UNITED STATES
SECURITIES AND EXCHANGE COMMISSION
Washington, D.C. 20549
FORMN-CSR
CERTIFIED SHAREHOLDER REPORT OF REGISTERED
MANAGEMENT INVESTMENT COMPANIES
Investment Company Act file number811-07452
AIM Variable Insurance Funds
(Invesco Variable Insurance Funds)
(Exact name of registrant as specified in charter)
11 Greenway Plaza, Suite 1000 Houston, Texas 77046
(Address of principal executive offices) (Zip code)
Sheri Morris 11 Greenway Plaza, Suite 1000 Houston, Texas 77046
(Name and address of agent for service)
Registrant’s telephone number, including area code: (713)626-1919
Date of fiscal year end: 12/31
Date of reporting period: 12/31/19
Item 1. Report to Stockholders.
| | | | |
| | |
 | | Annual Report to Shareholders | | December 31, 2019 |
| | |
| | Invesco V.I. American Franchise Fund |

Beginning on January 1, 2021, as permitted by regulations adopted by the Securities and Exchange Commission, the insurance company that offers your variable annuity or variable life insurance contract may no longer send you paper copies of the Fund’s shareholder reports by mail, unless you specifically request paper copies of the reports from the insurance company or your financial intermediary. Instead of delivering paper copies of the report, the insurance company may choose to make the reports available on a website, and will notify you by mail each time a report is posted and provide you with a website link to access the report. Instructions for requesting paper copies will be provided by your insurance company.
If the insurance company offers electronic delivery, you may elect to receive shareholder reports and other communications about the Fund electronically by following the instructions provided by the insurance company or by contacting your financial intermediary. If you already elected to receive shareholder reports electronically, you will not be affected by this change and you need not take any action.
You may elect to receive all future reports in paper free of charge from the insurance company. You can inform the insurance company or your financial intermediary that you wish to continue receiving paper copies of your shareholder reports by following the instructions provided by the insurance company or by contacting your financial intermediary. Your election to receive reports in paper will apply to all portfolio companies available under your contract with the insurance company.
The Fund provides a complete list of its holdings four times in each fiscal year, at the quarter-ends. For the second and fourth quarters, the lists appear in the Fund’s semiannual and annual reports to shareholders. For the first and third quarters, the Fund files the lists with the Securities and Exchange Commission (SEC) as an exhibit to its reports on FormN-PORT. The Fund’s FormN-PORT filings are available on the SEC website, sec.gov. The SEC file numbers for the Fund are811-07452 and033-57340. The Fund’s most recent portfolio holdings, as filed on FormN-PORT, have also been made available to insurance companies issuing variable annuity contracts and variable life insurance policies (“variable products”) that invest in the Fund.
A description of the policies and procedures that the Fund uses to determine how to vote proxies relating to portfolio securities is available without charge, upon request, from our Client Services department at 800 959 4246 or at invesco.com/proxyguidelines. The information is also available on the SEC website, sec.gov.
Information regarding how the Fund voted proxies related to its portfolio securities during the most recent12-month period ended June 30 is available at invesco.com/proxysearch. The information is also available on the SEC website, sec.gov.
Invesco Advisers, Inc. is an investment adviser; it provides investment advisory services to individual and institutional clients and does not sell securities. Invesco Distributors, Inc. is the US distributor for Invesco Ltd.’s retail mutual funds, exchange-traded funds and institutional money market funds. Both are wholly owned, indirect subsidiaries of Invesco Ltd.
This report must be accompanied or preceded by a currently effective Fund prospectus and variable product prospectus, which contain more complete information, including sales charges and expenses. Investors should read each carefully before investing.
| | | | |
NOT FDIC INSURED | MAY LOSE VALUE | NO BANK GUARANTEE |
| Invesco Distributors, Inc. | | | | VK-VIAMFR-AR-1 |
Management’s Discussion of Fund Performance
| | | | |
| Performance summary | | | | |
For the year ended December 31, 2019, Series I shares of Invesco V.I. American Franchise Fund (the Fund) outperformed the Russell 1000 Growth Index, the Fund’s style-specific benchmark. Your Fund’s long-term performance appears later in this report. | |
| Fund vs. Indexes | | | | |
| Total returns, 12/31/18 to 12/31/19, excluding variable product issuer charges. If variable product issuer charges were included, returns would be lower. | | | | |
| Series I Shares | | | 36.76 | % |
| Series II Shares | | | 36.43 | |
| S&P 500 Indexq(Broad Market Index) | | | 31.49 | |
| Russell 1000 Growth Indexq(Style-Specific Index) | | | 36.39 | |
| Lipper VUFLarge-Cap Growth Funds Index∎(Peer Group Index) | | | 32.69 | |
| |
| Source(s):qRIMES Technologies Corp.;∎Lipper Inc. | | | | |
Market conditions and your Fund
Equity markets rallied in the first quarter of 2019, fueled by optimism about a potentialUS-China trade deal and indication that the US Federal Reserve (the Fed) would not raise interest rates in 2019, a surprising shift in monetary policy. The Fed’s more accommodative stance provided a supportive environment for equities and fixed income, even as US economic data were mixed and overseas growth appeared to be slowing. Against this backdrop, the S&P 500 Index posted its best first quarter returns since 1998.
Although the S&P 500 Index posted modest gains for the second quarter of 2019, the US stock market experienced increased volatility. After four consecutive months of rising stock markets, the market sold off in May 2019, along with bond yields and oil prices, as investors weighed the impact of the lingering trade war between the US and China, as well as potential tariffs imposed on Mexico. In addition, economic data showed a slowing domestic and global economy.
Key issues that concerned investors in the second quarter of 2019 carried over into the third quarter. TheUS-China trade conflict worried investors and
stifled business investment, even as the Fed cut interest rates by 0.25% in July and again in September 2019.1 This environment, combined with evidence of slowing global economic growth, fueled market volatility in August 2019. The US Treasury yield curve inverted several times, increasing fears of a possible US recession. As a result, August saw increased risk aversion, with investors crowding into asset classes perceived as safe havens, such as US Treasuries and gold. However, the Fed’s accommodative tone provided some support for risk assets.
Macroeconomic issues that concerned investors in the third quarter of 2019 mostly abated during the fourth quarter, providing the backdrop for strong equity market returns. Risk assets surged higher as a result of a delay in the Brexit agreement until January 2020, optimism that phase one of aUS-China trade deal would be completed and better-than-expected third-quarter corporate earnings results. The US economy rose higher than expected, at 2.1% during the third quarter of 2019.2 During its October meeting, the Fed cut interest rates again by 0.25% based on business investment and exports remaining weak.1 Investors
were also encouraged by a resilient US economy and corporate earnings, putting the US equity market on track for its largest annual rise since 2013.
Given this landscape, the Fund produced a strong, double-digit return and outperformed its style-specific benchmark during the year. Relative performance was primarily driven by stock selection in the financials, health care and consumer staples sectors. Stock selection in industrials and consumer discretionary was also beneficial to the Fund’s relative performance. Conversely, stock selection in and underweight exposure to information technology (IT), as well as overweight exposure to energy detracted from the Fund’s relative performance. Ancillary cash also hurt the Fund’s relative returns given strong stock market performance during the year.
Top individual contributors to the Fund’s performance during the year includedFacebook,MicrosoftandAmazon.com. Social media giant Facebook reported strong earnings results during the year, showcasing an increase in the number of users worldwide, as well as increased revenue. In our view, increasing monetization for areas of Facebook, such as “Stories,” “Watch and “Messenger,” as well as improving margins from slowing regulatory and privacy costs would be more impactful in the future.
During the year, Microsoft contributed to the Fund’s performance on an absolute basis. However, the Fund’s underweight exposure to the company versus its style specific benchmark detracted from the Fund’s relative performance. Investor confidence in Microsoft grew following strong growth in Azure, its cloud computing platform. Additionally, Microsoft was awarded the $10 billion Joint Enterprise Defense Infrastructure (JEDI) contract from the US Department of Defense, further strengthening its competitive position. We see opportunity
| | | | |
Portfolio Composition | |
By sector | | | % of total net assets | |
| | | | |
| |
| Information Technology | | | 29.05% | |
| Consumer Discretionary | | | 20.43 | |
| Communication Services | | | 18.79 | |
| Health Care | | | 13.53 | |
| Industrials | | | 7.55 | |
| Financials | | | 5.09 | |
| Consumer Staples | | | 3.95 | |
| Other Sectors, Each Less than 2% of Net Assets | | | 1.76 | |
| Money Market Funds Plus Other | | | | |
| Assets Less Liabilities | | | (0.15) | |
| | |
Top 10 Equity Holdings* |
% of total net assets |
| | | | |
| |
| 1. Amazon.com, Inc. | | | 7.47% | |
2. Alphabet, Inc., Class A | | | 5.82 | |
3. Facebook, Inc., Class A | | | 4.96 | |
4. Microsoft Corp. | | | 4.61 | |
5. Lowe’s Cos., Inc. | | | 3.78 | |
6. Visa, Inc., Class A | | | 3.78 | |
7. Alibaba Group Holding Ltd., ADR | | | 3.59 | |
8. Apple, Inc. | | | 3.46 | |
9. Activision Blizzard, Inc. | | | 2.96 | |
10. salesforce.com, inc. | | | 2.93 | |
| | | | |
Total Net Assets | | $ | 652.6 million | |
| |
Total Number of Holdings* | | | 78 | |
The Fund’s holdings are subject to change, and there is no assurance that the Fund will continue to hold any particular security.
*Excluding money market fund holdings, if any.
Data presented here are as of December 31, 2019.
Invesco V.I. American Franchise Fund
for Microsoft to grow revenue and profits as customers continue their digital transformation into the cloud.
The Fund’s overweight allocation to Amazon.com benefited its absolute performance and performance relative to the style-specific benchmark during the year. The company switched fromtwo-day toone-day guaranteed shipping for its Prime subscription service and ramped up its salesforce headcount for Amazon Web Services, its cloud computing service. We viewed these changes as actions that will deepen Amazon.com’s moat as the leadinge-commerce provider and could drive better-than-expected revenue growth in the future. From a valuation standpoint, we viewed Amazon.com as attractive with upside potential frome-commerce penetration of consumables, food and goods, as well as automobiles.
Top individual detractors from the Fund’s performance during the year includedLyft, UberandIAA.Ridesharing companies Lyft and Uber both issued initial public offerings (IPOs) during the year. The Fund did not participate in Uber’s IPO and instead purchased shares in the secondary trading market. Both companies faced pressure in the second half of the year due to regulatory head-winds related to the advancement of California Assembly Bill 5 (AB5), which is designed to extend employee classification status to rideshare drivers giving them greater benefits, such as a protected minimum wage, sick days and health insurance. Though AB5 is not yet in effect, and a settlement or appeal of the law could still materialize, the advancement of the law has increased uncertainty for the ridesharing business model in California. At the close of the year, we believed that in the long term, the ridesharing industry has a large,un-derpenetrated market and potential to benefit from autonomous driving. Thus, we continued to hold both Lyft and Uber.
IAA is a salvage auto auctioneer that spun off from KAR Auction Services (not a Fund holding) in June 2019. While KAR focuses on selling to franchise and independent car dealerships, insurance companies make up IAA’s primary customer base given its focus on damaged andlow-value vehicles. We sold the position in IAA before the close of the year after we learned the company lost some business from its largest customer and were concerned it would lose more business to a competitor.
Atyear-end, based on our fundamental,bottom-up research approach, the
Fund maintained overweight exposures to the communication services, consumer discretionary and financials sectors relative to the style-specific benchmark. Within the consumer discretionary sector, we are focused on technology-driven share shift capabilities, demographics and changing behaviors. The Fund maintained a slight overweight position in the financials sector, primarily focusing on alternative asset managers, which we believed had potential for sales growth and profit expansion. The Fund maintained underweight exposures to the IT, real estate, industrials and health care sectors relative to the style-specific benchmark. Within IT, the Fund’s only overweight position was in semiconductors, given the current preference for technology-driven companies within the communication services and consumer discretionary sectors. Within health care, given potential for increased volatility during an election year, the Fund remained relatively underweight in thebio-pharmaceuticals industry. Finally, the Fund’s positioning in the industrials sector favored defensive,US-based, highly consolidated industries with pricing power.
Central bank actions in 2019 supported continued growth by keeping the cost of debt low. At the end of the year, the labor market remained healthy with employment and wage gains, which is beneficial to consumers. However, we believe these are the late innings of the economic cycle and, therefore, we expect only modest growth from here, as well as continued volatility spurred by trade and election headlines. Prolonged cyclical growth is likely to be scarce and we believe the market will continue to favor companies that can produce growth and compound earnings despite the economic cycle. We believe change is the fuel for growth. Thus, we are seeking to identify “share-takers,” companies that can gain market share through technology-enabled advantages in their business models and from disruptive shifts in consumer behavior.
Thank you for your commitment to Invesco V.I. American Franchise Fund and for sharing our long-term investment horizon.
| 1 | Source: US Federal Reserve |
| 2 | Source: Bureau of Economic Analysis |
Portfolio managers:
Ido Cohen
Erik Voss - Lead
The views and opinions expressed in management’s discussion of Fund performance are those of Invesco Advisers, Inc. These views and opinions are subject to change at any time based on factors such as market and economic conditions. These views and opinions may not be relied upon as investment advice or recommendations, or as an offer for a particular security. The information is not a complete analysis of every aspect of any market, country, industry, security or the Fund. Statements of fact are from sources considered reliable, but Invesco Advisers, Inc. makes no representation or warranty as to their completeness or accuracy. Although historical performance is no guarantee of future results, these insights may help you understand our investment management philosophy.
See important Fund and, if applicable, index disclosures later in this report.
Invesco V.I. American Franchise Fund
Your Fund’s Long-Term Performance
Results of a $10,000 Investment – Oldest Share Class(es)
Fund and index data from 12/31/09
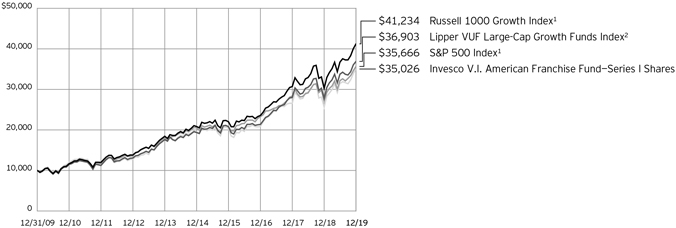
| 1 | Source: RIMES Technologies Corp. |
Past performance cannot guarantee
future results.
| | | | |
| Average Annual Total Returns | |
As of 12/31/19 | | | | |
| |
| Series I Shares | | | | |
| Inception (7/3/95) | | | 9.90% | |
| 10 Years | | | 13.35 | |
| 5 Years | | | 12.51 | |
| 1 Year | | | 36.76 | |
| |
| Series II Shares | | | | |
| Inception (9/18/00) | | | 3.08% | |
| 10 Years | | | 13.07 | |
| 5 Years | | | 12.22 | |
| 1 Year | | | 36.43 | |
Effective June 1, 2010, Class I and Class II shares of the predecessor fund, Van Kampen Life Investment Trust Capital Growth Portfolio, advised by Van Kampen Asset Management were reorganized into Series I and Series II shares, respectively, of Invesco Van Kampen V.I. Capital Growth Fund (renamed Invesco V.I. American Franchise Fund on April 29, 2013). Returns shown above, prior to June 1, 2010, for Series I and Series II shares are blended returns of the predecessor fund and Invesco V.I. American Franchise Fund. Share class returns will differ from the predecessor fund because of different expenses.
The performance data quoted represent past performance and cannot guarantee future results; current performance may be lower or higher. Please contact your variable product issuer or financial adviser for the most recentmonth-end variable product performance. Performance figures reflect Fund expenses, reinvested distributions and changes in net asset value.
Performance figures do not reflect deduction of taxes a shareholder would pay on Fund distributions or sale of Fund shares. Investment return and principal value will fluctuate so that you may have a gain or loss when you sell shares.
The total annual Fund operating expense ratio set forth in the most recent Fund prospectus as of the date of this report for Series I and Series II shares was 0.88% and 1.13%, respectively. The expense ratios presented above may vary from the expense ratios presented in other sections of this report that are based on expenses incurred during the period covered by this report.
Invesco V.I. American Franchise Fund, a series portfolio of AIM Variable Insurance Funds (Invesco Variable Insurance Funds), is currently offered through insurance companies issuing variable products. You cannot purchase shares of the Fund directly. Performance figures given represent the Fund and are not intended to reflect actual variable product values. They do not reflect sales charges, expenses and fees assessed in connection with a variable product. Sales charges, expenses and fees, which are determined by the variable product issuers, will vary and will lower the total return.
The most recentmonth-end performance at the Fund level, excluding variable product charges, is available at 800 451 4246. As mentioned above, for the most recentmonth-end performance including variable product charges, please contact your variable product issuer or financial adviser.
Fund performance reflects any applicable fee waivers and/or expense reimbursements. Had the adviser not waived fees and/or reimbursed expenses currently or in the past, returns would have been lower. See current prospectus for more information.
Invesco V.I. American Franchise Fund
Invesco V.I. American Franchise Fund’s investment objective is to seek capital growth.
| ∎ | | Unless otherwise stated, information presented in this report is as of December 31, 2019, and is based on total net assets. |
| ∎ | | Unless otherwise noted, all data provided by Invesco. |
| ∎ | | To access your Fund’s reports/prospectus, visit invesco.com/fundreports. |
About indexes used in this report
| ∎ | | TheS&P 500® Indexis an unmanaged index considered representative of the US stock market. |
| ∎ | | TheRussell 1000® Growth Indexis an unmanaged index considered representative oflarge-cap growth stocks. The Russell 1000 Growth Index is a trademark/service mark of the Frank Russell Co. Russell® is a trademark of the Frank Russell Co. |
| ∎ | | TheLipper VUFLarge-Cap Growth Funds Indexis an unmanaged index considered representative oflarge-cap growth variable insurance underlying funds tracked by Lipper. |
| ∎ | | The Fund is not managed to track the performance of any particular index, including the index(es) described here, and consequently, the performance of the Fund may deviate significantly from the performance of the index(es). |
| ∎ | | A direct investment cannot be made in an index. Unless otherwise indicated, index results include reinvested dividends, and they do not reflect sales charges. Performance of the peer group, if applicable, reflects fund expenses; performance of a market index does not. |
Other information
| ∎ | | The returns shown in management’s discussion of Fund performance are based on net asset values calculated for shareholder transactions. Generally accepted accounting principles require adjustments to be made to the net assets of the Fund at period end for financial reporting purposes, and as such, the net asset values for shareholder transactions and the returns based on those net asset values may differ from the net asset values and returns reported in the Financial Highlights. Additionally, the returns and net asset values shown throughout this report are at the Fund level only and do not include variable product issuer charges. If such charges were included, the total returns would be lower. |
| ∎ | | Industry classifications used in this report are generally according to the Global Industry Classification Standard, which was developed by and is |
| | the exclusive property and a service mark of MSCI Inc. and Standard & Poor’s. |
Invesco V.I. American Franchise Fund
Schedule of Investments(a)
December 31, 2019
| | | | | | | | |
| | | Shares | | | Value | |
Common Stocks & Other Equity Interests–100.15% | |
| Aerospace & Defense–2.74% | |
Airbus SE (France) | | | 44,748 | | | $ | 6,565,324 | |
| |
Boeing Co. (The) | | | 8,582 | | | | 2,795,672 | |
| |
L3Harris Technologies, Inc. | | | 27,996 | | | | 5,539,569 | |
| |
Lockheed Martin Corp. | | | 7,643 | | | | 2,976,031 | |
| |
| | | | | | | 17,876,596 | |
| |
|
| Agricultural & Farm Machinery–0.48% | |
Deere & Co. | | | 18,095 | | | | 3,135,140 | |
| |
|
| Application Software–5.21% | |
Adobe, Inc.(b) | | | 21,394 | | | | 7,055,955 | |
| |
salesforce.com, inc.(b) | | | 117,682 | | | | 19,139,801 | |
| |
Splunk, Inc.(b) | | | 45,822 | | | | 6,862,761 | |
| |
Synopsys, Inc.(b) | | | 6,700 | | | | 932,640 | |
| |
| | | | | | | 33,991,157 | |
| |
|
| Asset Management & Custody Banks–3.23% | |
Apollo Global Management, Inc. | | | 206,447 | | | | 9,849,587 | |
| |
Carlyle Group L.P. (The) | | | 109,689 | | | | 3,518,823 | |
| |
KKR & Co., Inc., Class A | | | 265,431 | | | | 7,742,622 | |
| |
| | | | | | | 21,111,032 | |
| |
|
| Biotechnology–0.98% | |
Alnylam Pharmaceuticals, Inc.(b) | | | 18,512 | | | | 2,132,027 | |
| |
BeiGene Ltd., ADR (China)(b) | | | 16,567 | | | | 2,746,146 | |
| |
Moderna, Inc.(b) | | | 77,615 | | | | 1,518,149 | |
| |
| | | | | | | 6,396,322 | |
| |
|
| Commodity Chemicals–0.25% | |
LyondellBasell Industries N.V., Class A | | | 17,323 | | | | 1,636,677 | |
| |
|
| Consumer Electronics–1.24% | |
Sony Corp. (Japan) | | | 118,800 | | | | 8,086,335 | |
| |
|
| Data Processing & Outsourced Services–8.37% | |
Fiserv, Inc.(b) | | | 57,440 | | | | 6,641,787 | |
| |
Mastercard, Inc., Class A | | | 51,785 | | | | 15,462,483 | |
| |
PayPal Holdings, Inc.(b) | | | 72,632 | | | | 7,856,604 | |
| |
Visa, Inc., Class A | | | 131,327 | | | | 24,676,343 | |
| |
| | | | | | | 54,637,217 | |
| |
|
| Diversified Support Services–1.10% | |
Cintas Corp. | | | 26,809 | | | | 7,213,766 | |
| |
|
| Environmental & Facilities Services–1.24% | |
Republic Services, Inc. | | | 26,587 | | | | 2,382,993 | |
| |
Waste Management, Inc. | | | 49,855 | | | | 5,681,476 | |
| |
| | | | | | | 8,064,469 | |
| |
|
| Financial Exchanges & Data–1.10% | |
London Stock Exchange Group PLC (United Kingdom) | | | 30,622 | | | | 3,163,011 | |
| |
| | | | | | | | |
| | | Shares | | | Value | |
| Financial Exchanges & Data–(continued) | |
S&P Global, Inc. | | | 14,675 | | | $ | 4,007,009 | |
| |
| | | | | | | 7,170,020 | |
| |
|
| Health Care Equipment–5.23% | |
Abbott Laboratories | | | 55,099 | | | | 4,785,899 | |
| |
Boston Scientific Corp.(b) | | | 155,225 | | | | 7,019,274 | |
| |
DexCom, Inc.(b) | | | 6,897 | | | | 1,508,650 | |
| |
Intuitive Surgical, Inc.(b) | | | 11,477 | | | | 6,784,629 | |
| |
Teleflex, Inc. | | | 24,400 | | | | 9,185,136 | |
| |
Zimmer Biomet Holdings, Inc. | | | 32,228 | | | | 4,823,887 | |
| |
| | | | | | | 34,107,475 | |
| |
|
| Home Improvement Retail–3.85% | |
Home Depot, Inc. (The) | | | 2,069 | | | | 451,828 | |
| |
Lowe’s Cos., Inc. | | | 206,288 | | | | 24,705,051 | |
| |
| | | | | | | 25,156,879 | |
| |
|
| Hotels, Resorts & Cruise Lines–2.50% | |
Norwegian Cruise Line Holdings Ltd.(b) | | | 22,420 | | | | 1,309,552 | |
| |
Royal Caribbean Cruises Ltd. | | | 112,626 | | | | 15,036,697 | |
| |
| | | | | | | 16,346,249 | |
| |
|
| Industrial Conglomerates–0.41% | |
Roper Technologies, Inc. | | | 7,505 | | | | 2,658,496 | |
| |
|
| Industrial Gases–0.61% | |
Air Products and Chemicals, Inc. | | | 16,815 | | | | 3,951,357 | |
| |
|
| Industrial Machinery–0.25% | |
Stanley Black & Decker, Inc. | | | 9,777 | | | | 1,620,440 | |
| |
|
| Interactive Home Entertainment–6.65% | |
Activision Blizzard, Inc. | | | 325,575 | | | | 19,345,666 | |
| |
Electronic Arts, Inc.(b) | | | 63,717 | | | | 6,850,215 | |
| |
Nintendo Co. Ltd. (Japan) | | | 35,000 | | | | 14,127,619 | |
| |
Take-Two Interactive Software, Inc.(b) | | | 25,141 | | | | 3,078,013 | |
| |
| | | | | | | 43,401,513 | |
| |
|
| Interactive Media & Services–10.78% | |
Alphabet, Inc., Class A(b) | | | 28,335 | | | | 37,951,616 | |
| |
Facebook, Inc., Class A(b) | | | 157,753 | | | | 32,378,803 | |
| |
| | | | | | | 70,330,419 | |
| |
|
| Internet & Direct Marketing Retail–12.84% | |
Alibaba Group Holding Ltd., ADR (China)(b) | | | 110,519 | | | | 23,441,080 | |
| |
Amazon.com, Inc.(b) | | | 26,383 | | | | 48,751,563 | |
| |
Booking Holdings, Inc.(b) | | | 4,461 | | | | 9,161,689 | |
| |
Farfetch Ltd., Class A (United Kingdom)(b) | | | 233,393 | | | | 2,415,618 | |
| |
| | | | | | | 83,769,950 | |
| |
|
| Investment Banking & Brokerage–0.47% | |
Goldman Sachs Group, Inc. (The) | | | 13,283 | | | | 3,054,160 | |
| |
See accompanying Notes to Financial Statements which are an integral part of the financial statements.
Invesco V.I. American Franchise Fund
| | | | | | | | |
| | | Shares | | | Value | |
| Life & Health Insurance–0.29% | |
Athene Holding Ltd., Class A(b) | | | 39,774 | | | $ | 1,870,571 | |
| |
|
| Life Sciences Tools & Services–4.02% | |
Avantor, Inc.(b) | | | 116,083 | | | | 2,106,906 | |
| |
Illumina, Inc.(b) | | | 34,517 | | | | 11,450,670 | |
| |
IQVIA Holdings, Inc.(b) | | | 37,908 | | | | 5,857,165 | |
| |
Thermo Fisher Scientific, Inc. | | | 20,939 | | | | 6,802,453 | |
| |
| | | | | | | 26,217,194 | |
| |
|
| Managed Health Care–1.96% | |
Anthem, Inc. | | | 11,046 | | | | 3,336,223 | |
| |
UnitedHealth Group, Inc. | | | 32,109 | | | | 9,439,404 | |
| |
| | | | | | | 12,775,627 | |
| |
|
| Movies & Entertainment–1.36% | |
Netflix, Inc.(b) | | | 22,411 | | | | 7,251,527 | |
| |
Vivendi S.A. (France) | | | 56,972 | | | | 1,651,339 | |
| |
| | | | | | | 8,902,866 | |
| |
|
| Oil & Gas Refining & Marketing–0.43% | |
Marathon Petroleum Corp. | | | 46,413 | | | | 2,796,383 | |
| |
|
| Packaged Foods & Meats–1.87% | |
Tyson Foods, Inc., Class A | | | 134,154 | | | | 12,213,380 | |
| |
|
| Pharmaceuticals–1.35% | |
Novo Nordisk A/S, Class B (Denmark) | | | 27,694 | | | | 1,606,243 | |
| |
Zoetis, Inc. | | | 54,397 | | | | 7,199,443 | |
| |
| | | | | | | 8,805,686 | |
| |
|
| Railroads–1.02% | |
Canadian Pacific Railway Ltd. (Canada) | | | 12,336 | | | | 3,145,063 | |
| |
Union Pacific Corp. | | | 19,382 | | | | 3,504,072 | |
| |
| | | | | | | 6,649,135 | |
| |
|
| Semiconductor Equipment–2.08% | |
Applied Materials, Inc. | | | 194,835 | | | | 11,892,728 | |
| |
ASML Holding N.V., New York Shares (Netherlands) | | | 5,791 | | | | 1,713,789 | |
| |
| | | | | | | 13,606,517 | |
| |
| | | | | | | | |
| | | Shares | | | Value | |
| Semiconductors–3.32% | |
Broadcom, Inc. | | | 28,885 | | | $ | 9,128,238 | |
| |
NVIDIA Corp. | | | 19,350 | | | | 4,553,055 | |
| |
QUALCOMM, Inc. | | | 90,520 | | | | 7,986,579 | |
| |
| | | | | | | 21,667,872 | |
| |
|
| Specialty Chemicals–0.48% | |
Sherwin-Williams Co. (The) | | | 5,345 | | | | 3,119,021 | |
| |
|
| Systems Software–6.60% | |
Microsoft Corp. | | | 190,688 | | | | 30,071,497 | |
| |
Palo Alto Networks, Inc.(b) | | | 33,736 | | | | 7,801,450 | |
| |
ServiceNow, Inc.(b) | | | 18,449 | | | | 5,208,522 | |
| |
| | | | | | | 43,081,469 | |
| |
|
| Technology Hardware, Storage & Peripherals–3.46% | |
Apple, Inc. | | | 76,891 | | | | 22,579,042 | |
| |
|
| Tobacco–2.07% | |
Philip Morris International, Inc. | | | 159,072 | | | | 13,535,437 | |
| |
|
| Trucking–0.31% | |
Lyft, Inc., Class A(b) | | | 31,402 | | | | 1,350,914 | |
| |
Uber Technologies, Inc.(b) | | | 22,835 | | | | 679,113 | |
| |
| | | | | | | 2,030,027 | |
| |
Total Common Stocks & Other Equity Interests
(Cost $326,505,892) | | | | 653,565,896 | |
| |
|
| Money Market Funds–0.13% | |
Invesco Government & Agency Portfolio, Institutional Class,
1.50%(c) | | | 293,529 | | | | 293,529 | |
| |
Invesco Liquid Assets Portfolio, Institutional Class, 1.71%(c) | | | 209,519 | | | | 209,582 | |
| |
Invesco Treasury Portfolio, Institutional Class, 1.49%(c) | | | 335,461 | | | | 335,461 | |
| |
Total Money Market Funds (Cost $838,572) | | | | 838,572 | |
| |
TOTAL INVESTMENTS INSECURITIES-100.28%
(Cost $327,344,464) | | | | 654,404,468 | |
| |
OTHER ASSETS LESS LIABILITIES–(0.28)% | | | | (1,817,690 | ) |
| |
NET ASSETS–100.00% | | | | | | $ | 652,586,778 | |
| |
Investment Abbreviations:
| | |
ADR - American Depositary Receipt |
Notes to Schedule of Investments:
| (a) | Industry and/or sector classifications used in this report are generally according to the Global Industry Classification Standard, which was developed by and is the exclusive property and a service mark of MSCI Inc. and Standard & Poor’s. |
| (b) | Non-income producing security. |
| (c) | The money market fund and the Fund are affiliated by having the same investment adviser. The rate shown is the7-day SEC standardized yield as of December31, 2019. |
See accompanying Notes to Financial Statements which are an integral part of the financial statements.
Invesco V.I. American Franchise Fund
Statement of Assets and Liabilities
December 31, 2019
| | | | |
Assets: | | | | |
Investments in securities, at value
(Cost $326,505,892) | | $ | 653,565,896 | |
| |
Investments in affiliated money market funds, at value
(Cost $838,572) | | | 838,572 | |
| |
Foreign currencies, at value (Cost $6,970) | | | 7,120 | |
| |
Receivable for: | | | | |
Investments sold | | | 4,365 | |
| |
Fund shares sold | | | 47,027 | |
| |
Dividends | | | 341,498 | |
| |
Investment for trustee deferred compensation and retirement plans | | | 357,604 | |
| |
Total assets | | | 655,162,082 | |
| |
| |
Liabilities: | | | | |
Payable for: | | | | |
Fund shares reacquired | | | 1,750,208 | |
| |
Amount due custodian | | | 63,855 | |
| |
Accrued fees to affiliates | | | 329,130 | |
| |
Accrued other operating expenses | | | 53,368 | |
| |
Trustee deferred compensation and retirement plans | | | 378,743 | |
| |
Total liabilities | | | 2,575,304 | |
| |
Net assets applicable to shares outstanding | | $ | 652,586,778 | |
| |
| |
Net assets consist of: | | | | |
Shares of beneficial interest | | $ | 278,679,682 | |
| |
Distributable earnings | | | 373,907,096 | |
| |
| | $ | 652,586,778 | |
| |
| |
Net Assets: | | | | |
Series I | | $ | 490,365,579 | |
| |
Series II | | $ | 162,221,199 | |
| |
|
Shares outstanding, no par value, with an unlimited number of shares authorized: | |
Series I | | | 7,302,302 | |
| |
Series II | | | 2,538,501 | |
| |
Series I: | | | | |
Net asset value per share | | $ | 67.15 | |
| |
Series II: | | | | |
Net asset value per share | | $ | 63.90 | |
| |
Statement of Operations
For the year ended December 31, 2019
| | | | |
Investment income: | | | | |
Dividends (net of foreign withholding taxes of $90,689) | | $ | 6,019,733 | |
| |
Dividends from affiliated money market funds (includes securities lending income of $84,387) | | | 133,494 | |
| |
Total investment income | | | 6,153,227 | |
| |
| |
Expenses: | | | | |
Advisory fees | | | 4,121,428 | |
| |
Administrative services fees | | | 972,400 | |
| |
Custodian fees | | | 23,429 | |
| |
Distribution fees - Series II | | | 376,654 | |
| |
Transfer agent fees | | | 69,019 | |
| |
Trustees’ and officers’ fees and benefits | | | 26,870 | |
| |
Reports to shareholders | | | 9,085 | |
| |
Professional services fees | | | 43,994 | |
| |
Other | | | 10,395 | |
| |
Total expenses | | | 5,653,274 | |
| |
Less: Fees waived | | | (2,980 | ) |
| |
Net expenses | | | 5,650,294 | |
| |
Net investment income | | | 502,933 | |
| |
| |
Realized and unrealized gain (loss) from: | | | | |
Net realized gain (loss) from: | | | | |
Investment securities (includes net gains (losses) from securities sold to affiliates of $(3,962)) | | | 54,084,301 | |
| |
Foreign currencies | | | (21,109 | ) |
| |
| | | 54,063,192 | |
| |
Change in net unrealized appreciation of: | | | | |
Investment securities | | | 132,918,740 | |
| |
Foreign currencies | | | 189 | |
| |
| | | 132,918,929 | |
| |
Net realized and unrealized gain | | | 186,982,121 | |
| |
Net increase in net assets resulting from operations | | $ | 187,485,054 | |
| |
See accompanying Notes to Financial Statements which are an integral part of the financial statements.
Invesco V.I. American Franchise Fund
Statement of Changes in Net Assets
For the years ended December 31, 2019 and 2018
| | | | | | | | |
| | | 2019 | | | 2018 | |
| |
Operations: | | | | | | | | |
Net investment income (loss) | | $ | 502,933 | | | $ | (419,319 | ) |
| |
Net realized gain | | | 54,063,192 | | | | 85,166,075 | |
| |
Change in net unrealized appreciation (depreciation) | | | 132,918,929 | | | | (97,421,166 | ) |
| |
Net increase (decrease) in net assets resulting from operations | | | 187,485,054 | | | | (12,674,410 | ) |
| |
| | |
Distributions to shareholders from distributable earnings: | | | | | | | | |
Series I | | | (64,492,029 | ) | | | (29,906,066 | ) |
| |
Series II | | | (21,911,152 | ) | | | (10,129,348 | ) |
| |
Total distributions from distributable earnings | | | (86,403,181 | ) | | | (40,035,414 | ) |
| |
| | |
Share transactions–net: | | | | | | | | |
Series I | | | 8,287,794 | | | | (46,845,225 | ) |
| |
Series II | | | 4,809,729 | | | | (24,264,904 | ) |
| |
Net increase (decrease) in net assets resulting from share transactions | | | 13,097,523 | | | | (71,110,129 | ) |
| |
Net increase (decrease) in net assets | | | 114,179,396 | | | | (123,819,953 | ) |
| |
| | |
Net assets: | | | | | | | | |
Beginning of year | | | 538,407,382 | | | | 662,227,335 | |
| |
End of year | | $ | 652,586,778 | | | $ | 538,407,382 | |
| |
See accompanying Notes to Financial Statements which are an integral part of the financial statements.
Invesco V.I. American Franchise Fund
Financial Highlights
The following schedule presents financial highlights for a share of the Fund outstanding throughout the periods indicated.
| | | | | | | | | | | | | | | | | | | | | | | | | | | | | | | | | | | | | | | | | | | | | | | | | | | | | | | | |
| | | Net asset
value,
beginning
of period | | | Net investment
income
(loss)(a) | | | Net gains
(losses)
on securities
(both realized and unrealized) | | | Total from
investment operations | | | Dividends from net investment income | | | Distributions from net realized
gains | | | Total
distributions | | | Net asset
value, end of period | | | Total
return (b) | | | Net assets,
end of period (000’s omitted) | | | Ratio of
expenses
to average
net assets
with fee waivers
and/or
expenses
absorbed | | | Ratio of
expenses
to average net
assets without fee waivers
and/or
expenses
absorbed | | | Ratio of net investment
income (loss) to average
net assets | | | Portfolio turnover (c) | |
Series I | | | | | | | | | | | | | | | | | | | | | | | | | | | | | | | | | | | | | | | | | | | | | | | | | | | | | | | | |
Year ended 12/31/19 | | | $57.15 | | | | $0.10 | | | | $19.86 | | | | $19.96 | | | | $ – | | | | $(9.96 | ) | | | $(9.96 | ) | | | $67.15 | | | | 36.76 | % | | | $490,366 | | | | 0.86%(d) | | | | 0.87%(d) | | | | 0.15%(d) | | | | 40% | |
Year ended 12/31/18 | | | 62.97 | | | | (0.00 | ) | | | (1.50 | ) | | | (1.50 | ) | | | – | | | | (4.32 | ) | | | (4.32 | ) | | | 57.15 | | | | (3.62 | ) | | | 405,192 | | | | 0.88 | | | | 0.88 | | | | (0.00) | | | | 42 | |
Year ended 12/31/17 | | | 53.58 | | | | (0.04 | ) | | | 14.50 | | | | 14.46 | | | | (0.05 | ) | | | (5.02 | ) | | | (5.07 | ) | | | 62.97 | | | | 27.34 | | | | 491,271 | | | | 0.89 | | | | 0.89 | | | | (0.06) | | | | 45 | |
Year ended 12/31/16 | | | 57.30 | | | | 0.07 | | | | 1.33 | | | | 1.40 | | | | – | | | | (5.12 | ) | | | (5.12 | ) | | | 53.58 | | | | 2.27 | | | | 420,824 | | | | 0.93 | | | | 0.93 | | | | 0.12 | | | | 59 | |
Year ended 12/31/15 | | | 54.88 | | | | (0.03 | ) | | | 2.76 | | | | 2.73 | | | | – | | | | (0.31 | ) | | | (0.31 | ) | | | 57.30 | | | | 5.01 | | | | 479,298 | | | | 0.96 | | | | 0.96 | | | | (0.05) | | | | 68 | |
Series II | | | | | | | | | | | | | | | | | | | | | | | | | | | | | | | | | | | | | | | | | | | | | | | | | | | | | | | | |
Year ended 12/31/19 | | | 54.90 | | | | (0.07 | ) | | | 19.03 | | | | 18.96 | | | | – | | | | (9.96 | ) | | | (9.96 | ) | | | 63.90 | | | | 36.43 | | | | 162,221 | | | | 1.11(d) | | | | 1.12(d) | | | | (0.10)(d) | | | | 40 | |
Year ended 12/31/18 | | | 60.79 | | | | (0.16 | ) | | | (1.41 | ) | | | (1.57 | ) | | | – | | | | (4.32 | ) | | | (4.32 | ) | | | 54.90 | | | | (3.88 | ) | | | 133,216 | | | | 1.13 | | | | 1.13 | | | | (0.25) | | | | 42 | |
Year ended 12/31/17 | | | 51.95 | | | | (0.19 | ) | | | 14.05 | | | | 13.86 | | | | – | | | | (5.02 | ) | | | (5.02 | ) | | | 60.79 | | | | 27.03 | | | | 170,956 | | | | 1.14 | | | | 1.14 | | | | (0.31) | | | | 45 | |
Year ended 12/31/16 | | | 55.85 | | | | (0.06 | ) | | | 1.28 | | | | 1.22 | | | | – | | | | (5.12 | ) | | | (5.12 | ) | | | 51.95 | | | | 2.00 | | | | 151,599 | | | | 1.18 | | | | 1.18 | | | | (0.13) | | | | 59 | |
Year ended 12/31/15 | | | 53.63 | | | | (0.16 | ) | | | 2.69 | | | | 2.53 | | | | – | | | | (0.31 | ) | | | (0.31 | ) | | | 55.85 | | | | 4.75 | | | | 175,919 | | | | 1.21 | | | | 1.21 | | | | (0.30) | | | | 68 | |
| (a) | Calculated using average shares outstanding. |
| (b) | Includes adjustments in accordance with accounting principles generally accepted in the United States of America and as such, the net asset value for financial reporting purposes and the returns based upon those net asset values may differ from the net asset value and returns for shareholder transactions. Total returns are not annualized for periods less than one year, if applicable, and do not reflect charges assessed in connection with a variable product, which if included would reduce total returns. |
| (c) | Portfolio turnover is calculated at the fund level and is not annualized for periods less than one year, if applicable. |
| (d) | Ratios are based on average daily net assets (000’s omitted) of $459,259 and $150,652 for Series I and Series II shares, respectively. |
See accompanying Notes to Financial Statements which are an integral part of the financial statements.
Invesco V.I. American Franchise Fund
Notes to Financial Statements
December 31, 2019
NOTE 1–Significant Accounting Policies
Invesco V.I. American Franchise Fund (the “Fund”) is a series portfolio of AIM Variable Insurance Funds (Invesco Variable Insurance Funds) (the “Trust”). The Trust is a Delaware statutory trust registered under the Investment Company Act of 1940, as amended (the “1940 Act”), as anopen-end series management investment company. Information presented in these financial statements pertains only to the Fund. Matters affecting the Fund or each class will be voted on exclusively by the shareholders of the Fund or each class. Current Securities and Exchange Commission (“SEC”) guidance, however, requires participating insurance companies offering separate accounts to vote shares proportionally in accordance with the instructions of the contract owners whose investments are funded by shares of each Fund or class.
The Fund’s investment objective is to seek capital growth.
The Fund currently offers two classes of shares, Series I and Series II, both of which are offered to insurance company separate accounts funding variable annuity contracts and variable life insurance policies (“variable products”).
The Fund is an investment company and accordingly follows the investment company accounting and reporting guidance in accordance with Financial Accounting Standards Board Accounting Standards Codification Topic 946,Financial Services - Investment Companies.
The following is a summary of the significant accounting policies followed by the Fund in the preparation of its financial statements.
A. Security Valuations– Securities, including restricted securities, are valued according to the following policy.
A security listed or traded on an exchange (except convertible securities) is valued at its last sales price or official closing price as of the close of the customary trading session on the exchange where the security is principally traded, or lacking any sales or official closing price on a particular day, the security may be valued at the closing bid price on that day. Securities traded in theover-the-counter market are valued based on prices furnished by independent pricing services or market makers. When such securities are valued by an independent pricing service they may be considered fair valued. Futures contracts are valued at the final settlement price set by an exchange on which they are principally traded. Listed options are valued at the mean between the last bid and asked prices from the exchange on which they are principally traded. Options not listed on an exchange are valued by an independent source at the mean between the last bid and asked prices. For purposes of determining net asset value (“NAV”) per share, futures and option contracts generally are valued 15 minutes after the close of the customary trading session of the New York Stock Exchange (“NYSE”).
Investments inopen-end andclosed-end registered investment companies that do not trade on an exchange are valued at theend-of-day net asset value per share. Investments inopen-end andclosed-end registered investment companies that trade on an exchange are valued at the last sales price or official closing price as of the close of the customary trading session on the exchange where the security is principally traded.
Debt obligations (including convertible securities) and unlisted equities are fair valued using an evaluated quote provided by an independent pricing service. Evaluated quotes provided by the pricing service may be determined without exclusive reliance on quoted prices, and may reflect appropriate factors such asinstitution-size trading in similar groups of securities, developments related to specific securities, dividend rate (for unlisted equities), yield (for debt obligations), quality, type of issue, coupon rate (for debt obligations), maturity (for debt obligations), individual trading characteristics and other market data. Pricing services generally value debt obligations assuming orderly transactions of institutional round lot size, but a fund may hold or transact in the same securities in smaller, odd lot sizes. Odd lots often trade at lower prices than institutional round lots. Debt obligations are subject to interest rate and credit risks. In addition, all debt obligations involve some risk of default with respect to interest and/or principal payments.
Foreign securities’ (including foreign exchange contracts) prices are converted into U.S. dollar amounts using the applicable exchange rates as of the close of the NYSE. If market quotations are available and reliable for foreign exchange-traded equity securities, the securities will be valued at the market quotations. Because trading hours for certain foreign securities end before the close of the NYSE, closing market quotations may become unreliable. If between the time trading ends on a particular security and the close of the customary trading session on the NYSE, events occur that the investment adviser determines are significant and make the closing price unreliable, the Fund may fair value the security. If the event is likely to have affected the closing price of the security, the security will be valued at fair value in good faith using procedures approved by the Board of Trustees. Adjustments to closing prices to reflect fair value may also be based on a screening process of an independent pricing service to indicate the degree of certainty, based on historical data, that the closing price in the principal market where a foreign security trades is not the current value as of the close of the NYSE. Foreign securities’ prices meeting the approved degree of certainty that the price is not reflective of current value will be priced at the indication of fair value from the independent pricing service. Multiple factors may be considered by the independent pricing service in determining adjustments to reflect fair value and may include information relating to sector indices, American Depositary Receipts and domestic and foreign index futures. Foreign securities may have additional risks including exchange rate changes, potential for sharply devalued currencies and high inflation, political and economic upheaval, the relative lack of issuer information, relatively low market liquidity and the potential lack of strict financial and accounting controls and standards.
Securities for which market prices are not provided by any of the above methods may be valued based upon quotes furnished by independent sources. The last bid price may be used to value equity securities. The mean between the last bid and asked prices is used to value debt obligations, including corporate loans.
Securities for which market quotations are not readily available or became unreliable are valued at fair value as determined in good faith by or under the supervision of the Trust’s officers following procedures approved by the Board of Trustees. Issuer specific events, market trends, bid/asked quotes of brokers and information providers and other market data may be reviewed in the course of making a good faith determination of a security’s fair value.
The Fund may invest in securities that are subject to interest rate risk, meaning the risk that the prices will generally fall as interest rates rise and, conversely, the prices will generally rise as interest rates fall. Specific securities differ in their sensitivity to changes in interest rates depending on their individual characteristics. Changes in interest rates may result in increased market volatility, which may affect the value and/or liquidity of certain Fund investments.
Invesco V.I. American Franchise Fund
Valuations change in response to many factors including the historical and prospective earnings of the issuer, the value of the issuer’s assets, general economic conditions, interest rates, investor perceptions and market liquidity. Because of the inherent uncertainties of valuation, the values reflected in the financial statements may materially differ from the value received upon actual sale of those investments.
| B. | Securities Transactions and Investment Income– Securities transactions are accounted for on a trade date basis. Realized gains or losses on sales are computed on the basis of specific identification of the securities sold. Interest income (net of withholding tax, if any) is recorded on the accrual basis from settlement date. Dividend income (net of withholding tax, if any) is recorded on theex-dividend date. |
The Fund may periodically participate in litigation related to Fund investments. As such, the Fund may receive proceeds from litigation settlements. Any proceeds received are included in the Statement of Operations as realized gain (loss) for investments no longer held and as unrealized gain (loss) for investments still held.
Brokerage commissions and mark ups are considered transaction costs and are recorded as an increase to the cost basis of securities purchased and/or a reduction of proceeds on a sale of securities. Such transaction costs are included in the determination of net realized and unrealized gain (loss) from investment securities reported in the Statement of Operations and the Statement of Changes in Net Assets and the net realized and unrealized gains (losses) on securities per share in the Financial Highlights. Transaction costs are included in the calculation of the Fund’s net asset value and, accordingly, they reduce the Fund’s total returns. These transaction costs are not considered operating expenses and are not reflected in net investment income reported in the Statement of Operations and the Statement of Changes in Net Assets, or the net investment income per share and the ratios of expenses and net investment income reported in the Financial Highlights, nor are they limited by any expense limitation arrangements between the Fund and the investment adviser.
The Fund allocates income and realized and unrealized capital gains and losses to a class based on the relative net assets of each class.
| C. | Country Determination – For the purposes of making investment selection decisions and presentation in the Schedule of Investments, the investment adviser may determine the country in which an issuer is located and/or credit risk exposure based on various factors. These factors include the laws of the country under which the issuer is organized, where the issuer maintains a principal office, the country in which the issuer derives 50% or more of its total revenues and the country that has the primary market for the issuer’s securities, as well as other criteria. Among the other criteria that may be evaluated for making this determination are the country in which the issuer maintains 50% or more of its assets, the type of security, financial guarantees and enhancements, the nature of the collateral and the sponsor organization. Country of issuer and/or credit risk exposure has been determined to be the United States of America, unless otherwise noted. |
| D. | Distributions– Distributions from net investment income and net realized capital gain, if any, are generally declared and paid to separate accounts of participating insurance companies annually and recorded on theex-dividend date. |
| E. | Federal Income Taxes –The Fund intends to comply with the requirements of Subchapter M of the Internal Revenue Code of 1986, as amended (the “Internal Revenue Code”), necessary to qualify as a regulated investment company and to distribute substantially all of the Fund’s taxable earnings to shareholders. As such, the Fund will not be subject to federal income taxes on otherwise taxable income (including net realized capital gain) that is distributed to shareholders. Therefore, no provision for federal income taxes is recorded in the financial statements. |
The Fund recognizes the tax benefits of uncertain tax positions only when the position is more likely than not to be sustained. Management has analyzed the Fund’s uncertain tax positions and concluded that no liability for unrecognized tax benefits should be recorded related to uncertain tax positions. Management is not aware of any tax positions for which it is reasonably possible that the total amounts of unrecognized tax benefits will change materially in the next 12 months.
The Fund files tax returns in the U.S. Federal jurisdiction and certain other jurisdictions. Generally, the Fund is subject to examinations by such taxing authorities for up to three years after the filing of the return for the tax period.
| F. | Expenses– Fees provided for under the Rule12b-1 plan of a particular class of the Fund and which are directly attributable to that class are charged to the operations of such class. All other expenses are allocated among the classes based on relative net assets. |
| G. | Accounting Estimates –The preparation of financial statements in conformity with accounting principles generally accepted in the United States of America (“GAAP”) requires management to make estimates and assumptions that affect the reported amounts of assets and liabilities at the date of the financial statements and the reported amounts of revenues and expenses during the reporting period including estimates and assumptions related to taxation. Actual results could differ from those estimates by a significant amount. In addition, the Fund monitors for material events or transactions that may occur or become known after theperiod-end date and before the date the financial statements are released to print. |
| H. | Indemnifications– Under the Trust’s organizational documents, each Trustee, officer, employee or other agent of the Trust is indemnified against certain liabilities that may arise out of the performance of their duties to the Fund. Additionally, in the normal course of business, the Fund enters into contracts, including the Fund’s servicing agreements, that contain a variety of indemnification clauses. The Fund’s maximum exposure under these arrangements is unknown as this would involve future claims that may be made against the Fund that have not yet occurred. The risk of material loss as a result of such indemnification claims is considered remote. |
| I. | Securities Lending– The Fund may lend portfolio securities having a market value up toone-third of the Fund’s total assets. Such loans are secured by collateral equal to no less than the market value of the loaned securities determined daily by the securities lending provider. Such collateral will be cash or debt securities issued or guaranteed by the U.S. Government or any of its sponsored agencies. Cash collateral received in connection with these loans is invested in short-term money market instruments or affiliated money market funds and is shown as such on the Schedule of Investments. The Fund bears the risk of loss with respect to the investment of collateral. It is the Fund’s policy to obtain additional collateral from or return excess collateral to the borrower by the end of the next business day, following the valuation date of the securities loaned. Therefore, the value of the collateral held may be temporarily less than the value of the securities on loan. When loaning securities, the Fund retains certain benefits of owning the securities, including the economic equivalent of dividends or interest generated by the security. Lending securities entails a risk of loss to the Fund if, and to the extent that, the market value of the securities loaned were to increase and the borrower did not increase the collateral accordingly, and the borrower failed to return the securities. The securities loaned are subject to termination at the option of the borrower or the Fund. Upon termination, the borrower will return to the Fund the securities loaned and the Fund will return the collateral. Upon the failure of the borrower to return the securities, collateral may be liquidated and the securities may be purchased on the open market to replace the loaned securities. The Fund could experience delays and costs in gaining access to the collateral and the securities may lose value during the delay which could result in potential losses to the Fund. Some of these losses may be indemnified by the lending agent. The Fund bears the risk of any deficiency in the amount of the collateral available for return to the borrower due to any loss on the |
Invesco V.I. American Franchise Fund
| | collateral invested. Dividends received on cash collateral investments for securities lending transactions, which are net of compensation to counterparties, are included inDividends from affiliated money market funds on the Statement of Operations. The aggregate value of securities out on loan, if any, is shown as a footnote on the Statement of Assets and Liabilities. |
| J. | Foreign Currency Translations– Foreign currency is valued at the close of the NYSE based on quotations posted by banks and major currency dealers. Portfolio securities and other assets and liabilities denominated in foreign currencies are translated into U.S. dollar amounts at the date of valuation. Purchases and sales of portfolio securities (net of foreign taxes withheld on disposition) and income items denominated in foreign currencies are translated into U.S. dollar amounts on the respective dates of such transactions. The Fund does not separately account for the portion of the results of operations resulting from changes in foreign exchange rates on investments and the fluctuations arising from changes in market prices of securities held. The combined results of changes in foreign exchange rates and the fluctuation of market prices on investments (net of estimated foreign tax withholding) are included with the net realized and unrealized gain or loss from investments in the Statement of Operations. Reported net realized foreign currency gains or losses arise from (1) sales of foreign currencies, (2) currency gains or losses realized between the trade and settlement dates on securities transactions, and (3) the difference between the amounts of dividends, interest, and foreign withholding taxes recorded on the Fund’s books and the U.S. dollar equivalent of the amounts actually received or paid. Net unrealized foreign currency gains and losses arise from changes in the fair values of assets and liabilities, other than investments in securities at fiscal period end, resulting from changes in exchange rates. |
The Fund may invest in foreign securities, which may be subject to foreign taxes on income, gains on investments or currency repatriation, a portion of which may be recoverable. Foreign taxes, if any, are recorded based on the tax regulations and rates that exist in the foreign markets in which the Fund invests and are shown in the Statement of Operations.
| K. | Forward Foreign Currency Contracts– The Fund may engage in foreign currency transactions either on a spot (i.e. for prompt delivery and settlement) basis, or through forward foreign currency contracts, to manage or minimize currency or exchange rate risk. |
The Fund may also enter into forward foreign currency contracts for the purchase or sale of a security denominated in a foreign currency in order to “lock in” the U.S. dollar price of that security, or the Fund may also enter into forward foreign currency contracts that do not provide for physical settlement of the two currencies, but instead are settled by a single cash payment calculated as the difference between the agreed upon exchange rate and the spot rate at settlement based upon an agreed upon notional amount(non-deliverable forwards). The Fund will set aside liquid assets in an amount equal to the dailymark-to-market obligation for forward foreign currency contracts.
A forward foreign currency contract is an obligation between two parties (“Counterparties”) to purchase or sell a specific currency for an agreed-upon price at a future date. The use of forward foreign currency contracts does not eliminate fluctuations in the price of the underlying securities the Fund owns or intends to acquire but establishes a rate of exchange in advance. Fluctuations in the value of these contracts are measured by the difference in the contract date and reporting date exchange rates and are recorded as unrealized appreciation (depreciation) until the contracts are closed. When the contracts are closed, realized gains (losses) are recorded. Realized and unrealized gains (losses) on the contracts are included in the Statement of Operations. The primary risks associated with forward foreign currency contracts include failure of the Counterparty to meet the terms of the contract and the value of the foreign currency changing unfavorably. These risks may be in excess of the amounts reflected in the Statement of Assets and Liabilities.
NOTE 2–Advisory Fees and Other Fees Paid to Affiliates
The Trust has entered into a master investment advisory agreement with Invesco Advisers, Inc. (the “Adviser” or “Invesco”). Under the terms of the investment advisory agreement, the Fund accrues daily and pays monthly an advisory fee to the Adviser based on the annual rate of the Fund’s average daily net assets as follows:
| | | | | | |
| Average Daily Net Assets | | Rate | |
First $250 million | | | 0.695% | |
| |
Next $250 million | | | 0.670% | |
| |
Next $500 million | | | 0.645% | |
| |
Next $550 million | | | 0.620% | |
| |
Next $3.45 billion | | | 0.600% | |
| |
Next $250 million | | | 0.595% | |
| |
Next $2.25 billion | | | 0.570% | |
| |
Next $2.5 billion | | | 0.545% | |
| |
Over $10 billion | | | 0.520% | |
| |
For the year ended December 31, 2019, the effective advisory fee rate incurred by the Fund was 0.68%.
Under the terms of a mastersub-advisory agreement between the Adviser and each of Invesco Asset Management Deutschland GmbH, Invesco Asset Management Limited, Invesco Asset Management (Japan) Limited, Invesco Hong Kong Limited, Invesco Senior Secured Management, Inc. and Invesco Canada Ltd. and separatesub-advisory agreements with Invesco Capital Management LLC and Invesco Asset Management (India) Private Limited (collectively, the “AffiliatedSub-Advisers”) the Adviser, not the Fund, will pay 40% of the fees paid to the Adviser to any such AffiliatedSub-Adviser(s) that provide(s) discretionary investment management services to the Fund based on the percentage of assets allocated to such AffiliatedSub-Adviser(s).
The Adviser has contractually agreed, through at least June 30, 2020, to waive advisory fees and/or reimburse expenses of all shares to the extent necessary to limit total annual fund operating expenses after fee waiver and/or expense reimbursement (excluding certain items discussed below) of Series I shares to 2.00% and Series II shares to 2.25% of average daily net assets (the “expense limits”). In determining the Adviser’s obligation to waive advisory fees and/or reimburse expenses, the following expenses are not taken into account, and could cause the total annual fund operating expenses after fee waiver and/or expense reimbursement to exceed the numbers reflected above: (1) interest; (2) taxes; (3) dividend expense on short sales; (4) extraordinary ornon-routine items, including litigation expenses; and (5) expenses that the Fund has incurred but did not actually pay because of an expense offset arrangement. Unless Invesco continues the fee waiver agreement, it will terminate on June 30, 2020.
Invesco V.I. American Franchise Fund
During its term, the fee waiver agreement cannot be terminated or amended to increase the expense limits or reduce the advisory fee waiver without approval of the Board of Trustees. The Adviser did not waive fees and/or reimburse expenses during the period under these expense limits.
Further, the Adviser has contractually agreed, through at least June 30, 2021, to waive the advisory fee payable by the Fund in an amount equal to 100% of the net advisory fees the Adviser receives from the affiliated money market funds on investments by the Fund of uninvested cash (excluding investments of cash collateral from securities lending) in such affiliated money market funds.
For the year ended December 31, 2019, the Adviser waived advisory fees of $2,980.
The Trust has entered into a master administrative services agreement with Invesco pursuant to which the Fund has agreed to pay Invesco a fee for costs incurred in providing accounting services and fund administrative services to the Fund and to reimburse Invesco for fees paid to insurance companies that have agreed to provide certain administrative services to the Fund. These administrative services provided by the insurance companies may include, among other things: maintenance of master accounts with the Fund; tracking, recording and transmitting net purchase and redemption orders for Fund shares; maintaining and preserving records related to the purchase, redemption and other account activity of variable product owners; distributing copies of Fund documents such as prospectuses, proxy materials and periodic reports, to variable product owners, and responding to inquiries from variable product owners about the Fund. Pursuant to such agreement, for the year ended December 31, 2019, Invesco was paid $86,136 for accounting and fund administrative services and was reimbursed $886,264 for fees paid to insurance companies. Invesco has entered into asub-administration agreement whereby State Street Bank and Trust Company (“SSB”) serves as fund accountant and provides certain administrative services to the Fund. Pursuant to a custody agreement with the Trust on behalf of the Fund, SSB also serves as the Fund’s custodian.
The Trust has entered into a transfer agency and service agreement with Invesco Investment Services, Inc. (“IIS”) pursuant to which the Fund has agreed to pay IIS a fee for providing transfer agency and shareholder services to the Fund and reimburse IIS for certain expenses incurred by IIS in the course of providing such services. For the year ended December 31, 2019, expenses incurred under the agreement are shown in the Statement of Operations asTransfer agent fees.
The Trust has entered into a master distribution agreement with Invesco Distributors, Inc. (“IDI”) to serve as the distributor for the Fund. The Trust has adopted a plan pursuant to Rule12b-1 under the 1940 Act with respect to the Fund’s Series II shares (the “Plan”). The Fund, pursuant to the Plan, pays IDI compensation at the annual rate of 0.25% of the Fund’s average daily net assets of Series II shares. The fees are accrued daily and paid monthly. Of the Plan payments, up to 0.25% of the average daily net assets of the Series II shares may be paid to insurance companies who furnish continuing personal shareholder services to customers who purchase and own Series II shares of the Fund. For the year ended December 31, 2019, expenses incurred under the Plan are detailed in the Statement of Operations asDistribution fees.
For the year ended December 31, 2019, the Fund incurred $4,136 in brokerage commissions with Invesco Capital Markets, Inc., an affiliate of the Adviser and IDI, for portfolio transactions executed on behalf of the Fund.
Certain officers and trustees of the Trust are officers and directors of the Adviser, IIS and/or IDI.
NOTE 3–Additional Valuation Information
GAAP defines fair value as the price that would be received to sell an asset or paid to transfer a liability in an orderly transaction between market participants at the measurement date, under current market conditions. GAAP establishes a hierarchy that prioritizes the inputs to valuation methods, giving the highest priority to readily available unadjusted quoted prices in an active market for identical assets (Level 1) and the lowest priority to significant unobservable inputs (Level 3), generally when market prices are not readily available or are unreliable. Based on the valuation inputs, the securities or other investments are tiered into one of three levels. Changes in valuation methods may result in transfers in or out of an investment’s assigned level:
| | Level 1 - | Prices are determined using quoted prices in an active market for identical assets. |
| | Level 2 - | Prices are determined using other significant observable inputs. Observable inputs are inputs that other market participants may use in pricing a security. These may include quoted prices for similar securities, interest rates, prepayment speeds, credit risk, yield curves, loss severities, default rates, discount rates, volatilities and others. |
| | Level 3 - | Prices are determined using significant unobservable inputs. In situations where quoted prices or observable inputs are unavailable (for example, when there is little or no market activity for an investment at the end of the period), unobservable inputs may be used. Unobservable inputs reflect the Fund’s own assumptions about the factors market participants would use in determining fair value of the securities or instruments and would be based on the best available information. |
The following is a summary of the tiered valuation input levels, as of December 31, 2019. The level assigned to the securities valuations may not be an indication of the risk or liquidity associated with investing in those securities. Because of the inherent uncertainties of valuation, the values reflected in the financial statements may materially differ from the value received upon actual sale of those investments.
| | | | | | | | | | | | | | | | |
| | | Level 1 | | | Level 2 | | | Level 3 | | | Total | |
Investments in Securities | | | | | | | | | | | | | | | | |
| |
Common Stocks & Other Equity Interests | | $ | 618,366,025 | | | $ | 35,199,871 | | | | $– | | | $ | 653,565,896 | |
| |
Money Market Funds | | | 838,572 | | | | – | | | | – | | | | 838,572 | |
| |
Total Investments | | $ | 619,204,597 | | | $ | 35,199,871 | | | | $– | | | $ | 654,404,468 | |
| |
NOTE 4–Security Transactions with Affiliated Funds
The Fund is permitted to purchase or sell securities from or to certain other Invesco Funds under specified conditions outlined in procedures adopted by the Board of Trustees of the Trust. The procedures have been designed to ensure that any purchase or sale of securities by the Fund from or to another fund or portfolio that is or could be considered an affiliate by virtue of having a common investment adviser (or affiliated investment advisers), common Trustees and/or common officers complies with Rule17a-7 of the 1940 Act. Further, as defined under the procedures, each transaction is effected at the current market price. Pursuant to these procedures, for the year ended December 31, 2019, the Fund engaged in securities purchases of $1,968,223 and securities sales of $19,702, which resulted in net realized gains (losses) of $(3,962).
Invesco V.I. American Franchise Fund
NOTE 5–Trustees’ and Officers’ Fees and Benefits
Trustees’ and Officers’ Fees and Benefits include amounts accrued by the Fund to pay remuneration to certain Trustees and Officers of the Fund. Trustees have the option to defer compensation payable by the Fund, andTrustees’ and Officers’ Fees and Benefits also include amounts accrued by the Fund to fund such deferred compensation amounts. Those Trustees who defer compensation have the option to select various Invesco Funds in which their deferral accounts shall be deemed to be invested. Finally, certain current Trustees were eligible to participate in a retirement plan that provided for benefits to be paid upon retirement to Trustees over a period of time based on the number of years of service. The Fund may have certain former Trustees who also participate in a retirement plan and receive benefits under such plan.Trustees’ and Officers’ Fees and Benefits include amounts accrued by the Fund to fund such retirement benefits. Obligations under the deferred compensation and retirement plans represent unsecured claims against the general assets of the Fund.
NOTE 6–Cash Balances
The Fund is permitted to temporarily carry a negative or overdrawn balance in its account with SSB, the custodian bank. Such balances, if any atperiod-end, are shown in the Statement of Assets and Liabilities under the payable caption Amount due custodian. To compensate the custodian bank for such overdrafts, the overdrawn Fund may either (1) leave funds as a compensating balance in the account so the custodian bank can be compensated by earning the additional interest; or (2) compensate by paying the custodian bank at a rate agreed upon by the custodian bank and Invesco, not to exceed the contractually agreed upon rate.
NOTE 7–Distributions to Shareholders and Tax Components of Net Assets
Tax Character of Distributions to Shareholders Paid During the Fiscal Years Ended December 31, 2019 and 2018:
| | | | | | | | |
| | | 2019 | | | 2018 | |
Ordinary income | | $ | 1,304,602 | | | $ | 3,547,796 | |
| |
Long-term capital gain | | | 85,098,579 | | | | 36,487,618 | |
| |
Total distributions | | $ | 86,403,181 | | | $ | 40,035,414 | |
| |
Tax Components of Net Assets atPeriod-End:
| | | | |
| | | 2019 | |
Undistributed ordinary income | | $ | 457,859 | |
| |
Undistributed long-term capital gain | | | 49,537,789 | |
| |
Net unrealized appreciation – investments | | | 324,202,325 | |
| |
Net unrealized appreciation (depreciation) - foreign currencies | | | (3,017 | ) |
| |
Temporary book/tax differences | | | (287,860 | ) |
| |
Shares of beneficial interest | | | 278,679,682 | |
| |
Total net assets | | $ | 652,586,778 | |
| |
The difference between book-basis andtax-basis unrealized appreciation (depreciation) is due to differences in the timing of recognition of gains and losses on investments for tax and book purposes. The Fund’s net unrealized appreciation difference is attributable primarily to wash sales and straddles.
The temporary book/tax differences are a result of timing differences between book and tax recognition of income and/or expenses. The Fund’s temporary book/tax differences are the result of the trustee deferral of compensation and retirement plan benefits.
Capital loss carryforward is calculated and reported as of a specific date. Results of transactions and other activity after that date may affect the amount of capital loss carryforward actually available for the Fund to utilize. Capital losses generated in years beginning after December 22, 2010 can be carried forward for an unlimited period, whereas previous losses expire in eight tax years. Capital losses with an expiration period may not be used to offset capital gains until all net capital losses without an expiration date have been utilized. Capital loss carryforwards with no expiration date will retain their character as either short-term or long-term capital losses instead of as short-term capital losses as under prior law. The ability to utilize capital loss carryforwards in the future may be limited under the Internal Revenue Code and related regulations based on the results of future transactions.
The Fund does not have a capital loss carryforward as of December 31, 2019.
NOTE 8–Investment Transactions
The aggregate amount of investment securities (other than short-term securities, U.S. Treasury obligations and money market funds, if any) purchased and sold by the Fund during the year ended December 31, 2019 was $243,250,309 and $307,792,150, respectively. Cost of investments, including any derivatives, on a tax basis includes the adjustments for financial reporting purposes as of the most recently completed federal income tax reportingperiod-end.
| | | | |
| Unrealized Appreciation (Depreciation) of Investments on a Tax Basis | | | |
Aggregate unrealized appreciation of investments | | $ | 325,463,687 | |
| |
Aggregate unrealized (depreciation) of investments | | | (1,261,362 | ) |
| |
Net unrealized appreciation of investments | | $ | 324,202,325 | |
| |
| |
Cost of investments for tax purposes is $330,202,143. | | | | |
Invesco V.I. American Franchise Fund
NOTE 9–Reclassification of Permanent Differences
Primarily as a result of differing book/tax treatment of foreign currency transactions, on December 31, 2019, undistributed net investment income was decreased by $21,070 and undistributed net realized gain was increased by $21,070. This reclassification had no effect on the net assets or the distributable earnings of the Fund.
NOTE 10–Share Information
| | | | | | | | | | | | | | | | |
| | | Summary of Share Activity | |
| | | Year ended
December 31, 2019(a) | | | Year ended
December 31, 2018 | |
| | | Shares | | | Amount | | | Shares | | | Amount | |
Sold: | | | | | | | | | | | | | | | | |
Series I | | | 288,463 | | | $ | 19,234,264 | | | | 309,111 | | | $ | 20,899,475 | |
| |
Series II | | | 178,715 | | | | 11,199,246 | | | | 172,561 | | | | 11,056,980 | |
| |
| | | | |
Issued as reinvestment of dividends: | | | | | | | | | | | | | | | | |
Series I | | | 1,061,073 | | | | 64,492,029 | | | | 428,393 | | | | 29,906,066 | |
| |
Series II | | | 378,562 | | | | 21,911,152 | | | | 150,914 | | | | 10,129,348 | |
| |
| | | | |
Reacquired: | | | | | | | | | | | | | | | | |
Series I | | | (1,137,749 | ) | | | (75,438,499 | ) | | | (1,448,513 | ) | | | (97,650,766 | ) |
| |
Series II | | | (445,184 | ) | | | (28,300,669 | ) | | | (709,185 | ) | | | (45,451,232 | ) |
| |
Net increase (decrease) in share activity | | | 323,880 | | | $ | 13,097,523 | | | | (1,096,719 | ) | | $ | (71,110,129 | ) |
| |
| (a) | There are entities that are record owners of more than 5% of the outstanding shares of the Fund and in the aggregate own 28% of the outstanding shares of the Fund. The Fund and the Fund’s principal underwriter or adviser, are parties to participation agreements with these entities whereby these entities sell units of interest in separate accounts funding variable products that are invested in the Fund. The Fund, Invesco and/or Invesco affiliates may make payments to these entities, which are considered to be related to the Fund, for providing services to the Fund, Invesco and/or Invesco affiliates including but not limited to services such as, securities brokerage, third party record keeping and account servicing and administrative services. The Fund has no knowledge as to whether all or any portion of the shares owned of record by these entities are also owned beneficially. |
Invesco V.I. American Franchise Fund
Report of Independent Registered Public Accounting Firm
To the Board of Trustees of AIM Variable Insurance Funds (Invesco Variable Insurance Funds) and Shareholders of Invesco V.I. American Franchise Fund
Opinion on the Financial Statements
We have audited the accompanying statement of assets and liabilities, including the schedule of investments, of Invesco V.I. American Franchise Fund (one of the funds constituting AIM Variable Insurance Funds (Invesco Variable Insurance Funds), referred to hereafter as the “Fund”) as of December 31, 2019, the related statement of operations for the year ended December 31, 2019, the statement of changes in net assets for each of the two years in the period ended December 31, 2019, including the related notes, and the financial highlights for each of the five years in the period ended December 31, 2019 (collectively referred to as the “financial statements”). In our opinion, the financial statements present fairly, in all material respects, the financial position of the Fund as of December 31, 2019, the results of its operations for the year then ended, the changes in its net assets for each of the two years in the period ended December 31, 2019 and the financial highlights for each of the five years in the period ended December 31, 2019 in conformity with accounting principles generally accepted in the United States of America.
Basis for Opinion
These financial statements are the responsibility of the Fund’s management. Our responsibility is to express an opinion on the Fund’s financial statements based on our audits. We are a public accounting firm registered with the Public Company Accounting Oversight Board (United States) (PCAOB) and are required to be independent with respect to the Fund in accordance with the U.S. federal securities laws and the applicable rules and regulations of the Securities and Exchange Commission and the PCAOB.
We conducted our audits of these financial statements in accordance with the standards of the PCAOB. Those standards require that we plan and perform the audit to obtain reasonable assurance about whether the financial statements are free of material misstatement, whether due to error or fraud.
Our audits included performing procedures to assess the risks of material misstatement of the financial statements, whether due to error or fraud, and performing procedures that respond to those risks. Such procedures included examining, on a test basis, evidence regarding the amounts and disclosures in the financial statements. Our audits also included evaluating the accounting principles used and significant estimates made by management, as well as evaluating the overall presentation of the financial statements. Our procedures included confirmation of securities owned as of December 31, 2019 by correspondence with the custodian and transfer agent. We believe that our audits provide a reasonable basis for our opinion.
/s/PricewaterhouseCoopers LLP
Houston, Texas
February 18, 2020
We have served as the auditor of one or more of the investment companies in the Invesco group of investment companies since at least 1995. We have not been able to determine the specific year we began serving as auditor.
Invesco V.I. American Franchise Fund
Calculating your ongoing Fund expenses
Example
As a shareholder of the Fund, you incur ongoing costs, including management fees; distribution and/or service fees(12b-1); and other Fund expenses. This example is intended to help you understand your ongoing costs (in dollars) of investing in the Fund and to compare these costs with ongoing costs of investing in other mutual funds. The example is based on an investment of $1,000 invested at the beginning of the period and held for the entire period July 1, 2019 through December 31, 2019.
The actual and hypothetical expenses in the examples below do not represent the effect of any fees or other expenses assessed in connection with a variable product; if they did, the expenses shown would be higher while the ending account values shown would be lower.
Actual expenses
The table below provides information about actual account values and actual expenses. You may use the information in this table, together with the amount you invested, to estimate the expenses that you paid over the period. Simply divide your account value by $1,000 (for example, an $8,600 account value divided by $1,000 = 8.6), then multiply the result by the number in the table under the heading entitled “Actual Expenses Paid During Period” to estimate the expenses you paid on your account during this period.
Hypothetical example for comparison purposes
The table below also provides information about hypothetical account values and hypothetical expenses based on the Fund’s actual expense ratio and an assumed rate of return of 5% per year before expenses, which is not the Fund’s actual return.
The hypothetical account values and expenses may not be used to estimate the actual ending account balance or expenses you paid for the period. You may use this information to compare the ongoing costs of investing in the Fund and other funds. To do so, compare this 5% hypothetical example with the 5% hypothetical examples that appear in the shareholder reports of the other funds.
Please note that the expenses shown in the table are meant to highlight your ongoing costs. Therefore, the hypothetical information is useful in comparing ongoing costs, and will not help you determine the relative total costs of owning different funds.
| | | | | | | | | | | | |
| | | Beginning
Account Value
(07/01/19) | | ACTUAL | | HYPOTHETICAL (5% annual return before
expenses) | | Annualized
Expense Ratio |
| | Ending
Account Value
(12/31/19)1 | | Expenses
Paid During
Period2 | | Ending
Account Value
(12/31/19) | | Expenses
Paid During
Period2 |
| Series I | | $1,000.00 | | $1,114.10 | | $4.58 | | $1,020.87 | | $4.38 | | 0.86% |
| Series II | | 1,000.00 | | 1,112.60 | | 5.91 | | 1,019.61 | | 5.65 | | 1.11 |
| 1 | The actual ending account value is based on the actual total return of the Fund for the period July 1, 2019 through December 31, 2019, after actual expenses and will differ from the hypothetical ending account value which is based on the Fund’s expense ratio and a hypothetical annual return of 5% before expenses. |
| 2 | Expenses are equal to the Fund’s annualized expense ratio as indicated above multiplied by the average account value over the period, multiplied by 184/365 to reflect the most recent fiscal half year. |
Invesco V.I. American Franchise Fund
Tax Information
Form1099-DIV, Form1042-S and other year–end tax information provide shareholders with actual calendar year amounts that should be included in their tax returns. Shareholders should consult their tax advisers.
The following distribution information is being provided as required by the Internal Revenue Code or to meet a specific state’s requirement.
The Fund designates the following amounts or, if subsequently determined to be different, the maximum amount allowable for its fiscal year ended December 31, 2019:
| | | | | | | | |
| Federal and State Income Tax | | | | |
Long-term Capital Gain Distribution | | $ | 85,098,579 | | | | | |
Corporate Dividends Received Deduction* | | | 100.00 | % | | | | |
U.S. Treasury Obligations* | | | 0.00 | % | | | | |
| | * | The above percentages are based on ordinary income dividends paid to shareholders during the Fund’s fiscal year. |
Invesco V.I. American Franchise Fund
Trustees and Officers
The address of each trustee and officer is AIM Variable Insurance Funds (Invesco Variable Insurance Funds) (the “Trust”), 11 Greenway Plaza, Suite 1000, Houston, Texas 77046-1173. The trustees serve for the life of the Trust, subject to their earlier death, incapacitation, resignation, retirement or removal as more specifically provided in the Trust’s organizational documents. Each officer serves for a one year term or until their successors are elected and qualified. Column two below includes length of time served with predecessor entities, if any.
| | | | | | | | |
Name, Year of Birth and
Position(s)
Held with the Trust | | Trustee
and/or
Officer
Since | | Principal Occupation(s)
During Past 5 Years | | Number of
Funds in
Fund Complex
Overseen by
Trustee | | Other
Directorship(s)
Held by Trustee
During Past 5
Years |
| Interested Person | | | | | | | | |
Martin L. Flanagan1– 1960
Trustee and Vice Chair | | 2007 | | Executive Director, Chief Executive Officer and President, Invesco Ltd. (ultimate parent of Invesco and a global investment management firm); Trustee and Vice Chair, The Invesco Funds; Vice Chair, Investment Company Institute; and Member of Executive Board, SMU Cox School of Business Formerly: Advisor to the Board, Invesco Advisers, Inc. (formerly known as Invesco Institutional (N.A.), Inc.); Chairman and Chief Executive Officer, Invesco Advisers, Inc. (registered investment adviser); Director, Chairman, Chief Executive Officer and President, Invesco Holding Company (US), Inc. (formerly IVZ Inc.) (holding company), Invesco Group Services, Inc. (service provider) and Invesco North American Holdings, Inc. (holding company); Director, Chief Executive Officer and President, Invesco Holding Company Limited (parent of Invesco and a global investment management firm); Director, Invesco Ltd.; Chairman, Investment Company Institute and President,Co-Chief Executive Officer,Co-President, Chief Operating Officer and Chief Financial Officer, Franklin Resources, Inc. (global investment management organization) | | 229 | | None |
| 1 | Mr. Flanagan is considered an interested person (within the meaning of Section 2(a)(19) of the 1940 Act) of the Trust because he is an officer of the Adviser to the Trust, and an officer and a director of Invesco Ltd., ultimate parent of the Adviser. |
Invesco V.I. American Franchise Fund
Trustees and Officers–(continued)
| | | | | | | | |
Name, Year of Birth and
Position(s)
Held with the Trust | | Trustee
and/or
Officer
Since | | Principal Occupation(s)
During Past 5 Years | | Number of
Funds
in
Fund Complex
Overseen by
Trustee | | Other
Directorship(s)
Held by Trustee
During Past 5
Years |
| Independent Trustees | | | | | | | | |
Bruce L. Crockett - 1944
Trustee and Chair | | 1993 | | Chairman, Crockett Technologies Associates (technology consulting company) Formerly: Director, Captaris (unified messaging provider); Director, President and Chief Executive Officer, COMSAT Corporation; Chairman, Board of Governors of INTELSAT (international communications company); ACE Limited (insurance company); Independent Directors Council and Investment Company Institute: Member of the Audit Committee, Investment Company Institute; Member of the Executive Committee and Chair of the Governance Committee, Independent Directors Council | | 229 | | Director and Chairman of the Audit Committee, ALPS (Attorneys Liability Protection Society) (insurance company); Director and Member of the Audit Committee and Compensation Committee, Ferroglobe PLC (metallurgical company) |
David C. Arch - 1945
Trustee | | 2010 | | Chairman of Blistex Inc. (consumer health care products manufacturer); Member, World Presidents’ Organization | | 229 | | Board member of the Illinois Manufacturers’ Association |
Beth Ann Brown - 1968
Trustee | | 2019 | | Independent Consultant Formerly: Head of Intermediary Distribution, Managing Director, Strategic Relations, Managing Director, Head of National Accounts, Senior Vice President, National Account Manager and Senior Vice President, Key Account Manager, Columbia Management Investment Advisers LLC; Vice President, Key Account Manager, Liberty Funds Distributor, Inc.; and Trustee of certain Oppenheimer Funds | | 229 | | Director, Board of Directors of Caron Engineering Inc.; Advisor, Board of Advisors of Caron Engineering Inc.; President and Director, Acton Shapleigh Youth Conservation Corps (non-profit); and Vice President and Director of Grahamtastic Connection(non-profit) |
Jack M. Fields - 1952
Trustee | | 1997 | | Chief Executive Officer, Twenty First Century Group, Inc. (government affairs company); and Chairman, Discovery Learning Alliance(non-profit) Formerly: Owner and Chief Executive Officer, Dos Angeles Ranch L.P. (cattle, hunting, corporate entertainment); Director, Insperity, Inc. (formerly known as Administaff) (human resources provider); Chief Executive Officer, Texana Timber LP (sustainable forestry company); Director of Cross Timbers Quail Research Ranch(non-profit); and member of the U.S. House of Representatives | | 229 | | None |
Invesco V.I. American Franchise Fund
Trustees and Officers–(continued)
| | | | | | | | |
Name, Year of Birth and
Position(s)
Held with the Trust | | Trustee
and/or
Officer
Since | | Principal Occupation(s)
During Past 5 Years | | Number of
Funds
in
Fund Complex
Overseen by
Trustee | | Other
Directorship(s)
Held by Trustee
During Past 5 Years |
| Independent Trustees–(continued) | | | | |
Cynthia Hostetler – 1962
Trustee | | 2017 | | Non-Executive Director and Trustee of a number of public and private business corporations Formerly: Director, Aberdeen Investment Funds (4 portfolios); Head of Investment Funds and Private Equity, Overseas Private Investment Corporation; President, First Manhattan Bancorporation, Inc.; Attorney, Simpson Thacher & Bartlett LLP | | 229 | | Vulcan Materials Company (construction materials company); Trilinc Global Impact Fund; Genesee & Wyoming, Inc. (railroads); Artio Global Investment LLC (mutual fund complex); Edgen Group, Inc. (specialized energy and infrastructure products distributor); Investment Company Institute (professional organization); Independent Directors Council (professional organization) |
Eli Jones - 1961
Trustee | | 2016 | | Professor and Dean, Mays Business School - Texas A&M University Formerly: Professor and Dean, Walton College of Business, University of Arkansas and E.J. Ourso College of Business, Louisiana State University; Director, Arvest Bank | | 229 | | Insperity, Inc. (formerly known as Administaff) (human resources provider) |
Elizabeth Krentzman - 1959
Trustee | | 2019 | | Formerly: Principal and Chief Regulatory Advisor for Asset Management Services and U.S. Mutual Fund Leader of Deloitte & Touche LLP; General Counsel of the Investment Company Institute (trade association); National Director of the Investment Management Regulatory Consulting Practice, Principal, Director and Senior Manager of Deloitte & Touche LLP; Assistant Director of the Division of Investment Management - Office of Disclosure and Investment Adviser Regulation of the U.S. Securities and Exchange Commission and various positions with the Division of Investment Management - Office of Regulatory Policy of the U.S. Securities and Exchange Commission; Associate at Ropes & Gray LLP; Advisory Board Member of the Securities and Exchange Commission Historical Society; and Trustee of certain Oppenheimer Funds | | 229 | | Trustee of the University of Florida National Board Foundation and Audit Committee Member; Member of the Cartica Funds Board of Directors (private investment funds); Member of the University of Florida Law Center Association, Inc. Board of Trustees and Audit Committee Member |
Anthony J. LaCava, Jr. - 1956
Trustee | | 2019 | | Formerly: Director and Member of the Audit Committee, Blue Hills Bank (publicly traded financial institution) and Managing Partner, KPMG LLP | | 229 | | Blue Hills Bank; Chairman, Bentley University; Member, Business School Advisory Council; and Nominating Committee KPMG LLP |
Prema Mathai-Davis - 1950
Trustee | | 1998 | | Retired Co-Owner & Partner of Quantalytics Research, LLC, (a FinTech Investment Research Platform for the Self-Directed Investor) | | 229 | | None |
Invesco V.I. American Franchise Fund
Trustees and Officers–(continued)
| | | | | | | | |
Name, Year of Birth and
Position(s)
Held with the Trust | | Trustee
and/or
Officer
Since | | Principal Occupation(s)
During Past 5 Years | | Number of
Funds
in
Fund Complex
Overseen by
Trustee | | Other
Directorship(s)
Held by Trustee
During Past 5 Years |
| Independent Trustees–(continued) | | | | |
Joel W. Motley - 1952
Trustee | | 2019 | | Director of Office of Finance, Federal Home Loan Bank; Member of the Vestry of Trinity Wall Street; Managing Director of Carmona Motley Inc. (privately held financial advisor); Member of the Finance and Budget Committee of the Council on Foreign Relations, Member of the Investment Committee and Board of Human Rights Watch and Member of the Investment Committee and Board of Historic Hudson Valley(non-profit cultural organization) Formerly: Managing Director of Public Capital Advisors, LLC (privately held financial advisor); Managing Director of Carmona Motley Hoffman, Inc. (privately held financial advisor); Trustee of certain Oppenheimer Funds; and Director of Columbia Equity Financial Corp. (privately held financial advisor) | | 229 | | Director of Greenwall Foundation (bioethics research foundation); Member of Board and Investment Committee of The Greenwall Foundation; Director of Southern Africa Legal Services Foundation; Board Member and Investment Committee Member of Pulizer Center for Crisis Reporting(non-profit journalism) |
Teresa M. Ressel - 1962
Trustee | | 2017 | | Non-executive director and trustee of a number of public and private business corporations Formerly: Chief Financial Officer, Olayan America, The Olayan Group (international investor/commercial/industrial); Chief Executive Officer, UBS Securities LLC; Group Chief Operating Officer, Americas, UBS AG; Assistant Secretary for Management & Budget and CFO, US Department of the Treasury | | 229 | | Atlantic Power Corporation (power generation company); ON Semiconductor Corp. (semiconductor supplier) |
Ann Barnett Stern - 1957
Trustee | | 2017 | | President and Chief Executive Officer, Houston Endowment Inc. (private philanthropic institution) Formerly: Executive Vice President and General Counsel, Texas Children’s Hospital; Attorney, Beck, Redden and Secrest, LLP; Business Law Instructor, University of St. Thomas; Attorney, Andrews & Kurth LLP | | 229 | | Federal Reserve Bank of Dallas |
Robert C. Troccoli - 1949
Trustee | | 2016 | | Retired | | 229 | | None |
Daniel S. Vandivort - 1954
Trustee | | 2019 | | Treasurer, Chairman of the Audit and Finance Committee, and Trustee, Board of Trustees, Huntington Disease Foundation of America; and President, Flyway Advisory Services LLC (consulting and property management) Formerly: Trustee and Governance Chair, of certain Oppenheimer Funds | | 229 | | Chairman and Lead Independent Director, Chairman of the Audit Committee, and Director, Board of Directors, Value Line Funds |
James D. Vaughn - 1945
Trustee | | 2019 | | Retired Formerly: Managing Partner, Deloitte & Touche LLP; Trustee and Chairman of the Audit Committee, Schroder Funds; Board Member, Mile High United Way, Boys and Girls Clubs, Boy Scouts, Colorado Business Committee for the Arts, Economic Club of Colorado and Metro Denver Network (economic development corporation); and Trustee of certain Oppenheimer Funds | | 229 | | Board member and Chairman of Audit Committee of AMG National Trust Bank; Trustee and Investment Committee member, University of South Dakota Foundation; Board member, Audit Committee Member and past Board Chair, Junior Achievement(non-profit) |
Invesco V.I. American Franchise Fund
Trustees and Officers–(continued)
| | | | | | | | |
Name, Year of Birth and
Position(s)
Held with the Trust | | Trustee
and/or
Officer
Since | | Principal Occupation(s)
During Past 5 Years | | Number of
Funds
in
Fund Complex
Overseen by
Trustee | | Other
Directorship(s)
Held by Trustee
During Past 5 Years |
| Independent Trustees–(continued) | | | | |
Christopher L. WIlson - 1957
Trustee, Vice Chair and Chair Designate | | 2017 | | Retired Formerly: Director, TD Asset Management USA Inc. (mutual fund complex) (22 portfolios); Managing Partner, CT2, LLC (investing and consulting firm); President/Chief Executive Officer, Columbia Funds, Bank of America Corporation; President/Chief Executive Officer, CDC IXIS Asset Management Services, Inc.; Principal & Director of Operations, Scudder Funds, Scudder, Stevens & Clark, Inc.; Assistant Vice President, Fidelity Investments | | 229 | | ISO New England, Inc.(non-profit organization managing regional electricity market) |
Invesco V.I. American Franchise Fund
Trustees and Officers–(continued)
| | | | | | | | |
Name, Year of Birth and
Position(s)
Held with the Trust | | Trustee
and/or
Officer
Since | | Principal Occupation(s)
During Past 5 Years | | Number of
Funds in
Fund Complex
Overseen by
Trustee | | Other
Directorship(s)
Held by Trustee
During Past 5 Years |
| Officers | | | | |
| Sheri Morris – 1964 President, Principal Executive Officer and Treasurer | | 1999 | | Head of Global Fund Services, Invesco Ltd.; President, Principal Executive Officer and Treasurer, The Invesco Funds; Vice President, Invesco Advisers, Inc. (formerly known as Invesco Institutional (N.A.), Inc.) (registered investment adviser); and Vice President, Invesco Exchange-Traded Fund Trust, Invesco Exchange-Traded Fund Trust II, Invesco India Exchange-Traded Fund Trust, Invesco Actively Managed Exchange-Traded Fund Trust, Invesco Actively Managed Exchange-Traded Commodity Fund Trust and Invesco Exchange-Traded Self-Indexed Fund Trust; and Vice President, OppenheimerFunds, Inc. Formerly: Vice President and Principal Financial Officer, The Invesco Funds; Vice President, Invesco AIM Advisers, Inc., Invesco AIM Capital Management, Inc. and Invesco AIM Private Asset Management, Inc.; Assistant Vice President and Assistant Treasurer, The Invesco Funds and Assistant Vice President, Invesco Advisers, Inc., Invesco AIM Capital Management, Inc. and Invesco AIM Private Asset Management, Inc.; and Treasurer, Invesco Exchange-Traded Fund Trust, Invesco Exchange-Traded Fund Trust II, Invesco India Exchange-Traded Fund Trust and Invesco Actively Managed Exchange-Traded Fund Trust | | N/A | | N/A |
| Russell C. Burk – 1958 Senior Vice President and Senior Officer | | 2005 | | Senior Vice President and Senior Officer, The Invesco Funds | | N/A | | N/A |
| Jeffrey H. Kupor -1968 Senior Vice President, Chief Legal Officer and Secretary | | 2018 | | Head of Legal of the Americas, Invesco Ltd.; Senior Vice President and Secretary, Invesco Advisers, Inc. (formerly known as Invesco Institutional (N.A.), Inc.) (registered investment adviser); Senior Vice President and Secretary, Invesco Distributors, Inc. (formerly known as Invesco AIM Distributors, Inc.); Vice President and Secretary, Invesco Investment Services, Inc. (formerly known as Invesco AIM Investment Services, Inc.) Senior Vice President, Chief Legal Officer and Secretary, The Invesco Funds; Secretary and General Counsel, Invesco Investment Advisers LLC (formerly known as Van Kampen Asset Management); Secretary and General Counsel, Invesco Capital Markets, Inc. (formerly known as Van Kampen Funds Inc.) and Chief Legal Officer, Invesco Exchange-Traded Fund Trust, Invesco Exchange-Traded Fund Trust II, Invesco India Exchange-Traded Fund Trust, Invesco Actively Managed Exchange-Traded Fund Trust, Invesco Actively Managed Exchange-Traded Commodity Fund Trust and Invesco Exchange-Traded Self-Indexed Fund Trust; Secretary, Invesco Indexing LLC; Secretary, W.L. Ross & Co., LLC Formerly: Secretary and Vice President, Jemstep, Inc.; Head of Legal, Worldwide Institutional, Invesco Ltd.; Secretary and General Counsel, INVESCO Private Capital Investments, Inc.; Senior Vice President, Secretary and General Counsel, Invesco Management Group, Inc. (formerly known as Invesco AIM Management Group, Inc.); Assistant Secretary, INVESCO Asset Management (Bermuda) Ltd.; Secretary and General Counsel, Invesco Private Capital, Inc.; Assistant Secretary and General Counsel, INVESCO Realty, Inc.; Secretary and General Counsel, Invesco Senior Secured Management, Inc.; and Secretary, Sovereign G./P. Holdings Inc. | | N/A | | N/A |
Andrew R. Schlossberg- 1974
Senior Vice President | | 2019 | | Head of the Americas and Senior Managing Director, Invesco Ltd.; Director and Senior Vice President, Invesco Advisers, Inc. (formerly known as Invesco Institutional (N.A.), Inc.) (registered investment adviser); Director and Chairman, Invesco Investment Services, Inc. (formerly known as Invesco AIM Investment Services, Inc.) (registered transfer agent); Senior Vice President, The Invesco Funds; Director, Invesco Investment Advisers LLC (formerly known as Van Kampen Asset Management); Director, President and Chairman, Invesco Insurance Agency, Inc. Formerly: Director, Invesco UK Limited; Director and Chief Executive, Invesco Asset Management Limited and Invesco Fund Managers Limited; Assistant Vice President, The Invesco Funds; Senior Vice President, Invesco Advisers, Inc. (formerly known as Invesco Institutional (N.A.), Inc.) (registered investment adviser); Director and Chief Executive, Invesco Administration Services Limited and Invesco Global Investment Funds Limited; Director, Invesco Distributors, Inc.; Head of EMEA, Invesco Ltd.; President, Invesco Actively Managed Exchange-Traded Commodity Fund Trust, Invesco Actively Managed Exchange-Traded Fund Trust, Invesco Exchange-Traded Fund Trust, Invesco Exchange-Traded Fund Trust II and Invesco India Exchange-Traded Fund Trust; Managing Director and Principal Executive Officer, Invesco Capital Management LLC | | N/A | | N/A |
Invesco V.I. American Franchise Fund
Trustees and Officers–(continued)
| | | | | | | | |
Name, Year of Birth and
Position(s)
Held with the Trust | | Trustee
and/or
Officer
Since | | Principal Occupation(s)
During Past 5 Years | | Number of
Funds in
Fund Complex
Overseen by
Trustee | | Other
Directorship(s)
Held by Trustee
During Past 5
Years |
| Officers–(continued) | | | | |
John M. Zerr - 1962
Senior Vice President | | 2006 | | Chief Operating Officer of the Americas; Senior Vice President, Invesco Advisers, Inc. (formerly known as Invesco Institutional (N.A.), Inc.) (registered investment adviser); Senior Vice President, Invesco Distributors, Inc. (formerly known as Invesco AIM Distributors, Inc.); Director and Vice President, Invesco Investment Services, Inc. (formerly known as Invesco AIM Investment Services, Inc.) Senior Vice President, The Invesco Funds; Managing Director, Invesco Capital Management LLC; Director, Invesco Investment Advisers LLC (formerly known as Van Kampen Asset Management); Senior Vice President, Invesco Capital Markets, Inc. (formerly known as Van Kampen Funds Inc.); Manager, Invesco Indexing LLC; Manager, Invesco Specialized Products, LLC; Director and Senior Vice President, Invesco Insurance Agency, Inc.; Member, Invesco Canada Funds Advisory Board; Director, President and Chief Executive Officer, Invesco Corporate Class Inc. (corporate mutual fund company); and Director, Chairman, President and Chief Executive Officer, Invesco Canada Ltd. (formerly known as Invesco Trimark Ltd./Invesco Trimark Ltèe) (registered investment adviser and registered transfer agent) Formerly: Director and Senior Vice President, Invesco Management Group, Inc. (formerly known as Invesco AIM Management Group, Inc.); Secretary and General Counsel, Invesco Management Group, Inc. (formerly known as Invesco AIM Management Group, Inc.); Secretary, Invesco Investment Services, Inc. (formerly known as Invesco AIM Investment Services, Inc.); Chief Legal Officer and Secretary, The Invesco Funds; Secretary and General Counsel, Invesco Investment Advisers LLC (formerly known as Van Kampen Asset Management); Secretary and General Counsel, Invesco Capital Markets, Inc. (formerly known as Van Kampen Funds Inc.); Chief Legal Officer, Invesco Exchange-Traded Fund Trust, Invesco Exchange-Traded Fund Trust II, Invesco India Exchange-Traded Fund Trust, Invesco Actively Managed Exchange-Traded Fund Trust, Invesco Actively Managed Exchange-Traded Commodity Fund Trust and Invesco Exchange-Traded Self-Indexed Fund Trust; Secretary, Invesco Indexing LLC; Director, Secretary, General Counsel and Senior Vice President, Van Kampen Exchange Corp.; Director, Vice President and Secretary, IVZ Distributors, Inc. (formerly known as INVESCO Distributors, Inc.); Director and Vice President, INVESCO Funds Group, Inc.; Director and Vice President, Van Kampen Advisors Inc.; Director, Vice President, Secretary and General Counsel, Van Kampen Investor Services Inc.;Director and Secretary, Invesco Distributors, Inc. (formerly known as Invesco AIM Distributors, Inc.); Director, Senior Vice President, General Counsel and Secretary, Invesco AIM Advisers, Inc. and Van Kampen Investments Inc.; Director, Vice President and Secretary, Fund Management Company; Director, Senior Vice President, Secretary, General Counsel and Vice President, Invesco AIM Capital Management, Inc.; Chief Operating Officer and General Counsel, Liberty Ridge Capital, Inc. (an investment adviser) | | N/A | | N/A |
Gregory G. McGreevey- 1962
Senior Vice President | | 2012 | | Senior Managing Director, Invesco Ltd.; Director, Chairman, President, and Chief Executive Officer, Invesco Advisers, Inc. (formerly known as Invesco Institutional (N.A.), Inc.) (registered investment adviser); Director, Invesco Mortgage Capital, Inc. and Invesco Senior Secured Management, Inc.; and Senior Vice President, The Invesco Funds; and President, SNW Asset Management Corporation Formerly: Senior Vice President, Invesco Management Group, Inc. and Invesco Advisers, Inc.; Assistant Vice President, The Invesco Funds | | N/A | | N/A |
| Kelli Gallegos - 1970 Vice President, Principal Financial Officer and Assistant Treasurer | | 2008 | | Principal Financial and Accounting Officer – Investments Pool, Invesco Specialized Products, LLC; Vice President, Principal Financial Officer and Assistant Treasurer, The Invesco Funds; Principal Financial and Accounting Officer – Pooled Investments, Invesco Capital Management LLC; Vice President and Treasurer, Invesco Exchange-Traded Fund Trust, Invesco Exchange-Traded Fund Trust II, Invesco India Exchange-Traded Fund Trust, Invesco Actively Managed Exchange-Traded Fund Trust, Invesco Actively Managed Exchange-Traded Commodity Fund Trust and Invesco Exchange-Traded Self-Indexed Fund Trust Formerly: Assistant Treasurer, Invesco Specialized Products, LLC; Assistant Treasurer, Invesco Exchange-Traded Fund Trust, Invesco Exchange-Traded Fund Trust II, Invesco India Exchange-Traded Fund Trust, Invesco Actively Managed Exchange-Traded Fund Trust, Invesco Actively Managed Exchange-Traded Commodity Fund Trust and Invesco Exchange-Traded Self-Indexed Fund Trust; Assistant Treasurer, Invesco Capital Management LLC; Assistant Vice President, The Invesco Funds | | N/A | | N/A |
Invesco V.I. American Franchise Fund
Trustees and Officers–(continued)
| | | | | | | | |
Name, Year of Birth and
Position(s)
Held with the Trust | | Trustee
and/or
Officer
Since | | Principal Occupation(s)
During Past 5 Years | | Number of
Funds in
Fund Complex
Overseen by
Trustee | | Other
Directorship(s)
Held by Trustee
During Past 5
Years |
| Officers–(continued) | | | | | | | | |
Crissie M. Wisdom - 1969
Anti-Money Laundering Compliance Officer | | 2013 | | Anti-Money Laundering Compliance Officer, Invesco Advisers, Inc. (formerly known as Invesco Institutional (N.A.), Inc.) (registered investment adviser), Invesco Capital Markets, Inc. (formerly known as Van Kampen Funds Inc.), Invesco Distributors, Inc., Invesco Investment Services, Inc., The Invesco Funds, and Invesco Exchange-Traded Fund Trust, Invesco Exchange-Traded Fund Trust II, Invesco India Exchange-Traded Fund Trust, Invesco Actively Managed Exchange-Traded Fund Trust, Invesco Actively Managed Exchange-Traded Commodity Fund Trust and Invesco Exchange-Traded Self-Indexed Fund Trust; Anti-Money Laundering Compliance Officer and Bank Secrecy Act Officer, INVESCO National Trust Company and Invesco Trust Company; and Fraud Prevention Manager and Controls and Risk Analysis Manager for Invesco Investment Services, Inc. Formerly: Anti-Money Laundering Compliance Officer, Van Kampen Exchange Corp. and Invesco Management Group, Inc. | | N/A | | N/A |
Robert R. Leveille - 1969
Chief Compliance Officer | | 2016 | | Chief Compliance Officer, Invesco Advisers, Inc. (registered investment adviser); and Chief Compliance Officer, The Invesco Funds Formerly: Chief Compliance Officer, Putnam Investments and the Putnam Funds | | N/A | | N/A |
The Statement of Additional Information of the Trust includes additional information about the Fund’s Trustees and is available upon request, without charge, by calling 1.800.959.4246. Please refer to the Fund���s Statement of Additional Information for information on the Fund’ssub-advisers.
| | | | | | |
Office of the Fund
11 Greenway Plaza, Suite 1000 Houston, TX 77046-1173 | | Investment Adviser
Invesco Advisers, Inc. 1555 Peachtree Street, N.E. Atlanta, GA 30309 | | Distributor
Invesco Distributors, Inc. 11 Greenway Plaza, Suite 1000 Houston, TX 77046-1173 | | Auditors
PricewaterhouseCoopers LLP
1000 Louisiana Street, Suite 5800
Houston, TX 77002-5678 |
| | | |
Counsel to the Fund
Stradley Ronon Stevens & Young, LLP 2005 Market Street, Suite 2600 Philadelphia, PA 19103-7018 | | Counsel to the Independent Trustees Goodwin Procter LLP
901 New York Avenue, N.W.
Washington, D.C. 20001 | | Transfer Agent
Invesco Investment Services, Inc. 11 Greenway Plaza, Suite 1000 Houston, TX 77046-1173 | | Custodian
State Street Bank and Trust Company 225 Franklin Street
Boston, MA 02110-2801 |
Invesco V.I. American Franchise Fund
| | | | |
| | |
 | | Annual Report to Shareholders | | December 31, 2019 |
| | |
| | Invesco V.I. American Value Fund |
| | |
| | |

Beginning on January 1, 2021, as permitted by regulations adopted by the Securities and Exchange Commission, the insurance company that offers your variable annuity or variable life insurance contract may no longer send you paper copies of the Fund’s shareholder reports by mail, unless you specifically request paper copies of the reports from the insurance company or your financial intermediary. Instead of delivering paper copies of the report, the insurance company may choose to make the reports available on a website, and will notify you by mail each time a report is posted and provide you with a website link to access the report. Instructions for requesting paper copies will be provided by your insurance company.
If the insurance company offers electronic delivery, you may elect to receive shareholder reports and other communications about the Fund electronically by following the instructions provided by the insurance company or by contacting your financial intermediary. If you already elected to receive shareholder reports electronically, you will not be affected by this change and you need not take any action.
You may elect to receive all future reports in paper free of charge from the insurance company. You can inform the insurance company or your financial intermediary that you wish to continue receiving paper copies of your shareholder reports by following the instructions provided by the insurance company or by contacting your financial intermediary. Your election to receive reports in paper will apply to all portfolio companies available under your contract with the insurance company.
The Fund provides a complete list of its holdings four times in each fiscal year, at the quarter-ends. For the second and fourth quarters, the lists appear in the Fund’s semiannual and annual reports to shareholders. For the first and third quarters, the Fund files the lists with the Securities and Exchange Commission (SEC) as an exhibit to its reports on FormN-PORT. The Fund’s FormN-PORT filings are available on the SEC website, sec.gov. The SEC file numbers for the Fund are811-07452 and033-57340. The Fund’s most recent portfolio holdings, as filed on FormN-PORT, have also been made available to insurance companies issuing variable annuity contracts and variable life insurance policies (“variable products”) that invest in the Fund.
A description of the policies and procedures that the Fund uses to determine how to vote proxies relating to portfolio securities is available without charge, upon request, from our Client Services department at 800 959 4246 or at invesco.com/proxyguidelines. The information is also available on the SEC website, sec.gov.
Information regarding how the Fund voted proxies related to its portfolio securities during the most recent12-month period ended June 30 is available at invesco.com/proxysearch. The information is also available on the SEC website, sec.gov.
Invesco Advisers, Inc. is an investment adviser; it provides investment advisory services to individual and institutional clients and does not sell securities. Invesco Distributors, Inc. is the US distributor for Invesco Ltd.’s retail mutual funds, exchange-traded funds and institutional money market funds. Both are wholly owned, indirect subsidiaries of Invesco Ltd.
This report must be accompanied or preceded by a currently effective Fund prospectus and variable product prospectus, which contain more complete information, including sales charges and expenses. Investors should read each carefully before investing.
NOT FDIC INSURED | MAY LOSE VALUE | NO BANK GUARANTEE
| | |
Invesco Distributors, Inc. | | VK-VIAMVA-AR-1 |
Management’s Discussion of Fund Performance
Performance summary
For the year ended December 31, 2019, Series I shares of Invesco V.I. American Value Fund (the Fund) underperformed the Russell Midcap Value Index, the Fund’s style-specific benchmark.
Your Fund’s long-term performance appears later in this report.
Fund vs. Indexes
Total returns, 12/31/18 to 12/31/19, excluding variable product issuer charges. If variable product issuer charges were included, returns would be lower.
| | | | |
| Series I Shares | | | 25.03 | % |
| Series II Shares | | | 24.71 | |
| S&P 500 Indexq(Broad Market Index) | | | 31.49 | |
| Russell Midcap Value Indexq(Style-Specific Index) | | | 27.06 | |
| Lipper VUF Mid Cap Value Funds Index∎(Peer Group Index) | | | 24.76 | |
| Source(s):qRIMES Technologies Corp.;∎Lipper Inc. | |
Market conditions and your Fund
Equity markets rallied in the first quarter of 2019, fueled by optimism about a potentialUS-China trade deal and indication that the US Federal Reserve (the Fed) would not raise interest rates in 2019, a surprising shift in monetary policy. The Fed’s more accommodative stance provided a supportive environment for equities and fixed income, even as US economic data were mixed and overseas growth appeared to be slowing. Against this backdrop, the S&P 500 Index posted its best first quarter returns since 1998.
Although the S&P 500 Index posted modest gains for the second quarter of 2019, the US stock market experienced increased volatility. After four consecutive months of rising stock markets, the market sold off in May 2019, along with bond yields and oil prices, as investors weighed the impact of the lingering trade war between the US and China, as well as potential tariffs imposed on Mexico. In addition, economic data showed a slowing domestic and global economy.
Key issues that concerned investors in the second quarter of 2019 carried over
into the third quarter. TheUS-China trade conflict worried investors and stifled business investment, even as the Fed cut interest rates by 0.25% in July and again in September 2019.1 This environment, combined with evidence of slowing global economic growth, fueled market volatility in August 2019. The US Treasury yield curve inverted several times, increasing fears of a possible US recession. As a result, August saw increased risk aversion, with investors crowding into asset classes perceived as safe havens, such as US Treasuries and gold. However, the Fed’s accommodative tone provided some support for risk assets.
Macroeconomic issues that concerned investors in the third quarter of 2019 mostly abated during the fourth quarter, providing the backdrop for strong equity market returns. Risk assets surged higher as a result of a delay in the Brexit agreement until January 2020, optimism that phase one of aUS-China trade deal would be completed and better-than-expected third-quarter corporate earnings results. The US economy rose higher than expected, at 2.1% during the third
quarter of 2019.2 During its October meeting, the Fed cut interest rates again by 0.25% based on business investment and exports remaining weak.1 Investors were also encouraged by a resilient US economy and corporate earnings, putting the US equity market on track for its largest annual rise since 2013.
All sectors within the Russell Midcap Value Index posted positive returns for the year, with information technology (IT) posting the highest return, while energy posted the lowest.
The largest contributor to the Fund’s return relative to the style-specific index for the year was stock selection in the energy sector, with outperformance largely due toAnadarko Petroleum. Shares of the company rose sharply in April after both Chevron and Occidental Petroleum (not Fund holdings) submitted bids to acquire the company. Occidental ultimately prevailed with an offer of $76 per share in a cash and stock deal, which was further bolstered by a $10 billion contribution from Berkshire Hathaway (not a Fund holding). Shares of Anadarko traded sharply higher following the announcement, and we sold our position in the company shortly thereafter.
Security selection and underweight positions in the utilities and communication services sectors also contributed to the Fund’s performance relative to the style-specific index for the year. The Fund benefited from exposure to utility companiesEvergyandFirstEnergy, as well asTake Two Interactive Software, the Fund’s only holding in the communication services sector. During the year, video game developer Take Two performed well following the successful release of several new game titles, which contributed to higher revenues and margins.
| | | | |
Portfolio Composition | |
By sector | | | % of total net assets | |
| | | | |
| |
| Financials | | | 24.51% | |
| Consumer Discretionary | | | 13.57 | |
| Industrials | | | 11.02 | |
| Information Technology | | | 10.14 | |
| Health Care | | | 7.79 | |
| Real Estate | | | 7.53 | |
| Materials | | | 6.05 | |
| Utilities | | | 5.87 | |
| Energy | | | 5.63 | |
| Consumer Staples | | | 3.98 | |
| Communication Services | | | 1.49 | |
| Money Market Funds Plus Other Assets Less Liabilities | | | 2.42 | |
| | | | |
Top 10 Equity Holdings* | | | | |
| % of total net assets | |
| |
1. Arthur J. Gallagher & Co. | | | 3.13% | |
2. Centene Corp. | | | 3.09 | |
3. Willis Towers Watson PLC | | | 3.07 | |
4. Ciena Corp. | | | 3.04 | |
5. Encompass Health Corp. | | | 2.90 | |
6. Kroger Co. (The) | | | 2.62 | |
7. Royal Caribbean Cruises Ltd. | | | 2.59 | |
8. Norwegian Cruise Line Holdings Ltd. | | | 2.57 | |
9. Hudson Pacific Properties, Inc. | | | 2.46 | |
10. Knight-Swift Transportation Holdings, Inc. | | | 2.45 | |
| | | | |
Total Net Assets | | | $318.7 million | |
| |
Total Number of Holdings* | | | 46 | |
The Fund’s holdings are subject to change, and there is no assurance that the Fund will continue to hold any particular security.
*Excluding money market fund holdings, if any.
Data presented here are as of December 31, 2019.
Invesco V.I. American Value Fund
Security selection and underweight positions in the real estate and consumer staples sectors also contributed to the Fund’s return relative to the style-specific index for the year. Stock selection in the consumer discretionary sector benefited the Fund’s relative and absolute performance. Within this sector,Royal Caribbeanwas a key contributor. During the year, the cruise line operator reported solid results despite an active hurricane season that impacted operations. The company also indicated that booking trends appeared strong for 2020.
During the year, stock selection in the IT sector was the largest detractor from the Fund’s performance relative to the style-specific index. Within the sector,DXC Technology,TeradataandPlantronicswere significant detractors. Data analytics provider Teradata made progress in its structural transition toward a subscription-based business during the year, but faced headwinds from an increasingly challenging competitive landscape. IT services provider DXC’s digital segment performed well during the year, but an ongoing transition away from legacy IT services work contributed to weaker earnings results and lowered full-year guidance, which weighed on the stock. Plantronics, a communications equipment company, reported weaker-than-expected earnings during the year and reduced its outlook. We eliminated our positions in these securities during the year.
Security selection in the industrials and health care sectors also detracted from the Fund’s return relative to the style-specific index for the year. Within industrials, a key detractor wasTextron, an industrial conglomerate primarily focused on aerospace and defense-related business lines. The company reported solid earnings during the year, but heightened geopolitical uncertainty raised investor concerns about business jet and corporate helicopter demand, which weighed on the stock.
In health care,Mylanwas a significant detractor from Fund performance for the year versus the style-specific index. We sold the stock in May after we became concerned about management’s plan for the direction of the company. Additionally, we believe that bipartisan pressure on drug pricing is likely to remain a significant overhang for the stock going into the election year.
The Fund’s cash position also detracted from the Fund’s return relative to the style-specific benchmark. While less than 3% on average, cash created a
drag on relative performance in the strong equity market rally.
During the year, we reduced the Fund’s exposure to the financials and energy sectors. Within these sectors, we harvested gains in a number of strong performers, and reduced exposure where we saw heightened risk. We also trimmed positions in the industrials and health care sectors. We used proceeds of these transactions to increase exposure to the utilities, consumer discretionary, IT, consumer staples and real estate sectors. Atyear-end, the Fund’s largest overweight exposures relative to the style-specific index were to financials and consumer discretionary, while the largest underweight exposures were to utilities and real estate.
Market volatility increased significantly during the year, and we believe it may continue given potential for a slowing global economy, geopolitical tensions and uncertainty about US trade policy. We believe market volatility creates opportunities to invest in companies with attractive valuations and strong fundamentals. We believe that ultimately those valuations and fundamentals will be reflected in those companies’ stock prices.
As always, we are committed to working to achieve positive returns for the Fund’s shareholders through an entire market cycle. Thank you for your continued investment in Invesco V.I. American Value Fund.
1 Source: US Federal Reserve
2 Source: Bureau of Economic Analysis
Portfolio managers:
Jeffrey Vancavage
The views and opinions expressed in management’s discussion of Fund performance are those of Invesco Advisers, Inc. These views and opinions are subject to change at any time based on factors such as market and economic conditions. These views and opinions may not be relied upon as investment advice or recommendations, or as an offer for a particular security. The information is not a complete analysis of every aspect of any market, country, industry, security or the Fund. Statements of fact are from sources considered reliable, but Invesco Advisers, Inc. makes no representation or warranty as to their completeness or accuracy. Although historical performance is no guarantee of future results, these insights may help you understand our investment management philosophy.
See important Fund and, if applicable, index disclosures later in this report.
Invesco V.I. American Value Fund
Your Fund’s Long-Term Performance
Results of a $10,000 Investment – Oldest Share Class(es)
Fund and index data from 12/31/09
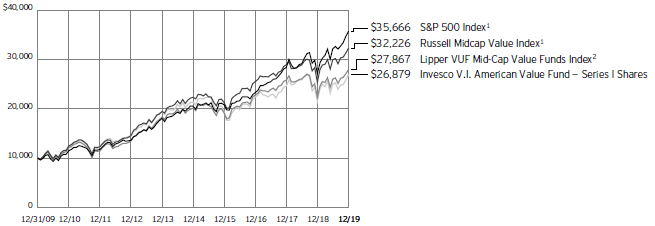
1 Source: RIMES Technologies Corp.
2 Source: Lipper Inc.
Past performance cannot guarantee future
results.
| | | | |
Average Annual Total Returns | |
As of 12/31/19 | | | | |
| |
Series I Shares | | | | |
Inception (1/2/97) | | | 9.40 | % |
10 Years | | | 10.39 | |
5 Years | | | 4.74 | |
1 Year | | | 25.03 | |
| |
Series II Shares | | | | |
Inception (5/5/03) | | | 9.80 | % |
10 Years | | | 10.16 | |
5 Years | | | 4.48 | |
1 Year | | | 24.71 | |
Effective June 1, 2010, Class I and Class II shares of the predecessor fund, The Universal Institutional Funds, Inc. U.S. Mid Cap Value Portfolio, advised by Morgan Stanley Investment Management Inc. were reorganized into Series I and Series II shares, respectively, of Invesco Van Kampen V.I. Mid Cap Value Fund (renamed Invesco V.I. American Value Fund on April 29, 2013). Returns shown above, prior to June 1, 2010, for Series I and Series II shares are blended returns of the predecessor fund and Invesco V.I. American Value Fund. Share class returns will differ from the predecessor fund because of different expenses.
The performance data quoted represent past performance and cannot guarantee future results; current performance may be lower or higher. Please contact your variable product issuer or financial adviser for the most recentmonth-end variable product performance. Performance figures reflect Fund expenses, reinvested distributions
and changes in net asset value. Performance figures do not reflect deduction of taxes a shareholder would pay on Fund distributions or sale of Fund shares. Investment return and principal value will fluctuate so that you may have a gain or loss when you sell shares.
The total annual Fund operating expense ratio set forth in the most recent Fund prospectus as of the date of this report for Series I and Series II shares was 0.93% and 1.18%, respectively. The expense ratios presented above may vary from the expense ratios presented in other sections of this report that are based on expenses incurred during the period covered by this report.
Invesco V.I. American Value Fund, a series portfolio of AIM Variable Insurance Funds (Invesco Variable Insurance Funds), is currently offered through insurance companies issuing variable products. You cannot purchase shares of the Fund directly. Performance figures given represent the Fund and are not intended to reflect actual variable product values. They do not reflect sales charges, expenses and fees assessed in connection with a variable product. Sales charges, expenses and fees, which are determined by the variable product issuers, will vary and will lower the total return.
The most recentmonth-end performance at the Fund level, excluding variable product charges, is available at 800 451 4246. As mentioned above, for the most recentmonth-end performance including variable product charges, please contact your variable product issuer or financial adviser.
Fund performance reflects any applicable fee waivers and/or expense reimbursements. Had the adviser not waived fees and/or reimbursed expenses currently or in the past, returns would have been lower. See current prospectus for more information.
Invesco V.I. American Value Fund
Invesco V.I. American Value Fund’s investment objective is long-term capital appreciation.
| ∎ | Unless otherwise stated, information presented in this report is as of December 31, 2019, and is based on total net assets. |
| ∎ | Unless otherwise noted, all data provided by Invesco. |
| ∎ | To access your Fund’s reports/prospectus, visit invesco.com/fundreports. |
About indexes used in this report
| ∎ | TheS&P 500® Indexis an unmanaged index considered representative of the US stock market. |
| ∎ | TheRussell Midcap® Value Indexis an unmanaged index considered representative ofmid-cap value stocks. The Russell Midcap Value Index is a trademark/service mark of the Frank Russell Co. Russell® is a trademark of the Frank Russell Co. |
| ∎ | TheLipper VUF Mid Cap Value Funds Indexis an unmanaged index considered representative ofmid-cap value variable insurance underlying funds tracked by Lipper. |
| ∎ | The Fund is not managed to track the performance of any particular index, including the index(es) described here, and consequently, the performance of the Fund may deviate significantly from the performance of the index(es). |
| ∎ | A direct investment cannot be made in an index. Unless otherwise indicated, index results include reinvested dividends, and they do not reflect sales charges. Performance of the peer group, if applicable, reflects fund expenses; performance of a market index does not. |
Other information
| ∎ | The returns shown in management’s discussion of Fund performance are based on net asset values calculated for shareholder transactions. Generally accepted accounting principles require adjustments to be made to the net assets of the Fund at period end for financial reporting purposes, and as such, the net asset values for shareholder transactions and the returns based on those net asset values may differ from the net asset values and returns reported in the Financial Highlights. Additionally, the returns and net asset values shown throughout this report are at the Fund level only and do not include variable product issuer charges. If such charges were included, the total returns would be lower. |
| ∎ | Industry classifications used in this report are generally according to the Global Industry Classification Standard, which was developed by and is the exclusive property and a service mark of MSCI Inc. and Standard & Poor’s. |
Invesco V.I. American Value Fund
Schedule of Investments(a)
December 31, 2019
| | | | | | |
| | | Shares | | | Value |
|
Common Stocks & Other Equity Interests–97.58% |
| | |
Aerospace & Defense–2.27% | | | | | | |
Textron, Inc. | | | 162,523 | | | $ 7,248,526 |
| |
Apparel, Accessories & Luxury Goods–1.99% | | | |
| | |
Tapestry, Inc. | | | 234,669 | | | 6,329,023 |
| | |
Automotive Retail–1.97% | | | | | | |
| | |
Advance Auto Parts, Inc. | | | 39,115 | | | 6,264,658 |
| | |
Building Products–2.38% | | | | | | |
| | |
Johnson Controls International PLC | | | 186,092 | | | 7,575,805 |
|
Communications Equipment–4.22% |
Ciena Corp.(b) | | | 227,119 | | | 9,695,710 |
Motorola Solutions, Inc. | | | 23,318 | | | 3,757,463 |
| | | | | | | 13,453,173 |
| | |
Consumer Finance–1.67% | | | | | | |
| | |
Santander Consumer USA Holdings, Inc. | | | 227,194 | | | 5,309,524 |
| | |
Copper–1.93% | | | | | | |
| | |
Freeport-McMoRan, Inc. | | | 469,048 | | | 6,153,910 |
| | |
Distributors–2.12% | | | | | | |
| | |
LKQ Corp.(b) | | | 189,010 | | | 6,747,657 |
| | |
Diversified Chemicals–1.69% | | | | | | |
| | |
Eastman Chemical Co. | | | 68,101 | | | 5,397,685 |
| | |
Electric Utilities–5.87% | | | | | | |
| | |
Edison International | | | 92,296 | | | 6,960,041 |
Evergy, Inc. | | | 95,628 | | | 6,224,427 |
FirstEnergy Corp. | | | 113,380 | | | 5,510,268 |
| | | | | | | 18,694,736 |
| |
Electronic Equipment & Instruments–1.87% | | | |
| | |
Keysight Technologies, Inc.(b) | | | 58,083 | | | 5,961,058 |
| | |
Food Distributors–1.36% | | | | | | |
| | |
Performance Food Group Co.(b) | | | 84,348 | | | 4,342,235 |
| | |
Food Retail–2.62% | | | | | | |
| | |
Kroger Co. (The) | | | 287,886 | | | 8,345,815 |
| | |
Health Care Facilities–2.90% | | | | | | |
| | |
Encompass Health Corp. | | | 133,506 | | | 9,247,961 |
| | |
Health Care Services–1.80% | | | | | | |
| | |
DaVita, Inc.(b) | | | 76,313 | | | 5,725,764 |
| |
Hotels, Resorts & Cruise Lines–7.50% | | | |
| | |
Norwegian Cruise Line Holdings
Ltd.(b) | | | 140,290 | | | 8,194,339 |
Royal Caribbean Cruises Ltd. | | | 61,799 | | | 8,250,784 |
Wyndham Hotels & Resorts, Inc. | | | 118,600 | | | 7,449,266 |
| | | | | | | 23,894,389 |
| | | | | | |
| | | Shares | | | Value |
| | |
Industrial Machinery–1.81% | | | | | | |
| | |
Kennametal, Inc. | | | 156,769 | | | $ 5,783,208 |
| | |
Industrial REITs–1.65% | | | | | | |
| | |
First Industrial Realty Trust, Inc. | | | 126,767 | | | 5,262,098 |
| | |
Insurance Brokers–6.20% | | | | | | |
| | |
Arthur J. Gallagher & Co. | | | 104,725 | | | 9,972,962 |
Willis Towers Watson PLC | | | 48,414 | | | 9,776,723 |
| | | | | | | 19,749,685 |
| |
Interactive Home Entertainment–1.49% | | | |
| | |
Take-Two Interactive Software, Inc.(b) | | | 38,723 | | | 4,740,857 |
| |
Investment Banking & Brokerage–1.88% | | | |
| | |
Stifel Financial Corp. | | | 98,882 | | | 5,997,193 |
| |
IT Consulting & Other Services–1.64% | | | |
| | |
Science Applications International Corp. | | | 59,922 | | | 5,214,412 |
| | |
Life & Health Insurance–1.90% | | | | | | |
| | |
Athene Holding Ltd., Class A(b) | | | 128,920 | | | 6,063,108 |
| | |
Managed Health Care–3.09% | | | | | | |
| | |
Centene Corp.(b) | | | 156,849 | | | 9,861,097 |
| | |
Marine–2.11% | | | | | | |
| | |
Kirby Corp.(b) | | | 75,051 | | | 6,719,316 |
| | |
Office REITs–2.46% | | | | | | |
| | |
Hudson Pacific Properties, Inc. | | | 208,283 | | | 7,841,855 |
| |
Oil & Gas Equipment & Services–1.79% | | | |
| | |
TechnipFMC PLC (United Kingdom) | | | 266,745 | | | 5,719,013 |
| |
Oil & Gas Exploration & Production–3.83% | | | |
| | |
Marathon Oil Corp. | | | 430,519 | | | 5,846,448 |
Noble Energy, Inc. | | | 256,398 | | | 6,368,926 |
| | | | | | | 12,215,374 |
| |
Other Diversified Financial Services–2.37% | | | |
| | |
Voya Financial, Inc. | | | 123,785 | | | 7,548,409 |
| | |
Regional Banks–10.50% | | | | | | |
| | |
Comerica, Inc. | | | 85,732 | | | 6,151,271 |
KeyCorp | | | 378,257 | | | 7,655,922 |
TCF Financial Corp. | | | 153,939 | | | 7,204,345 |
Wintrust Financial Corp. | | | 86,228 | | | 6,113,565 |
Zions Bancorporation N.A. | | | 121,929 | | | 6,330,554 |
| | | | | | | 33,455,657 |
| | |
Residential REITs–1.64% | | | | | | |
| | |
American Homes 4 Rent, Class A | | | 199,613 | | | 5,231,857 |
| | |
Semiconductor Equipment–2.41% | | | | | | |
| | |
KLA Corp. | | | 43,161 | | | 7,689,995 |
See accompanying Notes to Financial Statements which are an integral part of the financial statements.
Invesco V.I. American Value Fund
| | | | | | |
| | | Shares | | | Value |
| | |
Specialized REITs–1.78% | | | | | | |
| | |
Life Storage, Inc. | | | 52,435 | | | $ 5,677,662 |
| | |
Specialty Chemicals–2.42% | | | | | | |
| | |
W.R. Grace & Co. | | | 110,457 | | | 7,715,422 |
| | |
Trucking–2.45% | | | | | | |
| | |
Knight-Swift Transportation Holdings, Inc. | | | 217,539 | | | 7,796,598 |
Total Common Stocks & Other Equity Interests
(Cost $248,049,854) | | | 310,974,735 |
| | |
Money Market Funds–2.43% | | | | | | |
| | |
Invesco Government & Agency Portfolio, Institutional Class, 1.50%(c) | | | 2,646,181 | | | 2,646,182 |
| | | | | | | | |
| | | Shares | | | Value | |
| |
Invesco Liquid Assets Portfolio, Institutional Class, 1.71%(c) | | | 2,084,595 | | | $ | 2,085,220 | |
| |
Invesco Treasury Portfolio, Institutional Class, 1.49%(c) | | | 3,024,207 | | | | 3,024,207 | |
| |
Total Money Market Funds
(Cost $7,755,643) | | | | 7,755,609 | |
| |
TOTAL INVESTMENTS IN
SECURITIES-100.01%
(Cost $255,805,497) | | | | 318,730,344 | |
| |
OTHER ASSETS LESS LIABILITIES–(0.01)% | | | | (40,891 | ) |
| |
NET ASSETS–100.00% | | | $ | 318,689,453 | |
| |
Investment Abbreviations:
REIT - Real Estate Investment Trust
Notes to Schedule of Investments:
| (a) | Industry and/or sector classifications used in this report are generally according to the Global Industry Classification Standard, which was developed by and is the exclusive property and a service mark of MSCI Inc. and Standard & Poor’s. |
| (b) | Non-income producing security. |
| (c) | The money market fund and the Fund are affiliated by having the same investment adviser. The rate shown is the7-day SEC standardized yield as of December 31, 2019. |
See accompanying Notes to Financial Statements which are an integral part of the financial statements.
Invesco V.I. American Value Fund
Statement of Assets and Liabilities
December 31, 2019
| | | | |
Assets: | | | | |
| |
Investments in securities, at value
(Cost $ 248,049,854) | | $ | 310,974,735 | |
| |
Investments in affiliated money market funds, at value (Cost $ 7,755,643) | | | 7,755,609 | |
| |
Cash | | | 3,457 | |
| |
Receivable for: | | | | |
Fund shares sold | | | 29,417 | |
| |
Dividends | | | 397,401 | |
| |
Investment for trustee deferred compensation and retirement plans | | | 62,249 | |
| |
Total assets | | | 319,222,868 | |
| |
| |
Liabilities: | | | | |
| |
Payable for: | | | | |
Fund shares reacquired | | | 168,221 | |
| |
Accrued fees to affiliates | | | 252,003 | |
| |
Accrued other operating expenses | | | 43,007 | |
| |
Trustee deferred compensation and retirement plans | | | 70,184 | |
| |
Total liabilities | | | 533,415 | |
| |
Net assets applicable to shares outstanding | | $ | 318,689,453 | |
| |
| |
Net assets consist of: | | | | |
| |
Shares of beneficial interest | | $ | 261,632,635 | |
| |
Distributable earnings | | | 57,056,818 | |
| |
| | $ | 318,689,453 | |
| |
| |
Net Assets: | | | | |
| |
Series I | | $ | 84,799,429 | |
| |
Series II | | $ | 233,890,024 | |
| |
|
Shares outstanding, no par value, with an unlimited number of shares authorized: | |
| |
Series I | | | 5,325,784 | |
| |
Series II | | | 14,857,943 | |
| |
Series I: | | | | |
Net asset value per share | | $ | 15.92 | |
| |
Series II: | | | | |
Net asset value per share | | $ | 15.74 | |
| |
Statement of Operations
For the year ended December 31, 2019
| | | | |
Investment income: | | | | |
| |
Dividends | | $ | 4,748,820 | |
| |
Dividends from affiliated money market funds | | | 149,226 | |
| |
Total investment income | | | 4,898,046 | |
| |
| |
Expenses: | | | | |
| |
Advisory fees | | | 2,080,038 | |
| |
Administrative services fees | | | 468,428 | |
| |
Custodian fees | | | 6,304 | |
| |
Distribution fees - Series II | | | 515,179 | |
| |
Transfer agent fees | | | 23,101 | |
| |
Trustees’ and officers’ fees and benefits | | | 22,356 | |
| |
Reports to shareholders | | | 8,390 | |
| |
Professional services fees | | | 43,088 | |
| |
Other | | | 6,003 | |
| |
Total expenses | | | 3,172,887 | |
| |
Less: Fees waived | | | (7,877 | ) |
| |
Net expenses | | | 3,165,010 | |
| |
Net investment income | | | 1,733,036 | |
| |
| |
Realized and unrealized gain (loss) from: | | | | |
| |
Net realized gain (loss) from Investment securities | | | (3,087,063 | ) |
| |
Change in net unrealized appreciation of investment securities | | | 59,462,462 | |
| |
Net realized and unrealized gain | | | 56,375,399 | |
| |
Net increase in net assets resulting from operations | | $ | 58,108,435 | |
| |
See accompanying Notes to Financial Statements which are an integral part of the financial statements.
Invesco V.I. American Value Fund
Statement of Changes in Net Assets
For the years ended December 31, 2019 and 2018
| | | | | | | | |
| | | 2019 | | | 2018 | |
| |
Operations: | | | | | | | | |
| | |
Net investment income | | $ | 1,733,036 | | | $ | 1,196,936 | |
| |
Net realized gain (loss) | | | (3,087,063 | ) | | | 23,028,494 | |
| |
Change in net unrealized appreciation (depreciation) | | | 59,462,462 | | | | (59,304,127 | ) |
| |
Net increase (decrease) in net assets resulting from operations | | | 58,108,435 | | | | (35,078,697 | ) |
| |
| | |
Distributions to shareholders from distributable earnings: | | | | | | | | |
| | |
Series I | | | (6,549,244 | ) | | | (13,858,867 | ) |
| |
Series II | | | (16,801,199 | ) | | | (33,748,480 | ) |
| |
Total distributions from distributable earnings | | | (23,350,443 | ) | | | (47,607,347 | ) |
| |
| | |
Share transactions–net: | | | | | | | | |
| | |
Series I | | | (4,634,059 | ) | | | (2,498,966 | ) |
| |
Series II | | | 42,039,405 | | | | (67,396,523 | ) |
| |
Net increase (decrease) in net assets resulting from share transactions | | | 37,405,346 | | | | (69,895,489 | ) |
| |
Net increase (decrease) in net assets | | | 72,163,338 | | | | (152,581,533 | ) |
| |
| | |
Net assets: | | | | | | | | |
| | |
Beginning of year | | | 246,526,115 | | | | 399,107,648 | |
| |
End of year | | $ | 318,689,453 | | | $ | 246,526,115 | |
| |
See accompanying Notes to Financial Statements which are an integral part of the financial statements.
Invesco V.I. American Value Fund
Financial Highlights
The following schedule presents financial highlights for a share of the Fund outstanding throughout the periods indicated.
| | | | | | | | | | | | | | | | | | | | | | | | | | | | | | | | | | | | | | | | | | | | | | | | | | | | | | | | | | | | | | | | | | | | | | |
| | | | | | | | | | | | | | | | | | | | | | | Ratio of | | Ratio of | | | | |
| | | | | | | | | | | | | | | | | | | | | | | expenses | | expenses | | | | |
| | | | | | | Net gains | | | | | | | | | | | | | | | | to average | | to average net | | | | |
| | | | | | | (losses) | | | | | | | | | | | | | | | | net assets | | assets without | | Ratio of net | | |
| | | Net asset | | | | on securities | | | | Dividends | | Distributions | | | | | | | | | | with fee waivers | | fee waivers | | investment | | |
| | | value, | | Net | | (both | | Total from | | from net | | from net | | | | Net asset | | | | Net assets, | | and/or | | and/or | | income | | |
| | | beginning | | investment | | realized and | | investment | | investment | | realized | | Total | | value, end | | Total | | end of period | | expenses | | expenses | | to average | | Portfolio |
| | | of period | | income(a) | | unrealized) | | operations | | income | | gains | | distributions | | of period | | return (b) | | (000’s omitted) | | absorbed | | absorbed | | net assets | | turnover (c) |
Series I | | | | | | | | | | | | | | | | | | | | | | | | | | | | | | | | | | | | | | | | | | | | | | | | | | | | | | | | | | | | | | | | | | | | | | |
Year ended 12/31/19 | | | $ | 13.86 | | | | $ | 0.12 | | | | $ | 3.24 | | | | $ | 3.36 | | | | $ | (0.11 | ) | | | $ | (1.19 | ) | | | $ | (1.30 | ) | | | $ | 15.92 | | | | | 25.03 | % | | | $ | 84,799 | | | | | 0.92 | %(d) | | | | 0.92 | %(d) | | | | 0.78 | %(d) | | | | 68 | % |
Year ended 12/31/18 | | | | 18.38 | | | | | 0.10 | | | | | (1.87 | ) | | | | (1.77 | ) | | | | (0.09 | ) | | | | (2.66 | ) | | | | (2.75 | ) | | | | 13.86 | | | | | (12.65 | ) | | | | 77,491 | | | | | 0.93 | | | | | 0.93 | | | | | 0.52 | | | | | 39 | |
Year ended 12/31/17 | | | | 17.06 | | | | | 0.08 | | | | | 1.59 | | | | | 1.67 | | | | | (0.14 | ) | | | | (0.21 | ) | | | | (0.35 | ) | | | | 18.38 | | | | | 9.96 | | | | | 104,510 | | | | | 0.94 | | | | | 0.94 | | | | | 0.48 | | | | | 56 | |
Year ended 12/31/16 | | | | 15.69 | | | | | 0.13 | | | | | 2.23 | | | | | 2.36 | | | | | (0.06 | ) | | | | (0.93 | ) | | | | (0.99 | ) | | | | 17.06 | | | | | 15.49 | | | | | 116,762 | | | | | 0.97 | | | | | 0.97 | | | | | 0.84 | | | | | 50 | |
Year ended 12/31/15 | | | | 19.92 | | | | | 0.06 | | | | | (1.82 | ) | | | | (1.76 | ) | | | | (0.06 | ) | | | | (2.41 | ) | | | | (2.47 | ) | | | | 15.69 | | | | | (9.13 | ) | | | | 125,686 | | | | | 0.99 | | | | | 0.99 | | | | | 0.33 | | | | | 26 | |
Series II | | | | | | | | | | | | | | | | | | | | | | | | | | | | | | | | | | | | | | | | | | | | | | | | | | | | | | | | | | | | | | | | | | | | | | |
Year ended 12/31/19 | | | | 13.71 | | | | | 0.08 | | | | | 3.21 | | | | | 3.29 | | | | | (0.07 | ) | | | | (1.19 | ) | | | | (1.26 | ) | | | | 15.74 | | | | | 24.71 | | | | | 233,890 | | | | | 1.17 | (d) | | | | 1.17 | (d) | | | | 0.53 | (d) | | | | 68 | |
Year ended 12/31/18 | | | | 18.19 | | | | | 0.05 | | | | | (1.83 | ) | | | | (1.78 | ) | | | | (0.04 | ) | | | | (2.66 | ) | | | | (2.70 | ) | | | | 13.71 | | | | | (12.82 | ) | | | | 169,036 | | | | | 1.18 | | | | | 1.18 | | | | | 0.27 | | | | | 39 | |
Year ended 12/31/17 | | | | 16.90 | | | | | 0.04 | | | | | 1.56 | | | | | 1.60 | | | | | (0.10 | ) | | | | (0.21 | ) | | | | (0.31 | ) | | | | 18.19 | | | | | 9.62 | | | | | 294,598 | | | | | 1.19 | | | | | 1.19 | | | | | 0.23 | | | | | 56 | |
Year ended 12/31/16 | | | | 15.55 | | | | | 0.09 | | | | | 2.21 | | | | | 2.30 | | | | | (0.02 | ) | | | | (0.93 | ) | | | | (0.95 | ) | | | | 16.90 | | | | | 15.22 | | | | | 284,043 | | | | | 1.22 | | | | | 1.22 | | | | | 0.59 | | | | | 50 | |
Year ended 12/31/15 | | | | 19.75 | | | | | 0.02 | | | | | (1.80 | ) | | | | (1.78 | ) | | | | (0.01 | ) | | | | (2.41 | ) | | | | (2.42 | ) | | | | 15.55 | | | | | (9.36 | ) | | | | 210,354 | | | | | 1.24 | | | | | 1.24 | | | | | 0.08 | | | | | 26 | |
| (a) | Calculated using average shares outstanding. |
| (b) | Includes adjustments in accordance with accounting principles generally accepted in the United States of America and as such, the net asset value for financial reporting purposes and the returns based upon those net asset values may differ from the net asset value and returns for shareholder transactions. Total returns are not annualized for periods less than one year, if applicable, and do not reflect charges assessed in connection with a variable product, which if included would reduce total returns. |
| (c) | Portfolio turnover is calculated at the fund level and is not annualized for periods less than one year, if applicable. |
| (d) | Ratios are based on average daily net assets (000’s omitted) of $82,951 and $205,943 for Series I and Series II shares, respectively. |
See accompanying Notes to Financial Statements which are an integral part of the financial statements.
Invesco V.I. American Value Fund
Notes to Financial Statements
December 31, 2019
NOTE 1–Significant Accounting Policies
Invesco V.I. American Value Fund (the “Fund”) is a series portfolio of AIM Variable Insurance Funds (Invesco Variable Insurance Funds) (the “Trust”). The Trust is a Delaware statutory trust registered under the Investment Company Act of 1940, as amended (the “1940 Act”), as anopen-end series management investment company. Information presented in these financial statements pertains only to the Fund. Matters affecting the Fund or each class will be voted on exclusively by the shareholders of the Fund or each class. Current Securities and Exchange Commission (“SEC”) guidance, however, requires participating insurance companies offering separate accounts to vote shares proportionally in accordance with the instructions of the contract owners whose investments are funded by shares of each Fund or class.
The Fund’s investment objective is to provide above-average total return over a market cycle of three to five years by investing in common stocks and other equity securities.
The Fund currently offers two classes of shares, Series I and Series II, both of which are offered to insurance company separate accounts funding variable annuity contracts and variable life insurance policies (“variable products”).
The Fund is an investment company and accordingly follows the investment company accounting and reporting guidance in accordance with Financial Accounting Standards Board Accounting Standards Codification Topic 946,Financial Services – Investment Companies.
The following is a summary of the significant accounting policies followed by the Fund in the preparation of its financial statements.
A. Security Valuations– Securities, including restricted securities, are valued according to the following policy.
A security listed or traded on an exchange (except convertible securities) is valued at its last sales price or official closing price as of the close of the customary trading session on the exchange where the security is principally traded, or lacking any sales or official closing price on a particular day, the security may be valued at the closing bid price on that day. Securities traded in theover-the-counter market are valued based on prices furnished by independent pricing services or market makers. When such securities are valued by an independent pricing service they may be considered fair valued. Futures contracts are valued at the final settlement price set by an exchange on which they are principally traded. Listed options are valued at the mean between the last bid and asked prices from the exchange on which they are principally traded. Options not listed on an exchange are valued by an independent source at the mean between the last bid and asked prices. For purposes of determining net asset value (“NAV”) per share, futures and option contracts generally are valued 15 minutes after the close of the customary trading session of the New York Stock Exchange (“NYSE”).
Investments inopen-end andclosed-end registered investment companies that do not trade on an exchange are valued at theend-of-day net asset value per share. Investments inopen-end andclosed-end registered investment companies that trade on an exchange are valued at the last sales price or official closing price as of the close of the customary trading session on the exchange where the security is principally traded.
Debt obligations (including convertible securities) and unlisted equities are fair valued using an evaluated quote provided by an independent pricing service. Evaluated quotes provided by the pricing service may be determined without exclusive reliance on quoted prices, and may reflect appropriate factors such asinstitution-size trading in similar groups of securities, developments related to specific securities, dividend rate (for unlisted equities), yield (for debt obligations), quality, type of issue, coupon rate (for debt obligations), maturity (for debt obligations), individual trading characteristics and other market data. Pricing services generally value debt obligations assuming orderly transactions of institutional round lot size, but a fund may hold or transact in the same securities in smaller, odd lot sizes. Odd lots often trade at lower prices than institutional round lots. Debt obligations are subject to interest rate and credit risks. In addition, all debt obligations involve some risk of default with respect to interest and/or principal payments.
Foreign securities’ (including foreign exchange contracts) prices are converted into U.S. dollar amounts using the applicable exchange rates as of the close of the NYSE. If market quotations are available and reliable for foreign exchange-traded equity securities, the securities will be valued at the market quotations. Because trading hours for certain foreign securities end before the close of the NYSE, closing market quotations may become unreliable. If between the time trading ends on a particular security and the close of the customary trading session on the NYSE, events occur that the investment adviser determines are significant and make the closing price unreliable, the Fund may fair value the security. If the event is likely to have affected the closing price of the security, the security will be valued at fair value in good faith using procedures approved by the Board of Trustees. Adjustments to closing prices to reflect fair value may also be based on a screening process of an independent pricing service to indicate the degree of certainty, based on historical data, that the closing price in the principal market where a foreign security trades is not the current value as of the close of the NYSE. Foreign securities’ prices meeting the approved degree of certainty that the price is not reflective of current value will be priced at the indication of fair value from the independent pricing service. Multiple factors may be considered by the independent pricing service in determining adjustments to reflect fair value and may include information relating to sector indices, American Depositary Receipts and domestic and foreign index futures. Foreign securities may have additional risks including exchange rate changes, potential for sharply devalued currencies and high inflation, political and economic upheaval, the relative lack of issuer information, relatively low market liquidity and the potential lack of strict financial and accounting controls and standards.
Securities for which market prices are not provided by any of the above methods may be valued based upon quotes furnished by independent sources. The last bid price may be used to value equity securities. The mean between the last bid and asked prices is used to value debt obligations, including corporate loans.
Securities for which market quotations are not readily available or became unreliable are valued at fair value as determined in good faith by or under the supervision of the Trust’s officers following procedures approved by the Board of Trustees. Issuer specific events, market trends, bid/asked quotes of brokers and information providers and other market data may be reviewed in the course of making a good faith determination of a security’s fair value.
The Fund may invest in securities that are subject to interest rate risk, meaning the risk that the prices will generally fall as interest rates rise and, conversely, the prices will generally rise as interest rates fall. Specific securities differ in their sensitivity to changes in interest rates depending on their individual characteristics. Changes in interest rates may result in increased market volatility, which may affect the value and/or liquidity of certain Fund investments.
Invesco V.I. American Value Fund
Valuations change in response to many factors including the historical and prospective earnings of the issuer, the value of the issuer’s assets, general economic conditions, interest rates, investor perceptions and market liquidity. Because of the inherent uncertainties of valuation, the values reflected in the financial statements may materially differ from the value received upon actual sale of those investments.
| B. | Securities Transactions and Investment Income– Securities transactions are accounted for on a trade date basis. Realized gains or losses on sales are computed on the basis of specific identification of the securities sold. Interest income (net of withholding tax, if any) is recorded on the accrual basis from settlement date. Dividend income (net of withholding tax, if any) is recorded on theex-dividend date. |
The Fund may periodically participate in litigation related to Fund investments. As such, the Fund may receive proceeds from litigation settlements. Any proceeds received are included in the Statement of Operations as realized gain (loss) for investments no longer held and as unrealized gain (loss) for investments still held.
Brokerage commissions and mark ups are considered transaction costs and are recorded as an increase to the cost basis of securities purchased and/or a reduction of proceeds on a sale of securities. Such transaction costs are included in the determination of net realized and unrealized gain (loss) from investment securities reported in the Statement of Operations and the Statement of Changes in Net Assets and the net realized and unrealized gains (losses) on securities per share in the Financial Highlights. Transaction costs are included in the calculation of the Fund’s net asset value and, accordingly, they reduce the Fund’s total returns. These transaction costs are not considered operating expenses and are not reflected in net investment income reported in the Statement of Operations and the Statement of Changes in Net Assets, or the net investment income per share and the ratios of expenses and net investment income reported in the Financial Highlights, nor are they limited by any expense limitation arrangements between the Fund and the investment adviser.
The Fund allocates income and realized and unrealized capital gains and losses to a class based on the relative net assets of each class.
The Fund recharacterizes distributions received from REIT investments based on information provided by the REIT into the following categories: ordinary income, long-term and short-term capital gains, and return of capital. If information is not available on a timely basis from the REIT, the recharacterization will be based on available information which may include the previous year’s allocation. If new or additional information becomes available from the REIT at a later date, a recharacterization will be made in the following year. The Fund records as dividend income the amount recharacterized as ordinary income and as realized gain the amount recharacterized as capital gain in the Statement of Operations, and the amount recharacterized as return of capital as a reduction of the cost of the related investment. These recharacterizations are reflected in the accompanying financial statements.
| C. | Country Determination– For the purposes of making investment selection decisions and presentation in the Schedule of Investments, the investment adviser may determine the country in which an issuer is located and/or credit risk exposure based on various factors. These factors include the laws of the country under which the issuer is organized, where the issuer maintains a principal office, the country in which the issuer derives 50% or more of its total revenues and the country that has the primary market for the issuer’s securities, as well as other criteria. Among the other criteria that may be evaluated for making this determination are the country in which the issuer maintains 50% or more of its assets, the type of security, financial guarantees and enhancements, the nature of the collateral and the sponsor organization. Country of issuer and/or credit risk exposure has been determined to be the United States of America, unless otherwise noted. |
| D. | Distributions– Distributions from net investment income and net realized capital gain, if any, are generally declared and paid to separate accounts of participating insurance companies annually and recorded on theex-dividend date. |
| E. | Federal Income Taxes–The Fund intends to comply with the requirements of Subchapter M of the Internal Revenue Code of 1986, as amended (the “Internal Revenue Code”), necessary to qualify as a regulated investment company and to distribute substantially all of the Fund’s taxable earnings to shareholders. As such, the Fund will not be subject to federal income taxes on otherwise taxable income (including net realized capital gain) that is distributed to shareholders. Therefore, no provision for federal income taxes is recorded in the financial statements. |
The Fund recognizes the tax benefits of uncertain tax positions only when the position is more likely than not to be sustained. Management has analyzed the Fund’s uncertain tax positions and concluded that no liability for unrecognized tax benefits should be recorded related to uncertain tax positions. Management is not aware of any tax positions for which it is reasonably possible that the total amounts of unrecognized tax benefits will change materially in the next 12 months.
The Fund files tax returns in the U.S. Federal jurisdiction and certain other jurisdictions. Generally, the Fund is subject to examinations by such taxing authorities for up to three years after the filing of the return for the tax period.
| F. | Expenses– Fees provided for under the Rule12b-1 plan of a particular class of the Fund and which are directly attributable to that class are charged to the operations of such class. All other expenses are allocated among the classes based on relative net assets. |
| G. | Accounting Estimates–The preparation of financial statements in conformity with accounting principles generally accepted in the United States of America (“GAAP”) requires management to make estimates and assumptions that affect the reported amounts of assets and liabilities at the date of the financial statements and the reported amounts of revenues and expenses during the reporting period including estimates and assumptions related to taxation. Actual results could differ from those estimates by a significant amount. In addition, the Fund monitors for material events or transactions that may occur or become known after theperiod-end date and before the date the financial statements are released to print. |
| H. | Indemnifications– Under the Trust’s organizational documents, each Trustee, officer, employee or other agent of the Trust is indemnified against certain liabilities that may arise out of the performance of their duties to the Fund. Additionally, in the normal course of business, the Fund enters into contracts, including the Fund’s servicing agreements, that contain a variety of indemnification clauses. The Fund’s maximum exposure under these arrangements is unknown as this would involve future claims that may be made against the Fund that have not yet occurred. The risk of material loss as a result of such indemnification claims is considered remote. |
Invesco V.I. American Value Fund
NOTE 2–Advisory Fees and Other Fees Paid to Affiliates
The Trust has entered into a master investment advisory agreement with Invesco Advisers, Inc. (the “Adviser” or “Invesco”). Under the terms of the investment advisory agreement, the Fund accrues daily and pays monthly an advisory fee to the Adviser based on the annual rate of the Fund’s average daily net assets as follows:
| | | | |
| Average Daily Net Assets | | Rate | |
| |
First $1 billion | | | 0.720% | |
| |
Over $ 1 billion | | | 0.650% | |
| |
For the year ended December 31, 2019, the effective advisory fee rate incurred by the Fund was 0.72%.
Under the terms of a mastersub-advisory agreement between the Adviser and each of Invesco Asset Management Deutschland GmbH, Invesco Asset Management Limited, Invesco Asset Management (Japan) Limited, Invesco Hong Kong Limited, Invesco Senior Secured Management, Inc. and Invesco Canada Ltd. and separatesub-advisory agreements with Invesco Capital Management LLC and Invesco Asset Management (India) Private Limited (collectively, the “AffiliatedSub-Advisers”) the Adviser, not the Fund, will pay 40% of the fees paid to the Adviser to any such AffiliatedSub-Adviser(s) that provide(s) discretionary investment management services to the Fund based on the percentage of assets allocated to such AffiliatedSub-Adviser(s).
The Adviser has contractually agreed, through at least June 30, 2020, to waive advisory fees and/or reimburse expenses of all shares to the extent necessary to limit total annual fund operating expenses after fee waiver and/or expense reimbursement (excluding certain items discussed below) of Series I shares to 2.00% and Series II shares to 2.25% of average daily net assets (the “expense limits”). In determining the Adviser’s obligation to waive advisory fees and/or reimburse expenses, the following expenses are not taken into account, and could cause the total annual fund operating expenses after fee waiver and/or expense reimbursement to exceed the numbers reflected above: (1) interest; (2) taxes; (3) dividend expense on short sales; (4) extraordinary ornon-routine items, including litigation expenses; and (5) expenses that the Fund has incurred but did not actually pay because of an expense offset arrangement. Unless Invesco continues the fee waiver agreement, it will terminate on June 30, 2020. During its term, the fee waiver agreement cannot be terminated or amended to increase the expense limits or reduce the advisory fee waiver without approval of the Board of Trustees. The Adviser did not waive fees and/or reimburse expenses during the period under these expense limits.
Further, the Adviser has contractually agreed, through at least June 30, 2021, to waive the advisory fee payable by the Fund in an amount equal to 100% of the net advisory fees the Adviser receives from the affiliated money market funds on investments by the Fund of uninvested cash in such affiliated money market funds.
For the year ended December 31, 2019, the Adviser waived advisory fees of $7,877.
The Trust has entered into a master administrative services agreement with Invesco pursuant to which the Fund has agreed to pay Invesco a fee for costs incurred in providing accounting services and fund administrative services to the Fund and to reimburse Invesco for fees paid to insurance companies that have agreed to provide certain administrative services to the Fund. These administrative services provided by the insurance companies may include, among other things: maintenance of master accounts with the Fund; tracking, recording and transmitting net purchase and redemption orders for Fund shares; maintaining and preserving records related to the purchase, redemption and other account activity of variable product owners; distributing copies of Fund documents such as prospectuses, proxy materials and periodic reports, to variable product owners, and responding to inquiries from variable product owners about the Fund. Pursuant to such agreement, for the year ended December 31, 2019, Invesco was paid $40,507 for accounting and fund administrative services and was reimbursed $427,921 for fees paid to insurance companies. Invesco has entered into asub-administration agreement whereby State Street Bank and Trust Company (“SSB”) serves as fund accountant and provides certain administrative services to the Fund. Pursuant to a custody agreement with the Trust on behalf of the Fund, SSB also serves as the Fund’s custodian.
The Trust has entered into a transfer agency and service agreement with Invesco Investment Services, Inc. (“IIS”) pursuant to which the Fund has agreed to pay IIS a fee for providing transfer agency and shareholder services to the Fund and reimburse IIS for certain expenses incurred by IIS in the course of providing such services. For the year ended December 31, 2019, expenses incurred under the agreement are shown in the Statement of Operations asTransfer agent fees.
The Trust has entered into a master distribution agreement with Invesco Distributors, Inc. (“IDI”) to serve as the distributor for the Fund. The Trust has adopted a plan pursuant to Rule12b-1 under the 1940 Act with respect to the Fund’s Series II shares (the “Plan”). The Fund, pursuant to the Plan, pays IDI compensation at the annual rate of 0.25% of the Fund’s average daily net assets of Series II shares. The fees are accrued daily and paid monthly. Of the Plan payments, up to 0.25% of the average daily net assets of the Series II shares may be paid to insurance companies who furnish continuing personal shareholder services to customers who purchase and own Series II shares of the Fund. For the year ended December 31, 2019, expenses incurred under the Plan are detailed in the Statement of Operations asDistribution fees.
For the year ended December 31, 2019, the Fund incurred $17,176 in brokerage commissions with Invesco Capital Markets, Inc., an affiliate of the Adviser and IDI, for portfolio transactions executed on behalf of the Fund.
Certain officers and trustees of the Trust are officers and directors of the Adviser, IIS and/or IDI.
NOTE 3–Additional Valuation Information
GAAP defines fair value as the price that would be received to sell an asset or paid to transfer a liability in an orderly transaction between market participants at the measurement date, under current market conditions. GAAP establishes a hierarchy that prioritizes the inputs to valuation methods, giving the highest priority to readily available unadjusted quoted prices in an active market for identical assets (Level 1) and the lowest priority to significant unobservable inputs (Level 3), generally when market prices are not readily available or are unreliable. Based on the valuation inputs, the securities or other investments are tiered into one of three levels. Changes in valuation methods may result in transfers in or out of an investment’s assigned level:
| | Level 1 - | Prices are determined using quoted prices in an active market for identical assets. |
| | Level 2 - | Prices are determined using other significant observable inputs. Observable inputs are inputs that other market participants may use in pricing a security. These may include quoted prices for similar securities, interest rates, prepayment speeds, credit risk, yield curves, loss severities, default rates, discount rates, volatilities and others. |
Invesco V.I. American Value Fund
| | Level 3 - | Prices are determined using significant unobservable inputs. In situations where quoted prices or observable inputs are unavailable (for example, when there is little or no market activity for an investment at the end of the period), unobservable inputs may be used. Unobservable inputs reflect the Fund’s own assumptions about the factors market participants would use in determining fair value of the securities or instruments and would be based on the best available information. |
As of December 31, 2019, all of the securities in this Fund were valued based on Level 1 inputs (see the Schedule of Investments for security categories). The level assigned to the securities valuations may not be an indication of the risk or liquidity associated with investing in those securities. Because of the inherent uncertainties of valuation, the values reflected in the financial statements may materially differ from the value received upon actual sale of those investments.
NOTE 4–Trustees’ and Officers’ Fees and Benefits
Trustees’ and Officers’ Fees and Benefits include amounts accrued by the Fund to pay remuneration to certain Trustees and Officers of the Fund. Trustees have the option to defer compensation payable by the Fund, andTrustees’ and Officers’ Fees and Benefits also include amounts accrued by the Fund to fund such deferred compensation amounts. Those Trustees who defer compensation have the option to select various Invesco Funds in which their deferral accounts shall be deemed to be invested. Finally, certain current Trustees were eligible to participate in a retirement plan that provided for benefits to be paid upon retirement to Trustees over a period of time based on the number of years of service. The Fund may have certain former Trustees who also participate in a retirement plan and receive benefits under such plan.Trustees’ and Officers’ Fees and Benefits include amounts accrued by the Fund to fund such retirement benefits. Obligations under the deferred compensation and retirement plans represent unsecured claims against the general assets of the Fund.
NOTE 5–Cash Balances
The Fund is permitted to temporarily carry a negative or overdrawn balance in its account with SSB, the custodian bank. Such balances, if any atperiod-end, are shown in the Statement of Assets and Liabilities under the payable caption Amount due custodian. To compensate the custodian bank for such overdrafts, the overdrawn Fund may either (1) leave funds as a compensating balance in the account so the custodian bank can be compensated by earning the additional interest; or (2) compensate by paying the custodian bank at a rate agreed upon by the custodian bank and Invesco, not to exceed the contractually agreed upon rate.
NOTE 6–Distributions to Shareholders and Tax Components of Net Assets
Tax Character of Distributions to Shareholders Paid During the Fiscal Years Ended December 31, 2019 and 2018:
| | | | | | | | |
| | | 2019 | | | 2018 | |
| |
Ordinary income | | $ | 2,371,325 | | | $ | 3,909,159 | |
| |
Long-term capital gain | | | 20,979,118 | | | | 43,698,188 | |
| |
Total distributions | | $ | 23,350,443 | | | $ | 47,607,347 | |
| |
Tax Components of Net Assets atPeriod-End:
| | | | |
| | | 2019 | |
| |
Undistributed ordinary income | | $ | 1,713,490 | |
| |
Undistributed long-term capital gain | | | 2,609,747 | |
| |
Net unrealized appreciation - investments | | | 52,787,704 | |
| |
Temporary book/tax differences | | | (54,123 | ) |
| |
Shares of beneficial interest | | | 261,632,635 | |
| |
Total net assets | | $ | 318,689,453 | |
| |
The difference between book-basis andtax-basis unrealized appreciation (depreciation) is due to differences in the timing of recognition of gains and losses on investments for tax and book purposes. The Fund’s net unrealized appreciation difference is attributable primarily to wash sales.
The temporary book/tax differences are a result of timing differences between book and tax recognition of income and/or expenses. The Fund’s temporary book/tax differences are the result of the trustee deferral of compensation and retirement plan benefits.
Capital loss carryforward is calculated and reported as of a specific date. Results of transactions and other activity after that date may affect the amount of capital loss carryforward actually available for the Fund to utilize. Capital losses generated in years beginning after December 22, 2010 can be carried forward for an unlimited period, whereas previous losses expire in eight tax years. Capital losses with an expiration period may not be used to offset capital gains until all net capital losses without an expiration date have been utilized. Capital loss carryforwards with no expiration date will retain their character as either short-term or long-term capital losses instead of as short-term capital losses as under prior law. The ability to utilize capital loss carryforwards in the future may be limited under the Internal Revenue Code and related regulations based on the results of future transactions.
The Fund does not have a capital loss carryforward as of December 31, 2019.
NOTE 7–Investment Transactions
The aggregate amount of investment securities (other than short-term securities, U.S. Treasury obligations and money market funds, if any) purchased and sold by the Fund during the year ended December 31, 2019 was $207,050,462 and $191,240,773, respectively. Cost of
Invesco V.I. American Value Fund
investments, including any derivatives, on a tax basis includes the adjustments for financial reporting purposes as of the most recently completed federal income tax reportingperiod-end.
Unrealized Appreciation (Depreciation) of Investments on a Tax Basis
| | | | |
| |
Aggregate unrealized appreciation of investments | | $ | 57,173,505 | |
| |
Aggregate unrealized (depreciation) of investments | | | (4,385,801 | ) |
| |
Net unrealized appreciation of investments | | $ | 52,787,704 | |
| |
Cost of investments for tax purposes is $265,942,640.
NOTE 8–Reclassification of Permanent Differences
Primarily as a result of differing book/tax treatment of REIT distributions, on December 31, 2019, undistributed net investment income was increased by $498 and undistributed net realized gain (loss) was decreased by $498. This reclassification had no effect on the net assets or the distributable earnings of the Fund.
NOTE 9–Share Information
| | | | | | | | | | | | | | | | |
| | | Summary of Share Activity | |
| |
| | | Year ended | | | Year ended | |
| | | December 31, 2019(a) | | | December 31, 2018 | |
| | | | | | | | |
| | | Shares | | | Amount | | | Shares | | | Amount | |
| |
Sold: | | | | | | | | | | | | | | | | |
Series I | | | 160,277 | | | $ | 2,482,112 | | | | 237,067 | | | $ | 3,989,332 | |
| |
Series II | | | 7,353,290 | | | | 115,776,084 | | | | 1,290,855 | | | | 23,139,466 | |
| |
| | | | |
Issued as reinvestment of dividends: | | | | | | | | | | | | | | | | |
Series I | | | 444,318 | | | | 6,549,244 | | | | 796,944 | | | | 13,858,867 | |
| |
Series II | | | 1,152,345 | | | | 16,801,199 | | | | 1,959,842 | | | | 33,748,480 | |
| |
| | | | |
Reacquired: | | | | | | | | | | | | | | | | |
Series I | | | (867,811 | ) | | | (13,665,415 | ) | | | (1,132,589 | ) | | | (20,347,165 | ) |
| |
Series II | | | (5,973,505 | ) | | | (90,537,878 | ) | | | (7,116,736 | ) | | | (124,284,469 | ) |
| |
Net increase (decrease) in share activity | | | 2,268,914 | | | $ | 37,405,346 | | | | (3,964,617 | ) | | $ | (69,895,489 | ) |
| |
| (a) | There are entities that are record owners of more than 5% of the outstanding shares of the Fund and in the aggregate own 63% of the outstanding shares of the Fund. The Fund and the Fund’s principal underwriter or adviser, are parties to participation agreements with these entities whereby these entities sell units of interest in separate accounts funding variable products that are invested in the Fund. The Fund, Invesco and/or Invesco affiliates may make payments to these entities, which are considered to be related to the Fund, for providing services to the Fund, Invesco and/or Invesco affiliates including but not limited to services such as, securities brokerage, third party record keeping and account servicing and administrative services. The Fund has no knowledge as to whether all or any portion of the shares owned of record by these entities are also owned beneficially. |
Invesco V.I. American Value Fund
Report of Independent Registered Public Accounting Firm
To the Board of Trustees of AIM Variable Insurance Funds (Invesco Variable Insurance Funds) and Shareholders of Invesco V.I. American Value Fund
Opinion on the Financial Statements
We have audited the accompanying statement of assets and liabilities, including the schedule of investments, of Invesco V.I. American Value Fund (one of the funds constituting AIM Variable Insurance Funds (Invesco Variable Insurance Funds), referred to hereafter as the “Fund”) as of December 31, 2019, the related statement of operations for the year ended December 31, 2019, the statement of changes in net assets for each of the two years in the period ended December 31, 2019, including the related notes, and the financial highlights for each of the five years in the period ended December 31, 2019 (collectively referred to as the “financial statements”). In our opinion, the financial statements present fairly, in all material respects, the financial position of the Fund as of December 31, 2019, the results of its operations for the year then ended, the changes in its net assets for each of the two years in the period ended December 31, 2019 and the financial highlights for each of the five years in the period ended December 31, 2019 in conformity with accounting principles generally accepted in the United States of America.
Basis for Opinion
These financial statements are the responsibility of the Fund’s management. Our responsibility is to express an opinion on the Fund’s financial statements based on our audits. We are a public accounting firm registered with the Public Company Accounting Oversight Board (United States) (PCAOB) and are required to be independent with respect to the Fund in accordance with the U.S. federal securities laws and the applicable rules and regulations of the Securities and Exchange Commission and the PCAOB.
We conducted our audits of these financial statements in accordance with the standards of the PCAOB. Those standards require that we plan and perform the audit to obtain reasonable assurance about whether the financial statements are free of material misstatement, whether due to error or fraud.
Our audits included performing procedures to assess the risks of material misstatement of the financial statements, whether due to error or fraud, and performing procedures that respond to those risks. Such procedures included examining, on a test basis, evidence regarding the amounts and disclosures in the financial statements. Our audits also included evaluating the accounting principles used and significant estimates made by management, as well as evaluating the overall presentation of the financial statements. Our procedures included confirmation of securities owned as of December 31, 2019 by correspondence with the custodian and transfer agent. We believe that our audits provide a reasonable basis for our opinion.
/s/PricewaterhouseCoopers LLP
Houston, Texas
February 18, 2020
We have served as the auditor of one or more of the investment companies in the Invesco group of investment companies since at least 1995. We have not been able to determine the specific year we began serving as auditor.
Invesco V.I. American Value Fund
Calculating your ongoing Fund expenses
Example
As a shareholder of the Fund, you incur ongoing costs, including management fees; distribution and/or service fees(12b-1); and other Fund expenses. This example is intended to help you understand your ongoing costs (in dollars) of investing in the Fund and to compare these costs with ongoing costs of investing in other mutual funds. The example is based on an investment of $1,000 invested at the beginning of the period and held for the entire period July 1, 2019 through December 31, 2019.
The actual and hypothetical expenses in the examples below do not represent the effect of any fees or other expenses assessed in connection with a variable product; if they did, the expenses shown would be higher while the ending account values shown would be lower.
Actual expenses
The table below provides information about actual account values and actual expenses. You may use the information in this table, together with the amount you invested, to estimate the expenses that you paid over the period. Simply divide your account value by $1,000 (for example, an $8,600 account value divided by $1,000 = 8.6), then multiply the result by the number in the table under the heading entitled “Actual Expenses Paid During Period” to estimate the expenses you paid on your account during this period.
Hypothetical example for comparison purposes
The table below also provides information about hypothetical account values and hypothetical expenses based on the Fund’s actual expense ratio and an assumed rate of return of 5% per year before expenses, which is not the Fund’s actual return.
The hypothetical account values and expenses may not be used to estimate the actual ending account balance or expenses you paid for the period. You may use this information to compare the ongoing costs of investing in the Fund and other funds. To do so, compare this 5% hypothetical example with the 5% hypothetical examples that appear in the shareholder reports of the other funds.
Please note that the expenses shown in the table are meant to highlight your ongoing costs. Therefore, the hypothetical information is useful in comparing ongoing costs, and will not help you determine the relative total costs of owning different funds.
| | | | | | | | | | | | |
| | | Beginning
Account Value
(07/01/19) | | ACTUAL | | HYPOTHETICAL
(5% annual return before expenses) | | Annualized
Expense
Ratio |
| | Ending
Account Value
(12/31/19)1 | | Expenses Paid During Period2 | | Ending Account Value (12/31/19) | | Expenses
Paid During
Period2 |
Series I | | $1,000.00 | | $1,075.60 | | $4.81 | | $1,020.57 | | $4.69 | | 0.92% |
Series II | | 1,000.00 | | 1,074.70 | | 6.12 | | 1,019.31 | | 5.96 | | 1.17 |
| 1 | The actual ending account value is based on the actual total return of the Fund for the period July 1, 2019 through December 31, 2019, after actual expenses and will differ from the hypothetical ending account value which is based on the Fund’s expense ratio and a hypothetical annual return of 5% before expenses. |
| 2 | Expenses are equal to the Fund’s annualized expense ratio as indicated above multiplied by the average account value over the period, multiplied by 184/365 to reflect the most recent fiscal half year. |
Invesco V.I. American Value Fund
Tax Information
Form1099-DIV, Form1042-S and other year–end tax information provide shareholders with actual calendar year amounts that should be included in their tax returns. Shareholders should consult their tax advisers.
The following distribution information is being provided as required by the Internal Revenue Code or to meet a specific state’s requirement.
The Fund designates the following amounts or, if subsequently determined to be different, the maximum amount allowable for its fiscal year ended December 31, 2019:
| | | | | | |
| | Federal and State Income Tax | | | | |
| | Long-Term Capital Gain Distributions | | $ | 20,979,118 | |
| | Corporate Dividends Received Deduction* | | | 100.00 | % |
| | U.S. Treasury Obligations* | | | 0.00 | % |
* The above percentages are based on ordinary income dividends paid to shareholders during the Fund’s fiscal year.
Invesco V.I. American Value Fund
Trustees and Officers
The address of each trustee and officer is AIM Variable Insurance Funds (Invesco Variable Insurance Funds) (the “Trust”), 11 Greenway Plaza, Suite 1000, Houston, Texas 77046-1173. The trustees serve for the life of the Trust, subject to their earlier death, incapacitation, resignation, retirement or removal as more specifically provided in the Trust’s organizational documents. Each officer serves for a one year term or until their successors are elected and qualified. Column two below includes length of time served with predecessor entities, if any.
| | | | | | | | |
Name, Year of Birth and Position(s) Held with the Trust | | Trustee and/or Officer Since | | Principal Occupation(s) During Past 5 Years | | Number of
Funds in
Fund Complex
Overseen by
Trustee | | Other Directorship(s) Held by Trustee
During Past 5 Years |
| Interested Person |
Martin L. Flanagan1- 1960 Trustee and Vice Chair | | 2007 | | Executive Director, Chief Executive Officer and President, Invesco Ltd. (ultimate parent of Invesco and a global investment management firm); Trustee and Vice Chair, The Invesco Funds; Vice Chair, Investment Company Institute; and Member of Executive Board, SMU Cox School of Business Formerly: Advisor to the Board, Invesco Advisers, Inc. (formerly known as Invesco Institutional (N.A.), Inc.); Chairman and Chief Executive Officer, Invesco Advisers, Inc. (registered investment adviser); Director, Chairman, Chief Executive Officer and President, Invesco Holding Company (US), Inc. (formerly IVZ Inc.) (holding company), Invesco Group Services, Inc. (service provider) and Invesco North American Holdings, Inc. (holding company); Director, Chief Executive Officer and President, Invesco Holding Company Limited (parent of Invesco and a global investment management firm); Director, Invesco Ltd.; Chairman, Investment Company Institute and President,Co-Chief Executive Officer,Co-President, Chief Operating Officer and Chief Financial Officer, Franklin Resources, Inc. (global investment management organization) | | 229 | | None |
| 1 | Mr. Flanagan is considered an interested person (within the meaning of Section 2(a)(19) of the 1940 Act) of the Trust because he is an officer of the Adviser to the Trust, and an officer and a director of Invesco Ltd., ultimate parent of the Adviser. |
Invesco V.I. American Value Fund
Trustees and Officers–(continued)
| | | | | | | | |
Name, Year of Birth and Position(s) Held with the Trust | | Trustee and/or Officer Since | | Principal Occupation(s) During Past 5 Years | | Number of
Funds in
Fund Complex
Overseen by
Trustee | | Other Directorship(s) Held by Trustee
During Past 5 Years |
| Independent Trustees |
Bruce L. Crockett - 1944 Trustee and Chair | | 1993 | | Chairman, Crockett Technologies Associates (technology consulting company) Formerly: Director, Captaris (unified messaging provider); Director, President and Chief Executive Officer, COMSAT Corporation; Chairman, Board of Governors of INTELSAT (international communications company); ACE Limited (insurance company); Independent Directors Council and Investment Company Institute: Member of the Audit Committee, Investment Company Institute; Member of the Executive Committee and Chair of the Governance Committee, Independent Directors Council | | 229 | | Director and Chairman of the Audit Committee, ALPS (Attorneys Liability Protection Society) (insurance company); Director and Member of the Audit Committee and Compensation Committee, Ferroglobe PLC (metallurgical company) |
David C. Arch - 1945 Trustee | | 2010 | | Chairman of Blistex Inc. (consumer health care products manufacturer); Member, World Presidents’ Organization | | 229 | | Board member of the Illinois Manufacturers’ Association |
Beth Ann Brown - 1968 Trustee | | 2019 | | Independent Consultant Formerly: Head of Intermediary Distribution, Managing Director, Strategic Relations, Managing Director, Head of National Accounts, Senior Vice President, National Account Manager and Senior Vice President, Key Account Manager, Columbia Management Investment Advisers LLC; Vice President, Key Account Manager, Liberty Funds Distributor, Inc.; and Trustee of certain Oppenheimer Funds | | 229 | | Director, Board of Directors of Caron Engineering Inc.; Advisor, Board of Advisors of Caron Engineering Inc.; President and Director, Acton Shapleigh Youth Conservation Corps (non - profit); and Vice President and Director of Grahamtastic Connection (non-profit) |
Jack M. Fields - 1952 Trustee | | 1997 | | Chief Executive Officer, Twenty First Century Group, Inc. (government affairs company); and Chairman, Discovery Learning Alliance(non-profit) Formerly: Owner and Chief Executive Officer, Dos Angeles Ranch L.P. (cattle, hunting, corporate entertainment); Director, Insperity, Inc. (formerly known as Administaff) (human resources provider); Chief Executive Officer, Texana Timber LP (sustainable forestry company); Director of Cross Timbers Quail Research Ranch(non-profit); and member of the U.S. House of Representatives | | 229 | | None |
Invesco V.I. American Value Fund
Trustees and Officers–(continued)
| | | | | | | | |
Name, Year of Birth and Position(s) Held with the Trust | | Trustee and/or Officer Since | | Principal Occupation(s) During Past 5 Years | | Number of
Funds in
Fund Complex
Overseen by
Trustee | | Other Directorship(s) Held by Trustee
During Past 5 Years |
| Independent Trustees–(continued) |
Cynthia Hostetler - 1962 Trustee | | 2017 | | Non-Executive Director and Trustee of a number of public and private business corporations Formerly: Director, Aberdeen Investment Funds (4 portfolios); Head of Investment Funds and Private Equity, Overseas Private Investment Corporation; President, First Manhattan Bancorporation, Inc.; Attorney, Simpson Thacher & Bartlett LLP | | 229 | | Vulcan Materials Company (construction materials company); Trilinc Global Impact Fund; Genesee & Wyoming, Inc. (railroads); Artio Global Investment LLC (mutual fund complex); Edgen Group, Inc. (specialized energy and infrastructure products distributor); Investment Company Institute (professional organization); Independent Directors Council (professional organization) |
Eli Jones - 1961 Trustee | | 2016 | | Professor and Dean, Mays Business School - Texas A&M University Formerly: Professor and Dean, Walton College of Business, University of Arkansas and E.J. Ourso College of Business, Louisiana State University; Director, Arvest Bank | | 229 | | Insperity, Inc. (formerly known as Administaff) (human resources provider) |
Elizabeth Krentzman - 1959 Trustee | | 2019 | | Formerly: Principal and Chief Regulatory Advisor for Asset Management Services and U.S. Mutual Fund Leader of Deloitte & Touche LLP; General Counsel of the Investment Company Institute (trade association); National Director of the Investment Management Regulatory Consulting Practice, Principal, Director and Senior Manager of Deloitte & Touche LLP; Assistant Director of the Division of Investment Management - Office of Disclosure and Investment Adviser Regulation of the U.S. Securities and Exchange Commission and various positions with the Division of Investment Management - Office of Regulatory Policy of the U.S. Securities and Exchange Commission; Associate at Ropes & Gray LLP; Advisory Board Member of the Securities and Exchange Commission Historical Society; and Trustee of certain Oppenheimer Funds | | 229 | | Trustee of the University of Florida National Board Foundation and Audit Committee Member; Member of the Cartica Funds Board of Directors (private investment funds); Member of the University of Florida Law Center Association, Inc. Board of Trustees and Audit Committee Member |
Anthony J. LaCava, Jr. - 1956 Trustee | | 2019 | | Formerly: Director and Member of the Audit Committee, Blue Hills Bank (publicly traded financial institution) and Managing Partner, KPMG LLP | | 229 | | Blue Hills Bank; Chairman, Bentley University; Member, Business School Advisory Council; and Nominating Committee KPMG LLP |
Prema Mathai-Davis - 1950 Trustee | | 1998 | | Retired Co-Owner & Partner of Quantalytics Research, LLC, (a FinTech Investment Research Platform for the Self-Directed Investor) | | 229 | | None |
Invesco V.I. American Value Fund
Trustees and Officers–(continued)
| | | | | | | | |
Name, Year of Birth and Position(s) Held with the Trust | | Trustee and/or Officer Since | | Principal Occupation(s) During Past 5 Years | | Number of
Funds in
Fund Complex
Overseen by
Trustee | | Other Directorship(s) Held by Trustee
During Past 5 Years |
| Independent Trustees–(continued) |
Joel W. Motley - 1952 Trustee | | 2019 | | Director of Office of Finance, Federal Home Loan Bank; Member of the Vestry of Trinity Wall Street; Managing Director of Carmona Motley Inc. (privately held financial advisor); Member of the Finance and Budget Committee of the Council on Foreign Relations, Member of the Investment Committee and Board of Human Rights Watch and Member of the Investment Committee and Board of Historic Hudson Valley(non-profit cultural organization) Formerly: Managing Director of Public Capital Advisors, LLC (privately held financial advisor); Managing Director of Carmona Motley Hoffman, Inc. (privately held financial advisor); Trustee of certain Oppenheimer Funds; and Director of Columbia Equity Financial Corp. (privately held financial advisor) | | 229 | | Director of Greenwall Foundation (bioethics research foundation); Member of Board and Investment Committee of The Greenwall Foundation; Director of Southern Africa Legal Services Foundation; Board Member and Investment Committee Member of Pulizer Center for Crisis Reporting(non-profit journalism) |
Teresa M. Ressel - 1962 Trustee | | 2017 | | Non-executive director and trustee of a number of public and private business corporations Formerly: Chief Financial Officer, Olayan America, The Olayan Group (international investor/commercial/industrial); Chief Executive Officer, UBS Securities LLC; Group Chief Operating Officer, Americas, UBS AG; Assistant Secretary for Management & Budget and CFO, US Department of the Treasury | | 229 | | Atlantic Power Corporation (power generation company); ON Semiconductor Corp. (semiconductor supplier) |
Ann Barnett Stern - 1957 Trustee | | 2017 | | President and Chief Executive Officer, Houston Endowment Inc. (private philanthropic institution) Formerly: Executive Vice President and General Counsel, Texas Children’s Hospital; Attorney, Beck, Redden and Secrest, LLP; Business Law Instructor, University of St. Thomas; Attorney, Andrews & Kurth LLP | | 229 | | Federal Reserve Bank of Dallas |
Robert C. Troccoli - 1949 Trustee | | 2016 | | Retired | | 229 | | None |
| Daniel S. Vandivort - 1954 Trustee | | 2019 | | Treasurer, Chairman of the Audit and Finance Committee, and Trustee, Board of Trustees, Huntington Disease Foundation of America; and President, Flyway Advisory Services LLC (consulting and property management) Formerly: Trustee and Governance Chair, of certain Oppenheimer Funds | | 229 | | Chairman and Lead Independent Director, Chairman of the Audit Committee, and Director, Board of Directors, Value Line Funds |
| James D. Vaughn - 1945 Trustee | | 2019 | | Retired Formerly: Managing Partner, Deloitte & Touche LLP; Trustee and Chairman of the Audit Committee, Schroder Funds; Board Member, Mile High United Way, Boys and Girls Clubs, Boy Scouts, Colorado Business Committee for the Arts, Economic Club of Colorado and Metro Denver Network (economic development corporation); and Trustee of certain Oppenheimer Funds | | 229 | | Board member and Chairman of Audit Committee of AMG National Trust Bank; Trustee and Investment Committee member, University of South Dakota Foundation; Board member, Audit Committee Member and past Board Chair, Junior Achievement(non-profit) |
Invesco V.I. American Value Fund
Trustees and Officers–(continued)
| | | | | | | | |
Name, Year of Birth and Position(s) Held with the Trust | | Trustee and/or Officer Since | | Principal Occupation(s) During Past 5 Years | | Number of
Funds in
Fund Complex
Overseen by
Trustee | | Other Directorship(s) Held by Trustee
During Past 5 Years |
| Independent Trustees–(continued) |
| Christopher L. WIlson - 1957 Trustee, Vice Chair and Chair Designate | | 2017 | | Retired Formerly: Director, TD Asset Management USA Inc. (mutual fund complex) (22 portfolios); Managing Partner, CT2, LLC (investing and consulting firm); President/Chief Executive Officer, Columbia Funds, Bank of America Corporation; President/Chief Executive Officer, CDC IXIS Asset Management Services, Inc.; Principal & Director of Operations, Scudder Funds, Scudder, Stevens & Clark, Inc.; Assistant Vice President, Fidelity Investments | | 229 | | ISO New England, Inc.(non-profit organization managing regional electricity market) |
Invesco V.I. American Value Fund
Trustees and Officers–(continued)
| | | | | | | | |
Name, Year of Birth and Position(s) Held with the Trust | | Trustee and/or Officer Since | | Principal Occupation(s) During Past 5 Years | | Number of
Funds in
Fund Complex
Overseen by
Trustee | | Other Directorship(s) Held by Trustee
During Past 5 Years |
| Officers |
Sheri Morris - 1964 President, Principal Executive Officer and Treasurer | | 1999 | | Head of Global Fund Services, Invesco Ltd.; President, Principal Executive Officer and Treasurer, The Invesco Funds; Vice President, Invesco Advisers, Inc. (formerly known as Invesco Institutional (N.A.), Inc.) (registered investment adviser); and Vice President, Invesco Exchange-Traded Fund Trust, Invesco Exchange-Traded Fund Trust II, Invesco India Exchange-Traded Fund Trust, Invesco Actively Managed Exchange-Traded Fund Trust, Invesco Actively Managed Exchange-Traded Commodity Fund Trust and Invesco Exchange-Traded Self-Indexed Fund Trust; and Vice President, OppenheimerFunds, Inc. Formerly: Vice President and Principal Financial Officer, The Invesco Funds; Vice President, Invesco AIM Advisers, Inc., Invesco AIM Capital Management, Inc. and Invesco AIM Private Asset Management, Inc.; Assistant Vice President and Assistant Treasurer, The Invesco Funds and Assistant Vice President, Invesco Advisers, Inc., Invesco AIM Capital Management, Inc. and Invesco AIM Private Asset Management, Inc.; and Treasurer, Invesco Exchange-Traded Fund Trust, Invesco Exchange-Traded Fund Trust II, Invesco India Exchange-Traded Fund Trust and Invesco Actively Managed Exchange-Traded Fund Trust | | N/A | | N/A |
Russell C. Burk - 1958 Senior Vice President and Senior Officer | | 2005 | | Senior Vice President and Senior Officer, The Invesco Funds | | N/A | | N/A |
Jeffrey H. Kupor - 1968 Senior Vice President, Chief Legal Officer and Secretary | | 2018 | | Head of Legal of the Americas, Invesco Ltd.; Senior Vice President and Secretary, Invesco Advisers, Inc. (formerly known as Invesco Institutional (N.A.), Inc.) (registered investment adviser); Senior Vice President and Secretary, Invesco Distributors, Inc. (formerly known as Invesco AIM Distributors, Inc.); Vice President and Secretary, Invesco Investment Services, Inc. (formerly known as Invesco AIM Investment Services, Inc.) Senior Vice President, Chief Legal Officer and Secretary, The Invesco Funds; Secretary and General Counsel, Invesco Investment Advisers LLC (formerly known as Van Kampen Asset Management); Secretary and General Counsel, Invesco Capital Markets, Inc. (formerly known as Van Kampen Funds Inc.) and Chief Legal Officer, Invesco Exchange-Traded Fund Trust, Invesco Exchange-Traded Fund Trust II, Invesco India Exchange-Traded Fund Trust, Invesco Actively Managed Exchange-Traded Fund Trust, Invesco Actively Managed Exchange-Traded Commodity Fund Trust and Invesco Exchange-Traded Self-Indexed Fund Trust; Secretary, Invesco Indexing LLC; Secretary, W.L. Ross & Co., LLC Formerly: Secretary and Vice President, Jemstep, Inc.; Head of Legal, Worldwide Institutional, Invesco Ltd.; Secretary and General Counsel, INVESCO Private Capital Investments, Inc.; Senior Vice President, Secretary and General Counsel, Invesco Management Group, Inc. (formerly known as Invesco AIM Management Group, Inc.); Assistant Secretary, INVESCO Asset Management (Bermuda) Ltd.; Secretary and General Counsel, Invesco Private Capital, Inc.; Assistant Secretary and General Counsel, INVESCO Realty, Inc.; Secretary and General Counsel, Invesco Senior Secured Management, Inc.; and Secretary, Sovereign G./P. Holdings Inc. | | N/A | | N/A |
Andrew R. Schlossberg - 1974 Senior Vice President | | 2019 | | Head of the Americas and Senior Managing Director, Invesco Ltd.; Director and Senior Vice President, Invesco Advisers, Inc. (formerly known as Invesco Institutional (N.A.), Inc.) (registered investment adviser); Director and Chairman, Invesco Investment Services, Inc. (formerly known as Invesco AIM Investment Services, Inc.) (registered transfer agent); Senior Vice President, The Invesco Funds; Director, Invesco Investment Advisers LLC (formerly known as Van Kampen Asset Management); Director, President and Chairman, Invesco Insurance Agency, Inc. Formerly: Director, Invesco UK Limited; Director and Chief Executive, Invesco Asset Management Limited and Invesco Fund Managers Limited; Assistant Vice President, The Invesco Funds; Senior Vice President, Invesco Advisers, Inc. (formerly known as Invesco Institutional (N.A.), Inc.) (registered investment adviser); Director and Chief Executive, Invesco Administration Services Limited and Invesco Global Investment Funds Limited; Director, Invesco Distributors, Inc.; Head of EMEA, Invesco Ltd.; President, Invesco Actively Managed Exchange-Traded Commodity Fund Trust, Invesco Actively Managed Exchange-Traded Fund Trust, Invesco Exchange-Traded Fund Trust, Invesco Exchange-Traded Fund Trust II and Invesco India Exchange-Traded Fund Trust; Managing Director and Principal Executive Officer, Invesco Capital Management LLC | | N/A | | N/A |
Invesco V.I. American Value Fund
Trustees and Officers–(continued)
| | | | | | | | |
Name, Year of Birth and Position(s) Held with the Trust | | Trustee and/or Officer Since | | Principal Occupation(s) During Past 5 Years | | Number of
Funds in
Fund Complex
Overseen by
Trustee | | Other Directorship(s) Held by Trustee
During Past 5 Years |
| Officers–(continued) |
John M. Zerr - 1962 Senior Vice President | | 2006 | | Chief Operating Officer of the Americas; Senior Vice President, Invesco Advisers, Inc. (formerly known as Invesco Institutional (N.A.), Inc.) (registered investment adviser); Senior Vice President, Invesco Distributors, Inc. (formerly known as Invesco AIM Distributors, Inc.); Director and Vice President, Invesco Investment Services, Inc. (formerly known as Invesco AIM Investment Services, Inc.) Senior Vice President, The Invesco Funds; Managing Director, Invesco Capital Management LLC; Director, Invesco Investment Advisers LLC (formerly known as Van Kampen Asset Management); Senior Vice President, Invesco Capital Markets, Inc. (formerly known as Van Kampen Funds Inc.); Manager, Invesco Indexing LLC; Manager, Invesco Specialized Products, LLC; Director and Senior Vice President, Invesco Insurance Agency, Inc.; Member, Invesco Canada Funds Advisory Board; Director, President and Chief Executive Officer, Invesco Corporate Class Inc. (corporate mutual fund company); and Director, Chairman, President and Chief Executive Officer, Invesco Canada Ltd. (formerly known as Invesco Trimark Ltd./Invesco Trimark Ltèe) (registered investment adviser and registered transfer agent) Formerly: Director and Senior Vice President, Invesco Management Group, Inc. (formerly known as Invesco AIM Management Group, Inc.); Secretary and General Counsel, Invesco Management Group, Inc. (formerly known as Invesco AIM Management Group, Inc.); Secretary, Invesco Investment Services, Inc. (formerly known as Invesco AIM Investment Services, Inc.); Chief Legal Officer and Secretary, The Invesco Funds; Secretary and General Counsel, Invesco Investment Advisers LLC (formerly known as Van Kampen Asset Management); Secretary and General Counsel, Invesco Capital Markets, Inc. (formerly known as Van Kampen Funds Inc.); Chief Legal Officer, Invesco Exchange-Traded Fund Trust, Invesco Exchange-Traded Fund Trust II, Invesco India Exchange-Traded Fund Trust, Invesco Actively Managed Exchange-Traded Fund Trust, Invesco Actively Managed Exchange-Traded Commodity Fund Trust and Invesco Exchange-Traded Self-Indexed Fund Trust; Secretary, Invesco Indexing LLC; Director, Secretary, General Counsel and Senior Vice President, Van Kampen Exchange Corp.; Director, Vice President and Secretary, IVZ Distributors, Inc. (formerly known as INVESCO Distributors, Inc.); Director and Vice President, INVESCO Funds Group, Inc.; Director and Vice President, Van Kampen Advisors Inc.; Director, Vice President, Secretary and General Counsel, Van Kampen Investor Services Inc.; Director and Secretary, Invesco Distributors, Inc. (formerly known as Invesco AIM Distributors, Inc.); Director, Senior Vice President, General Counsel and Secretary, Invesco AIM Advisers, Inc. and Van Kampen Investments Inc.; Director, Vice President and Secretary, Fund Management Company; Director, Senior Vice President, Secretary, General Counsel and Vice President, Invesco AIM Capital Management, Inc.; Chief Operating Officer and General Counsel, Liberty Ridge Capital, Inc. (an investment adviser) | | N/A | | N/A |
Gregory G. McGreevey - 1962 Senior Vice President | | 2012 | | Senior Managing Director, Invesco Ltd.; Director, Chairman, President, and Chief Executive Officer, Invesco Advisers, Inc. (formerly known as Invesco Institutional (N.A.), Inc.) (registered investment adviser); Director, Invesco Mortgage Capital, Inc. and Invesco Senior Secured Management, Inc.; and Senior Vice President, The Invesco Funds; and President, SNW Asset Management Corporation Formerly: Senior Vice President, Invesco Management Group, Inc. and Invesco Advisers, Inc.; Assistant Vice President, The Invesco Funds | | N/A | | N/A |
Kelli Gallegos - 1970 Vice President, Principal Financial Officer and Assistant Treasurer | | 2008 | | Principal Financial and Accounting Officer - Investments Pool, Invesco Specialized Products, LLC; Vice President, Principal Financial Officer and Assistant Treasurer, The Invesco Funds; Principal Financial and Accounting Officer - Pooled Investments, Invesco Capital Management LLC; Vice President and Treasurer, Invesco Exchange-Traded Fund Trust, Invesco Exchange-Traded Fund Trust II, Invesco India Exchange-Traded Fund Trust, Invesco Actively Managed Exchange-Traded Fund Trust, Invesco Actively Managed Exchange-Traded Commodity Fund Trust and Invesco Exchange-Traded Self-Indexed Fund Trust Formerly: Assistant Treasurer, Invesco Specialized Products, LLC; Assistant Treasurer, Invesco Exchange-Traded Fund Trust, Invesco Exchange-Traded Fund Trust II, Invesco India Exchange-Traded Fund Trust, Invesco Actively Managed Exchange-Traded Fund Trust, Invesco Actively Managed Exchange-Traded Commodity Fund Trust and Invesco Exchange-Traded Self-Indexed Fund Trust; Assistant Treasurer, Invesco Capital Management LLC; Assistant Vice President, The Invesco Funds | | N/A | | N/A |
Invesco V.I. American Value Fund
Trustees and Officers–(continued)
| | | | | | | | |
Name, Year of Birth and Position(s) Held with the Trust | | Trustee and/or Officer Since | | Principal Occupation(s) During Past 5 Years | | Number of
Funds in
Fund Complex
Overseen by
Trustee | | Other Directorship(s) Held by Trustee
During Past 5 Years |
| Officers–(continued) |
Crissie M. Wisdom - 1969 Anti-Money Laundering Compliance Officer | | 2013 | | Anti-Money Laundering Compliance Officer, Invesco Advisers, Inc. (formerly known as Invesco Institutional (N.A.), Inc.) (registered investment adviser), Invesco Capital Markets, Inc. (formerly known as Van Kampen Funds Inc.), Invesco Distributors, Inc., Invesco Investment Services, Inc., The Invesco Funds, and Invesco Exchange-Traded Fund Trust, Invesco Exchange-Traded Fund Trust II, Invesco India Exchange-Traded Fund Trust, Invesco Actively Managed Exchange-Traded Fund Trust, Invesco Actively Managed Exchange-Traded Commodity Fund Trust and Invesco Exchange-Traded Self-Indexed Fund Trust; Anti-Money Laundering Compliance Officer and Bank Secrecy Act Officer, INVESCO National Trust Company and Invesco Trust Company; and Fraud Prevention Manager and Controls and Risk Analysis Manager for Invesco Investment Services, Inc. Formerly: Anti-Money Laundering Compliance Officer, Van Kampen Exchange Corp. and Invesco Management Group, Inc. | | N/A | | N/A |
Robert R. Leveille - 1969 Chief Compliance Officer | | 2016 | | Chief Compliance Officer, Invesco Advisers, Inc. (registered investment adviser); and Chief Compliance Officer, The Invesco Funds Formerly: Chief Compliance Officer, Putnam Investments and the Putnam Funds | | N/A | | N/A |
The Statement of Additional Information of the Trust includes additional information about the Fund’s Trustees and is available upon request, without charge, by calling 1.800.959.4246. Please refer to the Fund’s Statement of Additional Information for information on the Fund’ssub-advisers.
| | | | | | |
| Office of the Fund | | Investment Adviser | | Distributor | | Auditors |
| 11 Greenway Plaza, Suite 1000 | | Invesco Advisers, Inc. | | Invesco Distributors, Inc. | | PricewaterhouseCoopers LLP |
| Houston, TX 77046-1173 | | 1555 Peachtree Street, N.E. | | 11 Greenway Plaza, Suite 1000 | | 1000 Louisiana Street, Suite 5800 |
| | Atlanta, GA 30309 | | Houston, TX 77046-1173 | | Houston, TX 77002-5678 |
| | | |
| Counsel to the Fund | | Counsel to the Independent Trustees | | Transfer Agent | | Custodian |
| Stradley Ronon Stevens & Young, LLP | | Goodwin Procter LLP | | Invesco Investment Services, Inc. | | State Street Bank and Trust Company |
| 2005 Market Street, Suite 2600 | | 901 New York Avenue, N.W. | | 11 Greenway Plaza, Suite 1000 | | 225 Franklin Street |
| Philadelphia, PA 19103-7018 | | Washington, D.C. 20001 | | Houston, TX 77046-1173 | | Boston, MA 02110-2801 |
Invesco V.I. American Value Fund
| | | | |
| | |
 | | Annual Report to Shareholders | | December 31, 2019 |
| | Invesco V.I. Balanced-Risk Allocation Fund |
| | |
| | |

Beginning on January 1, 2021, as permitted by regulations adopted by the Securities and Exchange Commission, the insurance company that offers your variable annuity or variable life insurance contract may no longer send you paper copies of the Fund’s shareholder reports by mail, unless you specifically request paper copies of the reports from the insurance company or your financial intermediary. Instead of delivering paper copies of the report, the insurance company may choose to make the reports available on a website, and will notify you by mail each time a report is posted and provide you with a website link to access the report. Instructions for requesting paper copies will be provided by your insurance company.
If the insurance company offers electronic delivery, you may elect to receive shareholder reports and other communications about the Fund electronically by following the instructions provided by the insurance company or by contacting your financial intermediary. If you already elected to receive shareholder reports electronically, you will not be affected by this change and you need not take any action.
You may elect to receive all future reports in paper free of charge from the insurance company. You can inform the insurance company or your financial intermediary that you wish to continue receiving paper copies of your shareholder reports by following the instructions provided by the insurance company or by contacting your financial intermediary. Your election to receive reports in paper will apply to all portfolio companies available under your contract with the insurance company.
The Fund provides a complete list of its holdings four times in each fiscal year, at the quarter-ends. For the second and fourth quarters, the lists appear in the Fund’s semiannual and annual reports to shareholders. For the first and third quarters, the Fund files the lists with the Securities and Exchange Commission (SEC) as an exhibit to its reports on FormN-PORT. The Fund’s FormN-PORT filings are available on the SEC website, sec.gov. The SEC file numbers for the Fund are811-07452 and033-57340. The Fund’s most recent portfolio holdings, as filed on FormN-PORT, have also been made available to insurance companies issuing variable annuity contracts and variable life insurance policies (“variable products”) that invest in the Fund.
A description of the policies and procedures that the Fund uses to determine how to vote proxies relating to portfolio securities is available without charge, upon request, from our Client Services department at 800 959 4246 or at invesco.com/proxyguidelines. The information is also available on the SEC website, sec.gov.
Information regarding how the Fund voted proxies related to its portfolio securities during the most recent12-month period ended June 30 is available at invesco.com/proxysearch. The information is also available on the SEC website, sec.gov.
Invesco Advisers, Inc. is an investment adviser; it provides investment advisory services to individual and institutional clients and does not sell securities. Invesco Distributors, Inc. is the US distributor for Invesco Ltd.’s retail mutual funds, exchange-traded funds and institutional money market funds. Both are wholly owned, indirect subsidiaries of Invesco Ltd.
This report must be accompanied or preceded by a currently effective Fund prospectus and variable product prospectus, which contain more complete information, including sales charges and expenses. Investors should read each carefully before investing.
NOT FDIC INSURED | MAY LOSE VALUE | NO BANK GUARANTEE
| | |
| Invesco Distributors, Inc. | | VIIBRA-AR-1 |
Management’s Discussion of Fund Performance
Performance summary
For the year ended December 31, 2019, Series I shares of Invesco V.I. Balanced-Risk Allocation Fund (the Fund) underperformed the Custom Invesco V.I. Balanced-Risk Allocation Index, the Fund’s custom style-specific index.
Your Fund’s long-term performance appears later in this report.
Fund vs. Indexes
Total returns, 12/31/18 to 12/31/19, excluding variable product issuer charges. If variable product issuer charges were included, returns would be lower.
| | | | |
| |
Series I Shares | | | 15.21 | % |
| |
Series II Shares | | | 14.88 | |
MSCI World Indexq(Broad Market Index) | | | 27.67 | |
Custom Invesco V.I. Balanced-Risk Allocation Index∎(Style-Specific Index) | | | 19.93 | |
Lipper VUF Absolute Return Funds Classification Average∎(Peer Group) | | | 3.68 | |
|
Source(s):qRIMES Technologies Corp.;∎Invesco, RIMES Technologies Corp.;◆Lipper Inc. | |
Market conditions and your Fund
For the year ended December 31, 2019, the Fund reported positive absolute performance as all three of the three asset classes in which the Fund invests (stocks, bonds and commodities) contributed to Fund performance. The Fund invests in derivatives, such as swaps and futures, which are expected to correspond to the performance of US and international fixed income, equity and commodity markets. The strategic allocation portion of the investment process involves first selecting representative assets for each asset class from a universe of more than 50 assets. Next, we seek to construct the portfolio so that an approximately equal amount of risk comes from our equity, fixed income and commodity allocations. Tactical adjustments to the Fund’s portfolio are then made on a monthly basis to try and take advantage of short-term market dynamics.
The Fund’s strategic exposure to equities, obtained through the use of swaps and futures, contributed to results for the year with all six markets in which the Fund invests delivering positive returns. Equity markets applauded January’s pivot in central bank policy and optimism in trade relations between the US and China. European stocks were the top equity contributor for the year as the
region’s markets arguably had the most to gain from the central bank pivot given the eurozone economy has been teetering on the edge of recession. USlarge-cap stocks closed atall-time highs on the strength of cyclical sectors including technology, industrials and financials, while USsmall-cap stocks finished the year up and close to theirall-time high reached in August 2018. Japanese equities contributed as October saw the nation reach a trade deal with the US that focused on agricultural goods, while December’s Phase One trade deal provided additional relief to the export-focused economy. The country also implemented more fiscal stimulus given a record spending budget was passed to boost growth. UK stocks found positive footing after years of drama surrounding the ongoing challenge to leave the European Union (Brexit). UK stocks reached anall-time high in July and closed the year near those levels despite the headwinds of Brexit. Hong Kong stocks posted smaller gains as losses in the second half of the year reduced their first-half advance while the city has been mired in civil unrest. Abrupt price trend reversals during most of the year were challenging for our tactical stock positioning but the rally in the fourth quarter combined with an overweight position resulted in gains.
The Fund’s strategic exposure to global government bonds, obtained through the use of swaps and futures, contributed to Fund performance for the year with all six markets in which the Fund invests posting positive performance. Australian government bonds led performance as the Reserve Bank of Australia (RBA) cut interest rates three times in June, July and October. Prices were also supported by slower growth in China, one of the country’s largest trading partners, and the lingering trade war between China and the US. US Treasury prices rose as the US Federal Reserve surrendered to market pressure and decreased rates three times (August, September and October). Canadian bonds also contributed as the Bank of Canada held interest rates steady throughout the year which was justified by stable economic data and strong housing activity. Given multiple Brexit delays and the departure of Theresa May, the Bank of England held rates steady as gilt yields joined the global decline as the10-year bond set a newall-time low yield in August and ended the year just slightly above that record level. German bunds provided a marginal contribution after being temporarily removed from the portfolio in April and then again in June for the remainder of the year as10-year yields reached negative levels for the first time since 2016. Negative interest rates in Japan also caused the market to be removed from the portfolio in February through the remainder of the year. Tactical positioning in bonds benefitted from overweight exposure relative to the strategic positioning during the first half of the year.
The Fund’s strategic exposure to commodities, obtained through the use of swaps, futures and commodity-linked notes, also added to Fund performance for the year due to higher energy and precious metal prices. Positive performance was concentrated in the first and fourth quarters of the year as the asset class was heavily impacted by sentiment regarding trade conflict. Other primary
| | |
Target Risk Allocation and Notional Asset Weights as of 12/31/19 By asset class |
| | | | | | | | |
| Asset Class | | Target Risk
Allocation* | | | Notional Asset
Weights** | |
Equities | | | 44.12 | % | | | 41.64 | % |
Fixed Income | | | 16.67 | | | | 57.28 | |
Commodities | | | 39.21 | | | | 38.09 | |
Total | | | 100.00 | % | | | 137.01 | % |
| * | Reflects the risk that each asset class is expected to contribute to the overall risk of the Fund as measured by standard deviation and estimates of risk based on historical data. Standard deviation measures the annualized fluctuations (volatility) of monthly returns. |
| ** | Proprietary models determine the Notional Asset Weights necessary to achieve the Target Risk Allocations. Total Notional Asset Weight greater than 100% is achieved through derivatives and other instruments that create leverage. |
| | | | |
Total Net Assets | | $ | 1.0 billion | |
Invesco V.I. Balanced-Risk Allocation Fund
factors affecting commodity prices were the stable strength of the US dollar and concerns about demand given lower global growth.
Energy was the top contributor to Fund performance within the commodity asset class with five of our six exposures delivering double-digit returns. Energy’s largest gains came both early and late in the year on central bank easing and as the trade conflict was deescalated. OPEC’s production cuts provided another layer of support and delivered a second late year boost after OPEC announced in December that it would deepen production cuts in 2020. Oil prices saw Brent oil outpace West Texas Intermediate oil, while both pushed unleaded gasoline to asub-complex leading gain. Natural gas countered the uptrend as rising production and temperate weather caused prices to fall nearly 40%. Performance within metalssub-complexes were mixed. Precious metals advanced as gold out-paced silver and recorded its best year since 2010. Despite a great year for stocks, gold still rallied due to higher physical demand, heightened geopolitical risk and increased amounts of negative yielding bonds that add to the metal’s appeal. Silver joined the gold rally but to a lesser extent due to its crossover use as an economically sensitive industrial metal. Industrial metals were flat as aluminum fell and copper advanced. Aluminum declined due to rising global output and lower demand resulting from falling automobile production and slower growth in China. Copper closed the year with a gain solely due to December’s trade agreement rally. Agriculture detracted from Fund performance as it has been the complex the most directly impacted by the trade conflict and ongoing strength in the US dollar. Livestock posted negative performance due to an oversupply of lean hogs in the US, coupled with a lack of demand from China due to pork tariffs implemented in 2018. However, the large decline in lean hogs had limited impact on the strategy because we constrain its allocation due to low liquidity. Cotton was the largest detractor within agriculture as it was dually impacted by rising supply and from trade tariffs. Grains were also key detractors as corn, soybeans and soymeal were hindered by tariffs, while wheat rallied due to poor weather in key growing regions. Coffee was a top performer within agriculture as drought conditions in Brazil triggered supply fears. The Fund’s tactical positioning in commodities benefited from our underweight exposures
to agriculture, industrial metals and natural gas.
Please note that our strategy is principally implemented with derivative instruments that include futures, commodity-linked notes and total return swaps. Therefore, all or most of the performance of the strategy, both positive and negative, can be attributed to these instruments. Derivatives can be a cost-effective way to gain exposure to asset classes. However, derivatives may amplify traditional investment risks through the creation of leverage and may be less liquid than traditional securities.
Thank you for your continued investment in Invesco V.I. Balanced-Risk Allocation Fund.
Portfolio managers:
Mark Ahnrud
Chris Devine
Scott Hixon
Christian Ulrich
Scott Wolle
The views and opinions expressed in management’s discussion of Fund performance are those of Invesco Advisers, Inc. These views and opinions are subject to change at any time based on factors such as market and economic conditions. These views and opinions may not be relied upon as investment advice or recommendations, or as an offer for a particular security. The information is not a complete analysis of every aspect of any market, country, industry, security or the Fund. Statements of fact are from sources considered reliable, but Invesco Advisers, Inc. makes no representation or warranty as to their completeness or accuracy. Although historical performance is no guarantee of future results, these insights may help you understand our investment management philosophy.
See important Fund and, if applicable, index disclosures later in this report.
Invesco V.I. Balanced-Risk Allocation Fund
Your Fund’s Long-Term Performance
Results of a $10,000 Investment – Oldest Share Class(es)
Fund and index data from 12/31/09
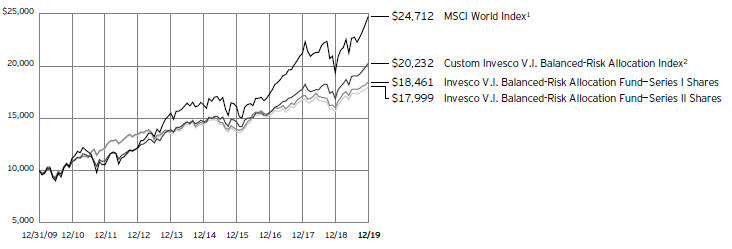
1 Source: RIMES Technologies Corp.
2 Source: Invesco, RIMES Technologies Corp.
Past performance cannot guarantee future results.
Due to changes within the Lipper VUF Absolute Returns Funds Classification Average, certain components do not have 10 years of
historical data. As such, the benchmark has not been included within the chart above.
| | | | |
Average Annual Total Returns | |
As of 12/31/19 | | | | |
| |
Series I Shares | | | | |
Inception (1/23/09) | | | 8.20 | % |
10 Years | | | 6.32 | |
5 Years | | | 4.91 | |
1 Year | | | 15.21 | |
Series II Shares | | | | |
Inception (1/23/09) | | | 7.92 | % |
10 Years | | | 6.05 | |
5 Years | | | 4.65 | |
1 Year | | | 14.88 | |
The returns shown above include the returns of Invesco Van Kampen V.I. Global Tactical Asset Allocation Fund (the first predecessor fund) for the period June 1, 2010, to May 2, 2011, the date the first predecessor fund was reorganized into the Fund, and the returns of Van Kampen Life Investment Trust Global Tactical Asset Allocation Portfolio (the second predecessor fund) for the period prior to June 1, 2010, the date the second predecessor fund was reorganized into the first predecessor fund. The second predecessor fund was advised by Van Kampen Asset Management. Returns shown above for Series I and Series II shares are blended returns of the predecessor funds and Invesco V.I. Balanced-Risk Allocation Fund. Share class returns will differ from the predecessor funds because of different expenses.
The performance data quoted represent past performance and cannot guarantee future results; current performance may be
lower or higher. Please contact your variable product issuer or financial adviser for the most recentmonth-end variable product performance. Performance figures reflect Fund expenses, reinvested distributions and changes in net asset value. Performance figures do not reflect deduction of taxes a shareholder would pay on Fund distributions or sale of Fund shares. Investment return and principal value will fluctuate so that you may have a gain or loss when you sell shares.
The net annual Fund operating expense ratio set forth in the most recent Fund prospectus as of the date of this report for Series I and Series II shares was 0.80% and 1.05%, respectively.1, 2, 3 The total annual Fund operating expense ratio set forth in the most recent Fund prospectus as of the date of this report for Series I and Series II shares was 1.26% and 1.51%, respectively.1 The expense ratios presented above may vary from the expense ratios presented in other sections of this report that are based on expenses incurred during the period covered by this report.
Invesco V.I. Balanced-Risk Allocation Fund, a series portfolio of AIM Variable Insurance Funds (Invesco Variable Insurance Funds), is currently offered through insurance companies issuing variable products. You cannot purchase shares of the Fund directly. Performance figures given represent the Fund and are not intended to reflect actual variable product values. They do not reflect sales charges, expenses and fees assessed in connection with a variable product.
Sales charges, expenses and fees, which are determined by the variable product issuers, will vary and will lower the total return.
The most recentmonth-end performance at the Fund level, excluding variable product charges, is available at 800 451 4246. As mentioned above, for the most recentmonth-end performance including variable product charges, please contact your variable product issuer or financial adviser.
Fund performance reflects any applicable fee waivers and/or expense reimbursements. Had the adviser not waived fees and/or reimbursed expenses currently or in the past, returns would have been lower. See current prospectus for more information.
| 1 | The expense ratio includes acquired fund fees and expenses of the underlying funds in which the Fund invests of 0.16%. |
| 2 | Total annual Fund operating expenses after any contractual fee waivers and/or expense reimbursements by the adviser in effect through at least April 30, 2021. See current prospectus for more information. |
| 3 | Total annual Fund operating expenses after any contractual fee waivers and/or expense reimbursements by the adviser in effect through at least June 30, 2021. See current prospectus for more information. |
Invesco V.I. Balanced-Risk Allocation Fund
Invesco V.I. Balanced-Risk Allocation Fund’s investment objective is total return with a low to moderate correlation to traditional financial market indices.
| ∎ | Unless otherwise stated, information presented in this report is as of December 31, 2019, and is based on total net assets. |
| ∎ | Unless otherwise noted, all data provided by Invesco. |
| ∎ | To access your Fund’s reports/prospectus, visit invesco.com/fundreports. |
About indexes used in this report
| ∎ | TheMSCI WorldSM Indexis considered representative of stocks of developed countries. The index is computed using the net return, which withholds applicable taxes for non-resident investors. |
| ∎ | TheCustom Invesco V.I. Balanced-Risk Allocation Indexis composed of the MSCI World Index and Bloomberg Barclays U.S. Aggregate Bond Index. Prior to May 2, 2011, the index comprised the MSCI World Index, JP Morgan GBI Global Index and FTSE US3-Month Treasury Bill Index. |
| ∎ | TheLipper VUF Absolute Return Funds Classification Averagerepresents an average of all variable insurance underlying funds in the Lipper Absolute Return Funds Classification. |
| ∎ | TheBloomberg Barclays U.S. Aggregate Bond Indexis considered representative of the US investment grade, fixed-rate bond market. |
| ∎ | TheFTSE US3-Month Treasury Bill Indexis considered representative of three-month US Treasury bills. |
| ∎ | TheJP Morgan GBI Global Indextracks the performance of fixed-rate issuances from high-income, developed market countries. |
| ∎ | The Fund is not managed to track the performance of any particular index, including the index(es) described here, and consequently, the performance of the Fund may deviate significantly from the performance of the index(es). |
| ∎ | A direct investment cannot be made in an index. Unless otherwise indicated, index results include reinvested dividends, and they do not reflect sales charges. Performance of the peer group, if applicable, reflects fund expenses; performance of a market index does not. |
Other information
| ∎ | The returns shown in management’s discussion of Fund performance are based on net asset values calculated for shareholder transactions. Generally accepted accounting principles require adjustments to be made to the net assets of the Fund at period end for financial reporting purposes, and as such, the net asset values for |
| | shareholder transactions and the returns based on those net asset values may differ from the net asset values and returns reported in the Financial Highlights. Additionally, the returns and net asset values shown throughout this report are at the Fund level only and do not include variable product issuer charges. If such charges were included, the total returns would be lower. |
| ∎ | Industry classifications used in this report are generally according to the Global Industry Classification Standard, which was developed by and is the exclusive property and a service mark of MSCI Inc. and Standard & Poor’s. |
Invesco V.I. Balanced-Risk Allocation Fund
Consolidated Schedule of Investments
December 31, 2019
| | | | | | | | | | | | | | | | |
| | | Interest
Rate | | | Maturity
Date | | | Principal
Amount (000) | | | Value | |
U.S. Treasury Securities–11.42%(a) | | | | | | | | | | | | | | | | |
U.S. Treasury Bills–11.42% | | | | | | | | | | | | | | | | |
U.S. Treasury Bills | | | 2.02% | | | | 01/09/2020 | | | $ | 46,000 | | | $ | 45,979,300 | |
U.S. Treasury Bills | | | 1.53% | | | | 03/05/2020 | | | | 45,500 | | | | 45,380,761 | |
U.S. Treasury Bills | | | 1.52% | | | | 05/07/2020 | | | | 13,000 | | | | 12,930,897 | |
U.S. Treasury Bills | | | 1.53% | | | | 06/04/2020 | | | | 12,500 | | | | 12,418,107 | |
Total U.S. Treasury Securities (Cost $116,703,576) | | | | | | | | | | | | | | | 116,709,065 | |
| | | | |
| | | | | | Expiration
Date | | | | | | | |
Commodity-Linked Securities–2.06% | | | | | | | | | | | | | | | | |
Canadian Imperial Bank of Commerce EMTN, U.S. Federal Funds Effective Rate minus 0.02% (linked to the Canadian Imperial Bank of Commerce Custom 7 Agriculture Commodity Index, multiplied by 2) (Canada)(b)(c) | | | | | | | 09/22/2020 | | | | 7,380 | | | | 8,572,931 | |
Cargill, Inc., Commodity-Linked Notes, one mo. USD LIBOR minus 0.10% (linked to the Monthly Rebalance Commodity Excess Return Index, multiplied by 2)(b) | | | | | | | 03/20/2020 | | | | 12,950 | | | | 12,490,903 | |
Total Commodity-Linked Securities (Cost $20,330,000) | | | | | | | | | | | | | | | 21,063,834 | |
| | | | |
| | | | | | | | | Shares | | | | |
Money Market Funds–81.75%(d) | | | | | | | | | | | | | | | | |
Invesco Government & Agency Portfolio, Institutional Class, 1.50% | | | | | | | | | | | 229,550,075 | | | | 229,550,075 | |
Invesco Government Money Market Fund, Cash Reserve Shares, 1.18% | | | | | | | | | | | 82,795,364 | | | | 82,795,364 | |
Invesco Premier U.S. Government Money Portfolio, Institutional Class, 1.47% | | | | | | | | | | | 126,387,049 | | | | 126,387,049 | |
Invesco STIC (Global Series) PLC, U.S. Dollar Liquidity Portfolio (Ireland), Institutional Class, 1.73% | | | | | | | | | | | 67,396,463 | | | | 67,396,463 | |
Invesco Treasury Obligations Portfolio, Institutional Class, 1.47% | | | | | | | | | | | 171,324,067 | | | | 171,324,067 | |
Invesco Treasury Portfolio, Institutional Class, 1.49% | | | | | | | | | | | 141,286,416 | | | | 141,286,416 | |
Invesco V.I. Government Money Market Fund, Series I, 1.32% | | | | | | | | | | | 16,640,310 | | | | 16,640,310 | |
Total Money Market Funds (Cost $835,379,744) | | | | | | | | | | | | | | | 835,379,744 | |
TOTAL INVESTMENTS IN SECURITIES-95.23% (Cost $972,413,320) | | | | | | | | 973,152,643 | |
OTHER ASSETS LESS LIABILITIES-4.77% | | | | | | | | | | | | | | | 48,751,621 | |
NET ASSETS-100.00% | | | | | | | | | | | | | | $ | 1,021,904,264 | |
Investment Abbreviations:
| | |
EMTN | | - European Medium-Term Notes |
LIBOR | | - London Interbank Offered Rate |
USD | | - U.S. Dollar |
Notes to Consolidated Schedule of Investments:
| (a) | Security traded on a discount basis. The interest rate shown represents the discount rate at the time of purchase by the Fund. |
| (b) | Security purchased or received in a transaction exempt from registration under the Securities Act of 1933, as amended (the “1933 Act”). The security may be resold pursuant to an exemption from registration under the 1933 Act, typically to qualified institutional buyers. The aggregate value of these securities at December 31, 2019 was $21,063,834, which represented 2.06% of the Fund’s Net Assets. |
| (c) | The Reference Entity Components table below includes additional information regarding the underlying components of certain reference entities that are not publicly available. |
| (d) | The money market fund and the Fund are affiliated by having the same investment adviser. The rate shown is the7-day SEC standardized yield as of December 31, 2019. |
See accompanying Notes to Consolidated Financial Statements which are an integral part of the financial statements.
Invesco V.I. Balanced-Risk Allocation Fund
Open Futures Contracts(a)
| | | | | | | | | | | | | | | | | | | | |
| Long Futures Contracts | | Number of
Contracts | | | Expiration
Month | | | Notional
Value | | | Value | | | Unrealized
Appreciation
(Depreciation) | |
| |
Commodity Risk | | | | | | | | | | | | | | | | | | | | |
| |
Brent Crude | | | 344 | | | | February-2020 | | | $ | 22,459,760 | | | $ | 1,837,569 | | | $ | 1,837,569 | |
| |
Gasoline Reformulated Blendstock Oxygenate Blending | | | 331 | | | | January-2020 | | | | 23,501,331 | | | | (275,794 | ) | | | (275,794 | ) |
| |
New York HarborUltra-Low Sulfur Diesel | | | 132 | | | | March-2020 | | | | 11,086,337 | | | | 1,036,198 | | | | 1,036,198 | |
| |
Silver | | | 251 | | | | March-2020 | | | | 22,490,855 | | | | 897,087 | | | | 897,087 | |
| |
WTI Crude | | | 212 | | | | June-2020 | | | | 12,480,440 | | | | 878,339 | | | | 878,339 | |
| |
Subtotal | | | | | | | | | | | | | | | 4,373,399 | | | | 4,373,399 | |
| |
Equity Risk | | | | | | | | | | | | | | | | | | | | |
| |
E-Mini Russell 2000 Index | | | 890 | | | | March-2020 | | | | 74,341,700 | | | | 254,690 | | | | 254,690 | |
| |
E-Mini S&P 500 Index | | | 435 | | | | March-2020 | | | | 70,276,425 | | | | 1,307,380 | | | | 1,307,380 | |
| |
EURO STOXX 50 Index | | | 2,000�� | | | | March-2020 | | | | 83,656,383 | | | | (216,502 | ) | | | (216,502 | ) |
| |
FTSE 100 Index | | | 1,015 | | | | March-2020 | | | | 100,821,716 | | | | 966,842 | | | | 966,842 | |
| |
Hang Seng Index | | | 269 | | | | January-2020 | | | | 48,795,798 | | | | 310,374 | | | | 310,374 | |
| |
Tokyo Stock Price Index | | | 774 | | | | March-2020 | | | | 122,594,818 | | | | 68,741 | | | | 68,741 | |
| |
Subtotal | | | | | | | | | | | | | | | 2,691,525 | | | | 2,691,525 | |
| |
Interest Rate Risk | | | | | | | | | | | | | | | | | | | | |
| |
Australia 10 Year Bonds | | | 2,690 | | | | March-2020 | | | | 269,863,135 | | | | (5,008,957 | ) | | | (5,008,957 | ) |
| |
Canada 10 Year Bonds | | | 2,151 | | | | March-2020 | | | | 227,730,530 | | | | (4,142,621 | ) | | | (4,142,621 | ) |
| |
Long Gilt | | | 622 | | | | March-2020 | | | | 108,244,124 | | | | (943,663 | ) | | | (943,663 | ) |
| |
U.S. Treasury Long Bonds | | | 606 | | | | March-2020 | | | | 94,479,188 | | | | (1,795,052 | ) | | | (1,795,052 | ) |
| |
Subtotal | | | | | | | | | | | | | | | (11,890,293 | ) | | | (11,890,293 | ) |
| |
Total Futures Contracts | | | | | | | | | | | | | | $ | (4,825,369 | ) | | $ | (4,825,369 | ) |
| |
| (a) | Futures contracts collateralized by $46,070,000 cash held with Goldman Sachs & Co., the futures commission merchant. |
See accompanying Notes to Consolidated Financial Statements which are an integral part of the financial statements.
Invesco V.I. Balanced-Risk Allocation Fund
| | | | | | | | | | | | | | | | | | | | | | | | | | | | | | | | | | |
OpenOver-The-Counter Total Return Swap Agreements(a)(b) |
| Counterparty | | Pay/
Receive | | | Reference Entity(c) | | Fixed
Rate | | | Payment Frequency | | | Number of Contracts | | | Maturity Date | | | Notional Value | | | Upfront
Payments
Paid
(Received) | | Value | | | Unrealized
Appreciation
(Depreciation) |
Commodity Risk |
Barclays Bank PLC | | | Receive | | | Barclays Commodity Strategy 1740 Index | | | 0.45% | | | | Monthly | | | | 50,200 | | | | August-2020 | | | $ | 11,221,899 | | | $– | | $ | 116,775 | | | $ 116,775 |
Canadian Imperial Bank of Commerce | | | Receive | | | Canadian Imperial Bank of Commerce Dynamic Roll LME Copper Excess Return Index 2 | | | 0.30 | | | | Monthly | | | | 279,000 | | | | April-2020 | | | | 21,200,066 | | | – | | | 54,349 | | | 54,349 |
Cargill, Inc. | | | Receive | | | Monthly Rebalance Commodity Excess Return Index | | | 0.47 | | | | Monthly | | | | 39,300 | | | | February-2020 | | | | 27,517,935 | | | – | | | 0 | | | 0 |
Cargill, Inc. | | | Receive | | | Single Commodity Index Excess Return | | | 0.12 | | | | Monthly | | | | 6,900 | | | | December-2020 | | | | 6,895,508 | | | – | | | 0 | | | 0 |
Goldman Sachs International | | | Receive | | | Goldman Sachs Commodity i-Select Strategy 1121 | | | 0.40 | | | | Monthly | | | | 384,500 | | | | October-2020 | | | | 26,620,638 | | | – | | | 865,921 | | | 865,921 |
JPMorgan Chase Bank, N.A. | | | Receive | | | J.P. Morgan Contag Beta Gas Oil Excess Return Index | | | 0.25 | | | | Monthly | | | | 44,300 | | | | April-2020 | | | | 11,494,304 | | | – | | | 28,489 | | | 28,489 |
JPMorgan Chase Bank, N.A. | | | Receive | | | S&P GSCI Gold Index Excess Return | | | 0.09 | | | | Monthly | | | | 126,000 | | | | October-2020 | | | | 14,409,285 | | | – | | | 332,968 | | | 332,968 |
Merrill Lynch International | | | Receive | | | Merrill Lynch Gold Excess Return Index | | | 0.14 | | | | Monthly | | | | 100,700 | | | | June-2020 | | | | 18,465,077 | | | – | | | 0 | | | 0 |
Merrill Lynch International | | | Receive | | | MLCX Natural Gas Annual Excess Return Index | | | 0.25 | | | | Monthly | | | | 5,000 | | | | November-2020 | | | | 196,726 | | | – | | | 0 | | | 0 |
Morgan Stanley Capital
Services LLC | | | Receive | | | S&P GSCI Aluminum Dynamic Roll Index Excess Return | | | 0.38 | | | | Monthly | | | | 167,000 | | | | October-2020 | | | | 14,249,283 | | | – | | | 259,879 | | | 259,879 |
Subtotal – Appreciation | | | | | | | | | | | | | | | | | | | | | | | | | | | | – | | | 1,658,381 | | | 1,658,381 |
Commodity Risk |
Barclays Bank PLC | | | Receive | | | Barclays Commodity Strategy 1452 Excess Return Index | | | 0.33 | | | | Monthly | | | | 39,100 | | | | October-2020 | | | | 19,318,731 | | | – | | | (80,831 | ) | | (80,831) |
Macquarie Bank Ltd. | | | Receive | | | Macquarie Aluminium Dynamic Selection Index | | | 0.30 | | | | Monthly | | | | 254,000 | | | | December-2020 | | | | 11,532,489 | | | – | | | (104,623 | ) | | (104,623) |
Subtotal – Depreciation | | | | | | | | | | | | | | | | | | | | | | – | | | (185,454 | ) | | (185,454) |
Total – Return Swap Agreements | | | | | | | | | | | | | | | | | | | | | | $– | | | $1,472,927 | | | $1,472,927 |
| (a) | OpenOver-The-Counter Total Return Swap Agreements are collateralized by cash held with the swap Counterparties in the amount of $6,964,596. |
| (b) | The Fund receives or pays payments based on any positive or negative return on the Reference Entity, respectively. |
| (c) | The table below includes additional information regarding the underlying components of certain reference entities that are not publicly available. |
| | | | |
| Reference Entity Components |
Reference Entity | | Underlying Components | | Percentage |
Canadian Imperial Bank of Commerce Custom 7 Agriculture
Commodity Index
| | | | |
| Long Futures Contracts | | | |
Coffee ‘C’ | | | 4.86 | % |
Corn | | | 5.19 | |
Cotton No. 2 | | | 19.46 | |
Lean Hogs | | | 0.91 | |
Live Cattle | | | 2.64 | |
Soybean Meal | | | 18.88 | |
Soybean Oil | | | 5.03 | |
Soybeans | | | 18.38 | |
Sugar No. 11 | | | 19.13 | |
Wheat | | | 5.52 | |
Total | | | 100.00 | % |
See accompanying Notes to Consolidated Financial Statements which are an integral part of the financial statements.
Invesco V.I. Balanced-Risk Allocation Fund
| | | | |
| Reference Entity Components–(continued) |
Reference Entity | | Underlying Components | | Percentage |
Monthly Rebalance Commodity Excess Return Index
| | | | |
| Long Futures Contracts | | | |
Coffee ’C’ | | | 4.86 | % |
Corn | | | 5.19 | |
Cotton No. 2 | | | 19.46 | |
Lean Hogs | | | 0.91 | |
Live Cattle | | | 2.64 | |
Soybean Meal | | | 18.88 | |
Soybean Oil | | | 5.03 | |
Soybeans | | | 18.38 | |
Sugar No. 11 | | | 19.13 | |
Wheat | | | 5.52 | |
Total | | | 100.00 | % |
Barclays Commodity Strategy 1740 Index
| | | | |
| Long Futures Contracts | | | |
Coffee ’C’ | | | 4.86 | % |
Corn | | | 5.19 | |
Cotton No. 2 | | | 19.46 | |
Lean Hogs | | | 0.91 | |
Live Cattle | | | 2.64 | |
Soybean Meal | | | 18.88 | |
Soybean Oil | | | 5.03 | |
Soybeans | | | 18.38 | |
Sugar No. 11 | | | 19.13 | |
Wheat | | | 5.52 | |
Total | | | 100.00 | % |
Canadian Imperial Bank of Commerce Dynamic Roll LME
Copper Excess Return Index 2
| | | | |
| Long Futures Contracts | | | |
Copper | | | 100.00 | % |
Single Commodity Index Excess Return
| | | | |
| Long Futures Contracts | | | |
Gold | | | 100.00 | % |
Goldman Sachs Commodity i-Select Strategy 1121
| | | | |
| Long Futures Contracts | | | |
Coffee ’C’ | | | 4.86 | % |
Corn | | | 5.19 | |
Cotton No. 2 | | | 19.46 | |
Lean Hogs | | | 0.91 | |
Live Cattle | | | 2.64 | |
Soybean Meal | | | 18.88 | |
Soybean Oil | | | 5.03 | |
Soybeans | | | 18.38 | |
Sugar No. 11 | | | 19.13 | |
Wheat | | | 5.52 | |
Total | | | 100.00 | % |
See accompanying Notes to Consolidated Financial Statements which are an integral part of the financial statements.
Invesco V.I. Balanced-Risk Allocation Fund
| | | | |
| Reference Entity Components–(continued) |
Reference Entity | | Underlying Components | | Percentage |
J.P. Morgan Contag Beta Gas Oil Excess Return Index
| | | | |
| Long Futures Contracts | | | |
Gas Oil | | | 100.00 | % |
S&P GSCI Gold Index Excess Return
| | | | |
| Long Futures Contracts | | | |
Gold | | | 100.00 | % |
Merrill Lynch Gold Excess Return Index
| | | | |
| Long Futures Contracts | | | |
Gold | | | 100.00 | % |
MLCX Natural Gas Annual Excess Return Index
| | | | |
| Long Futures Contracts | | | |
Natural Gas | | | 100.00 | % |
S&P GSCI Aluminum Dynamic Roll Index Excess Return
| | | | |
| Long Futures Contracts | | | |
Aluminum | | | 100.00 | % |
Barclays Commodity Strategy 1452 Excess Return Index
| | | | |
| Long Futures Contracts | | | |
Copper | | | 100.00 | % |
Macquarie Aluminium Dynamic Selection Index
| | | | |
| Long Futures Contracts | | | |
Aluminum | | | 100.00 | % |
See accompanying Notes to Consolidated Financial Statements which are an integral part of the financial statements.
Invesco V.I. Balanced-Risk Allocation Fund
Consolidated Statement of Assets and Liabilities
December 31, 2019
| | | | |
Assets: | | | | |
| |
Investments in securities, at value
(Cost $137,033,576) | | $ | 137,772,899 | |
Investments in affiliated money market funds, at value (Cost $835,379,744) | | | 835,379,744 | |
Other investments: | | | | |
Swaps receivable – OTC | | | 2,193,140 | |
Unrealized appreciation on swap agreements – OTC | | | 1,658,381 | |
Deposits with brokers: | | | | |
Cash collateral – exchange-traded futures contracts | | | 46,070,000 | |
Cash collateral – OTC Derivatives | | | 6,964,596 | |
Foreign currencies, at value (Cost $1,438) | | | 1,390 | |
Receivable for: Fund shares sold | | | 647,862 | |
Dividends | | | 1,064,231 | |
Investment for trustee deferred compensation and retirement plans | | | 113,243 | |
Total assets | | | 1,031,865,486 | |
| |
Liabilities: | | | | |
| |
Other investments: | | | | |
Variation margin payable - futures contracts | | | 3,656,716 | |
Swaps payable – OTC | | | 33,135 | |
Unrealized depreciation on swap agreements–OTC | | | 185,454 | |
Payable for: Fund shares reacquired | | | 466,726 | |
Amount due custodian | | | 4,399,472 | |
Accrued fees to affiliates | | | 1,012,682 | |
Accrued trustees’ and officers’ fees and benefits | | | 139 | |
Accrued other operating expenses | | | 81,538 | |
Trustee deferred compensation and retirement plans | | | 125,360 | |
Total liabilities | | | 9,961,222 | |
Net assets applicable to shares outstanding | | $ | 1,021,904,264 | |
| |
Net assets consist of: | | | | |
| |
Shares of beneficial interest | | $ | 910,435,941 | |
Distributable earnings | | | 111,468,323 | |
| | | $ | 1,021,904,264 | |
| |
Net Assets: | | | | |
| |
Series I | | $ | 45,427,034 | |
| |
Series II | | $ | 976,477,230 | |
|
Shares outstanding, no par value, with an unlimited number of shares authorized: | |
| |
Series I | | | 4,165,323 | |
| |
Series II | | | 91,008,867 | |
| |
Series I: Net asset value per share | | $ | 10.91 | |
| |
Series II: Net asset value per share | | $ | 10.73 | |
Consolidated Statement of Operations
For the year ended December 31, 2019
| | | | |
Investment income: | | | | |
| |
Dividends from affiliated money market funds | | $ | 17,759,544 | |
Interest | | | 3,032,139 | |
Total investment income | | | 20,791,683 | |
| |
Expenses: | | | | |
| |
Advisory fees | | | 9,430,812 | |
Administrative services fees | | | 1,700,249 | |
Custodian fees | | | 36,699 | |
Distribution fees - Series II | | | 2,463,688 | |
Transfer agent fees | | | 24,176 | |
Trustees’ and officers’ fees and benefits | | | 32,349 | |
Reports to shareholders | | | 11,949 | |
Professional services fees | | | 88,906 | |
Other | | | 13,849 | |
Total expenses | | | 13,802,677 | |
Less: Fees waived, expenses reimbursed and/or expense offset arrangement(s) | | | (4,741,689 | ) |
Net expenses | | | 9,060,988 | |
Net investment income | | | 11,730,695 | |
| |
Realized and unrealized gain (loss) from: | | | | |
| |
Net realized gain (loss) from:
Investment securities | | | (3,704,821 | ) |
Foreign currencies | | | (6,021 | ) |
Futures contracts | | | 132,342,922 | |
Swap agreements | | | (292,927 | ) |
| | | | 128,339,153 | |
| |
Change in net unrealized appreciation (depreciation) of: | | | | |
Investment securities | | | 3,081,284 | |
Foreign currencies | | | 10,004 | |
Futures contracts | | | (5,866,411 | ) |
Swap agreements | | | 5,507,812 | |
| | | | 2,732,689 | |
Net realized and unrealized gain | | | 131,071,842 | |
Net increase in net assets resulting from operations | | $ | 142,802,537 | |
See accompanying Notes to Consolidated Financial Statements which are an integral part of the financial statements.
Invesco V.I. Balanced-Risk Allocation Fund
Consolidated Statement of Changes in Net Assets
For the years ended December 31, 2019 and 2018
| | | | | | | | |
| | | 2019 | | | 2018 | |
Operations: | | | | | | | | |
Net investment income | | $ | 11,730,695 | | | $ | 8,716,217 | |
Net realized gain (loss) | | | 128,339,153 | | | | (62,901,126 | ) |
Change in net unrealized appreciation (depreciation) | | | 2,732,689 | | | | (21,238,796 | ) |
Net increase (decrease) in net assets resulting from operations | | | 142,802,537 | | | | (75,423,705 | ) |
| | |
Distributions to shareholders from distributable earnings: | | | | | | | | |
Series I | | | – | | | | (3,802,380 | ) |
Series II | | | – | | | | (107,564,085 | ) |
Total distributions from distributable earnings | | | – | | | | (111,366,465 | ) |
| | |
Return of capital: | | | | | | | | |
Series I | | | – | | | | (318,341 | ) |
Series II | | | – | | | | (2,637,420 | ) |
Total return of capital | | | – | | | | (2,955,761 | ) |
| | |
Share transactions–net: | | | | | | | | |
Series I | | | 2,158,487 | | | | 4,812,203 | |
Series II | | | (128,836,261 | ) | | | (6,703,716 | ) |
Net increase (decrease) in net assets resulting from share transactions | | | (126,677,774 | ) | | | (1,891,513 | ) |
Net increase (decrease) in net assets | | | 16,124,763 | | | | (191,637,444 | ) |
| | |
Net assets: | | | | | | | | |
Beginning of year | | | 1,005,779,501 | | | | 1,197,416,945 | |
End of year | | $ | 1,021,904,264 | | | $ | 1,005,779,501 | |
See accompanying Notes to Consolidated Financial Statements which are an integral part of the financial statements.
Invesco V.I. Balanced-Risk Allocation Fund
Consolidated Financial Highlights
The following schedule presents financial highlights for a share of the Fund outstanding throughout the periods indicated.
| | | | | | | | | | | | | | | | | | | | | | | | | | | | | | | | | | | | | | | | | | | | | | | | | | | | | | | | | | | | | | | | | | | | | | | | | | | |
| | | | | | | | | | | | | | | | | | | | | | | | | Ratio of | | Ratio of | | | | |
| | | | | | | | | | | | | | | | | | | | | | | | | expenses | | expenses | | | | |
| | | | | | | Net gains | | | | | | | | | | | | | | | | | | to average | | to average net | | Ratio of net | | |
| | | | | | | (losses) | | | | | | | | | | | | | | | | | | net assets | | assets without | | investment | | |
| | | Net asset | | Net | | on securities | | | | Dividends | | Distributions | | | | | | | | | | | | with fee waivers | | fee waivers | | income | | |
| | | value, | | investment | | (both | | Total from | | from net | | from net | | | | | | Net asset | | | | Net assets, | | and/or | | and/or | | (loss) | | |
| | | beginning | | income | | realized and | | investment | | investment | | realized | | Return of | | Total | | value, end | | Total | | end of period | | expenses | | expenses | | to average | | Portfolio |
| | | of period | | (loss)(a) | | unrealized) | | operations | | income | | gains | | capital | | distributions | | of period | | return (b) | | (000’s omitted) | | absorbed | | absorbed | | net assets | | turnover (c) |
Series I | | | | | | | | | | | | | | | | | | | | | | | | | | | | | | | | | | | | | | | | | | | | | | | | | | | | | | | | | | | | | | | | | | | | | | | | | | | |
Year ended 12/31/19 | | | $ | 9.47 | | | | $ | 0.14 | | | | $ | 1.30 | | | | $ | 1.44 | | | | $ | – | | | | $ | – | | | | $ | – | | | | $ | – | | | | $ | 10.91 | | | | | 15.21 | % | | | $ | 45,427 | | | | | 0.64 | %(d)(e) | | | | 1.10 | %(d) | | | | 1.38 | %(d) | | | | 94 | % |
Year ended 12/31/18 | | | | 11.31 | | | | | 0.11 | | | | | (0.79 | ) | | | | (0.68 | ) | | | | (0.14 | ) | | | | (0.99 | ) | | | | (0.03 | ) | | | | (1.16 | ) | | | | 9.47 | | | | | (6.46 | ) | | | | 37,450 | | | | | 0.65 | (e) | | | | 1.10 | | | | | 1.03 | | | | | 199 | |
Year ended 12/31/17 | | | | 11.35 | | | | | 0.01 | | | | | 1.08 | | | | | 1.09 | | | | | (0.48 | ) | | | | (0.65 | ) | | | | – | | | | | (1.13 | ) | | | | 11.31 | | | | | 10.06 | | | | | 39,340 | | | | | 0.68 | (e) | | | | 1.11 | | | | | 0.10 | | | | | 52 | |
Year ended 12/31/16 | | | | 10.20 | | | | | (0.04 | ) | | | | 1.24 | | | | | 1.20 | | | | | (0.05 | ) | | | | – | | | | | – | | | | | (0.05 | ) | | | | 11.35 | | | | | 11.74 | | | | | 34,714 | | | | | 0.67 | (e) | | | | 1.12 | | | | | (0.33 | ) | | | | 120 | |
Year ended 12/31/15 | | | | 12.30 | | | | | (0.07 | ) | | | | (0.44 | ) | | | | (0.51 | ) | | | | (0.52 | ) | | | | (1.07 | ) | | | | – | | | | | (1.59 | ) | | | | 10.20 | | | | | (4.10 | ) | | | | 26,854 | | | | | 0.69 | | | | | 1.15 | | | | | (0.61 | ) | | | | 44 | |
Series II | | | | | | | | | | | | | | | | | | | | | | | | | | | | | | | | | | | | | | | | | | | | | | | | | | | | | | | | | | | | | | | | | | | | | | | | | | | |
Year ended 12/31/19 | | | | 9.34 | | | | | 0.12 | | | | | 1.27 | | | | | 1.39 | | | | | – | | | | | – | | | | | – | | | | | – | | | | | 10.73 | | | | | 14.88 | | | | | 976,477 | | | | | 0.89 | (d)(e) | | | | 1.35 | (d) | | | | 1.13 | (d) | | | | 94 | |
Year ended 12/31/18 | | | | 11.17 | | | | | 0.08 | | | | | (0.78 | ) | | | | (0.70 | ) | | | | (0.11 | ) | | | | (0.99 | ) | | | | (0.03 | ) | | | | (1.13 | ) | | | | 9.34 | | | | | (6.71 | ) | | | | 968,329 | | | | | 0.90 | (e) | | | | 1.35 | | | | | 0.78 | | | | | 199 | |
Year ended 12/31/17 | | | | 11.22 | | | | | (0.02 | ) | | | | 1.07 | | | | | 1.05 | | | | | (0.45 | ) | | | | (0.65 | ) | | | | – | | | | | (1.10 | ) | | | | 11.17 | | | | | 9.83 | | | | | 1,158,077 | | | | | 0.93 | (e) | | | | 1.36 | | | | | (0.15 | ) | | | | 52 | |
Year ended 12/31/16 | | | | 10.08 | | | | | (0.06 | ) | | | | 1.22 | | | | | 1.16 | | | | | (0.02 | ) | | | | – | | | | | – | | | | | (0.02 | ) | | | | 11.22 | | | | | 11.51 | | | | | 1,113,539 | | | | | 0.92 | (e) | | | | 1.37 | | | | | (0.58 | ) | | | | 120 | |
Year ended 12/31/15 | | | | 12.17 | | | | | (0.10 | ) | | | | (0.44 | ) | | | | (0.54 | ) | | | | (0.48 | ) | | | | (1.07 | ) | | | | – | | | | | (1.55 | ) | | | | 10.08 | | | | | (4.40 | ) | | | | 939,354 | | | | | 0.94 | | | | | 1.40 | | | | | (0.86 | ) | | | | 44 | |
| (a) | Calculated using average shares outstanding. |
| (b) | Includes adjustments in accordance with accounting principles generally accepted in the United States of America and as such, the net asset value for financial reporting purposes and the returns based upon those net asset values may differ from the net asset value and returns for shareholder transactions. Total returns are not annualized for periods less than one year, if applicable, and do not reflect charges assessed in connection with a variable product, which if included would reduce total returns. |
| (c) | Portfolio turnover is calculated at the fund level and is not annualized for periods less than one year, if applicable. |
| (d) | Ratios are based on average daily net assets (000’s omitted) of $42,105 and $985,702 for Series I and Series II shares, respectively. |
| (e) | In addition to the fees and expenses which the Fund bears directly; the Fund indirectly bears a pro rata share of the fees and expenses of the underlying funds in which the Fund invests. Because the underlying funds have varied expenses and fee levels and the Fund may own different proportions at different times, the amount of fees and expenses incurred indirectly by the Fund will vary. Estimated underlying fund expenses are not expenses that are incurred directly by your Fund. They are expenses that are incurred directly by the underlying funds and are deducted from the value of the funds your Fund invests in. The effect of the estimated underlying fund expenses that you bear indirectly is included in your Fund’s total return. Estimated acquired fund fees from underlying funds were 0.15%, 0.16%, 0.15% and 0.12% for the years ended December 31, 2019, 2018, 2017 and 2016, respectively. |
See accompanying Notes to Consolidated Financial Statements which are an integral part of the financial statements.
Invesco V.I. Balanced-Risk Allocation Fund
Notes to Consolidated Financial Statements
December 31, 2019
NOTE 1–Significant Accounting Policies
Invesco V.I. Balanced-Risk Allocation Fund (the “Fund”) is a series portfolio of AIM Variable Insurance Funds (Invesco Variable Insurance Funds) (the “Trust”). The Trust is a Delaware statutory trust registered under the Investment Company Act of 1940, as amended (the “1940 Act”), as anopen-end series management investment company. Information presented in these consolidated financial statements pertains only to the Fund. Matters affecting the Fund or each class will be voted on exclusively by the shareholders of the Fund or each class. Current Securities and Exchange Commission (“SEC”) guidance, however, requires participating insurance companies offering separate accounts to vote shares proportionally in accordance with the instructions of the contract owners whose investments are funded by shares of each Fund or class.
The Fund will seek to gain exposure to the commodity markets primarily through investments in the Invesco Cayman Commodity Fund IV Ltd. (the “Subsidiary”), a wholly-owned subsidiary of the Fund organized under the laws of the Cayman Islands. The Subsidiary was organized by the Fund to invest in commodity-linked derivatives and other securities that may provide leveraged andnon-leveraged exposure to commodities. The Fund may invest up to 25% of its total assets in the Subsidiary.
The Fund’s investment objective is total return with a low to moderate correlation to traditional financial market indices.
The Fund currently offers two classes of shares, Series I and Series II, both of which are offered to insurance company separate accounts funding variable annuity contracts and variable life insurance policies (“variable products”).
The Fund is an investment company and accordingly follows the investment company accounting and reporting guidance in accordance with Financial Accounting Standards Board Accounting Standards Codification Topic 946,Financial Services – Investment Companies.
The following is a summary of the significant accounting policies followed by the Fund in the preparation of its consolidated financial statements.
| A. | Security Valuations– Securities, including restricted securities, are valued according to the following policy. |
Debt obligations (including convertible securities) and unlisted equities are fair valued using an evaluated quote provided by an independent pricing service. Evaluated quotes provided by the pricing service may be determined without exclusive reliance on quoted prices, and may reflect appropriate factors such asinstitution-size trading in similar groups of securities, developments related to specific securities, dividend rate (for unlisted equities), yield (for debt obligations), quality, type of issue, coupon rate (for debt obligations), maturity (for debt obligations), individual trading characteristics and other market data. Pricing services generally value debt obligations assuming orderly transactions of institutional round lot size, but a fund may hold or transact in the same securities in smaller, odd lot sizes. Odd lots often trade at lower prices than institutional round lots. Debt obligations are subject to interest rate and credit risks. In addition, all debt obligations involve some risk of default with respect to interest and/or principal payments.
A security listed or traded on an exchange (except convertible securities) is valued at its last sales price or official closing price as of the close of the customary trading session on the exchange where the security is principally traded, or lacking any sales or official closing price on a particular day, the security may be valued at the closing bid price on that day. Securities traded in theover-the-counter market are valued based on prices furnished by independent pricing services or market makers. When such securities are valued by an independent pricing service they may be considered fair valued. Futures contracts are valued at the final settlement price set by an exchange on which they are principally traded. Listed options are valued at the mean between the last bid and asked prices from the exchange on which they are principally traded. Options not listed on an exchange are valued by an independent source at the mean between the last bid and asked prices. For purposes of determining net asset value (“NAV”) per share, futures and option contracts generally are valued 15 minutes after the close of the customary trading session of the New York Stock Exchange (“NYSE”).
Investments inopen-end andclosed-end registered investment companies that do not trade on an exchange are valued at theend-of-day net asset value per share. Investments inopen-end andclosed-end registered investment companies that trade on an exchange are valued at the last sales price or official closing price as of the close of the customary trading session on the exchange where the security is principally traded.
Swap agreements are fair valued using an evaluated quote, if available, provided by an independent pricing service. Evaluated quotes provided by the pricing service are valued based on a model which may includeend-of-day net present values, spreads, ratings, industry, company performance and returns of referenced assets. Centrally cleared swap agreements are valued at the daily settlement price determined by the relevant exchange or clearinghouse.
Foreign securities’ (including foreign exchange contracts) prices are converted into U.S. dollar amounts using the applicable exchange rates as of the close of the NYSE. If market quotations are available and reliable for foreign exchange-traded equity securities, the securities will be valued at the market quotations. Because trading hours for certain foreign securities end before the close of the NYSE, closing market quotations may become unreliable. If between the time trading ends on a particular security and the close of the customary trading session on the NYSE, events occur that the investment adviser determines are significant and make the closing price unreliable, the Fund may fair value the security. If the event is likely to have affected the closing price of the security, the security will be valued at fair value in good faith using procedures approved by the Board of Trustees. Adjustments to closing prices to reflect fair value may also be based on a screening process of an independent pricing service to indicate the degree of certainty, based on historical data, that the closing price in the principal market where a foreign security trades is not the current value as of the close of the NYSE. Foreign securities’ prices meeting the approved degree of certainty that the price is not reflective of current value will be priced at the indication of fair value from the independent pricing service. Multiple factors may be considered by the independent pricing service in determining adjustments to reflect fair value and may include information relating to sector indices, American Depositary Receipts and domestic and foreign index futures. Foreign securities may have additional risks including exchange rate changes, potential for sharply devalued currencies and high inflation, political and economic upheaval, the relative lack of issuer information, relatively low market liquidity and the potential lack of strict financial and accounting controls and standards.
Securities for which market prices are not provided by any of the above methods may be valued based upon quotes furnished by independent sources. The last bid price may be used to value equity securities. The mean between the last bid and asked prices is used to value debt obligations, including corporate loans.
Securities for which market quotations are not readily available or became unreliable are valued at fair value as determined in good faith by or under the supervision of the Trust’s officers following procedures approved by the Board of Trustees. Issuer specific events, market trends,
Invesco V.I. Balanced-Risk Allocation Fund
bid/asked quotes of brokers and information providers and other market data may be reviewed in the course of making a good faith determination of a security’s fair value.
The Fund may invest in securities that are subject to interest rate risk, meaning the risk that the prices will generally fall as interest rates rise and, conversely, the prices will generally rise as interest rates fall. Specific securities differ in their sensitivity to changes in interest rates depending on their individual characteristics. Changes in interest rates may result in increased market volatility, which may affect the value and/or liquidity of certain Fund investments.
Valuations change in response to many factors including the historical and prospective earnings of the issuer, the value of the issuer’s assets, general economic conditions, interest rates, investor perceptions and market liquidity. Because of the inherent uncertainties of valuation, the values reflected in the consolidated financial statements may materially differ from the value received upon actual sale of those investments.
| B. | Securities Transactions and Investment Income– Securities transactions are accounted for on a trade date basis. Realized gains or losses on sales are computed on the basis of specific identification of the securities sold. Interest income (net of withholding tax, if any) is recorded on the accrual basis from settlement date. Bond premiums and discounts are amortized and/or accreted over the lives of the respective securities.Pay-in-kind interest income andnon-cash dividend income received in the form of securitiesin-lieu of cash are recorded at the fair value of the securities received. Dividend income (net of withholding tax, if any) is recorded on theex-dividend date. |
The Fund may periodically participate in litigation related to Fund investments. As such, the Fund may receive proceeds from litigation settlements. Any proceeds received are included in the Consolidated Statement of Operations as realized gain (loss) for investments no longer held and as unrealized gain (loss) for investments still held.
Brokerage commissions and mark ups are considered transaction costs and are recorded as an increase to the cost basis of securities purchased and/or a reduction of proceeds on a sale of securities. Such transaction costs are included in the determination of net realized and unrealized gain (loss) from investment securities reported in the Consolidated Statement of Operations and the Consolidated Statement of Changes in Net Assets and the net realized and unrealized gains (losses) on securities per share in the Consolidated Financial Highlights. Transaction costs are included in the calculation of the Fund’s net asset value and, accordingly, they reduce the Fund’s total returns. These transaction costs are not considered operating expenses and are not reflected in net investment income reported in the Consolidated Statement of Operations and the Consolidated Statement of Changes in Net Assets, or the net investment income per share and the ratios of expenses and net investment income reported in the Consolidated Financial Highlights, nor are they limited by any expense limitation arrangements between the Fund and the investment adviser.
The Fund allocates income and realized and unrealized capital gains and losses to a class based on the relative net assets of each class.
| C. | Country Determination – For the purposes of making investment selection decisions and presentation in the Consolidated Schedule of Investments, the investment adviser may determine the country in which an issuer is located and/or credit risk exposure based on various factors. These factors include the laws of the country under which the issuer is organized, where the issuer maintains a principal office, the country in which the issuer derives 50% or more of its total revenues and the country that has the primary market for the issuer’s securities, as well as other criteria. Among the other criteria that may be evaluated for making this determination are the country in which the issuer maintains 50% or more of its assets, the type of security, financial guarantees and enhancements, the nature of the collateral and the sponsor organization. Country of issuer and/or credit risk exposure has been determined to be the United States of America, unless otherwise noted. |
| D. | Distributions– Distributions from net investment income and net realized capital gain, if any, are generally declared and paid to separate accounts of participating insurance companies annually and recorded on theex-dividend date. |
| E. | Federal Income Taxes – The Fund intends to comply with the requirements of Subchapter M of the Internal Revenue Code of 1986, as amended (the “Internal Revenue Code”), necessary to qualify as a regulated investment company and to distribute substantially all of the Fund’s taxable earnings to shareholders. As such, the Fund will not be subject to federal income taxes on otherwise taxable income (including net realized capital gain) that is distributed to shareholders. Therefore, no provision for federal income taxes is recorded in the consolidated financial statements. |
The Fund recognizes the tax benefits of uncertain tax positions only when the position is more likely than not to be sustained. Management has analyzed the Fund’s uncertain tax positions and concluded that no liability for unrecognized tax benefits should be recorded related to uncertain tax positions. Management is not aware of any tax positions for which it is reasonably possible that the total amounts of unrecognized tax benefits will change materially in the next 12 months.
The Subsidiary is classified as a controlled foreign corporation under Subchapter N of the Internal Revenue Code. Therefore, the Fund is required to increase its taxable income by its share of the Subsidiary’s income. Net investment losses of the Subsidiary cannot be deducted by the Fund in the current period nor carried forward to offset taxable income in future periods.
The Fund files tax returns in the U.S. Federal jurisdiction and certain other jurisdictions. Generally the Fund is subject to examinations by such taxing authorities for up to three years after the filing of the return for the tax period.
| F. | Expenses– Fees provided for under the Rule12b-1 plan of a particular class of the Fund and which are directly attributable to that class are charged to the operations of such class. All other expenses are allocated among the classes based on relative net assets. |
| G. | Accounting Estimates–The financial statements are prepared on a consolidated basis in conformity with accounting principles generally accepted in the United States of America (“GAAP”), which requires management to make estimates and assumptions that affect the reported amounts of assets and liabilities at the date of the financial statements and the reported amounts of revenues and expenses during the reporting period including estimates and assumptions related to taxation. Actual results could differ from those estimates by a significant amount. The accompanying financial statements reflect the financial position of the Fund and its Subsidiary and the results of operations on a consolidated basis. All inter-company accounts and transactions have been eliminated in consolidation. |
In addition, the Fund monitors for material events or transactions that may occur or become known after theperiod-end date and before the date the consolidated financial statements are released to print.
| H. | Indemnifications– Under the Trust’s organizational documents, each Trustee, officer, employee or other agent of the Trust, and under the Subsidiary’s organizational documents, the directors and officers of the Subsidiary, are indemnified against certain liabilities that may arise out of the performance of their duties to the Fund and/or the Subsidiary, respectively. Additionally, in the normal course of business, the Fund enters into contracts, including the Fund’s servicing agreements, that contain a variety of indemnification clauses. The Fund’s maximum exposure under |
Invesco V.I. Balanced-Risk Allocation Fund
| | these arrangements is unknown as this would involve future claims that may be made against the Fund that have not yet occurred. The risk of material loss as a result of such indemnification claims is considered remote. |
| I. | Structured Securities– The Fund may invest in structured securities. Structured securities are a type of derivative security whose value is determined by reference to changes in the value of underlying securities, currencies, interest rates, commodities, indices or other financial indicators (“reference instruments”). Most structured securities are fixed-income securities that have maturities of three years or less. Structured securities may be positively or negatively indexed (i.e., their principal value or interest rates may increase or decrease if the underlying reference instrument appreciates) and may have return characteristics similar to direct investments in the underlying reference instrument. |
Structured securities may entail a greater degree of market risk than other types of debt securities because the investor bears the risk of the reference instruments. In addition to the credit risk of structured securities and the normal risks of price changes in response to changes in interest rates, the principal amount of structured notes or indexed securities may decrease as a result of changes in the value of the underlying reference instruments. Changes in the daily value of structured securities are recorded as unrealized gains (losses) in the Consolidated Statement of Operations. When the structured securities mature or are sold, the Fund recognizes a realized gain (loss) on the Consolidated Statement of Operations.
| J. | Foreign Currency Translations– Foreign currency is valued at the close of the NYSE based on quotations posted by banks and major currency dealers. Portfolio securities and other assets and liabilities denominated in foreign currencies are translated into U.S. dollar amounts at the date of valuation. Purchases and sales of portfolio securities (net of foreign taxes withheld on disposition) and income items denominated in foreign currencies are translated into U.S. dollar amounts on the respective dates of such transactions. The Fund does not separately account for the portion of the results of operations resulting from changes in foreign exchange rates on investments and the fluctuations arising from changes in market prices of securities held. The combined results of changes in foreign exchange rates and the fluctuation of market prices on investments (net of estimated foreign tax withholding) are included with the net realized and unrealized gain or loss from investments in the Consolidated Statement of Operations. Reported net realized foreign currency gains or losses arise from (1) sales of foreign currencies, (2) currency gains or losses realized between the trade and settlement dates on securities transactions, and (3) the difference between the amounts of dividends, interest, and foreign withholding taxes recorded on the Fund’s books and the U.S. dollar equivalent of the amounts actually received or paid. Net unrealized foreign currency gains and losses arise from changes in the fair values of assets and liabilities, other than investments in securities at fiscal period end, resulting from changes in exchange rates. |
The Fund may invest in foreign securities, which may be subject to foreign taxes on income, gains on investments or currency repatriation, a portion of which may be recoverable. Foreign taxes, if any, are recorded based on the tax regulations and rates that exist in the foreign markets in which the Fund invests and are shown in the Consolidated Statement of Operations.
| K. | Forward Foreign Currency Contracts– The Fund may engage in foreign currency transactions either on a spot (i.e. for prompt delivery and settlement) basis, or through forward foreign currency contracts, to manage or minimize currency or exchange rate risk. |
The Fund may also enter into forward foreign currency contracts for the purchase or sale of a security denominated in a foreign currency in order to “lock in” the U.S. dollar price of that security, or the Fund may also enter into forward foreign currency contracts that do not provide for physical settlement of the two currencies, but instead are settled by a single cash payment calculated as the difference between the agreed upon exchange rate and the spot rate at settlement based upon an agreed upon notional amount(non-deliverable forwards). The Fund will set aside liquid assets in an amount equal to the dailymark-to-market obligation for forward foreign currency contracts.
A forward foreign currency contract is an obligation between two parties (“Counterparties”) to purchase or sell a specific currency for an agreed-upon price at a future date. The use of forward foreign currency contracts does not eliminate fluctuations in the price of the underlying securities the Fund owns or intends to acquire but establishes a rate of exchange in advance. Fluctuations in the value of these contracts are measured by the difference in the contract date and reporting date exchange rates and are recorded as unrealized appreciation (depreciation) until the contracts are closed. When the contracts are closed, realized gains (losses) are recorded. Realized and unrealized gains (losses) on the contracts are included in the Consolidated Statement of Operations. The primary risks associated with forward foreign currency contracts include failure of the Counterparty to meet the terms of the contract and the value of the foreign currency changing unfavorably. These risks may be in excess of the amounts reflected in the Consolidated Statement of Assets and Liabilities.
| L. | Futures Contracts– The Fund may enter into futures contracts to equitize the Fund’s cash holdings or to manage exposure to interest rate, equity, commodity and market price movements and/or currency risks. A futures contract is an agreement between Counterparties to purchase or sell a specified underlying security, currency or commodity (or delivery of a cash settlement price, in the case of an index future) for a fixed price at a future date. The Fund currently invests only in exchange-traded futures and they are standardized as to maturity date and underlying financial instrument. Initial margin deposits required upon entering into futures contracts are satisfied by the segregation of specific securities or cash as collateral at the futures commission merchant (broker). During the period the futures contracts are open, changes in the value of the contracts are recognized as unrealized gains or losses by recalculating the value of the contracts on a daily basis. Subsequent or variation margin payments are received or made depending upon whether unrealized gains or losses are incurred. These amounts are reflected as receivables or payables on the Consolidated Statement of Assets and Liabilities. When the contracts are closed or expire, the Fund recognizes a realized gain or loss equal to the difference between the proceeds from, or cost of, the closing transaction and the Fund’s basis in the contract. The net realized gain (loss) and the change in unrealized gain (loss) on futures contracts held during the period is included on the Consolidated Statement of Operations. The primary risks associated with futures contracts are market risk and the absence of a liquid secondary market. If the Fund were unable to liquidate a futures contract and/or enter into an offsetting closing transaction, the Fund would continue to be subject to market risk with respect to the value of the contracts and continue to be required to maintain the margin deposits on the futures contracts. Futures contracts have minimal Counterparty risk since the exchange’s clearinghouse, as Counterparty to all exchange-traded futures, guarantees the futures against default. Risks may exceed amounts recognized in the Consolidated Statement of Assets and Liabilities. |
| M. | Swap Agreements– The Fund may enter into various swap transactions, including interest rate, total return, index, currency and credit default swap contracts (“CDS”) for investment purposes or to manage interest rate, currency, commodity or credit risk. Such transactions are agreements between Counterparties. These agreements may contain among other conditions, events of default and termination events, and various covenants and representations such as provisions that require the Fund to maintain apre-determined level of net assets, and/or provide limits regarding the decline of the Fund’s NAV over specific periods of time. If the Fund were to trigger such provisions and have open derivative |
Invesco V.I. Balanced-Risk Allocation Fund
| | positions at that time, the Counterparty may be able to terminate such agreement and request immediate payment in an amount equal to the net liability positions, if any. |
Interest rate, total return, index, and currency swap agreements aretwo-party contracts entered into primarily to exchange the returns (or differentials in rates of returns) earned or realized on particular predetermined investments or instruments. The gross returns to be exchanged or “swapped” between the parties are calculated with respect to a notional amount, i.e., the return on or increase in value of a particular dollar amount invested at a particular interest rate or return of an underlying asset, in a particular foreign currency, or in a “basket” of securities representing a particular index.
An interest rate swap is an agreement between Counterparties pursuant to which the parties exchange a floating rate payment for a fixed rate payment based on a specified notional amount.
A total return swap is an agreement in which one party makes payments based on a set rate, either fixed or variable, while the other party makes payments based on the return of an underlying asset, which includes both the income generated and capital gains, if any. The unrealized appreciation (depreciation) on total return swaps includes dividends on the underlying securities and financing rate payable from the Counterparty. At the maturity date, a net cash flow is exchanged where the total return is equivalent to the return of the underlying reference less a financing rate, if any. As a receiver, the Fund would receive payments based on any positive total return and would owe payments in the event of a negative total return. As the payer, the Fund would owe payments on any net positive total return, and would receive payment in the event of a negative total return.
Changes in the value of swap agreements are recognized as unrealized gains (losses) in the Consolidated Statement of Operations by “marking to market” on a daily basis to reflect the value of the swap agreement at the end of each trading day. Payments received or paid at the beginning of the agreement are reflected as such on the Consolidated Statement of Assets and Liabilities and may be referred to as upfront payments. The Fund accrues for the fixed payment stream and amortizes upfront payments, if any, on swap agreements on a daily basis with the net amount, recorded as a component of realized gain (loss) on the Consolidated Statement of Operations. A liquidation payment received or made at the termination of a swap agreement is recorded as realized gain (loss) on the Consolidated Statement of Operations. The Fund segregates cash or liquid securities having a value at least equal to the amount of the potential obligation of a Fund under any swap transaction. Cash held as collateral is recorded as deposits with brokers on the Consolidated Statement of Assets and Liabilities. Entering into these agreements involves, to varying degrees, lack of liquidity and elements of credit, market, and Counterparty risk in excess of amounts recognized on the Consolidated Statement of Assets and Liabilities. Such risks involve the possibility that a swap is difficult to sell or liquidate; the Counterparty does not honor its obligations under the agreement and unfavorable interest rates and market fluctuations. It is possible that developments in the swaps market, including potential government regulation, could adversely affect the Fund’s ability to terminate existing swap agreements or to realize amounts to be received under such agreements. A short position in a security poses more risk than holding the same security long. As there is no limit on how much the price of the security can increase, the Fund’s exposure is unlimited.
| N. | Other Risks– The Fund will seek to gain exposure to commodity markets primarily through an investment in the Subsidiary and through investments in exchange-traded funds and commodity-linked derivatives. The Subsidiary, unlike the Fund, may invest without limitation in commodities, commodity-linked derivatives and other securities, such as exchange-traded and commodity-linked notes, that may provide leveraged andnon-leveraged exposure to commodity markets. The Fund is indirectly exposed to the risks associated with the Subsidiary’s investments. |
| O. | Leverage Risk– Leverage exists when the Fund can lose more than it originally invests because it purchases or sells an instrument or enters into a transaction without investing an amount equal to the full economic exposure of the instrument or transaction. |
| P. | Collateral– To the extent the Fund has designated or segregated a security as collateral and that security is subsequently sold, it is the Fund’s practice to replace such collateral no later than the next business day. |
NOTE 2–Advisory Fees and Other Fees Paid to Affiliates
The Trust has entered into a master investment advisory agreement with Invesco Advisers, Inc. (the “Adviser” or “Invesco”). Under the terms of the investment advisory agreement, the Fund accrues daily and pays monthly an advisory fee to the Adviser less the amount paid by the Subsidiary to the Adviser based on the annual rate of the Fund’s average daily net assets as follows:
| | | | |
| Average Daily Net Assets | | Rate | |
| |
First $ 250 million | | | 0.950% | |
| |
Next $250 million | | | 0.925% | |
| |
Next $500 million | | | 0.900% | |
| |
Next $1.5 billion | | | 0.875% | |
| |
Next $2.5 billion | | | 0.850% | |
| |
Next $2.5 billion | | | 0.825% | |
| |
Next $2.5 billion | | | 0.800% | |
| |
Over $10 billion | | | 0.775% | |
| |
For the year ended December 31, 2019, the effective advisory fee rate incurred by the Fund was 0.92%.
The Subsidiary has entered into a separate contract with the Adviser whereby the Adviser provides investment advisory and other services to the Subsidiary. In consideration of these services, the Subsidiary pays an advisory fee to the Adviser based on the annual rate of the Subsidiary’s average daily net assets as set forth in the table above.
Under the terms of a mastersub-advisory agreement between the Adviser and each of Invesco Asset Management Deutschland GmbH, Invesco Asset Management Limited, Invesco Asset Management (Japan) Limited, Invesco Hong Kong Limited, Invesco Senior Secured Management, Inc. and Invesco Canada Ltd. and separatesub-advisory agreements with Invesco Capital Management LLC and Invesco Asset Management (India) Private Limited (collectively, the “AffiliatedSub-Advisers”) the Adviser, not the Fund, will pay 40% of the fees paid to the Adviser to any such AffiliatedSub-Adviser(s)
Invesco V.I. Balanced-Risk Allocation Fund
that provide(s) discretionary investment management services to the Fund based on the percentage of assets allocated to such AffiliatedSub-Adviser(s).
The Adviser has contractually agreed, through at least April 30, 2021, to waive advisory fees and/or reimburse expenses of all shares to the extent necessary to limit total annual fund operating expenses after fee waiver and/or expense reimbursement (including prior fiscalyear-end Acquired Fund Fees and Expenses of 0.16% and excluding certain items discussed below) of Series I shares to 0.80% and Series II shares to 1.05% of average daily net assets (the “expense limits”). In determining the Adviser’s obligation to waive advisory fees and/or reimburse expenses, the following expenses are not taken into account, and could cause the total annual fund operating expenses after fee waiver and/or expense reimbursement to exceed the numbers reflected above: (1) interest; (2) taxes; (3) dividend expense on short sales; (4) extraordinary ornon-routine items, including litigation expenses; and (5) expenses that the Fund has incurred but did not actually pay because of an expense offset arrangement. Acquired Fund Fees and Expenses are not operating expenses of the Fund directly, but are fees and expenses, including management fees, of the investment companies in which the Fund invests. As a result, the total annual fund operating expenses after expense reimbursement may exceed the expense limits above. Unless Invesco continues the fee waiver agreement, it will terminate on April 30, 2021. During its term, the fee waiver agreement cannot be terminated or amended to increase the expense limits or reduce the advisory fee waiver without approval of the Board of Trustees.
Further, the Adviser has contractually agreed, through at least June 30, 2021, to waive the advisory fee payable by the Fund in an amount equal to 100% of the net advisory fees the Adviser receives from the affiliated money market funds on investments by the Fund of uninvested cash in such affiliated money market funds.
For the year ended December 31, 2019, the Adviser waived advisory fees of $4,741,689.
The Trust has entered into a master administrative services agreement with Invesco pursuant to which the Fund has agreed to pay Invesco a fee for costs incurred in providing accounting services and fund administrative services to the Fund and to reimburse Invesco for fees paid to insurance companies that have agreed to provide certain administrative services to the Fund. These administrative services provided by the insurance companies may include, among other things: maintenance of master accounts with the Fund; tracking, recording and transmitting net purchase and redemption orders for Fund shares; maintaining and preserving records related to the purchase, redemption and other account activity of variable product owners; distributing copies of Fund documents such as prospectuses, proxy materials and periodic reports, to variable product owners, and responding to inquiries from variable product owners about the Fund. Pursuant to such agreement, for the year ended December 31, 2019, Invesco was paid $146,822 for accounting and fund administrative services and was reimbursed $1,553,427 for fees paid to insurance companies. Invesco has entered into asub-administration agreement whereby State Street Bank and Trust Company (“SSB”) serves as fund accountant and provides certain administrative services to the Fund. Pursuant to a custody agreement with the Trust on behalf of the Fund, SSB also serves as the Fund’s custodian.
The Trust has entered into a transfer agency and service agreement with Invesco Investment Services, Inc. (“IIS”) pursuant to which the Fund has agreed to pay IIS a fee for providing transfer agency and shareholder services to the Fund and reimburse IIS for certain expenses incurred by IIS in the course of providing such services. For the year ended December 31, 2019, expenses incurred under the agreement are shown in the Consolidated Statement of Operations asTransfer agent fees.
The Trust has entered into a master distribution agreement with Invesco Distributors, Inc. (“IDI”) to serve as the distributor for the Fund. The Trust has adopted a plan pursuant to Rule12b-1 under the 1940 Act with respect to the Fund’s Series II shares (the “Plan”). The Fund, pursuant to the Plan, pays IDI compensation at the annual rate of 0.25% of the Fund’s average daily net assets of Series II shares. The fees are accrued daily and paid monthly. Of the Plan payments, up to 0.25% of the average daily net assets of the Series II shares may be paid to insurance companies who furnish continuing personal shareholder services to customers who purchase and own Series II shares of the Fund. For the year ended December 31, 2019, expenses incurred under the Plan are detailed in the Consolidated Statement of Operations asDistribution fees.
Certain officers and trustees of the Trust are officers and directors of the Adviser, IIS and/or IDI.
NOTE 3–Additional Valuation Information
GAAP defines fair value as the price that would be received to sell an asset or paid to transfer a liability in an orderly transaction between market participants at the measurement date, under current market conditions. GAAP establishes a hierarchy that prioritizes the inputs to valuation methods, giving the highest priority to readily available unadjusted quoted prices in an active market for identical assets (Level 1) and the lowest priority to significant unobservable inputs (Level 3), generally when market prices are not readily available or are unreliable. Based on the valuation inputs, the securities or other investments are tiered into one of three levels. Changes in valuation methods may result in transfers in or out of an investment’s assigned level:
| | Level 1 - | Prices are determined using quoted prices in an active market for identical assets. |
| | Level 2 - | Prices are determined using other significant observable inputs. Observable inputs are inputs that other market participants may use in pricing a security. These may include quoted prices for similar securities, interest rates, prepayment speeds, credit risk, yield curves, loss severities, default rates, discount rates, volatilities and others. |
| | Level 3 - | Prices are determined using significant unobservable inputs. In situations where quoted prices or observable inputs are unavailable (for example, when there is little or no market activity for an investment at the end of the period), unobservable inputs may be used. Unobservable inputs reflect the Fund’s own assumptions about the factors market participants would use in determining fair value of the securities or instruments and would be based on the best available information. |
The following is a summary of the tiered valuation input levels, as of December 31, 2019. The level assigned to the securities valuations may not be an indication of the risk or liquidity associated with investing in those securities. Because of the inherent uncertainties of valuation, the values reflected in the consolidated financial statements may materially differ from the value received upon actual sale of those investments.
| | | | | | | | | | | | | | | | |
| | | Level 1 | | | Level 2 | | | Level 3 | | | Total | |
| |
Investments in Securities | | | | | | | | | | | | | | | | |
| |
U.S. Treasury Securities | | $ | – | | | | $116,709,065 | | | | $– | | | | $116,709,065 | |
| |
Commodity-Linked Securities | | | – | | | | 21,063,834 | | | | – | | | | 21,063,834 | |
| |
Money Market Funds | | | 835,379,744 | | | | – | | | | – | | | | 835,379,744 | |
| |
Total Investments in Securities | | | 835,379,744 | | | | 137,772,899 | | | | – | | | | 973,152,643 | |
| |
Invesco V.I. Balanced-Risk Allocation Fund
| | | | | | | | | | | | | | | | |
| | | Level 1 | | | Level 2 | | | Level 3 | | | Total | |
| |
| | | | |
Other Investments - Assets* | | | | | | | | | | | | | | | | |
| |
Futures Contracts | | $ | 7,557,220 | | | $ | – | | | | $– | | | $ | 7,557,220 | |
| |
Swap Agreements | | | – | | | | 1,658,381 | | | | – | | | | 1,658,381 | |
| |
| | | 7,557,220 | | | | 1,658,381 | | | | – | | | | 9,215,601 | |
| |
| | | | |
Other Investments - Liabilities* | | | | | | | | | | | | | | | | |
| |
Futures Contracts | | | (12,382,589 | ) | | | – | | | | – | | | | (12,382,589 | ) |
| |
Swap Agreements | | | – | | | | (185,454 | ) | | | – | | | | (185,454 | ) |
| |
| | | (12,382,589 | ) | | | (185,454 | ) | | | – | | | | (12,568,043 | ) |
| |
Total Other Investments | | | (4,825,369 | ) | | | 1,472,927 | | | | – | | | | (3,352,442 | ) |
| |
Total Investments | | $ | 830,554,375 | | | $ | 139,245,826 | | | | $– | | | $ | 969,800,201 | |
| |
| * | Unrealized appreciation (depreciation). |
NOTE 4–Derivative Investments
The Fund may enter into an International Swaps and Derivatives Association Master Agreement (“ISDA Master Agreement”) under which a fund may trade OTC derivatives. An OTC transaction entered into under an ISDA Master Agreement typically involves a collateral posting arrangement, payment netting provisions andclose-out netting provisions. These netting provisions allow for reduction of credit risk through netting of contractual obligations. The enforceability of the netting provisions of the ISDA Master Agreement depends on the governing law of the ISDA Master Agreement, among other factors.
For financial reporting purposes, the Fund does not offset OTC derivative assets or liabilities that are subject to ISDA Master Agreements in the Consolidated Statement of Assets and Liabilities.
Value of Derivative Investments atPeriod-End
The table below summarizes the value of the Fund’s derivative investments, detailed by primary risk exposure, held as of December 31, 2019:
| | | | | | | | | | | | | | | | |
| | | Value | |
| Derivative Assets | | Commodity
Risk | | | Equity Risk | | | Interest
Rate Risk | | | Total | |
| |
Unrealized appreciation on futures contracts – Exchange-Traded(a) | | $ | 4,649,193 | | | $ | 2,908,027 | | | $ | - | | | $ | 7,557,220 | |
| |
Unrealized appreciation on swap agreements – OTC | | | 1,658,381 | | | | - | | | | - | | | | 1,658,381 | |
| |
Total Derivative Assets | | | 6,307,574 | | | | 2,908,027 | | | | - | | | | 9,215,601 | |
| |
Derivatives not subject to master netting agreements | | | (4,649,193 | ) | | | (2,908,027 | ) | | | - | | | | (7,557,220 | ) |
| |
Total Derivative Assets subject to master netting agreements | | $ | 1,658,381 | | | $ | - | | | $ | - | | | $ | 1,658,381 | |
| |
| |
| | | Value | |
| Derivative Liabilities | | Commodity
Risk | | | Equity Risk | | | Interest Rate Risk | | | Total | |
| |
Unrealized depreciation on futures contracts – Exchange-Traded(a) | | $ | (275,794 | ) | | $ | (216,502 | ) | | $ | (11,890,293 | ) | | $ | (12,382,589 | ) |
| |
Unrealized depreciation on swap agreements – OTC | | | (185,454 | ) | | | - | | | | - | | | | (185,454 | ) |
| |
Total Derivative Liabilities | | | (461,248 | ) | | | (216,502 | ) | | | (11,890,293 | ) | | | (12,568,043 | ) |
| |
Derivatives not subject to master netting agreements | | | 275,794 | | | | 216,502 | | | | 11,890,293 | | | | 12,382,589 | |
| |
Total Derivative Liabilities subject to master netting agreements | | $ | (185,454 | ) | | $ | - | | | $ | - | | | $ | (185,454 | ) |
| |
| (a) | The daily variation margin receivable (payable) atperiod-end is recorded in the Consolidated Statement of Assets and Liabilities. |
Invesco V.I. Balanced-Risk Allocation Fund
Offsetting Assets and Liabilities
The table below reflects the Fund’s exposure to Counterparties subject to either an ISDA Master Agreement or other agreement for OTC derivative transactions as of December 31, 2019.
| | | | | | | | | | | | | | | | | | | | | | | | |
| | | Financial
Derivative
Assets | | | Financial
Derivative
Liabilities | | | | | | Collateral
(Received)/Pledged | | | | |
| | | | | | |
| | | Swap | | | Swap | | | Net Value of | | | | | | | | | Net | |
| Counterparty | | Agreements | | | Agreements | | | Derivatives | | | Non-Cash | | | Cash | | | Amount | |
| |
Subsidiary | | | | | | | | | | | | | | | | | | | | | | | | |
| |
Barclays Bank PLC | | $ | 116,775 | | | | $(85,745 | ) | | $ | 31,030 | | | | $– | | | $ | – | | | $ | 31,030 | |
| |
Canadian Imperial Bank of Commerce | | | 54,349 | | | | (3,602 | ) | | | 50,747 | | | | – | | | | – | | | | 50,747 | |
| |
Cargill, Inc. | | | 1,579,024 | | | | (11,931 | ) | | | 1,567,093 | | | | – | | | | (1,410,000 | ) | | | 157,093 | |
| |
Goldman Sachs International | | | 865,921 | | | | (6,583 | ) | | | 859,338 | | | | – | | | | – | | | | 859,338 | |
| |
JPMorgan Chase Bank, N.A. | | | 361,457 | | | | (1,009 | ) | | | 360,448 | | | | – | | | | – | | | | 360,448 | |
| |
Macquarie Bank Ltd. | | | – | | | | (105,088 | ) | | | (105,088 | ) | | | – | | | | 105,088 | | | | – | |
| |
Merrill Lynch International | | | 614,116 | | | | (2,302 | ) | | | 611,814 | | | | – | | | | – | | | | 611,814 | |
| |
Morgan Stanley Capital Services LLC | | | 259,879 | | | | (2,329 | ) | | | 257,550 | | | | – | | | | (150,000 | ) | | | 107,550 | |
| |
Total | | $ | 3,851,521 | | | | $(218,589 | ) | | $ | 3,632,932 | | | | $– | | | $ | (1,454,912 | ) | | $ | 2,178,020 | |
| |
Effect of Derivative Investments for the year ended December 31, 2019
The table below summarizes the gains (losses) on derivative investments, detailed by primary risk exposure, recognized in earnings during the period:
| | | | | | | | | | | | | | | | |
| | | Location of Gain (Loss) on
Consolidated Statement of Operations | |
| | | Commodity
Risk | | | Equity Risk | | | Interest Rate Risk | | | Total | |
| |
Realized Gain (Loss): | | | | | | | | | | | | | | | | |
Futures contracts | | | $ 6,671,796 | | | | $55,728,591 | | | | $ 69,942,535 | | | | $132,342,922 | |
| |
Swap agreements | | | (83,065 | ) | | | (209,862 | ) | | | - | | | | (292,927 | ) |
| |
Change in Net Unrealized Appreciation (Depreciation): Futures contracts | | | 9,995,264 | | | | 12,586,682 | | | | (28,448,357 | ) | | | (5,866,411 | ) |
| |
Swap agreements | | | 5,510,837 | | | | (3,025 | ) | | | - | | | | 5,507,812 | |
| |
Total | | | $22,094,832 | | | | $68,102,386 | | | | $ 41,494,178 | | | | $131,691,396 | |
| |
The table below summarizes the average notional value of derivatives held during the period.
| | | | | | | | |
| | | Futures Contracts | | | Swap
Agreements | |
| |
Average notional value | | $ | 1,266,351,584 | | | $ | 149,369,628 | |
| |
NOTE 5–Trustees’ and Officers’ Fees and Benefits
Trustees’ and Officers’ Fees and Benefits include amounts accrued by the Fund to pay remuneration to certain Trustees and Officers of the Fund. Trustees have the option to defer compensation payable by the Fund, andTrustees’ and Officers’Fees and Benefits also include amounts accrued by the Fund to fund such deferred compensation amounts. Those Trustees who defer compensation have the option to select various Invesco Funds in which their deferral accounts shall be deemed to be invested. Finally, certain current Trustees were eligible to participate in a retirement plan that provided for benefits to be paid upon retirement to Trustees over a period of time based on the number of years of service. The Fund may have certain former Trustees who also participate in a retirement plan and receive benefits under such plan.Trustees’ and Officers’Fees and Benefits include amounts accrued by the Fund to fund such retirement benefits. Obligations under the deferred compensation and retirement plans represent unsecured claims against the general assets of the Fund.
NOTE 6–Cash Balances
The Fund is permitted to temporarily carry a negative or overdrawn balance in its account with SSB, the custodian bank. Such balances, if any atperiod-end, are shown in the Consolidated Statement of Assets and Liabilities under the payable captionAmount due custodian. To compensate the custodian bank for such overdrafts, the overdrawn Fund may either (1) leave funds as a compensating balance in the account so the custodian bank can be compensated by earning the additional interest; or (2) compensate by paying the custodian bank at a rate agreed upon by the custodian bank and Invesco, not to exceed the contractually agreed upon rate.
Invesco V.I. Balanced-Risk Allocation Fund
NOTE 7–Distributions to Shareholders and Tax Components of Net Assets
Tax Character of Distributions to Shareholders Paid During the Fiscal Years Ended December 31, 2019 and 2018:
| | | | | | |
| | | 2019 | | 2018 | |
| |
Ordinary income | | $– | | | $ 84,502,400 | |
| |
Long-term capital gain | | – | | | 26,864,065 | |
| |
Return of capital | | – | | | 2,955,761 | |
| |
Total distributions | | $– | | | $114,322,226 | |
| |
Tax Components of Net Assets atPeriod-End:
| | | | | | | | |
| | | | | | 2019 | |
| |
Undistributed ordinary income | | | | | | $ | 89,306,332 | |
| |
Undistributed long-term capital gain | | | | | | | 30,225,749 | |
| |
Net unrealized appreciation (depreciation) – investments | | | | | | | (8,033,141 | ) |
| |
Net unrealized appreciation - foreign currencies | | | | | | | 65,972 | |
| |
Temporary book/tax differences | | | | | | | (96,589 | ) |
| |
Shares of beneficial interest | | | | | | | 910,435,941 | |
| |
Total net assets | | | | | | $ | 1,021,904,264 | |
| |
The difference between book-basis andtax-basis unrealized appreciation (depreciation) is due to differences in the timing of recognition of gains and losses on investments for tax and book purposes. The Fund’s net unrealized appreciation (depreciation) difference is attributable primarily to futures contracts and swap agreements.
The temporary book/tax differences are a result of timing differences between book and tax recognition of income and/or expenses. The Fund’s temporary book/tax differences are the result of the trustee deferral of compensation and retirement plan benefits.
Capital loss carryforward is calculated and reported as of a specific date. Results of transactions and other activity after that date may affect the amount of capital loss carryforward actually available for the Fund to utilize. Capital losses generated in years beginning after December 22, 2010 can be carried forward for an unlimited period, whereas previous losses expire in eight tax years. Capital losses with an expiration period may not be used to offset capital gains until all net capital losses without an expiration date have been utilized. Capital loss carryforwards with no expiration date will retain their character as either short-term or long-term capital losses instead of as short-term capital losses as under prior law. The ability to utilize capital loss carryforwards in the future may be limited under the Internal Revenue Code and related regulations based on the results of future transactions.
The Fund does not have a capital loss carryforward as of December 31, 2019.
NOTE 8–Investment Transactions
The aggregate amount of investment securities (other than short-term securities, U.S. Treasury obligations and money market funds, if any) purchased and sold by the Fund during the year ended December 31, 2019 was $20,330,000 and $18,284,450, respectively. Cost of investments, including any derivatives, on a tax basis includes the adjustments for financial reporting purposes as of the most recently completed federal income tax reportingperiod-end.
Unrealized Appreciation (Depreciation) of Investments on a Tax Basis
| | | | |
| |
Aggregate unrealized appreciation of investments | | $ | 10,414,021 | |
| |
Aggregate unrealized (depreciation) of investments | | | (18,447,162 | ) |
| |
Net unrealized appreciation (depreciation) of investments | | $ | (8,033,141 | ) |
| |
Cost of investments for tax purposes is $977,833,342.
NOTE 9–Reclassification of Permanent Differences
Primarily as a result of differing book/tax treatment of foreign currencies, swap agreements and futures contracts, on December 31, 2019, undistributed net investment income was increased by $54,468,012, undistributed net realized gain was decreased by $53,478,860 and shares of beneficial interest was decreased by $989,152. This reclassification had no effect on the net assets of the Fund.
NOTE 10–Share Information
| | | | | | | | | | | | | | | | |
| | | Summary of Share Activity | |
| |
| | | Year ended | | | Year ended | |
| | | December 31, 2019(a) | | | December 31, 2018 | |
| | | | | | | | |
| | | Shares | | | Amount | | | Shares | | | Amount | |
| |
Sold: | | | | | | | | | | | | | | | | |
Series I | | | 479,777 | | | $ | 4,939,090 | | | | 438,450 | | | $ | 4,686,758 | |
| |
Series II | | | 4,284,767 | | | | 43,466,506 | | | | 7,359,729 | | | | 79,190,918 | |
| |
Invesco V.I. Balanced-Risk Allocation Fund
| | | | | | | | | | | | | | | | |
| | | Summary of Share Activity | |
| |
| | | Year ended | | | Year ended | |
| | | December 31, 2019(a) | | | December 31, 2018 | |
| | | | | | | | |
| | | Shares | | | Amount | | | Shares | | | Amount | |
| |
| | | | |
Issued as reinvestment of dividends: | | | | | | | | | | | | | | | | |
Series I | | | - | | | $ | - | | | | 415,814 | | | $ | 4,120,721 | |
| |
Series II | | | - | | | | - | | | | 11,268,048 | | | | 110,201,505 | |
| |
| | | | |
Reacquired: | | | | | | | | | | | | | | | | |
Series I | | | (270,304 | ) | | | (2,780,603 | ) | | | (376,740 | ) | | | (3,995,276 | ) |
| |
Series II | | | (16,984,260 | ) | | | (172,302,767 | ) | | | (18,613,654 | ) | | | (196,096,139 | ) |
| |
Net increase (decrease) in share activity | | | (12,490,020 | ) | | $ | (126,677,774 | ) | | | 491,647 | | | $ | (1,891,513 | ) |
| |
| (a) | There are entities that are record owners of more than 5% of the outstanding shares of the Fund and in the aggregate own 81% of the outstanding shares of the Fund. The Fund and the Fund’s principal underwriter or adviser, are parties to participation agreements with these entities whereby these entities sell units of interest in separate accounts funding variable products that are invested in the Fund. The Fund, Invesco and/or Invesco affiliates may make payments to these entities, which are considered to be related to the Fund, for providing services to the Fund, Invesco and/or Invesco affiliates including but not limited to services such as, securities brokerage, third party record keeping and account servicing and administrative services. The Fund has no knowledge as to whether all or any portion of the shares owned of record by these entities are also owned beneficially. |
Invesco V.I. Balanced-Risk Allocation Fund
Report of Independent Registered Public Accounting Firm
To the Board of Trustees of AIM Variable Insurance Funds (Invesco Variable Insurance Funds) and Shareholders of Invesco V.I. Balanced- Risk Allocation Fund
Opinion on the Consolidated Financial Statements
We have audited the accompanying consolidated statement of assets and liabilities, including the consolidated schedule of investments, of Invesco V.I. Balanced- Risk Allocation Fund (one of the funds constituting AIM Variable Insurance Funds (Invesco Variable Insurance Funds), referred to hereafter as the “Fund”) as of December 31, 2019, the related consolidated statement of operations for the year ended December 31, 2019, the consolidated statement of changes in net assets for each of the two years in the period ended December 31, 2019, including the related notes, and the consolidated financial highlights for each of the five years in the period ended December 31, 2019 (collectively referred to as the “consolidated financial statements”). In our opinion, the consolidated financial statements present fairly, in all material respects, the financial position of the Fund as of December 31, 2019, the results of its operations for the year then ended, the changes in its net assets for each of the two years in the period ended December 31, 2019 and the financial highlights for each of the five years in the period ended December 31, 2019 in conformity with accounting principles generally accepted in the United States of America.
Basis for Opinion
These consolidated financial statements are the responsibility of the Fund’s management. Our responsibility is to express an opinion on the Fund’s consolidated financial statements based on our audits. We are a public accounting firm registered with the Public Company Accounting Oversight Board (United States) (PCAOB) and are required to be independent with respect to the Fund in accordance with the U.S. federal securities laws and the applicable rules and regulations of the Securities and Exchange Commission and the PCAOB.
We conducted our audits of these consolidated financial statements in accordance with the standards of the PCAOB. Those standards require that we plan and perform the audit to obtain reasonable assurance about whether the consolidated financial statements are free of material misstatement, whether due to error or fraud.
Our audits included performing procedures to assess the risks of material misstatement of the consolidated financial statements, whether due to error or fraud, and performing procedures that respond to those risks. Such procedures included examining, on a test basis, evidence regarding the amounts and disclosures in the consolidated financial statements. Our audits also included evaluating the accounting principles used and significant estimates made by management, as well as evaluating the overall presentation of the consolidated financial statements. Our procedures included confirmation of securities owned as of December 31, 2019 by correspondence with the custodian, transfer agent and brokers; when replies were not received from brokers, we performed other auditing procedures. We believe that our audits provide a reasonable basis for our opinion.
/s/PricewaterhouseCoopers LLP
Houston, Texas
February 18, 2020
We have served as the auditor of one or more of the investment companies in the Invesco group of investment companies since at least 1995. We have not been able to determine the specific year we began serving as auditor.
Invesco V.I. Balanced-Risk Allocation Fund
Calculating your ongoing Fund expenses
Example
As a shareholder of the Fund, you incur ongoing costs, including management fees; distribution and/or service fees(12b-1); and other Fund expenses. This example is intended to help you understand your ongoing costs (in dollars) of investing in the Fund and to compare these costs with ongoing costs of investing in other mutual funds. The example is based on an investment of $1,000 invested at the beginning of the period and held for the entire period July 1, 2019 through December 31, 2019.
The actual and hypothetical expenses in the examples below do not represent the effect of any fees or other expenses assessed in connection with a variable product; if they did, the expenses shown would be higher while the ending account values shown would be lower.
Actual expenses
The table below provides information about actual account values and actual expenses. You may use the information in this table, together with the amount you invested, to estimate the expenses that you paid over the period. Simply divide your account value by $1,000 (for example, an $8,600 account value divided by $1,000 = 8.6), then multiply the result by the number in the table under the heading entitled “Actual Expenses Paid During Period” to estimate the expenses you paid on your account during this period.
Hypothetical example for comparison purposes
The table below also provides information about hypothetical account values and hypothetical expenses based on the Fund��s actual expense ratio and an assumed rate of return of 5% per year before expenses, which is not the Fund’s actual return.
The hypothetical account values and expenses may not be used to estimate the actual ending account balance or expenses you paid for the period. You may use this information to compare the ongoing costs of investing in the Fund and other funds. To do so, compare this 5% hypothetical example with the 5% hypothetical examples that appear in the shareholder reports of the other funds.
Please note that the expenses shown in the table are meant to highlight your ongoing costs. Therefore, the hypothetical information is useful in comparing ongoing costs, and will not help you determine the relative total costs of owning different funds.
| | | | | | | | | | | | |
| | | | | |
| | | Beginning Account Value (07/01/19) | | ACTUAL | | HYPOTHETICAL (5% annual return before expenses) | | Annualized Expense Ratio |
| | Ending Account Value (12/31/19)1 | | Expenses Paid During Period2 | | Ending Account Value (12/31/19) | | Expenses Paid During Period2 |
Series I | | $1,000.00 | | $1,040.00 | | $3.29 | | $1,021.98 | | $3.26 | | 0.64% |
Series II | | 1,000.00 | | 1,038.70 | | 4.57 | | 1,020.72 | | 4.53 | | 0.89 |
| 1 | The actual ending account value is based on the actual total return of the Fund for the period July 1, 2019 through December 31, 2019, after actual expenses and will differ from the hypothetical ending account value which is based on the Fund’s expense ratio and a hypothetical annual return of 5% before expenses. |
| 2 | Expenses are equal to the Fund’s annualized expense ratio as indicated above multiplied by the average account value over the period, multiplied by 184/365 to reflect the most recent fiscal half year. |
Invesco V.I. Balanced-Risk Allocation Fund
Tax Information
Form1099-DIV, Form1042-S and other year-end tax information provide shareholders with actual calendar year amounts that should be included in their tax returns. Shareholders should consult their tax advisers.
The following distribution information is being provided as required by the Internal Revenue Code or to meet a specific state’s requirement.
The Fund designates the following amounts or, if subsequently determined to be different, the maximum amount allowable for its fiscal year ended December 31, 2019:
| | | | | | |
| | Federal and State Income Tax | | | | |
| | Qualified Dividend Income* | | | 0.00 | % |
| | Corporate Dividends Received Deduction* | | | 0.00 | % |
| | U.S. Treasury Obligations* | | | 13.33 | % |
* The above percentages are based on ordinary income dividends paid to shareholders during the Fund’s fiscal year.
Invesco V.I. Balanced-Risk Allocation Fund
Trustees and Officers
The address of each trustee and officer is AIM Variable Insurance Funds (Invesco Variable Insurance Funds) (the “Trust”), 11 Greenway Plaza, Suite 1000, Houston, Texas 77046-1173. The trustees serve for the life of the Trust, subject to their earlier death, incapacitation, resignation, retirement or removal as more specifically provided in the Trust’s organizational documents. Each officer serves for a one year term or until their successors are elected and qualified. Column two below includes length of time served with predecessor entities, if any.
| | | | | | | | |
Name, Year of Birth and Position(s) Held with the Trust | | Trustee and/or Officer Since | | Principal Occupation(s) During Past 5 Years | | Number of
Funds in
Fund Complex
Overseen by
Trustee | | Other Directorship(s) Held by Trustee
During Past 5 Years |
| Interested Person |
Martin L. Flanagan1- 1960 Trustee and Vice Chair | | 2007 | | Executive Director, Chief Executive Officer and President, Invesco Ltd. (ultimate parent of Invesco and a global investment management firm); Trustee and Vice Chair, The Invesco Funds; Vice Chair, Investment Company Institute; and Member of Executive Board, SMU Cox School of Business Formerly: Advisor to the Board, Invesco Advisers, Inc. (formerly known as Invesco Institutional (N.A.), Inc.); Chairman and Chief Executive Officer, Invesco Advisers, Inc. (registered investment adviser); Director, Chairman, Chief Executive Officer and President, Invesco Holding Company (US), Inc. (formerly IVZ Inc.) (holding company), Invesco Group Services, Inc. (service provider) and Invesco North American Holdings, Inc. (holding company); Director, Chief Executive Officer and President, Invesco Holding Company Limited (parent of Invesco and a global investment management firm); Director, Invesco Ltd.; Chairman, Investment Company Institute and President,Co-Chief Executive Officer,Co-President, Chief Operating Officer and Chief Financial Officer, Franklin Resources, Inc. (global investment management organization) | | 229 | | None |
| 1 | Mr. Flanagan is considered an interested person (within the meaning of Section 2(a)(19) of the 1940 Act) of the Trust because he is an officer of the Adviser to the Trust, and an officer and a director of Invesco Ltd., ultimate parent of the Adviser. |
Invesco V.I. Balanced-Risk Allocation Fund
Trustees and Officers–(continued)
| | | | | | | | |
Name, Year of Birth and Position(s) Held with the Trust | | Trustee and/or Officer Since | | Principal Occupation(s) During Past 5 Years | | Number of
Funds in Fund Complex
Overseen by
Trustee | | Other Directorship(s) Held by Trustee
During Past 5 Years |
| Independent Trustees |
Bruce L. Crockett - 1944 Trustee and Chair | | 1993 | | Chairman, Crockett Technologies Associates (technology consulting company) Formerly: Director, Captaris (unified messaging provider); Director, President and Chief Executive Officer, COMSAT Corporation; Chairman, Board of Governors of INTELSAT (international communications company); ACE Limited (insurance company); Independent Directors Council and Investment Company Institute: Member of the Audit Committee, Investment Company Institute; Member of the Executive Committee and Chair of the Governance Committee, Independent Directors Council | | 229 | | Director and Chairman of the Audit Committee, ALPS (Attorneys Liability Protection Society) (insurance company); Director and Member of the Audit Committee and Compensation Committee, Ferroglobe PLC (metallurgical company) |
David C. Arch - 1945 Trustee | | 2010 | | Chairman of Blistex Inc. (consumer health care products manufacturer); Member, World Presidents’ Organization | | 229 | | Board member of the Illinois Manufacturers’ Association |
Beth Ann Brown - 1968 Trustee | | 2019 | | Independent Consultant Formerly: Head of Intermediary Distribution, Managing Director, Strategic Relations, Managing Director, Head of National Accounts, Senior Vice President, National Account Manager and Senior Vice President, Key Account Manager, Columbia Management Investment Advisers LLC; Vice President, Key Account Manager, Liberty Funds Distributor, Inc.; and Trustee of certain Oppenheimer Funds | | 229 | | Director, Board of Directors of Caron Engineering Inc.; Advisor, Board of Advisors of Caron Engineering Inc.; President and Director, Acton Shapleigh Youth Conservation Corps (non-profit); and Vice President and Director of Grahamtastic Connection (non-profit) |
Jack M. Fields - 1952 Trustee | | 1997 | | Chief Executive Officer, Twenty First Century Group, Inc. (government affairs company); and Chairman, Discovery Learning Alliance(non-profit) Formerly: Owner and Chief Executive Officer, Dos Angeles Ranch L.P. (cattle, hunting, corporate entertainment); Director, Insperity, Inc. (formerly known as Administaff) (human resources provider); Chief Executive Officer, Texana Timber LP (sustainable forestry company); Director of Cross Timbers Quail Research Ranch(non-profit); and member of the U.S. House of Representatives | | 229 | | None |
Invesco V.I. Balanced-Risk Allocation Fund
Trustees and Officers–(continued)
| | | | | | | | |
Name, Year of Birth and Position(s) Held with the Trust | | Trustee and/or Officer Since | | Principal Occupation(s) During Past 5 Years | | Number of
Funds in Fund Complex
Overseen by
Trustee | | Other Directorship(s) Held by Trustee
During Past 5 Years |
| Independent Trustees–(continued) |
Cynthia Hostetler -1962 Trustee | | 2017 | | Non-Executive Director and Trustee of a number of public and private business corporations Formerly: Director, Aberdeen Investment Funds (4 portfolios); Head of Investment Funds and Private Equity, Overseas Private Investment Corporation; President, First Manhattan Bancorporation, Inc.; Attorney, Simpson Thacher & Bartlett LLP | | 229 | | Vulcan Materials Company (construction materials company); Trilinc Global Impact Fund; Genesee & Wyoming, Inc. (railroads); Artio Global Investment LLC (mutual fund complex); Edgen Group, Inc. (specialized energy and infrastructure products distributor); Investment Company Institute (professional organization); Independent Directors Council (professional organization) |
Eli Jones - 1961 Trustee | | 2016 | | Professor and Dean, Mays Business School - Texas A&M University Formerly: Professor and Dean, Walton College of Business, University of Arkansas and E.J. Ourso College of Business, Louisiana State University; Director, Arvest Bank | | 229 | | Insperity, Inc. (formerly known as Administaff) (human resources provider) |
Elizabeth Krentzman - 1959 Trustee | | 2019 | | Formerly: Principal and Chief Regulatory Advisor for Asset Management Services and U.S. Mutual Fund Leader of Deloitte & Touche LLP; General Counsel of the Investment Company Institute (trade association); National Director of the Investment Management Regulatory Consulting Practice, Principal, Director and Senior Manager of Deloitte & Touche LLP; Assistant Director of the Division of Investment Management - Office of Disclosure and Investment Adviser Regulation of the U.S. Securities and Exchange Commission and various positions with the Division of Investment Management - Office of Regulatory Policy of the U.S. Securities and Exchange Commission; Associate at Ropes & Gray LLP; Advisory Board Member of the Securities and Exchange Commission Historical Society; and Trustee of certain Oppenheimer Funds | | 229 | | Trustee of the University of Florida National Board Foundation and Audit Committee Member; Member of the Cartica Funds Board of Directors (private investment funds); Member of the University of Florida Law Center Association, Inc. Board of Trustees and Audit Committee Member |
Anthony J. LaCava, Jr. - 1956 Trustee | | 2019 | | Formerly: Director and Member of the Audit Committee, Blue Hills Bank (publicly traded financial institution) and Managing Partner, KPMG LLP | | 229 | | Blue Hills Bank; Chairman, Bentley University; Member, Business School Advisory Council; and Nominating Committee KPMG LLP |
Prema Mathai-Davis - 1950 Trustee | | 1998 | | Retired Co-Owner & Partner of Quantalytics Research, LLC, (a FinTech Investment Research Platform for the Self-Directed Investor) | | 229 | | None |
Invesco V.I. Balanced-Risk Allocation Fund
Trustees and Officers–(continued)
| | | | | | | | |
Name, Year of Birth and Position(s) Held with the Trust | | Trustee and/or Officer Since | | Principal Occupation(s) During Past 5 Years | | Number of
Funds in Fund Complex
Overseen by
Trustee | | Other Directorship(s) Held by Trustee
During Past 5 Years |
| Independent Trustees–(continued) |
Joel W. Motley - 1952 Trustee | | 2019 | | Director of Office of Finance, Federal Home Loan Bank; Member of the Vestry of Trinity Wall Street; Managing Director of Carmona Motley Inc. (privately held financial advisor); Member of the Finance and Budget Committee of the Council on Foreign Relations, Member of the Investment Committee and Board of Human Rights Watch and Member of the Investment Committee and Board of Historic Hudson Valley(non-profit cultural organization) Formerly: Managing Director of Public Capital Advisors, LLC (privately held financial advisor); Managing Director of Carmona Motley Hoffman, Inc. (privately held financial advisor); Trustee of certain Oppenheimer Funds; and Director of Columbia Equity Financial Corp. (privately held financial advisor) | | 229 | | Director of Greenwall Foundation (bioethics research foundation); Member of Board and Investment Committee of The Greenwall Foundation; Director of Southern Africa Legal Services Foundation; Board Member and Investment Committee Member of Pulizer Center for Crisis Reporting(non-profit journalism) |
Teresa M. Ressel - 1962 Trustee | | 2017 | | Non-executive director and trustee of a number of public and private business corporations Formerly: Chief Financial Officer, Olayan America, The Olayan Group (international investor/commercial/industrial); Chief Executive Officer, UBS Securities LLC; Group Chief Operating Officer, Americas, UBS AG; Assistant Secretary for Management & Budget and CFO, US Department of the Treasury | | 229 | | Atlantic Power Corporation (power generation company); ON Semiconductor Corp. (semiconductor supplier) |
Ann Barnett Stern - 1957 Trustee | | 2017 | | President and Chief Executive Officer, Houston Endowment Inc. (private philanthropic institution) Formerly: Executive Vice President and General Counsel, Texas Children’s Hospital; Attorney, Beck, Redden and Secrest, LLP; Business Law Instructor, University of St. Thomas; Attorney, Andrews & Kurth LLP | | 229 | | Federal Reserve Bank of Dallas |
Robert C. Troccoli - 1949 Trustee | | 2016 | | Retired | | 229 | | None |
| Daniel S. Vandivort - 1954 Trustee | | 2019 | | Treasurer, Chairman of the Audit and Finance Committee, and Trustee, Board of Trustees, Huntington Disease Foundation of America; and President, Flyway Advisory Services LLC (consulting and property management) Formerly: Trustee and Governance Chair, of certain Oppenheimer Funds | | 229 | | Chairman and Lead Independent Director, Chairman of the Audit Committee, and Director, Board of Directors, Value Line Funds |
| James D. Vaughn - 1945 Trustee | | 2019 | | Retired Formerly: Managing Partner, Deloitte & Touche LLP; Trustee and Chairman of the Audit Committee, Schroder Funds; Board Member, Mile High United Way, Boys and Girls Clubs, Boy Scouts, Colorado Business Committee for the Arts, Economic Club of Colorado and Metro Denver Network (economic development corporation); and Trustee of certain Oppenheimer Funds | | 229 | | Board member and Chairman of Audit Committee of AMG National Trust Bank; Trustee and Investment Committee member, University of South Dakota Foundation; Board member, Audit Committee Member and past Board Chair, Junior Achievement(non-profit) |
Invesco V.I. Balanced-Risk Allocation Fund
Trustees and Officers–(continued)
| | | | | | | | |
Name, Year of Birth and Position(s) Held with the Trust | | Trustee and/or Officer Since | | Principal Occupation(s) During Past 5 Years | | Number of
Funds in Fund Complex
Overseen by
Trustee | | Other Directorship(s) Held by Trustee
During Past 5 Years |
| Independent Trustees–(continued) |
| Christopher L. WIlson - 1957 Trustee, Vice Chair and Chair Designate | | 2017 | | Retired Formerly: Director, TD Asset Management USA Inc. (mutual fund complex) (22 portfolios); Managing Partner, CT2, LLC (investing and consulting firm); President/Chief Executive Officer, Columbia Funds, Bank of America Corporation; President/Chief Executive Officer, CDC IXIS Asset Management Services, Inc.; Principal & Director of Operations, Scudder Funds, Scudder, Stevens & Clark, Inc.; Assistant Vice President, Fidelity Investments | | 229 | | ISO New England, Inc.(non-profit organization managing regional electricity market) |
Invesco V.I. Balanced-Risk Allocation Fund
Trustees and Officers–(continued)
| | | | | | | | |
Name, Year of Birth and Position(s) Held with the Trust | | Trustee and/or Officer Since | | Principal Occupation(s) During Past 5 Years | | Number of
Funds in
Fund Complex
Overseen by
Trustee | | Other Directorship(s) Held by Trustee
During Past 5 Years |
| Officers |
Sheri Morris - 1964 President, Principal Executive Officer and Treasurer | | 1999 | | Head of Global Fund Services, Invesco Ltd.; President, Principal Executive Officer and Treasurer, The Invesco Funds; Vice President, Invesco Advisers, Inc. (formerly known as Invesco Institutional (N.A.), Inc.) (registered investment adviser); and Vice President, Invesco Exchange-Traded Fund Trust, Invesco Exchange-Traded Fund Trust II, Invesco India Exchange-Traded Fund Trust, Invesco Actively Managed Exchange-Traded Fund Trust, Invesco Actively Managed Exchange-Traded Commodity Fund Trust and Invesco Exchange-Traded Self-Indexed Fund Trust; and Vice President, OppenheimerFunds, Inc. Formerly: Vice President and Principal Financial Officer, The Invesco Funds; Vice President, Invesco AIM Advisers, Inc., Invesco AIM Capital Management, Inc. and Invesco AIM Private Asset Management, Inc.; Assistant Vice President and Assistant Treasurer, The Invesco Funds and Assistant Vice President, Invesco Advisers, Inc., Invesco AIM Capital Management, Inc. and Invesco AIM Private Asset Management, Inc.; and Treasurer, Invesco Exchange-Traded Fund Trust, Invesco Exchange-Traded Fund Trust II, Invesco India Exchange-Traded Fund Trust and Invesco Actively Managed Exchange-Traded Fund Trust | | N/A | | N/A |
Russell C. Burk - 1958 Senior Vice President and Senior Officer | | 2005 | | Senior Vice President and Senior Officer, The Invesco Funds | | N/A | | N/A |
Jeffrey H. Kupor - 1968 Senior Vice President, Chief Legal Officer and Secretary | | 2018 | | Head of Legal of the Americas, Invesco Ltd.; Senior Vice President and Secretary, Invesco Advisers, Inc. (formerly known as Invesco Institutional (N.A.), Inc.) (registered investment adviser); Senior Vice President and Secretary, Invesco Distributors, Inc. (formerly known as Invesco AIM Distributors, Inc.); Vice President and Secretary, Invesco Investment Services, Inc. (formerly known as Invesco AIM Investment Services, Inc.) Senior Vice President, Chief Legal Officer and Secretary, The Invesco Funds; Secretary and General Counsel, Invesco Investment Advisers LLC (formerly known as Van Kampen Asset Management); Secretary and General Counsel, Invesco Capital Markets, Inc. (formerly known as Van Kampen Funds Inc.) and Chief Legal Officer, Invesco Exchange-Traded Fund Trust, Invesco Exchange-Traded Fund Trust II, Invesco India Exchange-Traded Fund Trust, Invesco Actively Managed Exchange-Traded Fund Trust, Invesco Actively Managed Exchange-Traded Commodity Fund Trust and Invesco Exchange-Traded Self-Indexed Fund Trust; Secretary, Invesco Indexing LLC; Secretary, W.L. Ross & Co., LLC Formerly: Secretary and Vice President, Jemstep, Inc.; Head of Legal, Worldwide Institutional, Invesco Ltd.; Secretary and General Counsel, INVESCO Private Capital Investments, Inc.; Senior Vice President, Secretary and General Counsel, Invesco Management Group, Inc. (formerly known as Invesco AIM Management Group, Inc.); Assistant Secretary, INVESCO Asset Management (Bermuda) Ltd.; Secretary and General Counsel, Invesco Private Capital, Inc.; Assistant Secretary and General Counsel, INVESCO Realty, Inc.; Secretary and General Counsel, Invesco Senior Secured Management, Inc.; and Secretary, Sovereign G./P. Holdings Inc. | | N/A | | N/A |
Andrew R. Schlossberg - 1974 Senior Vice President | | 2019 | | Head of the Americas and Senior Managing Director, Invesco Ltd.; Director and Senior Vice President, Invesco Advisers, Inc. (formerly known as Invesco Institutional (N.A.), Inc.) (registered investment adviser); Director and Chairman, Invesco Investment Services, Inc. (formerly known as Invesco AIM Investment Services, Inc.) (registered transfer agent); Senior Vice President, The Invesco Funds; Director, Invesco Investment Advisers LLC (formerly known as Van Kampen Asset Management); Director, President and Chairman, Invesco Insurance Agency, Inc. Formerly: Director, Invesco UK Limited; Director and Chief Executive, Invesco Asset Management Limited and Invesco Fund Managers Limited; Assistant Vice President, The Invesco Funds; Senior Vice President, Invesco Advisers, Inc. (formerly known as Invesco Institutional (N.A.), Inc.) (registered investment adviser); Director and Chief Executive, Invesco Administration Services Limited and Invesco Global Investment Funds Limited; Director, Invesco Distributors, Inc.; Head of EMEA, Invesco Ltd.; President, Invesco Actively Managed Exchange-Traded Commodity Fund Trust, Invesco Actively Managed Exchange-Traded Fund Trust, Invesco Exchange-Traded Fund Trust, Invesco Exchange-Traded Fund Trust II and Invesco India Exchange-Traded Fund Trust; Managing Director and Principal Executive Officer, Invesco Capital Management LLC | | N/A | | N/A |
Invesco V.I. Balanced-Risk Allocation Fund
Trustees and Officers–(continued)
| | | | | | | | |
Name, Year of Birth and Position(s) Held with the Trust | | Trustee and/or Officer Since | | Principal Occupation(s) During Past 5 Years | | Number of
Funds in
Fund Complex
Overseen by
Trustee | | Other Directorship(s) Held by Trustee
During Past 5 Years |
| Officers–(continued) |
John M. Zerr - 1962 Senior Vice President | | 2006 | | Chief Operating Officer of the Americas; Senior Vice President, Invesco Advisers, Inc. (formerly known as Invesco Institutional (N.A.), Inc.) (registered investment adviser); Senior Vice President, Invesco Distributors, Inc. (formerly known as Invesco AIM Distributors, Inc.); Director and Vice President, Invesco Investment Services, Inc. (formerly known as Invesco AIM Investment Services, Inc.) Senior Vice President, The Invesco Funds; Managing Director, Invesco Capital Management LLC; Director, Invesco Investment Advisers LLC (formerly known as Van Kampen Asset Management); Senior Vice President, Invesco Capital Markets, Inc. (formerly known as Van Kampen Funds Inc.); Manager, Invesco Indexing LLC; Manager, Invesco Specialized Products, LLC; Director and Senior Vice President, Invesco Insurance Agency, Inc.; Member, Invesco Canada Funds Advisory Board; Director, President and Chief Executive Officer, Invesco Corporate Class Inc. (corporate mutual fund company); and Director, Chairman, President and Chief Executive Officer, Invesco Canada Ltd. (formerly known as Invesco Trimark Ltd./Invesco Trimark Ltèe) (registered investment adviser and registered transfer agent) Formerly: Director and Senior Vice President, Invesco Management Group, Inc. (formerly known as Invesco AIM Management Group, Inc.); Secretary and General Counsel, Invesco Management Group, Inc. (formerly known as Invesco AIM Management Group, Inc.); Secretary, Invesco Investment Services, Inc. (formerly known as Invesco AIM Investment Services, Inc.); Chief Legal Officer and Secretary, The Invesco Funds; Secretary and General Counsel, Invesco Investment Advisers LLC (formerly known as Van Kampen Asset Management); Secretary and General Counsel, Invesco Capital Markets, Inc. (formerly known as Van Kampen Funds Inc.); Chief Legal Officer, Invesco Exchange-Traded Fund Trust, Invesco Exchange-Traded Fund Trust II, Invesco India Exchange-Traded Fund Trust, Invesco Actively Managed Exchange-Traded Fund Trust, Invesco Actively Managed Exchange-Traded Commodity Fund Trust and Invesco Exchange-Traded Self-Indexed Fund Trust; Secretary, Invesco Indexing LLC; Director, Secretary, General Counsel and Senior Vice President, Van Kampen Exchange Corp.; Director, Vice President and Secretary, IVZ Distributors, Inc. (formerly known as INVESCO Distributors, Inc.); Director and Vice President, INVESCO Funds Group, Inc.; Director and Vice President, Van Kampen Advisors Inc.; Director, Vice President, Secretary and General Counsel, Van Kampen Investor Services Inc.;Director and Secretary, Invesco Distributors, Inc. (formerly known as Invesco AIM Distributors, Inc.); Director, Senior Vice President, General Counsel and Secretary, Invesco AIM Advisers, Inc. and Van Kampen Investments Inc.; Director, Vice President and Secretary, Fund Management Company; Director, Senior Vice President, Secretary, General Counsel and Vice President, Invesco AIM Capital Management, Inc.; Chief Operating Officer and General Counsel, Liberty Ridge Capital, Inc. (an investment adviser) | | N/A | | N/A |
Gregory G. McGreevey - 1962 Senior Vice President | | 2012 | | Senior Managing Director, Invesco Ltd.; Director, Chairman, President, and Chief Executive Officer, Invesco Advisers, Inc. (formerly known as Invesco Institutional (N.A.), Inc.) (registered investment adviser); Director, Invesco Mortgage Capital, Inc. and Invesco Senior Secured Management, Inc.; and Senior Vice President, The Invesco Funds; and President, SNW Asset Management Corporation Formerly: Senior Vice President, Invesco Management Group, Inc. and Invesco Advisers, Inc.; Assistant Vice President, The Invesco Funds | | N/A | | N/A |
Kelli Gallegos - 1970 Vice President, Principal Financial Officer and Assistant Treasurer | | 2008 | | Principal Financial and Accounting Officer - Investments Pool, Invesco Specialized Products, LLC; Vice President, Principal Financial Officer and Assistant Treasurer, The Invesco Funds; Principal Financial and Accounting Officer - Pooled Investments, Invesco Capital Management LLC; Vice President and Treasurer, Invesco Exchange-Traded Fund Trust, Invesco Exchange-Traded Fund Trust II, Invesco India Exchange-Traded Fund Trust, Invesco Actively Managed Exchange-Traded Fund Trust, Invesco Actively Managed Exchange-Traded Commodity Fund Trust and Invesco Exchange-Traded Self-Indexed Fund Trust Formerly: Assistant Treasurer, Invesco Specialized Products, LLC; Assistant Treasurer, Invesco Exchange-Traded Fund Trust, Invesco Exchange-Traded Fund Trust II, Invesco India Exchange-Traded Fund Trust, Invesco Actively Managed Exchange-Traded Fund Trust, Invesco Actively Managed Exchange-Traded Commodity Fund Trust and Invesco Exchange-Traded Self-Indexed Fund Trust; Assistant Treasurer, Invesco Capital Management LLC; Assistant Vice President, The Invesco Funds | | N/A | | N/A |
Invesco V.I. Balanced-Risk Allocation Fund
Trustees and Officers–(continued)
| | | | | | | | |
Name, Year of Birth and Position(s) Held with the Trust | | Trustee and/or Officer Since | | Principal Occupation(s) During Past 5 Years | | Number of
Funds in
Fund Complex
Overseen by
Trustee | | Other Directorship(s) Held by Trustee
During Past 5 Years |
| Officers–(continued) |
Crissie M. Wisdom - 1969 Anti-Money Laundering Compliance Officer | | 2013 | | Anti-Money Laundering Compliance Officer, Invesco Advisers, Inc. (formerly known as Invesco Institutional (N.A.), Inc.) (registered investment adviser), Invesco Capital Markets, Inc. (formerly known as Van Kampen Funds Inc.), Invesco Distributors, Inc., Invesco Investment Services, Inc., The Invesco Funds, and Invesco Exchange-Traded Fund Trust, Invesco Exchange-Traded Fund Trust II, Invesco India Exchange-Traded Fund Trust, Invesco Actively Managed Exchange-Traded Fund Trust, Invesco Actively Managed Exchange-Traded Commodity Fund Trust and Invesco Exchange-Traded Self-Indexed Fund Trust; Anti-Money Laundering Compliance Officer and Bank Secrecy Act Officer, INVESCO National Trust Company and Invesco Trust Company; and Fraud Prevention Manager and Controls and Risk Analysis Manager for Invesco Investment Services, Inc. Formerly: Anti-Money Laundering Compliance Officer, Van Kampen Exchange Corp. and Invesco Management Group, Inc. | | N/A | | N/A |
Robert R. Leveille - 1969 Chief Compliance Officer | | 2016 | | Chief Compliance Officer, Invesco Advisers, Inc. (registered investment adviser); and Chief Compliance Officer, The Invesco Funds Formerly: Chief Compliance Officer, Putnam Investments and the Putnam Funds | | N/A | | N/A |
The Statement of Additional Information of the Trust includes additional information about the Fund’s Trustees and is available upon request, without charge, by calling 1.800.959.4246. Please refer to the Fund’s Statement of Additional Information for information on the Fund’ssub-advisers.
| | | | | | |
| Office of the Fund | | Investment Adviser | | Distributor | | Auditors |
| 11 Greenway Plaza, Suite 1000 | | Invesco Advisers, Inc. | | Invesco Distributors, Inc. | | PricewaterhouseCoopers LLP |
| Houston, TX 77046-1173 | | 1555 Peachtree Street, N.E. | | 11 Greenway Plaza, Suite 1000 | | 1000 Louisiana Street, Suite 5800 |
| | Atlanta, GA 30309 | | Houston, TX 77046-1173 | | Houston, TX 77002-5678 |
| | | |
| Counsel to the Fund | | Counsel to the Independent Trustees | | Transfer Agent | | Custodian |
| Stradley Ronon Stevens & Young, LLP | | Goodwin Procter LLP | | Invesco Investment Services, Inc. | | State Street Bank and Trust Company |
| 2005 Market Street, Suite 2600 | | 901 New York Avenue, N.W. | | 11 Greenway Plaza, Suite 1000 | | 225 Franklin Street |
| Philadelphia, PA 19103-7018 | | Washington, D.C. 20001 | | Houston, TX 77046-1173 | | Boston, MA 02110-2801 |
Invesco V.I. Balanced-Risk Allocation Fund
| | | | |
| | |
 | | Annual Report to Shareholders | | December 31, 2019 |
| | |
| | Invesco V.I. Comstock Fund |
| | |
| | |

Beginning on January 1, 2021, as permitted by regulations adopted by the Securities and Exchange Commission, the insurance company that offers your variable annuity or variable life insurance contract may no longer send you paper copies of the Fund’s shareholder reports by mail, unless you specifically request paper copies of the reports from the insurance company or your financial intermediary. Instead of delivering paper copies of the report, the insurance company may choose to make the reports available on a website, and will notify you by mail each time a report is posted and provide you with a website link to access the report. Instructions for requesting paper copies will be provided by your insurance company.
If the insurance company offers electronic delivery, you may elect to receive shareholder reports and other communications about the Fund electronically by following the instructions provided by the insurance company or by contacting your financial intermediary. If you already elected to receive shareholder reports electronically, you will not be affected by this change and you need not take any action.
You may elect to receive all future reports in paper free of charge from the insurance company. You can inform the insurance company or your financial intermediary that you wish to continue receiving paper copies of your shareholder reports by following the instructions provided by the insurance company or by contacting your financial intermediary. Your election to receive reports in paper will apply to all portfolio companies available under your contract with the insurance company.
The Fund provides a complete list of its holdings four times in each fiscal year, at the quarter-ends. For the second and fourth quarters, the lists appear in the Fund’s semiannual and annual reports to shareholders. For the first and third quarters, the Fund files the lists with the Securities and Exchange Commission (SEC) as an exhibit to its reports on Form N-PORT. The Fund’s Form N-PORT filings are available on the SEC website, sec.gov. The SEC file numbers for the Fund are 811-07452 and 033-57340. The Fund’s most recent portfolio holdings, as filed on Form N-PORT, have also been made available to insurance companies issuing variable annuity contracts and variable life insurance policies (“variable products”) that invest in the Fund.
A description of the policies and procedures that the Fund uses to determine how to vote proxies relating to portfolio securities is available without charge, upon request, from our Client Services department at 800 959 4246 or at invesco.com/proxyguidelines. The information is also available on the SEC website, sec.gov.
Information regarding how the Fund voted proxies related to its portfolio securities during the most recent 12-month period ended June 30 is available at invesco.com/proxysearch. The information is also available on the SEC website, sec.gov.
Invesco Advisers, Inc. is an investment adviser; it provides investment advisory services to individual and institutional clients and does not sell securities. Invesco Distributors, Inc. is the US distributor for Invesco Ltd.’s retail mutual funds, exchange-traded funds and institutional money market funds. Both are wholly owned, indirect subsidiaries of Invesco Ltd.
This report must be accompanied or preceded by a currently effective Fund prospectus and variable product prospectus, which contain more complete information, including sales charges and expenses. Investors should read each carefully before investing.
NOT FDIC INSURED | MAY LOSE VALUE | NO BANK GUARANTEE
| | |
| Invesco Distributors, Inc. | | VK-VICOM-AR-1 |
Management’s Discussion of Fund Performance
Performance summary
For the year ended December 31, 2019, Series I shares of Invesco V.I. Comstock Fund (the Fund) underperformed the Russell 1000 Value Index, the Fund’s style-specific benchmark.
Your Fund’s long-term performance appears later in this report.
Fund vs. Indexes
Total returns, 12/31/18 to 12/31/19, excluding variable product issuer charges. If variable product issuer charges were included, returns would be lower.
| | | | | |
| Series I Shares | | | | 25.30 | % |
| Series II Shares | | | | 24.94 | |
| S&P 500 Indexq (Broad Market Index) | | | | 31.49 | |
| Russell 1000 Value Indexq(Style-Specific Index) | | | | 26.54 | |
| Lipper VUF Large-Cap Value Funds Index∎(Peer Group Index) | | | | 26.71 | |
| Source(s):qRIMES Technologies Corp.;∎Lipper Inc. | |
Market conditions and your Fund
Equity markets rallied in the first quarter of 2019, fueled by optimism about a potential US-China trade deal and indication that the US Federal Reserve (the Fed) would not raise interest rates in 2019, a surprising shift in monetary policy. The Fed’s more accommodative stance provided a supportive environment for equities and fixed income, even as US economic data were mixed and overseas growth appeared to be slowing. Against this backdrop, the S&P 500 Index posted its best first quarter returns since 1998.
Although the S&P 500 Index posted modest gains for the second quarter of 2019, the US stock market experienced increased volatility. After four consecutive months of rising stock markets, the market sold off in May 2019, along with bond yields and oil prices, as investors weighed the impact of the lingering trade war between the US and China, as well as potential tariffs imposed on Mexico. In addition, economic data showed a slowing domestic and global economy.
Key issues that concerned investors in the second quarter of 2019 carried over into the third quarter. The US-China
trade conflict worried investors and stifled business investment, even as the Fed cut interest rates by 0.25% in July and again in September 2019.1 This environment, combined with evidence of slowing global economic growth, fueled market volatility in August 2019. The US Treasury yield curve inverted several times, increasing fears of a possible US recession. As a result, August saw increased risk aversion, with investors crowding into asset classes perceived as safe havens, such as US Treasuries and gold. However, the Fed’s accommodative tone provided some support for risk assets.
Macroeconomic issues that concerned investors in the third quarter of 2019 mostly abated during the fourth quarter, providing the backdrop for strong equity market returns. Risk assets surged higher as a result of a delay in the Brexit agreement until January 2020, optimism that phase one of a US-China trade deal would be completed and better-than-expected third-quarter corporate earnings results. The US economy rose higher than expected, at 2.1% during the third quarter of 2019.2 During its October meeting, the Fed cut interest rates again
by 0.25% based on business investment and exports remaining weak.1 Investors were also encouraged by a resilient US economy and corporate earnings, putting the US equity market on track for its largest annual rise since 2013.
During the year, all sectors in the Russell 1000 Value Index posted positive returns. Information technology, industrials and financials were the strongest performing sectors, with energy being the worst performing sector.
On the positive side, strong stock selection in the financials sector was a large contributor to the Fund’s performance relative to its style-specific benchmark for the year.Citigroup,Bank of Americaand not owningBerkshire Hathaway(an underperforming component of the Russell 1000 Value Index) were the top individual relative contributors in the sector. Large banks performed well during the year, as interest rates stabilized and investors benefited from return of capital back to shareholders via stock buybacks (reducing outstanding shares) and increased dividends.
Stock selection in the industrials sector also boosted the Fund’s performance relative to its style-specific benchmark for the year.Johnson Controls Internationalwas notable as the company beat earnings’ estimates in the first half of the year. The stock rallied during the second quarter on the announcement of its earlier-than-expected closing of its Power Solutions business. The company announced its immediate intention to cash proceeds (which were $200 million higher than expected) for repurchases and debt repayment. Other contributors within the sector wereEmerson ElectricandEaton, as each outperformed the Russell 1000 Value benchmark for the year.
| | |
Portfolio Composition |
By sector | | % of total net assets |
| | |
| |
| Financials | | 30.44% |
| Energy | | 15.91 |
| Health Care | | 11.27 |
| Industrials | | 8.67 |
| Information Technology | | 8.25 |
| Consumer Staples | | 6.86 |
| Consumer Discretionary | | 5.85 |
| Communication Services | | 5.49 |
| Materials | | 3.24 |
| Utilities | | 0.47 |
| Money Market Funds Plus Other Assets Less Liabilities | | 3.55 |
| | |
Top 10 Equity Holdings* | | |
| % of total net assets |
| |
1. Citigroup, Inc. | | 5.33% |
2. Bank of America Corp. | | 5.10 |
3. JPMorgan Chase & Co. | | 3.56 |
4. Philip Morris International, Inc. | | 2.73 |
5. Suncor Energy, Inc. | | 2.17 |
6. Chevron Corp. | | 2.15 |
7. Anthem, Inc. | | 2.03 |
8. Morgan Stanley | | 2.02 |
9. BP PLC, ADR | | 2.02 |
10. American International Group, Inc. | | 1.97 |
| | |
Total Net Assets | | $1.4 billion |
| |
Total Number of Holdings* | | 69 |
The Fund’s holdings are subject to change, and there is no assurance that the Fund will continue to hold any particular security.
*Excluding money market fund holdings, if any.
Data presented here are as of December 31, 2019.
Invesco V.I. Comstock Fund
Stock selection in the communication services sector also enhanced Fund performance relative to its style-specific benchmark.Charter Communicationswas a notable contributor to the sector, as investors were optimistic due to increased margins after the merger with Time Warner. Management also provided guidance on price increases which may help alleviate the negative effects of customer attrition.
On the negative side, the Fund’s allocation to cash, although only averaging 6% for the year, was a large detractor from Fund performance. We believe this should be expected in a strong equity market.
Stock selection in the consumer discretionary sector also detracted from Fund performance relative to its style-specific benchmark.CarnivalandGapwere two of the largest detractors in the sector. During the second quarter, the US government imposed new restrictions on travel to Cuba, essentially barring cruise operators from docking in the country. Carnival lowered its full year earnings guidance based on these developments, and shares declined accordingly.
Overweight exposure to energy stocks versus the style-specific benchmark was a large relative detractor from Fund performance during the year. Energy stocks underperformed during most of the year and was the worst performing sector in the Russell 1000 Value Index. Most of the Fund’s exposure to energy is in exploration and production and integrated oil and gas. Our long-term view on energy is that these companies continue to offer attractive valuations and improving prospects, as management continues to move towards a focus on profitability versus production growth.
We used currency forward contracts during the year for the purpose of hedging currency exposure of non-US-based companies held in the Fund. Derivatives were used solely for the purpose of hedging and not for speculative purposes or leverage. The use of currency forward contracts had a slightly negative impact on the Fund’s performance relative to the Russell 1000 Value Index for the year.
At the close of the year, the Fund was overweight the financials sector compared to its style-specific benchmark, as we have a favorable view of large banks within financials. We also maintain a constructive view on the long–term prospects for our energy holdings, as we believe supply and demand for oil should balance over time. The Fund’s exposure
to each sector has a higher beta3 than the style-specific benchmark. Therefore, the portfolio should be more sensitive to broad moves within these sectors for the foreseeable future.
Thank you for your investment in Invesco V.I. Comstock Fund and for sharing our long-term investment horizon.
| 1 | Source: US Federal Reserve |
| 2 | Source: Bureau of Economic Analysis |
| 3 | Beta is a measure of risk representing how a security is expected to respond to general market movements. |
Portfolio managers:
Devin Armstrong - Lead
Charles DyReyes
Kevin Holt - Lead
James (Jay) Warwick
The views and opinions expressed in management’s discussion of Fund performance are those of Invesco Advisers, Inc. These views and opinions are subject to change at any time based on factors such as market and economic conditions. These views and opinions may not be relied upon as investment advice or recommendations, or as an offer for a particular security. The information is not a complete analysis of every aspect of any market, country, industry, security or the Fund. Statements of fact are from sources considered reliable, but Invesco Advisers, Inc. makes no representation or warranty as to their completeness or accuracy. Although historical performance is no guarantee of future results, these insights may help you understand our investment management philosophy.
See important Fund and, if applicable, index disclosures later in this report.
Invesco V.I. Comstock Fund
Your Fund’s Long-Term Performance
Results of a $10,000 Investment – Oldest Share Class(es)
Fund and index data from 12/31/09
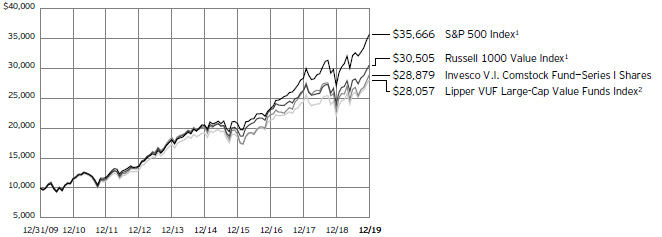
1 Source: RIMES Technologies Corp.
2 Source: Lipper Inc.
Past performance cannot guarantee future results.
| | | | |
Average Annual Total Returns | |
As of 12/31/19 | | | | |
| |
Series I Shares | | | | |
Inception (4/30/99) | | | 7.23 | % |
10 Years | | | 11.19 | |
5 Years | | | 7.42 | |
1 Year | | | 25.30 | |
| |
Series II Shares | | | | |
Inception (9/18/00) | | | 7.25 | % |
10 Years | | | 10.91 | |
5 Years | | | 7.15 | |
1 Year | | | 24.94 | |
Effective June 1, 2010, Class I and Class II shares of the predecessor fund, Van Kampen Life Investment Trust Comstock Portfolio, advised by Van Kampen Asset Management were reorganized into Series I and Series II shares, respectively, of Invesco Van Kampen V.I. Comstock Fund (renamed Invesco V.I. Comstock Fund on April 29, 2013). Returns shown above, prior to June 1, 2010, for Series I and Series II shares are blended returns of the predecessor fund and Invesco V.I. Comstock Fund. Share class returns will differ from the predecessor fund because of different expenses.
The performance data quoted represent past performance and cannot guarantee future results; current performance may be lower or higher. Please contact your variable product issuer or financial adviser for the most recent month-end variable product performance. Performance figures reflect Fund expenses, reinvested distributions and changes in net asset value.
Performance figures do not reflect deduction of taxes a shareholder would pay on Fund distributions or sale of Fund shares. Investment return and principal value will fluctuate so that you may have a gain or loss when you sell shares.
The total annual Fund operating expense ratio set forth in the most recent Fund prospectus as of the date of this report for Series I and Series II shares was 0.76% and 1.01%, respectively. The expense ratios presented above may vary from the expense ratios presented in other sections of this report that are based on expenses incurred during the period covered by this report.
Invesco V.I. Comstock Fund, a series portfolio of AIM Variable Insurance Funds (Invesco Variable Insurance Funds), is currently offered through insurance companies issuing variable products. You cannot purchase shares of the Fund directly. Performance figures given represent the Fund and are not intended to reflect actual variable product values. They do not reflect sales charges, expenses and fees assessed in connection with a variable product. Sales charges, expenses and fees, which are determined by the variable product issuers, will vary and will lower the total return.
The most recent month-end performance at the Fund level, excluding variable product charges, is available at 800 451 4246. As mentioned above, for the most recent month-end performance including variable product charges, please contact your variable product issuer or financial adviser.
Fund performance reflects any applicable fee waivers and/or expense reimbursements. Had the adviser not waived fees and/or reimbursed expenses currently or in the past, returns would have been lower. See current prospectus for more information.
Invesco V.I. Comstock Fund
Invesco V.I. Comstock Fund’s investment objective is to seek capital growth and income through investments in equity securities, including common stocks, preferred stocks and securities convertible into common and preferred stocks.
| ∎ | Unless otherwise stated, information presented in this report is as of December 31, 2019, and is based on total net assets. |
| ∎ | Unless otherwise noted, all data provided by Invesco. |
| ∎ | To access your Fund’s reports/prospectus, visit invesco.com/fundreports. |
About indexes used in this report
| ∎ | TheS&P 500® Indexis an unmanaged index considered representative of the US stock market. |
| ∎ | TheRussell 1000® Value Indexis an unmanaged index considered representative of large-cap value stocks. The Russell 1000 Value Index is a trademark/service mark of the Frank Russell Co. Russell® is a trademark of the Frank Russell Co. |
| ∎ | TheLipper VUF Large-Cap Value Funds Indexis an unmanaged index considered representative of large-cap value variable insurance underlying funds tracked by Lipper. |
| ∎ | The Fund is not managed to track the performance of any particular index, including the index(es) described here, and consequently, the performance of the Fund may deviate significantly from the performance of the index(es). |
| ∎ | A direct investment cannot be made in an index. Unless otherwise indicated, index results include reinvested dividends, and they do not reflect sales charges. Performance of the peer group, if applicable, reflects fund expenses; performance of a market index does not. |
Other information
| ∎ | The returns shown in management’s discussion of Fund performance are based on net asset values calculated for shareholder transactions. Generally accepted accounting principles require adjustments to be made to the net assets of the Fund at period end for financial reporting purposes, and as such, the net asset values for shareholder transactions and the returns based on those net asset values may differ from the net asset values and returns reported in the Financial Highlights. Additionally, the returns and net asset values shown throughout this report are at the Fund level only and do not include variable product issuer charges. If such charges were included, the total returns would be lower. |
| ∎ | Industry classifications used in this report are generally according to the Global Industry Classification Standard, |
| | which was developed by and is the exclusive property and a service mark of MSCI Inc. and Standard & Poor’s. |
Invesco V.I. Comstock Fund
Schedule of Investments(a)
December 31, 2019
| | | | | | | | |
| | | Shares | | | Value | |
| |
Common Stocks & Other Equity Interests–96.45% | |
|
Aerospace & Defense–1.14% | |
| | |
Textron, Inc. | | | 366,963 | | | $ | 16,366,550 | |
| |
|
Agricultural Products–1.38% | |
| | |
Archer-Daniels-Midland Co. | | | 429,158 | | | | 19,891,473 | |
| |
|
Apparel Retail–0.43% | |
| | |
Gap, Inc. (The) | | | 352,793 | | | | 6,237,380 | |
| |
|
Asset Management & Custody Banks–2.90% | |
| | |
Bank of New York Mellon Corp. (The) | | | 398,043 | | | | 20,033,504 | |
| |
State Street Corp. | | | 273,734 | | | | 21,652,360 | |
| |
| | | | 41,685,864 | |
| |
|
Automobile Manufacturers–1.95% | |
| | |
General Motors Co. | | | 767,308 | | | | 28,083,473 | |
| |
|
Automotive Retail–0.31% | |
| | |
Advance Auto Parts, Inc. | | | 28,056 | | | | 4,493,449 | |
| |
|
Biotechnology–1.18% | |
| | |
Gilead Sciences, Inc. | | | 262,128 | | | | 17,033,077 | |
| |
|
Broadcasting–0.61% | |
| | |
ViacomCBS, Inc., Class B | | | 209,177 | | | | 8,779,159 | |
| |
|
Building Products–1.49% | |
| | |
Johnson Controls International PLC | | | 526,851 | | | | 21,448,104 | |
| |
|
Cable & Satellite–2.64% | |
| | |
Charter Communications, Inc., Class A(b) | | | 43,667 | | | | 21,181,988 | |
| |
Comcast Corp., Class A | | | 375,233 | | | | 16,874,228 | |
| |
| | | | 38,056,216 | |
| |
|
Communications Equipment–1.61% | |
| | |
Cisco Systems, Inc. | | | 484,734 | | | | 23,247,843 | |
| |
|
Construction Machinery & Heavy Trucks–0.96% | |
| | |
Caterpillar, Inc. | | | 93,693 | | | | 13,836,582 | |
| |
|
Consumer Finance–0.64% | |
| | |
Ally Financial, Inc. | | | 303,317 | | | | 9,269,368 | |
| |
|
Diversified Banks–15.57% | |
| | |
Bank of America Corp. | | | 2,082,777 | | | | 73,355,406 | |
| |
Citigroup, Inc. | | | 961,068 | | | | 76,779,722 | |
| |
JPMorgan Chase & Co. | | | 368,024 | | | | 51,302,546 | |
| |
Wells Fargo & Co. | | | 422,135 | | | | 22,710,863 | |
| |
| | | | 224,148,537 | |
| |
|
Electrical Components & Equipment–3.12% | |
| | |
Eaton Corp. PLC | | | 253,531 | | | | 24,014,456 | |
| |
Emerson Electric Co. | | | 274,968 | | | | 20,969,060 | |
| |
| | | | 44,983,516 | |
| |
| | | | | | | | |
| | | Shares | | | Value | |
| |
Fertilizers & Agricultural Chemicals–2.02% | |
| | |
CF Industries Holdings, Inc. | | | 230,240 | | | $ | 10,991,658 | |
| |
Corteva, Inc. | | | 612,642 | | | | 18,109,697 | |
| |
| | | | 29,101,355 | |
| |
|
Health Care Distributors–1.66% | |
| | |
Cardinal Health, Inc. | | | 231,213 | | | | 11,694,754 | |
| |
McKesson Corp. | | | 88,169 | | | | 12,195,536 | |
| |
| | | | 23,890,290 | |
| |
|
Health Care Services–1.06% | |
| | |
CVS Health Corp. | | | 205,717 | | | | 15,282,716 | |
| |
|
Hotels, Resorts & Cruise Lines–1.91% | |
| | |
Carnival Corp. | | | 541,290 | | | | 27,513,771 | |
| |
|
Household Products–1.94% | |
| | |
Kimberly-Clark Corp. | | | 107,263 | | | | 14,754,025 | |
| |
Reckitt Benckiser Group PLC
(United Kingdom) | | | 162,151 | | | | 13,167,633 | |
| |
| | | | 27,921,658 | |
| |
|
Independent Power Producers & Energy Traders–0.47% | |
| | |
Vistra Energy Corp. | | | 296,138 | | | | 6,808,213 | |
| |
|
Industrial Conglomerates–1.07% | |
| | |
General Electric Co. | | | 1,376,970 | | | | 15,366,985 | |
| |
|
Industrial Machinery–0.89% | |
| | |
Ingersoll-Rand PLC | | | 96,543 | | | | 12,832,496 | |
| |
|
Integrated Oil & Gas–8.32% | |
| | |
BP PLC, ADR (United Kingdom) | | | 768,716 | | | | 29,011,342 | |
| |
Chevron Corp. | | | 256,868 | | | | 30,955,163 | |
| |
Exxon Mobil Corp. | | | 48,053 | | | | 3,353,138 | |
| |
Royal Dutch Shell PLC, Class A, ADR (United Kingdom) | | | 427,068 | | | | 25,188,471 | |
| |
Suncor Energy, Inc. (Canada) | | | 951,933 | | | | 31,223,402 | |
| |
| | | | 119,731,516 | |
| |
|
Integrated Telecommunication Services–1.66% | |
| | |
AT&T, Inc. | | | 611,302 | | | | 23,889,682 | |
| |
|
Internet & Direct Marketing Retail–1.25% | |
| | |
eBay, Inc. | | | 496,729 | | | | 17,936,884 | |
| |
|
Investment Banking & Brokerage–3.44% | |
| | |
Goldman Sachs Group, Inc. (The) | | | 88,640 | | | | 20,380,995 | |
| |
Morgan Stanley | | | 569,029 | | | | 29,088,763 | |
| |
| | | | 49,469,758 | |
| |
|
IT Consulting & Other Services–0.95% | |
| | |
Cognizant Technology Solutions Corp., Class A | | | 221,316 | | | | 13,726,018 | |
| |
Invesco V.I. Comstock Fund
| | | | | | | | |
| | | Shares | | | Value | |
| |
Life & Health Insurance–1.03% | |
| | |
MetLife, Inc. | | | 289,832 | | | $ | 14,772,737 | |
| |
|
Managed Health Care–2.03% | |
| | |
Anthem, Inc. | | | 96,675 | | | | 29,198,750 | |
| |
|
Multi-line Insurance–1.97% | |
| | |
American International Group, Inc. | | | 551,185 | | | | 28,292,326 | |
| |
|
Oil & Gas Exploration & Production–7.60% | |
| | |
Canadian Natural Resources Ltd. (Canada) | | | 542,279 | | | | 17,539,346 | |
| |
Devon Energy Corp. | | | 704,798 | | | | 18,303,604 | |
| |
Encana Corp. (Canada) | | | 2,131,359 | | | | 9,996,074 | |
| |
Hess Corp. | | | 308,278 | | | | 20,596,053 | |
| |
Marathon Oil Corp. | | | 1,699,347 | | | | 23,077,132 | |
| |
Noble Energy, Inc. | | | 598,739 | | | | 14,872,677 | |
| |
Pioneer Natural Resources Co. | | | 32,796 | | | | 4,964,331 | |
| |
| | | | 109,349,217 | |
| |
|
Paper Packaging–1.21% | |
| | |
International Paper Co. | | | 379,580 | | | | 17,479,659 | |
| |
|
Pharmaceuticals–5.33% | |
| | |
Allergan PLC | | | 75,429 | | | | 14,419,762 | |
| |
Bristol-Myers Squibb Co. | | | 328,888 | | | | 21,111,321 | |
| |
Mylan N.V.(b) | | | 445,043 | | | | 8,945,364 | |
| |
Novartis AG (Switzerland) | | | 77,925 | | | | 7,382,799 | |
| |
Sanofi, ADR (France) | | | 496,141 | | | | 24,906,278 | |
| |
| | | | 76,765,524 | |
| |
|
Property & Casualty Insurance–1.16% | |
| | |
Allstate Corp. (The) | | | 148,024 | | | | 16,645,299 | |
| |
|
Regional Banks–3.75% | |
| | |
Citizens Financial Group, Inc. | | | 471,899 | | | | 19,163,818 | |
| |
Fifth Third Bancorp | | | 646,947 | | | | 19,887,151 | |
| |
| | | | | | | | |
| | | Shares | | | Value | |
| |
Regional Banks–(continued) | |
| | |
PNC Financial Services Group, Inc. (The) | | | 93,301 | | | $ | 14,893,639 | |
| |
| | | | 53,944,608 | |
| |
|
Semiconductors–4.01% | |
| | |
Intel Corp. | | | 449,010 | | | | 26,873,248 | |
| |
NXP Semiconductors N.V. (Netherlands) | | | 55,780 | | | | 7,098,563 | |
| |
QUALCOMM, Inc. | | | 269,465 | | | | 23,774,897 | |
| |
| | | | 57,746,708 | |
| |
|
Systems Software–1.67% | |
| | |
Microsoft Corp. | | | 152,145 | | | | 23,993,266 | |
| |
|
Tobacco–3.54% | |
| | |
Altria Group, Inc. | | | 232,486 | | | | 11,603,376 | |
| |
Philip Morris International, Inc. | | | 462,774 | | | | 39,377,440 | |
| |
| | | | 50,980,816 | |
| |
|
Wireless Telecommunication Services–0.58% | |
| | |
Vodafone Group PLC
(United Kingdom) | | | 4,306,599 | | | | 8,360,710 | |
| |
Total Common Stocks & Other Equity Interests (Cost $1,136,938,996) | | | | 1,388,561,553 | |
| |
|
Money Market Funds–4.33% | |
| | |
Invesco Government & Agency Portfolio, Institutional Class, 1.50%(c) | | | 21,797,514 | | | | 21,797,514 | |
| |
Invesco Liquid Assets Portfolio, Institutional Class, 1.71%(c) | | | 15,597,356 | | | | 15,602,035 | |
| |
Invesco Treasury Portfolio, Institutional Class, 1.49%(c) | | | 24,911,444 | | | | 24,911,444 | |
| |
Total Money Market Funds
(Cost $62,310,993) | | | | 62,310,993 | |
| |
TOTAL INVESTMENTS IN
SECURITIES–100.78%
(Cost $1,199,249,989) | | | | 1,450,872,546 | |
| |
OTHER ASSETS LESS
LIABILITIES–(0.78)% | | | | (11,242,281 | ) |
| |
NET ASSETS–100.00% | | | $ | 1,439,630,265 | |
| |
Investment Abbreviations:
ADR – American Depositary Receipt
Notes to Schedule of Investments:
| (a) | Industry and/or sector classifications used in this report are generally according to the Global Industry Classification Standard, which was developed by and is the exclusive property and a service mark of MSCI Inc. and Standard & Poor’s. |
| (b) | Non-income producing security. |
| (c) | The money market fund and the Fund are affiliated by having the same investment adviser. The rate shown is the 7-day SEC standardized yield as of December 31, 2019. |
| | | | | | | | | | | | | | | | | | | | | | |
| Open Forward Foreign Currency Contracts | |
| | | | | | | | | | | | | | | | | Unrealized | |
| Settlement | | | | Contract to | | | Appreciation | |
| Date | | Counterparty | | Deliver | | | Receive | | | (Depreciation) | |
Currency Risk | | | | | | | | | | | | | | | | | | | | | | |
01/16/2020 | | Deutsche Bank AG | | | USD | | | | 628,764 | | | | GBP | | | | 474,723 | | | $ | 290 | |
01/16/2020 | | Goldman Sachs International | | | USD | | | | 810,162 | | | | GBP | | | | 617,394 | | | | 7,945 | |
01/16/2020 | | Royal Bank of Canada | | | USD | | | | 607,934 | | | | CAD | | | | 802,140 | | | | 9,838 | |
01/16/2020 | | Royal Bank of Canada | | | USD | | | | 103,175 | | | | CHF | | | | 101,692 | | | | 1,976 | |
01/16/2020 | | Royal Bank of Canada | | | USD | | | | 675,939 | | | | EUR | | | | 608,360 | | | | 7,010 | |
Subtotal–Appreciation | | | | | | | | | | | | | | | | | | | 27,059 | |
Invesco V.I. Comstock Fund
| | | | | | | | | | | | | | | | | | | | | | |
| Open Forward Foreign Currency Contracts–(continued) | |
| | | | | | | | | | | | | | | | | Unrealized | |
| Settlement | | | | Contract to | | | Appreciation | |
| Date | | Counterparty | | Deliver | | | Receive | | | (Depreciation) | |
| | | | | | |
Currency Risk | | | | | | | | | | | | | | | | | | | | | | |
01/16/2020 | | Canadian Imperial Bank of Commerce | | | CHF | | | | 74,808 | | | | USD | | | | 76,467 | | | | $ (885 | ) |
01/16/2020 | | Canadian Imperial Bank of Commerce | | | EUR | | | | 21,647,914 | | | | USD | | | | 23,935,297 | | | | (366,802 | ) |
01/16/2020 | | Goldman Sachs International | | | CAD | | | | 29,183,241 | | | | USD | | | | 21,957,558 | | | | (518,046 | ) |
01/16/2020 | | Goldman Sachs International | | | EUR | | | | 567,410 | | | | USD | | | | 633,952 | | | | (3,026 | ) |
01/16/2020 | | Goldman Sachs International | | | GBP | | | | 438,318 | | | | USD | | | | 575,989 | | | | (4,825 | ) |
01/16/2020 | | Royal Bank of Canada | | | CAD | | | | 3,330,518 | | | | USD | | | | 2,526,016 | | | | (38,999 | ) |
01/16/2020 | | Royal Bank of Canada | | | CHF | | | | 3,658,188 | | | | USD | | | | 3,682,128 | | | | (100,485 | ) |
01/16/2020 | | Royal Bank of Canada | | | EUR | | | | 762,088 | | | | USD | | | | 850,853 | | | | (4,672 | ) |
01/16/2020 | | Royal Bank of Canada | | | GBP | | | | 19,756,356 | | | | USD | | | | 25,600,124 | | | | (578,968 | ) |
Subtotal–Depreciation | | | | | | | | | | | | | | | | | | | (1,616,708 | ) |
Total Forward Foreign Currency Contracts | | | | | | | | | | | | | | | | | | | $ (1,589,649 | ) |
Abbreviations:
CAD – Canadian Dollar
CHF – Swiss Franc
EUR – Euro
GBP – British Pound Sterling
USD – U.S. Dollar
Invesco V.I. Comstock Fund
Statement of Assets and Liabilities
December 31, 2019
| | | | |
Assets: | | | | |
| |
Investments in securities, at value
(Cost $1,136,938,996) | | $ | 1,388,561,553 | |
Investments in affiliated money market funds, at value (Cost $62,310,993) | | | 62,310,993 | |
Other investments: | | | | |
Unrealized appreciation on forward foreign currency contracts outstanding | | | 27,059 | |
Foreign currencies, at value (Cost $512) | | | 518 | |
Receivable for: | | | | |
Fund shares sold | | | 17,046 | |
Dividends | | | 2,228,568 | |
Investment for trustee deferred compensation and retirement plans | | | 219,455 | |
Total assets | | | 1,453,365,192 | |
| |
Liabilities: | | | | |
| |
Other investments: | | | | |
Unrealized depreciation on forward foreign currency contracts outstanding | | | 1,616,708 | |
Payable for: | | | | |
Fund shares reacquired | | | 9,646,462 | |
Amount due custodian | | | 878,494 | |
Accrued fees to affiliates | | | 1,327,392 | |
Accrued trustees’ and officers’ fees and benefits | | | 555 | |
Accrued other operating expenses | | | 23,710 | |
Trustee deferred compensation and retirement plans | | | 241,606 | |
Total liabilities | | | 13,734,927 | |
Net assets applicable to shares outstanding | | $ | 1,439,630,265 | |
| |
Net assets consist of: | | | | |
| |
Shares of beneficial interest | | $ | 1,134,626,714 | |
Distributable earnings | | | 305,003,551 | |
| | | $ | 1,439,630,265 | |
| |
Net Assets: | | | | |
| |
Series I | | $ | 199,521,411 | |
Series II | | $ | 1,240,108,854 | |
|
Shares outstanding, no par value, with an unlimited number of shares authorized: | |
| |
Series I | | | 11,624,326 | |
Series II | | | 72,546,200 | |
Series I: | | | | |
Net asset value per share | | $ | 17.16 | |
Series II: | | | | |
Net asset value per share | | $ | 17.09 | |
Statement of Operations
For the year ended December 31, 2019
| | | | |
Investment income: | | | | |
| |
Dividends (net of foreign withholding taxes of $780,155) | | $ | 37,623,608 | |
| |
Dividends from affiliated money market funds | | | 1,580,111 | |
| |
Total investment income | | | 39,203,719 | |
| |
| |
Expenses: | | | | |
| |
Advisory fees | | | 7,880,253 | |
| |
Administrative services fees | | | 2,260,671 | |
| |
Custodian fees | | | 15,291 | |
| |
Distribution fees - Series II | | | 2,982,889 | |
| |
Transfer agent fees | | | 36,201 | |
| |
Trustees’ and officers’ fees and benefits | | | 37,485 | |
| |
Reports to shareholders | | | 5,326 | |
| |
Professional services fees | | | 45,987 | |
| |
Other | | | 17,628 | |
| |
Total expenses | | | 13,281,731 | |
| |
Less: Fees waived | | | (83,440 | ) |
| |
Net expenses | | | 13,198,291 | |
| |
Net investment income | | | 26,005,428 | |
| |
| |
Realized and unrealized gain (loss) from: | | | | |
| |
Net realized gain from: | | | | |
Investment securities | | | 40,447,364 | |
| |
Foreign currencies | | | 240,845 | |
| |
Forward foreign currency contracts | | | 1,422,429 | |
| |
| | | 42,110,638 | |
| |
Change in net unrealized appreciation (depreciation) of: | |
Investment securities | | | 239,469,341 | |
| |
Foreign currencies | | | 8,844 | |
| |
Forward foreign currency contracts | | | (1,373,453 | ) |
| |
| | | 238,104,732 | |
| |
Net realized and unrealized gain | | | 280,215,370 | |
| |
Net increase in net assets resulting from operations | | $ | 306,220,798 | |
| |
See accompanying Notes to Financial Statements which are an integral part of the financial statements.
Invesco V.I. Comstock Fund
Statement of Changes in Net Assets
For the years ended December 31, 2019 and 2018
| | | | | | | | |
| | | 2019 | | | 2018 | |
| |
Operations: | | | | | | | | |
| | |
Net investment income | | $ | 26,005,428 | | | $ | 23,660,844 | |
| |
Net realized gain | | | 42,110,638 | | | | 169,575,951 | |
| |
Change in net unrealized appreciation (depreciation) | | | 238,104,732 | | | | (378,547,863 | ) |
| |
Net increase (decrease) in net assets resulting from operations | | | 306,220,798 | | | | (185,311,068 | ) |
| |
| | |
Distributions to shareholders from distributable earnings: | | | | | | | | |
| | |
Series I | | | (27,866,941 | ) | | | (29,013,356 | ) |
| |
Series II | | | (173,615,673 | ) | | | (151,533,451 | ) |
| |
Total distributions from distributable earnings | | | (201,482,614 | ) | | | (180,546,807 | ) |
| |
| | |
Share transactions–net: | | | | | | | | |
| | |
Series I | | | (32,488,395 | ) | | | 1,540,438 | |
| |
Series II | | | 54,630,220 | | | | (236,864,144 | ) |
| |
Net increase (decrease) in net assets resulting from share transactions | | | 22,141,825 | | | | (235,323,706 | ) |
| |
Net increase (decrease) in net assets | | | 126,880,009 | | | | (601,181,581 | ) |
| |
| | |
Net assets: | | | | | | | | |
| | |
Beginning of year | | | 1,312,750,256 | | | | 1,913,931,837 | |
| |
End of year | | $ | 1,439,630,265 | | | $ | 1,312,750,256 | |
| |
See accompanying Notes to Financial Statements which are an integral part of the financial statements.
Invesco V.I. Comstock Fund
Financial Highlights
The following schedule presents financial highlights for a share of the Fund outstanding throughout the periods indicated.
| | | | | | | | | | | | | | | | | | | | | | | | | | | | | | | | | | | | | | | | | | | | | | | | | | | | | | | | | | | | | | | | | | | | | | |
| | | | | | | | | | | | | | | | | | | | | | | Ratio of | | Ratio of | | | | |
| | | | | | | | | | | | | | | | | | | | | | | expenses | | expenses | | | | |
| | | | | | | Net gains | | | | | | | | | | | | | | | | to average | | to average net | | | | |
| | | | | | | (losses) | | | | | | | | | | | | | | | | net assets | | assets without | | Ratio of net | | |
| | | Net asset | | | | on securities | | | | Dividends | | Distributions | | | | | | | | | | with fee waivers | | fee waivers | | investment | | |
| | | value, | | Net | | (both | | Total from | | from net | | from net | | | | Net asset | | | | Net assets, | | and/or | | and/or | | income | | |
| | | beginning | | investment | | realized and | | investment | | investment | | realized | | Total | | value, end | | Total | | end of period | | expenses | | expenses | | to average | | Portfolio |
| | | of period | | income(a) | | unrealized) | | operations | | income | | gains | | distributions | | of period | | return (b) | | (000’s omitted) | | absorbed | | absorbed | | net assets | | turnover (c) |
Series I | | | | | | | | | | | | | | | | | | | | | | | | | | | | | | | | | | | | | | | | | | | | | | | | | | | | | | | | | | | | | | | | | | | | | | |
Year ended 12/31/19 | | | $ | 16.12 | | | | $ | 0.37 | | | | $ | 3.45 | | | | $ | 3.82 | | | | $ | (0.37 | ) | | | $ | (2.41 | ) | | | $ | (2.78 | ) | | | $ | 17.16 | | | | | 25.30 | % | | | $ | 199,521 | | | | | 0.74 | %(d) | | | | 0.74 | %(d) | | | | 2.09 | %(d) | | | | 21 | % |
Year ended 12/31/18 | | | | 20.62 | | | | | 0.33 | | | | | (2.41 | ) | | | | (2.08 | ) | | | | (0.36 | ) | | | | (2.06 | ) | | | | (2.42 | ) | | | | 16.12 | | | | | (12.16 | ) | | | | 214,084 | | | | | 0.75 | | | | | 0.75 | | | | | 1.63 | | | | | 19 | |
Year ended 12/31/17 | | | | 18.69 | | | | | 0.28 | | | | | 2.94 | | | | | 3.22 | | | | | (0.44 | ) | | | | (0.85 | ) | | | | (1.29 | ) | | | | 20.62 | | | | | 17.85 | | | | | 270,651 | | | | | 0.75 | | | | | 0.75 | | | | | 1.47 | | | | | 13 | |
Year ended 12/31/16 | | | | 17.57 | | | | | 0.38 | | | | | 2.47 | | | | | 2.85 | | | | | (0.29 | ) | | | | (1.44 | ) | | | | (1.73 | ) | | | | 18.69 | | | | | 17.30 | | | | | 256,080 | | | | | 0.77 | | | | | 0.78 | | | | | 2.20 | | | | | 21 | |
Year ended 12/31/15 | | | | 19.16 | | | | | 0.28 | | | | | (1.45 | ) | | | | (1.17 | ) | | | | (0.37 | ) | | | | (0.05 | ) | | | | (0.42 | ) | | | | 17.57 | | | | | (5.98 | ) | | | | 332,411 | | | | | 0.78 | | | | | 0.83 | | | | | 1.52 | | | | | 16 | |
Series II | | | | | | | | | | | | | | | | | | | | | | | | | | | | | | | | | | | | | | | | | | | | | | | | | | | | | | | | | | | | | | | | | | | | | | |
Year ended 12/31/19 | | | | 16.06 | | | | | 0.32 | | | | | 3.44 | | | | | 3.76 | | | | | (0.32 | ) | | | | (2.41 | ) | | | | (2.73 | ) | | | | 17.09 | | | | | 24.94 | | | | | 1,240,109 | | | | | 0.99 | (d) | | | | 0.99 | (d) | | | | 1.84 | (d) | | | | 21 | |
Year ended 12/31/18 | | | | 20.54 | | | | | 0.28 | | | | | (2.40 | ) | | | | (2.12 | ) | | | | (0.30 | ) | | | | (2.06 | ) | | | | (2.36 | ) | | | | 16.06 | | | | | (12.37 | ) | | | | 1,098,666 | | | | | 1.00 | | | | | 1.00 | | | | | 1.38 | | | | | 19 | |
Year ended 12/31/17 | | | | 18.62 | | | | | 0.23 | | | | | 2.93 | | | | | 3.16 | | | | | (0.39 | ) | | | | (0.85 | ) | | | | (1.24 | ) | | | | 20.54 | | | | | 17.58 | | | | | 1,643,281 | | | | | 1.00 | | | | | 1.00 | | | | | 1.22 | | | | | 13 | |
Year ended 12/31/16 | | | | 17.51 | | | | | 0.34 | | | | | 2.45 | | | | | 2.79 | | | | | (0.24 | ) | | | | (1.44 | ) | | | | (1.68 | ) | | | | 18.62 | | | | | 16.99 | | | | | 1,679,769 | | | | | 1.02 | | | | | 1.03 | | | | | 1.95 | | | | | 21 | |
Year ended 12/31/15 | | | | 19.08 | | | | | 0.24 | | | | | (1.44 | ) | | | | (1.20 | ) | | | | (0.32 | ) | | | | (0.05 | ) | | | | (0.37 | ) | | | | 17.51 | | | | | (6.19 | ) | | | | 1,549,679 | | | | | 1.03 | | | | | 1.08 | | | | | 1.27 | | | | | 16 | |
| (a) | Calculated using average shares outstanding. |
| (b) | Includes adjustments in accordance with accounting principles generally accepted in the United States of America and as such, the net asset value for financial reporting purposes and the returns based upon those net asset values may differ from the net asset value and returns for shareholder transactions. Total returns are not annualized for periods less than one year, if applicable, and do not reflect charges assessed in connection with a variable product, which if included would reduce total returns. |
| (c) | Portfolio turnover is calculated at the fund level and is not annualized for periods less than one year, if applicable. |
| (d) | Ratios are based on average daily net assets (000’s omitted) of $194,472 and $1,192,847 for Series I and Series II shares, respectively. |
See accompanying Notes to Financial Statements which are an integral part of the financial statements.
Invesco V.I. Comstock Fund
Notes to Financial Statements
December 31, 2019
NOTE 1–Significant Accounting Policies
Invesco V.I. Comstock Fund (the “Fund”) is a series portfolio of AIM Variable Insurance Funds (Invesco Variable Insurance Funds) (the “Trust”). The Trust is a Delaware statutory trust registered under the Investment Company Act of 1940, as amended (the “1940 Act”), as an open-end series management investment company. Information presented in these financial statements pertains only to the Fund. Matters affecting the Fund or each class will be voted on exclusively by the shareholders of the Fund or each class. Current Securities and Exchange Commission (“SEC”) guidance, however, requires participating insurance companies offering separate accounts to vote shares proportionally in accordance with the instructions of the contract owners whose investments are funded by shares of each Fund or class.
The Fund’s investment objective is to seek capital growth and income through investments in equity securities, including common stocks, preferred stocks and securities convertible into common and preferred stocks.
The Fund currently offers two classes of shares, Series I and Series II, both of which are offered to insurance company separate accounts funding variable annuity contracts and variable life insurance policies (“variable products”).
The Fund is an investment company and accordingly follows the investment company accounting and reporting guidance in accordance with Financial Accounting Standards Board Accounting Standards Codification Topic 946,Financial Services - Investment Companies.
The following is a summary of the significant accounting policies followed by the Fund in the preparation of its financial statements.
| A. | Security Valuations– Securities, including restricted securities, are valued according to the following policy. |
A security listed or traded on an exchange (except convertible securities) is valued at its last sales price or official closing price as of the close of the customary trading session on the exchange where the security is principally traded, or lacking any sales or official closing price on a particular day, the security may be valued at the closing bid price on that day. Securities traded in the over-the-counter market are valued based on prices furnished by independent pricing services or market makers. When such securities are valued by an independent pricing service they may be considered fair valued. Futures contracts are valued at the final settlement price set by an exchange on which they are principally traded. Listed options are valued at the mean between the last bid and asked prices from the exchange on which they are principally traded. Options not listed on an exchange are valued by an independent source at the mean between the last bid and asked prices. For purposes of determining net asset value (“NAV”) per share, futures and option contracts generally are valued 15 minutes after the close of the customary trading session of the New York Stock Exchange (“NYSE”).
Investments in open-end and closed-end registered investment companies that do not trade on an exchange are valued at the end-of-day net asset value per share. Investments in open-end and closed-end registered investment companies that trade on an exchange are valued at the last sales price or official closing price as of the close of the customary trading session on the exchange where the security is principally traded.
Debt obligations (including convertible securities) and unlisted equities are fair valued using an evaluated quote provided by an independent pricing service. Evaluated quotes provided by the pricing service may be determined without exclusive reliance on quoted prices, and may reflect appropriate factors such as institution-size trading in similar groups of securities, developments related to specific securities, dividend rate (for unlisted equities), yield (for debt obligations), quality, type of issue, coupon rate (for debt obligations), maturity (for debt obligations), individual trading characteristics and other market data. Pricing services generally value debt obligations assuming orderly transactions of institutional round lot size, but a fund may hold or transact in the same securities in smaller, odd lot sizes. Odd lots often trade at lower prices than institutional round lots. Debt obligations are subject to interest rate and credit risks. In addition, all debt obligations involve some risk of default with respect to interest and/or principal payments.
Foreign securities’ (including foreign exchange contracts) prices are converted into U.S. dollar amounts using the applicable exchange rates as of the close of the NYSE. If market quotations are available and reliable for foreign exchange-traded equity securities, the securities will be valued at the market quotations. Because trading hours for certain foreign securities end before the close of the NYSE, closing market quotations may become unreliable. If between the time trading ends on a particular security and the close of the customary trading session on the NYSE, events occur that the investment adviser determines are significant and make the closing price unreliable, the Fund may fair value the security. If the event is likely to have affected the closing price of the security, the security will be valued at fair value in good faith using procedures approved by the Board of Trustees. Adjustments to closing prices to reflect fair value may also be based on a screening process of an independent pricing service to indicate the degree of certainty, based on historical data, that the closing price in the principal market where a foreign security trades is not the current value as of the close of the NYSE. Foreign securities’ prices meeting the approved degree of certainty that the price is not reflective of current value will be priced at the indication of fair value from the independent pricing service. Multiple factors may be considered by the independent pricing service in determining adjustments to reflect fair value and may include information relating to sector indices, American Depositary Receipts and domestic and foreign index futures. Foreign securities may have additional risks including exchange rate changes, potential for sharply devalued currencies and high inflation, political and economic upheaval, the relative lack of issuer information, relatively low market liquidity and the potential lack of strict financial and accounting controls and standards.
Securities for which market prices are not provided by any of the above methods may be valued based upon quotes furnished by independent sources. The last bid price may be used to value equity securities. The mean between the last bid and asked prices is used to value debt obligations, including corporate loans.
Securities for which market quotations are not readily available or became unreliable are valued at fair value as determined in good faith by or under the supervision of the Trust’s officers following procedures approved by the Board of Trustees. Issuer specific events, market trends, bid/asked quotes of brokers and information providers and other market data may be reviewed in the course of making a good faith determination of a security’s fair value.
The Fund may invest in securities that are subject to interest rate risk, meaning the risk that the prices will generally fall as interest rates rise and, conversely, the prices will generally rise as interest rates fall. Specific securities differ in their sensitivity to changes in interest rates depending on their individual characteristics. Changes in interest rates may result in increased market volatility, which may affect the value and/or liquidity of certain Fund investments.
Invesco V.I. Comstock Fund
Valuations change in response to many factors including the historical and prospective earnings of the issuer, the value of the issuer’s assets, general economic conditions, interest rates, investor perceptions and market liquidity. Because of the inherent uncertainties of valuation, the values reflected in the financial statements may materially differ from the value received upon actual sale of those investments.
| B. | Securities Transactions and Investment Income– Securities transactions are accounted for on a trade date basis. Realized gains or losses on sales are computed on the basis of specific identification of the securities sold. Interest income (net of withholding tax, if any) is recorded on the accrual basis from settlement date. Dividend income (net of withholding tax, if any) is recorded on the ex-dividend date. |
The Fund may periodically participate in litigation related to Fund investments. As such, the Fund may receive proceeds from litigation settlements. Any proceeds received are included in the Statement of Operations as realized gain (loss) for investments no longer held and as unrealized gain (loss) for investments still held.
Brokerage commissions and mark ups are considered transaction costs and are recorded as an increase to the cost basis of securities purchased and/or a reduction of proceeds on a sale of securities. Such transaction costs are included in the determination of net realized and unrealized gain (loss) from investment securities reported in the Statement of Operations and the Statement of Changes in Net Assets and the net realized and unrealized gains (losses) on securities per share in the Financial Highlights. Transaction costs are included in the calculation of the Fund’s net asset value and, accordingly, they reduce the Fund’s total returns. These transaction costs are not considered operating expenses and are not reflected in net investment income reported in the Statement of Operations and the Statement of Changes in Net Assets, or the net investment income per share and the ratios of expenses and net investment income reported in the Financial Highlights, nor are they limited by any expense limitation arrangements between the Fund and the investment adviser.
The Fund allocates income and realized and unrealized capital gains and losses to a class based on the relative net assets of each class.
| C. | Country Determination– For the purposes of making investment selection decisions and presentation in the Schedule of Investments, the investment adviser may determine the country in which an issuer is located and/or credit risk exposure based on various factors. These factors include the laws of the country under which the issuer is organized, where the issuer maintains a principal office, the country in which the issuer derives 50% or more of its total revenues and the country that has the primary market for the issuer’s securities, as well as other criteria. Among the other criteria that may be evaluated for making this determination are the country in which the issuer maintains 50% or more of its assets, the type of security, financial guarantees and enhancements, the nature of the collateral and the sponsor organization. Country of issuer and/or credit risk exposure has been determined to be the United States of America, unless otherwise noted. |
| D. | Distributions– Distributions from net investment income and net realized capital gain, if any, are generally declared and paid to separate accounts of participating insurance companies annually and recorded on the ex-dividend date. |
| E. | Federal Income Taxes – The Fund intends to comply with the requirements of Subchapter M of the Internal Revenue Code of 1986, as amended (the “Internal Revenue Code”), necessary to qualify as a regulated investment company and to distribute substantially all of the Fund’s taxable earnings to shareholders. As such, the Fund will not be subject to federal income taxes on otherwise taxable income (including net realized capital gain) that is distributed to shareholders. Therefore, no provision for federal income taxes is recorded in the financial statements. |
The Fund recognizes the tax benefits of uncertain tax positions only when the position is more likely than not to be sustained. Management has analyzed the Fund’s uncertain tax positions and concluded that no liability for unrecognized tax benefits should be recorded related to uncertain tax positions. Management is not aware of any tax positions for which it is reasonably possible that the total amounts of unrecognized tax benefits will change materially in the next 12 months.
The Fund files tax returns in the U.S. Federal jurisdiction and certain other jurisdictions. Generally, the Fund is subject to examinations by such taxing authorities for up to three years after the filing of the return for the tax period.
| F. | Expenses– Fees provided for under the Rule 12b-1 plan of a particular class of the Fund and which are directly attributable to that class are charged to the operations of such class. All other expenses are allocated among the classes based on relative net assets. |
| G. | Accounting Estimates –The preparation of financial statements in conformity with accounting principles generally accepted in the United States of America (“GAAP”) requires management to make estimates and assumptions that affect the reported amounts of assets and liabilities at the date of the financial statements and the reported amounts of revenues and expenses during the reporting period including estimates and assumptions related to taxation. Actual results could differ from those estimates by a significant amount. In addition, the Fund monitors for material events or transactions that may occur or become known after the period-end date and before the date the financial statements are released to print. |
| H. | Indemnifications– Under the Trust’s organizational documents, each Trustee, officer, employee or other agent of the Trust is indemnified against certain liabilities that may arise out of the performance of their duties to the Fund. Additionally, in the normal course of business, the Fund enters into contracts, including the Fund’s servicing agreements, that contain a variety of indemnification clauses. The Fund’s maximum exposure under these arrangements is unknown as this would involve future claims that may be made against the Fund that have not yet occurred. The risk of material loss as a result of such indemnification claims is considered remote. |
| I. | Foreign Currency Translations– Foreign currency is valued at the close of the NYSE based on quotations posted by banks and major currency dealers. Portfolio securities and other assets and liabilities denominated in foreign currencies are translated into U.S. dollar amounts at the date of valuation. Purchases and sales of portfolio securities (net of foreign taxes withheld on disposition) and income items denominated in foreign currencies are translated into U.S. dollar amounts on the respective dates of such transactions. The Fund does not separately account for the portion of the results of operations resulting from changes in foreign exchange rates on investments and the fluctuations arising from changes in market prices of securities held. The combined results of changes in foreign exchange rates and the fluctuation of market prices on investments (net of estimated foreign tax withholding) are included with the net realized and unrealized gain or loss from investments in the Statement of Operations. Reported net realized foreign currency gains or losses arise from (1) sales of foreign currencies, (2) currency gains or losses realized between the trade and settlement dates on securities transactions, and (3) the difference between the amounts of dividends, interest, and foreign withholding taxes recorded on the Fund’s books and the U.S. dollar equivalent of the amounts actually received or paid. Net unrealized foreign currency gains and losses arise from changes in the fair values of assets and liabilities, other than investments in securities at fiscal period end, resulting from changes in exchange rates. |
The Fund may invest in foreign securities, which may be subject to foreign taxes on income, gains on investments or currency repatriation, a portion of which may be recoverable. Foreign taxes, if any, are recorded based on the tax regulations and rates that exist in the foreign markets in which the Fund invests and are shown in the Statement of Operations.
Invesco V.I. Comstock Fund
| J. | Forward Foreign Currency Contracts– The Fund may engage in foreign currency transactions either on a spot (i.e. for prompt delivery and settlement) basis, or through forward foreign currency contracts, to manage or minimize currency or exchange rate risk. |
The Fund may also enter into forward foreign currency contracts for the purchase or sale of a security denominated in a foreign currency in order to “lock in” the U.S. dollar price of that security, or the Fund may also enter into forward foreign currency contracts that do not provide for physical settlement of the two currencies, but instead are settled by a single cash payment calculated as the difference between the agreed upon exchange rate and the spot rate at settlement based upon an agreed upon notional amount (non-deliverable forwards). The Fund will set aside liquid assets in an amount equal to the daily mark-to-market obligation for forward foreign currency contracts.
A forward foreign currency contract is an obligation between two parties (“Counterparties”) to purchase or sell a specific currency for an agreed-upon price at a future date. The use of forward foreign currency contracts does not eliminate fluctuations in the price of the underlying securities the Fund owns or intends to acquire but establishes a rate of exchange in advance. Fluctuations in the value of these contracts are measured by the difference in the contract date and reporting date exchange rates and are recorded as unrealized appreciation (depreciation) until the contracts are closed. When the contracts are closed, realized gains (losses) are recorded. Realized and unrealized gains (losses) on the contracts are included in the Statement of Operations. The primary risks associated with forward foreign currency contracts include failure of the Counterparty to meet the terms of the contract and the value of the foreign currency changing unfavorably. These risks may be in excess of the amounts reflected in the Statement of Assets and Liabilities.
NOTE 2–Advisory Fees and Other Fees Paid to Affiliates
The Trust has entered into a master investment advisory agreement with Invesco Advisers, Inc. (the “Adviser” or “Invesco”). Under the terms of the investment advisory agreement, the Fund accrues daily and pays monthly an advisory fee to the Adviser based on the annual rate of the Fund’s average daily net assets as follows:
| | | | |
| Average Daily Net Assets | | Rate | |
First $ 500 million | | | 0.600 | % |
Next $500 million | | | 0.550 | % |
For the year ended December 31, 2019, the effective advisory fee rate incurred by the Fund was 0.57%.
Under the terms of a master sub-advisory agreement between the Adviser and each of Invesco Asset Management Deutschland GmbH, Invesco Asset Management Limited, Invesco Asset Management (Japan) Limited, Invesco Hong Kong Limited, Invesco Senior Secured Management, Inc. and Invesco Canada Ltd. and separate sub-advisory agreements with Invesco Capital Management LLC and Invesco Asset Management (India) Private Limited (collectively, the “Affiliated Sub-Advisers”) the Adviser, not the Fund, will pay 40% of the fees paid to the Adviser to any such Affiliated Sub-Adviser(s) that provide(s) discretionary investment management services to the Fund based on the percentage of assets allocated to such Affiliated Sub-Adviser(s).
The Adviser has contractually agreed, through at least April 30, 2021, to waive advisory fees and/or reimburse expenses of all shares to the extent necessary to limit total annual fund operating expenses after fee waiver and/or expense reimbursement (excluding certain items discussed below) of Series I shares to 0.78% and Series II shares to 1.03% of average daily net assets (the “expense limits”). In determining the Adviser’s obligation to waive advisory fees and/or reimburse expenses, the following expenses are not taken into account, and could cause the total annual fund operating expenses after fee waiver and/or expense reimbursement to exceed the numbers reflected above: (1) interest; (2) taxes; (3) dividend expense on short sales; (4) extraordinary or non-routine items, including litigation expenses; and (5) expenses that the Fund has incurred but did not actually pay because of an expense offset arrangement. Unless Invesco continues the fee waiver agreement, it will terminate on April 30, 2021. During its term, the fee waiver agreement cannot be terminated or amended to increase the expense limits or reduce the advisory fee waiver without approval of the Board of Trustees. The Adviser did not waive fees and/or reimburse expenses during the period under these expense limits.
Further, the Adviser has contractually agreed, through at least June 30, 2021, to waive the advisory fee payable by the Fund in an amount equal to 100% of the net advisory fees the Adviser receives from the affiliated money market funds on investments by the Fund of uninvested cash in such affiliated money market funds.
For the year ended December 31, 2019, the Adviser waived advisory fees of $83,440.
The Trust has entered into a master administrative services agreement with Invesco pursuant to which the Fund has agreed to pay Invesco a fee for costs incurred in providing accounting services and fund administrative services to the Fund and to reimburse Invesco for fees paid to insurance companies that have agreed to provide certain administrative services to the Fund. These administrative services provided by the insurance companies may include, among other things: maintenance of master accounts with the Fund; tracking, recording and transmitting net purchase and redemption orders for Fund shares; maintaining and preserving records related to the purchase, redemption and other account activity of variable product owners; distributing copies of Fund documents such as prospectuses, proxy materials and periodic reports, to variable product owners, and responding to inquiries from variable product owners about the Fund. Pursuant to such agreement, for the year ended December 31, 2019, Invesco was paid $195,367 for accounting and fund administrative services and was reimbursed $2,065,304 for fees paid to insurance companies. Invesco has entered into a sub-administration agreement whereby State Street Bank and Trust Company (“SSB”) serves as fund accountant and provides certain administrative services to the Fund. Pursuant to a custody agreement with the Trust on behalf of the Fund, SSB also serves as the Fund’s custodian.
The Trust has entered into a transfer agency and service agreement with Invesco Investment Services, Inc. (“IIS”) pursuant to which the Fund has agreed to pay IIS a fee for providing transfer agency and shareholder services to the Fund and reimburse IIS for certain expenses incurred by IIS in the course of providing such services. IIS may make payments to intermediaries that provide omnibus account services, sub-accounting services and/or networking services. All fees payable by IIS to intermediaries that provide omnibus account services or sub-accounting services are charged back to the Fund, subject to certain limitations approved by the Trust’s Board of Trustees. For the year ended December 31, 2019, expenses incurred under the agreement are shown in the Statement of Operations asTransfer agent fees.
The Trust has entered into a master distribution agreement with Invesco Distributors, Inc. (“IDI”) to serve as the distributor for the Fund. The Trust has adopted a plan pursuant to Rule 12b-1 under the 1940 Act with respect to the Fund’s Series II shares (the “Plan”). The Fund, pursuant to the Plan, pays IDI compensation at the annual rate of 0.25% of the Fund’s average daily net assets of Series II shares. The fees are accrued daily and paid monthly. Of the Plan payments, up to 0.25% of the average daily net assets of the Series II shares may be paid to insurance companies who furnish
Invesco V.I. Comstock Fund
continuing personal shareholder services to customers who purchase and own Series II shares of the Fund. For the year ended December 31, 2019, expenses incurred under the Plan are detailed in the Statement of Operations asDistribution fees.
For the year ended December 31, 2019, the Fund incurred $16,621 in brokerage commissions with Invesco Capital Markets, Inc., an affiliate of the Adviser and IDI, for portfolio transactions executed on behalf of the Fund.
Certain officers and trustees of the Trust are officers and directors of the Adviser, IIS and/or IDI.
NOTE 3–Additional Valuation Information
GAAP defines fair value as the price that would be received to sell an asset or paid to transfer a liability in an orderly transaction between market participants at the measurement date, under current market conditions. GAAP establishes a hierarchy that prioritizes the inputs to valuation methods, giving the highest priority to readily available unadjusted quoted prices in an active market for identical assets (Level 1) and the lowest priority to significant unobservable inputs (Level 3), generally when market prices are not readily available or are unreliable. Based on the valuation inputs, the securities or other investments are tiered into one of three levels. Changes in valuation methods may result in transfers in or out of an investment’s assigned level:
| | Level 1 - | Prices are determined using quoted prices in an active market for identical assets. |
| | Level 2 - | Prices are determined using other significant observable inputs. Observable inputs are inputs that other market participants may use in pricing a security. These may include quoted prices for similar securities, interest rates, prepayment speeds, credit risk, yield curves, loss severities, default rates, discount rates, volatilities and others. |
| | Level 3 - | Prices are determined using significant unobservable inputs. In situations where quoted prices or observable inputs are unavailable (for example, when there is little or no market activity for an investment at the end of the period), unobservable inputs may be used. Unobservable inputs reflect the Fund’s own assumptions about the factors market participants would use in determining fair value of the securities or instruments and would be based on the best available information. |
The following is a summary of the tiered valuation input levels, as of December 31, 2019. The level assigned to the securities valuations may not be an indication of the risk or liquidity associated with investing in those securities. Because of the inherent uncertainties of valuation, the values reflected in the financial statements may materially differ from the value received upon actual sale of those investments.
| | | | | | | | | | | | | | | | |
| | | Level 1 | | | Level 2 | | | Level 3 | | | Total | |
| |
Investments in Securities | | | | | | | | | | | | | | | | |
| |
Common Stocks & Other Equity Interests | | $ | 1,359,650,411 | | | $ | 28,911,142 | | | | $– | | | $ | 1,388,561,553 | |
| |
Money Market Funds | | | 62,310,993 | | | | – | | | | – | | | | 62,310,993 | |
| |
Total Investments in Securities | | | 1,421,961,404 | | | | 28,911,142 | | | | – | | | | 1,450,872,546 | |
| |
| | | | |
Other Investments - Assets* | | | | | | | | | | | | | | | | |
| |
Forward Foreign Currency Contracts | | | – | | | | 27,059 | | | | – | | | | 27,059 | |
| |
| | | | |
Other Investments - Liabilities* | | | | | | | | | | | | | | | | |
| |
Forward Foreign Currency Contracts | | | – | | | | (1,616,708 | ) | | | – | | | | (1,616,708 | ) |
| |
Total Other Investments | | | – | | | | (1,589,649 | ) | | | – | | | | (1,589,649 | ) |
| |
Total Investments | | $ | 1,421,961,404 | | | $ | 27,321,493 | | | | $– | | | $ | 1,449,282,897 | |
| |
| * | Unrealized appreciation (depreciation). |
NOTE 4–Derivative Investments
The Fund may enter into an International Swaps and Derivatives Association Master Agreement (“ISDA Master Agreement”) under which a fund may trade OTC derivatives. An OTC transaction entered into under an ISDA Master Agreement typically involves a collateral posting arrangement, payment netting provisions and close-out netting provisions. These netting provisions allow for reduction of credit risk through netting of contractual obligations. The enforceability of the netting provisions of the ISDA Master Agreement depends on the governing law of the ISDA Master Agreement, among other factors.
For financial reporting purposes, the Fund does not offset OTC derivative assets or liabilities that are subject to ISDA Master Agreements in the Statement of Assets and Liabilities.
Value of Derivative Investments at Period-End
The table below summarizes the value of the Fund’s derivative investments, detailed by primary risk exposure, held as of December 31, 2019:
| | | | |
| | | Value | |
| | | Currency | |
| Derivative Assets | | Risk | |
Unrealized appreciation on forward foreign currency contracts outstanding | | $ | 27,059 | |
Derivatives not subject to master netting agreements | | | - | |
Total Derivative Assets subject to master netting agreements | | $ | 27,059 | |
Invesco V.I. Comstock Fund
| | | | |
| | | Value | |
| | | Currency | |
| Derivative Liabilities | | Risk | |
| |
Unrealized depreciation on forward foreign currency contracts outstanding | | $ | (1,616,708 | ) |
| |
Derivatives not subject to master netting agreements | | | - | |
| |
Total Derivative Liabilities subject to master netting agreements | | $ | (1,616,708 | ) |
| |
Offsetting Assets and Liabilities
The table below reflects the Fund’s exposure to Counterparties subject to either an ISDA Master Agreement or other agreement for OTC derivative transactions as of December 31, 2019.
| | | | | | | | | | | | | | | | | | |
| | | Financial | | | Financial | | | | | | | | | | |
| | | Derivative | | | Derivative | | | | | Collateral | | | |
| | | Assets | | | Liabilities | | | | | (Received)/Pledged | | | |
| | | Forward Foreign | | | Forward Foreign | | Net Value of | | | | | | | Net | |
| Counterparty | | Currency Contracts | | | Currency Contracts | | Derivatives | | | Non-Cash | | Cash | | Amount | |
| |
Canadian Imperial Bank of Commerce | | | $ – | | | $(367,687) | | | $ (367,687 | ) | | $– | | $– | | | $ (367,687 | ) |
| |
Deutsche Bank AG | | | 290 | | | – | | | 290 | | | – | | – | | | 290 | |
| |
Goldman Sachs International | | | 7,945 | | | (525,897) | | | (517,952 | ) | | – | | – | | | (517,952 | ) |
| |
Royal Bank of Canada | | | 18,824 | | | (723,124) | | | (704,300 | ) | | – | | – | | | (704,300 | ) |
| |
Total | | | $27,059 | | | $(1,616,708) | | | $(1,589,649 | ) | | $– | | $– | | | $(1,589,649 | ) |
| |
Effect of Derivative Investments for the year ended December 31, 2019
The table below summarizes the gains (losses) on derivative investments, detailed by primary risk exposure, recognized in earnings during the period:
| | | | |
| | | Location of Gain (Loss) on | |
| | | Statement of Operations | |
| | | Currency | |
| | | Risk | |
| |
Realized Gain: | | | | |
Forward foreign currency contracts | | | $ 1,422,429 | |
| |
Change in Net Unrealized Appreciation (Depreciation): | | | | |
Forward foreign currency contracts | | | (1,373,453) | |
| |
Total | | | $ 48,976 | |
| |
The table below summarizes the average notional value of derivatives held during the period.
| | | | |
| | | Forward | |
| | | Foreign Currency | |
| | | Contracts | |
Average notional value | | | $111,199,656 | |
NOTE 5–Trustees’ and Officers’ Fees and Benefits
Trustees’ and Officers’ Fees and Benefits include amounts accrued by the Fund to pay remuneration to certain Trustees and Officers of the Fund. Trustees have the option to defer compensation payable by the Fund, andTrustees’ and Officers’ Fees and Benefits also include amounts accrued by the Fund to fund such deferred compensation amounts. Those Trustees who defer compensation have the option to select various Invesco Funds in which their deferral accounts shall be deemed to be invested. Finally, certain current Trustees were eligible to participate in a retirement plan that provided for benefits to be paid upon retirement to Trustees over a period of time based on the number of years of service. The Fund may have certain former Trustees who also participate in a retirement plan and receive benefits under such plan.Trustees’ and Officers’ Fees and Benefits include amounts accrued by the Fund to fund such retirement benefits. Obligations under the deferred compensation and retirement plans represent unsecured claims against the general assets of the Fund.
NOTE 6–Cash Balances
The Fund is permitted to temporarily carry a negative or overdrawn balance in its account with SSB, the custodian bank. Such balances, if any at period-end, are shown in the Statement of Assets and Liabilities under the payable caption Amount due custodian. To compensate the custodian bank for such overdrafts, the overdrawn Fund may either (1) leave funds as a compensating balance in the account so the custodian bank can be compensated by earning the additional interest; or (2) compensate by paying the custodian bank at a rate agreed upon by the custodian bank and Invesco, not to exceed the contractually agreed upon rate.
Invesco V.I. Comstock Fund
NOTE 7–Distributions to Shareholders and Tax Components of Net Assets
Tax Character of Distributions to Shareholders Paid During the Fiscal Years Ended December 31, 2019 and 2018:
| | | | | | | | |
| | | 2019 | | | 2018 | |
Ordinary income | | $ | 35,243,443 | | | $ | 23,575,887 | |
Long-term capital gain | | | 166,239,171 | | | | 156,970,920 | |
Total distributions | | $ | 201,482,614 | | | $ | 180,546,807 | |
Tax Components of Net Assets at Period-End:
| | | | |
| | | 2019 | |
| |
Undistributed ordinary income | | $ | 26,301,607 | |
| |
Undistributed long-term capital gain | | | 32,144,715 | |
| |
Net unrealized appreciation – investments | | | 246,738,371 | |
| |
Net unrealized appreciation - foreign currencies | | | 6,015 | |
| |
Temporary book/tax differences | | | (187,157 | ) |
| |
Shares of beneficial interest | | | 1,134,626,714 | |
| |
Total net assets | | $ | 1,439,630,265 | |
| |
The difference between book-basis and tax-basis unrealized appreciation (depreciation) is due to differences in the timing of recognition of gains and losses on investments for tax and book purposes. The Fund’s net unrealized appreciation (depreciation) difference is attributable primarily to wash sales and forward foreign currency contracts.
The temporary book/tax differences are a result of timing differences between book and tax recognition of income and/or expenses. The Fund’s temporary book/tax differences are the result of the trustee deferral of compensation and retirement plan benefits.
Capital loss carryforward is calculated and reported as of a specific date. Results of transactions and other activity after that date may affect the amount of capital loss carryforward actually available for the Fund to utilize. Capital losses generated in years beginning after December 22, 2010 can be carried forward for an unlimited period, whereas previous losses expire in eight tax years. Capital losses with an expiration period may not be used to offset capital gains until all net capital losses without an expiration date have been utilized. Capital loss carryforwards with no expiration date will retain their character as either short-term or long-term capital losses instead of as short-term capital losses as under prior law. The ability to utilize capital loss carryforwards in the future may be limited under the Internal Revenue Code and related regulations based on the results of future transactions.
The Fund does not have a capital loss carryforward as of December 31, 2019.
NOTE 8–Investment Transactions
The aggregate amount of investment securities (other than short-term securities, U.S. Treasury obligations and money market funds, if any) purchased and sold by the Fund during the year ended December 31, 2019 was $277,726,126 and $387,879,431, respectively. Cost of investments, including any derivatives, on a tax basis includes the adjustments for financial reporting purposes as of the most recently completed federal income tax reporting period-end.
Unrealized Appreciation (Depreciation) of Investments on a Tax Basis
| | | | |
| |
Aggregate unrealized appreciation of investments | | $ | 327,427,848 | |
| |
Aggregate unrealized (depreciation) of investments | | | (80,689,477 | ) |
| |
Net unrealized appreciation of investments | | $ | 246,738,371 | |
| |
Cost of investments for tax purposes is $1,202,544,526.
NOTE 9–Reclassification of Permanent Differences
Primarily as a result of differing book/tax treatment of foreign currency transactions, on December 31, 2019, undistributed net investment income was increased by $487,308 and undistributed net realized gain was decreased by $487,308. This reclassification had no effect on the net assets or the distributable earnings of the Fund.
NOTE 10–Share Information
| | | | | | | | | | | | | | | | |
| | | Summary of Share Activity | |
| |
| | | Year ended | | | Year ended | |
| | | December 31, 2019(a) | | | December 31, 2018 | |
| | | | | | | | |
| | | Shares | | | Amount | | | Shares | | | Amount | |
| |
Sold: | | | | | | | | | | | | | | | | |
| | | | |
Series I | | | 531,077 | | | $ | 9,046,219 | | | | 899,651 | | | $ | 17,343,797 | |
| |
Series II | | | 6,503,571 | | | | 116,600,521 | | | | 3,163,658 | | | | 57,343,771 | |
| |
Invesco V.I. Comstock Fund
| | | | | | | | | | | | | | | | |
| | | Summary of Share Activity | |
| |
| | | Year ended | | | Year ended | |
| | | December 31, 2019(a) | | | December 31, 2018 | |
| | | | | | | | |
| | | Shares | | | Amount | | | Shares | | | Amount | |
| |
| | | | |
Issued as reinvestment of dividends: | | | | | | | | | | | | | | | | |
| | | | |
Series I | | | 1,776,096 | | | $ | 27,866,941 | | | | 1,479,518 | | | $ | 29,013,356 | |
| |
Series II | | | 11,100,746 | | | | 173,615,673 | | | | 7,755,038 | | | | 151,533,451 | |
| |
| | | | |
Reacquired: | | | | | | | | | | | | | | | | |
| | | | |
Series I | | | (3,961,633 | ) | | | (69,401,555 | ) | | | (2,224,115 | ) | | | (44,816,715 | ) |
| |
Series II | | | (13,487,073 | ) | | | (235,585,974 | ) | | | (22,497,477 | ) | | | (445,741,366 | ) |
| |
Net increase (decrease) in share activity | | | 2,462,784 | | | $ | 22,141,825 | | | | (11,423,727 | ) | | $ | (235,323,706 | ) |
| |
| (a) | There are entities that are record owners of more than 5% of the outstanding shares of the Fund and in the aggregate own 66% of the outstanding shares of the Fund. The Fund and the Fund’s principal underwriter or adviser, are parties to participation agreements with these entities whereby these entities sell units of interest in separate accounts funding variable products that are invested in the Fund. The Fund, Invesco and/or Invesco affiliates may make payments to these entities, which are considered to be related to the Fund, for providing services to the Fund, Invesco and/or Invesco affiliates including but not limited to services such as, securities brokerage, third party record keeping and account servicing and administrative services. The Fund has no knowledge as to whether all or any portion of the shares owned of record by these entities are also owned beneficially. |
Invesco V.I. Comstock Fund
Report of Independent Registered Public Accounting Firm
To the Board of Trustees of AIM Variable Insurance Funds (Invesco Variable Insurance Funds) and Shareholders of Invesco V.I. Comstock Fund
Opinion on the Financial Statements
We have audited the accompanying statement of assets and liabilities, including the schedule of investments, of Invesco V.I. Comstock Fund (one of the funds constituting AIM Variable Insurance Funds (Invesco Variable Insurance Funds), referred to hereafter as the “Fund”) as of December 31, 2019, the related statement of operations for the year ended December 31, 2019, the statement of changes in net assets for each of the two years in the period ended December 31, 2019, including the related notes, and the financial highlights for each of the five years in the period ended December 31, 2019 (collectively referred to as the “financial statements”). In our opinion, the financial statements present fairly, in all material respects, the financial position of the Fund as of December 31, 2019, the results of its operations for the year then ended, the changes in its net assets for each of the two years in the period ended December 31, 2019 and the financial highlights for each of the five years in the period ended December 31, 2019 in conformity with accounting principles generally accepted in the United States of America.
Basis for Opinion
These financial statements are the responsibility of the Fund’s management. Our responsibility is to express an opinion on the Fund’s financial statements based on our audits. We are a public accounting firm registered with the Public Company Accounting Oversight Board (United States) (PCAOB) and are required to be independent with respect to the Fund in accordance with the U.S. federal securities laws and the applicable rules and regulations of the Securities and Exchange Commission and the PCAOB.
We conducted our audits of these financial statements in accordance with the standards of the PCAOB. Those standards require that we plan and perform the audit to obtain reasonable assurance about whether the financial statements are free of material misstatement, whether due to error or fraud.
Our audits included performing procedures to assess the risks of material misstatement of the financial statements, whether due to error or fraud, and performing procedures that respond to those risks. Such procedures included examining, on a test basis, evidence regarding the amounts and disclosures in the financial statements. Our audits also included evaluating the accounting principles used and significant estimates made by management, as well as evaluating the overall presentation of the financial statements. Our procedures included confirmation of securities owned as of December 31, 2019 by correspondence with the custodian, transfer agent and brokers; when replies were not received from brokers, we performed other auditing procedures. We believe that our audits provide a reasonable basis for our opinion.
/s/PricewaterhouseCoopers LLP
Houston, Texas
February 18, 2020
We have served as the auditor of one or more of the investment companies in the Invesco group of investment companies since at least 1995. We have not been able to determine the specific year we began serving as auditor.
Invesco V.I. Comstock Fund
Calculating your ongoing Fund expenses
Example
As a shareholder of the Fund, you incur two types of costs: (1) transaction costs, which may include sales charges (loads) on purchase payments or contingent deferred sales charges on redemptions, if any; and (2) ongoing costs, including management fees, distribution and/or service (12b-1) fees, and other Fund expenses. This example is intended to help you understand your ongoing costs (in dollars) of investing in the Fund and to compare these costs with ongoing costs of investing in other mutual funds. The example is based on an investment of $1,000 invested at the beginning of the period and held for the entire period July 1, 2019 through December 31, 2019.
Actual expenses
The table below provides information about actual account values and actual expenses. You may use the information in this table, together with the amount you invested, to estimate the expenses that you paid over the period. Simply divide your account value by $1,000 (for example, an $8,600 account value divided by $1,000 = 8.6), then multiply the result by the number in the table under the heading entitled “Actual Expenses Paid During Period” to estimate the expenses you paid on your account during this period.
Hypothetical example for comparison purposes
The table below also provides information about hypothetical account values and hypothetical expenses based on the Fund’s actual expense ratio and an assumed rate of return of 5% per year before expenses, which is not the Fund’s actual return.
The hypothetical account values and expenses may not be used to estimate the actual ending account balance or expenses you paid for the period. You may use this information to compare the ongoing costs of investing in the Fund and other funds. To do so, compare this 5% hypothetical example with the 5% hypothetical examples that appear in the shareholder reports of the other funds.
Please note that the expenses shown in the table are meant to highlight your ongoing costs only and do not reflect any transaction costs, such as sales charges (loads) on purchase payments or contingent deferred sales charges on redemptions, if any. Therefore, the hypothetical information is useful in comparing ongoing costs only, and will not help you determine the relative total costs of owning different funds. In addition, if these transaction costs were included, your costs would have been higher.
| | | | | | | | | | | | |
| | | Beginning
Account Value
(07/01/19) | | ACTUAL | | HYPOTHETICAL
(5% annual return before expenses) | | Annualized
Expense
Ratio |
| | Ending
Account Value
(12/31/19)1 | | Expenses
Paid During
Period2 | | Ending
Account Value
(12/31/19) | | Expenses
Paid During
Period2 |
Series I | | $1,000.00 | | $1,090.00 | | $3.90 | | $1,021.48 | | $3.77 | | 0.74% |
Series II | | 1,000.00 | | 1,088.70 | | 5.21 | | 1,020.21 | | 5.04 | | 0.99 |
| 1 | The actual ending account value is based on the actual total return of the Fund for the period July 1, 2019 through December 31, 2019, after actual expenses and will differ from the hypothetical ending account value which is based on the Fund’s expense ratio and a hypothetical annual return of 5% before expenses. |
| 2 | Expenses are equal to the Fund’s annualized expense ratio as indicated above multiplied by the average account value over the period, multiplied by 184/365 to reflect the most recent fiscal half year. |
Invesco V.I. Comstock Fund
Tax Information
Form 1099-DIV, Form 1042-S and other year-end tax information provide shareholders with actual calendar year amounts that should be included in their tax returns. Shareholders should consult their tax advisers.
The following distribution information is being provided as required by the Internal Revenue Code or to meet a specific state’s requirement.
The Fund designates the following amounts or, if subsequently determined to be different, the maximum amount allowable for its fiscal year ended December 31, 2019:
| | | | | | | | |
| | Federal and State Income Tax | | | | | | |
| | Long-term Capital Gain Distribution | | $ | 166,239,171 | | | |
| | Corporate Dividends Received Deduction* | | | 78.63 | % | | |
| | U.S. Treasury Obligations* | | | 0.00 | % | | |
* The above percentages are based on ordinary income dividends paid to shareholders during the Fund’s fiscal year.
Invesco V.I. Comstock Fund
Trustees and Officers
The address of each trustee and officer is AIM Variable Insurance Funds (Invesco Variable Insurance Funds) (the “Trust”), 11 Greenway Plaza, Suite 1000, Houston, Texas 77046-1173. The trustees serve for the life of the Trust, subject to their earlier death, incapacitation, resignation, retirement or removal as more specifically provided in the Trust’s organizational documents. Each officer serves for a one year term or until their successors are elected and qualified. Column two below includes length of time served with predecessor entities, if any.
| | | | | | | | |
Name, Year of Birth and Position(s) Held with the Trust | | Trustee and/or Officer Since | | Principal Occupation(s) During Past 5 Years | | Number of
Funds in
Fund Complex
Overseen by
Trustee | | Other Directorship(s) Held by Trustee
During Past 5 Years |
| Interested Person |
Martin L. Flanagan1- 1960 Trustee and Vice Chair | | 2007 | | Executive Director, Chief Executive Officer and President, Invesco Ltd. (ultimate parent of Invesco and a global investment management firm); Trustee and Vice Chair, The Invesco Funds; Vice Chair, Investment Company Institute; and Member of Executive Board, SMU Cox School of Business Formerly: Advisor to the Board, Invesco Advisers, Inc. (formerly known as Invesco Institutional (N.A.), Inc.); Chairman and Chief Executive Officer, Invesco Advisers, Inc. (registered investment adviser); Director, Chairman, Chief Executive Officer and President, Invesco Holding Company (US), Inc. (formerly IVZ Inc.) (holding company), Invesco Group Services, Inc. (service provider) and Invesco North American Holdings, Inc. (holding company); Director, Chief Executive Officer and President, Invesco Holding Company Limited (parent of Invesco and a global investment management firm); Director, Invesco Ltd.; Chairman, Investment Company Institute and President,Co-Chief Executive Officer,Co-President, Chief Operating Officer and Chief Financial Officer, Franklin Resources, Inc. (global investment management organization) | | 229 | | None |
| 1 | Mr. Flanagan is considered an interested person (within the meaning of Section 2(a)(19) of the 1940 Act) of the Trust because he is an officer of the Adviser to the Trust, and an officer and a director of Invesco Ltd., ultimate parent of the Adviser. |
Invesco V.I. Comstock Fund
Trustees and Officers–(continued)
| | | | | | | | |
Name, Year of Birth and Position(s) Held with the Trust | | Trustee and/or Officer Since | | Principal Occupation(s) During Past 5 Years | | Number of
Funds in
Fund Complex
Overseen by
Trustee | | Other Directorship(s) Held by Trustee
During Past 5 Years |
| Independent Trustees |
Bruce L. Crockett - 1944 Trustee and Chair | | 1993 | | Chairman, Crockett Technologies Associates (technology consulting company) Formerly: Director, Captaris (unified messaging provider); Director, President and Chief Executive Officer, COMSAT Corporation; Chairman, Board of Governors of INTELSAT (international communications company); ACE Limited (insurance company); Independent Directors Council and Investment Company Institute: Member of the Audit Committee, Investment Company Institute; Member of the Executive Committee and Chair of the Governance Committee, Independent Directors Council | | 229 | | Director and Chairman of the Audit Committee, ALPS (Attorneys Liability Protection Society) (insurance company); Director and Member of the Audit Committee and Compensation Committee, Ferroglobe PLC (metallurgical company) |
David C. Arch - 1945 Trustee | | 2010 | | Chairman of Blistex Inc. (consumer health care products manufacturer); Member, World Presidents’ Organization | | 229 | | Board member of the Illinois Manufacturers’ Association |
Beth Ann Brown - 1968 Trustee | | 2019 | | Independent Consultant Formerly: Head of Intermediary Distribution, Managing Director, Strategic Relations, Managing Director, Head of National Accounts, Senior Vice President, National Account Manager and Senior Vice President, Key Account Manager, Columbia Management Investment Advisers LLC; Vice President, Key Account Manager, Liberty Funds Distributor, Inc.; and Trustee of certain Oppenheimer Funds | | 229 | | Director, Board of Directors of Caron Engineering Inc.; Advisor, Board of Advisors of Caron Engineering Inc.; President and Director, Acton Shapleigh Youth Conservation Corps (non-profit); and Vice President and Director of Grahamtastic Connection (non-profit) |
Jack M. Fields - 1952 Trustee | | 1997 | | Chief Executive Officer, Twenty First Century Group, Inc. (government affairs company); and Chairman, Discovery Learning Alliance(non-profit) Formerly: Owner and Chief Executive Officer, Dos Angeles Ranch L.P. (cattle, hunting, corporate entertainment); Director, Insperity, Inc. (formerly known as Administaff) (human resources provider); Chief Executive Officer, Texana Timber LP (sustainable forestry company); Director of Cross Timbers Quail Research Ranch(non-profit); and member of the U.S. House of Representatives | | 229 | | None |
Invesco V.I. Comstock Fund
Trustees and Officers–(continued)
| | | | | | | | |
Name, Year of Birth and Position(s) Held with the Trust | | Trustee and/or Officer Since | | Principal Occupation(s) During Past 5 Years | | Number of
Funds in
Fund Complex
Overseen by
Trustee | | Other Directorship(s) Held by Trustee
During Past 5 Years |
| Independent Trustees–(continued) |
Cynthia Hostetler -1962 Trustee | | 2017 | | Non-Executive Director and Trustee of a number of public and private business corporations Formerly: Director, Aberdeen Investment Funds (4 portfolios); Head of Investment Funds and Private Equity, Overseas Private Investment Corporation; President, First Manhattan Bancorporation, Inc.; Attorney, Simpson Thacher & Bartlett LLP | | 229 | | Vulcan Materials Company (construction materials company); Trilinc Global Impact Fund; Genesee & Wyoming, Inc. (railroads); Artio Global Investment LLC (mutual fund complex); Edgen Group, Inc. (specialized energy and infrastructure products distributor); Investment Company Institute (professional organization); Independent Directors Council (professional organization) |
Eli Jones - 1961 Trustee | | 2016 | | Professor and Dean, Mays Business School - Texas A&M University Formerly: Professor and Dean, Walton College of Business, University of Arkansas and E.J. Ourso College of Business, Louisiana State University; Director, Arvest Bank | | 229 | | Insperity, Inc. (formerly known as Administaff) (human resources provider) |
Elizabeth Krentzman - 1959 Trustee | | 2019 | | Formerly: Principal and Chief Regulatory Advisor for Asset Management Services and U.S. Mutual Fund Leader of Deloitte & Touche LLP; General Counsel of the Investment Company Institute (trade association); National Director of the Investment Management Regulatory Consulting Practice, Principal, Director and Senior Manager of Deloitte & Touche LLP; Assistant Director of the Division of Investment Management - Office of Disclosure and Investment Adviser Regulation of the U.S. Securities and Exchange Commission and various positions with the Division of Investment Management - Office of Regulatory Policy of the U.S. Securities and Exchange Commission; Associate at Ropes & Gray LLP; Advisory Board Member of the Securities and Exchange Commission Historical Society; and Trustee of certain Oppenheimer Funds | | 229 | | Trustee of the University of Florida National Board Foundation and Audit Committee Member; Member of the Cartica Funds Board of Directors (private investment funds); Member of the University of Florida Law Center Association, Inc. Board of Trustees and Audit Committee Member |
Anthony J. LaCava, Jr. - 1956 Trustee | | 2019 | | Formerly: Director and Member of the Audit Committee, Blue Hills Bank (publicly traded financial institution) and Managing Partner, KPMG LLP | | 229 | | Blue Hills Bank; Chairman, Bentley University; Member, Business School Advisory Council; and Nominating Committee KPMG LLP |
Prema Mathai-Davis - 1950 Trustee | | 1998 | | Retired Co-Owner & Partner of Quantalytics Research, LLC, (a FinTech Investment Research Platform for the Self-Directed Investor) | | 229 | | None |
Invesco V.I. Comstock Fund
Trustees and Officers–(continued)
| | | | | | | | |
Name, Year of Birth and Position(s) Held with the Trust | | Trustee and/or Officer Since | | Principal Occupation(s) During Past 5 Years | | Number of
Funds in
Fund Complex
Overseen by
Trustee | | Other Directorship(s) Held by Trustee
During Past 5 Years |
| Independent Trustees–(continued) |
Joel W. Motley - 1952 Trustee | | 2019 | | Director of Office of Finance, Federal Home Loan Bank; Member of the Vestry of Trinity Wall Street; Managing Director of Carmona Motley Inc. (privately held financial advisor); Member of the Finance and Budget Committee of the Council on Foreign Relations, Member of the Investment Committee and Board of Human Rights Watch and Member of the Investment Committee and Board of Historic Hudson Valley(non-profit cultural organization) Formerly: Managing Director of Public Capital Advisors, LLC (privately held financial advisor); Managing Director of Carmona Motley Hoffman, Inc. (privately held financial advisor); Trustee of certain Oppenheimer Funds; and Director of Columbia Equity Financial Corp. (privately held financial advisor) | | 229 | | Director of Greenwall Foundation (bioethics research foundation); Member of Board and Investment Committee of The Greenwall Foundation; Director of Southern Africa Legal Services Foundation; Board Member and Investment Committee Member of Pulizer Center for Crisis Reporting(non-profit journalism) |
Teresa M. Ressel - 1962 Trustee | | 2017 | | Non-executive director and trustee of a number of public and private business corporations Formerly: Chief Financial Officer, Olayan America, The Olayan Group (international investor/commercial/industrial); Chief Executive Officer, UBS Securities LLC; Group Chief Operating Officer, Americas, UBS AG; Assistant Secretary for Management & Budget and CFO, US Department of the Treasury | | 229 | | Atlantic Power Corporation (power generation company); ON Semiconductor Corp. (semiconductor supplier) |
Ann Barnett Stern - 1957 Trustee | | 2017 | | President and Chief Executive Officer, Houston Endowment Inc. (private philanthropic institution) Formerly: Executive Vice President and General Counsel, Texas Children’s Hospital; Attorney, Beck, Redden and Secrest, LLP; Business Law Instructor, University of St. Thomas; Attorney, Andrews & Kurth LLP | | 229 | | Federal Reserve Bank of Dallas |
Robert C. Troccoli - 1949 Trustee | | 2016 | | Retired | | 229 | | None |
| Daniel S. Vandivort - 1954 Trustee | | 2019 | | Treasurer, Chairman of the Audit and Finance Committee, and Trustee, Board of Trustees, Huntington Disease Foundation of America; and President, Flyway Advisory Services LLC (consulting and property management) Formerly: Trustee and Governance Chair, of certain Oppenheimer Funds | | 229 | | Chairman and Lead Independent Director, Chairman of the Audit Committee, and Director, Board of Directors, Value Line Funds |
| James D. Vaughn - 1945 Trustee | | 2019 | | Retired Formerly: Managing Partner, Deloitte & Touche LLP; Trustee and Chairman of the Audit Committee, Schroder Funds; Board Member, Mile High United Way, Boys and Girls Clubs, Boy Scouts, Colorado Business Committee for the Arts, Economic Club of Colorado and Metro Denver Network (economic development corporation); and Trustee of certain Oppenheimer Funds | | 229 | | Board member and Chairman of Audit Committee of AMG National Trust Bank; Trustee and Investment Committee member, University of South Dakota Foundation; Board member, Audit Committee Member and past Board Chair, Junior Achievement(non-profit) |
Invesco V.I. Comstock Fund
Trustees and Officers–(continued)
| | | | | | | | |
Name, Year of Birth and Position(s) Held with the Trust | | Trustee and/or Officer Since | | Principal Occupation(s) During Past 5 Years | | Number of
Funds in
Fund Complex
Overseen by
Trustee | | Other Directorship(s) Held by Trustee
During Past 5 Years |
| Independent Trustees–(continued) |
| Christopher L. WIlson - 1957 Trustee, Vice Chair and Chair Designate | | 2017 | | Retired Formerly: Director, TD Asset Management USA Inc. (mutual fund complex) (22 portfolios); Managing Partner, CT2, LLC (investing and consulting firm); President/Chief Executive Officer, Columbia Funds, Bank of America Corporation; President/Chief Executive Officer, CDC IXIS Asset Management Services, Inc.; Principal & Director of Operations, Scudder Funds, Scudder, Stevens & Clark, Inc.; Assistant Vice President, Fidelity Investments | | 229 | | ISO New England, Inc.(non-profit organization managing regional electricity market) |
Invesco V.I. Comstock Fund
Trustees and Officers–(continued)
| | | | | | | | |
Name, Year of Birth and Position(s) Held with the Trust | | Trustee and/or Officer Since | | Principal Occupation(s) During Past 5 Years | | Number of
Funds in
Fund Complex
Overseen by
Trustee | | Other Directorship(s) Held by Trustee
During Past 5 Years |
| Officers |
Sheri Morris - 1964 President, Principal Executive Officer and Treasurer | | 1999 | | Head of Global Fund Services, Invesco Ltd.; President, Principal Executive Officer and Treasurer, The Invesco Funds; Vice President, Invesco Advisers, Inc. (formerly known as Invesco Institutional (N.A.), Inc.) (registered investment adviser); and Vice President, Invesco Exchange-Traded Fund Trust, Invesco Exchange-Traded Fund Trust II, Invesco India Exchange-Traded Fund Trust, Invesco Actively Managed Exchange-Traded Fund Trust, Invesco Actively Managed Exchange-Traded Commodity Fund Trust and Invesco Exchange-Traded Self-Indexed Fund Trust; and Vice President, OppenheimerFunds, Inc. Formerly: Vice President and Principal Financial Officer, The Invesco Funds; Vice President, Invesco AIM Advisers, Inc., Invesco AIM Capital Management, Inc. and Invesco AIM Private Asset Management, Inc.; Assistant Vice President and Assistant Treasurer, The Invesco Funds and Assistant Vice President, Invesco Advisers, Inc., Invesco AIM Capital Management, Inc. and Invesco AIM Private Asset Management, Inc.; and Treasurer, Invesco Exchange-Traded Fund Trust, Invesco Exchange-Traded Fund Trust II, Invesco India Exchange-Traded Fund Trust and Invesco Actively Managed Exchange-Traded Fund Trust | | N/A | | N/A |
Russell C. Burk - 1958 Senior Vice President and Senior Officer | | 2005 | | Senior Vice President and Senior Officer, The Invesco Funds | | N/A | | N/A |
Jeffrey H. Kupor - 1968 Senior Vice President, Chief Legal Officer and Secretary | | 2018 | | Head of Legal of the Americas, Invesco Ltd.; Senior Vice President and Secretary, Invesco Advisers, Inc. (formerly known as Invesco Institutional (N.A.), Inc.) (registered investment adviser); Senior Vice President and Secretary, Invesco Distributors, Inc. (formerly known as Invesco AIM Distributors, Inc.); Vice President and Secretary, Invesco Investment Services, Inc. (formerly known as Invesco AIM Investment Services, Inc.) Senior Vice President, Chief Legal Officer and Secretary, The Invesco Funds; Secretary and General Counsel, Invesco Investment Advisers LLC (formerly known as Van Kampen Asset Management); Secretary and General Counsel, Invesco Capital Markets, Inc. (formerly known as Van Kampen Funds Inc.) and Chief Legal Officer, Invesco Exchange-Traded Fund Trust, Invesco Exchange-Traded Fund Trust II, Invesco India Exchange-Traded Fund Trust, Invesco Actively Managed Exchange-Traded Fund Trust, Invesco Actively Managed Exchange-Traded Commodity Fund Trust and Invesco Exchange-Traded Self-Indexed Fund Trust; Secretary, Invesco Indexing LLC; Secretary, W.L. Ross & Co., LLC Formerly: Secretary and Vice President, Jemstep, Inc.; Head of Legal, Worldwide Institutional, Invesco Ltd.; Secretary and General Counsel, INVESCO Private Capital Investments, Inc.; Senior Vice President, Secretary and General Counsel, Invesco Management Group, Inc. (formerly known as Invesco AIM Management Group, Inc.); Assistant Secretary, INVESCO Asset Management (Bermuda) Ltd.; Secretary and General Counsel, Invesco Private Capital, Inc.; Assistant Secretary and General Counsel, INVESCO Realty, Inc.; Secretary and General Counsel, Invesco Senior Secured Management, Inc.; and Secretary, Sovereign G./P. Holdings Inc. | | N/A | | N/A |
Andrew R. Schlossberg - 1974 Senior Vice President | | 2019 | | Head of the Americas and Senior Managing Director, Invesco Ltd.; Director and Senior Vice President, Invesco Advisers, Inc. (formerly known as Invesco Institutional (N.A.), Inc.) (registered investment adviser); Director and Chairman, Invesco Investment Services, Inc. (formerly known as Invesco AIM Investment Services, Inc.) (registered transfer agent); Senior Vice President, The Invesco Funds; Director, Invesco Investment Advisers LLC (formerly known as Van Kampen Asset Management); Director, President and Chairman, Invesco Insurance Agency, Inc. Formerly: Director, Invesco UK Limited; Director and Chief Executive, Invesco Asset Management Limited and Invesco Fund Managers Limited; Assistant Vice President, The Invesco Funds; Senior Vice President, Invesco Advisers, Inc. (formerly known as Invesco Institutional (N.A.), Inc.) (registered investment adviser); Director and Chief Executive, Invesco Administration Services Limited and Invesco Global Investment Funds Limited; Director, Invesco Distributors, Inc.; Head of EMEA, Invesco Ltd.; President, Invesco Actively Managed Exchange-Traded Commodity Fund Trust, Invesco Actively Managed Exchange-Traded Fund Trust, Invesco Exchange-Traded Fund Trust, Invesco Exchange-Traded Fund Trust II and Invesco India Exchange-Traded Fund Trust; Managing Director and Principal Executive Officer, Invesco Capital Management LLC | | N/A | | N/A |
Invesco V.I. Comstock Fund
Trustees and Officers–(continued)
| | | | | | | | |
Name, Year of Birth and Position(s) Held with the Trust | | Trustee and/or Officer Since | | Principal Occupation(s) During Past 5 Years | | Number of
Funds in
Fund Complex
Overseen by
Trustee | | Other Directorship(s) Held by Trustee
During Past 5 Years |
| Officers–(continued) |
John M. Zerr - 1962 Senior Vice President | | 2006 | | Chief Operating Officer of the Americas; Senior Vice President, Invesco Advisers, Inc. (formerly known as Invesco Institutional (N.A.), Inc.) (registered investment adviser); Senior Vice President, Invesco Distributors, Inc. (formerly known as Invesco AIM Distributors, Inc.); Director and Vice President, Invesco Investment Services, Inc. (formerly known as Invesco AIM Investment Services, Inc.) Senior Vice President, The Invesco Funds; Managing Director, Invesco Capital Management LLC; Director, Invesco Investment Advisers LLC (formerly known as Van Kampen Asset Management); Senior Vice President, Invesco Capital Markets, Inc. (formerly known as Van Kampen Funds Inc.); Manager, Invesco Indexing LLC; Manager, Invesco Specialized Products, LLC; Director and Senior Vice President, Invesco Insurance Agency, Inc.; Member, Invesco Canada Funds Advisory Board; Director, President and Chief Executive Officer, Invesco Corporate Class Inc. (corporate mutual fund company); and Director, Chairman, President and Chief Executive Officer, Invesco Canada Ltd. (formerly known as Invesco Trimark Ltd./Invesco Trimark Ltèe) (registered investment adviser and registered transfer agent) Formerly: Director and Senior Vice President, Invesco Management Group, Inc. (formerly known as Invesco AIM Management Group, Inc.); Secretary and General Counsel, Invesco Management Group, Inc. (formerly known as Invesco AIM Management Group, Inc.); Secretary, Invesco Investment Services, Inc. (formerly known as Invesco AIM Investment Services, Inc.); Chief Legal Officer and Secretary, The Invesco Funds; Secretary and General Counsel, Invesco Investment Advisers LLC (formerly known as Van Kampen Asset Management); Secretary and General Counsel, Invesco Capital Markets, Inc. (formerly known as Van Kampen Funds Inc.); Chief Legal Officer, Invesco Exchange-Traded Fund Trust, Invesco Exchange-Traded Fund Trust II, Invesco India Exchange-Traded Fund Trust, Invesco Actively Managed Exchange-Traded Fund Trust, Invesco Actively Managed Exchange-Traded Commodity Fund Trust and Invesco Exchange-Traded Self-Indexed Fund Trust; Secretary, Invesco Indexing LLC; Director, Secretary, General Counsel and Senior Vice President, Van Kampen Exchange Corp.; Director, Vice President and Secretary, IVZ Distributors, Inc. (formerly known as INVESCO Distributors, Inc.); Director and Vice President, INVESCO Funds Group, Inc.; Director and Vice President, Van Kampen Advisors Inc.; Director, Vice President, Secretary and General Counsel, Van Kampen Investor Services Inc.; Director and Secretary, Invesco Distributors, Inc. (formerly known as Invesco AIM Distributors, Inc.); Director, Senior Vice President, General Counsel and Secretary, Invesco AIM Advisers, Inc. and Van Kampen Investments Inc.; Director, Vice President and Secretary, Fund Management Company; Director, Senior Vice President, Secretary, General Counsel and Vice President, Invesco AIM Capital Management, Inc.; Chief Operating Officer and General Counsel, Liberty Ridge Capital, Inc. (an investment adviser) | | N/A | | N/A |
Gregory G. McGreevey - 1962 Senior Vice President | | 2012 | | Senior Managing Director, Invesco Ltd.; Director, Chairman, President, and Chief Executive Officer, Invesco Advisers, Inc. (formerly known as Invesco Institutional (N.A.), Inc.) (registered investment adviser); Director, Invesco Mortgage Capital, Inc. and Invesco Senior Secured Management, Inc.; and Senior Vice President, The Invesco Funds; and President, SNW Asset Management Corporation Formerly: Senior Vice President, Invesco Management Group, Inc. and Invesco Advisers, Inc.; Assistant Vice President, The Invesco Funds | | N/A | | N/A |
Kelli Gallegos - 1970 Vice President, Principal Financial Officer and Assistant Treasurer | | 2008 | | Principal Financial and Accounting Officer - Investments Pool, Invesco Specialized Products, LLC; Vice President, Principal Financial Officer and Assistant Treasurer, The Invesco Funds; Principal Financial and Accounting Officer - Pooled Investments, Invesco Capital Management LLC; Vice President and Treasurer, Invesco Exchange-Traded Fund Trust, Invesco Exchange-Traded Fund Trust II, Invesco India Exchange-Traded Fund Trust, Invesco Actively Managed Exchange-Traded Fund Trust, Invesco Actively Managed Exchange-Traded Commodity Fund Trust and Invesco Exchange-Traded Self-Indexed Fund Trust Formerly: Assistant Treasurer, Invesco Specialized Products, LLC; Assistant Treasurer, Invesco Exchange-Traded Fund Trust, Invesco Exchange-Traded Fund Trust II, Invesco India Exchange-Traded Fund Trust, Invesco Actively Managed Exchange-Traded Fund Trust, Invesco Actively Managed Exchange-Traded Commodity Fund Trust and Invesco Exchange-Traded Self-Indexed Fund Trust; Assistant Treasurer, Invesco Capital Management LLC; Assistant Vice President, The Invesco Funds | | N/A | | N/A |
Invesco V.I. Comstock Fund
Trustees and Officers–(continued)
| | | | | | | | |
Name, Year of Birth and Position(s) Held with the Trust | | Trustee and/or Officer Since | | Principal Occupation(s) During Past 5 Years | | Number of
Funds in
Fund Complex
Overseen by
Trustee | | Other Directorship(s) Held by Trustee
During Past 5 Years |
| Officers–(continued) |
Crissie M. Wisdom - 1969 Anti-Money Laundering Compliance Officer | | 2013 | | Anti-Money Laundering Compliance Officer, Invesco Advisers, Inc. (formerly known as Invesco Institutional (N.A.), Inc.) (registered investment adviser), Invesco Capital Markets, Inc. (formerly known as Van Kampen Funds Inc.), Invesco Distributors, Inc., Invesco Investment Services, Inc., The Invesco Funds, and Invesco Exchange-Traded Fund Trust, Invesco Exchange-Traded Fund Trust II, Invesco India Exchange-Traded Fund Trust, Invesco Actively Managed Exchange-Traded Fund Trust, Invesco Actively Managed Exchange-Traded Commodity Fund Trust and Invesco Exchange-Traded Self-Indexed Fund Trust; Anti-Money Laundering Compliance Officer and Bank Secrecy Act Officer, INVESCO National Trust Company and Invesco Trust Company; and Fraud Prevention Manager and Controls and Risk Analysis Manager for Invesco Investment Services, Inc. Formerly: Anti-Money Laundering Compliance Officer, Van Kampen Exchange Corp. and Invesco Management Group, Inc. | | N/A | | N/A |
Robert R. Leveille - 1969 Chief Compliance Officer | | 2016 | | Chief Compliance Officer, Invesco Advisers, Inc. (registered investment adviser); and Chief Compliance Officer, The Invesco Funds Formerly: Chief Compliance Officer, Putnam Investments and the Putnam Funds | | N/A | | N/A |
The Statement of Additional Information of the Trust includes additional information about the Fund’s Trustees and is available upon request, without charge, by calling 1.800.959.4246. Please refer to the Fund’s Statement of Additional Information for information on the Fund’ssub-advisers.
| | | | | | |
| Office of the Fund | | Investment Adviser | | Distributor | | Auditors |
| 11 Greenway Plaza, Suite 1000 | | Invesco Advisers, Inc. | | Invesco Distributors, Inc. | | PricewaterhouseCoopers LLP |
| Houston, TX 77046-1173 | | 1555 Peachtree Street, N.E. | | 11 Greenway Plaza, Suite 1000 | | 1000 Louisiana Street, Suite 5800 |
| | Atlanta, GA 30309 | | Houston, TX 77046-1173 | | Houston, TX 77002-5678 |
| | | |
| Counsel to the Fund | | Counsel to the Independent Trustees | | Transfer Agent | | Custodian |
| Stradley Ronon Stevens & Young, LLP | | Goodwin Procter LLP | | Invesco Investment Services, Inc. | | State Street Bank and Trust Company |
| 2005 Market Street, Suite 2600 | | 901 New York Avenue, N.W. | | 11 Greenway Plaza, Suite 1000 | | 225 Franklin Street |
| Philadelphia, PA 19103-7018 | | Washington, D.C. 20001 | | Houston, TX 77046-1173 | | Boston, MA 02110-2801 |
Invesco V.I. Comstock Fund
| | | | |
| | |
 | | Annual Report to Shareholders | | December 31, 2019 |
| | |
| | Invesco V.I. Core Equity Fund |
| | |
| | |

Beginning on January 1, 2021, as permitted by regulations adopted by the Securities and Exchange Commission, the insurance company that offers your variable annuity or variable life insurance contract may no longer send you paper copies of the Fund’s shareholder reports by mail, unless you specifically request paper copies of the reports from the insurance company or your financial intermediary. Instead of delivering paper copies of the report, the insurance company may choose to make the reports available on a website, and will notify you by mail each time a report is posted and provide you with a website link to access the report. Instructions for requesting paper copies will be provided by your insurance company.
If the insurance company offers electronic delivery, you may elect to receive shareholder reports and other communications about the Fund electronically by following the instructions provided by the insurance company or by contacting your financial intermediary. If you already elected to receive shareholder reports electronically, you will not be affected by this change and you need not take any action.
You may elect to receive all future reports in paper free of charge from the insurance company. You can inform the insurance company or your financial intermediary that you wish to continue receiving paper copies of your shareholder reports by following the instructions provided by the insurance company or by contacting your financial intermediary. Your election to receive reports in paper will apply to all portfolio companies available under your contract with the insurance company.
The Fund provides a complete list of its holdings four times in each fiscal year, at the quarter-ends. For the second and fourth quarters, the lists appear in the Fund’s semiannual and annual reports to shareholders. For the first and third quarters, the Fund files the lists with the Securities and Exchange Commission (SEC) as an exhibit to its reports on FormN-PORT. The Fund’s FormN-PORT filings are available on the SEC website, sec.gov. The SEC file numbers for the Fund are811-07452 and033-57340. The Fund’s most recent portfolio holdings, as filed on FormN-PORT, have also been made available to insurance companies issuing variable annuity contracts and variable life insurance policies (“variable products”) that invest in the Fund.
A description of the policies and procedures that the Fund uses to determine how to vote proxies relating to portfolio securities is available without charge, upon request, from our Client Services department at 800 959 4246 or at invesco.com/proxyguidelines. The information is also available on the SEC website, sec.gov.
Information regarding how the Fund voted proxies related to its portfolio securities during the most recent12-month period ended June 30 is available at invesco.com/proxysearch. The information is also available on the SEC website, sec.gov.
Invesco Advisers, Inc. is an investment adviser; it provides investment advisory services to individual and institutional clients and does not sell securities. Invesco Distributors, Inc. is the US distributor for Invesco Ltd.’s retail mutual funds, exchange-traded funds and institutional money market funds. Both are wholly owned, indirect subsidiaries of Invesco Ltd.
This report must be accompanied or preceded by a currently effective Fund prospectus and variable product prospectus, which contain more complete information, including sales charges and expenses. Investors should read each carefully before investing.
NOT FDIC INSURED | MAY LOSE VALUE | NO BANK GUARANTEE
| | |
| Invesco Distributors, Inc. | | VICEQ-AR-1 |
Management’s Discussion of Fund Performance
Performance summary
For the year ended December 31, 2019, Series I shares of Invesco V.I. Core Equity Fund (the Fund) underperformed the Russell 1000 Index, the Fund’s style-specific benchmark.
Your Fund’s long-term performance appears later in this report.
Fund vs. Indexes
Total returns, 12/31/18 to 12/31/19, excluding variable product issuer charges. If variable product issuer charges were included, returns would be lower.
| | | | | |
| Series I Shares | | | | 28.97 | % |
| Series II Shares | | | | 28.66 | |
| S&P 500 Indexq(Broad Market Index) | | | | 31.49 | |
| Russell 1000 Indexq(Style-Specific Index) | | | | 31.43 | |
| Lipper VUFLarge-Cap Core Funds Index∎(Peer Group Index) | | | | 28.24 | |
Source(s):qRIMES Technologies Corp.;∎Lipper Inc. | |
Market conditions and your Fund
Equity markets rallied in the first quarter of 2019, fueled by optimism about a potentialUS-China trade deal and indication that the US Federal Reserve (the Fed) would not raise interest rates in 2019, a surprising shift in monetary policy. The Fed’s more accommodative stance provided a supportive environment for equities and fixed income, even as US economic data were mixed and overseas growth appeared to be slowing. Against this backdrop, the S&P 500 Index posted its best first quarter returns since 1998.
Although the S&P 500 Index posted modest gains for the second quarter of 2019, the US stock market experienced increased volatility. After four consecutive months of rising stock markets, the market sold off in May 2019, along with bond yields and oil prices, as investors weighed the impact of the lingering trade war between the US and China, as well as potential tariffs imposed on Mexico. In addition, economic data showed a slowing domestic and global economy.
Key issues that concerned investors in the second quarter of 2019 carried over into the third quarter. TheUS-China
trade conflict worried investors and stifled business investment, even as the Fed cut interest rates by 0.25% in July and again in September 2019.1 This environment, combined with evidence of slowing global economic growth, fueled market volatility in August 2019. The US Treasury yield curve inverted several times, increasing fears of a possible US recession. As a result, August saw increased risk aversion, with investors crowding into asset classes perceived as safe havens, such as US Treasuries and gold. However, the Fed’s accommodative tone provided some support for risk assets.
Macroeconomic issues that concerned investors in the third quarter of 2019 mostly abated during the fourth quarter, providing the backdrop for strong equity market returns. Risk assets surged higher as a result of a delay in the Brexit agreement until January 2020, optimism that phase one of aUS-China trade deal would be completed and better-than-expected third-quarter corporate earnings results. The US economy rose higher than expected, at 2.1% during the third quarter of 2019.2 During its October meeting, the Fed cut interest rates again
by 0.25% based on business investment and exports remaining weak.1 Investors were also encouraged by a resilient US economy and corporate earnings, putting the US equity market on track for its largest annual rise since 2013.
During the year, stock selection in the financials and health care sectors was a key contributor to the Fund’s performance versus the Russell 1000 Index. Key detractors from the Fund’s relative returns included stock selection in the communication services and consumer staples sectors, as well as underweight exposure to the information technology sector.
Key individual contributors to the Fund’s performance relative to the style-specific benchmark for the year includedEPAM Systems,JPMorgan Chase, andMastercard. EPAM Systems provides software engineering solutions and technology services. The company benefited from an increased demand for digital products, which resulted in strong growth rates and increasing margins. We exited our position in the company before the close of the fiscal year.
JPMorgan Chase benefited from generally strong performance acrosslarge-cap banks. The company performed particularly well toward the end of the year as the yield curve moved from an inverted shape to a more normal upward slope. This, along with a strong economy, low unemployment rate and continued appreciation in the equity markets, fueled strong gains despite reduced near-term earnings expectations.
Mastercard’s fundamentals remained strong during the year withmid-teens revenue growth, margin expansion and capital return mainly through stockbuy-backs. Mastercard’s wide moat from its lead in global merchant acceptance, technology innovation and wide variety
| | |
Portfolio Composition |
By sector | | % of total net assets |
| | |
| |
| Financials | | 18.97% |
| Health Care | | 16.81 |
| Information Technology | | 16.80 |
| Consumer Discretionary | | 13.48 |
| Communication Services | | 7.84 |
| Industrials | | 7.60 |
| Consumer Staples | | 6.97 |
| Energy | | 5.33 |
| Real Estate | | 2.89 |
| Utilities | | 1.75 |
| Money Market Funds Plus Other Assets Less Liabilities | | 1.56 |
| | |
Top 10 Equity Holdings* | | |
| % of total net assets |
| |
1. Microsoft Corp. | | 7.97% |
2. JPMorgan Chase & Co. | | 5.11 |
3. UnitedHealth Group, Inc. | | 4.11 |
4. Facebook, Inc., Class A | | 3.82 |
5. Amazon.com, Inc. | | 3.71 |
6. Procter & Gamble Co. (The) | | 3.62 |
7. Berkshire Hathaway, Inc., Class B | | 3.34 |
8. Merck & Co., Inc. | | 3.23 |
9. Lockheed Martin Corp. | | 2.99 |
10. Prologis, Inc. | | 2.89 |
| | |
Total Net Assets | | $878.4 million |
| |
Total Number of Holdings* | | 56 |
The Fund’s holdings are subject to change, and there is no assurance that the Fund will continue to hold any particular security.
*Excluding money market fund holdings, if any.
Data presented here are as of December 31, 2019.
Invesco V.I. Core Equity Fund
of payments services business has well-positioned the company to compete and partner with emerging mobile-based payment models, such as digital wallets.
Key individual detractors from the Fund’s performance relative to the style-specific benchmark for the year includedBiogenandCarnival. Biotechnology company Biogen and cruise line operator Carnival both underperformed during the first half of 2019. As such, we exited our positions in both companies before the close of the year.
Underweight exposure toAlphabetand Apple (not a Fund holding) also detracted from the Fund’s performance versus the style-specific benchmark as both companies were strong performers within the Russell 1000 Index during the year. Our decision not to own Apple was based on concerns regarding peak iPhone sales. While we initiated a position in Alphabet during the year, the Fund’s underweight exposure was a drag on relative returns.
At the close of the year, we continued to focus on companies with competitive advantages and skilled management teams that are out executing peers. As evidence of this, we look for companies with high returns on invested capital, consistently strong pricing power, and/or rising market shares. During times of economic volatility, such companies frequently widen the lead over weaker competitors. We seek to invest in companies characterized by these qualities at compelling valuations and believe this disciplined approach is essential to generating superior long-term performance, especially in down markets.
Please note that a new portfolio management team began managing the Fund on June 21, 2019.
We thank you for your continued investment in Invesco V.I. Core Equity Fund.
1 Source: US Federal Reserve
2 Source: Bureau of Economic Analysis
Portfolio managers:
Manind (Mani) Govil - Lead
Paul Larson
Benjamin Ram
The views and opinions expressed in management’s discussion of Fund performance are those of Invesco Advisers, Inc. These views and opinions are subject to change at any time based on factors such as market and economic conditions. These views and opinions may not be relied upon as investment advice or recommendations, or as an offer for a particular security. The information is not a complete analysis of every aspect of any
market, country, industry, security or the Fund. Statements of fact are from sources considered reliable, but Invesco Advisers, Inc. makes no representation or warranty as to their completeness or accuracy. Although historical performance is no guarantee of future results, these insights may help you understand our investment management philosophy.
See important Fund and, if applicable, index disclosures later in this report.
Invesco V.I. Core Equity Fund
Your Fund’s Long-Term Performance
Results of a $10,000 Investment – Oldest Share Class(es)
Fund and index data from 12/31/09
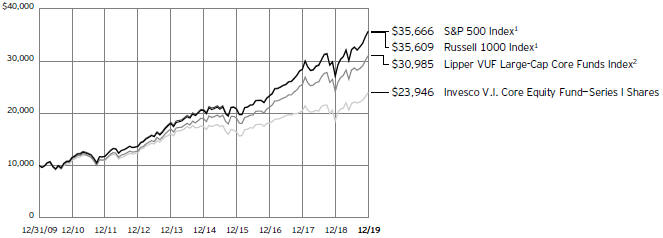
1 Source: RIMES Technologies Corp.
2 Source: Lipper Inc.
Past performance cannot guarantee future
results.
| | | | |
Average Annual Total Returns | |
As of 12/31/19 | | | | |
| |
Series I Shares | | | | |
Inception (5/2/94) | | | 8.14 | % |
10 Years | | | 9.12 | |
5 Years | | | 6.56 | |
1 Year | | | 28.97 | |
| |
Series II Shares | | | | |
Inception (10/24/01) | | | 6.83 | % |
10 Years | | | 8.86 | |
5 Years | | | 6.31 | |
1 Year | | | 28.66 | |
The performance of the Fund’s Series I and Series II share classes will differ primarily due to different class expenses.
The performance data quoted represent past performance and cannot guarantee future results; current performance may be lower or higher. Please contact your variable product issuer or financial adviser for the most recentmonth-end variable product performance. Performance figures reflect Fund expenses, reinvested distributions and changes in net asset value. Performance figures do not reflect deduction of taxes a shareholder would pay on Fund distributions or sale of Fund shares. Investment return and principal value will fluctuate so that you may have a gain or loss when you sell shares.
The net annual Fund operating expense ratio set forth in the most recent Fund prospectus as of the date of this report for Series I and Series II shares was 0.80% and 1.05%, respectively.1 The total annual Fund operating expense ratio set forth in
the most recent Fund prospectus as of the date of this report for Series I and Series II shares was 0.81% and 1.06%, respectively. The expense ratios presented above may vary from the expense ratios presented in other sections of this report that are based on expenses incurred during the period covered by this report.
Invesco V.I. Core Equity Fund, a series portfolio of AIM Variable Insurance Funds (Invesco Variable Insurance Funds), is currently offered through insurance companies issuing variable products. You cannot purchase shares of the Fund directly. Performance figures given represent the Fund and are not intended to reflect actual variable product values. They do not reflect sales charges, expenses and fees assessed in connection with a variable product. Sales charges, expenses and fees, which are determined by the variable product issuers, will vary and will lower the total return.
The most recentmonth-end performance at the Fund level, excluding variable product charges, is available at 800 451 4246. As mentioned above, for the most recentmonth-end performance including variable product charges, please contact your variable product issuer or financial adviser.
Fund performance reflects any applicable fee waivers and/or expense reimbursements. Had the adviser not waived fees and/or reimbursed expenses currently or in the past, returns would have been lower. See current prospectus for more information.
| 1 | Total annual Fund operating expenses after any |
| | contractual fee waivers and/or expense reimbursements by the adviser in effect through at least June 30, 2021. See current prospectus for more information. |
Invesco V.I. Core Equity Fund
Invesco V.I. Core Equity Fund’s investment objective is long-term growth of capital.
| ∎ | Unless otherwise stated, information presented in this report is as of December 31, 2019, and is based on total net assets. |
| ∎ | Unless otherwise noted, all data provided by Invesco. |
| ∎ | To access your Fund’s reports/prospectus, visit invesco.com/fundreports. |
About indexes used in this report
| ∎ | TheS&P 500® Indexis an unmanaged index considered representative of the US stock market. |
| ∎ | TheRussell 1000® Indexis an unmanaged index considered representative oflarge-cap stocks. The Russell 1000 Index is a trademark/service mark of the Frank Russell Co. Russell® is a trademark of the Frank Russell Co. |
| ∎ | TheLipper VUFLarge-Cap Core Funds Indexis an unmanaged index considered representative oflarge-cap core variable insurance underlying funds tracked by Lipper. |
| ∎ | The Fund is not managed to track the performance of any particular index, including the index(es) described here, and consequently, the performance of the Fund may deviate significantly from the performance of the index(es). |
| ∎ | A direct investment cannot be made in an index. Unless otherwise indicated, index results include reinvested dividends, and they do not reflect sales charges. Performance of the peer group, if applicable, reflects fund expenses; performance of a market index does not. |
Other information
| ∎ | The returns shown in management’s discussion of Fund performance are based on net asset values calculated for shareholder transactions. Generally accepted accounting principles require adjustments to be made to the net assets of the Fund at period end for financial reporting purposes, and as such, the net asset values for shareholder transactions and the returns based on those net asset values may differ from the net asset values and returns reported in the Financial Highlights. Additionally, the returns and net asset values shown throughout this report are at the Fund level only and do not include variable product issuer charges. If such charges were included, the total returns would be lower. |
| ∎ | Industry classifications used in this report are generally according to the Global Industry Classification Standard, which was developed by and is |
| | the exclusive property and a service mark of MSCI Inc. and Standard & Poor’s. |
Invesco V.I. Core Equity Fund
Schedule of Investments(a)
December 31, 2019
| | | | | | | | |
| | | Shares | | | Value | |
| |
Common Stocks & Other Equity Interests–98.44% | |
|
Aerospace & Defense–2.99% | |
| | |
Lockheed Martin Corp. | | | 67,440 | | | $ | 26,259,787 | |
| |
|
Air Freight & Logistics–0.30% | |
| | |
C.H. Robinson Worldwide, Inc. | | | 34,084 | | | | 2,665,369 | |
| |
|
Automobile Manufacturers–0.62% | |
| | |
General Motors Co. | | | 149,708 | | | | 5,479,313 | |
| |
|
Automotive Retail–0.69% | |
| | |
O’Reilly Automotive, Inc.(b) | | | 13,814 | | | | 6,054,124 | |
| |
|
Brewers–0.83% | |
Anheuser-Busch InBev S.A./N.V. (Belgium) | | | 88,984 | | | | 7,296,822 | |
| |
|
Communications Equipment–1.87% | |
| | |
Motorola Solutions, Inc. | | | 102,092 | | | | 16,451,105 | |
| |
|
Computer & Electronics Retail–1.38% | |
| | |
Best Buy Co., Inc. | | | 138,185 | | | | 12,132,643 | |
| |
|
Consumer Finance–4.19% | |
| | |
American Express Co. | | | 102,080 | | | | 12,707,939 | |
| |
Capital One Financial Corp. | | | 233,752 | | | | 24,055,418 | |
| |
| | | | 36,763,357 | |
| |
|
Data Processing & Outsourced Services–1.27% | |
| | |
Mastercard, Inc., Class A | | | 37,244 | | | | 11,120,686 | |
| |
|
Distillers & Vintners–0.89% | |
| | |
Constellation Brands, Inc., Class A | | | 41,308 | | | | 7,838,193 | |
| |
|
Diversified Banks–5.32% | |
| | |
Danske Bank A/S (Denmark) | | | 114,093 | | | | 1,845,158 | |
| |
JPMorgan Chase & Co. | | | 322,229 | | | | 44,918,722 | |
| |
| | | | 46,763,880 | |
| |
|
Electric Utilities–0.44% | |
| | |
Duke Energy Corp. | | | 42,202 | | | | 3,849,244 | |
| |
|
Financial Exchanges & Data–3.09% | |
| | |
Intercontinental Exchange, Inc. | | | 131,944 | | | | 12,211,417 | |
| |
Moody’s Corp. | | | 62,986 | | | | 14,953,506 | |
| |
| | | | 27,164,923 | |
| |
|
Gas Utilities–0.53% | |
| | |
UGI Corp. | | | 103,167 | | | | 4,659,022 | |
| |
|
Health Care Equipment–3.68% | |
| | |
Boston Scientific Corp.(b) | | | 100,857 | | | | 4,560,754 | |
| |
| | |
Medtronic PLC | | | 70,812 | | | | 8,033,621 | |
| |
| | |
Zimmer Biomet Holdings, Inc. | | | 131,719 | | | | 19,715,700 | |
| |
| | | | 32,310,075 | |
| |
| | | | | | | | |
| | | Shares | | | Value | |
| |
Health Care Facilities–0.76% | |
| | |
HCA Healthcare, Inc. | | | 45,116 | | | $ | 6,668,596 | |
| |
|
Home Improvement Retail–2.05% | |
| | |
Home Depot, Inc. (The) | | | 82,256 | | | | 17,963,065 | |
| |
|
Homebuilding–0.82% | |
| | |
D.R. Horton, Inc. | | | 135,804 | | | | 7,163,661 | |
| |
|
Household Products–3.62% | |
| | |
Procter & Gamble Co. (The) | | | 254,910 | | | | 31,838,259 | |
| |
|
Industrial Conglomerates–2.07% | |
| | |
Honeywell International, Inc. | | | 102,802 | | | | 18,195,954 | |
| |
|
Industrial Machinery–0.52% | |
| | |
Stanley Black & Decker, Inc. | | | 27,809 | | | | 4,609,064 | |
| |
|
Industrial REITs–2.89% | |
| | |
Prologis, Inc. | | | 284,662 | | | | 25,374,771 | |
| |
|
Integrated Oil & Gas–2.62% | |
| | |
Suncor Energy, Inc. (Canada) | | | 702,327 | | | | 23,036,326 | |
| |
|
Integrated Telecommunication Services–1.98% | |
| | |
Verizon Communications, Inc. | | | 283,379 | | | | 17,399,471 | |
| |
|
Interactive Media & Services–5.86% | |
| | |
Alphabet, Inc., Class A(b) | | | 13,403 | | | | 17,951,844 | |
| |
Facebook, Inc., Class A(b) | | | 163,402 | | | | 33,538,261 | |
| |
| | | | 51,490,105 | |
| |
|
Internet & Direct Marketing Retail–5.99% | |
| | |
Amazon.com, Inc.(b) | | | 17,621 | | | | 32,560,789 | |
| |
Booking Holdings, Inc.(b) | | | 9,772 | | | | 20,069,049 | |
| |
| | | | 52,629,838 | |
| |
|
IT Consulting & Other Services–1.01% | |
| | |
Amdocs Ltd. | | | 122,319 | | | | 8,830,209 | |
| |
|
Life Sciences Tools & Services–1.64% | |
| | |
Thermo Fisher Scientific, Inc. | | | 44,446 | | | | 14,439,172 | |
| |
|
Managed Health Care–4.11% | |
| | |
UnitedHealth Group, Inc. | | | 122,852 | | | | 36,116,031 | |
| |
|
Multi-Sector Holdings–3.34% | |
| | |
Berkshire Hathaway, Inc., Class B(b) | | | 129,333 | | | | 29,293,924 | |
| |
|
Multi-Utilities–0.78% | |
| | |
WEC Energy Group, Inc. | | | 74,195 | | | | 6,843,005 | |
| |
|
Oil & Gas Equipment & Services–1.30% | |
| | |
Schlumberger Ltd. | | | 282,984 | | | | 11,375,957 | |
| |
|
Oil & Gas Storage & Transportation–1.41% | |
| | |
Magellan Midstream Partners L.P. | | | 197,444 | | | | 12,413,304 | |
| |
See accompanying Notes to Financial Statements which are an integral part of the financial statements.
Invesco V.I. Core Equity Fund
| | | | | | | | |
| | | Shares | | | Value | |
| |
Other Diversified Financial Services–1.91% | |
| | |
AXA Equitable Holdings, Inc. | | | 677,649 | | | $ | 16,792,142 | |
| |
|
Pharmaceuticals–6.61% | |
| | |
AstraZeneca PLC, ADR (United Kingdom) | | | 305,742 | | | | 15,244,296 | |
| |
Elanco Animal Health, Inc.(b) | | | 491,248 | | | | 14,467,254 | |
| |
Merck & Co., Inc. | | | 312,172 | | | | 28,392,043 | |
| |
| | | | 58,103,593 | |
| |
|
Property & Casualty Insurance–1.00% | |
| | |
Fidelity National Financial, Inc. | | | 93,502 | | | | 4,240,316 | |
| |
Progressive Corp. (The) | | | 62,628 | | | | 4,533,641 | |
| |
| | | | 8,773,957 | |
| |
|
Railroads–1.60% | |
| | |
Union Pacific Corp. | | | 77,773 | | | | 14,060,581 | |
| |
|
Regional Banks–0.13% | |
| | |
SVB Financial Group(b) | | | 4,470 | | | | 1,122,149 | |
| |
|
Restaurants–0.90% | |
| | |
Starbucks Corp. | | | 89,606 | | | | 7,878,159 | |
| |
|
Semiconductor Equipment–2.14% | |
| | |
Applied Materials, Inc. | | | 308,024 | | | | 18,801,785 | |
| |
|
Semiconductors–2.54% | |
| | |
QUALCOMM, Inc. | | | 182,921 | | | | 16,139,120 | |
| |
Texas Instruments, Inc. | | | 48,064 | | | | 6,166,130 | |
| |
| | | | 22,305,250 | |
| |
| | | | | | | | |
| | | Shares | | | Value | |
| |
Soft Drinks–1.62% | |
| | |
PepsiCo., Inc. | | | 104,315 | | | $ | 14,256,731 | |
| |
|
Specialty Stores–1.04% | |
| | |
Ulta Beauty, Inc.(b) | | | 35,933 | | | | 9,096,080 | |
| |
|
Systems Software–7.97% | |
| | |
Microsoft Corp. | | | 444,194 | | | | 70,049,394 | |
| |
|
Trading Companies & Distributors–0.12% | |
| | |
Fastenal Co. | | | 27,313 | | | | 1,009,215 | |
| |
Total Common Stocks & Other Equity Interests (Cost $703,461,526) | | | | 864,738,291 | |
| |
|
Money Market Funds–2.51% | |
| | |
Invesco Government & Agency Portfolio, Institutional Class, 1.50%(c) | | | 7,673,323 | | | | 7,673,323 | |
| |
Invesco Liquid Assets Portfolio, Institutional Class, 1.71%(c) | | | 5,579,040 | | | | 5,580,713 | |
| |
Invesco Treasury Portfolio, Institutional Class, 1.49%(c) | | | 8,769,511 | | | | 8,769,511 | |
| |
Total Money Market Funds
(Cost $22,023,547) | | | | 22,023,547 | |
| |
TOTAL INVESTMENTS IN
SECURITIES–100.95%
(Cost $725,485,073) | | | | 886,761,838 | |
| |
OTHER ASSETS LESS LIABILITIES–(0.95)% | | | | (8,365,944 | ) |
| |
NET ASSETS–100.00% | | | $ | 878,395,894 | |
| |
Investment Abbreviations:
ADR – American Depositary Receipt
REIT – Real Estate Investment Trust
Notes to Schedule of Investments:
| (a) | Industry and/or sector classifications used in this report are generally according to the Global Industry Classification Standard, which was developed by and is the exclusive property and a service mark of MSCI Inc. and Standard & Poor’s. |
| (b) | Non-income producing security. |
| (c) | The money market fund and the Fund are affiliated by having the same investment adviser. The rate shown is the7-day SEC standardized yield as of December 31, 2019. |
See accompanying Notes to Financial Statements which are an integral part of the financial statements.
Invesco V.I. Core Equity Fund
Statement of Assets and Liabilities
December 31, 2019
| | | | |
Assets: | | | | |
| |
Investments in securities, at value
(Cost $703,461,526) | | $ | 864,738,291 | |
Investments in affiliated money market funds, at value (Cost $22,023,547) | | | 22,023,547 | |
Foreign currencies, at value (Cost $1,312) | | | 1,380 | |
Receivable for: | | | | |
Investments sold | | | 36,657,008 | |
Fund shares sold | | | 16,215 | |
Dividends | | | 867,546 | |
Investment for trustee deferred compensation and retirement plans | | | 446,220 | |
Total assets | | | 924,750,207 | |
| |
Liabilities: | | | | |
| |
Payable for: | | | | |
Investments purchased | | | 44,729,544 | |
Fund shares reacquired | | | 654,815 | |
Amount due custodian | | | 144,708 | |
Accrued fees to affiliates | | | 286,684 | |
Accrued trustees’ and officers’ fees and benefits | | | 498 | |
Accrued other operating expenses | | | 56,462 | |
Trustee deferred compensation and retirement plans | | | 481,602 | |
Total liabilities | | | 46,354,313 | |
Net assets applicable to shares outstanding | | $ | 878,395,894 | |
| |
Net assets consist of: | | | | |
| |
Shares of beneficial interest | | $ | 550,433,158 | |
Distributable earnings | | | 327,962,736 | |
| | | $ | 878,395,894 | |
| |
Net Assets: | | | | |
| |
Series I | | $ | 855,744,328 | |
Series II | | $ | 22,651,566 | |
|
Shares outstanding, no par value, with an unlimited number of shares authorized: | |
| |
Series I | | | 24,483,726 | |
Series II | | | 650,765 | |
Series I: | | | | |
Net asset value per share | | $ | 34.95 | |
Series II: | | | | |
Net asset value per share | | $ | 34.81 | |
Statement of Operations
For the year ended December 31, 2019
| | | | |
Investment income: | | | | |
| |
Dividends (net of foreign withholding taxes of $281,931) | | $ | 16,386,875 | |
| |
Dividends from affiliated money market funds | | | 352,661 | |
| |
Total investment income | | | 16,739,536 | |
| |
| |
Expenses: | | | | |
| |
Advisory fees | | | 5,510,639 | |
| |
Administrative services fees | | | 1,324,103 | |
| |
Custodian fees | | | 1,789 | |
| |
Distribution fees - Series II | | | 54,740 | |
| |
Transfer agent fees | | | 58,395 | |
| |
Trustees’ and officers’ fees and benefits | | | 31,963 | |
| |
Reports to shareholders | | | 9,244 | |
| |
Professional services fees | | | 50,151 | |
| |
Other | | | 16,457 | |
| |
Total expenses | | | 7,057,481 | |
| |
Less: Fees waived | | | (18,396 | ) |
| |
Net expenses | | | 7,039,085 | |
| |
Net investment income | | | 9,700,451 | |
| |
|
Realized and unrealized gain (loss) from: | |
| |
Net realized gain (loss) from: | | | | |
Investment securities (includes net gains from securities sold to affiliates of $14,806,769) | | | 165,074,328 | |
| |
Foreign currencies | | | (25,361 | ) |
| |
| | | 165,048,967 | |
| |
Change in net unrealized appreciation (depreciation) of: | |
Investment securities | | | 53,504,250 | |
| |
Foreign currencies | | | (1,776 | ) |
| |
| | | 53,502,474 | |
| |
Net realized and unrealized gain | | | 218,551,441 | |
| |
Net increase in net assets resulting from operations | | $ | 228,251,892 | |
| |
See accompanying Notes to Financial Statements which are an integral part of the financial statements.
Invesco V.I. Core Equity Fund
Statement of Changes in Net Assets
For the years ended December 31, 2019 and 2018
| | | | | | | | |
| | | 2019 | | | 2018 | |
| |
Operations: | | | | | | | | |
| | |
Net investment income | | $ | 9,700,451 | | | $ | 7,271,862 | |
| |
Net realized gain | | | 165,048,967 | | | | 96,380,296 | |
| |
Change in net unrealized appreciation (depreciation) | | | 53,502,474 | | | | (197,550,328 | ) |
| |
Net increase (decrease) in net assets resulting from operations | | | 228,251,892 | | | | (93,898,170 | ) |
| |
| | |
Distributions to shareholders from distributable earnings: | | | | | | | | |
| | |
Series I | | | (102,597,293 | ) | | | (72,928,447 | ) |
| |
Series II | | | (2,536,276 | ) | | | (1,504,788 | ) |
| |
Total distributions from distributable earnings | | | (105,133,569 | ) | | | (74,433,235 | ) |
| |
| | |
Share transactions–net: | | | | | | | | |
| | |
Series I | | | (123,248,676 | ) | | | (35,235,681 | ) |
| |
Series II | | | (504,539 | ) | | | (162,186,906 | ) |
| |
Net increase (decrease) in net assets resulting from share transactions | | | (123,753,215 | ) | | | (197,422,587 | ) |
| |
Net increase (decrease) in net assets | | | (634,892 | ) | | | (365,753,992 | ) |
| |
| | |
Net assets: | | | | | | | | |
| | |
Beginning of year | | | 879,030,786 | | | | 1,244,784,778 | |
| |
End of year | | $ | 878,395,894 | | | $ | 879,030,786 | |
| |
See accompanying Notes to Financial Statements which are an integral part of the financial statements.
Invesco V.I. Core Equity Fund
Financial Highlights
The following schedule presents financial highlights for a share of the Fund outstanding throughout the periods indicated.
| | | | | | | | | | | | | | | | | | | | | | | | | | | | | | | | | | | | | | | | | | | | | | | | | | | | | | | | | | | | | | | | | | | | | | |
| | | | | | | | | | | | | | | | | | | | | | | Ratio of | | Ratio of | | | | |
| | | | | | | | | | | | | | | | | | | | | | | expenses | | expenses | | | | |
| | | | | | | Net gains | | | | | | | | | | | | | | | | to average | | to average net | | | | |
| | | | | | | (losses) | | | | | | | | | | | | | | | | net assets | | assets without | | Ratio of net | | |
| | | Net asset | | | | on securities | | | | Dividends | | Distributions | | | | | | | | | | with fee waivers | | fee waivers | | investment | | |
| | | value, | | Net | | (both | | Total from | | from net | | from net | | | | Net asset | | | | Net assets, | | and/or | | and/or | | income | | |
| | | beginning | | investment | | realized and | | investment | | investment | | realized | | Total | | value, end | | Total | | end of period | | expenses | | expenses | | to average | | Portfolio |
| | | of period | | income(a) | | unrealized) | | operations | | income | | gains | | distributions | | of period | | return (b) | | (000’s omitted) | | absorbed | | absorbed | | net assets | | turnover (c) |
Series I | | | | | | | | | | | | | | | | | | | | | | | | | | | | | | | | | | | | | | | | | | | | | | | | | | | | | | | | | | | | | | | | | | | | | | |
Year ended 12/31/19 | | | $ | 30.94 | | | | $ | 0.38 | | | | $ | 8.22 | | | | $ | 8.60 | | | | $ | (0.35 | ) | | | $ | (4.24 | ) | | | $ | (4.59 | ) | | | $ | 34.95 | | | | | 28.97 | % | | | $ | 855,744 | | | | | 0.78 | %(d) | | | | 0.78 | %(d) | | | | 1.08 | %(d) | | | | 82 | % |
Year ended 12/31/18 | | | | 36.72 | | | | | 0.25 | | | | | (3.29 | ) | | | | (3.04 | ) | | | | (0.34 | ) | | | | (2.40 | ) | | | | (2.74 | ) | | | | 30.94 | | | | | (9.40 | ) | | | | 858,828 | | | | | 0.79 | | | | | 0.80 | | | | | 0.70 | | | | | 46 | |
Year ended 12/31/17 | | | | 34.58 | | | | | 0.27 | | | | | 4.21 | | | | | 4.48 | | | | | (0.39 | ) | | | | (1.95 | ) | | | | (2.34 | ) | | | | 36.72 | | | | | 13.17 | | | | | 1,054,802 | | | | | 0.79 | | | | | 0.80 | | | | | 0.74 | | | | | 30 | |
Year ended 12/31/16 | | | | 33.84 | | | | | 0.39 | | | | | 3.07 | | | | | 3.46 | | | | | (0.28 | ) | | | | (2.44 | ) | | | | (2.72 | ) | | | | 34.58 | | | | | 10.26 | | | | | 1,033,700 | | | | | 0.84 | | | | | 0.85 | | | | | 1.11 | | | | | 38 | |
Year ended 12/31/15 | | | | 41.00 | | | | | 0.32 | | | | | (2.79 | ) | | | | (2.47 | ) | | | | (0.46 | ) | | | | (4.23 | ) | | | | (4.69 | ) | | | | 33.84 | | | | | (5.75 | ) | | | | 921,516 | | | | | 0.89 | | | | | 0.90 | | | | | 0.81 | | | | | 45 | |
Series II | | | | | | | | | | | | | | | | | | | | | | | | | | | | | | | | | | | | | | | | | | | | | | | | | | | | | | | | | | | | | | | | | | | | | | |
Year ended 12/31/19 | | | | 30.66 | | | | | 0.29 | | | | | 8.16 | | | | | 8.45 | | | | | (0.06 | ) | | | | (4.24 | ) | | | | (4.30 | ) | | | | 34.81 | | | | | 28.66 | | | | | 22,652 | | | | | 1.03 | (d) | | | | 1.03 | (d) | | | | 0.83 | (d) | | | | 82 | |
Year ended 12/31/18 | | | | 36.18 | | | | | 0.16 | | | | | (3.28 | ) | | | | (3.12 | ) | | | | – | | | | | (2.40 | ) | | | | (2.40 | ) | | | | 30.66 | | | | | (9.61 | ) | | | | 20,203 | | | | | 1.04 | | | | | 1.05 | | | | | 0.45 | | | | | 46 | |
Year ended 12/31/17 | | | | 34.11 | | | | | 0.18 | | | | | 4.14 | | | | | 4.32 | | | | | (0.30 | ) | | | | (1.95 | ) | | | | (2.25 | ) | | | | 36.18 | | | | | 12.87 | | | | | 189,982 | | | | | 1.04 | | | | | 1.05 | | | | | 0.49 | | | | | 30 | |
Year ended 12/31/16 | | | | 33.40 | | | | | 0.30 | | | | | 3.03 | | | | | 3.33 | | | | | (0.18 | ) | | | | (2.44 | ) | | | | (2.62 | ) | | | | 34.11 | | | | | 10.02 | | | | | 179,596 | | | | | 1.09 | | | | | 1.10 | | | | | 0.86 | | | | | 38 | |
Year ended 12/31/15 | | | | 40.53 | | | | | 0.22 | | | | | (2.75 | ) | | | | (2.53 | ) | | | | (0.37 | ) | | | | (4.23 | ) | | | | (4.60 | ) | | | | 33.40 | | | | | (5.98 | ) | | | | 178,126 | | | | | 1.14 | | | | | 1.15 | | | | | 0.56 | | | | | 45 | |
| (a) | Calculated using average shares outstanding. |
| (b) | Includes adjustments in accordance with accounting principles generally accepted in the United States of America and as such, the net asset value for financial reporting purposes and the returns based upon those net asset values may differ from the net asset value and returns for shareholder transactions. Total returns are not annualized for periods less than one year, if applicable, and do not reflect charges assessed in connection with a variable product, which if included would reduce total returns. |
| (c) | Portfolio turnover is calculated at the fund level and is not annualized for periods less than one year, if applicable. |
| (d) | Ratios are based on average daily net assets (000’s omitted) of $875,709 and $21,898 for Series I and Series II shares, respectively. |
See accompanying Notes to Financial Statements which are an integral part of the financial statements.
Invesco V.I. Core Equity Fund
Notes to Financial Statements
December 31, 2019
NOTE 1–Significant Accounting Policies
Invesco V.I. Core Equity Fund (the “Fund”) is a series portfolio of AIM Variable Insurance Funds (Invesco Variable Insurance Funds) (the “Trust”). The Trust is a Delaware statutory trust registered under the Investment Company Act of 1940, as amended (the “1940 Act”), as anopen-end series management investment company. Information presented in these financial statements pertains only to the Fund. Matters affecting the Fund or each class will be voted on exclusively by the shareholders of the Fund or each class. Current Securities and Exchange Commission (“SEC”) guidance, however, requires participating insurance companies offering separate accounts to vote shares proportionally in accordance with the instructions of the contract owners whose investments are funded by shares of each Fund or class.
The Fund’s investment objective is long-term growth of capital.
The Fund currently offers two classes of shares, Series I and Series II, both of which are offered to insurance company separate accounts funding variable annuity contracts and variable life insurance policies (“variable products”).
The Fund is an investment company and accordingly follows the investment company accounting and reporting guidance in accordance with Financial Accounting Standards Board Accounting Standards Codification Topic 946,Financial Services – Investment Companies.
The following is a summary of the significant accounting policies followed by the Fund in the preparation of its financial statements.
| A. | Security Valuations– Securities, including restricted securities, are valued according to the following policy. |
A security listed or traded on an exchange (except convertible securities) is valued at its last sales price or official closing price as of the close of the customary trading session on the exchange where the security is principally traded, or lacking any sales or official closing price on a particular day, the security may be valued at the closing bid price on that day. Securities traded in theover-the-counter market are valued based on prices furnished by independent pricing services or market makers. When such securities are valued by an independent pricing service they may be considered fair valued. Futures contracts are valued at the final settlement price set by an exchange on which they are principally traded. Listed options are valued at the mean between the last bid and asked prices from the exchange on which they are principally traded. Options not listed on an exchange are valued by an independent source at the mean between the last bid and asked prices. For purposes of determining net asset value (“NAV”) per share, futures and option contracts generally are valued 15 minutes after the close of the customary trading session of the New York Stock Exchange (“NYSE”).
Investments inopen-end andclosed-end registered investment companies that do not trade on an exchange are valued at theend-of-day net asset value per share. Investments inopen-end andclosed-end registered investment companies that trade on an exchange are valued at the last sales price or official closing price as of the close of the customary trading session on the exchange where the security is principally traded.
Debt obligations (including convertible securities) and unlisted equities are fair valued using an evaluated quote provided by an independent pricing service. Evaluated quotes provided by the pricing service may be determined without exclusive reliance on quoted prices, and may reflect appropriate factors such asinstitution-size trading in similar groups of securities, developments related to specific securities, dividend rate (for unlisted equities), yield (for debt obligations), quality, type of issue, coupon rate (for debt obligations), maturity (for debt obligations), individual trading characteristics and other market data. Pricing services generally value debt obligations assuming orderly transactions of institutional round lot size, but a fund may hold or transact in the same securities in smaller, odd lot sizes. Odd lots often trade at lower prices than institutional round lots. Debt obligations are subject to interest rate and credit risks. In addition, all debt obligations involve some risk of default with respect to interest and/or principal payments.
Foreign securities’ (including foreign exchange contracts) prices are converted into U.S. dollar amounts using the applicable exchange rates as of the close of the NYSE. If market quotations are available and reliable for foreign exchange-traded equity securities, the securities will be valued at the market quotations. Because trading hours for certain foreign securities end before the close of the NYSE, closing market quotations may become unreliable. If between the time trading ends on a particular security and the close of the customary trading session on the NYSE, events occur that the investment adviser determines are significant and make the closing price unreliable, the Fund may fair value the security. If the event is likely to have affected the closing price of the security, the security will be valued at fair value in good faith using procedures approved by the Board of Trustees. Adjustments to closing prices to reflect fair value may also be based on a screening process of an independent pricing service to indicate the degree of certainty, based on historical data, that the closing price in the principal market where a foreign security trades is not the current value as of the close of the NYSE. Foreign securities’ prices meeting the approved degree of certainty that the price is not reflective of current value will be priced at the indication of fair value from the independent pricing service. Multiple factors may be considered by the independent pricing service in determining adjustments to reflect fair value and may include information relating to sector indices, American Depositary Receipts and domestic and foreign index futures. Foreign securities may have additional risks including exchange rate changes, potential for sharply devalued currencies and high inflation, political and economic upheaval, the relative lack of issuer information, relatively low market liquidity and the potential lack of strict financial and accounting controls and standards.
Securities for which market prices are not provided by any of the above methods may be valued based upon quotes furnished by independent sources. The last bid price may be used to value equity securities. The mean between the last bid and asked prices is used to value debt obligations, including corporate loans.
Securities for which market quotations are not readily available or became unreliable are valued at fair value as determined in good faith by or under the supervision of the Trust’s officers following procedures approved by the Board of Trustees. Issuer specific events, market trends, bid/asked quotes of brokers and information providers and other market data may be reviewed in the course of making a good faith determination of a security’s fair value.
The Fund may invest in securities that are subject to interest rate risk, meaning the risk that the prices will generally fall as interest rates rise and, conversely, the prices will generally rise as interest rates fall. Specific securities differ in their sensitivity to changes in interest rates depending on their individual characteristics. Changes in interest rates may result in increased market volatility, which may affect the value and/or liquidity of certain Fund investments.
Invesco V.I. Core Equity Fund
Valuations change in response to many factors including the historical and prospective earnings of the issuer, the value of the issuer’s assets, general economic conditions, interest rates, investor perceptions and market liquidity. Because of the inherent uncertainties of valuation, the values reflected in the financial statements may materially differ from the value received upon actual sale of those investments.
| B. | Securities Transactions and Investment Income– Securities transactions are accounted for on a trade date basis. Realized gains or losses on sales are computed on the basis of specific identification of the securities sold. Interest income (net of withholding tax, if any) is recorded on the accrual basis from settlement date. Dividend income (net of withholding tax, if any) is recorded on theex-dividend date. |
The Fund may periodically participate in litigation related to Fund investments. As such, the Fund may receive proceeds from litigation settlements. Any proceeds received are included in the Statement of Operations as realized gain (loss) for investments no longer held and as unrealized gain (loss) for investments still held.
Brokerage commissions and mark ups are considered transaction costs and are recorded as an increase to the cost basis of securities purchased and/or a reduction of proceeds on a sale of securities. Such transaction costs are included in the determination of net realized and unrealized gain (loss) from investment securities reported in the Statement of Operations and the Statement of Changes in Net Assets and the net realized and unrealized gains (losses) on securities per share in the Financial Highlights. Transaction costs are included in the calculation of the Fund’s net asset value and, accordingly, they reduce the Fund’s total returns. These transaction costs are not considered operating expenses and are not reflected in net investment income reported in the Statement of Operations and the Statement of Changes in Net Assets, or the net investment income per share and the ratios of expenses and net investment income reported in the Financial Highlights, nor are they limited by any expense limitation arrangements between the Fund and the investment adviser.
The Fund allocates income and realized and unrealized capital gains and losses to a class based on the relative net assets of each class.
| C. | Country Determination – For the purposes of making investment selection decisions and presentation in the Schedule of Investments, the investment adviser may determine the country in which an issuer is located and/or credit risk exposure based on various factors. These factors include the laws of the country under which the issuer is organized, where the issuer maintains a principal office, the country in which the issuer derives 50% or more of its total revenues and the country that has the primary market for the issuer’s securities, as well as other criteria. Among the other criteria that may be evaluated for making this determination are the country in which the issuer maintains 50% or more of its assets, the type of security, financial guarantees and enhancements, the nature of the collateral and the sponsor organization. Country of issuer and/or credit risk exposure has been determined to be the United States of America, unless otherwise noted. |
| D. | Distributions– Distributions from net investment income and net realized capital gain, if any, are generally declared and paid to separate accounts of participating insurance companies annually and recorded on theex-dividend date. |
| E. | Federal Income Taxes–The Fund intends to comply with the requirements of Subchapter M of the Internal Revenue Code of 1986, as amended (the “Internal Revenue Code”), necessary to qualify as a regulated investment company and to distribute substantially all of the Fund’s taxable earnings to shareholders. As such, the Fund will not be subject to federal income taxes on otherwise taxable income (including net realized capital gain) that is distributed to shareholders. Therefore, no provision for federal income taxes is recorded in the financial statements. |
The Fund recognizes the tax benefits of uncertain tax positions only when the position is more likely than not to be sustained. Management has analyzed the Fund’s uncertain tax positions and concluded that no liability for unrecognized tax benefits should be recorded related to uncertain tax positions. Management is not aware of any tax positions for which it is reasonably possible that the total amounts of unrecognized tax benefits will change materially in the next 12 months.
The Fund files tax returns in the U.S. Federal jurisdiction and certain other jurisdictions. Generally, the Fund is subject to examinations by such taxing authorities for up to three years after the filing of the return for the tax period.
| F. | Expenses– Fees provided for under the Rule12b-1 plan of a particular class of the Fund and which are directly attributable to that class are charged to the operations of such class. All other expenses are allocated among the classes based on relative net assets. |
| G. | Accounting Estimates–The preparation of financial statements in conformity with accounting principles generally accepted in the United States of America (“GAAP”) requires management to make estimates and assumptions that affect the reported amounts of assets and liabilities at the date of the financial statements and the reported amounts of revenues and expenses during the reporting period including estimates and assumptions related to taxation. Actual results could differ from those estimates by a significant amount. In addition, the Fund monitors for material events or transactions that may occur or become known after theperiod-end date and before the date the financial statements are released to print. |
| H. | Indemnifications– Under the Trust’s organizational documents, each Trustee, officer, employee or other agent of the Trust is indemnified against certain liabilities that may arise out of the performance of their duties to the Fund. Additionally, in the normal course of business, the Fund enters into contracts, including the Fund’s servicing agreements, that contain a variety of indemnification clauses. The Fund’s maximum exposure under these arrangements is unknown as this would involve future claims that may be made against the Fund that have not yet occurred. The risk of material loss as a result of such indemnification claims is considered remote. |
| I. | Foreign Currency Translations– Foreign currency is valued at the close of the NYSE based on quotations posted by banks and major currency dealers. Portfolio securities and other assets and liabilities denominated in foreign currencies are translated into U.S. dollar amounts at the date of valuation. Purchases and sales of portfolio securities (net of foreign taxes withheld on disposition) and income items denominated in foreign currencies are translated into U.S. dollar amounts on the respective dates of such transactions. The Fund does not separately account for the portion of the results of operations resulting from changes in foreign exchange rates on investments and the fluctuations arising from changes in market prices of securities held. The combined results of changes in foreign exchange rates and the fluctuation of market prices on investments (net of estimated foreign tax withholding) are included with the net realized and unrealized gain or loss from investments in the Statement of Operations. Reported net realized foreign currency gains or losses arise from (1) sales of foreign currencies, (2) currency gains or losses realized between the trade and settlement dates on securities transactions, and (3) the difference between the amounts of dividends, interest, and foreign withholding taxes recorded on the Fund’s books and the U.S. dollar equivalent of the amounts actually received or paid. Net unrealized foreign currency gains and losses arise from changes in the fair values of assets and liabilities, other than investments in securities at fiscal period end, resulting from changes in exchange rates. |
The Fund may invest in foreign securities, which may be subject to foreign taxes on income, gains on investments or currency repatriation, a portion of which may be recoverable. Foreign taxes, if any, are recorded based on the tax regulations and rates that exist in the foreign markets in which the Fund invests and are shown in the Statement of Operations.
Invesco V.I. Core Equity Fund
| J. | Forward Foreign Currency Contracts– The Fund may engage in foreign currency transactions either on a spot (i.e. for prompt delivery and settlement) basis, or through forward foreign currency contracts, to manage or minimize currency or exchange rate risk. |
The Fund may also enter into forward foreign currency contracts for the purchase or sale of a security denominated in a foreign currency in order to “lock in” the U.S. dollar price of that security, or the Fund may also enter into forward foreign currency contracts that do not provide for physical settlement of the two currencies, but instead are settled by a single cash payment calculated as the difference between the agreed upon exchange rate and the spot rate at settlement based upon an agreed upon notional amount(non-deliverable forwards). The Fund will set aside liquid assets in an amount equal to the dailymark-to-market obligation for forward foreign currency contracts.
A forward foreign currency contract is an obligation between two parties (“Counterparties”) to purchase or sell a specific currency for an agreed-upon price at a future date. The use of forward foreign currency contracts does not eliminate fluctuations in the price of the underlying securities the Fund owns or intends to acquire but establishes a rate of exchange in advance. Fluctuations in the value of these contracts are measured by the difference in the contract date and reporting date exchange rates and are recorded as unrealized appreciation (depreciation) until the contracts are closed. When the contracts are closed, realized gains (losses) are recorded. Realized and unrealized gains (losses) on the contracts are included in the Statement of Operations. The primary risks associated with forward foreign currency contracts include failure of the Counterparty to meet the terms of the contract and the value of the foreign currency changing unfavorably. These risks may be in excess of the amounts reflected in the Statement of Assets and Liabilities.
NOTE 2–Advisory Fees and Other Fees Paid to Affiliates
The Trust has entered into a master investment advisory agreement with Invesco Advisers, Inc. (the “Adviser” or “Invesco”). Under the terms of the investment advisory agreement, the Fund accrues daily and pays monthly an advisory fee to the Adviser based on the annual rate of the Fund’s average daily net assets as follows:
| | | | |
| Average Daily Net Assets | | Rate | |
First $ 250 million | | | 0.650 | % |
Over $250 million | | | 0.600 | % |
For the year ended December 31, 2019, the effective advisory fee rate incurred by the Fund was 0.61%.
Under the terms of a mastersub-advisory agreement between the Adviser and each of Invesco Asset Management Deutschland GmbH, Invesco Asset Management Limited, Invesco Asset Management (Japan) Limited, Invesco Hong Kong Limited, Invesco Senior Secured Management, Inc. and Invesco Canada Ltd. and separatesub-advisory agreements with Invesco Capital Management LLC and Invesco Asset Management (India) Private Limited (collectively, the “AffiliatedSub-Advisers”) the Adviser, not the Fund, will pay 40% of the fees paid to the Adviser to any such AffiliatedSub-Adviser(s) that provide(s) discretionary investment management services to the Fund based on the percentage of assets allocated to such AffiliatedSub-Adviser(s).
The Adviser has contractually agreed, through at least June 30, 2020, to waive advisory fees and/or reimburse expenses of all shares to the extent necessary to limit total annual fund operating expenses after fee waiver and/or expense reimbursement (excluding certain items discussed below) of Series I shares to 2.00% and Series II shares to 2.25% of average daily net assets (the “expense limits”). In determining the Adviser’s obligation to waive advisory fees and/or reimburse expenses, the following expenses are not taken into account, and could cause the total annual fund operating expenses after fee waiver and/or expense reimbursement to exceed the numbers reflected above: (1) interest; (2) taxes; (3) dividend expense on short sales; (4) extraordinary ornon-routine items, including litigation expenses; and (5) expenses that the Fund has incurred but did not actually pay because of an expense offset arrangement. Unless Invesco continues the fee waiver agreement, it will terminate on June 30, 2020. During its term, the fee waiver agreement cannot be terminated or amended to increase the expense limits or reduce the advisory fee waiver without approval of the Board of Trustees. The Adviser did not waive fees and/or reimburse expenses during the period under these expense limits.
Further, the Adviser has contractually agreed, through at least June 30, 2021, to waive the advisory fee payable by the Fund in an amount equal to 100% of the net advisory fees the Adviser receives from the affiliated money market funds on investments by the Fund of uninvested cash in such affiliated money market funds.
For the year ended December 31, 2019, the Adviser waived advisory fees of $18,396.
The Trust has entered into a master administrative services agreement with Invesco pursuant to which the Fund has agreed to pay Invesco a fee for costs incurred in providing accounting services and fund administrative services to the Fund and to reimburse Invesco for fees paid to insurance companies that have agreed to provide certain administrative services to the Fund. These administrative services provided by the insurance companies may include, among other things: maintenance of master accounts with the Fund; tracking, recording and transmitting net purchase and redemption orders for Fund shares; maintaining and preserving records related to the purchase, redemption and other account activity of variable product owners; distributing copies of Fund documents such as prospectuses, proxy materials and periodic reports, to variable product owners, and responding to inquiries from variable product owners about the Fund. Pursuant to such agreement, for the year ended December 31, 2019, Invesco was paid $129,428 for accounting and fund administrative services and was reimbursed $1,194,675 for fees paid to insurance companies. Invesco has entered into asub-administration agreement whereby State Street Bank and Trust Company (“SSB”) serves as fund accountant and provides certain administrative services to the Fund. Pursuant to a custody agreement with the Trust on behalf of the Fund, SSB also serves as the Fund’s custodian.
The Trust has entered into a transfer agency and service agreement with Invesco Investment Services, Inc. (“IIS”) pursuant to which the Fund has agreed to pay IIS a fee for providing transfer agency and shareholder services to the Fund and reimburse IIS for certain expenses incurred by IIS in the course of providing such services. For the year ended December 31, 2019, expenses incurred under the agreement are shown in the Statement of Operations asTransfer agent fees.
The Trust has entered into a master distribution agreement with Invesco Distributors, Inc. (“IDI”) to serve as the distributor for the Fund. The Trust has adopted a plan pursuant to Rule12b-1 under the 1940 Act with respect to the Fund’s Series II shares (the “Plan”). The Fund, pursuant to the Plan, pays IDI compensation at the annual rate of 0.25% of the Fund’s average daily net assets of Series II shares. The fees are accrued daily and paid monthly. Of the Plan payments, up to 0.25% of the average daily net assets of the Series II shares may be paid to insurance companies who furnish continuing personal shareholder services to customers who purchase and own Series II shares of the Fund. For the year ended December 31, 2019, expenses incurred under the Plan are detailed in the Statement of Operations asDistribution fees.
Invesco V.I. Core Equity Fund
For the year ended December 31, 2019, the Fund incurred $964 in brokerage commissions with Invesco Capital Markets, Inc., an affiliate of the Adviser and IDI, for portfolio transactions executed on behalf of the Fund.
Certain officers and trustees of the Trust are officers and directors of the Adviser, IIS and/or IDI.
NOTE 3–Additional Valuation Information
GAAP defines fair value as the price that would be received to sell an asset or paid to transfer a liability in an orderly transaction between market participants at the measurement date, under current market conditions. GAAP establishes a hierarchy that prioritizes the inputs to valuation methods, giving the highest priority to readily available unadjusted quoted prices in an active market for identical assets (Level 1) and the lowest priority to significant unobservable inputs (Level 3), generally when market prices are not readily available or are unreliable. Based on the valuation inputs, the securities or other investments are tiered into one of three levels. Changes in valuation methods may result in transfers in or out of an investment’s assigned level:
| | Level 1 - | Prices are determined using quoted prices in an active market for identical assets. |
| | Level 2 - | Prices are determined using other significant observable inputs. Observable inputs are inputs that other market participants may use in pricing a security. These may include quoted prices for similar securities, interest rates, prepayment speeds, credit risk, yield curves, loss severities, default rates, discount rates, volatilities and others. |
| | Level 3 - | Prices are determined using significant unobservable inputs. In situations where quoted prices or observable inputs are unavailable (for example, when there is little or no market activity for an investment at the end of the period), unobservable inputs may be used. Unobservable inputs reflect the Fund’s own assumptions about the factors market participants would use in determining fair value of the securities or instruments and would be based on the best available information. |
The following is a summary of the tiered valuation input levels, as of December 31, 2019. The level assigned to the securities valuations may not be an indication of the risk or liquidity associated with investing in those securities. Because of the inherent uncertainties of valuation, the values reflected in the financial statements may materially differ from the value received upon actual sale of those investments.
| | | | | | | | | | | | | | |
| | | Level 1 | | | Level 2 | | | Level 3 | | | Total |
Investments in Securities | | | | | | | | | | | | | | |
Common Stocks & Other Equity Interests | | | $855,596,311 | | | | $9,141,980 | | | | $– | | | $864,738,291 |
Money Market Funds | | | 22,023,547 | | | | – | | | | – | | | 22,023,547 |
Total Investments | | | $877,619,858 | | | | $9,141,980 | | | | $– | | | $886,761,838 |
NOTE 4–Security Transactions with Affiliated Funds
The Fund is permitted to purchase or sell securities from or to certain other Invesco Funds under specified conditions outlined in procedures adopted by the Board of Trustees of the Trust. The procedures have been designed to ensure that any purchase or sale of securities by the Fund from or to another fund or portfolio that is or could be considered an affiliate by virtue of having a common investment adviser (or affiliated investment advisers), common Trustees and/or common officers complies with Rule17a-7 of the 1940 Act. Further, as defined under the procedures, each transaction is effected at the current market price. Pursuant to these procedures, for the year ended December 31, 2019, the Fund engaged in securities purchases of $158,037,131 and securities sales of $34,914,135, which resulted in net realized gains of $14,806,769.
NOTE 5–Trustees’ and Officers’ Fees and Benefits
Trustees’ and Officers’ Fees and Benefits include amounts accrued by the Fund to pay remuneration to certain Trustees and Officers of the Fund. Trustees have the option to defer compensation payable by the Fund, andTrustees’ and Officers’ Fees and Benefits also include amounts accrued by the Fund to fund such deferred compensation amounts. Those Trustees who defer compensation have the option to select various Invesco Funds in which their deferral accounts shall be deemed to be invested. Finally, certain current Trustees were eligible to participate in a retirement plan that provided for benefits to be paid upon retirement to Trustees over a period of time based on the number of years of service. The Fund may have certain former Trustees who also participate in a retirement plan and receive benefits under such plan.Trustees’ and Officers’ Fees and Benefits include amounts accrued by the Fund to fund such retirement benefits. Obligations under the deferred compensation and retirement plans represent unsecured claims against the general assets of the Fund.
NOTE 6–Cash Balances
The Fund is permitted to temporarily carry a negative or overdrawn balance in its account with SSB, the custodian bank. Such balances, if any atperiod-end, are shown in the Statement of Assets and Liabilities under the payable caption Amount due custodian. To compensate the custodian bank for such overdrafts, the overdrawn Fund may either (1) leave funds as a compensating balance in the account so the custodian bank can be compensated by earning the additional interest; or (2) compensate by paying the custodian bank at a rate agreed upon by the custodian bank and Invesco, not to exceed the contractually agreed upon rate.
NOTE 7–Distributions to Shareholders and Tax Components of Net Assets
Tax Character of Distributions to Shareholders Paid During the Fiscal Years Ended December 31, 2019 and 2018:
| | | | | | |
| | | 2019 | | | 2018 |
Ordinary income | | $ | 7,836,902 | | | $ 8,935,012 |
Long-term capital gain | | | 97,296,667 | | | 65,498,223 |
Total distributions | | $ | 105,133,569 | | | $74,433,235 |
Invesco V.I. Core Equity Fund
Tax Components of Net Assets atPeriod-End:
| | | | |
| | | 2019 | |
| |
Undistributed ordinary income | | $ | 19,051,887 | |
| |
Undistributed long-term capital gain | | | 151,310,128 | |
| |
Net unrealized appreciation – investments | | | 157,980,295 | |
| |
Net unrealized appreciation (depreciation) - foreign currencies | | | (8,230 | ) |
| |
Temporary book/tax differences | | | (371,344 | ) |
| |
Shares of beneficial interest | | | 550,433,158 | |
| |
Total net assets | | $ | 878,395,894 | |
| |
The difference between book-basis andtax-basis unrealized appreciation (depreciation) is due to differences in the timing of recognition of gains and losses on investments for tax and book purposes. The Fund’s net unrealized appreciation difference is attributable primarily to wash sales.
The temporary book/tax differences are a result of timing differences between book and tax recognition of income and/or expenses. The Fund’s temporary book/tax differences are the result of the trustee deferral of compensation and retirement plan benefits.
Capital loss carryforward is calculated and reported as of a specific date. Results of transactions and other activity after that date may affect the amount of capital loss carryforward actually available for the Fund to utilize. Capital losses generated in years beginning after December 22, 2010 can be carried forward for an unlimited period, whereas previous losses expire in eight tax years. Capital losses with an expiration period may not be used to offset capital gains until all net capital losses without an expiration date have been utilized. Capital loss carryforwards with no expiration date will retain their character as either short-term or long-term capital losses instead of as short-term capital losses as under prior law. The ability to utilize capital loss carryforwards in the future may be limited under the Internal Revenue Code and related regulations based on the results of future transactions.
The Fund does not have a capital loss carryforward as of December 31, 2019.
NOTE 8–Investment Transactions
The aggregate amount of investment securities (other than short-term securities, U.S. Treasury obligations and money market funds, if any) purchased and sold by the Fund during the year ended December 31, 2019 was $713,150,246 and $918,220,327, respectively. Cost of investments, including any derivatives, on a tax basis includes the adjustments for financial reporting purposes as of the most recently completed federal income tax reportingperiod-end.
Unrealized Appreciation (Depreciation) of Investments on a Tax Basis
| | | | |
| |
Aggregate unrealized appreciation of investments | | $ | 162,307,282 | |
| |
Aggregate unrealized (depreciation) of investments | | | (4,326,987 | ) |
| |
Net unrealized appreciation of investments | | $ | 157,980,295 | |
| |
Cost of investments for tax purposes is $728,781,543.
NOTE 9–Reclassification of Permanent Differences
Primarily as a result of differing book/tax treatment of foreign currency transactions, on December 31, 2019, undistributed net investment income was decreased by $23,949 and undistributed net realized gain was increased by $23,949. This reclassification had no effect on the net assets or the distributable earnings of the Fund.
NOTE 10–Share Information
| | | | | | | | | | | | | | | | |
| | | Summary of Share Activity | |
| |
| | | Year ended | | | Year ended | |
| | | December 31, 2019(a) | | | December 31, 2018 | |
| | | | | | | | |
| | | Shares | | | Amount | | | Shares | | | Amount | |
| |
Sold: | | | | | | | | | | | | | | | | |
| | | | |
Series I | | | 435,385 | | | $ | 14,832,571 | | | | 1,686,758 | | | $ | 61,083,116 | |
| |
Series II | | | 38,664 | | | | 1,330,035 | | | | 96,316 | | | | 3,437,247 | |
| |
| | | | |
Issued as reinvestment of dividends: | | | | | | | | | | | | | | | | |
| | | | |
Series I | | | 3,165,606 | | | | 102,597,293 | | | | 2,005,181 | | | | 72,928,448 | |
| |
Series II | | | 78,522 | | | | 2,536,276 | | | | 41,719 | | | | 1,504,788 | |
| |
Invesco V.I. Core Equity Fund
| | | | | | | | | | | | | | | | |
| | | Summary of Share Activity | |
| |
| | | Year ended | | | Year ended | |
| | | December 31, 2019(a) | | | December 31, 2018 | |
| | | | | | | | |
| | | Shares | | | Amount | | | Shares | | | Amount | |
| |
| | | | |
Reacquired: | | | | | | | | | | | | | | | | |
| | | | |
Series I | | | (6,876,372 | ) | | $ | (240,678,540 | ) | | | (4,659,767 | ) | | $ | (169,247,245 | ) |
| |
Series II | | | (125,341 | ) | | | (4,370,850 | ) | | | (4,730,829 | ) | | | (167,128,941 | ) |
| |
Net increase (decrease) in share activity | | | (3,283,536 | ) | | $ | (123,753,215 | ) | | | (5,560,622 | ) | | $ | (197,422,587 | ) |
| |
| (a) | There are entities that are record owners of more than 5% of the outstanding shares of the Fund and in the aggregate own 56% of the outstanding shares of the Fund. The Fund and the Fund’s principal underwriter or adviser, are parties to participation agreements with these entities whereby these entities sell units of interest in separate accounts funding variable products that are invested in the Fund. The Fund, Invesco and/or Invesco affiliates may make payments to these entities, which are considered to be related to the Fund, for providing services to the Fund, Invesco and/or Invesco affiliates including but not limited to services such as, securities brokerage, third party record keeping and account servicing and administrative services. The Fund has no knowledge as to whether all or any portion of the shares owned of record by these entities are also owned beneficially. |
Invesco V.I. Core Equity Fund
Report of Independent Registered Public Accounting Firm
To the Board of Trustees of AIM Variable Insurance Funds (Invesco Variable Insurance Funds) and Shareholders of Invesco V.I. Core Equity Fund
Opinion on the Financial Statements
We have audited the accompanying statement of assets and liabilities, including the schedule of investments, of Invesco V.I. Core Equity Fund (one of the funds constituting AIM Variable Insurance Funds (Invesco Variable Insurance Funds), referred to hereafter as the “Fund”) as of December 31, 2019, the related statement of operations for the year ended December 31, 2019, the statement of changes in net assets for each of the two years in the period ended December 31, 2019, including the related notes, and the financial highlights for each of the five years in the period ended December 31, 2019 (collectively referred to as the “financial statements”). In our opinion, the financial statements present fairly, in all material respects, the financial position of the Fund as of December 31, 2019, the results of its operations for the year then ended, the changes in its net assets for each of the two years in the period ended December 31, 2019 and the financial highlights for each of the five years in the period ended December 31, 2019 in conformity with accounting principles generally accepted in the United States of America.
Basis for Opinion
These financial statements are the responsibility of the Fund’s management. Our responsibility is to express an opinion on the Fund’s financial statements based on our audits. We are a public accounting firm registered with the Public Company Accounting Oversight Board (United States) (PCAOB) and are required to be independent with respect to the Fund in accordance with the U.S. federal securities laws and the applicable rules and regulations of the Securities and Exchange Commission and the PCAOB.
We conducted our audits of these financial statements in accordance with the standards of the PCAOB. Those standards require that we plan and perform the audit to obtain reasonable assurance about whether the financial statements are free of material misstatement, whether due to error or fraud.
Our audits included performing procedures to assess the risks of material misstatement of the financial statements, whether due to error or fraud, and performing procedures that respond to those risks. Such procedures included examining, on a test basis, evidence regarding the amounts and disclosures in the financial statements. Our audits also included evaluating the accounting principles used and significant estimates made by management, as well as evaluating the overall presentation of the financial statements. Our procedures included confirmation of securities owned as of December 31, 2019 by correspondence with the custodian, transfer agent and brokers; when replies were not received from brokers, we performed other auditing procedures. We believe that our audits provide a reasonable basis for our opinion.
/s/PricewaterhouseCoopers LLP
Houston, Texas
February 18, 2020
We have served as the auditor of one or more of the investment companies in the Invesco group of investment companies since at least 1995. We have not been able to determine the specific year we began serving as auditor.
Invesco V.I. Core Equity Fund
Calculating your ongoing Fund expenses
Example
As a shareholder of the Fund, you incur ongoing costs, including management fees; distribution and/or service fees(12b-1); and other Fund expenses. This example is intended to help you understand your ongoing costs (in dollars) of investing in the Fund and to compare these costs with ongoing costs of investing in other mutual funds. The example is based on an investment of $1,000 invested at the beginning of the period and held for the entire period July 1, 2019 through December 31, 2019.
The actual and hypothetical expenses in the examples below do not represent the effect of any fees or other expenses assessed in connection with a variable product; if they did, the expenses shown would be higher while the ending account values shown would be lower.
Actual expenses
The table below provides information about actual account values and actual expenses. You may use the information in this table, together with the amount you invested, to estimate the expenses that you paid over the period. Simply divide your account value by $1,000 (for example, an $8,600 account value divided by $1,000 = 8.6), then multiply the result by the number in the table under the heading entitled “Actual Expenses Paid During Period” to estimate the expenses you paid on your account during this period.
Hypothetical example for comparison purposes
The table below also provides information about hypothetical account values and hypothetical expenses based on the Fund’s actual expense ratio and an assumed rate of return of 5% per year before expenses, which is not the Fund’s actual return.
The hypothetical account values and expenses may not be used to estimate the actual ending account balance or expenses you paid for the period. You may use this information to compare the ongoing costs of investing in the Fund and other funds. To do so, compare this 5% hypothetical example with the 5% hypothetical examples that appear in the shareholder reports of the other funds.
Please note that the expenses shown in the table are meant to highlight your ongoing costs. Therefore, the hypothetical information is useful in comparing ongoing costs, and will not help you determine the relative total costs of owning different funds.
| | | | | | | | | | | | |
| | | Beginning
Account Value
(07/01/19) | | ACTUAL | | HYPOTHETICAL
(5% annual return before expenses) | | Annualized
Expense
Ratio |
| | Ending
Account Value
(12/31/19)1 | | Expenses
Paid During
Period2 | | Ending
Account Value
(12/31/19) | | Expenses
Paid During
Period2 |
Series I | | $1,000.00 | | $1,095.60 | | $4.12 | | $1,021.27 | | $3.97 | | 0.78% |
Series II | | 1,000.00 | | 1,094.30 | | 5.44 | | 1,020.01 | | 5.24 | | 1.03 |
| 1 | The actual ending account value is based on the actual total return of the Fund for the period July 1, 2019 through December 31, 2019, after actual expenses and will differ from the hypothetical ending account value which is based on the Fund’s expense ratio and a hypothetical annual return of 5% before expenses. |
| 2 | Expenses are equal to the Fund’s annualized expense ratio as indicated above multiplied by the average account value over the period, multiplied by 184/365 to reflect the most recent fiscal half year. |
Invesco V.I. Core Equity Fund
Tax Information
Form1099-DIV, Form1042-S and other year-end tax information provide shareholders with actual calendar year amounts that should be included in their tax returns. Shareholders should consult their tax advisers.
The following distribution information is being provided as required by the Internal Revenue Code or to meet a specific state’s requirement.
The Fund designates the following amounts or, if subsequently determined to be different, the maximum amount allowable for its fiscal year ended December 31, 2019:
| | | | | | | | |
| | Federal and State Income Tax | | | | | | |
| | Qualified Dividend Income* | | | 0.00 | % | | |
| | Long-term Capital Gain Distribution | | | 97,296,667 | | | |
| | Corporate Dividends Received Deduction* | | | 99.99 | % | | |
| | U.S. Treasury Obligations* | | | 0.00 | % | | |
| | * The above percentages are based on ordinary income dividends paid to shareholders during the Fund’s fiscal year. | | | | | | |
Invesco V.I. Core Equity Fund
Trustees and Officers
The address of each trustee and officer is AIM Variable Insurance Funds (Invesco Variable Insurance Funds) (the “Trust”), 11 Greenway Plaza, Suite 1000, Houston, Texas 77046-1173. The trustees serve for the life of the Trust, subject to their earlier death, incapacitation, resignation, retirement or removal as more specifically provided in the Trust’s organizational documents. Each officer serves for a one year term or until their successors are elected and qualified. Column two below includes length of time served with predecessor entities, if any.
| | | | | | | | |
Name, Year of Birth and Position(s) Held with the Trust | | Trustee and/or Officer Since | | Principal Occupation(s) During Past 5 Years | | Number of
Funds in
Fund Complex
Overseen by
Trustee | | Other Directorship(s) Held by Trustee
During Past 5 Years |
| Interested Person |
Martin L. Flanagan1- 1960 Trustee and Vice Chair | | 2007 | | Executive Director, Chief Executive Officer and President, Invesco Ltd. (ultimate parent of Invesco and a global investment management firm); Trustee and Vice Chair, The Invesco Funds; Vice Chair, Investment Company Institute; and Member of Executive Board, SMU Cox School of Business Formerly: Advisor to the Board, Invesco Advisers, Inc. (formerly known as Invesco Institutional (N.A.), Inc.); Chairman and Chief Executive Officer, Invesco Advisers, Inc. (registered investment adviser); Director, Chairman, Chief Executive Officer and President, Invesco Holding Company (US), Inc. (formerly IVZ Inc.) (holding company), Invesco Group Services, Inc. (service provider) and Invesco North American Holdings, Inc. (holding company); Director, Chief Executive Officer and President, Invesco Holding Company Limited (parent of Invesco and a global investment management firm); Director, Invesco Ltd.; Chairman, Investment Company Institute and President,Co-Chief Executive Officer,Co-President, Chief Operating Officer and Chief Financial Officer, Franklin Resources, Inc. (global investment management organization) | | 229 | | None |
| 1 | Mr. Flanagan is considered an interested person (within the meaning of Section 2(a)(19) of the 1940 Act) of the Trust because he is an officer of the Adviser to the Trust, and an officer and a director of Invesco Ltd., ultimate parent of the Adviser. |
Invesco V.I. Core Equity Fund
Trustees and Officers–(continued)
| | | | | | | | |
Name, Year of Birth and Position(s) Held with the Trust | | Trustee and/or Officer Since | | Principal Occupation(s) During Past 5 Years | | Number of
Funds in
Fund Complex
Overseen by
Trustee | | Other Directorship(s) Held by Trustee
During Past 5 Years |
| Independent Trustees |
Bruce L. Crockett - 1944 Trustee and Chair | | 1993 | | Chairman, Crockett Technologies Associates (technology consulting company) Formerly: Director, Captaris (unified messaging provider); Director, President and Chief Executive Officer, COMSAT Corporation; Chairman, Board of Governors of INTELSAT (international communications company); ACE Limited (insurance company); Independent Directors Council and Investment Company Institute: Member of the Audit Committee, Investment Company Institute; Member of the Executive Committee and Chair of the Governance Committee, Independent Directors Council | | 229 | | Director and Chairman of the Audit Committee, ALPS (Attorneys Liability Protection Society) (insurance company); Director and Member of the Audit Committee and Compensation Committee, Ferroglobe PLC (metallurgical company) |
David C. Arch - 1945 Trustee | | 2010 | | Chairman of Blistex Inc. (consumer health care products manufacturer); Member, World Presidents’ Organization | | 229 | | Board member of the Illinois Manufacturers’ Association |
Beth Ann Brown - 1968 Trustee | | 2019 | | Independent Consultant Formerly: Head of Intermediary Distribution, Managing Director, Strategic Relations, Managing Director, Head of National Accounts, Senior Vice President, National Account Manager and Senior Vice President, Key Account Manager, Columbia Management Investment Advisers LLC; Vice President, Key Account Manager, Liberty Funds Distributor, Inc.; and Trustee of certain Oppenheimer Funds | | 229 | | Director, Board of Directors of Caron Engineering Inc.; Advisor, Board of Advisors of Caron Engineering Inc.; President and Director, Acton Shapleigh Youth Conservation Corps (non-profit); and Vice President and Director of Grahamtastic Connection (non-profit) |
Jack M. Fields - 1952 Trustee | | 1997 | | Chief Executive Officer, Twenty First Century Group, Inc. (government affairs company); and Chairman, Discovery Learning Alliance(non-profit) Formerly: Owner and Chief Executive Officer, Dos Angeles Ranch L.P. (cattle, hunting, corporate entertainment); Director, Insperity, Inc. (formerly known as Administaff) (human resources provider); Chief Executive Officer, Texana Timber LP (sustainable forestry company); Director of Cross Timbers Quail Research Ranch(non-profit); and member of the U.S. House of Representatives | | 229 | | None |
Invesco V.I. Core Equity Fund
Trustees and Officers–(continued)
| | | | | | | | |
Name, Year of Birth and Position(s) Held with the Trust | | Trustee and/or Officer Since | | Principal Occupation(s) During Past 5 Years | | Number of
Funds in
Fund Complex
Overseen by
Trustee | | Other Directorship(s) Held by Trustee
During Past 5 Years |
| Independent Trustees–(continued) |
Cynthia Hostetler -1962 Trustee | | 2017 | | Non-Executive Director and Trustee of a number of public and private business corporations Formerly: Director, Aberdeen Investment Funds (4 portfolios); Head of Investment Funds and Private Equity, Overseas Private Investment Corporation; President, First Manhattan Bancorporation, Inc.; Attorney, Simpson Thacher & Bartlett LLP | | 229 | | Vulcan Materials Company (construction materials company); Trilinc Global Impact Fund; Genesee & Wyoming, Inc. (railroads); Artio Global Investment LLC (mutual fund complex); Edgen Group, Inc. (specialized energy and infrastructure products distributor); Investment Company Institute (professional organization); Independent Directors Council (professional organization) |
Eli Jones - 1961 Trustee | | 2016 | | Professor and Dean, Mays Business School - Texas A&M University Formerly: Professor and Dean, Walton College of Business, University of Arkansas and E.J. Ourso College of Business, Louisiana State University; Director, Arvest Bank | | 229 | | Insperity, Inc. (formerly known as Administaff) (human resources provider) |
Elizabeth Krentzman - 1959 Trustee | | 2019 | | Formerly: Principal and Chief Regulatory Advisor for Asset Management Services and U.S. Mutual Fund Leader of Deloitte & Touche LLP; General Counsel of the Investment Company Institute (trade association); National Director of the Investment Management Regulatory Consulting Practice, Principal, Director and Senior Manager of Deloitte & Touche LLP; Assistant Director of the Division of Investment Management - Office of Disclosure and Investment Adviser Regulation of the U.S. Securities and Exchange Commission and various positions with the Division of Investment Management - Office of Regulatory Policy of the U.S. Securities and Exchange Commission; Associate at Ropes & Gray LLP; Advisory Board Member of the Securities and Exchange Commission Historical Society; and Trustee of certain Oppenheimer Funds | | 229 | | Trustee of the University of Florida National Board Foundation and Audit Committee Member; Member of the Cartica Funds Board of Directors (private investment funds); Member of the University of Florida Law Center Association, Inc. Board of Trustees and Audit Committee Member |
Anthony J. LaCava, Jr. - 1956 Trustee | | 2019 | | Formerly: Director and Member of the Audit Committee, Blue Hills Bank (publicly traded financial institution) and Managing Partner, KPMG LLP | | 229 | | Blue Hills Bank; Chairman, Bentley University; Member, Business School Advisory Council; and Nominating Committee KPMG LLP |
Prema Mathai-Davis - 1950 Trustee | | 1998 | | Retired Co-Owner & Partner of Quantalytics Research, LLC, (a FinTech Investment Research Platform for the Self-Directed Investor) | | 229 | | None |
Invesco V.I. Core Equity Fund
Trustees and Officers–(continued)
| | | | | | | | |
Name, Year of Birth and Position(s) Held with the Trust | | Trustee and/or Officer Since | | Principal Occupation(s) During Past 5 Years | | Number of
Funds in
Fund Complex
Overseen by
Trustee | | Other Directorship(s) Held by Trustee
During Past 5 Years |
| Independent Trustees–(continued) |
Joel W. Motley - 1952 Trustee | | 2019 | | Director of Office of Finance, Federal Home Loan Bank; Member of the Vestry of Trinity Wall Street; Managing Director of Carmona Motley Inc. (privately held financial advisor); Member of the Finance and Budget Committee of the Council on Foreign Relations, Member of the Investment Committee and Board of Human Rights Watch and Member of the Investment Committee and Board of Historic Hudson Valley(non-profit cultural organization) Formerly: Managing Director of Public Capital Advisors, LLC (privately held financial advisor); Managing Director of Carmona Motley Hoffman, Inc. (privately held financial advisor); Trustee of certain Oppenheimer Funds; and Director of Columbia Equity Financial Corp. (privately held financial advisor) | | 229 | | Director of Greenwall Foundation (bioethics research foundation); Member of Board and Investment Committee of The Greenwall Foundation; Director of Southern Africa Legal Services Foundation; Board Member and Investment Committee Member of Pulizer Center for Crisis Reporting(non-profit journalism) |
Teresa M. Ressel - 1962 Trustee | | 2017 | | Non-executive director and trustee of a number of public and private business corporations Formerly: Chief Financial Officer, Olayan America, The Olayan Group (international investor/commercial/industrial); Chief Executive Officer, UBS Securities LLC; Group Chief Operating Officer, Americas, UBS AG; Assistant Secretary for Management & Budget and CFO, US Department of the Treasury | | 229 | | Atlantic Power Corporation (power generation company); ON Semiconductor Corp. (semiconductor supplier) |
Ann Barnett Stern - 1957 Trustee | | 2017 | | President and Chief Executive Officer, Houston Endowment Inc. (private philanthropic institution) Formerly: Executive Vice President and General Counsel, Texas Children’s Hospital; Attorney, Beck, Redden and Secrest, LLP; Business Law Instructor, University of St. Thomas; Attorney, Andrews & Kurth LLP | | 229 | | Federal Reserve Bank of Dallas |
Robert C. Troccoli - 1949 Trustee | | 2016 | | Retired | | 229 | | None |
| Daniel S. Vandivort - 1954 Trustee | | 2019 | | Treasurer, Chairman of the Audit and Finance Committee, and Trustee, Board of Trustees, Huntington Disease Foundation of America; and President, Flyway Advisory Services LLC (consulting and property management) Formerly: Trustee and Governance Chair, of certain Oppenheimer Funds | | 229 | | Chairman and Lead Independent Director, Chairman of the Audit Committee, and Director, Board of Directors, Value Line Funds |
| James D. Vaughn - 1945 Trustee | | 2019 | | Retired Formerly: Managing Partner, Deloitte & Touche LLP; Trustee and Chairman of the Audit Committee, Schroder Funds; Board Member, Mile High United Way, Boys and Girls Clubs, Boy Scouts, Colorado Business Committee for the Arts, Economic Club of Colorado and Metro Denver Network (economic development corporation); and Trustee of certain Oppenheimer Funds | | 229 | | Board member and Chairman of Audit Committee of AMG National Trust Bank; Trustee and Investment Committee member, University of South Dakota Foundation; Board member, Audit Committee Member and past Board Chair, Junior Achievement(non-profit) |
Invesco V.I. Core Equity Fund
Trustees and Officers–(continued)
| | | | | | | | |
Name, Year of Birth and Position(s) Held with the Trust | | Trustee and/or Officer Since | | Principal Occupation(s) During Past 5 Years | | Number of
Funds in
Fund Complex
Overseen by
Trustee | | Other Directorship(s) Held by Trustee
During Past 5 Years |
| Independent Trustees–(continued) |
| Christopher L. WIlson - 1957 Trustee, Vice Chair and Chair Designate | | 2017 | | Retired Formerly: Director, TD Asset Management USA Inc. (mutual fund complex) (22 portfolios); Managing Partner, CT2, LLC (investing and consulting firm); President/Chief Executive Officer, Columbia Funds, Bank of America Corporation; President/Chief Executive Officer, CDC IXIS Asset Management Services, Inc.; Principal & Director of Operations, Scudder Funds, Scudder, Stevens & Clark, Inc.; Assistant Vice President, Fidelity Investments | | 229 | | ISO New England, Inc.(non-profit organization managing regional electricity market) |
Invesco V.I. Core Equity Fund
Trustees and Officers–(continued)
| | | | | | | | |
Name, Year of Birth and Position(s) Held with the Trust | | Trustee and/or Officer Since | | Principal Occupation(s) During Past 5 Years | | Number of
Funds in
Fund Complex
Overseen by
Trustee | | Other Directorship(s) Held by Trustee
During Past 5 Years |
| Officers |
Sheri Morris - 1964 President, Principal Executive Officer and Treasurer | | 1999 | | Head of Global Fund Services, Invesco Ltd.; President, Principal Executive Officer and Treasurer, The Invesco Funds; Vice President, Invesco Advisers, Inc. (formerly known as Invesco Institutional (N.A.), Inc.) (registered investment adviser); and Vice President, Invesco Exchange-Traded Fund Trust, Invesco Exchange-Traded Fund Trust II, Invesco India Exchange-Traded Fund Trust, Invesco Actively Managed Exchange-Traded Fund Trust, Invesco Actively Managed Exchange-Traded Commodity Fund Trust and Invesco Exchange-Traded Self-Indexed Fund Trust; and Vice President, OppenheimerFunds, Inc. Formerly: Vice President and Principal Financial Officer, The Invesco Funds; Vice President, Invesco AIM Advisers, Inc., Invesco AIM Capital Management, Inc. and Invesco AIM Private Asset Management, Inc.; Assistant Vice President and Assistant Treasurer, The Invesco Funds and Assistant Vice President, Invesco Advisers, Inc., Invesco AIM Capital Management, Inc. and Invesco AIM Private Asset Management, Inc.; and Treasurer, Invesco Exchange-Traded Fund Trust, Invesco Exchange-Traded Fund Trust II, Invesco India Exchange-Traded Fund Trust and Invesco Actively Managed Exchange-Traded Fund Trust | | N/A | | N/A |
Russell C. Burk - 1958 Senior Vice President and Senior Officer | | 2005 | | Senior Vice President and Senior Officer, The Invesco Funds | | N/A | | N/A |
Jeffrey H. Kupor - 1968 Senior Vice President, Chief Legal Officer and Secretary | | 2018 | | Head of Legal of the Americas, Invesco Ltd.; Senior Vice President and Secretary, Invesco Advisers, Inc. (formerly known as Invesco Institutional (N.A.), Inc.) (registered investment adviser); Senior Vice President and Secretary, Invesco Distributors, Inc. (formerly known as Invesco AIM Distributors, Inc.); Vice President and Secretary, Invesco Investment Services, Inc. (formerly known as Invesco AIM Investment Services, Inc.) Senior Vice President, Chief Legal Officer and Secretary, The Invesco Funds; Secretary and General Counsel, Invesco Investment Advisers LLC (formerly known as Van Kampen Asset Management); Secretary and General Counsel, Invesco Capital Markets, Inc. (formerly known as Van Kampen Funds Inc.) and Chief Legal Officer, Invesco Exchange-Traded Fund Trust, Invesco Exchange-Traded Fund Trust II, Invesco India Exchange-Traded Fund Trust, Invesco Actively Managed Exchange-Traded Fund Trust, Invesco Actively Managed Exchange-Traded Commodity Fund Trust and Invesco Exchange-Traded Self-Indexed Fund Trust; Secretary, Invesco Indexing LLC; Secretary, W.L. Ross & Co., LLC Formerly: Secretary and Vice President, Jemstep, Inc.; Head of Legal, Worldwide Institutional, Invesco Ltd.; Secretary and General Counsel, INVESCO Private Capital Investments, Inc.; Senior Vice President, Secretary and General Counsel, Invesco Management Group, Inc. (formerly known as Invesco AIM Management Group, Inc.); Assistant Secretary, INVESCO Asset Management (Bermuda) Ltd.; Secretary and General Counsel, Invesco Private Capital, Inc.; Assistant Secretary and General Counsel, INVESCO Realty, Inc.; Secretary and General Counsel, Invesco Senior Secured Management, Inc.; and Secretary, Sovereign G./P. Holdings Inc. | | N/A | | N/A |
Andrew R. Schlossberg - 1974 Senior Vice President | | 2019 | | Head of the Americas and Senior Managing Director, Invesco Ltd.; Director and Senior Vice President, Invesco Advisers, Inc. (formerly known as Invesco Institutional (N.A.), Inc.) (registered investment adviser); Director and Chairman, Invesco Investment Services, Inc. (formerly known as Invesco AIM Investment Services, Inc.) (registered transfer agent); Senior Vice President, The Invesco Funds; Director, Invesco Investment Advisers LLC (formerly known as Van Kampen Asset Management); Director, President and Chairman, Invesco Insurance Agency, Inc. Formerly: Director, Invesco UK Limited; Director and Chief Executive, Invesco Asset Management Limited and Invesco Fund Managers Limited; Assistant Vice President, The Invesco Funds; Senior Vice President, Invesco Advisers, Inc. (formerly known as Invesco Institutional (N.A.), Inc.) (registered investment adviser); Director and Chief Executive, Invesco Administration Services Limited and Invesco Global Investment Funds Limited; Director, Invesco Distributors, Inc.; Head of EMEA, Invesco Ltd.; President, Invesco Actively Managed Exchange-Traded Commodity Fund Trust, Invesco Actively Managed Exchange-Traded Fund Trust, Invesco Exchange-Traded Fund Trust, Invesco Exchange-Traded Fund Trust II and Invesco India Exchange-Traded Fund Trust; Managing Director and Principal Executive Officer, Invesco Capital Management LLC | | N/A | | N/A |
Invesco V.I. Core Equity Fund
Trustees and Officers–(continued)
| | | | | | | | |
Name, Year of Birth and Position(s) Held with the Trust | | Trustee and/or Officer Since | | Principal Occupation(s) During Past 5 Years | | Number of
Funds in
Fund Complex
Overseen by
Trustee | | Other Directorship(s) Held by Trustee
During Past 5 Years |
| Officers–(continued) |
John M. Zerr - 1962 Senior Vice President | | 2006 | | Chief Operating Officer of the Americas; Senior Vice President, Invesco Advisers, Inc. (formerly known as Invesco Institutional (N.A.), Inc.) (registered investment adviser); Senior Vice President, Invesco Distributors, Inc. (formerly known as Invesco AIM Distributors, Inc.); Director and Vice President, Invesco Investment Services, Inc. (formerly known as Invesco AIM Investment Services, Inc.) Senior Vice President, The Invesco Funds; Managing Director, Invesco Capital Management LLC; Director, Invesco Investment Advisers LLC (formerly known as Van Kampen Asset Management); Senior Vice President, Invesco Capital Markets, Inc. (formerly known as Van Kampen Funds Inc.); Manager, Invesco Indexing LLC; Manager, Invesco Specialized Products, LLC; Director and Senior Vice President, Invesco Insurance Agency, Inc.; Member, Invesco Canada Funds Advisory Board; Director, President and Chief Executive Officer, Invesco Corporate Class Inc. (corporate mutual fund company); and Director, Chairman, President and Chief Executive Officer, Invesco Canada Ltd. (formerly known as Invesco Trimark Ltd./Invesco Trimark Ltèe) (registered investment adviser and registered transfer agent) Formerly: Director and Senior Vice President, Invesco Management Group, Inc. (formerly known as Invesco AIM Management Group, Inc.); Secretary and General Counsel, Invesco Management Group, Inc. (formerly known as Invesco AIM Management Group, Inc.); Secretary, Invesco Investment Services, Inc. (formerly known as Invesco AIM Investment Services, Inc.); Chief Legal Officer and Secretary, The Invesco Funds; Secretary and General Counsel, Invesco Investment Advisers LLC (formerly known as Van Kampen Asset Management); Secretary and General Counsel, Invesco Capital Markets, Inc. (formerly known as Van Kampen Funds Inc.); Chief Legal Officer, Invesco Exchange-Traded Fund Trust, Invesco Exchange-Traded Fund Trust II, Invesco India Exchange-Traded Fund Trust, Invesco Actively Managed Exchange-Traded Fund Trust, Invesco Actively Managed Exchange-Traded Commodity Fund Trust and Invesco Exchange-Traded Self-Indexed Fund Trust; Secretary, Invesco Indexing LLC; Director, Secretary, General Counsel and Senior Vice President, Van Kampen Exchange Corp.; Director, Vice President and Secretary, IVZ Distributors, Inc. (formerly known as INVESCO Distributors, Inc.); Director and Vice President, INVESCO Funds Group, Inc.; Director and Vice President, Van Kampen Advisors Inc.; Director, Vice President, Secretary and General Counsel, Van Kampen Investor Services Inc.; Director and Secretary, Invesco Distributors, Inc. (formerly known as Invesco AIM Distributors, Inc.); Director, Senior Vice President, General Counsel and Secretary, Invesco AIM Advisers, Inc. and Van Kampen Investments Inc.; Director, Vice President and Secretary, Fund Management Company; Director, Senior Vice President, Secretary, General Counsel and Vice President, Invesco AIM Capital Management, Inc.; Chief Operating Officer and General Counsel, Liberty Ridge Capital, Inc. (an investment adviser) | | N/A | | N/A |
Gregory G. McGreevey - 1962 Senior Vice President | | 2012 | | Senior Managing Director, Invesco Ltd.; Director, Chairman, President, and Chief Executive Officer, Invesco Advisers, Inc. (formerly known as Invesco Institutional (N.A.), Inc.) (registered investment adviser); Director, Invesco Mortgage Capital, Inc. and Invesco Senior Secured Management, Inc.; and Senior Vice President, The Invesco Funds; and President, SNW Asset Management Corporation Formerly: Senior Vice President, Invesco Management Group, Inc. and Invesco Advisers, Inc.; Assistant Vice President, The Invesco Funds | | N/A | | N/A |
Kelli Gallegos - 1970 Vice President, Principal Financial Officer and Assistant Treasurer | | 2008 | | Principal Financial and Accounting Officer - Investments Pool, Invesco Specialized Products, LLC; Vice President, Principal Financial Officer and Assistant Treasurer, The Invesco Funds; Principal Financial and Accounting Officer - Pooled Investments, Invesco Capital Management LLC; Vice President and Treasurer, Invesco Exchange-Traded Fund Trust, Invesco Exchange-Traded Fund Trust II, Invesco India Exchange-Traded Fund Trust, Invesco Actively Managed Exchange-Traded Fund Trust, Invesco Actively Managed Exchange-Traded Commodity Fund Trust and Invesco Exchange-Traded Self-Indexed Fund Trust Formerly: Assistant Treasurer, Invesco Specialized Products, LLC; Assistant Treasurer, Invesco Exchange-Traded Fund Trust, Invesco Exchange-Traded Fund Trust II, Invesco India Exchange-Traded Fund Trust, Invesco Actively Managed Exchange-Traded Fund Trust, Invesco Actively Managed Exchange-Traded Commodity Fund Trust and Invesco Exchange-Traded Self-Indexed Fund Trust; Assistant Treasurer, Invesco Capital Management LLC; Assistant Vice President, The Invesco Funds | | N/A | | N/A |
Invesco V.I. Core Equity Fund
Trustees and Officers–(continued)
| | | | | | | | |
Name, Year of Birth and Position(s) Held with the Trust | | Trustee and/or Officer Since | | Principal Occupation(s) During Past 5 Years | | Number of
Funds in
Fund Complex
Overseen by
Trustee | | Other Directorship(s) Held by Trustee
During Past 5 Years |
| Officers–(continued) |
Crissie M. Wisdom - 1969 Anti-Money Laundering Compliance Officer | | 2013 | | Anti-Money Laundering Compliance Officer, Invesco Advisers, Inc. (formerly known as Invesco Institutional (N.A.), Inc.) (registered investment adviser), Invesco Capital Markets, Inc. (formerly known as Van Kampen Funds Inc.), Invesco Distributors, Inc., Invesco Investment Services, Inc., The Invesco Funds, and Invesco Exchange-Traded Fund Trust, Invesco Exchange-Traded Fund Trust II, Invesco India Exchange-Traded Fund Trust, Invesco Actively Managed Exchange-Traded Fund Trust, Invesco Actively Managed Exchange-Traded Commodity Fund Trust and Invesco Exchange-Traded Self-Indexed Fund Trust; Anti-Money Laundering Compliance Officer and Bank Secrecy Act Officer, INVESCO National Trust Company and Invesco Trust Company; and Fraud Prevention Manager and Controls and Risk Analysis Manager for Invesco Investment Services, Inc. Formerly: Anti-Money Laundering Compliance Officer, Van Kampen Exchange Corp. and Invesco Management Group, Inc. | | N/A | | N/A |
Robert R. Leveille - 1969 Chief Compliance Officer | | 2016 | | Chief Compliance Officer, Invesco Advisers, Inc. (registered investment adviser); and Chief Compliance Officer, The Invesco Funds Formerly: Chief Compliance Officer, Putnam Investments and the Putnam Funds | | N/A | | N/A |
The Statement of Additional Information of the Trust includes additional information about the Fund’s Trustees and is available upon request, without charge, by calling 1.800.959.4246. Please refer to the Fund’s Statement of Additional Information for information on the Fund’ssub-advisers.
| | | | | | |
| Office of the Fund | | Investment Adviser | | Distributor | | Auditors |
| 11 Greenway Plaza, Suite 1000 | | Invesco Advisers, Inc. | | Invesco Distributors, Inc. | | PricewaterhouseCoopers LLP |
| Houston, TX 77046-1173 | | 1555 Peachtree Street, N.E. | | 11 Greenway Plaza, Suite 1000 | | 1000 Louisiana Street, Suite 5800 |
| | Atlanta, GA 30309 | | Houston, TX 77046-1173 | | Houston, TX 77002-5678 |
| | | |
| Counsel to the Fund | | Counsel to the Independent Trustees | | Transfer Agent | | Custodian |
| Stradley Ronon Stevens & Young, LLP | | Goodwin Procter LLP | | Invesco Investment Services, Inc. | | State Street Bank and Trust Company |
| 2005 Market Street, Suite 2600 | | 901 New York Avenue, N.W. | | 11 Greenway Plaza, Suite 1000 | | 225 Franklin Street |
| Philadelphia, PA 19103-7018 | | Washington, D.C. 20001 | | Houston, TX 77046-1173 | | Boston, MA 02110-2801 |
Invesco V.I. Core Equity Fund
| | | | |
| | |
 | | Annual Report to Shareholders | | December 31, 2019 |
| | |
| | Invesco V.I. Core Plus Bond Fund |
| | |
| | |

Beginning on January 1, 2021, as permitted by regulations adopted by the Securities and Exchange Commission, the insurance company that offers your variable annuity or variable life insurance contract may no longer send you paper copies of the Fund’s shareholder reports by mail, unless you specifically request paper copies of the reports from the insurance company or your financial intermediary. Instead of delivering paper copies of the report, the insurance company may choose to make the reports available on a website, and will notify you by mail each time a report is posted and provide you with a website link to access the report. Instructions for requesting paper copies will be provided by your insurance company.
If the insurance company offers electronic delivery, you may elect to receive shareholder reports and other communications about the Fund electronically by following the instructions provided by the insurance company or by contacting your financial intermediary. If you already elected to receive shareholder reports electronically, you will not be affected by this change and you need not take any action.
You may elect to receive all future reports in paper free of charge from the insurance company. You can inform the insurance company or your financial intermediary that you wish to continue receiving paper copies of your shareholder reports by following the instructions provided by the insurance company or by contacting your financial intermediary. Your election to receive reports in paper will apply to all portfolio companies available under your contract with the insurance company.
The Fund provides a complete list of its holdings four times in each fiscal year, at the quarter-ends. For the second and fourth quarters, the lists appear in the Fund’s semiannual and annual reports to shareholders. For the first and third quarters, the Fund files the lists with the Securities and Exchange Commission (SEC) as an exhibit to its reports on FormN-PORT. The Fund’s FormN-PORT filings are available on the SEC website, sec.gov. The SEC file numbers for the Fund are811-07452 and033-57340. The Fund’s most recent portfolio holdings, as filed on FormN-PORT, have also been made available to insurance companies issuing variable annuity contracts and variable life insurance policies (“variable products”) that invest in the Fund.
A description of the policies and procedures that the Fund uses to determine how to vote proxies relating to portfolio securities is available without charge, upon request, from our Client Services department at 800 959 4246 or at invesco.com/proxyguidelines. The information is also available on the SEC website, sec.gov.
Information regarding how the Fund voted proxies related to its portfolio securities during the most recent12-month period ended June 30 is available at invesco.com/proxysearch. The information is also available on the SEC website, sec.gov.
Invesco Advisers, Inc. is an investment adviser; it provides investment advisory services to individual and institutional clients and does not sell securities. Invesco Distributors, Inc. is the US distributor for Invesco Ltd.’s retail mutual funds, exchange-traded funds and institutional money market funds. Both are wholly owned, indirect subsidiaries of Invesco Ltd.
This report must be accompanied or preceded by a currently effective Fund prospectus and variable product prospectus, which contain more complete information, including sales charges and expenses. Investors should read each carefully before investing.
NOT FDIC INSURED | MAY LOSE VALUE | NO BANK GUARANTEE
| | |
Invesco Distributors, Inc. | | VICPB-AR-1 |
Management’s Discussion of Fund Performance
| | | | |
Performance summary For the year ended December 31, 2019, Series I shares of Invesco V.I. Core Plus Bond Fund (the Fund) outperformed the Bloomberg Barclays U.S. Aggregate Bond Index, the Fund’s broad market/style-specific benchmark. Your Fund’s long-term performance appears later in this report. | |
|
Fund vs. Indexes Total returns, 12/31/18 to 12/31/19, excluding variable product issuer charges. If variable product issuer charges were included, returns would be lower. | |
| |
Series I Shares | | | 11.06 | % |
Series II Shares | | | 11.00 | |
Bloomberg Barclays U.S. Aggregate Bond Indexq(Broad Market/Style-Specific Index) | | | 8.72 | |
Lipper VUF Core Plus Bond Funds Index∎(Peer Group Index) | | | 9.51 | |
Source(s):qRIMES Technologies Corp.;∎Lipper Inc. | | | | |
Market conditions and your Fund
Calendar year 2019 proved to be an increasingly volatile time for the US bond market. US bond returns posted strong results for the year, as rates fell amid a decelerating global economy and persistent trade disputes between the US and China. Global risks remained a headwind to growth throughout most of the year. However, during the final months of 2019, rates increased amid diminishing risks of imminent rate cuts by the US Federal Reserve (the Fed), which were previously priced in. The global economy appeared to be stabilizing as trade disputes between the US and China, Brexit uncertainties and Chinese data all seemed less threatening to valuations. Credit investors were generally rewarded over the year, despite heightened volatility and escalating recession fears.US-based yield strategies remained competitive from a global perspective as negative yields increased across regions.
During the year, the Fed cut interest rates three times: in July, September and October 2019.1 However, at its December meeting, the Fed gave the clear indication that the target rate would likely remain at its current level through 2020 as factors that had driven risk
aversion over the year had shown signs of improving.
US rate movements were a primary driver of valuations for the year. Thetwo-year US Treasury yield declined from 2.48% to 1.58%, the10-year US Treasury yield decreased from 2.69% to 1.92% and the30-year US Treasury yield decreased from 3.02% to 2.39%.2 The yield curve, as measured by the yield differential of thetwo-year US Treasury yield versus the30-year US Treasury yield, steepened notably from 54 basis points to 81 basis points.2(A basis point is oneone-hundredth of a percentage point.)
Corporate credit spreads were also a significant contributor to Fund returns as spreads tightened about 0.60% during the year as solid corporate fundamentals and demand for high quality assets were robust in 2019.3 Corporate balance sheets remained relatively healthy as debt service levels remained strong and select companies looked to furtherde-leverage their balance sheets from recent acquisitions.
Given this market backdrop, the Fund’s total return for the year was positive and the Fund outperformed its broad market/
style-specific benchmark, the Bloomberg Barclays U.S. Aggregate Bond Index.
The US investment grade bond market, as represented by the Bloomberg Barclays U.S. Aggregate Bond Index, returned 8.72% for the year. This was largely attributed to the decline in US Treasury yields and the tightening of credit spreads. In particular, the corporate sector returned 14.54%, with long-dated corporate bonds and thelower-end of the investment grade bond spectrum performing best.3 US Treasuries also registered a solid year with a 6.86% return for 2019.3
During the year, the primary driver of the Fund’s outperformance versus its broad market/style-specific benchmark was overweight exposure to investment grade corporate bonds, as well as a smallout-of-benchmark position in high yield issuers. In particular, in the investment grade universe, overweight exposures to financial institutions and the technology, media and telecommunication sector were beneficial to the Fund’s relative performance. Security selection in these sectors also contributed to relative returns as the holdings in these sectors outperformed the positions in the broad market/style-specific benchmark.
The Fund also held a smallout-of-benchmark position in high yield issuers and an overweight allocation to emerging market bonds. Both of these positions were additive to Fund performance during the year as each benefited from a reduction in interest rates and tighter credit spreads due to a positive view on global growth. In the high yield space, we sought opportunities from thebest-in-class high quality high yield sector, while holding only a small position in the lower quality high yield space.
The Fund’s positioning in securitized assets also aided returns as the Fund maintained an overweight allocation tonon-agency mortgages, commercial
| | | | |
Portfolio Composition | |
By security type | | | % of total net assets | |
| | | | |
| |
| U.S. Dollar Denominated Bonds & Notes | | | 40.36 | % |
| Asset-Backed Securities | | | 17.57 | |
| U.S. Government Sponsored Agency Mortgage-Backed Securities | | | 16.95 | |
| U.S. Treasury Securities | | | 16.36 | |
| Security Types Each Less Than 1% of Portfolio | | | 1.57 | |
| Money Market Funds Plus Other Assets Less Liabilities | | | 7.19 | |
| | | | |
Top Five Debt Issuers* | | | | |
| % of total net assets | |
| | | | |
| |
1. U.S. Treasury | | | 16.36 | % |
2. Federal National Mortgage Association | | | 9.44 | % |
3. Freddie Mac Multifamily Structured Pass Through Ctfs. | | | 3.04 | |
4. Government National Mortgage Association | | | 2.28 | % |
5. Sprint Spectrum Co. LLC/Sprint Spectrum Co. II LLC/Sprint Spectrum Co. III LLC | | | 1.75 | % |
| | |
Total Net Assets | | $25.1 million |
| |
Total Number of Holdings* | | 484 |
The Fund’s holdings are subject to change, and there is no assurance that the Fund will continue to hold any particular security.
*Excluding money market fund holdings, if any.
Data presented here are as of December 31, 2019.
Invesco V.I. Core Plus Bond Fund
mortgage-backed securities and asset-backed securities. These sectors performed well during the year due to solid fundamentals and a strong US consumer. The securitized sector provides added diversification to the Fund, which can be beneficial in times of stress while also providing additional income. With the US housing market remaining robust, we continued to likenon-agency mortgage bonds.
The Fund also may use active duration and yield curve positioning for risk management and for generating excess return versus its broad market/style-specific benchmark. Duration measures a portfolio’s price sensitivity to interest rate changes. Yield curve positioning refers to actively emphasizing particular points (maturities) along the yield curve with favorable risk-return expectations. Duration of the portfolio was maintained close to that of the Fund’s broad market/ style-specific benchmark, on average, and the timing of changes and the degree of variance during the year detracted modestly from relative returns. Buying and selling US Treasury futures and interest rate swaptions were important tools used during the year for the management of interest rate risk and to maintain the Fund’s targeted portfolio duration.
Part of the Fund’s strategy to manage credit and currency risk in the portfolio during the year entailed purchasing and selling credit and currency derivatives. We managed credit market risk by purchasing and selling protection through credit default swaps at various points throughout the year. Currency management was carried out via currency forwards and options on anas-needed basis.
We wish to remind you that the Fund is subject to interest rate risk, meaning when interest rates rise, the value of fixed income securities tends to fall. The degree to which the value of fixed income securities may decline due to rising interest rates may vary depending on the speed and magnitude of the increase in interest rates, as well as individual security characteristics, such as price, maturity, duration and coupon and market forces, such as supply and demand for similar securities. We are monitoring interest rates, and the market, economic and geopolitical factors that may impact the direction, speed and magnitude of changes to interest rates across the maturity spectrum, including the potential impact of monetary policy changes by the Fed and certain foreign central
banks. If interest rates rise, markets may experience increased volatility, which may affect the value and/or liquidity of certain of the Fund’s investments.
Thank you for investing in Invesco V.I. Core Plus Bond Fund and for sharing our long-term investment horizon.
1 Source: US Federal Reserve
2 Source: US Department of the Treasury
3 Source: Bloomberg Barclays
Portfolio managers:
Matthew Brill
Chuck Burge
Michael Hyman
Joseph Portera
Scott Roberts
The views and opinions expressed in management’s discussion of Fund performance are those of Invesco Advisers, Inc. These views and opinions are subject to change at any time based on factors such as market and economic conditions. These views and opinions may not be relied upon as investment advice or recommendations, or as an offer for a particular security. The information is not a complete analysis of every aspect of any market, country, industry, security or the Fund. Statements of fact are from sources considered reliable, but Invesco Advisers, Inc. makes no representation or warranty as to their completeness or accuracy. Although historical performance is no guarantee of future results, these insights may help you understand our investment management philosophy.
See important Fund and, if applicable, index disclosures later in this report.
Invesco V.I. Core Plus Bond Fund
Your Fund’s Long-Term Performance
Results of a $10,000 Investment – Oldest Share Class(es)
Fund and index data from 12/31/09
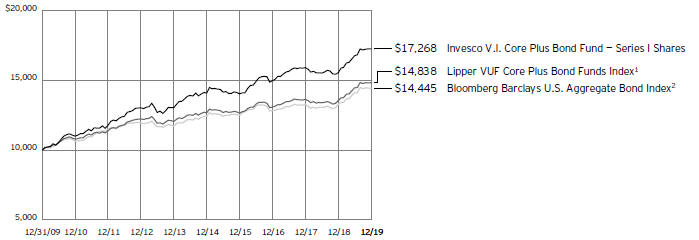
1 Source: Lipper Inc.
2 Source: RIMES Technologies Corp.
Past performance cannot guarantee future
results.
| | | | |
Average Annual Total Returns | |
As of 12/31/19 | | | | |
| |
Series I Shares | | | | |
Inception (5/5/93) | | | 4.43 | % |
10 Years | | | 5.61 | |
5 Years | | | 4.15 | |
1 Year | | | 11.06 | |
| |
Series II Shares | | | | |
Inception (3/14/02) | | | 4.03 | % |
10 Years | | | 5.35 | |
5 Years | | | 3.91 | |
1 Year | | | 11.00 | |
The performance of the Fund’s Series I and Series II share classes will differ primarily due to different class expenses.
The performance data quoted represent past performance and cannot guarantee future results; current performance may be lower or higher. Please contact your variable product issuer or financial adviser for the most recentmonth-end variable product performance. Performance figures reflect Fund expenses, reinvested distributions and changes in net asset value. Performance figures do not reflect deduction of taxes a shareholder would pay on Fund distributions or sale of Fund shares. Investment return and principal value will fluctuate so that you may have a gain or loss when you sell shares.
The net annual Fund operating expense ratio set forth in the most recent Fund prospectus as of the date of this report for Series I and Series II shares was 0.62% and 0.87%, respectively.1,2 The total annual Fund operating expense ratio set forth in
the most recent Fund prospectus as of the date of this report for Series I and Series II shares was 1.54% and 1.79%, respectively. The expense ratios presented above may vary from the expense ratios presented in other sections of this report that are based on expenses incurred during the period covered by this report.
Invesco V.I. Core Plus Bond Fund, a series portfolio of AIM Variable Insurance Funds (Invesco Variable Insurance Funds), is currently offered through insurance companies issuing variable products. You cannot purchase shares of the Fund directly. Performance figures given represent the Fund and are not intended to reflect actual variable product values. They do not reflect sales charges, expenses and fees assessed in connection with a variable product. Sales charges, expenses and fees, which are determined by the variable product issuers, will vary and will lower the total return.
The most recentmonth-end performance at the Fund level, excluding variable product charges, is available at 800 451 4246. As mentioned above, for the most recentmonth-end performance including variable product charges, please contact your variable product issuer or financial adviser.
Fund performance reflects any applicable fee waivers and/or expense reimbursements. Had the adviser not waived fees and/or reimbursed expenses currently or in the past, returns would have been lower. See current prospectus for more information.
| 1 | Total annual Fund operating expenses after any contractual fee waivers and/or expense reimbursements by the adviser in effect through at least April 30, 2021. See current prospectus for more information. |
| 2 | Total annual Fund operating expenses after any contractual fee waivers and/or expense reimbursements by the adviser in effect through at least June 30, 2021. See current prospectus for more information. |
Invesco V.I. Core Plus Bond Fund
Invesco V.I. Core Plus Bond Fund’s investment objective is total return, comprised of current income and capital appreciation.
| ⬛ | | Unless otherwise stated, information presented in this report is as of December 31, 2019, and is based on total net assets. |
| ⬛ | | Unless otherwise noted, all data provided by Invesco. |
| ⬛ | | To access your Fund’s reports/prospectus, visit invesco.com/fundreports. |
About indexes used in this report
| ⬛ | | TheBloomberg Barclays U.S. Aggregate Bond Indexis an unmanaged index considered representative of the US investment grade, fixed-rate bond market. |
| ⬛ | | TheLipper VUF Core Plus Bond Funds Indexis an unmanaged index considered representative of core plus bond variable insurance underlying funds tracked by Lipper. |
| ⬛ | | The Fund is not managed to track the performance of any particular index, including the index(es) described here, and consequently, the performance of the Fund may deviate significantly from the performance of the
index(es). |
| ⬛ | | A direct investment cannot be made in an index. Unless otherwise indicated, index results include reinvested dividends, and they do not reflect sales charges. Performance of the peer group, if applicable, reflects fund expenses; performance of a market index does not. |
Other information
| ⬛ | | The returns shown in management’s discussion of Fund performance are based on net asset values calculated for shareholder transactions. Generally accepted accounting principles require adjustments to be made to the net assets of the Fund at period end for financial reporting purposes, and as such, the net asset values for shareholder transactions and the returns based on those net asset values may differ from the net asset values and returns reported in the Financial Highlights. Additionally, the returns and net asset values shown throughout this report are at the Fund level only and do not include variable product issuer charges. If such charges were included, the total returns would be lower. |
| ⬛ | | Industry classifications used in this report are generally according to the Global Industry Classification Standard, which was developed by and is the exclusive property and a service mark of MSCI Inc. and Standard & Poor’s. |
Invesco V.I. Core Plus Bond Fund
Schedule of Investments(a)
December 31, 2019
| | | | | | | | |
| | | Principal
Amount | | | Value | |
U.S. Dollar Denominated Bonds & Notes–40.36% | �� |
|
Aerospace & Defense–0.05% | |
| | |
Moog, Inc.,
5.25%, 12/01/2022(b) | | $ | 2,000 | | | $ | 2,033 | |
4.25%, 12/15/2027(b) | | | 2,000 | | | | 2,040 | |
TransDigm, Inc.,
6.50%, 07/15/2024 | | | 2,000 | | | | 2,067 | |
6.38%, 06/15/2026 | | | 3,000 | | | | 3,187 | |
Triumph Group, Inc., 7.75%, 08/15/2025 | | | 2,000 | | | | 2,091 | |
| | | | | | | | 11,418 | |
|
Agricultural & Farm Machinery–0.02% | |
| | |
Titan International, Inc., 6.50%, 11/30/2023 | | | 5,000 | | | | 4,290 | |
|
Air Freight & Logistics–0.01% | |
| | |
XPO Logistics, Inc.,
6.50%, 06/15/2022(b) | | | 2,000 | | | | 2,041 | |
|
Airlines–2.74% | |
| | |
American Airlines Group, Inc., 5.00%, 06/01/2022(b) | | | 18,000 | | | | 18,855 | |
American Airlines Pass Through Trust,
Series2017-1, Class B, 4.95%, 02/15/2025 | | | 28,332 | | | | 29,952 | |
Series2017-2, Class B, 3.70%, 10/15/2025 | | | 30,540 | | | | 30,893 | |
Series2016-1, Class AA, 3.58%, 01/15/2028 | | | 27,420 | | | | 28,853 | |
Series2017-2, Class A, 3.60%, 10/15/2029 | | | 33,078 | | | | 33,638 | |
Series2019-1, Class AA, 3.15%, 02/15/2032 | | | 35,000 | | | | 36,025 | |
British Airways Pass Through Trust (United Kingdom), Series2019-1, Class A, 3.35%, 06/15/2029(b) | | | 33,000 | | | | 34,021 | |
Delta Air Lines Pass Through Trust, Series2019-1, Class A, 3.40%, 04/25/2024 | | | 10,000 | | | | 10,373 | |
Delta Air Lines, Inc.,
2.88%, 03/13/2020 | | | 27,000 | | | | 27,006 | |
3.63%, 03/15/2022 | | | 45,000 | | | | 46,090 | |
3.80%, 04/19/2023 | | | 24,000 | | | | 24,907 | |
2.90%, 10/28/2024 | | | 103,000 | | | | 103,259 | |
3.75%, 10/28/2029 | | | 44,000 | | | | 44,011 | |
LATAM Airlines Group S.A. Pass Through Trust (Chile), Series2015-1, Class A, 4.20%, 11/15/2027 | | | 91,340 | | | | 94,318 | |
| | | | | | | | |
| | |
| | | | | | | | |
| | | Principal
Amount | | | Value | |
Airlines–(continued) | | | | | | | | |
| | |
United Airlines Pass Through Trust,
Series2014-2, Class B, 4.63%, 09/03/2022 | | $ | 31,331 | | | $ | 32,330 | |
Series2019-2, Class B, 3.50%, 05/01/2028 | | | 36,000 | | | | 36,389 | |
Series2018-1, Class AA, 3.50%, 03/01/2030 | | | 55,553 | | | | 57,287 | |
| | | | | | | | 688,207 | |
|
Alternative Carriers–0.05% | |
| | |
CenturyLink, Inc.,
Series S, 6.45%, 06/15/2021 | | | 2,000 | | | | 2,098 | |
Series Y, 7.50%, 04/01/2024 | | | 4,000 | | | | 4,518 | |
Level 3 Financing, Inc.,
5.38%, 05/01/2025 | | | 5,000 | | | | 5,185 | |
5.25%, 03/15/2026 | | | 2,000 | | | | 2,084 | |
| | | | | | | | 13,885 | |
|
Apparel Retail–0.03% | |
| | |
L Brands, Inc.,
6.88%, 11/01/2035 | | | 4,000 | | | | 3,587 | |
6.75%, 07/01/2036 | | | 2,000 | | | | 1,760 | |
Michaels Stores, Inc., 8.00%, 07/15/2027(b) | | | 2,000 | | | | 1,914 | |
| | | | | | | | 7,261 | |
|
Apparel, Accessories & Luxury Goods–0.03% | |
| | |
Hanesbrands, Inc., 4.88%, 05/15/2026(b) | | | 3,000 | | | | 3,182 | |
William Carter Co. (The), 5.63%, 03/15/2027(b) | | | 3,000 | | | | 3,232 | |
| | | | | | | | 6,414 | |
|
Asset Management & Custody Banks–0.68% | |
| | |
Apollo Management Holdings L.P., 4.95% (5 yr. U.S. Treasury Yield Curve Rate + 3.27%), 01/14/2050(b)(c) | | | 90,000 | | | | 91,218 | |
Carlyle Holdings II Finance LLC, 5.63%, 03/30/2043(b) | | | 64,000 | | | | 75,248 | |
Prime Security Services Borrower LLC/Prime Finance, Inc.,
9.25%, 05/15/2023(b) | | | 2,000 | | | | 2,101 | |
5.75%, 04/15/2026(b) | | | 2,000 | | | | 2,178 | |
| | | | | | | | 170,745 | |
|
Auto Parts & Equipment–0.05% | |
| | |
Dana, Inc., 5.38%, 11/15/2027 | | | 2,000 | | | | 2,065 | |
Flexi-Van Leasing, Inc., 10.00%, 02/15/2023(b) | | | 4,000 | | | | 3,810 | |
Panther BF Aggregator 2 L.P./Panther Finance Co., Inc.,
6.25%, 05/15/2026(b) | | | 2,000 | | | | 2,159 | |
8.50%, 05/15/2027(b) | | | 2,000 | | | | 2,128 | |
See accompanying Notes to Financial Statements which are an integral part of the financial statements.
Invesco V.I. Core Plus Bond Fund
| | | | | | | | |
| | | Principal
Amount | | | Value | |
Auto Parts & Equipment–(continued) | |
| | |
Tenneco, Inc., 5.00%, 07/15/2026 | | $ | 2,000 | | | $ | 1,845 | |
| | | | | | | | 12,007 | |
| | |
Automobile Manufacturers–0.34% | | | | | | | | |
| | |
Hyundai Capital America,
4.30%, 02/01/2024(b) | | | 48,000 | | | | 50,560 | |
3.50%, 11/02/2026(b) | | | 30,000 | | | | 30,433 | |
J.B. Poindexter & Co., Inc., 7.13%, 04/15/2026(b) | | | 4,000 | | | | 4,232 | |
| | | | | | | | 85,225 | |
|
Automotive Retail–0.04% | |
| | |
Lithia Motors, Inc.,
5.25%, 08/01/2025(b) | | | 2,000 | | | | 2,098 | |
4.63%, 12/15/2027(b) | | | 2,000 | | | | 2,061 | |
Murphy Oil USA, Inc., 5.63%, 05/01/2027 | | | 2,000 | | | | 2,151 | |
Penske Automotive Group, Inc., 5.50%, 05/15/2026 | | | 4,000 | | | | 4,197 | |
| | | | | | | | 10,507 | |
|
Biotechnology–1.02% | |
| | |
AbbVie, Inc.,
2.30%, 11/21/2022(b) | | | 123,000 | | | | 123,669 | |
2.60%, 11/21/2024(b) | | | 132,000 | | | | 132,905 | |
| | | | | | | | 256,574 | |
|
Brewers–0.21% | |
Anheuser-Busch InBev Worldwide, Inc. (Belgium), 4.75%, 01/23/2029 | | | 45,000 | | | | 52,135 | |
|
Broadcasting–0.04% | |
| | |
AMC Networks, Inc., 4.75%, 08/01/2025 | | | 5,000 | | | | 5,029 | |
Gray Television, Inc., 7.00%, 05/15/2027(b) | | | 2,000 | | | | 2,226 | |
iHeartCommunications, Inc., 8.38%, 05/01/2027 | | | 2,000 | | | | 2,214 | |
| | | | | | | | 9,469 | |
|
Building Products–0.02% | |
| | |
Standard Industries, Inc.,
6.00%, 10/15/2025(b) | | | 3,000 | | | | 3,161 | |
5.00%, 02/15/2027(b) | | | 3,000 | | | | 3,135 | |
| | | | | | | | 6,296 | |
|
Cable & Satellite–1.07% | |
| | |
CCO Holdings LLC/CCO Holdings Capital Corp.,
5.75%, 09/01/2023 | | | 2,000 | | | | 2,043 | |
5.75%, 02/15/2026(b) | | | 11,000 | | | | 11,626 | |
Charter Communications Operating LLC/Charter Communications Operating Capital Corp., 5.38%, 04/01/2038 | | | 25,000 | | | | 28,650 | |
| | | | | | | | |
| | | Principal
Amount | | | Value | |
Cable & Satellite–(continued) | |
| | |
Comcast Corp.,
3.95%, 10/15/2025 | | $ | 20,000 | | | $ | 21,827 | |
4.60%, 10/15/2038 | | | 30,000 | | | | 35,743 | |
3.25%, 11/01/2039 | | | 15,000 | | | | 15,230 | |
3.45%, 02/01/2050 | | | 55,000 | | | | 56,345 | |
4.95%, 10/15/2058 | | | 31,000 | | | | 40,310 | |
CSC Holdings LLC,
6.75%, 11/15/2021 | | | 5,000 | | | | 5,393 | |
5.25%, 06/01/2024 | | | 5,000 | | | | 5,398 | |
Discovery Communications LLC, 5.20%, 09/20/2047 | | | 15,000 | | | | 17,463 | |
Dish DBS Corp., 5.88%, 11/15/2024 | | | 2,000 | | | | 2,048 | |
Sirius XM Radio, Inc.,
4.63%, 07/15/2024(b) | | | 19,000 | | | | 19,990 | |
5.38%, 07/15/2026(b) | | | 3,000 | | | | 3,194 | |
5.50%, 07/01/2029(b) | | | 3,000 | | | | 3,249 | |
| | | | | | | | 268,509 | |
|
Casinos & Gaming–0.15% | |
| | |
Boyd Gaming Corp.,
6.00%, 08/15/2026 | | | 2,000 | | | | 2,153 | |
4.75%, 12/01/2027(b) | | | 22,000 | | | | 22,893 | |
MGM Resorts International, 7.75%, 03/15/2022 | | | 5,000 | | | | 5,584 | |
Wynn Las Vegas LLC/Wynn Las Vegas Capital Corp., 5.50%, 03/01/2025(b) | | | 7,000 | | | | 7,516 | |
| | | | | | | | 38,146 | |
|
Coal & Consumable Fuels–0.02% | |
| | |
SunCoke Energy Partners L.P./SunCoke Energy Partners Finance Corp., 7.50%, 06/15/2025(b) | | | 6,000 | | | | 5,785 | |
|
Commodity Chemicals–0.03% | |
| | |
Nufarm Australia Ltd./Nufarm Americas, Inc. (Australia), 5.75%, 04/30/2026(b) | | | 2,000 | | | | 1,976 | |
Olin Corp., 5.63%, 08/01/2029 | | | 5,000 | | | �� | 5,290 | |
| | | | | | | | 7,266 | |
|
Communications Equipment–0.04% | |
| | |
CommScope Technologies LLC, 6.00%, 06/15/2025(b) | | | 2,000 | | | | 2,007 | |
Hughes Satellite Systems Corp.,
7.63%, 06/15/2021 | | | 5,000 | | | | 5,351 | |
5.25%, 08/01/2026 | | | 2,000 | | | | 2,201 | |
| | | | | | | | 9,559 | |
|
Construction & Engineering–0.03% | |
| | |
AECOM, 5.13%, 03/15/2027 | | | 2,000 | | | | 2,156 | |
William Lyon Homes, Inc.,
6.00%, 09/01/2023 | | | 2,000 | | | | 2,091 | |
6.63%, 07/15/2027(b) | | | 2,000 | | | | 2,175 | |
| | | | | | | | 6,422 | |
See accompanying Notes to Financial Statements which are an integral part of the financial statements.
Invesco V.I. Core Plus Bond Fund
| | | | | | | | |
| | | Principal
Amount | | | Value | |
Consumer Finance–0.31% | |
| | |
Ally Financial, Inc.,
8.00%, 03/15/2020 | | $ | 2,000 | | | $ | 2,019 | |
5.13%, 09/30/2024 | | | 8,000 | | | | 8,839 | |
4.63%, 03/30/2025 | | | 2,000 | | | | 2,169 | |
Credit Acceptance Corp.,
5.13%, 12/31/2024(b) | | | 18,000 | | | | 18,737 | |
6.63%, 03/15/2026(b) | | | 23,000 | | | | 24,923 | |
Navient Corp.,
8.00%, 03/25/2020 | | | 2,000 | | | | 2,024 | |
7.25%, 01/25/2022 | | | 2,000 | | | | 2,177 | |
7.25%, 09/25/2023 | | | 7,000 | | | | 7,928 | |
Springleaf Finance Corp.,
6.88%, 03/15/2025 | | | 4,000 | | | | 4,560 | |
7.13%, 03/15/2026 | | | 4,000 | | | | 4,632 | |
| | | | | | | | 78,008 | |
|
Copper–0.38% | |
| | |
Freeport-McMoRan, Inc.,
5.00%, 09/01/2027 | | | 57,000 | | | | 59,956 | |
5.40%, 11/14/2034 | | | 9,000 | | | | 9,448 | |
Southern Copper Corp. (Peru), 5.88%, 04/23/2045 | | | 18,000 | | | | 22,566 | |
Taseko Mines Ltd. (Canada), 8.75%, 06/15/2022(b) | | | 3,000 | | | | 2,498 | |
| | | | | | | | 94,468 | |
|
Data Processing & Outsourced Services–0.30% | |
| | |
Cardtronics Inc./Cardtronics USA, Inc., 5.50%, 05/01/2025(b) | | | 4,000 | | | | 4,162 | |
PayPal Holdings, Inc.,
2.65%, 10/01/2026 | | | 42,000 | | | | 42,606 | |
2.85%, 10/01/2029 | | | 29,000 | | | | 29,206 | |
| | | | | | | | 75,974 | |
|
Distillers & Vintners–0.09% | |
| | |
Constellation Brands, Inc., 2.61% (3 mo. USD LIBOR + 0.70%), 11/15/2021(c) | | | 22,000 | | | | 22,004 | |
|
Distributors–0.02% | |
| | |
Core & Main Holdings L.P., 9.38%
PIK Rate, 8.63% Cash Rate,
09/15/2024(b)(d) | | | 4,000 | | | | 4,172 | |
|
Diversified Banks–5.26% | |
| | |
Bank of America Corp., Series Z, 6.50%(e) | | | 85,000 | | | | 96,536 | |
BBVA Bancomer S.A. (Mexico), 6.75%, 09/30/2022(b) | | | 150,000 | | | | 163,581 | |
BNP Paribas S.A. (France), 4.38% (5 yr. U.S. Swap Rate + 1.48%), 03/01/2033(b)(c) | | | 58,000 | | | | 62,635 | |
Citigroup, Inc.,
Series Q, 5.95%(e) | | | 25,000 | | | | 25,586 | |
Series T, 6.25% (3 mo. USD LIBOR + 4.52%)(c)(e) | | | 30,000 | | | | 34,115 | |
Series U, 5.00%(e) | | | 95,000 | | | | 99,572 | |
2.88% (3 mo. USD LIBOR + 0.95%), 07/24/2023(c) | | | 20,000 | | | | 20,356 | |
| | | | | | | | |
| | | Principal
Amount | | | Value | |
Diversified Banks–(continued) | |
| | |
Corp. Andina de Fomento (Supranational), 4.38%, 06/15/2022 | | $ | 50,000 | | | $ | 52,584 | |
HSBC Holdings PLC (United Kingdom), 6.00%(e) | | | 200,000 | | | | 213,304 | |
4.00%, 03/30/2022 | | | 45,000 | | | | 46,893 | |
JPMorgan Chase & Co.,
Series V, 5.23%(e) | | | 40,000 | | | | 40,350 | |
2.30%, 08/15/2021 | | | 65,000 | | | | 65,150 | |
2.82%, (3 mo. USD LIBOR + 0.89%), 07/23/2024(c) | | | 65,000 | | | | 65,559 | |
3.63%, 12/01/2027 | | | 35,000 | | | | 36,966 | |
Series W, 2.91% (3 mo. USD LIBOR + 1.00%), 05/15/2047(c) | | | 65,000 | | | | 54,699 | |
Series I, 5.41% (3 mo. USD LIBOR + 3.47%)(c)(e) | | | 34,000 | | | | 34,358 | |
Royal Bank of Scotland Group PLC (The) (United Kingdom),
6.00%, 12/19/2023 | | | 5,000 | | | | 5,560 | |
3.75%, 11/01/2029 | | | 200,000 | | | | 204,213 | |
| | | | | | | | 1,322,017 | |
|
Diversified Chemicals–0.04% | |
| | |
Chemours Co. (The),
6.63%, 05/15/2023 | | | 5,000 | | | | 5,030 | |
7.00%, 05/15/2025 | | | 2,000 | | | | 2,019 | |
Trinseo Materials Operating S.C.A./Trinseo Materials Finance, Inc., 5.38%, 09/01/2025(b) | | | 2,000 | | | | 2,005 | |
| | | | | | | | 9,054 | |
|
Diversified Metals & Mining–0.19% | |
| | |
Hudbay Minerals, Inc. (Canada), 7.63%, 01/15/2025(b) | | | 4,000 | | | | 4,230 | |
Teck Resources Ltd. (Canada), 6.13%, 10/01/2035 | | | 38,000 | | | | 44,665 | |
| | | | | | | | 48,895 | |
|
Diversified REITs–1.71% | |
| | |
iStar, Inc., 4.75%, 10/01/2024 | | | 4,000 | | | | 4,153 | |
Trust F/1401 (Mexico),
5.25%, 01/30/2026(b) | | | 200,000 | | | | 215,322 | |
4.87%, 01/15/2030(b) | | | 200,000 | | | | 210,894 | |
| | | | | | | | 430,369 | |
|
Drug Retail–0.58% | |
| | |
CVS Pass Through Trust, 5.77%, 01/10/2033(b) | | | 128,743 | | | | 145,130 | |
|
Electric Utilities–0.14% | |
| | |
Southern Co. (The), Series B, 5.50% (3 mo. USD LIBOR + 3.63%), 03/15/2057(c) | | | 29,000 | | | | 30,388 | |
Vistra Operations Co. LLC, 5.50%, 09/01/2026(b) | | | 2,000 | | | | 2,125 | |
5.63%, 02/15/2027(b) | | | 2,000 | | | | 2,111 | |
| | | | | | | | 34,624 | |
See accompanying Notes to Financial Statements which are an integral part of the financial statements.
Invesco V.I. Core Plus Bond Fund
| | | | | | | | |
| | | Principal
Amount | | | Value | |
Electrical Components & Equipment–0.03% | |
| | |
EnerSys,
5.00%, 04/30/2023(b) | | $ | 5,000 | | | $ | 5,252 | |
4.38%, 12/15/2027(b) | | | 2,000 | | | | 1,980 | |
| | | | | | | | 7,232 | |
|
Electronic Components–1.28% | |
| | |
Corning, Inc., 5.45%, 11/15/2079 | | | 294,000 | | | | 322,492 | |
|
Electronic Equipment & Instruments–0.03% | |
| | |
Itron, Inc., 5.00%, 01/15/2026(b) | | | 6,000 | | | | 6,234 | |
MTS Systems Corp., 5.75%, 08/15/2027(b) | | | 2,000 | | | | 2,096 | |
| | | | | | | | 8,330 | |
|
Environmental & Facilities Services–0.02% | |
| | |
GFL Environmental, Inc. (Canada), 5.13%, 12/15/2026(b) | | | 2,000 | | | | 2,108 | |
Waste Pro USA, Inc., 5.50%, 02/15/2026(b) | | | 2,000 | | | | 2,089 | |
| | | | | | | | 4,197 | |
|
Financial Exchanges & Data–0.19% | |
| | |
Moody’s Corp., 5.25%, 07/15/2044 | | | 35,000 | | | | 44,330 | |
MSCI, Inc., 5.75%, 08/15/2025(b) | | | 3,000 | | | | 3,153 | |
| | | | | | | | 47,483 | |
|
Food Distributors–0.02% | |
| | |
US Foods, Inc., 5.88%, 06/15/2024(b) | | | 4,000 | | | | 4,128 | |
|
Food Retail–0.04% | |
| | |
Albertsons Cos., Inc./Safeway, Inc./New Albertson’s,
Inc./Albertson’s LLC,
6.63%, 06/15/2024 | | | 6,000 | | | | 6,295 | |
5.88%, 02/15/2028(b) | | | 2,000 | | | | 2,129 | |
Simmons Foods, Inc., 5.75%, 11/01/2024(b) | | | 2,000 | | | | 2,014 | |
| | | | | | | | 10,438 | |
|
Forest Products–0.02% | |
| | |
Norbord, Inc. (Canada), 5.75%, 07/15/2027(b) | | | 4,000 | | | | 4,161 | |
|
Gas Utilities–0.05% | |
| | |
AmeriGas Partners L.P./AmeriGas Finance Corp.,
5.63%, 05/20/2024 | | | 4,000 | | | | 4,330 | |
5.88%, 08/20/2026 | | | 2,000 | | | | 2,209 | |
Suburban Propane Partners L.P./Suburban Energy Finance Corp., 5.50%, 06/01/2024 | | | 5,000 | | | | 5,150 | |
Superior Plus L.P./Superior General Partner, Inc. (Canada), 7.00%, 07/15/2026(b) | | | 2,000 | | | | 2,153 | |
| | | | | | | | 13,842 | |
|
Health Care Equipment–0.16% | |
| | |
Teleflex, Inc., 4.88%, 06/01/2026 | | | 2,000 | | | | 2,096 | |
| | | | | | | | |
| | | Principal
Amount | | | Value | |
Health Care Equipment–(continued) | |
| | |
Zimmer Biomet Holdings, Inc., 2.65% (3 mo. USD LIBOR + 0.75%), 03/19/2021(c) | | $ | 38,000 | | | $ | 38,004 | |
| | | | | | | | 40,100 | |
|
Health Care Facilities–0.08% | |
| | |
Acadia Healthcare Co., Inc.,
6.50%, 03/01/2024 | | | 2,000 | | | | 2,078 | |
HCA, Inc.,
5.88%, 02/15/2026 | | | 10,000 | | | | 11,390 | |
5.38%, 09/01/2026 | | | 2,000 | | | | 2,232 | |
Tenet Healthcare Corp.,
8.13%, 04/01/2022 | | | 2,000 | | | | 2,216 | |
6.75%, 06/15/2023 | | | 2,000 | | | | 2,202 | |
| | | | | | | | 20,118 | |
|
Health Care REITs–0.53% | |
| | |
Diversified Healthcare Trust,
6.75%, 12/15/2021 | | | 40,000 | | | | 42,461 | |
MPT Operating Partnership L.P./MPT Finance Corp.,
5.00%, 10/15/2027 | | | 4,000 | | | | 4,250 | |
4.63%, 08/01/2029 | | | 32,000 | | | | 33,020 | |
Physicians Realty L.P., 4.30%, 03/15/2027 | | | 20,000 | | | | 21,378 | |
Welltower, Inc., 3.10%, 01/15/2030 | | | 31,000 | | | | 31,387 | |
| | | | | | | | 132,496 | |
|
Health Care Services–0.56% | |
| | |
AMN Healthcare, Inc., 5.13%, 10/01/2024(b) | | | 2,000 | | | | 2,076 | |
Cigna Corp.,
4.50%, 03/15/2021(b) | | | 45,000 | | | | 45,994 | |
3.40%, 09/17/2021 | | | 36,000 | | | | 36,857 | |
2.89%, (3 mo. USD LIBOR + 0.89%), 07/15/2023(c) | | | 43,000 | | | | 43,258 | |
Eagle Holding Co. II LLC, 8.38%
PIK Rate, 7.63% Cash Rate,
05/15/2022(b)(d) | | | 2,000 | | | | 2,036 | |
Envision Healthcare Corp.,
8.75%, 10/15/2026(b) | | | 2,000 | | | | 1,246 | |
Hadrian Merger Sub, Inc.,
8.50%, 05/01/2026(b) | | | 6,000 | | | | 6,159 | |
MPH Acquisition Holdings LLC,
7.13%, 06/01/2024(b) | | | 2,000 | | | | 1,940 | |
Surgery Center Holdings, Inc.,
10.00%, 04/15/2027(b) | | | 2,000 | | | | 2,201 | |
| | | | | | | | 141,767 | |
|
Home Improvement Retail–0.01% | |
| | |
Hillman Group, Inc. (The),
6.38%, 07/15/2022(b) | | | 2,000 | | | | 1,866 | |
|
Homebuilding–0.82% | |
| | |
Ashton Woods USA LLC/Ashton Woods Finance Co., 9.88%, 04/01/2027(b) | | | 2,000 | | | | 2,255 | |
Beazer Homes USA, Inc., 6.75%, 03/15/2025 | | | 2,000 | | | | 2,106 | |
KB Home, 4.80%, 11/15/2029 | | | 2,000 | | | | 2,045 | |
See accompanying Notes to Financial Statements which are an integral part of the financial statements.
Invesco V.I. Core Plus Bond Fund
| | | | | | | | |
| | | Principal
Amount | | | Value | |
Homebuilding–(continued) | |
| | |
Lennar Corp.,
8.38%, 01/15/2021 | | $ | 2,000 | | | $ | 2,121 | |
5.25%, 06/01/2026 | | | 5,000 | | | | 5,489 | |
Mattamy Group Corp. (Canada), 5.25%, 12/15/2027(b) | | | 2,000 | | | | 2,085 | |
MDC Holdings, Inc., 6.00%, 01/15/2043 | | | 174,000 | | | | 181,269 | |
Meritage Homes Corp., 5.13%, 06/06/2027 | | | 2,000 | | | | 2,136 | |
Taylor Morrison Communities, Inc., 5.75%, 01/15/2028(b) | | | 2,000 | | | | 2,186 | |
Taylor Morrison Communities, Inc./Taylor Morrison Holdings II, Inc.,
5.88%, 04/15/2023(b) | | | 3,000 | | | | 3,241 | |
| | | | | | | | 204,933 | |
|
Hotels, Resorts & Cruise Lines–0.02% | |
| | |
Marriott Ownership Resorts, Inc., 4.75%, 01/15/2028(b) | | | 4,000 | | | | 4,106 | |
|
Household Products–0.16% | |
| | |
Reynolds Group Issuer, Inc./LLC,
5.75%, 10/15/2020 | | | 35,857 | | | | 35,947 | |
7.00%, 07/15/2024(b) | | | 2,000 | | | | 2,071 | |
Spectrum Brands, Inc., 5.75%, 07/15/2025 | | | 2,000 | | | | 2,092 | |
| | | | | | | | 40,110 | |
|
Independent Power Producers & Energy Traders–0.17% | |
| | |
AES Corp. (The), 5.50%, 04/15/2025 | | | 5,000 | | | | 5,175 | |
Calpine Corp.,
5.50%, 02/01/2024 | | | 2,000 | | | | 2,035 | |
5.13%, 03/15/2028(b) | | | 28,000 | | | | 28,650 | |
Enviva Partners L.P./Enviva Partners Finance Corp., 6.50%, 01/15/2026(b) | | | 2,000 | | | | 2,146 | |
NRG Energy, Inc., 6.63%, 01/15/2027 | | | 5,000 | | | | 5,434 | |
| | | | | | | | 43,440 | |
|
Industrial Conglomerates–0.53% | |
| | |
General Electric Co., 5.55%, 01/05/2026 | | | 115,000 | | | | 132,006 | |
|
Industrial Machinery–0.06% | |
| | |
Cleaver-Brooks, Inc., 7.88%, 03/01/2023(b) | | | 8,000 | | | | 8,003 | |
EnPro Industries, Inc., 5.75%, 10/15/2026 | | | 4,000 | | | | 4,272 | |
Mueller Industries, Inc., 6.00%, 03/01/2027 | | | 4,000 | | | | 4,106 | |
| | | | | | | | 16,381 | |
|
Integrated Oil & Gas–0.92% | |
| | |
Petrobras Global Finance B.V. (Brazil), 5.75%, 02/01/2029 | | | 4,000 | | | | 4,519 | |
Petroleos Mexicanos (Mexico), 6.63%, 06/15/2035 | | | 23,000 | | | | 23,642 | |
Saudi Arabian Oil Co. (Saudi Arabia), 2.88%, 04/16/2024(b) | | | 200,000 | | | | 202,981 | |
| | | | | | | | 231,142 | |
| | | | | | | | |
| | | Principal
Amount | | | Value | |
Integrated Telecommunication Services–1.03% | |
| | |
AT&T, Inc.,
5.15%, 02/15/2050 | | $ | 141,000 | | | $ | 169,864 | |
5.70%, 03/01/2057 | | | 35,000 | | | | 45,112 | |
Cincinnati Bell, Inc., 7.00%,
07/15/2024(b) | | | 2,000 | | | | 2,102 | |
CommScope, Inc., 6.00%, 03/01/2026(b) | | | 4,000 | | | | 4,263 | |
Telecom Italia Capital S.A. (Italy), 7.20%, 07/18/2036 | | | 5,000 | | | | 5,937 | |
Verizon Communications, Inc.,
4.81%, 03/15/2039 | | | 27,000 | | | | 32,569 | |
| | | | | | | | 259,847 | |
|
Interactive Media & Services–0.45% | |
| | |
Cumulus Media New Holdings, Inc., 6.75%, 07/01/2026(b) | | | 2,000 | | | | 2,146 | |
Diamond Sports Group LLC/Diamond Sports Finance Co.,
5.38%, 08/15/2026(b) | | | 41,000 | | | | 41,551 | |
6.63%, 08/15/2027(b) | | | 2,000 | | | | 1,949 | |
Match Group, Inc., 5.63%, 02/15/2029(b) | | | 33,000 | | | | 35,239 | |
Twitter, Inc., 3.88%, 12/15/2027(b) | | | 31,000 | | | | 31,061 | |
| | | | | | | | 111,946 | |
|
Internet & Direct Marketing Retail–0.18% | |
| | |
QVC, Inc., 5.45%, 08/15/2034 | | | 48,000 | | | | 46,076 | |
|
Investment Banking & Brokerage–0.78% | |
| | |
Cantor Fitzgerald L.P., 6.50%, 06/17/2022(b) | | | 34,000 | | | | 36,777 | |
Goldman Sachs Group, Inc. (The),
Series P, 5.00%(e) | | | 40,000 | | | | 40,361 | |
3.27% (3 mo. USD LIBOR + 1.20%), 09/29/2025(c) | | | 50,000 | | | | 51,752 | |
Series L, 5.78% (3 mo. USD LIBOR + 3.88%)(c)(e) | | | 15,000 | | | | 15,094 | |
Jefferies Group LLC/Jefferies Group Capital Finance, Inc., 4.15%, 01/23/2030 | | | 49,000 | | | | 51,937 | |
| | | | | | | | 195,921 | |
|
Leisure Facilities–0.01% | |
| | |
Six Flags Entertainment Corp., 4.88%, 07/31/2024(b) | | | 2,000 | | | | 2,077 | |
|
Life & Health Insurance–1.59% | |
| | |
American Equity Investment Life Holding Co., 5.00%, 06/15/2027 | | | 40,000 | | | | 42,695 | |
Athene Holding Ltd., 4.13%, 01/12/2028 | | | 77,000 | | | | 79,705 | |
MetLife, Inc., Series C, 5.25%(e) | | | 65,000 | | | | 65,959 | |
Nationwide Financial Services, Inc.,
5.38%, 03/25/2021(b) | | | 165,000 | | | | 171,396 | |
3.90%, 11/30/2049(b) | | | 38,000 | | | | 39,577 | |
| | | | | | | | 399,332 | |
See accompanying Notes to Financial Statements which are an integral part of the financial statements.
Invesco V.I. Core Plus Bond Fund
| | | | | | | | |
| | | Principal
Amount | | | Value | |
Life Sciences Tools & Services–0.01% | |
| | |
Charles River Laboratories International, Inc., 4.25%, 05/01/2028(b) | | $ | 3,000 | | | $ | 3,062 | |
|
Managed Health Care–0.21% | |
| | |
Centene Corp.,
5.38%, 06/01/2026(b) | | | 4,000 | | | | 4,252 | |
4.63%, 12/15/2029(b) | | | 2,000 | | | | 2,111 | |
Molina Healthcare, Inc., 4.88%, 06/15/2025(b) | | | 1,000 | | | | 1,030 | |
UnitedHealth Group, Inc., 3.75%, 07/15/2025 | | | 35,000 | | | | 37,798 | |
WellCare Health Plans, Inc.,
5.25%, 04/01/2025 | | | 5,000 | | | | 5,213 | |
5.38%, 08/15/2026(b) | | | 2,000 | | | | 2,134 | |
| | | | | | | | 52,538 | |
|
Metal & Glass Containers–0.05% | |
| | |
Ball Corp., 5.25%, 07/01/2025 | | | 3,000 | | | | 3,348 | |
Berry Global, Inc., 6.00%, 10/15/2022 | | | 2,000 | | | | 2,043 | |
Flex Acquisition Co., Inc., 7.88%, 07/15/2026(b) | | | 4,000 | | | | 4,039 | |
OI European Group B.V., 4.00%, 03/15/2023(b) | | | 2,000 | | | | 2,021 | |
| | | | | | | | 11,451 | |
|
Movies & Entertainment–0.14% | |
| | |
AMC Entertainment Holdings, Inc., 6.13%, 05/15/2027 | | | 3,000 | | | | 2,745 | |
Netflix, Inc.,
5.75%, 03/01/2024 | | | 3,000 | | | | 3,328 | |
5.88%, 11/15/2028 | | | 7,000 | | | | 7,773 | |
5.38%, 11/15/2029(b) | | | 21,000 | | | | 22,403 | |
| | | | | | | | 36,249 | |
|
Multi-line Insurance–0.85% | |
| | |
AIG Global Funding, 2.70%, 12/15/2021(b) | | | 42,000 | | | | 42,642 | |
American Financial Group, Inc., 3.50%, 08/15/2026 | | | 20,000 | | | | 20,600 | |
Fairfax Financial Holdings Ltd. (Canada), 4.85%, 04/17/2028 | | | 35,000 | | | | 38,124 | |
Nationwide Mutual Insurance Co., 4.95%, 04/22/2044(b) | | | 100,000 | | | | 112,140 | |
| | | | | | | | 213,506 | |
|
Multi-Utilities–0.25% | |
| | |
CenterPoint Energy, Inc., Series A, 6.13%(e) | | | 60,000 | | | | 63,493 | |
|
Office REITs–0.27% | |
| | |
Alexandria Real Estate Equities, Inc.,
3.95%, 01/15/2027 | | | 40,000 | | | | 43,063 | |
3.38%, 08/15/2031 | | | 25,000 | | | | 26,091 | |
| | | | | | | | 69,154 | |
| | | | | | | | |
| | | Principal
Amount | | | Value | |
Office Services & Supplies–0.38% | |
| | |
Pitney Bowes, Inc.,
4.13%, 10/01/2021 | | $ | 55,000 | | | $ | 55,880 | |
5.20%, 04/01/2023 | | | 39,000 | | | | 38,529 | |
| | | | | | | | 94,409 | |
|
Oil & Gas Drilling–0.01% | |
| | |
Ensign Drilling, Inc. (Canada), 9.25%, 04/15/2024(b) | | | 2,000 | | | | 1,892 | |
Precision Drilling Corp. (Canada), 5.25%, 11/15/2024 | | | 2,000 | | | | 1,841 | |
| | | | | | | | 3,733 | |
|
Oil & Gas Equipment & Services–0.01% | |
| | |
Hilcorp Energy I L.P./Hilcorp Finance Co., 6.25%, 11/01/2028(b) | | | 2,000 | | | | 1,906 | |
|
Oil & Gas Exploration & Production–0.26% | |
| | |
Ascent Resources Utica Holdings LLC/ARU Finance Corp., 10.00%, 04/01/2022(b) | | | 2,000 | | | | 1,994 | |
Callon Petroleum Co.,
6.13%, 10/01/2024 | | | 2,000 | | | | 2,043 | |
6.38%, 07/01/2026 | | | 2,000 | | | | 2,035 | |
Continental Resources, Inc., 5.00%, 09/15/2022 | | | 39,000 | | | | 39,284 | |
Genesis Energy L.P./Genesis Energy Finance Corp., 6.25%, 05/15/2026 | | | 2,000 | | | | 1,916 | |
Gulfport Energy Corp.,
6.63%, 05/01/2023 | | | 2,000 | | | | 1,691 | |
6.00%, 10/15/2024 | | | 4,000 | | | | 2,850 | |
NGL Energy Partners L.P./NGL Energy Finance Corp., 7.50%, 04/15/2026(b) | | | 4,000 | | | | 3,879 | |
QEP Resources, Inc.,
6.88%, 03/01/2021 | | | 2,000 | | | | 2,076 | |
5.63%, 03/01/2026 | | | 2,000 | | | | 1,956 | |
Southwestern Energy Co.,
7.50%, 04/01/2026 | | | 2,000 | | | | 1,855 | |
7.75%, 10/01/2027 | | | 3,000 | | | | 2,786 | |
WPX Energy, Inc., 5.25%, 09/15/2024 | | | 2,000 | | | | 2,130 | |
| | | | | | | | 66,495 | |
|
Oil & Gas Refining & Marketing–0.26% | |
| | |
Calumet Specialty Products Partners L.P./Calumet Finance Corp., 7.63%, 01/15/2022 | | | 4,000 | | | | 4,011 | |
EnLink Midstream Partners L.P.,
4.85%, 07/15/2026 | | | 3,000 | | | | 2,819 | |
5.60%, 04/01/2044 | | | 2,000 | | | | 1,627 | |
NuStar Logistics L.P., 6.00%, 06/01/2026 | | | 5,000 | | | | 5,297 | |
Parkland Fuel Corp. (Canada),
6.00%, 04/01/2026(b) | | | 4,000 | | | | 4,233 | |
5.88%, 07/15/2027(b) | | | 40,000 | | | | 42,874 | |
Sunoco L.P./Sunoco Finance Corp.,
4.88%, 01/15/2023 | | | 2,000 | | | | 2,051 | |
5.88%, 03/15/2028 | | | 3,000 | | | | 3,194 | |
| | | | | | | | 66,106 | |
See accompanying Notes to Financial Statements which are an integral part of the financial statements.
Invesco V.I. Core Plus Bond Fund
| | | | | | | | |
| | | Principal
Amount | | | Value | |
Oil & Gas Storage & Transportation–2.21% | |
| | |
Antero Midstream Partners L.P./Antero Midstream Finance Corp., 5.38%, 09/15/2024 | | $ | 4,000 | | | $ | 3,720 | |
Cheniere Energy Partners L.P., 5.63%, 10/01/2026 | | | 2,000 | | | | 2,119 | |
Crestwood Midstream Partners L.P./Crestwood Midstream Finance Corp., 5.75%, 04/01/2025 | | | 2,000 | | | | 2,050 | |
DCP Midstream Operating L.P., 5.13%, 05/15/2029 | | | 3,000 | | | | 3,118 | |
Energy Transfer Operating L.P.,
Series A, 6.25%(e) | | | 2,000 | | | | 1,883 | |
5.88%, 01/15/2024 | | | 2,000 | | | | 2,214 | |
Enterprise Products Operating LLC, Series D, 4.88% (3 mo. USD LIBOR + 2.99%), 08/16/2077(c) | | | 28,000 | | | | 27,692 | |
Hess Midstream Operations L.P., 5.63%, 02/15/2026(b) | | | 3,000 | | | | 3,130 | |
Holly Energy Partners L.P./Holly Energy Finance Corp., 6.00%, 08/01/2024(b) | | | 2,000 | | | | 2,090 | |
MPLX L.P.,
2.79%, (3 mo. USD LIBOR + 0.90%), 09/09/2021(c) | | | 67,000 | | | | 67,212 | |
2.99%, (3 mo. USD LIBOR + 1.10%), 09/09/2022(c) | | | 48,000 | | | | 48,197 | |
Plains All American Pipeline L.P., Series B, 6.13%(e) | | | 54,000 | | | | 50,437 | |
Plains All American Pipeline L.P./PAA Finance Corp., 3.55%, 12/15/2029 | | | 186,000 | | | | 183,452 | |
Targa Resources Partners L.P./Targa Resources Partners Finance Corp.,
5.25%, 05/01/2023 | | | 57,000 | | | | 57,689 | |
5.13%, 02/01/2025 | | | 2,000 | | | | 2,080 | |
5.88%, 04/15/2026 | | | 7,000 | | | | 7,450 | |
5.00%, 01/15/2028 | | | 2,000 | | | | 2,045 | |
Williams Cos., Inc. (The),
4.13%, 11/15/2020 | | | 83,000 | | | | 83,997 | |
4.55%, 06/24/2024 | | | 4,000 | | | | 4,318 | |
| | | | | | | | 554,893 | |
|
Other Diversified Financial Services–0.41% | |
| | |
Carlyle Finance LLC, 5.65%, 09/15/2048(b) | | | 52,000 | | | | 61,804 | |
Football Trust V, 5.35%, 10/05/2020(b) | | | 33,353 | | | | 34,163 | |
Lions Gate Capital Holdings LLC, 6.38%, 02/01/2024(b) | | | 3,000 | | | | 3,143 | |
LPL Holdings, Inc., 5.75%,
09/15/2025(b) | | | 2,000 | | | | 2,097 | |
Tempo Acquisition LLC/Tempo Acquisition Finance Corp., 6.75%, 06/01/2025(b) | | | 3,000 | | | | 3,105 | |
| | | | | | | | 104,312 | |
|
Packaged Foods & Meats–0.19% | |
| | |
B&G Foods, Inc., 5.25%, 04/01/2025 | | | 2,000 | | | | 2,061 | |
Hershey Co. (The), 3.13%, 11/15/2049 | | | 36,000 | | | | 35,683 | |
JBS USA LUX S.A./JBS USA Finance, Inc., 5.75%, 06/15/2025(b) | | | 2,000 | | | | 2,076 | |
| | | | | | | | |
| | | Principal
Amount | | | Value | |
Packaged Foods & Meats–(continued) | |
| | |
Lamb Weston Holdings, Inc., 4.63%, 11/01/2024(b) | | $ | 4,000 | | | $ | 4,253 | |
Pilgrim’s Pride Corp., 5.88%,
09/30/2027(b) | | | 3,000 | | | | 3,249 | |
| | | | | | | | 47,322 | |
|
Paper Packaging–0.14% | |
| | |
Cascades, Inc./Cascades USA, Inc. (Canada), 5.38%, 01/15/2028(b) | | | 33,000 | | | | 33,990 | |
|
Paper Products–0.03% | |
| | |
Mercer International, Inc. (Germany), 6.50%, 02/01/2024 | | | 4,000 | | | | 4,162 | |
Schweitzer-Mauduit International, Inc., 6.88%, 10/01/2026(b) | | | 4,000 | | | | 4,321 | |
| | | | | | | | 8,483 | |
|
Pharmaceuticals–0.03% | |
| | |
Bausch Health Cos., Inc., 5.50%, 11/01/2025(b) | | | 4,000 | | | | 4,188 | |
HLF Financing S.a.r.l. LLC/Herbalife International, Inc., 7.25%,
08/15/2026(b) | | | 2,000 | | | | 2,123 | |
Par Pharmaceutical, Inc., 7.50%, 04/01/2027(b) | | | 2,000 | | | | 1,995 | |
| | | | | | | | 8,306 | |
|
Property & Casualty Insurance–0.10% | |
| | |
Allstate Corp. (The), 4.20%, 12/15/2046 | | | 20,000 | | | | 23,010 | |
AmWINS Group, Inc., 7.75%, 07/01/2026(b) | | | 2,000 | | | | 2,216 | |
| | | | | | | | 25,226 | |
|
Publishing–0.01% | |
| | |
Meredith Corp., 6.88%, 02/01/2026 | | | 2,000 | | | | 2,085 | |
|
Railroads–0.01% | |
| | |
Kenan Advantage Group, Inc. (The), 7.88%, 07/31/2023(b) | | | 2,000 | | | | 1,962 | |
|
Regional Banks–1.51% | |
| | |
CIT Group, Inc., 5.00%, 08/01/2023 | | | 2,000 | | | | 2,159 | |
Fifth Third Bancorp, 4.30%, 01/16/2024 | | | 55,000 | | | | 59,103 | |
First Niagara Financial Group, Inc., 7.25%, 12/15/2021 | | | 35,000 | | | | 38,335 | |
Synovus Financial Corp., 3.13%, 11/01/2022 | | | 33,000 | | | | 33,415 | |
Zions Bancorporation N.A., 3.25%, 10/29/2029 | | | 250,000 | | | | 245,446 | |
| | | | | | | | 378,458 | |
|
Reinsurance–0.64% | |
| | |
Global Atlantic Fin Co., 4.40%, 10/15/2029(b) | | | 130,000 | | | | 128,420 | |
Reinsurance Group of America, Inc., 4.70%, 09/15/2023 | | | 30,000 | | | | 32,542 | |
| | | | | | | | 160,962 | |
See accompanying Notes to Financial Statements which are an integral part of the financial statements.
Invesco V.I. Core Plus Bond Fund
| | | | | | | | |
| | | Principal
Amount | | | Value | |
Residential REITs–0.38% | |
| | |
Spirit Realty L.P.,
4.00%, 07/15/2029 | | $ | 25,000 | | | $ | 26,324 | |
3.40%, 01/15/2030 | | | 70,000 | | | | 70,352 | |
| | | | | | | | 96,676 | |
|
Restaurants–0.03% | |
| | |
1011778 BC ULC/New Red Finance, Inc. (Canada), 5.00%, 10/15/2025(b) | | | 4,000 | | | | 4,138 | |
Aramark Services, Inc., 5.00%, 04/01/2025(b) | | | 2,000 | | | | 2,090 | |
IRB Holding Corp., 6.75%,
02/15/2026(b) | | | 2,000 | | | | 2,101 | |
| | | | | | | | 8,329 | |
|
Retail REITs–0.11% | |
Regency Centers L.P., 4.13%, 03/15/2028 | | | 25,000 | | | | 27,112 | |
|
Security & Alarm Services–0.01% | |
Brink’s Co. (The), 4.63%, 10/15/2027(b) | | | 2,000 | | | | 2,065 | |
|
Semiconductors–0.59% | |
Analog Devices, Inc., 3.13%, 12/05/2023 | | | 30,000 | | | | 31,007 | |
Micron Technology, Inc.,
4.98%, 02/06/2026 | | | 25,000 | | | | 27,753 | |
4.19%, 02/15/2027 | | | 80,000 | | | | 85,645 | |
4.66%, 02/15/2030 | | | 3,000 | | | | 3,304 | |
| | | | | | | | 147,709 | |
|
Sovereign Debt–1.02% | |
Argentine Republic Government International Bond (Argentina), 7.13%, 06/28/2117 | | | 1,000 | | | | 506 | |
Egypt Government International Bond (Egypt), 7.05%, 01/15/2032(b) | | | 200,000 | | | | 210,014 | |
Hungary Government International Bond (Hungary), 5.38%, 03/25/2024 | | | 28,000 | | | | 31,613 | |
Mexico Government International Bond (Mexico), 4.00%, 10/02/2023 | | | 14,000 | | | | 14,753 | |
| | | | | | | | 256,886 | |
|
Specialized Consumer Services–0.02% | |
ServiceMaster Co. LLC (The),
5.13%, 11/15/2024(b) | | | 2,000 | | | | 2,079 | |
7.45%, 08/15/2027 | | | 3,000 | | | | 3,399 | |
| | | | | | | | 5,478 | |
|
Specialized Finance–0.06% | |
Park Aerospace Holdings Ltd. (Ireland), 5.25%, 08/15/2022(b) | | | 13,000 | | | | 13,887 | |
|
Specialized REITs–0.16% | |
Equinix, Inc., 5.88%, 01/15/2026REIT | | | 5,000 | | | | 5,315 | |
GLP Capital L.P./GLP Financing II, Inc., 5.38%, 04/15/2026 | | | 2,000 | | | | 2,214 | |
Iron Mountain US Holdings, Inc., 5.38%, 06/01/2026(b) | | | 2,000 | | | | 2,096 | |
| | | | | | | | |
| | | Principal
Amount | | | Value | |
Specialized REITs–(continued) | |
| | |
Iron Mountain, Inc.,
6.00%, 08/15/2023 | | $ | 2,000 | | | $ | 2,047 | |
5.25%, 03/15/2028(b) | | | 2,000 | | | | 2,084 | |
4.88%, 09/15/2029(b) | | | 22,000 | | | | 22,399 | |
Rayonier A.M. Products, Inc., 5.50%, 06/01/2024(b) | | | 4,000 | | | | 3,021 | |
SBA Communications Corp., 4.88%, 09/01/2024 | | | 2,000 | | | | 2,081 | |
| | | | | | | | 41,257 | |
|
Specialty Chemicals–0.03% | |
Ashland LLC, 4.75%, 08/15/2022 | | | 2,000 | | | | 2,095 | |
Element Solutions, Inc., 5.88%, 12/01/2025(b) | | | 2,000 | | | | 2,098 | |
GCP Applied Technologies, Inc., 5.50%, 04/15/2026(b) | | | 4,000 | | | | 4,211 | |
| | | | | | | | 8,404 | |
|
Steel–0.06% | |
| | |
Steel Dynamics, Inc., 5.13%, 10/01/2021 | | | 15,000 | | | | 15,009 | |
|
Systems Software–0.30% | |
| | |
Camelot Finance S.A., 4.50%, 11/01/2026(b) | | | 2,000 | | | | 2,059 | |
Microsoft Corp., 4.25%, 02/06/2047 | | | 24,000 | | | | 29,395 | |
VMware, Inc., 2.30%, 08/21/2020 | | | 45,000 | | | | 45,068 | |
| | | | | | | | 76,522 | |
|
Technology Hardware, Storage & Peripherals–0.96% | |
Apple, Inc.,
2.05%, 09/11/2026 | | | 49,000 | | | | 48,642 | |
4.25%, 02/09/2047 | | | 20,000 | | | | 23,906 | |
Dell International LLC/EMC Corp.,
7.13%, 06/15/2024(b) | | | 4,000 | | | | 4,225 | |
6.02%, 06/15/2026(b) | | | 62,000 | | | | 71,360 | |
4.90%, 10/01/2026(b) | | | 20,000 | | | | 22,018 | |
8.35%, 07/15/2046(b) | | | 49,000 | | | | 67,448 | |
Western Digital Corp., 4.75%, 02/15/2026 | | | 4,000 | | | | 4,177 | |
| | | | | | | | 241,776 | |
|
Tobacco–0.08% | |
| | |
Altria Group, Inc., 4.40%, 02/14/2026 | | | 18,000 | | | | 19,555 | |
|
Trading Companies & Distributors–0.93% | |
| | |
Air Lease Corp.,
3.88%, 04/01/2021 | | | 85,000 | | | | 86,747 | |
3.38%, 06/01/2021 | | | 60,000 | | | | 61,021 | |
3.00%, 09/15/2023 | | | 64,000 | | | | 65,549 | |
Aircastle Ltd.,
5.50%, 02/15/2022 | | | 2,000 | | | | 2,127 | |
5.00%, 04/01/2023 | | | 2,000 | | | | 2,139 | |
BMC East LLC, 5.50%, 10/01/2024(b) | | | 4,000 | | | | 4,172 | |
Herc Holdings, Inc., 5.50%,
07/15/2027(b) | | | 2,000 | | | | 2,110 | |
See accompanying Notes to Financial Statements which are an integral part of the financial statements.
Invesco V.I. Core Plus Bond Fund
| | | | | | | | |
| | | Principal
Amount | | | Value | |
Trading Companies & Distributors–(continued) | |
| | |
United Rentals North America, Inc.,
6.50%, 12/15/2026 | | $ | 6,000 | | | $ | 6,605 | |
5.50%, 05/15/2027 | | | 2,000 | | | | 2,148 | |
5.25%, 01/15/2030 | | | 2,000 | | | | 2,156 | |
| | | | | | | | 234,774 | |
|
Trucking–0.34% | |
Aviation Capital Group LLC,
2.61%, (3 mo. USD LIBOR + 0.67%), 07/30/2021(b)(c) | | | 22,000 | | | | 22,005 | |
4.13%, 08/01/2025(b) | | | 31,000 | | | | 32,409 | |
Avis Budget Car Rental LLC/Avis Budget Finance, Inc.,
5.25%, 03/15/2025(b) | | | 2,000 | | | | 2,063 | |
Avolon Holdings Funding Ltd. (Ireland), 4.38%, 05/01/2026(b) | | | 15,000 | | | | 15,863 | |
DAE Funding LLC (United Arab Emirates), 4.00%, 08/01/2020(b) | | | 12,000 | | | | 12,110 | |
| | | | | | | | 84,450 | |
|
Wireless Telecommunication Services–1.87% | |
| | |
Rogers Communications, Inc. (Canada), 4.35%, 05/01/2049 | | | 11,000 | | | | 12,295 | |
Sprint Spectrum Co. LLC/Sprint Spectrum Co. II LLC/Sprint Spectrum Co. III LLC,
4.74%, 03/20/2025(b) | | | 200,000 | | | | 212,379 | |
5.15%, 03/20/2028(b) | | | 209,000 | | | | 228,405 | |
T-Mobile USA, Inc.,
6.38%, 03/01/2025 | | | 6,000 | | | | 6,212 | |
6.50%, 01/15/2026 | | | 10,000 | | | | 10,741 | |
| | | | | | | | 470,032 | |
Total U.S. Dollar Denominated Bonds & Notes
(Cost $9,665,195) | | | | 10,140,865 | |
|
Asset-Backed Securities–17.57% | |
| | |
Adjustable Rate Mortgage Trust, Series2004-2, Class 6A1, 4.22%, 02/25/2035(f) | | | 9,677 | | | | 9,853 | |
Angel Oak Mortgage Trust I LLC,
Series2018-3, Class A1, 3.65%, 09/25/2048(b)(f) | | | 34,345 | | | | 34,831 | |
Series2019-2, Class A1, 3.63%, 03/25/2049(b)(f) | | | 89,727 | | | | 90,954 | |
Angel Oak Mortgage Trust LLC, Series2017-3, Class A1, 2.71%, 11/25/2047(b)(f) | | | 13,463 | | | | 13,482 | |
Banc of America Commercial Mortgage Trust, Series 2015-UBS7, Class AS, 3.99%, 09/15/2048(f) | | | 70,000 | | | | 74,396 | |
Benchmark Mortgage Trust,
Series2019-B14, Class A5, 3.05%, 12/15/2062 | | | 90,000 | | | | 93,122 | |
Series2019-B14, Class C, 3.78%, 12/15/2062 | | | 83,700 | | | | 84,954 | |
Series2019-B15, Class B, 3.56%, 12/15/2072 | | | 70,000 | | | | 72,243 | |
| | | | | | | | |
| | | Principal
Amount | | | Value | |
CGDBB Commercial Mortgage Trust, Series 2017-BIOC, Class A, 2.53% (1 mo. USD LIBOR + 0.79%), 07/15/2032(b)(c) | | $ | 91,354 | | | $ | 91,346 | |
Series 2017-BIOC, Class C, 2.79% (1 mo. USD LIBOR + 1.05%), 07/15/2032(b)(c) | | | 91,354 | | | | 91,262 | |
Series 2017-BIOC, Class D, 3.34% (1 mo. USD LIBOR + 1.60%), 07/15/2032(b)(c) | | | 91,354 | | | | 91,496 | |
Chase Home Lending Mortgage Trust, Series 2019-ATR2, Class A3, 3.50%, 07/25/2049(b)(f) | | | 136,626 | | | | 139,007 | |
Chase Mortgage Finance Corp.,
Series2016-1, Class M3, 3.75%, 04/25/2045(b)(f) | | | 55,453 | | | | 56,199 | |
Series2016-2, Class M3, 3.75%, 12/25/2045(b)(f) | | | 62,154 | | | | 62,832 | |
Citigroup Mortgage Loan Trust,
Series 2019-IMC1, Class A1, 2.72%, 07/25/2049(b)(f) | | | 88,034 | | | | 88,338 | |
Commercial Mortgage Trust,
Series 2015-CR23, Class CMB, 3.68%, 05/10/2048(b)(f) | | | 88,609 | | | | 88,814 | |
Series 2015-CR25, Class B, 4.54%, 08/10/2048(f) | | | 72,000 | | | | 76,848 | |
Series2016-GCT, Class B, 3.09%, 08/10/2029(b) | | | 100,000 | | | | 100,518 | |
CSFB Mortgage-Backed Pass Through Ctfs., Series2004-AR5, Class 3A1, 4.40%, 06/25/2034(f) | | | 17,383 | | | | 17,864 | |
CSWF, Series2018-TOP, Class B, 3.04% (1 mo. USD LIBOR + 1.30%), 08/15/2035(b)(c) | | | 100,000 | | | | 100,040 | |
DB Master Finance LLC,
Series2019-1A, Class A23, 4.35%, 05/20/2049(b) | | | 49,750 | | | | 51,643 | |
Series2019-1A, Class A2II, 4.02%, 05/20/2049(b) | | | 49,750 | | | | 51,085 | |
Deephaven Residential Mortgage Trust , Series2019-4A, Class A1, 2.79%, 10/25/2059(b)(f) | | | 97,665 | | | | 97,915 | |
Domino’s Pizza Master Issuer LLC, Series2019-1A, Class A2, 3.67%, 10/25/2049(b) | | | 109,000 | | | | 109,155 | |
DT Auto Owner Trust,
Series2019-3A, Class C, 2.74%, 04/15/2025(b) | | | 40,000 | | | | 40,209 | |
Series2019-3A, Class D, 2.96%, 04/15/2025(b) | | | 56,000 | | | | 56,048 | |
Ellington Financial Mortgage Trust, Series2019-2, Class A1, 2.74%, 11/25/2059(b)(f) | | | 97,789 | | | | 97,958 | |
Galton Funding Mortgage Trust, Series2019-H1, Class A1, 2.66%, 10/25/2059(b)(f) | | | 98,657 | | | | 98,556 | |
GCAT Trust,
Series2019-NM2, Class A1, 2.86%, 09/25/2059(b)(f)(g) | | | 94,810 | | | | 95,205 | |
Series 2019-NQM3, Class A1, 2.69%, 11/25/2059(b)(f) | | | 98,773 | | | | 98,943 | |
See accompanying Notes to Financial Statements which are an integral part of the financial statements.
Invesco V.I. Core Plus Bond Fund
| | | | | | | | |
| | | Principal
Amount | | | Value | |
GMACM Mortgage Loan Trust, Series2006-AR1, Class 1A1, 4.16%, 04/19/2036(f) | | $ | 54,412 | | | $ | 50,932 | |
Golub Capital Partners CLO 41 B Ltd., Series2019-41A, Class A, 3.34% (3 mo. USD LIBOR + 1.37%), 04/20/2029(b)(c) | | | 146,000 | | | | 146,133 | |
Hertz Vehicle Financing II L.P., Series2019-2A, Class A, 3.42%, 05/25/2025(b) | | | 100,000 | | | | 103,118 | |
HMH Trust, Series2017-NSS, Class A, 3.06%, 07/05/2031(b) | | | 100,000 | | | | 101,097 | |
Homeward Opportunities Fund I Trust, Series2019-1, Class A1, 3.45%, 01/25/2059(b)(f) | | | 74,857 | | | | 75,441 | |
Invitation Homes Trust, Series 2017- SFR2, Class C, 3.19% (1 mo. USD LIBOR + 1.45%), 12/17/2036(b)(c) | | | 100,000 | | | | 100,184 | |
JOL Air Ltd., Series2019-1, Class A, 3.97%, 04/15/2044(b) | | | 234,247 | | | | 237,168 | |
Merrill Lynch Mortgage Investors Trust, Series2005-3, Class 3A, 4.01% (1 mo. USD LIBOR + 0.25%), 11/25/2035(c) | | | 13,724 | | | | 14,136 | |
Morgan Stanley Capital I Trust,
Series2017-CLS, Class A, 2.44% (1 mo. USD LIBOR + 0.70%), 11/15/2034(b)(c) | | | 99,000 | | | | 98,844 | |
Series2017-CLS, Class B, 2.59% (1 mo. USD LIBOR + 0.85%), 11/15/2034(b)(c) | | | 49,000 | | | | 49,045 | |
Series2017-CLS, Class C, 2.74% (1 mo. USD LIBOR + 1.00%), 11/15/2034(b)(c) | | | 33,000 | | | | 33,030 | |
Morgan Stanley Capital I Trust ,
Series2019-L2, Class A4, 4.07%, 03/15/2052 | | | 80,000 | | | | 89,025 | |
Series2019-L3, Class AS, 3.49%, 11/15/2029 | | | 60,000 | | | | 62,060 | |
MVW LLC, Series2019-2A, Class A, 2.22%, 10/20/2038(b) | | | 95,511 | | | | 94,941 | |
MVW Owner Trust, Series2019-1A, Class A, 2.89%, 11/20/2036(b) | | | 89,140 | | | | 90,287 | |
New Residential Mortgage Loan Trust, Series 2019-NQM4, Class A1, 2.49%, 09/25/2059(b)(f) | | | 95,444 | | | | 95,212 | |
One Bryant Park Trust, Series2019-OBP, Class A, 2.52%, 09/15/2054(b) | | | 114,000 | | | | 111,258 | |
Starwood Waypoint Homes Trust, Series2017-1, Class D, 3.69% (1 mo. USD LIBOR + 1.95%), 01/17/2035(b)(c) | | | 100,000 | | | | 100,187 | |
Structured Adjustable Rate Mortgage Loan Trust, Series2004-12, Class 3A2, 4.16%, 09/25/2034(f) | | | 11,304 | | | | 11,569 | |
Structured Asset Securities Mortgage Pass-Through Ctfs., Series2003-34A, Class 5A5, 4.13%, 11/25/2033(f) | | | 62,844 | | | | 64,222 | |
Thornburg Mortgage Securities Trust, Series2005-1, Class A3, 4.46%, 04/25/2045(f) | | | 42,835 | | | | 43,049 | |
| | | | | | | | |
| | | Principal
Amount | | | Value | |
Towd Point Mortgage Trust, Series2017-2, Class A1, 2.75%,
04/25/2057(b)(f) | | $ | 52,237 | | | $ | 52,637 | |
UBS Commercial Mortgage Trust,
Series2019-C16, Class A4, 3.60%, 04/15/2052 | | | 80,000 | | | | 86,061 | |
Verus Securitization Trust, Series 2019- INV1, Class A1, 3.40%,
12/25/2059(b)(f) | | | 85,670 | | | | 86,370 | |
Wendy’s Funding LLC, Series2018-1A, Class A2II, 3.88%, 03/15/2048(b) | | | 58,800 | | | | 59,866 | |
WFRBS Commercial Mortgage Trust, Series2012-C6, Class B, 4.70%, 04/15/2045 | | | 80,000 | | | | 83,407 | |
Total Asset-Backed Securities
(Cost $4,374,819) | | | | 4,414,395 | |
|
U.S. Government Sponsored Agency Mortgage-Backed Securities–16.95% | |
|
Collateralized Mortgage Obligations–3.53% | |
Connecticut Avenue Securities Trust
Series2019-R03, Class 1M2, 3.94% (1 mo. USD LIBOR + 2.15%), 09/25/2031(b)(c) | | | 54,000 | | | | 54,457 | |
Series2019-R06, Class 2M2, 3.89% (1 mo. USD LIBOR + 2.10%), 09/25/2039(b)(c) | | | 54,000 | | | | 54,568 | |
Freddie Mac Multifamily Structured
Pass Through Ctfs.
Series K731, Class A2, 3.60%, 02/25/2025(f) | | | 79,000 | | | | 83,662 | |
Series K734, Class A2, 3.21%, 02/25/2026 | | | 181,000 | | | | 190,514 | |
Series K062, Class A1, 3.03%, 09/25/2026 | | | 25,117 | | | | 26,062 | |
Series K071, Class A2, 3.29%, 11/25/2027 | | | 50,000 | | | | 53,218 | |
Series K083, Class AM, 4.03%, 10/25/2028(f) | | | 23,000 | | | | 25,637 | |
Series K085, Class AM, 4.06%, 10/25/2028(f) | | | 23,000 | | | | 25,665 | |
Series K089, Class AM, 3.63%, 01/25/2029(f) | | | 39,000 | | | | 42,310 | |
Series K088, Class AM, 3.76%, 01/25/2029(f) | | | 92,000 | | | | 100,824 | |
Series K090, Class A2, 3.42%, 02/25/2029 | | | 200,000 | | | | 215,339 | |
Freddie Mac Whole Loan Securities Trust, Series 2017-SC02, Class 2A1, 3.50%, 05/25/2047 | | | 16,012 | | | | 16,172 | |
| | | | | | | | 888,428 | |
|
Federal Home Loan Mortgage Corp. (FHLMC)–1.70% | |
6.50%, 08/01/2032 | | | 618 | | | | 686 | |
4.00%, 11/01/2048 to 07/01/2049 | | | 407,417 | | | | 425,843 | |
| | | | | | | | 426,529 | |
See accompanying Notes to Financial Statements which are an integral part of the financial statements.
Invesco V.I. Core Plus Bond Fund
| | | | | | | | |
| | | Principal
Amount | | | Value | |
Federal National Mortgage Association (FNMA)–9.44% | |
| | |
7.50%, 04/01/2029 | | $ | 856 | | | $ | 907 | |
3.50%, 12/01/2030 to 05/01/2047 | | | 964,484 | | | | 1,004,310 | |
6.50%, 09/01/2031 | | | 654 | | | | 740 | |
7.00%, 09/01/2032 | | | 4,640 | | | | 4,925 | |
4.50%, 12/01/2048 | | | 52,947 | | | | 55,650 | |
TBA,
2.50%, 01/01/2035(h) | | | 431,000 | | | | 434,675 | |
3.00%, 01/01/2035 to 01/01/2050(h) | | | 854,000 | | | | 870,024 | |
| | | | | | | | 2,371,231 | |
|
Government National Mortgage Association (GNMA)–2.28% | |
| | |
7.50%, 06/15/2023 | | | 649 | | | | 658 | |
8.50%, 11/15/2024 | | | 727 | | | | 729 | |
7.00%, 07/15/2031 to 08/15/2031 | | | 793 | | | | 902 | |
6.50%, 11/15/2031 to 03/15/2032 | | | 1,974 | | | | 2,179 | |
6.00%, 11/15/2032 | | | 1,012 | | | | 1,136 | |
4.00%, 07/20/2049 | | | 205,956 | | | | 213,523 | |
TBA,
3.00%, 01/01/2050(h) | | | 345,000 | | | | 354,176 | |
| | | | | | | | 573,303 | |
Total U.S. Government Sponsored Agency Mortgage-Backed Securities (Cost $4,228,338) | | | | | | | 4,259,491 | |
|
U.S. Treasury Securities–16.36% | |
|
U.S. Treasury Bills–0.20% | |
| | |
1.52% - 1.62%, 04/09/2020(i)(j) | | | 51,000 | | | | 50,789 | |
|
U.S. Treasury Bonds–3.10% | |
| | |
2.25%, 08/15/2049 | | | 804,300 | | | | 779,557 | |
|
U.S. Treasury Floating Rate Notes–7.80% | |
| | |
1.75%, 12/31/2024 | | | 1,304,500 | | | | 1,307,460 | |
1.75%, 12/31/2026 | | | 655,200 | | | | 651,411 | |
| | | | | | | | 1,958,871 | |
|
U.S. Treasury Notes–5.26% | |
| | |
1.63%, 12/15/2022 | | | 623,300 | | | | 623,596 | |
1.75%, 11/15/2029 | | | 708,700 | | | | 697,543 | |
| | | | | | | | 1,321,139 | |
Total U.S. Treasury Securities
(Cost $4,117,127) | | | | 4,110,356 | |
| | |
| | | Shares | | | | | |
|
Preferred Stocks–0.62% | |
|
Diversified Banks–0.06% | |
| | |
Wells Fargo & Co., 7.50%, Class A, Series L, Conv. Pfd. | | | 11 | | | | 15,950 | |
|
Investment Banking & Brokerage–0.56% | |
| | |
Morgan Stanley, 6.88%, Series F, Pfd. | | | 5,000 | | | | 141,500 | |
Total Preferred Stocks (Cost $138,976) | | | | | | | 157,450 | |
| | | | | | | | |
| | | Principal
Amount | | | Value | |
Non-U.S. Dollar Denominated Bonds & Notes–0.47%(k) | |
|
Movies & Entertainment–0.47% | |
| | |
Netflix, Inc. 3.88%, 11/15/2029 (Cost $111,565)(b) | | EUR | 100,000 | | | $ | 119,040 | |
| |
| |
Municipal Obligations–0.28% | | | | | |
| | |
Texas Private Activity Bond Surface Transportation Corp. (NTE Mobility Partners LLC - North Tarrant Express Managed Lanes), Series 2019 B, RB, 3.92%, 12/31/2049
(Cost $70,000) | | $ | 70,000 | | | | 70,480 | |
| |
|
Agency Credit Risk Transfer Notes–0.20% | |
| | |
Fannie Mae Connecticut Avenue Securities Series2016-C07, Class 2M2, 6.14%, (1 mo. USD LIBOR + 4.35%) 05/25/2029(c) | | | 21,807 | | | | 23,014 | |
| |
Series2018-C05, Class 1M2, 4.14%, (1 mo. USD LIBOR + 2.35%) 01/25/2031(c) | | | 26,000 | | | | 26,396 | |
| |
Total Agency Credit Risk Transfer Notes
(Cost $49,215) | | | | 49,410 | |
| |
| | |
| | | Shares | | | | |
|
Common Stocks & Other Equity Interests–0.00% | |
|
Diversified Support Services–0.00% | |
| | |
ACC Claims Holdings LLC(l)(m) | | | 73,980 | | | | 0 | |
| |
|
Other Diversified Financial Services–0.00% | |
| | |
Adelphia Recovery Trust, Series ACC1(n) | | | 87,412 | | | | 1 | |
| |
Total Common Stocks & Other Equity Interests (Cost $22,181) | | | | 1 | |
| |
|
Money Market Funds–12.88% | |
| | |
Invesco Government & Agency Portfolio, Institutional Class, 1.50%(o) | | | 1,129,193 | | | | 1,129,193 | |
| |
Invesco Liquid Assets Portfolio, Institutional Class, 1.71%(o) | | | 817,397 | | | | 817,642 | |
| |
Invesco Treasury Portfolio, Institutional Class, 1.49%(o) | | | 1,290,506 | | | | 1,290,506 | |
| |
Total Money Market Funds
(Cost $3,237,269) | | | | 3,237,341 | |
| |
TOTAL INVESTMENTS IN SECURITIES–105.69%
(Cost $26,014,685) | | | | 26,558,829 | |
| |
OTHER ASSETS LESS LIABILITIES–(5.69)% | | | | (1,430,897 | ) |
| |
NET ASSETS–100.00% | | | | | | $ | 25,127,932 | |
| |
See accompanying Notes to Financial Statements which are an integral part of the financial statements.
Invesco V.I. Core Plus Bond Fund
Investment Abbreviations:
| | |
| CLO | | - Collateralized Loan Obligation |
| Conv. | | - Convertible |
| Ctfs. | | - Certificates |
| EUR | | - Euro |
| LIBOR | | - London Interbank Offered Rate |
| Pfd. | | - Preferred |
| PIK | | -Pay-in-Kind |
| RB | | - Revenue Bonds |
| REIT | | - Real Estate Investment Trust |
| TBA | | - To Be Announced |
| USD | | - U.S. Dollar |
Notes to Schedule of Investments:
| (a) | Industry and/or sector classifications used in this report are generally according to the Global Industry Classification Standard, which was developed by and is the exclusive property and a service mark of MSCI Inc. and Standard & Poor’s. |
| (b) | Security purchased or received in a transaction exempt from registration under the Securities Act of 1933, as amended (the “1933 Act”). The security may be resold pursuant to an exemption from registration under the 1933 Act, typically to qualified institutional buyers. The aggregate value of these securities at December 31, 2019 was $7,501,018, which represented 29.85% of the Fund’s Net Assets. |
| (c) | Interest or dividend rate is redetermined periodically. Rate shown is the rate in effect on December 31, 2019. |
| (d) | All or a portion of this security isPay-in-Kind.Pay-in-Kind securities pay interest income in the form of securities. |
| (e) | Perpetual bond with no specified maturity date. |
| (f) | Interest rate is redetermined periodically based on the cash flows generated by the pool of assets backing the security, less any applicable fees. The rate shown is the rate in effect on December 31, 2019. |
| (g) | Step coupon bond. The interest rate represents the coupon rate at which the bond will accrue at a specified future date. |
| (h) | Security purchased on a forward commitment basis. This security is subject to dollar roll transactions. See Note 1M. |
| (i) | All or a portion of the value was pledged as collateral to cover margin requirements for open futures contracts. See Note 1L. |
| (j) | Security traded on a discount basis. The interest rate shown represents the discount rate at the time of purchase by the Fund. |
| (k) | Foreign denominated security. Principal amount is denominated in the currency indicated. |
| (l) | Non-income producing security. |
| (m) | Security valued using significant unobservable inputs (Level 3). See Note 3. |
| (n) | Non-income producing security acquired as part of the Adelphia Communications bankruptcy reorganization. |
| (o) | The money market fund and the Fund are affiliated by having the same investment adviser. The rate shown is the7-day SEC standardized yield as of December 31, 2019. |
| | | | | | | | | | | | | | | | | | | | | | | | | |
| Open Futures Contracts |
| Long Futures Contracts | | Number of
Contracts | | Expiration
Month | | Notional
Value | | Value | | Unrealized
Appreciation
(Depreciation) |
Interest Rate Risk | | | | | | | | | | | | | | | | | | | | | | | | | |
U.S. Treasury 2 Year Notes | | | | 4 | | | | | March-2020 | | | | $ | 862,000 | | | | $ | (945 | ) | | | $ | (945 | ) |
U.S. Treasury 5 Year Notes | | | | 9 | | | | | March-2020 | | | | | 1,067,484 | | | | | (2,854 | ) | | | | (2,854 | ) |
U.S. Treasury 10 Year Notes | | | | 7 | | | | | March-2020 | | | | | 898,953 | | | | | (4,343 | ) | | | | (4,343 | ) |
U.S. Treasury Long Bonds | | | | 5 | | | | | March-2020 | | | | | 779,531 | | | | | (16,376 | ) | | | | (16,376 | ) |
U.S. Treasury Ultra Bonds | | | | 2 | | | | | March-2020 | | | | | 363,313 | | | | | (9,630 | ) | | | | (9,630 | ) |
Subtotal–Long Futures Contracts | | | | | | | | | | | | | | | | | | | (34,148 | ) | | | | (34,148 | ) |
| | | | | |
Short Futures Contracts | | | | | | | | | | | | | | | | | | | | | | | | | |
Interest Rate Risk | | | | | | | | | | | | | | | | | | | | | | | | | |
U.S. Treasury 10 Year Ultra Bonds | | | | 8 | | | | | March-2020 | | | | | (1,125,625 | ) | | | | 14,283 | | | | | 14,283 | |
Total Futures Contracts | | | | | | | | | | | | | | | | | | $ | (19,865 | ) | | | $ | (19,865 | ) |
| | | | | | | | | | | | | | |
| Open Forward Foreign Currency Contracts | |
Settlement Date | | | | Contract to | | | Unrealized Appreciation (Depreciation) | |
| | Counterparty | | Deliver | | | Receive | |
Currency Risk | | | | | | | | | | | | | | |
02/28/2020 | | Citibank N.A. | | | EUR 295,145 | | | | USD 327,593 | | | | $(4,628) | |
Abbreviations:
EUR – Euro
USD – U.S. Dollar
See accompanying Notes to Financial Statements which are an integral part of the financial statements.
Invesco V.I. Core Plus Bond Fund
Statement of Assets and Liabilities
December 31, 2019
| | | | |
Assets: | | | | |
| |
Investments in securities, at value
(Cost $22,777,416) | | $ | 23,321,488 | |
Investments in affiliated money market funds, at value
(Cost $3,237,269) | | | 3,237,341 | |
Cash | | | 1,228 | |
Foreign currencies, at value (Cost $170,163) | | | 173,359 | |
Receivable for: | | | | |
Fund shares sold | | | 7,606 | |
Dividends | | | 7,417 | |
Interest | | | 137,205 | |
Investment for trustee deferred compensation and retirement plans | | | 61,686 | |
Total assets | | | 26,947,330 | |
| |
Liabilities: | | | | |
| |
Other investments: | | | | |
Variation margin payable - futures contracts | | | 3,170 | |
Unrealized depreciation on forward foreign currency contracts outstanding | | | 4,628 | |
Payable for: | | | | |
Investments purchased | | | 1,660,589 | |
Fund shares reacquired | | | 1,735 | |
Accrued fees to affiliates | | | 18,942 | |
Accrued other operating expenses | | | 66,531 | |
Trustee deferred compensation and retirement plans | | | 63,803 | |
Total liabilities | | | 1,819,398 | |
Net assets applicable to shares outstanding | | $ | 25,127,932 | |
| |
Net assets consist of: | | | | |
| |
Shares of beneficial interest | | $ | 23,835,364 | |
Distributable earnings | | | 1,292,568 | |
| | | $25,127,932 | |
| |
Net Assets: | | | | |
| |
Series I | | $ | 24,768,535 | |
Series II | | $ | 359,397 | |
|
Shares outstanding, no par value, with an unlimited number of shares authorized: | |
| |
Series I | | | 3,825,630 | |
Series II | | | 55,757 | |
Series I: | | | | |
Net asset value per share | | $ | 6.47 | |
Series II: | | | | |
Net asset value per share | | $ | 6.45 | |
Statement of Operations
For the year ended December 31, 2019
| | | | |
Investment income: | | | | |
| |
Interest | | $ | 646,980 | |
| |
Dividends from affiliated money market funds | | | 89,280 | |
| |
Dividends | | | 11,870 | |
| |
Total investment income | | | 748,130 | |
| |
| |
Expenses: | | | | |
| |
Advisory fees | | | 95,502 | |
| |
Administrative services fees | | | 31,648 | |
| |
Custodian fees | | | 8,644 | |
| |
Distribution fees - Series II | | | 403 | |
| |
Transfer agent fees | | | 9,289 | |
| |
Trustees’ and officers’ fees and benefits | | | 18,723 | |
| |
Reports to shareholders | | | 10,473 | |
| |
Professional services fees | | | 51,530 | |
| |
Other | | | 14,895 | |
| |
Total expenses | | | 241,107 | |
| |
Less: Fees waived and/or expenses reimbursed | | | (115,860 | ) |
| |
Net expenses | | | 125,247 | |
| |
Net investment income | | | 622,883 | |
| |
| |
Realized and unrealized gain (loss) from: | | | | |
| |
Net realized gain (loss) from: | | | | |
Investment securities | | | 524,049 | |
| |
Foreign currencies | | | (6,503 | ) |
| |
Forward foreign currency contracts | | | 14,568 | |
| |
Futures contracts | | | 75,982 | |
| |
| | | 608,096 | |
| |
Change in net unrealized appreciation (depreciation) of: | | | | |
Investment securities | | | 925,197 | |
| |
Foreign currencies | | | 2,804 | |
| |
Forward foreign currency contracts | | | (3,785 | ) |
| |
Futures contracts | | | (43,167 | ) |
| |
| | | 881,049 | |
| |
Net realized and unrealized gain | | | 1,489,145 | |
| |
Net increase in net assets resulting from operations | | $ | 2,112,028 | |
| |
See accompanying Notes to Financial Statements which are an integral part of the financial statements.
Invesco V.I. Core Plus Bond Fund
Statement of Changes in Net Assets
For the years ended December 31, 2019 and 2018
| | | | | | | | |
| | | 2019 | | | 2018 | |
| |
Operations: | | | | | | | | |
| | |
Net investment income | | $ | 622,883 | | | $ | 640,454 | |
| |
Net realized gain (loss) | | | 608,096 | | | | (337,527 | ) |
| |
Change in net unrealized appreciation (depreciation) | | | 881,049 | | | | (756,125 | ) |
| |
Net increase (decrease) in net assets resulting from operations | | | 2,112,028 | | | | (453,198 | ) |
| |
| | |
Distributions to shareholders from distributable earnings: | | | | | | | | |
| | |
Series I | | | (684,305 | ) | | | (636,171 | ) |
| |
Series II | | | (3,040 | ) | | | (4,086 | ) |
| |
Total distributions from distributable earnings | | | (687,345 | ) | | | (640,257 | ) |
| |
| | |
Share transactions–net: | | | | | | | | |
| | |
Series I | | | 6,335,765 | | | | (2,220,996 | ) |
| |
Series II | | | 231,286 | | | | 1,722 | |
| |
Net increase (decrease) in net assets resulting from share transactions | | | 6,567,051 | | | | (2,219,274 | ) |
| |
Net increase (decrease) in net assets | | | 7,991,734 | | | | (3,312,729 | ) |
| |
| | |
Net assets: | | | | | | | | |
| | |
Beginning of year | | | 17,136,198 | | | | 20,448,927 | |
| |
End of year | | $ | 25,127,932 | | | $ | 17,136,198 | |
| |
See accompanying Notes to Financial Statements which are an integral part of the financial statements.
Invesco V.I. Core Plus Bond Fund
Financial Highlights
The following schedule presents financial highlights for a share of the Fund outstanding throughout the periods indicated.
| | | | | | | | | | | | | | | | | | | | | | | | | | | | | | | | | | | | | | | | | | | | | | | | | | | | | | | | | | | | |
| | | | | | | | | | | | | | | | | | | Ratio of | | Ratio of | | | | |
| | | | | | | | | | | | | | | | | | | expenses | | expenses | | | | |
| | | | | | | Net gains | | | | | | | | | | | | to average | | to average net | | | | |
| | | | | | | (losses) | | | | | | | | | | | | net assets | | assets without | | Ratio of net | | |
| | | Net asset | | | | on securities | | | | Dividends | | | | | | | | with fee waivers | | fee waivers | | investment | | |
| | | value, | | Net | | (both | | Total from | | from net | | Net asset | | | | Net assets, | | and/or | | and/or | | income | | |
| | | beginning | | investment | | realized and | | investment | | investment | | value, end | | Total | | end of period | | expenses | | expenses | | to average | | Portfolio |
| | | of period | | income(a) | | unrealized) | | operations | | income | | of period | | return (b) | | (000’s omitted) | | absorbed | | absorbed | | net assets | | turnover (c) |
Series I | | | | | | | | | | | | | | | | | | | | | | | | | | | | | | | | | | | | | | | | | | | | | | | | | | | | | | | | | | | | |
Year ended 12/31/19 | | | $ | 6.00 | | | | $ | 0.19 | | | | $ | 0.47 | | | | $ | 0.66 | | | | $ | (0.19 | ) | | | $ | 6.47 | | | | | 11.06 | % | | | $ | 24,769 | | | | | 0.59 | %(d) | | | | 1.13 | %(d) | | | | 2.94 | %(d) | | | | 300 | % |
Year ended 12/31/18 | | | | 6.38 | | | | | 0.22 | | | | | (0.37 | ) | | | | (0.15 | ) | | | | (0.23 | ) | | | | 6.00 | | | | | (2.37 | ) | | | | 17,019 | | | | | 0.59 | | | | | 1.78 | | | | | 3.57 | | | | | 339 | |
Year ended 12/31/17 | | | | 6.21 | | | | | 0.22 | | | | | 0.17 | | | | | 0.39 | | | | | (0.22 | ) | | | | 6.38 | | | | | 6.34 | | | | | 20,326 | | | | | 0.60 | | | | | 1.58 | | | | | 3.46 | | | | | 407 | |
Year ended 12/31/16 | | | | 6.07 | | | | | 0.23 | | | | | 0.18 | | | | | 0.41 | | | | | (0.27 | ) | | | | 6.21 | | | | | 6.66 | | | | | 15,485 | | | | | 0.55 | | | | | 1.68 | | | | | 3.71 | | | | | 474 | |
Year ended 12/31/15 | | | | 6.39 | | | | | 0.24 | | | | | (0.26 | ) | | | | (0.02 | ) | | | | (0.30 | ) | | | | 6.07 | | | | | (0.37 | ) | | | | 15,587 | | | | | 0.65 | | | | | 1.73 | | | | | 3.81 | | | | | 416 | |
Series II | | | | | | | | | | | | | | | | | | | | | | | | | | | | | | | | | | | | | | | | | | | | | | | | | | | | | | | | | | | | |
Year ended 12/31/19 | | | | 5.97 | | | | | 0.17 | | | | | 0.49 | | | | | 0.66 | | | | | (0.18 | ) | | | | 6.45 | | | | | 11.00 | | | | | 359 | | | | | 0.84 | (d) | | | | 1.38 | (d) | | | | 2.69 | (d) | | | | 300 | |
Year ended 12/31/18 | | | | 6.35 | | | | | 0.20 | | | | | (0.37 | ) | | | | (0.17 | ) | | | | (0.21 | ) | | | | 5.97 | | | | | (2.64 | ) | | | | 117 | | | | | 0.84 | | | | | 2.03 | | | | | 3.32 | | | | | 339 | |
Year ended 12/31/17 | | | | 6.19 | | | | | 0.20 | | | | | 0.16 | | | | | 0.36 | | | | | (0.20 | ) | | | | 6.35 | | | | | 5.89 | | | | | 123 | | | | | 0.85 | | | | | 1.83 | | | | | 3.21 | | | | | 407 | |
Year ended 12/31/16 | | | | 6.04 | | | | | 0.22 | | | | | 0.18 | | | | | 0.40 | | | | | (0.25 | ) | | | | 6.19 | | | | | 6.52 | | | | | 126 | | | | | 0.80 | | | | | 1.93 | | | | | 3.46 | | | | | 474 | |
Year ended 12/31/15 | | | | 6.36 | | | | | 0.22 | | | | | (0.26 | ) | | | | (0.04 | ) | | | | (0.28 | ) | | | | 6.04 | | | | | (0.64 | ) | | | | 156 | | | | | 0.90 | | | | | 1.98 | | | | | 3.56 | | | | | 416 | |
| (a) | Calculated using average shares outstanding. |
| (b) | Includes adjustments in accordance with accounting principles generally accepted in the United States of America and as such, the net asset value for financial reporting purposes and the returns based upon those net asset values may differ from the net asset value and returns for shareholder transactions. Total returns are not annualized for periods less than one year, if applicable, and do not reflect charges assessed in connection with a variable product, which if included would reduce total returns. |
| (c) | Portfolio turnover is calculated at the fund level and is not annualized for periods less than one year, if applicable. |
| (d) | Ratios are based on average daily net assets (000’s omitted) of $21,061 and $161 for Series I and Series II shares, respectively. |
See accompanying Notes to Financial Statements which are an integral part of the financial statements.
Invesco V.I. Core Plus Bond Fund
Notes to Financial Statements
December 31, 2019
NOTE 1–Significant Accounting Policies
Invesco V.I. Core Plus Bond Fund (the “Fund”) is a series portfolio of AIM Variable Insurance Funds (Invesco Variable Insurance Funds) (the “Trust”). The Trust is a Delaware statutory trust registered under the Investment Company Act of 1940, as amended (the “1940 Act”), as anopen-end series management investment company. Information presented in these financial statements pertains only to the Fund. Matters affecting the Fund or each class will be voted on exclusively by the shareholders of the Fund or each class. Current Securities and Exchange Commission (“SEC”) guidance, however, requires participating insurance companies offering separate accounts to vote shares proportionally in accordance with the instructions of the contract owners whose investments are funded by shares of each Fund or class.
The Fund’s investment objective is total return, comprised of current income and capital appreciation.
The Fund currently offers two classes of shares, Series I and Series II, both of which are offered to insurance company separate accounts funding variable annuity contracts and variable life insurance policies (“variable products”).
The Fund is an investment company and accordingly follows the investment company accounting and reporting guidance in accordance with Financial Accounting Standards Board Accounting Standards Codification Topic 946,Financial Services - Investment Companies.
The following is a summary of the significant accounting policies followed by the Fund in the preparation of its financial statements.
| A. | Security Valuations– Securities, including restricted securities, are valued according to the following policy. |
Debt obligations (including convertible securities) and unlisted equities are fair valued using an evaluated quote provided by an independent pricing service. Evaluated quotes provided by the pricing service may be determined without exclusive reliance on quoted prices, and may reflect appropriate factors such asinstitution-size trading in similar groups of securities, developments related to specific securities, dividend rate (for unlisted equities), yield (for debt obligations), quality, type of issue, coupon rate (for debt obligations), maturity (for debt obligations), individual trading characteristics and other market data. Pricing services generally value debt obligations assuming orderly transactions of institutional round lot size, but a fund may hold or transact in the same securities in smaller, odd lot sizes. Odd lots often trade at lower prices than institutional round lots. Debt obligations are subject to interest rate and credit risks. In addition, all debt obligations involve some risk of default with respect to interest and/or principal payments.
A security listed or traded on an exchange (except convertible securities) is valued at its last sales price or official closing price as of the close of the customary trading session on the exchange where the security is principally traded, or lacking any sales or official closing price on a particular day, the security may be valued at the closing bid price on that day. Securities traded in theover-the-counter market are valued based on prices furnished by independent pricing services or market makers. When such securities are valued by an independent pricing service they may be considered fair valued. Futures contracts are valued at the final settlement price set by an exchange on which they are principally traded. Listed options are valued at the mean between the last bid and asked prices from the exchange on which they are principally traded. Options not listed on an exchange are valued by an independent source at the mean between the last bid and asked prices. For purposes of determining net asset value (“NAV”) per share, futures and option contracts generally are valued 15 minutes after the close of the customary trading session of the New York Stock Exchange (“NYSE”).
Investments inopen-end andclosed-end registered investment companies that do not trade on an exchange are valued at theend-of-day net asset value per share. Investments inopen-end andclosed-end registered investment companies that trade on an exchange are valued at the last sales price or official closing price as of the close of the customary trading session on the exchange where the security is principally traded.
Swap agreements are fair valued using an evaluated quote, if available, provided by an independent pricing service. Evaluated quotes provided by the pricing service are valued based on a model which may includeend-of-day net present values, spreads, ratings, industry, company performance and returns of referenced assets. Centrally cleared swap agreements are valued at the daily settlement price determined by the relevant exchange or clearinghouse.
Foreign securities’ (including foreign exchange contracts) prices are converted into U.S. dollar amounts using the applicable exchange rates as of the close of the NYSE. If market quotations are available and reliable for foreign exchange-traded equity securities, the securities will be valued at the market quotations. Because trading hours for certain foreign securities end before the close of the NYSE, closing market quotations may become unreliable. If between the time trading ends on a particular security and the close of the customary trading session on the NYSE, events occur that the investment adviser determines are significant and make the closing price unreliable, the Fund may fair value the security. If the event is likely to have affected the closing price of the security, the security will be valued at fair value in good faith using procedures approved by the Board of Trustees. Adjustments to closing prices to reflect fair value may also be based on a screening process of an independent pricing service to indicate the degree of certainty, based on historical data, that the closing price in the principal market where a foreign security trades is not the current value as of the close of the NYSE. Foreign securities’ prices meeting the approved degree of certainty that the price is not reflective of current value will be priced at the indication of fair value from the independent pricing service. Multiple factors may be considered by the independent pricing service in determining adjustments to reflect fair value and may include information relating to sector indices, American Depositary Receipts and domestic and foreign index futures. Foreign securities may have additional risks including exchange rate changes, potential for sharply devalued currencies and high inflation, political and economic upheaval, the relative lack of issuer information, relatively low market liquidity and the potential lack of strict financial and accounting controls and standards.
Securities for which market prices are not provided by any of the above methods may be valued based upon quotes furnished by independent sources. The last bid price may be used to value equity securities. The mean between the last bid and asked prices is used to value debt obligations, including corporate loans.
Securities for which market quotations are not readily available or became unreliable are valued at fair value as determined in good faith by or under the supervision of the Trust’s officers following procedures approved by the Board of Trustees. Issuer specific events, market trends, bid/asked quotes of brokers and information providers and other market data may be reviewed in the course of making a good faith determination of a security’s fair value.
The Fund may invest in securities that are subject to interest rate risk, meaning the risk that the prices will generally fall as interest rates rise and, conversely, the prices will generally rise as interest rates fall. Specific securities differ in their sensitivity to changes in interest rates
Invesco V.I. Core Plus Bond Fund
depending on their individual characteristics. Changes in interest rates may result in increased market volatility, which may affect the value and/or liquidity of certain Fund investments.
Valuations change in response to many factors including the historical and prospective earnings of the issuer, the value of the issuer’s assets, general economic conditions, interest rates, investor perceptions and market liquidity. Because of the inherent uncertainties of valuation, the values reflected in the financial statements may materially differ from the value received upon actual sale of those investments.
| B. | Securities Transactions and Investment Income– Securities transactions are accounted for on a trade date basis. Realized gains or losses on sales are computed on the basis of specific identification of the securities sold. Interest income (net of withholding tax, if any) is recorded on the accrual basis from settlement date. Bond premiums and discounts are amortized and/or accreted over the lives of the respective securities.Pay-in-kind interest income andnon-cash dividend income received in the form of securitiesin-lieu of cash are recorded at the fair value of the securities received. Dividend income (net of withholding tax, if any) is recorded on theex-dividend date. |
The Fund may periodically participate in litigation related to Fund investments. As such, the Fund may receive proceeds from litigation settlements. Any proceeds received are included in the Statement of Operations as realized gain (loss) for investments no longer held and as unrealized gain (loss) for investments still held.
Brokerage commissions and mark ups are considered transaction costs and are recorded as an increase to the cost basis of securities purchased and/or a reduction of proceeds on a sale of securities. Such transaction costs are included in the determination of net realized and unrealized gain (loss) from investment securities reported in the Statement of Operations and the Statement of Changes in Net Assets and the net realized and unrealized gains (losses) on securities per share in the Financial Highlights. Transaction costs are included in the calculation of the Fund’s net asset value and, accordingly, they reduce the Fund’s total returns. These transaction costs are not considered operating expenses and are not reflected in net investment income reported in the Statement of Operations and the Statement of Changes in Net Assets, or the net investment income per share and the ratios of expenses and net investment income reported in the Financial Highlights, nor are they limited by any expense limitation arrangements between the Fund and the investment adviser.
The Fund allocates income and realized and unrealized capital gains and losses to a class based on the relative net assets of each class.
| C. | Country Determination– For the purposes of making investment selection decisions and presentation in the Schedule of Investments, the investment adviser may determine the country in which an issuer is located and/or credit risk exposure based on various factors. These factors include the laws of the country under which the issuer is organized, where the issuer maintains a principal office, the country in which the issuer derives 50% or more of its total revenues and the country that has the primary market for the issuer’s securities, as well as other criteria. Among the other criteria that may be evaluated for making this determination are the country in which the issuer maintains 50% or more of its assets, the type of security, financial guarantees and enhancements, the nature of the collateral and the sponsor organization. Country of issuer and/or credit risk exposure has been determined to be the United States of America, unless otherwise noted. |
| D. | Distributions– Distributions from net investment income and net realized capital gain, if any, are generally declared and paid to separate accounts of participating insurance companies annually and recorded on theex-dividend date. |
| E. | Federal Income Taxes–The Fund intends to comply with the requirements of Subchapter M of the Internal Revenue Code of 1986, as amended (the “Internal Revenue Code”), necessary to qualify as a regulated investment company and to distribute substantially all of the Fund’s taxable earnings to shareholders. As such, the Fund will not be subject to federal income taxes on otherwise taxable income (including net realized capital gain) that is distributed to shareholders. Therefore, no provision for federal income taxes is recorded in the financial statements. |
The Fund recognizes the tax benefits of uncertain tax positions only when the position is more likely than not to be sustained. Management has analyzed the Fund’s uncertain tax positions and concluded that no liability for unrecognized tax benefits should be recorded related to uncertain tax positions. Management is not aware of any tax positions for which it is reasonably possible that the total amounts of unrecognized tax benefits will change materially in the next 12 months.
The Fund files tax returns in the U.S. Federal jurisdiction and certain other jurisdictions. Generally, the Fund is subject to examinations by such taxing authorities for up to three years after the filing of the return for the tax period.
| F. | Expenses– Fees provided for under the Rule12b-1 plan of a particular class of the Fund and which are directly attributable to that class are charged to the operations of such class. All other expenses are allocated among the classes based on relative net assets. |
| G. | Accounting Estimates–The preparation of financial statements in conformity with accounting principles generally accepted in the United States of America (“GAAP”) requires management to make estimates and assumptions that affect the reported amounts of assets and liabilities at the date of the financial statements and the reported amounts of revenues and expenses during the reporting period including estimates and assumptions related to taxation. Actual results could differ from those estimates by a significant amount. In addition, the Fund monitors for material events or transactions that may occur or become known after theperiod-end date and before the date the financial statements are released to print. |
| H. | Indemnifications– Under the Trust’s organizational documents, each Trustee, officer, employee or other agent of the Trust is indemnified against certain liabilities that may arise out of the performance of their duties to the Fund. Additionally, in the normal course of business, the Fund enters into contracts, including the Fund’s servicing agreements, that contain a variety of indemnification clauses. The Fund’s maximum exposure under these arrangements is unknown as this would involve future claims that may be made against the Fund that have not yet occurred. The risk of material loss as a result of such indemnification claims is considered remote. |
| I. | Lower-Rated Securities– The Fund may invest in lower-quality debt securities, i.e., “junk bonds”. Investments in lower-rated securities or unrated securities of comparable quality tend to be more sensitive to economic conditions than higher rated securities. Junk bonds involve a greater risk of default by the issuer because such securities are generally unsecured and are often subordinated to other creditors’ claims. |
| J. | Foreign Currency Translations– Foreign currency is valued at the close of the NYSE based on quotations posted by banks and major currency dealers. Portfolio securities and other assets and liabilities denominated in foreign currencies are translated into U.S. dollar amounts at the date of valuation. Purchases and sales of portfolio securities (net of foreign taxes withheld on disposition) and income items denominated in foreign currencies are translated into U.S. dollar amounts on the respective dates of such transactions. The Fund does not separately account for the portion of the results of operations resulting from changes in foreign exchange rates on investments and the fluctuations arising from changes in market prices of securities held. The combined results of changes in foreign exchange rates and the fluctuation of market prices on investments (net of estimated foreign tax withholding) are included with the net realized and unrealized gain or loss from investments in the Statement of Operations. Reported net realized foreign currency gains or losses arise from (1) sales of foreign currencies, (2) currency gains or |
Invesco V.I. Core Plus Bond Fund
| | losses realized between the trade and settlement dates on securities transactions, and (3) the difference between the amounts of dividends, interest, and foreign withholding taxes recorded on the Fund’s books and the U.S. dollar equivalent of the amounts actually received or paid. Net unrealized foreign currency gains and losses arise from changes in the fair values of assets and liabilities, other than investments in securities at fiscal period end, resulting from changes in exchange rates. |
The Fund may invest in foreign securities, which may be subject to foreign taxes on income, gains on investments or currency repatriation, a portion of which may be recoverable. Foreign taxes, if any, are recorded based on the tax regulations and rates that exist in the foreign markets in which the Fund invests and are shown in the Statement of Operations.
| K. | Forward Foreign Currency Contracts– The Fund may engage in foreign currency transactions either on a spot (i.e. for prompt delivery and settlement) basis, or through forward foreign currency contracts, to manage or minimize currency or exchange rate risk. |
The Fund may also enter into forward foreign currency contracts for the purchase or sale of a security denominated in a foreign currency in order to “lock in” the U.S. dollar price of that security, or the Fund may also enter into forward foreign currency contracts that do not provide for physical settlement of the two currencies, but instead are settled by a single cash payment calculated as the difference between the agreed upon exchange rate and the spot rate at settlement based upon an agreed upon notional amount(non-deliverable forwards). The Fund will set aside liquid assets in an amount equal to the dailymark-to-market obligation for forward foreign currency contracts.
A forward foreign currency contract is an obligation between two parties (“Counterparties”) to purchase or sell a specific currency for an agreed-upon price at a future date. The use of forward foreign currency contracts does not eliminate fluctuations in the price of the underlying securities the Fund owns or intends to acquire but establishes a rate of exchange in advance. Fluctuations in the value of these contracts are measured by the difference in the contract date and reporting date exchange rates and are recorded as unrealized appreciation (depreciation) until the contracts are closed. When the contracts are closed, realized gains (losses) are recorded. Realized and unrealized gains (losses) on the contracts are included in the Statement of Operations. The primary risks associated with forward foreign currency contracts include failure of the Counterparty to meet the terms of the contract and the value of the foreign currency changing unfavorably. These risks may be in excess of the amounts reflected in the Statement of Assets and Liabilities.
| L. | Futures Contracts– The Fund may enter into futures contracts to manage exposure to interest rate, equity and market price movements and/or currency risks. A futures contract is an agreement between Counterparties to purchase or sell a specified underlying security, currency or commodity (or delivery of a cash settlement price, in the case of an index future) for a fixed price at a future date. The Fund currently invests only in exchange-traded futures and they are standardized as to maturity date and underlying financial instrument. Initial margin deposits required upon entering into futures contracts are satisfied by the segregation of specific securities or cash as collateral at the futures commission merchant (broker). During the period the futures contracts are open, changes in the value of the contracts are recognized as unrealized gains or losses by recalculating the value of the contracts on a daily basis. Subsequent or variation margin payments are received or made depending upon whether unrealized gains or losses are incurred. These amounts are reflected as receivables or payables on the Statement of Assets and Liabilities. When the contracts are closed or expire, the Fund recognizes a realized gain or loss equal to the difference between the proceeds from, or cost of, the closing transaction and the Fund’s basis in the contract. The net realized gain (loss) and the change in unrealized gain (loss) on futures contracts held during the period is included on the Statement of Operations. The primary risks associated with futures contracts are market risk and the absence of a liquid secondary market. If the Fund were unable to liquidate a futures contract and/or enter into an offsetting closing transaction, the Fund would continue to be subject to market risk with respect to the value of the contracts and continue to be required to maintain the margin deposits on the futures contracts. Futures contracts have minimal Counterparty risk since the exchange’s clearinghouse, as Counterparty to all exchange-traded futures, guarantees the futures against default. Risks may exceed amounts recognized in the Statement of Assets and Liabilities. |
| M. | Dollar Rolls and Forward Commitment Transactions– The Fund may enter into dollar roll transactions to enhance the Fund’s performance. The Fund executes its dollar roll transactions in the to be announced (“TBA”) market whereby the Fund makes a forward commitment to purchase a security and, instead of accepting delivery, the position is offset by the sale of the security with a simultaneous agreement to repurchase at a future date. |
The Fund accounts for dollar roll transactions as purchases and sales and realizes gains and losses on these transactions. These transactions increase the Fund’s portfolio turnover rate. The Fund will segregate liquid assets in an amount equal to its dollar roll commitments.
Dollar roll transactions involve the risk that a Counterparty to the transaction may fail to complete the transaction. If this occurs, the Fund may lose the opportunity to purchase or sell the security at the agreed upon price. Dollar roll transactions also involve the risk that the value of the securities retained by the Fund may decline below the price of the securities that the Fund has sold but is obligated to purchase under the agreement. Dollar roll transactions covered in this manner are not treated as senior securities for purposes of a Fund’s fundamental investment limitation on senior securities and borrowings.
| N. | Other Risks– Active trading of portfolio securities may result in added expenses, a lower return and increased tax liability. |
| O. | Leverage Risk– Leverage exists when the Fund can lose more than it originally invests because it purchases or sells an instrument or enters into a transaction without investing an amount equal to the full economic exposure of the instrument or transaction. |
| P. | Collateral– To the extent the Fund has designated or segregated a security as collateral and that security is subsequently sold, it is the Fund’s practice to replace such collateral no later than the next business day. |
Invesco V.I. Core Plus Bond Fund
NOTE 2–Advisory Fees and Other Fees Paid to Affiliates
The Trust has entered into a master investment advisory agreement with Invesco Advisers, Inc. (the “Adviser” or “Invesco”). Under the terms of the investment advisory agreement, the Fund accrues daily and pays monthly an advisory fee to the Adviser based on the annual rate of the Fund’s average daily net assets as follows:
| | | | |
| Average Daily Net Assets | | Rate | |
| |
First $ 500 million | | | 0.450% | |
| |
Next $500 million | | | 0.425% | |
| |
Next $1.5 billion | | | 0.400% | |
| |
Next $2.5 billion | | | 0.375% | |
| |
Over $5 billion | | | 0.350% | |
| |
For the year ended December 31, 2019, the effective advisory fee rate incurred by the Fund was 0.45%.
Under the terms of a mastersub-advisory agreement between the Adviser and each of Invesco Asset Management Deutschland GmbH, Invesco Asset Management Limited, Invesco Asset Management (Japan) Limited, Invesco Hong Kong Limited, Invesco Senior Secured Management, Inc. and Invesco Canada Ltd. and separatesub-advisory agreements with Invesco Capital Management LLC and Invesco Asset Management (India) Private Limited (collectively, the “AffiliatedSub-Advisers”) the Adviser, not the Fund, will pay 40% of the fees paid to the Adviser to any such AffiliatedSub-Adviser(s) that provide(s) discretionary investment management services to the Fund based on the percentage of assets allocated to such AffiliatedSub-Adviser(s).
The Adviser has contractually agreed, through at least April 30, 2021, to waive advisory fees and/or reimburse expenses of all shares to the extent necessary to limit total annual fund operating expenses after fee waiver and/or expense reimbursement (excluding certain items discussed below) of Series I shares to 0.61% and Series II shares to 0.86% of average daily net assets (the “expense limits”). In determining the Adviser’s obligation to waive advisory fees and/or reimburse expenses, the following expenses are not taken into account, and could cause the total annual fund operating expenses after fee waiver and/or expense reimbursement to exceed the numbers reflected above: (1) interest; (2) taxes; (3) dividend expense on short sales; (4) extraordinary ornon-routine items, including litigation expenses; and (5) expenses that the Fund has incurred but did not actually pay because of an expense offset arrangement. Unless Invesco continues the fee waiver agreement, it will terminate on April 30, 2021. During its term, the fee waiver agreement cannot be terminated or amended to increase the expense limits or reduce the advisory fee waiver without approval of the Board of Trustees.
Further, the Adviser has contractually agreed, through at least June 30, 2021, to waive the advisory fee payable by the Fund in an amount equal to 100% of the net advisory fees the Adviser receives from the affiliated money market funds on investments by the Fund of uninvested cash in such affiliated money market funds.
For the year ended December 31, 2019, the Adviser waived advisory fees of $100,077 and reimbursed Fund expenses of $15,783.
The Trust has entered into a master administrative services agreement with Invesco pursuant to which the Fund has agreed to pay Invesco a fee for costs incurred in providing accounting services and fund administrative services to the Fund and to reimburse Invesco for fees paid to insurance companies that have agreed to provide certain administrative services to the Fund. These administrative services provided by the insurance companies may include, among other things: maintenance of master accounts with the Fund; tracking, recording and transmitting net purchase and redemption orders for Fund shares; maintaining and preserving records related to the purchase, redemption and other account activity of variable product owners; distributing copies of Fund documents such as prospectuses, proxy materials and periodic reports, to variable product owners, and responding to inquiries from variable product owners about the Fund. Pursuant to such agreement, for the year ended December 31, 2019, Invesco was paid $2,811 for accounting and fund administrative services and was reimbursed $28,837 for fees paid to insurance companies. Invesco has entered into asub-administration agreement whereby State Street Bank and Trust Company (“SSB”) serves as fund accountant and provides certain administrative services to the Fund. Pursuant to a custody agreement with the Trust on behalf of the Fund, SSB also serves as the Fund’s custodian.
The Trust has entered into a transfer agency and service agreement with Invesco Investment Services, Inc. (“IIS”) pursuant to which the Fund has agreed to pay IIS a fee for providing transfer agency and shareholder services to the Fund and reimburse IIS for certain expenses incurred by IIS in the course of providing such services. IIS may make payments to intermediaries that provide omnibus account services,sub-accounting services and/or networking services. All fees payable by IIS to intermediaries that provide omnibus account services orsub-accounting services are charged back to the Fund, subject to certain limitations approved by the Trust’s Board of Trustees. For the year ended December 31, 2019, expenses incurred under the agreement are shown in the Statement of Operations asTransfer agent fees.
The Trust has entered into a master distribution agreement with Invesco Distributors, Inc. (“IDI”) to serve as the distributor for the Fund. The Trust has adopted a plan pursuant to Rule12b-1 under the 1940 Act with respect to the Fund’s Series II shares (the “Plan”). The Fund, pursuant to the Plan, pays IDI compensation at the annual rate of 0.25% of the Fund’s average daily net assets of Series II shares. The fees are accrued daily and paid monthly. Of the Plan payments, up to 0.25% of the average daily net assets of the Series II shares may be paid to insurance companies who furnish continuing personal shareholder services to customers who purchase and own Series II shares of the Fund. For the year ended December 31, 2019, expenses incurred under the Plan are detailed in the Statement of Operations asDistribution fees.
Certain officers and trustees of the Trust are officers and directors of the Adviser, IIS and/or IDI.
NOTE 3–Additional Valuation Information
GAAP defines fair value as the price that would be received to sell an asset or paid to transfer a liability in an orderly transaction between market participants at the measurement date, under current market conditions. GAAP establishes a hierarchy that prioritizes the inputs to valuation methods, giving the highest priority to readily available unadjusted quoted prices in an active market for identical assets (Level 1) and the lowest priority to significant unobservable inputs (Level 3), generally when market prices are not readily available or are unreliable. Based on the valuation inputs, the securities or other investments are tiered into one of three levels. Changes in valuation methods may result in transfers in or out of an investment’s assigned level:
| | |
Level 1 - | | Prices are determined using quoted prices in an active market for identical assets. |
Invesco V.I. Core Plus Bond Fund
| | |
Level 2 - | | Prices are determined using other significant observable inputs. Observable inputs are inputs that other market participants may use in pricing a security. These may include quoted prices for similar securities, interest rates, prepayment speeds, credit risk, yield curves, loss severities, default rates, discount rates, volatilities and others. |
Level 3 - | | Prices are determined using significant unobservable inputs. In situations where quoted prices or observable inputs are unavailable (for example, when there is little or no market activity for an investment at the end of the period), unobservable inputs may be used. Unobservable inputs reflect the Fund’s own assumptions about the factors market participants would use in determining fair value of the securities or instruments and would be based on the best available information. |
The following is a summary of the tiered valuation input levels, as of December 31, 2019. The level assigned to the securities valuations may not be an indication of the risk or liquidity associated with investing in those securities. Because of the inherent uncertainties of valuation, the values reflected in the financial statements may materially differ from the value received upon actual sale of those investments.
| | | | | | | | | | | | | | | | |
| | | Level 1 | | | Level 2 | | | Level 3 | | | Total | |
| |
Investments in Securities | | | | | | | | | | | | | | | | |
| |
U.S. Dollar Denominated Bonds & Notes | | $ | – | | | $ | 10,140,865 | | | | $– | | | $ | 10,140,865 | |
| |
Asset-Backed Securities | | | – | | | | 4,414,395 | | | | – | | | | 4,414,395 | |
| |
U.S. Government Sponsored Agency Mortgage-Backed Securities | | | – | | | | 4,259,491 | | | | – | | | | 4,259,491 | |
| |
U.S. Treasury Securities | | | – | | | | 4,110,356 | | | | – | | | | 4,110,356 | |
| |
Preferred Stocks | | | 157,450 | | | | – | | | | – | | | | 157,450 | |
| |
Non-U.S. Dollar Denominated Bonds & Notes | | | – | | | | 119,040 | | | | – | | | | 119,040 | |
| |
Municipal Obligations | | | – | | | | 70,480 | | | | – | | | | 70,480 | |
| |
Agency Credit Risk Transfer Notes | | | – | | | | 49,410 | | | | – | | | | 49,410 | |
| |
Common Stocks & Other Equity Interests | | | 1 | | | | – | | | | 0 | | | | 1 | |
| |
Money Market Funds | | | 3,237,341 | | | | – | | | | – | | | | 3,237,341 | |
| |
Total Investments in Securities | | | 3,394,792 | | | | 23,164,037 | | | | 0 | | | | 26,558,829 | |
| |
| | | | |
Other Investments - Assets* | | | | | | | | | | | | | | | | |
| |
Futures Contracts | | | 14,283 | | | | – | | | | – | | | | 14,283 | |
| |
Other Investments - Liabilities* | | | | | | | | | | | | | | | | |
| |
Futures Contracts | | | (34,148 | ) | | | – | | | | – | | | | (34,148 | ) |
| |
Forward Foreign Currency Contracts | | | – | | | | (4,628 | ) | | | – | | | | (4,628 | ) |
| |
| | | (34,148 | ) | | | (4,628 | ) | | | – | | | | (38,776 | ) |
| |
Total Other Investments | | | (19,865 | ) | | | (4,628 | ) | | | – | | | | (24,493 | ) |
| |
Total Investments | | $ | 3,374,927 | | | $ | 23,159,409 | | | | $0 | | | $ | 26,534,336 | |
| |
| * | Unrealized appreciation (depreciation). |
NOTE 4–Derivative Investments
The Fund may enter into an International Swaps and Derivatives Association Master Agreement (“ISDA Master Agreement”) under which a fund may trade OTC derivatives. An OTC transaction entered into under an ISDA Master Agreement typically involves a collateral posting arrangement, payment netting provisions andclose-out netting provisions. These netting provisions allow for reduction of credit risk through netting of contractual obligations. The enforceability of the netting provisions of the ISDA Master Agreement depends on the governing law of the ISDA Master Agreement, among other factors.
For financial reporting purposes, the Fund does not offset OTC derivative assets or liabilities that are subject to ISDA Master Agreements in the Statement of Assets and Liabilities.
Value of Derivative Investments atPeriod-End
The table below summarizes the value of the Fund’s derivative investments, detailed by primary risk exposure, held as of December 31, 2019:
| | | | | | | | | | | | |
| | | Value | |
| Derivative Assets | | Currency
Risk | | | Interest
Rate Risk | | | Total | |
| |
Unrealized appreciation on futures contracts – Exchange-Traded(a) | | $ | - | | | $ | 14,283 | | | $ | 14,283 | |
| |
Derivatives not subject to master netting agreements | | | - | | | | (14,283 | ) | | | (14,283 | ) |
| |
Total Derivative Assets subject to master netting agreements | | $ | - | | | $ | - | | | $ | - | |
| |
Invesco V.I. Core Plus Bond Fund
| | | | | | | | | | | | |
| | | Value | |
| Derivative Liabilities | | Currency
Risk | | | Interest
Rate Risk | | | Total | |
| |
Unrealized depreciation on futures contracts – Exchange-Traded(a) | | $ | - | | | $ | (34,148 | ) | | $ | (34,148 | ) |
| |
Unrealized depreciation on forward foreign currency contracts outstanding | | | (4,628 | ) | | | - | | | | (4,628 | ) |
| |
Total Derivative Liabilities | | | (4,628 | ) | | | (34,148 | ) | | | (38,776 | ) |
| |
Derivatives not subject to master netting agreements | | | - | | | | 34,148 | | | | 34,148 | |
| |
Total Derivative Liabilities subject to master netting agreements | | $ | (4,628 | ) | | $ | - | | | $ | (4,628 | ) |
| |
| (a) | The daily variation margin receivable (payable) atperiod-end is recorded in the Statement of Assets and Liabilities. |
Offsetting Assets and Liabilities
The table below reflects the Fund’s exposure to Counterparties subject to either an ISDA Master Agreement or other agreement for OTC derivative transactions as of December 31, 2019.
| | | | | | | | | | | | | | |
| | | Financial | | Financial | | | | | | | | | |
| | | Derivative
Assets | | Derivative
Liabilities | | | | Collateral
(Received)/Pledged | | | |
| | | Forward Foreign | | Forward Foreign | | Net Value of | | | | | | Net | |
| Counterparty | | Currency Contracts | | Currency Contracts | | Derivatives | | Non-Cash | | Cash | | Amount | |
| |
Citibank N.A. | | $– | | $(4,628) | | $(4,628) | | $– | | $– | | $ | (4,628 | ) |
| |
Effect of Derivative Investments for the year ended December 31, 2019
The table below summarizes the gains (losses) on derivative investments, detailed by primary risk exposure, recognized in earnings during the period:
| | | | | | | | | | | | |
| | | Location of Gain (Loss) on
Statement of Operations | |
| | | Currency
Risk | | | Interest
Rate Risk | | | Total | |
| |
Realized Gain: | | | | | | | | | | | | |
Forward foreign currency contracts | | | $14,568 | | | $ | - | | | $ | 14,568 | |
| |
Futures contracts | | | - | | | | 75,982 | | | | 75,982 | |
| |
Change in Net Unrealized Appreciation (Depreciation): | | | | | | | | | | | | |
Forward foreign currency contracts | | | (3,785 | ) | | | - | | | | (3,785 | ) |
| |
Futures contracts | | | - | | | | (43,167 | ) | | | (43,167 | ) |
| |
Total | | | $10,783 | | | $ | 32,815 | | | $ | 43,598 | |
| |
The table below summarizes the average notional value of derivatives held during the period.
| | | | |
| | | Forward | | |
| | | Foreign Currency | | Futures |
| | | Contracts | | Contracts |
|
Average notional value | | $246,812 | | $4,729,434 |
|
NOTE 5–Trustees’ and Officers’ Fees and Benefits
Trustees’ and Officers’ Fees and Benefits include amounts accrued by the Fund to pay remuneration to certain Trustees and Officers of the Fund. Trustees have the option to defer compensation payable by the Fund, andTrustees’ and Officers’Fees and Benefits also include amounts accrued by the Fund to fund such deferred compensation amounts. Those Trustees who defer compensation have the option to select various Invesco Funds in which their deferral accounts shall be deemed to be invested. Finally, certain current Trustees were eligible to participate in a retirement plan that provided for benefits to be paid upon retirement to Trustees over a period of time based on the number of years of service. The Fund may have certain former Trustees who also participate in a retirement plan and receive benefits under such plan.Trustees’ and Officers’ Fees and Benefits include amounts accrued by the Fund to fund such retirement benefits. Obligations under the deferred compensation and retirement plans represent unsecured claims against the general assets of the Fund.
NOTE 6–Cash Balances
The Fund may borrow for leveraging in an amount up to 5% of the Fund’s total assets (excluding the amount borrowed) at the time the borrowing is made. In doing so, the Fund is permitted to temporarily carry a negative or overdrawn balance in its account with SSB, the custodian bank. Such balances, if any at period end, are shown in the Statement of Assets and Liabilities under the payable captionAmount due custodian. To compensate the custodian bank for such overdrafts, the overdrawn Fund may either (1) leave funds as a compensating balance in the account so the custodian bank can be compensated by earning the additional interest; or (2) compensate by paying the custodian bank at a rate agreed upon by the custodian bank and Invesco, not to exceed the contractually agreed upon rate. The Fund may not purchase additional securities when any borrowings from banks exceed 5% of the Fund’s total assets.
Invesco V.I. Core Plus Bond Fund
NOTE 7–Distributions to Shareholders and Tax Components of Net Assets
Tax Character of Distributions to Shareholders Paid During the Fiscal Years Ended December 31, 2019 and 2018:
| | | | | | | | |
| | | 2019 | | | 2018 | |
Ordinary income | | $ | 687,345 | | | $ | 640,257 | |
Tax Components of Net Assets atPeriod-End:
| | | | |
| | | 2019 | |
| |
Undistributed ordinary income | | $ | 792,993 | |
| |
Net unrealized appreciation – investments | | | 543,463 | |
| |
Net unrealized appreciation - foreign currencies | | | 3,199 | |
| |
Temporary book/tax differences | | | (47,087 | ) |
| |
Shares of beneficial interest | | | 23,835,364 | |
| |
Total net assets | | $ | 25,127,932 | |
| |
The difference between book-basis andtax-basis unrealized appreciation (depreciation) is due to differences in the timing of recognition of gains and losses on investments for tax and book purposes. The Fund’s net unrealized appreciation (depreciation) difference is attributable primarily to futures contracts and foreign currency contracts.
The temporary book/tax differences are a result of timing differences between book and tax recognition of income and/or expenses. The Fund’s temporary book/tax differences are the result of the trustee deferral of compensation and retirement plan benefits.
Capital loss carryforward is calculated and reported as of a specific date. Results of transactions and other activity after that date may affect the amount of capital loss carryforward actually available for the Fund to utilize. Capital losses generated in years beginning after December 22, 2010 can be carried forward for an unlimited period, whereas previous losses expire in eight tax years. Capital losses with an expiration period may not be used to offset capital gains until all net capital losses without an expiration date have been utilized. Capital loss carryforwards with no expiration date will retain their character as either short-term or long-term capital losses instead of as short-term capital losses as under prior law. The ability to utilize capital loss carryforwards in the future may be limited under the Internal Revenue Code and related regulations based on the results of future transactions.
The Fund does not have a capital loss carryforward as of December 31, 2019.
NOTE 8–Investment Transactions
The aggregate amount of investment securities (other than short-term securities, U.S. Treasury obligations and money market funds, if any) purchased and sold by the Fund during the year ended December 31, 2019 was $58,703,114 and $59,041,990, respectively. During the same period, purchases and sales of U.S. Treasury obligations were $37,777,145 and $32,950,884, respectively. Cost of investments, including any derivatives, on a tax basis includes the adjustments for financial reporting purposes as of the most recently completed federal income tax reportingperiod-end.
| | | | |
| Unrealized Appreciation (Depreciation) of Investments on a Tax Basis | |
| |
Aggregate unrealized appreciation of investments | | $ | 653,011 | |
| |
Aggregate unrealized (depreciation) of investments | | | (109,548 | ) |
| |
Net unrealized appreciation of investments | | $ | 543,463 | |
| |
Cost of investments for tax purposes is $25,990,873.
NOTE 9–Reclassification of Permanent Differences
Primarily as a result of differing book/tax treatment of dollar rolls and forward foreign currency contracts, on December 31, 2019, undistributed net investment income was increased by $31,593 and undistributed net realized gain was decreased by $31,593. This reclassification had no effect on the net assets or the distributable earnings of the Fund.
NOTE 10–Share Information
| | | | | | | | | | | | | | | | |
| | | Summary of Share Activity | |
| |
| | | Year ended | | | Year ended | |
| | | December 31, 2019(a) | | | December 31, 2018 | |
| | | | | | | | |
| | | Shares | | | Amount | | | Shares | | | Amount | |
| |
Sold: | | | | | | | | | | | | | | | | |
Series I | | | 1,567,948 | | | $ | 10,023,351 | | | | 395,009 | | | $ | 2,447,919 | |
| |
Series II | | | 38,201 | | | | 244,863 | | | | 3 | | | | 19 | |
| |
| | | | |
Issued as reinvestment of dividends: | | | | | | | | | | | | | | | | |
| | | | |
Series I | | | 106,424 | | | | 684,305 | | | | 105,501 | | | | 636,171 | |
| |
Series II | | | 432 | | | | 2,771 | | | | 625 | | | | 3,758 | |
| |
Invesco V.I. Core Plus Bond Fund
| | | | | | | | | | | | | | | | |
| | | Summary of Share Activity | |
| |
| | | Year ended | | | Year ended | |
| | | December 31, 2019(a) | | | December 31, 2018 | |
| | | | | | | | |
| | | Shares | | | Amount | | | Shares | | | Amount | |
| |
| | | | |
Reacquired: | | | | | | | | | | | | | | | | |
| | | | |
Series I | | | (685,177 | ) | | $ | (4,371,891 | ) | | | (851,917 | ) | | $ | (5,305,086 | ) |
| |
Series II | | | (2,491 | ) | | | (16,348 | ) | | | (335 | ) | | | (2,055 | ) |
| |
Net increase (decrease) in share activity | | | 1,025,337 | | | $ | 6,567,051 | | | | (351,114 | ) | | $ | (2,219,274 | ) |
| |
| (a) | There are entities that are record owners of more than 5% of the outstanding shares of the Fund and in the aggregate own 82% of the outstanding shares of the Fund. The Fund and the Fund’s principal underwriter or adviser, are parties to participation agreements with these entities whereby these entities sell units of interest in separate accounts funding variable products that are invested in the Fund. The Fund, Invesco and/or Invesco affiliates may make payments to these entities, which are considered to be related to the Fund, for providing services to the Fund, Invesco and/or Invesco affiliates including but not limited to services such as, securities brokerage, third party record keeping and account servicing and administrative services. The Fund has no knowledge as to whether all or any portion of the shares owned of record by these entities are also owned beneficially. |
Invesco V.I. Core Plus Bond Fund
Report of Independent Registered Public Accounting Firm
To the Board of Trustees of AIM Variable Insurance Funds (Invesco Variable Insurance Funds) and Shareholders of Invesco V.I. Core Plus Bond Fund
Opinion on the Financial Statements
We have audited the accompanying statement of assets and liabilities, including the schedule of investments, of Invesco V.I. Core Plus Bond Fund (one of the funds constituting AIM Variable Insurance Funds (Invesco Variable Insurance Funds), referred to hereafter as the “Fund”) as of December 31, 2019, the related statement of operations for the year ended December 31, 2019, the statement of changes in net assets for each of the two years in the period ended December 31, 2019, including the related notes, and the financial highlights for each of the five years in the period ended December 31, 2019 (collectively referred to as the “financial statements”). In our opinion, the financial statements present fairly, in all material respects, the financial position of the Fund as of December 31, 2019, the results of its operations for the year then ended, the changes in its net assets for each of the two years in the period ended December 31, 2019 and the financial highlights for each of the five years in the period ended December 31, 2019 in conformity with accounting principles generally accepted in the United States of America.
Basis for Opinion
These financial statements are the responsibility of the Fund’s management. Our responsibility is to express an opinion on the Fund’s financial statements based on our audits. We are a public accounting firm registered with the Public Company Accounting Oversight Board (United States) (PCAOB) and are required to be independent with respect to the Fund in accordance with the U.S. federal securities laws and the applicable rules and regulations of the Securities and Exchange Commission and the PCAOB.
We conducted our audits of these financial statements in accordance with the standards of the PCAOB. Those standards require that we plan and perform the audit to obtain reasonable assurance about whether the financial statements are free of material misstatement, whether due to error or fraud.
Our audits included performing procedures to assess the risks of material misstatement of the financial statements, whether due to error or fraud, and performing procedures that respond to those risks. Such procedures included examining, on a test basis, evidence regarding the amounts and disclosures in the financial statements. Our audits also included evaluating the accounting principles used and significant estimates made by management, as well as evaluating the overall presentation of the financial statements. Our procedures included confirmation of securities owned as of December 31, 2019 by correspondence with the custodian, transfer agent and brokers; when replies were not received from brokers, we performed other auditing procedures. We believe that our audits provide a reasonable basis for our opinion.
/s/PricewaterhouseCoopers LLP
Houston, Texas
February 18, 2020
We have served as the auditor of one or more of the investment companies in the Invesco group of investment companies since at least 1995. We have not been able to determine the specific year we began serving as auditor.
Invesco V.I. Core Plus Bond Fund
Calculating your ongoing Fund expenses
Example
As a shareholder of the Fund, you incur two types of costs: (1) transaction costs, which may include sales charges (loads) on purchase payments or contingent deferred sales charges on redemptions, if any; and (2) ongoing costs, including management fees, distribution and/or service(12b-1) fees, and other Fund expenses. This example is intended to help you understand your ongoing costs (in dollars) of investing in the Fund and to compare these costs with ongoing costs of investing in other mutual funds. The example is based on an investment of $1,000 invested at the beginning of the period and held for the entire period July 1, 2019 through December 31, 2019.
Actual expenses
The table below provides information about actual account values and actual expenses. You may use the information in this table, together with the amount you invested, to estimate the expenses that you paid over the period. Simply divide your account value by $1,000 (for example, an $8,600 account value divided by $1,000 = 8.6), then multiply the result by the number in the table under the heading entitled “Actual Expenses Paid During Period” to estimate the expenses you paid on your account during this period.
Hypothetical example for comparison purposes
The table below also provides information about hypothetical account values and hypothetical expenses based on the Fund’s actual expense ratio and an assumed rate of return of 5% per year before expenses, which is not the Fund’s actual return.
The hypothetical account values and expenses may not be used to estimate the actual ending account balance or expenses you paid for the period. You may use this information to compare the ongoing costs of investing in the Fund and other funds. To do so, compare this 5% hypothetical example with the 5% hypothetical examples that appear in the shareholder reports of the other funds.
Please note that the expenses shown in the table are meant to highlight your ongoing costs only and do not reflect any transaction costs, such as sales charges (loads) on purchase payments or contingent deferred sales charges on redemptions, if any. Therefore, the hypothetical information is useful in comparing ongoing costs only, and will not help you determine the relative total costs of owning different funds. In addition, if these transaction costs were included, your costs would have been higher.
| | | | | | | | | | | | | | | | | | | | | | | | | | | | | | |
| | | | | ACTUAL | | HYPOTHETICAL
(5% annual return before expenses) | | |
| | | Beginning
Account Value
(07/01/19) | | Ending
Account Value
(12/31/19)1 | | Expenses
Paid During
Period2 | | Ending
Account Value
(12/31/19) | | Expenses
Paid During
Period2 | | Annualized
Expense Ratio |
Series I | | $1,000.00 | | $1,030.00 | | $3.02 | | $1,022.23 | | $3.01 | | | | 0.59 | % |
Series II | | 1,000.00 | | 1,030.60 | | 4.30 | | 1,020.97 | | 4.28 | | | | 0.84 | |
| 1 | The actual ending account value is based on the actual total return of the Fund for the period July 1, 2019 through December 31, 2019, after actual expenses and will differ from the hypothetical ending account value which is based on the Fund’s expense ratio and a hypothetical annual return of 5% before expenses. |
| 2 | Expenses are equal to the Fund’s annualized expense ratio as indicated above multiplied by the average account value over the period, multiplied by 184/365 to reflect the most recent fiscal half year. |
Invesco V.I. Core Plus Bond Fund
Tax Information
Form1099-DIV, Form1042-S and other year-end tax information provide shareholders with actual calendar year amounts that should be included in their tax returns. Shareholders should consult their tax advisors.
The following distribution information is being provided as required by the Internal Revenue Code or to meet a specific state’s requirement.
The Fund designates the following amounts or, if subsequently determined to be different, the maximum amount allowable for its fiscal year ended December 31, 2019:
| | | | | | |
Federal and State Income Tax | | | | | | |
Corporate Dividends Received Deduction* | | | 1.77 | % | | |
Qualified Dividend Income* | | | 0.00 | % | | |
U.S. Treasury Obligations* | | | 6.94 | % | | |
| | * | The above percentages are based on ordinary income dividends paid to shareholders during the Fund’s fiscal year. |
Invesco V.I. Core Plus Bond Fund
Trustees and Officers
The address of each trustee and officer is AIM Variable Insurance Funds (Invesco Variable Insurance Funds) (the “Trust”), 11 Greenway Plaza, Suite 1000, Houston, Texas 77046-1173. The trustees serve for the life of the Trust, subject to their earlier death, incapacitation, resignation, retirement or removal as more specifically provided in the Trust’s organizational documents. Each officer serves for a one year term or until their successors are elected and qualified. Column two below includes length of time served with predecessor entities, if any.
| | | | | | | | |
Name, Year of Birth and Position(s) Held with the Trust | | Trustee and/or Officer Since | | Principal Occupation(s) During Past 5 Years | | Number of
Funds in
Fund Complex
Overseen by
Trustee | | Other Directorship(s) Held by Trustee During Past 5 Years |
| Interested Person |
Martin L. Flanagan1- 1960 Trustee and Vice Chair | | 2007 | | Executive Director, Chief Executive Officer and President, Invesco Ltd. (ultimate parent of Invesco and a global investment management firm); Trustee and Vice Chair, The Invesco Funds; Vice Chair, Investment Company Institute; and Member of Executive Board, SMU Cox School of Business Formerly: Advisor to the Board, Invesco Advisers, Inc. (formerly known as Invesco Institutional (N.A.), Inc.); Chairman and Chief Executive Officer, Invesco Advisers, Inc. (registered investment adviser); Director, Chairman, Chief Executive Officer and President, Invesco Holding Company (US), Inc. (formerly IVZ Inc.) (holding company), Invesco Group Services, Inc. (service provider) and Invesco North American Holdings, Inc. (holding company); Director, Chief Executive Officer and President, Invesco Holding Company Limited (parent of Invesco and a global investment management firm); Director, Invesco Ltd.; Chairman, Investment Company Institute and President,Co-Chief Executive Officer,Co-President, Chief Operating Officer and Chief Financial Officer, Franklin Resources, Inc. (global investment management organization) | | 229 | | None |
| 1 | Mr. Flanagan is considered an interested person (within the meaning of Section 2(a)(19) of the 1940 Act) of the Trust because he is an officer of the Adviser to the Trust, and an officer and a director of Invesco Ltd., ultimate parent of the Adviser. |
Invesco V.I. Core Plus Bond Fund
Trustees and Officers–(continued)
| | | | | | | | |
Name, Year of Birth and Position(s) Held with the Trust | | Trustee and/or Officer Since | | Principal Occupation(s) During Past 5 Years | | Number of
Funds in
Fund Complex
Overseen by
Trustee | | Other Directorship(s) Held by Trustee During Past 5 Years |
| Independent Trustees |
Bruce L. Crockett - 1944 Trustee and Chair | | 1993 | | Chairman, Crockett Technologies Associates (technology consulting company) Formerly: Director, Captaris (unified messaging provider); Director, President and Chief Executive Officer, COMSAT Corporation; Chairman, Board of Governors of INTELSAT (international communications company); ACE Limited (insurance company); Independent Directors Council and Investment Company Institute: Member of the Audit Committee, Investment Company Institute; Member of the Executive Committee and Chair of the Governance Committee, Independent Directors Council | | 229 | | Director and Chairman of the Audit Committee, ALPS (Attorneys Liability Protection Society) (insurance company); Director and Member of the Audit Committee and Compensation Committee, Ferroglobe PLC (metallurgical company) |
David C. Arch - 1945 Trustee | | 2010 | | Chairman of Blistex Inc. (consumer health care products manufacturer); Member, World Presidents’ Organization | | 229 | | Board member of the Illinois Manufacturers’ Association |
Beth Ann Brown - 1968 Trustee | | 2019 | | Independent Consultant Formerly: Head of Intermediary Distribution, Managing Director, Strategic Relations, Managing Director, Head of National Accounts, Senior Vice President, National Account Manager and Senior Vice President, Key Account Manager, Columbia Management Investment Advisers LLC; Vice President, Key Account Manager, Liberty Funds Distributor, Inc.; and Trustee of certain Oppenheimer Funds | | 229 | | Director, Board of Directors of Caron Engineering Inc.; Advisor, Board of Advisors of Caron Engineering Inc.; President and Director, Acton Shapleigh Youth Conservation Corps (non - profit); and Vice President and Director of Grahamtastic Connection (non-profit) |
Jack M. Fields - 1952 Trustee | | 1997 | | Chief Executive Officer, Twenty First Century Group, Inc. (government affairs company); and Chairman, Discovery Learning Alliance(non-profit) Formerly: Owner and Chief Executive Officer, Dos Angeles Ranch L.P. (cattle, hunting, corporate entertainment); Director, Insperity, Inc. (formerly known as Administaff) (human resources provider); Chief Executive Officer, Texana Timber LP (sustainable forestry company); Director of Cross Timbers Quail Research Ranch(non-profit); and member of the U.S. House of Representatives | | 229 | | None |
Invesco V.I. Core Plus Bond Fund
Trustees and Officers–(continued)
| | | | | | | | |
Name, Year of Birth and Position(s) Held with the Trust | | Trustee and/or Officer Since | | Principal Occupation(s) During Past 5 Years | | Number of
Funds in
Fund Complex
Overseen by
Trustee | | Other Directorship(s) Held by Trustee During Past 5 Years |
| Independent Trustees–(continued) |
Cynthia Hostetler - 1962 Trustee | | 2017 | | Non-Executive Director and Trustee of a number of public and private business corporations Formerly: Director, Aberdeen Investment Funds (4 portfolios); Head of Investment Funds and Private Equity, Overseas Private Investment Corporation; President, First Manhattan Bancorporation, Inc.; Attorney, Simpson Thacher & Bartlett LLP | | 229 | | Vulcan Materials Company (construction materials company); Trilinc Global Impact Fund; Genesee & Wyoming, Inc. (railroads); Artio Global Investment LLC (mutual fund complex); Edgen Group, Inc. (specialized energy and infrastructure products distributor); Investment Company Institute (professional organization); Independent Directors Council (professional organization) |
Eli Jones - 1961 Trustee | | 2016 | | Professor and Dean, Mays Business School - Texas A&M University Formerly: Professor and Dean, Walton College of Business, University of Arkansas and E.J. Ourso College of Business, Louisiana State University; Director, Arvest Bank | | 229 | | Insperity, Inc. (formerly known as Administaff) (human resources provider) |
Elizabeth Krentzman - 1959 Trustee | | 2019 | | Formerly: Principal and Chief Regulatory Advisor for Asset Management Services and U.S. Mutual Fund Leader of Deloitte & Touche LLP; General Counsel of the Investment Company Institute (trade association); National Director of the Investment Management Regulatory Consulting Practice, Principal, Director and Senior Manager of Deloitte & Touche LLP; Assistant Director of the Division of Investment Management - Office of Disclosure and Investment Adviser Regulation of the U.S. Securities and Exchange Commission and various positions with the Division of Investment Management – Office of Regulatory Policy of the U.S. Securities and Exchange Commission; Associate at Ropes & Gray LLP; Advisory Board Member of the Securities and Exchange Commission Historical Society; and Trustee of certain Oppenheimer Funds | | 229 | | Trustee of the University of Florida National Board Foundation and Audit Committee Member; Member of the Cartica Funds Board of Directors (private investment funds); Member of the University of Florida Law Center Association, Inc. Board of Trustees and Audit Committee Member |
| Anthony J. LaCava, Jr. - 1956 Trustee | | 2019 | | Formerly: Director and Member of the Audit Committee, Blue Hills Bank (publicly traded financial institution) and Managing Partner, KPMG LLP | | 229 | | Blue Hills Bank; Chairman, Bentley University; Member, Business School Advisory Council; and Nominating Committee KPMG LLP |
| Prema Mathai-Davis - 1950 Trustee | | 1998 | | Retired Co-Owner & Partner of Quantalytics Research, LLC, (a FinTech Investment Research Platform for the Self-Directed Investor) | | 229 | | None |
Invesco V.I. Core Plus Bond Fund
Trustees and Officers–(continued)
| | | | | | | | |
Name, Year of Birth and Position(s) Held with the Trust | | Trustee and/or Officer Since | | Principal Occupation(s) During Past 5 Years | | Number of
Funds in
Fund Complex
Overseen by
Trustee | | Other Directorship(s) Held by Trustee During Past 5 Years |
| Independent Trustees–(continued) |
Joel W. Motley - 1952 Trustee | | 2019 | | Director of Office of Finance, Federal Home Loan Bank; Member of the Vestry of Trinity Wall Street; Managing Director of Carmona Motley Inc. (privately held financial advisor); Member of the Finance and Budget Committee of the Council on Foreign Relations, Member of the Investment Committee and Board of Human Rights Watch and Member of the Investment Committee and Board of Historic Hudson Valley(non-profit cultural organization) Formerly: Managing Director of Public Capital Advisors, LLC (privately held financial advisor); Managing Director of Carmona Motley Hoffman, Inc. (privately held financial advisor); Trustee of certain Oppenheimer Funds; and Director of Columbia Equity Financial Corp. (privately held financial advisor) | | 229 | | Director of Greenwall Foundation (bioethics research foundation); Member of Board and Investment Committee of The Greenwall Foundation; Director of Southern Africa Legal Services Foundation; Board Member and Investment Committee Member of Pulizer Center for Crisis Reporting(non-profit journalism) |
Teresa M. Ressel - 1962 Trustee | | 2017 | | Non-executive director and trustee of a number of public and private business corporations Formerly: Chief Financial Officer, Olayan America, The Olayan Group (international investor/commercial/industrial); Chief Executive Officer, UBS Securities LLC; Group Chief Operating Officer, Americas, UBS AG; Assistant Secretary for Management & Budget and CFO, US Department of the Treasury | | 229 | | Atlantic Power Corporation (power generation company); ON Semiconductor Corp. (semiconductor supplier) |
| Ann Barnett Stern - 1957 Trustee | | 2017 | | President and Chief Executive Officer, Houston Endowment Inc. (private philanthropic institution) Formerly: Executive Vice President and General Counsel, Texas Children’s Hospital; Attorney, Beck, Redden and Secrest, LLP; Business Law Instructor, University of St. Thomas; Attorney, Andrews & Kurth LLP | | 229 | | Federal Reserve Bank of Dallas |
Robert C. Troccoli - 1949 Trustee | | 2016 | | Retired | | 229 | | None |
Daniel S. Vandivort - 1954 Trustee | | 2019 | | Treasurer, Chairman of the Audit and Finance Committee, and Trustee, Board of Trustees, Huntington Disease Foundation of America; and President, Flyway Advisory Services LLC (consulting and property management) Formerly: Trustee and Governance Chair, of certain Oppenheimer Funds | | 229 | | Chairman and Lead Independent Director, Chairman of the Audit Committee, and Director, Board of Directors, Value Line Funds |
James D. Vaughn - 1945 Trustee | | 2019 | | Retired Formerly: Managing Partner, Deloitte & Touche LLP; Trustee and Chairman of the Audit Committee, Schroder Funds; Board Member, Mile High United Way, Boys and Girls Clubs, Boy Scouts, Colorado Business Committee for the Arts, Economic Club of Colorado and Metro Denver Network (economic development corporation); and Trustee of certain Oppenheimer Funds | | 229 | | Board member and Chairman of Audit Committee of AMG National Trust Bank; Trustee and Investment Committee member, University of South Dakota Foundation; Board member, Audit Committee Member and past Board Chair, Junior Achievement(non-profit) |
Invesco V.I. Core Plus Bond Fund
Trustees and Officers–(continued)
| | | | | | | | |
Name, Year of Birth and Position(s) Held with the Trust | | Trustee and/or Officer Since | | Principal Occupation(s) During Past 5 Years | | Number of
Funds in
Fund Complex
Overseen by
Trustee | | Other Directorship(s) Held by Trustee During Past 5 Years |
| Independent Trustees–(continued) |
| Christopher L. WIlson - 1957 Trustee, Vice Chair and Chair Designate | | 2017 | | Retired Formerly: Director, TD Asset Management USA Inc. (mutual fund complex) (22 portfolios); Managing Partner, CT2, LLC (investing and consulting firm); President/Chief Executive Officer, Columbia Funds, Bank of America Corporation; President/Chief Executive Officer, CDC IXIS Asset Management Services, Inc.; Principal & Director of Operations, Scudder Funds, Scudder, Stevens & Clark, Inc.; Assistant Vice President, Fidelity Investments | | 229 | | ISO New England, Inc.(non-profit organization managing regional electricity market) |
Invesco V.I. Core Plus Bond Fund
Trustees and Officers–(continued)
| | | | | | | | |
Name, Year of Birth and Position(s) Held with the Trust | | Trustee and/or Officer Since | | Principal Occupation(s) During Past 5 Years | | Number of
Funds in
Fund Complex
Overseen by
Trustee | | Other Directorship(s) Held by Trustee During Past 5 Years |
| Officers |
Sheri Morris - 1964 President, Principal Executive Officer and Treasurer | | 1999 | | Head of Global Fund Services, Invesco Ltd.; President, Principal Executive Officer and Treasurer, The Invesco Funds; Vice President, Invesco Advisers, Inc. (formerly known as Invesco Institutional (N.A.), Inc.) (registered investment adviser); and Vice President, Invesco Exchange-Traded Fund Trust, Invesco Exchange-Traded Fund Trust II, Invesco India Exchange-Traded Fund Trust, Invesco Actively Managed Exchange-Traded Fund Trust, Invesco Actively Managed Exchange-Traded Commodity Fund Trust and Invesco Exchange-Traded Self-Indexed Fund Trust; and Vice President, OppenheimerFunds, Inc. Formerly: Vice President and Principal Financial Officer, The Invesco Funds; Vice President, Invesco AIM Advisers, Inc., Invesco AIM Capital Management, Inc. and Invesco AIM Private Asset Management, Inc.; Assistant Vice President and Assistant Treasurer, The Invesco Funds and Assistant Vice President, Invesco Advisers, Inc., Invesco AIM Capital Management, Inc. and Invesco AIM Private Asset Management, Inc.; and Treasurer, Invesco Exchange-Traded Fund Trust, Invesco Exchange-Traded Fund Trust II, Invesco India Exchange-Traded Fund Trust and Invesco Actively Managed Exchange-Traded Fund Trust | | N/A | | N/A |
Russell C. Burk - 1958 Senior Vice President and Senior Officer | | 2005 | | Senior Vice President and Senior Officer, The Invesco Funds | | N/A | | N/A |
Jeffrey H. Kupor - 1968 Senior Vice President, Chief Legal Officer and Secretary | | 2018 | | Head of Legal of the Americas, Invesco Ltd.; Senior Vice President and Secretary, Invesco Advisers, Inc. (formerly known as Invesco Institutional (N.A.), Inc.) (registered investment adviser); Senior Vice President and Secretary, Invesco Distributors, Inc. (formerly known as Invesco AIM Distributors, Inc.); Vice President and Secretary, Invesco Investment Services, Inc. (formerly known as Invesco AIM Investment Services, Inc.) Senior Vice President, Chief Legal Officer and Secretary, The Invesco Funds; Secretary and General Counsel, Invesco Investment Advisers LLC (formerly known as Van Kampen Asset Management); Secretary and General Counsel, Invesco Capital Markets, Inc. (formerly known as Van Kampen Funds Inc.) and Chief Legal Officer, Invesco Exchange-Traded Fund Trust, Invesco Exchange-Traded Fund Trust II, Invesco India Exchange-Traded Fund Trust, Invesco Actively Managed Exchange-Traded Fund Trust, Invesco Actively Managed Exchange-Traded Commodity Fund Trust and Invesco Exchange-Traded Self-Indexed Fund Trust; Secretary, Invesco Indexing LLC; Secretary, W.L. Ross & Co., LLC Formerly: Secretary and Vice President, Jemstep, Inc.; Head of Legal, Worldwide Institutional, Invesco Ltd.; Secretary and General Counsel, INVESCO Private Capital Investments, Inc.; Senior Vice President, Secretary and General Counsel, Invesco Management Group, Inc. (formerly known as Invesco AIM Management Group, Inc.); Assistant Secretary, INVESCO Asset Management (Bermuda) Ltd.; Secretary and General Counsel, Invesco Private Capital, Inc.; Assistant Secretary and General Counsel, INVESCO Realty, Inc.; Secretary and General Counsel, Invesco Senior Secured Management, Inc.; and Secretary, Sovereign G./P. Holdings Inc. | | N/A | | N/A |
Andrew R. Schlossberg - 1974 Senior Vice President | | 2019 | | Head of the Americas and Senior Managing Director, Invesco Ltd.; Director and Senior Vice President, Invesco Advisers, Inc. (formerly known as Invesco Institutional (N.A.), Inc.) (registered investment adviser); Director and Chairman, Invesco Investment Services, Inc. (formerly known as Invesco AIM Investment Services, Inc.) (registered transfer agent); Senior Vice President, The Invesco Funds; Director, Invesco Investment Advisers LLC (formerly known as Van Kampen Asset Management); Director, President and Chairman, Invesco Insurance Agency, Inc. Formerly: Director, Invesco UK Limited; Director and Chief Executive, Invesco Asset Management Limited and Invesco Fund Managers Limited; Assistant Vice President, The Invesco Funds; Senior Vice President, Invesco Advisers, Inc. (formerly known as Invesco Institutional (N.A.), Inc.) (registered investment adviser); Director and Chief Executive, Invesco Administration Services Limited and Invesco Global Investment Funds Limited; Director, Invesco Distributors, Inc.; Head of EMEA, Invesco Ltd.; President, Invesco Actively Managed Exchange-Traded Commodity Fund Trust, Invesco Actively Managed Exchange-Traded Fund Trust, Invesco Exchange-Traded Fund Trust, Invesco Exchange-Traded Fund Trust II and Invesco India Exchange-Traded Fund Trust; Managing Director and Principal Executive Officer, Invesco Capital Management LLC | | N/A | | N/A |
Invesco V.I. Core Plus Bond Fund
Trustees and Officers–(continued)
| | | | | | | | |
Name, Year of Birth and Position(s) Held with the Trust | | Trustee and/or Officer Since | | Principal Occupation(s) During Past 5 Years | | Number of
Funds in
Fund Complex
Overseen by
Trustee | | Other Directorship(s) Held by Trustee During Past 5 Years |
| Officers–(continued) |
John M. Zerr - 1962
Senior Vice President | | 2006 | | Chief Operating Officer of the Americas; Senior Vice President, Invesco Advisers, Inc. (formerly known as Invesco Institutional (N.A.), Inc.) (registered investment adviser); Senior Vice President, Invesco Distributors, Inc. (formerly known as Invesco AIM Distributors, Inc.); Director and Vice President, Invesco Investment Services, Inc. (formerly known as Invesco AIM Investment Services, Inc.) Senior Vice President, The Invesco Funds; Managing Director, Invesco Capital Management LLC; Director, Invesco Investment Advisers LLC (formerly known as Van Kampen Asset Management); Senior Vice President, Invesco Capital Markets, Inc. (formerly known as Van Kampen Funds Inc.); Manager, Invesco Indexing LLC; Manager, Invesco Specialized Products, LLC; Director and Senior Vice President, Invesco Insurance Agency, Inc.; Member, Invesco Canada Funds Advisory Board; Director, President and Chief Executive Officer, Invesco Corporate Class Inc. (corporate mutual fund company); and Director, Chairman, President and Chief Executive Officer, Invesco Canada Ltd. (formerly known as Invesco Trimark Ltd./Invesco Trimark Ltèe) (registered investment adviser and registered transfer agent) Formerly: Director and Senior Vice President, Invesco Management Group, Inc. (formerly known as Invesco AIM Management Group, Inc.); Secretary and General Counsel, Invesco Management Group, Inc. (formerly known as Invesco AIM Management Group, Inc.); Secretary, Invesco Investment Services, Inc. (formerly known as Invesco AIM Investment Services, Inc.); Chief Legal Officer and Secretary, The Invesco Funds; Secretary and General Counsel, Invesco Investment Advisers LLC (formerly known as Van Kampen Asset Management); Secretary and General Counsel, Invesco Capital Markets, Inc. (formerly known as Van Kampen Funds Inc.); Chief Legal Officer, Invesco Exchange-Traded Fund Trust, Invesco Exchange-Traded Fund Trust II, Invesco India Exchange-Traded Fund Trust, Invesco Actively Managed Exchange-Traded Fund Trust, Invesco Actively Managed Exchange-Traded Commodity Fund Trust and Invesco Exchange-Traded Self-Indexed Fund Trust; Secretary, Invesco Indexing LLC; Director, Secretary, General Counsel and Senior Vice President, Van Kampen Exchange Corp.; Director, Vice President and Secretary, IVZ Distributors, Inc. (formerly known as INVESCO Distributors, Inc.); Director and Vice President, INVESCO Funds Group, Inc.; Director and Vice President, Van Kampen Advisors Inc.; Director, Vice President, Secretary and General Counsel, Van Kampen Investor Services Inc.;Director and Secretary, Invesco Distributors, Inc. (formerly known as Invesco AIM Distributors, Inc.); Director, Senior Vice President, General Counsel and Secretary, Invesco AIM Advisers, Inc. and Van Kampen Investments Inc.; Director, Vice President and Secretary, Fund Management Company; Director, Senior Vice President, Secretary, General Counsel and Vice President, Invesco AIM Capital Management, Inc.; Chief Operating Officer and General Counsel, Liberty Ridge Capital, Inc. (an investment adviser) | | N/A | | N/A |
| Gregory G. McGreevey - 1962 Senior Vice President | | 2012 | | Senior Managing Director, Invesco Ltd.; Director, Chairman, President, and Chief Executive Officer, Invesco Advisers, Inc. (formerly known as Invesco Institutional (N.A.), Inc.) (registered investment adviser); Director, Invesco Mortgage Capital, Inc. and Invesco Senior Secured Management, Inc.; and Senior Vice President, The Invesco Funds; and President, SNW Asset Management Corporation Formerly: Senior Vice President, Invesco Management Group, Inc. and Invesco Advisers, Inc.; Assistant Vice President, The Invesco Funds | | N/A | | N/A |
| Kelli Gallegos - 1970 Vice President, Principal Financial Officer and Assistant Treasurer | | 2008 | | Principal Financial and Accounting Officer – Investments Pool, Invesco Specialized Products, LLC; Vice President, Principal Financial Officer and Assistant Treasurer, The Invesco Funds; Principal Financial and Accounting Officer – Pooled Investments, Invesco Capital Management LLC; Vice President and Treasurer, Invesco Exchange-Traded Fund Trust, Invesco Exchange-Traded Fund Trust II, Invesco India Exchange-Traded Fund Trust, Invesco Actively Managed Exchange-Traded Fund Trust, Invesco Actively Managed Exchange-Traded Commodity Fund Trust and Invesco Exchange-Traded Self-Indexed Fund Trust Formerly: Assistant Treasurer, Invesco Specialized Products, LLC; Assistant Treasurer, Invesco Exchange-Traded Fund Trust, Invesco Exchange-Traded Fund Trust II, Invesco India Exchange-Traded Fund Trust, Invesco Actively Managed Exchange-Traded Fund Trust, Invesco Actively Managed Exchange-Traded Commodity Fund Trust and Invesco Exchange-Traded Self-Indexed Fund Trust; Assistant Treasurer, Invesco Capital Management LLC; Assistant Vice President, The Invesco Funds | | N/A | | N/A |
Invesco V.I. Core Plus Bond Fund
Trustees and Officers–(continued)
| | | | | | | | |
Name, Year of Birth and Position(s) Held with the Trust | | Trustee and/or Officer Since | | Principal Occupation(s) During Past 5 Years | | Number of
Funds in
Fund Complex
Overseen by
Trustee | | Other Directorship(s) Held by Trustee During Past 5 Years |
| Officers–(continued) |
Crissie M. Wisdom - 1969 Anti-Money Laundering Compliance Officer | | 2013 | | Anti-Money Laundering Compliance Officer, Invesco Advisers, Inc. (formerly known as Invesco Institutional (N.A.), Inc.) (registered investment adviser), Invesco Capital Markets, Inc. (formerly known as Van Kampen Funds Inc.), Invesco Distributors, Inc., Invesco Investment Services, Inc., The Invesco Funds, and Invesco Exchange-Traded Fund Trust, Invesco Exchange-Traded Fund Trust II, Invesco India Exchange-Traded Fund Trust, Invesco Actively Managed Exchange-Traded Fund Trust, Invesco Actively Managed Exchange-Traded Commodity Fund Trust and Invesco Exchange-Traded Self-Indexed Fund Trust; Anti-Money Laundering Compliance Officer and Bank Secrecy Act Officer, INVESCO National Trust Company and Invesco Trust Company; and Fraud Prevention Manager and Controls and Risk Analysis Manager for Invesco Investment Services, Inc. Formerly: Anti-Money Laundering Compliance Officer, Van Kampen Exchange Corp. and Invesco Management Group, Inc. | | N/A | | N/A |
Robert R. Leveille - 1969 Chief Compliance Officer | | 2016 | | Chief Compliance Officer, Invesco Advisers, Inc. (registered investment adviser); and Chief Compliance Officer, The Invesco Funds Formerly: Chief Compliance Officer, Putnam Investments and the Putnam Funds | | N/A | | N/A |
The Statement of Additional Information of the Trust includes additional information about the Fund’s Trustees and is available upon request, without charge, by calling 1.800.959.4246. Please refer to the Fund’s Statement of Additional Information for information on the Fund’ssub-advisers.
| | | | | | |
| Office of the Fund | | Investment Adviser | | Distributor | | Auditors |
| 11 Greenway Plaza, Suite 1000 | | Invesco Advisers, Inc. | | Invesco Distributors, Inc. | | PricewaterhouseCoopers LLP |
| Houston, TX 77046-1173 | | 1555 Peachtree Street, N.E. | | 11 Greenway Plaza, Suite 1000 | | 1000 Louisiana Street, Suite 5800 |
| | Atlanta, GA 30309 | | Houston, TX 77046-1173 | | Houston, TX 77002-5678 |
| | | |
| Counsel to the Fund | | Counsel to the Independent Trustees | | Transfer Agent | | Custodian |
| Stradley Ronon Stevens & Young, LLP | | Goodwin Procter LLP | | Invesco Investment Services, Inc. | | State Street Bank and Trust Company |
| 2005 Market Street, Suite 2600 | | 901 New York Avenue, N.W. | | 11 Greenway Plaza, Suite 1000 | | 225 Franklin Street |
| Philadelphia, PA 19103-7018 | | Washington, D.C. 20001 | | Houston, TX 77046-1173 | | Boston, MA 02110-2801 |
Invesco V.I. Core Plus Bond Fund
| | | | |
| | |
 | | Annual Report to Shareholders | | December 31, 2019 |
| | |
| | Invesco V.I. Diversified Dividend Fund |
| | |
| | |

Beginning on January 1, 2021, as permitted by regulations adopted by the Securities and Exchange Commission, the insurance company that offers your variable annuity or variable life insurance contract may no longer send you paper copies of the Fund’s shareholder reports by mail, unless you specifically request paper copies of the reports from the insurance company or your financial intermediary. Instead of delivering paper copies of the report, the insurance company may choose to make the reports available on a website, and will notify you by mail each time a report is posted and provide you with a website link to access the report. Instructions for requesting paper copies will be provided by your insurance company.
If the insurance company offers electronic delivery, you may elect to receive shareholder reports and other communications about the Fund electronically by following the instructions provided by the insurance company or by contacting your financial intermediary. If you already elected to receive shareholder reports electronically, you will not be affected by this change and you need not take any action.
You may elect to receive all future reports in paper free of charge from the insurance company. You can inform the insurance company or your financial intermediary that you wish to continue receiving paper copies of your shareholder reports by following the instructions provided by the insurance company or by contacting your financial intermediary. Your election to receive reports in paper will apply to all portfolio companies available under your contract with the insurance company.
The Fund provides a complete list of its holdings four times in each fiscal year, at the quarter-ends. For the second and fourth quarters, the lists appear in the Fund’s semiannual and annual reports to shareholders. For the first and third quarters, the Fund files the lists with the Securities and Exchange Commission (SEC) as an exhibit to its reports on Form N-PORT. The Fund’s Form N-PORT filings are available on the SEC website, sec.gov. The SEC file numbers for the Fund are 811-07452 and 033-57340. The Fund’s most recent portfolio holdings, as filed on Form N-PORT, have also been made available to insurance companies issuing variable annuity contracts and variable life insurance policies (“variable products”) that invest in the Fund.
A description of the policies and procedures that the Fund uses to determine how to vote proxies relating to portfolio securities is available without charge, upon request, from our Client Services department at 800 959 4246 or at invesco.com/proxyguidelines. The information is also available on the SEC website, sec.gov.
Information regarding how the Fund voted proxies related to its portfolio securities during the most recent 12-month period ended June 30 is available at invesco.com/proxysearch. The information is also available on the SEC website, sec.gov.
Invesco Advisers, Inc. is an investment adviser; it provides investment advisory services to individual and institutional clients and does not sell securities. Invesco Distributors, Inc. is the US distributor for Invesco Ltd.’s retail mutual funds, exchange-traded funds and institutional money market funds. Both are wholly owned, indirect subsidiaries of Invesco Ltd.
This report must be accompanied or preceded by a currently effective Fund prospectus and variable product prospectus, which contain more complete information, including sales charges and expenses. Investors should read each carefully before investing.
NOT FDIC INSURED | MAY LOSE VALUE | NO BANK GUARANTEE
| | |
| Invesco Distributors, Inc. | | VIDDI-AR-1 |
Management’s Discussion of Fund Performance
Performance summary
For the year ended December 31, 2019, Series I shares of Invesco V.I. Diversified Dividend Fund (the Fund) underperformed the Russell 1000 Value Index, the Fund’s style-specific benchmark.
Your Fund’s long-term performance appears later in this report.
Fund vs. Indexes
Total returns, 12/31/18 to 12/31/19, excluding variable product issuer charges. If variable product issuer charges were included, returns would be lower.
| | | | | |
| Series I Shares | | | | 25.09 | % |
| Series II Shares | | | | 24.77 | |
| S&P 500 Indexq (Broad Market Index) | | | | 31.49 | |
| Russell 1000 Value Indexq (Style-Specific Index) | | | | 26.54 | |
| Lipper VUF Large-Cap Value Funds Index∎(Peer Group Index) | | | | 26.71 | |
| Source(s):qRIMES Technologies Corp.;∎Lipper Inc. | |
Market conditions and your Fund
Equity markets rallied in the first quarter of 2019, as optimism about a potential US-China trade deal increased and the Fed signaled there would be no further interest rate hikes in 2019, a surprising shift in monetary policy. The Fed’s more accommodative stance provided a supportive environment for equities and fixed income, despite mixed US economic data and slower overseas growth. Against this backdrop, the S&P 500 Index posted its best first quarter returns since 1998.
Although the S&P 500 Index posted modest gains for the second quarter of 2019, the US stock market experienced increased volatility. After four consecutive months of rising stock markets, the market sold off in May 2019, along with bond yields and oil prices, as investors weighed the impact of the lingering trade war between the US and China, and potential tariffs on Mexico. In addition, economic data continued to show a slowing domestic and global economy.
These investor concerns carried over into the third quarter. The US-China
trade conflict worried investors and stifled business investment, even as the Fed cut interest rates by 0.25% twice in the quarter. This uncertainty increased both market volatility and risk aversion, and investors crowded into asset classes perceived as safe havens, such as US Treasuries and gold. The US Treasury yield curve inverted several times, increasing fears of a possible US recession. However, the Fed’s accommodative tone provided some support for risk assets.
Macroeconomic issues that concerned investors in the third quarter of 2019 mostly abated during the fourth quarter, providing the backdrop for strong equity market returns. Risk assets surged higher as a result of a delay in the Brexit agreement until January 2020, optimism that phase one of a US-China trade deal would be completed and better-than-expected third-quarter corporate earnings results. The US economy grew more than expected, by 2.1% during the third quarter of 2019.2 During its October meeting, the Fed cut interest rates again by 0.25% based on business investment and exports remaining weak.1
Within the S&P 500 Index, information technology (IT) was the best-performing sector for the fiscal year, while energy was the worst-performing sector. It is important to view the market’s performance within the context of a full market cycle. This cycle, which began in June 2009, is one of the longest expansions on record with one of the largest bull markets, despite a historically low recovery in revenue versus previous cycle troughs.3 In this environment, we remain focused on our assessment of each investment’s risk-reward profile.
During the year, the Fund’s management discipline remained unchanged. Our total return approach continued to emphasize long-term capital appreciation, current income and capital preservation. We believe the Fund may serve as an equity foundation within a well-diversified asset allocation strategy, complementing more aggressive and cyclical investments. We look for dividend-paying companies with strong profitability, solid balance sheets and capital allocation policies that support sustained or increasing dividends and share repurchases. We perform extensive fundamental research, incorporating both financial statement analysis and an assessment of the potential reward relative to the downside risk, to determine a fair valuation over our two- to three-year investment horizon for each stock. We believe this process may provide a valuable combination of dividend income, price appreciation and capital preservation. We also maintain a rigorous sell discipline and consider selling or reducing shares in stocks that no longer meet our investment criteria.
Within the Fund’s style-specific benchmark, IT, industrials and financials were the best-performing sectors, while energy was the worst-performing sector during the year. The Fund’s overweight
| | |
Portfolio Composition |
By sector | | % of total net assets |
| | |
| |
| Consumer Staples | | 22.80% |
| Utilities | | 17.62 |
| Financials | | 14.20 |
| Industrials | | 9.99 |
| Health Care | | 7.71 |
| Energy | | 5.87 |
| Consumer Discretionary | | 4.88 |
| Communication Services | | 4.28 |
| Materials | | 4.02 |
| Other Sectors, Each Less than 2% of Net Assets | | 3.15 |
| Money Market Funds Plus Other Assets Less Liabilities | | 5.48 |
| | |
Top 10 Equity Holdings* | | |
| % of total net assets |
| |
1. Entergy Corp. | | 3.22% |
2. Hartford Financial Services Group, Inc. (The) | | 3.22 |
3. General Mills, Inc. | | 3.01 |
4. Procter & Gamble Co. (The) | | 2.89 |
5. Coca-Cola Co. (The) | | 2.66 |
6. AT&T, Inc. | | 2.63 |
7. PPL Corp. | | 2.49 |
8. Dominion Energy, Inc. | | 2.38 |
9. Exelon Corp. | | 2.17 |
10. Campbell Soup Co. | | 2.10 |
| | |
Total Net Assets | | $515.6 million |
| |
Total Number of Holdings* | | 70 |
The Fund’s holdings are subject to change, and there is no assurance that the Fund will continue to hold any particular security.
*Excluding money market fund holdings, if any.
Data presented here are as of December 31, 2019.
Invesco V.I. Diversified Dividend Fund
exposure to the consumer staples sector and stock selection in the consumer discretionary sector contributed the most to relative performance versus the style-specific benchmark. The Fund’s underweight exposure to energy also helped relative performance, as did stock selection in the health care sector. Underweight positions in the IT and financials sectors detracted the most from the Fund’s relative performance versus the style-specific benchmark. Stock selection in the communication services and industrials sectors also hurt the Fund’s performance relative to the style-specific benchmark.
During the year, holdings in the consumer staples and utilities sectors were the largest contributors to the Fund’s performance. Packaged foods companyGeneral Millswas the largest contributor to Fund performance for the year. The company has benefited from improved profit margins and revenue growth driven by better pricing. Utility companyEntergywas also a large contributor to Fund performance. Management affirmed long-term earnings expectations as the company continues to exit the merchant power business and transition to a fully regulated utility. In addition, management plans to replace a portion of its legacy generation with clean natural gas and renewable capacity over the coming years.
Select holdings in the consumer staples and communication services sectors were the largest detractors from the Fund’s absolute performance during the year. Packaged foods companyKraft Heinzwas the largest detractor from Fund performance. The company faced increasing operating costs that have lowered profitability and revenue growth has disappointed. The stock was also impacted by previous management actions that included an impairment of company assets. A new CEO and CFO have started a renewed focus on initiatives to improve operations and invest in brands that we believe should drive improved profitability and organic sales. Telecom services companyBT Groupalso detracted from the Fund’s absolute performance during the year. The company provides phone, internet access and television services to residential and business customers in the U.K. BT Group’s business has faced negative pricing regulation and pressure to increase capital investment to support an upgrade to UK communications infrastructure.
The Fund used currency forward contracts for the purpose of hedging currency
exposure of some of the non-US-based companies held in the Fund’s portfolio and not for speculative purposes or leverage. The use of currency forward contracts had a very small positive impact on the Fund’s performance during the year.
The Fund has successfully navigated multiple market cycles with a consistent long-term mandate to emphasize capital appreciation, current income and capital preservation over a full market cycle.
It has been our privilege to oversee Invesco V.I. Diversified Dividend Fund, and we thank you for your continued investment.
| 1 | Source: US Federal Reserve |
| 2 | Source: Bureau of Economic Analysis |
| 3 | Sources: National Bureau of Economic Research, Ned Davis Research and FactSet Research Systems Inc. |
Portfolio managers:
Robert Botard
Kristina Bradshaw
Chris McMeans
Meggan Walsh - Lead
The views and opinions expressed in management’s discussion of Fund performance are those of Invesco Advisers, Inc. These views and opinions are subject to change at any time based on factors such as market and economic conditions. These views and opinions may not be relied upon as investment advice or recommendations, or as an offer for a particular security. The information is not a complete analysis of every aspect of any market, country, industry, security or the Fund. Statements of fact are from sources considered reliable, but Invesco Advisers, Inc. makes no representation or warranty as to their completeness or accuracy. Although historical performance is no guarantee of future results, these insights may help you understand our investment management philosophy.
See important Fund and, if applicable, index disclosures later in this report.
Invesco V.I. Diversified Dividend Fund
Your Fund’s Long-Term Performance
Results of a $10,000 Investment – Oldest Share Class(es)
Fund and index data from 12/31/09
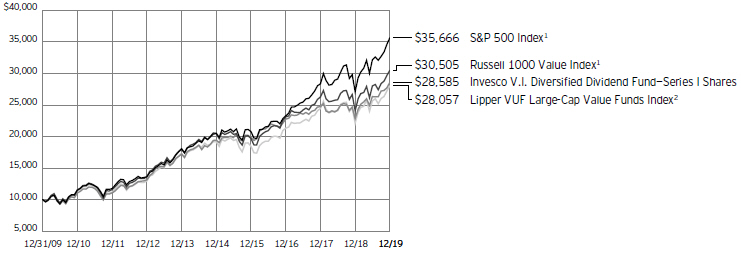
| 1 | Source: RIMES Technologies Corp. |
Past performance cannot guarantee future results.
| | | | |
Average Annual Total Returns | |
As of 12/31/19 | | | | |
| |
Series I Shares | | | | |
Inception (3/1/90) | | | 8.19 | % |
10 Years | | | 11.07 | |
5 Years | | | 8.03 | |
1 Year | | | 25.09 | |
| |
Series II Shares | | | | |
Inception (6/5/00) | | | 5.88 | % |
10 Years | | | 10.80 | |
5 Years | | | 7.76 | |
1 Year | | | 24.77 | |
Effective June 1, 2010, Class X and Class Y shares of the predecessor fund, Morgan Stanley Variable Investment Series Dividend Growth Portfolio, advised by Morgan Stanley Investment Advisors Inc. were reorganized into Series I and Series II shares, respectively, of Invesco V.I. Dividend Growth Fund (renamed Invesco V.I. Diversified Dividend Fund on April 30, 2012). Returns shown above, prior to June 1, 2010, for Series I and Series II shares are blended returns of the predecessor fund and Invesco V.I. Dividend Growth Fund. Share class returns will differ from the predecessor fund because of different expenses.
The performance data quoted represent past performance and cannot guarantee future results; current performance may be lower or higher. Please contact your variable product issuer or financial adviser for the most recent month-end variable product performance. Performance figures reflect Fund expenses, reinvested distributions
and changes in net asset value. Performance figures do not reflect deduction of taxes a shareholder would pay on Fund distributions or sale of Fund shares. Investment return and principal value will fluctuate so that you may have a gain or loss when you sell shares.
The net annual Fund operating expense ratio set forth in the most recent Fund prospectus as of the date of this report for Series I and Series II shares was 0.65% and 0.90%, respectively.1 The total annual Fund operating expense ratio set forth in the most recent Fund prospectus as of the date of this report for Series I and Series II shares was 0.66% and 0.91%, respectively. The expense ratios presented above may vary from the expense ratios presented in other sections of this report that are based on expenses incurred during the period covered by this report.
Invesco V.I. Diversified Dividend Fund, a series portfolio of AIM Variable Insurance Funds (Invesco Variable Insurance Funds), is currently offered through insurance companies issuing variable products. You cannot purchase shares of the Fund directly. Performance figures given represent the Fund and are not intended to reflect actual variable product values. They do not reflect sales charges, expenses and fees assessed in connection with a variable product. Sales charges, expenses and fees, which are determined by the variable product issuers, will vary and will lower the total return.
The most recent month-end performance at the Fund level, excluding variable product charges, is available at 800 451 4246. As
mentioned above, for the most recent month-end performance including variable product charges, please contact your variable product issuer or financial adviser.
Fund performance reflects any applicable fee waivers and/or expense reimbursements. Had the adviser not waived fees and/or reimbursed expenses currently or in the past, returns would have been lower. See current prospectus for more information.
| 1 | Total annual Fund operating expenses after any contractual fee waivers and/or expense reimbursements by the adviser in effect through at least June 30, 2021. See current prospectus for more information. |
Invesco V.I. Diversified Dividend Fund
Invesco V.I. Diversified Dividend Fund’s investment objective is to provide reasonable current income and long-term growth of income and capital.
| ∎ | Unless otherwise stated, information presented in this report is as of December 31, 2019, and is based on total net assets. |
| ∎ | Unless otherwise noted, all data provided by Invesco. |
| ∎ | To access your Fund’s reports/prospectus, visit invesco.com/fundreports. |
About indexes used in this report
| ∎ | TheS&P 500® Indexis an unmanaged index considered representative of the US stock market. |
| ∎ | TheRussell 1000® Value Indexis an unmanaged index considered representative of large-cap value stocks. The Russell 1000 Value Index is a trademark/service mark of the Frank Russell Co. Russell® is a trademark of the Frank Russell Co. |
| ∎ | TheLipper VUF Large-Cap Value Funds Indexis an unmanaged index considered representative of large-cap value variable insurance underlying funds tracked by Lipper. |
| ∎ | The Fund is not managed to track the performance of any particular index, including the index(es) described here, and consequently, the performance of the Fund may deviate significantly from the performance of the index(es). |
| ∎ | A direct investment cannot be made in an index. Unless otherwise indicated, index results include reinvested dividends, and they do not reflect sales charges. Performance of the peer group, if applicable, reflects fund expenses; performance of a market index does not. |
Other information
| ∎ | The returns shown in management’s discussion of Fund performance are based on net asset values calculated for shareholder transactions. Generally accepted accounting principles require adjustments to be made to the net assets of the Fund at period end for financial reporting purposes, and as such, the net asset values for shareholder transactions and the returns based on those net asset values may differ from the net asset values and returns reported in the Financial Highlights. Additionally, the returns and net asset values shown throughout this report are at the Fund level only and do not include variable product issuer charges. If such charges were included, the total returns would be lower. |
| ∎ | Industry classifications used in this report are generally according to the Global Industry Classification Standard, which was developed by and is |
| | the exclusive property and a service mark of MSCI Inc. and Standard & Poor’s. |
Invesco V.I. Diversified Dividend Fund
Schedule of Investments(a)
December 31, 2019
| | | | | | |
| | | Shares | | | Value |
Common Stocks & Other Equity Interests–94.52% |
|
Aerospace & Defense–1.67% |
| | |
General Dynamics Corp. | | | 31,505 | | | $ 5,555,907 |
Raytheon Co. | | | 14,022 | | | 3,081,194 |
| | | | | | | 8,637,101 |
| | |
Air Freight & Logistics–0.97% | | | | | | |
| | |
United Parcel Service, Inc., Class B | | | 42,697 | | | 4,998,111 |
|
Apparel Retail–1.26% |
| | |
TJX Cos., Inc. (The) | | | 106,626 | | | 6,510,584 |
|
Apparel, Accessories & Luxury Goods–0.46% |
| | |
Columbia Sportswear Co. | | | 23,538 | | | 2,358,272 |
|
Asset Management & Custody Banks–0.50% |
| | |
Federated Investors, Inc., Class B | | | 79,197 | | | 2,581,030 |
|
Brewers–2.99% |
| | |
Anheuser-Busch InBev S.A./N.V. (Belgium) | | | 72,237 | | | 5,923,542 |
Heineken N.V. (Netherlands) | | | 88,835 | | | 9,476,163 |
| | | | | | | 15,399,705 |
|
Construction Machinery & Heavy Trucks–0.96% |
| | |
Cummins, Inc. | | | 27,706 | | | 4,958,266 |
|
Consumer Finance–1.27% |
| | |
American Express Co. | | | 52,615 | | | 6,550,041 |
|
Data Processing & Outsourced Services–1.19% |
| | |
Automatic Data Processing, Inc. | | | 35,921 | | | 6,124,530 |
|
Diversified Chemicals–0.72% |
| | |
BASF SE (Germany) | | | 48,846 | | | 3,704,318 |
|
Electric Utilities–11.93% |
| | |
American Electric Power Co., Inc. | | | 78,193 | | | 7,390,020 |
Duke Energy Corp. | | | 66,142 | | | 6,032,812 |
Entergy Corp. | | | 138,574 | | | 16,601,165 |
Exelon Corp. | | | 245,219 | | | 11,179,534 |
PPL Corp. | | | 357,376 | | | 12,822,651 |
SSE PLC (United Kingdom) | | | 391,455 | | | 7,500,250 |
| | | | | | | 61,526,432 |
|
Electrical Components & Equipment–1.90% |
| | |
ABB Ltd. (Switzerland) | | | 289,795 | | | 6,995,908 |
Emerson Electric Co. | | | 36,593 | | | 2,790,582 |
| | | | | | | 9,786,490 |
|
Fertilizers & Agricultural Chemicals–0.51% |
| | |
Nutrien Ltd. (Canada) | | | 54,753 | | | 2,621,381 |
|
Food Distributors–1.27% |
| | |
Sysco Corp. | | | 76,761 | | | 6,566,136 |
| | | | | | |
| | | Shares | | | Value |
General Merchandise Stores–1.55% |
| | |
Target Corp. | | | 62,274 | | | $ 7,984,150 |
|
Household Products–4.92% |
| | |
Kimberly-Clark Corp. | | | 76,127 | | | 10,471,269 |
Procter & Gamble Co. (The) | | | 119,281 | | | 14,898,197 |
| | | | | | | 25,369,466 |
|
Industrial Conglomerates–1.95% |
| | |
3M Co. | | | 19,407 | | | 3,423,783 |
Siemens AG (Germany) | | | 50,767 | | | 6,636,257 |
| | | | | | | 10,060,040 |
|
Industrial Machinery–2.53% |
| | |
Flowserve Corp. | | | 199,122 | | | 9,910,302 |
Pentair PLC | | | 68,862 | | | 3,158,700 |
| | | | | | | 13,069,002 |
|
Integrated Oil & Gas–3.56% |
| | |
Royal Dutch Shell PLC, Class B (United Kingdom) | | | 53,306 | | | 1,588,390 |
Suncor Energy, Inc. (Canada) | | | 202,317 | | | 6,630,943 |
TOTAL S.A. (France) | | | 183,045 | | | 10,115,479 |
| | | | | | | 18,334,812 |
|
Integrated Telecommunication Services–4.28% |
| | |
AT&T, Inc. | | | 346,569 | | | 13,543,916 |
BT Group PLC (United Kingdom) | | | 1,413,193 | | | 3,621,748 |
Deutsche Telekom AG (Germany) | | | 298,723 | | | 4,881,602 |
| | | | | | | 22,047,266 |
|
IT Consulting & Other Services–0.42% |
| | |
International Business Machines Corp. | | | 16,018 | | | 2,147,053 |
|
Motorcycle Manufacturers–1.25% |
| | |
Harley-Davidson, Inc. | | | 173,848 | | | 6,465,407 |
|
Multi-line Insurance–3.22% |
| | |
Hartford Financial Services Group, Inc. (The) | | | 272,803 | | | 16,578,238 |
|
Multi-Utilities–5.69% |
| | |
Consolidated Edison, Inc. | | | 76,725 | | | 6,941,311 |
Dominion Energy, Inc. | | | 148,240 | | | 12,277,237 |
Sempra Energy | | | 66,792 | | | 10,117,652 |
| | | | | | | 29,336,200 |
|
Oil & Gas Equipment & Services–0.82% |
| | |
Baker Hughes Co., Class A | | | 165,403 | | | 4,239,279 |
|
Oil & Gas Exploration & Production–1.49% |
| | |
ConocoPhillips | | | 118,055 | | | 7,677,117 |
|
Packaged Foods & Meats–9.59% |
| | |
Campbell Soup Co. | | | 219,113 | | | 10,828,564 |
Danone S.A. (France) | | | 38,184 | | | 3,169,411 |
See accompanying Notes to Financial Statements which are an integral part of the financial statements.
Invesco V.I. Diversified Dividend Fund
| | | | | | |
| | | Shares | | | Value |
Packaged Foods & Meats–(continued) |
| | |
General Mills, Inc. | | | 289,866 | | | $ 15,525,223 |
Kraft Heinz Co. (The) | | | 109,706 | | | 3,524,854 |
Mondelez International, Inc., Class A | | | 172,453 | | | 9,498,711 |
Nestle S.A. (Switzerland) | | | 63,896 | | | 6,922,272 |
| | | | 49,469,035 |
|
Paper Packaging–2.30% |
| | |
Avery Dennison Corp. | | | 21,247 | | | 2,779,532 |
International Paper Co. | | | 115,671 | | | 5,326,650 |
Sonoco Products Co. | | | 60,982 | | | 3,763,809 |
| | | | 11,869,991 |
|
Personal Products–1.36% |
| | |
L’Oreal S.A. (France) | | | 23,673 | | | 7,030,264 |
| | |
Pharmaceuticals–7.72% | | | | | | |
| | |
Bayer AG (Germany) | | | 98,167 | | | 8,024,169 |
Bristol-Myers Squibb Co. | | | 124,755 | | | 8,008,023 |
Eli Lilly and Co. | | | 66,192 | | | 8,699,615 |
Johnson & Johnson | | | 42,170 | | | 6,151,338 |
Merck & Co., Inc. | | | 97,837 | | | 8,898,275 |
| | | | 39,781,420 |
|
Property & Casualty Insurance–1.63% |
| | |
Travelers Cos., Inc. (The) | | | 61,524 | | | 8,425,712 |
|
Regional Banks–7.58% |
| | |
Comerica, Inc. | | | 42,343 | | | 3,038,110 |
Cullen/Frost Bankers, Inc. | | | 37,397 | | | 3,656,679 |
Fifth Third Bancorp | | | 160,460 | | | 4,932,540 |
KeyCorp | | | 51,330 | | | 1,038,919 |
| | | | | | |
| | | Shares | | | Value |
Regional Banks–(continued) |
| | |
M&T Bank Corp. | | | 63,441 | | | $ 10,769,110 |
PNC Financial Services Group, Inc. (The) | | | 41,465 | | | 6,619,058 |
Zions Bancorporation N.A. | | | 173,905 | | | 9,029,148 |
| | | | 39,083,564 |
|
Restaurants–0.36% |
| | |
Darden Restaurants, Inc. | | | 16,924 | | | 1,844,885 |
|
Soft Drinks–2.66% |
| | |
Coca-Cola Co. (The) | | | 247,858 | | | 13,718,940 |
|
Specialized REITs–1.55% |
| | |
Weyerhaeuser Co. | | | 264,451 | | | 7,986,420 |
| | |
Specialty Chemicals–0.49% | | | | | | |
| | |
DuPont de Nemours, Inc. | | | 39,148 | | | 2,513,302 |
Total Common Stocks & Other Equity Interests
(Cost $359,322,189) | | | 487,353,960 |
|
Money Market Funds–5.40% |
| | |
Invesco Government & Agency Portfolio, Institutional Class, 1.50%(b) | | | 9,736,144 | | | 9,736,144 |
Invesco Liquid Assets Portfolio, Institutional Class, 1.71%(b) | | | 6,982,279 | | | 6,984,374 |
Invesco Treasury Portfolio, Institutional Class, 1.49%(b) | | | 11,127,022 | | | 11,127,022 |
Total Money Market Funds
(Cost $27,846,515) | | | 27,847,540 |
TOTAL INVESTMENTS IN SECURITIES–99.92%
(Cost $387,168,704) | | | 515,201,500 |
OTHER ASSETS LESS LIABILITIES–0.08% | | | 404,705 |
NET ASSETS–100.00% | | | $515,606,205 |
Investment Abbreviations:
REIT – Real Estate Investment Trust
Notes to Schedule of Investments:
| (a) | Industry and/or sector classifications used in this report are generally according to the Global Industry Classification Standard, which was developed by and is the exclusive property and a service mark of MSCI Inc. and Standard & Poor’s. |
| (b) | The money market fund and the Fund are affiliated by having the same investment adviser. The rate shown is the 7-day SEC standardized yield as of December 31, 2019. |
| | | | | | | | | | | | | | |
| Open Forward Foreign Currency Contracts | |
| |
| | | | | | | | | | | Unrealized | |
| Settlement | | | | Contract to | | | Appreciation | |
| | | | | | | | | | |
| Date | | Counterparty | | Deliver | | | Receive | | | (Depreciation) | |
| |
Currency Risk | | | | | | | | | | | | | | |
| |
02/10/2020 | | Citibank N.A. | | | EUR 10,390,219 | | | | USD 11,622,510 | | | $ | (59,751) | |
| |
02/10/2020 | | Royal Bank of Canada | | | EUR 10,170,774 | | | | USD 11,356,841 | | | | (78,685) | |
| |
Total Forward Foreign Currency Contracts | | | | | | | $ | (138,436) | |
| |
Abbreviations:
EUR – Euro
USD – U.S. Dollar
See accompanying Notes to Financial Statements which are an integral part of the financial statements.
Invesco V.I. Diversified Dividend Fund
Statement of Assets and Liabilities
December 31, 2019
| | |
Assets: | | |
| |
Investments in securities, at value (Cost $359,322,189) | | $487,353,960 |
Investments in affiliated money market funds, at value (Cost $27,846,515) | | 27,847,540 |
Cash | | 104,606 |
Foreign currencies, at value (Cost $79,823) | | 80,775 |
Receivable for: | | |
Fund shares sold | | 78,484 |
Dividends | | 992,638 |
Investment for trustee deferred compensation and retirement plans | | 93,920 |
Total assets | | 516,551,923 |
| |
Liabilities: | | |
| |
Other investments: | | |
Unrealized depreciation on forward foreign currency contracts outstanding | | 138,436 |
Payable for: | | |
Fund shares reacquired | | 340,843 |
Accrued fees to affiliates | | 310,478 |
Accrued trustees’ and officers’ fees and benefits | | 282 |
Accrued other operating expenses | | 27,854 |
Trustee deferred compensation and retirement plans | | 127,825 |
Total liabilities | | 945,718 |
Net assets applicable to shares outstanding | | $515,606,205 |
| |
Net assets consist of: | | |
| |
Shares of beneficial interest | | $364,827,071 |
Distributable earnings | | 150,779,134 |
| | | $515,606,205 |
| |
Net Assets: | | |
| |
Series I | | $278,726,539 |
Series II | | $236,879,666 |
|
Shares outstanding, no par value, with an unlimited number of shares authorized: |
| |
Series I | | 10,234,864 |
Series II | | 8,764,940 |
Series I: | | |
Net asset value per share | | $ 27.23 |
Series II: | | |
Net asset value per share | | $ 27.03 |
Statement of Operations
For the year ended December 31, 2019
| | | | |
Investment income: | | | | |
| |
Dividends (net of foreign withholding taxes of $ 370,751) | | $ | 16,143,534 | |
| |
Dividends from affiliated money market funds | | | 669,397 | |
| |
Total investment income | | | 16,812,931 | |
| |
| |
Expenses: | | | | |
| |
Advisory fees | | | 2,525,977 | |
| |
Administrative services fees | | | 772,607 | |
| |
Custodian fees | | | 17,450 | |
| |
Distribution fees - Series II | | | 560,193 | |
| |
Transfer agent fees | | | 32,054 | |
| |
Trustees’ and officers’ fees and benefits | | | 26,037 | |
| |
Reports to shareholders | | | 13,805 | |
| |
Professional services fees | | | 50,822 | |
| |
Other | | | 8,281 | |
| |
Total expenses | | | 4,007,226 | |
| |
Less: Fees waived | | | (35,912 | ) |
| |
Net expenses | | | 3,971,314 | |
| |
Net investment income | | | 12,841,617 | |
| |
| |
Realized and unrealized gain from: | | | | |
| |
Net realized gain from: | | | | |
Investment securities | | | 42,890,400 | |
| |
Foreign currencies | | | 145,728 | |
| |
Forward foreign currency contracts | | | 1,037,565 | |
| |
| | | 44,073,693 | |
| |
Change in net unrealized appreciation of: | | | | |
Investment securities | | | 61,501,707 | |
| |
Foreign currencies | | | 5,978 | |
| |
Forward foreign currency contracts | | | 116,901 | |
| |
| | | 61,624,586 | |
| |
Net realized and unrealized gain | | | 105,698,279 | |
| |
Net increase in net assets resulting from operations | | $ | 118,539,896 | |
| |
See accompanying Notes to Financial Statements which are an integral part of the financial statements.
Invesco V.I. Diversified Dividend Fund
Statement of Changes in Net Assets
For the years ended December 31, 2019 and 2018
| | | | | | | | |
| | | 2019 | | | 2018 | |
| |
Operations: | | | | | | | | |
| | |
Net investment income | | $ | 12,841,617 | | | $ | 14,230,667 | |
| |
Net realized gain | | | 44,073,693 | | | | 25,484,538 | |
| |
Change in net unrealized appreciation (depreciation) | | | 61,624,586 | | | | (85,816,560 | ) |
| |
Net increase (decrease) in net assets resulting from operations | | | 118,539,896 | | | | (46,101,355 | ) |
| |
| | |
Distributions to shareholders from distributable earnings: | | | | | | | | |
| | |
Series I | | | (21,611,367 | ) | | | (22,064,854 | ) |
| |
Series II | | | (18,163,081 | ) | | | (12,822,377 | ) |
| |
Total distributions from distributable earnings | | | (39,774,448 | ) | | | (34,887,231 | ) |
| |
| | |
Share transactions–net: | | | | | | | | |
| | |
Series I | | | (106,614,162 | ) | | | (48,998,234 | ) |
| |
Series II | | | 1,105,297 | | | | (7,380,757 | ) |
| |
Net increase (decrease) in net assets resulting from share transactions | | | (105,508,865 | ) | | | (56,378,991 | ) |
| |
Net increase (decrease) in net assets | | | (26,743,417 | ) | | | (137,367,577 | ) |
| |
| | |
Net assets: | | | | | | | | |
| | |
Beginning of year | | | 542,349,622 | | | | 679,717,199 | |
| |
End of year | | $ | 515,606,205 | | | $ | 542,349,622 | |
| |
See accompanying Notes to Financial Statements which are an integral part of the financial statements.
Invesco V.I. Diversified Dividend Fund
Financial Highlights
The following schedule presents financial highlights for a share of the Fund outstanding throughout the periods indicated.
| | | | | | | | | | | | | | | | | | | | | | | | | | | | | | | | | | | | | | | | | | | | | | | | | | | | | | | | | | | | | | | | | | | | | | |
| | | | | | | | | | | | | | | | | | | | | | | Ratio of | | Ratio of | | | | |
| | | | | | | | | | | | | | | | | | | | | | | expenses | | expenses | | | | |
| | | | | | | Net gains | | | | | | | | | | | | | | | | to average | | to average net | | | | |
| | | | | | | (losses) | | | | | | | | | | | | | | | | net assets | | assets without | | Ratio of net | | |
| | | Net asset | | | | on securities | | | | Dividends | | Distributions | | | | | | | | | | with fee waivers | | fee waivers | | investment | | |
| | | value, | | Net | | (both | | Total from | | from net | | from net | | | | Net asset | | | | Net assets, | | and/or | | and/or | | income | | |
| | | beginning | | investment | | realized and | | investment | | investment | | realized | | Total | | value, end | | Total | | end of period | | expenses | | expenses | | to average | | Portfolio |
| | | of period | | income(a) | | unrealized) | | operations | | income | | gains | | distributions | | of period | | return (b) | | (000’s omitted) | | absorbed | | absorbed | | net assets | | turnover (c) |
Series I | | | | | | | | | | | | | | | | | | | | | | | | | | | | | | | | | | | | | | | | | | | | | | | | | | | | | | | | | | | | | | | | | | | | | | |
Year ended 12/31/19 | | | $ | 23.70 | | | | $ | 0.67 | | | | $ | 5.15 | | | | $ | 5.82 | | | | $ | (0.80 | ) | | | $ | (1.49 | ) | | | $ | (2.29 | ) | | | $ | 27.23 | | | | | 25.09 | % | | | $ | 278,727 | | | | | 0.65 | %(d) | | | | 0.65 | %(d) | | | | 2.54 | %(d) | | | | 7 | % |
Year ended 12/31/18 | | | | 27.18 | | | | | 0.63 | | | | | (2.53 | ) | | | | (1.90 | ) | | | | (0.65 | ) | | | | (0.93 | ) | | | | (1.58 | ) | | | | 23.70 | | | | | (7.57 | ) | | | | 337,461 | | | | | 0.64 | | | | | 0.65 | | | | | 2.38 | | | | | 10 | |
Year ended 12/31/17 | | | | 26.38 | | | | | 0.56 | | | | | 1.65 | | | | | 2.21 | | | | | (0.46 | ) | | | | (0.95 | ) | | | | (1.41 | ) | | | | 27.18 | | | | | 8.58 | | | | | 437,104 | | | | | 0.64 | | | | | 0.65 | | | | | 2.06 | | | | | 16 | |
Year ended 12/31/16 | | | | 23.27 | | | | | 0.50 | | | | | 2.93 | | | | | 3.43 | | | | | (0.32 | ) | | | | – | | | | | (0.32 | ) | | | | 26.38 | | | | | 14.81 | | | | | 439,857 | | | | | 0.66 | | | | | 0.68 | | | | | 2.02 | | | | | 14 | |
Year ended 12/31/15 | | | | 23.21 | | | | | 0.43 | | | | | 0.04 | | | | | 0.47 | | | | | (0.41 | ) | | | | – | | | | | (0.41 | ) | | | | 23.27 | | | | | 2.07 | | | | | 333,573 | | | | | 0.70 | | | | | 0.71 | | | | | 1.84 | | | | | 15 | |
Series II | | | | | | | | | | | | | | | | | | | | | | | | | | | | | | | | | | | | | | | | | | | | | | | | | | | | | | | | | | | | | | | | | | | | | | |
Year ended 12/31/19 | | | | 23.54 | | | | | 0.60 | | | | | 5.11 | | | | | 5.71 | | | | | (0.73 | ) | | | | (1.49 | ) | | | | (2.22 | ) | | | | 27.03 | | | | | 24.77 | | | | | 236,880 | | | | | 0.90 | (d) | | | | 0.90 | (d) | | | | 2.29 | (d) | | | | 7 | |
Year ended 12/31/18 | | | | 27.00 | | | | | 0.56 | | | | | (2.51 | ) | | | | (1.95 | ) | | | | (0.58 | ) | | | | (0.93 | ) | | | | (1.51 | ) | | | | 23.54 | | | | | (7.78 | ) | | | | 204,889 | | | | | 0.89 | | | | | 0.90 | | | | | 2.13 | | | | | 10 | |
Year ended 12/31/17 | | | | 26.23 | | | | | 0.49 | | | | | 1.64 | | | | | 2.13 | | | | | (0.41 | ) | | | | (0.95 | ) | | | | (1.36 | ) | | | | 27.00 | | | | | 8.31 | | | | | 242,614 | | | | | 0.89 | | | | | 0.90 | | | | | 1.81 | | | | | 16 | |
Year ended 12/31/16 | | | | 23.16 | | | | | 0.43 | | | | | 2.92 | | | | | 3.35 | | | | | (0.28 | ) | | | | – | | | | | (0.28 | ) | | | | 26.23 | | | | | 14.54 | | | | | 215,614 | | | | | 0.91 | | | | | 0.93 | | | | | 1.77 | | | | | 14 | |
Year ended 12/31/15 | | | | 23.11 | | | | | 0.37 | | | | | 0.04 | | | | | 0.41 | | | | | (0.36 | ) | | | | – | | | | | (0.36 | ) | | | | 23.16 | | | | | 1.82 | | | | | 132,477 | | | | | 0.95 | | | | | 0.96 | | | | | 1.59 | | | | | 15 | |
| (a) | Calculated using average shares outstanding. |
| (b) | Includes adjustments in accordance with accounting principles generally accepted in the United States of America and as such, the net asset value for financial reporting purposes and the returns based upon those net asset values may differ from the net asset value and returns for shareholder transactions. Total returns are not annualized for periods less than one year, if applicable, and do not reflect charges assessed in connection with a variable product, which if included would reduce total returns. |
| (c) | Portfolio turnover is calculated at the fund level and is not annualized for periods less than one year, if applicable. |
| (d) | Ratios are based on average daily net assets (000’s omitted) of $302,948 and $224,071 for Series I and Series II shares, respectively. |
See accompanying Notes to Financial Statements which are an integral part of the financial statements.
Invesco V.I. Diversified Dividend Fund
Notes to Financial Statements
December 31, 2019
NOTE 1–Significant Accounting Policies
Invesco V.I. Diversified Dividend Fund (the “Fund”) is a series portfolio of AIM Variable Insurance Funds (Invesco Variable Insurance Funds) (the “Trust”). The Trust is a Delaware statutory trust registered under the Investment Company Act of 1940, as amended (the “1940 Act”), as an open-end series management investment company. Information presented in these financial statements pertains only to the Fund. Matters affecting the Fund or each class will be voted on exclusively by the shareholders of the Fund or each class. Current Securities and Exchange Commission (“SEC”) guidance, however, requires participating insurance companies offering separate accounts to vote shares proportionally in accordance with the instructions of the contract owners whose investments are funded by shares of each Fund or class.
The Fund’s investment objective is to provide reasonable current income and long-term growth of income and capital.
The Fund currently offers two classes of shares, Series I and Series II, both of which are offered to insurance company separate accounts funding variable annuity contracts and variable life insurance policies (“variable products”).
The Fund is an investment company and accordingly follows the investment company accounting and reporting guidance in accordance with Financial Accounting Standards Board Accounting Standards Codification Topic 946,Financial Services – Investment Companies.
The following is a summary of the significant accounting policies followed by the Fund in the preparation of its financial statements.
| A. | Security Valuations– Securities, including restricted securities, are valued according to the following policy. |
A security listed or traded on an exchange (except convertible securities) is valued at its last sales price or official closing price as of the close of the customary trading session on the exchange where the security is principally traded, or lacking any sales or official closing price on a particular day, the security may be valued at the closing bid price on that day. Securities traded in the over-the-counter market are valued based on prices furnished by independent pricing services or market makers. When such securities are valued by an independent pricing service they may be considered fair valued. Futures contracts are valued at the final settlement price set by an exchange on which they are principally traded. Listed options are valued at the mean between the last bid and asked prices from the exchange on which they are principally traded. Options not listed on an exchange are valued by an independent source at the mean between the last bid and asked prices. For purposes of determining net asset value (“NAV”) per share, futures and option contracts generally are valued 15 minutes after the close of the customary trading session of the New York Stock Exchange (“NYSE”).
Investments in open-end and closed-end registered investment companies that do not trade on an exchange are valued at the end-of-day net asset value per share. Investments in open-end and closed-end registered investment companies that trade on an exchange are valued at the last sales price or official closing price as of the close of the customary trading session on the exchange where the security is principally traded.
Debt obligations (including convertible securities) and unlisted equities are fair valued using an evaluated quote provided by an independent pricing service. Evaluated quotes provided by the pricing service may be determined without exclusive reliance on quoted prices, and may reflect appropriate factors such as institution-size trading in similar groups of securities, developments related to specific securities, dividend rate (for unlisted equities), yield (for debt obligations), quality, type of issue, coupon rate (for debt obligations), maturity (for debt obligations), individual trading characteristics and other market data. Pricing services generally value debt obligations assuming orderly transactions of institutional round lot size, but a fund may hold or transact in the same securities in smaller, odd lot sizes. Odd lots often trade at lower prices than institutional round lots. Debt obligations are subject to interest rate and credit risks. In addition, all debt obligations involve some risk of default with respect to interest and/or principal payments.
Foreign securities’ (including foreign exchange contracts) prices are converted into U.S. dollar amounts using the applicable exchange rates as of the close of the NYSE. If market quotations are available and reliable for foreign exchange-traded equity securities, the securities will be valued at the market quotations. Because trading hours for certain foreign securities end before the close of the NYSE, closing market quotations may become unreliable. If between the time trading ends on a particular security and the close of the customary trading session on the NYSE, events occur that the investment adviser determines are significant and make the closing price unreliable, the Fund may fair value the security. If the event is likely to have affected the closing price of the security, the security will be valued at fair value in good faith using procedures approved by the Board of Trustees. Adjustments to closing prices to reflect fair value may also be based on a screening process of an independent pricing service to indicate the degree of certainty, based on historical data, that the closing price in the principal market where a foreign security trades is not the current value as of the close of the NYSE. Foreign securities’ prices meeting the approved degree of certainty that the price is not reflective of current value will be priced at the indication of fair value from the independent pricing service. Multiple factors may be considered by the independent pricing service in determining adjustments to reflect fair value and may include information relating to sector indices, American Depositary Receipts and domestic and foreign index futures. Foreign securities may have additional risks including exchange rate changes, potential for sharply devalued currencies and high inflation, political and economic upheaval, the relative lack of issuer information, relatively low market liquidity and the potential lack of strict financial and accounting controls and standards.
Securities for which market prices are not provided by any of the above methods may be valued based upon quotes furnished by independent sources. The last bid price may be used to value equity securities. The mean between the last bid and asked prices is used to value debt obligations, including corporate loans.
Securities for which market quotations are not readily available or became unreliable are valued at fair value as determined in good faith by or under the supervision of the Trust’s officers following procedures approved by the Board of Trustees. Issuer specific events, market trends, bid/asked quotes of brokers and information providers and other market data may be reviewed in the course of making a good faith determination of a security’s fair value.
The Fund may invest in securities that are subject to interest rate risk, meaning the risk that the prices will generally fall as interest rates rise and, conversely, the prices will generally rise as interest rates fall. Specific securities differ in their sensitivity to changes in interest rates depending on their individual characteristics. Changes in interest rates may result in increased market volatility, which may affect the value and/or liquidity of certain Fund investments.
Invesco V.I. Diversified Dividend Fund
Valuations change in response to many factors including the historical and prospective earnings of the issuer, the value of the issuer’s assets, general economic conditions, interest rates, investor perceptions and market liquidity. Because of the inherent uncertainties of valuation, the values reflected in the financial statements may materially differ from the value received upon actual sale of those investments.
| B. | Securities Transactions and Investment Income– Securities transactions are accounted for on a trade date basis. Realized gains or losses on sales are computed on the basis of specific identification of the securities sold. Interest income (net of withholding tax, if any) is recorded on the accrual basis from settlement date. Dividend income (net of withholding tax, if any) is recorded on the ex-dividend date. |
The Fund may periodically participate in litigation related to Fund investments. As such, the Fund may receive proceeds from litigation settlements. Any proceeds received are included in the Statement of Operations as realized gain (loss) for investments no longer held and as unrealized gain (loss) for investments still held.
Brokerage commissions and mark ups are considered transaction costs and are recorded as an increase to the cost basis of securities purchased and/or a reduction of proceeds on a sale of securities. Such transaction costs are included in the determination of net realized and unrealized gain (loss) from investment securities reported in the Statement of Operations and the Statement of Changes in Net Assets and the net realized and unrealized gains (losses) on securities per share in the Financial Highlights. Transaction costs are included in the calculation of the Fund’s net asset value and, accordingly, they reduce the Fund’s total returns. These transaction costs are not considered operating expenses and are not reflected in net investment income reported in the Statement of Operations and the Statement of Changes in Net Assets, or the net investment income per share and the ratios of expenses and net investment income reported in the Financial Highlights, nor are they limited by any expense limitation arrangements between the Fund and the investment adviser.
The Fund allocates income and realized and unrealized capital gains and losses to a class based on the relative net assets of each class.
| C. | Country Determination– For the purposes of making investment selection decisions and presentation in the Schedule of Investments, the investment adviser may determine the country in which an issuer is located and/or credit risk exposure based on various factors. These factors include the laws of the country under which the issuer is organized, where the issuer maintains a principal office, the country in which the issuer derives 50% or more of its total revenues and the country that has the primary market for the issuer’s securities, as well as other criteria. Among the other criteria that may be evaluated for making this determination are the country in which the issuer maintains 50% or more of its assets, the type of security, financial guarantees and enhancements, the nature of the collateral and the sponsor organization. Country of issuer and/or credit risk exposure has been determined to be the United States of America, unless otherwise noted. |
| D. | Distributions– Distributions from net investment income and net realized capital gain, if any, are generally declared and paid to separate accounts of participating insurance companies annually and recorded on the ex-dividend date. |
| E. | Federal Income Taxes– The Fund intends to comply with the requirements of Subchapter M of the Internal Revenue Code of 1986, as amended (the “Internal Revenue Code”), necessary to qualify as a regulated investment company and to distribute substantially all of the Fund’s taxable earnings to shareholders. As such, the Fund will not be subject to federal income taxes on otherwise taxable income (including net realized capital gain) that is distributed to shareholders. Therefore, no provision for federal income taxes is recorded in the financial statements. |
The Fund recognizes the tax benefits of uncertain tax positions only when the position is more likely than not to be sustained. Management has analyzed the Fund’s uncertain tax positions and concluded that no liability for unrecognized tax benefits should be recorded related to uncertain tax positions. Management is not aware of any tax positions for which it is reasonably possible that the total amounts of unrecognized tax benefits will change materially in the next 12 months.
The Fund files tax returns in the U.S. Federal jurisdiction and certain other jurisdictions. Generally, the Fund is subject to examinations by such taxing authorities for up to three years after the filing of the return for the tax period.
| F. | Expenses– Fees provided for under the Rule 12b-1 plan of a particular class of the Fund and which are directly attributable to that class are charged to the operations of such class. All other expenses are allocated among the classes based on relative net assets. |
| G. | Accounting Estimates– The preparation of financial statements in conformity with accounting principles generally accepted in the United States of America (“GAAP”) requires management to make estimates and assumptions that affect the reported amounts of assets and liabilities at the date of the financial statements and the reported amounts of revenues and expenses during the reporting period including estimates and assumptions related to taxation. Actual results could differ from those estimates by a significant amount. In addition, the Fund monitors for material events or transactions that may occur or become known after the period-end date and before the date the financial statements are released to print. |
| H. | Indemnifications– Under the Trust’s organizational documents, each Trustee, officer, employee or other agent of the Trust is indemnified against certain liabilities that may arise out of the performance of their duties to the Fund. Additionally, in the normal course of business, the Fund enters into contracts, including the Fund’s servicing agreements, that contain a variety of indemnification clauses. The Fund’s maximum exposure under these arrangements is unknown as this would involve future claims that may be made against the Fund that have not yet occurred. The risk of material loss as a result of such indemnification claims is considered remote. |
| I. | Foreign Currency Translations– Foreign currency is valued at the close of the NYSE based on quotations posted by banks and major currency dealers. Portfolio securities and other assets and liabilities denominated in foreign currencies are translated into U.S. dollar amounts at the date of valuation. Purchases and sales of portfolio securities (net of foreign taxes withheld on disposition) and income items denominated in foreign currencies are translated into U.S. dollar amounts on the respective dates of such transactions. The Fund does not separately account for the portion of the results of operations resulting from changes in foreign exchange rates on investments and the fluctuations arising from changes in market prices of securities held. The combined results of changes in foreign exchange rates and the fluctuation of market prices on investments (net of estimated foreign tax withholding) are included with the net realized and unrealized gain or loss from investments in the Statement of Operations. Reported net realized foreign currency gains or losses arise from (1) sales of foreign currencies, (2) currency gains or losses realized between the trade and settlement dates on securities transactions, and (3) the difference between the amounts of dividends, interest, and foreign withholding taxes recorded on the Fund’s books and the U.S. dollar equivalent of the amounts actually received or paid. Net unrealized foreign currency gains and losses arise from changes in the fair values of assets and liabilities, other than investments in securities at fiscal period end, resulting from changes in exchange rates. |
The Fund may invest in foreign securities, which may be subject to foreign taxes on income, gains on investments or currency repatriation, a portion of which may be recoverable. Foreign taxes, if any, are recorded based on the tax regulations and rates that exist in the foreign markets in which the Fund invests and are shown in the Statement of Operations.
Invesco V.I. Diversified Dividend Fund
| J. | Forward Foreign Currency Contracts– The Fund may engage in foreign currency transactions either on a spot (i.e. for prompt delivery and settlement) basis, or through forward foreign currency contracts, to manage or minimize currency or exchange rate risk. |
The Fund may also enter into forward foreign currency contracts for the purchase or sale of a security denominated in a foreign currency in order to “lock in” the U.S. dollar price of that security, or the Fund may also enter into forward foreign currency contracts that do not provide for physical settlement of the two currencies, but instead are settled by a single cash payment calculated as the difference between the agreed upon exchange rate and the spot rate at settlement based upon an agreed upon notional amount (non-deliverable forwards). The Fund will set aside liquid assets in an amount equal to the daily mark-to-market obligation for forward foreign currency contracts.
A forward foreign currency contract is an obligation between two parties (“Counterparties”) to purchase or sell a specific currency for an agreed-upon price at a future date. The use of forward foreign currency contracts does not eliminate fluctuations in the price of the underlying securities the Fund owns or intends to acquire but establishes a rate of exchange in advance. Fluctuations in the value of these contracts are measured by the difference in the contract date and reporting date exchange rates and are recorded as unrealized appreciation (depreciation) until the contracts are closed. When the contracts are closed, realized gains (losses) are recorded. Realized and unrealized gains (losses) on the contracts are included in the Statement of Operations. The primary risks associated with forward foreign currency contracts include failure of the Counterparty to meet the terms of the contract and the value of the foreign currency changing unfavorably. These risks may be in excess of the amounts reflected in the Statement of Assets and Liabilities.
NOTE 2–Advisory Fees and Other Fees Paid to Affiliates
The Trust has entered into a master investment advisory agreement with Invesco Advisers, Inc. (the “Adviser” or “Invesco”). Under the terms of the investment advisory agreement, the Fund accrues daily and pays monthly an advisory fee to the Adviser based on the annual rate of the Fund’s average daily net assets as follows:
| | | | |
| Average Daily Net Assets | | Rate | |
| |
First $ 250 million | | | 0.545% | |
| |
Next $750 million | | | 0.420% | |
| |
Next $1 billion | | | 0.395% | |
| |
Over $2 billion | | | 0.370% | |
| |
For the year ended December 31, 2019, the effective advisory fee rate incurred by the Fund was 0.48%.
Under the terms of a master sub-advisory agreement between the Adviser and each of Invesco Asset Management Deutschland GmbH, Invesco Asset Management Limited, Invesco Asset Management (Japan) Limited, Invesco Hong Kong Limited, Invesco Senior Secured Management, Inc. and Invesco Canada Ltd. and separate sub-advisory agreements with Invesco Capital Management LLC and Invesco Asset Management (India) Private Limited (collectively, the “Affiliated Sub-Advisers”) the Adviser, not the Fund, will pay 40% of the fees paid to the Adviser to any such Affiliated Sub-Adviser(s) that provide(s) discretionary investment management services to the Fund based on the percentage of assets allocated to such Affiliated Sub-Adviser(s).
The Adviser has contractually agreed, through at least June 30, 2020, to waive advisory fees and/or reimburse expenses of all shares to the extent necessary to limit total annual fund operating expenses after fee waiver and/or expense reimbursement (excluding certain items discussed below) of Series I shares to 2.00% and Series II shares to 2.25% of average daily net assets (the “expense limits”). In determining the Adviser’s obligation to waive advisory fees and/or reimburse expenses, the following expenses are not taken into account, and could cause the total annual fund operating expenses after fee waiver and/or expense reimbursement to exceed the numbers reflected above: (1) interest; (2) taxes; (3) dividend expense on short sales; (4) extraordinary or non-routine items, including litigation expenses; and (5) expenses that the Fund has incurred but did not actually pay because of an expense offset arrangement. Unless Invesco continues the fee waiver agreement, it will terminate on June 30, 2020. During its term, the fee waiver agreement cannot be terminated or amended to increase the expense limits or reduce the advisory fee waiver without approval of the Board of Trustees. The Adviser did not waive fees and/or reimburse expenses during the period under these expense limits.
Further, the Adviser has contractually agreed, through at least June 30, 2021, to waive the advisory fee payable by the Fund in an amount equal to 100% of the net advisory fees the Adviser receives from the affiliated money market funds on investments by the Fund of uninvested cash in such affiliated money market funds.
For the year ended December 31, 2019, the Adviser waived advisory fees of $35,912.
The Trust has entered into a master administrative services agreement with Invesco pursuant to which the Fund has agreed to pay Invesco a fee for costs incurred in providing accounting services and fund administrative services to the Fund and to reimburse Invesco for fees paid to insurance companies that have agreed to provide certain administrative services to the Fund. These administrative services provided by the insurance companies may include, among other things: maintenance of master accounts with the Fund; tracking, recording and transmitting net purchase and redemption orders for Fund shares; maintaining and preserving records related to the purchase, redemption and other account activity of variable product owners; distributing copies of Fund documents such as prospectuses, proxy materials and periodic reports, to variable product owners, and responding to inquiries from variable product owners about the Fund. Pursuant to such agreement, for the year ended December 31, 2019, Invesco was paid $75,571 for accounting and fund administrative services and was reimbursed $697,036 for fees paid to insurance companies. Invesco has entered into a sub-administration agreement whereby State Street Bank and Trust Company (“SSB”) serves as fund accountant and provides certain administrative services to the Fund. Pursuant to a custody agreement with the Trust on behalf of the Fund, SSB also serves as the Fund’s custodian.
The Trust has entered into a transfer agency and service agreement with Invesco Investment Services, Inc. (“IIS”) pursuant to which the Fund has agreed to pay IIS a fee for providing transfer agency and shareholder services to the Fund and reimburse IIS for certain expenses incurred by IIS in the course of providing such services. For the year ended December 31, 2019, expenses incurred under the agreement are shown in the Statement of Operations asTransfer agent fees.
The Trust has entered into a master distribution agreement with Invesco Distributors, Inc. (“IDI”) to serve as the distributor for the Fund. The Trust has adopted a plan pursuant to Rule 12b-1 under the 1940 Act with respect to the Fund’s Series II shares (the “Plan”). The Fund, pursuant to the Plan, pays IDI compensation at the annual rate of 0.25% of the Fund’s average daily net assets of Series II shares. The fees are accrued daily and paid monthly. Of the Plan payments, up to 0.25% of the average daily net assets of the Series II shares may be paid to insurance companies who furnish
Invesco V.I. Diversified Dividend Fund
continuing personal shareholder services to customers who purchase and own Series II shares of the Fund. For the year ended December 31, 2019, expenses incurred under the Plan are detailed in the Statement of Operations asDistribution fees.
For the year ended December 31, 2019, the Fund incurred $1,068 in brokerage commissions with Invesco Capital Markets, Inc., an affiliate of the Adviser and IDI, for portfolio transactions executed on behalf of the Fund.
Certain officers and trustees of the Trust are officers and directors of the Adviser, IIS and/or IDI.
NOTE 3–Additional Valuation Information
GAAP defines fair value as the price that would be received to sell an asset or paid to transfer a liability in an orderly transaction between market participants at the measurement date, under current market conditions. GAAP establishes a hierarchy that prioritizes the inputs to valuation methods, giving the highest priority to readily available unadjusted quoted prices in an active market for identical assets (Level 1) and the lowest priority to significant unobservable inputs (Level 3), generally when market prices are not readily available or are unreliable. Based on the valuation inputs, the securities or other investments are tiered into one of three levels. Changes in valuation methods may result in transfers in or out of an investment’s assigned level:
| | Level 1 - | Prices are determined using quoted prices in an active market for identical assets. |
| | Level 2 - | Prices are determined using other significant observable inputs. Observable inputs are inputs that other market participants may use in pricing a security. These may include quoted prices for similar securities, interest rates, prepayment speeds, credit risk, yield curves, loss severities, default rates, discount rates, volatilities and others. |
| | Level 3 - | Prices are determined using significant unobservable inputs. In situations where quoted prices or observable inputs are unavailable (for example, when there is little or no market activity for an investment at the end of the period), unobservable inputs may be used. Unobservable inputs reflect the Fund’s own assumptions about the factors market participants would use in determining fair value of the securities or instruments and would be based on the best available information. |
The following is a summary of the tiered valuation input levels, as of December 31, 2019. The level assigned to the securities valuations may not be an indication of the risk or liquidity associated with investing in those securities. Because of the inherent uncertainties of valuation, the values reflected in the financial statements may materially differ from the value received upon actual sale of those investments.
| | | | | | | | | | | | | | | | |
| | | Level 1 | | | Level 2 | | | Level 3 | | | Total | |
| |
Investments in Securities | | | | | | | | | | | | | | | | |
| |
Common Stocks & Other Equity Interests | | $ | 401,764,187 | | | $ | 85,589,773 | | | | $– | | | $ | 487,353,960 | |
| |
Money Market Funds | | | 27,847,540 | | | | – | | | | – | | | | 27,847,540 | |
| |
Total Investments in Securities | | | 429,611,727 | | | | 85,589,773 | | | | – | | | | 515,201,500 | |
| |
Other Investments - Liabilities* | | | | | | | | | | | | | | | | |
| |
Forward Foreign Currency Contracts | | | – | | | | (138,436 | ) | | | – | | | | (138,436 | ) |
| |
Total Investments | | $ | 429,611,727 | | | $ | 85,451,337 | | | | $– | | | $ | 515,063,064 | |
| |
| * | Unrealized appreciation (depreciation). |
NOTE 4–Derivative Investments
The Fund may enter into an International Swaps and Derivatives Association Master Agreement (“ISDA Master Agreement”) under which a fund may trade OTC derivatives. An OTC transaction entered into under an ISDA Master Agreement typically involves a collateral posting arrangement, payment netting provisions and close-out netting provisions. These netting provisions allow for reduction of credit risk through netting of contractual obligations. The enforceability of the netting provisions of the ISDA Master Agreement depends on the governing law of the ISDA Master Agreement, among other factors.
For financial reporting purposes, the Fund does not offset OTC derivative assets or liabilities that are subject to ISDA Master Agreements in the Statement of Assets and Liabilities.
Value of Derivative Investments at Period-End
The table below summarizes the value of the Fund’s derivative investments, detailed by primary risk exposure, held as of December 31, 2019:
| | | | |
| | | Value | |
| | | Currency | |
| Derivative Liabilities | | Risk | |
| |
Unrealized depreciation on forward foreign currency contracts outstanding | | $ | (138,436 | ) |
| |
Derivatives not subject to master netting agreements | | | – | |
| |
Total Derivative Liabilities subject to master netting agreements | | $ | (138,436 | ) |
| |
Invesco V.I. Diversified Dividend Fund
Offsetting Assets and Liabilities
The table below reflects the Fund’s exposure to Counterparties subject to either an ISDA Master Agreement or other agreement for OTC derivative transactions as of December 31, 2019.
| | | | | | | | | | | | | | | | |
| | | Financial
Derivative
Liabilities | | | | | | Collateral
(Received)/Pledged | | | |
| Counterparty | | Forward Foreign
Currency Contracts | | | Net Value of
Derivatives | | | Non-Cash | | Cash | | Net
Amount | |
| |
Citibank N.A. | | | $ (59,751) | | | $ | (59,751 | ) | | $- | | $- | | $ | (59,751 | ) |
| |
Royal Bank of Canada | | | (78,685) | | | | (78,685 | ) | | - | | - | | | (78,685 | ) |
| |
Total | | | $(138,436) | | | $ | (138,436 | ) | | $- | | $- | | $ | (138,436 | ) |
| |
Effect of Derivative Investments for the year ended December 31, 2019
The table below summarizes the gains (losses) on derivative investments, detailed by primary risk exposure, recognized in earnings during the period:
| | | | |
| | | Location of Gain on
Statement of Operations | |
| | | Currency Risk | |
| |
Realized Gain: | | | | |
Forward foreign currency contracts | | | $1,037,565 | |
| |
Change in Net Unrealized Appreciation: | | | | |
Forward foreign currency contracts | | | 116,901 | |
| |
Total | | | $1,154,466 | |
| |
The table below summarizes the average notional value of derivatives held during the period.
| | | | |
| | | Forward
Foreign Currency
Contracts | |
| |
Average notional value | | | $24,169,771 | |
| |
NOTE 5–Trustees’ and Officers’ Fees and Benefits
Trustees’ and Officers’ Fees and Benefits include amounts accrued by the Fund to pay remuneration to certain Trustees and Officers of the Fund. Trustees have the option to defer compensation payable by the Fund, andTrustees’ and Officers’ Fees and Benefits also include amounts accrued by the Fund to fund such deferred compensation amounts. Those Trustees who defer compensation have the option to select various Invesco Funds in which their deferral accounts shall be deemed to be invested. Finally, certain current Trustees were eligible to participate in a retirement plan that provided for benefits to be paid upon retirement to Trustees over a period of time based on the number of years of service. The Fund may have certain former Trustees who also participate in a retirement plan and receive benefits under such plan.Trustees’ and Officers’ Fees and Benefits include amounts accrued by the Fund to fund such retirement benefits. Obligations under the deferred compensation and retirement plans represent unsecured claims against the general assets of the Fund.
NOTE 6–Cash Balances
The Fund is permitted to temporarily carry a negative or overdrawn balance in its account with SSB, the custodian bank. Such balances, if any at period-end, are shown in the Statement of Assets and Liabilities under the payable captionAmount due custodian. To compensate the custodian bank for such overdrafts, the overdrawn Fund may either (1) leave funds as a compensating balance in the account so the custodian bank can be compensated by earning the additional interest; or (2) compensate by paying the custodian bank at a rate agreed upon by the custodian bank and Invesco, not to exceed the contractually agreed upon rate.
NOTE 7–Distributions to Shareholders and Tax Components of Net Assets
Tax Character of Distributions to Shareholders Paid During the Fiscal Years Ended December 31, 2019 and 2018:
| | | | | | | | |
| | | 2019 | | | 2018 | |
| |
Ordinary income | | $ | 14,393,388 | | | $ | 13,981,690 | |
| |
Long-term capital gain | | | 25,381,060 | | | | 20,905,541 | |
| |
Total distributions | | $ | 39,774,448 | | | $ | 34,887,231 | |
| |
Invesco V.I. Diversified Dividend Fund
Tax Components of Net Assets at Period-End:
| | | | |
| | | 2019 | |
| |
Undistributed ordinary income | | $ | 13,280,241 | |
| |
Undistributed long-term capital gain | | | 10,268,349 | |
| |
Net unrealized appreciation – investments | | | 127,328,128 | |
| |
Net unrealized appreciation - foreign currencies | | | 5,941 | |
| |
Temporary book/tax differences | | | (103,525 | ) |
| |
Shares of beneficial interest | | | 364,827,071 | |
| |
Total net assets | | $ | 515,606,205 | |
| |
The difference between book-basis and tax-basis unrealized appreciation (depreciation) is due to differences in the timing of recognition of gains and losses on investments for tax and book purposes. The Fund’s net unrealized appreciation (depreciation) difference is attributable primarily to wash sales and forward foreign currency contracts.
The temporary book/tax differences are a result of timing differences between book and tax recognition of income and/or expenses. The Fund’s temporary book/tax differences are the result of the trustee deferral of compensation and retirement plan benefits.
Capital loss carryforward is calculated and reported as of a specific date. Results of transactions and other activity after that date may affect the amount of capital loss carryforward actually available for the Fund to utilize. Capital losses generated in years beginning after December 22, 2010 can be carried forward for an unlimited period, whereas previous losses expire in eight tax years. Capital losses with an expiration period may not be used to offset capital gains until all net capital losses without an expiration date have been utilized. Capital loss carryforwards with no expiration date will retain their character as either short-term or long-term capital losses instead of as short-term capital losses as under prior law. The ability to utilize capital loss carryforwards in the future may be limited under the Internal Revenue Code and related regulations based on the results of future transactions.
The Fund does not have a capital loss carryforward as of December 31, 2019.
During the year ended December 31, 2019, 3,660,162 Series I shares of the Fund valued at $97,177,295 were redeemed by significant shareholders and settled through a redemption-in-kind transaction, of which $6,188,994 consisted of cash, which resulted in a realized gain of $32,253,903 to the Fund for book purposes. From a federal income tax perspective, the realized gains are not recognized.
NOTE 8–Investment Transactions
The aggregate amount of investment securities (other than short-term securities, U.S. Treasury obligations and money market funds, if any) purchased and sold by the Fund during the year ended December 31, 2019 was $34,291,283 and $65,778,002, respectively. Cost of investments, including any derivatives, on a tax basis includes the adjustments for financial reporting purposes as of the most recently completed federal income tax reporting period-end.
Unrealized Appreciation (Depreciation) of Investments on a Tax Basis
| | | | |
| |
Aggregate unrealized appreciation of investments | | $ | 138,431,348 | |
| |
Aggregate unrealized (depreciation) of investments | | | (11,103,220 | ) |
| |
Net unrealized appreciation of investments | | $ | 127,328,128 | |
| |
Cost of investments for tax purposes is $387,734,936.
NOTE 9–Reclassification of Permanent Differences
Primarily as a result of differing book/tax treatment of redemption-in-kind, on December 31, 2019, undistributed net investment income was decreased by $234,873, undistributed net realized gain was decreased by $31,895,665 and shares of beneficial interest was increased by $32,130,538. This reclassification had no effect on the net assets of the Fund.
NOTE 10–Share Information
| | | | | | | | | | | | | | | | |
| | | Summary of Share Activity | |
| |
| | | Year ended | | | Year ended | |
| | | December 31, 2019(a) | | | December 31, 2018 | |
| | | | | | | | |
| | | Shares | | | Amount | | | Shares | | | Amount | |
| |
Sold: | | | | | | | | | | | | | | | | |
Series I | | | 1,203,566 | | | $ | 31,545,134 | | | | 1,113,850 | | | $ | 29,225,680 | |
| |
Series II | | | 533,931 | | | | 13,948,354 | | | | 628,883 | | | | 16,528,837 | |
| |
| | | | |
Issued as reinvestment of dividends: | | | | | | | | | | | | | | | | |
Series I | | | 837,001 | | | | 21,611,367 | | | | 836,424 | | | | 22,064,855 | |
| |
Series II | | | 708,388 | | | | 18,163,081 | | | | 489,217 | | | | 12,822,377 | |
| |
Invesco V.I. Diversified Dividend Fund
| | | | | | | | | | | | | | | | |
| | | Summary of Share Activity | |
| |
| | | Year ended | | | Year ended | |
| | | December 31, 2019(a) | | | December 31, 2018 | |
| | | | | | | | |
| | | Shares | | | Amount | | | Shares | | | Amount | |
| |
| | | | |
Reacquired: | | | | | | | | | | | | | | | | |
Series I | | | (6,041,667 | ) | | $ | (159,770,663 | ) | | | (3,794,255 | ) | | $ | (100,288,769 | ) |
| |
Series II | | | (1,181,712 | ) | | | (31,006,138 | ) | | | (1,398,007 | ) | | | (36,731,971 | ) |
| |
Net increase (decrease) in share activity | | | (3,940,493 | ) | | $ | (105,508,865 | ) | | | (2,123,888 | ) | | $ | (56,378,991 | ) |
| |
| (a) | There are entities that are record owners of more than 5% of the outstanding shares of the Fund and in the aggregate own 61% of the outstanding shares of the Fund. The Fund and the Fund’s principal underwriter or adviser, are parties to participation agreements with these entities whereby these entities sell units of interest in separate accounts funding variable products that are invested in the Fund. The Fund, Invesco and/or Invesco affiliates may make payments to these entities, which are considered to be related to the Fund, for providing services to the Fund, Invesco and/or Invesco affiliates including but not limited to services such as, securities brokerage, third party record keeping and account servicing and administrative services. The Fund has no knowledge as to whether all or any portion of the shares owned of record by these entities are also owned beneficially. |
Invesco V.I. Diversified Dividend Fund
Report of Independent Registered Public Accounting Firm
To the Board of Trustees of AIM Variable Insurance Funds (Invesco Variable Insurance Funds) and Shareholders of Invesco V.I. Diversified Dividend Fund
Opinion on the Financial Statements
We have audited the accompanying statement of assets and liabilities, including the schedule of investments, of Invesco V.I. Diversified Dividend Fund (one of the funds constituting AIM Variable Insurance Funds (Invesco Variable Insurance Funds), referred to hereafter as the “Fund”) as of December 31, 2019, the related statement of operations for the year ended December 31, 2019, the statement of changes in net assets for each of the two years in the period ended December 31, 2019, including the related notes, and the financial highlights for each of the five years in the period ended December 31, 2019 (collectively referred to as the “financial statements”). In our opinion, the financial statements present fairly, in all material respects, the financial position of the Fund as of December 31, 2019, the results of its operations for the year then ended, the changes in its net assets for each of the two years in the period ended December 31, 2019 and the financial highlights for each of the five years in the period ended December 31, 2019 in conformity with accounting principles generally accepted in the United States of America.
Basis for Opinion
These financial statements are the responsibility of the Fund’s management. Our responsibility is to express an opinion on the Fund’s financial statements based on our audits. We are a public accounting firm registered with the Public Company Accounting Oversight Board (United States) (PCAOB) and are required to be independent with respect to the Fund in accordance with the U.S. federal securities laws and the applicable rules and regulations of the Securities and Exchange Commission and the PCAOB.
We conducted our audits of these financial statements in accordance with the standards of the PCAOB. Those standards require that we plan and perform the audit to obtain reasonable assurance about whether the financial statements are free of material misstatement, whether due to error or fraud.
Our audits included performing procedures to assess the risks of material misstatement of the financial statements, whether due to error or fraud, and performing procedures that respond to those risks. Such procedures included examining, on a test basis, evidence regarding the amounts and disclosures in the financial statements. Our audits also included evaluating the accounting principles used and significant estimates made by management, as well as evaluating the overall presentation of the financial statements. Our procedures included confirmation of securities owned as of December 31, 2019 by correspondence with the custodian, transfer agent and brokers; when replies were not received from brokers, we performed other auditing procedures. We believe that our audits provide a reasonable basis for our opinion.
/s/PricewaterhouseCoopers LLP
Houston, Texas
February 18, 2020
We have served as the auditor of one or more of the investment companies in the Invesco group of investment companies since at least 1995. We have not been able to determine the specific year we began serving as auditor.
Invesco V.I. Diversified Dividend Fund
Calculating your ongoing Fund expenses
Example
As a shareholder of the Fund, you incur ongoing costs, including management fees; distribution and/or service fees (12b-1); and other Fund expenses. This example is intended to help you understand your ongoing costs (in dollars) of investing in the Fund and to compare these costs with ongoing costs of investing in other mutual funds. The example is based on an investment of $1,000 invested at the beginning of the period and held for the entire period July 1, 2019 through December 31, 2019.
The actual and hypothetical expenses in the examples below do not represent the effect of any fees or other expenses assessed in connection with a variable product; if they did, the expenses shown would be higher while the ending account values shown would be lower.
Actual expenses
The table below provides information about actual account values and actual expenses. You may use the information in this table, together with the amount you invested, to estimate the expenses that you paid over the period. Simply divide your account value by $1,000 (for example, an $8,600 account value divided by $1,000 = 8.6), then multiply the result by the number in the table under the heading entitled “Actual Expenses Paid During Period” to estimate the expenses you paid on your account during this period.
Hypothetical example for comparison purposes
The table below also provides information about hypothetical account values and hypothetical expenses based on the Fund’s actual expense ratio and an assumed rate of return of 5% per year before expenses, which is not the Fund’s actual return.
The hypothetical account values and expenses may not be used to estimate the actual ending account balance or expenses you paid for the period. You may use this information to compare the ongoing costs of investing in the Fund and other funds. To do so, compare this 5% hypothetical example with the 5% hypothetical examples that appear in the shareholder reports of the other funds.
Please note that the expenses shown in the table are meant to highlight your ongoing costs. Therefore, the hypothetical information is useful in comparing ongoing costs, and will not help you determine the relative total costs of owning different funds.
| | | | | | | | | | | | |
| | | Beginning
Account Value
(07/01/19) | | ACTUAL | | HYPOTHETICAL
(5% annual return before expenses) | | Annualized
Expense
Ratio |
| | Ending
Account Value
(12/31/19)1 | | Expenses
Paid During
Period2 | | Ending
Account Value
(12/31/19) | | Expenses
Paid During
Period2 |
Series I | | $1,000.00 | | $1,085.60 | | $3.42 | | $1,021.93 | | $3.31 | | 0.65% |
Series II | | 1,000.00 | | 1,084.60 | | 4.73 | | 1,020.67 | | 4.58 | | 0.90 |
| 1 | The actual ending account value is based on the actual total return of the Fund for the period July 1, 2019 through December 31, 2019, after actual expenses and will differ from the hypothetical ending account value which is based on the Fund’s expense ratio and a hypothetical annual return of 5% before expenses. |
| 2 | Expenses are equal to the Fund’s annualized expense ratio as indicated above multiplied by the average account value over the period, multiplied by 184/365 to reflect the most recent fiscal half year. |
Invesco V.I. Diversified Dividend Fund
Tax Information
Form 1099-DIV, Form 1042-S and other year–end tax information provide shareholders with actual calendar year amounts that should be included in their tax returns. Shareholders should consult their tax advisers.
The following distribution information is being provided as required by the Internal Revenue Code or to meet a specific state’s requirement.
The Fund designates the following amounts or, if subsequently determined to be different, the maximum amount allowable for its fiscal year ended December 31, 2019:
| | | | | | |
| | Federal and State Income Tax | | | | |
| | Long-Term Capital Gain Distributions | | $ | 25,381,060 | |
| | Corporate Dividends Received Deduction* | | | 93.73 | % |
| | U.S. Treasury Obligations* | | | 0.00 | % |
* The above percentages are based on ordinary income dividends paid to shareholders during the Fund’s fiscal year.
Invesco V.I. Diversified Dividend Fund
Trustees and Officers
The address of each trustee and officer is AIM Variable Insurance Funds (Invesco Variable Insurance Funds) (the “Trust”), 11 Greenway Plaza, Suite 1000, Houston, Texas 77046-1173. The trustees serve for the life of the Trust, subject to their earlier death, incapacitation, resignation, retirement or removal as more specifically provided in the Trust’s organizational documents. Each officer serves for a one year term or until their successors are elected and qualified. Column two below includes length of time served with predecessor entities, if any.
| | | | | | | | |
Name, Year of Birth and Position(s) Held with the Trust | | Trustee and/or Officer Since | | Principal Occupation(s) During Past 5 Years | | Number of
Funds in
Fund Complex
Overseen by
Trustee | | Other Directorship(s) Held by Trustee
During Past 5 Years |
| Interested Person |
Martin L. Flanagan1- 1960 Trustee and Vice Chair | | 2007 | | Executive Director, Chief Executive Officer and President, Invesco Ltd. (ultimate parent of Invesco and a global investment management firm); Trustee and Vice Chair, The Invesco Funds; Vice Chair, Investment Company Institute; and Member of Executive Board, SMU Cox School of Business Formerly: Advisor to the Board, Invesco Advisers, Inc. (formerly known as Invesco Institutional (N.A.), Inc.); Chairman and Chief Executive Officer, Invesco Advisers, Inc. (registered investment adviser); Director, Chairman, Chief Executive Officer and President, Invesco Holding Company (US), Inc. (formerly IVZ Inc.) (holding company), Invesco Group Services, Inc. (service provider) and Invesco North American Holdings, Inc. (holding company); Director, Chief Executive Officer and President, Invesco Holding Company Limited (parent of Invesco and a global investment management firm); Director, Invesco Ltd.; Chairman, Investment Company Institute and President,Co-Chief Executive Officer,Co-President, Chief Operating Officer and Chief Financial Officer, Franklin Resources, Inc. (global investment management organization) | | 229 | | None |
| 1 | Mr. Flanagan is considered an interested person (within the meaning of Section 2(a)(19) of the 1940 Act) of the Trust because he is an officer of the Adviser to the Trust, and an officer and a director of Invesco Ltd., ultimate parent of the Adviser. |
Invesco V.I. Diversified Dividend Fund
Trustees and Officers–(continued)
| | | | | | | | |
Name, Year of Birth and Position(s) Held with the Trust | | Trustee and/or Officer Since | | Principal Occupation(s) During Past 5 Years | | Number of
Funds in
Fund Complex
Overseen by
Trustee | | Other Directorship(s) Held by Trustee
During Past 5 Years |
| Independent Trustees |
Bruce L. Crockett - 1944 Trustee and Chair | | 1993 | | Chairman, Crockett Technologies Associates (technology consulting company) Formerly: Director, Captaris (unified messaging provider); Director, President and Chief Executive Officer, COMSAT Corporation; Chairman, Board of Governors of INTELSAT (international communications company); ACE Limited (insurance company); Independent Directors Council and Investment Company Institute: Member of the Audit Committee, Investment Company Institute; Member of the Executive Committee and Chair of the Governance Committee, Independent Directors Council | | 229 | | Director and Chairman of the Audit Committee, ALPS (Attorneys Liability Protection Society) (insurance company); Director and Member of the Audit Committee and Compensation Committee, Ferroglobe PLC (metallurgical company) |
David C. Arch - 1945 Trustee | | 2010 | | Chairman of Blistex Inc. (consumer health care products manufacturer); Member, World Presidents’ Organization | | 229 | | Board member of the Illinois Manufacturers’ Association |
Beth Ann Brown - 1968 Trustee | | 2019 | | Independent Consultant Formerly: Head of Intermediary Distribution, Managing Director, Strategic Relations, Managing Director, Head of National Accounts, Senior Vice President, National Account Manager and Senior Vice President, Key Account Manager, Columbia Management Investment Advisers LLC; Vice President, Key Account Manager, Liberty Funds Distributor, Inc.; and Trustee of certain Oppenheimer Funds | | 229 | | Director, Board of Directors of Caron Engineering Inc.; Advisor, Board of Advisors of Caron Engineering Inc.; President and Director, Acton Shapleigh Youth Conservation Corps (non - profit); and Vice President and Director of Grahamtastic Connection (non-profit) |
Jack M. Fields - 1952 Trustee | | 1997 | | Chief Executive Officer, Twenty First Century Group, Inc. (government affairs company); and Chairman, Discovery Learning Alliance(non-profit) Formerly: Owner and Chief Executive Officer, Dos Angeles Ranch L.P. (cattle, hunting, corporate entertainment); Director, Insperity, Inc. (formerly known as Administaff) (human resources provider); Chief Executive Officer, Texana Timber LP (sustainable forestry company); Director of Cross Timbers Quail Research Ranch(non-profit); and member of the U.S. House of Representatives | | 229 | | None |
Invesco V.I. Diversified Dividend Fund
Trustees and Officers–(continued)
| | | | | | | | |
Name, Year of Birth and Position(s) Held with the Trust | | Trustee and/or Officer Since | | Principal Occupation(s) During Past 5 Years | | Number of
Funds in
Fund Complex
Overseen by
Trustee | | Other Directorship(s) Held by Trustee
During Past 5 Years |
| Independent Trustees–(continued) |
Cynthia Hostetler -1962 Trustee | | 2017 | | Non-Executive Director and Trustee of a number of public and private business corporations Formerly: Director, Aberdeen Investment Funds (4 portfolios); Head of Investment Funds and Private Equity, Overseas Private Investment Corporation; President, First Manhattan Bancorporation, Inc.; Attorney, Simpson Thacher & Bartlett LLP | | 229 | | Vulcan Materials Company (construction materials company); Trilinc Global Impact Fund; Genesee & Wyoming, Inc. (railroads); Artio Global Investment LLC (mutual fund complex); Edgen Group, Inc. (specialized energy and infrastructure products distributor); Investment Company Institute (professional organization); Independent Directors Council (professional organization) |
Eli Jones - 1961 Trustee | | 2016 | | Professor and Dean, Mays Business School - Texas A&M University Formerly: Professor and Dean, Walton College of Business, University of Arkansas and E.J. Ourso College of Business, Louisiana State University; Director, Arvest Bank | | 229 | | Insperity, Inc. (formerly known as Administaff) (human resources provider) |
Elizabeth Krentzman - 1959 Trustee | | 2019 | | Formerly: Principal and Chief Regulatory Advisor for Asset Management Services and U.S. Mutual Fund Leader of Deloitte & Touche LLP; General Counsel of the Investment Company Institute (trade association); National Director of the Investment Management Regulatory Consulting Practice, Principal, Director and Senior Manager of Deloitte & Touche LLP; Assistant Director of the Division of Investment Management - Office of Disclosure and Investment Adviser Regulation of the U.S. Securities and Exchange Commission and various positions with the Division of Investment Management - Office of Regulatory Policy of the U.S. Securities and Exchange Commission; Associate at Ropes & Gray LLP; Advisory Board Member of the Securities and Exchange Commission Historical Society; and Trustee of certain Oppenheimer Funds | | 229 | | Trustee of the University of Florida National Board Foundation and Audit Committee Member; Member of the Cartica Funds Board of Directors (private investment funds); Member of the University of Florida Law Center Association, Inc. Board of Trustees and Audit Committee Member |
Anthony J. LaCava, Jr. - 1956 Trustee | | 2019 | | Formerly: Director and Member of the Audit Committee, Blue Hills Bank (publicly traded financial institution) and Managing Partner, KPMG LLP | | 229 | | Blue Hills Bank; Chairman, Bentley University; Member, Business School Advisory Council; and Nominating Committee KPMG LLP |
Prema Mathai-Davis - 1950 Trustee | | 1998 | | Retired Co-Owner & Partner of Quantalytics Research, LLC, (a FinTech Investment Research Platform for the Self-Directed Investor) | | 229 | | None |
Invesco V.I. Diversified Dividend Fund
Trustees and Officers–(continued)
| | | | | | | | |
Name, Year of Birth and Position(s) Held with the Trust | | Trustee and/or Officer Since | | Principal Occupation(s) During Past 5 Years | | Number of
Funds in
Fund Complex
Overseen by
Trustee | | Other Directorship(s) Held by Trustee
During Past 5 Years |
| Independent Trustees–(continued) |
Joel W. Motley - 1952 Trustee | | 2019 | | Director of Office of Finance, Federal Home Loan Bank; Member of the Vestry of Trinity Wall Street; Managing Director of Carmona Motley Inc. (privately held financial advisor); Member of the Finance and Budget Committee of the Council on Foreign Relations, Member of the Investment Committee and Board of Human Rights Watch and Member of the Investment Committee and Board of Historic Hudson Valley(non-profit cultural organization) Formerly: Managing Director of Public Capital Advisors, LLC (privately held financial advisor); Managing Director of Carmona Motley Hoffman, Inc. (privately held financial advisor); Trustee of certain Oppenheimer Funds; and Director of Columbia Equity Financial Corp. (privately held financial advisor) | | 229 | | Director of Greenwall Foundation (bioethics research foundation); Member of Board and Investment Committee of The Greenwall Foundation; Director of Southern Africa Legal Services Foundation; Board Member and Investment Committee Member of Pulizer Center for Crisis Reporting(non-profit journalism) |
Teresa M. Ressel - 1962 Trustee | | 2017 | | Non-executive director and trustee of a number of public and private business corporations Formerly: Chief Financial Officer, Olayan America, The Olayan Group (international investor/commercial/industrial); Chief Executive Officer, UBS Securities LLC; Group Chief Operating Officer, Americas, UBS AG; Assistant Secretary for Management & Budget and CFO, US Department of the Treasury | | 229 | | Atlantic Power Corporation (power generation company); ON Semiconductor Corp. (semiconductor supplier) |
Ann Barnett Stern - 1957 Trustee | | 2017 | | President and Chief Executive Officer, Houston Endowment Inc. (private philanthropic institution) Formerly: Executive Vice President and General Counsel, Texas Children’s Hospital; Attorney, Beck, Redden and Secrest, LLP; Business Law Instructor, University of St. Thomas; Attorney, Andrews & Kurth LLP | | 229 | | Federal Reserve Bank of Dallas |
Robert C. Troccoli - 1949 Trustee | | 2016 | | Retired | | 229 | | None |
| Daniel S. Vandivort - 1954 Trustee | | 2019 | | Treasurer, Chairman of the Audit and Finance Committee, and Trustee, Board of Trustees, Huntington Disease Foundation of America; and President, Flyway Advisory Services LLC (consulting and property management) Formerly: Trustee and Governance Chair, of certain Oppenheimer Funds | | 229 | | Chairman and Lead Independent Director, Chairman of the Audit Committee, and Director, Board of Directors, Value Line Funds |
| James D. Vaughn - 1945 Trustee | | 2019 | | Retired Formerly: Managing Partner, Deloitte & Touche LLP; Trustee and Chairman of the Audit Committee, Schroder Funds; Board Member, Mile High United Way, Boys and Girls Clubs, Boy Scouts, Colorado Business Committee for the Arts, Economic Club of Colorado and Metro Denver Network (economic development corporation); and Trustee of certain Oppenheimer Funds | | 229 | | Board member and Chairman of Audit Committee of AMG National Trust Bank; Trustee and Investment Committee member, University of South Dakota Foundation; Board member, Audit Committee Member and past Board Chair, Junior Achievement(non-profit) |
Invesco V.I. Diversified Dividend Fund
Trustees and Officers–(continued)
| | | | | | | | |
Name, Year of Birth and Position(s) Held with the Trust | | Trustee and/or Officer Since | | Principal Occupation(s) During Past 5 Years | | Number of
Funds in
Fund Complex
Overseen by
Trustee | | Other Directorship(s) Held by Trustee
During Past 5 Years |
| Independent Trustees–(continued) |
| Christopher L. WIlson - 1957 Trustee, Vice Chair and Chair Designate | | 2017 | | Retired Formerly: Director, TD Asset Management USA Inc. (mutual fund complex) (22 portfolios); Managing Partner, CT2, LLC (investing and consulting firm); President/Chief Executive Officer, Columbia Funds, Bank of America Corporation; President/Chief Executive Officer, CDC IXIS Asset Management Services, Inc.; Principal & Director of Operations, Scudder Funds, Scudder, Stevens & Clark, Inc.; Assistant Vice President, Fidelity Investments | | 229 | | ISO New England, Inc.(non-profit organization managing regional electricity market) |
Invesco V.I. Diversified Dividend Fund
Trustees and Officers–(continued)
| | | | | | | | |
Name, Year of Birth and Position(s) Held with the Trust | | Trustee and/or Officer Since | | Principal Occupation(s) During Past 5 Years | | Number of
Funds in
Fund Complex
Overseen by
Trustee | | Other Directorship(s) Held by Trustee
During Past 5 Years |
| Officers |
Sheri Morris - 1964 President, Principal Executive Officer and Treasurer | | 1999 | | Head of Global Fund Services, Invesco Ltd.; President, Principal Executive Officer and Treasurer, The Invesco Funds; Vice President, Invesco Advisers, Inc. (formerly known as Invesco Institutional (N.A.), Inc.) (registered investment adviser); and Vice President, Invesco Exchange-Traded Fund Trust, Invesco Exchange-Traded Fund Trust II, Invesco India Exchange-Traded Fund Trust, Invesco Actively Managed Exchange-Traded Fund Trust, Invesco Actively Managed Exchange-Traded Commodity Fund Trust and Invesco Exchange-Traded Self-Indexed Fund Trust; and Vice President, OppenheimerFunds, Inc. Formerly: Vice President and Principal Financial Officer, The Invesco Funds; Vice President, Invesco AIM Advisers, Inc., Invesco AIM Capital Management, Inc. and Invesco AIM Private Asset Management, Inc.; Assistant Vice President and Assistant Treasurer, The Invesco Funds and Assistant Vice President, Invesco Advisers, Inc., Invesco AIM Capital Management, Inc. and Invesco AIM Private Asset Management, Inc.; and Treasurer, Invesco Exchange-Traded Fund Trust, Invesco Exchange-Traded Fund Trust II, Invesco India Exchange-Traded Fund Trust and Invesco Actively Managed Exchange-Traded Fund Trust | | N/A | | N/A |
Russell C. Burk - 1958 Senior Vice President and Senior Officer | | 2005 | | Senior Vice President and Senior Officer, The Invesco Funds | | N/A | | N/A |
Jeffrey H. Kupor - 1968 Senior Vice President, Chief Legal Officer and Secretary | | 2018 | | Head of Legal of the Americas, Invesco Ltd.; Senior Vice President and Secretary, Invesco Advisers, Inc. (formerly known as Invesco Institutional (N.A.), Inc.) (registered investment adviser); Senior Vice President and Secretary, Invesco Distributors, Inc. (formerly known as Invesco AIM Distributors, Inc.); Vice President and Secretary, Invesco Investment Services, Inc. (formerly known as Invesco AIM Investment Services, Inc.) Senior Vice President, Chief Legal Officer and Secretary, The Invesco Funds; Secretary and General Counsel, Invesco Investment Advisers LLC (formerly known as Van Kampen Asset Management); Secretary and General Counsel, Invesco Capital Markets, Inc. (formerly known as Van Kampen Funds Inc.) and Chief Legal Officer, Invesco Exchange-Traded Fund Trust, Invesco Exchange-Traded Fund Trust II, Invesco India Exchange-Traded Fund Trust, Invesco Actively Managed Exchange-Traded Fund Trust, Invesco Actively Managed Exchange-Traded Commodity Fund Trust and Invesco Exchange-Traded Self-Indexed Fund Trust; Secretary, Invesco Indexing LLC; Secretary, W.L. Ross & Co., LLC Formerly: Secretary and Vice President, Jemstep, Inc.; Head of Legal, Worldwide Institutional, Invesco Ltd.; Secretary and General Counsel, INVESCO Private Capital Investments, Inc.; Senior Vice President, Secretary and General Counsel, Invesco Management Group, Inc. (formerly known as Invesco AIM Management Group, Inc.); Assistant Secretary, INVESCO Asset Management (Bermuda) Ltd.; Secretary and General Counsel, Invesco Private Capital, Inc.; Assistant Secretary and General Counsel, INVESCO Realty, Inc.; Secretary and General Counsel, Invesco Senior Secured Management, Inc.; and Secretary, Sovereign G./P. Holdings Inc. | | N/A | | N/A |
Andrew R. Schlossberg - 1974 Senior Vice President | | 2019 | | Head of the Americas and Senior Managing Director, Invesco Ltd.; Director and Senior Vice President, Invesco Advisers, Inc. (formerly known as Invesco Institutional (N.A.), Inc.) (registered investment adviser); Director and Chairman, Invesco Investment Services, Inc. (formerly known as Invesco AIM Investment Services, Inc.) (registered transfer agent); Senior Vice President, The Invesco Funds; Director, Invesco Investment Advisers LLC (formerly known as Van Kampen Asset Management); Director, President and Chairman, Invesco Insurance Agency, Inc. Formerly: Director, Invesco UK Limited; Director and Chief Executive, Invesco Asset Management Limited and Invesco Fund Managers Limited; Assistant Vice President, The Invesco Funds; Senior Vice President, Invesco Advisers, Inc. (formerly known as Invesco Institutional (N.A.), Inc.) (registered investment adviser); Director and Chief Executive, Invesco Administration Services Limited and Invesco Global Investment Funds Limited; Director, Invesco Distributors, Inc.; Head of EMEA, Invesco Ltd.; President, Invesco Actively Managed Exchange-Traded Commodity Fund Trust, Invesco Actively Managed Exchange-Traded Fund Trust, Invesco Exchange-Traded Fund Trust, Invesco Exchange-Traded Fund Trust II and Invesco India Exchange-Traded Fund Trust; Managing Director and Principal Executive Officer, Invesco Capital Management LLC | | N/A | | N/A |
Invesco V.I. Diversified Dividend Fund
Trustees and Officers–(continued)
| | | | | | | | |
Name, Year of Birth and Position(s) Held with the Trust | | Trustee and/or Officer Since | | Principal Occupation(s) During Past 5 Years | | Number of
Funds in
Fund Complex
Overseen by
Trustee | | Other Directorship(s) Held by Trustee
During Past 5 Years |
| Officers–(continued) |
John M. Zerr - 1962 Senior Vice President | | 2006 | | Chief Operating Officer of the Americas; Senior Vice President, Invesco Advisers, Inc. (formerly known as Invesco Institutional (N.A.), Inc.) (registered investment adviser); Senior Vice President, Invesco Distributors, Inc. (formerly known as Invesco AIM Distributors, Inc.); Director and Vice President, Invesco Investment Services, Inc. (formerly known as Invesco AIM Investment Services, Inc.) Senior Vice President, The Invesco Funds; Managing Director, Invesco Capital Management LLC; Director, Invesco Investment Advisers LLC (formerly known as Van Kampen Asset Management); Senior Vice President, Invesco Capital Markets, Inc. (formerly known as Van Kampen Funds Inc.); Manager, Invesco Indexing LLC; Manager, Invesco Specialized Products, LLC; Director and Senior Vice President, Invesco Insurance Agency, Inc.; Member, Invesco Canada Funds Advisory Board; Director, President and Chief Executive Officer, Invesco Corporate Class Inc. (corporate mutual fund company); and Director, Chairman, President and Chief Executive Officer, Invesco Canada Ltd. (formerly known as Invesco Trimark Ltd./Invesco Trimark Ltèe) (registered investment adviser and registered transfer agent) Formerly: Director and Senior Vice President, Invesco Management Group, Inc. (formerly known as Invesco AIM Management Group, Inc.); Secretary and General Counsel, Invesco Management Group, Inc. (formerly known as Invesco AIM Management Group, Inc.); Secretary, Invesco Investment Services, Inc. (formerly known as Invesco AIM Investment Services, Inc.); Chief Legal Officer and Secretary, The Invesco Funds; Secretary and General Counsel, Invesco Investment Advisers LLC (formerly known as Van Kampen Asset Management); Secretary and General Counsel, Invesco Capital Markets, Inc. (formerly known as Van Kampen Funds Inc.); Chief Legal Officer, Invesco Exchange-Traded Fund Trust, Invesco Exchange-Traded Fund Trust II, Invesco India Exchange-Traded Fund Trust, Invesco Actively Managed Exchange-Traded Fund Trust, Invesco Actively Managed Exchange-Traded Commodity Fund Trust and Invesco Exchange-Traded Self-Indexed Fund Trust; Secretary, Invesco Indexing LLC; Director, Secretary, General Counsel and Senior Vice President, Van Kampen Exchange Corp.; Director, Vice President and Secretary, IVZ Distributors, Inc. (formerly known as INVESCO Distributors, Inc.); Director and Vice President, INVESCO Funds Group, Inc.; Director and Vice President, Van Kampen Advisors Inc.; Director, Vice President, Secretary and General Counsel, Van Kampen Investor Services Inc.; Director and Secretary, Invesco Distributors, Inc. (formerly known as Invesco AIM Distributors, Inc.); Director, Senior Vice President, General Counsel and Secretary, Invesco AIM Advisers, Inc. and Van Kampen Investments Inc.; Director, Vice President and Secretary, Fund Management Company; Director, Senior Vice President, Secretary, General Counsel and Vice President, Invesco AIM Capital Management, Inc.; Chief Operating Officer and General Counsel, Liberty Ridge Capital, Inc. (an investment adviser) | | N/A | | N/A |
Gregory G. McGreevey - 1962 Senior Vice President | | 2012 | | Senior Managing Director, Invesco Ltd.; Director, Chairman, President, and Chief Executive Officer, Invesco Advisers, Inc. (formerly known as Invesco Institutional (N.A.), Inc.) (registered investment adviser); Director, Invesco Mortgage Capital, Inc. and Invesco Senior Secured Management, Inc.; and Senior Vice President, The Invesco Funds; and President, SNW Asset Management Corporation Formerly: Senior Vice President, Invesco Management Group, Inc. and Invesco Advisers, Inc.; Assistant Vice President, The Invesco Funds | | N/A | | N/A |
Kelli Gallegos - 1970 Vice President, Principal Financial Officer and Assistant Treasurer | | 2008 | | Principal Financial and Accounting Officer - Investments Pool, Invesco Specialized Products, LLC; Vice President, Principal Financial Officer and Assistant Treasurer, The Invesco Funds; Principal Financial and Accounting Officer - Pooled Investments, Invesco Capital Management LLC; Vice President and Treasurer, Invesco Exchange-Traded Fund Trust, Invesco Exchange-Traded Fund Trust II, Invesco India Exchange-Traded Fund Trust, Invesco Actively Managed Exchange-Traded Fund Trust, Invesco Actively Managed Exchange-Traded Commodity Fund Trust and Invesco Exchange-Traded Self-Indexed Fund Trust Formerly: Assistant Treasurer, Invesco Specialized Products, LLC; Assistant Treasurer, Invesco Exchange-Traded Fund Trust, Invesco Exchange-Traded Fund Trust II, Invesco India Exchange-Traded Fund Trust, Invesco Actively Managed Exchange-Traded Fund Trust, Invesco Actively Managed Exchange-Traded Commodity Fund Trust and Invesco Exchange-Traded Self-Indexed Fund Trust; Assistant Treasurer, Invesco Capital Management LLC; Assistant Vice President, The Invesco Funds | | N/A | | N/A |
Invesco V.I. Diversified Dividend Fund
Trustees and Officers–(continued)
| | | | | | | | |
Name, Year of Birth and Position(s) Held with the Trust | | Trustee and/or Officer Since | | Principal Occupation(s) During Past 5 Years | | Number of
Funds in
Fund Complex
Overseen by
Trustee | | Other Directorship(s) Held by Trustee
During Past 5 Years |
| Officers–(continued) |
Crissie M. Wisdom - 1969 Anti-Money Laundering Compliance Officer | | 2013 | | Anti-Money Laundering Compliance Officer, Invesco Advisers, Inc. (formerly known as Invesco Institutional (N.A.), Inc.) (registered investment adviser), Invesco Capital Markets, Inc. (formerly known as Van Kampen Funds Inc.), Invesco Distributors, Inc., Invesco Investment Services, Inc., The Invesco Funds, and Invesco Exchange-Traded Fund Trust, Invesco Exchange-Traded Fund Trust II, Invesco India Exchange-Traded Fund Trust, Invesco Actively Managed Exchange-Traded Fund Trust, Invesco Actively Managed Exchange-Traded Commodity Fund Trust and Invesco Exchange-Traded Self-Indexed Fund Trust; Anti-Money Laundering Compliance Officer and Bank Secrecy Act Officer, INVESCO National Trust Company and Invesco Trust Company; and Fraud Prevention Manager and Controls and Risk Analysis Manager for Invesco Investment Services, Inc. Formerly: Anti-Money Laundering Compliance Officer, Van Kampen Exchange Corp. and Invesco Management Group, Inc. | | N/A | | N/A |
Robert R. Leveille - 1969 Chief Compliance Officer | | 2016 | | Chief Compliance Officer, Invesco Advisers, Inc. (registered investment adviser); and Chief Compliance Officer, The Invesco Funds Formerly: Chief Compliance Officer, Putnam Investments and the Putnam Funds | | N/A | | N/A |
The Statement of Additional Information of the Trust includes additional information about the Fund’s Trustees and is available upon request, without charge, by calling 1.800.959.4246. Please refer to the Fund’s Statement of Additional Information for information on the Fund’ssub-advisers.
| | | | | | |
| Office of the Fund | | Investment Adviser | | Distributor | | Auditors |
| 11 Greenway Plaza, Suite 1000 | | Invesco Advisers, Inc. | | Invesco Distributors, Inc. | | PricewaterhouseCoopers LLP |
| Houston, TX 77046-1173 | | 1555 Peachtree Street, N.E. | | 11 Greenway Plaza, Suite 1000 | | 1000 Louisiana Street, Suite 5800 |
| | Atlanta, GA 30309 | | Houston, TX 77046-1173 | | Houston, TX 77002-5678 |
| | | |
| Counsel to the Fund | | Counsel to the Independent Trustees | | Transfer Agent | | Custodian |
| Stradley Ronon Stevens & Young, LLP | | Goodwin Procter LLP | | Invesco Investment Services, Inc. | | State Street Bank and Trust Company |
| 2005 Market Street, Suite 2600 | | 901 New York Avenue, N.W. | | 11 Greenway Plaza, Suite 1000 | | 225 Franklin Street |
| Philadelphia, PA 19103-7018 | | Washington, D.C. 20001 | | Houston, TX 77046-1173 | | Boston, MA 02110-2801 |
Invesco V.I. Diversified Dividend Fund
| | | | |
| | |

| | Annual Report to Shareholders | | December 31, 2019 |
| | |
| | Invesco V.I. Equally-Weighted S&P 500 Fund |

Beginning on January 1, 2021, as permitted by regulations adopted by the Securities and Exchange Commission, the insurance company that offers your variable annuity or variable life insurance contract may no longer send you paper copies of the Fund’s shareholder reports by mail, unless you specifically request paper copies of the reports from the insurance company or your financial intermediary. Instead of delivering paper copies of the report, the insurance company may choose to make the reports available on a website, and will notify you by mail each time a report is posted and provide you with a website link to access the report. Instructions for requesting paper copies will be provided by your insurance company.
If the insurance company offers electronic delivery, you may elect to receive shareholder reports and other communications about the Fund electronically by following the instructions provided by the insurance company or by contacting your financial intermediary. If you already elected to receive shareholder reports electronically, you will not be affected by this change and you need not take any action.
You may elect to receive all future reports in paper free of charge from the insurance company. You can inform the insurance company or your financial intermediary that you wish to continue receiving paper copies of your shareholder reports by following the instructions provided by the insurance company or by contacting your financial intermediary. Your election to receive reports in paper will apply to all portfolio companies available under your contract with the insurance company.
The Fund provides a complete list of its holdings four times in each fiscal year, at the quarter-ends. For the second and fourth quarters, the lists appear in the Fund’s semiannual and annual reports to shareholders. For the first and third quarters, the Fund files the lists with the Securities and Exchange Commission (SEC) as an exhibit to its reports on FormN-PORT. The Fund’s FormN-PORT filings are available on the SEC website, sec.gov. The SEC file numbers for the Fund are811-07452 and033-57340. The Fund’s most recent portfolio holdings, as filed on FormN-PORT, have also been made available to insurance companies issuing variable annuity contracts and variable life insurance policies (“variable products”) that invest in the Fund.
A description of the policies and procedures that the Fund uses to determine how to vote proxies relating to portfolio securities is available without charge, upon request, from our Client Services department at 800 959 4246 or at invesco.com/proxyguidelines. The information is also available on the SEC website, sec.gov.
Information regarding how the Fund voted proxies related to its portfolio securities during the most recent12-month period ended June 30 is available at invesco.com/proxysearch. The information is also available on the SEC website, sec.gov.
Invesco Advisers, Inc. is an investment adviser; it provides investment advisory services to individual and institutional clients and does not sell securities. Invesco Distributors, Inc. is the US distributor for Invesco Ltd.’s retail mutual funds, exchange-traded funds and institutional money market funds. Both are wholly owned, indirect subsidiaries of Invesco Ltd.
This report must be accompanied or preceded by a currently effective Fund prospectus and variable product prospectus, which contain more complete information, including sales charges and expenses. Investors should read each carefully before investing.
| | | | |
| NOT FDIC INSURED | MAY LOSE VALUE | NO BANK GUARANTEE |
| Invesco Distributors, Inc. | | | | MS-VIEWSP-AR-1 |
Management’s Discussion of Fund Performance
| | | | |
| Performance summary | | | | |
For the year ended December 31, 2019, Series I shares of Invesco V.I. Equally-Weighted S&P 500 Fund (the Fund) underperformed the S&P 500 Index. Your Fund’s long-term performance appears later in this report. | |
| Fund vs. Indexes | | | | |
| Total returns, 12/31/18 to 12/31/19, excluding variable product issuer charges. If variable product issuer charges were included, returns would be lower. | | | | |
| Series I Shares | | | 28.79 | % |
| Series II Shares | | | 28.46 | |
| S&P 500 Indexq(Broad Market Index) | | | 31.49 | |
| S&P 500 Equal Weight Indexq(Style-Specific Index) | | | 29.24 | |
| Lipper VUFMulti-Cap Core Funds Index∎(Peer Group Index) | | | 26.26 | |
| Source(s):qRIMES Technologies Corp.;◆Lipper Inc. | | | | |
Market conditions and your Fund
Equity markets rallied in the first quarter of 2019, fueled by optimism about a potentialUS-China trade deal and indication that the US Federal Reserve (the Fed) would not raise interest rates in 2019, a surprising shift in monetary policy. The Fed’s more accommodative stance provided a supportive environment for equities and fixed income, even as US economic data were mixed and overseas growth appeared to be slowing. Against this backdrop, the S&P 500 Index posted its best first quarter returns since 1998.
Although the S&P 500 Index posted modest gains for the second quarter of 2019, the US stock market experienced increased volatility. After four consecutive months of rising stock markets, the market sold off in May 2019, along with bond yields and oil prices, as investors weighed the impact of the lingering trade war between the US and China, as well as potential tariffs imposed on Mexico. In addition, economic data showed a slowing domestic and global economy.
Key issues that concerned investors in the second quarter of 2019 carried over into the third quarter. TheUS-China
trade conflict worried investors and stifled business investment, even as the Fed cut interest rates by 0.25% in July and again in September 2019.1 This environment, combined with evidence of slowing global economic growth, fueled market volatility in August 2019. The US Treasury yield curve inverted several times, increasing fears of a possible US recession. As a result, August saw increased risk aversion, with investors crowding into asset classes perceived as safe havens, such as US Treasuries and gold. However, the Fed’s accommodative tone provided some support for risk assets.
Macroeconomic issues that concerned investors in the third quarter of 2019 mostly abated during the fourth quarter, providing the backdrop for strong equity market returns. Risk assets surged higher as a result of a delay in the Brexit agreement until January 2020, optimism that phase one of aUS-China trade deal would be completed and better-than-expected third-quarter corporate earnings results. The US economy rose higher than expected, at 2.1% during the third quarter of 2019.2 During its October meeting, the Fed cut interest rates again
by 0.25% based on business investment and exports remaining weak.1 Investors were also encouraged by a resilient US economy and corporate earnings, putting the US equity market on track for its largest annual rise since 2013.
Invesco V.I. Equally-Weighted S&P 500 Fund seeks total return through growth of capital and current income. The Fund invests in a diversified portfolio of common stocks represented in the S&P 500 Index. The Fund generally invests in each common stock included in the S&P 500 Index in approximately equal proportions, which differs from the S&P 500 Index because stocks in the S&P 500 Index are represented in proportion to their market value or market capitalization. Due to the equally-weighted nature of the Fund and the capitalization-weighted nature of the S&P 500 Index, the Fund will lag when mega- andlarge-cap stocks outperformmid-cap stocks.
For the year, every sector contributed to the Fund’s absolute returns. The sectors that contributed the most to the Fund’s absolute performance were information technology (IT), industrials and financials. Relative to the S&P 500 Index, stock weightings in the health care sector and an overweight allocation to the industrials sector contributed to the Fund’s performance.
The energy, utilities and materials sectors lagged other sectors although each sector delivered double-digit returns for the year. The Fund’s underweight allocation to the IT sector in general, and to specific stocks within the sector, was the largest detractor from its relative performance. Stock selection in the communication services sector also detracted from relative returns. In general, the Fund’s underweight exposure to megacap stocks and overweight exposure to
| | | | |
Portfolio Composition | |
By sector | | | % of total net assets | |
| |
| Information Technology | | | 13.72% | |
| Industrials | | | 13.58 | |
| Financials | | | 12.75 | |
| Consumer Discretionary | | | 12.30 | |
| Health Care | | | 11.93 | |
| Consumer Staples | | | 6.52 | |
| Real Estate | | | 6.14 | |
| Energy | | | 5.74 | |
| Utilities | | | 5.56 | |
| Materials | | | 5.54 | |
| Communication Services | | | 4.36 | |
| Money Market Funds Plus Other | | | | |
| Assets Less Liabilities | | | 1.86 | |
|
Top 10 Equity Holdings* |
% of total net assets |
| | |
| |
| 1. Conagra Brands, Inc. | | 0.23% |
2. Apache Corp. | | 0.23 |
3. Western Digital Corp. | | 0.23 |
4. Mosaic Co. (The) | | 0.22 |
5. Macy’s, Inc. | | 0.22 |
6. Corteva, Inc. | | 0.22 |
7. Advanced Micro Devices, Inc. | | 0.22 |
| | |
8. Concho Resources, Inc. | | 0.21 |
9. Live Nation Entertainment, Inc. | | 0.21 |
10. Noble Energy, Inc. | | 0.21 |
| | | | |
Total Net Assets | | $ | 279.4 million | |
| |
Total Number of Holdings* | | | 505 | |
The Fund’s holdings are subject to change, and there is no assurance that the Fund will continue to hold any particular security.
*Excluding money market fund holdings, if any.
Data presented here are as of December 31, 2019.
Invesco V.I. Equally-Weighted S&P 500 Fund
mid-cap stocks were key detractors from relative performance.
The most significant contributor to the Fund’s absolute results for the year wasAdvanced Micro Devices, which generated a 148% return. The largest detractor on an absolute and relative basis wasPG&E, which declined over 70%. In January,Teleflexreplaced PG&E in the S&P 500 Index. As such, we made the same adjustment to the Fund’s positioning before the close of the fiscal year.
During the year, the largest contributors to the Fund’s performance versus the S&P 500 Index included underweight positions inPfizer,Berkshire Hathaway,Exxon MobilandJohnson & Johnson. The largest detractors from the Fund’s relative performance included underweight allocations toApple,Microsoft, Facebook andJP Morgan Chase.
Please note, the Fund’s strategy is principally implemented through equity investments, but the Fund may also use S&P 500 futures contracts, which are derivative instruments used to gain exposure to the equity market. During the year, the Fund invested in S&P 500 futures contracts, which generated a negative return and detracted from absolute performance. Derivatives can be a costeffective way to gain exposure to asset classes. However, derivatives may amplify traditional investment risks through the creation of leverage and may be less liquid than traditional securities.
We welcome new investors who joined the Fund during the year and thank you for your investment in Invesco V.I. Equally-Weighted S&P 500 Fund.
1 Source: US Federal Reserve
2 Source: Bureau of Economic Analysis
Portfolio managers:
Anthony Munchak
Glen Murphy
Francis Orlando
Daniel Tsai
The views and opinions expressed in management’s discussion of Fund performance are those of Invesco Advisers, Inc. These views and opinions are subject to change at any time based on factors such as market and economic conditions. These views and opinions may not be relied upon as investment advice or recommendations, or as an offer for a particular security. The information is not a complete analysis of every aspect of any market, country, industry, security or the Fund. Statements of fact are from sources considered reliable, but Invesco Advisers, Inc. makes no representation or warranty as to their completeness or accuracy. Although historical performance is no guarantee of future results,
these insights may help you understand our investment management philosophy.
See important Fund and, if applicable, index disclosures later in this report.
Invesco V.I. Equally-Weighted S&P 500 Fund
Your Fund’s Long-Term Performance
Results of a $10,000 Investment – Oldest Share Class(es)
Fund and index data from 12/31/09
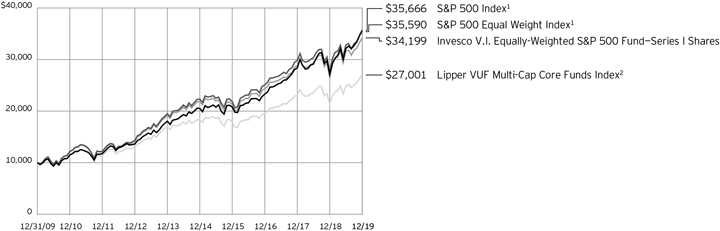
| 1 | Source: RIMES Technologies Corp. |
Past performance cannot guarantee future
results.
| | | | |
| Average Annual Total Returns | |
As of 12/31/19 | | | | |
| |
| Series I Shares | | | | |
| Inception (11/9/94) | | | 10.78 | % |
| 10 Years | | | 13.08 | |
| 5 Years | | | 9.36 | |
| 1 Year | | | 28.79 | |
| |
| Series II Shares | | | | |
| Inception (7/24/00) | | | 8.90 | % |
| 10 Years | | | 12.80 | |
| 5 Years | | | 9.09 | |
| 1 Year | | | 28.46 | |
Effective June 1, 2010, Class X and Class Y shares of the predecessor fund, Morgan Stanley V.I. Select Dimensions Equally-Weighted S&P 500 Fund, advised by Morgan Stanley Investment Advisors Inc. were reorganized into Series I and Series II shares, respectively, of Invesco V.I. Select Dimensions Equally-Weighted S&P 500 Fund (renamed Invesco V.I. Equally-Weighted S&P 500 Fund on April 30, 2012). Returns shown above, prior to June 1, 2010, for Series I and Series II shares are blended returns of the predecessor fund and Invesco V.I. Equally-Weighted S&P 500 Fund. Share class returns will differ from the predecessor fund because of different expenses.
The performance data quoted represent past performance and cannot guarantee future results; current performance may be lower or higher. Please contact your variable product issuer or financial adviser for the most recentmonth-end variable product performance. Performance figures
reflect Fund expenses, reinvested distributions and changes in net asset value. Performance figures do not reflect deduction of taxes a shareholder would pay on Fund distributions or sale of Fund shares. Investment return and principal value will fluctuate so that you may have a gain or loss when you sell shares.
The total annual Fund operating expense ratio set forth in the most recent Fund prospectus as of the date of this report for Series I and Series II shares was 0.31% and 0.56%, respectively. The expense ratios presented above may vary from the expense ratios presented in other sections of this report that are based on expenses incurred during the period covered by this report.
Invesco V.I. Equally-Weighted S&P 500 Fund, a series portfolio of AIM Variable Insurance Funds (Invesco Variable Insurance Funds), is currently offered through insurance companies issuing variable products. You cannot purchase shares of the Fund directly. Performance figures given represent the Fund and are not intended to reflect actual variable product values. They do not reflect sales charges, expenses and fees assessed in connection with a variable product. Sales charges, expenses and fees, which are determined by the variable product issuers, will vary and will lower the total return.
The most recentmonth-end performance at the Fund level, excluding variable product charges, is available at 800 451 4246. As mentioned above, for the most recentmonth-end performance including variable
product charges, please contact your variable product issuer or financial adviser.
Fund performance reflects any applicable fee waivers and/or expense reimbursements. Had the adviser not waived fees and/or reimbursed expenses currently or in the past, returns would have been lower. See current prospectus for more information.
Invesco V.I. Equally-Weighted S&P 500 Fund
Invesco V.I. Equally-Weighted S&P 500 Fund’s investment objective is to achieve a high level of total return on its assets through a combination of capital appreciation and current income.
| ∎ | | Unless otherwise stated, information presented in this report is as of December 31, 2019, and is based on total net assets. |
| ∎ | | Unless otherwise noted, all data provided by Invesco. |
| ∎ | | To access your Fund’s reports/prospectus, visit invesco.com/fundreports. |
About indexes used in this report
| ∎ | | TheS&P 500® Indexis an unmanaged index considered representative of the US stock market. |
| ∎ | | TheS&P 500® Equal Weight Indexis the equally weighted version of the S&P 500 Index, which is considered representative of the US stock market. |
| ∎ | | TheLipper VUFMulti-Cap Core Funds Indexis an unmanaged index considered representative of multicap core variable insurance underlying funds tracked by Lipper. |
| ∎ | | A direct investment cannot be made in an index. Unless otherwise indicated, index results include reinvested dividends, and they do not reflect sales charges. Performance of the peer group, if applicable, reflects fund expenses; performance of a market index does not. |
Other information
| ∎ | | The returns shown in management’s discussion of Fund performance are based on net asset values calculated for shareholder transactions. Generally accepted accounting principles require adjustments to be made to the net assets of the Fund at period end for financial reporting purposes, and as such, the net asset values for shareholder transactions and the returns based on those net asset values may differ from the net asset values and returns reported in the Financial Highlights. Additionally, the returns and net asset values shown throughout this report are at the Fund level only and do not include variable product issuer charges. If such charges were included, the total returns would be lower. |
| ∎ | | Industry classifications used in this report are generally according to the Global Industry Classification Standard, which was developed by and is the exclusive property and a service mark of MSCI Inc. and Standard & Poor’s. |
Invesco V.I. Equally-Weighted S&P 500 Fund
Schedule of Investments(a)
December 31, 2019
| | | | | | | | |
| | | Shares | | | Value | |
Common Stocks & Other Equity Interests-98.14% | |
| Advertising-0.38% | |
Interpublic Group of Cos., Inc. (The) | | | 23,381 | | | $ | 540,101 | |
| |
Omnicom Group, Inc. | | | 6,562 | | | | 531,653 | |
| |
| | | | | | | 1,071,754 | |
| |
|
| Aerospace & Defense-2.10% | |
Arconic, Inc. | | | 17,013 | | | | 523,490 | |
| |
Boeing Co. (The) | | | 1,575 | | | | 513,072 | |
| |
General Dynamics Corp. | | | 3,006 | | | | 530,108 | |
| |
Huntington Ingalls Industries, Inc. | | | 2,142 | | | | 537,385 | |
| |
L3Harris Technologies, Inc. | | | 2,689 | | | | 532,073 | |
| |
Lockheed Martin Corp. | | | 1,392 | | | | 542,017 | |
| |
Northrop Grumman Corp. | | | 1,561 | | | | 536,937 | |
| |
Raytheon Co. | | | 2,476 | | | | 544,076 | |
| |
Textron, Inc. | | | 12,392 | | | | 552,683 | |
| |
TransDigm Group, Inc. | | | 934 | | | | 523,040 | |
| |
United Technologies Corp. | | | 3,612 | | | | 540,933 | |
| |
| | | | | | | 5,875,814 | |
| |
|
| Agricultural & Farm Machinery-0.19% | |
Deere & Co. | | | 3,129 | | | | 542,131 | |
| |
|
| Agricultural Products-0.20% | |
Archer-Daniels-Midland Co. | | | 11,912 | | | | 552,121 | |
| |
|
| Air Freight & Logistics-0.76% | |
C.H. Robinson Worldwide, Inc. | | | 7,034 | | | | 550,059 | |
| |
Expeditors International of
Washington, Inc. | | | 7,071 | | | | 551,680 | |
| |
FedEx Corp. | | | 3,249 | | | | 491,281 | |
| |
United Parcel Service, Inc., Class B | | | 4,539 | | | | 531,335 | |
| |
| | | | | | | 2,124,355 | |
| |
|
| Airlines-0.98% | |
Alaska Air Group, Inc. | | | 7,987 | | | | 541,119 | |
| |
American Airlines Group, Inc.(b) | | | 19,594 | | | | 561,956 | |
| |
Delta Air Lines, Inc. | | | 9,491 | | | | 555,034 | |
| |
Southwest Airlines Co. | | | 9,944 | | | | 536,777 | |
| |
United Airlines Holdings, Inc.(c) | | | 6,147 | | | | 541,489 | |
| |
| | | | | | | 2,736,375 | |
| |
|
| Alternative Carriers-0.19% | |
CenturyLink, Inc. | | | 39,594 | | | | 523,037 | |
| |
|
| Apparel Retail-0.79% | |
Gap, Inc. (The) | | | 32,262 | | | | 570,392 | |
| |
L Brands, Inc. | | | 30,422 | | | | 551,247 | |
| |
Ross Stores, Inc. | | | 4,662 | | | | 542,750 | |
| |
TJX Cos., Inc. (The) | | | 8,918 | | | | 544,533 | |
| |
| | | | | | | 2,208,922 | |
| |
| | | | | | | | |
| | | Shares | | | Value | |
| Apparel, Accessories & Luxury Goods-1.39% | |
Capri Holdings Ltd.(c) | | | 13,885 | | | $ | 529,713 | |
| |
Hanesbrands, Inc. | | | 37,394 | | | | 555,301 | |
| |
PVH Corp. | | | 5,156 | | | | 542,153 | |
| |
Ralph Lauren Corp. | | | 4,605 | | | | 539,798 | |
| |
Tapestry, Inc. | | | 20,758 | | | | 559,843 | |
| |
Under Armour, Inc., Class A(c) | | | 14,208 | | | | 306,893 | |
| |
Under Armour, Inc., Class C(c) | | | 14,677 | | | | 281,505 | |
| |
VF Corp. | | | 5,780 | | | | 576,035 | |
| |
| | | | | | | 3,891,241 | |
| |
|
| Application Software-1.57% | |
Adobe, Inc.(c) | | | 1,693 | | | | 558,368 | |
| |
ANSYS, Inc.(c) | | | 2,119 | | | | 545,452 | |
| |
Autodesk, Inc.(c) | | | 3,000 | | | | 550,380 | |
| |
Cadence Design Systems, Inc.(c) | | | 7,897 | | | | 547,736 | |
| |
Citrix Systems, Inc. | | | 4,879 | | | | 541,081 | |
| |
Intuit, Inc. | | | 2,073 | | | | 542,981 | |
| |
salesforce.com, inc.(c) | | | 3,333 | | | | 542,079 | |
| |
Synopsys, Inc.(c) | | | 3,945 | | | | 549,144 | |
| |
| | | | | | | 4,377,221 | |
| |
|
| Asset Management & Custody Banks-1.54% | |
Ameriprise Financial, Inc. | | | 3,214 | | | | 535,388 | |
| |
Bank of New York Mellon Corp. (The) | | | 10,722 | | | | 539,638 | |
| |
BlackRock, Inc. | | | 1,079 | | | | 542,413 | |
| |
Franklin Resources, Inc. | | | 20,718 | | | | 538,254 | |
| |
Invesco Ltd.(d) | | | 30,560 | | | | 549,469 | |
| |
Northern Trust Corp. | | | 4,983 | | | | 529,394 | |
| |
State Street Corp. | | | 6,804 | | | | 538,196 | |
| |
T. Rowe Price Group, Inc. | | | 4,352 | | | | 530,248 | |
| |
| | | | | | | 4,303,000 | |
| |
|
| Auto Parts & Equipment-0.39% | |
Aptiv PLC | | | 5,750 | | | | 546,078 | |
| |
BorgWarner, Inc. | | | 12,293 | | | | 533,270 | |
| |
| | | | | | | 1,079,348 | |
| |
|
| Automobile Manufacturers-0.39% | |
Ford Motor Co. | | | 58,339 | | | | 542,553 | |
| |
General Motors Co. | | | 15,104 | | | | 552,806 | |
| |
| | | | | | | 1,095,359 | |
| |
|
| Automotive Retail-0.75% | |
Advance Auto Parts, Inc. | | | 3,469 | | | | 555,595 | |
| |
AutoZone, Inc.(c) | | | 435 | | | | 518,220 | |
| |
CarMax, Inc.(c) | | | 5,500 | | | | 482,185 | |
| |
O’Reilly Automotive, Inc.(c) | | | 1,219 | | | | 534,239 | |
| |
| | | | | | | 2,090,239 | |
| |
|
| Biotechnology-1.53% | |
AbbVie, Inc. | | | 6,129 | | | | 542,662 | |
| |
See accompanying Notes to Financial Statements which are an integral part of the financial statements.
Invesco V.I. Equally-Weighted S&P 500 Fund
| | | | | | | | |
| | | Shares | | | Value | |
| Biotechnology-(continued) | |
Alexion Pharmaceuticals, Inc.(c) | | | 4,876 | | | $ | 527,339 | |
| |
Amgen, Inc. | | | 2,273 | | | | 547,952 | |
| |
Biogen, Inc.(c) | | | 1,813 | | | | 537,972 | |
| |
Gilead Sciences, Inc. | | | 8,186 | | | | 531,926 | |
| |
Incyte Corp.(c) | | | 5,883 | | | | 513,704 | |
| |
Regeneron Pharmaceuticals, Inc.(c) | | | 1,430 | | | | 536,936 | |
| |
Vertex Pharmaceuticals, Inc.(c) | | | 2,458 | | | | 538,179 | |
| |
| | | | | | | 4,276,670 | |
| |
|
| Brewers-0.20% | |
Molson Coors Beverage Co., Class B | | | 10,597 | | | | 571,178 | |
| |
| Broadcasting-0.60% | |
Discovery, Inc., Class A(c) | | | 5,475 | | | | 179,252 | |
| |
Discovery, Inc., Class C(c) | | | 12,021 | | | | 366,520 | |
| |
Fox Corp., Class A | | | 10,122 | | | | 375,223 | |
| |
Fox Corp., Class B | | | 4,636 | | | | 168,750 | |
| |
ViacomCBS, Inc. , Class B | | | 13,935 | | | | 584,852 | |
| |
| | | | | | | 1,674,597 | |
| |
|
| Building Products-0.98% | |
A.O. Smith Corp. | | | 11,574 | | | | 551,385 | |
| |
Allegion PLC | | | 4,377 | | | | 545,112 | |
| |
Fortune Brands Home & Security, Inc. | | | 8,272 | | | | 540,493 | |
| |
Johnson Controls International PLC | | | 13,315 | | | | 542,054 | |
| |
Masco Corp. | | | 11,454 | | | | 549,677 | |
| |
| | | | | | | 2,728,721 | |
| |
|
| Cable & Satellite-0.60% | |
Charter Communications, Inc., Class A(c) | | | 1,132 | | | | 549,111 | |
| |
Comcast Corp., Class A | | | 12,355 | | | | 555,604 | |
| |
DISH Network Corp., Class A(c) | | | 15,778 | | | | 559,646 | |
| |
| | | | | | | 1,664,361 | |
| |
|
| Casinos & Gaming-0.59% | |
Las Vegas Sands Corp. | | | 7,794 | | | | 538,098 | |
| |
MGM Resorts International | | | 16,441 | | | | 546,992 | |
| |
Wynn Resorts Ltd. | | | 4,148 | | | | 576,033 | |
| |
| | | | | | | 1,661,123 | |
| |
|
| Commodity Chemicals-0.39% | |
Dow, Inc. | | | 10,106 | | | | 553,102 | |
| |
LyondellBasell Industries N.V., Class A | | | 5,813 | | | | 549,212 | |
| |
| | | | | | | 1,102,314 | |
| |
|
| Communications Equipment-0.99% | |
Arista Networks, Inc.(c) | | | 2,790 | | | | 567,486 | |
| |
Cisco Systems, Inc. | | | 11,886 | | | | 570,053 | |
| |
F5 Networks, Inc.(c) | | | 3,866 | | | | 539,887 | |
| |
Juniper Networks, Inc. | | | 22,315 | | | | 549,618 | |
| |
Motorola Solutions, Inc. | | | 3,355 | | | | 540,625 | |
| |
| | | | | | | 2,767,669 | |
| |
|
| Computer & Electronics Retail-0.20% | |
Best Buy Co., Inc. | | | 6,349 | | | | 557,442 | |
| |
| | | | | | | | |
| | | Shares | | | Value | |
| Construction & Engineering-0.38% | |
Jacobs Engineering Group, Inc. | | | 5,980 | | | $ | 537,184 | |
| |
Quanta Services, Inc. | | | 13,113 | | | | 533,830 | |
| |
| | | | | | | 1,071,014 | |
| |
|
| Construction Machinery & Heavy Trucks-0.77% | |
Caterpillar, Inc. | | | 3,700 | | | | 546,416 | |
| |
Cummins, Inc. | | | 2,950 | | | | 527,932 | |
| |
PACCAR, Inc. | | | 6,565 | | | | 519,292 | |
| |
Westinghouse Air Brake Technologies Corp. | | | 7,164 | | | | 557,359 | |
| |
| | | | | | | 2,150,999 | |
| |
|
| Construction Materials-0.39% | |
Martin Marietta Materials, Inc. | | | 1,948 | | | | 544,739 | |
| |
Vulcan Materials Co. | | | 3,765 | | | | 542,122 | |
| |
| | | | | | | 1,086,861 | |
| |
|
| Consumer Electronics-0.19% | |
Garmin Ltd. | | | 5,526 | | | | 539,117 | |
| |
|
| Consumer Finance-0.76% | |
American Express Co.(b) | | | 4,317 | | | | 537,423 | |
| |
Capital One Financial Corp. | | | 5,158 | | | | 530,810 | |
| |
Discover Financial Services | | | 6,211 | | | | 526,817 | |
| |
Synchrony Financial | | | 14,286 | | | | 514,439 | |
| |
| | | | | | | 2,109,489 | |
| |
| Copper-0.20% | |
Freeport-McMoRan, Inc. | | | 41,839 | | | | 548,928 | |
| |
|
| Data Processing & Outsourced Services-2.51% | |
Alliance Data Systems Corp. | | | 4,892 | | | | 548,882 | |
| |
Automatic Data Processing, Inc. | | | 3,190 | | | | 543,895 | |
| |
Broadridge Financial Solutions, Inc. | | | 4,497 | | | | 555,559 | |
| |
Fidelity National Information Services, Inc. | | | 3,896 | | | | 541,895 | |
| |
Fiserv, Inc.(c) | | | 4,611 | | | | 533,170 | |
| |
FleetCor Technologies, Inc.(c) | | | 1,771 | | | | 509,552 | |
| |
Global Payments, Inc. | | | 3,008 | | | | 549,140 | |
| |
Jack Henry & Associates, Inc. | | | 3,691 | | | | 537,668 | |
| |
Mastercard, Inc., Class A | | | 1,818 | | | | 542,837 | |
| |
Paychex, Inc. | | | 6,342 | | | | 539,451 | |
| |
PayPal Holdings, Inc.(c) | | | 5,001 | | | | 540,958 | |
| |
Visa, Inc., Class A | | | 2,907 | | | | 546,225 | |
| |
Western Union Co. (The) | | | 19,775 | | | | 529,575 | |
| |
| | | | | | | 7,018,807 | |
| |
|
| Department Stores-0.62% | |
Kohl’s Corp. | | | 11,152 | | | | 568,194 | |
| |
Macy’s, Inc. | | | 35,472 | | | | 603,024 | |
| |
Nordstrom, Inc. | | | 14,030 | | | | 574,248 | |
| |
| | | | | | | 1,745,466 | |
| |
|
| Distillers & Vintners-0.41% | |
Brown-Forman Corp., Class B | | | 8,432 | | | | 570,003 | |
| |
Constellation Brands, Inc., Class A | | | 2,956 | | | | 560,901 | |
| |
| | | | | | | 1,130,904 | |
| |
See accompanying Notes to Financial Statements which are an integral part of the financial statements.
Invesco V.I. Equally-Weighted S&P 500 Fund
| | | | | | | | |
| | | Shares | | | Value | |
| Distributors-0.39% | |
Genuine Parts Co. | | | 5,120 | | | $ | 543,897 | |
| |
LKQ Corp.(c) | | | 14,911 | | | | 532,323 | |
| |
| | | | | | | 1,076,220 | |
| |
|
| Diversified Banks-0.98% | |
Bank of America Corp. | | | 15,634 | | | | 550,629 | |
| |
Citigroup, Inc. | | | 7,048 | | | | 563,065 | |
| |
JPMorgan Chase & Co. | | | 3,935 | | | | 548,539 | |
| |
U.S. Bancorp | | | 8,933 | | | | 529,638 | |
| |
Wells Fargo & Co. | | | 10,010 | | | | 538,538 | |
| |
| | | | | | | 2,730,409 | |
| |
|
| Diversified Chemicals-0.19% | |
Eastman Chemical Co. | | | 6,858 | | | | 543,565 | |
| |
|
| Diversified Support Services-0.40% | |
Cintas Corp. | | | 2,048 | | | | 551,076 | |
| |
Copart, Inc.(c) | | | 6,075 | | | | 552,460 | |
| |
| | | | | | | 1,103,536 | |
| |
|
| Drug Retail-0.20% | |
Walgreens Boots Alliance, Inc. | | | 9,346 | | | | 551,040 | |
| |
|
| Electric Utilities-2.78% | |
Alliant Energy Corp. | | | 10,174 | | | | 556,721 | |
| |
American Electric Power Co., Inc. | | | 5,849 | | | | 552,789 | |
| |
Duke Energy Corp. | | | 5,975 | | | | 544,980 | |
| |
Edison International | | | 7,407 | | | | 558,562 | |
| |
Entergy Corp. | | | 4,560 | | | | 546,288 | |
| |
Evergy, Inc. | | | 8,579 | | | | 558,407 | |
| |
Eversource Energy | | | 6,620 | | | | 563,163 | |
| |
Exelon Corp. | | | 12,287 | | | | 560,164 | |
| |
FirstEnergy Corp. | | | 11,229 | | | | 545,729 | |
| |
NextEra Energy, Inc. | | | 2,271 | | | | 549,945 | |
| |
Pinnacle West Capital Corp. | | | 6,250 | | | | 562,063 | |
| |
PPL Corp. | | | 15,108 | | | | 542,075 | |
| |
Southern Co. (The) | | | 8,861 | | | | 564,446 | |
| |
Xcel Energy, Inc. | | | 8,648 | | | | 549,062 | |
| |
| | | | | | | 7,754,394 | |
| |
|
| Electrical Components & Equipment-0.78% | |
AMETEK, Inc. | | | 5,462 | | | | 544,780 | |
| |
Eaton Corp. PLC | | | 5,752 | | | | 544,829 | |
| |
Emerson Electric Co. | | | 7,087 | | | | 540,455 | |
| |
Rockwell Automation, Inc. | | | 2,645 | | | | 536,062 | |
| |
| | | | | | | 2,166,126 | |
| |
|
| Electronic Components-0.39% | |
Amphenol Corp., Class A | | | 5,025 | | | | 543,856 | |
| |
Corning, Inc. | | | 18,735 | | | | 545,376 | |
| |
| | | | | | | 1,089,232 | |
| |
|
| Electronic Equipment & Instruments-0.56% | |
FLIR Systems, Inc. | | | 10,127 | | | | 527,313 | |
| |
Keysight Technologies, Inc.(c) | | | 4,994 | | | | 512,534 | |
| |
| | | | | | | | |
| | | Shares | | | Value | |
| Electronic Equipment & Instruments-(continued) | |
Zebra Technologies Corp., Class A(c) | | | 2,088 | | | $ | 533,359 | |
| |
| | | | | | | 1,573,206 | |
| |
|
| Electronic Manufacturing Services-0.39% | |
IPG Photonics Corp.(c) | | | 3,723 | | | | 539,537 | |
| |
TE Connectivity Ltd. | | | 5,727 | | | | 548,876 | |
| |
| | | | | | | 1,088,413 | |
| |
|
| Environmental & Facilities Services-0.58% | |
Republic Services, Inc. | | | 6,039 | | | | 541,276 | |
| |
Rollins, Inc. | | | 16,341 | | | | 541,867 | |
| |
Waste Management, Inc. | | | 4,806 | | | | 547,692 | |
| |
| | | | | | | 1,630,835 | |
| |
|
| Fertilizers & Agricultural Chemicals-0.84% | |
CF Industries Holdings, Inc. | | | 11,928 | | | | 569,443 | |
| |
Corteva, Inc. | | | 20,327 | | | | 600,866 | |
| |
FMC Corp. | | | 5,428 | | | | 541,823 | |
| |
Mosaic Co. (The) | | | 28,903 | | | | 625,461 | |
| |
| | | | | | | 2,337,593 | |
| |
|
| Financial Exchanges & Data-1.56% | |
Cboe Global Markets, Inc. | | | 4,660 | | | | 559,200 | |
| |
CME Group, Inc., Class A | | | 2,631 | | | | 528,094 | |
| |
Intercontinental Exchange, Inc. | | | 5,858 | | | | 542,158 | |
| |
MarketAxess Holdings, Inc. | | | 1,439 | | | | 545,539 | |
| |
Moody’s Corp. | | | 2,289 | | | | 543,432 | |
| |
MSCI, Inc. | | | 2,069 | | | | 534,175 | |
| |
Nasdaq, Inc. | | | 5,153 | | | | 551,886 | |
| |
S&P Global, Inc. | | | 1,984 | | | | 541,731 | |
| |
| | | | | | | 4,346,215 | |
| |
|
| Food Distributors-0.20% | |
Sysco Corp. | | | 6,444 | | | | 551,220 | |
| |
|
| Food Retail-0.20% | |
Kroger Co. (The) | | | 19,169 | | | | 555,709 | |
| |
|
| Footwear-0.20% | |
NIKE, Inc., Class B | | | 5,506 | | | | 557,813 | |
| |
|
| Gas Utilities-0.20% | |
Atmos Energy Corp. | | | 5,029 | | | | 562,544 | |
| |
|
| General Merchandise Stores-0.58% | |
Dollar General Corp. | | | 3,482 | | | | 543,122 | |
| |
Dollar Tree, Inc.(c) | | | 5,752 | | | | 540,976 | |
| |
Target Corp. | | | 4,232 | | | | 542,585 | |
| |
| | | | | | | 1,626,683 | |
| |
|
| Gold-0.20% | |
Newmont Goldcorp Corp. | | | 13,040 | | | | 566,588 | |
| |
|
| Health Care Distributors-0.75% | |
AmerisourceBergen Corp. | | | 6,345 | | | | 539,452 | |
| |
Cardinal Health, Inc. | | | 10,035 | | | | 507,570 | |
| |
See accompanying Notes to Financial Statements which are an integral part of the financial statements.
Invesco V.I. Equally-Weighted S&P 500 Fund
| | | | | | | | |
| | | Shares | | | Value | |
| Health Care Distributors-(continued) | |
Henry Schein, Inc.(c) | | | 7,861 | | | $ | 524,486 | |
| |
McKesson Corp. | | | 3,829 | | | | 529,627 | |
| |
| | | | | | | 2,101,135 | |
| |
|
| Health Care Equipment-3.30% | |
Abbott Laboratories | | | 6,247 | | | | 542,614 | |
| |
ABIOMED, Inc.(c) | | | 2,960 | | | | 504,946 | |
| |
Baxter International, Inc. | | | 6,412 | | | | 536,171 | |
| |
Becton, Dickinson and Co. | | | 2,003 | | | | 544,756 | |
| |
Boston Scientific Corp.(c) | | | 11,941 | | | | 539,972 | |
| |
Danaher Corp. | | | 3,620 | | | | 555,598 | |
| |
Edwards Lifesciences Corp.(c) | | | 2,307 | | | | 538,200 | |
| |
Hologic, Inc.(c) | | | 10,131 | | | | 528,939 | |
| |
IDEXX Laboratories, Inc.(c) | | | 2,128 | | | | 555,685 | |
| |
Intuitive Surgical, Inc.(c) | | | 928 | | | | 548,587 | |
| |
Medtronic PLC | | | 4,719 | | | | 535,371 | |
| |
ResMed, Inc. | | | 3,504 | | | | 543,015 | |
| |
STERIS PLC | | | 3,544 | | | | 540,176 | |
| |
Stryker Corp. | | | 2,652 | | | | 556,761 | |
| |
Teleflex, Inc. | | | 1,495 | | | | 562,778 | |
| |
Varian Medical Systems, Inc.(c) | | | 3,804 | | | | 540,206 | |
| |
Zimmer Biomet Holdings, Inc. | | | 3,629 | | | | 543,189 | |
| |
| | | | | | | 9,216,964 | |
| |
|
| Health Care Facilities-0.39% | |
HCA Healthcare, Inc. | | | 3,769 | | | | 557,096 | |
| |
Universal Health Services, Inc., Class B | | | 3,730 | | | | 535,106 | |
| |
| | | | | | | 1,092,202 | |
| |
|
| Health Care REITs-0.61% | |
Healthpeak Properties, Inc. | | | 16,697 | | | | 575,546 | |
| |
Ventas, Inc. | | | 9,701 | | | | 560,136 | |
| |
Welltower, Inc. | | | 6,844 | | | | 559,702 | |
| |
| | | | | | | 1,695,384 | |
| |
|
| Health Care Services-0.99% | |
Cigna Corp. | | | 2,835 | | | | 579,729 | |
| |
CVS Health Corp. | | | 7,317 | | | | 543,580 | |
| |
DaVita, Inc.(c) | | | 7,405 | | | | 555,597 | |
| |
Laboratory Corp. of America Holdings(c) | | | 3,231 | | | | 546,589 | |
| |
Quest Diagnostics, Inc. | | | 5,118 | | | | 546,551 | |
| |
| | | | | | | 2,772,046 | |
| |
|
| Health Care Supplies-0.59% | |
Align Technology, Inc.(c) | | | 2,023 | | | | 564,498 | |
| |
Cooper Cos., Inc. (The) | | | 1,696 | | | | 544,908 | |
| |
DENTSPLY SIRONA, Inc. | | | 9,550 | | | | 540,434 | |
| |
| | | | | | | 1,649,840 | |
| |
|
| Health Care Technology-0.20% | |
Cerner Corp. | | | 7,454 | | | | 547,049 | |
| |
|
| Home Furnishings-0.38% | |
Leggett & Platt, Inc. | | | 10,616 | | | | 539,611 | |
| |
| | | | | | | | |
| | | Shares | | | Value | |
| Home Furnishings-(continued) | |
Mohawk Industries, Inc.(c) | | | 3,903 | | | $ | 532,291 | |
| |
| | | | | | | 1,071,902 | |
| |
|
| Home Improvement Retail-0.39% | |
Home Depot, Inc. (The) | | | 2,514 | | | | 549,007 | |
| |
Lowe’s Cos., Inc. | | | 4,566 | | | | 546,824 | |
| |
| | | | | | | 1,095,831 | |
| |
|
| Homebuilding-0.75% | |
D.R. Horton, Inc. | | | 9,823 | | | | 518,163 | |
| |
Lennar Corp., Class A | | | 9,235 | | | | 515,221 | |
| |
NVR, Inc.(c) | | | 141 | | | | 536,986 | |
| |
PulteGroup, Inc. | | | 13,335 | | | | 517,398 | |
| |
| | | | | | | 2,087,768 | |
| |
|
| Hotel & Resort REITs-0.20% | |
Host Hotels & Resorts, Inc. | | | 29,998 | | | | 556,463 | |
| |
|
| Hotels, Resorts & Cruise Lines-1.01% | |
Carnival Corp. | | | 11,347 | | | | 576,768 | |
| |
Hilton Worldwide Holdings, Inc. | | | 5,022 | | | | 556,990 | |
| |
Marriott International, Inc., Class A | | | 3,684 | | | | 557,868 | |
| |
Norwegian Cruise Line Holdings Ltd.(c) | | | 9,652 | | | | 563,773 | |
| |
Royal Caribbean Cruises Ltd. | | | 4,285 | | | | 572,091 | |
| |
| | | | | | | 2,827,490 | |
| |
|
| Household Appliances-0.19% | |
Whirlpool Corp. | | | 3,627 | | | | 535,091 | |
| |
|
| Household Products-0.97% | |
Church & Dwight Co., Inc. | | | 7,693 | | | | 541,126 | |
| |
Clorox Co. (The) | | | 3,549 | | | | 544,913 | |
| |
Colgate-Palmolive Co. | | | 7,838 | | | | 539,568 | |
| |
Kimberly-Clark Corp. | | | 3,960 | | | | 544,698 | |
| |
Procter & Gamble Co. (The) | | | 4,291 | | | | 535,946 | |
| |
| | | | | | | 2,706,251 | |
| |
|
| Housewares & Specialties-0.19% | |
Newell Brands, Inc. | | | 28,041 | | | | 538,948 | |
| |
|
| Human Resource & Employment Services-0.20% | |
Robert Half International, Inc. | | | 8,735 | | | | 551,615 | |
| |
|
| Hypermarkets & Super Centers-0.38% | |
Costco Wholesale Corp. | | | 1,844 | | | | 541,988 | |
| |
Walmart, Inc. | | | 4,476 | | | | 531,928 | |
| |
| | | | | | | 1,073,916 | |
| |
|
| Independent Power Producers & Energy Traders-0.40% | |
AES Corp. (The) | | | 28,460 | | | | 566,354 | |
| |
NRG Energy, Inc. | | | 13,677 | | | | 543,661 | |
| |
| | | | | | | 1,110,015 | |
| |
|
| Industrial Conglomerates-0.78% | |
3M Co. | | | 3,189 | | | | 562,603 | |
| |
General Electric Co. | | | 47,484 | | | | 529,922 | |
| |
See accompanying Notes to Financial Statements which are an integral part of the financial statements.
Invesco V.I. Equally-Weighted S&P 500 Fund
| | | | | | | | |
| | | Shares | | | Value | |
| Industrial Conglomerates-(continued) | |
Honeywell International, Inc. | | | 3,037 | | | $ | 537,549 | |
| |
Roper Technologies, Inc. | | | 1,535 | | | | 543,743 | |
| |
| | | | | | | 2,173,817 | |
| |
|
| Industrial Gases-0.39% | |
Air Products and Chemicals, Inc. | | | 2,328 | | | | 547,057 | |
| |
Linde PLC (United Kingdom) | | | 2,575 | | | | 548,217 | |
| |
| | | | | | | 1,095,274 | |
| |
|
| Industrial Machinery-2.14% | |
Dover Corp. | | | 4,737 | | | | 545,987 | |
| |
Flowserve Corp. | | | 11,122 | | | | 553,542 | |
| |
Fortive Corp. | | | 7,161 | | | | 547,029 | |
| |
IDEX Corp. | | | 3,216 | | | | 553,152 | |
| |
Illinois Tool Works, Inc. | | | 3,036 | | | | 545,357 | |
| |
Ingersoll-Rand PLC | | | 4,024 | | | | 534,870 | |
| |
Parker-Hannifin Corp. | | | 2,606 | | | | 536,367 | |
| |
Pentair PLC | | | 11,743 | | | | 538,651 | |
| |
Snap-on, Inc. | | | 3,159 | | | | 535,135 | |
| |
Stanley Black & Decker, Inc. | | | 3,271 | | | | 542,135 | |
| |
Xylem, Inc. | | | 6,928 | | | | 545,857 | |
| |
| | | | | | | 5,978,082 | |
| |
|
| Industrial REITs-0.39% | |
Duke Realty Corp. | | | 15,739 | | | | 545,671 | |
| |
Prologis, Inc. | | | 6,052 | | | | 539,475 | |
| |
| | | | | | | 1,085,146 | |
| |
|
| Insurance Brokers-0.78% | |
Aon PLC | | | 2,611 | | | | 543,845 | |
| |
Arthur J. Gallagher & Co. | | | 5,700 | | | | 542,811 | |
| |
Marsh & McLennan Cos., Inc. | | | 4,870 | | | | 542,567 | |
| |
Willis Towers Watson PLC | | | 2,691 | | | | 543,420 | |
| |
| | | | | | | 2,172,643 | |
| |
|
| Integrated Oil & Gas-0.60% | |
Chevron Corp. | | | 4,564 | | | | 550,008 | |
| |
Exxon Mobil Corp. | | | 7,777 | | | | 542,679 | |
| |
Occidental Petroleum Corp. | | | 14,279 | | | | 588,437 | |
| |
| | | | | | | 1,681,124 | |
| |
|
| Integrated Telecommunication Services-0.39% | |
AT&T, Inc. | | | 14,074 | | | | 550,012 | |
| |
Verizon Communications, Inc. | | | 8,854 | | | | 543,635 | |
| |
| | | | | | | 1,093,647 | |
| |
|
| Interactive Home Entertainment-0.59% | |
Activision Blizzard, Inc. | | | 9,151 | | | | 543,753 | |
| |
Electronic Arts, Inc.(c) | | | 5,149 | | | | 553,569 | |
| |
Take-Two Interactive Software, Inc.(c) | | | 4,419 | | | | 541,018 | |
| |
| | | | | | | 1,638,340 | |
| |
|
| Interactive Media & Services-0.60% | |
Alphabet, Inc., Class A(c) | | | 198 | | | | 265,199 | |
| |
Alphabet, Inc., Class C(c) | | | 200 | | | | 267,404 | |
| |
| | | | | | | | |
| | | Shares | | | Value | |
| Interactive Media & Services-(continued) | |
Facebook, Inc., Class A(c) | | | 2,771 | | | $ | 568,748 | |
| |
Twitter, Inc.(c) | | | 17,718 | | | | 567,862 | |
| |
| | | | | | | 1,669,213 | |
| |
|
| Internet & Direct Marketing Retail-0.78% | |
Amazon.com, Inc.(c) | | | 305 | | | | 563,591 | |
| |
Booking Holdings, Inc.(c) | | | 272 | | | | 558,615 | |
| |
eBay, Inc. | | | 15,176 | | | | 548,005 | |
| |
Expedia Group, Inc. | | | 4,775 | | | | 516,369 | |
| |
| | | | | | | 2,186,580 | |
| |
|
| Internet Services & Infrastructure-0.39% | |
Akamai Technologies, Inc.(c) | | | 6,357 | | | | 549,118 | |
| |
VeriSign, Inc.(c) | | | 2,811 | | | | 541,623 | |
| |
| | | | | | | 1,090,741 | |
| |
|
| Investment Banking & Brokerage-0.96% | |
Charles Schwab Corp. (The) | | | 10,780 | | | | 512,697 | |
| |
E*TRADE Financial Corp. | | | 11,925 | | | | 541,037 | |
| |
Goldman Sachs Group, Inc. (The) | | | 2,392 | | | | 549,993 | |
| |
Morgan Stanley | | | 10,717 | | | | 547,853 | |
| |
Raymond James Financial, Inc. | | | 5,949 | | | | 532,197 | |
| |
| | | | | | | 2,683,777 | |
| |
|
| IT Consulting & Other Services-1.17% | |
Accenture PLC, Class A | | | 2,604 | | | | 548,324 | |
| |
Cognizant Technology Solutions Corp., Class A | | | 8,735 | | | | 541,745 | |
| |
DXC Technology Co. | | | 14,351 | | | | 539,454 | |
| |
Gartner, Inc.(c) | | | 3,415 | | | | 526,252 | |
| |
International Business Machines Corp. | | | 4,012 | | | | 537,768 | |
| |
Leidos Holdings, Inc. | | | 5,862 | | | | 573,831 | |
| |
| | | | | | | 3,267,374 | |
| |
|
| Leisure Products-0.20% | |
Hasbro, Inc. | | | 5,181 | | | | 547,165 | |
| |
|
| Life & Health Insurance-1.34% | |
Aflac, Inc. | | | 10,127 | | | | 535,718 | |
| |
Globe Life, Inc. | | | 5,097 | | | | 536,459 | |
| |
Lincoln National Corp. | | | 9,014 | | | | 531,916 | |
| |
MetLife, Inc. | | | 10,701 | | | | 545,430 | |
| |
Principal Financial Group, Inc. | | | 9,918 | | | | 545,490 | |
| |
Prudential Financial, Inc. | | | 5,719 | | | | 536,099 | |
| |
Unum Group | | | 17,747 | | | | 517,503 | |
| |
| | | | | | | 3,748,615 | |
| |
|
| Life Sciences Tools & Services-1.38% | |
Agilent Technologies, Inc. | | | 6,431 | | | | 548,629 | |
| |
Illumina, Inc.(c) | | | 1,657 | | | | 549,693 | |
| |
IQVIA Holdings, Inc.(c) | | | 3,717 | | | | 574,314 | |
| |
Mettler-Toledo International, Inc.(c) | | | 699 | | | | 554,503 | |
| |
PerkinElmer, Inc. | | | 5,704 | | | | 553,858 | |
| |
Thermo Fisher Scientific, Inc. | | | 1,679 | | | | 545,457 | |
| |
See accompanying Notes to Financial Statements which are an integral part of the financial statements.
Invesco V.I. Equally-Weighted S&P 500 Fund
| | | | | | | | |
| | | Shares | | | Value | |
| Life Sciences Tools & Services-(continued) | |
Waters Corp.(c) | | | 2,299 | | | $ | 537,161 | |
| |
| | | | | | | 3,863,615 | |
| |
|
| Managed Health Care-1.02% | |
Anthem, Inc. | | | 1,894 | | | | 572,045 | |
| |
Centene Corp.(c) | | | 9,330 | | | | 586,577 | |
| |
Humana, Inc. | | | 1,524 | | | | 558,576 | |
| |
UnitedHealth Group, Inc. | | | 1,885 | | | | 554,152 | |
| |
WellCare Health Plans, Inc.(c) | | | 1,722 | | | | 568,622 | |
| |
| | | | | | | 2,839,972 | |
| |
|
| Metal & Glass Containers-0.20% | |
Ball Corp. | | | 8,500 | | | | 549,695 | |
| |
|
| Motorcycle Manufacturers-0.19% | |
Harley-Davidson, Inc. | | | 14,416 | | | | 536,131 | |
| |
|
| Movies & Entertainment-0.61% | |
Live Nation Entertainment, Inc.(c) | | | 8,368 | | | | 598,061 | |
| |
Netflix, Inc.(c) | | | 1,803 | | | | 583,397 | |
| |
Walt Disney Co. (The) | | | 3,678 | | | | 531,949 | |
| |
| | | | | | | 1,713,407 | |
| |
|
| Multi-line Insurance-0.58% | |
American International Group, Inc. | | | 10,435 | | | | 535,629 | |
| |
Assurant, Inc. | | | 4,141 | | | | 542,802 | |
| |
Hartford Financial Services Group, Inc. (The) | | | 8,816 | | | | 535,748 | |
| |
| | | | | | | 1,614,179 | |
| |
|
| Multi-Sector Holdings-0.19% | |
Berkshire Hathaway, Inc., Class B(c) | | | 2,385 | | | | 540,202 | |
| |
|
| Multi-Utilities-1.98% | |
Ameren Corp. | | | 7,177 | | | | 551,194 | |
| |
CenterPoint Energy, Inc. | | | 20,758 | | | | 566,071 | |
| |
CMS Energy Corp. | | | 8,828 | | | | 554,751 | |
| |
Consolidated Edison, Inc. | | | 6,130 | | | | 554,581 | |
| |
Dominion Energy, Inc. | | | 6,657 | | | | 551,333 | |
| |
DTE Energy Co. | | | 4,312 | | | | 559,999 | |
| |
NiSource, Inc. | | | 20,032 | | | | 557,691 | |
| |
Public Service Enterprise Group, Inc. | | | 9,196 | | | | 543,024 | |
| |
Sempra Energy | | | 3,602 | | | | 545,631 | |
| |
WEC Energy Group, Inc. | | | 6,037 | | | | 556,792 | |
| |
| | | | | | | 5,541,067 | |
| |
|
| Office REITs-0.79% | |
Alexandria Real Estate Equities, Inc. | | | 3,441 | | | | 555,997 | |
| |
Boston Properties, Inc. | | | 3,985 | | | | 549,372 | |
| |
SL Green Realty Corp. | | | 6,069 | | | | 557,620 | |
| |
Vornado Realty Trust | | | 8,257 | | | | 549,090 | |
| |
| | | | | | | 2,212,079 | |
| |
|
| Oil & Gas Drilling-0.21% | |
Helmerich & Payne, Inc. | | | 12,792 | | | | 581,141 | |
| |
| | | | | | | | |
| | | Shares | | | Value | |
| Oil & Gas Equipment & Services-1.01% | |
Baker Hughes Co., Class A | | | 22,783 | | | $ | 583,928 | |
| |
Halliburton Co. | | | 22,445 | | | | 549,229 | |
| |
National Oilwell Varco, Inc. | | | 22,594 | | | | 565,980 | |
| |
Schlumberger Ltd. | | | 13,766 | | | | 553,393 | |
| |
TechnipFMC PLC (United Kingdom) | | | 26,923 | | | | 577,229 | |
| |
| | | | | | | 2,829,759 | |
| |
|
| Oil & Gas Exploration & Production-2.54% | |
Apache Corp. | | | 25,221 | | | | 645,405 | |
| |
Cabot Oil & Gas Corp. | | | 33,445 | | | | 582,277 | |
| |
Cimarex Energy Co. | | | 11,201 | | | | 587,941 | |
| |
Concho Resources, Inc. | | | 6,837 | | | | 598,716 | |
| |
ConocoPhillips | | | 8,587 | | | | 558,413 | |
| |
Devon Energy Corp. | | | 22,932 | | | | 595,544 | |
| |
Diamondback Energy, Inc. | | | 6,327 | | | | 587,525 | |
| |
EOG Resources, Inc. | | | 7,132 | | | | 597,376 | |
| |
Hess Corp. | | | 8,639 | | | | 577,172 | |
| |
Marathon Oil Corp. | | | 42,332 | | | | 574,869 | |
| |
Noble Energy, Inc. | | | 24,060 | | | | 597,650 | |
| |
Pioneer Natural Resources Co. | | | 3,846 | | | | 582,169 | |
| |
| | | | | | | 7,085,057 | |
| |
|
| Oil & Gas Refining & Marketing-0.78% | |
HollyFrontier Corp. | | | 10,728 | | | | 544,017 | |
| |
Marathon Petroleum Corp. | | | 9,186 | | | | 553,456 | |
| |
Phillips 66 | | | 4,765 | | | | 530,869 | |
| |
Valero Energy Corp. | | | 5,739 | | | | 537,457 | |
| |
| | | | | | | 2,165,799 | |
| |
|
| Oil & Gas Storage & Transportation-0.60% | |
Kinder Morgan, Inc. | | | 26,657 | | | | 564,329 | |
| |
ONEOK, Inc. | | | 7,359 | | | | 556,855 | |
| |
Williams Cos., Inc. (The) | | | 23,711 | | | | 562,425 | |
| |
| | | | | | | 1,683,609 | |
| |
|
| Packaged Foods & Meats-2.40% | |
Campbell Soup Co. | | | 11,288 | | | | 557,853 | |
| |
Conagra Brands, Inc. | | | 18,973 | | | | 649,635 | |
| |
General Mills, Inc. | | | 10,435 | | | | 558,899 | |
| |
Hershey Co. (The) | | | 3,659 | | | | 537,800 | |
| |
Hormel Foods Corp. | | | 11,943 | | | | 538,749 | |
| |
JM Smucker Co. (The) | | | 5,304 | | | | 552,306 | |
| |
Kellogg Co. | | | 8,127 | | | | 562,063 | |
| |
Kraft Heinz Co. (The) | | | 17,040 | | | | 547,495 | |
| |
Lamb Weston Holdings, Inc. | | | 6,401 | | | | 550,678 | |
| |
McCormick & Co., Inc. | | | 3,213 | | | | 545,342 | |
| |
Mondelez International, Inc., Class A | | | 10,114 | | | | 557,079 | |
| |
Tyson Foods, Inc., Class A | | | 6,120 | | | | 557,165 | |
| |
| | | | | | | 6,715,064 | |
| |
|
| Paper Packaging-1.18% | |
Amcor PLC | | | 50,992 | | | | 552,753 | |
| |
Avery Dennison Corp. | | | 4,142 | | | | 541,856 | |
| |
International Paper Co. | | | 11,614 | | | | 534,825 | |
| |
See accompanying Notes to Financial Statements which are an integral part of the financial statements.
Invesco V.I. Equally-Weighted S&P 500 Fund
| | | | | | | | |
| | | Shares | | | Value | |
| Paper Packaging-(continued) | |
Packaging Corp. of America | | | 4,848 | | | $ | 542,928 | |
| |
Sealed Air Corp. | | | 14,166 | | | | 564,232 | |
| |
Westrock Co. | | | 13,142 | | | | 563,923 | |
| |
| | | | | | | 3,300,517 | |
| |
|
| Personal Products-0.39% | |
Coty, Inc., Class A | | | 48,559 | | | | 546,289 | |
| |
Estee Lauder Cos., Inc. (The), Class A | | | 2,649 | | | | 547,124 | |
| |
| | | | | | | 1,093,413 | |
| |
|
| Pharmaceuticals-1.78% | |
Allergan PLC | | | 2,858 | | | | 546,364 | |
| |
Bristol-Myers Squibb Co. | | | 8,436 | | | | 541,507 | |
| |
Eli Lilly and Co. | | | 4,430 | | | | 582,235 | |
| |
Johnson & Johnson | | | 3,808 | | | | 555,473 | |
| |
Merck & Co., Inc. | | | 6,036 | | | | 548,974 | |
| |
Mylan N.V.(c) | | | 28,133 | | | | 565,473 | |
| |
Perrigo Co. PLC | | | 9,984 | | | | 515,774 | |
| |
Pfizer, Inc. | | | 14,023 | | | | 549,421 | |
| |
Zoetis, Inc. | | | 4,326 | | | | 572,546 | |
| |
| | | | | | | 4,977,767 | |
| |
|
| Property & Casualty Insurance-1.36% | |
Allstate Corp. (The) | | | 4,915 | | | | 552,692 | |
| |
Chubb Ltd. | | | 3,482 | | | | 542,008 | |
| |
Cincinnati Financial Corp. | | | 5,105 | | | | 536,791 | |
| |
Loews Corp. | | | 10,639 | | | | 558,441 | |
| |
Progressive Corp. (The) | | | 7,461 | | | | 540,102 | |
| |
Travelers Cos., Inc. (The) | | | 3,969 | | | | 543,554 | |
| |
W.R. Berkley Corp. | | | 7,740 | | | | 534,834 | |
| |
| | | | | | | 3,808,422 | |
| |
|
| Publishing-0.20% | |
News Corp., Class A | | | 29,945 | | | | 423,422 | |
| |
News Corp., Class B | | | 9,454 | | | | 137,178 | |
| |
| | | | | | | 560,600 | |
| |
|
| Railroads-0.78% | |
CSX Corp. | | | 7,398 | | | | 535,319 | |
| |
Kansas City Southern | | | 3,555 | | | | 544,484 | |
| |
Norfolk Southern Corp. | | | 2,846 | | | | 552,494 | |
| |
Union Pacific Corp. | | | 3,040 | | | | 549,602 | |
| |
| | | | | | | 2,181,899 | |
| |
|
| Real Estate Services-0.20% | |
CBRE Group, Inc., Class A(c) | | | 9,241 | | | | 566,381 | |
| |
|
| Regional Banks-2.52% | |
Citizens Financial Group, Inc. | | | 13,421 | | | | 545,027 | |
| |
Comerica, Inc. | | | 7,485 | | | | 537,049 | |
| |
Fifth Third Bancorp | | | 17,386 | | | | 534,446 | |
| |
First Republic Bank | | | 4,686 | | | | 550,371 | |
| |
Huntington Bancshares, Inc. | | | 35,094 | | | | 529,217 | |
| |
KeyCorp | | | 26,843 | | | | 543,302 | |
| |
M&T Bank Corp. | | | 3,164 | | | | 537,089 | |
| |
| | | | | | | | |
| | | Shares | | | Value | |
| Regional Banks-(continued) | |
People’s United Financial, Inc. | | | 32,340 | | | $ | 546,546 | |
| |
PNC Financial Services Group, Inc. (The) | | | 3,394 | | | | 541,784 | |
| |
Regions Financial Corp. | | | 31,361 | | | | 538,155 | |
| |
SVB Financial Group(c) | | | 2,159 | | | | 541,995 | |
| |
Truist Financial Corp. | | | 9,611 | | | | 541,291 | |
| |
Zions Bancorporation N.A. | | | 10,527 | | | | 546,562 | |
| |
| | | | | | | 7,032,834 | |
| |
|
| Reinsurance-0.19% | |
Everest Re Group Ltd. | | | 1,959 | | | | 542,330 | |
| |
|
| Research & Consulting Services-0.78% | |
Equifax, Inc. | | | 3,882 | | | | 543,946 | |
| |
IHS Markit Ltd.(c) | | | 7,218 | | | | 543,876 | |
| |
Nielsen Holdings PLC | | | 26,991 | | | | 547,917 | |
| |
Verisk Analytics, Inc. | | | 3,609 | | | | 538,968 | |
| |
| | | | | | | 2,174,707 | |
| |
|
| Residential REITs-1.16% | |
Apartment Investment & Management Co., Class A | | | 10,527 | | | | 543,720 | |
| |
AvalonBay Communities, Inc. | | | 2,580 | | | | 541,026 | |
| |
Equity Residential | | | 6,647 | | | | 537,875 | |
Essex Property Trust, Inc. | | | 1,791 | | | | 538,840 | |
| |
Mid-America Apartment Communities, Inc. | | | 4,126 | | | | 544,055 | |
| |
UDR, Inc. | | | 11,639 | | | | 543,541 | |
| |
| | | | | | | 3,249,057 | |
| |
|
| Restaurants-0.96% | |
Chipotle Mexican Grill, Inc.(c) | | | 661 | | | | 553,330 | |
| |
Darden Restaurants, Inc. | | | 4,658 | | | | 507,769 | |
| |
McDonald’s Corp. | | | 2,730 | | | | 539,475 | |
| |
Starbucks Corp. | | | 6,072 | | | | 533,850 | |
| |
Yum! Brands, Inc. | | | 5,378 | | | | 541,726 | |
| |
| | | | | | | 2,676,150 | |
| |
|
| Retail REITs-0.99% | |
Federal Realty Investment Trust | | | 4,214 | | | | 542,468 | |
| |
Kimco Realty Corp. | | | 26,513 | | | | 549,084 | |
| |
Realty Income Corp. | | | 7,427 | | | | 546,850 | |
| |
Regency Centers Corp. | | | 8,839 | | | | 557,653 | |
| |
Simon Property Group, Inc. | | | 3,730 | | | | 555,621 | |
| |
| | | | | | | 2,751,676 | |
| |
|
| Semiconductor Equipment-0.60% | |
Applied Materials, Inc. | | | 8,993 | | | | 548,933 | |
| |
KLA Corp. | | | 3,143 | | | | 559,988 | |
| |
Lam Research Corp. | | | 1,909 | | | | 558,192 | |
| |
| | | | | | | 1,667,113 | |
| |
|
| Semiconductors-2.59% | |
Advanced Micro Devices, Inc.(c) | | | 13,084 | | | | 600,032 | |
| |
Analog Devices, Inc. | | | 4,543 | | | | 539,890 | |
| |
Broadcom, Inc. | | | 1,706 | | | | 539,130 | |
| |
Intel Corp. | | | 9,317 | | | | 557,623 | |
| |
See accompanying Notes to Financial Statements which are an integral part of the financial statements.
Invesco V.I. Equally-Weighted S&P 500 Fund
| | | | | | | | |
| | | Shares | | | Value | |
| Semiconductors-(continued) | |
Maxim Integrated Products, Inc. | | | 9,035 | | | $ | 555,743 | |
| |
Microchip Technology, Inc.(e) | | | 5,273 | | | | 552,189 | |
| |
Micron Technology, Inc.(c) | | | 10,517 | | | | 565,604 | |
| |
NVIDIA Corp. | | | 2,403 | | | | 565,426 | |
| |
Qorvo, Inc.(c) | | | 4,747 | | | | 551,744 | |
| |
QUALCOMM, Inc. | | | 6,130 | | | | 540,850 | |
| |
Skyworks Solutions, Inc. | | | 4,813 | | | | 581,795 | |
| |
Texas Instruments, Inc. | | | 4,251 | | | | 545,361 | |
| |
Xilinx, Inc. | | | 5,595 | | | | 547,023 | |
| |
| | | | | | | 7,242,410 | |
| |
|
| Soft Drinks-0.58% | |
Coca-Cola Co. (The) | | | 9,894 | | | | 547,633 | |
| |
Monster Beverage Corp.(c) | | | 8,655 | | | | 550,025 | |
| |
PepsiCo., Inc. | | | 3,903 | | | | 533,423 | |
| |
| | | | | | | 1,631,081 | |
| |
|
| Specialized Consumer Services-0.19% | |
H&R Block, Inc. | | | 22,922 | | | | 538,209 | |
| |
|
| Specialized REITs-1.81% | |
American Tower Corp. | | | 2,533 | | | | 582,134 | |
| |
Crown Castle International Corp. | | | 4,058 | | | | 576,845 | |
| |
Digital Realty Trust, Inc. | | | 4,735 | | | | 566,969 | |
| |
Equinix, Inc. | | | 975 | | | | 569,108 | |
| |
Extra Space Storage, Inc. | | | 5,263 | | | | 555,878 | |
| |
Iron Mountain, Inc. | | | 17,045 | | | | 543,224 | |
| |
Public Storage | | | 2,620 | | | | 557,955 | |
| |
SBA Communications Corp., Class A | | | 2,286 | | | | 550,903 | |
| |
Weyerhaeuser Co. | | | 18,166 | | | | 548,613 | |
| |
| | | | | | | 5,051,629 | |
| |
|
| Specialty Chemicals-1.37% | |
Albemarle Corp. | | | 8,081 | | | | 590,236 | |
| |
Celanese Corp. | | | 4,325 | | | | 532,494 | |
| |
DuPont de Nemours, Inc. | | | 8,309 | | | | 533,438 | |
| |
Ecolab, Inc. | | | 2,901 | | | | 559,864 | |
| |
International Flavors
& Fragrances, Inc.(e) | | | 4,016 | | | | 518,144 | |
| |
PPG Industries, Inc. | | | 4,048 | | | | 540,367 | |
| |
Sherwin-Williams Co. (The) | | | 940 | | | | 548,528 | |
| |
| | | | | | | 3,823,071 | |
| |
|
| Specialty Stores-0.57% | |
Tiffany & Co. | | | 4,027 | | | | 538,209 | |
| |
Tractor Supply Co. | | | 5,671 | | | | 529,898 | |
| |
Ulta Beauty, Inc.(c) | | | 2,123 | | | | 537,416 | |
| |
| | | | | | | 1,605,523 | |
| |
|
| Steel-0.19% | |
Nucor Corp. | | | 9,534 | | | | 536,574 | |
| |
Systems Software-0.97% | | | | | | | | |
Fortinet, Inc.(c) | | | 5,096 | | | | 544,049 | |
| |
Microsoft Corp. | | | 3,484 | | | | 549,427 | |
| |
NortonLifeLock, Inc. | | | 20,710 | | | | 528,519 | |
| |
| | | | | | | | |
| | | Shares | | | Value | |
| Systems Software-(continued) | |
Oracle Corp. | | | 9,877 | | | $ | 523,283 | |
| |
ServiceNow, Inc.(c) | | | 1,972 | | | | 556,735 | |
| |
| | | | | | | 2,702,013 | |
| |
|
| Technology Distributors-0.20% | |
CDW Corp. | | | 3,908 | | | | 558,219 | |
| |
|
| Technology Hardware, Storage & Peripherals-1.39% | |
Apple, Inc. | | | 1,956 | | | | 574,379 | |
| |
Hewlett Packard Enterprise Co. | | | 33,591 | | | | 532,753 | |
| |
HP, Inc. | | | 26,461 | | | | 543,774 | |
| |
NetApp, Inc. | | | 8,514 | | | | 529,996 | |
| |
Seagate Technology PLC | | | 9,118 | | | | 542,521 | |
| |
Western Digital Corp. | | | 9,916 | | | | 629,369 | |
| |
Xerox Holdings Corp. | | | 14,616 | | | | 538,892 | |
| |
| | | | | | | 3,891,684 | |
| |
|
| Tobacco-0.39% | |
Altria Group, Inc. | | | 10,735 | | | | 535,784 | |
| |
Philip Morris International, Inc. | | | 6,358 | | | | 541,002 | |
| |
| | | | | | | 1,076,786 | |
| |
|
| Trading Companies & Distributors-0.59% | |
Fastenal Co. | | | 14,541 | | | | 537,290 | |
| |
United Rentals, Inc.(c) | | | 3,308 | | | | 551,675 | |
| |
W.W. Grainger, Inc. | | | 1,619 | | | | 548,064 | |
| |
| | | | | | | 1,637,029 | |
| |
|
| Trucking-0.39% | |
J.B. Hunt Transport Services, Inc. | | | 4,764 | | | | 556,340 | |
| |
Old Dominion Freight Line, Inc. | | | 2,877 | | | | 545,997 | |
| |
| | | | | | | 1,102,337 | |
| |
|
| Water Utilities-0.20% | |
American Water Works Co., Inc. | | | 4,517 | | | | 554,913 | |
| |
|
| Wireless Telecommunication Services-0.20% | |
T-Mobile US, Inc.(c) | | | 7,134 | | | | 559,448 | |
| |
Total Common Stocks & Other Equity Interests
(Cost $177,509,755) | | | | 274,193,934 | |
| |
|
| Money Market Funds-1.76% | |
Invesco Government & Agency Portfolio, Institutional Class, 1.50%(f) | | | 1,740,175 | | | | 1,740,175 | |
| |
Invesco Liquid Assets Portfolio, Institutional Class, 1.71%(f) | | | 1,182,742 | | | | 1,183,097 | |
| |
Invesco Treasury Portfolio, Institutional Class, 1.49%(f) | | | 1,988,772 | | | | 1,988,772 | |
| |
Total Money Market Funds
(Cost $4,912,013) | | | | | | | 4,912,044 | |
| |
TOTAL INVESTMENTS IN SECURITIES
(excluding investments purchased with cash collateral from securities onloan)-99.90%
(Cost $182,421,768) | | | | | | | 279,105,978 | |
| |
See accompanying Notes to Financial Statements which are an integral part of the financial statements.
Invesco V.I. Equally-Weighted S&P 500 Fund
| | | | | | | | |
| | | Shares | | | Value | |
Investments Purchased with Cash Collateral from Securities on Loan | |
| Money Market Funds-0.34% | |
Invesco Government & Agency Portfolio, Institutional Class, 1.50%(f)(g) | | | 716,421 | | | $ | 716,421 | |
| |
Invesco Liquid Assets Portfolio, Institutional Class, 1.71%(f)(g) | | | 239,664 | | | | 239,736 | |
| |
Total Investments Purchased with Cash Collateral from Securities on Loan
(Cost $956,157) | | | | 956,157 | |
| |
TOTAL INVESTMENTS IN
SECURITIES–100.24%
(Cost $183,377,925) | | | | 280,062,135 | |
| |
OTHER ASSETS LESS LIABILITIES–(0.24)% | | | | (678,017 | ) |
| |
NET ASSETS–100.00% | | | | | | $ | 279,384,118 | |
| |
Investment Abbreviations:
| | |
| REIT | | - Real Estate Investment Trust |
Notes to Schedule of Investments:
| (a) | Industry and/or sector classifications used in this report are generally according to the Global Industry Classification Standard, which was developed by and is the exclusive property and a service mark of MSCI Inc. and Standard & Poor’s. |
| (b) | All or a portion of the value was pledged as collateral to cover margin requirements for open futures contracts. See Note 1J. |
| (c) | Non-income producing security. |
| (d) | The Fund’s Adviser is a wholly-owned subsidiary of Invesco Ltd. and therefore, Invesco Ltd. is considered to be affiliated. The table below shows the Fund’s transactions in, and earnings from, its investments in affiliates (excluding affiliated money market funds) for the fiscal year ended December 31, 2019. |
| | | | | | | | | | | | | | | | | | | | | | | | | | | | |
| | | Value
December 31, 2018 | | | Purchases
at Cost | | | Proceeds
from Sales | | | Change in
Unrealized
Appreciation | | | Realized
Gain
(Loss) | | | Value
December 31, 2019 | | | Dividend
Income | |
| |
Invesco Ltd. | | | $524,213 | | | | $193,810 | | | | $(216,034 | ) | | | $176,525 | | | | $(129,045 | ) | | | $549,469 | | | | $29,399 | |
| |
| (e) | All or a portion of this security was out on loan at December 31, 2019. |
| (f) | The money market fund and the Fund are affiliated by having the same investment adviser. The rate shown is the7-day SEC standardized yield as of December 31, 2019. |
| (g) | The security has been segregated to satisfy the commitment to return the cash collateral received in securities lending transactions upon the borrower’s return of the securities loaned. See Note 1I. |
| | | | | | | | | | | | | | | | | | | | |
Open Futures Contracts | |
| |
| Long Futures Contracts | | Number of
Contracts | | | Expiration
Month | | | Notional
Value | | | Value | | | Unrealized
Appreciation | |
| |
Equity Risk | | | | | | | | | | | | | | | | | | | | |
| |
E-Mini S&P 500 Index | | | 32 | | | | March-2020 | | | $ | 5,169,760 | | | $ | 94,045 | | | | $94,045 | |
| |
See accompanying Notes to Financial Statements which are an integral part of the financial statements.
Invesco V.I. Equally-Weighted S&P 500 Fund
Statement of Assets and Liabilities
December 31, 2019
| | | | |
Assets: | | | | |
Investments in securities, at value
(Cost $ 176,928,164)* | | $ | 273,644,465 | |
| |
Investments in affiliates, at value
(Cost $ 6,449,761) | | | 6,417,670 | |
| |
Other investments: Variation margin receivable – futures contracts | | | 12,333 | |
| |
Cash | | | 2,206 | |
| |
Receivable for: | | | | |
Fund shares sold | | | 166,395 | |
| |
Dividends | | | 420,134 | |
| |
Investment for trustee deferred compensation and retirement plans | | | 40,785 | |
| |
Total assets | | | 280,703,988 | |
| |
| |
Liabilities: | | | | |
Payable for: | | | | |
Fund shares reacquired | | | 4,251 | |
| |
Collateral upon return of securities loaned | | | 956,157 | |
| |
Accrued fees to affiliates | | | 233,228 | |
| |
Accrued other operating expenses | | | 82,423 | |
| |
Trustee deferred compensation and retirement plans | | | 43,811 | |
| |
Total liabilities | | | 1,319,870 | |
| |
Net assets applicable to shares outstanding | | $ | 279,384,118 | |
| |
| |
Net assets consist of: | | | | |
Shares of beneficial interest | | $ | 176,665,177 | |
| |
Distributable earnings | | | 102,718,941 | |
| |
| | $ | 279,384,118 | |
| |
| |
Net Assets: | | | | |
Series I | | $ | 31,326,840 | |
| |
Series II | | $ | 248,057,278 | |
| |
|
Shares outstanding, no par value, with an unlimited number of shares authorized: | |
Series I | | | 1,414,953 | |
| |
Series II | | | 11,560,842 | |
| |
Series I: | | | | |
Net asset value per share | | $ | 22.14 | |
| |
Series II: | | | | |
Net asset value per share | | $ | 21.46 | |
| |
| * | At December 31, 2019, securities with an aggregate value of $933,345 were on loan to brokers. |
Statement of Operations
For the year ended December 31, 2019
| | | | |
Investment income: | | | | |
Dividends | | $ | 4,830,277 | |
| |
Dividends from affiliates (includes securities lending income of $2,138) | | | 126,085 | |
| |
Total investment income | | | 4,956,362 | |
| |
| |
Expenses: | | | | |
Advisory fees | | | 288,739 | |
| |
Administrative services fees | | | 364,389 | |
| |
Custodian fees | | | 24,363 | |
| |
Distribution fees - Series II | | | 507,438 | |
| |
Transfer agent fees | | | 5,029 | |
| |
Trustees’ and officers’ fees and benefits | | | 21,808 | |
| |
Licensing fees | | | 47,069 | |
| |
Reports to shareholders | | | 11,699 | |
| |
Professional services fees | | | 52,009 | |
| |
Taxes | | | 57 | |
| |
Other | | | 34,928 | |
| |
Total expenses | | | 1,357,528 | |
| |
Less: Fees waived | | | (5,165 | ) |
| |
Net expenses | | | 1,352,363 | |
| |
Net investment income | | | 3,603,999 | |
| |
| |
Realized and unrealized gain from: | | | | |
Net realized gain from: | | | | |
Investment securities | | | 3,584,722 | |
| |
Futures contracts | | | 1,012,481 | |
| |
| | | 4,597,203 | |
| |
Change in net unrealized appreciation of: | | | | |
| |
Investment securities | | | 55,373,344 | |
| |
Futures contracts | | | 89,463 | |
| |
| | | 55,462,807 | |
| |
Net realized and unrealized gain | | | 60,060,010 | |
| |
Net increase in net assets resulting from operations | | $ | 63,664,009 | |
| |
See accompanying Notes to Financial Statements which are an integral part of the financial statements.
Invesco V.I. Equally-Weighted S&P 500 Fund
Statement of Changes in Net Assets
For the years ended December 31, 2019 and 2018
| | | | | | | | |
| | | 2019 | | | 2018 | |
| |
Operations: | | | | | | | | |
Net investment income | | $ | 3,603,999 | | | $ | 3,868,575 | |
| |
Net realized gain | | | 4,597,203 | | | | 4,032,717 | |
| |
Change in net unrealized appreciation (depreciation) | | | 55,462,807 | | | | (31,117,348 | ) |
| |
Net increase (decrease) in net assets resulting from operations | | | 63,664,009 | | | | (23,216,056 | ) |
| |
| | |
Distributions to shareholders from distributable earnings: | | | | | | | | |
Series I | | | (984,182 | ) | | | (3,643,484 | ) |
| |
Series II | | | (7,440,206 | ) | | | (4,379,437 | ) |
| |
Total distributions from distributable earnings | | | (8,424,388 | ) | | | (8,022,921 | ) |
| |
| | |
Share transactions-net: | | | | | | | | |
Series I | | | (92,725,236 | ) | | | (5,211,678 | ) |
| |
Series II | | | 57,543,221 | | | | 50,915,126 | |
| |
Net increase (decrease) in net assets resulting from share transactions | | | (35,182,015 | ) | | | 45,703,448 | |
| |
Net increase in net assets | | | 20,057,606 | | | | 14,464,471 | |
| |
| | |
Net assets: | | | | | | | | |
Beginning of year | | | 259,326,512 | | | | 244,862,041 | |
| |
End of year | | $ | 279,384,118 | | | $ | 259,326,512 | |
| |
See accompanying Notes to Financial Statements which are an integral part of the financial statements.
Invesco V.I. Equally-Weighted S&P 500 Fund
Financial Highlights
The following schedule presents financial highlights for a share of the Fund outstanding throughout the periods indicated.
| | | | | | | | | | | | | | | | | | | | | | | | | | | | | | | | | | | | | | | | | | | | | | | | | | | | | | | | |
| | | Net asset
value,
beginning
of period | | | Net investment
income(a) | | | Net gains
(losses)
on securities
(both realized and unrealized) | | | Total from
investment operations | | | Dividends from net investment income | | | Distributions from net realized
gains | | | Total
distributions | | | Net asset
value, end of period | | | Total
return (b) | | | Net assets,
end of period (000’s omitted) | | | Ratio of
expenses
to average
net assets
with fee waivers
and/or
expenses
absorbed | | | Ratio of
expenses
to average net
assets without fee waivers
and/or
expenses
absorbed | | | Ratio of net investment
income
to average
net assets | | | Portfolio turnover (c) | |
Series I | | | | | | | | | | | | | | | | | | | | | | | | | | | | | | | | | | | | | | | | | | | | | | | | | | | | | | | | |
Year ended 12/31/19 | | $ | 17.80 | | | $ | 0.34 | | | $ | 4.73 | | | $ | 5.07 | | | $ | (0.35 | ) | | $ | (0.38 | ) | | $ | (0.73 | ) | | $ | 22.14 | | | | 28.79 | % | | $ | 31,327 | | | | 0.35 | %(d) | | | 0.35 | %(d) | | | 1.71 | %(d) | | | 39 | % |
Year ended 12/31/18 | | | 19.88 | | | | 0.32 | | | | (1.80 | ) | | | (1.48 | ) | | | (0.23 | ) | | | (0.37 | ) | | | (0.60 | ) | | | 17.80 | | | | (7.87 | ) | | | 109,414 | | | | 0.31 | | | | 0.31 | | | | 1.61 | | | | 24 | |
Year ended 12/31/17 | | | 17.24 | | | | 0.29 | | | | 2.87 | | | | 3.16 | | | | (0.15 | ) | | | (0.37 | ) | | | (0.52 | ) | | | 19.88 | | | | 18.58 | | | | 127,462 | | | | 0.32 | | | | 0.32 | | | | 1.55 | | | | 22 | |
Year ended 12/31/16 | | | 15.81 | | | | 0.26 | | | | 1.96 | | | | 2.22 | | | | (0.10 | ) | | | (0.69 | ) | | | (0.79 | ) | | | 17.24 | | | | 14.24 | | | | 114,202 | | | | 0.39 | | | | 0.39 | | | | 1.56 | | | | 22 | |
Year ended 12/31/15 | | | 19.98 | | | | 0.26 | | | | (0.94 | ) | | | (0.68 | ) | | | (0.28 | ) | | | (3.21 | ) | | | (3.49 | ) | | | 15.81 | | | | (2.68 | ) | | | 27,974 | | | | 0.55 | | | | 0.55 | | | | 1.38 | | | | 25 | |
Series II | | | | | | | | | | | | | | | | | | | | | | | | | | | | | | | | | | | | | | | | | | | | | | | | | | | | | | | | |
Year ended 12/31/19 | | | 17.29 | | | | 0.29 | | | | 4.57 | | | | 4.86 | | | | (0.31 | ) | | | (0.38 | ) | | | (0.69 | ) | | | 21.46 | | | | 28.46 | | | | 248,057 | | | | 0.60 | (d) | | | 0.60 | (d) | | | 1.46 | (d) | | | 39 | |
Year ended 12/31/18 | | | 19.35 | | | | 0.26 | | | | (1.74 | ) | | | (1.48 | ) | | | (0.21 | ) | | | (0.37 | ) | | | (0.58 | ) | | | 17.29 | | | | (8.11 | ) | | | 149,913 | | | | 0.56 | | | | 0.56 | | | | 1.36 | | | | 24 | |
Year ended 12/31/17 | | | 16.82 | | | | 0.24 | | | | 2.79 | | | | 3.03 | | | | (0.13 | ) | | | (0.37 | ) | | | (0.50 | ) | | | 19.35 | | | | 18.26 | | | | 117,400 | | | | 0.57 | | | | 0.57 | | | | 1.30 | | | | 22 | |
Year ended 12/31/16 | | | 15.44 | | | | 0.21 | | | | 1.93 | | | | 2.14 | | | | (0.07 | ) | | | (0.69 | ) | | | (0.76 | ) | | | 16.82 | | | | 14.01 | | | | 48,936 | | | | 0.64 | | | | 0.64 | | | | 1.31 | | | | 22 | |
Year ended 12/31/15 | | | 19.60 | | | | 0.21 | | | | (0.92 | ) | | | (0.71 | ) | | | (0.24 | ) | | | (3.21 | ) | | | (3.45 | ) | | | 15.44 | | | | (2.92 | ) | | | 38,643 | | | | 0.80 | | | | 0.80 | | | | 1.13 | | | | 25 | |
| (a) | Calculated using average shares outstanding. |
| (b) | Includes adjustments in accordance with accounting principles generally accepted in the United States of America and as such, the net asset value for financial reporting purposes and the returns based upon those net asset values may differ from the net asset value and returns for shareholder transactions. Total returns are not annualized for periods less than one year, if applicable, and do not reflect charges assessed in connection with a variable product, which if included would reduce total returns. |
| (c) | Portfolio turnover is calculated at the fund level and is not annualized for periods less than one year, if applicable. |
| (d) | Ratios are based on average daily net assets (000’s omitted) of $37,777 and $202,839 for Series I and Series II shares, respectively. |
See accompanying Notes to Financial Statements which are an integral part of the financial statements.
Invesco V.I. Equally-Weighted S&P 500 Fund
Notes to Financial Statements
December 31, 2019
NOTE 1–Significant Accounting Policies
Invesco V.I. Equally-Weighted S&P 500 Fund (the “Fund”) is a series portfolio of AIM Variable Insurance Funds (Invesco Variable Insurance Funds) (the “Trust”). The Trust is a Delaware statutory trust registered under the Investment Company Act of 1940, as amended (the “1940 Act”), as anopen-end series management investment company. Information presented in these financial statements pertains only to the Fund. Matters affecting the Fund or each class will be voted on exclusively by the shareholders of the Fund or each class. Current Securities and Exchange Commission (“SEC”) guidance, however, requires participating insurance companies offering separate accounts to vote shares proportionally in accordance with the instructions of the contract owners whose investments are funded by shares of each Fund or class.
The Fund’s investment objective is to achieve a high level of total return on its assets through a combination of capital appreciation and current income.
The Fund currently offers two classes of shares, Series I and Series II, both of which are offered to insurance company separate accounts funding variable annuity contracts and variable life insurance policies (“variable products”).
The Fund is an investment company and accordingly follows the investment company accounting and reporting guidance in accordance with Financial Accounting Standards Board Accounting Standards Codification Topic 946,Financial Services - Investment Companies.
The following is a summary of the significant accounting policies followed by the Fund in the preparation of its financial statements.
A. Security Valuations– Securities, including restricted securities, are valued according to the following policy.
A security listed or traded on an exchange (except convertible securities) is valued at its last sales price or official closing price as of the close of the customary trading session on the exchange where the security is principally traded, or lacking any sales or official closing price on a particular day, the security may be valued at the closing bid price on that day. Securities traded in theover-the-counter market are valued based on prices furnished by independent pricing services or market makers. When such securities are valued by an independent pricing service they may be considered fair valued. Futures contracts are valued at the final settlement price set by an exchange on which they are principally traded. Listed options are valued at the mean between the last bid and asked prices from the exchange on which they are principally traded. Options not listed on an exchange are valued by an independent source at the mean between the last bid and asked prices. For purposes of determining net asset value (“NAV”) per share, futures and option contracts generally are valued 15 minutes after the close of the customary trading session of the New York Stock Exchange (“NYSE”).
Investments inopen-end andclosed-end registered investment companies that do not trade on an exchange are valued at theend-of-day net asset value per share. Investments inopen-end andclosed-end registered investment companies that trade on an exchange are valued at the last sales price or official closing price as of the close of the customary trading session on the exchange where the security is principally traded.
Debt obligations (including convertible securities) and unlisted equities are fair valued using an evaluated quote provided by an independent pricing service. Evaluated quotes provided by the pricing service may be determined without exclusive reliance on quoted prices, and may reflect appropriate factors such asinstitution-size trading in similar groups of securities, developments related to specific securities, dividend rate (for unlisted equities), yield (for debt obligations), quality, type of issue, coupon rate (for debt obligations), maturity (for debt obligations), individual trading characteristics and other market data. Pricing services generally value debt obligations assuming orderly transactions of institutional round lot size, but a fund may hold or transact in the same securities in smaller, odd lot sizes. Odd lots often trade at lower prices than institutional round lots. Debt obligations are subject to interest rate and credit risks. In addition, all debt obligations involve some risk of default with respect to interest and/or principal payments.
Foreign securities’ (including foreign exchange contracts) prices are converted into U.S. dollar amounts using the applicable exchange rates as of the close of the NYSE. If market quotations are available and reliable for foreign exchange-traded equity securities, the securities will be valued at the market quotations. Because trading hours for certain foreign securities end before the close of the NYSE, closing market quotations may become unreliable. If between the time trading ends on a particular security and the close of the customary trading session on the NYSE, events occur that the investment adviser determines are significant and make the closing price unreliable, the Fund may fair value the security. If the event is likely to have affected the closing price of the security, the security will be valued at fair value in good faith using procedures approved by the Board of Trustees. Adjustments to closing prices to reflect fair value may also be based on a screening process of an independent pricing service to indicate the degree of certainty, based on historical data, that the closing price in the principal market where a foreign security trades is not the current value as of the close of the NYSE. Foreign securities’ prices meeting the approved degree of certainty that the price is not reflective of current value will be priced at the indication of fair value from the independent pricing service. Multiple factors may be considered by the independent pricing service in determining adjustments to reflect fair value and may include information relating to sector indices, American Depositary Receipts and domestic and foreign index futures. Foreign securities may have additional risks including exchange rate changes, potential for sharply devalued currencies and high inflation, political and economic upheaval, the relative lack of issuer information, relatively low market liquidity and the potential lack of strict financial and accounting controls and standards.
Securities for which market prices are not provided by any of the above methods may be valued based upon quotes furnished by independent sources. The last bid price may be used to value equity securities. The mean between the last bid and asked prices is used to value debt obligations, including corporate loans.
Securities for which market quotations are not readily available or became unreliable are valued at fair value as determined in good faith by or under the supervision of the Trust’s officers following procedures approved by the Board of Trustees. Issuer specific events, market trends, bid/asked quotes of brokers and information providers and other market data may be reviewed in the course of making a good faith determination of a security’s fair value.
The Fund may invest in securities that are subject to interest rate risk, meaning the risk that the prices will generally fall as interest rates rise and, conversely, the prices will generally rise as interest rates fall. Specific securities differ in their sensitivity to changes in interest rates depending on their individual characteristics. Changes in interest rates may result in increased market volatility, which may affect the value and/or liquidity of certain Fund investments.
Invesco V.I. Equally-Weighted S&P 500 Fund
Valuations change in response to many factors including the historical and prospective earnings of the issuer, the value of the issuer’s assets, general economic conditions, interest rates, investor perceptions and market liquidity. Because of the inherent uncertainties of valuation, the values reflected in the financial statements may materially differ from the value received upon actual sale of those investments.
| B. | Securities Transactions and Investment Income- Securities transactions are accounted for on a trade date basis. Realized gains or losses on sales are computed on the basis of specific identification of the securities sold. Interest income (net of withholding tax, if any) is recorded on the accrual basis from settlement date. Dividend income (net of withholding tax, if any) is recorded on theex-dividend date. |
The Fund may periodically participate in litigation related to Fund investments. As such, the Fund may receive proceeds from litigation settlements. Any proceeds received are included in the Statement of Operations as realized gain (loss) for investments no longer held and as unrealized gain (loss) for investments still held.
Brokerage commissions and mark ups are considered transaction costs and are recorded as an increase to the cost basis of securities purchased and/or a reduction of proceeds on a sale of securities. Such transaction costs are included in the determination of net realized and unrealized gain (loss) from investment securities reported in the Statement of Operations and the Statement of Changes in Net Assets and the net realized and unrealized gains (losses) on securities per share in the Financial Highlights. Transaction costs are included in the calculation of the Fund’s net asset value and, accordingly, they reduce the Fund’s total returns. These transaction costs are not considered operating expenses and are not reflected in net investment income reported in the Statement of Operations and the Statement of Changes in Net Assets, or the net investment income per share and the ratios of expenses and net investment income reported in the Financial Highlights, nor are they limited by any expense limitation arrangements between the Fund and the investment adviser.
The Fund allocates income and realized and unrealized capital gains and losses to a class based on the relative net assets of each class.
The Fund recharacterizes distributions received from REIT investments based on information provided by the REIT into the following categories: ordinary income, long-term and short-term capital gains, and return of capital. If information is not available on a timely basis from the REIT, the recharacterization will be based on available information which may include the previous year’s allocation. If new or additional information becomes available from the REIT at a later date, a recharacterization will be made in the following year. The Fund records as dividend income the amount recharacterized as ordinary income and as realized gain the amount recharacterized as capital gain in the Statement of Operations, and the amount recharacterized as return of capital as a reduction of the cost of the related investment. These recharacterizations are reflected in the accompanying financial statements.
| C. | Country Determination- For the purposes of making investment selection decisions and presentation in the Schedule of Investments, the investment adviser may determine the country in which an issuer is located and/or credit risk exposure based on various factors. These factors include the laws of the country under which the issuer is organized, where the issuer maintains a principal office, the country in which the issuer derives 50% or more of its total revenues and the country that has the primary market for the issuer’s securities, as well as other criteria. Among the other criteria that may be evaluated for making this determination are the country in which the issuer maintains 50% or more of its assets, the type of security, financial guarantees and enhancements, the nature of the collateral and the sponsor organization. Country of issuer and/or credit risk exposure has been determined to be the United States of America, unless otherwise noted. |
| D. | Distributions- Distributions from net investment income and net realized capital gain, if any, are generally declared and paid to separate accounts of participating insurance companies annually and recorded on theex-dividend date. |
| E. | Federal Income Taxes -The Fund intends to comply with the requirements of Subchapter M of the Internal Revenue Code of 1986, as amended (the “Internal Revenue Code”), necessary to qualify as a regulated investment company and to distribute substantially all of the Fund’s taxable earnings to shareholders. As such, the Fund will not be subject to federal income taxes on otherwise taxable income (including net realized capital gain) that is distributed to shareholders. Therefore, no provision for federal income taxes is recorded in the financial statements. |
The Fund recognizes the tax benefits of uncertain tax positions only when the position is more likely than not to be sustained. Management has analyzed the Fund’s uncertain tax positions and concluded that no liability for unrecognized tax benefits should be recorded related to uncertain tax positions. Management is not aware of any tax positions for which it is reasonably possible that the total amounts of unrecognized tax benefits will change materially in the next 12 months.
The Fund files tax returns in the U.S. Federal jurisdiction and certain other jurisdictions. Generally, the Fund is subject to examinations by such taxing authorities for up to three years after the filing of the return for the tax period.
| F. | Expenses- Fees provided for under the Rule12b-1 plan of a particular class of the Fund and which are directly attributable to that class are charged to the operations of such class. All other expenses are allocated among the classes based on relative net assets. |
| G. | Accounting Estimates -The preparation of financial statements in conformity with accounting principles generally accepted in the United States of America (“GAAP”) requires management to make estimates and assumptions that affect the reported amounts of assets and liabilities at the date of the financial statements and the reported amounts of revenues and expenses during the reporting period including estimates and assumptions related to taxation. Actual results could differ from those estimates by a significant amount. In addition, the Fund monitors for material events or transactions that may occur or become known after theperiod-end date and before the date the financial statements are released to print. |
| H. | Indemnifications- Under the Trust’s organizational documents, each Trustee, officer, employee or other agent of the Trust is indemnified against certain liabilities that may arise out of the performance of their duties to the Fund. Additionally, in the normal course of business, the Fund enters into contracts, including the Fund’s servicing agreements, that contain a variety of indemnification clauses. The Fund’s maximum exposure under these arrangements is unknown as this would involve future claims that may be made against the Fund that have not yet occurred. The risk of material loss as a result of such indemnification claims is considered remote. |
| I. | Securities Lending- The Fund may lend portfolio securities having a market value up toone-third of the Fund’s total assets. Such loans are secured by collateral equal to no less than the market value of the loaned securities determined daily by the securities lending provider. Such collateral will be cash or debt securities issued or guaranteed by the U.S. Government or any of its sponsored agencies. Cash collateral received in connection with these loans is invested in short-term money market instruments or affiliated money market funds and is shown as such on the Schedule of Investments. The Fund bears the risk of loss with respect to the investment of collateral. It is the Fund’s policy to obtain additional collateral from or return excess collateral to the borrower by the end of the next business day, following the valuation date of the securities loaned. Therefore, the value of the collateral held may be temporarily less than the value of the securities on loan. When loaning securities, the Fund retains certain benefits of owning the securities, including the economic equivalent of dividends or interest generated by the security. |
Invesco V.I. Equally-Weighted S&P 500 Fund
| | Lending securities entails a risk of loss to the Fund if, and to the extent that, the market value of the securities loaned were to increase and the borrower did not increase the collateral accordingly, and the borrower failed to return the securities. The securities loaned are subject to termination at the option of the borrower or the Fund. Upon termination, the borrower will return to the Fund the securities loaned and the Fund will return the collateral. Upon the failure of the borrower to return the securities, collateral may be liquidated and the securities may be purchased on the open market to replace the loaned securities. The Fund could experience delays and costs in gaining access to the collateral and the securities may lose value during the delay which could result in potential losses to the Fund. Some of these losses may be indemnified by the lending agent. The Fund bears the risk of any deficiency in the amount of the collateral available for return to the borrower due to any loss on the collateral invested. Dividends received on cash collateral investments for securities lending transactions, which are net of compensation to counterparties, are included in Dividends from affiliates on the Statement of Operations. The aggregate value of securities out on loan, if any, is shown as a footnote on the Statement of Assets and Liabilities. |
| J. | Futures Contracts– The Fund may enter into futures contracts to manage exposure to interest rate, equity and market price movements and/or currency risks. A futures contract is an agreement between two parties (“Counterparties”) to purchase or sell a specified underlying security, currency or commodity (or delivery of a cash settlement price, in the case of an index future) for a fixed price at a future date. The Fund currently invests only in exchange-traded futures and they are standardized as to maturity date and underlying financial instrument. Initial margin deposits required upon entering into futures contracts are satisfied by the segregation of specific securities or cash as collateral at the futures commission merchant (broker). During the period the futures contracts are open, changes in the value of the contracts are recognized as unrealized gains or losses by recalculating the value of the contracts on a daily basis. Subsequent or variation margin payments are received or made depending upon whether unrealized gains or losses are incurred. These amounts are reflected as receivables or payables on the Statement of Assets and Liabilities. When the contracts are closed or expire, the Fund recognizes a realized gain or loss equal to the difference between the proceeds from, or cost of, the closing transaction and the Fund’s basis in the contract. The net realized gain (loss) and the change in unrealized gain (loss) on futures contracts held during the period is included on the Statement of Operations. The primary risks associated with futures contracts are market risk and the absence of a liquid secondary market. If the Fund were unable to liquidate a futures contract and/or enter into an offsetting closing transaction, the Fund would continue to be subject to market risk with respect to the value of the contracts and continue to be required to maintain the margin deposits on the futures contracts. Futures contracts have minimal Counterparty risk since the exchange’s clearinghouse, as Counterparty to all exchange-traded futures, guarantees the futures against default. Risks may exceed amounts recognized in the Statement of Assets and Liabilities. |
| K. | Collateral– To the extent the Fund has designated or segregated a security as collateral and that security is subsequently sold, it is the Fund’s practice to replace such collateral no later than the next business day. This practice does not apply to securities pledged as collateral for securities lending transactions. |
NOTE 2–Advisory Fees and Other Fees Paid to Affiliates
The Trust has entered into a master investment advisory agreement with Invesco Advisers, Inc. (the “Adviser” or “Invesco”). Under the terms of the investment advisory agreement, the Fund accrues daily and pays monthly an advisory fee to the Adviser based on the annual rate of the Fund’s average daily net assets as follows:
| | | | |
| Average Daily Net Assets | | Rate | |
| |
| |
First $2 billion | | | 0.120% | |
| |
| |
Over $2 billion | | | 0.100% | |
| |
For the year ended December 31, 2019, the effective advisory fee rate incurred by the Fund was 0.12%.
Under the terms of a mastersub-advisory agreement between the Adviser and each of Invesco Asset Management Deutschland GmbH, Invesco Asset Management Limited, Invesco Asset Management (Japan) Limited, Invesco Hong Kong Limited, Invesco Senior Secured Management, Inc. and Invesco Canada Ltd. and separatesub-advisory agreements with Invesco Capital Management LLC and Invesco Asset Management (India) Private Limited (collectively, the “AffiliatedSub-Advisers”) the Adviser, not the Fund, will pay 40% of the fees paid to the Adviser to any such AffiliatedSub-Adviser(s) that provide(s) discretionary investment management services to the Fund based on the percentage of assets allocated to such AffiliatedSub-Adviser(s).
The Adviser has contractually agreed, through at least June 30, 2020, to waive advisory fees and/or reimburse expenses of all shares to the extent necessary to limit total annual fund operating expenses after fee waiver and/or expense reimbursement (excluding certain items discussed below) of Series I shares to 2.00% and Series II shares to 2.25% of average daily net assets (the “expense limits”). In determining the Adviser’s obligation to waive advisory fees and/or reimburse expenses, the following expenses are not taken into account, and could cause the total annual fund operating expenses after fee waiver and/or expense reimbursement to exceed the numbers reflected above: (1) interest; (2) taxes; (3) dividend expense on short sales; (4) extraordinary ornon-routine items, including litigation expenses; and (5) expenses that the Fund has incurred but did not actually pay because of an expense offset arrangement. Unless Invesco continues the fee waiver agreement, it will terminate on June 30, 2020. During its term, the fee waiver agreement cannot be terminated or amended to increase the expense limits or reduce the advisory fee waiver without approval of the Board of Trustees. The Adviser did not waive fees and/or reimburse expenses during the period under these expense limits.
Further, the Adviser has contractually agreed, through at least June 30, 2021, to waive the advisory fee payable by the Fund in an amount equal to 100% of the net advisory fees the Adviser receives from the affiliated money market funds on investments by the Fund of uninvested cash (excluding investments of cash collateral from securities lending) in such affiliated money market funds.
For the year ended December 31, 2019, the Adviser waived advisory fees of $5,165.
The Trust has entered into a master administrative services agreement with Invesco pursuant to which the Fund has agreed to pay Invesco a fee for costs incurred in providing accounting services and fund administrative services to the Fund and to reimburse Invesco for fees paid to insurance companies that have agreed to provide certain administrative services to the Fund. These administrative services provided by the insurance companies may include, among other things: maintenance of master accounts with the Fund; tracking, recording and transmitting net purchase and redemption orders for Fund shares; maintaining and preserving records related to the purchase, redemption and other account activity of variable product owners; distributing copies of Fund documents such as prospectuses, proxy materials and periodic reports, to variable product owners, and responding to
Invesco V.I. Equally-Weighted S&P 500 Fund
inquiries from variable product owners about the Fund. Pursuant to such agreement, for the year ended December 31, 2019, Invesco was paid $32,253 for accounting and fund administrative services and was reimbursed $332,136 for fees paid to insurance companies. Invesco has entered into asub-administration agreement whereby State Street Bank and Trust Company (“SSB”) serves as fund accountant and provides certain administrative services to the Fund. Pursuant to a custody agreement with the Trust on behalf of the Fund, SSB also serves as the Fund’s custodian.
The Trust has entered into a transfer agency and service agreement with Invesco Investment Services, Inc. (“IIS”) pursuant to which the Fund has agreed to pay IIS a fee for providing transfer agency and shareholder services to the Fund and reimburse IIS for certain expenses incurred by IIS in the course of providing such services. For the year ended December 31, 2019, expenses incurred under the agreement are shown in the Statement of Operations as Transfer agent fees.
The Trust has entered into a master distribution agreement with Invesco Distributors, Inc. (“IDI”) to serve as the distributor for the Fund. The Trust has adopted a plan pursuant to Rule12b-1 under the 1940 Act with respect to the Fund’s Series II shares (the “Plan”). The Fund, pursuant to the Plan, pays IDI compensation at the annual rate of 0.25% of the Fund’s average daily net assets of Series II shares. The fees are accrued daily and paid monthly. Of the Plan payments, up to 0.25% of the average daily net assets of the Series II shares may be paid to insurance companies who furnish continuing personal shareholder services to customers who purchase and own Series II shares of the Fund. For the year ended December 31, 2019, expenses incurred under the Plan are detailed in the Statement of Operations asDistribution fees.
Certain officers and trustees of the Trust are officers and directors of the Adviser, IIS and/or IDI.
NOTE 3–Additional Valuation Information
GAAP defines fair value as the price that would be received to sell an asset or paid to transfer a liability in an orderly transaction between market participants at the measurement date, under current market conditions. GAAP establishes a hierarchy that prioritizes the inputs to valuation methods, giving the highest priority to readily available unadjusted quoted prices in an active market for identical assets (Level 1) and the lowest priority to significant unobservable inputs (Level 3), generally when market prices are not readily available or are unreliable. Based on the valuation inputs, the securities or other investments are tiered into one of three levels. Changes in valuation methods may result in transfers in or out of an investment’s assigned level:
| | Level 1 - | Prices are determined using quoted prices in an active market for identical assets. |
| | Level 2 - | Prices are determined using other significant observable inputs. Observable inputs are inputs that other market participants may use in pricing a security. These may include quoted prices for similar securities, interest rates, prepayment speeds, credit risk, yield curves, loss severities, default rates, discount rates, volatilities and others. |
| | Level 3 - | Prices are determined using significant unobservable inputs. In situations where quoted prices or observable inputs are unavailable (for example, when there is little or no market activity for an investment at the end of the period), unobservable inputs may be used. Unobservable inputs reflect the Fund’s own assumptions about the factors market participants would use in determining fair value of the securities or instruments and would be based on the best available information. |
The following is a summary of the tiered valuation input levels, as of December 31, 2019. The level assigned to the securities valuations may not be an indication of the risk or liquidity associated with investing in those securities. Because of the inherent uncertainties of valuation, the values reflected in the financial statements may materially differ from the value received upon actual sale of those investments.
| | | | | | | | | | | | | | | | |
| | | Level 1 | | | Level 2 | | | Level 3 | | | Total | |
| |
Investments in Securities | | | | | | | | | | | | | | | | |
| |
| | | | |
Common Stocks & Other Equity Interests | | $ | 274,193,934 | | | | $— | | | | $— | | | $ | 274,193,934 | |
| |
| | | | |
Money Market Funds | | | 5,868,201 | | | | — | | | | — | | | | 5,868,201 | |
| |
Total Investments in Securities | | | 280,062,135 | | | | — | | | | — | | | | 280,062,135 | |
| |
Other Investments - Assets* | | | | | | | | | | | | | | | | |
| |
| | | | |
Futures Contracts | | | 94,045 | | | | — | | | | — | | | | 94,045 | |
| |
| | | | |
Total Investments | | $ | 280,156,180 | | | | $— | | | | $— | | | $ | 280,156,180 | |
| |
| * | Unrealized appreciation. |
NOTE 4–Derivative Investments
The Fund may enter into an International Swaps and Derivatives Association Master Agreement (“ISDA Master Agreement”) under which a fund may trade OTC derivatives. An OTC transaction entered into under an ISDA Master Agreement typically involves a collateral posting arrangement, payment netting provisions andclose-out netting provisions. These netting provisions allow for reduction of credit risk through netting of contractual obligations. The enforceability of the netting provisions of the ISDA Master Agreement depends on the governing law of the ISDA Master Agreement, among other factors.
For financial reporting purposes, the Fund does not offset OTC derivative assets or liabilities that are subject to ISDA Master Agreements in the Statement of Assets and Liabilities.
Invesco V.I. Equally-Weighted S&P 500 Fund
Value of Derivative Investments atPeriod-End
The table below summarizes the value of the Fund’s derivative investments, detailed by primary risk exposure, held as of December 31, 2019:
| | | | |
| | | Value | |
| Derivative Assets | | Equity
Risk | |
| |
Unrealized appreciation on futures contracts – Exchange-Traded | | $ | 94,045 | |
| |
Derivatives not subject to master netting agreements | | | (94,045 | ) |
| |
Total Derivative Assets subject to master netting agreements | | $ | - | |
| |
Effect of Derivative Investments for the year ended December 31, 2019
The table below summarizes the gains (losses) on derivative investments, detailed by primary risk exposure, recognized in earnings during the period:
| | | | |
| | | Location of Gain on
Statement of Operations | |
| | | Equity
Risk | |
| |
Realized Gain: | | | | |
Futures contracts | | $ | 1,012,481 | |
| |
Change in Net Unrealized Appreciation: | | | | |
Futures contracts | | | 89,463 | |
| |
Total | | $ | 1,101,944 | |
| |
The table below summarizes the average notional value of derivatives held during the period.
| | | | |
| | | Futures
Contracts | |
| |
Average notional value | | $ | 4,175,133 | |
| |
NOTE 5–Trustees’ and Officers’ Fees and Benefits
Trustees’ and Officers’ Fees and Benefits include amounts accrued by the Fund to pay remuneration to certain Trustees and Officers of the Fund. Trustees have the option to defer compensation payable by the Fund, andTrustees’ and Officers’Fees and Benefits also include amounts accrued by the Fund to fund such deferred compensation amounts. Those Trustees who defer compensation have the option to select various Invesco Funds in which their deferral accounts shall be deemed to be invested. Finally, certain current Trustees were eligible to participate in a retirement plan that provided for benefits to be paid upon retirement to Trustees over a period of time based on the number of years of service. The Fund may have certain former Trustees who also participate in a retirement plan and receive benefits under such plan.Trustees’ and Officers’ Fees and Benefits include amounts accrued by the Fund to fund such retirement benefits. Obligations under the deferred compensation and retirement plans represent unsecured claims against the general assets of the Fund.
NOTE 6–Cash Balances
The Fund is permitted to temporarily carry a negative or overdrawn balance in its account with SSB, the custodian bank. Such balances, if any atperiod-end, are shown in the Statement of Assets and Liabilities under the payable caption Amount due custodian. To compensate the custodian bank for such overdrafts, the overdrawn Fund may either (1) leave funds as a compensating balance in the account so the custodian bank can be compensated by earning the additional interest; or (2) compensate by paying the custodian bank at a rate agreed upon by the custodian bank and Invesco, not to exceed the contractually agreed upon rate.
NOTE 7–Distributions to Shareholders and Tax Components of Net Assets
Tax Character of Distributions to Shareholders Paid During the Fiscal Years Ended December 31, 2019 and 2018:
| | | | | | | | |
| | |
| | | 2019 | | | 2018 | |
| |
| | |
Ordinary income | | $ | 5,190,383 | | | $ | 5,428,590 | |
| |
| | |
Long-term capital gain | | | 3,234,005 | | | | 2,594,331 | |
| |
| | |
Total distributions | | $ | 8,424,388 | | | $ | 8,022,921 | |
| |
Invesco V.I. Equally-Weighted S&P 500 Fund
Tax Components of Net Assets atPeriod-End:
| | | | |
| | | 2019 | |
| |
Undistributed ordinary income | | $ | 3,615,913 | |
| |
Undistributed long-term capital gain | | | 4,504,643 | |
| |
Net unrealized appreciation – investments | | | 94,631,185 | |
| |
Temporary book/tax differences | | | (32,800 | ) |
| |
Shares of beneficial interest | | | 176,665,177 | |
| |
Total net assets | | $ | 279,384,118 | |
| |
The difference between book-basis andtax-basis unrealized appreciation (depreciation) is due to differences in the timing of recognition of gains and losses on investments for tax and book purposes. The Fund’s net unrealized appreciation difference is attributable primarily to wash sales.
The temporary book/tax differences are a result of timing differences between book and tax recognition of income and/or expenses. The Fund’s temporary book/tax differences are the result of the trustee deferral of compensation and retirement plan benefits.
Capital loss carryforward is calculated and reported as of a specific date. Results of transactions and other activity after that date may affect the amount of capital loss carryforward actually available for the Fund to utilize. Capital losses generated in years beginning after December 22, 2010 can be carried forward for an unlimited period, whereas previous losses expire in eight tax years. Capital losses with an expiration period may not be used to offset capital gains until all net capital losses without an expiration date have been utilized. Capital loss carryforwards with no expiration date will retain their character as either short-term or long-term capital losses instead of as short-term capital losses as under prior law. The ability to utilize capital loss carryforwards in the future may be limited under the Internal Revenue Code and related regulations based on the results of future transactions.
The Fund does not have a capital loss carryforward as of December 31, 2019.
NOTE 8–Investment Transactions
The aggregate amount of investment securities (other than short-term securities, U.S. Treasury obligations and money market funds, if any) purchased and sold by the Fund during the year ended December 31, 2019 was $93,434,767 and $132,448,545, respectively. Cost of investments, including any derivatives, on a tax basis includes the adjustments for financial reporting purposes as of the most recently completed federal income tax reportingperiod-end.
| | | | |
| Unrealized Appreciation (Depreciation) of Investments on a Tax Basis | |
| |
Aggregate unrealized appreciation of investments | | | $97,256,399 | |
| |
Aggregate unrealized (depreciation) of investments | | | (2,625,214 | ) |
| |
Net unrealized appreciation of investments | | | $94,631,185 | |
| |
Cost of investments for tax purposes is $185,524,995.
NOTE 9–Reclassification of Permanent Differences
Primarily as a result of differing book/tax treatment of fair fund settlements and return of capital, on December 31, 2019, undistributed net investment income was increased by $13,240, undistributed net realized gain was decreased by $9,692 and shares of beneficial interest was decreased by $3,548. This reclassification had no effect on the net assets of the Fund.
NOTE 10–Share Information
| | | | | | | | | | | | | | | | |
| | | Summary of Share Activity | |
| | | Year ended
December 31, 2019(a) | | | Year ended
December 31, 2018 | |
| | | Shares | | | Amount | | | Shares | | | Amount | |
Sold: | | | | | | | | | | | | | | | | |
Series I | | | 284,241 | | | $ | 5,873,493 | | | | 424,677 | | | $ | 8,542,209 | |
| |
Series II | | | 3,153,361 | | | | 62,882,016 | | | | 3,056,048 | | | | 59,434,939 | |
| |
| | | | |
Issued as reinvestment of dividends: | | | | | | | | | | | | | | | | |
Series I | | | 47,845 | | | | 984,182 | | | | 174,246 | | | | 3,643,484 | |
| |
Series II | | | 373,130 | | | | 7,440,206 | | | | 215,418 | | | | 4,379,437 | |
| |
Invesco V.I. Equally-Weighted S&P 500 Fund
| | | | | | | | | | | | | | | | |
| | | Summary of Share Activity | |
| |
| | | Year ended
December 31, 2019(a) | | | Year ended
December 31, 2018 | |
| | | Shares | | | Amount | | | Shares | | | Amount | |
| |
| | | | |
Reacquired: | | | | | | | | | | | | | | | | |
Series I | | | (5,064,768 | ) | | $ | (99,582,911 | ) | | | (863,544 | ) | | $ | (17,397,371 | ) |
| |
Series II | | | (637,753 | ) | | | (12,779,001 | ) | | | (667,704 | ) | | | (12,899,250 | ) |
| |
Net increase (decrease) in share activity | | | (1,843,944 | ) | | $ | (35,182,015 | ) | | | 2,339,141 | | | $ | 45,703,448 | |
| |
| (a) | There are entities that are record owners of more than 5% of the outstanding shares of the Fund and in the aggregate own 88% of the outstanding shares of the Fund. The Fund and the Fund’s principal underwriter or adviser, are parties to participation agreements with these entities whereby these entities sell units of interest in separate accounts funding variable products that are invested in the Fund. The Fund, Invesco and/or Invesco affiliates may make payments to these entities, which are considered to be related to the Fund, for providing services to the Fund, Invesco and/or Invesco affiliates including but not limited to services such as, securities brokerage, third party record keeping and account servicing and administrative services. The Fund has no knowledge as to whether all or any portion of the shares owned of record by these entities are also owned beneficially. |
Invesco V.I. Equally-Weighted S&P 500 Fund
Report of Independent Registered Public Accounting Firm
To the Board of Trustees of AIM Variable Insurance Funds (Invesco Variable Insurance Funds) and Shareholders of Invesco V.I. Equally-Weighted S&P 500 Fund
Opinion on the Financial Statements
We have audited the accompanying statement of assets and liabilities, including the schedule of investments, of Invesco V.I. Equally-Weighted S&P 500 Fund (one of the funds constituting AIM Variable Insurance Funds (Invesco Variable Insurance Funds), referred to hereafter as the “Fund”) as of December 31, 2019, the related statement of operations for the year ended December 31, 2019, the statement of changes in net assets for each of the two years in the period ended December 31, 2019, including the related notes, and the financial highlights for each of the five years in the period ended December 31, 2019 (collectively referred to as the “financial statements”). In our opinion, the financial statements present fairly, in all material respects, the financial position of the Fund as of December 31, 2019, the results of its operations for the year then ended, the changes in its net assets for each of the two years in the period ended December 31, 2019 and the financial highlights for each of the five years in the period ended December 31, 2019 in conformity with accounting principles generally accepted in the United States of America.
Basis for Opinion
These financial statements are the responsibility of the Fund’s management. Our responsibility is to express an opinion on the Fund’s financial statements based on our audits. We are a public accounting firm registered with the Public Company Accounting Oversight Board (United States) (PCAOB) and are required to be independent with respect to the Fund in accordance with the U.S. federal securities laws and the applicable rules and regulations of the Securities and Exchange Commission and the PCAOB.
We conducted our audits of these financial statements in accordance with the standards of the PCAOB. Those standards require that we plan and perform the audit to obtain reasonable assurance about whether the financial statements are free of material misstatement, whether due to error or fraud.
Our audits included performing procedures to assess the risks of material misstatement of the financial statements, whether due to error or fraud, and performing procedures that respond to those risks. Such procedures included examining, on a test basis, evidence regarding the amounts and disclosures in the financial statements. Our audits also included evaluating the accounting principles used and significant estimates made by management, as well as evaluating the overall presentation of the financial statements. Our procedures included confirmation of securities owned as of December 31, 2019 by correspondence with the custodian, transfer agent and brokers; when replies were not received from brokers, we performed other auditing procedures. We believe that our audits provide a reasonable basis for our opinion.
/s/PricewaterhouseCoopers LLP
Houston, Texas
February 18, 2020
We have served as the auditor of one or more of the investment companies in the Invesco group of investment companies since at least 1995. We have not been able to determine the specific year we began serving as auditor.
Invesco V.I. Equally-Weighted S&P 500 Fund
Calculating your ongoing Fund expenses
Example
As a shareholder of the Fund, you incur two types of costs: (1) transaction costs, which may include sales charges (loads) on purchase payments or contingent deferred sales charges on redemptions, if any; and (2) ongoing costs, including management fees, distribution and/or service(12b-1) fees, and other Fund expenses. This example is intended to help you understand your ongoing costs (in dollars) of investing in the Fund and to compare these costs with ongoing costs of investing in other mutual funds. The example is based on an investment of $1,000 invested at the beginning of the period and held for the entire period July 1, 2019 through December 31, 2019.
Actual expenses
The table below provides information about actual account values and actual expenses. You may use the information in this table, together with the amount you invested, to estimate the expenses that you paid over the period. Simply divide your account value by $1,000 (for example, an $8,600 account value divided by $1,000 = 8.6), then multiply the result by the number in the table under the heading entitled “Actual Expenses Paid During Period” to estimate the expenses you paid on your account during this period.
Hypothetical example for comparison purposes
The table below also provides information about hypothetical account values and hypothetical expenses based on the Fund’s actual expense ratio and an assumed rate of return of 5% per year before expenses, which is not the Fund’s actual return.
The hypothetical account values and expenses may not be used to estimate the actual ending account balance or expenses you paid for the period. You may use this information to compare the ongoing costs of investing in the Fund and other funds. To do so, compare this 5% hypothetical example with the 5% hypothetical examples that appear in the shareholder reports of the other funds.
Please note that the expenses shown in the table are meant to highlight your ongoing costs only and do not reflect any transaction costs, such as sales charges (loads) on purchase payments or contingent deferred sales charges on redemptions, if any. Therefore, the hypothetical information is useful in comparing ongoing costs only, and will not help you determine the relative total costs of owning different funds. In addition, if these transaction costs were included, your costs would have been higher.
| | | | | | | | | | | | | | | | | | | | |
| | | Beginning
Account Value
(07/01/19) | | ACTUAL | | | HYPOTHETICAL (5% annual return before
expenses) | | | Annualized
Expense
Ratio |
| | Ending
Account Value
(12/31/19)1 | | | Expenses
Paid During
Period2 | | | Ending
Account Value
(12/31/19) | | | Expenses
Paid During
Period2 | |
| Series I | | $1,000.00 | | | $1,082.90 | | | | $1.79 | | | | $1,023.49 | | | | $1.73 | | | 0.35% |
| Series II | | 1,000.00 | | | 1,081.80 | | | | 3.15 | | | | 1,022.18 | | | | 3.06 | | | 0.60 |
| 1 | The actual ending account value is based on the actual total return of the Fund for the period July 1, 2019 through December 31, 2019, after actual expenses and will differ from the hypothetical ending account value which is based on the Fund’s expense ratio and a hypothetical annual return of 5% before expenses. |
| 2 | Expenses are equal to the Fund’s annualized expense ratio as indicated above multiplied by the average account value over the period, multiplied by 184/365 to reflect the most recent fiscal half year. |
Invesco V.I. Equally-Weighted S&P 500 Fund
Tax Information
Form1099-DIV, Form1042-S and other year–end tax information provide shareholders with actual calendar year amounts that should be included in their tax returns. Shareholders should consult their tax advisors.
The following distribution information is being provided as required by the Internal Revenue Code or to meet a specific state’s requirement.
The Fund designates the following amounts or, if subsequently determined to be different, the maximum amount allowable for its fiscal year ended December 31, 2019:
| | | | | | | | |
Federal and State Income Tax | | | | | | | | |
Long-term Capital Gain Distribution | | $ | 3,234,005 | | | | | |
Corporate Dividends Received Deduction* | | | 80.82 | % | | | | |
U.S. Treasury Obligations* | | | 0.00 | % | | | | |
| | * | The above percentages are based on ordinary income dividends paid to shareholders during the Fund’s fiscal year. |
Invesco V.I. Equally-Weighted S&P 500 Fund
Trustees and Officers
The address of each trustee and officer is AIM Variable Insurance Funds (Invesco Variable Insurance Funds) (the “Trust”), 11 Greenway Plaza, Suite 1000, Houston, Texas 77046-1173. The trustees serve for the life of the Trust, subject to their earlier death, incapacitation, resignation, retirement or removal as more specifically provided in the Trust’s organizational documents. Each officer serves for a one year term or until their successors are elected and qualified. Column two below includes length of time served with predecessor entities, if any.
| | | | | | | | |
Name, Year of Birth and
Position(s)
Held with the Trust | | Trustee
and/or
Officer
Since | | Principal Occupation(s)
During Past 5 Years | | Number of
Funds in
Fund Complex
Overseen by
Trustee | | Other
Directorship(s)
Held by Trustee
During Past 5
Years |
| Interested Person | | | | | | | | |
| Martin L. Flanagan1- 1960 Trustee and Vice Chair | | 2007 | | Executive Director, Chief Executive Officer and President, Invesco Ltd. (ultimate parent of Invesco and a global investment management firm); Trustee and Vice Chair, The Invesco Funds; Vice Chair, Investment Company Institute; and Member of Executive Board, SMU Cox School of Business Formerly: Advisor to the Board, Invesco Advisers, Inc. (formerly known as Invesco Institutional (N.A.), Inc.); Chairman and Chief Executive Officer, Invesco Advisers, Inc. (registered investment adviser); Director, Chairman, Chief Executive Officer and President, Invesco Holding Company (US), Inc. (formerly IVZ Inc.) (holding company), Invesco Group Services, Inc. (service provider) and Invesco North American Holdings, Inc. (holding company); Director, Chief Executive Officer and President, Invesco Holding Company Limited (parent of Invesco and a global investment management firm); Director, Invesco Ltd.; Chairman, Investment Company Institute and President,Co-Chief Executive Officer,Co-President, Chief Operating Officer and Chief Financial Officer, Franklin Resources, Inc. (global investment management organization) | | 229 | | None |
| 1 | Mr. Flanagan is considered an interested person (within the meaning of Section 2(a)(19) of the 1940 Act) of the Trust because he is an officer of the Adviser to the Trust, and an officer and a director of Invesco Ltd., ultimate parent of the Adviser. |
Invesco V.I. Equally-Weighted S&P 500 Fund
Trustees and Officers–(continued)
| | | | | | | | |
Name, Year of Birth and
Position(s)
Held with the Trust | | Trustee
and/or
Officer
Since | | Principal Occupation(s)
During Past 5 Years | | Number of
Funds in Fund Complex
Overseen by
Trustee | | Other
Directorship(s)
Held by Trustee
During Past 5
Years |
| Independent Trustees | | | | | | | | |
| Bruce L. Crockett - 1944 Trustee and Chair | | 1993 | | Chairman, Crockett Technologies Associates (technology consulting company) Formerly: Director, Captaris (unified messaging provider); Director, President and Chief Executive Officer, COMSAT Corporation; Chairman, Board of Governors of INTELSAT (international communications company); ACE Limited (insurance company); Independent Directors Council and Investment Company Institute: Member of the Audit Committee, Investment Company Institute; Member of the Executive Committee and Chair of the Governance Committee, Independent Directors Council | | 229 | | Director and Chairman of the Audit Committee, ALPS (Attorneys Liability Protection Society) (insurance company); Director and Member of the Audit Committee and Compensation Committee, Ferroglobe PLC (metallurgical company) |
| David C. Arch - 1945 Trustee | | 2010 | | Chairman of Blistex Inc. (consumer health care products manufacturer); Member, World Presidents’ Organization | | 229 | | Board member of the Illinois Manufacturers’ Association |
| Beth Ann Brown - 1968 Trustee | | 2019 | | Independent Consultant Formerly: Head of Intermediary Distribution, Managing Director, Strategic Relations, Managing Director, Head of National Accounts, Senior Vice President, National Account Manager and Senior Vice President, Key Account Manager, Columbia Management Investment Advisers LLC; Vice President, Key Account Manager, Liberty Funds Distributor, Inc.; and Trustee of certain Oppenheimer Funds | | 229 | | Director, Board of Directors of Caron Engineering Inc.; Advisor, Board of Advisors of Caron Engineering Inc.; President and Director, Acton Shapleigh Youth Conservation Corps (non - profit); and Vice President and Director of Grahamtastic Connection (non-profit) |
| Jack M. Fields - 1952 Trustee | | 1997 | | Chief Executive Officer, Twenty First Century Group, Inc. (government affairs company); and Chairman, Discovery Learning Alliance(non-profit) Formerly: Owner and Chief Executive Officer, Dos Angeles Ranch L.P. (cattle, hunting, corporate entertainment); Director, Insperity, Inc. (formerly known as Administaff) (human resources provider); Chief Executive Officer, Texana Timber LP (sustainable forestry company); Director of Cross Timbers Quail Research Ranch(non-profit); and member of the U.S. House of Representatives | | 229 | | None |
Invesco V.I. Equally-Weighted S&P 500 Fund
Trustees and Officers–(continued)
| | | | | | | | |
Name, Year of Birth and
Position(s)
Held with the Trust | | Trustee
and/or
Officer
Since | | Principal Occupation(s)
During Past 5 Years | | Number of
Funds in
Fund Complex
Overseen by
Trustee | | Other
Directorship(s)
Held by Trustee
During Past 5 Years |
| Independent Trustees–(continued) | | | | |
Cynthia Hostetler - 1962
Trustee | | 2017 | | Non-Executive Director and Trustee of a number of public and private business corporations Formerly: Director, Aberdeen Investment Funds (4 portfolios); Head of Investment Funds and Private Equity, Overseas Private Investment Corporation; President, First Manhattan Bancorporation, Inc.; Attorney, Simpson Thacher & Bartlett LLP | | 229 | | Vulcan Materials Company (construction materials company); Trilinc Global Impact Fund; Genesee & Wyoming, Inc. (railroads); Artio Global Investment LLC (mutual fund complex); Edgen Group, Inc. (specialized energy and infrastructure products distributor); Investment Company Institute (professional organization); Independent Directors Council (professional organization) |
Eli Jones - 1961
Trustee | | 2016 | | Professor and Dean, Mays Business School - Texas A&M University Formerly: Professor and Dean, Walton College of Business, University of Arkansas and E.J. Ourso College of Business, Louisiana State University; Director, Arvest Bank | | 229 | | Insperity, Inc. (formerly known as Administaff) (human resources provider) |
Elizabeth Krentzman - 1959
Trustee | | 2019 | | Formerly: Principal and Chief Regulatory Advisor for Asset Management Services and U.S. Mutual Fund Leader of Deloitte & Touche LLP; General Counsel of the Investment Company Institute (trade association); National Director of the Investment Management Regulatory Consulting Practice, Principal, Director and Senior Manager of Deloitte & Touche LLP; Assistant Director of the Division of Investment Management - Office of Disclosure and Investment Adviser Regulation of the U.S. Securities and Exchange Commission and various positions with the Division of Investment Management - Office of Regulatory Policy of the U.S. Securities and Exchange Commission; Associate at Ropes & Gray LLP; Advisory Board Member of the Securities and Exchange Commission Historical Society; and Trustee of certain Oppenheimer Funds | | 229 | | Trustee of the University of Florida National Board Foundation and Audit Committee Member; Member of the Cartica Funds Board of Directors (private investment funds); Member of the University of Florida Law Center Association, Inc. Board of Trustees and Audit Committee Member |
Anthony J. LaCava, Jr. -1956
Trustee | | 2019 | | Formerly: Director and Member of the Audit Committee, Blue Hills Bank (publicly traded financial institution) and Managing Partner, KPMG LLP | | 229 | | Blue Hills Bank; Chairman, Bentley University; Member, Business School Advisory Council; and Nominating Committee KPMG LLP |
Prema Mathai-Davis -1950
Trustee | | 1998 | | Retired Co-Owner & Partner of Quantalytics Research, LLC, (a FinTech Investment Research Platform for the Self-Directed Investor) | | 229 | | None |
Invesco V.I. Equally-Weighted S&P 500 Fund
Trustees and Officers–(continued)
| | | | | | | | |
Name, Year of Birth and
Position(s)
Held with the Trust | | Trustee
and/or
Officer
Since | | Principal Occupation(s)
During Past 5 Years | | Number of
Funds in
Fund Complex
Overseen by
Trustee | | Other
Directorship(s)
Held by Trustee
During Past 5 Years |
| Independent Trustees–(continued) | | | | |
Joel W. Motley - 1952
Trustee | | 2019 | | Director of Office of Finance, Federal Home Loan Bank; Member of the Vestry of Trinity Wall Street; Managing Director of Carmona Motley Inc. (privately held financial advisor); Member of the Finance and Budget Committee of the Council on Foreign Relations, Member of the Investment Committee and Board of Human Rights Watch and Member of the Investment Committee and Board of Historic Hudson Valley(non-profit cultural organization) Formerly: Managing Director of Public Capital Advisors, LLC (privately held financial advisor); Managing Director of Carmona Motley Hoffman, Inc. (privately held financial advisor); Trustee of certain Oppenheimer Funds; and Director of Columbia Equity Financial Corp. (privately held financial advisor) | | 229 | | Director of Greenwall Foundation (bioethics research foundation); Member of Board and Investment Committee of The Greenwall Foundation; Director of Southern Africa Legal Services Foundation; Board Member and Investment Committee Member of Pulizer Center for Crisis Reporting(non-profit journalism) |
Teresa M. Ressel - 1962
Trustee | | 2017 | | Non-executive director and trustee of a number of public and private business corporations Formerly: Chief Financial Officer, Olayan America, The Olayan Group (international investor/commercial/industrial); Chief Executive Officer, UBS Securities LLC; Group Chief Operating Officer, Americas, UBS AG; Assistant Secretary for Management & Budget and CFO, US Department of the Treasury | | 229 | | Atlantic Power Corporation (power generation company); ON Semiconductor Corp. (semiconductor supplier) |
Ann Barnett Stern - 1957
Trustee | | 2017 | | President and Chief Executive Officer, Houston Endowment Inc. (private philanthropic institution) Formerly: Executive Vice President and General Counsel, Texas Children’s Hospital; Attorney, Beck, Redden and Secrest, LLP; Business Law Instructor, University of St. Thomas; Attorney, Andrews & Kurth LLP | | 229 | | Federal Reserve Bank of Dallas |
Robert C. Troccoli - 1949
Trustee | | 2016 | | Retired | | 229 | | None |
Daniel S. Vandivort - 1954
Trustee | | 2019 | | Treasurer, Chairman of the Audit and Finance Committee, and Trustee, Board of Trustees, Huntington Disease Foundation of America; and President, Flyway Advisory Services LLC (consulting and property management) Formerly: Trustee and Governance Chair, of certain Oppenheimer Funds | | 229 | | Chairman and Lead Independent Director, Chairman of the Audit Committee, and Director, Board of Directors, Value Line Funds |
James D. Vaughn - 1945
Trustee | | 2019 | | Retired Formerly: Managing Partner, Deloitte & Touche LLP; Trustee and Chairman of the Audit Committee, Schroder Funds; Board Member, Mile High United Way, Boys and Girls Clubs, Boy Scouts, Colorado Business Committee for the Arts, Economic Club of Colorado and Metro Denver Network (economic development corporation); and Trustee of certain Oppenheimer Funds | | 229 | | Board member and Chairman of Audit Committee of AMG National Trust Bank; Trustee and Investment Committee member, University of South Dakota Foundation; Board member, Audit Committee Member and past Board Chair, Junior Achievement(non-profit) |
Invesco V.I. Equally-Weighted S&P 500 Fund
Trustees and Officers–(continued)
| | | | | | | | |
Name, Year of Birth and
Position(s)
Held with the Trust | | Trustee
and/or
Officer
Since | | Principal Occupation(s)
During Past 5 Years | | Number of
Funds in
Fund Complex
Overseen by
Trustee | | Other
Directorship(s)
Held by Trustee
During Past 5 Years |
| Independent Trustees—(continued) | | | | |
Christopher L. WIlson - 1957
Trustee, Vice Chair and Chair Designate | | 2017 | | Retired Formerly: Director, TD Asset Management USA Inc. (mutual fund complex) (22 portfolios); Managing Partner, CT2, LLC (investing and consulting firm); President/Chief Executive Officer, Columbia Funds, Bank of America Corporation; President/Chief Executive Officer, CDC IXIS Asset Management Services, Inc.; Principal & Director of Operations, Scudder Funds, Scudder, Stevens & Clark, Inc.; Assistant Vice President, Fidelity Investments | | 229 | | ISO New England, Inc.(non-profit organization managing regional electricity market) |
Invesco V.I. Equally-Weighted S&P 500 Fund
Trustees and Officers–(continued)
| | | | | | | | |
Name, Year of Birth and
Position(s)
Held with the Trust | | Trustee
and/or
Officer
Since | | Principal Occupation(s)
During Past 5 Years | | Number of
Funds in
Fund Complex
Overseen by
Trustee | | Other
Directorship(s)
Held by Trustee
During Past 5
Years |
| Officers | | | | | | | | |
Sheri Morris - 1964
President, Principal Executive Officer and Treasurer | | 1999 | | Head of Global Fund Services, Invesco Ltd.; President, Principal Executive Officer and Treasurer, The Invesco Funds; Vice President, Invesco Advisers, Inc. (formerly known as Invesco Institutional (N.A.), Inc.) (registered investment adviser); and Vice President, Invesco Exchange-Traded Fund Trust, Invesco Exchange-Traded Fund Trust II, Invesco India Exchange-Traded Fund Trust, Invesco Actively Managed Exchange-Traded Fund Trust, Invesco Actively Managed Exchange-Traded Commodity Fund Trust and Invesco Exchange-Traded Self-Indexed Fund Trust; and Vice President, OppenheimerFunds, Inc. Formerly: Vice President and Principal Financial Officer, The Invesco Funds; Vice President, Invesco AIM Advisers, Inc., Invesco AIM Capital Management, Inc. and Invesco AIM Private Asset Management, Inc.; Assistant Vice President and Assistant Treasurer, The Invesco Funds and Assistant Vice President, Invesco Advisers, Inc., Invesco AIM Capital Management, Inc. and Invesco AIM Private Asset Management, Inc.; and Treasurer, Invesco Exchange-Traded Fund Trust, Invesco Exchange-Traded Fund Trust II, Invesco India Exchange-Traded Fund Trust and Invesco Actively Managed Exchange-Traded Fund Trust | | N/A | | N/A |
Russell C. Burk - 1958
Senior Vice President and Senior Officer | | 2005 | | Senior Vice President and Senior Officer, The Invesco Funds | | N/A | | N/A |
Jeffrey H. Kupor - 1968
Senior Vice President, Chief Legal Officer and Secretary | | 2018 | | Head of Legal of the Americas, Invesco Ltd.; Senior Vice President and Secretary, Invesco Advisers, Inc. (formerly known as Invesco Institutional (N.A.), Inc.) (registered investment adviser); Senior Vice President and Secretary, Invesco Distributors, Inc. (formerly known as Invesco AIM Distributors, Inc.); Vice President and Secretary, Invesco Investment Services, Inc. (formerly known as Invesco AIM Investment Services, Inc.) Senior Vice President, Chief Legal Officer and Secretary, The Invesco Funds; Secretary and General Counsel, Invesco Investment Advisers LLC (formerly known as Van Kampen Asset Management); Secretary and General Counsel, Invesco Capital Markets, Inc. (formerly known as Van Kampen Funds Inc.) and Chief Legal Officer, Invesco Exchange-Traded Fund Trust, Invesco Exchange-Traded Fund Trust II, Invesco India Exchange-Traded Fund Trust, Invesco Actively Managed Exchange-Traded Fund Trust, Invesco Actively Managed Exchange-Traded Commodity Fund Trust and Invesco Exchange-Traded Self-Indexed Fund Trust; Secretary, Invesco Indexing LLC; Secretary, W.L. Ross & Co., LLC Formerly: Secretary and Vice President, Jemstep, Inc.; Head of Legal, Worldwide Institutional, Invesco Ltd.; Secretary and General Counsel, INVESCO Private Capital Investments, Inc.; Senior Vice President, Secretary and General Counsel, Invesco Management Group, Inc. (formerly known as Invesco AIM Management Group, Inc.); Assistant Secretary, INVESCO Asset Management (Bermuda) Ltd.; Secretary and General Counsel, Invesco Private Capital, Inc.; Assistant Secretary and General Counsel, INVESCO Realty, Inc.; Secretary and General Counsel, Invesco Senior Secured Management, Inc.; and Secretary, Sovereign G./P. Holdings Inc. | | N/A | | N/A |
Andrew R. Schlossberg - 1974
Senior Vice President | | 2019 | | Head of the Americas and Senior Managing Director, Invesco Ltd.; Director and Senior Vice President, Invesco Advisers, Inc. (formerly known as Invesco Institutional (N.A.), Inc.) (registered investment adviser); Director and Chairman, Invesco Investment Services, Inc. (formerly known as Invesco AIM Investment Services, Inc.) (registered transfer agent); Senior Vice President, The Invesco Funds; Director, Invesco Investment Advisers LLC (formerly known as Van Kampen Asset Management); Director, President and Chairman, Invesco Insurance Agency, Inc. Formerly: Director, Invesco UK Limited; Director and Chief Executive, Invesco Asset Management Limited and Invesco Fund Managers Limited; Assistant Vice President, The Invesco Funds; Senior Vice President, Invesco Advisers, Inc. (formerly known as Invesco Institutional (N.A.), Inc.) (registered investment adviser); Director and Chief Executive, Invesco Administration Services Limited and Invesco Global Investment Funds Limited; Director, Invesco Distributors, Inc.; Head of EMEA, Invesco Ltd.; President, Invesco Actively Managed Exchange-Traded Commodity Fund Trust, Invesco Actively Managed Exchange-Traded Fund Trust, Invesco Exchange-Traded Fund Trust, Invesco Exchange-Traded Fund Trust II and Invesco India Exchange-Traded Fund Trust; Managing Director and Principal Executive Officer, Invesco Capital Management LLC | | N/A | | N/A |
Invesco V.I. Equally-Weighted S&P 500 Fund
Trustees and Officers–(continued)
| | | | | | | | |
Name, Year of Birth and
Position(s)
Held with the Trust | | Trustee
and/or
Officer
Since | | Principal Occupation(s)
During Past 5 Years | | Number of
Funds in
Fund Complex
Overseen by
Trustee | | Other
Directorship(s)
Held by Trustee
During Past 5
Years |
| Officers—(continued) | | | | | | | | |
| John M. Zerr - 1962 Senior Vice President | | 2006 | | Chief Operating Officer of the Americas; Senior Vice President, Invesco Advisers, Inc. (formerly known as Invesco Institutional (N.A.), Inc.) (registered investment adviser); Senior Vice President, Invesco Distributors, Inc. (formerly known as Invesco AIM Distributors, Inc.); Director and Vice President, Invesco Investment Services, Inc. (formerly known as Invesco AIM Investment Services, Inc.) Senior Vice President, The Invesco Funds; Managing Director, Invesco Capital Management LLC; Director, Invesco Investment Advisers LLC (formerly known as Van Kampen Asset Management); Senior Vice President, Invesco Capital Markets, Inc. (formerly known as Van Kampen Funds Inc.); Manager, Invesco Indexing LLC; Manager, Invesco Specialized Products, LLC; Director and Senior Vice President, Invesco Insurance Agency, Inc.; Member, Invesco Canada Funds Advisory Board; Director, President and Chief Executive Officer, Invesco Corporate Class Inc. (corporate mutual fund company); and Director, Chairman, President and Chief Executive Officer, Invesco Canada Ltd. (formerly known as Invesco Trimark Ltd./Invesco Trimark Ltèe) (registered investment adviser and registered transfer agent) Formerly: Director and Senior Vice President, Invesco Management Group, Inc. (formerly known as Invesco AIM Management Group, Inc.); Secretary and General Counsel, Invesco Management Group, Inc. (formerly known as Invesco AIM Management Group, Inc.); Secretary, Invesco Investment Services, Inc. (formerly known as Invesco AIM Investment Services, Inc.); Chief Legal Officer and Secretary, The Invesco Funds; Secretary and General Counsel, Invesco Investment Advisers LLC (formerly known as Van Kampen Asset Management); Secretary and General Counsel, Invesco Capital Markets, Inc. (formerly known as Van Kampen Funds Inc.); Chief Legal Officer, Invesco Exchange-Traded Fund Trust, Invesco Exchange-Traded Fund Trust II, Invesco India Exchange-Traded Fund Trust, Invesco Actively Managed Exchange-Traded Fund Trust, Invesco Actively Managed Exchange-Traded Commodity Fund Trust and Invesco Exchange-Traded Self-Indexed Fund Trust; Secretary, Invesco Indexing LLC; Director, Secretary, General Counsel and Senior Vice President, Van Kampen Exchange Corp.; Director, Vice President and Secretary, IVZ Distributors, Inc. (formerly known as INVESCO Distributors, Inc.); Director and Vice President, INVESCO Funds Group, Inc.; Director and Vice President, Van Kampen Advisors Inc.; Director, Vice President, Secretary and General Counsel, Van Kampen Investor Services Inc.;Director and Secretary, Invesco Distributors, Inc. (formerly known as Invesco AIM Distributors, Inc.); Director, Senior Vice President, General Counsel and Secretary, Invesco AIM Advisers, Inc. and Van Kampen Investments Inc.; Director, Vice President and Secretary, Fund Management Company; Director, Senior Vice President, Secretary, General Counsel and Vice President, Invesco AIM Capital Management, Inc.; Chief Operating Officer and General Counsel, Liberty Ridge Capital, Inc. (an investment adviser) | | N/A | | N/A |
| Gregory G. McGreevey - 1962 Senior Vice President | | 2012 | | Senior Managing Director, Invesco Ltd.; Director, Chairman, President, and Chief Executive Officer, Invesco Advisers, Inc. (formerly known as Invesco Institutional (N.A.), Inc.) (registered investment adviser); Director, Invesco Mortgage Capital, Inc. and Invesco Senior Secured Management, Inc.; and Senior Vice President, The Invesco Funds; and President, SNW Asset Management Corporation Formerly: Senior Vice President, Invesco Management Group, Inc. and Invesco Advisers, Inc.; Assistant Vice President, The Invesco Funds | | N/A | | N/A |
| Kelli Gallegos - 1970 Vice President, Principal Financial Officer and Assistant Treasurer | | 2008 | | Principal Financial and Accounting Officer – Investments Pool, Invesco Specialized Products, LLC; Vice President, Principal Financial Officer and Assistant Treasurer, The Invesco Funds; Principal Financial and Accounting Officer – Pooled Investments, Invesco Capital Management LLC; Vice President and Treasurer, Invesco Exchange-Traded Fund Trust, Invesco Exchange-Traded Fund Trust II, Invesco India Exchange-Traded Fund Trust, Invesco Actively Managed Exchange-Traded Fund Trust, Invesco Actively Managed Exchange-Traded Commodity Fund Trust and Invesco Exchange-Traded Self-Indexed Fund Trust Formerly: Assistant Treasurer, Invesco Specialized Products, LLC; Assistant Treasurer, Invesco Exchange-Traded Fund Trust, Invesco Exchange-Traded Fund Trust II, Invesco India Exchange-Traded Fund Trust, Invesco Actively Managed Exchange-Traded Fund Trust, Invesco Actively Managed Exchange-Traded Commodity Fund Trust and Invesco Exchange-Traded Self-Indexed Fund Trust; Assistant Treasurer, Invesco Capital Management LLC; Assistant Vice President, The Invesco Funds | | N/A | | N/A |
Invesco V.I. Equally-Weighted S&P 500 Fund
Trustees and Officers–(continued)
| | | | | | | | |
Name, Year of Birth and
Position(s)
Held with the Trust | | Trustee
and/or
Officer
Since | | Principal Occupation(s)
During Past 5 Years | | Number of
Funds in
Fund Complex
Overseen by
Trustee | | Other
Directorship(s)
Held by Trustee
During Past 5
Years |
| Officers–(continued) | | | | | | | | |
| Crissie M. Wisdom - 1969 Anti-Money Laundering Compliance Officer | | 2013 | | Anti-Money Laundering Compliance Officer, Invesco Advisers, Inc. (formerly known as Invesco Institutional (N.A.), Inc.) (registered investment adviser), Invesco Capital Markets, Inc. (formerly known as Van Kampen Funds Inc.), Invesco Distributors, Inc., Invesco Investment Services, Inc., The Invesco Funds, and Invesco Exchange-Traded Fund Trust, Invesco Exchange-Traded Fund Trust II, Invesco India Exchange-Traded Fund Trust, Invesco Actively Managed Exchange-Traded Fund Trust, Invesco Actively Managed Exchange-Traded Commodity Fund Trust and Invesco Exchange-Traded Self-Indexed Fund Trust; Anti-Money Laundering Compliance Officer and Bank Secrecy Act Officer, INVESCO National Trust Company and Invesco Trust Company; and Fraud Prevention Manager and Controls and Risk Analysis Manager for Invesco Investment Services, Inc. Formerly: Anti-Money Laundering Compliance Officer, Van Kampen Exchange Corp. and Invesco Management Group, Inc. | | N/A | | N/A |
Robert R. Leveille – 1969 Chief Compliance Officer | | 2016 | | Chief Compliance Officer, Invesco Advisers, Inc. (registered investment adviser); and Chief Compliance Officer, The Invesco Funds Formerly: Chief Compliance Officer, Putnam Investments and the Putnam Funds | | N/A | | N/A |
The Statement of Additional Information of the Trust includes additional information about the Fund’s Trustees and is available upon request, without charge, by calling 1.800.959.4246. Please refer to the Fund’s Statement of Additional Information for information on the Fund’ssub-advisers.
| | | | | | |
Office of the Fund
11 Greenway Plaza, Suite 1000
Houston, TX 77046-1173
| | Investment Adviser
Invesco Advisers, Inc.
1555 Peachtree Street, N.E.
Atlanta, GA 30309 | | Distributor
Invesco Distributors, Inc.
11 Greenway Plaza, Suite 1000
Houston, TX 77046-1173 | | Auditors
PricewaterhouseCoopers LLP
1000 Louisiana Street, Suite 5800
Houston, TX 77002-5678 |
| | | |
Counsel to the Fund
Stradley Ronon Stevens & Young, LLP
2005 Market Street, Suite 2600
Philadelphia, PA 19103-7018 | | Counsel to the Independent Trustees
Goodwin Procter LLP
901 New York Avenue, N.W.
Washington, D.C. 20001 | | Transfer Agent
Invesco Investment Services, Inc.
11 Greenway Plaza, Suite 1000
Houston, TX 77046-1173 | | Custodian
State Street Bank and Trust Company
225 Franklin Street
Boston, MA 02110-2801
|
Invesco V.I. Equally-Weighted S&P 500 Fund
| | | | |
 | | Annual Report to Shareholders | | December 31, 2019 |
| | Invesco V.I. Equity and Income Fund |
| | |
| | |

Beginning on January 1, 2021, as permitted by regulations adopted by the Securities and Exchange Commission, the insurance company that offers your variable annuity or variable life insurance contract may no longer send you paper copies of the Fund’s shareholder reports by mail, unless you specifically request paper copies of the reports from the insurance company or your financial intermediary. Instead of delivering paper copies of the report, the insurance company may choose to make the reports available on a website, and will notify you by mail each time a report is posted and provide you with a website link to access the report. Instructions for requesting paper copies will be provided by your insurance company.
If the insurance company offers electronic delivery, you may elect to receive shareholder reports and other communications about the Fund electronically by following the instructions provided by the insurance company or by contacting your financial intermediary. If you already elected to receive shareholder reports electronically, you will not be affected by this change and you need not take any action.
You may elect to receive all future reports in paper free of charge from the insurance company. You can inform the insurance company or your financial intermediary that you wish to continue receiving paper copies of your shareholder reports by following the instructions provided by the insurance company or by contacting your financial intermediary. Your election to receive reports in paper will apply to all portfolio companies available under your contract with the insurance company.
The Fund provides a complete list of its holdings four times in each fiscal year, at the quarter-ends. For the second and fourth quarters, the lists appear in the Fund’s semiannual and annual reports to shareholders. For the first and third quarters, the Fund files the lists with the Securities and Exchange Commission (SEC) as an exhibit to its reports on FormN-PORT. The Fund’s FormN-PORT filings are available on the SEC website, sec.gov. The SEC file numbers for the Fund are811-07452 and033-57340. The Fund’s most recent portfolio holdings, as filed on FormN-PORT, have also been made available to insurance companies issuing variable annuity contracts and variable life insurance policies (“variable products”) that invest in the Fund.
A description of the policies and procedures that the Fund uses to determine how to vote proxies relating to portfolio securities is available without charge, upon request, from our Client Services department at 800 959 4246 or at invesco.com/proxyguidelines. The information is also available on the SEC website, sec.gov.
Information regarding how the Fund voted proxies related to its portfolio securities during the most recent12-month period ended June 30 is available at invesco.com/proxysearch. The information is also available on the SEC website, sec.gov.
Invesco Advisers, Inc. is an investment adviser; it provides investment advisory services to individual and institutional clients and does not sell securities. Invesco Distributors, Inc. is the US distributor for Invesco Ltd.’s retail mutual funds, exchange-traded funds and institutional money market funds. Both are wholly owned, indirect subsidiaries of Invesco Ltd.
This report must be accompanied or preceded by a currently effective Fund prospectus and variable product prospectus, which contain more complete information, including sales charges and expenses. Investors should read each carefully before investing.
NOT FDIC INSURED | MAY LOSE VALUE | NO BANK GUARANTEE
| | |
Invesco Distributors, Inc. | | VK-VIEQI-AR-1 |
Management’s Discussion of Fund Performance
| | | | |
Performance summary For the fiscal year ended December 31, 2019, Series I shares of V.I. Invesco Equity and Income Fund (the Fund), at net asset value (NAV), underperformed the Russell 1000 Value Index. Your Fund’s long-term performance appears later in this report. | |
Fund vs. Indexes Total returns, 12/31/18 to 12/31/19, excluding variable product issuer charges. If variable product issuer charges were included, returns would be lower. | | | | |
| Series I Shares | | | 20.37 | % |
| Series II Shares | | | 20.01 | |
| Russell 1000 Value Indexq(Broad Market Index) | | | 26.54 | |
| Bloomberg Barclays U.S. Government/Credit Indexq(Style-Specific Index) | | | 9.71 | |
| Lipper VUF Mixed-Asset Target Allocation Growth Funds Index∎(Peer Group Index) | | | 20.66 | |
Source(s):qRIMES Technologies Corp.;∎Lipper Inc. | |
Market conditions and your Fund
Equity markets rallied in the first quarter of 2019, fueled by optimism about a potentialUS-China trade deal and indication that the US Federal Reserve (the Fed) would not raise interest rates in 2019, a surprising shift in monetary policy. The Fed’s more accommodative stance provided a supportive environment for equities and fixed income, even as US economic data were mixed and overseas growth appeared to be slowing. Against this backdrop, the S&P 500 Index posted its best first quarter returns since 1998.
Although the S&P 500 Index posted modest gains for the second quarter of 2019, the US stock market experienced increased volatility. After four consecutive months of rising stock markets, the market sold off in May 2019, along with bond yields and oil prices, as investors weighed the impact of the lingering trade war between the US and China, as well as potential tariffs imposed on Mexico. In addition, economic data showed a slowing domestic and global economy.
Key issues that concerned investors in the second quarter of 2019 carried over
into the third quarter. TheUS-China trade conflict worried investors and stifled business investment, even as the Fed cut interest rates by 0.25% in July and again in September 2019.1 This environment, combined with evidence of slowing global economic growth, fueled market volatility in August 2019. The US Treasury yield curve inverted several times, increasing fears of a possible US recession. As a result, August saw increased risk aversion, with investors crowding into asset classes perceived as safe havens, such as US Treasuries and gold. However, the Fed’s accommodative tone provided some support for risk assets.
Macroeconomic issues that concerned investors in the third quarter of 2019 mostly abated during the fourth quarter, providing the backdrop for strong equity market returns. Risk assets surged higher as a result of a delay in the Brexit agreement until January 2020, optimism that phase one of theUS-China trade deal would be completed and better-than-expected third-quarter corporate earnings results. The US economy rose higher than expected, at 2.1% during the
third quarter of 2019.2 During its October meeting, the Fed cut interest rates again by 0.25% based on business investment and exports remaining weak.1 Investors were also encouraged by a resilient US economy and corporate earnings, putting the US equity market on track for its largest annual rise since 2013.
All sectors within the Russell 1000 Value Index had positive returns for the year, and except for energy, all had double digit returns, with information technology and industrials posting the strongest gains.
Security selection in the financials sector was the largest contributor to the Fund’s performance relative to the Russell 1000 Value Index for the year. Several key relative contributors for the year were concentrated in the banking industry, includingCitigroup,Citizens Financial,PNC FinancialsandBank of America. Following a sharp selloff in the fourth quarter of 2018, banks rebounded in the first quarter of 2019, and performed well throughout 2019 as revenues have generally improved and companies continue to return capital to shareholders through stock buybacks (reducing outstanding shares) and increased dividends.
Good stock selection in the health care, communication services and consumer staples sectors also contributed to the Fund’s performance relative to the Russell 1000 Value Index. Within the health care sector, the Fund’s holdings inCelgeneandPfizerwere strong contributors. During the year, Celgene was acquired byBristol Meyers Squibb(also a Fund holding) at a significant premium, and shares of the acquisition target rose sharply following the announcement. We sold Celgene after the bid was announced, and the deal ultimately closed
| | | | |
Portfolio Composition | |
By security type | | | % of total net assets | |
| | | | |
| |
| Common Stocks & Other Equity Interests | | | 61.11 | % |
| U.S. Dollar Denominated Bonds & Notes | | | 21.99 | |
| U.S. Treasury Securities | | | 11.93 | |
| Security Types Each Less Than 1% of Portfolio | | | 0.65 | |
| Money Market Funds Plus Other Assets Less Liabilities | | | 4.32 | |
| | | | |
Top 10 Equity Holdings* | | | | |
| % of total net assets | |
| |
1. Johnson & Johnson | | | 2.25 | % |
2. Bank of America Corp. | | | 2.19 | |
3. Philip Morris International, Inc. | | | 2.02 | |
4. Citigroup, Inc. | | | 1.98 | |
5. American International Group, Inc. | | | 1.83 | |
6. General Motors Co. | | | 1.67 | |
7. Morgan Stanley | | | 1.65 | |
8. PNC Financial Services Group, Inc. (The) | | | 1.61 | |
9. General Dynamics Corp. | | | 1.38 | |
10. Carnival Corp. | | | 1.34 | |
| | |
Total Net Assets | | $1.3 billion |
| |
Total Number of Holdings* | | 351 |
The Fund’s holdings are subject to change, and there is no assurance that the Fund will continue to hold any particular security.
*Excluding money market fund holdings, if any.
Data presented here are as of December 31, 2019.
Invesco V.I. Equity and Income Fund
in November. At the close of the year, we maintained our holding in Bristol Meyers.
Charter Communicationswas a key absolute and relative contributor (versus the Russell 1000 Value Index) in the communication services sector during the year. The company reported strong revenues during the year as the company focused on adding broadband subscribers to drive future growth. At the close of the year, we maintained our position in the company.
Within the consumer staples sector,Mondelezwas a strong absolute and relative contributor (versus the Russell 1000 Value Index) to Fund performance for the year. The company has made progress on its plan to increase profitability, with revenues and earnings growth accelerating during the year. Additionally, the fund’s lack of exposure to Walgreens Boots Alliance (an underperforming component of the Russell 1000 Value Index) contributed to relative Fund performance.
Given the strong equity market, the Fund’s allocation to cash, although averaging less than 5% for the year, was the Fund’s largest relative detractor compared to the Russell 1000 Value Index.
Security selection in the consumer discretionary sector also detracted from the Fund’s relative performance compared to the Russell 1000 Value Index during the year, due largely toCapri HoldingsandCarnival. Capri Holdings suffered as its Michael Kors brand witnessed declining sales, and reduced its 2020 outlook. However, the company’s Jimmy Choo and Versace brands have shown improvement, and the company is focusing more on accessories which we believe should help boost margins. Shares of cruise operator Carnival declined in June after the company reported a decline in profits and a weaker outlook for the remainder of 2019.
The materials and information technology sectors also detracted from the Fund’s relative return versus the Russell 1000 Value Index. Within the materials sector, this was due largely toThe Mosaic Company, a potash and phosphate supplier which announced plans to reduce phosphate production, an intended long-term benefit that has the potential to negatively affect short-term earnings. We liquidated our position in The Mosaic Company during the year.
The Fund uses high grade bonds as a source of income and to dampen return volatility. While bonds fared well on an absolute basis during the year, the bond
portion of the Fund’s portfolio underperformed the Russell 1000 Value Index. Similarly, the Fund’s allocation to convertible securities, while positive, underperformed the Russell 1000 Value Index, detracting from the Fund’s relative returns.
The Fund held currency forward contracts during the year for the purpose of hedging currency exposure ofnon-US-based companies held in the Fund. These derivatives were not for speculative purposes or leverage, and these positions had a small negative impact on the Fund’s performance relative to the Russell 1000 Value Index for the year.
During the year, within the equity portion of the Fund, we reduced the Fund’s relative overweight exposures to the financials and energy sectors, and increased exposures to the consumer staples, communication services and materials sectors. At the end of the year, the Fund’s largest equity overweight exposures relative to the style-specific benchmark were in the information technology, health care and financials sectors, while the largest underweight exposures were in the real estate, utilities and communication services sectors.
As always, we thank you for your investment in Invesco V.I. Equity and Income Fund and for sharing our long-term investment horizon.
1 Source: US Federal Reserve
2 Source: Bureau of Economic Analysis
Portfolio managers:
Chuck Burge
Brian Jurkash - Lead
Sergio Marcheli
Matthew Titus - Lead
The views and opinions expressed in management’s discussion of Fund performance are those of Invesco Advisers, Inc. These views and opinions are subject to change at any time based on factors such as market and economic conditions. These views and opinions may not be relied upon as investment advice or recommendations, or as an offer for a particular security. The information is not a complete analysis of every aspect of any market, country, industry, security or the Fund. Statements of fact are from sources considered reliable, but Invesco Advisers, Inc. makes no representation or warranty as to their completeness or accuracy. Although historical performance is no guarantee of future results, these insights may help you understand our investment management philosophy.
See important Fund and, if applicable, index disclosures later in this report.
Invesco V.I. Equity and Income Fund
Your Fund’s Long-Term Performance
Results of a $10,000 Investment – Oldest Share Class(es)
Fund and index data from 12/31/09
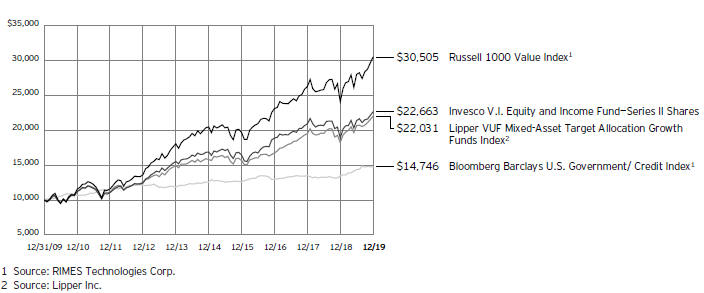
Past performance cannot guarantee future
results.
| | | | |
Average Annual Total Returns | |
As of 12/31/19 | | | | |
| |
Series I Shares | | | | |
10 Years | | | 8.75 | % |
5 Years | | | 6.35 | |
1 Year | | | 20.37 | |
Series II Shares | | | | |
Inception (4/30/03) | | | 7.82 | % |
10 Years | | | 8.53 | |
5 Years | | | 6.07 | |
1 Year | | | 20.01 | |
Effective June 1, 2010, Class II shares of the predecessor fund, Universal Institutional Funds Equity and Income Portfolio, advised by Morgan Stanley Investment Management Inc. were reorganized into Series II shares of Invesco Van Kampen V.I. Equity and Income Fund (renamed Invesco V.I. Equity and Income Fund on April 29, 2013). Returns shown above, prior to June 1, 2010, for Series II shares are blended returns of the predecessor fund and Invesco V.I. Equity and Income Fund. Share class returns will differ from the predecessor fund because of different expenses.
Series I shares incepted on June 1, 2010. Series I shares performance shown prior to that date is that of the predecessor fund’s Class II shares and includes the12b-1 fees applicable to the predecessor fund’s Class II shares.
The performance data quoted represent past performance and cannot guarantee future results; current performance may be lower or higher. Please contact your variable
product issuer or financial adviser for the most recentmonth-end variable product performance. Performance figures reflect Fund expenses, reinvested distributions and changes in net asset value. Performance figures do not reflect deduction of taxes a shareholder would pay on Fund distributions or sale of Fund shares. Investment return and principal value will fluctuate so that you may have a gain or loss when you sell shares.
The net annual Fund operating expense ratio set forth in the most recent Fund prospectus as of the date of this report for Series I and Series II shares was 0.55% and 0.80%, respectively.1 The total annual Fund operating expense ratio set forth in the most recent Fund prospectus as of the date of this report for Series I and Series II shares was 0.56% and 0.81%, respectively. The expense ratios presented above may vary from the expense ratios presented in other sections of this report that are based on expenses incurred during the period covered by this report.
Invesco V.I. Equity and Income Fund, a series portfolio of AIM Variable Insurance Funds (Invesco Variable Insurance Funds), is currently offered through insurance companies issuing variable products. You cannot purchase shares of the Fund directly. Performance figures given represent the Fund and are not intended to reflect actual variable product values. They do not reflect sales charges, expenses and fees assessed in connection with a variable product. Sales charges, expenses and fees, which are
determined by the variable product issuers, will vary and will lower the total return.
The most recentmonth-end performance at the Fund level, excluding variable product charges, is available at 800 451 4246. As mentioned above, for the most recentmonth-end performance including variable product charges, please contact your variable product issuer or financial adviser.
Fund performance reflects any applicable fee waivers and/or expense reimbursements. Had the adviser not waived fees and/or reimbursed expenses currently or in the past, returns would have been lower. See current prospectus for more information.
| 1 | Total annual Fund operating expenses after any contractual fee waivers and/or expense reimbursements by the adviser in effect through at least June 30, 2021. See current prospectus for more information. |
Invesco V.I. Equity and Income Fund
Invesco V.I. Equity and Income Fund’s investment objectives are both capital appreciation and current income.
| ∎ | Unless otherwise stated, information presented in this report is as of December 31, 2019, and is based on total net assets. |
| ∎ | Unless otherwise noted, all data provided by Invesco. |
∎ To access your Fund’s reports/prospectus, visit invesco.com/fundreports.
About indexes used in this report
| ∎ | TheRussell 1000® Value Indexis an unmanaged index considered representative oflarge-cap value stocks. The Russell 1000 Value Index is a trademark/service mark of the Frank Russell Co. Russell® is a trademark of the Frank Russell Co. |
| ∎ | TheBloomberg Barclays U.S. Government/Credit Index is a broad-based benchmark that includes investment-grade, US dollar-denominated, fixed-rate Treasuries, government-related and corporate securities. |
| ∎ | TheLipper VUF Mixed-Asset Target Allocation Growth Funds Indexis an unmanaged index considered representative of mixed-asset target allocation growth variable insurance underlying funds tracked by Lipper. |
| ∎ | The Fund is not managed to track the performance of any particular index, including the index(es) described here, and consequently, the performance of the Fund may deviate significantly from the performance of the index(es). |
| ∎ | A direct investment cannot be made in an index. Unless otherwise indicated, index results include reinvested dividends, and they do not reflect sales charges. Performance of the peer group, if applicable, reflects fund expenses; performance of a market index does not. |
Other information
| ∎ | The returns shown in management’s discussion of Fund performance are based on net asset values calculated for shareholder transactions. Generally accepted accounting principles require adjustments to be made to the net assets of the Fund at period end for financial reporting purposes, and as such, the net asset values for shareholder transactions and the returns based on those net asset values may differ from the net asset values and returns reported in the Financial Highlights. Additionally, the returns and net asset values shown throughout this report are at the Fund level only and do not include variable |
| | product issuer charges. If such charges were included, the total returns would be lower. |
| ∎ | Industry classifications used in this report are generally according to the Global Industry Classification Standard, which was developed by and is the exclusive property and a service mark of MSCI Inc. and Standard & Poor’s. |
Invesco V.I. Equity and Income Fund
Schedule of Investments(a)
December 31, 2019
| | | | | | |
| | | Shares | | | Value |
|
Common Stocks & Other Equity Interests–61.11% |
| | |
Aerospace & Defense–1.38% | | | | | | |
General Dynamics Corp. | | | 100,864 | | | $ 17,787,366 |
|
Apparel, Accessories & Luxury Goods–1.19% |
Capri Holdings Ltd.(b) | | | 401,127 | | | 15,302,995 |
| | |
Automobile Manufacturers–1.67% | | | | | | |
General Motors Co. | | | 586,873 | | | 21,479,552 |
| | |
Building Products–0.88% | | | | | | |
Johnson Controls International PLC | | | 278,714 | | | 11,346,447 |
| | |
Cable & Satellite–1.73% | | | | | | |
Charter Communications, Inc., Class A(b) | | | 25,859 | | | 12,543,684 |
Comcast Corp., Class A | | | 217,051 | | | 9,760,783 |
| | | | | | | 22,304,467 |
| | |
Commodity Chemicals–0.60% | | | | | | |
Dow, Inc. | | | 141,587 | | | 7,749,057 |
|
Communications Equipment–0.62% |
Cisco Systems, Inc. | | | 167,161 | | | 8,017,042 |
Diversified Banks–5.99% | | | | | | |
Bank of America Corp. | | | 799,871 | | | 28,171,457 |
Citigroup, Inc. | | | 318,178 | | | 25,419,241 |
JPMorgan Chase & Co. | | | 99,753 | | | 13,905,568 |
Wells Fargo & Co. | | | 176,549 | | | 9,498,336 |
| | | | | | | 76,994,602 |
| | |
Electric Utilities–1.36% | | | | | | |
Duke Energy Corp. | | | 59,193 | | | 5,398,993 |
Exelon Corp. | | | 138,152 | | | 6,298,350 |
FirstEnergy Corp. | | | 120,637 | | | 5,862,958 |
| | | | | | | 17,560,301 |
| |
Fertilizers & Agricultural Chemicals–1.46% | | | |
Corteva, Inc. | | | 454,148 | | | 13,424,615 |
Nutrien Ltd. (Canada) | | | 113,016 | | | 5,414,596 |
| | | | | | | 18,839,211 |
| | |
Food Distributors–1.07% | | | | | | |
US Foods Holding Corp.(b) | | | 328,650 | | | 13,767,149 |
| | |
Health Care Distributors–0.82% | | | | | | |
McKesson Corp. | | | 76,685 | | | 10,607,069 |
| | |
Health Care Equipment–1.62% | | | | | | |
Medtronic PLC | | | 87,154 | | | 9,887,621 |
Zimmer Biomet Holdings, Inc. | | | 73,498 | | | 11,001,181 |
| | | | | | | 20,888,802 |
| | | | | | |
| | |
| | | | | | |
| | | Shares | | | Value |
| |
Health Care Services–1.01% | | | |
CVS Health Corp. | | | 174,059 | | | $ 12,930,843 |
| |
Health Care Supplies–0.38% | | | |
Alcon, Inc. (Switzerland)(b) | | | 87,053 | | | 4,931,527 |
| | |
Home Improvement Retail–0.52% | | | | | | |
Kingfisher PLC (United Kingdom) | | | 2,323,863 | | | 6,739,349 |
|
Hotels, Resorts & Cruise Lines–1.34% |
Carnival Corp. | | | 339,203 | | | 17,241,689 |
| | |
Industrial Machinery–0.98% | | | | | | |
Ingersoll-Rand PLC | | | 94,450 | | | 12,554,294 |
| | |
Insurance Brokers–0.95% | | | | | | |
Willis Towers Watson PLC | | | 60,277 | | | 12,172,337 |
| | |
Integrated Oil & Gas–3.10% | | | | | | |
BP PLC (United Kingdom) | | | 2,011,410 | | | 12,626,317 |
Chevron Corp. | | | 103,448 | | | 12,466,518 |
Royal Dutch Shell PLC, Class A (United Kingdom) | | | 495,149 | | | 14,718,055 |
| | | | | | | 39,810,890 |
|
Internet & Direct Marketing Retail–0.80% |
eBay, Inc. | | | 283,600 | | | 10,240,796 |
| |
Investment Banking & Brokerage–2.96% | | | |
Goldman Sachs Group, Inc. (The) | | | 73,311 | | | 16,856,398 |
Morgan Stanley | | | 414,457 | | | 21,187,042 |
| | | | | | | 38,043,440 |
|
IT Consulting & Other Services–0.98% |
Cognizant Technology Solutions Corp., Class A | | | 202,482 | | | 12,557,934 |
| | |
Managed Health Care–0.77% | | | | | | |
Anthem, Inc. | | | 32,607 | | | 9,848,292 |
| | |
Multi-line Insurance–1.83% | | | | | | |
American International Group, Inc. | | | 458,002 | | | 23,509,243 |
| |
Oil & Gas Equipment & Services–0.75% | | | |
TechnipFMC PLC (United Kingdom) | | | 453,157 | | | 9,715,686 |
| |
Oil & Gas Exploration & Production–2.41% | | | |
Canadian Natural Resources Ltd. (Canada) | | | 274,064 | | | 8,864,262 |
Devon Energy Corp. | | | 420,393 | | | 10,917,606 |
Marathon Oil Corp. | | | 826,837 | | | 11,228,447 |
| | | | | | | 31,010,315 |
| |
Other Diversified Financial Services–1.31% | | | |
AXA Equitable Holdings, Inc. | | | 277,318 | | | 6,871,940 |
See accompanying Notes to Financial Statements which are an integral part of the financial statements.
Invesco V.I. Equity and Income Fund
| | | | | | |
| | | Shares | | | Value |
Other Diversified Financial Services–(continued) |
Voya Financial, Inc. | | | 163,014 | | | $9,940,594 |
| | | | | | | 16,812,534 |
|
Packaged Foods & Meats–1.89% |
Kellogg Co. | | | 124,701 | | | 8,624,321 |
Mondelez International, Inc., Class A | | | 284,544 | | | 15,672,684 |
| | | | | | | 24,297,005 |
| | |
Pharmaceuticals–5.35% | | | | | | |
Bristol-Myers Squibb Co. | | | 238,800 | | | 15,328,572 |
GlaxoSmithKline PLC (United Kingdom) | | | 260,427 | | | 6,126,752 |
Johnson & Johnson | | | 198,749 | | | 28,991,517 |
Pfizer, Inc. | | | 190,416 | | | 7,460,499 |
Sanofi (France) | | | 108,274 | | | 10,874,735 |
| | | | | | | 68,782,075 |
| | |
Railroads–0.98% | | | | | | |
CSX Corp. | | | 173,611 | | | 12,562,492 |
| | |
Regional Banks–4.03% | | | | | | |
Citizens Financial Group, Inc. | | | 404,234 | | | 16,415,943 |
PNC Financial Services Group, Inc. (The) | | | 129,538 | | | 20,678,151 |
Truist Financial Corp. | | | 262,174 | | | 14,765,639 |
| | | | | | | 51,859,733 |
| | |
Semiconductors–2.82% | | | | | | |
Intel Corp. | | | 255,953 | | | 15,318,787 |
NXP Semiconductors N.V. (Netherlands) | | | 68,753 | | | 8,749,507 |
QUALCOMM, Inc. | | | 137,761 | | | 12,154,653 |
| | | | | | | 36,222,947 |
| | |
Specialty Chemicals–0.52% | | | | | | |
DuPont de Nemours, Inc. | | | 104,467 | | | 6,706,781 |
| | |
Systems Software–1.16% | | | | | | |
Oracle Corp. | | | 281,456 | | | 14,911,539 |
|
Technology Hardware, Storage & Peripherals–1.06% |
Apple, Inc. | | | 46,374 | | | 13,617,725 |
| | |
Tobacco–2.02% | | | | | | |
Philip Morris International, Inc. | | | 305,447 | | | 25,990,485 |
|
Wireless Telecommunication Services–0.80% |
Vodafone Group PLC (United Kingdom) | | | 5,276,147 | | | 10,242,964 |
Total Common Stocks & Other Equity Interests (Cost $601,389,474) | | | 785,956,975 |
| | |
| | | Principal
Amount | | | |
U.S. Dollar Denominated Bonds & Notes–21.99% |
| | |
Aerospace & Defense–0.39% | | | | | | |
BAE Systems Holdings, Inc. (United Kingdom), 2.85%, 12/15/2020(c) | | $ | 262,000 | | | 263,805 |
General Dynamics Corp., 2.88%, 05/11/2020 | | | 397,000 | | | 398,403 |
| | | | | | |
| | | Principal
Amount | | | Value |
Aerospace & Defense–(continued) |
Northrop Grumman Corp., 2.08%, 10/15/2020 | | $ | 1,278,000 | | | $ 1,279,522 |
Precision Castparts Corp., 2.50%, 01/15/2023 | | | 333,000 | | | 339,023 |
Raytheon Co., 3.13%, 10/15/2020 | | | 2,375,000 | | | 2,398,030 |
United Technologies Corp., 4.45%, 11/16/2038 | | | 299,000 | | | 353,791 |
| | | | | | | 5,032,574 |
| |
Agricultural & Farm Machinery–0.09% | | | |
Deere & Co., 2.60%, 06/08/2022 | | | 1,161,000 | | | 1,182,675 |
| | |
Agricultural Products–0.02% | | | | | | |
Ingredion, Inc., 6.63%, 04/15/2037 | | | 232,000 | | | 294,845 |
| | |
Air Freight & Logistics–0.12% | | | | | | |
FedEx Corp., 4.90%, 01/15/2034 | | | 402,000 | | | 458,872 |
5.10%, 01/15/2044 | | | 828,000 | | | 907,735 |
United Parcel Service, Inc., 3.40%, 11/15/2046 | | | 236,000 | | | 235,433 |
| | | | | | | 1,602,040 |
| | |
Airlines–0.13% | | | | | | |
American Airlines Pass Through Trust, Series2014-1, Class A, 3.70%, 04/01/2028 | | | 297,877 | | | 313,919 |
Continental Airlines Pass Through Trust, Series2010-1, Class A, 4.75%, 01/12/2021 | | | 122,032 | | | 124,667 |
| | |
Series2012-1, Class A, 4.15%, 04/11/2024 | | | 316,236 | | | 332,682 |
United Airlines Pass Through Trust, Series2014-2, Class A, 3.75%, 09/03/2026 | | | 384,480 | | | 405,936 |
Series2018-1, Class AA, 3.50%, 03/01/2030 | | | 474,116 | | | 488,916 |
| | | | | | | 1,666,120 |
| | |
Alternative Carriers–0.23% | | | | | | |
GCI Liberty, Inc., Conv., 1.75%, 10/05/2023(c)(d) | | | 2,143,000 | | | 2,960,555 |
| | |
Application Software–0.61% | | | | | | |
Nuance Communications, Inc., Conv.,
1.00%, 12/15/2022(d) | | | 2,458,000 | | | 2,481,041 |
1.25%, 04/01/2025 | | | 1,558,000 | | | 1,738,420 |
RealPage, Inc., Conv., 1.50%, 11/15/2022 | | | 628,000 | | | 876,845 |
Workday, Inc., Conv., 0.25%, 10/01/2022 | | | 2,173,000 | | | 2,786,719 |
| | | | | | | 7,883,025 |
| |
Asset Management & Custody Banks–0.29% | | | |
Apollo Management Holdings L.P.,
4.00%, 05/30/2024(c) | | | 2,715,000 | | | 2,875,367 |
See accompanying Notes to Financial Statements which are an integral part of the financial statements.
Invesco V.I. Equity and Income Fund
| | | | | | |
| | | Principal
Amount | | | Value |
|
Asset Management & Custody Banks–(continued) |
Brookfield Asset Management, Inc. (Canada), 4.00%, 01/15/2025 | | $ | 420,000 | | | $ 451,663 |
Carlyle Holdings Finance LLC, 3.88%, 02/01/2023(c) | | | 98,000 | | | 101,278 |
KKR Group Finance Co. III LLC, 5.13%, 06/01/2044(c) | | | 287,000 | | | 339,491 |
| | | | | | | 3,767,799 |
| |
Automobile Manufacturers–0.28% | | | |
Daimler Finance North America LLC (Germany), 2.25%, 03/02/2020(c) | | | 1,230,000 | | | 1,230,335 |
Ford Motor Credit Co. LLC,
3.10%, 05/04/2023 | | | 267,000 | | | 266,801 |
3.81%, 01/09/2024 | | | 445,000 | | | 451,745 |
4.13%, 08/04/2025 | | | 687,000 | | | 696,515 |
General Motors Co., 6.60%, 04/01/2036 | | | 361,000 | | | 425,900 |
General Motors Financial Co., Inc., 5.25%, 03/01/2026 | | | 459,000 | | | 509,748 |
| | | | | | | 3,581,044 |
| | |
Automotive Retail–0.05% | | | | | | |
Advance Auto Parts, Inc.,
4.50%, 12/01/2023 | | | 602,000 | | | 645,188 |
| | |
Biotechnology–0.71% | | | | | | |
AbbVie, Inc.,
4.50%, 05/14/2035 | | | 656,000 | | | 743,575 |
4.05%, 11/21/2039(c) | | | 1,288,000 | | | 1,365,789 |
BioMarin Pharmaceutical, Inc., Conv., 1.50%, 10/15/2020 | | | 2,172,000 | | | 2,364,888 |
Gilead Sciences, Inc.,
2.55%, 09/01/2020 | | | 1,643,000 | | | 1,650,167 |
4.40%, 12/01/2021 | | | 448,000 | | | 467,474 |
Neurocrine Biosciences, Inc., Conv., 2.25%, 05/15/2024 | | | 1,685,000 | | | 2,588,644 |
| | | | | | | 9,180,537 |
| | |
Brewers–0.28% | | | | | | |
Anheuser-Busch Cos. LLC/Anheuser- Busch InBev Worldwide, Inc. (Belgium),
4.70%, 02/01/2036 | | | 914,000 | | | 1,055,783 |
4.90%, 02/01/2046 | | | 1,021,000 | | | 1,209,342 |
Heineken N.V. (Netherlands), 3.50%, 01/29/2028(c) | | | 910,000 | | | 964,128 |
Molson Coors Beverage Co., 4.20%, 07/15/2046 | | | 361,000 | | | 359,885 |
| | | | | | | 3,589,138 |
| | |
Broadcasting–0.70% | | | | | | |
Liberty Media Corp., Conv.,
2.25%, 10/05/2021(d) | | | 1,399,000 | | | 812,108 |
1.38%, 10/15/2023 | | | 5,513,000 | | | 7,432,075 |
| | | | | | |
| | | Principal
Amount | | | Value |
Broadcasting–(continued) | | | | | | |
Liberty Formula One, Conv., 1.00%, 01/30/2023 | | $ | 520,000 | | | $693,005 |
| | | | | | | 8,937,188 |
| | |
Cable & Satellite–1.31% | | | | | | |
Charter Communications Operating LLC/Charter Communications Operating Capital Corp., 4.46%, 07/23/2022 | | | 969,000 | | | 1,018,417 |
Comcast Corp.,
4.15%, 10/15/2028 | | | 905,000 | | | 1,018,836 |
6.45%, 03/15/2037 | | | 278,000 | | | 393,080 |
3.90%, 03/01/2038 | | | 746,000 | | | 825,826 |
4.60%, 10/15/2038 | | | 364,000 | | | 433,681 |
Discovery Communications LLC, 2.80%, 06/15/2020 | | | 3,195,000 | | | 3,203,503 |
DISH Network Corp., Conv., 3.38%, 08/15/2026 | | | 7,388,000 | | | 7,124,987 |
Liberty Latin America Ltd. (Chile), Conv., 2.00%, 07/15/2024(c) | | | 2,431,000 | | | 2,610,286 |
NBCUniversal Media LLC, 5.95%, 04/01/2041 | | | 197,000 | | | 270,928 |
| | | | | | | 16,899,544 |
| | |
Commodity Chemicals–0.07% | | | | | | |
LYB Finance Co. B.V. (Netherlands),
8.10%, 03/15/2027(c) | | | 678,000 | | | 867,147 |
| |
Communications Equipment–0.39% | | | |
Finisar Corp., Conv., 0.50%, 12/15/2021(d) | | | 1,013,000 | | | 1,011,987 |
Viavi Solutions, Inc., Conv., 1.75%, 06/01/2023 | | | 1,295,000 | | | 1,631,632 |
1.00%, 03/01/2024 | | | 1,806,000 | | | 2,334,243 |
| | | | | | | 4,977,862 |
| | |
Consumer Finance–0.15% | | | | | | |
American Express Co., 3.63%, 12/05/2024 | | | 306,000 | | | 323,432 |
Capital One Financial Corp., 3.20%, 01/30/2023 | | | 943,000 | | | 969,567 |
Synchrony Financial, 3.95%, 12/01/2027 | | | 546,000 | | | 573,702 |
| | | | | | | 1,866,701 |
|
Data Processing & Outsourced Services–0.17% |
Euronet Worldwide, Inc., Conv., 0.75%, 03/15/2025(c)(d) | | | 554,000 | | | 662,188 |
Fiserv, Inc., 3.80%, 10/01/2023 | | | 1,397,000 | | | 1,475,551 |
| | | | | | | 2,137,739 |
| | |
Diversified Banks–2.25% | | | | | | |
ANZ New Zealand (Int’l) Ltd. (New Zealand), 2.88%, 01/25/2022(c) | | | 350,000 | | | 355,715 |
See accompanying Notes to Financial Statements which are an integral part of the financial statements.
Invesco V.I. Equity and Income Fund
| | | | | | |
| | | Principal
Amount | | | Value |
| | |
Diversified Banks–(continued) | | | | | | |
Australia & New Zealand Banking Group Ltd. (Australia),
2.70%, 11/16/2020 | | $ | 2,690,000 | | | $ 2,709,956 |
2.30%, 06/01/2021 | | | 713,000 | | | 716,875 |
Bank of America Corp., 3.25%, 10/21/2027 | | | 515,000 | | | 536,692 |
BBVA Bancomer S.A. (Mexico), 4.38%, 04/10/2024(c) | | | 700,000 | | | 746,672 |
Citigroup, Inc.,
3.67%, (3 mo. USD LIBOR + 1.39%), 07/24/2028(e) | | | 496,000 | | | 528,566 |
6.68%, 09/13/2043 | | | 741,000 | | | 1,084,039 |
5.30%, 05/06/2044 | | | 228,000 | | | 291,019 |
4.75%, 05/18/2046 | | | 341,000 | | | 409,231 |
Commonwealth Bank of Australia (Australia), 2.25%, 03/10/2020(c) | | | 987,000 | | | 987,583 |
Discover Bank, 3.35%, 02/06/2023 | | | 1,500,000 | | | 1,548,257 |
HSBC Holdings PLC (United Kingdom),
2.63% (3 mo. USD LIBOR + 1.14%), 11/07/2025(e) | | | 1,775,000 | | | 1,781,613 |
JPMorgan Chase & Co.,
Series V, 5.23%(f) | | | 582,000 | | | 587,092 |
4.50%, 01/24/2022 | | | 74,000 | | | 77,699 |
3.20%, 06/15/2026 | | | 379,000 | | | 395,892 |
3.51%, (3 mo. USD LIBOR + 0.95%), 01/23/2029(e) | | | 1,043,000 | | | 1,108,061 |
4.26%, (3 mo. USD LIBOR + 1.58%), 02/22/2048(e) | | | 479,000 | | | 567,772 |
3.90%, (3 mo. USD LIBOR + 1.22%), 01/23/2049(e) | | | 1,043,000 | | | 1,171,863 |
Mizuho Financial Group Cayman 3 Ltd. (Japan), 4.60%,
03/27/2024(c) | | | 200,000 | | | 213,688 |
National Australia Bank Ltd. (Australia), 1.88%, 07/12/2021 | | | 945,000 | | | 944,659 |
SMBC Aviation Capital Finance DAC (Ireland), 2.65%, 07/15/2021(c) | | | 315,000 | | | 317,217 |
Societe Generale S.A. (France), 2.63%, 09/16/2020(c) | | | 890,000 | | | 893,933 |
5.00%, 01/17/2024(c) | | | 735,000 | | | 792,598 |
Standard Chartered PLC (United Kingdom), 3.05%, 01/15/2021(c) | | | 680,000 | | | 685,699 |
Sumitomo Mitsui Banking Corp. (Japan), 2.65%, 07/23/2020 | | | 715,000 | | | 717,823 |
Toronto-Dominion Bank (The) (Canada), 2.65%, 06/12/2024 | | | 560,000 | | | 573,521 |
U.S. Bancorp, Series W, 3.10%, 04/27/2026 | | | 2,087,000 | | | 2,172,183 |
Wells Fargo & Co.,
3.55%, 09/29/2025 | | | 596,000 | | | 631,145 |
4.10%, 06/03/2026 | | | 410,000 | | | 442,112 |
4.65%, 11/04/2044 | | | 1,092,000 | | | 1,282,488 |
| | | | | | |
| | | Principal
Amount | | | Value |
| | |
Diversified Banks–(continued) | | | | | | |
Westpac Banking Corp. (Australia), 2.10%, 05/13/2021 | | $ | 3,590,000 | | | $3,600,726 |
| | | | | | | 28,872,389 |
| | |
Diversified Capital Markets–0.65% | | | | | | |
Credit Suisse AG (Switzerland), 6.50%, 08/08/2023(c) | | | 686,000 | | | 766,553 |
Conv., 0.50%, 06/24/2024(c) | | | 7,880,000 | | | 7,556,920 |
| | | | | | | 8,323,473 |
| | |
Diversified Metals & Mining–0.02% | | | | | | |
Rio Tinto Finance USA Ltd. (Australia), 7.13%, 07/15/2028 | | | 182,000 | | | 243,929 |
| | |
Drug Retail–0.13% | | | | | | |
CVS Pass Through Trust, 6.04%, 12/10/2028 | | | 630,303 | | | 703,895 |
Walgreens Boots Alliance, Inc., 3.30%, 11/18/2021 | | | 548,000 | | | 558,395 |
4.50%, 11/18/2034 | | | 404,000 | | | 421,328 |
| | | | | | | 1,683,618 |
| | |
Electric Utilities–0.43% | | | | | | |
Electricite de France S.A. (France), 5.63%(c)(f) | | | 745,000 | | | 790,233 |
4.60%, 01/27/2020(c) | | | 138,000 | | | 138,233 |
4.88%, 01/22/2044(c) | | | 846,000 | | | 970,009 |
Georgia Power Co., 2.00%, 03/30/2020 | | | 1,897,000 | | | 1,896,787 |
NextEra Energy Capital Holdings, Inc., 3.55%, 05/01/2027 | | | 519,000 | | | 551,269 |
Ohio Power Co., Series M, 5.38%, 10/01/2021 | | | 182,000 | | | 192,860 |
PPL Electric Utilities Corp., 6.25%, 05/15/2039 | | | 46,000 | | | 64,353 |
Xcel Energy, Inc., 3.50%, 12/01/2049 | | | 957,000 | | | 974,094 |
| | | | | | | 5,577,838 |
| |
Environmental & Facilities Services–0.04% | | | |
Waste Management, Inc., 3.90%, 03/01/2035 | | | 427,000 | | | 470,450 |
| | |
Food Retail–0.30% | | | | | | |
Kraft Heinz Foods Co., 4.63%, 10/01/2039(c) | | | 525,000 | | | 546,748 |
Nestle Holdings, Inc., 3.10%, 09/24/2021(c) | | | 3,190,000 | | | 3,261,504 |
| | | | | | | 3,808,252 |
| | |
General Merchandise Stores–0.03% | | | | | | |
Dollar General Corp., 3.25%, 04/15/2023 | | | 333,000 | | | 343,943 |
| | |
Health Care Equipment–1.00% | | | | | | |
Becton, Dickinson and Co., 4.88%, 05/15/2044 | | | 342,000 | | | 395,706 |
See accompanying Notes to Financial Statements which are an integral part of the financial statements.
Invesco V.I. Equity and Income Fund
| | | | | | |
| | | Principal
Amount | | | Value |
| |
Health Care Equipment–(continued) | | | |
DexCom, Inc.,
Conv.,
0.75%, 05/15/2022 | | $ | 859,000 | | | $ 1,912,265 |
0.75%, 12/01/2023 | | | 2,639,000 | | | 3,915,477 |
Medtronic, Inc.,
3.15%, 03/15/2022 | | | 385,000 | | | 395,931 |
4.38%, 03/15/2035 | | | 234,000 | | | 277,077 |
NuVasive, Inc., Conv.,
2.25%, 03/15/2021 | | | 1,710,000 | | | 2,282,529 |
Wright Medical Group N.V., Conv.,
2.25%, 11/15/2021 | | | 897,000 | | | 1,302,489 |
Wright Medical Group, Inc., Conv.,
1.63%, 06/15/2023 | | | 2,296,000 | | | 2,430,966 |
| | | | | | | 12,912,440 |
| | |
Health Care REITs–0.09% | | | | | | |
Healthpeak Properties, Inc., 4.20%, 03/01/2024 | | | 438,000 | | | 468,294 |
3.88%, 08/15/2024 | | | 461,000 | | | 490,342 |
Ventas Realty L.P., 5.70%, 09/30/2043 | | | 196,000 | | | 243,679 |
| | | | | | | 1,202,315 |
| | |
Health Care Services–0.22% | | | | | | |
Cigna Corp., 4.80%, 08/15/2038 | | | 298,000 | | | 347,863 |
CVS Health Corp.,
3.38%, 08/12/2024 | | | 341,000 | | | 354,895 |
4.10%, 03/25/2025 | | | 1,237,000 | | | 1,327,679 |
Laboratory Corp. of America Holdings,
3.20%, 02/01/2022 | | | 548,000 | | | 560,462 |
4.70%, 02/01/2045 | | | 241,000 | | | 271,003 |
| | | | | | | 2,861,902 |
|
Home Improvement Retail–0.09% |
Home Depot, Inc. (The), 2.00%, 04/01/2021 | | | 575,000 | | | 576,251 |
Lowe’s Cos., Inc., 4.55%, 04/05/2049 | | | 508,000 | | | 598,834 |
| | | | | | | 1,175,085 |
| | |
Homebuilding–0.08% | | | | | | |
MDC Holdings, Inc., 6.00%, 01/15/2043 | | | 956,000 | | | 995,937 |
| | |
Hotel & Resort REITs–0.02% | | | | | | |
Service Properties Trust, 5.00%, 08/15/2022 | | | 182,000 | | | 191,439 |
|
Housewares & Specialties–0.03% |
Tupperware Brands Corp., 4.75%, 06/01/2021 | | | 433,000 | | | 436,404 |
| | |
Insurance Brokers–0.02% | | | | | | |
Willis North America, Inc., 3.60%, 05/15/2024 | | | 228,000 | | | 238,176 |
| | | | | | |
| | | Principal
Amount | | | Value |
| | |
Integrated Oil & Gas–0.09% | | | | | | |
Husky Energy, Inc. (Canada), 3.95%, 04/15/2022 | | $ | 274,000 | | | $283,408 |
Occidental Petroleum Corp., 3.40%, 04/15/2026 | | | 333,000 | | | 341,860 |
3.20%, 08/15/2026 | | | 225,000 | | | 227,853 |
Suncor Energy, Inc. (Canada), 3.60%, 12/01/2024 | | | 304,000 | | | 322,555 |
| | | | | | | 1,175,676 |
|
Integrated Telecommunication Services–0.46% |
AT&T, Inc.,
3.00%, 06/30/2022 | | | 474,000 | | | 484,446 |
3.40%, 05/15/2025 | | | 263,000 | | | 275,680 |
4.30%, 02/15/2030 | | | 318,000 | | | 353,590 |
4.50%, 05/15/2035 | | | 421,000 | | | 468,883 |
5.35%, 09/01/2040 | | | 92,000 | | | 110,963 |
5.15%, 03/15/2042 | | | 82,000 | | | 95,745 |
4.80%, 06/15/2044 | | | 851,000 | | | 969,775 |
5.15%, 11/15/2046 | | | 128,000 | | | 153,076 |
Telefonica Emisiones S.A. (Spain),
7.05%, 06/20/2036 | | | 328,000 | | | 458,796 |
4.67%, 03/06/2038 | | | 750,000 | | | 832,912 |
5.21%, 03/08/2047 | | | 700,000 | | | 829,758 |
Verizon Communications, Inc., 4.40%, 11/01/2034 | | | 297,000 | | | 344,137 |
4.81%, 03/15/2039 | | | 459,000 | | | 553,665 |
| | | | | | | 5,931,426 |
| |
Interactive Media & Services–0.16% | | | |
JOYY, Inc. (China), Conv., 1.38%, 06/15/2024(c)(d) | | | 2,294,000 | | | 2,075,341 |
| |
Internet & Direct Marketing Retail–0.56% | | | |
IAC Financeco 3, Inc., Conv., 2.00%, 01/15/2030(c) | | | 3,211,000 | | | 3,758,797 |
QVC, Inc., 5.45%, 08/15/2034 | | | 802,000 | | | 769,848 |
Trip.com Group Ltd. (China), Conv.,
1.25%, 09/15/2022 | | | 2,721,000 | | | 2,717,324 |
| | | | | | | 7,245,969 |
| |
Investment Banking & Brokerage–0.60% | | | |
Goldman Sachs Group, Inc. (The),
5.25%, 07/27/2021 | | | 364,000 | | | 382,017 |
4.25%, 10/21/2025 | | | 502,000 | | | 545,093 |
GS Finance Corp., Series 0001, Conv., 0.25%, 07/08/2024 | | | 5,920,000 | | | 6,085,760 |
Morgan Stanley, 4.00%, 07/23/2025 | | | 619,000 | | | 669,809 |
| | | | | | | 7,682,679 |
| |
IT Consulting & Other Services–0.04% | | | |
DXC Technology Co., 4.45%, 09/18/2022 | | | 446,000 | | | 468,282 |
See accompanying Notes to Financial Statements which are an integral part of the financial statements.
Invesco V.I. Equity and Income Fund
| | | | | | |
| | | Principal
Amount | | | Value |
| | |
Life & Health Insurance–0.36% | | | | | | |
Athene Global Funding,
4.00%, 01/25/2022(c) | | $ | 1,110,000 | | | $1,146,580 |
2.75%, 06/25/2024(c) | | | 260,000 | | | 262,582 |
Guardian Life Global Funding, 2.90%, 05/06/2024(c) | | | 669,000 | | | 687,523 |
Jackson National Life Global Funding,
2.10%, 10/25/2021(c) | | | 479,000 | | | 480,176 |
3.25%, 01/30/2024(c) | | | 438,000 | | | 454,386 |
Nationwide Financial Services, Inc.,
5.30%, 11/18/2044(c) | | | 405,000 | | | 461,543 |
Prudential Financial, Inc.,
3.91%, 12/07/2047 | | | 141,000 | | | 151,580 |
3.94%, 12/07/2049 | | | 451,000 | | | 491,532 |
Reliance Standard Life Global Funding II, 3.05%, 01/20/2021(c) | | | 423,000 | | | 427,571 |
| | | | | | | 4,563,473 |
| | |
Managed Health Care–0.04% | | | | | | |
UnitedHealth Group, Inc., 3.50%, 08/15/2039 | | | 543,000 | | | 569,948 |
| | |
Movies & Entertainment–0.19% | | | | | | |
Live Nation Entertainment, Inc., Conv., 2.50%, 03/15/2023 | | | 1,953,000 | | | 2,386,371 |
| | |
Multi-line Insurance–0.14% | | | | | | |
American Financial Group, Inc., 4.50%, 06/15/2047 | | | 474,000 | | | 512,276 |
American International Group, Inc.,
4.38%, 01/15/2055 | | | 656,000 | | | 719,088 |
Metropolitan Life Global Funding I, 2.05%, 06/12/2020(c) | | | 590,000 | | | 590,393 |
| | | | | | | 1,821,757 |
| | |
Multi-Utilities–0.09% | | | | | | |
NiSource, Inc., 4.38%, 05/15/2047 | | | 562,000 | | | 622,527 |
Sempra Energy, 3.80%, 02/01/2038 | | | 551,000 | | | 575,177 |
| | | | | | | 1,197,704 |
| | |
Office REITs–0.05% | | | | | | |
Office Properties Income Trust, 4.00%, 07/15/2022 | | | 664,000 | | | 679,617 |
| |
Oil & Gas Equipment & Services–0.19% | | | |
Helix Energy Solutions Group, Inc., Conv., 4.25%, 05/01/2022 | | | 1,105,000 | | | 1,183,786 |
Oil States International, Inc., Conv.,
1.50%, 02/15/2023 | | | 1,451,000 | | | 1,309,673 |
| | | | | | | 2,493,459 |
| |
Oil & Gas Exploration & Production–0.13% | | | |
Cameron LNG LLC, 3.70%, 01/15/2039(c) | | | 606,000 | | | 618,920 |
ConocoPhillips Co., 4.15%, 11/15/2034 | | | 217,000 | | | 243,607 |
| | | | | | |
| | | Principal
Amount | | | Value |
|
Oil & Gas Exploration & Production–(continued) |
Noble Energy, Inc., 5.25%, 11/15/2043 | | $ | 756,000 | | | $850,850 |
| | | | | | | 1,713,377 |
| |
Oil & Gas Storage & Transportation–0.84% | | | |
Energy Transfer Operating L.P.,
7.50%, 10/15/2020 | | | 2,392,000 | | | 2,486,197 |
4.20%, 09/15/2023 | | | 1,722,000 | | | 1,808,074 |
4.90%, 03/15/2035 | | | 325,000 | | | 341,291 |
Enterprise Products Operating LLC,
5.25%, 01/31/2020 | | | 141,000 | | | 141,322 |
6.45%, 09/01/2040 | | | 23,000 | | | 31,241 |
4.25%, 02/15/2048 | | | 686,000 | | | 735,987 |
Kinder Morgan, Inc., 5.30%, 12/01/2034 | | | 384,000 | | | 452,195 |
MPLX L.P.,
4.50%, 07/15/2023 | | | 1,656,000 | | | 1,759,781 |
4.50%, 04/15/2038 | | | 799,000 | | | 812,514 |
Plains All American Pipeline L.P./PAA Finance Corp., 3.65%, 06/01/2022 | | | 323,000 | | | 331,418 |
Spectra Energy Partners L.P., 4.50%, 03/15/2045 | | | 488,000 | | | 537,737 |
Sunoco Logistics Partners Operations L.P., 5.50%, 02/15/2020 | | | 487,000 | | | 488,606 |
5.30%, 04/01/2044 | | | 587,000 | | | 624,171 |
Texas Eastern Transmission L.P., 7.00%, 07/15/2032 | | | 169,000 | | | 226,628 |
| | | | | | | 10,777,162 |
| |
Other Diversified Financial Services–1.98% | | | |
Convertible Trust - Consumer, Series2018-1, 0.25%, 01/17/2024 | | | 5,674,000 | | | 5,847,624 |
Convertible Trust - Energy, Series2019-1, 0.33%, 09/19/2024 | | | 5,688,000 | | | 5,891,062 |
Convertible Trust - Healthcare, Series2018-1, 0.25%, 02/05/2024 | | | 5,897,000 | | | 6,421,833 |
Convertible Trust - Media, Series 2019, Class 1, 0.25%, 12/04/2024 | | | 5,704,000 | | | 6,326,306 |
MassMutual Global Funding II, 2.00%, 04/15/2021(c) | | | 945,000 | | | 946,549 |
| | | | | | | 25,433,374 |
| |
Packaged Foods & Meats–0.24% | | | |
J. M. Smucker Co. (The), 2.50%, 03/15/2020 | | | 3,038,000 | | | 3,040,622 |
Mead Johnson Nutrition Co. (United Kingdom), 4.13%, 11/15/2025 | | | 60,000 | | | 65,565 |
| | | | | | | 3,106,187 |
| | |
Paper Packaging–0.11% | | | | | | |
International Paper Co., 6.00%, 11/15/2041 | | | 223,000 | | | 278,127 |
See accompanying Notes to Financial Statements which are an integral part of the financial statements.
Invesco V.I. Equity and Income Fund
| | | | | | |
| | | Principal
Amount | | | Value |
| | |
Paper Packaging–(continued) | | | | | | |
Packaging Corp. of America, 4.50%, 11/01/2023 | | $ | 1,037,000 | | | $1,114,106 |
| | | | | | | 1,392,233 |
| | |
Pharmaceuticals–0.78% | | | | | | |
Allergan Funding S.C.S., 4.85%, 06/15/2044 | | | 864,000 | | | 940,529 |
Bayer US Finance II LLC (Germany), 4.38%,
12/15/2028(c) | | | 985,000 | | | 1,074,719 |
Bayer US Finance LLC (Germany),
3.00%, 10/08/2021(c) | | | 590,000 | | | 597,570 |
Bristol-Myers Squibb Co.,
4.00%, 08/15/2023(c) | | | 485,000 | | | 516,714 |
4.13%, 06/15/2039(c) | | | 603,000 | | | 695,509 |
4.63%, 05/15/2044(c) | | | 1,390,000 | | | 1,684,245 |
GlaxoSmithKline Capital, Inc. (United Kingdom),
6.38%, 05/15/2038 | | | 64,000 | | | 91,803 |
Jazz Investments I Ltd., Conv., 1.88%, 08/15/2021 | | | 1,455,000 | | | 1,501,741 |
Mylan N.V., 3.15%, 06/15/2021 | | | 393,000 | | | 398,174 |
Pacira BioSciences, Inc., Conv., 2.38%, 04/01/2022 | | | 1,080,000 | | | 1,125,374 |
Supernus Pharmaceuticals, Inc., Conv., 0.63%, 04/01/2023 | | | 1,057,000 | | | 962,050 |
Zoetis, Inc., 4.70%, 02/01/2043 | | | 333,000 | | | 396,379 |
| | | | | | | 9,984,807 |
| |
Property & Casualty Insurance–0.27% | | | |
Allstate Corp. (The), 3.28%, 12/15/2026 | | | 292,000 | | | 308,420 |
Liberty Mutual Group, Inc., 4.85%, 08/01/2044(c) | | | 887,000 | | | 1,017,163 |
Markel Corp.,
5.00%, 03/30/2043 | | | 351,000 | | | 380,937 |
5.00%, 05/20/2049 | | | 482,000 | | | 567,149 |
Travelers Cos., Inc. (The), 4.60%, 08/01/2043 | | | 605,000 | | | 732,559 |
WR Berkley Corp., 4.63%, 03/15/2022 | | | 382,000 | | | 402,827 |
| | | | | | | 3,409,055 |
| | |
Railroads–0.24% | | | | | | |
Burlington Northern Santa Fe LLC, 5.15%, 09/01/2043 | | | 901,000 | | | 1,148,357 |
CSX Corp., 5.50%, 04/15/2041 | | | 346,000 | | | 438,404 |
Norfolk Southern Corp., 3.40%, 11/01/2049 | | | 456,000 | | | 453,563 |
Union Pacific Corp.,
3.65%, 02/15/2024 | | | 92,000 | | | 97,275 |
4.15%, 01/15/2045 | | | 401,000 | | | 439,460 |
3.84%, 03/20/2060(c) | | | 519,000 | | | 527,261 |
| | | | | | | 3,104,320 |
| | |
Regional Banks–0.09% | | | | | | |
Citizens Financial Group, Inc., 2.38%, 07/28/2021 | | | 415,000 | | | 417,039 |
| | | | | | |
| | | Principal
Amount | | | Value |
| | |
Regional Banks–(continued) | | | | | | |
PNC Financial Services Group, Inc. (The), 3.45%, 04/23/2029 | | $ | 669,000 | | | $713,676 |
| | | | | | | 1,130,715 |
| | |
Reinsurance–0.11% | | | | | | |
PartnerRe Finance B LLC, 3.70%, 07/02/2029 | | | 1,015,000 | | | 1,055,721 |
Reinsurance Group of America, Inc.,
4.70%, 09/15/2023 | | | 352,000 | | | 381,825 |
| | | | | | | 1,437,546 |
| | |
Renewable Electricity–0.04% | | | | | | |
Oglethorpe Power Corp., 4.55%, 06/01/2044 | | | 529,000 | | | 554,897 |
| | |
Restaurants–0.06% | | | | | | |
Starbucks Corp., 3.55%, 08/15/2029 | | | 685,000 | | | 742,679 |
| | |
Retail REITs–0.08% | | | | | | |
Regency Centers L.P.,
2.95%, 09/15/2029 | | | 745,000 | | | 744,401 |
4.65%, 03/15/2049 | | | 256,000 | | | 300,848 |
| | | | | | | 1,045,249 |
|
Semiconductor Equipment–0.15% |
Applied Materials, Inc., 2.63%, 10/01/2020 | | | 1,979,000 | | | 1,989,974 |
| | |
Semiconductors–0.87% | | | | | | |
Broadcom Corp./Broadcom Cayman Finance Ltd., 3.63%, 01/15/2024 610,000 | | | 632,133 |
Cree, Inc., Conv., 0.88%, 09/01/2023 | | | 3,209,000 | | | 3,409,955 |
Microchip Technology, Inc., Conv., 1.63%, 02/15/2027 | | | 1,983,000 | | | 2,830,732 |
Micron Technology, Inc., 4.19%, 02/15/2027 | | | 410,000 | | | 438,930 |
NXP B.V./NXP Funding LLC (Netherlands), 5.35%, 03/01/2026(c) | | | 656,000 | | | 739,729 |
ON Semiconductor Corp., Conv., 1.00%, 12/01/2020 | | | 1,548,000 | | | 2,107,591 |
Silicon Laboratories, Inc., Conv., 1.38%, 03/01/2022 | | | 563,000 | | | 749,674 |
Texas Instruments, Inc., 2.63%, 05/15/2024 | | | 210,000 | | | 215,563 |
| | | | | | | 11,124,307 |
| | |
Specialized REITs–0.17% | | | | | | |
Crown Castle International Corp., 4.75%, 05/15/2047 | | | 46,000 | | | 52,758 |
EPR Properties, 4.75%, 12/15/2026 | | | 1,556,000 | | | 1,700,393 |
LifeStorage L.P., 3.50%, 07/01/2026 | | | 404,000 | | | 415,125 |
| | | | | | | 2,168,276 |
See accompanying Notes to Financial Statements which are an integral part of the financial statements.
Invesco V.I. Equity and Income Fund
| | | | | | |
| | | Principal
Amount | | | Value |
| | |
Specialty Chemicals–0.01% | | | | | | |
Sherwin-Williams Co. (The), 4.50%, 06/01/2047 | | $ | 156,000 | | | $ 176,999 |
| | |
Systems Software–0.27% | | | | | | |
FireEye, Inc., | | | | | | |
Series A, Conv., 1.00%, 06/01/2020(d) | | | 1,566,000 | | | 1,561,316 |
Series B, Conv., 1.63%, 06/01/2022(d) | | | 1,587,000 | | | 1,539,735 |
Microsoft Corp., 3.50%, 02/12/2035 | | | 367,000 | | | 404,069 |
| | | | | | | 3,505,120 |
|
Technology Distributors–0.05% |
Avnet, Inc., 4.63%, 04/15/2026 | | | 641,000 | | | 678,214 |
|
Technology Hardware, Storage & Peripherals–0.45% |
Apple, Inc.,
2.15%, 02/09/2022 | | | 652,000 | | | 657,471 |
3.35%, 02/09/2027 | | | 305,000 | | | 324,786 |
Dell International LLC/EMC Corp.,
5.45%, 06/15/2023(c) | | | 587,000 | | | 636,698 |
8.35%, 07/15/2046(c) | | | 14,000 | | | 19,271 |
SanDisk LLC, Conv., 0.50%, 10/15/2020 | | | 2,520,000 | | | 2,295,544 |
Western Digital Corp., Conv., 1.50%, 02/01/2024 | | | 1,916,000 | | | 1,886,062 |
| | | | | | | 5,819,832 |
| | |
Tobacco–0.23% | | | | | | |
Altria Group, Inc., 5.80%, 02/14/2039 | | | 1,088,000 | | | 1,279,544 |
Philip Morris International, Inc., 3.60%, 11/15/2023 | | | 369,000 | | | 389,236 |
4.88%, 11/15/2043 | | | 1,102,000 | | | 1,316,319 |
| | | | | | | 2,985,099 |
| |
Trading Companies & Distributors–0.10% | | | |
Air Lease Corp.,
3.00%, 09/15/2023 | | | 63,000 | | | 64,524 |
4.25%, 09/15/2024 | | | 392,000 | | | 419,844 |
Aircastle Ltd., 4.40%, 09/25/2023 | | | 761,000 | | | 804,570 |
| | | | | | | 1,288,938 |
| | |
Trucking–0.14% | | | | | | |
Aviation Capital Group LLC, 2.88%, 01/20/2022(c) | | | 1,015,000 | | | 1,022,221 |
4.88%, 10/01/2025(c) | | | 669,000 | | | 720,617 |
| | | | | | | 1,742,838 |
|
Wireless Telecommunication Services–0.22% |
America Movil S.A.B. de C.V. (Mexico), 4.38%, 07/16/2042 | | | 600,000 | | | 676,947 |
| | | | | | |
| | | Principal
Amount | | | Value |
|
Wireless Telecommunication Services–(continued) |
Rogers Communications, Inc. (Canada), 4.50%, 03/15/2043 | | $ | 533,000 | | | $ 594,746 |
4.30%, 02/15/2048 | | | 1,379,000 | | | 1,533,942 |
| | | | | | | 2,805,635 |
Total U.S. Dollar Denominated Bonds & Notes
(Cost $260,628,503) | | | 282,817,846 |
| |
U.S. Treasury Securities–11.93% | | | |
| | |
U.S. Treasury Bills–0.00% | | | | | | |
1.54%, 04/09/2020(g)(h) | | | 15,000 | | | 14,938 |
| | |
U.S. Treasury Bonds–1.44% | | | | | | |
4.50%, 02/15/2036 | | | 3,636,800 | | | 4,818,928 |
4.50%, 08/15/2039 | | | 36,400 | | | 49,365 |
4.38%, 05/15/2040 | | | 72,800 | | | 97,677 |
2.25%, 08/15/2049 | | | 13,999,600 | | | 13,568,924 |
| | | | | | | 18,534,894 |
| |
U.S. Treasury Floating Rate Notes–1.83% | | | |
1.75%, 12/31/2024 | | | 21,110,100 | | | 21,157,989 |
1.75%, 12/31/2026 | | | 2,304,800 | | | 2,291,472 |
| | | | | | | 23,449,461 |
| | |
U.S. Treasury Notes–8.66% | | | | | | |
3.63%, 02/15/2020 | | | 41,900 | | | 41,998 |
2.63%, 11/15/2020 | | | 545,600 | | | 550,197 |
1.63%, 12/31/2021 | | | 77,689,300 | | | 77,767,691 |
1.63%, 12/15/2022 | | | 15,880,500 | | | 15,888,041 |
1.75%, 11/15/2029 | | | 17,408,100 | | | 17,134,055 |
| | | | | | | 111,381,982 |
Total U.S. Treasury Securities
(Cost $152,978,184) | | | | | | 153,381,275 |
| | |
| | | Shares | | | |
Preferred Stocks–0.57% | | | | | | |
Asset Management & Custody Banks–0.16% | | | |
AMG Capital Trust II, 5.15%, Conv. Pfd. | | | 42,732 | | | 2,072,502 |
| | |
Diversified Banks–0.03% | | | | | | |
Wells Fargo & Co., 5.85%, Series Q, Pfd.(f) | | | 10,911 | | | 298,852 |
| |
Oil & Gas Storage & Transportation–0.38% | | | |
El Paso Energy Capital Trust I, 4.75%, Conv. Pfd. | | | 95,499 | | | 4,914,379 |
Total Preferred Stocks
(Cost $5,854,432) | | | 7,285,733 |
| | |
| | | Principal
Amount | | | |
U.S. Government Sponsored Agency Mortgage-Backed Securities–0.08% |
Federal Home Loan Mortgage Corp. (FHLMC)–0.08% |
6.75%, 03/15/2031 | | $ | 682,000 | | | 987,632 |
5.50%, 02/01/2037 | | | 14 | | | 16 |
| | | | | | | 987,648 |
See accompanying Notes to Financial Statements which are an integral part of the financial statements.
Invesco V.I. Equity and Income Fund
| | | | | | |
| | | Principal
Amount | | | Value |
|
Federal National Mortgage Association (FNMA)–0.00% |
5.50%, 03/01/2021 | | $ | 15 | | | $ 15 |
9.50%, 04/01/2030 | | | 952 | | | 1,064 |
| | | | | | | 1,079 |
Total U.S. Government Sponsored Agency Mortgage-Backed Securities (Cost $843,407) | | | 988,727 |
| | |
| | | Shares | | | |
|
Money Market Funds–4.22% |
Invesco Government & Agency Portfolio, Institutional Class,
1.50%(i) | | | 19,017,510 | | | 19,017,510 |
| | | | | | |
| | | Shares | | | Value |
Invesco Liquid Assets Portfolio, Institutional Class, 1.71%(i) | | | 13,559,883 | | | $ 13,563,951 |
Invesco Treasury Portfolio, Institutional Class, 1.49%(i) | | | 21,734,298 | | | 21,734,298 |
Total Money Market Funds (Cost $54,313,451) | | | 54,315,759 |
TOTAL INVESTMENTS IN SECURITIES–99.90%
(Cost $1,076,007,451) | | | 1,284,746,315 |
OTHER ASSETS LESS LIABILITIES–0.10% | | | | | | 1,253,753 |
NET ASSETS–100.00% | | | | | | $1,286,000,068 |
Investment Abbreviations:
| | |
| Conv. | | - Convertible |
| DAC | | - Designated Activity Co. |
| LIBOR | | - London Interbank Offered Rate |
| Pfd. | | - Preferred |
| REIT | | - Real Estate Investment Trust |
| USD | | - U.S. Dollar |
Notes to Schedule of Investments:
| (a) | Industry and/or sector classifications used in this report are generally according to the Global Industry Classification Standard, which was developed by and is the exclusive property and a service mark of MSCI Inc. and Standard & Poor’s. |
| (b) | Non-income producing security. |
| (c) | Security purchased or received in a transaction exempt from registration under the Securities Act of 1933, as amended (the “1933 Act”). The security may be resold pursuant to an exemption from registration under the 1933 Act, typically to qualified institutional buyers. The aggregate value of these securities at December 31, 2019 was $54,425,752, which represented 4.23% of the Fund’s Net Assets. |
| (d) | Security has an irrevocable call by the issuer or mandatory put by the holder. Maturity date reflects such call or put. |
| (e) | Interest or dividend rate is redetermined periodically. Rate shown is the rate in effect on December 31, 2019. |
| (f) | Perpetual bond with no specified maturity date. |
| (g) | All or a portion of the value was pledged as collateral to cover margin requirements for open futures contracts. See Note 1K. |
| (h) | Security traded on a discount basis. The interest rate shown represents the discount rate at the time of purchase by the Fund. |
| (i) | The money market fund and the Fund are affiliated by having the same investment adviser. The rate shown is the7-day SEC standardized yield as of December 31, 2019. |
| | | | | | | | | | | | | | | | | | | | |
| Open Futures Contracts | |
| Short Futures Contracts | | Number of
Contracts | | | Expiration
Month | | | Notional
Value | | | Value | | | Unrealized
Appreciation | |
Interest Rate Risk | | | | | | | | | | | | | | | | | | | | |
U.S. Treasury 5 Year Notes | | | 14 | | | | March-2020 | | | | $(1,660,531) | | | | $5,107 | | | | $5,107 | |
| | | | | | | | | | | | | | | | | | | | | | |
| Open Forward Foreign Currency Contracts | |
| |
Settlement Date | | | | Contract to | | | Unrealized
Appreciation (Depreciation) | |
| | Counterparty | | Deliver | | | Receive | |
| |
Currency Risk | | | | | | | | | | | | | | | | | | | | | | |
| |
01/17/2020 | | State Street Bank & Trust Co. | | | USD | | | | 140,199 | | | | CAD | | | | 184,993 | | | $ | 2,274 | |
| |
01/17/2020 | | State Street Bank & Trust Co. | | | USD | | | | 65,334 | | | | CHF | | | | 63,984 | | | | 831 | |
| |
01/17/2020 | | State Street Bank & Trust Co. | | | USD | | | | 363,093 | | | | EUR | | | | 326,447 | | | | 3,402 | |
| |
01/17/2020 | | State Street Bank & Trust Co. | | | USD | | | | 1,218,556 | | | | GBP | | | | 925,306 | | | | 7,599 | |
| |
Subtotal–Appreciation | | | | | | | | | | | | | | | | | | | 14,106 | |
| |
| | | | | | |
Currency Risk | | | | | | | | | | | | | | | | | | | | | | |
| |
01/17/2020 | | Bank of New York Mellon (The) | | | GBP | | | | 13,721,816 | | | | USD | | | | 17,766,870 | | | | (416,390 | ) |
| |
01/17/2020 | | State Street Bank & Trust Co. | | | CAD | | | | 8,727,568 | | | | USD | | | | 6,573,076 | | | | (148,528 | ) |
| |
01/17/2020 | | State Street Bank & Trust Co. | | | CHF | | | | 3,727,392 | | | | USD | | | | 3,766,455 | | | | (87,985 | ) |
| |
01/17/2020 | | State Street Bank & Trust Co. | | | EUR | | | | 7,683,665 | | | | USD | | | | 8,536,776 | | | | (89,495 | ) |
| |
01/17/2020 | | State Street Bank & Trust Co. | | | GBP | | | | 15,970,612 | | | | USD | | | | 20,724,772 | | | | (438,446 | ) |
| |
See accompanying Notes to Financial Statements which are an integral part of the financial statements.
Invesco V.I. Equity and Income Fund
| | | | | | | | | | | | | | | | | | | | | | |
| Open Forward Foreign Currency Contracts–(continued) | |
| |
Settlement Date | | | | Contract to | | | Unrealized
Appreciation (Depreciation) | |
| | Counterparty | | Deliver | | | Receive | |
| |
01/17/2020 | | State Street Bank & Trust Co. | | | USD | | | | 88,462 | | | | CHF | | | | 85,530 | | | $ | (17 | ) |
| |
Subtotal–Depreciation | | | | | | | | | | | | | | | | | | | (1,180,861 | ) |
| |
Total Forward Foreign Currency Contracts | | | | | | | | | | | | | | | | | | $ | (1,166,755 | ) |
| |
Abbreviations:
CAD - Canadian Dollar
CHF - Swiss Franc
EUR - Euro
GBP - British Pound Sterling
USD - U.S. Dollar
See accompanying Notes to Financial Statements which are an integral part of the financial statements.
Invesco V.I. Equity and Income Fund
Statement of Assets and Liabilities
December 31, 2019
| | | | |
Assets: | | | | |
Investments in securities, at value
(Cost $1,021,694,000) | | $ | 1,230,430,556 | |
Investments in affiliated money market funds, at value
(Cost $54,313,451) | | | 54,315,759 | |
Other investments: | | | | |
Variation margin receivable – futures contracts | | | 310 | |
Unrealized appreciation on forward foreign currency contracts outstanding | | | 14,106 | |
Foreign currencies, at value (Cost $404,162) | | | 409,096 | |
Receivable for: | | | | |
Fund shares sold | | | 654,006 | |
Dividends | | | 1,328,234 | |
Interest | | | 2,140,753 | |
Investment for trustee deferred compensation and retirement plans | | | 166,094 | |
Total assets | | | 1,289,458,914 | |
| |
Liabilities: | | | | |
| |
Other investments: | | | | |
Unrealized depreciation on forward foreign currency contracts outstanding | | | 1,180,861 | |
| |
Payable for: | | | | |
Investments purchased | | | 64,081 | |
Fund shares reacquired | | | 480,032 | |
Amount due custodian | | | 297,398 | |
Accrued fees to affiliates | | | 1,194,902 | |
Accrued trustees’ and officers’ fees and benefits | | | 843 | |
Accrued other operating expenses | | | 59,568 | |
Trustee deferred compensation and retirement plans | | | 181,161 | |
Total liabilities | | | 3,458,846 | |
Net assets applicable to shares outstanding | | $ | 1,286,000,068 | |
| |
Net assets consist of: | | | | |
| |
Shares of beneficial interest | | $ | 1,009,126,008 | |
Distributable earnings | | | 276,874,060 | |
| | | $1,286,000,068 | |
| |
Net Assets: | | | | |
| |
Series I | | $ | 50,731,316 | |
Series II | | $ | 1,235,268,752 | |
|
Shares outstanding, no par value, with an unlimited number of shares authorized: | |
| |
Series I | | | 2,896,201 | |
Series II | | | 70,919,360 | |
Series I: | | | | |
Net asset value per share | | $ | 17.52 | |
Series II: | | | | |
Net asset value per share | | $ | 17.42 | |
Statement of Operations
For the year ended December 31, 2019
| | | | |
Investment income: | | | | |
Dividends (net of foreign withholding taxes of $357,009) | | $ | 21,429,499 | |
| |
Interest | | | 10,041,147 | |
| |
Dividends from affiliated money market funds | | | 1,618,997 | |
| |
Total investment income | | | 33,089,643 | |
| |
| |
Expenses: | | | | |
Advisory fees | | | 4,891,556 | |
| |
Administrative services fees | | | 1,966,454 | |
| |
Custodian fees | | | 30,850 | |
| |
Distribution fees - Series II | | | 2,970,641 | |
| |
Transfer agent fees | | | 38,636 | |
| |
Trustees’ and officers’ fees and benefits | | | 36,494 | |
| |
Reports to shareholders | | | 8,490 | |
| |
Professional services fees | | | 73,104 | |
| |
Other | | | 23,423 | |
| |
Total expenses | | | 10,039,648 | |
| |
Less: Fees waived | | | (85,135 | ) |
| |
Net expenses | | | 9,954,513 | |
| |
Net investment income | | | 23,135,130 | |
| |
| |
Realized and unrealized gain (loss) from: | | | | |
Net realized gain (loss) from: | | | | |
Investment securities | | | 83,542,287 | |
| |
Foreign currencies | | | 119,754 | |
| |
Forward foreign currency contracts | | | 513,125 | |
| |
Futures contracts | | | (265,138 | ) |
| |
| | | 83,910,028 | |
| |
Change in net unrealized appreciation (depreciation) of: | | | | |
Investment securities | | | 122,025,135 | |
| |
Foreign currencies | | | 13,913 | |
| |
Forward foreign currency contracts | | | (1,074,785 | ) |
| |
Futures contracts | | | 91,612 | |
| |
| | | 121,055,875 | |
| |
Net realized and unrealized gain | | | 204,965,903 | |
| |
Net increase in net assets resulting from operations | | $ | 228,101,033 | |
| |
See accompanying Notes to Financial Statements which are an integral part of the financial statements.
Invesco V.I. Equity and Income Fund
Statement of Changes in Net Assets
For the years ended December 31, 2019 and 2018
| | | | | | | | |
| | | 2019 | | | 2018 | |
| |
Operations: | | | | | | | | |
Net investment income | | $ | 23,135,130 | | | $ | 24,910,635 | |
| |
Net realized gain | | | 83,910,028 | | | | 92,833,956 | |
| |
Change in net unrealized appreciation (depreciation) | | | 121,055,875 | | | | (251,690,383 | ) |
| |
Net increase (decrease) in net assets resulting from operations | | | 228,101,033 | | | | (133,945,792 | ) |
| |
| | |
Distributions to shareholders from distributable earnings: | | | | | | | | |
Series I | | | (4,953,688 | ) | | | (12,212,096 | ) |
| |
Series II | | | (114,458,310 | ) | | | (83,405,521 | ) |
| |
Total distributions from distributable earnings | | | (119,411,998 | ) | | | (95,617,617 | ) |
| |
| | |
Share transactions–net: | | | | | | | | |
Series I | | | (131,330,818 | ) | | | 10,954,748 | |
| |
Series II | | | 100,806,762 | | | | (143,814,137 | ) |
| |
Net increase (decrease) in net assets resulting from share transactions | | | (30,524,056 | ) | | | (132,859,389 | ) |
| |
Net increase (decrease) in net assets | | | 78,164,979 | | | | (362,422,798 | ) |
| |
| | |
Net assets: | | | | | | | | |
Beginning of year | | | 1,207,835,089 | | | | 1,570,257,887 | |
| |
End of year | | $ | 1,286,000,068 | | | $ | 1,207,835,089 | |
| |
See accompanying Notes to Financial Statements which are an integral part of the financial statements.
Invesco V.I. Equity and Income Fund
Financial Highlights
The following schedule presents financial highlights for a share of the Fund outstanding throughout the periods indicated.
| | | | | | | | | | | | | | | | | | | | | | | | | | | | | | | | | | | | | | | | | | | | | | | | | | | | | | | | | | | | | | | | | | | | | | |
| | | | | | | | | | | | | | | | | | | | | | | Ratio of | | Ratio of | | | | |
| | | | | | | | | | | | | | | | | | | | | | | expenses | | expenses | | | | |
| | | | | | | Net gains | | | | | | | | | | | | | | | | to average | | to average net | | | | |
| | | | | | | (losses) | | | | | | | | | | | | | | | | net assets | | assets without | | Ratio of net | | |
| | | Net asset | | | | on securities | | | | Dividends | | Distributions | | | | | | | | | | with fee waivers | | fee waivers | | investment | | |
| | | value, | | Net | | (both | | Total from | | from net | | from net | | | | Net asset | | | | Net assets, | | and/or | | and/or | | income | | |
| | | beginning | | investment | | realized and | | investment | | investment | | realized | | Total | | value, end | | Total | | end of period | | expenses | | expenses | | to average | | Portfolio |
| | | of period | | income(a) | | unrealized) | | operations | | income | | gains | | distributions | | of period | | return (b) | | (000’s omitted) | | absorbed | | absorbed | | net assets | | turnover (c) |
Series I | | | | | | | | | | | | | | | | | | | | | | | | | | | | | | | | | | | | | | | | | | | | | | | | | | | | | | | | | | | | | | | | | | | | | | |
Year ended 12/31/19 | | | $ | 16.12 | | | | $ | 0.36 | | | | $ | 2.82 | | | | $ | 3.18 | | | | $ | (0.47 | ) | | | $ | (1.31 | ) | | | $ | (1.78 | ) | | | $ | 17.52 | | | | | 20.37 | % | | | $ | 50,731 | | | | | 0.54 | %(d) | | | | 0.55 | %(d) | | | | 2.02 | %(d) | | | | 150 | % |
Year ended 12/31/18 | | | | 19.04 | | | | | 0.35 | | | | | (2.00 | ) | | | | (1.65 | ) | | | | (0.43 | ) | | | | (0.84 | ) | | | | (1.27 | ) | | | | 16.12 | | | | | (9.50 | ) | | | | 165,924 | | | | | 0.54 | | | | | 0.55 | | | | | 1.91 | | | | | 150 | |
Year ended 12/31/17 | | | | 17.76 | | | | | 0.35 | (e) | | | | 1.58 | | | | | 1.93 | | | | | (0.31 | ) | | | | (0.34 | ) | | | | (0.65 | ) | | | | 19.04 | | | | | 11.03 | | | | | 184,768 | | | | | 0.55 | | | | | 0.56 | | | | | 1.93 | (e) | | | | 119 | |
Year ended 12/31/16 | | | | 16.23 | | | | | 0.29 | | | | | 2.10 | | | | | 2.39 | | | | | (0.32 | ) | | | | (0.54 | ) | | | | (0.86 | ) | | | | 17.76 | | | | | 15.12 | | | | | 157,774 | | | | | 0.60 | | | | | 0.61 | | | | | 1.78 | | | | | 101 | |
Year ended 12/31/15 | | | | 18.93 | | | | | 0.28 | | | | | (0.78 | ) | | | | (0.50 | ) | | | | (0.49 | ) | | | | (1.71 | ) | | | | (2.20 | ) | | | | 16.23 | | | | | (2.29 | ) | | | | 96,287 | | | | | 0.64 | | | | | 0.65 | | | | | 1.55 | | | | | 87 | |
Series II | | | | | | | | | | | | | | | | | | | | | | | | | | | | | | | | | | | | | | | | | | | | | | | | | | | | | | | | | | | | | | | | | | | | | | |
Year ended 12/31/19 | | | | 16.04 | | | | | 0.31 | | | | | 2.80 | | | | | 3.11 | | | | | (0.42 | ) | | | | (1.31 | ) | | | | (1.73 | ) | | | | 17.42 | | | | | 20.01 | | | | | 1,235,269 | | | | | 0.79 | (d) | | | | 0.80 | (d) | | | | 1.77 | (d) | | | | 150 | |
Year ended 12/31/18 | | | | 18.95 | | | | | 0.31 | | | | | (2.00 | ) | | | | (1.69 | ) | | | | (0.38 | ) | | | | (0.84 | ) | | | | (1.22 | ) | | | | 16.04 | | | | | (9.73 | ) | | | | 1,041,911 | | | | | 0.79 | | | | | 0.80 | | | | | 1.66 | | | | | 150 | |
Year ended 12/31/17 | | | | 17.68 | | | | | 0.31 | (e) | | | | 1.57 | | | | | 1.88 | | | | | (0.27 | ) | | | | (0.34 | ) | | | | (0.61 | ) | | | | 18.95 | | | | | 10.78 | | | | | 1,385,490 | | | | | 0.80 | | | | | 0.81 | | | | | 1.68 | (e)ı | | | | 119 | |
Year ended 12/31/16 | | | | 16.16 | | | | | 0.25 | | | | | 2.09 | | | | | 2.34 | | | | | (0.28 | ) | | | | (0.54 | ) | | | | (0.82 | ) | | | | 17.68 | | | | | 14.84 | | | | | 1,314,323 | | | | | 0.85 | | | | | 0.86 | | | | | 1.53 | | | | | 101 | |
Year ended 12/31/15 | | | | 18.86 | | | | | 0.23 | | | | | (0.78 | ) | | | | (0.55 | ) | | | | (0.44 | ) | | | | (1.71 | ) | | | | (2.15 | ) | | | | 16.16 | | | | | (2.58 | ) | | | | 1,129,261 | | | | | 0.89 | | | | | 0.90 | | | | | 1.30 | | | | | 87 | |
| (a) | Calculated using average shares outstanding. |
| (b) | Includes adjustments in accordance with accounting principles generally accepted in the United States of America and as such, the net asset value for financial reporting purposes and the returns based upon those net asset values may differ from the net asset value and returns for shareholder transactions. Total returns are not annualized for periods less than one year, if applicable, and do not reflect charges assessed in connection with a variable product, which if included would reduce total returns. |
| (c) | Portfolio turnover is calculated at the fund level and is not annualized for periods less than one year, if applicable. |
| (d) | Ratios are based on average daily net assets (000’s omitted) of $102,553 and $1,187,891 for Series I and Series II shares, respectively. |
| (e) | Net investment income per share and the ratio of net investment income to average net assets includes significant dividends received during the year ended December 31, 2017. Net investment income per share and the ratio of net investment income to average net assets excluding the significant dividends are $0.30 and 1.64% and $0.26 and 1.39% for Series I and Series II shares, respectively. |
See accompanying Notes to Financial Statements which are an integral part of the financial statements.
Invesco V.I. Equity and Income Fund
Notes to Financial Statements
December 31, 2019
NOTE 1–Significant Accounting Policies
Invesco V.I. Equity and Income Fund (the “Fund”) is a series portfolio of AIM Variable Insurance Funds (Invesco Variable Insurance Funds) (the “Trust”). The Trust is a Delaware statutory trust registered under the Investment Company Act of 1940, as amended (the “1940 Act”), as anopen-end series management investment company. Information presented in these financial statements pertains only to the Fund. Matters affecting the Fund or each class will be voted on exclusively by the shareholders of the Fund or each class. Current Securities and Exchange Commission (“SEC”) guidance, however, requires participating insurance companies offering separate accounts to vote shares proportionally in accordance with the instructions of the contract owners whose investments are funded by shares of each Fund or class.
The Fund’s investment objectives are both capital appreciation and current income.
The Fund currently offers two classes of shares, Series I and Series II, both of which are offered to insurance company separate accounts funding variable annuity contracts and variable life insurance policies (“variable products”).
The Fund is an investment company and accordingly follows the investment company accounting and reporting guidance in accordance with Financial Accounting Standards Board Accounting Standards Codification Topic 946, Financial Services – Investment Companies.
The following is a summary of the significant accounting policies followed by the Fund in the preparation of its financial statements.
| A. | Security Valuations– Securities, including restricted securities, are valued according to the following policy. |
A security listed or traded on an exchange (except convertible securities) is valued at its last sales price or official closing price as of the close of the customary trading session on the exchange where the security is principally traded, or lacking any sales or official closing price on a particular day, the security may be valued at the closing bid price on that day. Securities traded in theover-the-counter market are valued based on prices furnished by independent pricing services or market makers. When such securities are valued by an independent pricing service they may be considered fair valued. Futures contracts are valued at the final settlement price set by an exchange on which they are principally traded. Listed options are valued at the mean between the last bid and asked prices from the exchange on which they are principally traded. Options not listed on an exchange are valued by an independent source at the mean between the last bid and asked prices. For purposes of determining net asset value (“NAV”) per share, futures and option contracts generally are valued 15 minutes after the close of the customary trading session of the New York Stock Exchange (“NYSE”).
Investments inopen-end andclosed-end registered investment companies that do not trade on an exchange are valued at theend-of-day net asset value per share. Investments inopen-end andclosed-end registered investment companies that trade on an exchange are valued at the last sales price or official closing price as of the close of the customary trading session on the exchange where the security is principally traded.
Debt obligations (including convertible securities) and unlisted equities are fair valued using an evaluated quote provided by an independent pricing service. Evaluated quotes provided by the pricing service may be determined without exclusive reliance on quoted prices, and may reflect appropriate factors such asinstitution-size trading in similar groups of securities, developments related to specific securities, dividend rate (for unlisted equities), yield (for debt obligations), quality, type of issue, coupon rate (for debt obligations), maturity (for debt obligations), individual trading characteristics and other market data. Pricing services generally value debt obligations assuming orderly transactions of institutional round lot size, but a fund may hold or transact in the same securities in smaller, odd lot sizes. Odd lots often trade at lower prices than institutional round lots. Debt obligations are subject to interest rate and credit risks. In addition, all debt obligations involve some risk of default with respect to interest and/or principal payments.
Foreign securities’ (including foreign exchange contracts) prices are converted into U.S. dollar amounts using the applicable exchange rates as of the close of the NYSE. If market quotations are available and reliable for foreign exchange-traded equity securities, the securities will be valued at the market quotations. Because trading hours for certain foreign securities end before the close of the NYSE, closing market quotations may become unreliable. If between the time trading ends on a particular security and the close of the customary trading session on the NYSE, events occur that the investment adviser determines are significant and make the closing price unreliable, the Fund may fair value the security. If the event is likely to have affected the closing price of the security, the security will be valued at fair value in good faith using procedures approved by the Board of Trustees. Adjustments to closing prices to reflect fair value may also be based on a screening process of an independent pricing service to indicate the degree of certainty, based on historical data, that the closing price in the principal market where a foreign security trades is not the current value as of the close of the NYSE. Foreign securities’ prices meeting the approved degree of certainty that the price is not reflective of current value will be priced at the indication of fair value from the independent pricing service. Multiple factors may be considered by the independent pricing service in determining adjustments to reflect fair value and may include information relating to sector indices, American Depositary Receipts and domestic and foreign index futures. Foreign securities may have additional risks including exchange rate changes, potential for sharply devalued currencies and high inflation, political and economic upheaval, the relative lack of issuer information, relatively low market liquidity and the potential lack of strict financial and accounting controls and standards.
Securities for which market prices are not provided by any of the above methods may be valued based upon quotes furnished by independent sources. The last bid price may be used to value equity securities. The mean between the last bid and asked prices is used to value debt obligations, including corporate loans.
Securities for which market quotations are not readily available or became unreliable are valued at fair value as determined in good faith by or under the supervision of the Trust’s officers following procedures approved by the Board of Trustees. Issuer specific events, market trends, bid/asked quotes of brokers and information providers and other market data may be reviewed in the course of making a good faith determination of a security’s fair value.
The Fund may invest in securities that are subject to interest rate risk, meaning the risk that the prices will generally fall as interest rates rise and, conversely, the prices will generally rise as interest rates fall. Specific securities differ in their sensitivity to changes in interest rates depending on their individual characteristics. Changes in interest rates may result in increased market volatility, which may affect the value and/or liquidity of certain Fund investments.
Invesco V.I. Equity and Income Fund
Valuations change in response to many factors including the historical and prospective earnings of the issuer, the value of the issuer’s assets, general economic conditions, interest rates, investor perceptions and market liquidity. Because of the inherent uncertainties of valuation, the values reflected in the financial statements may materially differ from the value received upon actual sale of those investments.
| B. | Securities Transactions and Investment Income– Securities transactions are accounted for on a trade date basis. Realized gains or losses on sales are computed on the basis of specific identification of the securities sold. Interest income (net of withholding tax, if any) is recorded on the accrual basis from settlement date. Bond premiums and discounts are amortized and/or accreted over the lives of the respective securities.Pay-in-kind interest income andnon-cash dividend income received in the form of securitiesin-lieu of cash are recorded at the fair value of the securities received. Dividend income (net of withholding tax, if any) is recorded on theex-dividend date. |
The Fund may periodically participate in litigation related to Fund investments. As such, the Fund may receive proceeds from litigation settlements. Any proceeds received are included in the Statement of Operations as realized gain (loss) for investments no longer held and as unrealized gain (loss) for investments still held.
Brokerage commissions and mark ups are considered transaction costs and are recorded as an increase to the cost basis of securities purchased and/or a reduction of proceeds on a sale of securities. Such transaction costs are included in the determination of net realized and unrealized gain (loss) from investment securities reported in the Statement of Operations and the Statement of Changes in Net Assets and the net realized and unrealized gains (losses) on securities per share in the Financial Highlights. Transaction costs are included in the calculation of the Fund’s net asset value and, accordingly, they reduce the Fund’s total returns. These transaction costs are not considered operating expenses and are not reflected in net investment income reported in the Statement of Operations and the Statement of Changes in Net Assets, or the net investment income per share and the ratios of expenses and net investment income reported in the Financial Highlights, nor are they limited by any expense limitation arrangements between the Fund and the investment adviser.
The Fund allocates income and realized and unrealized capital gains and losses to a class based on the relative net assets of each class.
| C. | Country Determination – For the purposes of making investment selection decisions and presentation in the Schedule of Investments, the investment adviser may determine the country in which an issuer is located and/or credit risk exposure based on various factors. These factors include the laws of the country under which the issuer is organized, where the issuer maintains a principal office, the country in which the issuer derives 50% or more of its total revenues and the country that has the primary market for the issuer’s securities, as well as other criteria. Among the other criteria that may be evaluated for making this determination are the country in which the issuer maintains 50% or more of its assets, the type of security, financial guarantees and enhancements, the nature of the collateral and the sponsor organization. Country of issuer and/or credit risk exposure has been determined to be the United States of America, unless otherwise noted. |
| D. | Distributions– Distributions from net investment income and net realized capital gain, if any, are generally declared and paid to separate accounts of participating insurance companies annually and recorded on theex-dividend date. |
| E. | Federal Income Taxes –The Fund intends to comply with the requirements of Subchapter M of the Internal Revenue Code of 1986, as amended (the “Internal Revenue Code”), necessary to qualify as a regulated investment company and to distribute substantially all of the Fund’s taxable earnings to shareholders. As such, the Fund will not be subject to federal income taxes on otherwise taxable income (including net realized capital gain) that is distributed to shareholders. Therefore, no provision for federal income taxes is recorded in the financial statements. |
The Fund recognizes the tax benefits of uncertain tax positions only when the position is more likely than not to be sustained. Management has analyzed the Fund’s uncertain tax positions and concluded that no liability for unrecognized tax benefits should be recorded related to uncertain tax positions. Management is not aware of any tax positions for which it is reasonably possible that the total amounts of unrecognized tax benefits will change materially in the next 12 months.
The Fund files tax returns in the U.S. Federal jurisdiction and certain other jurisdictions. Generally, the Fund is subject to examinations by such taxing authorities for up to three years after the filing of the return for the tax period.
| F. | Expenses– Fees provided for under the Rule12b-1 plan of a particular class of the Fund and which are directly attributable to that class are charged to the operations of such class. All other expenses are allocated among the classes based on relative net assets. |
| G. | Accounting Estimates –The preparation of financial statements in conformity with accounting principles generally accepted in the United States of America (“GAAP”) requires management to make estimates and assumptions that affect the reported amounts of assets and liabilities at the date of the financial statements and the reported amounts of revenues and expenses during the reporting period including estimates and assumptions related to taxation. Actual results could differ from those estimates by a significant amount. In addition, the Fund monitors for material events or transactions that may occur or become known after theperiod-end date and before the date the financial statements are released to print. |
| H. | Indemnifications– Under the Trust’s organizational documents, each Trustee, officer, employee or other agent of the Trust is indemnified against certain liabilities that may arise out of the performance of their duties to the Fund. Additionally, in the normal course of business, the Fund enters into contracts, including the Fund’s servicing agreements, that contain a variety of indemnification clauses. The Fund’s maximum exposure under these arrangements is unknown as this would involve future claims that may be made against the Fund that have not yet occurred. The risk of material loss as a result of such indemnification claims is considered remote. |
| I. | Foreign Currency Translations– Foreign currency is valued at the close of the NYSE based on quotations posted by banks and major currency dealers. Portfolio securities and other assets and liabilities denominated in foreign currencies are translated into U.S. dollar amounts at the date of valuation. Purchases and sales of portfolio securities (net of foreign taxes withheld on disposition) and income items denominated in foreign currencies are translated into U.S. dollar amounts on the respective dates of such transactions. The Fund does not separately account for the portion of the results of operations resulting from changes in foreign exchange rates on investments and the fluctuations arising from changes in market prices of securities held. The combined results of changes in foreign exchange rates and the fluctuation of market prices on investments (net of estimated foreign tax withholding) are included with the net realized and unrealized gain or loss from investments in the Statement of Operations. Reported net realized foreign currency gains or losses arise from (1) sales of foreign currencies, (2) currency gains or losses realized between the trade and settlement dates on securities transactions, and (3) the difference between the amounts of dividends, interest, and foreign withholding taxes recorded on the Fund’s books and the U.S. dollar equivalent of the amounts actually received or paid. Net |
Invesco V.I. Equity and Income Fund
| | unrealized foreign currency gains and losses arise from changes in the fair values of assets and liabilities, other than investments in securities at fiscal period end, resulting from changes in exchange rates. |
The Fund may invest in foreign securities, which may be subject to foreign taxes on income, gains on investments or currency repatriation, a portion of which may be recoverable. Foreign taxes, if any, are recorded based on the tax regulations and rates that exist in the foreign markets in which the Fund invests and are shown in the Statement of Operations.
| J. | Forward Foreign Currency Contracts– The Fund may engage in foreign currency transactions either on a spot (i.e. for prompt delivery and settlement) basis, or through forward foreign currency contracts, to manage or minimize currency or exchange rate risk. |
The Fund may also enter into forward foreign currency contracts for the purchase or sale of a security denominated in a foreign currency in order to “lock in” the U.S. dollar price of that security, or the Fund may also enter into forward foreign currency contracts that do not provide for physical settlement of the two currencies, but instead are settled by a single cash payment calculated as the difference between the agreed upon exchange rate and the spot rate at settlement based upon an agreed upon notional amount(non-deliverable forwards). The Fund will set aside liquid assets in an amount equal to the dailymark-to-market obligation for forward foreign currency contracts.
A forward foreign currency contract is an obligation between two parties (“Counterparties”) to purchase or sell a specific currency for an agreed-upon price at a future date. The use of forward foreign currency contracts does not eliminate fluctuations in the price of the underlying securities the Fund owns or intends to acquire but establishes a rate of exchange in advance. Fluctuations in the value of these contracts are measured by the difference in the contract date and reporting date exchange rates and are recorded as unrealized appreciation (depreciation) until the contracts are closed. When the contracts are closed, realized gains (losses) are recorded. Realized and unrealized gains (losses) on the contracts are included in the Statement of Operations. The primary risks associated with forward foreign currency contracts include failure of the Counterparty to meet the terms of the contract and the value of the foreign currency changing unfavorably. These risks may be in excess of the amounts reflected in the Statement of Assets and Liabilities.
| K. | Futures Contracts– The Fund may enter into futures contracts to manage exposure to interest rate, equity and market price movements and/or currency risks. A futures contract is an agreement between Counterparties to purchase or sell a specified underlying security, currency or commodity (or delivery of a cash settlement price, in the case of an index future) for a fixed price at a future date. The Fund currently invests only in exchange-traded futures and they are standardized as to maturity date and underlying financial instrument. Initial margin deposits required upon entering into futures contracts are satisfied by the segregation of specific securities or cash as collateral at the futures commission merchant (broker). During the period the futures contracts are open, changes in the value of the contracts are recognized as unrealized gains or losses by recalculating the value of the contracts on a daily basis. Subsequent or variation margin payments are received or made depending upon whether unrealized gains or losses are incurred. These amounts are reflected as receivables or payables on the Statement of Assets and Liabilities. When the contracts are closed or expire, the Fund recognizes a realized gain or loss equal to the difference between the proceeds from, or cost of, the closing transaction and the Fund’s basis in the contract. The net realized gain (loss) and the change in unrealized gain (loss) on futures contracts held during the period is included on the Statement of Operations. The primary risks associated with futures contracts are market risk and the absence of a liquid secondary market. If the Fund were unable to liquidate a futures contract and/or enter into an offsetting closing transaction, the Fund would continue to be subject to market risk with respect to the value of the contracts and continue to be required to maintain the margin deposits on the futures contracts. Futures contracts have minimal Counterparty risk since the exchange’s clearinghouse, as Counterparty to all exchange-traded futures, guarantees the futures against default. Risks may exceed amounts recognized in the Statement of Assets and Liabilities. |
| L. | Other Risks– Active trading of portfolio securities may result in added expenses, a lower return and increased tax liability. |
| M. | Collateral– To the extent the Fund has designated or segregated a security as collateral and that security is subsequently sold, it is the Fund’s practice to replace such collateral no later than the next business day. |
NOTE 2–Advisory Fees and Other Fees Paid to Affiliates
The Trust has entered into a master investment advisory agreement with Invesco Advisers, Inc. (the “Adviser” or “Invesco”). Under the terms of the investment advisory agreement, the Fund accrues daily and pays monthly an advisory fee to the Adviser based on the annual rate of the Fund’s average daily net assets as follows:
| | | | |
| Average Daily Net Assets | | Rate | |
| |
First $ 150 million | | | 0.500% | |
| |
Next $100 million | | | 0.450% | |
| |
Next $100 million | | | 0.400% | |
| |
Over $350 million | | | 0.350% | |
| |
For the year ended December 31, 2019, the effective advisory fee rate incurred by the Fund was 0.38%.
Under the terms of a mastersub-advisory agreement between the Adviser and each of Invesco Asset Management Deutschland GmbH, Invesco Asset Management Limited, Invesco Asset Management (Japan) Limited, Invesco Hong Kong Limited, Invesco Senior Secured Management, Inc. and Invesco Canada Ltd. and separatesub-advisory agreements with Invesco Capital Management LLC and Invesco Asset Management (India) Private Limited (collectively, the “AffiliatedSub-Advisers”) the Adviser, not the Fund, will pay 40% of the fees paid to the Adviser to any such AffiliatedSub-Adviser(s) that provide(s) discretionary investment management services to the Fund based on the percentage of assets allocated to such AffiliatedSub-Adviser(s).
The Adviser has contractually agreed, through at least June 30, 2020, to waive advisory fees and/or reimburse expenses of all shares to the extent necessary to limit total annual fund operating expenses after fee waiver and/or expense reimbursement (excluding certain items discussed below) of Series I shares to 1.50% and Series II shares to 1.75% of average daily net assets (the “expense limits”). In determining the Adviser’s obligation to waive advisory fees and/or reimburse expenses, the following expenses are not taken into account, and could cause the total annual fund operating expenses after fee waiver and/or expense reimbursement to exceed the numbers reflected above: (1) interest; (2) taxes; (3) dividend expense on short sales; (4) extraordinary ornon-routine items, including litigation expenses; and (5) expenses that the Fund has incurred but did not actually pay because of an expense offset arrangement. Unless Invesco continues the fee waiver agreement, it will terminate on June 30, 2020.
Invesco V.I. Equity and Income Fund
During its term, the fee waiver agreement cannot be terminated or amended to increase the expense limits or reduce the advisory fee waiver without approval of the Board of Trustees. The Adviser did not waive fees and/or reimburse expenses during the period under these expense limits.
Further, the Adviser has contractually agreed, through at least June 30, 2021, to waive the advisory fee payable by the Fund in an amount equal to 100% of the net advisory fees the Adviser receives from the affiliated money market funds on investments by the Fund of uninvested cash in such affiliated money market funds.
For the year ended December 31, 2019, the Adviser waived advisory fees of $85,135.
The Trust has entered into a master administrative services agreement with Invesco pursuant to which the Fund has agreed to pay Invesco a fee for costs incurred in providing accounting services and fund administrative services to the Fund and to reimburse Invesco for fees paid to insurance companies that have agreed to provide certain administrative services to the Fund. These administrative services provided by the insurance companies may include, among other things: maintenance of master accounts with the Fund; tracking, recording and transmitting net purchase and redemption orders for Fund shares; maintaining and preserving records related to the purchase, redemption and other account activity of variable product owners; distributing copies of Fund documents such as prospectuses, proxy materials and periodic reports, to variable product owners, and responding to inquiries from variable product owners about the Fund. Pursuant to such agreement, for the year ended December 31, 2019, Invesco was paid $181,664 for accounting and fund administrative services and was reimbursed $1,784,790 for fees paid to insurance companies. Invesco has entered into asub-administration agreement whereby State Street Bank and Trust Company (“SSB”) serves as fund accountant and provides certain administrative services to the Fund. Pursuant to a custody agreement with the Trust on behalf of the Fund, SSB also serves as the Fund’s custodian.
The Trust has entered into a transfer agency and service agreement with Invesco Investment Services, Inc. (“IIS”) pursuant to which the Fund has agreed to pay IIS a fee for providing transfer agency and shareholder services to the Fund and reimburse IIS for certain expenses incurred by IIS in the course of providing such services. For the year ended December 31, 2019, expenses incurred under the agreement are shown in the Statement of Operations asTransfer agent fees.
The Trust has entered into a master distribution agreement with Invesco Distributors, Inc. (“IDI”) to serve as the distributor for the Fund. The Trust has adopted a plan pursuant to Rule12b-1 under the 1940 Act with respect to the Fund’s Series II shares (the “Plan”). The Fund, pursuant to the Plan, pays IDI compensation at the annual rate of 0.25% of the Fund’s average daily net assets of Series II shares. The fees are accrued daily and paid monthly. Of the Plan payments, up to 0.25% of the average daily net assets of the Series II shares may be paid to insurance companies who furnish continuing personal shareholder services to customers who purchase and own Series II shares of the Fund. For the year ended December 31, 2019, expenses incurred under the Plan are detailed in the Statement of Operations asDistribution fees.
For the year ended December 31, 2019, the Fund incurred $18,848 in brokerage commissions with Invesco Capital Markets, Inc., an affiliate of the Adviser and IDI, for portfolio transactions executed on behalf of the Fund.
Certain officers and trustees of the Trust are officers and directors of the Adviser, IIS and/or IDI.
NOTE 3–Additional Valuation Information
GAAP defines fair value as the price that would be received to sell an asset or paid to transfer a liability in an orderly transaction between market participants at the measurement date, under current market conditions. GAAP establishes a hierarchy that prioritizes the inputs to valuation methods, giving the highest priority to readily available unadjusted quoted prices in an active market for identical assets (Level 1) and the lowest priority to significant unobservable inputs (Level 3), generally when market prices are not readily available or are unreliable. Based on the valuation inputs, the securities or other investments are tiered into one of three levels. Changes in valuation methods may result in transfers in or out of an investment’s assigned level:
| | |
Level 1 - | | Prices are determined using quoted prices in an active market for identical assets. |
Level 2 - | | Prices are determined using other significant observable inputs. Observable inputs are inputs that other market participants may use in pricing a security. These may include quoted prices for similar securities, interest rates, prepayment speeds, credit risk, yield curves, loss severities, default rates, discount rates, volatilities and others. |
Level 3 - | | Prices are determined using significant unobservable inputs. In situations where quoted prices or observable inputs are unavailable (for example, when there is little or no market activity for an investment at the end of the period), unobservable inputs may be used. Unobservable inputs reflect the Fund’s own assumptions about the factors market participants would use in determining fair value of the securities or instruments and would be based on the best available information. |
The following is a summary of the tiered valuation input levels, as of December 31, 2019. The level assigned to the securities valuations may not be an indication of the risk or liquidity associated with investing in those securities. Because of the inherent uncertainties of valuation, the values reflected in the financial statements may materially differ from the value received upon actual sale of those investments.
| | | | | | | | | | | | | | | | |
| | | Level 1 | | | Level 2 | | | Level 3 | | | Total | |
| |
Investments in Securities | | | | | | | | | | | | | | | | |
| |
Common Stocks & Other Equity Interests | | $ | 719,697,276 | | | $ | 66,259,699 | | | | $– | | | $ | 785,956,975 | |
| |
U.S. Dollar Denominated Bonds & Notes | | | – | | | | 282,817,846 | | | | – | | | | 282,817,846 | |
| |
U.S. Treasury Securities | | | – | | | | 153,381,275 | | | | – | | | | 153,381,275 | |
| |
Preferred Stocks | | | 7,285,733 | | | | – | | | | – | | | | 7,285,733 | |
| |
U.S. Government Sponsored Agency Mortgage-Backed Securities | | | – | | | | 988,727 | | | | – | | | | 988,727 | |
| |
Money Market Funds | | | 54,315,759 | | | | – | | | | – | | | | 54,315,759 | |
| |
Total Investments in Securities | | | 781,298,768 | | | | 503,447,547 | | | | – | | | | 1,284,746,315 | |
| |
| | | | |
Other Investments - Assets* | | | | | | | | | | | | | | | | |
| |
Futures Contracts | | | 5,107 | | | | – | | | | – | | | | 5,107 | |
| |
Forward Foreign Currency Contracts | | | – | | | | 14,106 | | | | – | | | | 14,106 | |
| |
| | | 5,107 | | | | 14,106 | | | | – | | | | 19,213 | |
| |
Invesco V.I. Equity and Income Fund
| | | | | | | | | | | | | | | | |
| | | Level 1 | | | Level 2 | | | Level 3 | | | Total | |
| |
Other Investments - Liabilities* | | | | | | | | | | | | | | | | |
| |
Forward Foreign Currency Contracts | | $ | - | | | $ | (1,180,861 | ) | | | $- | | | $ | (1,180,861 | ) |
| |
Total Other Investments | | | 5,107 | | | | (1,166,755 | ) | | | - | | | | (1,161,648 | ) |
| |
Total Investments | | $ | 781,303,875 | | | $ | 502,280,792 | | | | $- | | | $ | 1,283,584,667 | |
| |
| * | Unrealized appreciation (depreciation). |
NOTE 4–Derivative Investments
The Fund may enter into an International Swaps and Derivatives Association Master Agreement (“ISDA Master Agreement”) under which a fund may trade OTC derivatives. An OTC transaction entered into under an ISDA Master Agreement typically involves a collateral posting arrangement, payment netting provisions andclose-out netting provisions. These netting provisions allow for reduction of credit risk through netting of contractual obligations. The enforceability of the netting provisions of the ISDA Master Agreement depends on the governing law of the ISDA Master Agreement, among other factors.
For financial reporting purposes, the Fund does not offset OTC derivative assets or liabilities that are subject to ISDA Master Agreements in the Statement of Assets and Liabilities.
Value of Derivative Investments atPeriod-End
The table below summarizes the value of the Fund’s derivative investments, detailed by primary risk exposure, held as of December 31, 2019:
| | | | | | | | | | | | |
| | | Value | |
| Derivative Assets | | Currency
Risk | | | Interest
Rate Risk | | | Total | |
| |
Unrealized appreciation on futures contracts – Exchange-Traded(a) | | $ | - | | | $ | 5,107 | | | $ | 5,107 | |
| |
Unrealized appreciation on forward foreign currency contracts outstanding | | | 14,106 | | | | - | | | | 14,106 | |
| |
Total Derivative Assets | | | 14,106 | | | | 5,107 | | | | 19,213 | |
| |
Derivatives not subject to master netting agreements | | | - | | | | (5,107 | ) | | | (5,107 | ) |
| |
Total Derivative Assets subject to master netting agreements | | $ | 14,106 | | | $ | - | | | $ | 14,106 | |
| |
| |
| | | Value | |
| Derivative Liabilities | | Currency
Risk | | | Interest
Rate Risk | | | Total | |
| |
Unrealized depreciation on forward foreign currency contracts outstanding | | $ | (1,180,861 | ) | | $ | - | | | $ | (1,180,861 | ) |
| |
Derivatives not subject to master netting agreements | | | - | | | | - | | | | - | |
| |
Total Derivative Liabilities subject to master netting agreements | | $ | (1,180,861 | ) | | $ | - | | | $ | (1,180,861 | ) |
| |
| (a) | The daily variation margin receivable atperiod-end is recorded in the Statement of Assets and Liabilities. |
Offsetting Assets and Liabilities
The table below reflects the Fund’s exposure to Counterparties subject to either an ISDA Master Agreement or other agreement for OTC derivative transactions as of December 31, 2019.
| | | | | | | | | | | | | | |
| | | Financial | | Financial | | | | | | | | | |
| | | Derivative
Assets | | Derivative
Liabilities | | | | | Collateral
(Received)/Pledged | | |
| | | Forward Foreign | | Forward Foreign | | Net Value of | | | | | | | Net |
| Counterparty | | Currency Contracts | | Currency Contracts | | Derivatives | | | Non-Cash | | Cash | | Amount |
|
Bank of New York Mellon (The) | | $ - | | $(416,390) | | $ | (416,390 | ) | | $- | | $- | | $(416,390) |
|
State Street Bank & Trust Co. | | 14,106 | | (764,471) | | | (750,365 | ) | | - | | - | | (750,365) |
|
Total | | $14,106 | | $(1,180,861) | | $ | (1,166,755 | ) | | $- | | $- | | $(1,166,755) |
|
Effect of Derivative Investments for the year ended December 31, 2019
The table below summarizes the gains (losses) on derivative investments, detailed by primary risk exposure, recognized in earnings during the period:
| | | | | | | | | | | | |
| | | Location of Gain (Loss) on
Statement of Operations | |
| | | Currency
Risk | | | Interest
Rate Risk | | | Total | |
| |
Realized Gain (Loss): | | | | | | | | | | | | |
Forward foreign currency contracts | | $ | 513,125 | | | $ | - | | | $ | 513,125 | |
| |
Futures contracts | | | - | | | | (265,138 | ) | | | (265,138 | ) |
| |
Invesco V.I. Equity and Income Fund
| | | | | | | | | | | | |
| | | Location of Gain (Loss) on
Statement of Operations | |
| | | Currency
Risk | | | Interest
Rate Risk | | | Total | |
| |
Change in Net Unrealized Appreciation (Depreciation): | | | | | | | | | | | | |
Forward foreign currency contracts | | $ | (1,074,785 | ) | | $ | - | | | $ | (1,074,785 | ) |
| |
Futures contracts | | | - | | | | 91,612 | | | | 91,612 | |
| |
Total | | $ | (561,660 | ) | | $ | (173,526 | ) | | $ | (735,186 | ) |
| |
The table below summarizes the average notional value of derivatives held during the period.
| | | | | | | | |
| | | Forward | | | | |
| | | Foreign Currency | | | Futures | |
| | | Contracts | | | Contracts | |
| |
Average notional value | | $ | 82,582,467 | | | $ | 3,159,206 | |
| |
NOTE 5–Trustees’ and Officers’ Fees and Benefits
Trustees’ and Officers’Fees and Benefits include amounts accrued by the Fund to pay remuneration to certain Trustees and Officers of the Fund. Trustees have the option to defer compensation payable by the Fund, andTrustees’ and Officers’ Fees and Benefits also include amounts accrued by the Fund to fund such deferred compensation amounts. Those Trustees who defer compensation have the option to select various Invesco Funds in which their deferral accounts shall be deemed to be invested. Finally, certain current Trustees were eligible to participate in a retirement plan that provided for benefits to be paid upon retirement to Trustees over a period of time based on the number of years of service. The Fund may have certain former Trustees who also participate in a retirement plan and receive benefits under such plan.Trustees’ and Officers’ Fees and Benefits include amounts accrued by the Fund to fund such retirement benefits. Obligations under the deferred compensation and retirement plans represent unsecured claims against the general assets of the Fund.
NOTE 6–Cash Balances
The Fund is permitted to temporarily carry a negative or overdrawn balance in its account with SSB, the custodian bank. Such balances, if any atperiod-end, are shown in the Statement of Assets and Liabilities under the payable captionAmount due custodian. To compensate the custodian bank for such overdrafts, the overdrawn Fund may either (1) leave funds as a compensating balance in the account so the custodian bank can be compensated by earning the additional interest; or (2) compensate by paying the custodian bank at a rate agreed upon by the custodian bank and Invesco, not to exceed the contractually agreed upon rate.
NOTE 7–Distributions to Shareholders and Tax Components of Net Assets
Tax Character of Distributions to Shareholders Paid During the Fiscal Years Ended December 31, 2019 and 2018:
| | | | | | | | |
| | | 2019 | | | 2018 | |
| |
Ordinary income | | $ | 29,108,510 | | | $ | 30,004,918 | |
| |
Long-term capital gain | | | 90,303,488 | | | | 65,612,699 | |
| |
Total distributions | | $ | 119,411,998 | | | $ | 95,617,617 | |
| |
Tax Components of Net Assets atPeriod-End:
| | | | |
| | | 2019 | |
| |
Undistributed ordinary income | | $ | 28,743,726 | |
| |
Undistributed long-term capital gain | | | 47,332,212 | |
| |
Net unrealized appreciation - investments | | | 200,924,262 | |
| |
Net unrealized appreciation - foreign currencies | | | 12,708 | |
| |
Temporary book/tax differences | | | (138,848 | ) |
| |
Shares of beneficial interest | | | 1,009,126,008 | |
| |
Total net assets | | $ | 1,286,000,068 | |
| |
The difference between book-basis andtax-basis unrealized appreciation (depreciation) is due to differences in the timing of recognition of gains and losses on investments for tax and book purposes. The Fund’s net unrealized appreciation (depreciation) difference is attributable primarily to wash sales, the tax treatment of equity securities, bond premiums, forward foreign currency contracts and contingent payment debt instruments.
The temporary book/tax differences are a result of timing differences between book and tax recognition of income and/or expenses. The Fund’s temporary book/tax differences are the result of the trustee deferral of compensation and retirement plan benefits.
Capital loss carryforward is calculated and reported as of a specific date. Results of transactions and other activity after that date may affect the amount of capital loss carryforward actually available for the Fund to utilize. Capital losses generated in years beginning after December 22, 2010 can be carried forward for an unlimited period, whereas previous losses expire in eight tax years. Capital losses with an expiration period may not be used to offset capital gains until all net capital losses without an expiration date have been utilized. Capital loss carryforwards with no expiration date
Invesco V.I. Equity and Income Fund
will retain their character as either short-term or long-term capital losses instead of as short-term capital losses as under prior law. The ability to utilize capital loss carryforwards in the future may be limited under the Internal Revenue Code and related regulations based on the results of future transactions.
The Fund does not have a capital loss carryforward as of December 31, 2019.
During the year ended December 31, 2019, 7,236,105 Series I shares of the Fund valued at $128,223,776 were redeemed by significant shareholders and settled through aredemption-in-kind transaction, of which $16,258,255 consisted of cash, which resulted in a realized gain of $26,486,492 to the Fund for book purposes. From a federal income tax perspective, the realized gains are not recognized.
NOTE 8–Investment Transactions
The aggregate amount of investment securities (other than short-term securities, U.S. Treasury obligations and money market funds, if any) purchased and sold by the Fund during the year ended December 31, 2019 was $326,380,892 and $351,187,278, respectively. During the same period, purchases and sales of U.S. Treasury obligations were $1,471,149,835 and $1,463,605,206, respectively. Cost of investments, including any derivatives, on a tax basis includes the adjustments for financial reporting purposes as of the most recently completed federal income tax reportingperiod-end.
| | | | |
| Unrealized Appreciation (Depreciation) of Investments on a Tax Basis | |
| |
Aggregate unrealized appreciation of investments | | $ | 225,937,904 | |
| |
Aggregate unrealized (depreciation) of investments | | | (25,013,642 | ) |
| |
Net unrealized appreciation of investments | | $ | 200,924,262 | |
| |
Cost of investments for tax purposes is $1,082,660,405.
NOTE 9–Reclassification of Permanent Differences
Primarily as a result of differing book/tax treatment ofredemption-in-kind, on December 31, 2019, undistributed net investment income was increased by $412,460, undistributed net realized gain was decreased by $25,985,869 and shares of beneficial interest was increased by $25,573,409. This reclassification had no effect on the net assets of the Fund.
NOTE 10–Share Information
| | | | | | | | | | | | | | | | |
| | | Summary of Share Activity | |
| |
| | | Year ended | | | Year ended | |
| | | December 31, 2019(a) | | | December 31, 2018 | |
| | | | | | | | |
| | | Shares | | | Amount | | | Shares | | | Amount | |
| |
Sold: | | | | | | | | | | | | | | | | |
Series I | | | 400,977 | | | $ | 7,034,559 | | | | 986,810 | | | $ | 18,720,753 | |
| |
Series II | | | 10,719,286 | | | | 190,855,182 | | | | 3,896,513 | | | | 72,253,278 | |
| |
| | | | |
Issued as reinvestment of dividends: | | | | | | | | | | | | | | | | |
Series I | | | 298,775 | | | | 4,953,688 | | | | 665,147 | | | | 12,212,096 | |
| |
Series II | | | 6,936,867 | | | | 114,458,310 | | | | 4,562,665 | | | | 83,405,521 | |
| |
| | | | |
Reacquired: | | | | | | | | | | | | | | | | |
Series I | | | (8,098,584 | ) | | | (143,319,065 | ) | | | (1,063,169 | ) | | | (19,978,101 | ) |
| |
Series II | | | (11,706,489 | ) | | | (204,506,730 | ) | | | (16,614,655 | ) | | | (299,472,936 | ) |
| |
Net increase (decrease) in share activity | | | (1,449,168 | ) | | $ | (30,524,056 | ) | | | (7,566,689 | ) | | $ | (132,859,389 | ) |
| |
| (a) | There are entities that are record owners of more than 5% of the outstanding shares of the Fund and in the aggregate own 74% of the outstanding shares of the Fund. The Fund and the Fund’s principal underwriter or adviser, are parties to participation agreements with these entities whereby these entities sell units of interest in separate accounts funding variable products that are invested in the Fund. The Fund, Invesco and/or Invesco affiliates may make payments to these entities, which are considered to be related to the Fund, for providing services to the Fund, Invesco and/or Invesco affiliates including but not limited to services such as, securities brokerage, third party record keeping and account servicing and administrative services. The Fund has no knowledge as to whether all or any portion of the shares owned of record by these entities are also owned beneficially. |
Invesco V.I. Equity and Income Fund
Report of Independent Registered Public Accounting Firm
To the Board of Trustees of AIM Variable Insurance Funds (Invesco Variable Insurance Funds) and Shareholders of Invesco V.I. Equity and Income Fund
Opinion on the Financial Statements
We have audited the accompanying statement of assets and liabilities, including the schedule of investments, of Invesco V.I. Equity and Income Fund (one of the funds constituting AIM Variable Insurance Funds (Invesco Variable Insurance Funds), referred to hereafter as the “Fund”) as of December 31, 2019, the related statement of operations for the year ended December 31, 2019, the statement of changes in net assets for each of the two years in the period ended December 31, 2019, including the related notes, and the financial highlights for each of the five years in the period ended December 31, 2019 (collectively referred to as the “financial statements”). In our opinion, the financial statements present fairly, in all material respects, the financial position of the Fund as of December 31, 2019, the results of its operations for the year then ended, the changes in its net assets for each of the two years in the period ended December 31, 2019 and the financial highlights for each of the five years in the period ended December 31, 2019 in conformity with accounting principles generally accepted in the United States of America.
Basis for Opinion
These financial statements are the responsibility of the Fund’s management. Our responsibility is to express an opinion on the Fund’s financial statements based on our audits. We are a public accounting firm registered with the Public Company Accounting Oversight Board (United States) (PCAOB) and are required to be independent with respect to the Fund in accordance with the U.S. federal securities laws and the applicable rules and regulations of the Securities and Exchange Commission and the PCAOB.
We conducted our audits of these financial statements in accordance with the standards of the PCAOB. Those standards require that we plan and perform the audit to obtain reasonable assurance about whether the financial statements are free of material misstatement, whether due to error or fraud.
Our audits included performing procedures to assess the risks of material misstatement of the financial statements, whether due to error or fraud, and performing procedures that respond to those risks. Such procedures included examining, on a test basis, evidence regarding the amounts and disclosures in the financial statements. Our audits also included evaluating the accounting principles used and significant estimates made by management, as well as evaluating the overall presentation of the financial statements. Our procedures included confirmation of securities owned as of December 31, 2019 by correspondence with the custodian, transfer agent and brokers; when replies were not received from brokers, we performed other auditing procedures. We believe that our audits provide a reasonable basis for our opinion.
/s/PricewaterhouseCoopers LLP
Houston, Texas
February 18, 2020
We have served as the auditor of one or more of the investment companies in the Invesco group of investment companies since at least 1995. We have not been able to determine the specific year we began serving as auditor.
Invesco V.I. Equity and Income Fund
Calculating your ongoing Fund expenses
Example
As a shareholder of the Fund, you incur ongoing costs, including management fees; distribution and/or service fees(12b-1); and other Fund expenses. This example is intended to help you understand your ongoing costs (in dollars) of investing in the Fund and to compare these costs with ongoing costs of investing in other mutual funds. The example is based on an investment of $1,000 invested at the beginning of the period and held for the entire period July 1, 2019 through December 31, 2019.
The actual and hypothetical expenses in the examples below do not represent the effect of any fees or other expenses assessed in connection with a variable product; if they did, the expenses shown would be higher while the ending account values shown would be lower.
Actual expenses
The table below provides information about actual account values and actual expenses. You may use the information in this table, together with the amount you invested, to estimate the expenses that you paid over the period. Simply divide your account value by $1,000 (for example, an $8,600 account value divided by $1,000 = 8.6), then multiply the result by the number in the table under the heading entitled “Actual Expenses Paid During Period” to estimate the expenses you paid on your account during this period.
Hypothetical example for comparison purposes
The table below also provides information about hypothetical account values and hypothetical expenses based on the Fund’s actual expense ratio and an assumed rate of return of 5% per year before expenses, which is not the Fund’s actual return.
The hypothetical account values and expenses may not be used to estimate the actual ending account balance or expenses you paid for the period. You may use this information to compare the ongoing costs of investing in the Fund and other funds. To do so, compare this 5% hypothetical example with the 5% hypothetical examples that appear in the shareholder reports of the other funds.
Please note that the expenses shown in the table are meant to highlight your ongoing costs. Therefore, the hypothetical information is useful in comparing ongoing costs, and will not help you determine the relative total costs of owning different funds.
| | | | | | | | | | | | | | | | | | | | | | | | | | | | | | |
| | | | | ACTUAL | | HYPOTHETICAL (5% annual return before expenses) | | Annualized
Expense Ratio |
| | | Beginning
Account Value
(07/01/19) | | Ending
Account Value
(12/31/19)1 | | Expenses
Paid During
Period2 | | Ending
Account Value
(12/31/19) | | Expenses
Paid During
Period2 |
Series I | | $1,000.00 | | $1,062.00 | | $2.81 | | $1,022.48 | | $2.75 | | | | 0.54 | % |
Series II | | 1,000.00 | | 1,060.60 | | 4.10 | | 1,021.22 | | 4.02 | | | | 0.79 | |
| 1 | The actual ending account value is based on the actual total return of the Fund for the period July 1, 2019 through December 31, 2019, after actual expenses and will differ from the hypothetical ending account value which is based on the Fund’s expense ratio and a hypothetical annual return of 5% before expenses. |
| 2 | Expenses are equal to the Fund’s annualized expense ratio as indicated above multiplied by the average account value over the period, multiplied by 184/365 to reflect the most recent fiscal half year. |
Invesco V.I. Equity and Income Fund
Tax Information
Form1099-DIV, Form1042-S and other year-end tax information provide shareholders with actual calendar year amounts that should be included in their tax returns. Shareholders should consult their tax advisors.
The following distribution information is being provided as required by the Internal Revenue Code or to meet a specific state’s requirement.
The Fund designates the following amounts or, if subsequently determined to be different, the maximum amount allowable for its fiscal year ended December 31, 2019:
| | | | | | |
Federal and State Income Tax | | | | | | |
Long-Term Capital Gain Distributions | | | 90,303,488 | | | |
Corporate Dividends Received Deduction* | | | 56.45 | % | | |
U.S. Treasury Obligations* | | | 9.47 | % | | |
| | * | The above percentages are based on ordinary income dividends paid to shareholders during the Fund’s fiscal year. |
Invesco V.I. Equity and Income Fund
Trustees and Officers
The address of each trustee and officer is AIM Variable Insurance Funds (Invesco Variable Insurance Funds) (the “Trust”), 11 Greenway Plaza, Suite 1000, Houston, Texas 77046-1173. The trustees serve for the life of the Trust, subject to their earlier death, incapacitation, resignation, retirement or removal as more specifically provided in the Trust’s organizational documents. Each officer serves for a one year term or until their successors are elected and qualified. Column two below includes length of time served with predecessor entities, if any.
| | | | | | | | |
Name, Year of Birth and Position(s) Held with the Trust | | Trustee and/or Officer Since | | Principal Occupation(s) During Past 5 Years | | Number of
Funds in
Fund Complex
Overseen by
Trustee | | Other Directorship(s) Held by Trustee
During Past 5 Years |
| Interested Person |
Martin L. Flanagan1- 1960 Trustee and Vice Chair | | 2007 | | Executive Director, Chief Executive Officer and President, Invesco Ltd. (ultimate parent of Invesco and a global investment management firm); Trustee and Vice Chair, The Invesco Funds; Vice Chair, Investment Company Institute; and Member of Executive Board, SMU Cox School of Business Formerly: Advisor to the Board, Invesco Advisers, Inc. (formerly known as Invesco Institutional (N.A.), Inc.); Chairman and Chief Executive Officer, Invesco Advisers, Inc. (registered investment adviser); Director, Chairman, Chief Executive Officer and President, Invesco Holding Company (US), Inc. (formerly IVZ Inc.) (holding company), Invesco Group Services, Inc. (service provider) and Invesco North American Holdings, Inc. (holding company); Director, Chief Executive Officer and President, Invesco Holding Company Limited (parent of Invesco and a global investment management firm); Director, Invesco Ltd.; Chairman, Investment Company Institute and President,Co-Chief Executive Officer,Co-President, Chief Operating Officer and Chief Financial Officer, Franklin Resources, Inc. (global investment management organization) | | 229 | | None |
| 1 | Mr. Flanagan is considered an interested person (within the meaning of Section 2(a)(19) of the 1940 Act) of the Trust because he is an officer of the Adviser to the Trust, and an officer and a director of Invesco Ltd., ultimate parent of the Adviser. |
Invesco V.I. Equity and Income Fund
Trustees and Officers–(continued)
| | | | | | | | |
Name, Year of Birth and Position(s) Held with the Trust | | Trustee and/or Officer Since | | Principal Occupation(s) During Past 5 Years | | Number of
Funds in
Fund Complex
Overseen by
Trustee | | Other Directorship(s) Held by Trustee
During Past 5 Years |
| Independent Trustees |
Bruce L. Crockett - 1944 Trustee and Chair | | 1993 | | Chairman, Crockett Technologies Associates (technology consulting company) Formerly: Director, Captaris (unified messaging provider); Director, President and Chief Executive Officer, COMSAT Corporation; Chairman, Board of Governors of INTELSAT (international communications company); ACE Limited (insurance company); Independent Directors Council and Investment Company Institute: Member of the Audit Committee, Investment Company Institute; Member of the Executive Committee and Chair of the Governance Committee, Independent Directors Council | | 229 | | Director and Chairman of the Audit Committee, ALPS (Attorneys Liability Protection Society) (insurance company); Director and Member of the Audit Committee and Compensation Committee, Ferroglobe PLC (metallurgical company) |
David C. Arch - 1945 Trustee | | 2010 | | Chairman of Blistex Inc. (consumer health care products manufacturer); Member, World Presidents’ Organization | | 229 | | Board member of the Illinois Manufacturers’ Association |
Beth Ann Brown - 1968 Trustee | | 2019 | | Independent Consultant Formerly: Head of Intermediary Distribution, Managing Director, Strategic Relations, Managing Director, Head of National Accounts, Senior Vice President, National Account Manager and Senior Vice President, Key Account Manager, Columbia Management Investment Advisers LLC; Vice President, Key Account Manager, Liberty Funds Distributor, Inc.; and Trustee of certain Oppenheimer Funds | | 229 | | Director, Board of Directors of Caron Engineering Inc.; Advisor, Board of Advisors of Caron Engineering Inc.; President and Director, Acton Shapleigh Youth Conservation Corps (non - profit); and Vice President and Director of Grahamtastic Connection (non-profit) |
Jack M. Fields - 1952 Trustee | | 1997 | | Chief Executive Officer, Twenty First Century Group, Inc. (government affairs company); and Chairman, Discovery Learning Alliance(non-profit) Formerly: Owner and Chief Executive Officer, Dos Angeles Ranch L.P. (cattle, hunting, corporate entertainment); Director, Insperity, Inc. (formerly known as Administaff) (human resources provider); Chief Executive Officer, Texana Timber LP (sustainable forestry company); Director of Cross Timbers Quail Research Ranch(non-profit); and member of the U.S. House of Representatives | | 229 | | None |
Invesco V.I. Equity and Income Fund
Trustees and Officers–(continued)
| | | | | | | | |
Name, Year of Birth and Position(s) Held with the Trust | | Trustee and/or Officer Since | | Principal Occupation(s) During Past 5 Years | | Number of
Funds in
Fund Complex
Overseen by
Trustee | | Other Directorship(s) Held by Trustee
During Past 5 Years |
| Independent Trustees–(continued) |
Cynthia Hostetler -1962 Trustee | | 2017 | | Non-Executive Director and Trustee of a number of public and private business corporations Formerly: Director, Aberdeen Investment Funds (4 portfolios); Head of Investment Funds and Private Equity, Overseas Private Investment Corporation; President, First Manhattan Bancorporation, Inc.; Attorney, Simpson Thacher & Bartlett LLP | | 229 | | Vulcan Materials Company (construction materials company); Trilinc Global Impact Fund; Genesee & Wyoming, Inc. (railroads); Artio Global Investment LLC (mutual fund complex); Edgen Group, Inc. (specialized energy and infrastructure products distributor); Investment Company Institute (professional organization); Independent Directors Council (professional organization) |
Eli Jones - 1961 Trustee | | 2016 | | Professor and Dean, Mays Business School - Texas A&M University Formerly: Professor and Dean, Walton College of Business, University of Arkansas and E.J. Ourso College of Business, Louisiana State University; Director, Arvest Bank | | 229 | | Insperity, Inc. (formerly known as Administaff) (human resources provider) |
Elizabeth Krentzman - 1959 Trustee | | 2019 | | Formerly: Principal and Chief Regulatory Advisor for Asset Management Services and U.S. Mutual Fund Leader of Deloitte & Touche LLP; General Counsel of the Investment Company Institute (trade association); National Director of the Investment Management Regulatory Consulting Practice, Principal, Director and Senior Manager of Deloitte & Touche LLP; Assistant Director of the Division of Investment Management - Office of Disclosure and Investment Adviser Regulation of the U.S. Securities and Exchange Commission and various positions with the Division of Investment Management - Office of Regulatory Policy of the U.S. Securities and Exchange Commission; Associate at Ropes & Gray LLP; Advisory Board Member of the Securities and Exchange Commission Historical Society; and Trustee of certain Oppenheimer Funds | | 229 | | Trustee of the University of Florida National Board Foundation and Audit Committee Member; Member of the Cartica Funds Board of Directors (private investment funds); Member of the University of Florida Law Center Association, Inc. Board of Trustees and Audit Committee Member |
Anthony J. LaCava, Jr. - 1956 Trustee | | 2019 | | Formerly: Director and Member of the Audit Committee, Blue Hills Bank (publicly traded financial institution) and Managing Partner, KPMG LLP | | 229 | | Blue Hills Bank; Chairman, Bentley University; Member, Business School Advisory Council; and Nominating Committee KPMG LLP |
Prema Mathai-Davis - 1950 Trustee | | 1998 | | Retired Co-Owner & Partner of Quantalytics Research, LLC, (a FinTech Investment Research Platform for the Self-Directed Investor) | | 229 | | None |
Invesco V.I. Equity and Income Fund
Trustees and Officers–(continued)
| | | | | | | | |
Name, Year of Birth and Position(s) Held with the Trust | | Trustee and/or Officer Since | | Principal Occupation(s) During Past 5 Years | | Number of
Funds in
Fund Complex
Overseen by
Trustee | | Other Directorship(s) Held by Trustee
During Past 5 Years |
| Independent Trustees–(continued) |
Joel W. Motley - 1952 Trustee | | 2019 | | Director of Office of Finance, Federal Home Loan Bank; Member of the Vestry of Trinity Wall Street; Managing Director of Carmona Motley Inc. (privately held financial advisor); Member of the Finance and Budget Committee of the Council on Foreign Relations, Member of the Investment Committee and Board of Human Rights Watch and Member of the Investment Committee and Board of Historic Hudson Valley(non-profit cultural organization) Formerly: Managing Director of Public Capital Advisors, LLC (privately held financial advisor); Managing Director of Carmona Motley Hoffman, Inc. (privately held financial advisor); Trustee of certain Oppenheimer Funds; and Director of Columbia Equity Financial Corp. (privately held financial advisor) | | 229 | | Director of Greenwall Foundation (bioethics research foundation); Member of Board and Investment Committee of The Greenwall Foundation; Director of Southern Africa Legal Services Foundation; Board Member and Investment Committee Member of Pulizer Center for Crisis Reporting(non-profit journalism) |
Teresa M. Ressel - 1962 Trustee | | 2017 | | Non-executive director and trustee of a number of public and private business corporations Formerly: Chief Financial Officer, Olayan America, The Olayan Group (international investor/commercial/industrial); Chief Executive Officer, UBS Securities LLC; Group Chief Operating Officer, Americas, UBS AG; Assistant Secretary for Management & Budget and CFO, US Department of the Treasury | | 229 | | Atlantic Power Corporation (power generation company); ON Semiconductor Corp. (semiconductor supplier) |
Ann Barnett Stern - 1957 Trustee | | 2017 | | President and Chief Executive Officer, Houston Endowment Inc. (private philanthropic institution) Formerly: Executive Vice President and General Counsel, Texas Children’s Hospital; Attorney, Beck, Redden and Secrest, LLP; Business Law Instructor, University of St. Thomas; Attorney, Andrews & Kurth LLP | | 229 | | Federal Reserve Bank of Dallas |
Robert C. Troccoli - 1949 Trustee | | 2016 | | Retired | | 229 | | None |
| Daniel S. Vandivort - 1954 Trustee | | 2019 | | Treasurer, Chairman of the Audit and Finance Committee, and Trustee, Board of Trustees, Huntington Disease Foundation of America; and President, Flyway Advisory Services LLC (consulting and property management) Formerly: Trustee and Governance Chair, of certain Oppenheimer Funds | | 229 | | Chairman and Lead Independent Director, Chairman of the Audit Committee, and Director, Board of Directors, Value Line Funds |
| James D. Vaughn - 1945 Trustee | | 2019 | | Retired Formerly: Managing Partner, Deloitte & Touche LLP; Trustee and Chairman of the Audit Committee, Schroder Funds; Board Member, Mile High United Way, Boys and Girls Clubs, Boy Scouts, Colorado Business Committee for the Arts, Economic Club of Colorado and Metro Denver Network (economic development corporation); and Trustee of certain Oppenheimer Funds | | 229 | | Board member and Chairman of Audit Committee of AMG National Trust Bank; Trustee and Investment Committee member, University of South Dakota Foundation; Board member, Audit Committee Member and past Board Chair, Junior Achievement(non-profit) |
Invesco V.I. Equity and Income Fund
Trustees and Officers–(continued)
| | | | | | | | |
Name, Year of Birth and Position(s) Held with the Trust | | Trustee and/or Officer Since | | Principal Occupation(s) During Past 5 Years | | Number of
Funds in
Fund Complex
Overseen by
Trustee | | Other Directorship(s) Held by Trustee
During Past 5 Years |
| Independent Trustees–(continued) |
| Christopher L. WIlson - 1957 Trustee, Vice Chair and Chair Designate | | 2017 | | Retired Formerly: Director, TD Asset Management USA Inc. (mutual fund complex) (22 portfolios); Managing Partner, CT2, LLC (investing and consulting firm); President/Chief Executive Officer, Columbia Funds, Bank of America Corporation; President/Chief Executive Officer, CDC IXIS Asset Management Services, Inc.; Principal & Director of Operations, Scudder Funds, Scudder, Stevens & Clark, Inc.; Assistant Vice President, Fidelity Investments | | 229 | | ISO New England, Inc.(non-profit organization managing regional electricity market) |
Invesco V.I. Equity and Income Fund
Trustees and Officers–(continued)
| | | | | | | | |
Name, Year of Birth and Position(s) Held with the Trust | | Trustee and/or Officer Since | | Principal Occupation(s) During Past 5 Years | | Number of
Funds in
Fund Complex
Overseen by
Trustee | | Other Directorship(s) Held by Trustee
During Past 5 Years |
| Officers |
Sheri Morris - 1964 President, Principal Executive Officer and Treasurer | | 1999 | | Head of Global Fund Services, Invesco Ltd.; President, Principal Executive Officer and Treasurer, The Invesco Funds; Vice President, Invesco Advisers, Inc. (formerly known as Invesco Institutional (N.A.), Inc.) (registered investment adviser); and Vice President, Invesco Exchange-Traded Fund Trust, Invesco Exchange-Traded Fund Trust II, Invesco India Exchange-Traded Fund Trust, Invesco Actively Managed Exchange-Traded Fund Trust, Invesco Actively Managed Exchange-Traded Commodity Fund Trust and Invesco Exchange-Traded Self-Indexed Fund Trust; and Vice President, OppenheimerFunds, Inc. Formerly: Vice President and Principal Financial Officer, The Invesco Funds; Vice President, Invesco AIM Advisers, Inc., Invesco AIM Capital Management, Inc. and Invesco AIM Private Asset Management, Inc.; Assistant Vice President and Assistant Treasurer, The Invesco Funds and Assistant Vice President, Invesco Advisers, Inc., Invesco AIM Capital Management, Inc. and Invesco AIM Private Asset Management, Inc.; and Treasurer, Invesco Exchange-Traded Fund Trust, Invesco Exchange-Traded Fund Trust II, Invesco India Exchange-Traded Fund Trust and Invesco Actively Managed Exchange-Traded Fund Trust | | N/A | | N/A |
Russell C. Burk - 1958 Senior Vice President and Senior Officer | | 2005 | | Senior Vice President and Senior Officer, The Invesco Funds | | N/A | | N/A |
Jeffrey H. Kupor - 1968 Senior Vice President, Chief Legal Officer and Secretary | | 2018 | | Head of Legal of the Americas, Invesco Ltd.; Senior Vice President and Secretary, Invesco Advisers, Inc. (formerly known as Invesco Institutional (N.A.), Inc.) (registered investment adviser); Senior Vice President and Secretary, Invesco Distributors, Inc. (formerly known as Invesco AIM Distributors, Inc.); Vice President and Secretary, Invesco Investment Services, Inc. (formerly known as Invesco AIM Investment Services, Inc.) Senior Vice President, Chief Legal Officer and Secretary, The Invesco Funds; Secretary and General Counsel, Invesco Investment Advisers LLC (formerly known as Van Kampen Asset Management); Secretary and General Counsel, Invesco Capital Markets, Inc. (formerly known as Van Kampen Funds Inc.) and Chief Legal Officer, Invesco Exchange-Traded Fund Trust, Invesco Exchange-Traded Fund Trust II, Invesco India Exchange-Traded Fund Trust, Invesco Actively Managed Exchange-Traded Fund Trust, Invesco Actively Managed Exchange-Traded Commodity Fund Trust and Invesco Exchange-Traded Self-Indexed Fund Trust; Secretary, Invesco Indexing LLC; Secretary, W.L. Ross & Co., LLC Formerly: Secretary and Vice President, Jemstep, Inc.; Head of Legal, Worldwide Institutional, Invesco Ltd.; Secretary and General Counsel, INVESCO Private Capital Investments, Inc.; Senior Vice President, Secretary and General Counsel, Invesco Management Group, Inc. (formerly known as Invesco AIM Management Group, Inc.); Assistant Secretary, INVESCO Asset Management (Bermuda) Ltd.; Secretary and General Counsel, Invesco Private Capital, Inc.; Assistant Secretary and General Counsel, INVESCO Realty, Inc.; Secretary and General Counsel, Invesco Senior Secured Management, Inc.; and Secretary, Sovereign G./P. Holdings Inc. | | N/A | | N/A |
Andrew R. Schlossberg - 1974 Senior Vice President | | 2019 | | Head of the Americas and Senior Managing Director, Invesco Ltd.; Director and Senior Vice President, Invesco Advisers, Inc. (formerly known as Invesco Institutional (N.A.), Inc.) (registered investment adviser); Director and Chairman, Invesco Investment Services, Inc. (formerly known as Invesco AIM Investment Services, Inc.) (registered transfer agent); Senior Vice President, The Invesco Funds; Director, Invesco Investment Advisers LLC (formerly known as Van Kampen Asset Management); Director, President and Chairman, Invesco Insurance Agency, Inc. Formerly: Director, Invesco UK Limited; Director and Chief Executive, Invesco Asset Management Limited and Invesco Fund Managers Limited; Assistant Vice President, The Invesco Funds; Senior Vice President, Invesco Advisers, Inc. (formerly known as Invesco Institutional (N.A.), Inc.) (registered investment adviser); Director and Chief Executive, Invesco Administration Services Limited and Invesco Global Investment Funds Limited; Director, Invesco Distributors, Inc.; Head of EMEA, Invesco Ltd.; President, Invesco Actively Managed Exchange-Traded Commodity Fund Trust, Invesco Actively Managed Exchange-Traded Fund Trust, Invesco Exchange-Traded Fund Trust, Invesco Exchange-Traded Fund Trust II and Invesco India Exchange-Traded Fund Trust; Managing Director and Principal Executive Officer, Invesco Capital Management LLC | | N/A | | N/A |
Invesco V.I. Equity and Income Fund
Trustees and Officers–(continued)
| | | | | | | | |
Name, Year of Birth and Position(s) Held with the Trust | | Trustee and/or Officer Since | | Principal Occupation(s) During Past 5 Years | | Number of
Funds in
Fund Complex
Overseen by
Trustee | | Other Directorship(s) Held by Trustee
During Past 5 Years |
| Officers–(continued) |
John M. Zerr - 1962 Senior Vice President | | 2006 | | Chief Operating Officer of the Americas; Senior Vice President, Invesco Advisers, Inc. (formerly known as Invesco Institutional (N.A.), Inc.) (registered investment adviser); Senior Vice President, Invesco Distributors, Inc. (formerly known as Invesco AIM Distributors, Inc.); Director and Vice President, Invesco Investment Services, Inc. (formerly known as Invesco AIM Investment Services, Inc.) Senior Vice President, The Invesco Funds; Managing Director, Invesco Capital Management LLC; Director, Invesco Investment Advisers LLC (formerly known as Van Kampen Asset Management); Senior Vice President, Invesco Capital Markets, Inc. (formerly known as Van Kampen Funds Inc.); Manager, Invesco Indexing LLC; Manager, Invesco Specialized Products, LLC; Director and Senior Vice President, Invesco Insurance Agency, Inc.; Member, Invesco Canada Funds Advisory Board; Director, President and Chief Executive Officer, Invesco Corporate Class Inc. (corporate mutual fund company); and Director, Chairman, President and Chief Executive Officer, Invesco Canada Ltd. (formerly known as Invesco Trimark Ltd./Invesco Trimark Ltèe) (registered investment adviser and registered transfer agent) Formerly: Director and Senior Vice President, Invesco Management Group, Inc. (formerly known as Invesco AIM Management Group, Inc.); Secretary and General Counsel, Invesco Management Group, Inc. (formerly known as Invesco AIM Management Group, Inc.); Secretary, Invesco Investment Services, Inc. (formerly known as Invesco AIM Investment Services, Inc.); Chief Legal Officer and Secretary, The Invesco Funds; Secretary and General Counsel, Invesco Investment Advisers LLC (formerly known as Van Kampen Asset Management); Secretary and General Counsel, Invesco Capital Markets, Inc. (formerly known as Van Kampen Funds Inc.); Chief Legal Officer, Invesco Exchange-Traded Fund Trust, Invesco Exchange-Traded Fund Trust II, Invesco India Exchange-Traded Fund Trust, Invesco Actively Managed Exchange-Traded Fund Trust, Invesco Actively Managed Exchange-Traded Commodity Fund Trust and Invesco Exchange-Traded Self-Indexed Fund Trust; Secretary, Invesco Indexing LLC; Director, Secretary, General Counsel and Senior Vice President, Van Kampen Exchange Corp.; Director, Vice President and Secretary, IVZ Distributors, Inc. (formerly known as INVESCO Distributors, Inc.); Director and Vice President, INVESCO Funds Group, Inc.; Director and Vice President, Van Kampen Advisors Inc.; Director, Vice President, Secretary and General Counsel, Van Kampen Investor Services Inc.; Director and Secretary, Invesco Distributors, Inc. (formerly known as Invesco AIM Distributors, Inc.); Director, Senior Vice President, General Counsel and Secretary, Invesco AIM Advisers, Inc. and Van Kampen Investments Inc.; Director, Vice President and Secretary, Fund Management Company; Director, Senior Vice President, Secretary, General Counsel and Vice President, Invesco AIM Capital Management, Inc.; Chief Operating Officer and General Counsel, Liberty Ridge Capital, Inc. (an investment adviser) | | N/A | | N/A |
Gregory G. McGreevey - 1962 Senior Vice President | | 2012 | | Senior Managing Director, Invesco Ltd.; Director, Chairman, President, and Chief Executive Officer, Invesco Advisers, Inc. (formerly known as Invesco Institutional (N.A.), Inc.) (registered investment adviser); Director, Invesco Mortgage Capital, Inc. and Invesco Senior Secured Management, Inc.; and Senior Vice President, The Invesco Funds; and President, SNW Asset Management Corporation Formerly: Senior Vice President, Invesco Management Group, Inc. and Invesco Advisers, Inc.; Assistant Vice President, The Invesco Funds | | N/A | | N/A |
Kelli Gallegos - 1970 Vice President, Principal Financial Officer and Assistant Treasurer | | 2008 | | Principal Financial and Accounting Officer - Investments Pool, Invesco Specialized Products, LLC; Vice President, Principal Financial Officer and Assistant Treasurer, The Invesco Funds; Principal Financial and Accounting Officer - Pooled Investments, Invesco Capital Management LLC; Vice President and Treasurer, Invesco Exchange-Traded Fund Trust, Invesco Exchange-Traded Fund Trust II, Invesco India Exchange-Traded Fund Trust, Invesco Actively Managed Exchange-Traded Fund Trust, Invesco Actively Managed Exchange-Traded Commodity Fund Trust and Invesco Exchange-Traded Self-Indexed Fund Trust Formerly: Assistant Treasurer, Invesco Specialized Products, LLC; Assistant Treasurer, Invesco Exchange-Traded Fund Trust, Invesco Exchange-Traded Fund Trust II, Invesco India Exchange-Traded Fund Trust, Invesco Actively Managed Exchange-Traded Fund Trust, Invesco Actively Managed Exchange-Traded Commodity Fund Trust and Invesco Exchange-Traded Self-Indexed Fund Trust; Assistant Treasurer, Invesco Capital Management LLC; Assistant Vice President, The Invesco Funds | | N/A | | N/A |
Invesco V.I. Equity and Income Fund
Trustees and Officers–(continued)
| | | | | | | | |
Name, Year of Birth and Position(s) Held with the Trust | | Trustee and/or Officer Since | | Principal Occupation(s) During Past 5 Years | | Number of
Funds in
Fund Complex
Overseen by
Trustee | | Other Directorship(s) Held by Trustee
During Past 5 Years |
| Officers–(continued) |
Crissie M. Wisdom - 1969 Anti-Money Laundering Compliance Officer | | 2013 | | Anti-Money Laundering Compliance Officer, Invesco Advisers, Inc. (formerly known as Invesco Institutional (N.A.), Inc.) (registered investment adviser), Invesco Capital Markets, Inc. (formerly known as Van Kampen Funds Inc.), Invesco Distributors, Inc., Invesco Investment Services, Inc., The Invesco Funds, and Invesco Exchange-Traded Fund Trust, Invesco Exchange-Traded Fund Trust II, Invesco India Exchange-Traded Fund Trust, Invesco Actively Managed Exchange-Traded Fund Trust, Invesco Actively Managed Exchange-Traded Commodity Fund Trust and Invesco Exchange-Traded Self-Indexed Fund Trust; Anti-Money Laundering Compliance Officer and Bank Secrecy Act Officer, INVESCO National Trust Company and Invesco Trust Company; and Fraud Prevention Manager and Controls and Risk Analysis Manager for Invesco Investment Services, Inc. Formerly: Anti-Money Laundering Compliance Officer, Van Kampen Exchange Corp. and Invesco Management Group, Inc. | | N/A | | N/A |
Robert R. Leveille - 1969 Chief Compliance Officer | | 2016 | | Chief Compliance Officer, Invesco Advisers, Inc. (registered investment adviser); and Chief Compliance Officer, The Invesco Funds Formerly: Chief Compliance Officer, Putnam Investments and the Putnam Funds | | N/A | | N/A |
The Statement of Additional Information of the Trust includes additional information about the Fund’s Trustees and is available upon request, without charge, by calling 1.800.959.4246. Please refer to the Fund’s Statement of Additional Information for information on the Fund’ssub-advisers.
| | | | | | |
| Office of the Fund | | Investment Adviser | | Distributor | | Auditors |
| 11 Greenway Plaza, Suite 1000 | | Invesco Advisers, Inc. | | Invesco Distributors, Inc. | | PricewaterhouseCoopers LLP |
| Houston, TX 77046-1173 | | 1555 Peachtree Street, N.E. | | 11 Greenway Plaza, Suite 1000 | | 1000 Louisiana Street, Suite 5800 |
| | Atlanta, GA 30309 | | Houston, TX 77046-1173 | | Houston, TX 77002-5678 |
| | | |
| Counsel to the Fund | | Counsel to the Independent Trustees | | Transfer Agent | | Custodian |
| Stradley Ronon Stevens & Young, LLP | | Goodwin Procter LLP | | Invesco Investment Services, Inc. | | State Street Bank and Trust Company |
| 2005 Market Street, Suite 2600 | | 901 New York Avenue, N.W. | | 11 Greenway Plaza, Suite 1000 | | 225 Franklin Street |
| Philadelphia, PA 19103-7018 | | Washington, D.C. 20001 | | Houston, TX 77046-1173 | | Boston, MA 02110-2801 |
Invesco V.I. Equity and Income Fund
| | | | |
| | |
 | | Annual Report to Shareholders | | December 31, 2019 |
| | |
| | Invesco V.I. Global Core Equity Fund |

Beginning on January 1, 2021, as permitted by regulations adopted by the Securities and Exchange Commission, the insurance company that offers your variable annuity or variable life insurance contract may no longer send you paper copies of the Fund’s shareholder reports by mail, unless you specifically request paper copies of the reports from the insurance company or your financial intermediary. Instead of delivering paper copies of the report, the insurance company may choose to make the reports available on a website, and will notify you by mail each time a report is posted and provide you with a website link to access the report. Instructions for requesting paper copies will be provided by your insurance company.
If the insurance company offers electronic delivery, you may elect to receive shareholder reports and other communications about the Fund electronically by following the instructions provided by the insurance company or by contacting your financial intermediary. If you already elected to receive shareholder reports electronically, you will not be affected by this change and you need not take any action.
You may elect to receive all future reports in paper free of charge from the insurance company. You can inform the insurance company or your financial intermediary that you wish to continue receiving paper copies of your shareholder reports by following the instructions provided by the insurance company or by contacting your financial intermediary. Your election to receive reports in paper will apply to all portfolio companies available under your contract with the insurance company.
The Fund provides a complete list of its holdings four times in each fiscal year, at the quarter-ends. For the second and fourth quarters, the lists appear in the Fund’s semiannual and annual reports to shareholders. For the first and third quarters, the Fund files the lists with the Securities and Exchange Commission (SEC) as an exhibit to its reports on FormN-PORT. The Fund’s FormN-PORT filings are available on the SEC website, sec.gov. The SEC file numbers for the Fund are811-07452 and033-57340. The Fund’s most recent portfolio holdings, as filed on FormN-PORT, have also been made available to insurance companies issuing variable annuity contracts and variable life insurance policies (“variable products”) that invest in the Fund.
A description of the policies and procedures that the Fund uses to determine how to vote proxies relating to portfolio securities is available without charge, upon request, from our Client Services department at 800 959 4246 or at invesco.com/proxyguidelines. The information is also available on the SEC website, sec.gov.
Information regarding how the Fund voted proxies related to its portfolio securities during the most recent12-month period ended June 30 is available at invesco.com/proxysearch. The information is also available on the SEC website, sec.gov.
Invesco Advisers, Inc. is an investment adviser; it provides investment advisory services to individual and institutional clients and does not sell securities. Invesco Distributors, Inc. is the US distributor for Invesco Ltd.’s retail mutual funds, exchange-traded funds and institutional money market funds. Both are wholly owned, indirect subsidiaries of Invesco Ltd.
This report must be accompanied or preceded by a currently effective Fund prospectus and variable product prospectus, which contain more complete information, including sales charges and expenses. Investors should read each carefully before investing.
| | | | |
NOT FDIC INSURED | MAY LOSE VALUE | NO BANK GUARANTEE |
| Invesco Distributors, Inc. | | | | VIGCE-AR-1 |
Management’s Discussion of Fund Performance
| | | | |
| Performance summary | | | | |
For the year ended December 31, 2019, Series I shares of Invesco V.I. Global Core Equity Fund (the Fund) underperformed the MSCI World Index, the Fund’s broad market/style-specific benchmark. Your Fund’s long-term performance appears later in this report. | |
| Fund vs. Indexes | | | | |
| Total returns, 12/31/18 to 12/31/19, excluding variable product issuer charges. If variable product issuer charges were included, returns would be lower. | | | | |
| Series I Shares | | | 25.20 | % |
| Series II Shares | | | 24.82 | |
| MSCI World Indexq(Broad Market/Style-Specific Index) | | | 27.67 | |
| Lipper VUF GlobalMulti-Cap Value Funds Classification Average∎(Peer Group) | | | 20.22 | |
| |
| Source(s):qRIMES Technologies Corp.;∎Lipper Inc. | | | | |
Market conditions and your Fund
After a relatively calm start at the beginning of 2019, global equity markets faced greater volatility in the second and third quarters, hampered by ongoing US and China trade issues, potential for new tariffs and weakening global economic growth. Disagreement within the UK about its withdrawal from the European Union increased uncertainty for the UK and eurozone economies.
Much of the year showed slowing manufacturing activity and declining business investment, which was evidence that trade tensions were stifling economic growth across both developed and emerging markets. Global recession concerns caused a sharp equitysell-off in August 2019, as investors crowded into asset classes perceived as safe havens, including US Treasuries and gold.
During the year, third quarter macroeconomic and geopolitical issues mostly abated during the fourth quarter, providing a favorable backdrop for global equity returns. In response to third quarter economic weakness, central banks maintained accommodative policies, with the US Federal Reserve cutting interest rates in October 2019 and the European Central Bank restarting net purchases in its
asset purchase program in November. Better economic data and signs of progress in US and China trade talks also supported global equities. The UK’s general election in December delivered a decisive victory to the conservative party, reaffirming the original Brexit vote and the UK’s eventual exit from the European Union. In this environment, global equity markets had robust gains for the year, with developed markets outperforming emerging markets.
During the year, stock selection in the information technology (IT) and utilities sectors contributed to the Fund’s performance relative to the broad market/ style-specific benchmark, while stock selection in the energy and consumer staples sectors detracted from the Fund’s relative performance. While stock selection in the IT sector was favorable, the Fund’s underweight allocation to the sector was the largest drag on relative performance.
From a geographic perspective, stock selection in Australia, Japan and Hong Kong benefited the Fund’s performance versus the broad market/style-specific benchmark for the year. Conversely, stock selection in the US and UK detracted from the Fund’s relative performance.
The Fund’s top contributor relative to its broad market/style-specific benchmark for the year was Italian energy companyEnel.Shares of the company returned 45% during the year as investors reacted favorably to the successful restructuring of the company’s Latin American business division. During the year, we trimmed our position in Enel, but we continued to hold the stock based on our belief in the durability of Enel’s position as one of the preeminent renewable energy players.
Another key contributor to the Fund’s performance relative to its broad market/style-specific benchmark for the year was Japanese technology companyHitachi.The company benefited from portfolio rationalization and improving corporate governance. At the close of the year, we continued to see a considerable asymmetric payoff in its shares.
EPAM Systemswas also a leading contributor to the Fund’s performance relative to its broad market/style-specific benchmark for the year. The technology services company delivered strongtop-line and earnings growth on the back of project wins. While we trimmed our position in EPAM Systems during the year, our outlook remained favorable, as we believed the company will continue to create value by helping its customers solve digital challenges.
During the year, Chinese internet companyBaiduwas the Fund’s largest individual detractor versus the broad market/style-specific benchmark, with shares declining 20%. Growth in Baidu’s core search business slowed dramatically as its competition gained market share. As such, we exited our position in the company before the close of the year in order to focus on what we believed were more promising, durable businesses.
Concho Resourceswas another detractor from the Fund’s performance
| | | | |
Portfolio Composition | |
By country | | | % of total net assets | |
| | | | |
| |
| United States | | | 50.42% | |
| United Kingdom | | | 11.46 | |
| Japan | | | 10.89 | |
| Germany | | | 6.00 | |
| Italy | | | 3.63 | |
| Denmark | | | 2.41 | |
| Hong Kong | | | 2.25 | |
| Countries, each less than 2% of portfolio | | | 12.69 | |
| Money Market Funds Plus Other Assets Less Liabilities | | | 0.25 | |
| | | | |
Top 10 Equity Holdings* | |
% of total net assets | |
1. Alphabet, Inc., Class C | | | 3.86% | |
2. Royal Dutch Shell PLC, Class A, ADR | | | 2.69 | |
3. Siemens AG | | | 2.50 | |
4. Chevron Corp. | | | 2.40 | |
5. Wynn Resorts Ltd. | | | 2.28 | |
6. American Express Co. | | | 2.25 | |
7. AIA Group Ltd. | | | 2.25 | |
8. Asahi Group Holdings Ltd. | | | 2.16 | |
9. Nomad Foods Ltd. | | | 2.15 | |
10. First Republic Bank | | | 2.14 | |
| | | | |
Total Net Assets | | $ | 70.6 million | |
| | | | |
| |
| Total Number of Holdings* | | | 69 | |
The Fund’s holdings are subject to change, and there is no assurance that the Fund will continue to hold any particular security.
*Excluding money market fund holdings, if any.
Data presented here are as of December 31, 2019.
Invesco V.I. Global Core Equity Fund
relative to the broad market/style-specific benchmark during the year. The company sold off 14% as oil prices fell during the year. In addition, company-specific issues arose as production growth unexpectedly slowed. We exited our position in Concho Resources before the close of the year.
Finally,Glencore,a global mining company, detracted from the Fund’s performance relative to the broad market/ style-specific benchmark for the year. Shares of the company declined as a result of investigations into its business practices by the Department of Justice and the Commodity Futures Trading Commission. We exited our position in the holding before the close of the year.
At the close of the year, the Fund’s largest overweight positions relative to the MSCI World Index were in the communication services, financials and industrials sectors. The largest underweight positions relative to the MSCI World Index were in the health care and IT sectors.
We believe the Fund is well-positioned for an improvement in economic data. We also believe it remains well-balanced and diversified with a focus on exploiting stock-specific opportunities. Our investment decision making process remains focused on our three Research Pillars of Durability, Asymmetry and Differentiated Thesis. We continue to exercise discipline in striving to manage outsized risks and focusing on opportunities with asymmetric return profiles. The Fund remains intentionally weighted toward stock-specific risk as opposed to macroeconomic and other risk factors.
We thank you for your continued investment in Invesco V.I. Global Core Equity Fund.
Portfolio managers:
Erik Esselink
Jeffrey Everett
Marty Steinik
Assisted by Invesco’s Global Core Equity Team
The views and opinions expressed in management’s discussion of Fund performance are those of Invesco Advisers, Inc. These views and opinions are subject to change at any time based on factors such as market and economic conditions. These views and opinions may not be relied upon as investment advice or recommendations, or as an offer for a particular security. The information is not a complete analysis of every aspect of any market, country, industry, security or the Fund. Statements of fact are from sources considered reliable, but Invesco Advisers, Inc. makes no representation or warranty as to their
completeness or accuracy. Although historical performance is no guarantee of future results, these insights may help you understand our investment management philosophy.
See important Fund and, if applicable, index disclosures later in this report.
Invesco V.I. Global Core Equity Fund
Your Fund’s Long-Term Performance
Results of a $10,000 Investment – Oldest Share Class(es)
Fund and index data from 12/31/09
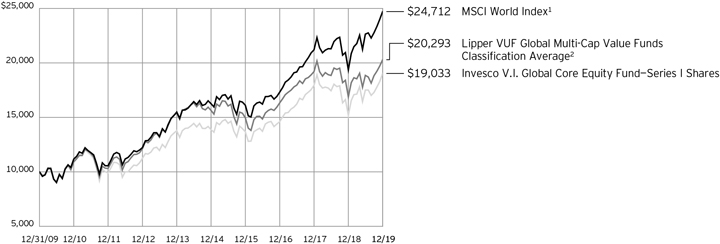
| 1 | Source: RIMES Technologies Corp. |
Past performance cannot guarantee
future results.
| | | | |
| Average Annual Total Returns | |
As of 12/31/19 | | | | |
| |
| Series I Shares | | | | |
| Inception (1/2/97) | | | 5.23% | |
| 10 Years | | | 6.65 | |
| 5 Years | | | 6.53 | |
| 1 Year | | | 25.20 | |
| |
| Series II Shares | | | | |
| 10 Years | | | 6.38% | |
| 5 Years | | | 6.24 | |
| 1 Year | | | 24.82 | |
Effective June 1, 2010, Class I shares of the predecessor fund, Universal Funds Global Value Equity Portfolio, advised by Morgan Stanley Investment Management Inc. were reorganized into Series I shares of Invesco Van Kampen V.I. Global Value Equity Fund (renamed Invesco V.I. Global Core Equity Fund on April 30, 2012). Returns shown above, prior to June 1, 2010, for Series I shares are blended returns of the predecessor fund and Invesco V.I. Global Value Equity Fund. Share class returns will differ from the predecessor fund because of different expenses.
Series II shares incepted on June 1, 2010. Series II share performance shown prior to that date is that of the predecessor fund’s Class I shares restated to reflect the higher12b-1 fees applicable to Series II shares.
The performance data quoted represent past performance and cannot guarantee future results; current performance may be lower or higher. Please contact your variable product issuer or financial adviser for
the most recentmonth-end variable product performance. Performance figures reflect Fund expenses, reinvested distributions and changes in net asset value. Performance figures do not reflect deduction of taxes a shareholder would pay on Fund distributions or sale of Fund shares. Investment return and principal value will fluctuate so that you may have a gain or loss when you sell shares.
The total annual Fund operating expense ratio set forth in the most recent Fund prospectus as of the date of this report for Series I and Series II shares was 1.02% and 1.27%, respectively. The expense ratios presented above may vary from the expense ratios presented in other sections of this report that are based on expenses incurred during the period covered by this report.
Invesco V.I. Global Core Equity Fund, a series portfolio of AIM Variable Insurance Funds (Invesco Variable Insurance Funds), is currently offered through insurance companies issuing variable products. You cannot purchase shares of the Fund directly. Performance figures given represent the Fund and are not intended to reflect actual variable product values. They do not reflect sales charges, expenses and fees assessed in connection with a variable product. Sales charges, expenses and fees, which are determined by the variable product issuers, will vary and will lower the total return.
The most recentmonth-end performance at the Fund level, excluding variable product charges, is available at 800 451 4246. As mentioned above, for the most recent
month-end performance including variable product charges, please contact your variable product issuer or financial adviser.
Fund performance reflects any applicable fee waivers and/or expense reimbursements. Had the adviser not waived fees and/or reimbursed expenses currently or in the past, returns would have been lower. See current prospectus for more information.
Invesco V.I. Global Core Equity Fund
|
Invesco V.I. Global Core Equity Fund’s investment objective is long-term capital appreciation by investing primarily in equity securities of issuers throughout the world, including US issuers. ∎ Unless otherwise stated, information presented in this report is as of December 31, 2019, and is based on total net assets. ∎ Unless otherwise noted, all data provided by Invesco. ∎ To access your Fund’s reports/prospectus, visit invesco.com/fundreports. |
About indexes used in this report
| ∎ | | TheMSCI World IndexSMis an unmanaged index considered representative of stocks of developed countries. The index is computed using the net return, which withholds applicable taxes fornon-resident investors. |
| ∎ | | TheLipper VUF GlobalMulti-Cap Value Funds Classification Averagerepresents an average of all variable insurance underlying funds in the Lipper Global Multi Cap Value Funds classification. |
| ∎ | | The Fund is not managed to track the performance of any particular index, including the index(es) described here, and consequently, the performance of the Fund may deviate significantly from the performance of the index(es). |
| ∎ | | A direct investment cannot be made in an index. Unless otherwise indicated, index results include reinvested dividends, and they do not reflect sales charges. Performance of the peer group, if applicable, reflects fund expenses; performance of a market index does not. |
Other information
| ∎ | | The returns shown in management’s discussion of Fund performance are based on net asset values calculated for shareholder transactions. Generally accepted accounting principles require adjustments to be made to the net assets of the Fund at period end for financial reporting purposes, and as such, the net asset values for shareholder transactions and the returns based on those net asset values may differ from the net asset values and returns reported in the Financial Highlights. Additionally, the returns and net asset values shown throughout this report are at the Fund level only and do not include variable product issuer charges. If such charges were included, the total returns would be lower. |
| ∎ | | Industry classifications used in this report are generally according to the Global Industry Classification Standard, which was developed by and is the exclusive property and a service mark of MSCI Inc. and Standard & Poor’s. |
Invesco V.I. Global Core Equity Fund
Schedule of Investments
December 31, 2019
| | | | | | | | |
| | | Shares | | | Value | |
Common Stocks & Other Equity Interests–99.75% | |
| Australia–1.22% | |
Rio Tinto PLC | | | 14,477 | | | $ | 860,179 | |
| |
|
| Brazil–1.18% | |
Pagseguro Digital Ltd., Class A(a) | | | 24,297 | | | | 829,986 | |
| |
|
| China–0.83% | |
Autohome, Inc., ADR(a) | | | 7,345 | | | | 587,673 | |
| |
|
| Denmark–2.41% | |
AP Moller - Maersk A/S, Class B | | | 405 | | | | 584,395 | |
| |
Novo Nordisk A/S, Class B | | | 19,262 | | | | 1,117,190 | |
| |
| | | | | | | 1,701,585 | |
| |
|
| France–1.10% | |
Airbus SE | | | 5,292 | | | | 776,430 | |
| |
|
| Germany–6.00% | |
Infineon Technologies AG | | | 24,987 | | | | 572,999 | |
| |
KION Group AG | | | 12,765 | | | | 881,398 | |
| |
SAP SE | | | 7,559 | | | | 1,018,725 | |
| |
Siemens AG | | | 13,525 | | | | 1,767,987 | |
| |
| | | | | | | | 4,241,109 | |
|
| Hong Kong–2.25% | |
AIA Group Ltd. | | | 150,800 | | | | 1,586,666 | |
| |
|
| Ireland–0.95% | |
Ryanair Holdings PLC, ADR(a) | | | 7,656 | | | | 670,742 | |
| |
|
| Italy–3.63% | |
Enel S.p.A. | | | 180,932 | | | | 1,439,387 | |
| |
Prysmian S.p.A. | | | 46,708 | | | | 1,125,543 | |
| |
| | | | | | | 2,564,930 | |
| |
|
| Japan–10.89% | |
Asahi Group Holdings Ltd. | | | 33,400 | | | | 1,525,702 | |
| |
FANUC Corp. | | | 2,000 | | | | 369,376 | |
| |
Hitachi Ltd. | | | 31,000 | | | | 1,305,783 | |
| |
KDDI Corp. | | | 48,200 | | | | 1,433,940 | |
| |
Kobe Bussan Co. Ltd. | | | 8,300 | | | | 285,150 | |
| |
Nissan Chemical Corp. | | | 11,900 | | | | 497,483 | |
| |
Shimano, Inc. | | | 7,900 | | | | 1,282,645 | |
| |
SoftBank Group Corp. | | | 22,800 | | | | 992,633 | |
| |
| | | | | | | 7,692,712 | |
| |
Luxembourg–0.58% | |
ArcelorMittal S.A. | | | 23,180 | | | | 409,459 | |
| |
|
| Netherlands–1.32% | |
Heineken N.V. | | | 8,768 | | | | 935,296 | |
| |
|
| Singapore–1.40% | |
DBS Group Holdings Ltd. | | | 51,300 | | | | 988,821 | |
| |
| | | | | | | | |
| | | Shares | | | Value | |
South Korea–0.69% | |
Samsung Electronics Co. Ltd. | | | 10,079 | | | $ | 485,650 | |
| |
|
| Spain–1.19% | |
Bankinter S.A. | | | 114,109 | | | | 838,966 | |
| |
|
| Sweden–1.20% | |
Svenska Handelsbanken AB, Class A | | | 78,964 | | | | 850,230 | |
| |
|
| Taiwan–1.03% | |
Taiwan Semiconductor Manufacturing Co. Ltd. | | | 66,000 | | | | 730,915 | |
| |
|
| United Kingdom–11.46% | |
Experian PLC | | | 16,900 | | | | 571,602 | |
| |
Imperial Brands PLC | | | 58,938 | | | | 1,460,393 | |
| |
Nomad Foods Ltd.(a) | | | 67,831 | | | | 1,517,379 | |
| |
Reckitt Benckiser Group PLC | | | 14,568 | | | | 1,183,009 | |
| |
Royal Dutch Shell PLC, Class A, ADR | | | 32,273 | | | | 1,903,461 | |
| |
St James’s Place PLC | | | 94,112 | | | | 1,456,243 | |
| |
| | | | | | | 8,092,087 | |
| |
|
| United States–50.42% | |
Activision Blizzard, Inc. | | | 12,880 | | | | 765,330 | |
| |
Alphabet, Inc., Class C(a) | | | 2,039 | | | | 2,726,184 | |
| |
American Express Co. | | | 12,762 | | | | 1,588,741 | |
| |
Aptiv PLC | | | 7,112 | | | | 675,427 | |
| |
Biogen, Inc.(a) | | | 2,014 | | | | 597,614 | |
| |
BioMarin Pharmaceutical, Inc.(a) | | | 7,875 | | | | 665,831 | |
| |
Booking Holdings, Inc.(a) | | | 438 | | | | 899,534 | |
| |
Carnival Corp. | | | 25,648 | | | | 1,303,688 | |
| |
Chevron Corp. | | | 14,063 | | | | 1,694,732 | |
| |
Comcast Corp., Class A | | | 29,574 | | | | 1,329,943 | |
| |
Delta Air Lines, Inc. | | | 14,196 | | | | 830,182 | |
| |
EPAM Systems, Inc.(a) | | | 4,619 | | | | 979,967 | |
| |
Facebook, Inc., Class A(a) | | | 5,832 | | | | 1,197,018 | |
| |
FedEx Corp. | | | 3,194 | | | | 482,965 | |
| |
First Republic Bank | | | 12,871 | | | | 1,511,699 | |
| |
Globus Medical, Inc., Class A(a) | | | 19,629 | | | | 1,155,755 | |
| |
HCA Healthcare, Inc. | | | 6,358 | | | | 939,776 | |
| |
James Hardie Industries PLC, CDI | | | 52,239 | | | | 1,024,162 | |
| |
Marsh & McLennan Cos., Inc. | | | 8,882 | | | | 989,544 | |
| |
Mastercard, Inc., Class A | | | 2,556 | | | | 763,196 | |
| |
Moody’s Corp. | | | 2,816 | | | | 668,547 | |
| |
NIKE, Inc., Class B | | | 6,919 | | | | 700,964 | |
| |
Norfolk Southern Corp. | | | 2,760 | | | | 535,799 | |
| |
Northrop Grumman Corp. | | | 1,315 | | | | 452,320 | |
| |
PepsiCo., Inc. | | | 10,522 | | | | 1,438,042 | |
| |
Progressive Corp. (The) | | | 9,557 | | | | 691,831 | |
| |
salesforce.com, inc.(a) | | | 8,750 | | | | 1,423,100 | |
| |
Samsonite International S.A.(b) | | | 304,200 | | | | 728,773 | |
| |
Texas Instruments, Inc. | | | 7,370 | | | | 945,497 | |
| |
U.S. Bancorp | | | 18,125 | | | | 1,074,631 | |
| |
See accompanying Notes to Financial Statements which are an integral part of the financial statements.
Invesco V.I. Global Core Equity Fund
| | | | | | | | |
| | | Shares | | | Value | |
| |
|
| United States–(continued) | |
United Technologies Corp. | | | 7,659 | | | $ | 1,147,012 | |
| |
Verizon Communications, Inc. | | | 20,528 | | | | 1,260,419 | |
| |
Wynn Resorts Ltd. | | | 11,607 | | | | 1,611,864 | |
| |
Zimmer Biomet Holdings, Inc. | | | 5,446 | | | | 815,157 | |
| |
| | | | | | | 35,615,244 | |
| |
Total Common Stocks & Other Equity Interests
(Cost $56,322,453) | | | | 70,458,680 | |
| |
|
| Money Market Funds–0.19% | |
Invesco Government & Agency Portfolio, Institutional
Class, 1.50%(c) | | | 40,649 | | | | 40,649 | |
| |
| | | | | | | | |
| | | Shares | | | Value | |
| |
|
| Money Market Funds–(continued) | |
Invesco Liquid Assets Portfolio, Institutional Class, 1.71%(c) | | | 47,369 | | | $ | 47,383 | |
| |
Invesco Treasury Portfolio, Institutional Class, 1.49%(c) | | | 46,456 | | | | 46,456 | |
| |
Total Money Market Funds
(Cost $134,488) | | | | | | | 134,488 | |
| |
TOTAL INVESTMENTS IN SECURITIES–99.94%
(Cost $56,456,941) | | | | | | | 70,593,168 | |
| |
OTHER ASSETS LESS LIABILITIES–0.06% | | | | 45,636 | |
| |
NET ASSETS–100.00% | | | | | | $ | 70,638,804 | |
| |
Investment Abbreviations:
ADR - American Depositary Receipt
CDI - CREST Depository Interest
Notes to Schedule of Investments:
| (a) | Non-income producing security. |
| (b) | Security purchased or received in a transaction exempt from registration under the Securities Act of 1933, as amended (the “1933 Act”). The security may be resold pursuant to an exemption from registration under the 1933 Act, typically to qualified institutional buyers. The value of this security at December 31, 2019 represented 1.03% of the Fund’s Net Assets. |
| (c) | The money market fund and the Fund are affiliated by having the same investment adviser. The rate shown is the7-day SEC standardized yield as of December 31, 2019. |
| | | | | | | | | | | | | | |
Open Forward Foreign Currency Contracts | |
| |
| | | | |
Settlement
Date | | | | | | Contract to | | | Unrealized
Appreciation | |
| | | | | | | |
| | Counterparty | | | | Deliver | | Receive | |
| |
Currency Risk | | | | | |
| |
02/14/2020 | | Royal Bank of Canada | | | | JPY 202,000,000 | | | USD 1,869,429 | | | | $6,462 | |
| |
Abbreviations:
|
JPY - Japanese Yen |
USD - U.S. Dollar |
See accompanying Notes to Financial Statements which are an integral part of the financial statements.
Invesco V.I. Global Core Equity Fund
Statement of Assets and Liabilities
December 31, 2019
| | | | |
| |
Assets: | | | | |
Investments in securities, at value
(Cost $56,322,453) | | $ | 70,458,680 | |
| |
Investments in affiliated money market funds, at value
(Cost $134,488) | | | 134,488 | |
| |
Other investments: | | | | |
Unrealized appreciation on forward foreign currency contracts outstanding | | | 6,462 | |
| |
Foreign currencies, at value (Cost $100,123) | | | 100,722 | |
| |
Receivable for: | | | | |
Fund shares sold | | | 7,440 | |
| |
Dividends | | | 66,505 | |
| |
Investment for trustee deferred compensation and retirement plans | | | 45,359 | |
| |
Total assets | | | 70,819,656 | |
| |
| |
Liabilities: | | | | |
Payable for: | | | | |
Fund shares reacquired | | | 23,544 | |
| |
Amount due custodian | | | 25,146 | |
| |
Accrued fees to affiliates | | | 35,879 | |
| |
Accrued other operating expenses | | | 48,362 | |
| |
Trustee deferred compensation and retirement plans | | | 47,921 | |
| |
Total liabilities | | | 180,852 | |
| |
Net assets applicable to shares outstanding | | $ | 70,638,804 | |
| |
| |
Net assets consist of: | | | | |
Shares of beneficial interest | | $ | 57,032,573 | |
| |
Distributable earnings | | | 13,606,231 | |
| |
| | $ | 70,638,804 | |
| |
| |
Net Assets: | | | | |
Series I | | $ | 60,078,159 | |
| |
Series II | | $ | 10,560,645 | |
| |
|
Shares outstanding, no par value, with an unlimited number of shares authorized: | |
Series I | | | 5,846,471 | |
| |
Series II | | | 1,027,014 | |
| |
Series I: | | | | |
Net asset value per share | | $ | 10.28 | |
| |
Series II: | | | | |
Net asset value per share | | $ | 10.28 | |
| |
Statement of Operations
For the year ended December 31, 2019
| | | | |
| |
Investment income: | | | | |
Dividends (net of foreign withholding taxes of $110,511) | | $ | 1,745,484 | |
| |
Dividends from affiliated money market funds (includes securities lending income of $270) | | | 5,182 | |
| |
Total investment income | | | 1,750,666 | |
| |
| |
Expenses: | | | | |
Advisory fees | | | 460,556 | |
| |
Administrative services fees | | | 114,556 | |
| |
Custodian fees | | | 11,449 | |
| |
Distribution fees - Series II | | | 25,884 | |
| |
Transfer agent fees | | | 13,007 | |
| |
Trustees’ and officers’ fees and benefits | | | 19,328 | |
| |
Reports to shareholders | | | 13,377 | |
| |
Professional services fees | | | 56,366 | |
| |
Other | | | 7,015 | |
| |
Total expenses | | | 721,538 | |
| |
Less: Fees waived | | | (293 | ) |
| |
Net expenses | | | 721,245 | |
| |
Net investment income | | | 1,029,421 | |
| |
| |
Realized and unrealized gain (loss) from: | | | | |
Net realized gain (loss) from: | | | | |
Investment securities | | | (1,278,217 | ) |
| |
Foreign currencies | | | (3,784 | ) |
| |
Forward foreign currency contracts | | | (17,674 | ) |
| |
| | | (1,299,675 | ) |
| |
Change in net unrealized appreciation of: | | | | |
Investment securities | | | 15,521,127 | |
| |
Foreign currencies | | | 683 | |
| |
Forward foreign currency contracts | | | 53,972 | |
| |
| | | 15,575,782 | |
| |
Net realized and unrealized gain | | | 14,276,107 | |
| |
Net increase in net assets resulting from operations | | $ | 15,305,528 | |
| |
See accompanying Notes to Financial Statements which are an integral part of the financial statements.
Invesco V.I. Global Core Equity Fund
Statement of Changes in Net Assets
For the years ended December 31, 2019 and 2018
| | | | | | | | |
| | | 2019 | | | 2018 | |
| |
| | |
Operations: | | | | | | | | |
Net investment income | | $ | 1,029,421 | | | $ | 922,275 | |
| |
Net realized gain (loss) | | | (1,299,675 | ) | | | 4,749,812 | |
| |
Change in net unrealized appreciation (depreciation) | | | 15,575,782 | | | | (17,548,034 | ) |
| |
Net increase (decrease) in net assets resulting from operations | | | 15,305,528 | | | | (11,875,947 | ) |
| |
| | |
Distributions to shareholders from distributable earnings: | | | | | | | | |
Series I | | | (4,858,170 | ) | | | (726,931 | ) |
| |
Series II | | | (849,972 | ) | | | (93,313 | ) |
| |
Total distributions from distributable earnings | | | (5,708,142 | ) | | | (820,244 | ) |
| |
| | |
Share transactions–net: | | | | | | | | |
Series I | | | (2,943,770 | ) | | | (8,045,844 | ) |
| |
Series II | | | (484,443 | ) | | | (1,547,564 | ) |
| |
Net increase (decrease) in net assets resulting from share transactions | | | (3,428,213 | ) | | | (9,593,408 | ) |
| |
Net increase (decrease) in net assets | | | 6,169,173 | | | | (22,289,599 | ) |
| |
| | |
Net assets: | | | | | | | | |
Beginning of year | | | 64,469,631 | | | | 86,759,230 | |
| |
End of year | | $ | 70,638,804 | | | $ | 64,469,631 | |
| |
See accompanying Notes to Financial Statements which are an integral part of the financial statements.
Invesco V.I. Global Core Equity Fund
Financial Highlights
The following schedule presents financial highlights for a share of the Fund outstanding throughout the periods indicated.
| | | | | | | | | | | | | | | | | | | | | | | | | | | | | | | | | | | | | | | | | | | | | | | | | | | | | | | | |
| | | Net asset
value,
beginning
of period | | | Net investment
income(a) | | | Net gains
(losses)
on securities
(both realized and unrealized) | | | Total from
investment operations | | | Dividends from net investment income | | | Distributions from net realized
gains | | | Total
distributions | | | Net asset
value, end of period | | | Total
return (b) | | | Net assets,
end of period (000’s omitted) | | | Ratio of
expenses
to average
net assets
with fee waivers
and/or
expenses
absorbed | | | Ratio of
expenses
to average net
assets without fee waivers
and/or
expenses
absorbed | | | Ratio of net investment
income
to average
net assets | | | Portfolio turnover (c) | |
Series I | | | | | | | | | | | | | | | | | | | | | | | | | | | | | | | | | | | | | | | | | | | | | | | | | | | | | | | | |
Year ended 12/31/19 | | $ | 8.99 | | | $ | 0.15 | | | $ | 2.03 | | | $ | 2.18 | | | $ | (0.15 | ) | | $ | (0.74 | ) | | $ | (0.89 | ) | | $ | 10.28 | | | | 25.20 | % | | $ | 60,078 | | | | 1.01 | %(d) | | | 1.01 | %(d) | | | 1.54 | %(d) | | | 24 | % |
Year ended 12/31/18 | | | 10.73 | | | | 0.13 | | | | (1.76 | ) | | | (1.63 | ) | | | (0.11 | ) | | | – | | | | (0.11 | ) | | | 8.99 | | | | (15.32 | ) | | | 54,854 | | | | 1.02 | | | | 1.02 | | | | 1.19 | | | | 26 | |
Year ended 12/31/17 | | | 8.83 | | | | 0.09 | | | | 1.93 | | | | 2.02 | | | | (0.12 | ) | | | – | | | | (0.12 | ) | | | 10.73 | | | | 22.90 | | | | 73,716 | | | | 1.04 | | | | 1.04 | | | | 0.95 | | | | 69 | |
Year ended 12/31/16 | | | 8.35 | | | | 0.10 | | | | 0.47 | | | | 0.57 | | | | (0.09 | ) | | | – | | | | (0.09 | ) | | | 8.83 | | | | 6.81 | | | | 62,130 | | | | 1.05 | | | | 1.05 | | | | 1.14 | | | | 47 | |
Year ended 12/31/15 | | | 8.94 | | | | 0.09 | | | | (0.23 | ) | | | (0.14 | ) | | | (0.13 | ) | | | (0.32 | ) | | | (0.45 | ) | | | 8.35 | | | | (1.42 | ) | | | 65,167 | | | | 1.06 | | | | 1.06 | | | | 0.98 | | | | 75 | |
| |
Series II | | | | | | | | | | | | | | | | | | | | | | | | | | | | | | | | | | | | | | | | | | | | | | | | | | | | | | | | |
Year ended 12/31/19 | | | 8.99 | | | | 0.13 | | | | 2.02 | | | | 2.15 | | | | (0.12 | ) | | | (0.74 | ) | | | (0.86 | ) | | | 10.28 | | | | 24.82 | | | | 10,561 | | | | 1.26 | (d) | | | 1.26 | (d) | | | 1.29 | (d) | | | 24 | |
Year ended 12/31/18 | | | 10.73 | | | | 0.10 | | | | (1.75 | ) | | | (1.65 | ) | | | (0.09 | ) | | | – | | | | (0.09 | ) | | | 8.99 | | | | (15.54 | ) | | | 9,616 | | | | 1.27 | | | | 1.27 | | | | 0.94 | | | | 26 | |
Year ended 12/31/17 | | | 8.83 | | | | 0.07 | | | | 1.92 | | | | 1.99 | | | | (0.09 | ) | | | – | | | | (0.09 | ) | | | 10.73 | | | | 22.60 | | | | 13,043 | | | | 1.29 | | | | 1.29 | | | | 0.70 | | | | 69 | |
Year ended 12/31/16 | | | 8.35 | | | | 0.07 | | | | 0.47 | | | | 0.54 | | | | (0.06 | ) | | | – | | | | (0.06 | ) | | | 8.83 | | | | 6.50 | | | | 12,302 | | | | 1.30 | | | | 1.30 | | | | 0.89 | | | | 47 | |
Year ended 12/31/15 | | | 8.93 | | | | 0.07 | | | | (0.23 | ) | | | (0.16 | ) | | | (0.10 | ) | | | (0.32 | ) | | | (0.42 | ) | | | 8.35 | | | | (1.65 | ) | | | 13,286 | | | | 1.31 | | | | 1.31 | | | | 0.73 | | | | 75 | |
| |
| (a) | Calculated using average shares outstanding. |
| (b) | Includes adjustments in accordance with accounting principles generally accepted in the United States of America and as such, the net asset value for financial reporting purposes and the returns based upon those net asset values may differ from the net asset value and returns for shareholder transactions. Total returns are not annualized for periods less than one year, if applicable, and do not reflect charges assessed in connection with a variable product, which if included would reduce total returns. |
| (c) | Portfolio turnover is calculated at the fund level and is not annualized for periods less than one year, if applicable. |
| (d) | Ratios are based on average daily net assets (000’s omitted) of $58,379 and $10,361 for Series I and Series II shares, respectively. |
See accompanying Notes to Financial Statements which are an integral part of the financial statements.
Invesco V.I. Global Core Equity Fund
Notes to Financial Statements
December 31, 2019
NOTE 1–Significant Accounting Policies
Invesco V.I. Global Core Equity Fund (the “Fund”) is a series portfolio of AIM Variable Insurance Funds (Invesco Variable Insurance Funds) (the “Trust”). The Trust is a Delaware statutory trust registered under the Investment Company Act of 1940, as amended (the “1940 Act”), as anopen-end series management investment company. Information presented in these financial statements pertains only to the Fund. Matters affecting the Fund or each class will be voted on exclusively by the shareholders of the Fund or each class. Current Securities and Exchange Commission (“SEC”) guidance, however, requires participating insurance companies offering separate accounts to vote shares proportionally in accordance with the instructions of the contract owners whose investments are funded by shares of each Fund or class.
The Fund’s investment objective is long-term capital appreciation by investing primarily in equity securities of issuers throughout the world, including U.S. issuers.
The Fund currently offers two classes of shares, Series I and Series II, both of which are offered to insurance company separate accounts funding variable annuity contracts and variable life insurance policies (“variable products”).
The Fund is an investment company and accordingly follows the investment company accounting and reporting guidance in accordance with Financial Accounting Standards Board Accounting Standards Codification Topic 946,Financial Services – Investment Companies.
The following is a summary of the significant accounting policies followed by the Fund in the preparation of its financial statements.
A. Security Valuations–Securities, including restricted securities, are valued according to the following policy.
A security listed or traded on an exchange (except convertible securities) is valued at its last sales price or official closing price as of the close of the customary trading session on the exchange where the security is principally traded, or lacking any sales or official closing price on a particular day, the security may be valued at the closing bid price on that day. Securities traded in theover-the-counter market are valued based on prices furnished by independent pricing services or market makers. When such securities are valued by an independent pricing service they may be considered fair valued. Futures contracts are valued at the final settlement price set by an exchange on which they are principally traded. Listed options are valued at the mean between the last bid and asked prices from the exchange on which they are principally traded. Options not listed on an exchange are valued by an independent source at the mean between the last bid and asked prices. For purposes of determining net asset value (“NAV”) per share, futures and option contracts generally are valued 15 minutes after the close of the customary trading session of the New York Stock Exchange (“NYSE”).
Investments inopen-end andclosed-end registered investment companies that do not trade on an exchange are valued at theend-of-day net asset value per share. Investments inopen-end andclosed-end registered investment companies that trade on an exchange are valued at the last sales price or official closing price as of the close of the customary trading session on the exchange where the security is principally traded.
Debt obligations (including convertible securities) and unlisted equities are fair valued using an evaluated quote provided by an independent pricing service. Evaluated quotes provided by the pricing service may be determined without exclusive reliance on quoted prices, and may reflect appropriate factors such asinstitution-size trading in similar groups of securities, developments related to specific securities, dividend rate (for unlisted equities), yield (for debt obligations), quality, type of issue, coupon rate (for debt obligations), maturity (for debt obligations), individual trading characteristics and other market data. Pricing services generally value debt obligations assuming orderly transactions of institutional round lot size, but a fund may hold or transact in the same securities in smaller, odd lot sizes. Odd lots often trade at lower prices than institutional round lots. Debt obligations are subject to interest rate and credit risks. In addition, all debt obligations involve some risk of default with respect to interest and/or principal payments.
Foreign securities’ (including foreign exchange contracts) prices are converted into U.S. dollar amounts using the applicable exchange rates as of the close of the NYSE. If market quotations are available and reliable for foreign exchange-traded equity securities, the securities will be valued at the market quotations. Because trading hours for certain foreign securities end before the close of the NYSE, closing market quotations may become unreliable. If between the time trading ends on a particular security and the close of the customary trading session on the NYSE, events occur that the investment adviser determines are significant and make the closing price unreliable, the Fund may fair value the security. If the event is likely to have affected the closing price of the security, the security will be valued at fair value in good faith using procedures approved by the Board of Trustees. Adjustments to closing prices to reflect fair value may also be based on a screening process of an independent pricing service to indicate the degree of certainty, based on historical data, that the closing price in the principal market where a foreign security trades is not the current value as of the close of the NYSE. Foreign securities’ prices meeting the approved degree of certainty that the price is not reflective of current value will be priced at the indication of fair value from the independent pricing service. Multiple factors may be considered by the independent pricing service in determining adjustments to reflect fair value and may include information relating to sector indices, American Depositary Receipts and domestic and foreign index futures. Foreign securities may have additional risks including exchange rate changes, potential for sharply devalued currencies and high inflation, political and economic upheaval, the relative lack of issuer information, relatively low market liquidity and the potential lack of strict financial and accounting controls and standards.
Securities for which market prices are not provided by any of the above methods may be valued based upon quotes furnished by independent sources. The last bid price may be used to value equity securities. The mean between the last bid and asked prices is used to value debt obligations, including corporate loans.
Securities for which market quotations are not readily available or became unreliable are valued at fair value as determined in good faith by or under the supervision of the Trust’s officers following procedures approved by the Board of Trustees. Issuer specific events, market trends, bid/asked quotes of brokers and information providers and other market data may be reviewed in the course of making a good faith determination of a security’s fair value.
The Fund may invest in securities that are subject to interest rate risk, meaning the risk that the prices will generally fall as interest rates rise and, conversely, the prices will generally rise as interest rates fall. Specific securities differ in their sensitivity to changes in interest rates depending on their individual characteristics. Changes in interest rates may result in increased market volatility, which may affect the value and/or liquidity of certain Fund investments.
Invesco V.I. Global Core Equity Fund
Valuations change in response to many factors including the historical and prospective earnings of the issuer, the value of the issuer’s assets, general economic conditions, interest rates, investor perceptions and market liquidity. Because of the inherent uncertainties of valuation, the values reflected in the financial statements may materially differ from the value received upon actual sale of those investments.
| B. | Securities Transactions and Investment Income– Securities transactions are accounted for on a trade date basis. Realized gains or losses on sales are computed on the basis of specific identification of the securities sold. Interest income (net of withholding tax, if any) is recorded on the accrual basis from settlement date. Dividend income (net of withholding tax, if any) is recorded on theex-dividend date. |
The Fund may periodically participate in litigation related to Fund investments. As such, the Fund may receive proceeds from litigation settlements. Any proceeds received are included in the Statement of Operations as realized gain (loss) for investments no longer held and as unrealized gain (loss) for investments still held.
Brokerage commissions and mark ups are considered transaction costs and are recorded as an increase to the cost basis of securities purchased and/or a reduction of proceeds on a sale of securities. Such transaction costs are included in the determination of net realized and unrealized gain (loss) from investment securities reported in the Statement of Operations and the Statement of Changes in Net Assets and the net realized and unrealized gains (losses) on securities per share in the Financial Highlights. Transaction costs are included in the calculation of the Fund’s net asset value and, accordingly, they reduce the Fund’s total returns. These transaction costs are not considered operating expenses and are not reflected in net investment income reported in the Statement of Operations and the Statement of Changes in Net Assets, or the net investment income per share and the ratios of expenses and net investment income reported in the Financial Highlights, nor are they limited by any expense limitation arrangements between the Fund and the investment adviser.
The Fund allocates income and realized and unrealized capital gains and losses to a class based on the relative net assets of each class.
| C. | Country Determination– For the purposes of making investment selection decisions and presentation in the Schedule of Investments, the investment adviser may determine the country in which an issuer is located and/or credit risk exposure based on various factors. These factors include the laws of the country under which the issuer is organized, where the issuer maintains a principal office, the country in which the issuer derives 50% or more of its total revenues and the country that has the primary market for the issuer’s securities, as well as other criteria. Among the other criteria that may be evaluated for making this determination are the country in which the issuer maintains 50% or more of its assets, the type of security, financial guarantees and enhancements, the nature of the collateral and the sponsor organization. Country of issuer and/or credit risk exposure has been determined to be the United States of America, unless otherwise noted. |
| D. | Distributions– Distributions from net investment income and net realized capital gain, if any, are generally declared and paid to separate accounts of participating insurance companies annually and recorded on theex-dividend date. |
| E. | Federal Income Taxes –The Fund intends to comply with the requirements of Subchapter M of the Internal Revenue Code of 1986, as amended (the “Internal Revenue Code”), necessary to qualify as a regulated investment company and to distribute substantially all of the Fund’s taxable earnings to shareholders. As such, the Fund will not be subject to federal income taxes on otherwise taxable income (including net realized capital gain) that is distributed to shareholders. Therefore, no provision for federal income taxes is recorded in the financial statements. |
The Fund recognizes the tax benefits of uncertain tax positions only when the position is more likely than not to be sustained. Management has analyzed the Fund’s uncertain tax positions and concluded that no liability for unrecognized tax benefits should be recorded related to uncertain tax positions. Management is not aware of any tax positions for which it is reasonably possible that the total amounts of unrecognized tax benefits will change materially in the next 12 months.
The Fund files tax returns in the U.S. Federal jurisdiction and certain other jurisdictions. Generally, the Fund is subject to examinations by such taxing authorities for up to three years after the filing of the return for the tax period.
| F. | Expenses– Fees provided for under the Rule12b-1 plan of a particular class of the Fund and which are directly attributable to that class are charged to the operations of such class. All other expenses are allocated among the classes based on relative net assets. |
| G. | Accounting Estimates –The preparation of financial statements in conformity with accounting principles generally accepted in the United States of America (“GAAP”) requires management to make estimates and assumptions that affect the reported amounts of assets and liabilities at the date of the financial statements and the reported amounts of revenues and expenses during the reporting period including estimates and assumptions related to taxation. Actual results could differ from those estimates by a significant amount. In addition, the Fund monitors for material events or transactions that may occur or become known after theperiod-end date and before the date the financial statements are released to print. |
| H. | Indemnifications– Under the Trust’s organizational documents, each Trustee, officer, employee or other agent of the Trust is indemnified against certain liabilities that may arise out of the performance of their duties to the Fund. Additionally, in the normal course of business, the Fund enters into contracts, including the Fund’s servicing agreements, that contain a variety of indemnification clauses. The Fund’s maximum exposure under these arrangements is unknown as this would involve future claims that may be made against the Fund that have not yet occurred. The risk of material loss as a result of such indemnification claims is considered remote. |
| I. | Securities Lending– The Fund may lend portfolio securities having a market value up toone-third of the Fund’s total assets. Such loans are secured by collateral equal to no less than the market value of the loaned securities determined daily by the securities lending provider. Such collateral will be cash or debt securities issued or guaranteed by the U.S. Government or any of its sponsored agencies. Cash collateral received in connection with these loans is invested in short-term money market instruments or affiliated money market funds and is shown as such on the Schedule of Investments. The Fund bears the risk of loss with respect to the investment of collateral. It is the Fund’s policy to obtain additional collateral from or return excess collateral to the borrower by the end of the next business day, following the valuation date of the securities loaned. Therefore, the value of the collateral held may be temporarily less than the value of the securities on loan. When loaning securities, the Fund retains certain benefits of owning the securities, including the economic equivalent of dividends or interest generated by the security. Lending securities entails a risk of loss to the Fund if, and to the extent that, the market value of the securities loaned were to increase and the borrower did not increase the collateral accordingly, and the borrower failed to return the securities. The securities loaned are subject to termination at the option of the borrower or the Fund. Upon termination, the borrower will return to the Fund the securities loaned and the Fund will return the collateral. Upon the failure of the borrower to return the securities, collateral may be liquidated and the securities may be purchased on the open market to replace the loaned securities. The Fund could experience delays and costs in gaining access to the collateral and the securities may lose value during the delay which could result in potential losses to the Fund. Some of these losses may be indemnified by the lending agent. The Fund bears the risk of any deficiency in the amount of the collateral available for return to the borrower due to any loss on the |
Invesco V.I. Global Core Equity Fund
collateral invested. Dividends received on cash collateral investments for securities lending transactions, which are net of compensation to counterparties, are included inDividends from affiliated money market funds on the Statement of Operations. The aggregate value of securities out on loan, if any, is shown as a footnote on the Statement of Assets and Liabilities.
| J. | Foreign Currency Translations– Foreign currency is valued at the close of the NYSE based on quotations posted by banks and major currency dealers. Portfolio securities and other assets and liabilities denominated in foreign currencies are translated into U.S. dollar amounts at the date of valuation. Purchases and sales of portfolio securities (net of foreign taxes withheld on disposition) and income items denominated in foreign currencies are translated into U.S. dollar amounts on the respective dates of such transactions. The Fund does not separately account for the portion of the results of operations resulting from changes in foreign exchange rates on investments and the fluctuations arising from changes in market prices of securities held. The combined results of changes in foreign exchange rates and the fluctuation of market prices on investments (net of estimated foreign tax withholding) are included with the net realized and unrealized gain or loss from investments in the Statement of Operations. Reported net realized foreign currency gains or losses arise from (1) sales of foreign currencies, (2) currency gains or losses realized between the trade and settlement dates on securities transactions, and (3) the difference between the amounts of dividends, interest, and foreign withholding taxes recorded on the Fund’s books and the U.S. dollar equivalent of the amounts actually received or paid. Net unrealized foreign currency gains and losses arise from changes in the fair values of assets and liabilities, other than investments in securities at fiscal period end, resulting from changes in exchange rates. |
The Fund may invest in foreign securities, which may be subject to foreign taxes on income, gains on investments or currency repatriation, a portion of which may be recoverable. Foreign taxes, if any, are recorded based on the tax regulations and rates that exist in the foreign markets in which the Fund invests and are shown in the Statement of Operations.
| K. | Forward Foreign Currency Contracts– The Fund may engage in foreign currency transactions either on a spot (i.e. for prompt delivery and settlement) basis, or through forward foreign currency contracts, to manage or minimize currency or exchange rate risk. |
The Fund may also enter into forward foreign currency contracts for the purchase or sale of a security denominated in a foreign currency in order to “lock in” the U.S. dollar price of that security, or the Fund may also enter into forward foreign currency contracts that do not provide for physical settlement of the two currencies, but instead are settled by a single cash payment calculated as the difference between the agreed upon exchange rate and the spot rate at settlement based upon an agreed upon notional amount(non-deliverable forwards). The Fund will set aside liquid assets in an amount equal to the dailymark-to-market obligation for forward foreign currency contracts.
A forward foreign currency contract is an obligation between two parties (“Counterparties”) to purchase or sell a specific currency for an agreed-upon price at a future date. The use of forward foreign currency contracts does not eliminate fluctuations in the price of the underlying securities the Fund owns or intends to acquire but establishes a rate of exchange in advance. Fluctuations in the value of these contracts are measured by the difference in the contract date and reporting date exchange rates and are recorded as unrealized appreciation (depreciation) until the contracts are closed. When the contracts are closed, realized gains (losses) are recorded. Realized and unrealized gains (losses) on the contracts are included in the Statement of Operations. The primary risks associated with forward foreign currency contracts include failure of the Counterparty to meet the terms of the contract and the value of the foreign currency changing unfavorably. These risks may be in excess of the amounts reflected in the Statement of Assets and Liabilities.
NOTE 2–Advisory Fees and Other Fees Paid to Affiliates
The Trust has entered into a master investment advisory agreement with Invesco Advisers, Inc. (the “Adviser” or “Invesco”). Under the terms of the investment advisory agreement, the Fund accrues daily and pays monthly an advisory fee to the Adviser based on the annual rate of the Fund’s average daily net assets as follows:
| | | | |
| Average Daily Net Assets | | Rate | |
| |
| |
First $1 billion | | | 0.670% | |
| |
| |
Next $ 500 million | | | 0.645% | |
| |
| |
Next $ 1 billion | | | 0.620% | |
| |
| |
Next $ 1 billion | | | 0.595% | |
| |
| |
Next $ 1 billion | | | 0.570% | |
| |
| |
Over $4.5 billion | | | 0.545% | |
| |
For the year ended December 31, 2019, the effective advisory fee rate incurred by the Fund was 0.67%.
Under the terms of a mastersub-advisory agreement between the Adviser and each of Invesco Asset Management Deutschland GmbH, Invesco Asset Management Limited, Invesco Asset Management (Japan) Limited, Invesco Hong Kong Limited, Invesco Senior Secured Management, Inc. and Invesco Canada Ltd. (collectively, the “AffiliatedSub-Advisers”) the Adviser, not the Fund, will pay 40% of the fees paid to the Adviser to any such AffiliatedSub-Adviser(s) that provide(s) discretionary investment management services to the Fund based on the percentage of assets allocated to such AffiliatedSub-Adviser(s).
The Adviser has contractually agreed, through at least June 30, 2020, to waive advisory fees and/or reimburse expenses of all shares to the extent necessary to limit total annual fund operating expenses after fee waiver and/or expense reimbursement (excluding certain items discussed below) of Series I shares to 2.25% and Series II shares to 2.50% of average daily net assets (the “expense limits”). In determining the Adviser’s obligation to waive advisory fees and/or reimburse expenses, the following expenses are not taken into account, and could cause the total annual fund operating expenses after fee waiver and/or expense reimbursement to exceed the numbers reflected above: (1) interest; (2) taxes; (3) dividend expense on short sales; (4) extraordinary ornon-routine items, including litigation expenses; and (5) expenses that the Fund has incurred but did not actually pay because of an expense offset arrangement. Unless Invesco continues the fee waiver agreement, it will terminate on June 30, 2020. During its term, the fee waiver agreement cannot be terminated or amended to increase the expense limits or reduce the advisory fee waiver without approval of the Board of Trustees. The Adviser did not waive fees and/or reimburse expenses during the period under these expense limits.
Invesco V.I. Global Core Equity Fund
Further, the Adviser has contractually agreed, through at least June 30, 2021, to waive the advisory fee payable by the Fund in an amount equal to 100% of the net advisory fees the Adviser receives from the affiliated money market funds on investments by the Fund of uninvested cash in such affiliated money market funds.
For the year ended December 31, 2019, the Adviser waived advisory fees of $293.
The Trust has entered into a master administrative services agreement with Invesco pursuant to which the Fund has agreed to pay Invesco a fee for costs incurred in providing accounting services and fund administrative services to the Fund and to reimburse Invesco for fees paid to insurance companies that have agreed to provide certain administrative services to the Fund. These administrative services provided by the insurance companies may include, among other things: maintenance of master accounts with the Fund; tracking, recording and transmitting net purchase and redemption orders for Fund shares; maintaining and preserving records related to the purchase, redemption and other account activity of variable product owners; distributing copies of Fund documents such as prospectuses, proxy materials and periodic reports, to variable product owners, and responding to inquiries from variable product owners about the Fund. Pursuant to such agreement, for the year ended December 31, 2019, Invesco was paid $9,828 for accounting and fund administrative services and was reimbursed $104,728 for fees paid to insurance companies. Invesco has entered into asub-administration agreement whereby State Street Bank and Trust Company (“SSB”) serves as fund accountant and provides certain administrative services to the Fund. Pursuant to a custody agreement with the Trust on behalf of the Fund, SSB also serves as the Fund’s custodian.
The Trust has entered into a transfer agency and service agreement with Invesco Investment Services, Inc. (“IIS”) pursuant to which the Fund has agreed to pay IIS a fee for providing transfer agency and shareholder services to the Fund and reimburse IIS for certain expenses incurred by IIS in the course of providing such services. For the year ended December 31, 2019, expenses incurred under the agreement are shown in the Statement of Operations asTransfer agent fees.
The Trust has entered into a master distribution agreement with Invesco Distributors, Inc. (“IDI”) to serve as the distributor for the Fund. The Trust has adopted a plan pursuant to Rule12b-1 under the 1940 Act with respect to the Fund’s Series II shares (the “Plan”). The Fund, pursuant to the Plan, pays IDI compensation at the annual rate of 0.25% of the Fund’s average daily net assets of Series II shares. The fees are accrued daily and paid monthly. Of the Plan payments, up to 0.25% of the average daily net assets of the Series II shares may be paid to insurance companies who furnish continuing personal shareholder services to customers who purchase and own Series II shares of the Fund. For the year ended December 31, 2019, expenses incurred under the Plan are detailed in the Statement of Operations asDistribution fees.
Certain officers and trustees of the Trust are officers and directors of the Adviser, IIS and/or IDI.
NOTE 3–Additional Valuation Information
GAAP defines fair value as the price that would be received to sell an asset or paid to transfer a liability in an orderly transaction between market participants at the measurement date, under current market conditions. GAAP establishes a hierarchy that prioritizes the inputs to valuation methods, giving the highest priority to readily available unadjusted quoted prices in an active market for identical assets (Level 1) and the lowest priority to significant unobservable inputs (Level 3), generally when market prices are not readily available or are unreliable. Based on the valuation inputs, the securities or other investments are tiered into one of three levels. Changes in valuation methods may result in transfers in or out of an investment’s assigned level:
| | Level 1 – | Prices are determined using quoted prices in an active market for identical assets. |
| | Level 2 – | Prices are determined using other significant observable inputs. Observable inputs are inputs that other market participants may use in pricing a security. These may include quoted prices for similar securities, interest rates, prepayment speeds, credit risk, yield curves, loss severities, default rates, discount rates, volatilities and others. |
| | Level 3 – | Prices are determined using significant unobservable inputs. In situations where quoted prices or observable inputs are unavailable (for example, when there is little or no market activity for an investment at the end of the period), unobservable inputs may be used. Unobservable inputs reflect the Fund’s own assumptions about the factors market participants would use in determining fair value of the securities or instruments and would be based on the best available information. |
The following is a summary of the tiered valuation input levels, as of December 31, 2019. The level assigned to the securities valuations may not be an indication of the risk or liquidity associated with investing in those securities. Because of the inherent uncertainties of valuation, the values reflected in the financial statements may materially differ from the value received upon actual sale of those investments.
Invesco V.I. Global Core Equity Fund
| | | | | | | | | | | | | | | | |
| | | Level 1 | | | Level 2 | | | Level 3 | | | Total | |
| |
Investments in Securities | | | | | | | | | | | | | | | | |
| |
| | | | |
Australia | | $ | – | | | $ | 860,179 | | | $ | – | | | $ | 860,179 | |
| |
| | | | |
Brazil | | | 829,986 | | | | – | | | | – | | | | 829,986 | |
| |
| | | | |
China | | | 587,673 | | | | – | | | | – | | | | 587,673 | |
| |
| | | | |
Denmark | | | – | | | | 1,701,585 | | | | – | | | | 1,701,585 | |
| |
| | | | |
France | | | – | | | | 776,430 | | | | – | | | | 776,430 | |
| |
| | | | |
Germany | | | – | | | | 4,241,109 | | | | – | | | | 4,241,109 | |
| |
| | | | |
Hong Kong | | | – | | | | 1,586,666 | | | | – | | | | 1,586,666 | |
| |
| | | | |
Ireland | | | 670,742 | | | | – | | | | – | | | | 670,742 | |
| |
| | | | |
Italy | | | – | | | | 2,564,930 | | | | – | | | | 2,564,930 | |
| |
| | | | |
Japan | | | – | | | | 7,692,712 | | | | – | | | | 7,692,712 | |
| |
| | | | |
Luxembourg | | | – | | | | 409,459 | | | | – | | | | 409,459 | |
| |
| | | | |
Netherlands | | | – | | | | 935,296 | | | | – | | | | 935,296 | |
| |
| | | | |
Singapore | | | – | | | | 988,821 | | | | – | | | | 988,821 | |
| |
| | | | |
South Korea | | | – | | | | 485,650 | | | | – | | | | 485,650 | |
| |
| | | | |
Spain | | | – | | | | 838,966 | | | | – | | | | 838,966 | |
| |
| | | | |
Sweden | | | – | | | | 850,230 | | | | – | | | | 850,230 | |
| |
| | | | |
Taiwan | | | – | | | | 730,915 | | | | – | | | | 730,915 | |
| |
| | | | |
United Kingdom | | | 3,420,840 | | | | 4,671,247 | | | | – | | | | 8,092,087 | |
| |
| | | | |
United States | | | 33,862,309 | | | | 1,752,935 | | | | – | | | | 35,615,244 | |
| |
| | | | |
Money Market Funds | | | 134,488 | | | | – | | | | – | | | | 134,488 | |
| |
Total Investments in Securities | | | 39,506,038 | | | | 31,087,130 | | | | – | | | | 70,593,168 | |
| |
Other Investments - Assets* | | | | | | | | | | | | | | | | |
| |
| | | | |
Forward Foreign Currency Contracts | | | – | | | | 6,462 | | | | – | | | | 6,462 | |
| |
| | | | |
Total Investments | | $ | 39,506,038 | | | $ | 31,093,592 | | | $ | – | | | $ | 70,599,630 | |
| |
| * | Unrealized appreciation. |
NOTE 4–Derivative Investments
The Fund may enter into an International Swaps and Derivatives Association Master Agreement (“ISDA Master Agreement”) under which a fund may trade OTC derivatives. An OTC transaction entered into under an ISDA Master Agreement typically involves a collateral posting arrangement, payment netting provisions andclose-out netting provisions. These netting provisions allow for reduction of credit risk through netting of contractual obligations. The enforceability of the netting provisions of the ISDA Master Agreement depends on the governing law of the ISDA Master Agreement, among other factors.
For financial reporting purposes, the Fund does not offset OTC derivative assets or liabilities that are subject to ISDA Master Agreements in the Statement of Assets and Liabilities.
Value of Derivative Investments atPeriod-End
The table below summarizes the value of the Fund’s derivative investments, detailed by primary risk exposure, held as of December 31, 2019:
| | | | |
| | | Value | |
| Derivative Assets | | Currency
Risk | |
Unrealized appreciation on forward foreign currency contracts outstanding | | | $6,462 | |
| |
Derivatives not subject to master netting agreements | | | - | |
| |
Total Derivative Assets subject to master netting agreements | | | $6,462 | |
| |
Offsetting Assets and Liabilities
The table below reflects the Fund’s exposure to Counterparties subject to either an ISDA Master Agreement or other agreement for OTC derivative transactions as of December 31, 2019.
| | | | | | | | | | | | | | |
| | | Financial
Derivative
Assets | | | | Collateral
(Received)/Pledged | | | | |
| Counterparty | | Forward Foreign
Currency Contracts | | Net Value of
Derivatives | | Non-Cash | | Cash | | | Net
Amount | |
Royal Bank of Canada | | $6,462 | | $6,462 | | $– | | | $– | | | | $6,462 | |
| |
Invesco V.I. Global Core Equity Fund
Effect of Derivative Investments for the year ended December 31, 2019
The table below summarizes the gains (losses) on derivative investments, detailed by primary risk exposure, recognized in earnings during the period:
| | | | |
| | | Location of Gain (Loss) on
Statement of Operations | |
| | | Currency
Risk | |
| |
Realized Gain (Loss): | | | | |
Forward foreign currency contracts | | | $(17,674) | |
| |
Change in Net Unrealized Appreciation: | | | | |
Forward foreign currency contracts | | | 53,972 | |
| |
Total | | | $ 36,298 | |
| |
| |
The table below summarizes the average notional value of derivatives held during the period. | | | | |
| |
| | | Forward
Foreign Currency
Contracts | |
| |
Average notional value | | | $1,859,213 | |
| |
NOTE 5–Trustees’ and Officers’ Fees and Benefits
Trustees’ and Officers’ Fees and Benefits include amounts accrued by the Fund to pay remuneration to certain Trustees and Officers of the Fund. Trustees have the option to defer compensation payable by the Fund, andTrustees’ and Officers’Fees and Benefits also include amounts accrued by the Fund to fund such deferred compensation amounts. Those Trustees who defer compensation have the option to select various Invesco Funds in which their deferral accounts shall be deemed to be invested. Finally, certain current Trustees were eligible to participate in a retirement plan that provided for benefits to be paid upon retirement to Trustees over a period of time based on the number of years of service. The Fund may have certain former Trustees who also participate in a retirement plan and receive benefits under such plan.Trustees’ and Officers’Fees and Benefits include amounts accrued by the Fund to fund such retirement benefits. Obligations under the deferred compensation and retirement plans represent unsecured claims against the general assets of the Fund.
NOTE 6–Cash Balances
The Fund is permitted to temporarily carry a negative or overdrawn balance in its account with SSB, the custodian bank. Such balances, if any atperiod-end, are shown in the Statement of Assets and Liabilities under the payable caption Amount due custodian. To compensate the custodian bank for such overdrafts, the overdrawn Fund may either (1) leave funds as a compensating balance in the account so the custodian bank can be compensated by earning the additional interest; or (2) compensate by paying the custodian bank at a rate agreed upon by the custodian bank and Invesco, not to exceed the contractually agreed upon rate.
NOTE 7–Distributions to Shareholders and Tax Components of Net Assets
Tax Character of Distributions to Shareholders Paid During the Fiscal Years Ended December 31, 2019 and 2018:
| | | | | | | | |
| | | 2019 | | | 2018 | |
Ordinary income | | $ | 1,865,502 | | | $ | 820,244 | |
| |
Long-term capital gain | | | 3,842,640 | | | | – | |
| |
Total distributions | | $ | 5,708,142 | | | $ | 820,244 | |
| |
| | | | | | |
| Tax Components of Net Assets atPeriod-End: | | | | | | |
| | | | | 2019 | |
Undistributed ordinary income | | | | $ | 802,346 | |
| |
Net unrealized appreciation – investments | | | | | 14,126,824 | |
| |
Net unrealized appreciation – foreign currencies | | | | | 557 | |
| |
Temporary book/tax differences | | | | | (35,716 | ) |
| |
Capital loss carryforward | | | | | (1,287,780 | ) |
| |
Shares of beneficial interest | | | | | 57,032,573 | |
| |
Total net assets | | | | $ | 70,638,804 | |
| |
The difference between book-basis andtax-basis unrealized appreciation (depreciation) is due to differences in the timing of recognition of gains and losses on investments for tax and book purposes. The Fund’s net unrealized appreciation difference is attributable primarily to wash sales and forward foreign currency contracts.
The temporary book/tax differences are a result of timing differences between book and tax recognition of income and/or expenses. The Fund’s temporary book/tax differences are the result of the trustee deferral of compensation and retirement plan benefits.
Capital loss carryforward is calculated and reported as of a specific date. Results of transactions and other activity after that date may affect the amount of capital loss carryforward actually available for the Fund to utilize. Capital losses generated in years beginning after December 22, 2010
Invesco V.I. Global Core Equity Fund
can be carried forward for an unlimited period, whereas previous losses expire in eight tax years. Capital losses with an expiration period may not be used to offset capital gains until all net capital losses without an expiration date have been utilized. Capital loss carryforwards with no expiration date will retain their character as either short-term or long-term capital losses instead of as short-term capital losses as under prior law. The ability to utilize capital loss carryforwards in the future may be limited under the Internal Revenue Code and related regulations based on the results of future transactions.
The Fund has a capital loss carryforward as of December 31, 2019, as follows:
| | | | | | | | | | | | | | |
| | | Capital Loss Carryforward* | | | | | | | |
| |
| Expiration | | | | Short-Term | | | Long-Term | | | Total | |
| |
Not subject to expiration | | | | | $356,447 | | | | $931,333 | | | | $1,287,780 | |
| |
| * | Capital loss carryforward as of the date listed above is reduced for limitations, if any, to the extent required by the Internal Revenue Code and may be further limited depending upon a variety of factors, including the realization of net unrealized gains or losses as of the date of any reorganization. |
NOTE 8–Investment Transactions
The aggregate amount of investment securities (other than short-term securities, U.S. Treasury obligations and money market funds, if any) purchased and sold by the Fund during the year ended December 31, 2019 was $16,599,058 and $24,862,826, respectively. Cost of investments, including any derivatives, on a tax basis includes the adjustments for financial reporting purposes as of the most recently completed federal income tax reportingperiod-end.
| | | | |
| Unrealized Appreciation (Depreciation) of Investments on a Tax Basis | | | |
| |
Aggregate unrealized appreciation of investments | | $ | 15,891,255 | |
| |
Aggregate unrealized (depreciation) of investments | | | (1,764,431 | ) |
| |
Net unrealized appreciation of investments | | $ | 14,126,824 | |
| |
| |
Cost of investments for tax purposes is $56,472,806. | | | | |
NOTE 9–Reclassification of Permanent Differences
Primarily as a result of differing book/tax treatment of distributions and foreign currency transactions, on December 31, 2019, undistributed net investment income was decreased by $224,600 and undistributed net realized gain (loss) was increased by $224,600. This reclassification had no effect on the net assets or the distributable earnings of the Fund.
NOTE 10–Share Information
| | | | | | | | | | | | | | | | |
| | | | | | | | Summary of Share Activity | | | | | |
| | | Year ended
December 31, 2019(a) | | | Year ended
December 31, 2018 | |
| | | Shares | | | Amount | | | Shares | | | Amount | |
Sold: | | | | | | | | | | | | | | | | |
Series I | | | 173,169 | | | $ | 1,705,731 | | | | 503,897 | | | $ | 5,374,444 | |
| |
Series II | | | 12,211 | | | | 120,875 | | | | 8,185 | | | | 83,331 | |
| |
| | | | |
Issued as reinvestment of dividends: | | | | | | | | | | | | | | | | |
Series I | | | 517,929 | | | | 4,858,170 | | | | 68,065 | | | | 726,931 | |
| |
Series II | | | 90,378 | | | | 848,653 | | | | 8,717 | | | | 93,182 | |
| |
| | | | |
Reacquired: | | | | | | | | | | | | | | | | |
Series I | | | (948,455 | ) | | | (9,507,671 | ) | | | (1,339,378 | ) | | | (14,147,219 | ) |
| |
Series II | | | (145,366 | ) | | | (1,453,971 | ) | | | (162,966 | ) | | | (1,724,077 | ) |
| |
Net increase (decrease) in share activity | | | (300,134 | ) | | $ | (3,428,213 | ) | | | (913,480 | ) | | $ | (9,593,408 | ) |
| |
| (a) | There are entities that are record owners of more than 5% of the outstanding shares of the Fund and in the aggregate own 85% of the outstanding shares of the Fund. The Fund and the Fund’s principal underwriter or adviser, are parties to participation agreements with these entities whereby these entities sell units of interest in separate accounts funding variable products that are invested in the Fund. The Fund, Invesco and/or Invesco affiliates may make payments to these entities, which are considered to be related to the Fund, for providing services to the Fund, Invesco and/or Invesco affiliates including but not limited to services such as, securities brokerage, third party record keeping and account servicing and administrative services. The Fund has no knowledge as to whether all or any portion of the shares owned of record by these entities are also owned beneficially. |
Invesco V.I. Global Core Equity Fund
Report of Independent Registered Public Accounting Firm
To the Board of Trustees of AIM Variable Insurance Funds (Invesco Variable Insurance Funds) and Shareholders of Invesco V.I. Global Core Equity Fund
Opinion on the Financial Statements
We have audited the accompanying statement of assets and liabilities, including the schedule of investments, of Invesco V.I. Global Core Equity Fund (one of the funds constituting AIM Variable Insurance Funds (Invesco Variable Insurance Funds), referred to hereafter as the “Fund”) as of December 31, 2019, the related statement of operations for the year ended December 31, 2019, the statement of changes in net assets for each of the two years in the period ended December 31, 2019, including the related notes, and the financial highlights for each of the five years in the period ended December 31, 2019 (collectively referred to as the “financial statements”). In our opinion, the financial statements present fairly, in all material respects, the financial position of the Fund as of December 31, 2019, the results of its operations for the year then ended, the changes in its net assets for each of the two years in the period ended December 31, 2019 and the financial highlights for each of the five years in the period ended December 31, 2019 in conformity with accounting principles generally accepted in the United States of America.
Basis for Opinion
These financial statements are the responsibility of the Fund’s management. Our responsibility is to express an opinion on the Fund’s financial statements based on our audits. We are a public accounting firm registered with the Public Company Accounting Oversight Board (United States) (PCAOB) and are required to be independent with respect to the Fund in accordance with the U.S. federal securities laws and the applicable rules and regulations of the Securities and Exchange Commission and the PCAOB.
We conducted our audits of these financial statements in accordance with the standards of the PCAOB. Those standards require that we plan and perform the audit to obtain reasonable assurance about whether the financial statements are free of material misstatement, whether due to error or fraud.
Our audits included performing procedures to assess the risks of material misstatement of the financial statements, whether due to error or fraud, and performing procedures that respond to those risks. Such procedures included examining, on a test basis, evidence regarding the amounts and disclosures in the financial statements. Our audits also included evaluating the accounting principles used and significant estimates made by management, as well as evaluating the overall presentation of the financial statements. Our procedures included confirmation of securities owned as of December 31, 2019 by correspondence with the custodian, transfer agent and brokers; when replies were not received from brokers, we performed other auditing procedures. We believe that our audits provide a reasonable basis for our opinion.
/s/PricewaterhouseCoopers LLP
Houston, Texas
February 18, 2020
We have served as the auditor of one or more of the investment companies in the Invesco group of investment companies since at least 1995. We have not been able to determine the specific year we began serving as auditor.
Invesco V.I. Global Core Equity Fund
Calculating your ongoing Fund expenses
Example
As a shareholder of the Fund, you incur two types of costs: (1) transaction costs, which may include sales charges (loads) on purchase payments or contingent deferred sales charges on redemptions, if any; and (2) ongoing costs, including management fees, distribution and/or service(12b-1) fees, and other Fund expenses. This example is intended to help you understand your ongoing costs (in dollars) of investing in the Fund and to compare these costs with ongoing costs of investing in other mutual funds. The example is based on an investment of $1,000 invested at the beginning of the period and held for the entire period July 1, 2019 through December 31, 2019.
Actual expenses
The table below provides information about actual account values and actual expenses. You may use the information in this table, together with the amount you invested, to estimate the expenses that you paid over the period. Simply divide your account value by $1,000 (for example, an $8,600 account value divided by $1,000 = 8.6), then multiply the result by the number in the table under the heading entitled “Actual Expenses Paid During Period” to estimate the expenses you paid on your account during this period.
Hypothetical example for comparison purposes
The table below also provides information about hypothetical account values and hypothetical expenses based on the Fund’s actual expense ratio and an assumed rate of return of 5% per year before expenses, which is not the Fund’s actual return.
The hypothetical account values and expenses may not be used to estimate the actual ending account balance or expenses you paid for the period. You may use this information to compare the ongoing costs of investing in the Fund and other funds. To do so, compare this 5% hypothetical example with the 5% hypothetical examples that appear in the shareholder reports of the other funds.
Please note that the expenses shown in the table are meant to highlight your ongoing costs. Therefore, the hypothetical information is useful in comparing ongoing costs, and will not help you determine the relative total costs of owning different funds.
| | | | | | | | | | | | |
| | | | | ACTUAL | | HYPOTHETICAL (5% annual return before
expenses) | | |
| | Beginning
Account Value
(07/01/19) | | Ending
Account Value
(12/31/19)1 | | Expenses
Paid During
Period2 | | Ending
Account Value
(12/31/19) | | Expenses
Paid During
Period2 | | Annualized
Expense
Ratio |
| Series I | | $1,000.00 | | $1,086.40 | | $5.31 | | $1,020.11 | | $5.14 | | 1.01% |
| Series II | | 1,000.00 | | 1,084.20 | | 6.62 | | 1,018.85 | | 6.41 | | 1.26 |
| 1 | The actual ending account value is based on the actual total return of the Fund for the period July 1, 2019 through December 31, 2019, after actual expenses and will differ from the hypothetical ending account value which is based on the Fund’s expense ratio and a hypothetical annual return of 5% before expenses. |
| 2 | Expenses are equal to the Fund’s annualized expense ratio as indicated above multiplied by the average account value over the period, multiplied by 184/365 to reflect the most recent fiscal half year. |
Invesco V.I. Global Core Equity Fund
Tax Information
Form1099-DIV, Form1042-S and other year-end tax information provide shareholders with actual calendar year amounts that should be included in their tax returns. Shareholders should consult their tax advisors.
The following distribution information is being provided as required by the Internal Revenue Code or to meet a specific state’s requirement.
The Fund designates the following amounts or, if subsequently determined to be different, the maximum amount allowable for its fiscal year ended December 31, 2019:
| | | | | | | | |
| Federal and State Income Tax | | | | |
Long-term Capital Gain Distribution | | | 3,842,640 | | | | | |
Qualified Dividend Income* | | | 0.00 | % | | | | |
Corporate Dividends Received Deduction* | | | 27.57 | % | | | | |
U.S. Treasury Obligations* | | | 0.00 | % | | | | |
| | * | The above percentages are based on ordinary income dividends paid to shareholders during the Fund’s fiscal year. |
Invesco V.I. Global Core Equity Fund
Trustees and Officers
The address of each trustee and officer is AIM Variable Insurance Funds (Invesco Variable Insurance Funds) (the “Trust”), 11 Greenway Plaza, Suite 1000, Houston, Texas 77046-1173. The trustees serve for the life of the Trust, subject to their earlier death, incapacitation, resignation, retirement or removal as more specifically provided in the Trust’s organizational documents. Each officer serves for a one year term or until their successors are elected and qualified. Column two below includes length of time served with predecessor entities, if any.
| | | | | | | | |
Name, Year of Birth and
Position(s)
Held with the Trust | | Trustee
and/or
Officer
Since | | Principal Occupation(s)
During Past 5 Years | | Number of
Funds in
Fund Complex
Overseen by
Trustee | | Other
Directorship(s)
Held by Trustee
During Past
5 Years |
| Interested Person | | | | | | | | |
| Martin L. Flanagan1- 1960 Trustee and Vice Chair | | 2007 | | Executive Director, Chief Executive Officer and President, Invesco Ltd. (ultimate parent of Invesco and a global investment management firm); Trustee and Vice Chair, The Invesco Funds; Vice Chair, Investment Company Institute; and Member of Executive Board, SMU Cox School of Business Formerly: Advisor to the Board, Invesco Advisers, Inc. (formerly known as Invesco Institutional (N.A.), Inc.); Chairman and Chief Executive Officer, Invesco Advisers, Inc. (registered investment adviser); Director, Chairman, Chief Executive Officer and President, Invesco Holding Company (US), Inc. (formerly IVZ Inc.) (holding company), Invesco Group Services, Inc. (service provider) and Invesco North American Holdings, Inc. (holding company); Director, Chief Executive Officer and President, Invesco Holding Company Limited (parent of Invesco and a global investment management firm); Director, Invesco Ltd.; Chairman, Investment Company Institute and President,Co-Chief Executive Officer,Co-President, Chief Operating Officer and Chief Financial Officer, Franklin Resources, Inc. (global investment management organization) | | 229 | | None |
| 1 | Mr. Flanagan is considered an interested person (within the meaning of Section 2(a)(19) of the 1940 Act) of the Trust because he is an officer of the Adviser to the Trust, and an officer and a director of Invesco Ltd., ultimate parent of the Adviser. |
Invesco V.I. Global Core Equity Fund
Trustees and Officers–(continued)
| | | | | | | | |
Name, Year of Birth and
Position(s)
Held with the Trust | | Trustee
and/or
Officer
Since | | Principal Occupation(s)
During Past 5 Years | | Number of
Funds
in
Fund Complex
Overseen by
Trustee | | Other
Directorship(s)
Held by Trustee
During Past 5
Years |
| Independent Trustees | | | | | | | | |
Bruce L. Crockett - 1944
Trustee and Chair | | 1993 | | Chairman, Crockett Technologies Associates (technology consulting company) Formerly: Director, Captaris (unified messaging provider); Director, President and Chief Executive Officer, COMSAT Corporation; Chairman, Board of Governors of INTELSAT (international communications company); ACE Limited (insurance company); Independent Directors Council and Investment Company Institute: Member of the Audit Committee, Investment Company Institute; Member of the Executive Committee and Chair of the Governance Committee, Independent Directors Council | | 229 | | Director and Chairman of the Audit Committee, ALPS (Attorneys Liability Protection Society) (insurance company); Director and Member of the Audit Committee and Compensation Committee, Ferroglobe PLC (metallurgical company) |
David C. Arch - 1945
Trustee | | 2010 | | Chairman of Blistex Inc. (consumer health care products manufacturer); Member, World Presidents’ Organization | | 229 | | Board member of the Illinois Manufacturers’ Association |
Beth Ann Brown - 1968
Trustee | | 2019 | | Independent Consultant Formerly: Head of Intermediary Distribution, Managing Director, Strategic Relations, Managing Director, Head of National Accounts, Senior Vice President, National Account Manager and Senior Vice President, Key Account Manager, Columbia Management Investment Advisers LLC; Vice President, Key Account Manager, Liberty Funds Distributor, Inc.; and Trustee of certain Oppenheimer Funds | | 229 | | Director, Board of Directors of Caron Engineering Inc.; Advisor, Board of Advisors of Caron Engineering Inc.; President and Director, Acton Shapleigh Youth Conservation Corps (non - profit); and Vice President and Director of Grahamtastic Connection (non-profit) |
Jack M. Fields - 1952
Trustee | | 1997 | | Chief Executive Officer, Twenty First Century Group, Inc. (government affairs company); and Chairman, Discovery Learning Alliance(non-profit) Formerly: Owner and Chief Executive Officer, Dos Angeles Ranch L.P. (cattle, hunting, corporate entertainment); Director, Insperity, Inc. (formerly known as Administaff) (human resources provider); Chief Executive Officer, Texana Timber LP (sustainable forestry company); Director of Cross Timbers Quail Research Ranch(non-profit); and member of the U.S. House of Representatives | | 229 | | None |
Invesco V.I. Global Core Equity Fund
Trustees and Officers–(continued)
| | | | | | | | | | |
Name, Year of Birth and
Position(s)
Held with the Trust | | Trustee
and/or
Officer
Since | | Principal Occupation(s)
During Past 5 Years | | Number of
Funds in
Fund Complex
Overseen by
Trustee | | | Other
Directorship(s)
Held by Trustee
During Past 5
Years |
| Independent Trustees–(continued) | | | | | | |
Cynthia Hostetler -1962
Trustee | | 2017 | | Non-Executive Director and Trustee of a number of public and private business corporations Formerly: Director, Aberdeen Investment Funds (4 portfolios); Head of Investment Funds and Private Equity, Overseas Private Investment Corporation; President, First Manhattan Bancorporation, Inc.; Attorney, Simpson Thacher & Bartlett LLP | | | 229 | | | Vulcan Materials Company (construction materials company); Trilinc Global Impact Fund; Genesee & Wyoming, Inc. (railroads); Artio Global Investment LLC (mutual fund complex); Edgen Group, Inc. (specialized energy and infrastructure products distributor); Investment Company Institute (professional organization); Independent Directors Council (professional organization) |
Eli Jones - 1961
Trustee | | 2016 | | Professor and Dean, Mays Business School - Texas A&M University Formerly: Professor and Dean, Walton College of Business, University of Arkansas and E.J. Ourso College of Business, Louisiana State University; Director, Arvest Bank | | | 229 | | | Insperity, Inc. (formerly known as Administaff) (human resources provider) |
Elizabeth Krentzman -1959
Trustee | | 2019 | | Formerly: Principal and Chief Regulatory Advisor for Asset Management Services and U.S. Mutual Fund Leader of Deloitte & Touche LLP; General Counsel of the Investment Company Institute (trade association); National Director of the Investment Management Regulatory Consulting Practice, Principal, Director and Senior Manager of Deloitte & Touche LLP; Assistant Director of the Division of Investment Management - Office of Disclosure and Investment Adviser Regulation of the U.S. Securities and Exchange Commission and various positions with the Division of Investment Management – Office of Regulatory Policy of the U.S. Securities and Exchange Commission; Associate at Ropes & Gray LLP; Advisory Board Member of the Securities and Exchange Commission Historical Society; and Trustee of certain Oppenheimer Funds | | | 229 | | | Trustee of the University of Florida National Board Foundation and Audit Committee Member; Member of the Cartica Funds Board of Directors (private investment funds); Member of the University of Florida Law Center Association, Inc. Board of Trustees and Audit Committee Member |
Anthony J. LaCava, Jr.-1956
Trustee | | 2019 | | Formerly: Director and Member of the Audit Committee, Blue Hills Bank (publicly traded financial institution) and Managing Partner, KPMG LLP | | | 229 | | | Blue Hills Bank; Chairman, Bentley University; Member, Business School Advisory Council; and Nominating Committee KPMG LLP |
Prema Mathai-Davis -1950
Trustee | | 1998 | | Retired Co-Owner & Partner of Quantalytics Research, LLC, (a FinTech Investment Research Platform for the Self-Directed Investor) | | | 229 | | | None |
Invesco V.I. Global Core Equity Fund
Trustees and Officers–(continued)
| | | | | | | | |
Name, Year of Birth and
Position(s)
Held with the Trust | | Trustee
and/or
Officer
Since | | Principal Occupation(s)
During Past 5 Years | | Number of
Funds in Fund Complex
Overseen by
Trustee | | Other
Directorship(s)
Held by Trustee
During Past 5
Years |
| Independent Trustees–(continued) | | | | |
Joel W. Motley - 1952
Trustee | | 2019 | | Director of Office of Finance, Federal Home Loan Bank; Member of the Vestry of Trinity Wall Street; Managing Director of Carmona Motley Inc. (privately held financial advisor); Member of the Finance and Budget Committee of the Council on Foreign Relations, Member of the Investment Committee and Board of Human Rights Watch and Member of the Investment Committee and Board of Historic Hudson Valley(non-profit cultural organization) Formerly: Managing Director of Public Capital Advisors, LLC (privately held financial advisor); Managing Director of Carmona Motley Hoffman, Inc. (privately held financial advisor); Trustee of certain Oppenheimer Funds; and Director of Columbia Equity Financial Corp. (privately held financial advisor) | | 229 | | Director of Greenwall Foundation (bioethics research foundation); Member of Board and Investment Committee of The Greenwall Foundation; Director of Southern Africa Legal Services Foundation; Board Member and Investment Committee Member of Pulizer Center for Crisis Reporting(non-profit journalism) |
Teresa M. Ressel - 1962
Trustee | | 2017 | | Non-executive director and trustee of a number of public and private business corporations Formerly: Chief Financial Officer, Olayan America, The Olayan Group (international investor/commercial/industrial); Chief Executive Officer, UBS Securities LLC; Group Chief Operating Officer, Americas, UBS AG; Assistant Secretary for Management & Budget and CFO, US Department of the Treasury | | 229 | | Atlantic Power Corporation (power generation company); ON Semiconductor Corp. (semiconductor supplier) |
Ann Barnett Stern - 1957
Trustee | | 2017 | | President and Chief Executive Officer, Houston Endowment Inc. (private philanthropic institution) Formerly: Executive Vice President and General Counsel, Texas Children’s Hospital; Attorney, Beck, Redden and Secrest, LLP; Business Law Instructor, University of St. Thomas; Attorney, Andrews & Kurth LLP | | 229 | | Federal Reserve Bank of Dallas |
Robert C. Troccoli - 1949
Trustee | | 2016 | | Retired | | 229 | | None |
Daniel S. Vandivort -1954
Trustee | | 2019 | | Treasurer, Chairman of the Audit and Finance Committee, and Trustee, Board of Trustees, Huntington Disease Foundation of America; and President, Flyway Advisory Services LLC (consulting and property management) Formerly: Trustee and Governance Chair, of certain Oppenheimer Funds | | 229 | | Chairman and Lead Independent Director, Chairman of the Audit Committee, and Director, Board of Directors, Value Line Funds |
James D. Vaughn - 1945
Trustee | | 2019 | | Retired Formerly: Managing Partner, Deloitte & Touche LLP; Trustee and Chairman of the Audit Committee, Schroder Funds; Board Member, Mile High United Way, Boys and Girls Clubs, Boy Scouts, Colorado Business Committee for the Arts, Economic Club of Colorado and Metro Denver Network (economic development corporation); and Trustee of certain Oppenheimer Funds | | 229 | | Board member and Chairman of Audit Committee of AMG National Trust Bank; Trustee and Investment Committee member, University of South Dakota Foundation; Board member, Audit Committee Member and past Board Chair, Junior Achievement(non-profit) |
Invesco V.I. Global Core Equity Fund
Trustees and Officers–(continued)
| | | | | | | | |
Name, Year of Birth and
Position(s)
Held with the Trust | | Trustee
and/or
Officer
Since | | Principal Occupation(s)
During Past 5 Years | | Number of
Funds in
Fund Complex
Overseen by
Trustee | | Other
Directorship(s)
Held by Trustee
During Past 5 Years |
| Independent Trustees–(continued) | | | | |
Christopher L. WIlson - 1957
Trustee, Vice Chair and Chair Designate | | 2017 | | Retired Formerly: Director, TD Asset Management USA Inc. (mutual fund complex) (22 portfolios); Managing Partner, CT2, LLC (investing and consulting firm); President/Chief Executive Officer, Columbia Funds, Bank of America Corporation; President/Chief Executive Officer, CDC IXIS Asset Management Services, Inc.; Principal & Director of Operations, Scudder Funds, Scudder, Stevens & Clark, Inc.; Assistant Vice President, Fidelity Investments | | 229 | | ISO New England, Inc.(non-profit organization managing regional electricity market) |
Invesco V.I. Global Core Equity Fund
Trustees and Officers–(continued)
| | | | | | | | |
Name, Year of Birth and
Position(s)
Held with the Trust | | Trustee
and/or
Officer
Since | | Principal Occupation(s)
During Past 5 Years | | Number of
Funds in
Fund Complex
Overseen by
Trustee | | Other
Directorship(s)
Held by Trustee
During Past 5
Years |
| Officers | | | | | | | | |
Sheri Morris - 1964 President, Principal Executive Officer and Treasurer | | 1999 | | Head of Global Fund Services, Invesco Ltd.; President, Principal Executive Officer and Treasurer, The Invesco Funds; Vice President, Invesco Advisers, Inc. (formerly known as Invesco Institutional (N.A.), Inc.) (registered investment adviser); and Vice President, Invesco Exchange-Traded Fund Trust, Invesco Exchange-Traded Fund Trust II, Invesco India Exchange-Traded Fund Trust, Invesco Actively Managed Exchange-Traded Fund Trust, Invesco Actively Managed Exchange-Traded Commodity Fund Trust and Invesco Exchange-Traded Self-Indexed Fund Trust; and Vice President, OppenheimerFunds, Inc. Formerly: Vice President and Principal Financial Officer, The Invesco Funds; Vice President, Invesco AIM Advisers, Inc., Invesco AIM Capital Management, Inc. and Invesco AIM Private Asset Management, Inc.; Assistant Vice President and Assistant Treasurer, The Invesco Funds and Assistant Vice President, Invesco Advisers, Inc., Invesco AIM Capital Management, Inc. and Invesco AIM Private Asset Management, Inc.; and Treasurer, Invesco Exchange-Traded Fund Trust, Invesco Exchange-Traded Fund Trust II, Invesco India Exchange-Traded Fund Trust and Invesco Actively Managed Exchange-Traded Fund Trust | | N/A | | N/A |
Russell C. Burk – 1958 Senior Vice President and Senior Officer | | 2005 | | Senior Vice President and Senior Officer, The Invesco Funds | | N/A | | N/A |
Jeffrey H. Kupor – 1968 Senior Vice President, Chief Legal Officer and Secretary | | 2018 | | Head of Legal of the Americas, Invesco Ltd.; Senior Vice President and Secretary, Invesco Advisers, Inc. (formerly known as Invesco Institutional (N.A.), Inc.) (registered investment adviser); Senior Vice President and Secretary, Invesco Distributors, Inc. (formerly known as Invesco AIM Distributors, Inc.); Vice President and Secretary, Invesco Investment Services, Inc. (formerly known as Invesco AIM Investment Services, Inc.) Senior Vice President, Chief Legal Officer and Secretary, The Invesco Funds; Secretary and General Counsel, Invesco Investment Advisers LLC (formerly known as Van Kampen Asset Management); Secretary and General Counsel, Invesco Capital Markets, Inc. (formerly known as Van Kampen Funds Inc.) and Chief Legal Officer, Invesco Exchange-Traded Fund Trust, Invesco Exchange-Traded Fund Trust II, Invesco India Exchange-Traded Fund Trust, Invesco Actively Managed Exchange-Traded Fund Trust, Invesco Actively Managed Exchange-Traded Commodity Fund Trust and Invesco Exchange-Traded Self-Indexed Fund Trust; Secretary, Invesco Indexing LLC; Secretary, W.L. Ross & Co., LLC Formerly: Secretary and Vice President, Jemstep, Inc.; Head of Legal, Worldwide Institutional, Invesco Ltd.; Secretary and General Counsel, INVESCO Private Capital Investments, Inc.; Senior Vice President, Secretary and General Counsel, Invesco Management Group, Inc. (formerly known as Invesco AIM Management Group, Inc.); Assistant Secretary, INVESCO Asset Management (Bermuda) Ltd.; Secretary and General Counsel, Invesco Private Capital, Inc.; Assistant Secretary and General Counsel, INVESCO Realty, Inc.; Secretary and General Counsel, Invesco Senior Secured Management, Inc.; and Secretary, Sovereign G./P. Holdings Inc. | | N/A | | N/A |
| Andrew R. Schlossberg – 1974 Senior Vice President | | 2019 | | Head of the Americas and Senior Managing Director, Invesco Ltd.; Director and Senior Vice President, Invesco Advisers, Inc. (formerly known as Invesco Institutional (N.A.), Inc.) (registered investment adviser); Director and Chairman, Invesco Investment Services, Inc. (formerly known as Invesco AIM Investment Services, Inc.) (registered transfer agent); Senior Vice President, The Invesco Funds; Director, Invesco Investment Advisers LLC (formerly known as Van Kampen Asset Management); Director, President and Chairman, Invesco Insurance Agency, Inc. Formerly: Director, Invesco UK Limited; Director and Chief Executive, Invesco Asset Management Limited and Invesco Fund Managers Limited; Assistant Vice President, The Invesco Funds; Senior Vice President, Invesco Advisers, Inc. (formerly known as Invesco Institutional (N.A.), Inc.) (registered investment adviser); Director and Chief Executive, Invesco Administration Services Limited and Invesco Global Investment Funds Limited; Director, Invesco Distributors, Inc.; Head of EMEA, Invesco Ltd.; President, Invesco Actively Managed Exchange-Traded Commodity Fund Trust, Invesco Actively Managed Exchange-Traded Fund Trust, Invesco Exchange-Traded Fund Trust, Invesco Exchange-Traded Fund Trust II and Invesco India Exchange-Traded Fund Trust; Managing Director and Principal Executive Officer, Invesco Capital Management LLC | | N/A | | N/A |
Invesco V.I. Global Core Equity Fund
Trustees and Officers–(continued)
| | | | | | | | |
Name, Year of Birth and
Position(s)
Held with the Trust | | Trustee
and/or
Officer
Since | | Principal Occupation(s)
During Past 5 Years | | Number of
Funds in
Fund Complex
Overseen by
Trustee | | Other
Directorship(s)
Held by Trustee
During Past 5
Years |
| Officers–(continued) | | | | | | | | |
John M. Zerr - 1962 Senior Vice President | | 2006 | | Chief Operating Officer of the Americas; Senior Vice President, Invesco Advisers, Inc. (formerly known as Invesco Institutional (N.A.), Inc.) (registered investment adviser); Senior Vice President, Invesco Distributors, Inc. (formerly known as Invesco AIM Distributors, Inc.); Director and Vice President, Invesco Investment Services, Inc. (formerly known as Invesco AIM Investment Services, Inc.) Senior Vice President, The Invesco Funds; Managing Director, Invesco Capital Management LLC; Director, Invesco Investment Advisers LLC (formerly known as Van Kampen Asset Management); Senior Vice President, Invesco Capital Markets, Inc. (formerly known as Van Kampen Funds Inc.); Manager, Invesco Indexing LLC; Manager, Invesco Specialized Products, LLC; Director and Senior Vice President, Invesco Insurance Agency, Inc.; Member, Invesco Canada Funds Advisory Board; Director, President and Chief Executive Officer, Invesco Corporate Class Inc. (corporate mutual fund company); and Director, Chairman, President and Chief Executive Officer, Invesco Canada Ltd. (formerly known as Invesco Trimark Ltd./Invesco Trimark Ltèe) (registered investment adviser and registered transfer agent) Formerly: Director and Senior Vice President, Invesco Management Group, Inc. (formerly known as Invesco AIM Management Group, Inc.); Secretary and General Counsel, Invesco Management Group, Inc. (formerly known as Invesco AIM Management Group, Inc.); Secretary, Invesco Investment Services, Inc. (formerly known as Invesco AIM Investment Services, Inc.); Chief Legal Officer and Secretary, The Invesco Funds; Secretary and General Counsel, Invesco Investment Advisers LLC (formerly known as Van Kampen Asset Management); Secretary and General Counsel, Invesco Capital Markets, Inc. (formerly known as Van Kampen Funds Inc.); Chief Legal Officer, Invesco Exchange-Traded Fund Trust, Invesco Exchange-Traded Fund Trust II, Invesco India Exchange-Traded Fund Trust, Invesco Actively Managed Exchange-Traded Fund Trust, Invesco Actively Managed Exchange-Traded Commodity Fund Trust and Invesco Exchange-Traded Self-Indexed Fund Trust; Secretary, Invesco Indexing LLC; Director, Secretary, General Counsel and Senior Vice President, Van Kampen Exchange Corp.; Director, Vice President and Secretary, IVZ Distributors, Inc. (formerly known as INVESCO Distributors, Inc.); Director and Vice President, INVESCO Funds Group, Inc.; Director and Vice President, Van Kampen Advisors Inc.; Director, Vice President, Secretary and General Counsel, Van Kampen Investor Services Inc.;Director and Secretary, Invesco Distributors, Inc. (formerly known as Invesco AIM Distributors, Inc.); Director, Senior Vice President, General Counsel and Secretary, Invesco AIM Advisers, Inc. and Van Kampen Investments Inc.; Director, Vice President and Secretary, Fund Management Company; Director, Senior Vice President, Secretary, General Counsel and Vice President, Invesco AIM Capital Management, Inc.; Chief Operating Officer and General Counsel, Liberty Ridge Capital, Inc. (an investment adviser) | | N/A | | N/A |
| Gregory G. McGreevey - 1962 Senior Vice President | | 2012 | | Senior Managing Director, Invesco Ltd.; Director, Chairman, President, and Chief Executive Officer, Invesco Advisers, Inc. (formerly known as Invesco Institutional (N.A.), Inc.) (registered investment adviser); Director, Invesco Mortgage Capital, Inc. and Invesco Senior Secured Management, Inc.; and Senior Vice President, The Invesco Funds; and President, SNW Asset Management Corporation Formerly: Senior Vice President, Invesco Management Group, Inc. and Invesco Advisers, Inc.; Assistant Vice President, The Invesco Funds | | N/A | | N/A |
| Kelli Gallegos - 1970 Vice President, Principal Financial Officer and Assistant Treasurer | | 2008 | | Principal Financial and Accounting Officer – Investments Pool, Invesco Specialized Products, LLC; Vice President, Principal Financial Officer and Assistant Treasurer, The Invesco Funds; Principal Financial and Accounting Officer – Pooled Investments, Invesco Capital Management LLC; Vice President and Treasurer, Invesco Exchange-Traded Fund Trust, Invesco Exchange-Traded Fund Trust II, Invesco India Exchange-Traded Fund Trust, Invesco Actively Managed Exchange-Traded Fund Trust, Invesco Actively Managed Exchange-Traded Commodity Fund Trust and Invesco Exchange-Traded Self-Indexed Fund Trust Formerly: Assistant Treasurer, Invesco Specialized Products, LLC; Assistant Treasurer, Invesco Exchange-Traded Fund Trust, Invesco Exchange-Traded Fund Trust II, Invesco India Exchange-Traded Fund Trust, Invesco Actively Managed Exchange-Traded Fund Trust, Invesco Actively Managed Exchange-Traded Commodity Fund Trust and Invesco Exchange-Traded Self-Indexed Fund Trust; Assistant Treasurer, Invesco Capital Management LLC; Assistant Vice President, The Invesco Funds | | N/A | | N/A |
Invesco V.I. Global Core Equity Fund
Trustees and Officers–(continued)
| | | | | | | | |
Name, Year of Birth and
Position(s)
Held with the Trust | | Trustee
and/or
Officer
Since | | Principal Occupation(s)
During Past 5 Years | | Number of
Funds in
Fund Complex
Overseen by
Trustee | | Other
Directorship(s)
Held by Trustee
During Past 5
Years |
| Officers–(continued) | | | | | | | | |
Crissie M. Wisdom - 1969 Anti-Money Laundering Compliance Officer | | 2013 | | Anti-Money Laundering Compliance Officer, Invesco Advisers, Inc. (formerly known as Invesco Institutional (N.A.), Inc.) (registered investment adviser), Invesco Capital Markets, Inc. (formerly known as Van Kampen Funds Inc.), Invesco Distributors, Inc., Invesco Investment Services, Inc., The Invesco Funds, and Invesco Exchange-Traded Fund Trust, Invesco Exchange-Traded Fund Trust II, Invesco India Exchange-Traded Fund Trust, Invesco Actively Managed Exchange-Traded Fund Trust, Invesco Actively Managed Exchange-Traded Commodity Fund Trust and Invesco Exchange-Traded Self-Indexed Fund Trust; Anti-Money Laundering Compliance Officer and Bank Secrecy Act Officer, INVESCO National Trust Company and Invesco Trust Company; and Fraud Prevention Manager and Controls and Risk Analysis Manager for Invesco Investment Services, Inc. Formerly: Anti-Money Laundering Compliance Officer, Van Kampen Exchange Corp. and Invesco Management Group, Inc. | | N/A | | N/A |
Robert R. Leveille - 1969 Chief Compliance Officer | | 2016 | | Chief Compliance Officer, Invesco Advisers, Inc. (registered investment adviser); and Chief Compliance Officer, The Invesco Funds Formerly: Chief Compliance Officer, Putnam Investments and the Putnam Funds | | N/A | | N/A |
The Statement of Additional Information of the Trust includes additional information about the Fund’s Trustees and is available upon request, without charge, by calling 1.800.959.4246.
Please refer to the Fund’s Statement of Additional Information for information on the Fund’ssub-advisers.
| | | | | | |
Office of the Fund 11 Greenway Plaza, Suite 1000 Houston, TX 77046-1173 | | Investment Adviser Invesco Advisers, Inc. 1555 Peachtree Street, N.E. Atlanta, GA 30309 | | Distributor Invesco Distributors, Inc. 11 Greenway Plaza, Suite 1000 Houston, TX 77046-1173 | | Auditors PricewaterhouseCoopers LLP 1000 Louisiana Street, Suite 5800 Houston, TX 77002-5678 |
| | | |
Counsel to the Fund Stradley Ronon Stevens & Young, LLP 2005 Market Street, Suite 2600 Philadelphia, PA 19103-7018 | | Counsel to the Independent Trustees Goodwin Procter LLP 901 New York Avenue, N.W. Washington, D.C. 20001 | | Transfer Agent Invesco Investment Services, Inc. 11 Greenway Plaza, Suite 1000 Houston, TX 77046-1173 | | Custodian State Street Bank and Trust Company 225 Franklin Street Boston, MA 02110-2801 |
Invesco V.I. Global Core Equity Fund
| | | | |
| | |
 | | Annual Report to Shareholders | | December 31, 2019 |
| | |
| | Invesco V.I. Global Real Estate Fund |

Beginning on January 1, 2021, as permitted by regulations adopted by the Securities and Exchange Commission, the insurance company that offers your variable annuity or variable life insurance contract may no longer send you paper copies of the Fund’s shareholder reports by mail, unless you specifically request paper copies of the reports from the insurance company or your financial intermediary. Instead of delivering paper copies of the report, the insurance company may choose to make the reports available on a website, and will notify you by mail each time a report is posted and provide you with a website link to access the report. Instructions for requesting paper copies will be provided by your insurance company.
If the insurance company offers electronic delivery, you may elect to receive shareholder reports and other communications about the Fund electronically by following the instructions provided by the insurance company or by contacting your financial intermediary. If you already elected to receive shareholder reports electronically, you will not be affected by this change and you need not take any action.
You may elect to receive all future reports in paper free of charge from the insurance company. You can inform the insurance company or your financial intermediary that you wish to continue receiving paper copies of your shareholder reports by following the instructions provided by the insurance company or by contacting your financial intermediary. Your election to receive reports in paper will apply to all portfolio companies available under your contract with the insurance company.
The Fund provides a complete list of its holdings four times in each fiscal year, at the quarter-ends. For the second and fourth quarters, the lists appear in the Fund’s semiannual and annual reports to shareholders. For the first and third quarters, the Fund files the lists with the Securities and Exchange Commission (SEC) as an exhibit to its reports on FormN-PORT. The Fund’s FormN-PORT filings are available on the SEC website, sec.gov. The SEC file numbers for the Fund are811-07452 and033-57340. The Fund’s most recent portfolio holdings, as filed on FormN-PORT, have also been made available to insurance companies issuing variable annuity contracts and variable life insurance policies (“variable products”) that invest in the Fund.
A description of the policies and procedures that the Fund uses to determine how to vote proxies relating to portfolio securities is available without charge, upon request, from our Client Services department at 800 959 4246 or at invesco.com/proxyguidelines. The information is also available on the SEC website, sec.gov.
Information regarding how the Fund voted proxies related to its portfolio securities during the most recent12-month period ended June 30 is available at invesco.com/proxysearch. The information is also available on the SEC website, sec.gov.
Invesco Advisers, Inc. is an investment adviser; it provides investment advisory services to individual and institutional clients and does not sell securities. Invesco Distributors, Inc. is the US distributor for Invesco Ltd.’s retail mutual funds, exchange-traded funds and institutional money market funds. Both are wholly owned, indirect subsidiaries of Invesco Ltd.
This report must be accompanied or preceded by a currently effective Fund prospectus and variable product prospectus, which contain more complete information, including sales charges and expenses. Investors should read each carefully before investing.
| | | | |
| NOT FDIC INSURED | MAY LOSE VALUE | NO BANK GUARANTEE |
| Invesco Distributors, Inc. | | | | VIGRE-AR-1 |
Management’s Discussion of Fund Performance
| | | | |
| Performance summary | | | | |
For the year ended December 31, 2019, Series I shares of Invesco V.I. Global Real Estate Fund (the Fund) outperformed the Fund’s style-specific benchmark, the Custom Invesco Global Real Estate Index. Your Fund’s long-term performance appears later in this report. | |
| Fund vs. Indexes | | | | |
| Total returns, 12/31/18 to 12/31/19, excluding variable product issuer charges. If variable product issuer charges were included, returns would be lower. | | | | |
| Series I Shares | | | 23.00 | % |
| Series II Shares | | | 22.65 | |
| MSCI World Indexq(Broad Market Index) | | | 27.67 | |
| Custom Invesco Global Real Estate Index∎(Style-Specific Index) | | | 22.50 | |
| Lipper VUF Real Estate Funds Classification Average◆ (Peer Group) | | | 27.14 | |
| |
| Source(s):qRIMES Technologies Corp.;∎Invesco, RIMES Technologies Corp.;◆Lipper Inc. | | | | |
Market conditions and your Fund
Global economic data ended the year with indications of improving growth conditions for several important countries. The US Federal Reserve (the Fed) signaled limited interest rate change probability, reflecting a constructive view of the underlying US economy. US job growth and housing conditions accelerated toward the end of the year, with borrowing costs and income levels comparing favorably to prior year levels. Progress toward aUS-China trade resolution improved investor confidence and increased risk appetites in equity markets toward year end. Regional economic activity in the Asia Pacific region was subdued at the end of the year, although confidence indicators were starting to show incremental improvements. European economic data was relatively poor toward the end of the year, with headlines focused on the fragility of the German manufacturing sector and the economic impact of political uncertainty in the UK. Both countries have flirted with recession, but have so far avoided it.
More positively, the French and Spanish economies were both improving slightly, while the Swedish Riksbank saw enough health in its domestic economy to raise interest rates and remove the country’s negative interest rate policy. The recent UK general election brought greater clarity on Brexit prospects, albeit the challenge of negotiating a trade deal between the UK and the European Union still needs to be met.
Global listed real estate delivered performance above its long-term average absolute performance in 2019. Performance was driven by a combination of supportive fundamental and macroeconomic-related factors. Real estate investment trusts (REITs) delivered modest cash flow growth during the year, as expected, and REITs experienced multiple expansions as markets tended to reward predictable growth and well-covered dividends during a period of falling bond yields and slowing global growth. The end of the Fed’s period of monetary tightening served as a meaningful inflection point. Almost all the world’s key central banks added stimulus
in 2019, which we believe is unlikely to be reversed in 2020 as inflation remains low. Demand for quality investment income remained undiminished in this low rate environment. Institutional allocations to direct real estate remained under-invested, which may be supportive of capital values for real estate in 2020. We believe slower global growth from 2019 may be followed with slightly improved growth. We believe such expansion may be supportive of tenant demand for real estate and where new development supply is not forthcoming, pricing power for landlords should remain and rent growth may be expected.
Overall, the Fund modestly outperformed its style-specific benchmark during a year of strong positive performance. Key relative contributors included overall security selection, particularly in the US, the UK and China. Key relative detractors included security selection in Canada, an overweight allocation to Germany and an allocation to cash. Although the portfolio held a small amount of ancillary cash, it detracted meaningfully, as markets gained significant ground over the year.
Top contributors to the Fund’s absolute performance during the year included industrial space owner and developerPrologis. A number of residential REITs also did well over the year, benefiting from economic and job growth tail-winds, includingMid-America Apartment CommunitiesandInvitation Homes. In one of the largest transactions this year, Prologis acquiredLiberty Property Trustin anall-stock deal valued at $12.6 billion, representing an opportunity for Prologis to utilize its global platform as a leading operator of distribution centers that serve local consumers or more global trade routes.
| | | | |
Portfolio Composition | |
By country | | | % of total net assets | |
| | | | |
| |
| United States | | | 47.79% | |
| Japan | | | 10.40 | |
| China | | | 6.33 | |
| Hong Kong | | | 5.86 | |
| Germany | | | 4.91 | |
| United Kingdom | | | 4.64 | |
| Australia | | | 3.05 | |
| Canada | | | 2.90 | |
| Singapore | | | 2.53 | |
| France | | | 2.25 | |
| Countries, each less than 2% of portfolio | | | 7.71 | |
| Money Market Funds Plus Other | | | | |
| Assets Less Liabilities | | | 1.63 | |
| | |
Top 10 Equity Holdings* |
% of total net assets |
| | | | |
| |
| 1. Boston Properties, Inc. | | | 3.16% | |
2. Prologis, Inc. | | | 2.99 | |
3. AvalonBay Communities, Inc. | | | 2.80 | |
4. Simon Property Group, Inc. | | | 2.43 | |
5. Ventas, Inc. | | | 2.38 | |
6. Healthpeak Properties, Inc. | | | 1.92 | |
7. Vonovia SE | | | 1.91 | |
8. VICI Properties, Inc. | | | 1.56 | |
9. UDR, Inc. | | | 1.49 | |
10. Hudson Pacific Properties, Inc. | | | 1.48 | |
| | | | |
Total Net Assets | | $ | 195.5 million | |
| | | | |
| |
Total Number of Holdings* | | | 181 | |
The Fund’s holdings are subject to change, and there is no assurance that the Fund will continue to hold any particular security.
*Excluding money market fund holdings, if any.
Data presented here are as of December 31, 2019.
Invesco V.I. Global Real Estate Fund
Top detractors from the Fund’s absolute performance during the year includedMacerichandVentas. Macerich is a regional mall operator that owns high-quality properties in the US. The company offered a discounted valuation and the prospect of stabilized operating results. Healthcare REIT Ventas reported a more modest outlook in the senior housing component of its business during the year, yet we believe the potential for growth remains favorable over the longer term.
New holdings added to the Fund during the year included US REITEssential Propertiesand Japanese REITsTokyu Fudosan HoldingsandLaSalle Logiport.
At the end of the year, the Fund held neutral exposure to the North America region versus the style-specific benchmark, with a modest overweight position in Canada and a slight underweight position in the US. In the US, positioning focused on sectors and market exposures that support rental growth, as well as companies that can generate growth from attractive capital deployment opportunities.
The Fund ended the year with an underweight allocation to the Asia Pacific region versus the style-specific benchmark, with a focus on stocks with company-specific growth opportunities and local relative value opportunity. Country weights across the region showed generally neutral exposure to Hong Kong and Japan and underweight exposure to Singapore and Australia, relative to the style-specific benchmark.
The Fund also held an underweight allocation to the European region versus the style-specific benchmark at the close of the year. Key active positioning reflected a material underweight exposure to retail-focused REITs and overweight exposure to the secular growth prospects of industrial and residential real estate. Material country overweight exposure to Continental Europe was focused on Germany and smaller country overweight exposure was held in Spain.
The Fund ended the year with a small underweight allocation to emerging markets versus the style-specific benchmark. Key active positioning resulted in relative underweight exposure to Chinese and Brazilian homebuilders and relative overweight exposure to Thailand and Philippines.
At the end of the year, real estate continued to offer investors tangible asset exposure, with rents that could adjust upward (or downward) over time with economic strength and inflation. Listed
real estate companies generally maintained financial discipline, falling credit costs were improving cash flows modestly and absolute levels of debt remained in check. Many companies had the ability to utilize attractively priced new equity and debt to complete accretive acquisitions and enhance their growth rate. While recognizing the need to maintain attractive yield characteristics in an income-starved world, our overall portfolio maintained a bias toward companies with higher quality assets, supply-constrained real estate market exposure, generally lower-leveraged balance sheets and, most importantly, above-average earnings and asset value growth.
We thank you for your continued investment in Invesco V.I. Global Real Estate Fund.
Portfolio managers:
Mark Blackburn
James Cowen -Co-lead
Paul Curbo -Co-lead
Grant Jackson
Joe Rodriguez, Jr. -Co-lead
Darin Turner
Ping-Ying Wang -Co-lead
The views and opinions expressed in management’s discussion of Fund performance are those of Invesco Advisers, Inc. These views and opinions are subject to change at any time based on factors such as market and economic conditions. These views and opinions may not be relied upon as investment advice or recommendations, or as an offer for a particular security. The information is not a complete analysis of every aspect of any market, country, industry, security or the Fund. Statements of fact are from sources considered reliable, but Invesco Advisers, Inc. makes no representation or warranty as to their completeness or accuracy. Although historical performance is no guarantee of future results, these insights may help you understand our investment management philosophy.
See important Fund and, if applicable, index disclosures later in this report.
Invesco V.I. Global Real Estate Fund
Your Fund’s Long-Term Performance
Results of a $10,000 Investment – Oldest Share Class(es)
Fund and index data from 12/31/09
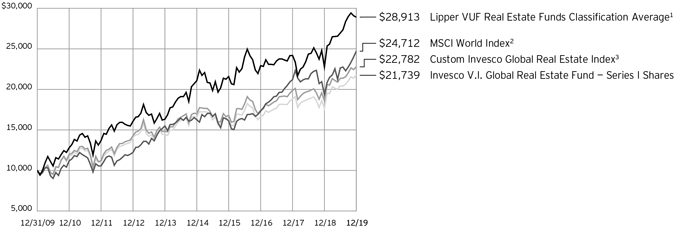
| 2 | Source: RIMES Technologies Corp. |
| 3 | Sources: Invesco, RIMES Technologies Corp. |
Past performance cannot guarantee
future results.
| | | | |
| Average Annual Total Returns | |
As of 12/31/19 | | | | |
| |
| Series I Shares | | | | |
| Inception (3/31/98) | | | 7.96% | |
| 10 Years | | | 8.07 | |
| 5 Years | | | 5.58 | |
| 1 Year | | | 23.00 | |
| |
| Series II Shares | | | | |
| Inception (4/30/04) | | | 7.90% | |
| 10 Years | | | 7.81 | |
| 5 Years | | | 5.31 | |
| 1 Year | | | 22.65 | |
The performance of the Fund’s Series I and Series II share classes will differ primarily due to different class expenses.
The performance data quoted represent past performance and cannot guarantee future results; current performance may be lower or higher. Please contact your variable product issuer or financial adviser for the most recentmonth-end variable product performance. Performance figures reflect Fund expenses, reinvested distributions and changes in net asset value. Performance figures do not reflect deduction of taxes a shareholder would pay on Fund distributions or sale of Fund shares. Investment return and principal value will fluctuate so that you may have a gain or loss when you sell shares.
The total annual Fund operating expense ratio set forth in the most recent Fund prospectus as of the date of this report for Series I and Series II shares was 1.01% and 1.26%, respectively. The expense ratios
presented above may vary from the expense ratios presented in other sections of this report that are based on expenses incurred during the period covered by this report.
Invesco V.I. Global Real Estate Fund, a series portfolio of AIM Variable Insurance Funds (Invesco Variable Insurance Funds), is currently offered through insurance companies issuing variable products. You cannot purchase shares of the Fund directly. Performance figures given represent the Fund and are not intended to reflect actual variable product values. They do not reflect sales charges, expenses and fees assessed in connection with a variable product. Sales charges, expenses and fees, which are determined by the variable product issuers, will vary and will lower the total return.
The most recentmonth-end performance at the Fund level, excluding variable product charges, is available at 800 451 4246. As mentioned above, for the most recentmonth-end performance including variable product charges, please contact your variable product issuer or financial adviser.
Fund performance reflects any applicable fee waivers and/or expense reimbursements. Had the adviser not waived fees and/or reimbursed expenses currently or in the past, returns would have been lower. See current prospectus for more information.
Invesco V.I. Global Real Estate Fund
Invesco V.I. Global Real Estate Fund’s investment objective is total return through growth of capital and current income.
| ∎ | | Unless otherwise stated, information presented in this report is as of December 31, 2019, and is based on total net assets. |
| ∎ | | Unless otherwise noted, all data provided by Invesco. |
| ∎ | | To access your Fund’s reports/prospectus, visit invesco.com/fundreports. |
About indexes used in this report
| ∎ | | TheMSCI World IndexSMis an unmanaged index considered representative of stocks of developed countries. The index is computed using the net return, which withholds applicable taxes fornon-resident investors. |
| ∎ | | TheCustom Invesco Global Real Estate Indexis composed of the FTSE EPRA/NAREIT Developed Index (gross) from Fund inception through February 17, 2005; the FTSE EPRA/ NAREIT Developed Index (net) from February 18, 2005, through June 30, 2014; and the FTSE/EPRA NAREIT Global Index (net) thereafter. |
| ∎ | | TheLipper VUF Real Estate Funds Classification Averagerepresents an average of all variable insurance underlying funds in the Lipper Real Estate Funds classification. |
| ∎ | | TheFTSE EPRA/NAREIT Developed Indexis considered representative of global real estate companies and REITs. The net version of the index is computed using the net return, which withholds taxes fornon-resident investors. |
| ∎ | | TheFTSE EPRA/NAREIT Global Indexis designed to track the performance of listed real estate companies and REITS in developed and emerging markets. The net version of the index is computed using the net return, which withholds taxes fornon-resident investors. |
| ∎ | | The Fund is not managed to track the performance of any particular index, including the index(es) described here, and consequently, the performance of the Fund may deviate significantly from the performance of the index(es). |
| ∎ | | A direct investment cannot be made in an index. Unless otherwise indicated, index results include reinvested dividends, and they do not reflect sales charges. Performance of the peer group, if applicable, reflects fund expenses; performance of a market index does not. |
Other information
| ∎ | | The returns shown in management’s discussion of Fund performance are based on net asset values calculated for shareholder transactions. |
| | | Generally accepted accounting principles require adjustments to be made to the net assets of the Fund at period end for financial reporting purposes, and as such, the net asset values for shareholder transactions and the returns based on those net asset values may differ from the net asset values and returns reported in the Financial Highlights. Additionally, the returns and net asset values shown throughout this report are at the Fund level only and do not include variable product issuer charges. If such charges were included, the total returns would be lower. |
| ∎ | | Industry classifications used in this report are generally according to the Global Industry Classification Standard, which was developed by and is the exclusive property and a service mark of MSCI Inc. and Standard & Poor’s. |
Invesco V.I. Global Real Estate Fund
Schedule of Investments
December 31, 2019
| | | | | | | | |
| | | Shares | | | Value | |
Common Stocks & Other Equity Interests–98.37% | |
| Australia–3.05% | |
Dexus | | | 122,486 | | | $ | 1,007,893 | |
| |
Goodman Group | | | 96,294 | | | | 905,181 | |
| |
GPT Group (The) | | | 173,717 | | | | 683,834 | |
| |
Mirvac Group | | | 566,173 | | | | 1,266,288 | |
| |
Scentre Group | | | 778,157 | | | | 2,094,968 | |
| |
| | | | | | | 5,958,164 | |
| |
|
| Brazil–0.56% | |
BR Malls Participacoes S.A. | | | 108,925 | | | | 489,679 | |
| |
Cyrela Brazil Realty S.A. Empreendimentos e Participacoes | | | 34,800 | | | | 257,324 | |
| |
Multiplan Empreendimentos Imobiliarios S.A. | | | 41,700 | | | | 343,838 | |
| |
| | | | | | | 1,090,841 | |
| |
|
| Canada–2.90% | |
Allied Properties REIT | | | 34,972 | | | | 1,402,327 | |
| |
Canadian Apartment Properties REIT | | | 23,906 | | | | 975,902 | |
| |
H&R REIT | | | 25,981 | | | | 422,162 | |
| |
Killam Apartment REIT | | | 70,471 | | | | 1,027,855 | |
| |
SmartCentres REIT | | | 59,311 | | | | 1,425,510 | |
| |
Summit Industrial Income REIT | | | 45,000 | | | | 417,928 | |
| |
| | | | | | | 5,671,684 | |
| |
|
| Chile–0.08% | |
Parque Arauco S.A. | | | 60,410 | | | | 148,901 | |
| |
|
| China–6.33% | |
Agile Group Holdings Ltd. | | | 284,000 | | | | 427,816 | |
| |
CapitaLand Retail China Trust | | | 301,256 | | | | 360,594 | |
| |
China Aoyuan Group Ltd. | | | 53,000 | | | | 86,621 | |
| |
China Evergrande Group(a) | | | 218,000 | | | | 606,505 | |
| |
China Jinmao Holdings Group Ltd. | | | 748,000 | | | | 583,265 | |
| |
China Overseas Land & Investment Ltd. | | | 412,000 | | | | 1,609,085 | |
| |
China Resources Land Ltd. | | | 292,444 | | | | 1,457,150 | |
| |
China SCE Group Holdings Ltd. | | | 594,000 | | | | 346,760 | |
| |
China Vanke Co. Ltd., H Shares | | | 198,500 | | | | 847,369 | |
| |
CIFI Holdings Group Co. Ltd. | | | 366,000 | | | | 309,713 | |
| |
Country Garden Holdings Co. Ltd. | | | 841,000 | | | | 1,351,389 | |
| |
Guangzhou R&F Properties Co. Ltd., H Shares | | | 170,400 | | | | 314,621 | |
| |
Jiayuan International Group Ltd. | | | 106,000 | | | | 41,517 | |
| |
Logan Property Holdings Co. Ltd. | | | 184,000 | | | | 309,533 | |
| |
Longfor Group Holdings Ltd.(b) | | | 173,500 | | | | 814,848 | |
| |
Ronshine China Holdings Ltd.(a) | | | 121,500 | | | | 168,523 | |
| |
Shenzhen Investment Ltd. | | | 496,000 | | | | 198,703 | |
| |
Shimao Property Holdings Ltd. | | | 125,000 | | | | 485,418 | |
| |
SOHO China Ltd. | | | 213,500 | | | | 80,598 | |
| |
Sunac China Holdings Ltd. | | | 232,000 | | | | 1,390,323 | |
| |
Times China Holdings Ltd. | | | 78,000 | | | | 156,025 | |
| |
| | | | | | | | |
| | | Shares | | | Value | |
| China–(continued) | |
Times Neighborhood Holdings Ltd.(a) | | | 30,000 | | | $ | 18,672 | |
| |
Yanlord Land Group Ltd. | | | 72,800 | | | | 65,524 | |
| |
Yuexiu Property Co. Ltd. | | | 1,468,000 | | | | 339,672 | |
| |
| | | | | | | 12,370,244 | |
| |
|
| France–2.25% | |
Gecina S.A. | | | 7,053 | | | | 1,264,228 | |
| |
ICADE | | | 9,779 | | | | 1,066,090 | |
| |
Unibail-Rodamco-Westfield | | | 159 | | | | 25,085 | |
| |
Unibail-Rodamco-Westfield | | | 12,989 | | | | 2,052,180 | |
| |
| | | | | | | 4,407,583 | |
| |
|
| Germany–4.91% | |
Aroundtown S.A. | | | 165,104 | | | | 1,478,537 | |
| |
Deutsche Wohnen SE | | | 39,424 | | | | 1,611,120 | |
| |
Grand City Properties S.A. | | | 63,690 | | | | 1,527,519 | |
| |
LEG Immobilien AG | | | 10,461 | | | | 1,238,977 | |
| |
Vonovia SE | | | 69,385 | | | | 3,735,418 | |
| |
| | | | | | | 9,591,571 | |
| |
|
| Hong Kong–5.86% | |
CK Asset Holdings Ltd. | | | 194,300 | | | | 1,408,159 | |
| |
Hang Lung Properties Ltd. | | | 550,000 | | | | 1,202,378 | |
| |
K Wah International Holdings Ltd. | | | 120,000 | | | | 67,056 | |
| |
Kerry Properties Ltd. | | | 63,000 | | | | 200,767 | |
| |
Link REIT | | | 226,500 | | | | 2,404,621 | |
| |
Mapletree North Asia Commercial Trust | | | 178,000 | | | | 153,668 | |
| |
New World Development Co. Ltd. | | | 910,000 | | | | 1,248,038 | |
| |
Sino Land Co. Ltd. | | | 374,000 | | | | 544,916 | |
| |
Sun Hung Kai Properties Ltd. | | | 172,000 | | | | 2,638,347 | |
| |
Swire Properties Ltd. | | | 219,800 | | | | 730,396 | |
| |
Wharf Real Estate Investment Co. Ltd. | | | 123,000 | | | | 754,222 | |
| |
Yuexiu REIT | | | 156,000 | | | | 105,735 | |
| |
| | | | | | | 11,458,303 | |
| |
|
| India–0.11% | |
DLF Ltd. | | | 6,013 | | | | 19,463 | |
| |
Oberoi Realty Ltd. | | | 27,494 | | | | 204,805 | |
| |
| | | | | | | 224,268 | |
| |
|
| Indonesia–0.18% | |
PT Bumi Serpong Damai Tbk(a) | | | 864,800 | | | | 77,976 | |
| |
PT Pakuwon Jati Tbk | | | 4,632,400 | | | | 189,742 | |
| |
PT Summarecon Agung Tbk | | | 1,301,200 | | | | 94,119 | |
| |
| | | | | | | 361,837 | |
| |
|
| Japan–10.40% | |
Activia Properties, Inc. | | | 219 | | | | 1,098,243 | |
| |
Comforia Residential REIT, Inc. | | | 301 | | | | 952,751 | |
| |
Daiwa House REIT Investment Corp. | | | 330 | | | | 862,106 | |
| |
Daiwa Office Investment Corp. | | | 181 | | | | 1,390,401 | |
| |
See accompanying Notes to Financial Statements which are an integral part of the financial statements.
Invesco V.I. Global Real Estate Fund
| | | | | | | | |
| | | Shares | | | Value | |
| Japan–(continued) | |
Invincible Investment Corp. | | | 905 | | | $ | 515,545 | |
| |
Japan Hotel REIT Investment Corp. | | | 462 | | | | 345,225 | |
| |
Japan Real Estate Investment Corp. | | | 179 | | | | 1,187,527 | |
| |
Japan Rental Housing Investments, Inc. | | | 580 | | | | 567,412 | |
| |
Japan Retail Fund Investment Corp. | | | 327 | | | | 703,028 | |
| |
LaSalle Logiport REIT | | | 519 | | | | 771,031 | |
| |
Mitsubishi Estate Co. Ltd. | | | 93,220 | | | | 1,782,106 | |
| |
Mitsui Fudosan Co. Ltd. | | | 98,258 | | | | 2,399,847 | |
| |
Mitsui Fudosan Logistics Park, Inc. | | | 198 | | | | 879,218 | |
| |
Mori Hills REIT Investment Corp. | | | 442 | | | | 734,186 | |
| |
Nippon Accommodations Fund, Inc. | | | 108 | | | | 682,454 | |
| |
Nippon Building Fund, Inc. | | | 126 | | | | 923,283 | |
| |
Nomura Real Estate Holdings, Inc. | | | 25,400 | | | | 611,231 | |
| |
Nomura Real Estate Master Fund, Inc. | | | 412 | | | | 704,085 | |
| |
ORIX JREIT, Inc. | | | 273 | | | | 591,949 | |
| |
Sumitomo Realty & Development Co. Ltd. | | | 46,589 | | | | 1,624,980 | |
| |
Tokyu Fudosan Holdings Corp. | | | 145,500 | | | | 1,004,643 | |
| |
| | | | | | | 20,331,251 | |
| |
|
| Malaysia–0.14% | |
IOI Properties Group Bhd. | | | 394,600 | | | | 119,725 | |
| |
Mah Sing Group Bhd. | | | 291,200 | | | | 50,261 | |
| |
Sime Darby Property Bhd. | | | 465,100 | | | | 104,156 | |
| |
| | | | | | | 274,142 | |
| |
|
| Malta–0.00% | |
BGP Holdings PLC, (Acquired 08/06/2009; Cost $0)(a)(c) | | | 1,355,927 | | | | 0 | |
| |
|
| Mexico–0.49% | |
Fibra Uno Administracion S.A. de C.V. | | | 335,200 | | | | 519,088 | |
| |
Macquarie Mexico Real Estate Management S.A. de C.V.(b) | | | 217,800 | | | | 284,755 | |
| |
PLA Administradora Industrial, S. de R.L. de C.V. | | | 96,200 | | | | 157,726 | |
| |
| | | | | | | 961,569 | |
| |
|
| Philippines–0.95% | |
Altus San Nicolas Corp.(a)(c) | | | 4,684 | | | | 481 | |
| |
Ayala Land, Inc. | | | 722,930 | | | | 648,325 | |
| |
Megaworld Corp. | | | 5,405,300 | | | | 425,445 | |
| |
SM Prime Holdings, Inc. | | | 954,800 | | | | 791,932 | |
| |
| | | | | | | 1,866,183 | |
| |
|
| Singapore–2.53% | |
Ascendas India Trust | | | 169,800 | | | | 195,763 | |
| |
Ascendas REIT | | | 373,056 | | | | 824,189 | |
| |
CapitaLand Commercial Trust | | | 288,700 | | | | 427,444 | |
| |
CapitaLand Ltd. | | | 353,400 | | | | 985,678 | |
| |
CapitaLand Mall Trust | | | 305,800 | | | | 559,440 | |
| |
City Developments Ltd. | | | 73,000 | | | | 595,317 | |
| |
Mapletree Commercial Trust | | | 494,621 | | | | 879,050 | |
| |
Mapletree Logistics Trust | | | 363,500 | | | | 470,582 | |
| |
| | | | | | | 4,937,463 | |
| |
| | | | | | | | |
| | | Shares | | | Value | |
|
| South Africa–0.66% | |
Growthpoint Properties Ltd. | | | 374,398 | | | $ | 592,484 | |
| |
Hyprop Investments Ltd. | | | 42,310 | | | | 169,301 | |
| |
Redefine Properties Ltd. | | | 621,965 | | | | 336,284 | |
| |
SA Corporate Real Estate Ltd. | | | 881,591 | | | | 192,697 | |
| |
| | | | | | | 1,290,766 | |
| |
|
| Spain–1.02% | |
Inmobiliaria Colonial SOCIMI S.A. | | | 73,676 | | | | 940,116 | |
| |
Merlin Properties SOCIMI S.A. | | | 72,890 | | | | 1,047,498 | |
| |
| | | | | | | 1,987,614 | |
| |
|
| Sweden–1.85% | |
Fabege AB | | | 68,831 | | | | 1,144,750 | |
| |
Hufvudstaden AB, Class A | | | 60,643 | | | | 1,198,910 | |
| |
Wihlborgs Fastigheter AB | | | 69,289 | | | | 1,276,265 | |
| |
| | | | | | | 3,619,925 | |
| |
|
| Switzerland–0.87% | |
Swiss Prime Site AG(a) | | | 14,599 | | | | 1,692,380 | |
| |
|
| Thailand–0.60% | |
AP Thailand PCL, Foreign Shares | | | 268,400 | | | | 66,036 | |
| |
Central Pattana PCL, Foreign Shares | | | 500,900 | | | | 1,035,493 | |
| |
Supalai PCL, Foreign Shares | | | 67,600 | | | | 40,235 | |
| |
Supalai PCL, NVDR | | | 41,900 | | | | 24,939 | |
| |
| | | | | | | 1,166,703 | |
| |
|
| Turkey–0.03% | |
Emlak Konut Gayrimenkul Yatirim Ortakligi A.S. | | | 227,990 | | | | 55,988 | |
| |
|
| United Arab Emirates–0.17% | |
Emaar Development PJSC | | | 220,013 | | | | 234,889 | |
| |
Emaar Malls PJSC | | | 203,254 | | | | 101,208 | |
| |
| | | | | | | 336,097 | |
| |
|
| United Kingdom–4.64% | |
Assura PLC | | | 831,882 | | | | 859,890 | |
| |
Big Yellow Group PLC | | | 42,671 | | | | 679,907 | |
| |
Derwent London PLC | | | 17,331 | | | | 925,682 | |
| |
GCP Student Living PLC | | | 198,924 | | | | 522,213 | |
| |
Grainger PLC | | | 163,808 | | | | 680,073 | |
| |
Land Securities Group PLC | | | 136,905 | | | | 1,798,977 | |
| |
Segro PLC | | | 152,964 | | | | 1,825,903 | |
| |
Tritax Big Box REIT PLC | | | 518,072 | | | | 1,022,533 | |
| |
Workspace Group PLC | | | 47,704 | | | | 755,945 | |
| |
| | | | | | | 9,071,123 | |
| |
|
| United States–47.79% | |
Agree Realty Corp. | | | 24,758 | | | | 1,737,269 | |
| |
Alexandria Real Estate Equities, Inc. | | | 10,642 | | | | 1,719,534 | |
| |
American Assets Trust, Inc. | | | 14,396 | | | | 660,776 | |
| |
American Homes 4 Rent, Class A | | | 73,145 | | | | 1,917,130 | |
| |
Americold Realty Trust | | | 47,997 | | | | 1,682,775 | |
| |
AvalonBay Communities, Inc. | | | 26,135 | | | | 5,480,509 | |
| |
See accompanying Notes to Financial Statements which are an integral part of the financial statements.
Invesco V.I. Global Real Estate Fund
| | | | | | | | |
| | | Shares | | | Value | |
| United States–(continued) | |
Boston Properties, Inc. | | | 44,871 | | | $ | 6,185,916 | |
| |
Camden Property Trust | | | 11,555 | | | | 1,225,986 | |
| |
CareTrust REIT, Inc. | | | 24,722 | | | | 510,015 | |
| |
Crown Castle International Corp. | | | 6,907 | | | | 981,830 | |
| |
CyrusOne, Inc. | | | 13,988 | | | | 915,235 | |
| |
Digital Realty Trust, Inc. | | | 9,868 | | | | 1,181,594 | |
| |
EastGroup Properties, Inc. | | | 5,267 | | | | 698,773 | |
| |
Empire State Realty Trust, Inc., Class A | | | 68,894 | | | | 961,760 | |
| |
EPR Properties | | | 14,782 | | | | 1,044,200 | |
| |
Equity LifeStyle Properties, Inc. | | | 17,227 | | | | 1,212,609 | |
| |
Essential Properties Realty Trust, Inc. | | | 28,002 | | | | 694,730 | |
| |
Essex Property Trust, Inc. | | | 6,593 | | | | 1,983,570 | |
| |
Extra Space Storage, Inc. | | | 5,891 | | | | 622,207 | |
| |
Federal Realty Investment Trust | | | 10,711 | | | | 1,378,827 | |
| |
Four Corners Property Trust, Inc. | | | 14,324 | | | | 403,794 | |
| |
Gaming and Leisure Properties, Inc. | | | 17,619 | | | | 758,498 | |
| |
Healthpeak Properties, Inc. | | | 108,709 | | | | 3,747,199 | |
| |
Hudson Pacific Properties, Inc. | | | 77,108 | | | | 2,903,116 | |
| |
Invitation Homes, Inc. | | | 86,862 | | | | 2,603,254 | |
| |
Macerich Co. (The) | | | 52,034 | | | | 1,400,755 | |
| |
Medical Properties Trust, Inc. | | | 57,802 | | | | 1,220,200 | |
| |
Mid-America Apartment Communities, Inc. | | | 13,332 | | | | 1,757,958 | |
| |
Omega Healthcare Investors, Inc. | | | 30,081 | | | | 1,273,930 | |
| |
Park Hotels & Resorts, Inc. | | | 51,717 | | | | 1,337,919 | |
| |
Pebblebrook Hotel Trust | | | 70,861 | | | | 1,899,783 | |
| |
Prologis, Inc. | | | 65,471 | | | | 5,836,085 | |
| |
Public Storage | | | 9,468 | | | | 2,016,305 | |
| |
QTS Realty Trust, Inc., Class A | | | 24,211 | | | | 1,313,931 | |
| |
Realty Income Corp. | | | 11,708 | | | | 862,060 | |
| |
Regency Centers Corp. | | | 18,475 | | | | 1,165,588 | |
| |
| | | | | | | | |
| | | Shares | | | Value | |
| United States–(continued) | |
Retail Opportunity Investments Corp. | | | 46,719 | | | $ | 825,058 | |
| |
Rexford Industrial Realty, Inc. | | | 23,471 | | | | 1,071,921 | |
| |
RLJ Lodging Trust | | | 83,590 | | | | 1,481,215 | |
| |
SBA Communications Corp., Class A | | | 3,559 | | | | 857,683 | |
| |
Simon Property Group, Inc. | | | 31,872 | | | | 4,747,653 | |
| |
STAG Industrial, Inc. | | | 49,263 | | | | 1,555,233 | |
| |
Sun Communities, Inc. | | | 17,315 | | | | 2,598,981 | |
| |
Sunstone Hotel Investors, Inc. | | | 39,151 | | | | 544,982 | |
| |
Terreno Realty Corp. | | | 18,916 | | | | 1,024,112 | |
| |
UDR, Inc. | | | 62,428 | | | | 2,915,388 | |
| |
Ventas, Inc. | | | 80,439 | | | | 4,644,548 | |
| |
VEREIT, Inc. | | | 165,428 | | | | 1,528,555 | |
| |
VICI Properties, Inc. | | | 119,502 | | | | 3,053,276 | |
| |
Vornado Realty Trust | | | 27,627 | | | | 1,837,196 | |
| |
Welltower, Inc. | | | 17,669 | | | | 1,444,971 | |
| |
| | | | | | | 93,426,392 | |
| |
Total Common Stocks & Other Equity Interests (Cost $168,467,277) | | | | 192,300,992 | |
| |
|
| Money Market Funds–1.26% | |
Invesco Government & Agency Portfolio, Institutional Class, 1.50%(d) | | | 857,646 | | | | 857,646 | |
| |
Invesco Liquid Assets Portfolio, Institutional Class, 1.71%(d) | | | 618,784 | | | | 618,970 | |
| |
Invesco Treasury Portfolio, Institutional Class, 1.49%(d) | | | 980,167 | | | | 980,167 | |
| |
Total Money Market Funds
(Cost $2,456,793) | | | | | | | 2,456,783 | |
| |
TOTAL INVESTMENTS IN SECURITIES–99.63%
(Cost $170,924,070) | | | | 194,757,775 | |
| |
OTHER ASSETS LESS LIABILITIES–0.37% | | | | 729,902 | |
| |
NET ASSETS-100.00% | | | | | | $ | 195,487,677 | |
| |
Investment Abbreviations:
| | |
| NVDR | | – Non-Voting Depositary Receipt |
| REIT | | – Real Estate Investment Trust |
Notes to Schedule of Investments:
| (a) | Non-income producing security. |
| (b) | Security purchased or received in a transaction exempt from registration under the Securities Act of 1933, as amended (the “1933 Act”). The security may be resold pursuant to an exemption from registration under the 1933 Act, typically to qualified institutional buyers. The aggregate value of these securities at December 31, 2019 was $1,099,603, which represented less than 1% of the Fund’s Net Assets. |
| (c) | Security valued using significant unobservable inputs (Level 3). See Note 3. |
| (d) | The money market fund and the Fund are affiliated by having the same investment adviser. The rate shown is the7-day SEC standardized yield as of December 31, 2019. |
See accompanying Notes to Financial Statements which are an integral part of the financial statements.
Invesco V.I. Global Real Estate Fund
Statement of Assets and Liabilities
December 31, 2019
| | | | |
Assets: | | | | |
Investments in securities, at value
(Cost $168,467,277) | | $ | 192,300,992 | |
| |
Investments in affiliated money market funds, at value (Cost $2,456,793) | | | 2,456,783 | |
| |
Foreign currencies, at value (Cost $217,154) | | | 217,374 | |
| |
Receivable for: | | | | |
Investments sold | | | 43,613 | |
| |
Fund shares sold | | | 23,636 | |
| |
Dividends | | | 781,357 | |
| |
Investment for trustee deferred compensation and retirement plans | | | 75,885 | |
| |
Other assets | | | 22,383 | |
| |
Total assets | | | 195,922,023 | |
| |
| |
Liabilities: | | | | |
Payable for: | | | | |
Investments purchased | | | 21,261 | |
| |
Fund shares reacquired | | | 116,219 | |
| |
Amount due custodian | | | 18,582 | |
| |
Accrued foreign taxes | | | 5,010 | |
| |
Accrued fees to affiliates | | | 103,250 | |
| |
Accrued other operating expenses | | | 85,848 | |
| |
Trustee deferred compensation and retirement plans | | | 84,176 | |
| |
Total liabilities | | | 434,346 | |
| |
Net assets applicable to shares outstanding | | $ | 195,487,677 | |
| |
| |
Net assets consist of: | | | | |
Shares of beneficial interest | | $ | 165,667,385 | |
| |
Distributable earnings | | | 29,820,292 | |
| |
| | $ | 195,487,677 | |
| |
| |
Net Assets: | | | | |
Series I | | $ | 150,254,572 | |
| |
Series II | | $ | 45,233,105 | |
| |
|
Shares outstanding, no par value, with an unlimited number of shares authorized: | |
Series I | | | 8,248,340 | |
| |
Series II | | | 2,544,661 | |
| |
Series I: | | | | |
Net asset value per share | | $ | 18.22 | |
| |
Series II: | | | | |
Net asset value per share | | $ | 17.78 | |
| |
Statement of Operations
For the year ended December 31, 2019
| | | | |
Investment income: | | | | |
Dividends (net of foreign withholding taxes of $280,951) | | $ | 5,998,563 | |
| |
Dividends from affiliated money market funds | | | 56,089 | |
| |
Total investment income | | | 6,054,652 | |
| |
| |
Expenses: | | | | |
Advisory fees | | | 1,391,610 | |
| |
Administrative services fees | | | 298,898 | |
| |
Custodian fees | | | 97,151 | |
| |
Distribution fees - Series II | | | 104,243 | |
| |
Transfer agent fees | | | 34,868 | |
| |
Trustees’ and officers’ fees and benefits | | | 20,998 | |
| |
Reports to shareholders | | | 13,684 | |
| |
Professional services fees | | | 49,062 | |
| |
Other | | | 18,413 | |
| |
Total expenses | | | 2,028,927 | |
| |
Less: Fees waived | | | (2,990 | ) |
| |
Net expenses | | | 2,025,937 | |
| |
Net investment income | | | 4,028,715 | |
| |
| |
Realized and unrealized gain (loss) from: | | | | |
Net realized gain (loss) from: | | | | |
Investment securities (net of foreign taxes of $50,159) | | | 6,517,104 | |
| |
Foreign currencies | | | (13,574 | ) |
| |
| | | 6,503,530 | |
| |
Change in net unrealized appreciation of: | | | | |
Investment securities (net of foreign taxes of $12,007) | | | 25,177,524 | |
| |
Foreign currencies | | | 2,243 | |
| |
| | | 25,179,767 | |
| |
Net realized and unrealized gain | | | 31,683,297 | |
| |
Net increase in net assets resulting from operations | | $ | 35,712,012 | |
| |
See accompanying Notes to Financial Statements which are an integral part of the financial statements.
Invesco V.I. Global Real Estate Fund
Statement of Changes in Net Assets
For the years ended December 31, 2019 and 2018
| | | | | | | | |
| | | 2019 | | | 2018 | |
| |
Operations: | | | | | | | | |
Net investment income | | $ | 4,028,715 | | | $ | 7,824,734 | |
| |
Net realized gain | | | 6,503,530 | | | | 32,257,333 | |
| |
Change in net unrealized appreciation (depreciation) | | | 25,179,767 | | | | (62,318,170 | ) |
| |
Net increase (decrease) in net assets resulting from operations | | | 35,712,012 | | | | (22,236,103 | ) |
| |
| | |
Distributions to shareholders from distributable earnings: | | | | | | | | |
Series I | | | (6,628,755 | ) | | | (6,963,469 | ) |
| |
Series II | | | (1,565,707 | ) | | | (12,230,519 | ) |
| |
Total distributions from distributable earnings | | | (8,194,462 | ) | | | (19,193,988 | ) |
| |
| | |
Share transactions–net: | | | | | | | | |
Series I | | | 3,645,528 | | | | (17,886,490 | ) |
| |
Series II | | | 12,709,777 | | | | (207,381,121 | ) |
| |
Net increase (decrease) in net assets resulting from share transactions | | | 16,355,305 | | | | (225,267,611 | ) |
| |
Net increase (decrease) in net assets | | | 43,872,855 | | | | (266,697,702 | ) |
| |
| | |
Net assets: | | | | | | | | |
Beginning of year | | | 151,614,822 | | | | 418,312,524 | |
| |
End of year | | $ | 195,487,677 | | | $ | 151,614,822 | |
| |
See accompanying Notes to Financial Statements which are an integral part of the financial statements.
Invesco V.I. Global Real Estate Fund
Financial Highlights
The following schedule presents financial highlights for a share of the Fund outstanding throughout the periods indicated.
| | | | | | | | | | | | | | | | | | | | | | | | | | | | | | | | | | | | | | | | | | | | | | | | | | | | | | | | |
| | | Net asset
value,
beginning
of period | | | Net investment
income(a) | | | Net gains
(losses)
on securities
(both realized and unrealized) | | | Total from
investment operations | | | Dividends from net investment income | | | Distributions from net realized
gains | | | Total
distributions | | | Net asset
value, end of period | | | Total
return (b) | | | Net assets,
end of period (000’s omitted) | | | Ratio of
expenses
to average
net assets
with fee waivers
and/or
expenses
absorbed | | | Ratio of
expenses
to average net
assets without fee waivers
and/or
expenses
absorbed | | | Ratio of net investment
income
to average
net assets | | | Portfolio turnover (c) | |
Series I | | | | | | | | | | | | | | | | | | | | | | | | | | | | | | | | | | | | | | | | | | | | | | | | | | | | | | | | |
Year ended 12/31/19 | | $ | 15.52 | | | $ | 0.39 | | | $ | 3.15 | | | $ | 3.54 | | | $ | (0.82 | ) | | $ | (0.02 | ) | | $ | (0.84 | ) | | $ | 18.22 | | | | 23.00 | % | | $ | 150,255 | | | | 1.04 | %(d) | | | 1.04 | %(d) | | | 2.22 | %(d) | | | 61 | % |
Year ended 12/31/18 | | | 17.38 | | | | 0.40 | | | | (1.41 | ) | | | (1.01 | ) | | | (0.65 | ) | | | (0.20 | ) | | | (0.85 | ) | | | 15.52 | | | | (6.10 | ) | | | 124,816 | | | | 1.01 | | | | 1.01 | | | | 2.38 | | | | 57 | |
Year ended 12/31/17 | | | 16.15 | | | | 0.45 | (e) | | | 1.62 | | | | 2.07 | | | | (0.56 | ) | | | (0.28 | ) | | | (0.84 | ) | | | 17.38 | | | | 12.98 | | | | 158,229 | | | | 1.02 | | | | 1.02 | | | | 2.63 | (e) | | | 50 | |
Year ended 12/31/16 | | | 16.36 | | | | 0.30 | | | | 0.08 | | | | 0.38 | | | | (0.27 | ) | | | (0.32 | ) | | | (0.59 | ) | | | 16.15 | | | | 2.04 | | | | 147,382 | | | | 1.05 | | | | 1.05 | | | | 1.81 | | | | 66 | |
Year ended 12/31/15 | | | 17.24 | | | | 0.31 | | | | (0.59 | ) | | | (0.28 | ) | | | (0.60 | ) | | | - | | | | (0.60 | ) | | | 16.36 | | | | (1.48 | ) | | | 208,796 | | | | 1.11 | | | | 1.11 | | | | 1.79 | | | | 72 | |
Series II | | | | | | | | | | | | | | | | | | | | | | | | | | | | | | | | | | | | | | | | | | | | | | | | | | | | | | | | |
Year ended 12/31/19 | | | 15.03 | | | | 0.34 | | | | 3.04 | | | | 3.38 | | | | (0.61 | ) | | | (0.02 | ) | | | (0.63 | ) | | | 17.78 | | | | 22.65 | | | | 45,233 | | | | 1.29 | (d) | | | 1.29 | (d) | | | 1.97 | (d) | | | 61 | |
Year ended 12/31/18 | | | 16.86 | | | | 0.34 | | | | (1.35 | ) | | | (1.01 | ) | | | (0.62 | ) | | | (0.20 | ) | | | (0.82 | ) | | | 15.03 | | | | (6.33 | ) | | | 26,799 | | | | 1.26 | | | | 1.26 | | | | 2.13 | | | | 57 | |
Year ended 12/31/17 | | | 15.69 | | | | 0.39 | (e) | | | 1.58 | | | | 1.97 | | | | (0.52 | ) | | | (0.28 | ) | | | (0.80 | ) | | | 16.86 | | | | 12.73 | | | | 260,083 | | | | 1.27 | | | | 1.27 | | | | 2.38 | (e) | | | 50 | |
Year ended 12/31/16 | | | 15.91 | | | | 0.25 | | | | 0.08 | | | | 0.33 | | | | (0.23 | ) | | | (0.32 | ) | | | (0.55 | ) | | | 15.69 | | | | 1.82 | | | | 216,893 | | | | 1.30 | | | | 1.30 | | | | 1.56 | | | | 66 | |
Year ended 12/31/15 | | | 16.79 | | | | 0.26 | | | | (0.58 | ) | | | (0.32 | ) | | | (0.56 | ) | | | - | | | | (0.56 | ) | | | 15.91 | | | | (1.74 | ) | | | 208,000 | | | | 1.36 | | | | 1.36 | | | | 1.54 | | | | 72 | |
| (a) | Calculated using average shares outstanding. |
| (b) | Includes adjustments in accordance with accounting principles generally accepted in the United States of America and as such, the net asset value for financial reporting purposes and the returns based upon those net asset values may differ from the net asset value and returns for shareholder transactions. Total returns are not annualized for periods less than one year, if applicable, and do not reflect charges assessed in connection with a variable product, which if included would reduce total returns. |
| (c) | Portfolio turnover is calculated at the fund level and is not annualized for periods less than one year, if applicable. |
| (d) | Ratios are based on average daily net assets (000’s omitted) of $143,853 and $41,695 for Series I and Series II shares, respectively. |
| (e) | Net investment income per share and the ratio of net investment income to average net assets includes significant dividends received during the period. Net investment income per share and the ratio of net investment income to average net assets excluding the significant dividends are $0.38 and 2.18%, $0.32 and 1.93% for Series I and Series II shares, respectively. |
See accompanying Notes to Financial Statements which are an integral part of the financial statements.
Invesco V.I. Global Real Estate Fund
Notes to Financial Statements
December 31, 2019
NOTE 1–Significant Accounting Policies
Invesco V.I. Global Real Estate Fund (the “Fund”) is a series portfolio of AIM Variable Insurance Funds (Invesco Variable Insurance Funds) (the “Trust”). The Trust is a Delaware statutory trust registered under the Investment Company Act of 1940, as amended (the “1940 Act”), as anopen-end series management investment company. Information presented in these financial statements pertains only to the Fund. Matters affecting the Fund or each class will be voted on exclusively by the shareholders of the Fund or each class. Current Securities and Exchange Commission (“SEC”) guidance, however, requires participating insurance companies offering separate accounts to vote shares proportionally in accordance with the instructions of the contract owners whose investments are funded by shares of each Fund or class.
The Fund’s investment objective is total return through growth of capital and current income.
The Fund currently offers two classes of shares, Series I and Series II, both of which are offered to insurance company separate accounts funding variable annuity contracts and variable life insurance policies (“variable products”).
The Fund is an investment company and accordingly follows the investment company accounting and reporting guidance in accordance with Financial Accounting Standards Board Accounting Standards Codification Topic 946,Financial Services – Investment Companies.
The following is a summary of the significant accounting policies followed by the Fund in the preparation of its financial statements.
A. Security Valuations– Securities, including restricted securities, are valued according to the following policy.
A security listed or traded on an exchange (except convertible securities) is valued at its last sales price or official closing price as of the close of the customary trading session on the exchange where the security is principally traded, or lacking any sales or official closing price on a particular day, the security may be valued at the closing bid price on that day. Securities traded in theover-the-counter market are valued based on prices furnished by independent pricing services or market makers. When such securities are valued by an independent pricing service they may be considered fair valued. Futures contracts are valued at the final settlement price set by an exchange on which they are principally traded. Listed options are valued at the mean between the last bid and asked prices from the exchange on which they are principally traded. Options not listed on an exchange are valued by an independent source at the mean between the last bid and asked prices. For purposes of determining net asset value (“NAV”) per share, futures and option contracts generally are valued 15 minutes after the close of the customary trading session of the New York Stock Exchange (“NYSE”).
Investments inopen-end andclosed-end registered investment companies that do not trade on an exchange are valued at theend-of-day net asset value per share. Investments inopen-end andclosed-end registered investment companies that trade on an exchange are valued at the last sales price or official closing price as of the close of the customary trading session on the exchange where the security is principally traded.
Debt obligations (including convertible securities) and unlisted equities are fair valued using an evaluated quote provided by an independent pricing service. Evaluated quotes provided by the pricing service may be determined without exclusive reliance on quoted prices, and may reflect appropriate factors such asinstitution-size trading in similar groups of securities, developments related to specific securities, dividend rate (for unlisted equities), yield (for debt obligations), quality, type of issue, coupon rate (for debt obligations), maturity (for debt obligations), individual trading characteristics and other market data. Pricing services generally value debt obligations assuming orderly transactions of institutional round lot size, but a fund may hold or transact in the same securities in smaller, odd lot sizes. Odd lots often trade at lower prices than institutional round lots. Debt obligations are subject to interest rate and credit risks. In addition, all debt obligations involve some risk of default with respect to interest and/or principal payments.
Foreign securities’ (including foreign exchange contracts) prices are converted into U.S. dollar amounts using the applicable exchange rates as of the close of the NYSE. If market quotations are available and reliable for foreign exchange-traded equity securities, the securities will be valued at the market quotations. Because trading hours for certain foreign securities end before the close of the NYSE, closing market quotations may become unreliable. If between the time trading ends on a particular security and the close of the customary trading session on the NYSE, events occur that the investment adviser determines are significant and make the closing price unreliable, the Fund may fair value the security. If the event is likely to have affected the closing price of the security, the security will be valued at fair value in good faith using procedures approved by the Board of Trustees. Adjustments to closing prices to reflect fair value may also be based on a screening process of an independent pricing service to indicate the degree of certainty, based on historical data, that the closing price in the principal market where a foreign security trades is not the current value as of the close of the NYSE. Foreign securities’ prices meeting the approved degree of certainty that the price is not reflective of current value will be priced at the indication of fair value from the independent pricing service. Multiple factors may be considered by the independent pricing service in determining adjustments to reflect fair value and may include information relating to sector indices, American Depositary Receipts and domestic and foreign index futures. Foreign securities may have additional risks including exchange rate changes, potential for sharply devalued currencies and high inflation, political and economic upheaval, the relative lack of issuer information, relatively low market liquidity and the potential lack of strict financial and accounting controls and standards.
Securities for which market prices are not provided by any of the above methods may be valued based upon quotes furnished by independent sources. The last bid price may be used to value equity securities. The mean between the last bid and asked prices is used to value debt obligations, including corporate loans.
Securities for which market quotations are not readily available or became unreliable are valued at fair value as determined in good faith by or under the supervision of the Trust’s officers following procedures approved by the Board of Trustees. Issuer specific events, market trends, bid/asked quotes of brokers and information providers and other market data may be reviewed in the course of making a good faith determination of a security’s fair value.
The Fund may invest in securities that are subject to interest rate risk, meaning the risk that the prices will generally fall as interest rates rise and, conversely, the prices will generally rise as interest rates fall. Specific securities differ in their sensitivity to changes in interest rates depending on their individual characteristics. Changes in interest rates may result in increased market volatility, which may affect the value and/or liquidity of certain Fund investments.
Invesco V.I. Global Real Estate Fund
Valuations change in response to many factors including the historical and prospective earnings of the issuer, the value of the issuer’s assets, general economic conditions, interest rates, investor perceptions and market liquidity. Because of the inherent uncertainties of valuation, the values reflected in the financial statements may materially differ from the value received upon actual sale of those investments.
| B. | Securities Transactions and Investment Income– Securities transactions are accounted for on a trade date basis. Realized gains or losses on sales are computed on the basis of specific identification of the securities sold. Interest income (net of withholding tax, if any) is recorded on the accrual basis from settlement date. Dividend income (net of withholding tax, if any) is recorded on theex-dividend date. |
The Fund may periodically participate in litigation related to Fund investments. As such, the Fund may receive proceeds from litigation settlements. Any proceeds received are included in the Statement of Operations as realized gain (loss) for investments no longer held and as unrealized gain (loss) for investments still held.
Brokerage commissions and mark ups are considered transaction costs and are recorded as an increase to the cost basis of securities purchased and/or a reduction of proceeds on a sale of securities. Such transaction costs are included in the determination of net realized and unrealized gain (loss) from investment securities reported in the Statement of Operations and the Statement of Changes in Net Assets and the net realized and unrealized gains (losses) on securities per share in the Financial Highlights. Transaction costs are included in the calculation of the Fund’s net asset value and, accordingly, they reduce the Fund’s total returns. These transaction costs are not considered operating expenses and are not reflected in net investment income reported in the Statement of Operations and the Statement of Changes in Net Assets, or the net investment income per share and the ratios of expenses and net investment income reported in the Financial Highlights, nor are they limited by any expense limitation arrangements between the Fund and the investment adviser.
The Fund allocates income and realized and unrealized capital gains and losses to a class based on the relative net assets of each class.
The Fund recharacterizes distributions received from REIT investments based on information provided by the REIT into the following categories: ordinary income, long-term and short-term capital gains, and return of capital. If information is not available on a timely basis from the REIT, the recharacterization will be based on available information which may include the previous year’s allocation. If new or additional information becomes available from the REIT at a later date, a recharacterization will be made in the following year. The Fund records as dividend income the amount recharacterized as ordinary income and as realized gain the amount recharacterized as capital gain in the Statement of Operations, and the amount recharacterized as return of capital as a reduction of the cost of the related investment. These recharacterizations are reflected in the accompanying financial statements.
| C. | Country Determination– For the purposes of making investment selection decisions and presentation in the Schedule of Investments, the investment adviser may determine the country in which an issuer is located and/or credit risk exposure based on various factors. These factors include the laws of the country under which the issuer is organized, where the issuer maintains a principal office, the country in which the issuer derives 50% or more of its total revenues and the country that has the primary market for the issuer’s securities, as well as other criteria. Among the other criteria that may be evaluated for making this determination are the country in which the issuer maintains 50% or more of its assets, the type of security, financial guarantees and enhancements, the nature of the collateral and the sponsor organization. Country of issuer and/or credit risk exposure has been determined to be the United States of America, unless otherwise noted. |
| D. | Distributions– Distributions from net investment income and net realized capital gain, if any, are generally declared and paid to separate accounts of participating insurance companies annually and recorded on theex-dividend date. |
| E. | Federal Income Taxes –The Fund intends to comply with the requirements of Subchapter M of the Internal Revenue Code of 1986, as amended (the “Internal Revenue Code”), necessary to qualify as a regulated investment company and to distribute substantially all of the Fund’s taxable earnings to shareholders. As such, the Fund will not be subject to federal income taxes on otherwise taxable income (including net realized capital gain) that is distributed to shareholders. Therefore, no provision for federal income taxes is recorded in the financial statements. |
The Fund recognizes the tax benefits of uncertain tax positions only when the position is more likely than not to be sustained. Management has analyzed the Fund’s uncertain tax positions and concluded that no liability for unrecognized tax benefits should be recorded related to uncertain tax positions. Management is not aware of any tax positions for which it is reasonably possible that the total amounts of unrecognized tax benefits will change materially in the next 12 months.
The Fund files tax returns in the U.S. Federal jurisdiction and certain other jurisdictions. Generally, the Fund is subject to examinations by such taxing authorities for up to three years after the filing of the return for the tax period.
| F. | Expenses– Fees provided for under the Rule12b-1 plan of a particular class of the Fund and which are directly attributable to that class are charged to the operations of such class. All other expenses are allocated among the classes based on relative net assets. |
| G. | Accounting Estimates –The preparation of financial statements in conformity with accounting principles generally accepted in the United States of America (“GAAP”) requires management to make estimates and assumptions that affect the reported amounts of assets and liabilities at the date of the financial statements and the reported amounts of revenues and expenses during the reporting period including estimates and assumptions related to taxation. Actual results could differ from those estimates by a significant amount. In addition, the Fund monitors for material events or transactions that may occur or become known after theperiod-end date and before the date the financial statements are released to print. |
| H. | Indemnifications– Under the Trust’s organizational documents, each Trustee, officer, employee or other agent of the Trust is indemnified against certain liabilities that may arise out of the performance of their duties to the Fund. Additionally, in the normal course of business, the Fund enters into contracts, including the Fund’s servicing agreements, that contain a variety of indemnification clauses. The Fund’s maximum exposure under these arrangements is unknown as this would involve future claims that may be made against the Fund that have not yet occurred. The risk of material loss as a result of such indemnification claims is considered remote. |
| I. | Foreign Currency Translations– Foreign currency is valued at the close of the NYSE based on quotations posted by banks and major currency dealers. Portfolio securities and other assets and liabilities denominated in foreign currencies are translated into U.S. dollar amounts at the date of valuation. Purchases and sales of portfolio securities (net of foreign taxes withheld on disposition) and income items denominated in foreign currencies are translated into U.S. dollar amounts on the respective dates of such transactions. The Fund does not separately account for the portion of the results of operations resulting from changes in foreign exchange rates on investments and the fluctuations arising from changes in market prices of securities held. The combined results of changes in foreign exchange rates and the fluctuation of market prices on investments (net of estimated foreign tax withholding) are included with the net realized and unrealized gain or loss from investments in the Statement of Operations. Reported net realized foreign currency gains or losses arise from (1) sales of foreign currencies, (2) currency gains or |
Invesco V.I. Global Real Estate Fund
| | losses realized between the trade and settlement dates on securities transactions, and (3) the difference between the amounts of dividends, interest, and foreign withholding taxes recorded on the Fund’s books and the U.S. dollar equivalent of the amounts actually received or paid. Net unrealized foreign currency gains and losses arise from changes in the fair values of assets and liabilities, other than investments in securities at fiscal period end, resulting from changes in exchange rates. |
The Fund may invest in foreign securities, which may be subject to foreign taxes on income, gains on investments or currency repatriation, a portion of which may be recoverable. Foreign taxes, if any, are recorded based on the tax regulations and rates that exist in the foreign markets in which the Fund invests and are shown in the Statement of Operations.
| J. | Forward Foreign Currency Contracts– The Fund may engage in foreign currency transactions either on a spot (i.e. for prompt delivery and settlement) basis, or through forward foreign currency contracts, to manage or minimize currency or exchange rate risk. |
The Fund may also enter into forward foreign currency contracts for the purchase or sale of a security denominated in a foreign currency in order to “lock in” the U.S. dollar price of that security, or the Fund may also enter into forward foreign currency contracts that do not provide for physical settlement of the two currencies, but instead are settled by a single cash payment calculated as the difference between the agreed upon exchange rate and the spot rate at settlement based upon an agreed upon notional amount(non-deliverable forwards). The Fund will set aside liquid assets in an amount equal to the dailymark-to-market obligation for forward foreign currency contracts.
A forward foreign currency contract is an obligation between two parties (“Counterparties”) to purchase or sell a specific currency for an agreed-upon price at a future date. The use of forward foreign currency contracts does not eliminate fluctuations in the price of the underlying securities the Fund owns or intends to acquire but establishes a rate of exchange in advance. Fluctuations in the value of these contracts are measured by the difference in the contract date and reporting date exchange rates and are recorded as unrealized appreciation (depreciation) until the contracts are closed. When the contracts are closed, realized gains (losses) are recorded. Realized and unrealized gains (losses) on the contracts are included in the Statement of Operations. The primary risks associated with forward foreign currency contracts include failure of the Counterparty to meet the terms of the contract and the value of the foreign currency changing unfavorably. These risks may be in excess of the amounts reflected in the Statement of Assets and Liabilities.
| K. | Other Risks– The Fund’s investments are concentrated in a comparatively narrow segment of the economy. Consequently, the Fund may tend to be more volatile than other mutual funds, and the value of the Fund’s investments may tend to rise and fall more rapidly. |
Because the Fund concentrates its assets in the real estate industry, an investment in the Fund will be closely linked to the performance of the real estate markets. Property values may fall due to increasing vacancies or declining rents resulting from economic, legal, cultural or technological developments.
NOTE 2–Advisory Fees and Other Fees Paid to Affiliates
The Trust has entered into a master investment advisory agreement with Invesco Advisers, Inc. (the “Adviser” or “Invesco”). Under the terms of the investment advisory agreement, the Fund accrues daily and pays monthly an advisory fee to the Adviser based on the annual rate of the Fund’s average daily net assets as follows:
| | | | |
| Average Daily Net Assets | | Rate | |
| |
| |
First $250 million | | | 0.750% | |
| |
| |
Next $250 million | | | 0.740% | |
| |
| |
Next $500 million | | | 0.730% | |
| |
| |
Next $1.5 billion | | | 0.720% | |
| |
| |
Next $2.5 billion | | | 0.710% | |
| |
| |
Next $2.5 billion | | | 0.700% | |
| |
| |
Next $2.5 billion | | | 0.690% | |
| |
| |
Over $10 billion | | | 0.680% | |
| |
For the year ended December 31, 2019, the effective advisory fee rate incurred by the Fund was 0.75%.
Under the terms of a mastersub-advisory agreement between the Adviser and each of Invesco Asset Management Deutschland GmbH, Invesco Asset Management Limited, Invesco Asset Management (Japan) Limited, Invesco Hong Kong Limited, Invesco Senior Secured Management, Inc. and Invesco Canada Ltd. and separatesub-advisory agreements with Invesco Capital Management LLC and Invesco Asset Management (India) Private Limited (collectively, the “AffiliatedSub-Advisers”) the Adviser, not the Fund, will pay 40% of the fees paid to the Adviser to any such AffiliatedSub-Adviser(s) that provide(s) discretionary investment management services to the Fund based on the percentage of assets allocated to such AffiliatedSub-Adviser(s).
The Adviser has contractually agreed, through at least June 30, 2020, to waive advisory fees and/or reimburse expenses of all shares to the extent necessary to limit total annual fund operating expenses after fee waiver and/or expense reimbursement (excluding certain items discussed below) of Series I shares to 2.00% and Series II shares to 2.25% of average daily net assets (the “expense limits”). In determining the Adviser’s obligation to waive advisory fees and/or reimburse expenses, the following expenses are not taken into account, and could cause the total annual fund operating expenses after fee waiver and/or expense reimbursement to exceed the numbers reflected above: (1) interest; (2) taxes; (3) dividend expense on short sales; (4) extraordinary ornon-routine items, including litigation expenses; and (5) expenses that the Fund has incurred but did not actually pay because of an expense offset arrangement. Unless Invesco continues the fee waiver agreement, it will terminate on June 30, 2020. During its term, the fee waiver agreement cannot be terminated or amended to increase the expense limits or reduce the advisory fee waiver without approval of the Board of Trustees. The Adviser did not waive fees and/or reimburse expenses during the period under these expense limits.
Further, the Adviser has contractually agreed, through at least June 30, 2021, to waive the advisory fee payable by the Fund in an amount equal to 100% of the net advisory fees the Adviser receives from the affiliated money market funds on investments by the Fund of uninvested cash in such affiliated money market funds.
For the year ended December 31, 2019, the Adviser waived advisory fees of $2,990.
Invesco V.I. Global Real Estate Fund
The Trust has entered into a master administrative services agreement with Invesco pursuant to which the Fund has agreed to pay Invesco a fee for costs incurred in providing accounting services and fund administrative services to the Fund and to reimburse Invesco for fees paid to insurance companies that have agreed to provide certain administrative services to the Fund. These administrative services provided by the insurance companies may include, among other things: maintenance of master accounts with the Fund; tracking, recording and transmitting net purchase and redemption orders for Fund shares; maintaining and preserving records related to the purchase, redemption and other account activity of variable product owners; distributing copies of Fund documents such as prospectuses, proxy materials and periodic reports, to variable product owners, and responding to inquiries from variable product owners about the Fund. Pursuant to such agreement, for the year ended December 31, 2019, Invesco was paid $25,886 for accounting and fund administrative services and was reimbursed $273,012 for fees paid to insurance companies. Invesco has entered into asub-administration agreement whereby State Street Bank and Trust Company (“SSB”) serves as fund accountant and provides certain administrative services to the Fund. Pursuant to a custody agreement with the Trust on behalf of the Fund, SSB also serves as the Fund’s custodian.
The Trust has entered into a transfer agency and service agreement with Invesco Investment Services, Inc. (“IIS”) pursuant to which the Fund has agreed to pay IIS a fee for providing transfer agency and shareholder services to the Fund and reimburse IIS for certain expenses incurred by IIS in the course of providing such services. For the year ended December 31, 2019, expenses incurred under the agreement are shown in the Statement of Operations asTransfer agent fees.
The Trust has entered into a master distribution agreement with Invesco Distributors, Inc. (“IDI”) to serve as the distributor for the Fund. The Trust has adopted a plan pursuant to Rule12b-1 under the 1940 Act with respect to the Fund’s Series II shares (the “Plan”). The Fund, pursuant to the Plan, pays IDI compensation at the annual rate of 0.25% of the Fund’s average daily net assets of Series II shares. The fees are accrued daily and paid monthly. Of the Plan payments, up to 0.25% of the average daily net assets of the Series II shares may be paid to insurance companies who furnish continuing personal shareholder services to customers who purchase and own Series II shares of the Fund. For the year ended December 31, 2019, expenses incurred under the Plan are detailed in the Statement of Operations asDistribution fees.
Certain officers and trustees of the Trust are officers and directors of the Adviser, IIS and/or IDI.
NOTE 3–Additional Valuation Information
GAAP defines fair value as the price that would be received to sell an asset or paid to transfer a liability in an orderly transaction between market participants at the measurement date, under current market conditions. GAAP establishes a hierarchy that prioritizes the inputs to valuation methods, giving the highest priority to readily available unadjusted quoted prices in an active market for identical assets (Level 1) and the lowest priority to significant unobservable inputs (Level 3), generally when market prices are not readily available or are unreliable. Based on the valuation inputs, the securities or other investments are tiered into one of three levels. Changes in valuation methods may result in transfers in or out of an investment’s assigned level:
| | Level 1 - | Prices are determined using quoted prices in an active market for identical assets. |
| | Level 2 - | Prices are determined using other significant observable inputs. Observable inputs are inputs that other market participants may use in pricing a security. These may include quoted prices for similar securities, interest rates, prepayment speeds, credit risk, yield curves, loss severities, default rates, discount rates, volatilities and others. |
| | Level 3 - | Prices are determined using significant unobservable inputs. In situations where quoted prices or observable inputs are unavailable (for example, when there is little or no market activity for an investment at the end of the period), unobservable inputs may be used. Unobservable inputs reflect the Fund’s own assumptions about the factors market participants would use in determining fair value of the securities or instruments and would be based on the best available information. |
The following is a summary of the tiered valuation input levels, as of December 31, 2019. The level assigned to the securities valuations may not be an indication of the risk or liquidity associated with investing in those securities. Because of the inherent uncertainties of valuation, the values reflected in the financial statements may materially differ from the value received upon actual sale of those investments.
Invesco V.I. Global Real Estate Fund
| | | | | | | | | | | | | | | | |
| | | Level 1 | | | Level 2 | | | Level 3 | | | Total | |
| |
Investments in Securities | | | | | | | | | | | | | | | | |
| |
| | | | |
Australia | | $ | — | | | $ | 5,958,164 | | | | $ — | | | $ | 5,958,164 | |
| |
| | | | |
Brazil | | | — | | | | 1,090,841 | | | | — | | | | 1,090,841 | |
| |
| | | | |
Canada | | | 5,671,684 | | | | — | | | | — | | | | 5,671,684 | |
| |
| | | | |
Chile | | | — | | | | 148,901 | | | | — | | | | 148,901 | |
| |
| | | | |
China | | | 18,672 | | | | 12,351,572 | | | | — | | | | 12,370,244 | |
| |
| | | | |
France | | | 25,085 | | | | 4,382,498 | | | | — | | | | 4,407,583 | |
| |
| | | | |
Germany | | | — | | | | 9,591,571 | | | | — | | | | 9,591,571 | |
| |
| | | | |
Hong Kong | | | — | | | | 11,458,303 | | | | — | | | | 11,458,303 | |
| |
| | | | |
India | | | — | | | | 224,268 | | | | — | | | | 224,268 | |
| |
| | | | |
Indonesia | | | — | | | | 361,837 | | | | — | | | | 361,837 | |
| |
| | | | |
Japan | | | — | | | | 20,331,251 | | | | — | | | | 20,331,251 | |
| |
| | | | |
Malaysia | | | — | | | | 274,142 | | | | — | | | | 274,142 | |
| |
| | | | |
Malta | | | — | | | | — | | | | 0 | | | | 0 | |
| |
| | | | |
Mexico | | | 961,569 | | | | — | | | | — | | | | 961,569 | |
| |
| | | | |
Philippines | | | — | | | | 1,865,702 | | | | 481 | | | | 1,866,183 | |
| |
| | | | |
Singapore | | | — | | | | 4,937,463 | | | | — | | | | 4,937,463 | |
| |
| | | | |
South Africa | | | — | | | | 1,290,766 | | | | — | | | | 1,290,766 | |
| |
| | | | |
Spain | | | — | | | | 1,987,614 | | | | — | | | | 1,987,614 | |
| |
| | | | |
Sweden | | | — | | | | 3,619,925 | | | | — | | | | 3,619,925 | |
| |
| | | | |
Switzerland | | | — | | | | 1,692,380 | | | | — | | | | 1,692,380 | |
| |
| | | | |
Thailand | | | 1,141,764 | | | | 24,939 | | | | — | | | | 1,166,703 | |
| |
| | | | |
Turkey | | | — | | | | 55,988 | | | | — | | | | 55,988 | |
| |
| | | | |
United Arab Emirates | | | — | | | | 336,097 | | | | — | | | | 336,097 | |
| |
| | | | |
United Kingdom | | | — | | | | 9,071,123 | | | | — | | | | 9,071,123 | |
| |
| | | | |
United States | | | 93,426,392 | | | | — | | | | — | | | | 93,426,392 | |
| |
| | | | |
Money Market Funds | | | 2,456,783 | | | | — | | | | — | | | | 2,456,783 | |
| |
| | | | |
Total Investments | | $ | 103,701,949 | | | $ | 91,055,345 | | | | $481 | | | $ | 194,757,775 | |
| |
NOTE 4–Trustees’ and Officers’ Fees and Benefits
Trustees’ and Officers’ Fees and Benefits include amounts accrued by the Fund to pay remuneration to certain Trustees and Officers of the Fund. Trustees have the option to defer compensation payable by the Fund, andTrustees’ and Officers’ Fees and Benefits also include amounts accrued by the Fund to fund such deferred compensation amounts. Those Trustees who defer compensation have the option to select various Invesco Funds in which their deferral accounts shall be deemed to be invested. Finally, certain current Trustees were eligible to participate in a retirement plan that provided for benefits to be paid upon retirement to Trustees over a period of time based on the number of years of service. The Fund may have certain former Trustees who also participate in a retirement plan and receive benefits under such plan.Trustees’ and Officers’ Fees and Benefits include amounts accrued by the Fund to fund such retirement benefits. Obligations under the deferred compensation and retirement plans represent unsecured claims against the general assets of the Fund.
NOTE 5–Cash Balances
The Fund is permitted to temporarily carry a negative or overdrawn balance in its account with SSB, the custodian bank. Such balances, if any atperiod-end, are shown in the Statement of Assets and Liabilities under the payable caption Amount due custodian. To compensate the custodian bank for such overdrafts, the overdrawn Fund may either (1) leave funds as a compensating balance in the account so the custodian bank can be compensated by earning the additional interest; or (2) compensate by paying the custodian bank at a rate agreed upon by the custodian bank and Invesco, not to exceed the contractually agreed upon rate.
NOTE 6–Distributions to Shareholders and Tax Components of Net Assets
Tax Character of Distributions to Shareholders Paid During the Fiscal Years Ended December 31, 2019 and 2018:
| | | | | | | | |
| | | 2019 | | | 2018 | |
| |
| | |
Ordinary income | | $ | 7,977,318 | | | $ | 14,684,055 | |
| |
| | |
Long-term capital gain | | | 217,144 | | | | 4,509,933 | |
| |
| | |
Total distributions | | $ | 8,194,462 | | | $ | 19,193,988 | |
| |
Invesco V.I. Global Real Estate Fund
Tax Components of Net Assets atPeriod-End:
| | | | |
| | | 2019 | |
| |
Undistributed ordinary income | | $ | 8,106,844 | |
| |
Undistributed long-term capital gain | | | 2,947,580 | |
| |
Net unrealized appreciation – investments | | | 18,828,109 | |
| |
Net unrealized appreciation - foreign currencies | | | 2,183 | |
| |
Temporary book/tax differences | | | (64,424 | ) |
| |
Shares of beneficial interest | | | 165,667,385 | |
| |
Total net assets | | $ | 195,487,677 | |
| |
The difference between book-basis andtax-basis unrealized appreciation (depreciation) is due to differences in the timing of recognition of gains and losses on investments for tax and book purposes. The Fund’s net unrealized appreciation (depreciation) difference is attributable primarily to wash sales and the tax treatment of passive foreign investment companies.
The temporary book/tax differences are a result of timing differences between book and tax recognition of income and/or expenses. The Fund’s temporary book/tax differences are the result of the trustee deferral of compensation and retirement plan benefits.
Capital loss carryforward is calculated and reported as of a specific date. Results of transactions and other activity after that date may affect the amount of capital loss carryforward actually available for the Fund to utilize. Capital losses generated in years beginning after December 22, 2010 can be carried forward for an unlimited period, whereas previous losses expire in eight tax years. Capital losses with an expiration period may not be used to offset capital gains until all net capital losses without an expiration date have been utilized. Capital loss carryforwards with no expiration date will retain their character as either short-term or long-term capital losses instead of as short-term capital losses as under prior law. The ability to utilize capital loss carryforwards in the future may be limited under the Internal Revenue Code and related regulations based on the results of future transactions.
The Fund does not have a capital loss carryforward as of December 31, 2019.
NOTE 7–Investment Transactions
The aggregate amount of investment securities (other than short-term securities, U.S. Treasury obligations and money market funds, if any) purchased and sold by the Fund during the year ended December 31, 2019 was $122,546,053 and $111,178,465, respectively. Cost of investments, including any derivatives, on a tax basis includes the adjustments for financial reporting purposes as of the most recently completed federal income tax reportingperiod-end.
| | | | |
| Unrealized Appreciation (Depreciation) of Investments on a Tax Basis | |
| |
Aggregate unrealized appreciation of investments | | | $24,896,439 | |
| |
Aggregate unrealized (depreciation) of investments | | | (6,068,330 | ) |
| |
Net unrealized appreciation of investments | | | $18,828,109 | |
| |
Cost of investments for tax purposes is $175,929,666.
NOTE 8–Reclassification of Permanent Differences
Primarily as a result of differing book/tax treatment of passive foreign investment companies, on December 31, 2019, undistributed net investment income was increased by $1,809,872 and undistributed net realized gain was decreased by $1,809,872. This reclassification had no effect on the net assets or the distributable earnings of the Fund.
NOTE 9–Share Information
| | | | | | | | | | | | | | | | |
| | | Summary of Share Activity | |
| | | Year ended
December 31, 2019(a) | | | Year ended
December 31, 2018 | |
| | | Shares | | | Amount | | | Shares | | | Amount | |
Sold: | | | | | | | | | | | | | | | | |
Series I | | | 1,903,457 | | | $ | 33,607,781 | | | | 1,662,498 | | | $ | 28,085,608 | |
| |
Series II | | | 1,239,958 | | | | 20,535,447 | | | | 1,936,421 | | | | 31,871,041 | |
| |
| | | | |
Issued as reinvestment of dividends: | | | | | | | | | | | | | | | | |
Series I | | | 375,567 | | | | 6,628,755 | | | | 418,729 | | | | 6,963,469 | |
| |
Series II | | | 90,818 | | | | 1,565,707 | | | | 759,188 | | | | 12,230,519 | |
| |
Invesco V.I. Global Real Estate Fund
| | | | | | | | | | | | | | | | |
| | | Summary of Share Activity | |
| |
| | | Year ended December 31, 2019(a) | | | Year ended December 31, 2018 | |
| | | | | | | | |
| | | Shares | | | Amount | | | Shares | | | Amount | |
| |
| | | | |
Reacquired: | | | | | | | | | | | | | | | | |
Series I | | | (2,070,856 | ) | | $ | (36,591,008 | ) | | | (3,142,606 | ) | | $ | (52,935,567 | ) |
| |
Series II | | | (569,384 | ) | | | (9,391,377 | ) | | | (16,340,645 | ) | | | (251,482,681 | ) |
| |
Net increase (decrease) in share activity | | | 969,560 | | | $ | 16,355,305 | | | | (14,706,415 | ) | | $ | (225,267,611 | ) |
| |
| (a) | There are entities that are record owners of more than 5% of the outstanding shares of the Fund and in the aggregate own 62% of the outstanding shares of the Fund. The Fund and the Fund’s principal underwriter or adviser, are parties to participation agreements with these entities whereby these entities sell units of interest in separate accounts funding variable products that are invested in the Fund. The Fund, Invesco and/or Invesco affiliates may make payments to these entities, which are considered to be related to the Fund, for providing services to the Fund, Invesco and/or Invesco affiliates including but not limited to services such as, securities brokerage, third party record keeping and account servicing and administrative services. The Fund has no knowledge as to whether all or any portion of the shares owned of record by these entities are also owned beneficially. |
Invesco V.I. Global Real Estate Fund
Report of Independent Registered Public Accounting Firm
To the Board of Trustees of AIM Variable Insurance Funds (Invesco Variable Insurance Funds) and Shareholders of Invesco V.I. Global Real Estate Fund
Opinion on the Financial Statements
We have audited the accompanying statement of assets and liabilities, including the schedule of investments, of Invesco V.I. Global Real Estate Fund (one of the funds constituting AIM Variable Insurance Funds (Invesco Variable Insurance Funds), referred to hereafter as the “Fund”) as of December 31, 2019, the related statement of operations for the year ended December 31, 2019, the statement of changes in net assets for each of the two years in the period ended December 31, 2019, including the related notes, and the financial highlights for each of the five years in the period ended December 31, 2019 (collectively referred to as the “financial statements”). In our opinion, the financial statements present fairly, in all material respects, the financial position of the Fund as of December 31, 2019, the results of its operations for the year then ended, the changes in its net assets for each of the two years in the period ended December 31, 2019 and the financial highlights for each of the five years in the period ended December 31, 2019 in conformity with accounting principles generally accepted in the United States of America.
Basis for Opinion
These financial statements are the responsibility of the Fund’s management. Our responsibility is to express an opinion on the Fund’s financial statements based on our audits. We are a public accounting firm registered with the Public Company Accounting Oversight Board (United States) (PCAOB) and are required to be independent with respect to the Fund in accordance with the U.S. federal securities laws and the applicable rules and regulations of the Securities and Exchange Commission and the PCAOB.
We conducted our audits of these financial statements in accordance with the standards of the PCAOB. Those standards require that we plan and perform the audit to obtain reasonable assurance about whether the financial statements are free of material misstatement, whether due to error or fraud.
Our audits included performing procedures to assess the risks of material misstatement of the financial statements, whether due to error or fraud, and performing procedures that respond to those risks. Such procedures included examining, on a test basis, evidence regarding the amounts and disclosures in the financial statements. Our audits also included evaluating the accounting principles used and significant estimates made by management, as well as evaluating the overall presentation of the financial statements. Our procedures included confirmation of securities owned as of December 31, 2019 by correspondence with the custodian, transfer agent and brokers; when replies were not received from brokers, we performed other auditing procedures. We believe that our audits provide a reasonable basis for our opinion.
/s/PricewaterhouseCoopers LLP
Houston, Texas
February 18, 2020
We have served as the auditor of one or more of the investment companies in the Invesco group of investment companies since at least 1995. We have not been able to determine the specific year we began serving as auditor.
Invesco V.I. Global Real Estate Fund
Calculating your ongoing Fund expenses
Example
As a shareholder of the Fund, you incur two types of costs: (1) transaction costs, which may include sales charges (loads) on purchase payments or contingent deferred sales charges on redemptions, if any; and (2) ongoing costs, including management fees, distribution and/or service(12b-1) fees, and other Fund expenses. This example is intended to help you understand your ongoing costs (in dollars) of investing in the Fund and to compare these costs with ongoing costs of investing in other mutual funds. The example is based on an investment of $1,000 invested at the beginning of the period and held for the entire period July 1, 2019 through December 31, 2019.
Actual expenses
The table below provides information about actual account values and actual expenses. You may use the information in this table, together with the amount you invested, to estimate the expenses that you paid over the period. Simply divide your account value by $1,000 (for example, an $8,600 account value divided by $1,000 = 8.6), then multiply the result by the number in the table under the heading entitled “Actual Expenses Paid During Period” to estimate the expenses you paid on your account during this period.
Hypothetical example for comparison purposes
The table below also provides information about hypothetical account values and hypothetical expenses based on the Fund’s actual expense ratio and an assumed rate of return of 5% per year before expenses, which is not the Fund’s actual return.
The hypothetical account values and expenses may not be used to estimate the actual ending account balance or expenses you paid for the period. You may use this information to compare the ongoing costs of investing in the Fund and other funds. To do so, compare this 5% hypothetical example with the 5% hypothetical examples that appear in the shareholder reports of the other funds.
Please note that the expenses shown in the table are meant to highlight your ongoing costs only and do not reflect any transaction costs, such as sales charges (loads) on purchase payments or contingent deferred sales charges on redemptions, if any. Therefore, the hypothetical information is useful in comparing ongoing costs only, and will not help you determine the relative total costs of owning different funds. In addition, if these transaction costs were included, your costs would have been higher.
| | | | | | | | | | | | | | | | | | | | |
| | | Beginning
Account Value
(07/01/19) | | ACTUAL | | | HYPOTHETICAL (5% annual return before
expenses) | | | Annualized
Expense
Ratio |
| | Ending
Account Value
(12/31/19)1 | | | Expenses
Paid During
Period2 | | | Ending
Account Value
(12/31/19) | | | Expenses
Paid During
Period2 | |
| Series I | | $1,000.00 | | | $1,062.90 | | | | $5.41 | | | | $1,019.96 | | | | $5.30 | | | 1.04% |
| Series II | | 1,000.00 | | | 1,061.20 | | | | 6.70 | | | | 1,018.70 | | | | 6.56 | | | 1.29 |
| 1 | The actual ending account value is based on the actual total return of the Fund for the period July 1, 2019 through December 31, 2019, after actual expenses and will differ from the hypothetical ending account value which is based on the Fund’s expense ratio and a hypothetical annual return of 5% before expenses. |
| 2 | Expenses are equal to the Fund’s annualized expense ratio as indicated above multiplied by the average account value over the period, multiplied by 184/365 to reflect the most recent fiscal half year. |
Invesco V.I. Global Real Estate Fund
Tax Information
Form1099-DIV, Form1042-S and other year–end tax information provide shareholders with actual calendar year amounts that should be included in their tax returns. Shareholders should consult their tax advisors.
The following distribution information is being provided as required by the Internal Revenue Code or to meet a specific state’s requirement.
The Fund designates the following amounts or, if subsequently determined to be different, the maximum amount allowable for its fiscal year ended December 31, 2019:
| | | | | | | | |
| Federal and State Income Tax | | | | |
Long-term Capital Gain Distribution | | $ | 217,144 | | | | | |
Corporate Dividends Received Deduction* | | | 0.10 | % | | | | |
U.S. Treasury Obligations* | | | 0.00 | % | | | | |
| | * | The above percentages are based on ordinary income dividends paid to shareholders during the Fund’s fiscal year. |
Invesco V.I. Global Real Estate Fund
Trustees and Officers
The address of each trustee and officer is AIM Variable Insurance Funds (Invesco Variable Insurance Funds) (the “Trust”), 11 Greenway Plaza, Suite 1000, Houston, Texas 77046-1173. The trustees serve for the life of the Trust, subject to their earlier death, incapacitation, resignation, retirement or removal as more specifically provided in the Trust’s organizational documents. Each officer serves for a one year term or until their successors are elected and qualified. Column two below includes length of time served with predecessor entities, if any.
| | | | | | | | |
Name, Year of Birth and
Position(s)
Held with the Trust | | Trustee
and/or
Officer
Since | | Principal Occupation(s)
During Past 5 Years | | Number of
Funds in
Fund Complex
Overseen by
Trustee | | Other
Directorship(s)
Held by Trustee
During Past
5 Years |
| Interested Person | | | | | | | | |
Martin L. Flanagan1- 1960
Trustee and Vice Chair | | 2007 | | Executive Director, Chief Executive Officer and President, Invesco Ltd. (ultimate parent of Invesco and a global investment management firm); Trustee and Vice Chair, The Invesco Funds; Vice Chair, Investment Company Institute; and Member of Executive Board, SMU Cox School of Business Formerly: Advisor to the Board, Invesco Advisers, Inc. (formerly known as Invesco Institutional (N.A.), Inc.); Chairman and Chief Executive Officer, Invesco Advisers, Inc. (registered investment adviser); Director, Chairman, Chief Executive Officer and President, Invesco Holding Company (US), Inc. (formerly IVZ Inc.) (holding company), Invesco Group Services, Inc. (service provider) and Invesco North American Holdings, Inc. (holding company); Director, Chief Executive Officer and President, Invesco Holding Company Limited (parent of Invesco and a global investment management firm); Director, Invesco Ltd.; Chairman, Investment Company Institute and President,Co-Chief Executive Officer,Co-President, Chief Operating Officer and Chief Financial Officer, Franklin Resources, Inc. (global investment management organization) | | 229 | | None |
| 1 | Mr. Flanagan is considered an interested person (within the meaning of Section 2(a)(19) of the 1940 Act) of the Trust because he is an officer of the Adviser to the Trust, and an officer and a director of Invesco Ltd., ultimate parent of the Adviser. |
Invesco V.I. Global Real Estate Fund
Trustees and Officers–(continued)
| | | | | | | | |
Name, Year of Birth and
Position(s)
Held with the Trust | | Trustee
and/or
Officer
Since | | Principal Occupation(s)
During Past 5 Years | | Number of
Funds in
Fund Complex
Overseen by
Trustee | | Other
Directorship(s)
Held by Trustee
During Past
5 Years |
| Independent Trustees | | | | | | | | |
Bruce L. Crockett - 1944
Trustee and Chair | | 1993 | | Chairman, Crockett Technologies Associates (technology consulting company) Formerly: Director, Captaris (unified messaging provider); Director, President and Chief Executive Officer, COMSAT Corporation; Chairman, Board of Governors of INTELSAT (international communications company); ACE Limited (insurance company); Independent Directors Council and Investment Company Institute: Member of the Audit Committee, Investment Company Institute; Member of the Executive Committee and Chair of the Governance Committee, Independent Directors Council | | 229 | | Director and Chairman of the Audit Committee, ALPS (Attorneys Liability Protection Society) (insurance company); Director and Member of the Audit Committee and Compensation Committee, Ferroglobe PLC (metallurgical company) |
David C. Arch - 1945
Trustee | | 2010 | | Chairman of Blistex Inc. (consumer health care products manufacturer); Member, World Presidents’ Organization | | 229 | | Board member of the Illinois Manufacturers’ Association |
Beth Ann Brown - 1968
Trustee | | 2019 | | Independent Consultant Formerly: Head of Intermediary Distribution, Managing Director, Strategic Relations, Managing Director, Head of National Accounts, Senior Vice President, National Account Manager and Senior Vice President, Key Account Manager, Columbia Management Investment Advisers LLC; Vice President, Key Account Manager, Liberty Funds Distributor, Inc.; and Trustee of certain Oppenheimer Funds | | 229 | | Director, Board of Directors of Caron Engineering Inc.; Advisor, Board of Advisors of Caron Engineering Inc.; President and Director, Acton Shapleigh Youth Conservation Corps (non - profit); and Vice President and Director of Grahamtastic Connection (non-profit) |
Jack M. Fields - 1952
Trustee | | 1997 | | Chief Executive Officer, Twenty First Century Group, Inc. (government affairs company); and Chairman, Discovery Learning Alliance(non-profit) Formerly: Owner and Chief Executive Officer, Dos Angeles Ranch L.P. (cattle, hunting, corporate entertainment); Director, Insperity, Inc. (formerly known as Administaff) (human resources provider); Chief Executive Officer, Texana Timber LP (sustainable forestry company); Director of Cross Timbers Quail Research Ranch(non-profit); and member of the U.S. House of Representatives | | 229 | | None |
Invesco V.I. Global Real Estate Fund
Trustees and Officers–(continued)
| | | | | | | | |
Name, Year of Birth and
Position(s)
Held with the Trust | | Trustee
and/or
Officer
Since | | Principal Occupation(s)
During Past 5 Years | | Number of
Funds in
Fund Complex
Overseen by
Trustee | | Other
Directorship(s)
Held by Trustee
During Past
5 Years |
| Independent Trustees–(continued) | | | | |
Cynthia Hostetler - 1962
Trustee | | 2017 | | Non-Executive Director and Trustee of a number of public and private business corporations Formerly: Director, Aberdeen Investment Funds (4 portfolios); Head of Investment Funds and Private Equity, Overseas Private Investment Corporation; President, First Manhattan Bancorporation, Inc.; Attorney, Simpson Thacher & Bartlett LLP | | 229 | | Vulcan Materials Company (construction materials company); Trilinc Global Impact Fund; Genesee & Wyoming, Inc. (railroads); Artio Global Investment LLC (mutual fund complex); Edgen Group, Inc. (specialized energy and infrastructure products distributor); Investment Company Institute (professional organization); Independent Directors Council (professional organization) |
Eli Jones - 1961
Trustee | | 2016 | | Professor and Dean, Mays Business School - Texas A&M University Formerly: Professor and Dean, Walton College of Business, University of Arkansas and E.J. Ourso College of Business, Louisiana State University; Director, Arvest Bank | | 229 | | Insperity, Inc. (formerly known as Administaff) (human resources provider) |
Elizabeth Krentzman - 1959
Trustee | | 2019 | | Formerly: Principal and Chief Regulatory Advisor for Asset Management Services and U.S. Mutual Fund Leader of Deloitte & Touche LLP; General Counsel of the Investment Company Institute (trade association); National Director of the Investment Management Regulatory Consulting Practice, Principal, Director and Senior Manager of Deloitte & Touche LLP; Assistant Director of the Division of Investment Management -Office of Disclosure and Investment Adviser Regulation of the U.S. Securities and Exchange Commission and various positions with the Division of Investment Management - Office of Regulatory Policy of the U.S. Securities and Exchange Commission; Associate at Ropes & Gray LLP; Advisory Board Member of the Securities and Exchange Commission Historical Society; and Trustee of certain Oppenheimer Funds | | 229 | | Trustee of the University of Florida National Board Foundation and Audit Committee Member; Member of the Cartica Funds Board of Directors (private investment funds); Member of the University of Florida Law Center Association, Inc. Board of Trustees and Audit Committee Member |
Anthony J. LaCava, Jr. - 1956
Trustee | | 2019 | | Formerly: Director and Member of the Audit Committee, Blue Hills Bank (publicly traded financial institution) and Managing Partner, KPMG LLP | | 229 | | Blue Hills Bank; Chairman, Bentley University; Member, Business School Advisory Council; and Nominating Committee KPMG LLP |
Prema Mathai-Davis - 1950
Trustee | | 1998 | | Retired Co-Owner & Partner of Quantalytics Research, LLC, (a FinTech Investment Research Platform for the Self-Directed Investor) | | 229 | | None |
Invesco V.I. Global Real Estate Fund
Trustees and Officers–(continued)
| | | | | | | | |
Name, Year of Birth and
Position(s)
Held with the Trust | | Trustee
and/or
Officer
Since | | Principal Occupation(s)
During Past 5 Years | | Number of
Funds in
Fund Complex
Overseen by
Trustee | | Other
Directorship(s)
Held by Trustee
During Past
5 Years |
| Independent Trustees–(continued) | | | | |
Joel W. Motley - 1952
Trustee | | 2019 | | Director of Office of Finance, Federal Home Loan Bank; Member of the Vestry of Trinity Wall Street; Managing Director of Carmona Motley Inc. (privately held financial advisor); Member of the Finance and Budget Committee of the Council on Foreign Relations, Member of the Investment Committee and Board of Human Rights Watch and Member of the Investment Committee and Board of Historic Hudson Valley(non-profit cultural organization) Formerly: Managing Director of Public Capital Advisors, LLC (privately held financial advisor); Managing Director of Carmona Motley Hoffman, Inc. (privately held financial advisor); Trustee of certain Oppenheimer Funds; and Director of Columbia Equity Financial Corp. (privately held financial advisor) | | 229 | | Director of Greenwall Foundation (bioethics research foundation); Member of Board and Investment Committee of The Greenwall Foundation; Director of Southern Africa Legal Services Foundation; Board Member and Investment Committee Member of Pulizer Center for Crisis Reporting(non-profit journalism) |
Teresa M. Ressel - 1962
Trustee | | 2017 | | Non-executive director and trustee of a number of public and private business corporations Formerly: Chief Financial Officer, Olayan America, The Olayan Group (international investor/commercial/industrial); Chief Executive Officer, UBS Securities LLC; Group Chief Operating Officer, Americas, UBS AG; Assistant Secretary for Management & Budget and CFO, US Department of the Treasury | | 229 | | Atlantic Power Corporation (power generation company); ON Semiconductor Corp. (semiconductor supplier) |
Ann Barnett Stern - 1957
Trustee | | 2017 | | President and Chief Executive Officer, Houston Endowment Inc. (private philanthropic institution) Formerly: Executive Vice President and General Counsel, Texas Children’s Hospital; Attorney, Beck, Redden and Secrest, LLP; Business Law Instructor, University of St. Thomas; Attorney, Andrews & Kurth LLP | | 229 | | Federal Reserve Bank of Dallas |
Robert C. Troccoli - 1949
Trustee | | 2016 | | Retired | | 229 | | None |
Daniel S. Vandivort - 1954
Trustee | | 2019 | | Treasurer, Chairman of the Audit and Finance Committee, and Trustee, Board of Trustees, Huntington Disease Foundation of America; and President, Flyway Advisory Services LLC (consulting and property management) Formerly: Trustee and Governance Chair, of certain Oppenheimer Funds | | 229 | | Chairman and Lead Independent Director, Chairman of the Audit Committee, and Director, Board of Directors, Value Line Funds |
James D. Vaughn - 1945
Trustee | | 2019 | | Retired Formerly: Managing Partner, Deloitte & Touche LLP; Trustee and Chairman of the Audit Committee, Schroder Funds; Board Member, Mile High United Way, Boys and Girls Clubs, Boy Scouts, Colorado Business Committee for the Arts, Economic Club of Colorado and Metro Denver Network (economic development corporation); and Trustee of certain Oppenheimer Funds | | 229 | | Board member and Chairman of Audit Committee of AMG National Trust Bank; Trustee and Investment Committee member, University of South Dakota Foundation; Board member, Audit Committee Member and past Board Chair, Junior Achievement(non-profit) |
Invesco V.I. Global Real Estate Fund
Trustees and Officers–(continued)
| | | | | | | | |
Name, Year of Birth and
Position(s)
Held with the Trust | | Trustee
and/or
Officer
Since | | Principal Occupation(s)
During Past 5 Years | | Number of
Funds in
Fund Complex
Overseen by
Trustee | | Other
Directorship(s)
Held by Trustee
During Past
5 Years |
| Independent Trustees–(continued) | | | | |
Christopher L. WIlson - 1957
Trustee, Vice Chair and Chair Designate | | 2017 | | Retired Formerly: Director, TD Asset Management USA Inc. (mutual fund complex) (22 portfolios); Managing Partner, CT2, LLC (investing and consulting firm); President/Chief Executive Officer, Columbia Funds, Bank of America Corporation; President/Chief Executive Officer, CDC IXIS Asset Management Services, Inc.; Principal & Director of Operations, Scudder Funds, Scudder, Stevens & Clark, Inc.; Assistant Vice President, Fidelity Investments | | 229 | | ISO New England, Inc.(non-profit organization managing regional electricity market) |
Invesco V.I. Global Real Estate Fund
Trustees and Officers–(continued)
| | | | | | | | |
Name, Year of Birth and
Position(s)
Held with the Trust | | Trustee
and/or
Officer
Since | | Principal Occupation(s)
During Past 5 Years | | Number of
Funds in
Fund Complex
Overseen by
Trustee | | Other
Directorship(s)
Held by Trustee
During Past 5
Years |
| Officers | | | | | | | | |
Sheri Morris - 1964
President, Principal Executive
Officer and Treasurer | | 1999 | | Head of Global Fund Services, Invesco Ltd.; President, Principal Executive Officer and Treasurer, The Invesco Funds; Vice President, Invesco Advisers, Inc. (formerly known as Invesco Institutional (N.A.), Inc.) (registered investment adviser); and Vice President, Invesco Exchange-Traded Fund Trust, Invesco Exchange-Traded Fund Trust II, Invesco India Exchange-Traded Fund Trust, Invesco Actively Managed Exchange-Traded Fund Trust, Invesco Actively Managed Exchange-Traded Commodity Fund Trust and Invesco Exchange-Traded Self-Indexed Fund Trust; and Vice President, OppenheimerFunds, Inc. Formerly: Vice President and Principal Financial Officer, The Invesco Funds; Vice President, Invesco AIM Advisers, Inc., Invesco AIM Capital Management, Inc. and Invesco AIM Private Asset Management, Inc.; Assistant Vice President and Assistant Treasurer, The Invesco Funds and Assistant Vice President, Invesco Advisers, Inc., Invesco AIM Capital Management, Inc. and Invesco AIM Private Asset Management, Inc.; and Treasurer, Invesco Exchange-Traded Fund Trust, Invesco Exchange-Traded Fund Trust II, Invesco India Exchange-Traded Fund Trust and Invesco Actively Managed Exchange-Traded Fund Trust | | N/A | | N/A |
Russell C. Burk - 1958
Senior Vice President and Senior Officer | | 2005 | | Senior Vice President and Senior Officer, The Invesco Funds | | N/A | | N/A |
Jeffrey H. Kupor - 1968
Senior Vice President, Chief Legal Officer and Secretary | | 2018 | | Head of Legal of the Americas, Invesco Ltd.; Senior Vice President and Secretary, Invesco Advisers, Inc. (formerly known as Invesco Institutional (N.A.), Inc.) (registered investment adviser); Senior Vice President and Secretary, Invesco Distributors, Inc. (formerly known as Invesco AIM Distributors, Inc.); Vice President and Secretary, Invesco Investment Services, Inc. (formerly known as Invesco AIM Investment Services, Inc.) Senior Vice President, Chief Legal Officer and Secretary, The Invesco Funds; Secretary and General Counsel, Invesco Investment Advisers LLC (formerly known as Van Kampen Asset Management); Secretary and General Counsel, Invesco Capital Markets, Inc. (formerly known as Van Kampen Funds Inc.) and Chief Legal Officer, Invesco Exchange-Traded Fund Trust, Invesco Exchange-Traded Fund Trust II, Invesco India Exchange-Traded Fund Trust, Invesco Actively Managed Exchange-Traded Fund Trust, Invesco Actively Managed Exchange-Traded Commodity Fund Trust and Invesco Exchange-Traded Self-Indexed Fund Trust; Secretary, Invesco Indexing LLC; Secretary, W.L. Ross & Co., LLC Formerly: Secretary and Vice President, Jemstep, Inc.; Head of Legal, Worldwide Institutional, Invesco Ltd.; Secretary and General Counsel, INVESCO Private Capital Investments, Inc.; Senior Vice President, Secretary and General Counsel, Invesco Management Group, Inc. (formerly known as Invesco AIM Management Group, Inc.); Assistant Secretary, INVESCO Asset Management (Bermuda) Ltd.; Secretary and General Counsel, Invesco Private Capital, Inc.; Assistant Secretary and General Counsel, INVESCO Realty, Inc.; Secretary and General Counsel, Invesco Senior Secured Management, Inc.; and Secretary, Sovereign G./P. Holdings Inc. | | N/A | | N/A |
| Andrew R. Schlossberg – 1974 Senior Vice President | | 2019 | | Head of the Americas and Senior Managing Director, Invesco Ltd.; Director and Senior Vice President, Invesco Advisers, Inc. (formerly known as Invesco Institutional (N.A.), Inc.) (registered investment adviser); Director and Chairman, Invesco Investment Services, Inc. (formerly known as Invesco AIM Investment Services, Inc.) (registered transfer agent); Senior Vice President, The Invesco Funds; Director, Invesco Investment Advisers LLC (formerly known as Van Kampen Asset Management); Director, President and Chairman, Invesco Insurance Agency, Inc. Formerly: Director, Invesco UK Limited; Director and Chief Executive, Invesco Asset Management Limited and Invesco Fund Managers Limited; Assistant Vice President, The Invesco Funds; Senior Vice President, Invesco Advisers, Inc. (formerly known as Invesco Institutional (N.A.), Inc.) (registered investment adviser); Director and Chief Executive, Invesco Administration Services Limited and Invesco Global Investment Funds Limited; Director, Invesco Distributors, Inc.; Head of EMEA, Invesco Ltd.; President, Invesco Actively Managed Exchange-Traded Commodity Fund Trust, Invesco Actively Managed Exchange-Traded Fund Trust, Invesco Exchange-Traded Fund Trust, Invesco Exchange-Traded Fund Trust II and Invesco India Exchange-Traded Fund Trust; Managing Director and Principal Executive Officer, Invesco Capital Management LLC | | N/A | | N/A |
Invesco V.I. Global Real Estate Fund
Trustees and Officers–(continued)
| | | | | | | | |
Name, Year of Birth and
Position(s)
Held with the Trust | | Trustee
and/or
Officer
Since | | Principal Occupation(s)
During Past 5 Years | | Number of
Funds in
Fund Complex
Overseen by
Trustee | | Other
Directorship(s)
Held by Trustee
During Past 5
Years |
| Officers—(continued) | | | | | | | | |
John M. Zerr – 1962
Senior Vice President | | 2006 | | Chief Operating Officer of the Americas; Senior Vice President, Invesco Advisers, Inc. (formerly known as Invesco Institutional (N.A.), Inc.) (registered investment adviser); Senior Vice President, Invesco Distributors, Inc. (formerly known as Invesco AIM Distributors, Inc.); Director and Vice President, Invesco Investment Services, Inc. (formerly known as Invesco AIM Investment Services, Inc.) Senior Vice President, The Invesco Funds; Managing Director, Invesco Capital Management LLC; Director, Invesco Investment Advisers LLC (formerly known as Van Kampen Asset Management); Senior Vice President, Invesco Capital Markets, Inc. (formerly known as Van Kampen Funds Inc.); Manager, Invesco Indexing LLC; Manager, Invesco Specialized Products, LLC; Director and Senior Vice President, Invesco Insurance Agency, Inc.; Member, Invesco Canada Funds Advisory Board; Director, President and Chief Executive Officer, Invesco Corporate Class Inc. (corporate mutual fund company); and Director, Chairman, President and Chief Executive Officer, Invesco Canada Ltd. (formerly known as Invesco Trimark Ltd./Invesco Trimark Ltèe) (registered investment adviser and registered transfer agent) Formerly: Director and Senior Vice President, Invesco Management Group, Inc. (formerly known as Invesco AIM Management Group, Inc.); Secretary and General Counsel, Invesco Management Group, Inc. (formerly known as Invesco AIM Management Group, Inc.); Secretary, Invesco Investment Services, Inc. (formerly known as Invesco AIM Investment Services, Inc.); Chief Legal Officer and Secretary, The Invesco Funds; Secretary and General Counsel, Invesco Investment Advisers LLC (formerly known as Van Kampen Asset Management); Secretary and General Counsel, Invesco Capital Markets, Inc. (formerly known as Van Kampen Funds Inc.); Chief Legal Officer, Invesco Exchange-Traded Fund Trust, Invesco Exchange-Traded Fund Trust II, Invesco India Exchange-Traded Fund Trust, Invesco Actively Managed Exchange-Traded Fund Trust, Invesco Actively Managed Exchange-Traded Commodity Fund Trust and Invesco Exchange-Traded Self-Indexed Fund Trust; Secretary, Invesco Indexing LLC; Director, Secretary, General Counsel and Senior Vice President, Van Kampen Exchange Corp.; Director, Vice President and Secretary, IVZ Distributors, Inc. (formerly known as INVESCO Distributors, Inc.); Director and Vice President, INVESCO Funds Group, Inc.; Director and Vice President, Van Kampen Advisors Inc.; Director, Vice President, Secretary and General Counsel, Van Kampen Investor Services Inc.;Director and Secretary, Invesco Distributors, Inc. (formerly known as Invesco AIM Distributors, Inc.); Director, Senior Vice President, General Counsel and Secretary, Invesco AIM Advisers, Inc. and Van Kampen Investments Inc.; Director, Vice President and Secretary, Fund Management Company; Director, Senior Vice President, Secretary, General Counsel and Vice President, Invesco AIM Capital Management, Inc.; Chief Operating Officer and General Counsel, Liberty Ridge Capital, Inc. (an investment adviser) | | N/A | | N/A |
| Gregory G. McGreevey – 1962 Senior Vice President | | 2012 | | Senior Managing Director, Invesco Ltd.; Director, Chairman, President, and Chief Executive Officer, Invesco Advisers, Inc. (formerly known as Invesco Institutional (N.A.), Inc.) (registered investment adviser); Director, Invesco Mortgage Capital, Inc. and Invesco Senior Secured Management, Inc.; and Senior Vice President, The Invesco Funds; and President, SNW Asset Management Corporation Formerly: Senior Vice President, Invesco Management Group, Inc. and Invesco Advisers, Inc.; Assistant Vice President, The Invesco Funds | | N/A | | N/A |
Kelli Gallegos - 1970
Vice President, Principal Financial Officer and Assistant Treasurer | | 2008 | | Principal Financial and Accounting Officer – Investments Pool, Invesco Specialized Products, LLC; Vice President, Principal Financial Officer and Assistant Treasurer, The Invesco Funds; Principal Financial and Accounting Officer – Pooled Investments, Invesco Capital Management LLC; Vice President and Treasurer, Invesco Exchange-Traded Fund Trust, Invesco Exchange-Traded Fund Trust II, Invesco India Exchange-Traded Fund Trust, Invesco Actively Managed Exchange-Traded Fund Trust, Invesco Actively Managed Exchange-Traded Commodity Fund Trust and Invesco Exchange-Traded Self-Indexed Fund Trust Formerly: Assistant Treasurer, Invesco Specialized Products, LLC; Assistant Treasurer, Invesco Exchange-Traded Fund Trust, Invesco Exchange-Traded Fund Trust II, Invesco India Exchange-Traded Fund Trust, Invesco Actively Managed Exchange-Traded Fund Trust, Invesco Actively Managed Exchange-Traded Commodity Fund Trust and Invesco Exchange-Traded Self-Indexed Fund Trust; Assistant Treasurer, Invesco Capital Management LLC; Assistant Vice President, The Invesco Funds | | N/A | | N/A |
Invesco V.I. Global Real Estate Fund
Trustees and Officers–(continued)
| | | | | | | | |
Name, Year of Birth and
Position(s)
Held with the Trust | | Trustee
and/or
Officer
Since | | Principal Occupation(s)
During Past 5 Years | | Number of
Funds in
Fund Complex
Overseen by
Trustee | | Other
Directorship(s)
Held by Trustee
During Past 5
Years |
| Officers—(continued) | | | | | | | | |
Crissie M. Wisdom – 1969
Anti-Money Laundering Compliance Officer | | 2013 | | Anti-Money Laundering Compliance Officer, Invesco Advisers, Inc. (formerly known as Invesco Institutional (N.A.), Inc.) (registered investment adviser), Invesco Capital Markets, Inc. (formerly known as Van Kampen Funds Inc.), Invesco Distributors, Inc., Invesco Investment Services, Inc., The Invesco Funds, and Invesco Exchange-Traded Fund Trust, Invesco Exchange-Traded Fund Trust II, Invesco India Exchange-Traded Fund Trust, Invesco Actively Managed Exchange-Traded Fund Trust, Invesco Actively Managed Exchange-Traded Commodity Fund Trust and Invesco Exchange-Traded Self-Indexed Fund Trust; Anti-Money Laundering Compliance Officer and Bank Secrecy Act Officer, INVESCO National Trust Company and Invesco Trust Company; and Fraud Prevention Manager and Controls and Risk Analysis Manager for Invesco Investment Services, Inc. Formerly: Anti-Money Laundering Compliance Officer, Van Kampen Exchange Corp. and Invesco Management Group, Inc. | | N/A | | N/A |
Robert R. Leveille – 1969
Chief Compliance Officer | | 2016 | | Chief Compliance Officer, Invesco Advisers, Inc. (registered investment adviser); and Chief Compliance Officer, The Invesco Funds Formerly: Chief Compliance Officer, Putnam Investments and the Putnam Funds | | N/A | | N/A |
The Statement of Additional Information of the Trust includes additional information about the Fund’s Trustees and is available upon request, without charge, by calling 1.800.959.4246. Please refer to the Fund’s Statement of Additional Information for information on the Fund’ssub-advisers.
| | | | | | |
Office of the Fund 11 Greenway Plaza, Suite 1000 Houston, TX 77046-1173 | | Investment Adviser Invesco Advisers, Inc. 1555 Peachtree Street, N.E. Atlanta, GA 30309 | | Distributor Invesco Distributors, Inc. 11 Greenway Plaza, Suite 1000 Houston, TX 77046-1173 | | Auditors PricewaterhouseCoopers LLP 1000 Louisiana Street, Suite 5800 Houston, TX 77002-5678 |
| | | |
Counsel to the Fund Stradley Ronon Stevens & Young, LLP 2005 Market Street, Suite 2600 Philadelphia, PA 19103-7018 | | Counsel to the Independent Trustees Goodwin Procter LLP 901 New York Avenue, N.W. Washington, D.C. 20001 | | Transfer Agent Invesco Investment Services, Inc. 11 Greenway Plaza, Suite 1000 Houston, TX 77046-1173 | | Custodian State Street Bank and Trust Company 225 Franklin Street Boston, MA 02110-2801 |
Invesco V.I. Global Real Estate Fund
| | | | |
| | |

| | Annual Report to Shareholders | | December 31, 2019 |
| | |
| | Invesco V.I. Government Money Market Fund |

Beginning on January 1, 2021, as permitted by regulations adopted by the Securities and Exchange Commission, the insurance company that offers your variable annuity or variable life insurance contract may no longer send you paper copies of the Fund’s shareholder reports by mail, unless you specifically request paper copies of the reports from the insurance company or your financial intermediary. Instead of delivering paper copies of the report, the insurance company may choose to make the reports available on a website, and will notify you by mail each time a report is posted and provide you with a website link to access the report. Instructions for requesting paper copies will be provided by your insurance company.
If the insurance company offers electronic delivery, you may elect to receive shareholder reports and other communications about the Fund electronically by following the instructions provided by the insurance company or by contacting your financial intermediary. If you already elected to receive shareholder reports electronically, you will not be affected by this change and you need not take any action.
You may elect to receive all future reports in paper free of charge from the insurance company. You can inform the insurance company or your financial intermediary that you wish to continue receiving paper copies of your shareholder reports by following the instructions provided by the insurance company or by contacting your financial intermediary. Your election to receive reports in paper will apply to all portfolio companies available under your contract with the insurance company.
The Fund provides a complete list of its holdings in various monthly and quarterly regulatory filings. The Fund files a complete schedule of portfolio holdings with the Securities and Exchange Commission (SEC) monthly on FormN-MFP. For the second and fourth quarters, the list appears in the Fund’s semiannual and annual reports to shareholders. The Fund’s FormN-MFP filings are available on the SEC website, sec.gov. The SEC file numbers for the Fund are811-07452 and033-57340. The Fund’s most recent portfolio holdings, as filed on FormN-MFP, have also been made available to insurance companies issuing variable annuity contracts and variable life insurance policies (“variable products”) that invest in the Fund.
A description of the policies and procedures that the Fund uses to determine how to vote proxies relating to portfolio securities is available without charge, upon request, from our Client Services department at 800 959 4246 or at invesco.com/proxyguidelines. The information is also available on the SEC website, sec.gov.
Information regarding how the Fund voted proxies related to its portfolio securities during the most recent12-month period ended June 30 is available at invesco.com/proxysearch. The information is also available on the SEC website, sec.gov.
Invesco Advisers, Inc. is an investment adviser; it provides investment advisory services to individual and institutional clients and does not sell securities. Invesco Distributors, Inc. is the US distributor for Invesco Ltd.’s retail mutual funds, exchange-traded funds and institutional money market funds. Both are wholly owned, indirect subsidiaries of Invesco Ltd.
This report must be accompanied or preceded by a currently effective Fund prospectus and variable product prospectus, which contain more complete information, including sales charges and expenses. Investors should read each carefully before investing.
| | | | |
NOT FDC INSURED | MAY LOSE VALUE | NO BANK GUARANTEE |
| Invesco Distributors, Inc. | | | | VIGMKT-AR-1 |
Management’s Discussion
| | | | |
| Fund Information | | | | |
This annual report for Invesco V.I. Government Money Market Fund (the Fund) covers the year ended December 31, 2019. As of December 31, 2019, the Fund’s net assets totaled $670.6 million. As of the same date, the Fund’s weighted average maturity was 23 days and the Fund’s weighted average life was 112 days. Weighted average maturity (WAM) is an average of the maturities of all securities held in the portfolio, weighted by each security’s percentage of net assets. The days to maturity for WAM is the lower of the stated maturity date or next interest rate reset date. WAM reflects how a portfolio would react to interest rate changes. Weighted average life (WAL) is an average of all the maturities of all securities held in the portfolio, weighted by each security’s percentage of net assets. The days to maturity for WAL is the lower of the stated maturity date or next demand feature date. WAL reflects how a portfolio would react to deteriorating credit (widening spreads) or tightening liquidity conditions. | | | | |
Market conditions affecting money market funds
After raising interest rates four times in 2018, the US Federal Reserve (the Fed) adopted a more accommodative monetary policy during 2019. At the start of the year, the Fed indicated there would likely be no interest rate hikes in 2019. During the first half of 2019, the Fed left rates unchanged. In the second half of the year, the Fed cut the federal funds rate by 0.25% three times in July, September and October 2019, respectively.1 This left the federal funds target range at 1.50% to 1.75% at the close of 2019.
One of the major developments impacting money market funds and the money market industry during the second half 2019 was the volatility in the short-term funding markets. October 2019, the Fed directed the Federal Reserve Bank of New York Trading Desk (the Desk) to purchase $60 billion per month in short-term Treasury Bills at least into the second quarter of 2020 to maintain sufficient reserve balances. This has resulted in the flattening of the US Treasury curve and the stabilization of the repurchase agreement operations (repo) markets. Repos have been trending toward the lower end of the federal funds rate of 1.50% in part due to the Fed conducting overnight and term repo operations to keep adequate reserve supply and to lessen the risk of money market pressures on certain funding dates. Although many investors anticipated further volatility through the end of 2019 the Fed was able to supply enough liquidity to the markets so that repo rates were well contained heading into 2020.
At the close of the year, it was Invesco Global Liquidity’s view that the Federal Open Market Committee (FOMC ) monetary policy directive would remain on hold for the year 2020, net issuance of
Treasury supply would be negative, and it would continue to stabilize the funding of markets by liquidity injections in the form of temporary open market operations and Treasury Bill purchases.
For over 35 years, Invesco Global Liquidity has been a core business for Invesco. We believe in a disciplined investment process, high credit quality solutions, distinguished client engagement and consistent performance.
1 Source: US Federal Reserve
The views and opinions expressed in management’s discussion of Fund performance are those of Invesco Advisers, Inc. These views and opinions are subject to change at any time based on factors such as market and economic conditions. These views and opinions may not be relied upon as investment advice or recommendations, or as an offer for a particular security. The information is not a complete analysis of every aspect of any market, country, industry, security or the Fund. Statements of fact are from sources considered reliable, but Invesco Advisers, Inc. makes no representation or warranty as to their completeness or accuracy. Although historical performance is no guarantee of future results, these insights may help you understand our investment management philosophy.
See important Fund and, if applicable, index disclosures later in this report.
Team managed by Invesco Advisers, Inc.
You could lose money by investing in the Fund. Although the Fund seeks to preserve your investment at $1.00 per share, it cannot guarantee it will do so. An investment in the Fund is not insured or guaranteed by the Federal Deposit Insurance Corporation or any other government agency. The Fund’s sponsor has no legal obligation to provide financial support to the Fund, and you should not expect that the sponsor will provide financial support to the Fund at any time.
| | | | |
Portfolio Composition by Maturity | |
In days, as of 12/31/2019 | | | | |
| |
| 1-7 | | | 9.4% | |
| 8-30 | | | 14.7 | |
| 31-60 | | | 9.3 | |
| 61-90 | | | 18.3 | |
| 91-180 | | | 14.8 | |
| 181+ | | | 33.5 | |
The number of days to maturity of each holding is determined in accordance with the provisions of Rule2a-7 under the Investment Company Act of 1940.
Invesco V.I. Government Money Market Fund
Invesco V.I. Government Money Market Fund’s investment objective is to provide current income consistent with preservation of capital and liquidity
| ∎ | Unless otherwise stated, information presented in this report is as of December 31, 2019, and is based on total net assets. |
| ∎ | Unless otherwise noted, all data provided by Invesco. |
| ∎ | To access your Fund’s reports/prospectus, visit invesco.com/fundreports. |
Invesco V.I. Government Money Market Fund
Schedule of Investments
December 31, 2019
| | | | | | | | | | | | | | | | |
| | | Interest
Rate | | | Maturity
Date | | | Principal
Amount
(000) | | | Value | |
| U.S. Government Sponsored AgencySecurities-31.88% | | | | | | | | | |
| Federal Farm Credit Bank(FFCB)-2.24% | | | | | | | | | |
Federal Farm Credit Bank (1 mo. USD LIBOR - 0.06%)(a) | | | 1.73% | | | | 03/25/2020 | | | $ | 8,500 | | | $ | 8,499,156 | |
| |
Federal Farm Credit Bank (1 mo. USD LIBOR)(a) | | | 1.79% | | | | 06/25/2020 | | | | 1,500 | | | | 1,500,070 | |
| |
Federal Farm Credit Bank (1 mo. USD LIBOR - 0.06%)(a) | | | 1.75% | | | | 07/29/2020 | | | | 5,000 | | | | 4,999,654 | |
| |
| | | | | | | | | | | | | | | 14,998,880 | |
| |
| | |
| Federal Home Loan Bank(FHLB)-23.23% | | | | | | | | | |
Federal Home Loan Bank (1 mo. USD LIBOR - 0.07%)(a) | | | 1.72% | | | | 01/23/2020 | | | | 9,800 | | | | 9,799,753 | |
| |
Federal Home Loan Bank (SOFR + 0.03%)(a) | | | 1.58% | | | | 03/06/2020 | | | | 10,000 | | | | 10,000,000 | |
| |
Federal Home Loan Bank (1 mo. USD LIBOR - 0.07%)(a) | | | 1.66% | | | | 04/06/2020 | | | | 10,000 | | | | 10,000,000 | |
| |
Federal Home Loan Bank (1 mo. USD LIBOR - 0.06%)(a) | | | 1.75% | | | | 04/28/2020 | | | | 5,000 | | | | 5,000,000 | |
| |
Federal Home Loan Bank (3 mo. USD LIBOR - 0.22%)(a) | | | 1.67% | | | | 06/08/2020 | | | | 15,000 | | | | 15,000,000 | |
| |
Federal Home Loan Bank (1 mo. USD LIBOR - 0.06%)(a) | | | 1.65% | | | | 06/09/2020 | | | | 5,000 | | | | 5,000,000 | |
| |
Federal Home Loan Bank (3 mo. USD LIBOR - 0.22%)(a) | | | 1.67% | | | | 06/09/2020 | | | | 10,000 | | | | 10,000,000 | |
| |
Federal Home Loan Bank (1 mo. USD LIBOR - 0.06%)(a) | | | 1.66% | | | | 06/10/2020 | | | | 10,000 | | | | 9,999,822 | |
| |
Federal Home Loan Bank (1 mo. USD LIBOR - 0.07%)(a) | | | 1.67% | | | | 06/12/2020 | | | | 5,000 | | | | 5,000,000 | |
| |
Federal Home Loan Bank (1 mo. USD LIBOR - 0.07%)(a) | | | 1.65% | | | | 07/13/2020 | | | | 10,000 | | | | 10,000,000 | |
| |
Federal Home Loan Bank (SOFR + 0.03%)(a) | | | 1.58% | | | | 07/17/2020 | | | | 5,000 | | | | 5,000,000 | |
| |
Federal Home Loan Bank (SOFR + 0.08%)(a) | | | 1.63% | | | | 07/24/2020 | | | | 3,000 | | | | 3,000,000 | |
| |
Federal Home Loan Bank (1 mo. USD LIBOR - 0.06%)(a) | | | 1.69% | | | | 08/13/2020 | | | | 5,000 | | | | 5,000,000 | |
| |
Federal Home Loan Bank (SOFR + 0.05%)(a) | | | 1.60% | | | | 09/28/2020 | | | | 10,000 | | | | 10,000,000 | |
| |
Federal Home Loan Bank (1 mo. USD LIBOR - 0.05%)(a) | | | 1.70% | | | | 10/15/2020 | | | | 2,000 | | | | 2,000,000 | |
| |
Federal Home Loan Bank (SOFR + 0.03%)(a) | | | 1.58% | | | | 11/06/2020 | | | | 4,000 | | | | 4,000,000 | |
| |
Federal Home Loan Bank (SOFR + 0.05%)(a) | | | 1.60% | | | | 01/22/2021 | | | | 5,000 | | | | 5,000,000 | |
| |
Federal Home Loan Bank (SOFR + 0.05%)(a) | | | 1.60% | | | | 01/28/2021 | | | | 12,000 | | | | 11,999,975 | |
| |
Federal Home Loan Bank (SOFR + 0.04%)(a) | | | 1.59% | | | | 02/09/2021 | | | | 8,000 | | | | 8,000,000 | |
| |
Federal Home Loan Bank (SOFR + 0.07%)(a) | | | 1.62% | | | | 02/26/2021 | | | | 5,000 | | | | 5,000,000 | |
| |
Federal Home Loan Bank (SOFR + 0.17%)(a) | | | 1.72% | | | | 04/09/2021 | | | | 5,000 | | | | 5,000,000 | |
| |
Federal Home Loan Bank (SOFR + 0.08%)(a) | | | 1.63% | | | | 07/23/2021 | | | | 2,000 | | | | 2,000,000 | |
| |
| | | | | | | | | | | | | | | 155,799,550 | |
| |
| | |
| Federal Home Loan Mortgage Corp.(FHLMC)-2.24% | | | | | | | | | |
Federal Home Loan Mortgage Corp. (SOFR + 0.04%)(a) | | | 1.59% | | | | 04/03/2020 | | | | 5,000 | | | | 5,000,000 | |
| |
Federal Home Loan Mortgage Corp. (SOFR + 0.04%)(a) | | | 1.59% | | | | 09/10/2020 | | | | 4,000 | | | | 4,000,000 | |
| |
Federal Home Loan Mortgage Corp. (SOFR + 0.03%)(a) | | | 1.58% | | | | 02/05/2021 | | | | 3,000 | | | | 3,000,000 | |
| |
Federal Home Loan Mortgage Corp. (SOFR + 0.03%)(a) | | | 1.58% | | | | 02/19/2021 | | | | 3,000 | | | | 3,000,000 | |
| |
| | | | | | | | | | | | | | | 15,000,000 | |
| |
| | |
| Federal National Mortgage Association(FNMA)-0.45% | | | | | | | | | |
Federal National Mortgage Association (SOFR + 0.06%)(a) | | | 1.61% | | | | 07/30/2020 | | | | 3,000 | | | | 3,000,000 | |
| |
| | |
| Overseas Private Investment Corp.(OPIC)-3.72% | | | | | | | | | |
Overseas Private Investment Corp. VRD Bonds (3 mo. U.S. Treasury Bill Rate)(b) | | | 1.95% | | | | 09/15/2020 | | | | 5,000 | | | | 5,000,000 | |
| |
Overseas Private Investment Corp. VRD Bonds (3 mo. U.S. Treasury Bill Rate)(b) | | | 1.95% | | | | 06/15/2025 | | | | 3,000 | | | | 3,000,000 | |
| |
Overseas Private Investment Corp. VRD Bonds (3 mo. U.S. Treasury Bill Rate)(b) | | | 1.95% | | | | 07/15/2025 | | | | 298 | | | | 297,722 | |
| |
Overseas Private Investment Corp. VRD Bonds (3 mo. U.S. Treasury Bill Rate)(b) | | | 1.95% | | | | 02/15/2028 | | | | 9,167 | | | | 9,166,667 | |
| |
Overseas Private Investment Corp. VRD Bonds (3 mo. U.S. Treasury Bill Rate)(b) | | | 1.54% | | | | 07/07/2040 | | | | 7,494 | | | | 7,493,565 | |
| |
| | | | | | | | | | | | | | | 24,957,954 | |
| |
Total U.S. Government Sponsored Agency Securities (Cost $213,756,384) | | | | | | | | | | | | | | | 213,756,384 | |
| |
See accompanying Notes to Financial Statements which are an integral part of the financial statements.
Invesco V.I. Government Money Market Fund
| | | | | | | | | | | | | | | | |
| | | Interest
Rate | | | Maturity
Date | | | Principal
Amount
(000) | | | Value | |
| U.S. TreasurySecurities-27.07% | | | | | | | | | |
| U.S. TreasuryBills-17.83%(c) | | | | | | | | | |
U.S. Treasury Bills | | | 1.64% | | | | 01/23/2020 | | | $ | 10,000 | | | $ | 9,990,039 | |
| |
U.S. Treasury Bills | | | 1.56% | | | | 01/28/2020 | | | | 10,000 | | | | 9,988,338 | |
| |
U.S. Treasury Bills | | | 1.56% | | | | 02/18/2020 | | | | 10,000 | | | | 9,979,267 | |
| |
U.S. Treasury Bills | | | 1.57% | | | | 02/25/2020 | | | | 25,000 | | | | 24,940,226 | |
| |
U.S. Treasury Bills | | | 1.57% | | | | 03/05/2020 | | | | 15,000 | | | | 14,958,400 | |
| |
U.S. Treasury Bills | | | 1.56% | | | | 03/26/2020 | | | | 5,000 | | | | 4,981,642 | |
| |
U.S. Treasury Bills | | | 1.52% | | | | 04/02/2020 | | | | 5,000 | | | | 4,980,789 | |
| |
U.S. Treasury Bills | | | 1.69% | | | | 04/09/2020 | | | | 10,000 | | | | 9,953,800 | |
| |
U.S. Treasury Bills | �� | | 1.63% | | | | 04/16/2020 | | | | 5,000 | | | | 4,976,150 | |
| |
U.S. Treasury Bills | | | 1.62% | | | | 04/30/2020 | | | | 10,000 | | | | 9,946,333 | |
| |
U.S. Treasury Bills | | | 1.58% | | | | 06/25/2020 | | | | 5,000 | | | | 4,961,622 | |
| |
U.S. Treasury Bills | | | 1.56% | | | | 07/02/2020 | | | | 5,000 | | | | 4,960,567 | |
| |
U.S. Treasury Bills | | | 1.78% | | | | 08/13/2020 | | | | 5,000 | | | | 4,945,312 | |
| |
| | | | | | | | | | | | | | | 119,562,485 | |
| |
| | |
| U.S. TreasuryNotes-9.24% | | | | | | | | | |
U.S. Treasury Floating Rate Notes (3 mo. U.S. Treasury Bill Money Market Yield Rate + 0.05%)(a) | | | 1.57% | | | | 10/31/2020 | | | | 38,000 | | | | 37,999,094 | |
| |
U.S. Treasury Floating Rate Notes (3 mo. U.S. Treasury Bill Money Market Yield Rate + 0.12%)(a) | | | 1.64% | | | | 01/31/2021 | | | | 14,000 | | | | 13,994,502 | |
| |
U.S. Treasury Floating Rate Notes (3 mo. U.S. Treasury Bill Money Market Yield Rate + 0.14%)(a) | | | 1.67% | | | | 04/30/2021 | | | | 10,000 | | | | 10,000,038 | |
| |
| | | | | | | | | | | | | | | 61,993,634 | |
| |
Total U.S. Treasury Securities (Cost $181,556,119) | | | | | | | | | | | | | | | 181,556,119 | |
| |
TOTAL INVESTMENTS IN SECURITIES (excluding RepurchaseAgreements)-58.95%
(Cost $395,312,503) | | | | | | | | | | | | | | | 395,312,503 | |
| |
| | | | |
| | | | | | | | | Repurchase
Amount | | | | |
| | |
| RepurchaseAgreements-42.46%(d) | | | | | | | | | |
Bank of Montreal, joint term agreement dated 11/14/2019, aggregate maturing value of $501,358,333 (collateralized by U.S. Treasury obligations and domestic agency mortgage-backed securities valued at $510,000,000; 2.50% - 7.00%; 03/31/2023 - 12/01/2049)(e) | | | 1.63% | | | | 01/13/2020 | | | | 10,027,167 | | | | 10,000,000 | |
| |
BMO Capital Markets Corp., joint term agreement dated 11/14/2019, aggregate maturing value of $1,002,790,000 (collateralized by U.S. Treasury obligations valued at $1,020,000,093; 0% - 8.75%; 01/02/2020 - 08/15/2049)(e) | | | 1.62% | | | | 01/15/2020 | | | | 5,013,950 | | | | 5,000,000 | |
| |
BNP Paribas Securities Corp., joint term agreement dated 12/09/2019, aggregate maturing value of $1,001,383,333 (collateralized by U.S. Treasury obligations valued at $1,020,000,037; 0% - 6.00%; 01/02/2020 - 02/15/2049)(e) | | | 1.66% | | | | 01/08/2020 | | | | 10,013,833 | | | | 10,000,000 | |
| |
BNP Paribas Securities Corp., term agreement dated 12/04/2019, maturing value of $8,032,600 (collateralized by domestic agency mortgage-backed securities and U.S. Treasury obligations valued at $8,160,000; 0% - 3.50%; 01/02/2020 - 09/20/2049)(e) | | | 1.63% | | | | 03/03/2020 | | | | 8,032,600 | | | | 8,000,000 | |
| |
CIBC World Markets Corp. , term agreement dated 11/01/2019, maturing value of $10,032,444 (collateralized by U.S. Treasury obligations valued at $10,200,007; 0.50% - 3.00%; 07/31/2021 - 08/15/2049)(e) | | | 1.60% | | | | 01/13/2020 | | | | 10,032,444 | | | | 10,000,000 | |
| |
CIBC World Markets Corp., joint term agreement dated 10/11/2019, aggregate maturing value of $502,162,500 (collateralized by U.S. Treasury obligations valued at $510,000,289; 0.13% - 3.63%; 02/15/2021 - 08/15/2049)(e) | | | 1.73% | | | | 01/09/2020 | | | | 5,021,625 | | | | 5,000,000 | |
| |
CIBC World Markets Corp., term agreement dated 11/04/2019, maturing value of $15,046,667 (collateralized by U.S. Treasury obligations valued at $15,300,063; 1.38% - 3.75%; 12/31/2020 - 08/15/2049)(e) | | | 1.60% | | | | 01/13/2020 | | | | 15,046,667 | | | | 15,000,000 | |
| |
Credit Agricole Corporate & Investment Bank, joint term agreement dated 12/09/2019, aggregate maturing value of $1,001,420,833 (collateralized by U.S. Treasury obligations valued at $1,020,000,109; 0.13% - 3.63%; 01/15/2020 - 08/15/2047)(e) | | | 1.65% | | | | 01/09/2020 | | | | 10,014,208 | | | | 10,000,000 | |
| |
See accompanying Notes to Financial Statements which are an integral part of the financial statements.
Invesco V.I. Government Money Market Fund
| | | | | | | | | | | | | | | | |
| | | Interest
Rate | | | Maturity
Date | | | Repurchase
Amount | | | Value | |
Credit Agricole Corporate & Investment Bank, joint term agreement dated 12/23/2019, aggregate maturing value of $1,004,044,444 (collateralized by U.S. Treasury obligations valued at $1,020,000,081; 0.13% - 4.25%; 06/30/2020 - 11/15/2040)(e) | | | 1.60% | | | | 03/23/2020 | | | $ | 11,044,489 | | | $ | 11,000,000 | |
| |
ING Financial Markets, LLC, joint term agreement dated 11/21/2019, aggregate maturing value of $685,836,727 (collateralized by domestic agency mortgage-backed securities and a U.S. Treasury obligation valued at $696,660,001; 1.75% - 6.50%; 01/01/2024 - 09/01/2057) | | | 1.68% | | | | 02/18/2020 | | | | 18,074,760 | | | | 18,000,000 | |
| |
J.P. Morgan Securities LLC, joint open agreement dated 05/02/2019 (collateralized by U.S. Treasury obligations, domestic agency mortgage-backed securities and U.S. government sponsered agency obligations valued at $510,000,033; 0% - 6.00%; 09/30/2020 - 08/01/2049)(f) | | | 1.55% | | | | - | | | | - | | | | 12,000,000 | |
| |
J.P. Morgan Securities LLC, joint open agreement dated 05/15/2019 (collateralized by U.S. Treasury obligations and domestic agency mortgage-backed securities valued at $295,800,004; 0% - 6.50%; 02/15/2020 - 12/01/2049)(f) | | | 1.59% | | | | - | | | | - | | | | 5,000,000 | |
| |
J.P. Morgan Securities LLC, joint open agreement dated 07/18/2019 (collateralized by U.S. Treasury obligations valued at $357,000,120; 0% - 2.75%; 02/06/2020 - 07/15/2025)(f) | | | 1.53% | | | | - | | | | - | | | | 5,000,000 | |
| |
J.P. Morgan Securities LLC, joint open agreement dated 10/15/2019 (collateralized by U.S. Treasury obligations, domestic agency mortgage-backed securities and a U.S. government sponsored agency obligation valued at $408,000,001; 0% - 8.00%; 01/01/2029 - 12/16/2059)(f) | | | 1.56% | | | | - | | | | - | | | | 10,000,000 | |
| |
J.P. Morgan Securities LLC, joint term agreement dated 12/04/2019, aggregate maturing value of $572,000,000 (collateralized by U.S. Treasury obligations valued at $583,440,041; 0% - 4.50%; 03/26/2020 - 02/15/2036)(a) | | | 1.56% | | | | 03/04/2020 | | | | 7,000,000 | | | | 7,000,000 | |
| |
Metropolitan Life Insurance Co., joint term agreement dated 12/31/2019, aggregate maturing value of $450,140,976 (collateralized by U.S. Treasury obligations valued at $456,345,231; 0% - 2.63%; 01/30/2020 - 05/15/2046)(e) | | | 1.56% | | | | 01/07/2020 | | | | 15,004,750 | | | | 15,000,200 | |
| |
Mitsubishi UFJ Trust & Banking Corp., joint term agreement dated 12/26/2019, aggregate maturing value of $1,189,900,059 (collateralized by U.S. Treasury obligations valued at $1,215,505,890; 1.63% - 2.63%; 04/30/2024 - 08/15/2029)(e) | | | 2.00% | | | | 01/02/2020 | | | | 29,861,608 | | | | 29,850,000 | |
| |
Mitsubishi UFJ Trust & Banking Corp., joint term agreement dated 12/26/2019, aggregate maturing value of $100,038,889 (collateralized by U.S. Treasury obligations valued at $102,034,206; 2.63%; 02/15/2029)(e) | | | 2.00% | | | | 01/02/2020 | | | | 15,005,833 | | | | 15,000,000 | |
| |
RBC Capital Markets LLC, joint term agreement dated 12/31/2019, aggregate maturing value of $1,250,000,000 (collateralized by domestic agency mortgage-backed securities, U.S. government sponsored agency obligations and a foreign corporate obligation valued at $1,275,000,002; 0% - 8.00%; 11/15/2021 - 08/20/2069)(a)(e) | | | 1.60% | | | | 03/02/2020 | | | | 45,000,000 | | | | 45,000,000 | |
| |
RBC Dominion Securities Inc., joint agreement dated 12/31/2019, aggregate maturing value of $650,056,694 (collateralized by domestic agency mortgage-backed securities and U.S. Treasury obligations valued at $663,000,028; 0% - 6.00%; 01/02/2020 - 11/20/2049) | | | 1.57% | | | | 01/02/2020 | | | | 3,908,719 | | | | 3,908,378 | |
| |
RBC Dominion Securities Inc., joint term agreement dated 12/09/2019, aggregate maturing value of $350,490,000 (collateralized by domestic agency mortgage-backed securities and U.S. Treasury obligations valued at $357,000,035; 0% - 5.50%; 01/02/2020 - 01/01/2050)(e) | | | 1.68% | | | | 01/08/2020 | | | | 5,007,000 | | | | 5,000,000 | |
| |
RBC Dominion Securities Inc., joint term agreement dated 12/09/2019, aggregate maturing value of $350,962,500 (collateralized by domestic agency mortgage-backed securities and U.S. Treasury obligations valued at $357,000,054; 1.50% - 6.00%; 07/15/2021 - 11/20/2049)(e) | | | 1.65% | | | | 02/07/2020 | | | | 5,013,750 | | | | 5,000,000 | |
| |
RBC Dominion Securities Inc., joint term agreement dated 12/11/2019, aggregate maturing value of $325,829,111 (collateralized by domestic agency mortgage-backed securities and U.S. Treasury obligations valued at $331,500,091; 0.13% - 4.50%; 03/31/2022 - 12/01/2049)(e) | | | 1.64% | | | | 02/05/2020 | | | | 5,012,755 | | | | 5,000,000 | |
| |
Royal Bank of Canada, joint term agreement dated 12/20/2019, aggregate maturing value of $1,004,000,000 (collateralized by domestic agency mortgage-backed securities valued at $1,020,000,000; 0% - 5.00%; 01/25/2029 - 12/20/2049)(e) | | | 1.60% | | | | 03/19/2020 | | | | 15,060,000 | | | | 15,000,000 | |
| |
See accompanying Notes to Financial Statements which are an integral part of the financial statements.
Invesco V.I. Government Money Market Fund
| | | | | | | | | | | | | | | | |
| | | Interest
Rate | | | Maturity
Date | | | Repurchase
Amount | | | Value | |
Societe Generale, joint open agreement dated 06/25/2018 (collateralized by U.S. Treasury obligations and domestic agency mortgage-backed securities valued at $510,000,000; 0% -7.50%; 07/01/2020 -
04/20/2065)(f) | | | 1.57% | | | | - | | | $ | - | | | $ | 5,000,000 | |
| |
Total Repurchase Agreements (Cost $284,758,578) | | | | | | | | | | | | | | | 284,758,578 | |
| |
TOTAL INVESTMENTS IN SECURITIES(g)-101.41% (Cost $680,071,081) | | | | | | | | | | | | 680,071,081 | |
| |
OTHER ASSETS LESS LIABILITIES-(1.41)% | | | | | | | | | | | | (9,423,488 | ) |
| |
NETASSETS-100.00% | | | | | | | | | | | $ | 670,647,593 | |
| |
| | |
| LIBOR | | -London Interbank Offered Rate |
| SOFR | | -Secured Overnight Financing Rate |
| USD | | -U.S. Dollar |
| VRD | | -Variable Rate Demand |
Notes to Schedule of Investments:
| (a) | Interest or dividend rate is redetermined periodically. Rate shown is the rate in effect on December 31, 2019. |
| (b) | Demand security payable upon demand by the Fund at specified time intervals no greater than thirteen months. Interest rate is redetermined periodically by the issuer or agent based on current market conditions. Rate shown is the rate in effect on December 31, 2019. |
| (c) | Security traded on a discount basis. The interest rate shown represents the discount rate at the time of purchase by the Fund. |
| (d) | Principal amount equals value at period end. See Note 1I. |
| (e) | The Fund may demand payment of the term repurchase agreement upon one to seven business days’ notice depending on the timing of the demand. |
| (f) | Either party may terminate the agreement upon demand. Interest rates, principal amount and collateral are redetermined daily. |
| (g) | Also represents cost for federal income tax purposes. |
See accompanying Notes to Financial Statements which are an integral part of the financial statements.
Invesco V.I. Government Money Market Fund
Statement of Assets and Liabilities
December 31, 2019
| | | | |
| |
Assets: | | | | |
Investments in securities, excluding repurchase agreements, at value and cost | | $ | 395,312,503 | |
| |
Repurchase agreements, at value and cost | | | 284,758,578 | |
| |
Receivable for: | | | | |
Fund shares sold | | | 887,183 | |
| |
Interest | | | 810,863 | |
| |
Investment for trustee deferred compensation and retirement plans | | | 48,550 | |
| |
Total assets | | | 681,817,677 | |
| |
| |
Liabilities: | | | | |
Payable for: | | | | |
Investments purchased | | | 9,941,356 | |
| |
Fund shares reacquired | | | 775,086 | |
| |
Dividends | | | 18,401 | |
| |
Accrued fees to affiliates | | | 326,118 | |
| |
Accrued trustees’ and officers’ fees and benefits | | | 629 | |
| |
Accrued operating expenses | | | 51,406 | |
| |
Trustee deferred compensation and retirement plans | | | 57,088 | |
| |
Total liabilities | | | 11,170,084 | |
| |
Net assets applicable to shares outstanding | | $ | 670,647,593 | |
| |
| |
Net assets consist of: | | | | |
Shares of beneficial interest | | $ | 670,653,256 | |
| |
Distributable earnings (loss) | | | (5,663 | ) |
| |
| | $ | 670,647,593 | |
| |
| |
Net Assets: | | | | |
Series I | | $ | 598,669,868 | |
| |
Series II | | $ | 71,977,725 | |
| |
| |
Shares outstanding, no par value,
unlimited number of shares authorized: | | | | |
Series I | | | 598,663,458 | |
| |
Series II | | | 71,976,936 | |
| |
Series I: | | | | |
Net asset value and offering price per share | | $ | 1.00 | |
| |
Series II: | | | | |
Net asset value and offering price per share | | $ | 1.00 | |
| |
Statement of Operations
For the year ended December 31, 2019
| | | | |
Investment income: | | | | |
Interest | | $ | 16,784,420 | |
| |
| |
Expenses: | | | | |
Advisory fees | | | 1,116,208 | |
| |
Administrative services fees | | | 1,412,721 | |
| |
Custodian fees | | | 9,386 | |
| |
Distribution fees - Series II | | | 199,305 | |
| |
Transfer agent fees | | | 17,355 | |
| |
Trustees’ and officers’ fees and benefits | | | 29,174 | |
| |
Reports to shareholders | | | 12,197 | |
| |
Professional services fees | | | 60,368 | |
| |
Other | | | 11,749 | |
| |
Total expenses | | | 2,868,463 | |
| |
Net investment income | | | 13,915,957 | |
| |
Net realized gain from investment securities | | | 10,478 | |
| |
Net increase in net assets resulting from operations | | $ | 13,926,435 | |
| |
See accompanying Notes to Financial Statements which are an integral part of the financial statements.
Invesco V.I. Government Money Market Fund
Statement of Changes in Net Assets
For the years ended December 31, 2019 and 2018
| | | | | | | | |
| | | 2019 | | | 2018 | |
| |
Operations: | | | | | | | | |
Net investment income | | $ | 13,915,957 | | | $ | 12,056,451 | |
| |
Net realized gain (loss) | | | 10,478 | | | | (1,401 | ) |
| |
Net increase in net assets resulting from operations | | | 13,926,435 | | | | 12,055,050 | |
| |
| | |
Distributions to shareholders from distributable earnings: | | | | | | | | |
Series I | | | (12,604,943 | ) | | | (10,928,099 | ) |
| |
Series II | | | (1,311,014 | ) | | | (1,128,352 | ) |
| |
Total distributions from distributable earnings | | | (13,915,957 | ) | | | (12,056,451 | ) |
| |
| | |
Sharetransactions-net: | | | | | | | | |
Series I | | | (302,240,128 | ) | | | 244,533,792 | |
| |
Series II | | | (24,362,713 | ) | | | 10,798,163 | |
| |
Net increase (decrease) in net assets resulting from share transactions | | | (326,602,841 | ) | | | 255,331,955 | |
| |
Net increase (decrease) in net assets | | | (326,592,363 | ) | | | 255,330,554 | |
| |
| | |
Net assets: | | | | | | | | |
Beginning of year | | | 997,239,956 | | | | 741,909,402 | |
| |
End of year | | $ | 670,647,593 | | | $ | 997,239,956 | |
| |
See accompanying Notes to Financial Statements which are an integral part of the financial statements.
Invesco V.I. Government Money Market Fund
Financial Highlights
The following schedule presents financial highlights for a share of the Fund outstanding throughout the periods indicated.
| | | | | | | | | | | | | | | | | | | | | | | | | | | | | | | | | | | | | | | | | | | | |
| | | Net asset
value,
beginning
of period | | | Net
investment
income(a) | | | Net gains
(losses)
on securities
(realized) | | | Total from
investment
operations | | | Dividends from net investment income | | | Net asset
value, end
of period | | | Total
return(b) | | | Net assets,
end of period (000’s omitted) | | | Ratio of
expenses
to average net assets
with fee waivers
and/or expenses
absorbed | | | Ratio of
expenses
to average net
assets without fee waivers
and/or expenses
absorbed | | | Ratio of net investment
income
to average
net assets | |
Series I | | | | | | | | | | | | | | | | | | | | | | | | | | | | | | | | | | | | | | | | | | | | |
Year ended 12/31/19 | | | $1.00 | | | | $0.02 | | | | $0.00 | | | | $0.02 | | | | $(0.02 | ) | | | $1.00 | | | | 1.90 | % | | | $598,670 | | | | 0.36%(c) | | | | 0.36%(c) | | | | 1.90%(c) | |
Year ended 12/31/18 | | | 1.00 | | | | 0.02 | | | | (0.00 | ) | | | 0.02 | | | | (0.02 | ) | | | 1.00 | | | | 1.55 | | | | 900,901 | | | | 0.36 | | | | 0.36 | | | | 1.55 | |
Year ended 12/31/17 | | | 1.00 | | | | 0.01 | | | | (0.00 | ) | | | 0.01 | | | | (0.01 | ) | | | 1.00 | | | | 0.56 | | | | 656,368 | | | | 0.40 | | | | 0.40 | | | | 0.56 | |
Year ended 12/31/16 | | | 1.00 | | | | 0.00 | | | | 0.00 | | | | 0.00 | | | | (0.00 | ) | | | 1.00 | | | | 0.10 | | | | 636,532 | | | | 0.35 | | | | 0.38 | | | | 0.10 | |
Year ended 12/31/15 | | | 1.00 | | | | 0.00 | | | | 0.00 | | | | 0.00 | | | | (0.00 | ) | | | 1.00 | | | | 0.01 | | | | 737,858 | | | | 0.21 | | | | 0.51 | | | | 0.01 | |
Series II | | | | | | | | | | | | | | | | | | | | | | | | | | | | | | | | | | | | | | | | | | | | |
Year ended 12/31/19 | | | 1.00 | | | | 0.02 | | | | 0.00 | | | | 0.02 | | | | (0.02 | ) | | | 1.00 | | | | 1.64 | | | | 71,978 | | | | 0.61(c) | | | | 0.61(c) | | | | 1.65(c) | |
Year ended 12/31/18 | | | 1.00 | | | | 0.01 | | | | (0.00 | ) | | | 0.01 | | | | (0.01 | ) | | | 1.00 | | | | 1.30 | | | | 96,339 | | | | 0.61 | | | | 0.61 | | | | 1.30 | |
Year ended 12/31/17 | | | 1.00 | | | | 0.00 | | | | (0.00 | ) | | | 0.00 | | | | (0.00 | ) | | | 1.00 | | | | 0.31 | | | | 85,541 | | | | 0.65 | | | | 0.65 | | | | 0.31 | |
Year ended 12/31/16 | | | 1.00 | | | | 0.00 | | | | 0.00 | | | | 0.00 | | | | (0.00 | ) | | | 1.00 | | | | 0.03 | | | | 97,362 | | | | 0.43 | | | | 0.63 | | | | 0.02 | |
Year ended 12/31/15 | | | 1.00 | | | | 0.00 | | | | 0.00 | | | | 0.00 | | | | (0.00 | ) | | | 1.00 | | | | 0.01 | | | | 23,940 | | | | 0.21 | | | | 0.76 | | | | 0.01 | |
| (a) | Calculated using average shares outstanding. |
| (b) | Includes adjustments in accordance with accounting principles generally accepted in the United States of America. Total returns are not annualized for periods less than one year, if applicable and do not reflect charges assessed in connection with a variable product, which if included would reduce total returns. |
| (c) | Ratios are based on average daily net assets (000’s omitted) of $664,417 and $79,722 for Series I and Series II shares, respectively. |
See accompanying Notes to Financial Statements which are an integral part of the financial statements.
Invesco V.I. Government Money Market Fund
Notes to Financial Statements
December 31, 2019
NOTE 1–Significant Accounting Policies
Invesco V.I. Government Money Market Fund (the “Fund”) is a series portfolio of AIM Variable Insurance Funds (Invesco Variable Insurance Funds) (the “Trust”). The Trust is a Delaware statutory trust registered under the Investment Company Act of 1940, as amended (the “1940 Act”), as anopen-end series management investment company. Information presented in these financial statements pertains only to the Fund. Matters affecting the Fund or each class will be voted on exclusively by the shareholders of the Fund or each class. Current Securities and Exchange Commission (“SEC”) guidance, however, requires participating insurance companies offering separate accounts to vote shares proportionally in accordance with the instructions of the contract owners whose investments are funded by shares of each Fund or class.
The Fund’s investment objective is to provide current income consistent with preservation of capital and liquidity.
The Fund currently offers two classes of shares, Series I and Series II, both of which are offered to insurance company separate accounts funding variable annuity contracts and variable life insurance policies (“variable products”).
The Fund is an investment company and accordingly follows the investment company accounting and reporting guidance in accordance with Financial Accounting Standards Board Accounting Standards Codification Topic 946,Financial Services – Investment Companies.
The following is a summary of the significant accounting policies followed by the Fund in the preparation of its financial statements.
| A. | Security Valuations- The Fund’s securities are recorded on the basis of amortized cost which approximates value as permitted by Rule2a-7 under the 1940 Act. This method values a security at its cost on the date of purchase and, thereafter, assumes a constant amortization to maturity of any premiums or accretion of any discounts. |
Because of the inherent uncertainties of valuation, the values reflected in the financial statements may materially differ from the value received upon actual sale of those investments.
The Fund may invest in securities that are subject to interest rate risk, meaning the risk that the prices will generally fall as interest rates rise and, conversely, the prices will generally rise as interest rates fall. Specific securities differ in their sensitivity to changes in interest rates depending on their individual characteristics. Changes in interest rates may result in increased market volatility, which may affect the value and/or liquidity of certain Fund investments.
| B. | Securities Transactions and Investment Income- Securities transactions are accounted for on a trade date basis. Realized gains or losses on sales are computed on the basis of specific identification of the securities sold. Interest income (net of withholding tax, if any) is recorded on the accrual basis from settlement date. Bond premiums and discounts are amortized and/or accreted over the lives of the respective securities.Pay-in-kind interest income andnon-cash dividend income received in the form of securitiesin-lieu of cash are recorded at the fair value of the securities received. Paydown gains and losses on mortgage and asset-backed securities are recorded as adjustments to interest income. |
The Fund may periodically participate in litigation related to Fund investments. As such, the Fund may receive proceeds from litigation settlements. Any proceeds received are included in the Statement of Operations as realized gain (loss) for investments no longer held and as unrealized gain (loss) for investments still held.
Brokerage commissions and mark ups are considered transaction costs and are recorded as an increase to the cost basis of securities purchased and/or a reduction of proceeds on a sale of securities. Such transaction costs are included in the determination of net realized and unrealized gain (loss) from investment securities reported in the Statement of Operations and the Statement of Changes in Net Assets and the net realized and unrealized gains (losses) on securities per share in the Financial Highlights. Transaction costs are included in the calculation of the Fund’s net asset value and, accordingly, they reduce the Fund’s total returns. These transaction costs are not considered operating expenses and are not reflected in net investment income reported in the Statement of Operations and the Statement of Changes in Net Assets, or the net investment income per share and the ratios of expenses and net investment income reported in the Financial Highlights, nor are they limited by any expense limitation arrangements between the Fund and the investment adviser.
The Fund allocates realized and unrealized capital gains and losses to a class based on the relative net assets of each class. The Fund allocates income to a class based on the relative value of the settled shares of each class.
| C. | Country Determination- For the purposes of making investment selection decisions and presentation in the Schedule of Investments, the investment adviser may determine the country in which an issuer is located and/or credit risk exposure based on various factors. These factors include the laws of the country under which the issuer is organized, where the issuer maintains a principal office, the country in which the issuer derives 50% or more of its total revenues and the country that has the primary market for the issuer’s securities, as well as other criteria. Among the other criteria that may be evaluated for making this determination are the country in which the issuer maintains 50% or more of its assets, the type of security, financial guarantees and enhancements, the nature of the collateral and the sponsor organization. Country of issuer and/or credit risk exposure has been determined to be the United States of America, unless otherwise noted. |
| D. | Distributions - Distributions from net investment income, if any, are declared daily and paid monthly to separate accounts of participating insurance companies. Distributions from net realized gain, if any, are generally declared and paid annually and recorded on theex-dividend date. |
| E. | Federal Income Taxes - The Fund intends to comply with the requirements of Subchapter M of the Internal Revenue Code of 1986, as amended (the “Internal Revenue Code”), necessary to qualify as a regulated investment company and to distribute substantially all of the Fund’s taxable earnings to shareholders. As such, the Fund will not be subject to federal income taxes on otherwise taxable income (including net realized capital gain) that is distributed to shareholders. Therefore, no provision for federal income taxes is recorded in the financial statements. |
The Fund recognizes the tax benefits of uncertain tax positions only when the position is more likely than not to be sustained. Management has analyzed the Fund’s uncertain tax positions and concluded that no liability for unrecognized tax benefits should be recorded related to uncertain tax positions. Management is not aware of any tax positions for which it is reasonably possible that the total amounts of unrecognized tax benefits will change materially in the next 12 months.
The Fund files tax returns in the U.S. Federal jurisdiction and certain other jurisdictions. Generally, the Fund is subject to examinations by such taxing authorities for up to three years after the filing of the return for the tax period.
Invesco V.I. Government Money Market Fund
| F. | Expenses- Fees provided for under the Rule12b-1 plan of a particular class of the Fund and which are directly attributable to that class are charged to the operations of such class. All other expenses are allocated among the classes based on relative net assets. |
| G. | Accounting Estimates- The preparation of financial statements in conformity with accounting principles generally accepted in the United States of America (“GAAP”) requires management to make estimates and assumptions that affect the reported amounts of assets and liabilities at the date of the financial statements and the reported amounts of revenues and expenses during the reporting period including estimates and assumptions related to taxation. Actual results could differ from those estimates by a significant amount. In addition, the Fund monitors for material events or transactions that may occur or become known after theperiod-end date and before the date the financial statements are released to print. |
| H. | Indemnifications- Under the Trust’s organizational documents, each Trustee, officer, employee or other agent of the Trust is indemnified against certain liabilities that may arise out of the performance of their duties to the Fund. Additionally, in the normal course of business, the Fund enters into contracts, including the Fund’s servicing agreements, that contain a variety of indemnification clauses. The Fund’s maximum exposure under these arrangements is unknown as this would involve future claims that may be made against the Fund that have not yet occurred. The risk of material loss as a result of such indemnification claims is considered remote. |
| I. | Repurchase Agreements- The Fund may enter into repurchase agreements. Collateral on repurchase agreements, including the Fund’spro-rata interest in joint repurchase agreements, is taken into possession by the Fund upon entering into the repurchase agreement. Collateral consisting of U.S. Government Securities and U.S. Government Sponsored Agency Securities is marked to market daily to ensure its market value is at least 102% of the sales price of the repurchase agreement. The investments in some repurchase agreements, pursuant to procedures approved by the Board of Trustees, are through participation with other mutual funds, private accounts and certainnon-registered investment companies managed by the investment adviser or its affiliates (“Joint repurchase agreements”). The principal amount of the repurchase agreement is equal to the value atperiod-end. If the seller of a repurchase agreement fails to repurchase the security in accordance with the terms of the agreement, the Fund might incur expenses in enforcing its rights, and could experience losses, including a decline in the value of the collateral and loss of income. |
| J. | Other Risks- Investments in obligations issued by agencies and instrumentalities of the U.S. Government may vary in the level of support they receive from the government. The government may choose not to provide financial support to government sponsored agencies or instrumentalities if it is not legally obligated to do so. In this case, if the issuer defaulted, the Fund may not be able to recover its investment in such issuer from the U.S. Government. |
NOTE 2–Advisory Fees and Other Fees Paid to Affiliates
The Trust has entered into a master investment advisory agreement with Invesco Advisers, Inc. (the “Adviser” or “Invesco”). Under the terms of the investment advisory agreement, the Fund pays an advisory fee to the Adviser based on the annual rate of 0.15% of the Fund’s average daily net assets.
Under the terms of a mastersub-advisory agreement between the Adviser and each of Invesco Asset Management Deutschland GmbH, Invesco Asset Management Limited, Invesco Asset Management (Japan) Limited, Invesco Hong Kong Limited, Invesco Senior Secured Management, Inc. and Invesco Canada Ltd. and separatesub-advisory agreements with Invesco Capital Management LLC, formerly Invesco PowerShares Capital Management LLC, and Invesco Asset Management (India) Private Limited (collectively, the “AffiliatedSub-Advisers”) the Adviser, not the Fund, will pay 40% of the fees paid to the Adviser to any such AffiliatedSub-Adviser(s) that provide(s) discretionary investment management services to the Fund based on the percentage of assets allocated to such AffiliatedSub-Adviser(s).
The Adviser has contractually agreed, through at least June 30, 2020, to waive advisory fees and/or reimburse expenses to the extent necessary to limit total annual operating expenses after fee waivers and/or expense reimbursements (excluding certain items discussed below) of Series I shares to 1.50% and Series II shares to 1.75% of average daily net assets (the “expense limits”). In determining the Adviser’s obligation to waive advisory fees and/or reimburse expenses, the following expenses are not taken into account, and could cause the total annual operating expenses after fee waivers and/or expense reimbursements to exceed the numbers reflected above: (1) interest; (2) taxes; (3) dividend expense on short sales; (4) extraordinary ornon-routine items, including litigation expenses; and (5) expenses that the Fund has incurred but did not actually pay because of an expense offset arrangement. Unless Invesco continues the fee waiver agreement, it will terminate on June 30, 2020. During its term, the fee waiver agreement cannot be terminated or amended to increase the expense limits or reduce the advisory fee waiver without approval of the Board of Trustees. The Adviser did not waive fees and/or reimburse expenses during the period under these expense limits.
The Adviser and/or Invesco Distributors, Inc., (“IDI”) voluntarily agreed to waive fees and/or reimburse expenses in order to increase the Fund’s yield. Voluntary fee waivers and/or reimbursements may be modified at any time upon consultation with the Board of Trustees without further notice to investors.
The Trust has entered into a master administrative services agreement with Invesco pursuant to which the Fund has agreed to pay Invesco a fee for costs incurred in providing accounting services and fund administrative services to the Fund and to reimburse Invesco for fees paid to insurance companies that have agreed to provide certain administrative services to the Fund. These administrative services provided by the insurance companies may include, among other things: maintenance of master accounts with the Fund; tracking, recording and transmitting net purchase and redemption orders for Fund shares; maintaining and preserving records related to the purchase, redemption and other account activity of variable product owners; distributing copies of Fund documents such as prospectuses, proxy materials and periodic reports, to variable product owners, and responding to inquiries from variable product owners about the Fund. Pursuant to such agreement, for the year ended December 31, 2019, Invesco was paid $328,771 for accounting and fund administrative services and was reimbursed $1,083,950 for fees paid to insurance companies.
The Trust has entered into a transfer agency and service agreement with Invesco Investment Services, Inc. (“IIS”) pursuant to which the Fund has agreed to pay IIS a fee for providing transfer agency and shareholder services to the Fund and reimburse IIS for certain expenses incurred by IIS in the course of providing such services. For the year ended December 31, 2019, expenses incurred under the agreement are shown in the Statement of Operations asTransfer agent fees.
The Trust has entered into a master distribution agreement with IDI to serve as the distributor for the Fund. The Trust has adopted a plan pursuant to Rule12b-1 under the 1940 Act with respect to the Fund’s Series II shares (the “Plan”). The Fund, pursuant to the Plan, pays IDI compensation at the annual rate of 0.25% of the Fund’s average daily net assets of Series II shares. The fees are accrued daily and paid monthly. Of the Plan payments, up to 0.25% of the average daily net assets of the Series II shares may be paid to insurance companies who furnish continuing personal shareholder
Invesco V.I. Government Money Market Fund
services to customers who purchase and own Series II shares of the Fund. For the year ended December 31, 2019, expenses incurred under the Plan are detailed in the Statement of Operations as Distribution fees.
Certain officers and trustees of the Trust are officers and directors of the Adviser, IIS and/or IDI.
NOTE 3–Additional Valuation Information
GAAP defines fair value as the price that would be received to sell an asset or paid to transfer a liability in an orderly transaction between market participants at the measurement date, under current market conditions. GAAP establishes a hierarchy that prioritizes the inputs to valuation methods, giving the highest priority to readily available unadjusted quoted prices in an active market for identical assets (Level 1) and the lowest priority to significant unobservable inputs (Level 3), generally when market prices are not readily available or are unreliable. Based on the valuation inputs, the securities or other investments are tiered into one of three levels. Changes in valuation methods may result in transfers in or out of an investment’s assigned level:
| | Level 1 – | Prices are determined using quoted prices in an active market for identical assets. |
| | Level 2 – | Prices are determined using other significant observable inputs. Observable inputs are inputs that other market participants may use in pricing a security. These may include quoted prices for similar securities, interest rates, prepayment speeds, credit risk, yield curves, loss severities, default rates, discount rates, volatilities and others. |
| | Level 3 – | Prices are determined using significant unobservable inputs. In situations where quoted prices or observable inputs are unavailable (for example, when there is little or no market activity for an investment at the end of the period), unobservable inputs may be used. Unobservable inputs reflect the Fund’s own assumptions about the factors market participants would use in determining fair value of the securities or instruments and would be based on the best available information. |
As of December 31, 2019, all of the securities in this Fund were valued based on Level 2 inputs (see the Schedule of Investments for security categories). The level assigned to the securities valuations may not be an indication of the risk or liquidity associated with investing in those securities. Because of the inherent uncertainties of valuation, the values reflected in the financial statements may materially differ from the value received upon actual sale of those investments.
NOTE 4–Trustees’ and Officers’ Fees and Benefits
Trustees’ and Officers’Fees and Benefits include amounts accrued by the Fund to pay remuneration to certain Trustees and Officers of the Fund. Trustees have the option to defer compensation payable by the Fund, andTrustees’ and Officers’Fees and Benefits also include amounts accrued by the Fund to fund such deferred compensation amounts. Those Trustees who defer compensation have the option to select various Invesco Funds in which their deferral accounts shall be deemed to be invested. Finally, certain current Trustees were eligible to participate in a retirement plan that provided for benefits to be paid upon retirement to Trustees over a period of time based on the number of years of service. The Fund may have certain former Trustees who also participate in a retirement plan and receive benefits under such plan.Trustees’ and Officers’ Fees and Benefits include amounts accrued by the Fund to fund such retirement benefits. Obligations under the deferred compensation and retirement plans represent unsecured claims against the general assets of the Fund.
NOTE 5–Cash Balances
The Fund is permitted to temporarily carry a negative or overdrawn balance in its account with The Bank of New York Mellon, the custodian bank. Such balances, if any atperiod-end, are shown in the Statement of Assets and Liabilities under the payable captionAmount due custodian. To compensate the custodian bank for such overdrafts, the overdrawn Fund may either (1) leave funds as a compensating balance in the account so the custodian bank can be compensated by earning the additional interest; or (2) compensate by paying the custodian bank at a rate agreed upon by the custodian bank and Invesco, not to exceed the contractually agreed upon rate.
NOTE 6–Distributions to Shareholders and Tax Components of Net Assets
Tax Character of Distributions to Shareholders Paid During the Years Ended December 31, 2019 and 2018:
| | | | | | | | |
| | | 2019 | | | 2018 | |
| |
Ordinary income | | $ | 13,915,957 | | | $ | 12,056,451 | |
| |
Tax Components of Net Assets atPeriod-End:
| | | | |
| | | 2019 | |
| |
Undistributed ordinary income | | $ | 59,705 | |
| |
Temporary book/tax differences | | | (57,088 | ) |
| |
Capital loss carryforward | | | (8,280 | ) |
| |
Shares of beneficial interest | | | 670,653,256 | |
| |
Total net assets | | $ | 670,647,593 | |
| |
| | | | |
The temporary book/tax differences are a result of timing differences between book and tax recognition of income and/or expenses. The Fund’s temporary book/tax differences are the result of the trustee deferral of compensation and retirement plan benefits.
Capital loss carryforward is calculated and reported as of a specific date. Results of transactions and other activity after that date may affect the amount of capital loss carryforward actually available for the Funds to utilize. The ability to utilize capital loss carryforward in the future may be limited under the Internal Revenue Code and related regulations based on the results of future transactions.
Invesco V.I. Government Money Market Fund
The Fund has a capital loss carryforward as of December 31, 2019 as follows:
| | | | | | | | |
| Capital Loss Carryforward* | | | | | | | |
| Expiration | | Short-Term | | Long-Term | | Total | |
Not subject to expiration | | $710 | | $7,570 | | | $8,280 | |
| |
| * | Capital loss carryforwards as of the date listed above is reduced for limitations, if any, to the extent required by the Internal Revenue Code and may be further limited depending upon a variety of factors, including the realization of net unrealized gains or losses as of the date of any reorganization. |
NOTE 7–Share Information
| | | | | | | | | | | | | | | | |
| | | | | | Summary of Share Activity | | | | |
| |
| | | | | | Years ended December 31, | | | | |
| | | | |
| | | 2019(a) | | | 2018 | |
| | | | | | | | |
| | | Shares | | | Amount | | | Shares | | | Amount | |
| |
Sold: | | | | | | | | | | | | | | | | |
Series I | | | 1,064,989,449 | | | $ | 1,064,989,449 | | | | 1,959,818,121 | | | $ | 1,959,818,121 | |
| |
Series II | | | 42,932,790 | | | | 42,932,790 | | | | 73,566,458 | | | | 73,566,458 | |
| |
| | | | |
Issued as reinvestment of dividends: | | | | | | | | | | | | | | | | |
Series I | | | 12,291,497 | | | | 12,291,497 | | | | 10,672,129 | | | | 10,672,129 | |
| |
Series II | | | 1,311,014 | | | | 1,311,014 | | | | 1,128,365 | | | | 1,128,365 | |
| |
| | | | |
Reacquired: | | | | | | | | | | | | | | | | |
Series I | | | (1,379,521,074 | ) | | | (1,379,521,074 | ) | | | (1,725,956,458 | ) | | | (1,725,956,458 | ) |
| |
Series II | | | (68,606,517 | ) | | | (68,606,517 | ) | | | (63,896,660 | ) | | | (63,896,660 | ) |
| |
Net increase (decrease) in share activity | | | (326,602,841 | ) | | $ | (326,602,841 | ) | | | 255,331,955 | | | $ | 255,331,955 | |
| |
| (a) | There are entities that are record owners of more than 5% of the outstanding shares of the Fund and in the aggregate own 88% of the outstanding shares of the Fund. The Fund and the Fund’s principal underwriter or adviser, are parties to participation agreements with these entities whereby these entities sell units of interest in separate accounts funding variable products that are invested in the Fund. The Fund, Invesco and/or Invesco affiliates may make payments to these entities, which are considered to be related to the Fund, for providing services to the Fund, Invesco and/or Invesco affiliates including but not limited to services such as, securities brokerage, third party record keeping and account servicing and administrative services. The Fund has no knowledge as to whether all or any portion of the shares owned of record by these entities are also owned beneficially. |
Invesco V.I. Government Money Market Fund
Report of Independent Registered Public Accounting Firm
To the Board of Trustees of AIM Variable Insurance Funds (Invesco Variable Insurance Funds) and Shareholders of Invesco V.I. Government Money Market Fund
Opinion on the Financial Statements
We have audited the accompanying statement of assets and liabilities, including the schedule of investments, of Invesco V.I. Government Money Market Fund (one of the funds constituting AIM Variable Insurance Funds (Invesco Variable Insurance Funds), referred to hereafter as the “Fund”) as of December 31, 2019, the related statement of operations for the year ended December 31, 2019, the statement of changes in net assets for each of the two years in the period ended December 31, 2019, including the related notes, and the financial highlights for each of the five years in the period ended December 31, 2019 (collectively referred to as the “financial statements”). In our opinion, the financial statements present fairly, in all material respects, the financial position of the Fund as of December 31, 2019, the results of its operations for the year then ended, the changes in its net assets for each of the two years in the period ended December 31, 2019 and the financial highlights for each of the five years in the period ended December 31, 2019 in conformity with accounting principles generally accepted in the United States of America.
Basis for Opinion
These financial statements are the responsibility of the Fund’s management. Our responsibility is to express an opinion on the Fund’s financial statements based on our audits. We are a public accounting firm registered with the Public Company Accounting Oversight Board (United States) (PCAOB) and are required to be independent with respect to the Fund in accordance with the U.S. federal securities laws and the applicable rules and regulations of the Securities and Exchange Commission and the PCAOB.
We conducted our audits of these financial statements in accordance with the standards of the PCAOB. Those standards require that we plan and perform the audit to obtain reasonable assurance about whether the financial statements are free of material misstatement, whether due to error or fraud.
Our audits included performing procedures to assess the risks of material misstatement of the financial statements, whether due to error or fraud, and performing procedures that respond to those risks. Such procedures included examining, on a test basis, evidence regarding the amounts and disclosures in the financial statements. Our audits also included evaluating the accounting principles used and significant estimates made by management, as well as evaluating the overall presentation of the financial statements. Our procedures included confirmation of securities owned as of December 31, 2019 by correspondence with the custodian and brokers; when replies were not received from brokers, we performed other auditing procedures. We believe that our audits provide a reasonable basis for our opinion.
/s/PricewaterhouseCoopers LLP
Houston, Texas
February 18, 2020
We have served as the auditor of one or more of the investment companies in the Invesco group of investment companies since at least 1995. We have not been able to determine the specific year we began serving as auditor.
Invesco V.I. Government Money Market Fund
Calculating your ongoing Fund expenses
Example
As a shareholder of the Fund, you incur ongoing costs, including management fees; distribution and/or service fees(12b-1); and other Fund expenses. This example is intended to help you understand your ongoing costs (in dollars) of investing in the Fund and to compare these costs with ongoing costs of investing in other mutual funds. The example is based on an investment of $1,000 invested at the beginning of the period and held for the entire period July 1, 2019 through December 31, 2019.
The actual and hypothetical expenses in the examples below do not represent the effect of any fees or other expenses assessed in connection with a variable product; if they did, the expenses shown would be higher while the ending account values shown would be lower.
Actual expenses
The table below provides information about actual account values and actual expenses. You may use the information in this table, together with the amount you invested, to estimate the expenses that you paid over the period. Simply divide your account value by $1,000 (for example, an $8,600 account value divided by $1,000 = 8.6), then multiply the result by the number in the table under the heading entitled “Actual Expenses Paid During Period” to estimate the expenses you paid on your account during this period.
Hypothetical example for comparison purposes
The table below also provides information about hypothetical account values and hypothetical expenses based on the Fund’s actual expense ratio and an assumed rate of return of 5% per year before expenses, which is not the Fund’s actual return.
The hypothetical account values and expenses may not be used to estimate the actual ending account balance or expenses you paid for the period. You may use this information to compare the ongoing costs of investing in the Fund and other funds. To do so, compare this 5% hypothetical example with the 5% hypothetical examples that appear in the shareholder reports of the other funds.
Please note that the expenses shown in the table are meant to highlight your ongoing costs. Therefore, the hypothetical information is useful in comparing ongoing costs, and will not help you determine the relative total costs of owning different funds.
| | | | | | | | | | | | |
| | | | | ACTUAL | | HYPOTHETICAL
(5% annual return before expenses) | | |
| Class | | Beginning
Account Value
(07/01/19) | | Ending
Account Value
(12/31/19)1 | | Expenses
Paid During
Period2 | | Ending
Account Value
(12/31/19) | | Expenses
Paid During
Period2 | | Annualized
Expense
Ratio |
Series I | | $1,000.00 | | $1,008.40 | | $1.82 | | $1,023.39 | | $1.84 | | 0.36% |
Series II | | 1,000.00 | | 1,007.10 | | 3.09 | | 1,022.13 | | 3.11 | | 0.61 |
| 1 | The actual ending account value is based on the actual total return of the Fund for the period July 1, 2019 through December 31, 2019, after actual expenses and will differ from the hypothetical ending account value which is based on the Fund’s expense ratio and a hypothetical annual return of 5% before expenses. |
| 2 | Expenses are equal to the Fund’s annualized expense ratio as indicated above multiplied by the average account value over the period, multiplied by 184/365 to reflect the most recent fiscal half year. |
Invesco V.I. Government Money Market Fund
Tax Information
Form1099-DIV, Form1042-S and otheryear-end tax information provide shareholders with actual calendar year amounts that should be included in their tax returns. Shareholders should consult their tax advisors.
The following distribution information is being provided as required by the Internal Revenue Code or to meet a specific state’s requirement.
The Fund designates the following amounts or, if subsequently determined to be different, the maximum amount allowable for its fiscal year ended December 31, 2019:
| | | | | | | | |
| | | | | | | |
| Federal and State Income Tax | |
Corporate Dividends Received Deduction* | | | 0.00 | % |
U.S. Treasury Obligations* | | | 34.10 | % | | | | |
| | * | The above percentages are based on ordinary income dividends paid to shareholders during the Fund’s fiscal year. |
Invesco V.I. Government Money Market Fund
Trustees and Officers
The address of each trustee and officer is AIM Variable Insurance Funds (Invesco Variable Insurance Funds) (the “Trust”), 11 Greenway Plaza, Suite 1000, Houston, Texas 77046-1173. The trustees serve for the life of the Trust, subject to their earlier death, incapacitation, resignation, retirement or removal as more specifically provided in the Trust’s organizational documents. Each officer serves for a one year term or until their successors are elected and qualified. Column two below includes length of time served with predecessor entities, if any.
| | | | | | | | |
Name, Year of Birth and
Position(s)
Held with the Trust | | Trustee and/or
Officer
Since | | Principal Occupation(s)
During Past 5 Years | | Number of
Funds in
Fund Complex
Overseen by
Trustee | | Other
Directorship(s)
Held by Trustee
During Past 5
Years |
| Interested Person | | | | | | | | |
Martin L. Flanagan1- 1960
Trustee and Vice Chair | | 2007 | | Executive Director, Chief Executive Officer and President, Invesco Ltd. (ultimate parent of Invesco and a global investment management firm); Trustee and Vice Chair, The Invesco Funds; Vice Chair, Investment Company Institute; and Member of Executive Board, SMU Cox School of Business Formerly: Advisor to the Board, Invesco Advisers, Inc. (formerly known as Invesco Institutional (N.A.), Inc.); Chairman and Chief Executive Officer, Invesco Advisers, Inc. (registered investment adviser); Director, Chairman, Chief Executive Officer and President, Invesco Holding Company (US), Inc. (formerly IVZ Inc.) (holding company), Invesco Group Services, Inc. (service provider) and Invesco North American Holdings, Inc. (holding company); Director, Chief Executive Officer and President, Invesco Holding Company Limited (parent of Invesco and a global investment management firm); Director, Invesco Ltd.; Chairman, Investment Company Institute and President,Co-Chief Executive Officer,Co-President, Chief Operating Officer and Chief Financial Officer, Franklin Resources, Inc. (global investment management organization) | | 229 | | None |
| 1 | Mr. Flanagan is considered an interested person (within the meaning of Section 2(a)(19) of the 1940 Act) of the Trust because he is an officer of the Adviser to the Trust, and an officer and a director of Invesco Ltd., ultimate parent of the Adviser. |
Invesco V.I. Government Money Market Fund
Trustees and Officers–(continued)
| | | | | | | | |
Name, Year of Birth and
Position(s)
Held with the Trust | | Trustee
and/or
Officer
Since | | Principal Occupation(s)
During Past 5 Years | | Number of
Funds in
Fund Complex
Overseen by
Trustee | | Other
Directorship(s)
Held by Trustee
During Past 5
Years |
| Independent Trustees | | | | | | | | |
Bruce L. Crockett - 1944
Trustee and Chair | | 1993 | | Chairman, Crockett Technologies Associates (technology consulting company) Formerly: Director, Captaris (unified messaging provider); Director, President and Chief Executive Officer, COMSAT Corporation; Chairman, Board of Governors of INTELSAT (international communications company); ACE Limited (insurance company); Independent Directors Council and Investment Company Institute: Member of the Audit Committee, Investment Company Institute; Member of the Executive Committee and Chair of the Governance Committee, Independent Directors Council | | 229 | | Director and Chairman of the Audit Committee, ALPS (Attorneys Liability Protection Society) (insurance company); Director and Member of the Audit Committee and Compensation Committee, Ferroglobe PLC (metallurgical company) |
David C. Arch - 1945
Trustee | | 2010 | | Chairman of Blistex Inc. (consumer health care products manufacturer); Member, World Presidents’ Organization | | 229 | | Board member of the Illinois Manufacturers’ Association |
Beth Ann Brown - 1968
Trustee | | 2019 | | Independent Consultant Formerly: Head of Intermediary Distribution, Managing Director, Strategic Relations, Managing Director, Head of National Accounts, Senior Vice President, National Account Manager and Senior Vice President, Key Account Manager, Columbia Management Investment Advisers LLC; Vice President, Key Account Manager, Liberty Funds Distributor, Inc.; and Trustee of certain Oppenheimer Funds | | 229 | | Director, Board of Directors of Caron Engineering Inc.; Advisor, Board of Advisors of Caron Engineering Inc.; President and Director, Acton Shapleigh Youth Conservation Corps (non - profit); and Vice President and Director of Grahamtastic Connection (non-profit) |
Jack M. Fields - 1952
Trustee | | 1997 | | Chief Executive Officer, Twenty First Century Group, Inc. (government affairs company); and Chairman, Discovery Learning Alliance(non-profit) Formerly: Owner and Chief Executive Officer, Dos Angeles Ranch L.P. (cattle, hunting, corporate entertainment); Director, Insperity, Inc. (formerly known as Administaff) (human resources provider); Chief Executive Officer, Texana Timber LP (sustainable forestry company); Director of Cross Timbers Quail Research Ranch(non-profit); and member of the U.S. House of Representatives | | 229 | | None |
Invesco V.I. Government Money Market Fund
Trustees and Officers–(continued)
| | | | | | | | |
Name, Year of Birth and
Position(s)
Held with the Trust | | Trustee
and/or
Officer
Since | | Principal Occupation(s)
During Past 5 Years | | Number of
Funds in
Fund Complex
Overseen by
Trustee | | Other
Directorship(s)
Held by Trustee
During Past 5
Years |
| Independent Trustees–(continued) | | | | |
Cynthia Hostetler - 1962
Trustee | | 2017 | | Non-Executive Director and Trustee of a number of public and private business corporations Formerly: Director, Aberdeen Investment Funds (4 portfolios); Head of Investment Funds and Private Equity, Overseas Private Investment Corporation; President, First Manhattan Bancorporation, Inc.; Attorney, Simpson Thacher & Bartlett LLP | | 229 | | Vulcan Materials Company (construction materials company); Trilinc Global Impact Fund; Genesee & Wyoming, Inc. (railroads); Artio Global Investment LLC (mutual fund complex); Edgen Group, Inc. (specialized energy and infrastructure products distributor); Investment Company Institute (professional organization); Independent Directors Council (professional organization) |
Eli Jones - 1961
Trustee | | 2016 | | Professor and Dean, Mays Business School - Texas A&M University Formerly: Professor and Dean, Walton College of Business, University of Arkansas and E.J. Ourso College of Business, Louisiana State University; Director, Arvest Bank | | 229 | | Insperity, Inc. (formerly known as Administaff) (human resources provider) |
| Elizabeth Krentzman - 1959 Trustee | | 2019 | | Formerly: Principal and Chief Regulatory Advisor for Asset Management Services and U.S. Mutual Fund Leader of Deloitte & Touche LLP; General Counsel of the Investment Company Institute (trade association); National Director of the Investment Management Regulatory Consulting Practice, Principal, Director and Senior Manager of Deloitte & Touche LLP; Assistant Director of the Division of Investment Management - Office of Disclosure and Investment Adviser Regulation of the U.S. Securities and Exchange Commission and various positions with the Division of Investment Management - Office of Regulatory Policy of the U.S. Securities and Exchange Commission; Associate at Ropes & Gray LLP; Advisory Board Member of the Securities and Exchange Commission Historical Society; and Trustee of certain Oppenheimer Funds | | 229 | | Trustee of the University of Florida National Board Foundation and Audit Committee Member; Member of the Cartica Funds Board of Directors (private investment funds); Member of the University of Florida Law Center Association, Inc. Board of Trustees and Audit Committee Member |
Anthony J. LaCava, Jr. - 1956
Trustee | | 2019 | | Formerly: Director and Member of the Audit Committee, Blue Hills Bank (publicly traded financial institution) and Managing Partner, KPMG LLP | | 229 | | Blue Hills Bank; Chairman, Bentley University; Member, Business School Advisory Council; and Nominating Committee KPMG LLP |
Prema Mathai-Davis - 1950
Trustee | | 1998 | | Retired Co-Owner & Partner of Quantalytics Research, LLC, (a FinTech Investment Research Platform for the Self-Directed Investor) | | 229 | | None |
Invesco V.I. Government Money Market Fund
Trustees and Officers–(continued)
| | | | | | | | |
Name, Year of Birth and
Position(s)
Held with the Trust | | Trustee
and/or
Officer
Since | | Principal Occupation(s)
During Past 5 Years | | Number of
Funds in
Fund Complex
Overseen by
Trustee | | Other
Directorship(s)
Held by Trustee
During Past 5
Years |
| Independent Trustees–(continued) | | | | |
Joel W. Motley - 1952
Trustee | | 2019 | | Director of Office of Finance, Federal Home Loan Bank; Member of the Vestry of Trinity Wall Street; Managing Director of Carmona Motley Inc. (privately held financial advisor); Member of the Finance and Budget Committee of the Council on Foreign Relations, Member of the Investment Committee and Board of Human Rights Watch and Member of the Investment Committee and Board of Historic Hudson Valley(non-profit cultural organization) Formerly: Managing Director of Public Capital Advisors, LLC (privately held financial advisor); Managing Director of Carmona Motley Hoffman, Inc. (privately held financial advisor); Trustee of certain Oppenheimer Funds; and Director of Columbia Equity Financial Corp. (privately held financial advisor) | | 229 | | Director of Greenwall Foundation (bioethics research foundation); Member of Board and Investment Committee of The Greenwall Foundation; Director of Southern Africa Legal Services Foundation; Board Member and Investment Committee Member of Pulizer Center for Crisis Reporting(non-profit journalism) |
Teresa M. Ressel - 1962
Trustee | | 2017 | | Non-executive director and trustee of a number of public and private business corporations Formerly: Chief Financial Officer, Olayan America, The Olayan Group (international investor/commercial/industrial); Chief Executive Officer, UBS Securities LLC; Group Chief Operating Officer, Americas, UBS AG; Assistant Secretary for Management & Budget and CFO, US Department of the Treasury | | 229 | | Atlantic Power Corporation (power generation company); ON Semiconductor Corp. (semiconductor supplier) |
Ann Barnett Stern - 1957
Trustee | | 2017 | | President and Chief Executive Officer, Houston Endowment Inc. (private philanthropic institution) Formerly: Executive Vice President and General Counsel, Texas Children’s Hospital; Attorney, Beck, Redden and Secrest, LLP; Business Law Instructor, University of St. Thomas; Attorney, Andrews & Kurth LLP | | 229 | | Federal Reserve Bank of Dallas |
| Robert C. Troccoli - 1949 Trustee | | 2016 | | Retired | | 229 | | None |
Daniel S. Vandivort -1954
Trustee | | 2019 | | Treasurer, Chairman of the Audit and Finance Committee, and Trustee, Board of Trustees, Huntington Disease Foundation of America; and President, Flyway Advisory Services LLC (consulting and property management) Formerly: Trustee and Governance Chair, of certain Oppenheimer Funds | | 229 | | Chairman and Lead Independent Director, Chairman of the Audit Committee, and Director, Board of Directors, Value Line Funds |
James D. Vaughn - 1945
Trustee | | 2019 | | Retired Formerly: Managing Partner, Deloitte & Touche LLP; Trustee and Chairman of the Audit Committee, Schroder Funds; Board Member, Mile High United Way, Boys and Girls Clubs, Boy Scouts, Colorado Business Committee for the Arts, Economic Club of Colorado and Metro Denver Network (economic development corporation); and Trustee of certain Oppenheimer Funds | | 229 | | Board member and Chairman of Audit Committee of AMG National Trust Bank; Trustee and Investment Committee member, University of South Dakota Foundation; Board member, Audit Committee Member and past Board Chair, Junior Achievement(non-profit) |
Invesco V.I. Government Money Market Fund
Trustees and Officers–(continued)
| | | | | | | | |
Name, Year of Birth and
Position(s)
Held with the Trust | | Trustee
and/or
Officer
Since | | Principal Occupation(s)
During Past 5 Years | | Number of
Funds in
Fund Complex
Overseen by
Trustee | | Other
Directorship(s) Held by Trustee
During Past 5 Years |
| Independent Trustees–(continued) | | | | |
Christopher L. Wilson - 1957
Trustee, Vice Chair and Chair Designate | | 2017 | | Retired Formerly: Director, TD Asset Management USA Inc. (mutual fund complex) (22 portfolios); Managing Partner, CT2, LLC (investing and consulting firm); President/Chief Executive Officer, Columbia Funds, Bank of America Corporation; President/Chief Executive Officer, CDC IXIS Asset Management Services, Inc.; Principal & Director of Operations, Scudder Funds, Scudder, Stevens & Clark, Inc.; Assistant Vice President, Fidelity Investments | | 229 | | ISO New England, Inc.(non-profit organization managing regional electricity market) |
Invesco V.I. Government Money Market Fund
Trustees and Officers–(continued)
| | | | | | | | |
Name, Year of Birth and
Position(s)
Held with the Trust | | Trustee
and/or
Officer
Since | | Principal Occupation(s)
During Past 5 Years | | Number of
Funds in
Fund Complex
Overseen by
Trustee | | Other
Directorship(s)
Held by Trustee
During Past 5
Years |
| Officers | | | | | | | | |
Sheri Morris – 1964
President, Principal Executive
Officer and Treasurer | | 1999 | | Head of Global Fund Services, Invesco Ltd.; President, Principal Executive Officer and Treasurer, The Invesco Funds; Vice President, Invesco Advisers, Inc. (formerly known as Invesco Institutional (N.A.), Inc.) (registered investment adviser); and Vice President, Invesco Exchange-Traded Fund Trust, Invesco Exchange-Traded Fund Trust II, Invesco India Exchange-Traded Fund Trust, Invesco Actively Managed Exchange-Traded Fund Trust, Invesco Actively Managed Exchange-Traded Commodity Fund Trust and Invesco Exchange-Traded Self-Indexed Fund Trust; and Vice President, OppenheimerFunds, Inc. Formerly: Vice President and Principal Financial Officer, The Invesco Funds; Vice President, Invesco AIM Advisers, Inc., Invesco AIM Capital Management, Inc. and Invesco AIM Private Asset Management, Inc.; Assistant Vice President and Assistant Treasurer, The Invesco Funds and Assistant Vice President, Invesco Advisers, Inc., Invesco AIM Capital Management, Inc. and Invesco AIM Private Asset Management, Inc.; and Treasurer, Invesco Exchange-Traded Fund Trust, Invesco Exchange-Traded Fund Trust II, Invesco India Exchange-Traded Fund Trust and Invesco Actively Managed Exchange-Traded Fund Trust | | N/A | | N/A |
Russell C. Burk – 1958
Senior Vice President and Senior Officer | | 2005 | | Senior Vice President and Senior Officer, The Invesco Funds | | N/A | | N/A |
Jeffrey H. Kupor – 1968
Senior Vice President, Chief Legal Officer and Secretary | | 2018 | | Head of Legal of the Americas, Invesco Ltd.; Senior Vice President and Secretary, Invesco Advisers, Inc. (formerly known as Invesco Institutional (N.A.), Inc.) (registered investment adviser); Senior Vice President and Secretary, Invesco Distributors, Inc. (formerly known as Invesco AIM Distributors, Inc.); Vice President and Secretary, Invesco Investment Services, Inc. (formerly known as Invesco AIM Investment Services, Inc.) Senior Vice President, Chief Legal Officer and Secretary, The Invesco Funds; Secretary and General Counsel, Invesco Investment Advisers LLC (formerly known as Van Kampen Asset Management); Secretary and General Counsel, Invesco Capital Markets, Inc. (formerly known as Van Kampen Funds Inc.) and Chief Legal Officer, Invesco Exchange-Traded Fund Trust, Invesco Exchange-Traded Fund Trust II, Invesco India Exchange-Traded Fund Trust, Invesco Actively Managed Exchange-Traded Fund Trust, Invesco Actively Managed Exchange-Traded Commodity Fund Trust and Invesco Exchange-Traded Self-Indexed Fund Trust; Secretary, Invesco Indexing LLC; Secretary, W.L. Ross & Co., LLC Formerly: Secretary and Vice President, Jemstep, Inc.; Head of Legal, Worldwide Institutional, Invesco Ltd.; Secretary and General Counsel, INVESCO Private Capital Investments, Inc.; Senior Vice President, Secretary and General Counsel, Invesco Management Group, Inc. (formerly known as Invesco AIM Management Group, Inc.); Assistant Secretary, INVESCO Asset Management (Bermuda) Ltd.; Secretary and General Counsel, Invesco Private Capital, Inc.; Assistant Secretary and General Counsel, INVESCO Realty, Inc.; Secretary and General Counsel, Invesco Senior Secured Management, Inc.; and Secretary, Sovereign G./P. Holdings Inc. | | N/A | | N/A |
| Andrew R. Schlossberg - 1974 Senior Vice President | | 2019 | | Head of the Americas and Senior Managing Director, Invesco Ltd.; Director and Senior Vice President, Invesco Advisers, Inc. (formerly known as Invesco Institutional (N.A.), Inc.) (registered investment adviser); Director and Chairman, Invesco Investment Services, Inc. (formerly known as Invesco AIM Investment Services, Inc.) (registered transfer agent); Senior Vice President, The Invesco Funds; Director, Invesco Investment Advisers LLC (formerly known as Van Kampen Asset Management); Director, President and Chairman, Invesco Insurance Agency, Inc. Formerly: Director, Invesco UK Limited; Director and Chief Executive, Invesco Asset Management Limited and Invesco Fund Managers Limited; Assistant Vice President, The Invesco Funds; Senior Vice President, Invesco Advisers, Inc. (formerly known as Invesco Institutional (N.A.), Inc.) (registered investment adviser); Director and Chief Executive, Invesco Administration Services Limited and Invesco Global Investment Funds Limited; Director, Invesco Distributors, Inc.; Head of EMEA, Invesco Ltd.; President, Invesco Actively Managed Exchange-Traded Commodity Fund Trust, Invesco Actively Managed Exchange-Traded Fund Trust, Invesco Exchange-Traded Fund Trust, Invesco Exchange-Traded Fund Trust II and Invesco India Exchange-Traded Fund Trust; Managing Director and Principal Executive Officer, Invesco Capital Management LLC | | N/A | | N/A |
Invesco V.I. Government Money Market Fund
Trustees and Officers–(continued)
| | | | | | | | |
Name, Year of Birth and
Position(s)
Held with the Trust | | Trustee
and/or
Officer
Since | | Principal Occupation(s)
During Past 5 Years | | Number of
Funds in
Fund Complex
Overseen by
Trustee | | Other
Directorship(s)
Held by Trustee
During Past 5
Years |
| Officers–(continued) | | | | | | | | |
John M. Zerr - 1962
Senior Vice President | | 2006 | | Chief Operating Officer of the Americas; Senior Vice President, Invesco Advisers, Inc. (formerly known as Invesco Institutional (N.A.), Inc.) (registered investment adviser); Senior Vice President, Invesco Distributors, Inc. (formerly known as Invesco AIM Distributors, Inc.); Director and Vice President, Invesco Investment Services, Inc. (formerly known as Invesco AIM Investment Services, Inc.) Senior Vice President, The Invesco Funds; Managing Director, Invesco Capital Management LLC; Director, Invesco Investment Advisers LLC (formerly known as Van Kampen Asset Management); Senior Vice President, Invesco Capital Markets, Inc. (formerly known as Van Kampen Funds Inc.); Manager, Invesco Indexing LLC; Manager, Invesco Specialized Products, LLC; Director and Senior Vice President, Invesco Insurance Agency, Inc.; Member, Invesco Canada Funds Advisory Board; Director, President and Chief Executive Officer, Invesco Corporate Class Inc. (corporate mutual fund company); and Director, Chairman, President and Chief Executive Officer, Invesco Canada Ltd. (formerly known as Invesco Trimark Ltd./Invesco Trimark Ltèe) (registered investment adviser and registered transfer agent) Formerly: Director and Senior Vice President, Invesco Management Group, Inc. (formerly known as Invesco AIM Management Group, Inc.); Secretary and General Counsel, Invesco Management Group, Inc. (formerly known as Invesco AIM Management Group, Inc.); Secretary, Invesco Investment Services, Inc. (formerly known as Invesco AIM Investment Services, Inc.); Chief Legal Officer and Secretary, The Invesco Funds; Secretary and General Counsel, Invesco Investment Advisers LLC (formerly known as Van Kampen Asset Management); Secretary and General Counsel, Invesco Capital Markets, Inc. (formerly known as Van Kampen Funds Inc.); Chief Legal Officer, Invesco Exchange-Traded Fund Trust, Invesco Exchange-Traded Fund Trust II, Invesco India Exchange-Traded Fund Trust, Invesco Actively Managed Exchange-Traded Fund Trust, Invesco Actively Managed Exchange-Traded Commodity Fund Trust and Invesco Exchange-Traded Self-Indexed Fund Trust; Secretary, Invesco Indexing LLC; Director, Secretary, General Counsel and Senior Vice President, Van Kampen Exchange Corp.; Director, Vice President and Secretary, IVZ Distributors, Inc. (formerly known as INVESCO Distributors, Inc.); Director and Vice President, INVESCO Funds Group, Inc.; Director and Vice President, Van Kampen Advisors Inc.; Director, Vice President, Secretary and General Counsel, Van Kampen Investor Services Inc.; Director and Secretary, Invesco Distributors, Inc. (formerly known as Invesco AIM Distributors, Inc.); Director, Senior Vice President, General Counsel and Secretary, Invesco AIM Advisers, Inc. and Van Kampen Investments Inc.; Director, Vice President and Secretary, Fund Management Company; Director, Senior Vice President, Secretary, General Counsel and Vice President, Invesco AIM Capital Management, Inc.; Chief Operating Officer and General Counsel, Liberty Ridge Capital, Inc. (an investment adviser) | | N/A | | N/A |
Gregory G. McGreevey - 1962
Senior Vice President | | 2012 | | Senior Managing Director, Invesco Ltd.; Director, Chairman, President, and Chief Executive Officer, Invesco Advisers, Inc. (formerly known as Invesco Institutional (N.A.), Inc.) (registered investment adviser); Director, Invesco Mortgage Capital, Inc. and Invesco Senior Secured Management, Inc.; and Senior Vice President, The Invesco Funds; and President, SNW Asset Management Corporation Formerly: Senior Vice President, Invesco Management Group, Inc. and Invesco Advisers, Inc.; Assistant Vice President, The Invesco Funds | | N/A | | N/A |
Kelli Gallegos – 1970
Vice President, Principal Financial Officer and Assistant Treasurer | | 2008 | | Principal Financial and Accounting Officer – Investments Pool, Invesco Specialized Products, LLC; Vice President, Principal Financial Officer and Assistant Treasurer, The Invesco Funds; Principal Financial and Accounting Officer – Pooled Investments, Invesco Capital Management LLC; Vice President and Treasurer, Invesco Exchange-Traded Fund Trust, Invesco Exchange-Traded Fund Trust II, Invesco India Exchange-Traded Fund Trust, Invesco Actively Managed Exchange-Traded Fund Trust, Invesco Actively Managed Exchange-Traded Commodity Fund Trust and Invesco Exchange-Traded Self-Indexed Fund Trust Formerly: Assistant Treasurer, Invesco Specialized Products, LLC; Assistant Treasurer, Invesco Exchange-Traded Fund Trust, Invesco Exchange-Traded Fund Trust II, Invesco India Exchange-Traded Fund Trust, Invesco Actively Managed Exchange-Traded Fund Trust, Invesco Actively Managed Exchange-Traded Commodity Fund Trust and Invesco Exchange-Traded Self-Indexed Fund Trust; Assistant Treasurer, Invesco Capital Management LLC; Assistant Vice President, The Invesco Funds | | N/A | | N/A |
Invesco V.I. Government Money Market Fund
Trustees and Officers–(continued)
| | | | | | | | |
Name, Year of Birth and
Position(s)
Held with the Trust | | Trustee
and/or
Officer
Since | | Principal Occupation(s)
During Past 5 Years | | Number of
Funds in
Fund Complex
Overseen by
Trustee | | Other
Directorship(s)
Held by Trustee
During Past 5
Years |
| Officers–(continued) | | | | | | | | |
Crissie M. Wisdom - 1969
Anti-Money Laundering Compliance Officer | | 2013 | | Anti-Money Laundering Compliance Officer, Invesco Advisers, Inc. (formerly known as Invesco Institutional (N.A.), Inc.) (registered investment adviser), Invesco Capital Markets, Inc. (formerly known as Van Kampen Funds Inc.), Invesco Distributors, Inc., Invesco Investment Services, Inc., The Invesco Funds, and Invesco Exchange-Traded Fund Trust, Invesco Exchange-Traded Fund Trust II, Invesco India Exchange-Traded Fund Trust, Invesco Actively Managed Exchange-Traded Fund Trust, Invesco Actively Managed Exchange-Traded Commodity Fund Trust and Invesco Exchange-Traded Self-Indexed Fund Trust; Anti-Money Laundering Compliance Officer and Bank Secrecy Act Officer, INVESCO National Trust Company and Invesco Trust Company; and Fraud Prevention Manager and Controls and Risk Analysis Manager for Invesco Investment Services, Inc. Formerly: Anti-Money Laundering Compliance Officer, Van Kampen Exchange Corp. and Invesco Management Group, Inc. | | N/A | | N/A |
Robert R. Leveille - 1969
Chief Compliance Officer | | 2016 | | Chief Compliance Officer, Invesco Advisers, Inc. (registered investment adviser); and Chief Compliance Officer, The Invesco Funds Formerly: Chief Compliance Officer, Putnam Investments and the Putnam Funds | | N/A | | N/A |
The Statement of Additional Information of the Trust includes additional information about the Fund’s Trustees and is available upon request, without charge, by calling 1.800.959.4246. Please refer to the Fund’s Statement of Additional Information for information on the Fund’ssub-advisers.
| | | | | | |
Office of the Fund 11 Greenway Plaza, Suite 1000 Houston, TX 77046-1173 | | Investment Adviser Invesco Advisers, Inc. 1555 Peachtree Street, N.E. Atlanta, GA 30309 | | Distributor Invesco Distributors, Inc. 11 Greenway Plaza, Suite 1000 Houston, TX 77046-1173 | | Auditors PricewaterhouseCoopers LLP 1000 Louisiana Street, Suite 5800 Houston, TX 77002-5678 |
| | | |
Counsel to the Fund Stradley Ronon Stevens & Young, LLP
2005 Market Street, Suite 2600 Philadelphia, PA 19103-7018 | | Counsel to the Independent Trustees Goodwin Procter LLP 901 New York Avenue, N.W. Washington, D.C. 20001 | | Transfer Agent Invesco Investment Services, Inc. 11 Greenway Plaza, Suite 1000 Houston, TX 77046-1173 | | Custodian Bank of New York Mellon 2 Hanson Place Brooklyn, NY 11217-1431 |
Invesco V.I. Government Money Market Fund
| | | | |
| | |
 | | Annual Report to Shareholders | | December 31, 2019 |
| | |
| | Invesco V.I. Government Securities Fund |

Beginning on January 1, 2021, as permitted by regulations adopted by the Securities and Exchange Commission, the insurance company that offers your variable annuity or variable life insurance contract may no longer send you paper copies of the Fund’s shareholder reports by mail, unless you specifically request paper copies of the reports from the insurance company or your financial intermediary. Instead of delivering paper copies of the report, the insurance company may choose to make the reports available on a website, and will notify you by mail each time a report is posted and provide you with a website link to access the report. Instructions for requesting paper copies will be provided by your insurance company.
If the insurance company offers electronic delivery, you may elect to receive shareholder reports and other communications about the Fund electronically by following the instructions provided by the insurance company or by contacting your financial intermediary. If you already elected to receive shareholder reports electronically, you will not be affected by this change and you need not take any action.
You may elect to receive all future reports in paper free of charge from the insurance company. You can inform the insurance company or your financial intermediary that you wish to continue receiving paper copies of your shareholder reports by following the instructions provided by the insurance company or by contacting your financial intermediary. Your election to receive reports in paper will apply to all portfolio companies available under your contract with the insurance company.
The Fund provides a complete list of its holdings four times in each fiscal year, at the quarter-ends. For the second and fourth quarters, the lists appear in the Fund’s semiannual and annual reports to shareholders. For the first and third quarters, the Fund files the lists with the Securities and Exchange Commission (SEC) as an exhibit to its reports on FormN-PORT. The Fund’s FormN-PORT filings are available on the SEC website, sec.gov. The SEC file numbers for the Fund are811-07452 and033-57340. The Fund’s most recent portfolio holdings, as filed on FormN-PORT, have also been made available to insurance companies issuing variable annuity contracts and variable life insurance policies (“variable products”) that invest in the Fund.
A description of the policies and procedures that the Fund uses to determine how to vote proxies relating to portfolio securities is available without charge, upon request, from our Client Services department at 800 959 4246 or at invesco.com/proxyguidelines. The information is also available on the SEC website, sec.gov.
Information regarding how the Fund voted proxies related to its portfolio securities during the most recent12-month period ended June 30 is available at invesco.com/proxysearch. The information is also available on the SEC website, sec.gov.
Invesco Advisers, Inc. is an investment adviser; it provides investment advisory services to individual and institutional clients and does not sell securities. Invesco Distributors, Inc. is the US distributor for Invesco Ltd.’s retail mutual funds, exchange-traded funds and institutional money market funds. Both are wholly owned, indirect subsidiaries of Invesco Ltd.
This report must be accompanied or preceded by a currently effective Fund prospectus and variable product prospectus, which contain more complete information, including sales charges and expenses. Investors should read each carefully before investing.
| | | | |
| NOT FDIC INSURED | MAY LOSE VALUE | NO BANK GUARANTEE | | |
| Invesco Distributors, Inc. | | VIGOV-AR-1 | | |
Management’s Discussion of Fund Performance
| | | | | |
Performance summary For the year ended December 31, 2019, Series I shares of Invesco V.I. Government Securities Fund (the Fund) underperformed the Bloomberg Barclays U.S. Government Index, the Fund’s style-specific benchmark. Your Fund’s long-term performance appears later in this report. | | | | | |
Fund vs. Indexes Total returns, 12/31/18 to 12/31/19, excluding variable product issuer charges. If variable product issuer charges were included, returns would be lower. | | | | | |
| Series I Shares | | | | 6.07 | % |
| Series II Shares | | | | 5.75 | |
| Bloomberg Barclays U.S. Aggregate Bond Indexq(Broad Market Index) | | | | 8.72 | |
| Bloomberg Barclays U.S. Government Indexq(Style-Specific Index) | | | | 6.83 | |
| Lipper VUF Intermediate U.S. Government Funds Classification Average∎(Peer Group) | | | | 5.76 | |
| |
| Source(s):qRIMES Technologies Corp.;∎Lipper Inc. | | | | | |
Market conditions and your Fund
Calendar year 2019 proved to be an increasingly volatile time for the US bond market. US bond returns posted strong nominal results for the year, as rates fell amid a decelerating global economy and persistent trade disputes between the US and China. Global risks remained a head-wind to growth throughout most of the year. However, during the final months of 2019, rates increased amid diminishing risks of imminent rate cuts by the US Federal Reserve (the Fed), which were previously priced in. The global economy appeared to be stabilizing, as trade disputes between the US and China, Brexit uncertainties and Chinese data all seemed less threatening to valuations. Credit investors were generally rewarded over the year, despite heightened volatility and escalating recession fears. US based yield strategies remained competitive from a global perspective as negative yields increased across regions.
During the year, the Fed cut interest rates three times: in July, September and October 2019.1 However, at its December meeting, the Fed gave the clear indication that the target rate would likely remain at its current level through 2020, as factors that had driven risk aversion over the year had shown signs of improving.
US rate movements were the primary driver of valuations for the year. Thetwo-year US Treasury yield declined from 2.48% to 1.58%, the10-year US Treasury yield decreased from 2.69% to 1.92%, and the30-year US Treasury yield decreased from 3.02% to 2.39%.2 The yield curve, as measured by the yield differential of thetwo-year US Treasury yield versus the30-year US Treasury yield, steepened notably from 54 basis points to 81 basis points.2 (A basis point is one one-hundreth of a percentage point). Given this market backdrop, the Fund’s total return for the year was positive, but the Fund underperformed its style-specific benchmark, the Bloomberg Barclays U.S. Government Index.
Most of the Fund’s performance relative to the style-specific benchmark in 2019 was driven by the Fund’sout-of-index exposure to structured securities. These securities included agency pass-through mortgage-backed securities, high-qualitynon-agency residential mortgage-backed securities and commercial mortgage-backed securities. The
Fund’s underweight duration relative to its style-specific benchmark proved to be the Fund’s largest detractor as interest rates fell during the year. The Fund’s use of derivatives during the year included interest rate futures to manage yield curve exposure and swaptions to hedge interest rate volatility.
The Fund utilizes duration and yield curve positioning for risk management and for generating returns. Duration measures a portfolio’s price sensitivity to interest rate changes, with a shorter duration tending to be less sensitive to these changes. Yield curve positioning refers to actively emphasizing points (maturities) along the yield curve with favorable risk-return expectations. During the year, duration was managed with cash, bonds and futures positions. Buying and selling interest rate futures contracts was an important tool we used to manage interest rate risk. The Fund also used swaptions to hedge interest rate volatility during the year.
Please note that our strategy is implemented using derivative instruments, including futures and swaptions. Therefore, a portion of the Fund’s performance, both positive and negative, can be attributed to these instruments. Derivatives can be a cost-effective way to gain or hedge exposure to certain risks and asset classes. However, derivatives may amplify traditional investment risks through the creation of leverage and may be less liquid than traditional securities.
We wish to remind you that the Fund is subject to interest rate risk, meaning when interest rates rise, the value of fixed income securities tends to fall. The degree to which the value of fixed income securities may decline due to rising interest rates may vary depending on the speed and magnitude of the increase in
| | | | | |
Portfolio Composition | |
By security type | | | | % of total net assets | |
| |
| U.S. Government Sponsored Agency Mortgage-Backed Securities | | | | 53.61% | |
| U.S. Treasury Securities | | | | 33.63 | |
| Asset-Backed Securities | | | | 8.34 | |
| U.S. Government Sponsored Agency Securities | | | | 1.94 | |
| U.S. Dollar Denominated Bonds & Notes | | | | 1.39 | |
| Money Market Funds Plus Other Assets Less Liabilities | | | | 1.09 | |
| | | | | |
Top Five Debt Issuers* | |
% of total net assets | |
| |
| 1. U.S. Treasury | | | | 33.63% | |
2. Federal Home Loan Mortgage Corp. | | | | 14.08% | |
3. Federal National Mortgage Association | | | | 13.84 | |
4. Freddie Mac Multifamily Structured Pass Through Ctfs. | | | | 7.32 | |
5. Fannie Mae REMICs | | | | 6.10 | |
| | |
| Total Net Assets | | $426.3 million |
| Total Number of Holdings* | | 575 |
The Fund’s holdings are subject to change, and there is no assurance that the Fund will continue to hold any particular security.
*Excluding money market fund holdings, if any.
Data presented here are as of December 31, 2019.
Invesco V.I. Government Securities Fund
interest rates, as well as individual security characteristics, such as price, maturity, duration and coupon, and market forces, such as supply and demand for similar securities. We are monitoring interest rates, and the market, economic and geopolitical factors that may impact the direction, speed and magnitude of changes to interest rates across the maturity spectrum, including the potential impact of monetary policy changes by the Fed and certain foreign central banks. If interest rates rise, markets may experience increased volatility, which may affect the value and/or liquidity of certain of the Fund’s investments.
We welcome new investors who joined the Fund during the year and thank you for your investment in Invesco V.I. Government Securities Fund.
1 Source: US Federal Reserve
2 Source: US Department of the Treasury
Portfolio managers:
Clint Dudley
Noelle Corum
The views and opinions expressed in management’s discussion of Fund performance are those of Invesco Advisers, Inc. These views and opinions are subject to change at any time based on factors such as market and economic conditions. These views and opinions may not be relied upon as investment advice or recommendations, or as an offer for a particular security. The information is not a complete analysis of every aspect of any market, country, industry, security or the Fund. Statements of fact are from sources considered reliable, but Invesco Advisers, Inc. makes no representation or warranty as to their completeness or accuracy. Although historical performance is no guarantee of future results, these insights may help you understand our investment management philosophy.
See important Fund and, if applicable, index disclosures later in this report.
Invesco V.I. Government Securities Fund
Your Fund’s Long-Term Performance
Results of a $10,000 Investment – Oldest Share Class(es)
Fund and index data from 12/31/09
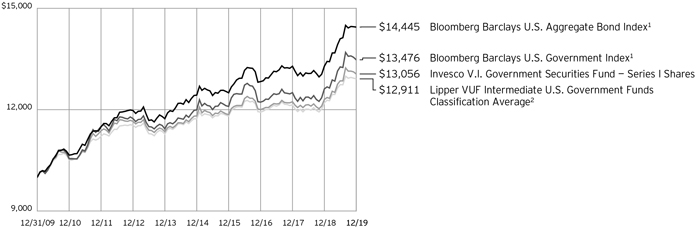
| 1 | Source: RIMES Technologies Corp. |
Past performance cannot guarantee future results.
| | | | | |
Average Annual Total Returns As of 12/31/19 |
| |
| Series I Shares | | | | | |
| Inception (5/5/93) | | | | 4.16% | |
| 10 Years | | | | 2.70 | |
| 5 Years | | | | 2.01 | |
| 1 Year | | | | 6.07 | |
| |
| Series II Shares | | | | | |
| Inception (9/19/01) | | | | 3.22% | |
| 10 Years | | | | 2.44 | |
| 5 Years | | | | 1.74 | |
| 1 Year | | | | 5.75 | |
The performance of the Fund’s Series I and Series II share classes will differ primarily due to different class expenses.
The performance data quoted represent past performance and cannot guarantee future results; current performance may be lower or higher. Please contact your variable product issuer or financial adviser for the most recentmonth-end variable product performance. Performance figures reflect Fund expenses, reinvested distributions and changes in net asset value. Performance figures do not reflect deduction of taxes a shareholder would pay on Fund distributions or sale of Fund shares. Investment return and principal value will fluctuate so that you may have a gain or loss when you sell shares.
The total annual Fund operating expense ratio set forth in the most recent Fund prospectus as of the date of this report for Series I and Series II shares was 0.69% and 0.94%, respectively. The expense ratios presented above may vary from the ex-
pense ratios presented in other sections of this report that are based on expenses incurred during the period covered by this report.
Invesco V.I. Government Securities Fund, a series portfolio of AIM Variable Insurance Funds (Invesco Variable Insurance Funds), is currently offered through insurance companies issuing variable products. You cannot purchase shares of the Fund directly. Performance figures given represent the Fund and are not intended to reflect actual variable product values. They do not reflect sales charges, expenses and fees assessed in connection with a variable product. Sales charges, expenses and fees, which are determined by the variable product issuers, will vary and will lower the total return.
The most recentmonth-end performance at the Fund level, excluding variable product charges, is available at 800 451 4246. As mentioned above, for the most recentmonth-end performance including variable product charges, please contact your variable product issuer or financial adviser.
Fund performance reflects any applicable fee waivers and/or expense reimbursements. Had the adviser not waived fees and/or reimbursed expenses currently or in the past, returns would have been lower. See current prospectus for more information.
Invesco V.I. Government Securities Fund
Invesco V.I. Government Securities Fund’s investment objective is total return, comprised of current income and capital appreciation.
| ∎ | | Unless otherwise stated, information presented in this report is as of December 31, 2019, and is based on total net assets. |
| ∎ | | Unless otherwise noted, all data provided by Invesco. |
| ∎ | | To access your Fund’s reports/prospectus, visit invesco.com/fundreports. |
About indexes used in this report
| ∎ | | TheBloomberg Barclays U.S. Aggregate Bond Indexis an unmanaged index considered representative of the US investment grade, fixed-rate bond market. |
| ∎ | | TheBloomberg Barclays U.S. Government Indexis an unmanaged index considered representative of fixed income obligations issued by the US Treasury, government agencies and quasi-federal corporations. |
| ∎ | | TheLipper VUF Intermediate U.S. Government Funds Classification Averagerepresents an average of all variable insurance underlying funds in the Lipper Intermediate U.S. Government Funds classification. |
| ∎ | | The Fund is not managed to track the performance of any particular index, including the index(es) described here, and consequently, the performance of the Fund may deviate significantly from the performance of the index(es). |
| ∎ | | A direct investment cannot be made in an index. Unless otherwise indicated, index results include reinvested dividends, and they do not reflect sales charges. Performance of the peer group, if applicable, reflects fund expenses; performance of a market index does not. |
Other information
| ∎ | | The returns shown in management’s discussion of Fund performance are based on net asset values calculated for shareholder transactions. Generally accepted accounting principles require adjustments to be made to the net assets of the Fund at period end for financial reporting purposes, and as such, the net asset values for shareholder transactions and the returns based on those net asset values may differ from the net asset values and returns reported in the Financial Highlights. Additionally, the returns and net asset values shown throughout this report are at the Fund level only and do not include variable product issuer charges. If such charges were included, the total returns would be lower. |
Invesco V.I. Government Securities Fund
Schedule of Investments
December 31, 2019
| | | | | | | | |
| | | Principal
Amount | | | Value | |
U.S. Government Sponsored Agency Mortgage-Backed Securities–53.61% | |
| Collateralized Mortgage Obligations–20.77% | |
Fannie Mae ACES | | | | | | | | |
2.76%, (1 mo. USD LIBOR + 0.59%), 09/25/2023(a) | | $ | 702,369 | | | $ | 703,191 | |
| |
3.27%, 01/25/2029 | | | 5,000,000 | | | | 5,304,797 | |
| |
Fannie Mae REMICs | | | | | | | | |
3.00%, 10/25/2025 | | | 40,497 | | | | 40,528 | |
| |
2.50%, 03/25/2026 | | | 61,653 | | | | 61,548 | |
| |
7.00%, 09/18/2027 | | | 165,977 | | | | 182,134 | |
| |
1.50%, 01/25/2028 | | | 2,948,963 | | | | 2,899,444 | |
| |
6.50%, 03/25/2032 | | | 525,549 | | | | 597,064 | |
| |
5.75%, 10/25/2035 | | | 185,155 | | | | 203,237 | |
| |
2.09%, (1 mo. USD LIBOR + 0.30%), 05/25/2036(a) | | | 1,768,655 | | | | 1,758,607 | |
| |
4.25%, 02/25/2037 | | | 224,105 | | | | 227,426 | |
| |
2.24%, (1 mo. USD LIBOR + 0.45%), 03/25/2037(a) | | | 905,299 | | | | 893,042 | |
| |
2.19%, (1 mo. USD LIBOR + 0.40%), 06/25/2038(a) | | | 871,806 | | | | 872,210 | |
| |
6.59%, 06/25/2039(b) | | | 2,493,618 | | | | 2,876,525 | |
| |
2.29%, 03/25/40 to 05/25/41 | | | 2,038,415 | | | | 2,048,374 | |
| |
4.00%, 07/25/2040 | | | 1,589,406 | | | | 1,679,039 | |
| |
2.34%, (1 mo. USD LIBOR + 0.55%), 02/25/2041(a) | | | 1,663,628 | | | | 1,673,458 | |
| |
2.31%, (1 mo. USD LIBOR + 0.52%), 11/25/2041(a) | | | 1,731,798 | | | | 1,739,594 | |
| |
2.10%, (1 mo. USD LIBOR + 0.32%), 08/25/2044(a) | | | 1,558,325 | | | | 1,555,894 | |
| |
2.26%, (1 mo. USD LIBOR + 0.48%), 02/25/2056(a) | | | 3,046,752 | | | | 3,047,729 | |
| |
2.20%, (1 mo. USD LIBOR + 0.42%), 12/25/2056(a) | | | 3,620,553 | | | | 3,615,779 | |
| |
Freddie Mac Multifamily Structured Pass Through Ctfs. | | | | | | | | |
| |
Series K714, Class A2, 3.03%, 10/25/2020(b) | | | 8,753,953 | | | | 8,792,184 | |
| |
Series KLU1, Class A2, 2.51%, 12/25/2025 | | | 5,000,000 | | | | 5,050,398 | |
| |
Series KG01, Class A7, 2.88%, 04/25/2026 | | | 5,000,000 | | | | 5,145,379 | |
| |
Series KS11, Class AFX1, 2.15%, 12/25/2028 | | | 5,000,000 | | | | 4,963,729 | |
| |
Series K093, Class A1, 2.76%, 12/25/2028 | | | 1,976,501 | | | | 2,029,412 | |
| |
Series K092, Class AM, 3.02%, 04/25/2029 | | | 5,000,000 | | | | 5,210,759 | |
| |
| | | | | | | | |
| | | Principal
Amount | | | Value | |
| Collateralized Mortgage Obligations–(continued) | |
Freddie Mac REMICs | | | | | | | | |
3.00%, 04/15/2026 | | $ | 55,322 | | | $ | 55,340 | |
| |
2.24%, 12/15/35 to 03/15/40 | | | 3,469,866 | | | | 3,484,095 | |
| |
2.04%, 03/15/36 to 09/15/44 | | | 8,197,993 | | | | 8,125,641 | |
| |
2.13%, (1 mo. USD LIBOR + 0.35%), 11/15/2036(a) | | | 2,208,089 | | | | 2,198,510 | |
| |
2.11%, (1 mo. USD LIBOR + 0.37%), 03/15/2037(a) | | | 959,507 | | | | 956,784 | |
| |
2.14%, 05/15/37 to 06/15/37 | | | 1,704,960 | | | | 1,703,113 | |
| |
2.60%, (1 mo. USD LIBOR + 0.86%), 11/15/2039(a) | | | 496,287 | | | | 504,576 | |
| |
2.19%, 03/15/40 to 02/15/42 | | | 5,464,656 | | | | 5,469,178 | |
| |
Freddie Mac STRIPS, 2.13% (1 mo. USD LIBOR + 0.35%), 10/15/2037(a) | | | 1,789,252 | | | | 1,773,018 | |
| |
Freddie Mac Whole Loan Securities Trust, Series 2017-SC02, Class 2A1, 3.50%, 05/25/2047 | | | 1,080,802 | | | | 1,091,578 | |
| |
| | | | | | | 88,533,314 | |
| |
Federal Home Loan Mortgage Corp. (FHLMC)–14.08% | |
4.50%, 09/01/2020 to 08/01/2041 | | | 5,853,305 | | | | 6,418,328 | |
| |
6.50%, 02/01/2021 to 12/01/2035 | | | 1,630,515 | | | | 1,841,272 | |
| |
6.00%, 03/01/2021 to 07/01/2038 | | | 178,286 | | | | 196,726 | |
| |
10.00%, 03/01/2021 | | | 142 | | | | 142 | |
| |
9.00%, 06/01/2021 to 06/01/2022 | | | 2,641 | | | | 2,644 | |
| |
7.00%, 12/01/2021 to 11/01/2035 | | | 2,077,022 | | | | 2,357,520 | |
| |
8.00%, 12/01/2021 to 02/01/2035 | | | 407,721 | | | | 427,815 | |
| |
7.50%, 09/01/2022 to 06/01/2035 | | | 691,153 | | | | 776,736 | |
| |
8.50%, 11/17/2022 to 08/01/2031 | | | 127,635 | | | | 135,220 | |
| |
5.50%, 12/01/2022 | | | 11,995 | | | | 12,080 | |
| |
3.50%, 08/01/2026 | | | 428,250 | | | | 444,129 | |
| |
3.00%, 05/01/2027 to 12/01/2049 | | | 14,796,748 | | | | 15,157,993 | |
| |
7.05%, 05/20/2027 | | | 63,303 | | | | 67,788 | |
| |
6.03%, 10/20/2030 | | | 585,759 | | | | 657,583 | |
| |
2.50%, 09/01/2034 to 10/01/2034 | | | 17,621,461 | | | | 17,798,481 | |
| |
5.00%, 01/01/2037 to 01/01/2040 | | | 869,956 | | | | 960,841 | |
| |
See accompanying Notes to Financial Statements which are an integral part of the financial statements.
Invesco V.I. Government Securities Fund
| | | | | | | | |
| | | Principal
Amount | | | Value | |
| Federal Home Loan Mortgage Corp. (FHLMC)–(continued) | |
ARM, | |
4.28%, (1 yr. USD LIBOR + 1.88%), 09/01/2035(a) | | $ | 2,138,008 | | | $ | 2,254,625 | |
| |
4.50%, (1 yr. USD LIBOR + 1.88%), 07/01/2036(a) | | | 1,939,826 | | | | 2,041,994 | |
| |
3.95%, (1 yr. USD LIBOR + 1.91%), 10/01/2036(a) | | | 80,355 | | | | 84,827 | |
| |
3.98%, (1 yr. USD LIBOR + 1.55%), 10/01/2036(a) | | | 1,123,936 | | | | 1,174,991 | |
| |
3.98%, (1 yr. USD LIBOR + 1.97%), 11/01/2037(a) | | | 530,695 | | | | 562,229 | |
| |
5.20%, (1 yr. USD LIBOR + 2.01%), 01/01/2038(a) | | | 20,274 | | | | 21,291 | |
| |
4.54%, (1 yr. USD LIBOR + 1.84%), 07/01/2038(a) | | | 622,923 | | | | 658,723 | |
| |
4.49%, (1 yr. USD LIBOR + 1.79%), 06/01/2043(a) | | | 839,834 | | | | 877,549 | |
| |
2.89%, (1 yr. USD LIBOR + 1.64%), 01/01/2048(a) | | | 5,005,625 | | | | 5,073,718 | |
| |
| | | | | | | 60,005,245 | |
| |
Federal National Mortgage Association (FNMA)–13.84% | |
5.00%, 03/01/2020 to 12/01/2033 | | | 151,643 | | | | 160,217 | |
| |
7.00%, 08/01/2020 to 06/01/2036 | | | 1,711,234 | | | | 1,836,418 | |
| |
8.00%, 02/01/2021 to 10/01/2037 | | | 2,019,964 | | | | 2,348,135 | |
| |
8.50%, 02/01/2021 to 08/01/2037 | | | 519,195 | | | | 582,618 | |
| |
5.50%, 03/01/2021 to 05/01/2035 | | | 993,242 | | | | 1,118,036 | |
| |
6.00%, 08/01/2021 to 10/01/2038 | | | 1,056,750 | | | | 1,182,182 | |
| |
7.50%, 11/01/2022 to 08/01/2037 | | | 3,027,738 | | | | 3,431,440 | |
| |
6.50%, 06/01/2023 to 11/01/2037 | | | 1,587,424 | | | | 1,768,185 | |
| |
6.75%, 07/01/2024 | | | 133,641 | | | | 148,414 | |
| |
4.50%, 11/01/2024 to 12/01/2048 | | | 12,001,446 | | | | 12,867,788 | |
| |
6.95%, 10/01/2025 | | | 12,832 | | | | 12,952 | |
| |
3.50%, 03/01/2027 to 08/01/2027 | | | 5,230,496 | | | | 5,429,838 | |
| |
3.00%, 05/01/2027 to 12/01/2049 | | | 13,801,573 | | | | 14,166,358 | |
| |
4.00%, 12/01/2048 | | | 8,200,576 | | | | 8,742,618 | |
| |
| | | | | | | | |
| | | Principal
Amount | | | Value | |
| Federal National Mortgage Association (FNMA)–(continued) | |
ARM, | |
4.20%, (1 yr. U.S. Treasury Yield Curve Rate + 2.36%), 10/01/2034(a) | | $ | 1,384,514 | | | $ | 1,468,991 | |
| |
4.47%, (1 yr. U.S. Treasury Yield Curve Rate + 2.21%), 05/01/2035(a) | | | 159,412 | | | | 168,060 | |
| |
4.44%, (1 yr. USD LIBOR + 1.72%), 03/01/2038(a) | | | 36,854 | | | | 38,785 | |
| |
3.99%, (1 yr. USD LIBOR + 1.75%), 02/01/2042(a) | | | 346,517 | | | | 353,224 | |
| |
2.15%, (1 yr. USD LIBOR + 1.52%), 08/01/2043(a) | | | 1,390,726 | | | | 1,421,361 | |
| |
2.59%, (1 yr. U.S. Treasury Yield Curve Rate + 1.88%), 05/01/2044(a) | | | 1,683,595 | | | | 1,747,698 | |
| |
| | | | | | | 58,993,318 | |
| |
Government National Mortgage Association (GNMA)–4.92% | |
6.50%, 07/15/2020 to 09/15/2034 | | | 2,319,475 | | | | 2,547,901 | |
| |
6.00%, 09/15/2020 to 08/15/2033 | | | 477,614 | | | | 520,851 | |
| |
7.50%, 09/15/2022 to 10/15/2035 | | | 1,477,084 | | | | 1,645,287 | |
| |
8.00%, 01/15/2023 to 01/15/2037 | | | 870,810 | | | | 984,730 | |
| |
7.00%, 04/15/2023 to 12/15/2036 | | | 635,660 | | | | 694,104 | |
| |
5.00%, 02/15/2025 | | | 119,933 | | | | 128,266 | |
| |
8.50%, 02/15/2025 to 01/15/2037 | | | 131,143 | | | | 136,815 | |
| |
6.95%, 08/20/2025 to 08/20/2027 | | | 138,511 | | | | 138,727 | |
| |
6.38%, 10/20/2027 to 02/20/2028 | | | 156,471 | | | | 166,283 | |
| |
6.10%, 12/20/2033 | | | 3,087,502 | | | | 3,482,882 | |
| |
5.71%, 08/20/2034(b) | | | 876,286 | | | | 976,101 | |
| |
5.88%, 01/20/2039(b) | | | 3,046,574 | | | | 3,420,827 | |
| |
2.54%, (1 mo. USD LIBOR + 0.80%), 09/16/2039(a) | | | 925,682 | | | | 942,455 | |
| |
4.49%, 07/20/2041(b) | | | 669,453 | | | | 717,835 | |
| |
3.85%, 09/20/2041(b) | | | 2,136,246 | | | | 2,195,227 | |
| |
2.01%, (1 mo. USD LIBOR + 0.25%), 01/20/2042(a) | | | 360,873 | | | | 360,340 | |
| |
3.50%, 10/20/2042 | | | 1,872,813 | | | | 1,921,708 | |
| |
| | | | | | | 20,980,339 | |
| |
Total U.S. Government Sponsored Agency Mortgage-Backed Securities
(Cost $225,187,294) | | | | | | | 228,512,216 | |
| |
U.S. Treasury Securities–33.63% | |
| U.S. Treasury Bills–0.18% | |
1.52%, 04/09/2020(c)(d) | | | 760,000 | | | | 756,855 | |
| |
See accompanying Notes to Financial Statements which are an integral part of the financial statements.
Invesco V.I. Government Securities Fund
| | | | | | | | |
| | | Principal
Amount | | | Value | |
| U.S. Treasury Bonds–13.72% | |
5.38%, 02/15/2031 | | $ | 3,800,000 | | | $ | 5,098,256 | |
| |
3.38%, 05/15/2044 | | | 3,500,000 | | | | 4,138,494 | |
| |
3.00%, 05/15/2045 | | | 7,000,000 | | | | 7,808,059 | |
| |
2.88%, 08/15/2045 | | | 750,000 | | | | 819,151 | |
| |
3.00%, 11/15/2045 | | | 3,000,000 | | | | 3,353,240 | |
| |
2.50%, 05/15/2046 | | | 6,000,000 | | | | 6,120,543 | |
| |
2.25%, 08/15/2046 | | | 6,550,000 | | | | 6,359,927 | |
| |
3.00%, 05/15/2047 | | | 7,300,000 | | | | 8,194,876 | |
| |
2.75%, 08/15/2047 | | | 10,000,000 | | | | 10,714,752 | |
| |
2.75%, 11/15/2047 | | | 5,500,000 | | | | 5,893,018 | |
| |
| | | | | | | 58,500,316 | |
| |
|
| U.S. Treasury Inflation – Indexed Bonds–1.00% | |
0.13%, 04/15/2021(e) | | | 2,171,480 | | | | 2,167,095 | |
0.50%, 04/15/2024(e) | | | 2,040,580 | | | | 2,073,898 | |
| |
| | | | | | | 4,240,993 | |
| |
U.S. Treasury Inflation – Indexed Notes–0.64% | |
0.63%, 04/15/2023(e) | | | 2,693,522 | | | | 2,735,529 | |
| |
| U.S. Treasury Notes–18.09% | |
2.63%, 05/15/2021 | | | 2,000,000 | | | | 2,027,453 | |
| |
2.13%, 08/15/2021 | | | 2,700,000 | | | | 2,722,547 | |
| |
2.00%, 10/31/2021 | | | 500,000 | | | | 503,697 | |
| |
2.00%, 11/15/2021 | | | 3,300,000 | | | | 3,325,974 | |
| |
2.00%, 12/31/2021 | | | 3,000,000 | | | | 3,023,676 | |
| |
2.00%, 07/31/2022 | | | 2,000,000 | | | | 2,020,089 | |
| |
1.63%, 08/31/2022 | | | 5,000,000 | | | | 5,002,707 | |
| |
1.50%, 09/15/2022 | | | 5,000,000 | | | | 4,986,719 | |
| |
1.63%, 11/15/2022 | | | 2,000,000 | | | | 2,000,648 | |
| |
2.00%, 11/30/2022 | | | 2,700,000 | | | | 2,729,545 | |
| |
2.38%, 01/31/2023 | | | 2,000,000 | | | | 2,044,577 | |
| |
1.63%, 04/30/2023 | | | 4,000,000 | | | | 3,998,014 | |
| |
1.63% - 2.75%, 05/31/2023 | | | 7,700,000 | | | | 7,928,902 | |
| |
1.63%, 10/31/2023 | | | 625,000 | | | | 624,076 | |
| |
2.63%, 12/31/2023 | | | 4,000,000 | | | | 4,146,678 | |
| |
2.13%, 03/31/2024 | | | 4,000,000 | | | | 4,071,574 | |
| |
2.00%, 05/31/2024 | | | 2,500,000 | | | | 2,532,800 | |
| |
2.25%, 11/15/2024 | | | 3,000,000 | | | | 3,076,528 | |
| |
2.88%, 05/31/2025 | | | 4,000,000 | | | | 4,233,689 | |
| |
2.88%, 11/30/2025 | | | 2,500,000 | | | | 2,653,865 | |
| |
2.63%, 12/31/2025 | | | 2,000,000 | | | | 2,095,774 | |
| |
1.50%, 08/15/2026 | | | 4,250,000 | | | | 4,163,011 | |
| |
2.38%, 05/15/2027 | | | 1,000,000 | | | | 1,036,246 | |
| |
2.25%, 11/15/2027 | | | 3,000,000 | | | | 3,082,029 | |
| |
2.38%, 05/15/2029 | | | 2,600,000 | | | | 2,700,804 | |
| |
1.63%, 08/15/2029 | | | 400,000 | | | | 389,447 | |
| |
| | | | | | | 77,121,069 | |
| |
Total U.S. Treasury Securities
(Cost $136,631,023) | | | | 143,354,762 | |
| |
|
| Asset-Backed Securities–8.34%(f) | |
Banc of America Commercial Mortgage Trust, Series 2015-UBS7, Class XA, IO, 0.81%, 09/15/2048(b) | | | 15,914,953 | | | | 622,342 | |
| |
| | | | | | | | |
| | | Principal
Amount | | | Value | |
Bear Stearns Adjustable Rate Mortgage Trust, Series2004-10, Class 12A1, 3.82%, 01/25/2035(b) | | $ | 411,060 | | | $ | 427,072 | |
| |
Chase Mortgage Finance Corp., Series2016-1, Class M3, 3.75%, 04/25/2045(b)(g) | | | 1,940,854 | | | | 1,966,968 | |
| |
Series2016-2, Class M3, 3.75%, 12/25/2045(b)(g) | | | 2,299,706 | | | | 2,324,773 | |
| |
Commercial Mortgage Trust, Series 2015-CR23, Class CMB,
3.68%, 05/10/2048(b)(g) | | | 2,800,026 | | | | 2,806,508 | |
| |
Series 2015-CR24, Class B, 4.38%, 08/10/2048(b) | | | 6,200,000 | | | | 6,596,971 | |
| |
FRESB Mortgage Trust, Series 2019- SB63, Class A5, 2.55% (1 mo. USD LIBOR + 2.55%), 02/25/2039(a) | | | 3,793,854 | | | | 3,842,946 | |
| |
Galton Funding Mortgage Trust, Series2018-2, Series A41, 4.50%, 10/25/2058(b)(g) | | | 2,628,037 | | | | 2,686,716 | |
| |
JP Morgan Mortgage Trust, Series2018-8, Class A15, 4.00%, 01/25/2049(b)(g) | | | 1,476,786 | | | | 1,480,357 | |
| |
New Residential Mortgage Loan Trust, Series2018-4A, Class A1S, 2.54% (1 mo. USD LIBOR + 0.75%), 01/25/2048(a)(g) | | | 3,213,030 | | | | 3,212,314 | |
| |
Towd Point Mortgage Trust, Series2015-1, Class AES, 3.00%, 10/25/2053(b)(g) | | | 693,326 | | | | 696,225 | |
| |
Verus Securitization Trust, Series2018-3,Class A-2, 4.18%, 10/25/2058(b)(g) | | | 2,665,137 | | | | 2,698,072 | |
| |
Wells Fargo Commercial Mortgage Trust, Series2015-C28, Class B, 4.11%, 05/15/2048(b) | | | 5,900,000 | | | | 6,168,630 | |
| |
Total Asset-Backed Securities
(Cost $34,857,996) | | | | 35,529,894 | |
| |
|
| U.S. Government Sponsored Agency Securities–1.94% | |
| Federal Home Loan Bank (FHLB)–1.47% | |
Federal Home Loan Bank, 3.38%, 06/12/2020 | | | 6,220,000 | | | | 6,265,553 | |
| |
|
| Tennessee Valley Authority (TVA)–0.47% | |
Tennessee Valley Authority, 1.88%, 08/15/2022 | | | 2,000,000 | | | | 2,007,564 | |
| |
Total U.S. Government Sponsored Agency Securities
(Cost $8,244,318) | | | | 8,273,117 | |
| |
|
| U.S. Dollar Denominated Bonds & Notes–1.39% | |
| Other Diversified Financial Services–0.38% | |
Private Export Funding Corp., Series BB, 4.30%, 12/15/2021 | | | 1,540,000 | | | | 1,615,668 | |
| |
|
| Sovereign Debt–1.01% | |
Israel Government AID Bond, 5.13%, 11/01/2024 | | | 3,800,000 | | | | 4,326,709 | |
| |
Total U.S. Dollar Denominated Bonds & Notes
(Cost $5,349,195) | | | | 5,942,377 | |
| |
See accompanying Notes to Financial Statements which are an integral part of the financial statements.
Invesco V.I. Government Securities Fund
| | | | | | | | |
| | | Shares | | | Value | |
| Money Market Funds–2.00% | |
Invesco Government & Agency Portfolio,Institutional Class, 1.50% (Cost $8,520,491)(h) | | | 8,520,491 | | | $ | 8,520,491 | |
| |
TOTAL INVESTMENTS IN
SECURITIES-100.91%
(Cost $418,790,317) | | | | 430,132,857 | |
| |
OTHER ASSETS LESS LIABILITIES-(0.91)% | | | | | | | (3,864,438 | ) |
| |
NET ASSETS-100.00% | | | | | | $ | 426,268,419 | |
| |
Investment Abbreviations:
| | |
| ACES | | - Automatically Convertible Extendable Security |
| ARM | | - Adjustable Rate Mortgage |
| Ctfs. | | - Certificates |
| IO | | - Interest Only |
| LIBOR | | - London Interbank Offered Rate |
| REMICs | | - Real Estate Mortgage Investment Conduits |
| STRIPS | | - Separately Traded Registered Interest and Principal Security |
| USD | | - U.S. Dollar |
Notes to Schedule of Investments:
| (a) | Interest or dividend rate is redetermined periodically. Rate shown is the rate in effect on December 31, 2019. |
| (b) | Interest rate is redetermined periodically based on the cash flows generated by the pool of assets backing the security, less any applicable fees. The rate shown is the rate in effect on December 31, 2019. |
| (c) | All or a portion of the value was pledged as collateral to cover margin requirements for open futures contracts. See Note 1J. |
| (d) | Security traded on a discount basis. The interest rate shown represents the discount rate at the time of purchase by the Fund. |
| (e) | Principal amount of security and interest payments are adjusted for inflation. See Note 1I. |
| (f) | Non-U.S. government sponsored securities. |
| (g) | Security purchased or received in a transaction exempt from registration under the Securities Act of 1933, as amended (the “1933 Act”). The security may be resold pursuant to an exemption from registration under the 1933 Act, typically to qualified institutional buyers. The aggregate value of these securities at December 31, 2019 was $17,871,933, which represented 4.19% of the Fund’s Net Assets. |
| (h) | The money market fund and the Fund are affiliated by having the same investment adviser. The rate shown is the7-day SEC standardized yield as of December 31, 2019. |
| | | | | | | | | | | | | | | | | | | | |
| Open Futures Contracts | |
| Long Futures Contracts | | Number of
Contracts | | | Expiration
Month | | | Notional
Value | | | Value | | | Unrealized
Appreciation
(Depreciation)(a) | |
Interest Rate Risk | | | | | | | | | | | | | | | | | | | | |
| |
U.S. Treasury 2 Year Notes | | | 369 | | | | March-2020 | | | $ | 79,519,500 | | | $ | (78,149 | ) | | $ | (78,149) | |
| |
Short Futures Contracts | | | | | | | | | | | | | | | | | | | | |
| |
Interest Rate Risk | | | | | | | | | | | | | | | | | | | | |
| |
U.S. Treasury 5 Year Notes | | | 17 | | | | March-2020 | | | | (2,016,359 | ) | | | 6,206 | | | | 6,206 | |
| |
U.S. Treasury 10 Year Ultra Bonds | | | 71 | | | | March-2020 | | | | (9,989,922 | ) | | | 126,767 | | | | 126,767 | |
| |
U.S. Treasury 10 Year Notes | | | 26 | | | | March-2020 | | | | (3,338,969 | ) | | | (6,149 | ) | | | (6,149) | |
| |
U.S. Treasury Ultra Bond | | | 146 | | | | March-2020 | | | | (26,521,813 | ) | | | 167,082 | | | | 167,082 | |
| |
Subtotal–Short Futures Contracts | | | | | | | | | | | | | | | 293,906 | | | | 293,906 | |
| |
Total Futures Contracts | | | | | | | | | | | | | | $ | 215,757 | | | $ | 215,757 | |
| |
| (a) | The daily variation margin receivable (payable) at period end is recorded in the Statement of Assets and Liabilities. |
See accompanying Notes to Financial Statements which are an integral part of the financial statements.
Invesco V.I. Government Securities Fund
Statement of Assets and Liabilities
December 31, 2019
| | | | |
Assets: | | | | |
Investments in securities, at value
(Cost $ 410,269,826) | | $ | 421,612,366 | |
| |
Investments in affiliated money market funds, at value (Cost $ 8,520,491) | | | 8,520,491 | |
| |
Other investments: | | | | |
Variation margin receivable – futures contracts | | | 201,562 | |
| |
Cash | | | 177,388 | |
| |
Receivable for: | | | | |
Fund shares sold | | | 34,239 | |
| |
Dividends | | | 14,134 | |
| |
Interest | | | 1,471,351 | |
| |
Principal paydowns | | | 197,659 | |
| |
Investment for trustee deferred compensation and retirement plans | | | 249,141 | |
| |
Total assets | | | 432,478,331 | |
| |
| |
Liabilities: | | | | |
Payable for: | | | | |
Investments purchased | | | 5,102,292 | |
| |
Fund shares reacquired | | | 479,785 | |
| |
Accrued fees to affiliates | | | 293,854 | |
| |
Accrued other operating expenses | | | 67,684 | |
| |
Trustee deferred compensation and retirement plans | | | 266,297 | |
| |
Total liabilities | | | 6,209,912 | |
| |
Net assets applicable to shares outstanding | | $ | 426,268,419 | |
| |
| |
Net assets consist of: | | | | |
Shares of beneficial interest | | $ | 421,684,363 | |
| |
Distributable earnings | | | 4,584,056 | |
| |
| | $ | 426,268,419 | |
| |
| |
Net Assets: | | | | |
Series I | | $ | 251,440,286 | |
| |
Series II | | $ | 174,828,133 | |
| |
|
Shares outstanding, no par value, with an unlimited number of shares authorized: | |
Series I | | | 21,666,387 | |
| |
Series II | | | 15,205,088 | |
| |
Series I: | | | | |
Net asset value per share | | $ | 11.61 | |
| |
Series II: | | | | |
Net asset value per share | | $ | 11.50 | |
| |
Statement of Operations
For the year ended December 31, 2019
| | | | |
Investment income: | | | | |
Interest | | $ | 12,639,900 | |
| |
Treasury Inflation-Protected Securities inflation adjustments | | | 251,877 | |
| |
Dividends from affiliated money market funds | | | 92,363 | |
| |
Total investment income | | | 12,984,140 | |
| |
| |
Expenses: | | | | |
Advisory fees | | | 2,170,512 | |
| |
Administrative services fees | | | 753,463 | |
| |
Custodian fees | | | 27,838 | |
| |
Distribution fees - Series II | | | 465,987 | |
| |
Transfer agent fees | | | 35,794 | |
| |
Trustees’ and officers’ fees and benefits | | | 24,474 | |
| |
Reports to shareholders | | | 7,530 | |
| |
Professional services fees | | | 47,833 | |
| |
Other | | | 29,946 | |
| |
Total expenses | | | 3,563,377 | |
| |
Less: Fees waived | | | (4,102 | ) |
| |
Net expenses | | | 3,559,275 | |
| |
Net investment income | | | 9,424,865 | |
| |
|
Realized and unrealized gain (loss) from: | |
Net realized gain (loss) from: | | | | |
Investment securities | | | 1,824,209 | |
| |
Foreign currencies | | | (312 | ) |
| |
Futures contracts | | | 2,609,830 | |
| |
Swap agreements | | | (594,990 | ) |
| |
| | | 3,838,737 | |
| |
Change in net unrealized appreciation (depreciation) of: | | | | |
Investment securities | | | 13,565,030 | |
| |
Futures contracts | | | (87,353 | ) |
| |
Swap agreements | | | (325,665 | ) |
| |
| | | 13,152,012 | |
| |
Net realized and unrealized gain | | | 16,990,749 | |
| |
Net increase in net assets resulting from operations | | $ | 26,415,614 | |
| |
See accompanying Notes to Financial Statements which are an integral part of the financial statements.
Invesco V.I. Government Securities Fund
Statement of Changes in Net Assets
For the years ended December 31, 2019 and 2018
| | | | | | | | |
| | | 2019 | | | 2018 | |
| |
Operations: | | | | | | | | |
Net investment income | | $ | 9,424,865 | | | $ | 10,721,947 | |
| |
Net realized gain (loss) | | | 3,838,737 | | | | (4,268,596 | ) |
| |
Change in net unrealized appreciation (depreciation) | | | 13,152,012 | | | | (4,960,649 | ) |
| |
Net increase in net assets resulting from operations | | | 26,415,614 | | | | 1,492,702 | |
| |
| | |
Distributions to shareholders from distributable earnings: | | | | | | | | |
Series I | | | (6,666,815 | ) | | | (6,550,635 | ) |
| |
Series II | | | (4,034,804 | ) | | | (3,832,997 | ) |
| |
Total distributions from distributable earnings | | | (10,701,619 | ) | | | (10,383,632 | ) |
| |
| | |
Share transactions–net: | | | | | | | | |
Series I | | | (37,212,596 | ) | | | (33,348,279 | ) |
| |
Series II | | | (23,434,778 | ) | | | (11,943,167 | ) |
| |
Net increase (decrease) in net assets resulting from share transactions | | | (60,647,374 | ) | | | (45,291,446 | ) |
| |
Net increase (decrease) in net assets | | | (44,933,379 | ) | | | (54,182,376 | ) |
| |
| | |
Net assets: | | | | | | | | |
Beginning of year | | | 471,201,798 | | | | 525,384,174 | |
| |
End of year | | $ | 426,268,419 | | | $ | 471,201,798 | |
| |
See accompanying Notes to Financial Statements which are an integral part of the financial statements.
Invesco V.I. Government Securities Fund
Financial Highlights
The following schedule presents financial highlights for a share of the Fund outstanding throughout the periods indicated.
| | | | | | | | | | | | | | | | | | | | | | | | | | | | | | | | | | | | | | | | | | | | | | | | |
| | | Net asset
value,
beginning
of period | | | Net
investment
income(a) | | | Net gains
(losses)
on securities
(both
realized and
unrealized) | | | Total from
investment
operations | | | Dividends
from net
investment
income | | | Net asset
value,end
of period | | | Total
return(b) | | | Net assets,
end of period
(000’s omitted) | | | Ratio of
expenses
to average
net assets
with fee waivers
and/or
expenses
absorbed | | | Ratio of
expenses
to average net
assets without
fee waivers
and/or
expenses
absorbed | | | Ratio of net
investment
income
to average
net assets | | | Portfolio
turnover(c) | |
Series I | | | | | | | | | | | | | | | | | | | | | | | | | | | | | | | | | | | | | | | | | | | | | | | | |
Year ended 12/31/19 | | $ | 11.22 | | | $ | 0.25 | | | $ | 0.43 | | | $ | 0.68 | | | $ | (0.29 | ) | | $ | 11.61 | | | | 6.07 | % | | $ | 251,440 | | | | 0.68 | %(d) | | | 0.68 | %(d) | | | 2.18 | %(d) | | | 35 | % |
Year ended 12/31/18 | | | 11.41 | | | | 0.25 | | | | (0.19 | ) | | | 0.06 | | | | (0.25 | ) | | | 11.22 | | | | 0.56 | | | | 279,476 | | | | 0.69 | | | | 0.69 | | | | 2.25 | | | | 25 | |
Year ended 12/31/17 | | | 11.44 | | | | 0.22 | | | | (0.01 | ) | | | 0.21 | | | | (0.24 | ) | | | 11.41 | | | | 1.87 | | | | 318,298 | | | | 0.70 | | | | 0.70 | | | | 1.97 | | | | 35 | |
Year ended 12/31/16 | | | 11.52 | | | | 0.23 | | | | (0.07 | ) | | | 0.16 | | | | (0.24 | ) | | | 11.44 | | | | 1.32 | | | | 353,614 | | | | 0.73 | | | | 0.73 | | | | 1.93 | | | | 31 | |
Year ended 12/31/15 | | | 11.74 | | | | 0.17 | | | | (0.13 | ) | | | 0.04 | | | | (0.26 | ) | | | 11.52 | | | | 0.34 | | | | 393,090 | | | | 0.77 | | | | 0.77 | | | | 1.44 | | | | 59 | |
Series II | | | | | | | | | | | | | | | | | | | | | | | | | | | | | | | | | | | | | | | | | | | | | | | | |
Year ended 12/31/19 | | | 11.12 | | | | 0.22 | | | | 0.42 | | | | 0.64 | | | | (0.26 | ) | | | 11.50 | | | | 5.75 | | | | 174,828 | | | | 0.93 | (d) | | | 0.93 | (d) | | | 1.93 | (d) | | | 35 | |
Year ended 12/31/18 | | | 11.31 | | | | 0.22 | | | | (0.19 | ) | | | 0.03 | | | | (0.22 | ) | | | 11.12 | | | | 0.29 | | | | 191,725 | | | | 0.94 | | | | 0.94 | | | | 2.00 | | | | 25 | |
Year ended 12/31/17 | | | 11.33 | | | | 0.19 | | | | (0.00 | ) | | | 0.19 | | | | (0.21 | ) | | | 11.31 | | | | 1.72 | | | | 207,086 | | | | 0.95 | | | | 0.95 | | | | 1.72 | | | | 35 | |
Year ended 12/31/16 | | | 11.42 | | | | 0.20 | | | | (0.08 | ) | | | 0.12 | | | | (0.21 | ) | | | 11.33 | | | | 1.00 | | | | 205,010 | | | | 0.98 | | | | 0.98 | | | | 1.68 | | | | 31 | |
Year ended 12/31/15 | | | 11.64 | | | | 0.14 | | | | (0.13 | ) | | | 0.01 | | | | (0.23 | ) | | | 11.42 | | | | 0.06 | | | | 195,392 | | | | 1.02 | | | | 1.02 | | | | 1.19 | | | | 59 | |
| (a) | Calculated using average shares outstanding. |
| (b) | Includes adjustments in accordance with accounting principles generally accepted in the United States of America and as such, the net asset value for financial reporting purposes and the returns based upon those net asset values may differ from the net asset value and returns for shareholder transactions. Total returns are not annualized for periods less than one year, if applicable, and do not reflect charges assessed in connection with a variable product, which if included would reduce total returns. |
| (c) | Portfolio turnover is calculated at the fund level and is not annualized for periods less than one year, if applicable. |
| (d) | Ratios are based on average daily net assets (000’s omitted) of $268,124 and $186,434 for Series I and Series II shares, respectively. |
See accompanying Notes to Financial Statements which are an integral part of the financial statements.
Invesco V.I. Government Securities Fund
Notes to Financial Statements
December 31, 2019
NOTE 1–Significant Accounting Policies
Invesco V.I. Government Securities Fund (the “Fund”) is a series portfolio of AIM Variable Insurance Funds (Invesco Variable Insurance Funds) (the “Trust”). The Trust is a Delaware statutory trust registered under the Investment Company Act of 1940, as amended (the “1940 Act”), as anopen-end series management investment company. Information presented in these financial statements pertains only to the Fund. Matters affecting the Fund or each class will be voted on exclusively by the shareholders of the Fund or each class. Current Securities and Exchange Commission (“SEC”) guidance, however, requires participating insurance companies offering separate accounts to vote shares proportionally in accordance with the instructions of the contract owners whose investments are funded by shares of each Fund or class.
The Fund’s investment objective is total return, comprised of current income and capital appreciation.
The Fund currently offers two classes of shares, Series I and Series II, both of which are offered to insurance company separate accounts funding variable annuity contracts and variable life insurance policies (“variable products”).
The Fund is an investment company and accordingly follows the investment company accounting and reporting guidance in accordance with Financial Accounting Standards Board Accounting Standards Codification Topic 946,Financial Services - Investment Companies.
The following is a summary of the significant accounting policies followed by the Fund in the preparation of its financial statements.
| A. | Security Valuations- Securities, including restricted securities, are valued according to the following policy. |
Debt obligations (including convertible securities) and unlisted equities are fair valued using an evaluated quote provided by an independent pricing service. Evaluated quotes provided by the pricing service may be determined without exclusive reliance on quoted prices, and may reflect appropriate factors such asinstitution-size trading in similar groups of securities, developments related to specific securities, dividend rate (for unlisted equities), yield (for debt obligations), quality, type of issue, coupon rate (for debt obligations), maturity (for debt obligations), individual trading characteristics and other market data. Pricing services generally value debt obligations assuming orderly transactions of institutional round lot size, but a fund may hold or transact in the same securities in smaller, odd lot sizes. Odd lots often trade at lower prices than institutional round lots. Debt obligations are subject to interest rate and credit risks. In addition, all debt obligations involve some risk of default with respect to interest and/or principal payments.
A security listed or traded on an exchange (except convertible securities) is valued at its last sales price or official closing price as of the close of the customary trading session on the exchange where the security is principally traded, or lacking any sales or official closing price on a particular day, the security may be valued at the closing bid price on that day. Securities traded in theover-the-counter market are valued based on prices furnished by independent pricing services or market makers. When such securities are valued by an independent pricing service they may be considered fair valued. Futures contracts are valued at the final settlement price set by an exchange on which they are principally traded. Listed options are valued at the mean between the last bid and asked prices from the exchange on which they are principally traded. Options not listed on an exchange are valued by an independent source at the mean between the last bid and asked prices. For purposes of determining net asset value (“NAV”) per share, futures and option contracts generally are valued 15 minutes after the close of the customary trading session of the New York Stock Exchange (“NYSE”).
Investments inopen-end andclosed-end registered investment companies that do not trade on an exchange are valued at theend-of-day net asset value per share. Investments inopen-end andclosed-end registered investment companies that trade on an exchange are valued at the last sales price or official closing price as of the close of the customary trading session on the exchange where the security is principally traded.
Swap agreements are fair valued using an evaluated quote, if available, provided by an independent pricing service. Evaluated quotes provided by the pricing service are valued based on a model which may includeend-of-day net present values, spreads, ratings, industry, company performance and returns of referenced assets. Centrally cleared swap agreements are valued at the daily settlement price determined by the relevant exchange or clearinghouse.
Foreign securities’ (including foreign exchange contracts) prices are converted into U.S. dollar amounts using the applicable exchange rates as of the close of the NYSE. If market quotations are available and reliable for foreign exchange-traded equity securities, the securities will be valued at the market quotations. Because trading hours for certain foreign securities end before the close of the NYSE, closing market quotations may become unreliable. If between the time trading ends on a particular security and the close of the customary trading session on the NYSE, events occur that the investment adviser determines are significant and make the closing price unreliable, the Fund may fair value the security. If the event is likely to have affected the closing price of the security, the security will be valued at fair value in good faith using procedures approved by the Board of Trustees. Adjustments to closing prices to reflect fair value may also be based on a screening process of an independent pricing service to indicate the degree of certainty, based on historical data, that the closing price in the principal market where a foreign security trades is not the current value as of the close of the NYSE. Foreign securities’ prices meeting the approved degree of certainty that the price is not reflective of current value will be priced at the indication of fair value from the independent pricing service. Multiple factors may be considered by the independent pricing service in determining adjustments to reflect fair value and may include information relating to sector indices, American Depositary Receipts and domestic and foreign index futures. Foreign securities may have additional risks including exchange rate changes, potential for sharply devalued currencies and high inflation, political and economic upheaval, the relative lack of issuer information, relatively low market liquidity and the potential lack of strict financial and accounting controls and standards.
Securities for which market prices are not provided by any of the above methods may be valued based upon quotes furnished by independent sources. The last bid price may be used to value equity securities. The mean between the last bid and asked prices is used to value debt obligations, including corporate loans.
Securities for which market quotations are not readily available or became unreliable are valued at fair value as determined in good faith by or under the supervision of the Trust’s officers following procedures approved by the Board of Trustees. Issuer specific events, market trends, bid/asked quotes of brokers and information providers and other market data may be reviewed in the course of making a good faith determination of a security’s fair value.
The Fund may invest in securities that are subject to interest rate risk, meaning the risk that the prices will generally fall as interest rates rise and, conversely, the prices will generally rise as interest rates fall. Specific securities differ in their sensitivity to changes in interest rates
Invesco V.I. Government Securities Fund
depending on their individual characteristics. Changes in interest rates may result in increased market volatility, which may affect the value and/or liquidity of certain Fund investments.
Valuations change in response to many factors including the historical and prospective earnings of the issuer, the value of the issuer’s assets, general economic conditions, interest rates, investor perceptions and market liquidity. Because of the inherent uncertainties of valuation, the values reflected in the financial statements may materially differ from the value received upon actual sale of those investments.
| B. | Securities Transactions and Investment Income -Securities transactions are accounted for on a trade date basis. Realized gains or losses on sales are computed on the basis of specific identification of the securities sold. Interest income (net of withholding tax, if any) is recorded on the accrual basis from settlement date. Bond premiums and discounts are amortized and/or accreted over the lives of the respective securities.Pay-in-kind interest income andnon-cash dividend income received in the form of securitiesin-lieu of cash are recorded at the fair value of the securities received. Paydown gains and losses on mortgage and asset-backed securities are recorded as adjustments to interest income. Dividend income (net of withholding tax, if any) is recorded on theex-dividend date. |
The Fund may periodically participate in litigation related to Fund investments. As such, the Fund may receive proceeds from litigation settlements. Any proceeds received are included in the Statement of Operations as realized gain (loss) for investments no longer held and as unrealized gain (loss) for investments still held.
Brokerage commissions and mark ups are considered transaction costs and are recorded as an increase to the cost basis of securities purchased and/or a reduction of proceeds on a sale of securities. Such transaction costs are included in the determination of net realized and unrealized gain (loss) from investment securities reported in the Statement of Operations and the Statement of Changes in Net Assets and the net realized and unrealized gains (losses) on securities per share in the Financial Highlights. Transaction costs are included in the calculation of the Fund’s net asset value and, accordingly, they reduce the Fund’s total returns. These transaction costs are not considered operating expenses and are not reflected in net investment income reported in the Statement of Operations and the Statement of Changes in Net Assets, or the net investment income per share and the ratios of expenses and net investment income reported in the Financial Highlights, nor are they limited by any expense limitation arrangements between the Fund and the investment adviser.
The Fund allocates income and realized and unrealized capital gains and losses to a class based on the relative net assets of each class.
| C. | Country Determination –For the purposes of making investment selection decisions and presentation in the Schedule of Investments, the investment adviser may determine the country in which an issuer is located and/or credit risk exposure based on various factors. These factors include the laws of the country under which the issuer is organized, where the issuer maintains a principal office, the country in which the issuer derives 50% or more of its total revenues and the country that has the primary market for the issuer’s securities, as well as other criteria. Among the other criteria that may be evaluated for making this determination are the country in which the issuer maintains 50% or more of its assets, the type of security, financial guarantees and enhancements, the nature of the collateral and the sponsor organization. Country of issuer and/or credit risk exposure has been determined to be the United States of America, unless otherwise noted. |
| D. | Distributions -Distributions from net investment income and net realized capital gain, if any, are generally declared and paid to separate accounts of participating insurance companies annually and recorded on theex-dividend date. |
| E. | Federal Income Taxes -The Fund intends to comply with the requirements of Subchapter M of the Internal Revenue Code of 1986, as amended (the “Internal Revenue Code”), necessary to qualify as a regulated investment company and to distribute substantially all of the Fund’s taxable earnings to shareholders. As such, the Fund will not be subject to federal income taxes on otherwise taxable income (including net realized capital gain) that is distributed to shareholders. Therefore, no provision for federal income taxes is recorded in the financial statements. |
The Fund recognizes the tax benefits of uncertain tax positions only when the position is more likely than not to be sustained. Management has analyzed the Fund’s uncertain tax positions and concluded that no liability for unrecognized tax benefits should be recorded related to uncertain tax positions. Management is not aware of any tax positions for which it is reasonably possible that the total amounts of unrecognized tax benefits will change materially in the next 12 months.
The Fund files tax returns in the U.S. Federal jurisdiction and certain other jurisdictions. Generally, the Fund is subject to examinations by such taxing authorities for up to three years after the filing of the return for the tax period.
| F. | Expenses -Fees provided for under the Rule12b-1 plan of a particular class of the Fund and which are directly attributable to that class are charged to the operations of such class. All other expenses are allocated among the classes based on relative net assets. |
| G. | Accounting Estimates -The preparation of financial statements in conformity with accounting principles generally accepted in the United States of America (“GAAP”) requires management to make estimates and assumptions that affect the reported amounts of assets and liabilities at the date of the financial statements and the reported amounts of revenues and expenses during the reporting period including estimates and assumptions related to taxation. Actual results could differ from those estimates by a significant amount. In addition, the Fund monitors for material events or transactions that may occur or become known after theperiod-end date and before the date the financial statements are released to print. |
| H. | Indemnifications -Under the Trust’s organizational documents, each Trustee, officer, employee or other agent of the Trust is indemnified against certain liabilities that may arise out of the performance of their duties to the Fund. Additionally, in the normal course of business, the Fund enters into contracts, including the Fund’s servicing agreements, that contain a variety of indemnification clauses. The Fund’s maximum exposure under these arrangements is unknown as this would involve future claims that may be made against the Fund that have not yet occurred. The risk of material loss as a result of such indemnification claims is considered remote. |
| I. | Treasury Inflation-Protected Securities -The Fund may invest in Treasury Inflation-Protected Securities (“TIPS”). TIPS are fixed income securities whose principal value is periodically adjusted to the rate of inflation. The principal value of TIPS will be adjusted upward or downward, and any increase or decrease in the principal amount of TIPS will be shown asTreasury Inflation-Protected Securities inflation adjustments in the Statement of Operations, even though investors do not receive their principal until maturity. |
| J. | Futures Contracts -The Fund may enter into futures contracts to manage exposure to interest rate, equity and market price movements and/or currency risks. A futures contract is an agreement between two parties (“Counterparties”) to purchase or sell a specified underlying security, currency or commodity (or delivery of a cash settlement price, in the case of an index future) for a fixed price at a future date. The Fund currently invests only in exchange-traded futures and they are standardized as to maturity date and underlying financial instrument. Initial margin deposits required upon entering into futures contracts are satisfied by the segregation of specific securities or cash as collateral at the futures commission merchant (broker). During the period the futures contracts are open, changes in the value of the contracts are recognized as |
Invesco V.I. Government Securities Fund
| | unrealized gains or losses by recalculating the value of the contracts on a daily basis. Subsequent or variation margin payments are received or made depending upon whether unrealized gains or losses are incurred. These amounts are reflected as receivables or payables on the Statement of Assets and Liabilities. When the contracts are closed or expire, the Fund recognizes a realized gain or loss equal to the difference between the proceeds from, or cost of, the closing transaction and the Fund’s basis in the contract. The net realized gain (loss) and the change in unrealized gain (loss) on futures contracts held during the period is included on the Statement of Operations. The primary risks associated with futures contracts are market risk and the absence of a liquid secondary market. If the Fund were unable to liquidate a futures contract and/or enter into an offsetting closing transaction, the Fund would continue to be subject to market risk with respect to the value of the contracts and continue to be required to maintain the margin deposits on the futures contracts. Futures contracts have minimal Counterparty risk since the exchange’s clearinghouse, as Counterparty to all exchange-traded futures, guarantees the futures against default. Risks may exceed amounts recognized in the Statement of Assets and Liabilities. |
| K. | Put Options Purchased -The Fund may purchase put options including options on securities indexes, or foreign currency and/or futures contracts. By purchasing a put option, the Fund obtains the right (but not the obligation) to sell the option’s underlying instrument at a fixed strike price. In return for this right, the Fund pays an option premium. The option’s underlying instrument may be a security, securities index, or a futures contract. |
Additionally, the Fund may enter into an option on a swap agreement, also called a “swaption”. A swaption is an option that gives the buyer the right, but not the obligation, to enter into a swap on a future date in exchange for paying a market-based premium. A receiver swaption gives the owner the right to receive the total return of a specified asset, reference rate or index. Swaptions also include options that allow an existing swap to be terminated or extended by one of the Counterparties.
Put options may be used by the Fund to hedge securities it owns by locking in a minimum price at which the Fund can sell. If security prices fall, the put option could be exercised to offset all or a portion of the Fund’s resulting losses. At the same time, because the maximum the Fund has at risk is the cost of the option, purchasing put options does not eliminate the potential for the Fund to profit from an increase in the value of the securities hedged. Realized and unrealized gains and losses on put options purchased are included in the Statement of Operations as Net realized gain (loss) from and Change in net unrealized appreciation (depreciation) of Investment securities. A risk in buying an option is that the Fund pays a premium whether or not the option is exercised. In addition, there can be no assurance that a liquid secondary market will exist for any option purchased.
| L. | Swap Agreements- The Fund may enter into various swap transactions, including interest rate, total return, index, currency and credit default swap contracts (“CDS”) for investment purposes or to manage interest rate, currency or credit risk. Such transactions are agreements between Counterparties. A swap agreement may be negotiated bilaterally and tradedover-the-counter (“OTC”) between two parties (“uncleared/ OTC”) or, in some instances, must be transacted through a future commission merchant (“FCM”) and cleared through a clearinghouse that serves as a central Counterparty (“centrally cleared swap”). These agreements may contain among other conditions, events of default and termination events, and various covenants and representations such as provisions that require the Fund to maintain apre-determined level of net assets, and/ or provide limits regarding the decline of the Fund’s NAV over specific periods of time. If the Fund were to trigger such provisions and have open derivative positions at that time, the Counterparty may be able to terminate such agreement and request immediate payment in an amount equal to the net liability positions, if any. |
Interest rate, total return, index, and currency swap agreements aretwo-party contracts entered into primarily to exchange the returns (or differentials in rates of returns) earned or realized on particular predetermined investments or instruments. The gross returns to be exchanged or “swapped” between the parties are calculated with respect to a notional amount, i.e., the return on or increase in value of a particular dollar amount invested at a particular interest rate or return of an underlying asset, in a particular foreign currency, or in a “basket” of securities representing a particular index.
In a centrally cleared swap, the Fund’s ultimate Counterparty is a central clearinghouse. The Fund initially will enter into centrally cleared swaps through an executing broker. When a fund enters into a centrally cleared swap, it must deliver to the central Counterparty (via the FCM) an amount referred to as “initial margin.” Initial margin requirements are determined by the central Counterparty, but an FCM may require additional initial margin above the amount required by the central Counterparty. Initial margin deposits required upon entering into centrally cleared swaps are satisfied by cash or securities as collateral at the FCM. Securities deposited as initial margin are designated on the Schedule of Investments and cash deposited is recorded on the Statement of Assets and Liabilities. During the term of a cleared swap agreement, a “variation margin” amount may be required to be paid by the Fund or may be received by the Fund, based on the daily change in price of the underlying reference instrument subject to the swap agreement and is recorded as a receivable or payable for variation margin in the Statement of Assets and Liabilities until the centrally cleared swap is terminated at which time a realized gain or loss is recorded.
A CDS is an agreement between Counterparties to exchange the credit risk of an issuer. A buyer of a CDS is said to buy protection by paying a fixed payment over the life of the agreement and in some situations an upfront payment to the seller of the CDS. If a defined credit event occurs (such as payment default or bankruptcy), the Fund as a protection buyer would cease paying its fixed payment, the Fund would deliver eligible bonds issued by the reference entity to the seller, and the seller would pay the full notional value, or the “par value”, of the referenced obligation to the Fund. A seller of a CDS is said to sell protection and thus would receive a fixed payment over the life of the agreement and an upfront payment, if applicable. If a credit event occurs, the Fund as a protection seller would cease to receive the fixed payment stream, the Fund would pay the buyer “par value” or the full notional value of the referenced obligation, and the Fund would receive the eligible bonds issued by the reference entity. In turn, these bonds may be sold in order to realize a recovery value. Alternatively, the seller of the CDS and its Counterparty may agree to net the notional amount and the market value of the bonds and make a cash payment equal to the difference to the buyer of protection. If no credit event occurs, the Fund receives the fixed payment over the life of the agreement. As the seller, the Fund would effectively add leverage to its portfolio because, in addition to its total net assets, the Fund would be subject to investment exposure on the notional amount of the CDS. In connection with these agreements, cash and securities may be identified as collateral in accordance with the terms of the respective swap agreements to provide assets of value and recourse in the event of default under the swap agreement or bankruptcy/insolvency of a party to the swap agreement. If a Counterparty becomes bankrupt or otherwise fails to perform its obligations due to financial difficulties, the Fund may experience significant delays in obtaining any recovery in a bankruptcy or other reorganization proceeding. The Fund may obtain only limited recovery or may obtain no recovery in such circumstances. The Fund’s maximum risk of loss from Counterparty risk, either as the
Invesco V.I. Government Securities Fund
protection seller or as the protection buyer, is the value of the contract. The risk may be mitigated by having a master netting arrangement between the Fund and the Counterparty and by the designation of collateral by the Counterparty to cover the Fund’s exposure to the Counterparty.
Implied credit spreads represent the current level at which protection could be bought or sold given the terms of the existing CDS contract and serve as an indicator of the current status of the payment/performance risk of the CDS. An implied spread that has widened or increased since entry into the initial contract may indicate a deteriorating credit profile and increased risk of default for the reference entity. A declining or narrowing spread may indicate an improving credit profile or decreased risk of default for the reference entity. Alternatively, credit spreads may increase or decrease reflecting the general tolerance for risk in the credit markets.
An interest rate swap is an agreement between Counterparties pursuant to which the parties exchange a floating rate payment for a fixed rate payment based on a specified notional amount.
Changes in the value of centrally cleared and OTC swap agreements are recognized as unrealized gains (losses) in the Statement of Operations by “marking to market” on a daily basis to reflect the value of the swap agreement at the end of each trading day. Payments received or paid at the beginning of the agreement are reflected as such on the Statement of Assets and Liabilities and may be referred to as upfront payments. The Fund accrues for the fixed payment stream and amortizes upfront payments, if any, on swap agreements on a daily basis with the net amount, recorded as a component of realized gain (loss) on the Statement of Operations. A liquidation payment received or made at the termination of a swap agreement is recorded as realized gain (loss) on the Statement of Operations. The Fund segregates cash or liquid securities having a value at least equal to the amount of the potential obligation of a Fund under any swap transaction. Cash held as collateral is recorded as deposits with brokers on the Statement of Assets and Liabilities. Entering into these agreements involves, to varying degrees, lack of liquidity and elements of credit, market, and Counterparty risk in excess of amounts recognized on the Statement of Assets and Liabilities. Such risks involve the possibility that a swap is difficult to sell or liquidate; the Counterparty does not honor its obligations under the agreement and unfavorable interest rates and market fluctuations. It is possible that developments in the swaps market, including potential government regulation, could adversely affect the Fund’s ability to terminate existing swap agreements or to realize amounts to be received under such agreements. A short position in a security poses more risk than holding the same security long. As there is no limit on how much the price of the security can increase, the Fund’s exposure is unlimited.
Notional amounts of each individual credit default swap agreement outstanding as of December 31, 2019 for which the Fund is the seller of protection are disclosed in the open swap agreements table. These potential amounts would be partially offset by any recovery values of the respective referenced obligations, upfront payments received upon entering into the agreement, or net amounts received from the settlement of buy protection credit default swap agreements entered into by the Fund for the same referenced entity or entities.
| M. | Other Risks -The Fund may invest in obligations issued by agencies and instrumentalities of the U.S. Government that may vary in the level of support they receive from the government. The government may choose not to provide financial support to government sponsored agencies or instrumentalities if it is not legally obligated to do so. In this case, if the issuer defaulted, the Fund may not be able to recover its investment in such issuer from the U.S. Government. Many securities purchased by the Fund are not guaranteed by the U.S. Government. |
| N. | Leverage Risk -Leverage exists when the Fund can lose more than it originally invests because it purchases or sells an instrument or enters into a transaction without investing an amount equal to the full economic exposure of the instrument or transaction. |
| O. | Collateral -To the extent the Fund has designated or segregated a security as collateral and that security is subsequently sold, it is the Fund’s practice to replace such collateral no later than the next business day. |
NOTE 2–Advisory Fees and Other Fees Paid to Affiliates
The Trust has entered into a master investment advisory agreement with Invesco Advisers, Inc. (the “Adviser” or “Invesco”). Under the terms of the investment advisory agreement, the Fund accrues daily and pays monthly an advisory fee to the Adviser based on the annual rate of the Fund’s average daily net assets as follows:
| | | | |
| Average Daily Net Assets | | Rate | |
First $250 million | | | 0.500% | |
Over $250 million | | | 0.450% | |
For the year ended December 31, 2019, the effective advisory fee rate incurred by the Fund was 0.48%.
Under the terms of a mastersub-advisory agreement between the Adviser and each of Invesco Asset Management Deutschland GmbH, Invesco Asset Management Limited, Invesco Asset Management (Japan) Limited, Invesco Hong Kong Limited, Invesco Senior Secured Management, Inc. and Invesco Canada Ltd. and separatesub-advisory agreements with Invesco Capital Management LLC and Invesco Asset Management (India) Private Limited (collectively, the “AffiliatedSub-Advisers”) the Adviser, not the Fund, will pay 40% of the fees paid to the Adviser to any such AffiliatedSub-Adviser(s) that provide(s) discretionary investment management services to the Fund based on the percentage of assets allocated to such AffiliatedSub-Adviser(s).
The Adviser has contractually agreed, through at least June 30, 2020, to waive advisory fees and/or reimburse expenses of all shares to the extent necessary to limit total annual fund operating expenses after fee waiver and/or expense reimbursement (excluding certain items discussed below) of Series I shares to 1.50% and Series II shares to 1.75% of average daily net assets (the “expense limits”). In determining the Adviser’s obligation to waive advisory fees and/or reimburse expenses, the following expenses are not taken into account, and could cause the total annual fund operating expenses after fee waiver and/or expense reimbursement to exceed the numbers reflected above: (1) interest; (2) taxes; (3) dividend expense on short sales; (4) extraordinary ornon-routine items, including litigation expenses; and (5) expenses that the Fund has incurred but did not actually pay because of an expense offset arrangement. Unless Invesco continues the fee waiver agreement, it will terminate on June 30, 2020. During its term, the fee waiver agreement cannot be terminated or amended to increase the expense limits or reduce the advisory fee waiver without approval of the Board of Trustees. The Adviser did not waive fees and/or reimburse expenses during the period under these expense limits.
Further, the Adviser has contractually agreed, through at least June 30, 2021, to waive the advisory fee payable by the Fund in an amount equal to 100% of the net advisory fees the Adviser receives from the affiliated money market funds on investments by the Fund of uninvested cash in such affiliated money market funds.
Invesco V.I. Government Securities Fund
For the year ended December 31, 2019, the Adviser waived advisory fees of $4,102.
The Trust has entered into a master administrative services agreement with Invesco pursuant to which the Fund has agreed to pay Invesco a fee for costs incurred in providing accounting services and fund administrative services to the Fund and to reimburse Invesco for fees paid to insurance companies that have agreed to provide certain administrative services to the Fund. These administrative services provided by the insurance companies may include, among other things: maintenance of master accounts with the Fund; tracking, recording and transmitting net purchase and redemption orders for Fund shares; maintaining and preserving records related to the purchase, redemption and other account activity of variable product owners; distributing copies of Fund documents such as prospectuses, proxy materials and periodic reports, to variable product owners, and responding to inquiries from variable product owners about the Fund. Pursuant to such agreement, for the year ended December 31, 2019, Invesco was paid $64,686 for accounting and fund administrative services and was reimbursed $688,777 for fees paid to insurance companies. Invesco has entered into asub-administration agreement whereby State Street Bank and Trust Company (“SSB”) serves as fund accountant and provides certain administrative services to the Fund. Pursuant to a custody agreement with the Trust on behalf of the Fund, SSB also serves as the Fund’s custodian.
The Trust has entered into a transfer agency and service agreement with Invesco Investment Services, Inc. (“IIS”) pursuant to which the Fund has agreed to pay IIS a fee for providing transfer agency and shareholder services to the Fund and reimburse IIS for certain expenses incurred by IIS in the course of providing such services. For the year ended December 31, 2019, expenses incurred under the agreement are shown in the Statement of Operations asTransfer agent fees.
The Trust has entered into a master distribution agreement with Invesco Distributors, Inc. (“IDI”) to serve as the distributor for the Fund. The Trust has adopted a plan pursuant to Rule12b-1 under the 1940 Act with respect to the Fund’s Series II shares (the “Plan”). The Fund, pursuant to the Plan, pays IDI compensation at the annual rate of 0.25% of the Fund’s average daily net assets of Series II shares. The fees are accrued daily and paid monthly. Of the Plan payments, up to 0.25% of the average daily net assets of the Series II shares may be paid to insurance companies who furnish continuing personal shareholder services to customers who purchase and own Series II shares of the Fund. For the year ended December 31, 2019, expenses incurred under the Plan are detailed in the Statement of Operations asDistribution fees.
Certain officers and trustees of the Trust are officers and directors of the Adviser, IIS and/or IDI.
NOTE 3–Additional Valuation Information
GAAP defines fair value as the price that would be received to sell an asset or paid to transfer a liability in an orderly transaction between market participants at the measurement date, under current market conditions. GAAP establishes a hierarchy that prioritizes the inputs to valuation methods, giving the highest priority to readily available unadjusted quoted prices in an active market for identical assets (Level 1) and the lowest priority to significant unobservable inputs (Level 3), generally when market prices are not readily available or are unreliable. Based on the valuation inputs, the securities or other investments are tiered into one of three levels. Changes in valuation methods may result in transfers in or out of an investment’s assigned level:
| | Level 1 - | Prices are determined using quoted prices in an active market for identical assets. |
| | Level 2 - | Prices are determined using other significant observable inputs. Observable inputs are inputs that other market participants may use in pricing a security. These may include quoted prices for similar securities, interest rates, prepayment speeds, credit risk, yield curves, loss severities, default rates, discount rates, volatilities and others. |
| | Level 3 - | Prices are determined using significant unobservable inputs. In situations where quoted prices or observable inputs are unavailable (for example, when there is little or no market activity for an investment at the end of the period), unobservable inputs may be used. Unobservable inputs reflect the Fund’s own assumptions about the factors market participants would use in determining fair value of the securities or instruments and would be based on the best available information. |
The following is a summary of the tiered valuation input levels, as of December 31, 2019. The level assigned to the securities valuations may not be an indication of the risk or liquidity associated with investing in those securities. Because of the inherent uncertainties of valuation, the values reflected in the consolidated financial statements may materially differ from the value received upon actual sale of those investments.
| | | | | | | | | | | | | | | | |
| | | Level 1 | | | Level 2 | | | Level 3 | | | Total | |
| |
Investments in Securities | | | | | | | | | | | | | | | | |
| |
U.S. Government Sponsored Agency Mortgage-Backed Securities | | $ | — | | | $ | 228,512,216 | | | $ | — | | | $ | 228,512,216 | |
| |
U.S. Treasury Securities | | | — | | | | 143,354,762 | | | | — | | | | 143,354,762 | |
| |
Asset-Backed Securities | | | — | | | | 35,529,894 | | | | — | | | | 35,529,894 | |
| |
U.S. Government Sponsored Agency Securities | | | — | | | | 8,273,117 | | | | — | | | | 8,273,117 | |
| |
U.S. Dollar Denominated Bonds & Notes | | | — | | | | 5,942,377 | | | | — | | | | 5,942,377 | |
| |
Money Market Funds | | | 8,520,491 | | | | — | | | | — | | | | 8,520,491 | |
| |
Total Investments in Securities | | | 8,520,491 | | | | 421,612,366 | | | | — | | | | 430,132,857 | |
| |
| | | | |
Other Investments - Assets* | | | | | | | | | | | | | | | | |
| |
Futures Contracts | | | 300,055 | | | | — | | | | — | | | | 300,055 | |
| |
| | | | |
Other Investments - Liabilities* | | | | | | | | | | | | | | | | |
| |
Futures Contracts | | | (84,298 | ) | | | — | | | | — | | | | (84,298 | ) |
| |
Total Other Investments | | | 215,757 | | | | — | | | | — | | | | 215,757 | |
| |
Total Investments | | $ | 8,736,248 | | | $ | 421,612,366 | | | $ | — | | | $ | 430,348,614 | |
| |
| * | Unrealized appreciation (depreciation). |
Invesco V.I. Government Securities Fund
NOTE 4–Derivative Investments
The Fund may enter into an International Swaps and Derivatives Association Master Agreement (“ISDA Master Agreement”) under which a fund may trade OTC derivatives. An OTC transaction entered into under an ISDA Master Agreement typically involves a collateral posting arrangement, payment netting provisions andclose-out netting provisions. These netting provisions allow for reduction of credit risk through netting of contractual obligations. The enforceability of the netting provisions of the ISDA Master Agreement depends on the governing law of the ISDA Master Agreement, among other factors.
For financial reporting purposes, the Fund does not offset OTC derivative assets or liabilities that are subject to ISDA Master Agreements in the Statement of Assets and Liabilities.
Value of Derivative Investments atPeriod-End
The table below summarizes the value of the Fund’s derivative investments, detailed by primary risk exposure, held as of December 31, 2019:
| | | | |
| | | Value | |
| | | | |
| Derivative Assets | | Interest
Rate Risk | |
| |
Unrealized appreciation on futures contracts – Exchange-Traded(a) | | $ | 300,055 | |
| |
Derivatives not subject to master netting agreements | | | (300,055 | ) |
| |
Total Derivative Assets subject to master netting agreements | | $ | - | |
| |
| |
| | | Value | |
| | | | |
| Derivative Liabilities | | Interest
Rate Risk | |
| |
Unrealized depreciation on futures contracts – Exchange-Traded(a) | | $ | (84,298 | ) |
| |
Derivatives not subject to master netting agreements | | | 84,298 | |
| |
Total Derivative Liabilities subject to master netting agreements | | $ | - | |
| |
| (a) | The daily variation margin receivable (payable) atperiod-end is recorded in the Statement of Assets and Liabilities. |
Effect of Derivative Investments for the year ended December 31, 2019
The table below summarizes the gains (losses) on derivative investments, detailed by primary risk exposure, recognized in earnings during the period:
| | | | |
| | | Location of Gain (Loss) on
Statement of Operations | |
| | | | |
| | | Interest
Rate Risk | |
| |
Realized Gain (Loss): | | | | |
Futures contracts | | | $2,609,830 | |
| |
Options purchased(a) | | | (279,125 | ) |
| |
Swap agreements | | | (594,990 | ) |
| |
Change in Net Unrealized Appreciation (Depreciation): | | | | |
Futures contracts | | | (87,353 | ) |
| |
Options purchased(a) | | | 148,784 | |
| |
Swap agreements | | | (325,665 | ) |
| |
Total | | | $1,471,481 | |
| |
| (a) | Options purchased are included in the net realized gain (loss) from investment securities and the change in net unrealized appreciation (depreciation) on investment securities. |
The table below summarizes the average notional value of derivatives held during the period.
| | | | | | | | | | | | |
| | | Futures
Contracts | | | Swaptions
Purchased | | | Swap
Agreements | |
| |
Average notional value | | $ | 111,812,401 | | | $ | 57,000,000 | | | $ | 69,000,000 | |
| |
NOTE 5–Trustees’ and Officers’ Fees and Benefits
Trustees’ and Officers’Fees and Benefits include amounts accrued by the Fund to pay remuneration to certain Trustees and Officers of the Fund. Trustees have the option to defer compensation payable by the Fund, andTrustees’ andOfficers’ Fees andBenefits also include amounts accrued by the Fund to fund such deferred compensation amounts. Those Trustees who defer compensation have the option to select various Invesco Funds in which their deferral accounts shall be deemed to be invested. Finally, certain current Trustees were eligible to participate in a retirement plan that provided for benefits to be paid upon retirement to Trustees over a period of time based on the number of years of service. The Fund may have certain former Trustees who also participate in a retirement plan and receive benefits under such plan.Trustees’ andOfficers’Fees andBenefits include amounts accrued by the Fund to fund such retirement benefits. Obligations under the deferred compensation and retirement plans represent unsecured claims against the general assets of the Fund.
Invesco V.I. Government Securities Fund
NOTE 6–Cash Balances
The Fund is permitted to temporarily carry a negative or overdrawn balance in its account with SSB, the custodian bank. Such balances, if any atperiod-end, are shown in the Statement of Assets and Liabilities under the payable caption Amount due custodian. To compensate the custodian bank for such overdrafts, the overdrawn Fund may either (1) leave funds as a compensating balance in the account so the custodian bank can be compensated by earning the additional interest; or (2) compensate by paying the custodian bank at a rate agreed upon by the custodian bank and Invesco, not to exceed the contractually agreed upon rate.
NOTE 7–Distributions to Shareholders and Tax Components of Net Assets
| | | | | | | | |
Tax Character of Distributions to Shareholders Paid During the Fiscal Years Ended December 31, 2019 and 2018: | |
| | |
| | | 2019 | | | 2018 | |
| |
Ordinary income | | $ | 10,701,619 | | | | $10,383,632 | |
| |
Tax Components of Net Assets atPeriod-End: | | | | | | | | |
| | |
| | | | | | 2019 | |
| |
Undistributed ordinary income | | | | | | $ | 10,364,572 | |
| |
Net unrealized appreciation – investments | | | | | | | 11,116,767 | |
| |
Temporary book/tax differences | | | | | | | (204,294 | ) |
| |
Capital loss carryforward | | | | | | | (16,692,989 | ) |
| |
Shares of beneficial interest | | | | | | | 421,684,363 | |
| |
Total net assets | | | | | | $ | 426,268,419 | |
| |
The difference between book-basis andtax-basis unrealized appreciation (depreciation) is due to differences in the timing of recognition of gains and losses on investments for tax and book purposes. The Fund’s net unrealized appreciation (depreciation) difference is attributable primarily to futures contracts and straddle.
The temporary book/tax differences are a result of timing differences between book and tax recognition of income and/or expenses. The Fund’s temporary book/tax differences are the result of the trustee deferral of compensation and retirement plan benefits.
Capital loss carryforward is calculated and reported as of a specific date. Results of transactions and other activity after that date may affect the amount of capital loss carryforward actually available for the Fund to utilize. Capital losses generated in years beginning after December 22, 2010 can be carried forward for an unlimited period, whereas previous losses expire in eight tax years. Capital losses with an expiration period may not be used to offset capital gains until all net capital losses without an expiration date have been utilized. Capital loss carryforwards with no expiration date will retain their character as either short-term or long-term capital losses instead of as short-term capital losses as under prior law. The ability to utilize capital loss carryforwards in the future may be limited under the Internal Revenue Code and related regulations based on the results of future transactions.
The Fund has a capital loss carryforward as of December 31, 2019, as follows:
| | | | | | | | | | | | | | |
| Capital Loss Carryforward | |
| |
| Expiration | | | | Short-Term | | | Long-Term | | | Total | |
| |
Not subject to expiration | | | | $ | 7,872,584 | | | $ | 8,820,405 | | | $ | 16,692,989 | |
| |
NOTE 8–Investment Transactions
The aggregate amount of investment securities (other than short-term securities, U.S. Treasury obligations and money market funds, if any) purchased and sold by the Fund during the year ended December 31, 2019 was $19,172,875 and $20,060,800, respectively. During the same period, purchases and sales of U.S. Treasury obligations were $137,421,227 and $207,449,714, respectively. Cost of investments, including any derivatives, on a tax basis includes the adjustments for financial reporting purposes as of the most recently completed federal income tax reportingperiod-end.
| | | | |
| Unrealized Appreciation (Depreciation) of Investments on a Tax Basis | |
| |
Aggregate unrealized appreciation of investments | | $ | 11,717,069 | |
| |
Aggregate unrealized (depreciation) of investments | | | (600,302 | ) |
| |
Net unrealized appreciation of investments | | $ | 11,116,767 | |
| |
| |
Cost of investments for tax purposes is $419,231,847. | | | | |
Invesco V.I. Government Securities Fund
NOTE 9–Reclassification of Permanent Differences
Primarily as a result of differing book/tax treatment of paydowns, on December 31, 2019, undistributed net investment income was increased by $1,058,037 and undistributed net realized gain (loss) was decreased by $1,058,037. This reclassification had no effect on the net assets or the distributable earnings of the Fund.
NOTE 10–Share Information
| | | | | | | | | | | | | | | | |
| | | Summary of Share Activity | |
| |
| | | Year ended
December 31, 2019(a) | | | Year ended
December 31, 2018 | |
| | | | | | | | |
| | | Shares | | | Amount | | | Shares | | | Amount | |
| |
Sold: | | | | | | | | | | | | | | | | |
Series I | | | 3,053,546 | | | $ | 35,296,652 | | | | 3,593,416 | | | $ | 40,500,688 | |
| |
Series II | | | 1,618,892 | | | | 18,750,084 | | | | 1,057,433 | | | | 11,758,788 | |
| |
Issued as reinvestment of dividends: | | | | | | | | | | | | | | | | |
Series I | | | 571,278 | | | | 6,666,815 | | | | 594,971 | | | | 6,550,635 | |
| |
Series II | | | 348,730 | | | | 4,034,804 | | | | 351,007 | | | | 3,832,997 | |
| |
Reacquired: | | | | | | | | | | | | | | | | |
Series I | | | (6,860,415 | ) | | | (79,176,063 | ) | | | (7,180,556 | ) | | | (80,399,602 | ) |
| |
Series II | | | (4,004,398 | ) | | | (46,219,666 | ) | | | (2,482,818 | ) | | | (27,534,952 | ) |
| |
Net increase (decrease) in share activity | | | (5,272,367 | ) | | $ | (60,647,374 | ) | | | (4,066,547 | ) | | $ | (45,291,446 | ) |
| |
| (a) | There are entities that are record owners of more than 5% of the outstanding shares of the Fund and in the aggregate own 81% of the outstanding shares of the Fund. The Fund and the Fund’s principal underwriter or adviser, are parties to participation agreements with these entities whereby these entities sell units of interest in separate accounts funding variable products that are invested in the Fund. The Fund, Invesco and/or Invesco affiliates may make payments to these entities, which are considered to be related to the Fund, for providing services to the Fund, Invesco and/or Invesco affiliates including but not limited to services such as, securities brokerage, third party record keeping and account servicing and administrative services. The Fund has no knowledge as to whether all or any portion of the shares owned of record by these entities are also owned beneficially. |
Invesco V.I. Government Securities Fund
Report of Independent Registered Public Accounting Firm
To the Board of Trustees of AIM Variable Insurance Funds (Invesco Variable Insurance Funds) and Shareholders of Invesco V.I. Government Securities Fund
Opinion on the Financial Statements
We have audited the accompanying statement of assets and liabilities, including the schedule of investments, of Invesco V.I. Government Securities Fund (one of the funds constituting AIM Variable Insurance Funds (Invesco Variable Insurance Funds), referred to hereafter as the “Fund”) as of December 31, 2019, the related statement of operations for the year ended December 31, 2019, the statement of changes in net assets for each of the two years in the period ended December 31, 2019, including the related notes, and the financial highlights for each of the five years in the period ended December 31, 2019 (collectively referred to as the “financial statements”). In our opinion, the financial statements present fairly, in all material respects, the financial position of the Fund as of December 31, 2019, the results of its operations for the year then ended, the changes in its net assets for each of the two years in the period ended December 31, 2019 and the financial highlights for each of the five years in the period ended December 31, 2019 in conformity with accounting principles generally accepted in the United States of America.
Basis for Opinion
These financial statements are the responsibility of the Fund’s management. Our responsibility is to express an opinion on the Fund’s financial statements based on our audits. We are a public accounting firm registered with the Public Company Accounting Oversight Board (United States) (PCAOB) and are required to be independent with respect to the Fund in accordance with the U.S. federal securities laws and the applicable rules and regulations of the Securities and Exchange Commission and the PCAOB.
We conducted our audits of these financial statements in accordance with the standards of the PCAOB. Those standards require that we plan and perform the audit to obtain reasonable assurance about whether the financial statements are free of material misstatement, whether due to error or fraud.
Our audits included performing procedures to assess the risks of material misstatement of the financial statements, whether due to error or fraud, and performing procedures that respond to those risks. Such procedures included examining, on a test basis, evidence regarding the amounts and disclosures in the financial statements. Our audits also included evaluating the accounting principles used and significant estimates made by management, as well as evaluating the overall presentation of the financial statements. Our procedures included confirmation of securities owned as of December 31, 2019 by correspondence with the custodian, transfer agent and brokers; when replies were not received from brokers, we performed other auditing procedures. We believe that our audits provide a reasonable basis for our opinion.
/s/PricewaterhouseCoopers LLP
Houston, Texas
February 18, 2020
We have served as the auditor of one or more of the investment companies in the Invesco group of investment companies since at least 1995. We have not been able to determine the specific year we began serving as auditor.
Calculating your ongoing Fund expenses
Example
As a shareholder of the Fund, you incur ongoing costs, including management fees; distribution and/or service fees(12b-1); and other Fund expenses. This example is intended to help you understand your ongoing costs (in dollars) of investing in the Fund and to compare these costs with ongoing costs of investing in other mutual funds. The example is based on an investment of $1,000 invested at the beginning of the period and held for the entire period July 1, 2019 through December 31, 2019.
The actual and hypothetical expenses in the examples below do not represent the effect of any fees or other expenses assessed in connection with a variable product; if they did, the expenses shown would be higher while the ending account values shown would be lower.
Actual expenses
The table below provides information about actual account values and actual expenses. You may use the information in this table, together with the amount you invested, to estimate the expenses that you paid over the period. Simply divide your account value by $1,000 (for example, an $8,600 account value divided by $1,000 = 8.6), then multiply the result by the number in the table under the heading entitled “Actual Expenses Paid During Period” to estimate the expenses you paid on your account during this period.
Hypothetical example for comparison purposes
The table below also provides information about hypothetical account values and hypothetical expenses based on the Fund’s actual expense ratio and an assumed rate of return of 5% per year before expenses, which is not the Fund’s actual return.
The hypothetical account values and expenses may not be used to estimate the actual ending account balance or expenses you paid for the period. You may use this information to compare the ongoing costs of investing in the Fund and other funds. To do so, compare this 5% hypothetical example with the 5% hypothetical examples that appear in the shareholder reports of the other funds.
Please note that the expenses shown in the table are meant to highlight your ongoing costs. Therefore, the hypothetical information is useful in comparing ongoing costs, and will not help you determine the relative total costs of owning different funds.
| | | | | | | | | | | | | | | | | | | | | | | | |
| | | Beginning
Account Value
(07/01/19) | | | ACTUAL | | | HYPOTHETICAL
(5% annual return before expenses) | | | Annualized
Expense
Ratio | |
| | Ending
Account Value
(12/31/19)1 | | | Expenses
Paid During
Period2 | | | Ending
Account Value
(12/31/19) | | | Expenses
Paid During
Period2 | |
Series I | | | $1,000.00 | | | | $1,015.50 | | | | $3.40 | | | | $1,021.83 | | | | $3.41 | | | | 0.67% | |
Series II | | | 1,000.00 | | | | 1,013.70 | | | | 4.67 | | | | 1,020.57 | | | | 4.69 | | | | 0.92 | |
| 1 | The actual ending account value is based on the actual total return of the Fund for the period July 1, 2019 through December 31, 2019, after actual expenses and will differ from the hypothetical ending account value which is based on the Fund’s expense ratio and a hypothetical annual return of 5% before expenses. |
| 2 | Expenses are equal to the Fund’s annualized expense ratio as indicated above multiplied by the average account value over the period, multiplied by 184/365 to reflect the most recent fiscal half year. |
Invesco V.I. Government Securities Fund
Tax Information
Form1099-DIV, Form1042-S and other year–end tax information provide shareholders with actual calendar year amounts that should be included in their tax returns. Shareholders should consult their tax advisors.
The following distribution information is being provided as required by the Internal Revenue Code or to meet a specific state’s requirement.
The Fund designates the following amounts or, if subsequently determined to be different, the maximum amount allowable for its fiscal year ended December 31, 2019:
| | | | | | |
| | | | | | |
| | Federal and State Income Tax | | | |
| | Corporate Dividends Received Deduction* | | | 0.00 | % |
| | U.S. Treasury Obligations* | | | 34.21 | % |
| | * | The above percentages are based on ordinary income dividends paid to shareholders during the Fund’s fiscal year. |
Invesco V.I. Government Securities Fund
Trustees and Officers
The address of each trustee and officer is AIM Variable Insurance Funds (Invesco Variable Insurance Funds) (the “Trust”), 11 Greenway Plaza, Suite 1000, Houston, Texas 77046-1173. The trustees serve for the life of the Trust, subject to their earlier death, incapacitation, resignation, retirement or removal as more specifically provided in the Trust’s organizational documents. Each officer serves for a one year term or until their successors are elected and qualified. Column two below includes length of time served with predecessor entities, if any.
| | | | | | | | |
Name, Year of Birth and
Position(s)
Held with the Trust | | Trustee
and/or
Officer
Since | | Principal Occupation(s)
During Past 5 Years | | Number of
Funds in
Fund Complex
Overseen by
Trustee | | Other
Directorship(s)
Held by Trustee
During Past 5
Years |
| Interested Person |
| Martin L. Flanagan1 - 1960 Trustee and Vice Chair | | 2007 | | Executive Director, Chief Executive Officer and President, Invesco Ltd. (ultimate parent of Invesco and a global investment management firm); Trustee and Vice Chair, The Invesco Funds; Vice Chair, Investment Company Institute; and Member of Executive Board, SMU Cox School of Business Formerly: Advisor to the Board, Invesco Advisers, Inc. (formerly known as Invesco Institutional (N.A.), Inc.); Chairman and Chief Executive Officer, Invesco Advisers, Inc. (registered investment adviser); Director, Chairman, Chief Executive Officer and President, Invesco Holding Company (US), Inc. (formerly IVZ Inc.) (holding company), Invesco Group Services, Inc. (service provider) and Invesco North American Holdings, Inc. (holding company); Director, Chief Executive Officer and President, Invesco Holding Company Limited (parent of Invesco and a global investment management firm); Director, Invesco Ltd.; Chairman, Investment Company Institute and President,Co-Chief Executive Officer,Co-President, Chief Operating Officer and Chief Financial Officer, Franklin Resources, Inc. (global investment management organization) | | 229 | | None |
| 1 | Mr. Flanagan is considered an interested person (within the meaning of Section 2(a)(19) of the 1940 Act) of the Trust because he is an officer of the Adviser to the Trust, and an officer and a director of Invesco Ltd., ultimate parent of the Adviser. |
Invesco V.I. Government Securities Fund
Trustees and Officers–(continued)
| | | | | | | | |
Name, Year of Birth and
Position(s)
Held with the Trust | | Trustee
and/or
Officer
Since | | Principal Occupation(s)
During Past 5 Years | | Number of
Funds
in
Fund Complex
Overseen by
Trustee | | Other
Directorship(s)
Held by Trustee
During Past 5
Years |
| Independent Trustees |
| Bruce L. Crockett - 1944 Trustee and Chair | | 1993 | | Chairman, Crockett Technologies Associates (technology consulting company) Formerly: Director, Captaris (unified messaging provider); Director, President and Chief Executive Officer, COMSAT Corporation; Chairman, Board of Governors of INTELSAT (international communications company); ACE Limited (insurance company); Independent Directors Council and Investment Company Institute: Member of the Audit Committee, Investment Company Institute; Member of the Executive Committee and Chair of the Governance Committee, Independent Directors Council | | 229 | | Director and Chairman of the Audit Committee, ALPS (Attorneys Liability Protection Society) (insurance company); Director and Member of the Audit Committee and Compensation Committee, Ferroglobe PLC (metallurgical company) |
| David C. Arch - 1945 Trustee | | 2010 | | Chairman of Blistex Inc. (consumer health care products manufacturer); Member, World Presidents’ Organization | | 229 | | Board member of the Illinois Manufacturers’ Association |
| Beth Ann Brown - 1968 Trustee | | 2019 | | Independent Consultant Formerly: Head of Intermediary Distribution, Managing Director, Strategic Relations, Managing Director, Head of National Accounts, Senior Vice President, National Account Manager and Senior Vice President, Key Account Manager, Columbia Management Investment Advisers LLC; Vice President, Key Account Manager, Liberty Funds Distributor, Inc.; and Trustee of certain Oppenheimer Funds | | 229 | | Director, Board of Directors of Caron Engineering Inc.; Advisor, Board of Advisors of Caron Engineering Inc.; President and Director, Acton Shapleigh Youth Conservation Corps (non - profit); and Vice President and Director of Grahamtastic Connection (non- profit) |
| Jack M. Fields - 1952 Trustee | | 1997 | | Chief Executive Officer, Twenty First Century Group, Inc. (government affairs company); and Chairman, Discovery Learning Alliance(non-profit) Formerly: Owner and Chief Executive Officer, Dos Angeles Ranch L.P. (cattle, hunting, corporate entertainment); Director, Insperity, Inc. (formerly known as Administaff) (human resources provider); Chief Executive Officer, Texana Timber LP (sustainable forestry company); Director of Cross Timbers Quail Research Ranch(non-profit); and member of the U.S. House of Representatives | | 229 | | None |
Invesco V.I. Government Securities Fund
Trustees and Officers–(continued)
| | | | | | | | |
Name, Year of Birth and
Position(s)
Held with the Trust | | Trustee
and/or
Officer
Since | | Principal Occupation(s)
During Past 5 Years | | Number of
Funds
in
Fund Complex
Overseen by
Trustee | | Other
Directorship(s)
Held by Trustee
During Past 5
Years |
| Independent Trustees–(continued) |
| Cynthia Hostetler - 1962 Trustee | | 2017 | | Non-Executive Director and Trustee of a number of public and private business corporations Formerly: Director, Aberdeen Investment Funds (4 portfolios); Head of Investment Funds and Private Equity, Overseas Private Investment Corporation; President, First Manhattan Bancorporation, Inc.; Attorney, Simpson Thacher & Bartlett LLP | | 229 | | Vulcan Materials Company (construction materials company); Trilinc Global Impact Fund; Genesee & Wyoming, Inc. (railroads); Artio Global Investment LLC (mutual fund complex); Edgen Group, Inc. (specialized energy and infrastructure products distributor); Investment Company Institute (professional organization); Independent Directors Council (professional organization) |
Eli Jones - 1961 Trustee | | 2016 | | Professor and Dean, Mays Business School - Texas A&M University Formerly: Professor and Dean, Walton College of Business, University of Arkansas and E.J. Ourso College of Business, Louisiana State University; Director, Arvest Bank | | 229 | | Insperity, Inc. (formerly known as Administaff) (human resources provider) |
| Elizabeth Krentzman - 1959 Trustee | | 2019 | | Formerly: Principal and Chief Regulatory Advisor for Asset Management Services and U.S. Mutual Fund Leader of Deloitte & Touche LLP; General Counsel of the Investment Company Institute (trade association); National Director of the Investment Management Regulatory Consulting Practice, Principal, Director and Senior Manager of Deloitte & Touche LLP; Assistant Director of the Division of Investment Management - Office of Disclosure and Investment Adviser Regulation of the U.S. Securities and Exchange Commission and various positions with the Division of Investment Management - Office of Regulatory Policy of the U.S. Securities and Exchange Commission; Associate at Ropes & Gray LLP; Advisory Board Member of the Securities and Exchange Commission Historical Society; and Trustee of certain Oppenheimer Funds | | 229 | | Trustee of the University of Florida National Board Foundation and Audit Committee Member; Member of the Cartica Funds Board of Directors (private investment funds); Member of the University of Florida Law Center Association, Inc. Board of Trustees and Audit Committee Member |
| Anthony J. LaCava, Jr. - 1956 Trustee | | 2019 | | Formerly: Director and Member of the Audit Committee, Blue Hills Bank (publicly traded financial institution) and Managing Partner, KPMG LLP | | 229 | | Blue Hills Bank; Chairman, Bentley University; Member, Business School Advisory Council; and Nominating Committee KPMG LLP |
| Prema Mathai-Davis - 1950 Trustee | | 1998 | | Retired Co-Owner & Partner of Quantalytics Research, LLC, (a FinTech Investment Research Platform for the Self-Directed Investor) | | 229 | | None |
Invesco V.I. Government Securities Fund
Trustees and Officers–(continued)
| | | | | | | | |
Name, Year of Birth and
Position(s)
Held with the Trust | | Trustee
and/or
Officer
Since | | Principal Occupation(s)
During Past 5 Years | | Number of
Funds
in
Fund Complex
Overseen by
Trustee | | Other
Directorship(s)
Held by Trustee
During Past 5
Years |
| Independent Trustees–(continued) |
| Joel W. Motley - 1952 Trustee | | 2019 | | Director of Office of Finance, Federal Home Loan Bank; Member of the Vestry of Trinity Wall Street; Managing Director of Carmona Motley Inc. (privately held financial advisor); Member of the Finance and Budget Committee of the Council on Foreign Relations, Member of the Investment Committee and Board of Human Rights Watch and Member of the Investment Committee and Board of Historic Hudson Valley(non-profit cultural organization) Formerly: Managing Director of Public Capital Advisors, LLC (privately held financial advisor); Managing Director of Carmona Motley Hoffman, Inc. (privately held financial advisor); Trustee of certain Oppenheimer Funds; and Director of Columbia Equity Financial Corp. (privately held financial advisor) | | 229 | | Director of Greenwall Foundation (bioethics research foundation); Member of Board and Investment Committee of The Greenwall Foundation; Director of Southern Africa Legal Services Foundation; Board Member and Investment Committee Member of Pulizer Center for Crisis Reporting(non-profit journalism) |
| Teresa M. Ressel - 1962 Trustee | | 2017 | | Non-executive director and trustee of a number of public and private business corporations Formerly: Chief Financial Officer, Olayan America, The Olayan Group (international investor/commercial/industrial); Chief Executive Officer, UBS Securities LLC; Group Chief Operating Officer, Americas, UBS AG; Assistant Secretary for Management & Budget and CFO, US Department of the Treasury | | 229 | | Atlantic Power Corporation (power generation company); ON Semiconductor Corp. (semiconductor supplier) |
| Ann Barnett Stern - 1957 Trustee | | 2017 | | President and Chief Executive Officer, Houston Endowment Inc. (private philanthropic institution) Formerly: Executive Vice President and General Counsel, Texas Children’s Hospital; Attorney, Beck, Redden and Secrest, LLP; Business Law Instructor, University of St. Thomas; Attorney, Andrews & Kurth LLP | | 229 | | Federal Reserve Bank of Dallas |
| Robert C. Troccoli - 1949 Trustee | | 2016 | | Retired | | 229 | | None |
| Daniel S. Vandivort - 1954 Trustee | | 2019 | | Treasurer, Chairman of the Audit and Finance Committee, and Trustee, Board of Trustees, Huntington Disease Foundation of America; and President, Flyway Advisory Services LLC (consulting and property management) Formerly: Trustee and Governance Chair, of certain Oppenheimer Funds | | 229 | | Chairman and Lead Independent Director, Chairman of the Audit Committee, and Director, Board of Directors, Value Line Funds |
| James D. Vaughn - 1945 Trustee | | 2019 | | Retired Formerly: Managing Partner, Deloitte & Touche LLP; Trustee and Chairman of the Audit Committee, Schroder Funds; Board Member, Mile High United Way, Boys and Girls Clubs, Boy Scouts, Colorado Business Committee for the Arts, Economic Club of Colorado and Metro Denver Network (economic development corporation); and Trustee of certain Oppenheimer Funds | | 229 | | Board member and Chairman of Audit Committee of AMG National Trust Bank; Trustee and Investment Committee member, University of South Dakota Foundation; Board member, Audit Committee Member and past Board Chair, Junior Achievement(non-profit) |
Invesco V.I. Government Securities Fund
Trustees and Officers–(continued)
| | | | | | | | |
Name, Year of Birth and
Position(s)
Held with the Trust | | Trustee
and/or
Officer
Since | | Principal Occupation(s)
During Past 5 Years | | Number of
Funds
in
Fund Complex
Overseen by
Trustee | | Other
Directorship(s)
Held by Trustee
During Past 5 Years |
| Independent Trustees–(continued) |
Christopher L. WIlson - 1957
Trustee, Vice Chair and Chair Designate | | 2017 | | Retired Formerly: Director, TD Asset Management USA Inc. (mutual fund complex) (22 portfolios); Managing Partner, CT2, LLC (investing and consulting firm); President/Chief Executive Officer, Columbia Funds, Bank of America Corporation; President/Chief Executive Officer, CDC IXIS Asset Management Services, Inc.; Principal & Director of Operations, Scudder Funds, Scudder, Stevens & Clark, Inc.; Assistant Vice President, Fidelity Investments | | 229 | | ISO New England, Inc.(non-profit organization managing regional electricity market) |
Invesco V.I. Government Securities Fund
Trustees and Officers–(continued)
| | | | | | | | |
Name, Year of Birth and
Position(s)
Held with the Trust | | Trustee
and/or
Officer
Since | | Principal Occupation(s)
During Past 5 Years | | Number of
Funds in
Fund Complex
Overseen by
Trustee | | Other
Directorship(s)
Held by Trustee
During Past 5
Years |
| Officers |
Sheri Morris - 1964
President, Principal Executive
Officer and Treasurer | | 1999 | | Head of Global Fund Services, Invesco Ltd.; President, Principal Executive Officer and Treasurer, The Invesco Funds; Vice President, Invesco Advisers, Inc. (formerly known as Invesco Institutional (N.A.), Inc.) (registered investment adviser); and Vice President, Invesco Exchange-Traded Fund Trust, Invesco Exchange-Traded Fund Trust II, Invesco India Exchange-Traded Fund Trust, Invesco Actively Managed Exchange-Traded Fund Trust, Invesco Actively Managed Exchange-Traded Commodity Fund Trust and Invesco Exchange-Traded Self-Indexed Fund Trust; and Vice President, OppenheimerFunds, Inc. Formerly: Vice President and Principal Financial Officer, The Invesco Funds; Vice President, Invesco AIM Advisers, Inc., Invesco AIM Capital Management, Inc. and Invesco AIM Private Asset Management, Inc.; Assistant Vice President and Assistant Treasurer, The Invesco Funds and Assistant Vice President, Invesco Advisers, Inc., Invesco AIM Capital Management, Inc. and Invesco AIM Private Asset Management, Inc.; and Treasurer, Invesco Exchange-Traded Fund Trust, Invesco Exchange-Traded Fund Trust II, Invesco India Exchange-Traded Fund Trust and Invesco Actively Managed Exchange-Traded Fund Trust | | N/A | | N/A |
Russell C. Burk - 1958
Senior Vice President and Senior Officer | | 2005 | | Senior Vice President and Senior Officer, The Invesco Funds | | N/A | | N/A |
Jeffrey H. Kupor - 1968
Senior Vice President, Chief Legal Officer and Secretary | | 2018 | | Head of Legal of the Americas, Invesco Ltd.; Senior Vice President and Secretary, Invesco Advisers, Inc. (formerly known as Invesco Institutional (N.A.), Inc.) (registered investment adviser); Senior Vice President and Secretary, Invesco Distributors, Inc. (formerly known as Invesco AIM Distributors, Inc.); Vice President and Secretary, Invesco Investment Services, Inc. (formerly known as Invesco AIM Investment Services, Inc.) Senior Vice President, Chief Legal Officer and Secretary, The Invesco Funds; Secretary and General Counsel, Invesco Investment Advisers LLC (formerly known as Van Kampen Asset Management); Secretary and General Counsel, Invesco Capital Markets, Inc. (formerly known as Van Kampen Funds Inc.) and Chief Legal Officer, Invesco Exchange-Traded Fund Trust, Invesco Exchange-Traded Fund Trust II, Invesco India Exchange-Traded Fund Trust, Invesco Actively Managed Exchange-Traded Fund Trust, Invesco Actively Managed Exchange-Traded Commodity Fund Trust and Invesco Exchange-Traded Self-Indexed Fund Trust; Secretary, Invesco Indexing LLC; Secretary, W.L. Ross & Co., LLC Formerly: Secretary and Vice President, Jemstep, Inc.; Head of Legal, Worldwide Institutional, Invesco Ltd.; Secretary and General Counsel, INVESCO Private Capital Investments, Inc.; Senior Vice President, Secretary and General Counsel, Invesco Management Group, Inc. (formerly known as Invesco AIM Management Group, Inc.); Assistant Secretary, INVESCO Asset Management (Bermuda) Ltd.; Secretary and General Counsel, Invesco Private Capital, Inc.; Assistant Secretary and General Counsel, INVESCO Realty, Inc.; Secretary and General Counsel, Invesco Senior Secured Management, Inc.; and Secretary, Sovereign G./P. Holdings Inc. | | N/A | | N/A |
Andrew R. Schlossberg - 1974
Senior Vice President | | 2019 | | Head of the Americas and Senior Managing Director, Invesco Ltd.; Director and Senior Vice President, Invesco Advisers, Inc. (formerly known as Invesco Institutional (N.A.), Inc.) (registered investment adviser); Director and Chairman, Invesco Investment Services, Inc. (formerly known as Invesco AIM Investment Services, Inc.) (registered transfer agent); Senior Vice President, The Invesco Funds; Director, Invesco Investment Advisers LLC (formerly known as Van Kampen Asset Management); Director, President and Chairman, Invesco Insurance Agency, Inc. Formerly: Director, Invesco UK Limited; Director and Chief Executive, Invesco Asset Management Limited and Invesco Fund Managers Limited; Assistant Vice President, The Invesco Funds; Senior Vice President, Invesco Advisers, Inc. (formerly known as Invesco Institutional (N.A.), Inc.) (registered investment adviser); Director and Chief Executive, Invesco Administration Services Limited and Invesco Global Investment Funds Limited; Director, Invesco Distributors, Inc.; Head of EMEA, Invesco Ltd.; President, Invesco Actively Managed Exchange-Traded Commodity Fund Trust, Invesco Actively Managed Exchange-Traded Fund Trust, Invesco Exchange-Traded Fund Trust, Invesco Exchange-Traded Fund Trust II and Invesco India Exchange-Traded Fund Trust; Managing Director and Principal Executive Officer, Invesco Capital Management LLC | | N/A | | N/A |
Invesco V.I. Government Securities Fund
Trustees and Officers–(continued)
| | | | | | | | |
Name, Year of Birth and
Position(s)
Held with the Trust | | Trustee
and/or
Officer
Since | | Principal Occupation(s)
During Past 5 Years | | Number of
Funds in
Fund Complex
Overseen by
Trustee | | Other
Directorship(s)
Held by Trustee
During Past 5 Years |
| Officers–(continued) |
John M. Zerr - 1962
Senior Vice President | | 2006 | | Chief Operating Officer of the Americas; Senior Vice President, Invesco Advisers, Inc. (formerly known as Invesco Institutional (N.A.), Inc.) (registered investment adviser); Senior Vice President, Invesco Distributors, Inc. (formerly known as Invesco AIM Distributors, Inc.); Director and Vice President, Invesco Investment Services, Inc. (formerly known as Invesco AIM Investment Services, Inc.) Senior Vice President, The Invesco Funds; Managing Director, Invesco Capital Management LLC; Director, Invesco Investment Advisers LLC (formerly known as Van Kampen Asset Management); Senior Vice President, Invesco Capital Markets, Inc. (formerly known as Van Kampen Funds Inc.); Manager, Invesco Indexing LLC; Manager, Invesco Specialized Products, LLC; Director and Senior Vice President, Invesco Insurance Agency, Inc.; Member, Invesco Canada Funds Advisory Board; Director, President and Chief Executive Officer, Invesco Corporate Class Inc. (corporate mutual fund company); and Director, Chairman, President and Chief Executive Officer, Invesco Canada Ltd. (formerly known as Invesco Trimark Ltd./Invesco Trimark Ltèe) (registered investment adviser and registered transfer agent) Formerly: Director and Senior Vice President, Invesco Management Group, Inc. (formerly known as Invesco AIM Management Group, Inc.); Secretary and General Counsel, Invesco Management Group, Inc. (formerly known as Invesco AIM Management Group, Inc.); Secretary, Invesco Investment Services, Inc. (formerly known as Invesco AIM Investment Services, Inc.); Chief Legal Officer and Secretary, The Invesco Funds; Secretary and General Counsel, Invesco Investment Advisers LLC (formerly known as Van Kampen Asset Management); Secretary and General Counsel, Invesco Capital Markets, Inc. (formerly known as Van Kampen Funds Inc.); Chief Legal Officer, Invesco Exchange-Traded Fund Trust, Invesco Exchange-Traded Fund Trust II, Invesco India Exchange-Traded Fund Trust, Invesco Actively Managed Exchange-Traded Fund Trust, Invesco Actively Managed Exchange-Traded Commodity Fund Trust and Invesco Exchange-Traded Self-Indexed Fund Trust; Secretary, Invesco Indexing LLC; Director, Secretary, General Counsel and Senior Vice President, Van Kampen Exchange Corp.; Director, Vice President and Secretary, IVZ Distributors, Inc. (formerly known as INVESCO Distributors, Inc.); Director and Vice President, INVESCO Funds Group, Inc.; Director and Vice President, Van Kampen Advisors Inc.; Director, Vice President, Secretary and General Counsel, Van Kampen Investor Services Inc.;Director and Secretary, Invesco Distributors, Inc. (formerly known as Invesco AIM Distributors, Inc.); Director, Senior Vice President, General Counsel and Secretary, Invesco AIM Advisers, Inc. and Van Kampen Investments Inc.; Director, Vice President and Secretary, Fund Management Company; Director, Senior Vice President, Secretary, General Counsel and Vice President, Invesco AIM Capital Management, Inc.; Chief Operating Officer and General Counsel, Liberty Ridge Capital, Inc. (an investment adviser) | | N/A | | N/A |
Gregory G. McGreevey - 1962
Senior Vice President | | 2012 | | Senior Managing Director, Invesco Ltd.; Director, Chairman, President, and Chief Executive Officer, Invesco Advisers, Inc. (formerly known as Invesco Institutional (N.A.), Inc.) (registered investment adviser); Director, Invesco Mortgage Capital, Inc. and Invesco Senior Secured Management, Inc.; and Senior Vice President, The Invesco Funds; and President, SNW Asset Management Corporation Formerly: Senior Vice President, Invesco Management Group, Inc. and Invesco Advisers, Inc.; Assistant Vice President, The Invesco Funds | | N/A | | N/A |
Kelli Gallegos - 1970
Vice President, Principal Financial Officer and Assistant Treasurer | | 2008 | | Principal Financial and Accounting Officer – Investments Pool, Invesco Specialized Products, LLC; Vice President, Principal Financial Officer and Assistant Treasurer, The Invesco Funds; Principal Financial and Accounting Officer – Pooled Investments, Invesco Capital Management LLC; Vice President and Treasurer, Invesco Exchange-Traded Fund Trust, Invesco Exchange-Traded Fund Trust II, Invesco India Exchange-Traded Fund Trust, Invesco Actively Managed Exchange-Traded Fund Trust, Invesco Actively Managed Exchange-Traded Commodity Fund Trust and Invesco Exchange-Traded Self-Indexed Fund Trust Formerly: Assistant Treasurer, Invesco Specialized Products, LLC; Assistant Treasurer, Invesco Exchange-Traded Fund Trust, Invesco Exchange-Traded Fund Trust II, Invesco India Exchange-Traded Fund Trust, Invesco Actively Managed Exchange-Traded Fund Trust, Invesco Actively Managed Exchange-Traded Commodity Fund Trust and Invesco Exchange-Traded Self-Indexed Fund Trust; Assistant Treasurer, Invesco Capital Management LLC; Assistant Vice President, The Invesco Funds | | N/A | | N/A |
Invesco V.I. Government Securities Fund
Trustees and Officers–(continued)
| | | | | | | | |
Name, Year of Birth and
Position(s)
Held with the Trust | | Trustee
and/or
Officer
Since | | Principal Occupation(s)
During Past 5 Years | | Number of
Funds in
Fund Complex
Overseen by
Trustee | | Other
Directorship(s)
Held by Trustee
During Past 5 Years |
| Officers—(continued) |
Crissie M. Wisdom - 1969
Anti-Money Laundering Compliance Officer | | 2013 | | Anti-Money Laundering Compliance Officer, Invesco Advisers, Inc. (formerly known as Invesco Institutional (N.A.), Inc.) (registered investment adviser), Invesco Capital Markets, Inc. (formerly known as Van Kampen Funds Inc.), Invesco Distributors, Inc., Invesco Investment Services, Inc., The Invesco Funds, and Invesco Exchange-Traded Fund Trust, Invesco Exchange-Traded Fund Trust II, Invesco India Exchange-Traded Fund Trust, Invesco Actively Managed Exchange-Traded Fund Trust, Invesco Actively Managed Exchange-Traded Commodity Fund Trust and Invesco Exchange-Traded Self-Indexed Fund Trust; Anti-Money Laundering Compliance Officer and Bank Secrecy Act Officer, INVESCO National Trust Company and Invesco Trust Company; and Fraud Prevention Manager and Controls and Risk Analysis Manager for Invesco Investment Services, Inc. Formerly: Anti-Money Laundering Compliance Officer, Van Kampen Exchange Corp. and Invesco Management Group, Inc. | | N/A | | N/A |
Robert R. Leveille - 1969
Chief Compliance Officer | | 2016 | | Chief Compliance Officer, Invesco Advisers, Inc. (registered investment adviser); and Chief Compliance Officer, The Invesco Funds Formerly: Chief Compliance Officer, Putnam Investments and the Putnam Funds | | N/A | | N/A |
The Statement of Additional Information of the Trust includes additional information about the Fund’s Trustees and is available upon request, without charge, by calling 1.800.959.4246. Please refer to the Fund’s Statement of Additional Information for information on the Fund’ssub-advisers.
| | | | | | |
Office of the Fund 11 Greenway Plaza, Suite 1000 Houston, TX 77046-1173 | | Investment Adviser Invesco Advisers, Inc. 1555 Peachtree Street, N.E. Atlanta, GA 30309 | | Distributor Invesco Distributors, Inc. 11 Greenway Plaza, Suite 1000 Houston, TX 77046-1173 | | Auditors PricewaterhouseCoopers LLP 1000 Louisiana Street, Suite 5800 Houston, TX 77002-5678 |
| | | |
Counsel to the Fund Stradley Ronon Stevens & Young, LLP 2005 Market Street, Suite 2600 Philadelphia, PA 19103-7018 | | Counsel to the Independent Trustees Goodwin Procter LLP 901 New York Avenue, N.W. Washington, D.C. 20001 | | Transfer Agent Invesco Investment Services, Inc. 11 Greenway Plaza, Suite 1000 Houston, TX 77046-1173 | | Custodian State Street Bank and Trust Company 225 Franklin Street
Boston, MA 02110-2801 |
Invesco V.I. Government Securities Fund
| | | | |
| | |
 | | Annual Report to Shareholders | | December 31, 2019 |
| | |
| | Invesco V.I. Growth and Income Fund |

Beginning on January 1, 2021, as permitted by regulations adopted by the Securities and Exchange Commission, the insurance company that offers your variable annuity or variable life insurance contract may no longer send you paper copies of the Fund’s shareholder reports by mail, unless you specifically request paper copies of the reports from the insurance company or your financial intermediary. Instead of delivering paper copies of the report, the insurance company may choose to make the reports available on a website, and will notify you by mail each time a report is posted and provide you with a website link to access the report. Instructions for requesting paper copies will be provided by your insurance company.
If the insurance company offers electronic delivery, you may elect to receive shareholder reports and other communications about the Fund electronically by following the instructions provided by the insurance company or by contacting your financial intermediary. If you already elected to receive shareholder reports electronically, you will not be affected by this change and you need not take any action.
You may elect to receive all future reports in paper free of charge from the insurance company. You can inform the insurance company or your financial intermediary that you wish to continue receiving paper copies of your shareholder reports by following the instructions provided by the insurance company or by contacting your financial intermediary. Your election to receive reports in paper will apply to all portfolio companies available under your contract with the insurance company.
The Fund provides a complete list of its holdings four times in each fiscal year, at the quarter-ends. For the second and fourth quarters, the lists appear in the Fund’s semiannual and annual reports to shareholders. For the first and third quarters, the Fund files the lists with the Securities and Exchange Commission (SEC) as an exhibit to its reports on FormN-PORT. The Fund’s FormN-PORT filings are available on the SEC website, sec.gov. The SEC file numbers for the Fund are811-07452 and033-57340. The Fund’s most recent portfolio holdings, as filed on FormN-PORT, have also been made available to insurance companies issuing variable annuity contracts and variable life insurance policies (“variable products”) that invest in the Fund.
A description of the policies and procedures that the Fund uses to determine how to vote proxies relating to portfolio securities is available without charge, upon request, from our Client Services department at 800 959 4246 or at invesco.com/proxyguidelines. The information is also available on the SEC website, sec.gov.
Information regarding how the Fund voted proxies related to its portfolio securities during the most recent12-month period ended June 30 is available at invesco.com/proxysearch. The information is also available on the SEC website, sec.gov.
Invesco Advisers, Inc. is an investment adviser; it provides investment advisory services to individual and institutional clients and does not sell securities. Invesco Distributors, Inc. is the US distributor for Invesco Ltd.’s retail mutual funds, exchange-traded funds and institutional money market funds. Both are wholly owned, indirect subsidiaries of Invesco Ltd.
This report must be accompanied or preceded by a currently effective Fund prospectus and variable product prospectus, which contain more complete information, including sales charges and expenses. Investors should read each carefully before investing.
| | | | |
| NOT FDIC INSURED | MAY LOSE VALUE | NO BANK GUARANTEE |
| | |
| Invesco Distributors, Inc. | | | | VK-VIGRI-AR-1 |
Management’s Discussion of Fund Performance
| | | | |
| Performance summary | | | | |
For the year ended December 31, 2019, Series I shares of Invesco V.I. Growth and Income Fund (the Fund) underperformed the Russell 1000 Value Index, the Fund’s style-specific benchmark. Your Fund’s long-term performance appears later in this report. | |
| Fund vs. Indexes | | | | |
| Total returns, 12/31/18 to 12/31/19, excluding variable product issuer charges. If variable product issuer charges were included, returns would be lower. | | | | |
| Series I Shares | | | 25.19 | % |
| Series II Shares | | | 24.85 | |
| S&P 500 Indexq(Broad Market Index) | | | 31.49 | |
| Russell 1000 Value Indexq(Style-Specific Index) | | | 26.54 | |
| Lipper VUFLarge-Cap Value Funds Index∎ (Peer Group Index) | | | 26.71 | |
| |
| Source(s):qRIMES Technologies Corp.;∎Lipper Inc. | | | | |
Market conditions and your Fund
Equity markets rallied in the first quarter of 2019, fueled by optimism about a potentialUS-China trade deal and indication that the US Federal Reserve (the Fed) would not raise interest rates in 2019, a surprising shift in monetary policy. The Fed’s more accommodative stance provided a supportive environment for equities and fixed income, even as US economic data were mixed and overseas growth appeared to be slowing. Against this backdrop, the S&P 500 Index posted its best first quarter returns since 1998.
Although the S&P 500 Index posted modest gains for the second quarter of 2019, the US stock market experienced increased volatility. After four consecutive months of rising stock markets, the market sold off in May 2019, along with bond yields and oil prices, as investors weighed the impact of the lingering trade war between the US and China, as well as potential tariffs imposed on Mexico. In addition, economic data showed a slowing domestic and global economy.
Key issues that concerned investors in the second quarter of 2019 carried over into the third quarter. TheUS-China
trade conflict worried investors and stifled business investment, even as the Fed cut interest rates by 0.25% in July and again in September 2019.1 This environment, combined with evidence of slowing global economic growth, fueled market volatility in August 2019. The US Treasury yield curve inverted several times, increasing fears of a possible US recession. As a result, August saw increased risk aversion, with investors crowding into asset classes perceived as safe havens, such as US Treasuries and gold. However, the Fed’s accommodative tone provided some support for risk assets.
Macroeconomic issues that concerned investors in the third quarter of 2019 mostly abated during the fourth quarter, providing the backdrop for strong equity market returns. Risk assets surged higher as a result of a delay in the Brexit agreement until January 2020, optimism that phase one of aUS-China trade deal would be completed and better-than-expected third-quarter corporate earnings results. The US economy rose higher than expected, at 2.1% during the third quarter of 2019.2 During its October meeting, the Fed cut interest rates again
by 0.25% based on business investment and exports remaining weak.1 Investors were also encouraged by a resilient US economy and corporate earnings, putting the US equity market on track for its largest annual rise since 2013.
All sectors within the Russell 1000 Value Index had positive returns for the year, and except for energy, all had double digit returns, with information technology and industrials posting the strongest gains.
Security selection in the financials sector was the largest contributor to the Fund’s performance relative to its style-specific benchmark for the year. Several key relative contributors for the year were concentrated in the banking industry, includingCitigroup,Citizens Financial,PNC FinancialsandBank of America. Following a sharp selloff in the fourth quarter of 2018, banks rebounded in the first quarter of 2019, and performed well throughout 2019 as revenues have generally improved and companies continue to return capital to shareholders through stock buybacks (reducing outstanding shares) and increased dividends.
Good stock selection in the health care, communication services and consumer staples sectors also contributed to the Fund’s performance relative to its style-specific benchmark. Within the health care sector, the Fund’s holdings inCelgeneandJohnson & Johnsonwere strong contributors. During the year, Celgene was acquired byBristol Meyers Squibb(also a fund holding) at a significant premium, and shares of the acquisition target rose sharply following the announcement. We sold Celgene after the bid was announced, and the deal ultimately closed in November. We maintained our holding in Bristol Meyers at the end of the year.
| | | | |
By sector | | | % of total net assets | |
| | | | |
| Financials | | | 26.10% | |
| Health Care | | | 15.45 | |
| Information Technology | | | 10.60 | |
| Energy | | | 10.06 | |
| Consumer Discretionary | | | 8.76 | |
| Consumer Staples | | | 7.90 | |
| Industrials | | | 6.65 | |
| Communication Services | | | 4.25 | |
| Materials | | | 4.06 | |
| Utilities | | | 2.14 | |
| Money Market Funds Plus Other | | | | |
| Assets Less Liabilities | | | 4.03 | |
| | | | |
Top 10 Equity Holdings* | | | | |
% of total net assets | |
| | | | |
| 1. Johnson & Johnson | | | 3.57% | |
| 2. Bank of America Corp. | | | 3.37 | |
3. Philip Morris International, Inc. | | | 3.22 | |
4. American International Group, Inc. | | | 3.05 | |
| 5. Citigroup, Inc. | | | 2.87 | |
| 6. General Motors Co. | | | 2.77 | |
7. PNC Financial Services Group, Inc. (The) | | | 2.54 | |
| 8. Morgan Stanley | | | 2.43 | |
| 9. General Dynamics Corp. | | | 2.16 | |
| 10. Carnival Corp. | | | 2.15 | |
| | | | |
Total Net Assets | | $ | 1.7 billion | |
| |
Total Number of Holdings* | | | 61 | |
The Fund’s holdings are subject to change, and there is no assurance that the Fund will continue to hold any particular security.
*Excluding money market fund holdings, if any.
Data presented here are as of December 31, 2019.
Invesco V.I. Growth and Income Fund
Charter Communicationswas a key absolute and relative (compared to the Fund’s style-specific benchmark) contributor in the communication services sector during the year. The company reported strong revenues during the year as the company focused on adding broadband subscribers to drive future growth. We maintained our position in the company at the end of the year.
Within the consumer staples sector,Mondelezwas a strong absolute and relative (compared to the Fund’s style-specific benchmark) contributor to Fund performance. The company has made progress on its plan to increase profitability, with revenues and earnings growth accelerating during the year. Additionally, the Fund’s lack of exposure to Walgreens Boots Alliance (an underperforming component of the Russell 1000 Value Index) contributed to relative Fund performance.
Given the strong equity market, the Fund’s allocation to cash, although averaging less than 5% for the year, was the Fund’s largest relative detractor compared to its style-specific benchmark.
Security selection in the consumer discretionary sector also detracted from the Fund’s relative performance compared to its style-specific benchmark during the year, due largely toCapri HoldingsandCarnival. Capri Holdings suffered as its Michael Kors brand witnessed declining sales, and reduced its 2020 outlook, However, the company’s Jimmy Choo and Versace brands have shown improvement, and the company is focusing more on accessories which we believe should help boost margins. Shares of cruise operator Carnival declined in June after the company reported a decline in profits and a weaker outlook for the remainder of 2019.
The materials sector also detracted from the Fund’s relative return versus its style-specific benchmark during the year. This was due largely toThe Mosaic Company, a potash and phosphate supplier which announced plans to reduce phosphate production, an intended long-term benefit that has the potential to negatively affect short-term earnings. We liquidated our position in The Mosaic Company during the year.
The Fund held currency forward contracts during the year for the purpose of hedging currency exposure ofnon-US-based companies held in the Fund. These derivatives were not for speculative purposes or leverage, and these positions had a small negative impact on the Fund’s performance relative to its style-specific benchmark for the year.
During the year, we reduced the Fund’s relative overweight exposures to the financials and energy sectors, and increased exposures to the consumer staples, materials and consumer discretionary sectors. At the end of the year, the Fund’s largest overweight exposures relative to the style-specific benchmark were in the information technology, health care and financials sectors, while the largest underweight exposures were in the real estate, utilities and communication services sectors.
As always, we thank you for your investment in Invesco V.I. Growth and Income Fund and for sharing our long-term investment horizon.
1 Source: US Federal Reserve
2 Source: Bureau of Economic Analysis
Portfolio managers:
Brian Jurkash - Lead
Sergio Marcheli
Matthew Titus - Lead
The views and opinions expressed in management’s discussion of Fund performance are those of Invesco Advisers, Inc. These views and opinions are subject to change at any time based on factors such as market and economic conditions. These views and opinions may not be relied upon as investment advice or recommendations, or as an offer for a particular security. The information is not a complete analysis of every aspect of any market, country, industry, security or the Fund. Statements of fact are from sources considered reliable, but Invesco Advisers, Inc. makes no representation or warranty as to their completeness or accuracy. Although historical performance is no guarantee of future results, these insights may help you understand our investment management philosophy.
See important Fund and, if applicable, index disclosures later in this report.
Invesco V.I. Growth and Income Fund
Your Fund’s Long-Term Performance
Results of a $10,000 Investment – Oldest Share Class(es)
Fund and index data from 12/31/09
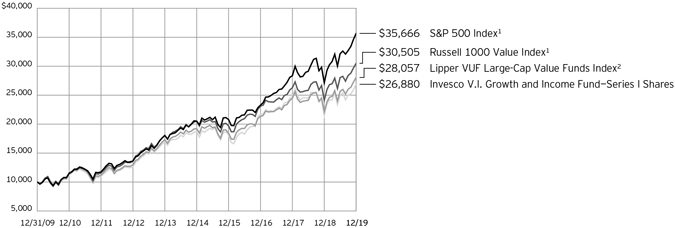
| 1 | Source: RIMES Technologies Corp. |
Past performance cannot guarantee
future results.
| | | | |
| Average Annual Total Returns | |
As of 12/31/19 | | | | |
| |
| Series I Shares | | | | |
| Inception (12/23/96) | | | 8.83% | |
| 10 Years | | | 10.39 | |
| 5 Years | | | 7.54 | |
| 1 Year | | | 25.19 | |
| |
| Series II Shares | | | | |
| Inception (9/18/00) | | | 6.75% | |
| 10 Years | | | 10.11 | |
| 5 Years | | | 7.27 | |
| 1 Year | | | 24.85 | |
Effective June 1, 2010, Class I and Class II shares of the predecessor fund, Van Kampen Life Investment Trust Growth and Income Portfolio, advised by Van Kampen Asset Management were reorganized into Series I and Series II shares, respectively, of Invesco Van Kampen V.I. Growth and Income Fund (renamed Invesco V.I. Growth and Income Fund on April 29, 2013). Returns shown above, prior to June 1, 2010, for Series I and Series II shares are blended returns of the predecessor fund and Invesco V.I. Growth and Income Fund. Share class returns will differ from the predecessor fund because of different expenses.
The performance data quoted represent past performance and cannot guarantee future results; current performance may be lower or higher. Please contact your variable product issuer or financial adviser for the most recentmonth-end variable product performance. Performance figures reflect Fund expenses, reinvested distributions and changes in net asset value.
Performance figures do not reflect deduction of taxes a shareholder would pay on Fund distributions or sale of Fund shares. Investment return and principal value will fluctuate so that you may have a gain or loss when you sell shares.
The total annual Fund operating expense ratio set forth in the most recent Fund prospectus as of the date of this report for Series I and Series II shares was 0.75% and 1.00%, respectively. The expense ratios presented above may vary from the expense ratios presented in other sections of this report that are based on expenses incurred during the period covered by this report.
Invesco V.I. Growth and Income Fund, a series portfolio of AIM Variable Insurance Funds (Invesco Variable Insurance Funds), is currently offered through insurance companies issuing variable products. You cannot purchase shares of the Fund directly. Performance figures given represent the Fund and are not intended to reflect actual variable product values. They do not reflect sales charges, expenses and fees assessed in connection with a variable product. Sales charges, expenses and fees, which are determined by the variable product issuers, will vary and will lower the total return.
The most recentmonth-end performance at the Fund level, excluding variable product charges, is available at 800 451 4246. As mentioned above, for the most recentmonth-end performance including variable product charges, please contact your variable product issuer or financial adviser.
Fund performance reflects any applicable fee waivers and/or expense reimbursements. Had the adviser not waived fees and/or reimbursed expenses currently or in the past, returns would have been lower. See current prospectus for more information.
Invesco V.I. Growth and Income Fund
Invesco V.I. Growth and Income Fund’s investment objective is to seek long-term growth of capital and income.
| ∎ | | Unless otherwise stated, information presented in this report is as of December 31, 2019, and is based on total net assets. |
| ∎ | | Unless otherwise noted, all data provided by Invesco. |
| ∎ | | To access your Fund’s reports/prospectus, visit invesco.com/fundreports. |
About indexes used in this report
| ∎ | | TheS&P 500® Indexis an unmanaged index considered representative of the US stock market. |
| ∎ | | TheRussell 1000® Value Indexis an unmanaged index considered representative oflarge-cap value stocks. The Russell 1000 Value Index is a trademark/service mark of the Frank Russell Co. Russell® is a trademark of the Frank Russell Co. |
| ∎ | | TheLipper VUFLarge-Cap Value Funds Index is an unmanaged index considered representative oflarge-cap value variable insurance underlying funds tracked by Lipper. |
| ∎ | | The Fund is not managed to track the performance of any particular index, including the index(es) described here, and consequently, the performance of the Fund may deviate significantly from the performance of the index(es). |
| ∎ | | A direct investment cannot be made in an index. Unless otherwise indicated, index results include reinvested dividends, and they do not reflect sales charges. Performance of the peer group, if applicable, reflects fund expenses; performance of a market index does not. |
Other information
| ∎ | | The returns shown in management’s discussion of Fund performance are based on net asset values calculated for shareholder transactions. Generally accepted accounting principles require adjustments to be made to the net assets of the Fund at period end for financial reporting purposes, and as such, the net asset values for shareholder transactions and the returns based on those net asset values may differ from the net asset values and returns reported in the Financial Highlights. Additionally, the returns and net asset values shown throughout this report are at the Fund level only and do not include variable product issuer charges. If such charges were included, the total returns would be lower. |
| ∎ | | Industry classifications used in this report are generally according to the Global Industry Classification Standard, which was developed by and is |
| | | the exclusive property and a service mark of MSCI Inc. and Standard & Poor’s. |
Invesco V.I. Growth and Income Fund
Schedule of Investments(a)
December 31, 2019
| | | | | | | | |
| | | Shares | | | Value | |
Common Stocks & Other Equity Interests-95.97% | |
|
| Aerospace & Defense-2.16% | |
| | |
General Dynamics Corp. | | | 208,266 | | | $ | 36,727,709 | |
| |
|
| Apparel, Accessories & Luxury Goods-1.82% | |
| | |
Capri Holdings Ltd.(b) | | | 813,101 | | | | 31,019,803 | |
| |
|
| Automobile Manufacturers-2.77% | |
| | |
General Motors Co. | | | 1,288,226 | | | | 47,149,072 | |
| |
|
| Building Products-1.36% | |
| | |
Johnson Controls International PLC | | | 569,994 | | | | 23,204,456 | |
| |
|
| Cable & Satellite-2.82% | |
| | |
Charter Communications, Inc., Class A(b) | | | 53,863 | | | | 26,127,864 | |
| |
Comcast Corp., Class A | | | 484,979 | | | | 21,809,506 | |
| |
| | | | | | | 47,937,370 | |
| |
|
| Commodity Chemicals-0.95% | |
| | |
Dow, Inc. | | | 295,560 | | | | 16,175,999 | |
| |
|
| Communications Equipment-0.85% | |
| | |
Cisco Systems, Inc. | | | 301,877 | | | | 14,478,021 | |
| |
|
| Diversified Banks-9.02% | |
| | |
Bank of America Corp. | | | 1,628,076 | | | | 57,340,837 | |
| |
Citigroup, Inc. | | | 610,029 | | | | 48,735,217 | |
| |
JPMorgan Chase & Co. | | | 195,905 | | | | 27,309,157 | |
| |
Wells Fargo & Co. | | | 370,587 | | | | 19,937,580 | |
| |
| | | | | | | 153,322,791 | |
| |
|
| Electric Utilities-2.14% | |
| | |
Duke Energy Corp. | | | 128,402 | | | | 11,711,546 | |
| |
Exelon Corp. | | | 284,973 | | | | 12,991,919 | |
| |
FirstEnergy Corp. | | | 239,468 | | | | 11,638,145 | |
| |
| | | | | | | 36,341,610 | |
| |
|
| Fertilizers & Agricultural Chemicals-2.30% | |
| | |
Corteva, Inc. | | | 936,991 | | | | 27,697,454 | |
| |
Nutrien Ltd. (Canada) | | | 239,036 | | | | 11,452,215 | |
| |
| | | | | | | 39,149,669 | |
| |
|
| Food Distributors-1.70% | |
| | |
US Foods Holding Corp.(b) | | | 688,284 | | | | 28,832,217 | |
| |
|
| Health Care Distributors-1.20% | |
| | |
McKesson Corp. | | | 146,890 | | | | 20,317,825 | |
| |
|
| Health Care Equipment-2.49% | |
| | |
Medtronic PLC | | | 180,344 | | | | 20,460,027 | |
| |
Zimmer Biomet Holdings, Inc. | | | 146,575 | | | | 21,939,346 | |
| |
| | | | | | | 42,399,373 | |
| |
|
| Health Care Services-1.51% | |
| | |
CVS Health Corp. | | | 345,129 | | | | 25,639,633 | |
| |
| | | | | | | | |
| | | Shares | | | Value | |
|
| Health Care Supplies-0.75% | |
| | |
Alcon, Inc. (Switzerland)(b) | | | 225,966 | | | $ | 12,800,909 | |
| |
|
| Home Improvement Retail-0.79% | |
| | |
Kingfisher PLC (United Kingdom) | | | 4,617,831 | | | | 13,392,000 | |
| |
|
| Hotels, Resorts & Cruise Lines-2.15% | |
| | |
Carnival Corp. | | | 720,370 | | | | 36,616,407 | |
| |
|
| Industrial Machinery-1.55% | |
| | |
Ingersoll-Rand PLC | | | 198,887 | | | | 26,436,060 | |
| |
|
| Insurance Brokers-1.43% | |
| | |
Willis Towers Watson PLC | | | 120,275 | | | | 24,288,333 | |
| |
|
| Integrated Oil & Gas-4.95% | |
| | |
BP PLC (United Kingdom) | | | 3,953,074 | | | | 24,814,813 | |
| |
Chevron Corp. | | | 210,894 | | | | 25,414,836 | |
| |
Royal Dutch Shell PLC, Class A (United Kingdom) | | | 1,141,517 | | | | 33,931,020 | |
| |
| | | | | | | 84,160,669 | |
| |
|
| Internet & Direct Marketing Retail-1.23% | |
| | |
eBay, Inc. | | | 577,014 | | | | 20,835,976 | |
| |
|
| Investment Banking & Brokerage-4.37% | |
| | |
Goldman Sachs Group, Inc. (The) | | | 143,540 | | | | 33,004,152 | |
| |
Morgan Stanley | | | 806,653 | | | | 41,236,102 | |
| |
| | | | | | | 74,240,254 | |
| |
|
| IT Consulting & Other Services-1.57% | |
| | |
Cognizant Technology Solutions Corp., Class A | | | 430,847 | | | | 26,721,131 | |
| |
|
| Managed Health Care-1.15% | |
| | |
Anthem, Inc. | | | 64,455 | | | | 19,467,344 | |
| |
|
| Multi-line Insurance-3.05% | |
| | |
American International Group, Inc. | | | 1,011,334 | | | | 51,911,774 | |
| |
|
| Oil & Gas Equipment & Services-1.12% | |
| | |
TechnipFMC PLC (United Kingdom) | | | 891,791 | | | | 19,119,999 | |
| |
|
| Oil & Gas Exploration & Production-3.99% | |
| | |
Canadian Natural Resources Ltd. (Canada) | | | 626,257 | | | | 20,255,511 | |
| |
Devon Energy Corp. | | | 829,350 | | | | 21,538,219 | |
| |
Marathon Oil Corp. | | | 1,914,239 | | | | 25,995,366 | |
| |
| | | | | | | 67,789,096 | |
| |
|
| Other Diversified Financial Services-1.93% | |
| | |
AXA Equitable Holdings, Inc. | | | 539,221 | | | | 13,361,897 | |
| |
Voya Financial, Inc. | | | 318,142 | | | | 19,400,299 | |
| |
| | | | | | | 32,762,196 | |
| |
|
| Packaged Foods & Meats-2.98% | |
| | |
Kellogg Co. | | | 259,111 | | | | 17,920,117 | |
| |
See accompanying Notes to Financial Statements which are an integral part of the financial statements.
Invesco V.I. Growth and Income Fund
| | | | | | | | |
| | | Shares | | | Value | |
|
| Packaged Foods & Meats-(continued) | |
| | |
Mondelez International, Inc., Class A | | | 593,939 | | | $ | 32,714,160 | |
| |
| | | | | | | 50,634,277 | |
| |
|
| Pharmaceuticals-8.35% | |
Bristol-Myers Squibb Co. | | | 472,134 | | | | 30,306,281 | |
| |
GlaxoSmithKline PLC (United Kingdom) | | | 536,820 | | | | 12,629,118 | |
| |
Johnson & Johnson | | | 415,950 | | | | 60,674,626 | |
| |
Pfizer, Inc. | | | 406,792 | | | | 15,938,111 | |
| |
Sanofi (France) | | | 223,975 | | | | 22,495,418 | |
| |
| | | | | | | 142,043,554 | |
| |
|
| Railroads-1.57% | |
CSX Corp. | | | 367,768 | | | | 26,611,692 | |
| |
|
| Regional Banks-6.31% | |
Citizens Financial Group, Inc. | | | 819,134 | | | | 33,265,031 | |
| |
PNC Financial Services Group, Inc. (The) | | | 271,033 | | | | 43,264,998 | |
| |
Truist Financial Corp. | | | 544,956 | | | | 30,691,922 | |
| |
| | | | | | | 107,221,951 | |
| |
|
| Semiconductors-4.80% | |
Intel Corp. | | | 603,348 | | | | 36,110,378 | |
| |
NXP Semiconductors N.V. (Netherlands) | | | 156,488 | | | | 19,914,663 | |
| |
QUALCOMM, Inc. | | | 290,664 | | | | 25,645,284 | |
| |
| | | | | | | 81,670,325 | |
| |
|
| Specialty Chemicals-0.81% | |
DuPont de Nemours, Inc. | | | 214,207 | | | | 13,752,089 | |
| |
| | | | | | | | |
| | | Shares | | | Value | |
|
| Systems Software-1.75% | |
Oracle Corp. | | | 561,294 | | | $ | 29,737,356 | |
| |
|
| Technology Hardware, Storage & Peripherals-1.63% | |
Apple, Inc. | | | 94,155 | | | | 27,648,616 | |
| |
|
| Tobacco-3.22% | |
Philip Morris International, Inc. | | | 644,365 | | | | 54,829,018 | |
| |
|
| Wireless Telecommunication Services-1.43% | |
Vodafone Group PLC (United Kingdom) | | | 12,507,253 | | | | 24,281,229 | |
| |
Total Common Stocks & Other Equity Interests (Cost $1,328,500,568) | | | | 1,631,667,803 | |
| |
|
| Money Market Funds-6.08% | |
Invesco Government & Agency Portfolio, Institutional Class, 1.50%(c) | | | 36,165,254 | | | | 36,165,254 | |
| |
Invesco Liquid Assets Portfolio, Institutional Class, 1.71%(c) | | | 25,908,034 | | | | 25,915,806 | |
| |
Invesco Treasury Portfolio, Institutional Class, 1.49%(c) | | | 41,331,718 | | | | 41,331,718 | |
| |
Total Money Market Funds
(Cost $103,413,096) | | | | 103,412,778 | |
| |
TOTAL INVESTMENTS IN SECURITIES-102.05%
(Cost $1,431,913,664) | | | | 1,735,080,581 | |
| |
OTHER ASSETS LESS LIABILITIES-(2.05)% | | | | (34,879,304 | ) |
| |
NET ASSETS-100.00% | | | | $1,700,201,277 | |
| |
Notes to Schedule of Investments:
| (a) | Industry and/or sector classifications used in this report are generally according to the Global Industry Classification Standard, which was developed by and is the exclusive property and a service mark of MSCI Inc. and Standard & Poor’s. |
| (b) | Non-income producing security. |
| (c) | The money market fund and the Fund are affiliated by having the same investment adviser. The rate shown is the 7-day SEC standardized yield as of December 31, 2019. |
| | | | | | | | | | | | | | | | | | | | | | |
| Open Forward Foreign Currency Contracts | |
| |
| Settlement | | | | Contract to | | | Unrealized Appreciation | |
| Date | | Counterparty | | Deliver | | | Receive | | | (Depreciation) | |
| |
| Currency Risk | | | | | | | | | | | | | | | | | | | | | | |
| |
01/17/2020 | | State Street Bank & Trust Co. | | | USD | | | | 314,876 | | | | CAD | | | | 415,479 | | | $ | 5,108 | |
| |
01/17/2020 | | State Street Bank & Trust Co. | | | USD | | | | 166,681 | | | | CHF | | | | 163,237 | | | | 2,120 | |
| |
01/17/2020 | | State Street Bank & Trust Co. | | | USD | | | | 738,219 | | | | EUR | | | | 663,713 | | | | 6,916 | |
| |
01/17/2020 | | State Street Bank & Trust Co. | | | USD | | | | 1,455,688 | | | | GBP | | | | 1,110,149 | | | | 15,410 | |
| |
Subtotal-Appreciation | | | | | | | | | | | | | | | | | | | 29,554 | |
| |
| | | | | |
Currency Risk | | | | | | | | | | | | | | | | | | | | |
| |
01/17/2020 | | Bank of New York Mellon (The) | | | GBP | | | | 29,050,110 | | | | USD | | | | 37,613,792 | | | | (881,528 | ) |
| |
01/17/2020 | | State Street Bank & Trust Co. | | | CAD | | | | 20,109,696 | | | | USD | | | | 15,151,896 | | | | (335,744 | ) |
| |
01/17/2020 | | State Street Bank & Trust Co. | | | CHF | | | | 9,509,465 | | | | USD | | | | 9,609,126 | | | | (224,471 | ) |
| |
01/17/2020 | | State Street Bank & Trust Co. | | | EUR | | | | 15,923,130 | | | | USD | | | | 17,694,361 | | | | (182,163 | ) |
| |
See accompanying Notes to Financial Statements which are an integral part of the financial statements.
Invesco V.I. Growth and Income Fund
| | | | | | | | | | | | | | | | | | | | | | |
| Open Forward Foreign Currency Contracts–(continued) | |
| |
| Settlement | | | | Contract to | | | Unrealized Appreciation | |
| Date | | Counterparty | | Deliver | | | Receive | | | (Depreciation) | |
| |
01/17/2020 | | State Street Bank & Trust Co. | | | GBP | | | | 34,910,663 | | | | USD | | | | 45,320,488 | | | | $ (940,857 | ) |
| |
Subtotal–Depreciation | | | | | | | | | | | | | | | | | | | (2,564,763 | ) |
| |
Total Forward Foreign Currency Contracts | | | | | | | | | | | | | | | | | | | $(2,535,209 | ) |
| |
Abbreviations:
| | |
| CAD | | - Canadian Dollar |
| CHF | | - Swiss Franc |
| EUR | | - Euro |
| GBP | | - British Pound Sterling |
| USD | | - U.S. Dollar |
See accompanying Notes to Financial Statements which are an integral part of the financial statements.
Invesco V.I. Growth and Income Fund
Statement of Assets and Liabilities
December 31, 2019
| | | | |
Assets: | | | | |
| |
Investments in securities, at value
(Cost $1,328,500,568) | | $ | 1,631,667,803 | |
| |
Investments in affiliated money market funds, at value
(Cost $103,413,096) | | | 103,412,778 | |
| |
Other investments: | | | | |
Unrealized appreciation on forward foreign currency contracts outstanding | | | 29,554 | |
| |
Foreign currencies, at value (Cost $846,234) | | | 856,183 | |
| |
Receivable for: | | | | |
Investments sold | | | 18,710 | |
| |
Fund shares sold | | | 777,503 | |
| |
Dividends | | | 2,702,145 | |
| |
Investment for trustee deferred compensation and retirement plans | | | 226,236 | |
| |
Total assets | | | 1,739,690,912 | |
| |
| |
Liabilities: | | | | |
| |
Other investments: | | | | |
Unrealized depreciation on forward foreign currency contracts outstanding | | | 2,564,763 | |
| |
Payable for: | | | | |
Investments purchased | | | 28,011,059 | |
| |
Fund shares reacquired | | | 6,383,822 | |
| |
Amount due custodian | | | 717,282 | |
| |
Accrued fees to affiliates | | | 1,500,654 | |
| |
Accrued trustees’ and officers’ fees and benefits | | | 297 | |
| |
Accrued other operating expenses | | | 62,300 | |
| |
Trustee deferred compensation and retirement plans | | | 249,458 | |
| |
Total liabilities | | | 39,489,635 | |
| |
Net assets applicable to shares outstanding | | $ | 1,700,201,277 | |
| |
| |
Net assets consist of: | | | | |
Shares of beneficial interest | | $ | 1,390,932,962 | |
| |
Distributable earnings | | | 309,268,315 | |
| |
| | $ | 1,700,201,277 | |
| |
| |
Net Assets: | | | | |
Series I | | $ | 187,096,710 | |
| |
Series II | | $ | 1,513,104,567 | |
| |
| |
Shares outstanding, no par value, with an unlimited number of shares authorized: | | | | |
Series I | | | 9,803,091 | |
| |
Series II | | | 79,397,791 | |
| |
Series I: | | | | |
Net asset value per share | | $ | 19.09 | |
| |
Series II: | | | | |
Net asset value per share | | $ | 19.06 | |
| |
Statement of Operations
For the year ended December 31, 2019
| | | | |
Investment income: | | | | |
| |
Dividends (net of foreign withholding taxes of $705,270) | | $ | 38,924,340 | |
| |
Dividends from affiliated money market funds | | | 1,713,295 | |
| |
Total investment income | | | 40,637,635 | |
| |
| |
Expenses: | | | | |
| |
Advisory fees | | | 8,704,724 | |
| |
Administrative services fees | | | 2,450,536 | |
| |
Custodian fees | | | 46,919 | |
| |
Distribution fees - Series II | | | 3,389,283 | |
| |
Transfer agent fees | | | 30,472 | |
| |
Trustees’ and officers’ fees and benefits | | | 38,729 | |
| |
Reports to shareholders | | | 11,659 | |
| |
Professional services fees | | | 81,000 | |
| |
Other | | | 23,174 | |
| |
Total expenses | | | 14,776,496 | |
| |
Less: Fees waived | | | (85,922 | ) |
| |
Net expenses | | | 14,690,574 | |
| |
Net investment income | | | 25,947,061 | |
| |
| |
Realized and unrealized gain (loss) from: | | | | |
| |
Net realized gain (loss) from: | | | | |
Investment securities | | | (8,098,192 | ) |
| |
Foreign currencies | | | 355,860 | |
| |
Forward foreign currency contracts | | | 903,540 | |
| |
| | | (6,838,792 | ) |
| |
Change in net unrealized appreciation (depreciation) of: | | | | |
Investment securities | | | 281,453,547 | |
| |
Foreign currencies | | | 24,902 | |
| |
Forward foreign currency contracts | | | (2,383,293 | ) |
| |
| | | 279,095,156 | |
| |
Net realized and unrealized gain | | | 272,256,364 | |
| |
Net increase in net assets resulting from operations | | $ | 298,203,425 | |
| |
See accompanying Notes to Financial Statements which are an integral part of the financial statements.
Invesco V.I. Growth and Income Fund
Statement of Changes in Net Assets
For the years ended December 31, 2019 and 2018
| | | | | | | | |
| | | 2019 | | | 2018 | |
| |
Operations: | | | | | | | | |
| | |
Net investment income | | $ | 25,947,061 | | | $ | 25,317,518 | |
| |
Net realized gain (loss) | | | (6,838,792 | ) | | | 167,616,765 | |
| |
Change in net unrealized appreciation (depreciation) | | | 279,095,156 | | | | (397,739,484 | ) |
| |
Net increase (decrease) in net assets resulting from operations | | | 298,203,425 | | | | (204,805,201 | ) |
| |
| | |
Distributions to shareholders from distributable earnings: | | | | | | | | |
| | |
Series I | | | (23,474,054 | ) | | | (20,657,576 | ) |
| |
Series II | | | (173,791,397 | ) | | | (184,183,100 | ) |
| |
Total distributions from distributable earnings | | | (197,265,451 | ) | | | (204,840,676 | ) |
| |
| | |
Share transactions-net: | | | | | | | | |
| | |
Series I | | | 4,136,745 | | | | 25,029,084 | |
| |
Series II | | | 343,560,704 | | | | (374,156,431 | ) |
| |
Net increase (decrease) in net assets resulting from share transactions | | | 347,697,449 | | | | (349,127,347 | ) |
| |
Net increase (decrease) in net assets | | | 448,635,423 | | | | (758,773,224 | ) |
| |
| | |
Net assets: | | | | | | | | |
| | |
Beginning of year | | | 1,251,565,854 | | | | 2,010,339,078 | |
| |
End of year | | $ | 1,700,201,277 | | | $ | 1,251,565,854 | |
| |
See accompanying Notes to Financial Statements which are an integral part of the financial statements.
Invesco V.I. Growth and Income Fund
Financial Highlights
The following schedule presents financial highlights for a share of the Fund outstanding throughout the periods indicated.
| | | | | | | | | | | | | | | | | | | | | | | | | | | | | | | | | | | | | | | | | | | | | | | | | | | | | | | | |
| | | Net asset
value,
beginning
of period | | | Net investment
income(a) | | | Net gains
(losses)
on securities
(both realized and unrealized) | | | Total from
investment operations | | | Dividends from net investment income | | | Distributions from net realized
gains | | | Total
distributions | | | Net asset
value, end of period | | | Total
return (b) | | | Net assets,
end of period (000’s omitted) | | | Ratio of
expenses
to average
net assets
with fee waivers
and/or
expenses
absorbed | | | Ratio of
expenses
to average net
assets without fee waivers
and/or
expenses
absorbed | | | Ratio of net investment
income
to average
net assets | | | Portfolio turnover (c) | |
Series I | | | | | | | | | | | | | | | | | | | | | | | | | | | | | | | | | | | | | | | | | | | | | | | | | | | | | | | | |
Year ended 12/31/19 | | | $17.51 | | | | $0.37 | | | | $3.84 | | | | $ 4.21 | | | | $(0.38 | ) | | | $(2.25 | ) | | | $(2.63 | ) | | | $19.09 | | | | 25.19 | % | | | $ 187,097 | | | | 0.73 | %(d) | | | 0.74 | %(d) | | | 1.91 | %(d) | | | 62 | % |
Year ended 12/31/18 | | | 22.70 | | | | 0.36 | | | | (2.95 | ) | | | (2.59 | ) | | | (0.47 | ) | | | (2.13 | ) | | | (2.60 | ) | | | 17.51 | | | | (13.38 | ) | | | 166,306 | | | | 0.75 | | | | 0.75 | | | | 1.63 | | | | 32 | |
Year ended 12/31/17 | | | 21.05 | | | | 0.41 | (e) | | | 2.52 | | | | 2.93 | | | | (0.34 | ) | | | (0.94 | ) | | | (1.28 | ) | | | 22.70 | | | | 14.32 | | | | 187,254 | | | | 0.76 | | | | 0.76 | | | | 1.90 | (e) | | | 17 | |
Year ended 12/31/16 | | | 19.60 | | | | 0.33 | | | | 3.29 | | | | 3.62 | | | | (0.23 | ) | | | (1.94 | ) | | | (2.17 | ) | | | 21.05 | | | | 19.69 | | | | 168,082 | | | | 0.77 | | | | 0.79 | | | | 1.69 | | | | 28 | |
Year ended 12/31/15 | | | 25.15 | | | | 0.33 | | | | (1.30 | ) | | | (0.97 | ) | | | (0.74 | ) | | | (3.84 | ) | | | (4.58 | ) | | | 19.60 | | | | (3.06 | ) | | | 149,066 | | | | 0.78 | | | | 0.84 | | | | 1.41 | | | | 22 | |
Series II | | | | | | | | | | | | | | | | | | | | | | | | | | | | | | | | | | | | | | | | | | | | | | | | | | | | | | | | |
Year ended 12/31/19 | | | 17.48 | | | | 0.32 | | | | 3.83 | | | | 4.15 | | | | (0.32 | ) | | | (2.25 | ) | | | (2.57 | ) | | | 19.06 | | | | 24.85 | | | | 1,513,105 | | | | 0.98 | (d) | | | 0.99 | (d) | | | 1.66 | (d) | | | 62 | |
Year ended 12/31/18 | | | 22.66 | | | | 0.30 | | | | (2.95 | ) | | | (2.65 | ) | | | (0.40 | ) | | | (2.13 | ) | | | (2.53 | ) | | | 17.48 | | | | (13.59 | ) | | | 1,085,260 | | | | 1.00 | | | | 1.00 | | | | 1.38 | | | | 32 | |
Year ended 12/31/17 | | | 21.02 | | | | 0.36 | (e) | | | 2.51 | | | | 2.87 | | | | (0.29 | ) | | | (0.94 | ) | | | (1.23 | ) | | | 22.66 | | | | 14.04 | | | | 1,823,085 | | | | 1.01 | | | | 1.01 | | | | 1.65 | (e) | | | 17 | |
Year ended 12/31/16 | | | 19.58 | | | | 0.28 | | | | 3.28 | | | | 3.56 | | | | (0.18 | ) | | | (1.94 | ) | | | (2.12 | ) | | | 21.02 | | | | 19.37 | | | | 1,838,074 | | | | 1.02 | | | | 1.04 | | | | 1.44 | | | | 28 | |
Year ended 12/31/15 | | | 25.09 | | | | 0.27 | | | | (1.29 | ) | | | (1.02 | ) | | | (0.65 | ) | | | (3.84 | ) | | | (4.49 | ) | | | 19.58 | | | | (3.26 | ) | | | 1,435,111 | | | | 1.03 | | | | 1.09 | | | | 1.16 | | | | 22 | |
| (a) | Calculated using average shares outstanding. |
| (b) | Includes adjustments in accordance with accounting principles generally accepted in the United States of America and as such, the net asset value for financial reporting purposes and the returns based upon those net asset values may differ from the net asset value and returns for shareholder transactions. Total returns are not annualized for periods less than one year, if applicable, and do not reflect charges assessed in connection with a variable product, which if included would reduce total returns. |
| (c) | Portfolio turnover is calculated at the fund level and is not annualized for periods less than one year, if applicable. |
| (d) | Ratios are based on average daily net assets (000’s omitted) of $182,503 and $1,354,720 for Series I and Series II shares, respectively. |
| (e) | Net investment income per share and the ratio of net investment income to average net assets include significant dividends received during the period. Net investment income per share and the ratio of net investment income to average net assets excluding the significant dividends are $0.30 and 1.42%, and $0.25 and 1.17%, for Series I and Series II, respectively. |
See accompanying Notes to Financial Statements which are an integral part of the financial statements.
Invesco V.I. Growth and Income Fund
Notes to Financial Statements
December 31, 2019
NOTE 1–Significant Accounting Policies
Invesco V.I. Growth and Income Fund (the “Fund”) is a series portfolio of AIM Variable Insurance Funds (Invesco Variable Insurance Funds) (the “Trust”). The Trust is a Delaware statutory trust registered under the Investment Company Act of 1940, as amended (the “1940 Act”), as anopen-end series management investment company. Information presented in these financial statements pertains only to the Fund. Matters affecting the Fund or each class will be voted on exclusively by the shareholders of the Fund or each class. Current Securities and Exchange Commission (“SEC”) guidance, however, requires participating insurance companies offering separate accounts to vote shares proportionally in accordance with the instructions of the contract owners whose investments are funded by shares of each Fund or class.
The Fund’s investment objective is to seek long-term growth of capital and income.
The Fund currently offers two classes of shares, Series I and Series II, both of which are offered to insurance company separate accounts funding variable annuity contracts and variable life insurance policies (“variable products”).
The Fund is an investment company and accordingly follows the investment company accounting and reporting guidance in accordance with Financial Accounting Standards Board Accounting Standards Codification Topic 946,Financial Services – Investment Companies.
The following is a summary of the significant accounting policies followed by the Fund in the preparation of its financial statements.
A. Security Valuations– Securities, including restricted securities, are valued according to the following policy.
A security listed or traded on an exchange (except convertible securities) is valued at its last sales price or official closing price as of the close of the customary trading session on the exchange where the security is principally traded, or lacking any sales or official closing price on a particular day, the security may be valued at the closing bid price on that day. Securities traded in theover-the-counter market are valued based on prices furnished by independent pricing services or market makers. When such securities are valued by an independent pricing service they may be considered fair valued. Futures contracts are valued at the final settlement price set by an exchange on which they are principally traded. Listed options are valued at the mean between the last bid and asked prices from the exchange on which they are principally traded. Options not listed on an exchange are valued by an independent source at the mean between the last bid and asked prices. For purposes of determining net asset value (“NAV”) per share, futures and option contracts generally are valued 15 minutes after the close of the customary trading session of the New York Stock Exchange (“NYSE”).
Investments inopen-end andclosed-end registered investment companies that do not trade on an exchange are valued at theend-of-day net asset value per share. Investments inopen-end andclosed-end registered investment companies that trade on an exchange are valued at the last sales price or official closing price as of the close of the customary trading session on the exchange where the security is principally traded.
Debt obligations (including convertible securities) and unlisted equities are fair valued using an evaluated quote provided by an independent pricing service. Evaluated quotes provided by the pricing service may be determined without exclusive reliance on quoted prices, and may reflect appropriate factors such asinstitution-size trading in similar groups of securities, developments related to specific securities, dividend rate (for unlisted equities), yield (for debt obligations), quality, type of issue, coupon rate (for debt obligations), maturity (for debt obligations), individual trading characteristics and other market data. Pricing services generally value debt obligations assuming orderly transactions of institutional round lot size, but a fund may hold or transact in the same securities in smaller, odd lot sizes. Odd lots often trade at lower prices than institutional round lots. Debt obligations are subject to interest rate and credit risks. In addition, all debt obligations involve some risk of default with respect to interest and/or principal payments.
Foreign securities’ (including foreign exchange contracts) prices are converted into U.S. dollar amounts using the applicable exchange rates as of the close of the NYSE. If market quotations are available and reliable for foreign exchange-traded equity securities, the securities will be valued at the market quotations. Because trading hours for certain foreign securities end before the close of the NYSE, closing market quotations may become unreliable. If between the time trading ends on a particular security and the close of the customary trading session on the NYSE, events occur that the investment adviser determines are significant and make the closing price unreliable, the Fund may fair value the security. If the event is likely to have affected the closing price of the security, the security will be valued at fair value in good faith using procedures approved by the Board of Trustees. Adjustments to closing prices to reflect fair value may also be based on a screening process of an independent pricing service to indicate the degree of certainty, based on historical data, that the closing price in the principal market where a foreign security trades is not the current value as of the close of the NYSE. Foreign securities’ prices meeting the approved degree of certainty that the price is not reflective of current value will be priced at the indication of fair value from the independent pricing service. Multiple factors may be considered by the independent pricing service in determining adjustments to reflect fair value and may include information relating to sector indices, American Depositary Receipts and domestic and foreign index futures. Foreign securities may have additional risks including exchange rate changes, potential for sharply devalued currencies and high inflation, political and economic upheaval, the relative lack of issuer information, relatively low market liquidity and the potential lack of strict financial and accounting controls and standards.
Securities for which market prices are not provided by any of the above methods may be valued based upon quotes furnished by independent sources. The last bid price may be used to value equity securities. The mean between the last bid and asked prices is used to value debt obligations, including corporate loans.
Securities for which market quotations are not readily available or became unreliable are valued at fair value as determined in good faith by or under the supervision of the Trust’s officers following procedures approved by the Board of Trustees. Issuer specific events, market trends, bid/asked quotes of brokers and information providers and other market data may be reviewed in the course of making a good faith determination of a security’s fair value.
The Fund may invest in securities that are subject to interest rate risk, meaning the risk that the prices will generally fall as interest rates rise and, conversely, the prices will generally rise as interest rates fall. Specific securities differ in their sensitivity to changes in interest rates depending on their individual characteristics. Changes in interest rates may result in increased market volatility, which may affect the value and/or liquidity of certain Fund investments.
Invesco V.I. Growth and Income Fund
Valuations change in response to many factors including the historical and prospective earnings of the issuer, the value of the issuer’s assets, general economic conditions, interest rates, investor perceptions and market liquidity. Because of the inherent uncertainties of valuation, the values reflected in the financial statements may materially differ from the value received upon actual sale of those investments.
| B. | Securities Transactions and Investment Income – Securities transactions are accounted for on a trade date basis. Realized gains or losses on sales are computed on the basis of specific identification of the securities sold. Interest income (net of withholding tax, if any) is recorded on the accrual basis from settlement date. Dividend income (net of withholding tax, if any) is recorded on theex-dividend date. |
The Fund may periodically participate in litigation related to Fund investments. As such, the Fund may receive proceeds from litigation settlements. Any proceeds received are included in the Statement of Operations as realized gain (loss) for investments no longer held and as unrealized gain (loss) for investments still held.
Brokerage commissions and mark ups are considered transaction costs and are recorded as an increase to the cost basis of securities purchased and/or a reduction of proceeds on a sale of securities. Such transaction costs are included in the determination of net realized and unrealized gain (loss) from investment securities reported in the Statement of Operations and the Statement of Changes in Net Assets and the net realized and unrealized gains (losses) on securities per share in the Financial Highlights. Transaction costs are included in the calculation of the Fund’s net asset value and, accordingly, they reduce the Fund’s total returns. These transaction costs are not considered operating expenses and are not reflected in net investment income reported in the Statement of Operations and the Statement of Changes in Net Assets, or the net investment income per share and the ratios of expenses and net investment income reported in the Financial Highlights, nor are they limited by any expense limitation arrangements between the Fund and the investment adviser.
The Fund allocates income and realized and unrealized capital gains and losses to a class based on the relative net assets of each class.
| C. | Country Determination – For the purposes of making investment selection decisions and presentation in the Schedule of Investments, the investment adviser may determine the country in which an issuer is located and/or credit risk exposure based on various factors. These factors include the laws of the country under which the issuer is organized, where the issuer maintains a principal office, the country in which the issuer derives 50% or more of its total revenues and the country that has the primary market for the issuer’s securities, as well as other criteria. Among the other criteria that may be evaluated for making this determination are the country in which the issuer maintains 50% or more of its assets, the type of security, financial guarantees and enhancements, the nature of the collateral and the sponsor organization. Country of issuer and/or credit risk exposure has been determined to be the United States of America, unless otherwise noted. |
| D. | Distributions - Distributions from net investment income and net realized capital gain, if any, are generally declared and paid to separate accounts of participating insurance companies annually and recorded on theex-dividend date. |
| E. | Federal Income Taxes –The Fund intends to comply with the requirements of Subchapter M of the Internal Revenue Code of 1986, as amended (the “Internal Revenue Code”), necessary to qualify as a regulated investment company and to distribute substantially all of the Fund’s taxable earnings to shareholders. As such, the Fund will not be subject to federal income taxes on otherwise taxable income (including net realized capital gain) that is distributed to shareholders. Therefore, no provision for federal income taxes is recorded in the financial statements. |
The Fund recognizes the tax benefits of uncertain tax positions only when the position is more likely than not to be sustained. Management has analyzed the Fund’s uncertain tax positions and concluded that no liability for unrecognized tax benefits should be recorded related to uncertain tax positions. Management is not aware of any tax positions for which it is reasonably possible that the total amounts of unrecognized tax benefits will change materially in the next 12 months.
The Fund files tax returns in the U.S. Federal jurisdiction and certain other jurisdictions. Generally, the Fund is subject to examinations by such taxing authorities for up to three years after the filing of the return for the tax period.
| F. | Expenses –Fees provided for under the Rule12b-1 plan of a particular class of the Fund and which are directly attributable to that class are charged to the operations of such class. All other expenses are allocated among the classes based on relative net assets. |
| G. | Accounting Estimates –The preparation of financial statements in conformity with accounting principles generally accepted in the United States of America (“GAAP”) requires management to make estimates and assumptions that affect the reported amounts of assets and liabilities at the date of the financial statements and the reported amounts of revenues and expenses during the reporting period including estimates and assumptions related to taxation. Actual results could differ from those estimates by a significant amount. In addition, the Fund monitors for material events or transactions that may occur or become known after theperiod-end date and before the date the financial statements are released to print. |
| H. | Indemnifications –Under the Trust’s organizational documents, each Trustee, officer, employee or other agent of the Trust is indemnified against certain liabilities that may arise out of the performance of their duties to the Fund. Additionally, in the normal course of business, the Fund enters into contracts, including the Fund’s servicing agreements, that contain a variety of indemnification clauses. The Fund’s maximum exposure under these arrangements is unknown as this would involve future claims that may be made against the Fund that have not yet occurred. The risk of material loss as a result of such indemnification claims is considered remote. |
| I. | Foreign Currency Translations – Foreign currency is valued at the close of the NYSE based on quotations posted by banks and major currency dealers. Portfolio securities and other assets and liabilities denominated in foreign currencies are translated into U.S. dollar amounts at the date of valuation. Purchases and sales of portfolio securities (net of foreign taxes withheld on disposition) and income items denominated in foreign currencies are translated into U.S. dollar amounts on the respective dates of such transactions. The Fund does not separately account for the portion of the results of operations resulting from changes in foreign exchange rates on investments and the fluctuations arising from changes in market prices of securities held. The combined results of changes in foreign exchange rates and the fluctuation of market prices on investments (net of estimated foreign tax withholding) are included with the net realized and unrealized gain or loss from investments in the Statement of Operations. Reported net realized foreign currency gains or losses arise from (1) sales of foreign currencies, (2) currency gains or losses realized between the trade and settlement dates on securities transactions, and (3) the difference between the amounts of dividends, interest, and foreign withholding taxes recorded on the Fund’s books and the U.S. dollar equivalent of the amounts actually received or paid. Net unrealized foreign currency gains and losses arise from changes in the fair values of assets and liabilities, other than investments in securities at fiscal period end, resulting from changes in exchange rates. |
The Fund may invest in foreign securities, which may be subject to foreign taxes on income, gains on investments or currency repatriation, a portion of which may be recoverable. Foreign taxes, if any, are recorded based on the tax regulations and rates that exist in the foreign markets in which the Fund invests and are shown in the Statement of Operations.
Invesco V.I. Growth and Income Fund
| J. | Forward Foreign Currency Contracts –The Fund may engage in foreign currency transactions either on a spot (i.e. for prompt delivery and settlement) basis, or through forward foreign currency contracts, to manage or minimize currency or exchange rate risk. |
The Fund may also enter into forward foreign currency contracts for the purchase or sale of a security denominated in a foreign currency in order to “lock in” the U.S. dollar price of that security, or the Fund may also enter into forward foreign currency contracts that do not provide for physical settlement of the two currencies, but instead are settled by a single cash payment calculated as the difference between the agreed upon exchange rate and the spot rate at settlement based upon an agreed upon notional amount(non-deliverable forwards). The Fund will set aside liquid assets in an amount equal to the dailymark-to-market obligation for forward foreign currency contracts.
A forward foreign currency contract is an obligation between two parties (“Counterparties”) to purchase or sell a specific currency for an agreed-upon price at a future date. The use of forward foreign currency contracts does not eliminate fluctuations in the price of the underlying securities the Fund owns or intends to acquire but establishes a rate of exchange in advance. Fluctuations in the value of these contracts are measured by the difference in the contract date and reporting date exchange rates and are recorded as unrealized appreciation (depreciation) until the contracts are closed. When the contracts are closed, realized gains (losses) are recorded. Realized and unrealized gains (losses) on the contracts are included in the Statement of Operations. The primary risks associated with forward foreign currency contracts include failure of the Counterparty to meet the terms of the contract and the value of the foreign currency changing unfavorably. These risks may be in excess of the amounts reflected in the Statement of Assets and Liabilities.
NOTE 2–Advisory Fees and Other Fees Paid to Affiliates
The Trust has entered into a master investment advisory agreement with Invesco Advisers, Inc. (the “Adviser” or “Invesco”). Under the terms of the investment advisory agreement, the Fund accrues daily and pays monthly an advisory fee to the Adviser based on the annual rate of the Fund’s average daily net assets as follows:
| | | | |
| Average Daily Net Assets | | Rate | |
| |
| |
First $500 million | | | 0.600% | |
| |
Over $500 million | | | 0.550% | |
| |
For the year ended December 31, 2019, the effective advisory fee rate incurred by the Fund was 0.57%.
Under the terms of a mastersub-advisory agreement between the Adviser and each of Invesco Asset Management Deutschland GmbH, Invesco Asset Management Limited, Invesco Asset Management (Japan) Limited, Invesco Hong Kong Limited, Invesco Senior Secured Management, Inc. and Invesco Canada Ltd. and separatesub-advisory agreements with Invesco Capital Management LLC and Invesco Asset Management (India) Private Limited (collectively, the “AffiliatedSub-Advisers”) the Adviser, not the Fund, will pay 40% of the fees paid to the Adviser to any such AffiliatedSub-Adviser(s) that provide(s) discretionary investment management services to the Fund based on the percentage of assets allocated to such AffiliatedSub-Adviser(s).
The Adviser has contractually agreed, through at least April 30, 2021, to waive advisory fees and/or reimburse expenses of all shares to the extent necessary to limit total annual fund operating expenses after fee waiver and/or expense reimbursement (excluding certain items discussed below) of Series I shares to 0.78% and Series II shares to 1.03% of average daily net assets (the “expense limits”). In determining the Adviser’s obligation to waive advisory fees and/or reimburse expenses, the following expenses are not taken into account, and could cause the total annual fund operating expenses after fee waiver and/or expense reimbursement to exceed the numbers reflected above: (1) interest; (2) taxes; (3) dividend expense on short sales; (4) extraordinary ornon-routine items, including litigation expenses; and (5) expenses that the Fund has incurred but did not actually pay because of an expense offset arrangement. Unless Invesco continues the fee waiver agreement, it will terminate on April 30, 2021. During its term, the fee waiver agreement cannot be terminated or amended to increase the expense limits or reduce the advisory fee waiver without approval of the Board of Trustees. The Adviser did not waive fees and/or reimburse expenses during the period under these expense limits.
Further, the Adviser has contractually agreed, through at least June 30, 2021, to waive the advisory fee payable by the Fund in an amount equal to 100% of the net advisory fees the Adviser receives from the affiliated money market funds on investments by the Fund of uninvested cash in such affiliated money market funds.
For the year ended December 31, 2019, the Adviser waived advisory fees of $85,922.
The Trust has entered into a master administrative services agreement with Invesco pursuant to which the Fund has agreed to pay Invesco a fee for costs incurred in providing accounting services and fund administrative services to the Fund and to reimburse Invesco for fees paid to insurance companies that have agreed to provide certain administrative services to the Fund. These administrative services provided by the insurance companies may include, among other things: maintenance of master accounts with the Fund; tracking, recording and transmitting net purchase and redemption orders for Fund shares; maintaining and preserving records related to the purchase, redemption and other account activity of variable product owners; distributing copies of Fund documents such as prospectuses, proxy materials and periodic reports, to variable product owners, and responding to inquiries from variable product owners about the Fund. Pursuant to such agreement, for the year ended December 31, 2019, Invesco was paid $207,526 for accounting and fund administrative services and was reimbursed $2,243,010 for fees paid to insurance companies. Invesco has entered into asub-administration agreement whereby State Street Bank and Trust Company (“SSB”) serves as fund accountant and provides certain administrative services to the Fund. Pursuant to a custody agreement with the Trust on behalf of the Fund, SSB also serves as the Fund’s custodian.
The Trust has entered into a transfer agency and service agreement with Invesco Investment Services, Inc. (“IIS”) pursuant to which the Fund has agreed to pay IIS a fee for providing transfer agency and shareholder services to the Fund and reimburse IIS for certain expenses incurred by IIS in the course of providing such services. For the year ended December 31, 2019, expenses incurred under the agreement are shown in the Statement of Operations asTransfer agent fees.
The Trust has entered into a master distribution agreement with Invesco Distributors, Inc. (“IDI”) to serve as the distributor for the Fund. The Trust has adopted a plan pursuant to Rule12b-1 under the 1940 Act with respect to the Fund’s Series II shares (the “Plan”). The Fund, pursuant to the Plan, pays IDI compensation at the annual rate of 0.25% of the Fund’s average daily net assets of Series II shares. The fees are accrued daily and paid monthly. Of the Plan payments, up to 0.25% of the average daily net assets of the Series II shares may be paid to insurance companies who furnish continuing personal shareholder services to customers who purchase and own Series II shares of the Fund. For the year ended December 31, 2019, expenses incurred under the Plan are detailed in the Statement of Operations asDistribution fees.
Invesco V.I. Growth and Income Fund
For the year ended December 31, 2019, the Fund incurred $73,303 in brokerage commissions with Invesco Capital Markets, Inc., an affiliate of the Adviser and IDI, for portfolio transactions executed on behalf of the Fund.
Certain officers and trustees of the Trust are officers and directors of the Adviser, IIS and/or IDI.
NOTE 3–Additional Valuation Information
GAAP defines fair value as the price that would be received to sell an asset or paid to transfer a liability in an orderly transaction between market participants at the measurement date, under current market conditions. GAAP establishes a hierarchy that prioritizes the inputs to valuation methods, giving the highest priority to readily available unadjusted quoted prices in an active market for identical assets (Level 1) and the lowest priority to significant unobservable inputs (Level 3), generally when market prices are not readily available or are unreliable. Based on the valuation inputs, the securities or other investments are tiered into one of three levels. Changes in valuation methods may result in transfers in or out of an investment’s assigned level:
| | | | | | |
| | | Level 1 | | - | | Prices are determined using quoted prices in an active market for identical assets. |
| | Level 2 | | - | | Prices are determined using other significant observable inputs. Observable inputs are inputs that other market participants may use in pricing a security. These may include quoted prices for similar securities, interest rates, prepayment speeds, credit risk, yield curves, loss severities, default rates, discount rates, volatilities and others. |
| | Level 3 | | - | | Prices are determined using significant unobservable inputs. In situations where quoted prices or observable inputs are unavailable (for example, when there is little or no market activity for an investment at the end of the period), unobservable inputs may be used. Unobservable inputs reflect the Fund’s own assumptions about the factors market participants would use in determining fair value of the securities or instruments and would be based on the best available information. |
The following is a summary of the tiered valuation input levels, as of December 31, 2019. The level assigned to the securities valuations may not be an indication of the risk or liquidity associated with investing in those securities. Because of the inherent uncertainties of valuation, the values reflected in the financial statements may materially differ from the value received upon actual sale of those investments.
| | | | | | | | | | | | | | | | |
| | | Level 1 | | | Level 2 | | | Level 3 | | | Total | |
| |
Investments in Securities | | | | | | | | | | | | | | | | |
| |
| | | | |
Common Stocks & Other Equity Interests | | | $1,487,323,296 | | | | $144,344,507 | | | | $- | | | | $ 1,631,667,803 | |
| |
| | | | |
Money Market Funds | | | 103,412,778 | | | | - | | | | - | | | | 103,412,778 | |
| |
Total Investments in Securities | | | 1,590,736,074 | | | | 144,344,507 | | | | - | | | | 1,735,080,581 | |
| |
| | | | |
Other Investments - Assets* | | | | | | | | | | | | | | | | |
| |
| | | | |
Forward Foreign Currency Contracts | | | - | | | | 29,554 | | | | - | | | | 29,554 | |
| |
| | | | |
Other Investments - Liabilities* | | | | | | | | | | | | | | | | |
| |
| | | | |
Forward Foreign Currency Contracts | | | - | | | | (2,564,763 | ) | | | - | | | | (2,564,763 | ) |
| |
Total Other Investments | | | - | | | | (2,535,209 | ) | | | - | | | | (2,535,209 | ) |
| |
| | | | |
Total Investments | | | $1,590,736,074 | | | | $141,809,298 | | | | $- | | | | $1,732,545,372 | |
| |
* Unrealized appreciation (depreciation).
NOTE 4–Derivative Investments
The Fund may enter into an International Swaps and Derivatives Association Master Agreement (“ISDA Master Agreement”) under which a fund may trade OTC derivatives. An OTC transaction entered into under an ISDA Master Agreement typically involves a collateral posting arrangement, payment netting provisions andclose-out netting provisions. These netting provisions allow for reduction of credit risk through netting of contractual obligations. The enforceability of the netting provisions of the ISDA Master Agreement depends on the governing law of the ISDA Master Agreement, among other factors.
For financial reporting purposes, the Fund does not offset OTC derivative assets or liabilities that are subject to ISDA Master Agreements in the Statement of Assets and Liabilities.
Value of Derivative Investments atPeriod-End
The table below summarizes the value of the Fund’s derivative investments, detailed by primary risk exposure, held as of December 31, 2019:
| | | | |
| | | Value | |
| Derivative Assets | | Currency
Risk | |
| |
Unrealized appreciation on forward foreign currency contracts outstanding | | $ | 29,554 | |
| |
Derivatives not subject to master netting agreements | | | - | |
| |
Total Derivative Assets subject to master netting agreements | | $ | 29,554 | |
| |
Invesco V.I. Growth and Income Fund
| | | | |
| | | Value | |
| Derivative Liabilities | | Currency
Risk | |
| |
Unrealized depreciation on forward foreign currency contracts outstanding | | $ | (2,564,763 | ) |
| |
Derivatives not subject to master netting agreements | | | - | |
| |
Total Derivative Liabilities subject to master netting agreements | | $ | (2,564,763 | ) |
| |
Offsetting Assets and Liabilities
The table below reflects the Fund’s exposure to Counterparties subject to either an ISDA Master Agreement or other agreement for OTC derivative transactions as of December 31, 2019.
| | | | | | | | | | | | | | | | | | | | |
| | | Financial Derivative
Assets | | | Financial Derivative
Liabilities | | | | | | Collateral
(Received)/Pledged | | | |
| Counterparty | | Forward Foreign
Currency Contracts | | | Forward Foreign
Currency Contracts | | | Net Value of
Derivatives | | | Non-Cash | | Cash | | Net
Amount | |
| |
Bank of New York Mellon (The) | | | $ - | | | | $ (881,528) | | | $ | (881,528 | ) | | $- | | $- | | $ | (881,528 | ) |
| |
State Street Bank & Trust Co. | | | 29,554 | | | | (1,683,235) | | | | (1,653,681 | ) | | - | | - | | | (1,653,681 | ) |
| |
Total | | | $29,554 | | | | $(2,564,763) | | | $ | (2,535,209 | ) | | $- | | $- | | $ | (2,535,209 | ) |
| |
Effect of Derivative Investments for the year ended December 31, 2019
The table below summarizes the gains (losses) on derivative investments, detailed by primary risk exposure, recognized in earnings during the period:
| | | | |
| | | Location of Gain (Loss) on
Statement of Operations
Currency
Risk | |
Realized Gain: | | | | |
Forward foreign currency contracts | | | $ 903,540 | |
| |
Change in Net Unrealized Appreciation (Depreciation): | | | | |
Forward foreign currency contracts | | | (2,383,293) | |
| |
Total | | | $(1,479,753) | |
| |
The table below summarizes the average notional value of derivatives held during the period.
| | | | |
| | | Forward
Foreign Currency
Contracts | |
Average notional value | | $ | 159,044,939 | |
| |
NOTE 5–Trustees’ and Officers’ Fees and Benefits
Trustees’ and Officers’ Fees and Benefits include amounts accrued by the Fund to pay remuneration to certain Trustees and Officers of the Fund. Trustees have the option to defer compensation payable by the Fund, andTrustees’ and Officers’ Fees and Benefits also include amounts accrued by the Fund to fund such deferred compensation amounts. Those Trustees who defer compensation have the option to select various Invesco Funds in which their deferral accounts shall be deemed to be invested. Finally, certain current Trustees were eligible to participate in a retirement plan that provided for benefits to be paid upon retirement to Trustees over a period of time based on the number of years of service. The Fund may have certain former Trustees who also participate in a retirement plan and receive benefits under such plan.Trustees’ and Officers’ Fees and Benefits include amounts accrued by the Fund to fund such retirement benefits. Obligations under the deferred compensation and retirement plans represent unsecured claims against the general assets of the Fund.
NOTE 6–Cash Balances
The Fund is permitted to temporarily carry a negative or overdrawn balance in its account with SSB, the custodian bank. Such balances, if any atperiod-end, are shown in the Statement of Assets and Liabilities under the payable caption Amount due custodian. To compensate the custodian bank for such overdrafts, the overdrawn Fund may either (1) leave funds as a compensating balance in the account so the custodian bank can be compensated by earning the additional interest; or (2) compensate by paying the custodian bank at a rate agreed upon by the custodian bank and Invesco, not to exceed the contractually agreed upon rate.
Invesco V.I. Growth and Income Fund
NOTE 7–Distributions to Shareholders and Tax Components of Net Assets
Tax Character of Distributions to Shareholders Paid During the Fiscal Years Ended December 31, 2019 and 2018:
| | | | | | | | |
| | | 2019 | | | 2018 | |
| |
| | |
Ordinary income | | $ | 24,898,470 | | | $ | 38,083,181 | |
| |
Long-term capital gain | | | 172,366,981 | | | | 166,757,495 | |
| |
Total distributions | | $ | 197,265,451 | | | $ | 204,840,676 | |
| |
| | | | | | | | |
| Tax Components of Net Assets atPeriod-End: | | | | | | | | |
| | | | | | 2019 | |
| |
Undistributed ordinary income | | | | | | $ | 26,288,357 | |
| |
Undistributed long-term capital gain | | | | | | | 21,853,705 | |
| |
Net unrealized appreciation – investments | | | | | | | 261,297,943 | |
| |
Net unrealized appreciation - foreign currencies | | | | | | | 21,831 | |
| |
Temporary book/tax differences | | | | | | | (193,521 | ) |
| |
Shares of beneficial interest | | | | | | | 1,390,932,962 | |
| |
Total net assets | | | | | | $ | 1,700,201,277 | |
| |
The difference between book-basis andtax-basis unrealized appreciation (depreciation) is due to differences in the timing of recognition of gains and losses on investments for tax and book purposes. The Fund’s net unrealized appreciation (depreciation) difference is attributable primarily to forward foreign currency contracts and wash sales.
The temporary book/tax differences are a result of timing differences between book and tax recognition of income and/or expenses. The Fund’s temporary book/tax differences are the result of the trustee deferral of compensation and retirement plan benefits.
Capital loss carryforward is calculated and reported as of a specific date. Results of transactions and other activity after that date may affect the amount of capital loss carryforward actually available for the Fund to utilize. Capital losses generated in years beginning after December 22, 2010 can be carried forward for an unlimited period, whereas previous losses expire in eight tax years. Capital losses with an expiration period may not be used to offset capital gains until all net capital losses without an expiration date have been utilized. Capital loss carryforwards with no expiration date will retain their character as either short-term or long-term capital losses instead of as short-term capital losses as under prior law. The ability to utilize capital loss carryforwards in the future may be limited under the Internal Revenue Code and related regulations based on the results of future transactions.
The Fund does not have a capital loss carryforward as of December 31, 2019.
NOTE 8–Investment Transactions
The aggregate amount of investment securities (other than short-term securities, U.S. Treasury obligations and money market funds, if any) purchased and sold by the Fund during the year ended December 31, 2019 was $1,078,494,879 and $902,686,567, respectively. Cost of investments, including any derivatives, on a tax basis includes the adjustments for financial reporting purposes as of the most recently completed federal income tax reportingperiod-end.
| | | | |
| Unrealized Appreciation (Depreciation) of Investments on a Tax Basis | |
Aggregate unrealized appreciation of investments | | | $291,213,520 | |
| |
Aggregate unrealized (depreciation) of investments | | | (29,915,577 | ) |
| |
Net unrealized appreciation of investments | | | $261,297,943 | |
| |
| |
Cost of investments for tax purposes is $1,471,247,429. | | | | |
NOTE 9–Reclassification of Permanent Differences
Primarily as a result of differing book/tax treatment of foreign currency transactions, on December 31, 2019, undistributed net investment income was increased by $355,861 and undistributed net realized gain (loss) was decreased by $355,861. This reclassification had no effect on the net assets or the distributable earnings of the Fund.
NOTE 10–Share Information
| | | | | | | | | | | | | | | | |
| | | | Summary of Share Activity | |
| | | Year ended
December 31, 2019(a) | | | Year ended
December 31, 2018 | |
| | | Shares | | | Amount | | | Shares | | | Amount | |
Sold: | | | | | | | | | | | | | | | | |
Series I | | | 961,502 | | | $ | 18,593,160 | | | | 1,599,024 | | | $ | 33,449,701 | |
| |
Series II | | | 46,991,194 | | | | 937,263,516 | | | | 4,823,927 | | | | 100,263,745 | |
| |
Invesco V.I. Growth and Income Fund
| | | | | | | | | | | | | | | | |
| | | Summary of Share Activity | |
| | | Year ended
December 31, 2019(a) | | | Year ended
December 31, 2018 | |
| | | Shares | | | Amount | | | Shares | | | Amount | |
| | | | |
Issued as reinvestment of dividends: | | | | | | | | | | | | | | | | |
Series I | | | 1,324,721 | | | $ | 23,474,054 | | | | 978,568 | | | $ | 20,657,576 | |
| |
Series II | | | 9,813,179 | | | | 173,791,397 | | | | 8,737,339 | | | | 184,183,100 | |
| |
| | | | |
Reacquired: | | | | | | | | | | | | | | | | |
Series I | | | (1,980,258 | ) | | | (37,930,469 | ) | | | (1,330,437 | ) | | | (29,078,193 | ) |
| |
Series II | | | (39,496,692 | ) | | | (767,494,209 | ) | | | (31,937,812 | ) | | | (658,603,276 | ) |
| |
Net increase (decrease) in share activity | | | 17,613,646 | | | $ | 347,697,449 | | | | (17,129,391 | ) | | $ | (349,127,347 | ) |
| |
| (a) | There are entities that are record owners of more than 5% of the outstanding shares of the Fund and in the aggregate own 79% of the outstanding shares of the Fund. The Fund and the Fund’s principal underwriter or adviser, are parties to participation agreements with these entities whereby these entities sell units of interest in separate accounts funding variable products that are invested in the Fund. The Fund, Invesco and/or Invesco affiliates may make payments to these entities, which are considered to be related to the Fund, for providing services to the Fund, Invesco and/or Invesco affiliates including but not limited to services such as, securities brokerage, third party record keeping and account servicing and administrative services. The Fund has no knowledge as to whether all or any portion of the shares owned of record by these entities are also owned beneficially. |
Invesco V.I. Growth and Income Fund
Report of Independent Registered Public Accounting Firm
To the Board of Trustees of AIM Variable Insurance Funds (Invesco Variable Insurance Funds) and Shareholders of Invesco V.I. Growth and Income Fund
Opinion on the Financial Statements
We have audited the accompanying statement of assets and liabilities, including the schedule of investments, of Invesco V.I. Growth and Income Fund (one of the funds constituting AIM Variable Insurance Funds (Invesco Variable Insurance Funds), referred to hereafter as the “Fund”) as of December 31, 2019, the related statement of operations for the year ended December 31, 2019, the statement of changes in net assets for each of the two years in the period ended December 31, 2019, including the related notes, and the financial highlights for each of the five years in the period ended December 31, 2019 (collectively referred to as the “financial statements”). In our opinion, the financial statements present fairly, in all material respects, the financial position of the Fund as of December 31, 2019, the results of its operations for the year then ended, the changes in its net assets for each of the two years in the period ended December 31, 2019 and the financial highlights for each of the five years in the period ended December 31, 2019 in conformity with accounting principles generally accepted in the United States of America.
Basis for Opinion
These financial statements are the responsibility of the Fund’s management. Our responsibility is to express an opinion on the Fund’s financial statements based on our audits. We are a public accounting firm registered with the Public Company Accounting Oversight Board (United States) (PCAOB) and are required to be independent with respect to the Fund in accordance with the U.S. federal securities laws and the applicable rules and regulations of the Securities and Exchange Commission and the PCAOB.
We conducted our audits of these financial statements in accordance with the standards of the PCAOB. Those standards require that we plan and perform the audit to obtain reasonable assurance about whether the financial statements are free of material misstatement, whether due to error or fraud.
Our audits included performing procedures to assess the risks of material misstatement of the financial statements, whether due to error or fraud, and performing procedures that respond to those risks. Such procedures included examining, on a test basis, evidence regarding the amounts and disclosures in the financial statements. Our audits also included evaluating the accounting principles used and significant estimates made by management, as well as evaluating the overall presentation of the financial statements. Our procedures included confirmation of securities owned as of December 31, 2019 by correspondence with the custodian, transfer agent and brokers; when replies were not received from brokers, we performed other auditing procedures. We believe that our audits provide a reasonable basis for our opinion.
/s/PricewaterhouseCoopers LLP
Houston, Texas
February 18, 2020
We have served as the auditor of one or more of the investment companies in the Invesco group of investment companies since at least 1995. We have not been able to determine the specific year we began serving as auditor.
Invesco V.I. Growth and Income Fund
Calculating your ongoing Fund expenses
Example
As a shareholder of the Fund, you incur ongoing costs, including management fees; distribution and/or service fees(12b-1); and other Fund expenses. This example is intended to help you understand your ongoing costs (in dollars) of investing in the Fund and to compare these costs with ongoing costs of investing in other mutual funds. The example is based on an investment of $1,000 invested at the beginning of the period and held for the entire period July 1, 2019 through December 31, 2019.
The actual and hypothetical expenses in the examples below do not represent the effect of any fees or other expenses assessed in connection with a variable product; if they did, the expenses shown would be higher while the ending account values shown would be lower.
Actual expenses
The table below provides information about actual account values and actual expenses. You may use the information in this table, together with the amount you invested, to estimate the expenses that you paid over the period. Simply divide your account value by $1,000 (for example, an $8,600 account value divided by $1,000 = 8.6), then multiply the result by the number in the table under the heading entitled “Actual Expenses Paid During Period” to estimate the expenses you paid on your account during this period.
Hypothetical example for comparison purposes
The table below also provides information about hypothetical account values and hypothetical expenses based on the Fund’s actual expense ratio and an assumed rate of return of 5% per year before expenses, which is not the Fund’s actual return.
The hypothetical account values and expenses may not be used to estimate the actual ending account balance or expenses you paid for the period. You may use this information to compare the ongoing costs of investing in the Fund and other funds. To do so, compare this 5% hypothetical example with the 5% hypothetical examples that appear in the shareholder reports of the other funds.
Please note that the expenses shown in the table are meant to highlight your ongoing costs. Therefore, the hypothetical information is useful in comparing ongoing costs, and will not help you determine the relative total costs of owning different funds.
| | | | | | | | | | | | | | | | | | | | | | | | | | | |
| | | | | ACTUAL | | HYPOTHETICAL (5% annual return before
expenses) | | |
| | Beginning Account Value (07/01/19) | | Ending Account Value (12/31/19)1 | | Expenses Paid During Period2 | | Ending Account Value (12/31/19) | | Expenses Paid During Period2 | | Annualized Expense Ratio |
| Series I | | $1,000.00 | | | | $1,078.20 | | | | | $3.82 | | | | | $1,021.53 | | | | | $3.72 | | | | | 0.73% | |
| Series II | | 1,000.00 | | | | 1,076.60 | | | | | 5.13 | | | | | 1,020.27 | | | | | 4.99 | | | | | 0.98 | |
| 1 | The actual ending account value is based on the actual total return of the Fund for the period July 1, 2019 through December 31, 2019, after actual expenses and will differ from the hypothetical ending account value which is based on the Fund’s expense ratio and a hypothetical annual return of 5% before expenses. |
| 2 | Expenses are equal to the Fund’s annualized expense ratio as indicated above multiplied by the average account value over the period, multiplied by 184/365 to reflect the most recent fiscal half year. |
Invesco V.I. Growth and Income Fund
Tax Information
Form1099-DIV, Form1042-S and other year–end tax information provide shareholders with actual calendar year amounts that should be included in their tax returns. Shareholders should consult their tax advisors.
The following distribution information is being provided as required by the Internal Revenue Code or to meet a specific state’s requirement.
The Fund designates the following amounts or, if subsequently determined to be different, the maximum amount allowable for its fiscal year ended December 31, 2019:
| | | | | | | | |
| Federal and State Income Tax | | | | |
Long-term Capital Gain Distribution | | | 172,366,981 | | | | | |
Corporate Dividends Received Deduction* | | | 100.00 | % | | | | |
U.S. Treasury Obligations* | | | 0.00 | % | | | | |
| | * | The above percentages are based on ordinary income dividends paid to shareholders during the Fund’s fiscal year. |
Invesco V.I. Growth and Income Fund
Trustees and Officers
The address of each trustee and officer is AIM Variable Insurance Funds (Invesco Variable Insurance Funds) (the “Trust”), 11 Greenway Plaza, Suite 1000, Houston, Texas 77046-1173. The trustees serve for the life of the Trust, subject to their earlier death, incapacitation, resignation, retirement or removal as more specifically provided in the Trust’s organizational documents. Each officer serves for a one year term or until their successors are elected and qualified. Column two below includes length of time served with predecessor entities, if any.
| | | | | | | | |
Name, Year of Birth and
Position(s)
Held with the Trust | | Trustee
and/or
Officer
Since | | Principal Occupation(s)
During Past 5 Years | | Number of
Funds in
Fund Complex
Overseen by
Trustee | | Other
Directorship(s)
Held by Trustee
During Past 5
Years |
| Interested Person | | | | | | | | |
Martin L. Flanagan1 - 1960
Trustee and Vice Chair | | 2007 | | Executive Director, Chief Executive Officer and President, Invesco Ltd. (ultimate parent of Invesco and a global investment management firm); Trustee and Vice Chair, The Invesco Funds; Vice Chair, Investment Company Institute; and Member of Executive Board, SMU Cox School of Business Formerly: Advisor to the Board, Invesco Advisers, Inc. (formerly known as Invesco Institutional (N.A.), Inc.); Chairman and Chief Executive Officer, Invesco Advisers, Inc. (registered investment adviser); Director, Chairman, Chief Executive Officer and President, Invesco Holding Company (US), Inc. (formerly IVZ Inc.) (holding company), Invesco Group Services, Inc. (service provider) and Invesco North American Holdings, Inc. (holding company); Director, Chief Executive Officer and President, Invesco Holding Company Limited (parent of Invesco and a global investment management firm); Director, Invesco Ltd.; Chairman, Investment Company Institute and President,Co-Chief Executive Officer,Co-President, Chief Operating Officer and Chief Financial Officer, Franklin Resources, Inc. (global investment management organization) | | 229 | | None |
| 1 | Mr. Flanagan is considered an interested person (within the meaning of Section 2(a)(19) of the 1940 Act) of the Trust because he is an officer of the Adviser to the Trust, and an officer and a director of Invesco Ltd., ultimate parent of the Adviser. |
Invesco V.I. Growth and Income Fund
Trustees and Officers–(continued)
| | | | | | | | |
Name, Year of Birth and
Position(s)
Held with the Trust | | Trustee
and/or
Officer
Since | | Principal Occupation(s)
During Past 5 Years | | Number of
Funds in
Fund Complex
Overseen by
Trustee | | Other
Directorship(s)
Held by Trustee
During Past 5
Years |
| Independent Trustees | | | | | | | | |
Bruce L. Crockett - 1944
Trustee and Chair | | 1993 | | Chairman, Crockett Technologies Associates (technology consulting company) Formerly: Director, Captaris (unified messaging provider); Director, President and Chief Executive Officer, COMSAT Corporation; Chairman, Board of Governors of INTELSAT (international communications company); ACE Limited (insurance company); Independent Directors Council and Investment Company Institute: Member of the Audit Committee, Investment Company Institute; Member of the Executive Committee and Chair of the Governance Committee, Independent Directors Council | | 229 | | Director and Chairman of the Audit Committee, ALPS (Attorneys Liability Protection Society) (insurance company); Director and Member of the Audit Committee and Compensation Committee, Ferroglobe PLC (metallurgical company) |
David C. Arch - 1945
Trustee | | 2010 | | Chairman of Blistex Inc. (consumer health care products manufacturer); Member, World Presidents’ Organization | | 229 | | Board member of the Illinois Manufacturers’ Association |
Beth Ann Brown - 1968
Trustee | | 2019 | | Independent Consultant Formerly: Head of Intermediary Distribution, Managing Director, Strategic Relations, Managing Director, Head of National Accounts, Senior Vice President, National Account Manager and Senior Vice President, Key Account Manager, Columbia Management Investment Advisers LLC; Vice President, Key Account Manager, Liberty Funds Distributor, Inc.; and Trustee of certain Oppenheimer Funds | | 229 | | Director, Board of Directors of Caron Engineering Inc.; Advisor, Board of Advisors of Caron Engineering Inc.; President and Director, Acton Shapleigh Youth Conservation Corps (non - profit); and Vice President and Director of Grahamtastic Connection (non-profit) |
Jack M. Fields - 1952
Trustee | | 1997 | | Chief Executive Officer, Twenty First Century Group, Inc. (government affairs company); and Chairman, Discovery Learning Alliance(non-profit) Formerly: Owner and Chief Executive Officer, Dos Angeles Ranch L.P. (cattle, hunting, corporate entertainment); Director, Insperity, Inc. (formerly known as Administaff) (human resources provider); Chief Executive Officer, Texana Timber LP (sustainable forestry company); Director of Cross Timbers Quail Research Ranch(non-profit); and member of the U.S. House of Representatives | | 229 | | None |
Invesco V.I. Growth and Income Fund
Trustees and Officers–(continued)
| | | | | | | | |
Name, Year of Birth and
Position(s)
Held with the Trust | | Trustee
and/or
Officer
Since | | Principal Occupation(s)
During Past 5 Years | | Number of
Funds in
Fund Complex
Overseen by
Trustee | | Other
Directorship(s)
Held by Trustee
During Past 5
Years |
| Independent Trustees–(continued) | | | | |
Cynthia Hostetler - 1962
Trustee | | 2017 | | Non-Executive Director and Trustee of a number of public and private business corporations Formerly: Director, Aberdeen Investment Funds (4 portfolios); Head of Investment Funds and Private Equity, Overseas Private Investment Corporation; President, First Manhattan Bancorporation, Inc.; Attorney, Simpson Thacher & Bartlett LLP | | 229 | | Vulcan Materials Company (construction materials company); Trilinc Global Impact Fund; Genesee & Wyoming, Inc. (railroads); Artio Global Investment LLC (mutual fund complex); Edgen Group, Inc. (specialized energy and infrastructure products distributor); Investment Company Institute (professional organization); Independent Directors Council (professional organization) |
Eli Jones - 1961
Trustee | | 2016 | | Professor and Dean, Mays Business School - Texas A&M University Formerly: Professor and Dean, Walton College of Business, University of Arkansas and E.J. Ourso College of Business, Louisiana State University; Director, Arvest Bank | | 229 | | Insperity, Inc. (formerly known as Administaff) (human resources provider) |
Elizabeth Krentzman - 1959
Trustee | | 2019 | | Formerly: Principal and Chief Regulatory Advisor for Asset Management Services and U.S. Mutual Fund Leader of Deloitte & Touche LLP; General Counsel of the Investment Company Institute (trade association); National Director of the Investment Management Regulatory Consulting Practice, Principal, Director and Senior Manager of Deloitte & Touche LLP; Assistant Director of the Division of Investment Management - Office of Disclosure and Investment Adviser Regulation of the U.S. Securities and Exchange Commission and various positions with the Division of Investment Management – Office of Regulatory Policy of the U.S. Securities and Exchange Commission; Associate at Ropes & Gray LLP; Advisory Board Member of the Securities and Exchange Commission Historical Society; and Trustee of certain Oppenheimer Funds | | 229 | | Trustee of the University of Florida National Board Foundation and Audit Committee Member; Member of the Cartica Funds Board of Directors (private investment funds); Member of the University of Florida Law Center Association, Inc. Board of Trustees and Audit Committee Member |
Anthony J. LaCava, Jr. - 1956
Trustee | | 2019 | | Formerly: Director and Member of the Audit Committee, Blue Hills Bank (publicly traded financial institution) and Managing Partner, KPMG LLP | | 229 | | Blue Hills Bank; Chairman, Bentley University; Member, Business School Advisory Council; and Nominating Committee KPMG LLP |
Prema Mathai-Davis - 1950
Trustee | | 1998 | | Retired Co-Owner & Partner of Quantalytics Research, LLC, (a FinTech Investment Research Platform for the Self-Directed Investor) | | 229 | | None |
Invesco V.I. Growth and Income Fund
Trustees and Officers–(continued)
| | | | | | | | |
Name, Year of Birth and
Position(s)
Held with the Trust | | Trustee
and/or
Officer
Since | | Principal Occupation(s)
During Past 5 Years | | Number of
Funds in
Fund Complex
Overseen by
Trustee | | Other
Directorship(s)
Held by Trustee
During Past
5 Years |
| Independent Trustees–(continued) | | | | |
Joel W. Motley - 1952
Trustee | | 2019 | | Director of Office of Finance, Federal Home Loan Bank; Member of the Vestry of Trinity Wall Street; Managing Director of Carmona Motley Inc. (privately held financial advisor); Member of the Finance and Budget Committee of the Council on Foreign Relations, Member of the Investment Committee and Board of Human Rights Watch and Member of the Investment Committee and Board of Historic Hudson Valley(non-profit cultural organization) Formerly: Managing Director of Public Capital Advisors, LLC (privately held financial advisor); Managing Director of Carmona Motley Hoffman, Inc. (privately held financial advisor); Trustee of certain Oppenheimer Funds; and Director of Columbia Equity Financial Corp. (privately held financial advisor) | | 229 | | Director of Greenwall Foundation (bioethics research foundation); Member of Board and Investment Committee of The Greenwall Foundation; Director of Southern Africa Legal Services Foundation; Board Member and Investment Committee Member of Pulizer Center for Crisis Reporting(non-profit journalism) |
Teresa M. Ressel – 1962
Trustee | | 2017 | | Non-executive director and trustee of a number of public and private business corporations Formerly: Chief Financial Officer, Olayan America, The Olayan Group (international investor/commercial/industrial); Chief Executive Officer, UBS Securities LLC; Group Chief Operating Officer, Americas, UBS AG; Assistant Secretary for Management & Budget and CFO, US Department of the Treasury | | 229 | | Atlantic Power Corporation (power generation company); ON Semiconductor Corp. (semiconductor supplier) |
Ann Barnett Stern - 1957
Trustee | | 2017 | | President and Chief Executive Officer, Houston Endowment Inc. (private philanthropic institution) Formerly: Executive Vice President and General Counsel, Texas Children’s Hospital; Attorney, Beck, Redden and Secrest, LLP; Business Law Instructor, University of St. Thomas; Attorney, Andrews & Kurth LLP | | 229 | | Federal Reserve Bank of Dallas |
Robert C. Troccoli - 1949
Trustee | | 2016 | | Retired | | 229 | | None |
Daniel S. Vandivort - 1954
Trustee | | 2019 | | Treasurer, Chairman of the Audit and Finance Committee, and Trustee, Board of Trustees, Huntington Disease Foundation of America; and President, Flyway Advisory Services LLC (consulting and property management) Formerly: Trustee and Governance Chair, of certain Oppenheimer Funds | | 229 | | Chairman and Lead Independent Director, Chairman of the Audit Committee, and Director, Board of Directors, Value Line Funds |
James D. Vaughn - 1945
Trustee | | 2019 | | Retired Formerly: Managing Partner, Deloitte & Touche LLP; Trustee and Chairman of the Audit Committee, Schroder Funds; Board Member, Mile High United Way, Boys and Girls Clubs, Boy Scouts, Colorado Business Committee for the Arts, Economic Club of Colorado and Metro Denver Network (economic development corporation); and Trustee of certain Oppenheimer Funds | | 229 | | Board member and Chairman of Audit Committee of AMG National Trust Bank; Trustee and Investment Committee member, University of South Dakota Foundation; Board member, Audit Committee Member and past Board Chair, Junior Achievement(non-profit) |
Invesco V.I. Growth and Income Fund
Trustees and Officers–(continued)
| | | | | | | | |
Name, Year of Birth and
Position(s)
Held with the Trust | | Trustee
and/or
Officer
Since | | Principal Occupation(s)
During Past 5 Years | | Number of
Funds in
Fund Complex
Overseen by
Trustee | | Other
Directorship(s)
Held by Trustee
During Past
5 Years |
| Independent Trustees–(continued) | | | | |
Christopher L.WIlson - 1957
Trustee, Vice Chair and Chair Designate | | 2017 | | Retired Formerly: Director, TD Asset Management USA Inc. (mutual fund complex) (22 portfolios); Managing Partner, CT2, LLC (investing and consulting firm); President/Chief Executive Officer, Columbia Funds, Bank of America Corporation; President/Chief Executive Officer, CDC IXIS Asset Management Services, Inc.; Principal & Director of Operations, Scudder Funds, Scudder, Stevens & Clark, Inc.; Assistant Vice President, Fidelity Investments | | 229 | | ISO New England, Inc.(non-profit organization managing regional electricity market) |
Invesco V.I. Growth and Income Fund
Trustees and Officers–(continued)
| | | | | | | | |
Name, Year of Birth and
Position(s)
Held with the Trust | | Trustee
and/or
Officer
Since | | Principal Occupation(s)
During Past 5 Years | | Number of
Funds in
Fund Complex
Overseen by
Trustee | | Other
Directorship(s) Held by Trustee
During Past
5 Years |
| Officers | | | | | | | | |
Sheri Morris - 1964
President, Principal Executive
Officer and Treasurer | | 1999 | | Head of Global Fund Services, Invesco Ltd.; President, Principal Executive Officer and Treasurer, The Invesco Funds; Vice President, Invesco Advisers, Inc. (formerly known as Invesco Institutional (N.A.), Inc.) (registered investment adviser); and Vice President, Invesco Exchange-Traded Fund Trust, Invesco Exchange-Traded Fund Trust II, Invesco India Exchange-Traded Fund Trust, Invesco Actively Managed Exchange-Traded Fund Trust, Invesco Actively Managed Exchange-Traded Commodity Fund Trust and Invesco Exchange-Traded Self-Indexed Fund Trust; and Vice President, OppenheimerFunds, Inc. Formerly: Vice President and Principal Financial Officer, The Invesco Funds; Vice President, Invesco AIM Advisers, Inc., Invesco AIM Capital Management, Inc. and Invesco AIM Private Asset Management, Inc.; Assistant Vice President and Assistant Treasurer, The Invesco Funds and Assistant Vice President, Invesco Advisers, Inc., Invesco AIM Capital Management, Inc. and Invesco AIM Private Asset Management, Inc.; and Treasurer, Invesco Exchange-Traded Fund Trust, Invesco Exchange-Traded Fund Trust II, Invesco India Exchange-Traded Fund Trust and Invesco Actively Managed Exchange-Traded Fund Trust | | N/A | | N/A |
Russell C. Burk - 1958
Senior Vice President and Senior Officer | | 2005 | | Senior Vice President and Senior Officer, The Invesco Funds | | N/A | | N/A |
Jeffrey H. Kupor - 1968
Senior Vice President, Chief Legal Officer and Secretary | | 2018 | | Head of Legal of the Americas, Invesco Ltd.; Senior Vice President and Secretary, Invesco Advisers, Inc. (formerly known as Invesco Institutional (N.A.), Inc.) (registered investment adviser); Senior Vice President and Secretary, Invesco Distributors, Inc. (formerly known as Invesco AIM Distributors, Inc.); Vice President and Secretary, Invesco Investment Services, Inc. (formerly known as Invesco AIM Investment Services, Inc.) Senior Vice President, Chief Legal Officer and Secretary, The Invesco Funds; Secretary and General Counsel, Invesco Investment Advisers LLC (formerly known as Van Kampen Asset Management); Secretary and General Counsel, Invesco Capital Markets, Inc. (formerly known as Van Kampen Funds Inc.) and Chief Legal Officer, Invesco Exchange-Traded Fund Trust, Invesco Exchange-Traded Fund Trust II, Invesco India Exchange-Traded Fund Trust, Invesco Actively Managed Exchange-Traded Fund Trust, Invesco Actively Managed Exchange-Traded Commodity Fund Trust and Invesco Exchange-Traded Self-Indexed Fund Trust; Secretary, Invesco Indexing LLC; Secretary, W.L. Ross & Co., LLC Formerly: Secretary and Vice President, Jemstep, Inc.; Head of Legal, Worldwide Institutional, Invesco Ltd.; Secretary and General Counsel, INVESCO Private Capital Investments, Inc.; Senior Vice President, Secretary and General Counsel, Invesco Management Group, Inc. (formerly known as Invesco AIM Management Group, Inc.); Assistant Secretary, INVESCO Asset Management (Bermuda) Ltd.; Secretary and General Counsel, Invesco Private Capital, Inc.; Assistant Secretary and General Counsel, INVESCO Realty, Inc.; Secretary and General Counsel, Invesco Senior Secured Management, Inc.; and Secretary, Sovereign G./P. Holdings Inc. | | N/A | | N/A |
Andrew R. Schlossberg - 1974
Senior Vice President | | 2019 | | Head of the Americas and Senior Managing Director, Invesco Ltd.; Director and Senior Vice President, Invesco Advisers, Inc. (formerly known as Invesco Institutional (N.A.), Inc.) (registered investment adviser); Director and Chairman, Invesco Investment Services, Inc. (formerly known as Invesco AIM Investment Services, Inc.) (registered transfer agent); Senior Vice President, The Invesco Funds; Director, Invesco Investment Advisers LLC (formerly known as Van Kampen Asset Management); Director, President and Chairman, Invesco Insurance Agency, Inc. Formerly: Director, Invesco UK Limited; Director and Chief Executive, Invesco Asset Management Limited and Invesco Fund Managers Limited; Assistant Vice President, The Invesco Funds; Senior Vice President, Invesco Advisers, Inc. (formerly known as Invesco Institutional (N.A.), Inc.) (registered investment adviser); Director and Chief Executive, Invesco Administration Services Limited and Invesco Global Investment Funds Limited; Director, Invesco Distributors, Inc.; Head of EMEA, Invesco Ltd.; President, Invesco Actively Managed Exchange-Traded Commodity Fund Trust, Invesco Actively Managed Exchange-Traded Fund Trust, Invesco Exchange-Traded Fund Trust, Invesco Exchange-Traded Fund Trust II and Invesco India Exchange-Traded Fund Trust; Managing Director and Principal Executive Officer, Invesco Capital Management LLC | | N/A | | N/A |
Invesco V.I. Growth and Income Fund
Trustees and Officers–(continued)
| | | | | | | | |
Name, Year of Birth and
Position(s)
Held with the Trust | | Trustee
and/or
Officer
Since | | Principal Occupation(s)
During Past 5 Years | | Number of
Funds in
Fund Complex
Overseen by
Trustee | | Other
Directorship(s)
Held by Trustee
During Past 5
Years |
| Officers—(continued) | | | | | | | | |
John M. Zerr - 1962 Senior Vice President | | 2006 | | Chief Operating Officer of the Americas; Senior Vice President, Invesco Advisers, Inc. (formerly known as Invesco Institutional (N.A.), Inc.) (registered investment adviser); Senior Vice President, Invesco Distributors, Inc. (formerly known as Invesco AIM Distributors, Inc.); Director and Vice President, Invesco Investment Services, Inc. (formerly known as Invesco AIM Investment Services, Inc.) Senior Vice President, The Invesco Funds; Managing Director, Invesco Capital Management LLC; Director, Invesco Investment Advisers LLC (formerly known as Van Kampen Asset Management); Senior Vice President, Invesco Capital Markets, Inc. (formerly known as Van Kampen Funds Inc.); Manager, Invesco Indexing LLC; Manager, Invesco Specialized Products, LLC; Director and Senior Vice President, Invesco Insurance Agency, Inc.; Member, Invesco Canada Funds Advisory Board; Director, President and Chief Executive Officer, Invesco Corporate Class Inc. (corporate mutual fund company); and Director, Chairman, President and Chief Executive Officer, Invesco Canada Ltd. (formerly known as Invesco Trimark Ltd./Invesco Trimark Ltèe) (registered investment adviser and registered transfer agent) Formerly: Director and Senior Vice President, Invesco Management Group, Inc. (formerly known as Invesco AIM Management Group, Inc.); Secretary and General Counsel, Invesco Management Group, Inc. (formerly known as Invesco AIM Management Group, Inc.); Secretary, Invesco Investment Services, Inc. (formerly known as Invesco AIM Investment Services, Inc.); Chief Legal Officer and Secretary, The Invesco Funds; Secretary and General Counsel, Invesco Investment Advisers LLC (formerly known as Van Kampen Asset Management); Secretary and General Counsel, Invesco Capital Markets, Inc. (formerly known as Van Kampen Funds Inc.); Chief Legal Officer, Invesco Exchange-Traded Fund Trust, Invesco Exchange-Traded Fund Trust II, Invesco India Exchange-Traded Fund Trust, Invesco Actively Managed Exchange-Traded Fund Trust, Invesco Actively Managed Exchange-Traded Commodity Fund Trust and Invesco Exchange-Traded Self-Indexed Fund Trust; Secretary, Invesco Indexing LLC; Director, Secretary, General Counsel and Senior Vice President, Van Kampen Exchange Corp.; Director, Vice President and Secretary, IVZ Distributors, Inc. (formerly known as INVESCO Distributors, Inc.); Director and Vice President, INVESCO Funds Group, Inc.; Director and Vice President, Van Kampen Advisors Inc.; Director, Vice President, Secretary and General Counsel, Van Kampen Investor Services Inc.;Director and Secretary, Invesco Distributors, Inc. (formerly known as Invesco AIM Distributors, Inc.); Director, Senior Vice President, General Counsel and Secretary, Invesco AIM Advisers, Inc. and Van Kampen Investments Inc.; Director, Vice President and Secretary, Fund Management Company; Director, Senior Vice President, Secretary, General Counsel and Vice President, Invesco AIM Capital Management, Inc.; Chief Operating Officer and General Counsel, Liberty Ridge Capital, Inc. (an investment adviser) | | N/A | | N/A |
| Gregory G. McGreevey - 1962 Senior Vice President | | 2012 | | Senior Managing Director, Invesco Ltd.; Director, Chairman, President, and Chief Executive Officer, Invesco Advisers, Inc. (formerly known as Invesco Institutional (N.A.), Inc.) (registered investment adviser); Director, Invesco Mortgage Capital, Inc. and Invesco Senior Secured Management, Inc.; and Senior Vice President, The Invesco Funds; and President, SNW Asset Management Corporation Formerly: Senior Vice President, Invesco Management Group, Inc. and Invesco Advisers, Inc.; Assistant Vice President, The Invesco Funds | | N/A | | N/A |
Kelli Gallegos - 1970 Vice President, Principal Financial Officer and Assistant Treasurer | | 2008 | | Principal Financial and Accounting Officer - Investments Pool, Invesco Specialized Products, LLC; Vice President, Principal Financial Officer and Assistant Treasurer, The Invesco Funds; Principal Financial and Accounting Officer - Pooled Investments, Invesco Capital Management LLC; Vice President and Treasurer, Invesco Exchange-Traded Fund Trust, Invesco Exchange-Traded Fund Trust II, Invesco India Exchange-Traded Fund Trust, Invesco Actively Managed Exchange-Traded Fund Trust, Invesco Actively Managed Exchange-Traded Commodity Fund Trust and Invesco Exchange-Traded Self-Indexed Fund Trust Formerly: Assistant Treasurer, Invesco Specialized Products, LLC; Assistant Treasurer, Invesco Exchange-Traded Fund Trust, Invesco Exchange-Traded Fund Trust II, Invesco India Exchange-Traded Fund Trust, Invesco Actively Managed Exchange-Traded Fund Trust, Invesco Actively Managed Exchange-Traded Commodity Fund Trust and Invesco Exchange-Traded Self-Indexed Fund Trust; Assistant Treasurer, Invesco Capital Management LLC; Assistant Vice President, The Invesco Funds | | N/A | | N/A |
Invesco V.I. Growth and Income Fund
Trustees and Officers–(continued)
| | | | | | | | |
Name, Year of Birth and
Position(s)
Held with the Trust | | Trustee
and/or
Officer
Since | | Principal Occupation(s)
During Past 5 Years | | Number of
Funds in
Fund Complex
Overseen by
Trustee | | Other
Directorship(s)
Held by Trustee
During Past 5
Years |
| Officers-(continued) | | | | | | | | |
Crissie M. Wisdom - 1969 Anti-Money Laundering Compliance Officer | | 2013 | | Anti-Money Laundering Compliance Officer, Invesco Advisers, Inc. (formerly known as Invesco Institutional (N.A.), Inc.) (registered investment adviser), Invesco Capital Markets, Inc. (formerly known as Van Kampen Funds Inc.), Invesco Distributors, Inc., Invesco Investment Services, Inc., The Invesco Funds, and Invesco Exchange-Traded Fund Trust, Invesco Exchange-Traded Fund Trust II, Invesco India Exchange-Traded Fund Trust, Invesco Actively Managed Exchange-Traded Fund Trust, Invesco Actively Managed Exchange-Traded Commodity Fund Trust and Invesco Exchange-Traded Self-Indexed Fund Trust; Anti-Money Laundering Compliance Officer and Bank Secrecy Act Officer, INVESCO National Trust Company and Invesco Trust Company; and Fraud Prevention Manager and Controls and Risk Analysis Manager for Invesco Investment Services, Inc. Formerly: Anti-Money Laundering Compliance Officer, Van Kampen Exchange Corp. and Invesco Management Group, Inc. | | N/A | | N/A |
Robert R. Leveille - 1969 Chief Compliance Officer | | 2016 | | Chief Compliance Officer, Invesco Advisers, Inc. (registered investment adviser); and Chief Compliance Officer, The Invesco Funds Formerly: Chief Compliance Officer, Putnam Investments and the Putnam Funds | | N/A | | N/A |
The Statement of Additional Information of the Trust includes additional information about the Fund’s Trustees and is available upon request, without charge, by calling 1.800.959.4246. Please refer to the Fund’s Statement of Additional Information for information on the Fund’ssub-advisers.
| | | | | | |
Office of the Fund 11 Greenway Plaza, Suite 1000 Houston, TX 77046-1173 | | Investment Adviser Invesco Advisers, Inc. 1555 Peachtree Street, N.E. Atlanta, GA 30309 | | Distributor Invesco Distributors, Inc. 11 Greenway Plaza, Suite 1000 Houston, TX 77046-1173 | | Auditors PricewaterhouseCoopers LLP 1000 Louisiana Street, Suite 5800 Houston, TX 77002-5678 |
| | | |
Counsel to the Fund Stradley Ronon Stevens & Young, LLP 2005 Market Street, Suite 2600 Philadelphia, PA 19103-7018 | | Counsel to the Independent Trustees Goodwin Procter LLP 901 New York Avenue, N.W. Washington, D.C. 20001 | | Transfer Agent Invesco Investment Services, Inc. 11 Greenway Plaza, Suite 1000 Houston, TX 77046-1173 | | Custodian State Street Bank and Trust Company 225 Franklin Street Boston, MA 02110-2801 |
Invesco V.I. Growth and Income Fund
| | | | |
| | |
 | | Annual Report to Shareholders | | December 31, 2019 |
| | |
| | Invesco V.I. Health Care Fund |

Beginning on January 1, 2021, as permitted by regulations adopted by the Securities and Exchange Commission, the insurance company that offers your variable annuity or variable life insurance contract may no longer send you paper copies of the Fund’s shareholder reports by mail, unless you specifically request paper copies of the reports from the insurance company or your financial intermediary. Instead of delivering paper copies of the report, the insurance company may choose to make the reports available on a website, and will notify you by mail each time a report is posted and provide you with a website link to access the report. Instructions for requesting paper copies will be provided by your insurance company.
If the insurance company offers electronic delivery, you may elect to receive shareholder reports and other communications about the Fund electronically by following the instructions provided by the insurance company or by contacting your financial intermediary. If you already elected to receive shareholder reports electronically, you will not be affected by this change and you need not take any action.
You may elect to receive all future reports in paper free of charge from the insurance company. You can inform the insurance company or your financial intermediary that you wish to continue receiving paper copies of your shareholder reports by following the instructions provided by the insurance company or by contacting your financial intermediary. Your election to receive reports in paper will apply to all portfolio companies available under your contract with the insurance company.
The Fund provides a complete list of its holdings four times in each fiscal year, at the quarter-ends. For the second and fourth quarters, the lists appear in the Fund’s semiannual and annual reports to shareholders. For the first and third quarters, the Fund files the lists with the Securities and Exchange Commission (SEC) as an exhibit to its reports on FormN-PORT. The Fund’s FormN-PORT filings are available on the SEC website, sec.gov. The SEC file numbers for the Fund are811-07452 and033-57340. The Fund’s most recent portfolio holdings, as filed on FormN-PORT, have also been made available to insurance companies issuing variable annuity contracts and variable life insurance policies (“variable products”) that invest in the Fund.
A description of the policies and procedures that the Fund uses to determine how to vote proxies relating to portfolio securities is available without charge, upon request, from our Client Services department at 800 959 4246 or at invesco.com/proxyguidelines. The information is also available on the SEC website, sec.gov.
Information regarding how the Fund voted proxies related to its portfolio securities during the most recent12-month period ended June 30 is available at invesco.com/proxysearch. The information is also available on the SEC website, sec.gov.
Invesco Advisers, Inc. is an investment adviser; it provides investment advisory services to individual and institutional clients and does not sell securities. Invesco Distributors, Inc. is the US distributor for Invesco Ltd.’s retail mutual funds, exchange-traded funds and institutional money market funds. Both are wholly owned, indirect subsidiaries of Invesco Ltd.
This report must be accompanied or preceded by a currently effective Fund prospectus and variable product prospectus, which contain more complete information, including sales charges and expenses. Investors should read each carefully before investing.
NOT FDIC INSURED | MAY LOSE VALUE | NO BANK GUARANTEE
| | | | |
| Invesco Distributors, Inc. | | | | I-VIGHC-AR-1 |
Management’s Discussion of Fund Performance
| | | | | |
Performance summary For the year ended December 31, 2019, Series I shares of Invesco V.I. Health Care Fund (the Fund) outperformed the MSCI World Health Care Index, the Fund’s style-specific benchmark. Your Fund’s long-term performance appears later in this report. | |
Fund vs. Indexes Total returns, 12/31/18 to 12/31/19, excluding variable product issuer charges. If variable product issuer charges were included, returns would be lower. | |
| |
| Series I Shares | | | | 32.50 | % |
| Series II Shares | | | | 32.18 | |
| MSCI World Indexq(Broad Market Index) | | | | 27.67 | |
| MSCI World Health Care Indexq(Style-Specific Index) | | | | 23.24 | |
| Lipper VUF Health/Biotechnology Funds Classification Average∎(Peer Group) | | | | 27.16 | |
| Source(s):qRIMES Technologies Corp.;∎Lipper Inc. | | | | | |
Market conditions and your Fund
Equity markets rallied in the first quarter of 2019, fueled by optimism about a potentialUS-China trade deal and indication that the US Federal Reserve (the Fed) would not raise interest rates in 2019, a surprising shift in monetary policy. The Fed’s more accommodative stance provided a supportive environment for equities and fixed income, even as US economic data were mixed and overseas growth appeared to be slowing. Against this backdrop, the S&P 500 Index posted its best first quarter returns since 1998.
Although the S&P 500 Index posted modest gains for the second quarter of 2019, the US stock market experienced increased volatility. After four consecutive months of rising stock markets, the market sold off in May 2019, along with bond yields and oil prices, as investors weighed the impact of the lingering trade war between the US and China, as well as potential tariffs imposed on Mexico. In addition, economic data showed a slowing domestic and global economy.
Key issues that concerned investors in the second quarter of 2019 carried over into the third quarter. TheUS-China trade conflict worried investors and stifled business investment, even as the
Fed cut interest rates by 0.25% in July and again in September 2019.1 This environment, combined with evidence of slowing global economic growth, fueled market volatility in August 2019. The US Treasury yield curve inverted several times, increasing fears of a possible US recession. As a result, August saw increased risk aversion, with investors crowding into asset classes perceived as safe havens, such as US Treasuries and gold. However, the Fed’s accommodative tone provided some support for risk assets.
Macroeconomic issues that concerned investors in the third quarter of 2019 mostly abated during the fourth quarter, providing the backdrop for strong equity market returns. Risk assets surged higher as a result of a delay in the Brexit agreement until January 2020, optimism that phase one of aUS-China trade deal would be completed and better-than-expected third-quarter corporate earnings results. The US economy rose higher than expected, at 2.1% during the third quarter of 2019.2 During its Octobermeeting, the Fed cut interest rates again by 0.25% based on business investment and exports remaining weak.1 Investors were also encouraged by a resilient US
economy and corporate earnings, putting the US equity market on track for its largest annual rise since 2013.
Stock selection in biotechnology and pharmaceuticals was the main driver behind the Fund’s outperformance relative to the style-specific benchmark during the year.Axsome Therapeutics, a neurology company developing potentialbest-in-class drugs for depression, migraine, agitation and narcolepsy, was the greatest contributor to relative performance. The company reported positive data in narcolepsy and depression in 2019. In the fourth quarter, Axsome announced positivetop-line data for the phase III GEMINI trial ofAXS-05 in major depressive disorder. The effects, speed of onset, responder rates and deepening effect over time positionAXS-05 as a differentiated therapy that could potentially be a new standard of care.Array BioPharmawas the second-largest contributor to the Fund’s relative performance. Array BioPharma is a discovery research company that provides drug discovery products and services to create, evaluate and optimize potential drug candidates in collaboration with pharmaceutical and biotechnology companies. The company’s stock soared after announcing positive clinical trial results in early spring and then was bought byPfizerin June 2019.
Stock selection in managed health care and life science tools and services also aided the Fund’s performance versus the style-specific benchmark during the year. The greatest contributor of these beingThermo Fisher Scientific,alife sciences tools and services company. The firm consolidated its presence in this market with several acquisitions, most recently Affymetrix, FEI and Patheon (not Fund holdings), with the goal of continuing to be the ultimate provider of life science instruments and consumables. The acquisition approach has allowed the
| | |
| Portfolio Composition |
By country | | % of total net assets |
| |
| United States | | 75.28% |
| Switzerland | | 6.56 |
| United Kingdom | | 3.77 |
| Brazil | | 2.86 |
| France | | 2.80 |
| Denmark | | 2.47 |
| Countries, each less than 2% of portfolio | | 4.67 |
| Money Market Funds Plus Other Assets Less Liabilities | | 1.59 |
| | |
| Top 10 Equity Holdings* |
% of total net assets |
| |
| 1. UnitedHealth Group, Inc. | | 4.61% |
2. Thermo Fisher Scientific, Inc. | | 4.41 |
3. Medtronic PLC | | 4.19 |
4. Novartis AG, ADR | | 4.17 |
5. Johnson & Johnson | | 3.92 |
6. AstraZeneca PLC, ADR | | 3.77 |
7. Merck & Co., Inc. | | 3.23 |
8. Sanofi, ADR | | 2.63 |
9. Biogen, Inc. | | 2.53 |
10. Zimmer Biomet Holdings, Inc. | | 2.45 |
| | |
| Total Net Assets | | $220.7 million |
| |
| Total Number of Holdings* | | 72 |
The Fund’s holdings are subject to change, and there is no assurance that the Fund will continue to hold any particular security.
*Excluding money market fund holdings, if any.
Data presented here are as of December 31, 2019.
Invesco V.I. Health Care Fund
firm to broaden its product offering and increase market share.
Stock selection in health care equipment and health care supplies detracted from the Fund’s performance relative to the style-specific benchmark during the year. Specifically,Alcon,the largest eye care device company in the world. In 2019, the companyspun-off fromNovartisand management was optimistic that this independence would result in increased flexibility and improved performance. The stock price was not particularly strong during the year, as the company worked through separation costs and restructuring plans.Wright Medical,a medical device company specializing in extremities and biologics products, also detracted from the Fund’s relative performance. The firm had a difficult second quarter with salesforce integration issues slowing momentum and lowering forward guidance. However, in the fourth quarter Stryker (not a Fund holding) agreed to buy Wright at a 52% premium to its stock price at the time.
We continue to believe research and development productivity within health care remains robust, as information technology increasingly intersects with new medical technologies and a receptive regulatory environment to shepherd new treatments to market. Therefore, we continue to emphasize and search for new investment opportunities in the biotechnology and pharmaceuticals industries, and in areas like life sciences tools and services, and medical devices.
As always, thank you for your continued investment in Invesco V.I. Health Care Fund.
| 1 | Source: US Federal Reserve |
| 2 | Source: Bureau of Economic Analysis |
Portfolio managers:
Henry Wu
The views and opinions expressed in management’s discussion of Fund performance are those of Invesco Advisers, Inc. These views and opinions are subject to change at any time based on factors such as market and economic conditions. These views and opinions may not be relied upon as investment advice or recommendations, or as an offer for a particular security. The information is not a complete analysis of every aspect of any market, country, industry, security or the Fund. Statements of fact are from sources considered reliable, but Invesco Advisers, Inc. makes no representation or warranty as to their completeness or accuracy. Although historical performance is no guarantee of future results, these insights may help you understand our investment management philosophy.
See important Fund and, if applicable, index disclosures later in this report.
Invesco V.I. Health Care Fund
Your Fund’s Long-Term Performance
Results of a $10,000 Investment – Oldest Share Class(es)
Fund and index data from 12/31/09
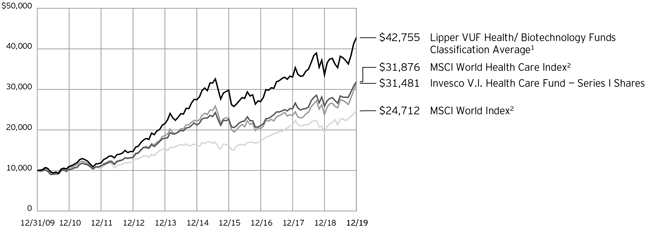
| 2 | Source: RIMES Technologies Corp. |
Past performance cannot guarantee
future results.
| | | | |
| Average Annual Total Returns | |
As of 12/31/19 | | | | |
| |
| Series I Shares | | | | |
| Inception (5/21/97) | | | 9.09% | |
| 10 Years | | | 12.15 | |
| 5 Years | | | 7.18 | |
| 1 Year | | | 32.50 | |
| |
| Series II Shares | | | | |
| Inception (4/30/04) | | | 8.61% | |
| 10 Years | | | 11.87 | |
| 5 Years | | | 6.91 | |
| 1 Year | | | 32.18 | |
The performance of the Fund’s Series I and Series II share classes will differ primarily due to different class expenses.
The performance data quoted represent past performance and cannot guarantee future results; current performance may be lower or higher. Please contact your variable product issuer or financial adviser for the most recentmonth-end variable product performance. Performance figures reflect Fund expenses, reinvested distributions and changes in net asset value. Performance figures do not reflect deduction of taxes a shareholder would pay on Fund distributions or sale of Fund shares. Investment return and principal value will fluctuate so that you may have a gain or loss when you sell shares.
The total annual Fund operating expense ratio set forth in the most recent Fund prospectus as of the date of this report for Series I and Series II shares was 1.00% and 1.25%, respectively. The expense ratios presented above may vary from the expense
ratios presented in other sections of this report that are based on expenses incurred during the period covered by this report.
Invesco V.I. Health Care Fund, a series portfolio of AIM Variable Insurance Funds (Invesco Variable Insurance Funds), is currently offered through insurance companies issuing variable products. You cannot purchase shares of the Fund directly. Performance figures given represent the Fund and are not intended to reflect actual variable product values. They do not reflect sales charges, expenses and fees assessed in connection with a variable product. Sales charges, expenses and fees, which are determined by the variable product issuers, will vary and will lower the total return.
The most recentmonth-end performance at the Fund level, excluding variable product charges, is available at 800 451 4246. As mentioned above, for the most recentmonth-end performance including variable product charges, please contact your variable product issuer or financial adviser.
Fund performance reflects any applicable fee waivers and/or expense reimbursements. Had the adviser not waived fees and/or reimbursed expenses currently or in the past, returns would have been lower. See current prospectus for more information.
Invesco V.I. Health Care Fund
Invesco V.I. Health Care Fund’s investment objective is long-term growth of capital.
| ∎ | | Unless otherwise stated, information presented in this report is as of December 31, 2019, and is based on total net assets. |
| ∎ | | Unless otherwise noted, all data provided by Invesco. |
| ∎ | | To access your Fund’s reports/prospectus, visit invesco.com/fundreports. |
About indexes used in this report
| ∎ | | TheMSCI World Indexis an unmanaged index considered representative of stocks of developed countries. The index is computed using the net return, which withholds applicable taxes fornon-resident investors. |
| ∎ | | TheMSCI World Health Care Indexis an unmanaged index considered representative of health care stocks of developed countries. The index is computed using the net return, which withholds applicable taxes for nonresident investors. |
| ∎ | | TheLipper VUF Health/Biotechnology Funds Classification Averagerepresents an average of all variable insurance underlying funds in the Lipper Health/Biotechnology Funds classification. |
| ∎ | | TheS&P 500® Indexis an unmanaged index considered representative of the US stock market. |
| ∎ | | The Fund is not managed to track the performance of any particular index, including the index(es) described here, and consequently, the performance of the Fund may deviate significantly from the performance of the index(es). |
| ∎ | | A direct investment cannot be made in an index. Unless otherwise indicated, index results include reinvested dividends, and they do not reflect sales charges. Performance of the peer group, if applicable, reflects fund expenses; performance of a market index does not. |
Other information
| ∎ | | The returns shown in management’s discussion of Fund performance are based on net asset values calculated for shareholder transactions. Generally accepted accounting principles require adjustments to be made to the net assets of the Fund at period end for financial reporting purposes, and as such, the net asset values for shareholder transactions and the returns based on those net asset values may differ from the net asset values and returns reported in the Financial Highlights. Additionally, the returns and net asset values shown throughout this report are at the Fund level only and do not include variable |
| | product issuer charges. If such charges were included, the total returns would be lower. |
| ∎ | | Industry classifications used in this report are generally according to the Global Industry Classification Standard, which was developed by and is the exclusive property and a service mark of MSCI Inc. and Standard & Poor’s. |
Invesco V.I. Health Care Fund
Schedule of Investments(a)
December 31, 2019
| | | | | | | | |
| | | Shares | | | Value | |
Common Stocks & Other Equity Interests-98.41% | |
| Biotechnology-17.70% | |
ACADIA Pharmaceuticals, Inc.(b) | | | 29,163 | | | $ | 1,247,593 | |
| |
Alexion Pharmaceuticals, Inc.(b) | | | 27,043 | | | | 2,924,700 | |
| |
Amarin Corp. PLC, ADR (Ireland)(b) | | | 53,490 | | | | 1,146,826 | |
| |
Ascendis Pharma A/S, ADR (Denmark)(b) | | | 9,637 | | | | 1,340,699 | |
| |
Avrobio, Inc.(b) | | | 15,465 | | | | 311,310 | |
| |
Biogen, Inc.(b) | | | 18,845 | | | | 5,591,877 | |
| |
Biohaven Pharmaceutical Holding Co. Ltd.(b) | | | 21,736 | | | | 1,183,308 | |
| |
BioMarin Pharmaceutical, Inc.(b) | | | 48,889 | | | | 4,133,565 | |
| |
Bluebird Bio, Inc.(b) | | | 5,791 | | | | 508,160 | |
| |
Constellation Pharmaceuticals, Inc.(b) | | | 8,994 | | | | 423,707 | |
| |
DBV Technologies S.A., ADR (France)(b) | | | 34,735 | | | | 371,665 | |
| |
Exact Sciences Corp.(b) | | | 31,402 | | | | 2,904,057 | |
| |
Global Blood Therapeutics, Inc.(b) | | | 19,010 | | | | 1,511,105 | |
| |
Heron Therapeutics, Inc.(b) | | | 27,976 | | | | 657,436 | |
| |
Immunomedics, Inc.(b) | | | 55,348 | | | | 1,171,164 | |
| |
Incyte Corp.(b) | | | 20,164 | | | | 1,760,721 | |
| |
IVERIC bio, Inc.(b) | | | 103,668 | | | | 889,471 | |
| |
Kadmon Holdings, Inc.(b) | | | 189,896 | | | | 860,229 | |
| |
Neurocrine Biosciences, Inc.(b) | | | 14,118 | | | | 1,517,544 | |
| |
REGENXBIO, Inc.(b) | | | 14,958 | | | | 612,829 | |
| |
Rocket Pharmaceuticals, Inc.(b) | | | 63,634 | | | | 1,448,310 | |
| |
Rubius Therapeutics, Inc.(b) | | | 40,991 | | | | 389,415 | |
| |
Sarepta Therapeutics, Inc.(b) | | | 11,570 | | | | 1,492,993 | |
| |
Vertex Pharmaceuticals, Inc.(b) | | | 21,353 | | | | 4,675,239 | |
| |
| | | | | | | 39,073,923 | |
| |
|
| Drug Retail-0.61% | |
Raia Drogasil S.A. (Brazil) | | | 48,660 | | | | 1,352,087 | |
| |
|
| Health Care Equipment-16.87% | |
Abbott Laboratories | | | 62,242 | | | | 5,406,340 | |
| |
Baxter International, Inc. | | | 31,801 | | | | 2,659,200 | |
| |
Becton, Dickinson and Co. | | | 6,568 | | | | 1,786,299 | |
| |
Boston Scientific Corp.(b) | | | 115,911 | | | | 5,241,495 | |
| |
Edwards Lifesciences Corp.(b) | | | 12,869 | | | | 3,002,209 | |
| |
Globus Medical, Inc., Class A(b) | | | 9,201 | | | | 541,755 | |
| |
Koninklijke Philips N.V. (Netherlands) | | | 80,603 | | | | 3,940,614 | |
| |
Medtronic PLC | | | 81,585 | | | | 9,255,818 | |
| |
Zimmer Biomet Holdings, Inc. | | | 36,147 | | | | 5,410,483 | |
| |
| | | | | | | 37,244,213 | |
| |
|
| Health Care Facilities–1.62% | |
HCA Healthcare, Inc. | | | 24,171 | | | | 3,572,716 | |
| |
|
| Health Care Services-2.91% | |
Cigna Corp. | | | 16,951 | | | | 3,466,310 | |
| |
CVS Health Corp. | | | 39,698 | | | | 2,949,164 | |
| |
| | | | | | | 6,415,474 | |
| |
| | | | | | | | |
| | | Shares | | | Value | |
| Health Care Supplies-2.03% | |
Alcon, Inc. (Switzerland)(b) | | | 20,862 | | | $ | 1,180,163 | |
| |
Align Technology, Inc.(b) | | | 6,791 | | | | 1,894,961 | |
| |
Silk Road Medical, Inc.(b) | | | 34,745 | | | | 1,403,003 | |
| |
| | | | | | | 4,478,127 | |
| |
|
| Health Care Technology-1.30% | |
HMS Holdings Corp.(b) | | | 32,082 | | | | 949,627 | |
Inspire Medical Systems, Inc.(b) | | | 25,931 | | | | 1,924,340 | |
| |
| | | | | | | 2,873,967 | |
| |
|
| Life Sciences Tools & Services-8.51% | |
10X Genomics, Inc., Class A(b) | | | 9,554 | | | | 728,493 | |
| |
Agilent Technologies, Inc. | | | 16,723 | | | | 1,426,639 | |
| |
Bio-Rad Laboratories, Inc., Class A(b) | | | 6,180 | | | | 2,286,785 | |
| |
Eurofins Scientific SE (Luxembourg) | | | 3,811 | | | | 2,116,398 | |
| |
Illumina, Inc.(b) | | | 7,505 | | | | 2,489,709 | |
| |
Thermo Fisher Scientific, Inc. | | | 29,943 | | | | 9,727,582 | |
| |
| | | | | | | 18,775,606 | |
| |
|
| Managed Health Care-13.53% | |
Anthem, Inc. | | | 15,612 | | | | 4,715,292 | |
| |
Centene Corp.(b) | | | 59,710 | | | | 3,753,968 | |
| |
Hapvida Participacoes e Investimentos S.A. (Brazil)(c) | | | 150,700 | | | | 2,396,722 | |
| |
HealthEquity, Inc.(b) | | | 11,488 | | | | 850,916 | |
| |
Humana, Inc. | | | 14,723 | | | | 5,396,274 | |
| |
Notre Dame Intermedica Participacoes S.A. (Brazil) | | | 150,683 | | | | 2,559,351 | |
| |
UnitedHealth Group, Inc. | | | 34,631 | | | | 10,180,821 | |
| |
| | | | | | | 29,853,344 | |
| |
|
| Pharmaceuticals-33.33% | |
AstraZeneca PLC, ADR (United Kingdom) | | | 166,828 | | | | 8,318,044 | |
| |
Axsome Therapeutics, Inc.(b) | | | 45,329 | | | | 4,685,205 | |
| |
Bristol-Myers Squibb Co. | | | 78,666 | | | | 5,049,570 | |
| |
Elanco Animal Health, Inc.(b) | | | 58,724 | | | | 1,729,422 | |
| |
Eli Lilly and Co. | | | 39,598 | | | | 5,204,365 | |
| |
Johnson & Johnson | | | 59,326 | | | | 8,653,884 | |
| |
Merck & Co., Inc. | | | 78,283 | | | | 7,119,839 | |
| |
Milestone Pharmaceuticals, Inc. (Canada)(b) | | | 34,630 | | | | 554,426 | |
| |
Nippon Shinyaku Co. Ltd. (Japan) | | | 29,200 | | | | 2,539,262 | |
| |
Novartis AG, ADR (Switzerland) | | | 97,228 | | | | 9,206,519 | |
| |
Novo Nordisk A/S, Class B (Denmark) | | | 70,943 | | | | 4,114,671 | |
| |
Odonate Therapeutics, Inc.(b) | | | 27,809 | | | | 902,402 | |
| |
Pfizer, Inc. | | | 90,493 | | | | 3,545,516 | |
| |
Relmada Therapeutics, Inc.(b) | | | 28,383 | | | | 1,106,937 | |
| |
Roche Holding AG (Switzerland) | | | 12,664 | | | | 4,106,404 | |
| |
Sanofi, ADR (France) | | | 115,630 | | | | 5,804,626 | |
| |
See accompanying Notes to Financial Statements which are an integral part of the financial statements.
Invesco V.I. Health Care Fund
| | | | | | | | |
| | | Shares | | | Value | |
| Pharmaceuticals–(continued) | |
Zogenix, Inc.(b) | | | 17,712 | | | $ | 923,327 | |
| |
| | | | | | | 73,564,419 | |
| |
Total Common Stocks & Other Equity Interests
(Cost $143,337,219) | | | | 217,203,876 | |
| |
|
| Money Market Funds–1.73% | |
Invesco Government & Agency Portfolio, Institutional Class, 1.50%(d) | | | 1,366,547 | | | | 1,366,547 | |
| |
Invesco Liquid Assets Portfolio, Institutional Class, 1.71%(d) | | | 893,541 | | | | 893,809 | |
| |
| | | | | | | | |
| | | Shares | | | Value | |
Invesco Treasury Portfolio, Institutional Class, 1.49%(d) | | | 1,561,768 | | | $ | 1,561,768 | |
| |
Total Money Market Funds
(Cost $3,822,164) | | | | 3,822,124 | |
| |
TOTAL INVESTMENTS INSECURITIES-100.14%
(Cost $147,159,383) | | | | 221,026,000 | |
| |
OTHER ASSETS LESS LIABILITIES–(0.14)% | | | | (308,643 | ) |
| |
NET ASSETS-100.00% | | | $ | 220,717,357 | |
| |
Investment Abbreviations:
| | | | |
ADR – American Depositary Receipt |
Notes to Schedule of Investments:
| (a) | Industry and/or sector classifications used in this report are generally according to the Global Industry Classification Standard, which was developed by and is the exclusive property and a service mark of MSCI Inc. and Standard & Poor’s. |
| (b) | Non-income producing security. |
| (c) | Security purchased or received in a transaction exempt from registration under the Securities Act of 1933, as amended (the “1933 Act”). The security may be resold pursuant to an exemption from registration under the 1933 Act, typically to qualified institutional buyers. The value of this security at December 31, 2019 represented 1.09% of the Fund’s Net Assets. |
| (d) | The money market fund and the Fund are affiliated by having the same investment adviser. The rate shown is the7-day SEC standardized yield as of December 31, 2019. |
See accompanying Notes to Financial Statements which are an integral part of the financial statements.
Invesco V.I. Health Care Fund
Statement of Assets and Liabilities
December 31, 2019
| | | | |
Assets: | | | | |
Investments in securities, at value
(Cost $143,337,219) | | $ | 217,203,876 | |
| |
Investments in affiliated money market funds, at value
(Cost $3,822,164) | | | 3,822,124 | |
| |
Foreign currencies, at value (Cost $53,968) | | | 54,562 | |
| |
Receivable for: | | | | |
Fund shares sold | | | 26,288 | |
| |
Dividends | | | 278,318 | |
| |
Investment for trustee deferred compensation and retirement plans | | | 81,744 | |
| |
Total assets | | | 221,466,912 | |
| |
| |
Liabilities: | | | | |
Payable for: | | | | |
Fund shares reacquired | | | 388,864 | |
| |
Amount due custodian | | | 110,478 | |
| |
Accrued fees to affiliates | | | 120,788 | |
| |
Accrued other operating expenses | | | 39,364 | |
| |
Trustee deferred compensation and retirement plans | | | 90,061 | |
| |
Total liabilities | | | 749,555 | |
| |
Net assets applicable to shares outstanding | | $ | 220,717,357 | |
| |
| |
Net assets consist of: | | | | |
Shares of beneficial interest | | $ | 141,570,385 | |
| |
Distributable earnings | | | 79,146,972 | |
| |
| | $ | 220,717,357 | |
| |
| |
Net Assets: | | | | |
Series I | | $ | 149,954,492 | |
| |
Series II | | $ | 70,762,865 | |
| |
|
Shares outstanding, no par value, with an unlimited number of shares authorized: | |
Series I | | | 4,960,896 | |
| |
Series II | | | 2,483,505 | |
| |
Series I: | | | | |
Net asset value per share | | $ | 30.23 | |
| |
Series II: | | | | |
Net asset value per share | | $ | 28.49 | |
| |
Statement of Operations
For the year ended December 31, 2019
| | | | |
Investment income: | | | | |
Dividends (net of foreign withholding taxes of $122,215) | | $ | 2,496,070 | |
| |
Dividends from affiliated money market funds | | | 90,288 | |
| |
Total investment income | | | 2,586,358 | |
| |
| |
Expenses: | | | | |
Advisory fees | | | 1,505,765 | |
| |
Administrative services fees | | | 326,651 | |
| |
Custodian fees | | | 8,484 | |
| |
Distribution fees - Series II | | | 161,301 | |
| |
Transfer agent fees | | | 31,478 | |
| |
Trustees’ and officers’ fees and benefits | | | 20,911 | |
| |
Reports to shareholders | | | 8,189 | |
| |
Professional services fees | | | 48,589 | |
| |
Other | | | 3,208 | |
| |
Total expenses | | | 2,114,576 | |
| |
Less: Fees waived | | | (4,841 | ) |
| |
Net expenses | | | 2,109,735 | |
| |
Net investment income | | | 476,623 | |
| |
| |
Realized and unrealized gain from: | | | | |
Net realized gain from: | | | | |
Investment securities | | | 5,110,258 | |
| |
Foreign currencies | | | 1,676 | |
| |
| | | 5,111,934 | |
| |
Change in net unrealized appreciation of: | | | | |
Investment securities | | | 50,734,461 | |
| |
Foreign currencies | | | 1,765 | |
| |
| | | 50,736,226 | |
| |
Net realized and unrealized gain | | | 55,848,160 | |
| |
Net increase in net assets resulting from operations | | $ | 56,324,783 | |
| |
See accompanying Notes to Financial Statements which are an integral part of the financial statements.
Invesco V.I. Health Care Fund
Statement of Changes in Net Assets
For the years ended December 31, 2019 and 2018
| | | | | | | | |
| | | 2019 | | | 2018 | |
| |
Operations: | | | | | | | | |
Net investment income | | $ | 476,623 | | | $ | 52,575 | |
| |
Net realized gain | | | 5,111,934 | | | | 6,023,929 | |
| |
Change in net unrealized appreciation (depreciation) | | | 50,736,226 | | | | (4,170,670 | ) |
| |
Net increase in net assets resulting from operations | | | 56,324,783 | | | | 1,905,834 | |
| |
| | |
Distributions to shareholders from distributable earnings: | | | | | | | | |
Series I | | | (3,345,368 | ) | | | (18,007,655 | ) |
| |
Series II | | | (1,628,278 | ) | | | (8,604,944 | ) |
| |
Total distributions from distributable earnings | | | (4,973,646 | ) | | | (26,612,599 | ) |
| |
| | |
Share transactions-net: | | | | | | | | |
Series I | | | (14,313,793 | ) | | | 1,916,919 | |
| |
Series II | | | (6,003,015 | ) | | | 1,194,044 | |
| |
Net increase (decrease) in net assets resulting from share transactions | | | (20,316,808 | ) | | | 3,110,963 | |
| |
Net increase (decrease) in net assets | | | 31,034,329 | | | | (21,595,802 | ) |
| |
| | |
Net assets: | | | | | | | | |
Beginning of year | | | 189,683,028 | | | | 211,278,830 | |
| |
End of year | | $ | 220,717,357 | | | $ | 189,683,028 | |
| |
See accompanying Notes to Financial Statements which are an integral part of the financial statements.
Invesco V.I. Health Care Fund
Financial Highlights
The following schedule presents financial highlights for a share of the Fund outstanding throughout the periods indicated.
| | | | | | | | | | | | | | | | | | | | | | | | | | | | | | | | | | | | | | | | | | | | | | | | | | | | | | | | | | | | | | | | | | | | | | |
| | | Net asset
value,
beginning
of period | | Net
investment
income
(loss)(a) | | Net gains
(losses)
on securities
(both
realized and
unrealized) | | Total from
investment
operations | | Dividends
from net
investment
income | | Distributions
from net
realized
gains | | Total
distributions | | Net asset
value, end
of period | | Total
return (b) | | Net assets,
end of period
(000’s omitted) | | Ratio of
expenses
to average
net assets
with fee waivers
and/or
expenses
absorbed | | Ratio of
expenses
to average net
assets without
fee waivers
and/or
expenses
absorbed | | Ratio of net
investment
income
(loss)
to average
net assets | | Portfolio
turnover (c) |
Series I | | | | | | | | | | | | | | | | | | | | | | | | | | | | | | | | | | | | | | | | | | | | | | | | | | | | | | | | | | | | | | | | | | | | | | |
Year ended 12/31/19 | | | | $23.41 | | | | | $ 0.08 | | | | | $ 7.40 | | | | | $ 7.48 | | | | | $(0.01 | ) | | | | $(0.65 | ) | | | | $(0.66) | | | | $ | 30.2 | 3 | | | | 32.50 | % | | | | $149,95 | 4 | | | | 0.97% | (d) | | | | 0.97% | (d) | | | | 0.32% | (d) | | | | 8 | % |
Year ended 12/31/18 | | | | 26.44 | | | | | 0.03 | (e) | | | | 0.59 | | | | | 0.62 | | | | | - | | | | | (3.65 | ) | | | | (3.65 | ) | | | | 23.41 | | | | | 0.90 | | | | | 129,377 | | | | | 1.00 | | | | | 1.00 | | | | | 0.10 | (e) | | | | 35 | |
Year ended 12/31/17 | | | | 24.11 | | | | | (0.02 | ) | | | | 3.86 | | | | | 3.84 | | | | | (0.10 | ) | | | | (1.41 | ) | | | | (1.51 | ) | | | | 26.44 | | | | | 15.83 | | | | | 144,038 | | | | | 1.01 | | | | | 1.01 | | | | | (0.08 | ) | | | | 37 | |
Year ended 12/31/16 | | | | 31.75 | | | | | 0.09 | | | | | (3.36 | ) | | | | (3.27 | ) | | | | - | | | | | (4.37 | ) | | | | (4.37 | ) | | | | 24.11 | | | | | (11.46 | ) | | | | 145,408 | | | | | 1.04 | | | | | 1.04 | | | | | 0.31 | | | | | 23 | |
Year ended 12/31/15 | | | | 33.78 | | | | | 0.00 | | | | | 1.08 | | | | | 1.08 | | | | | - | | | | | (3.11 | ) | | | | (3.11 | ) | | | | 31.75 | | | | | 3.16 | | | | | 209,511 | | | | | 1.06 | | | | | 1.07 | | | | | 0.01 | | | | | 42 | |
Series II | | | | | | | | | | | | | | | | | | | | | | | | | | | | | | | | | | | | | | | | | | | | | | | | | | | | | | | | | | | | | | | | | | | | | | |
Year ended 12/31/19 | | | | 22.14 | | | | | 0.02 | | | | | 6.98 | | | | | 7.00 | | | | | - | | | | | (0.65 | ) | | | | (0.65 | ) | | | | 28.49 | | | | | 32.18 | | | | | 70,763 | | | | | 1.22 | (d) | | | | 1.22 | (d) | | | | 0.07 | (d) | | | | 8 | |
Year ended 12/31/18 | | | | 25.25 | | | | | (0.04 | )(e) | | | | 0.58 | | | | | 0.54 | | | | | - | | | | | (3.65 | ) | | | | (3.65 | ) | | | | 22.14 | | | | | 0.62 | | | | | 60,306 | | | | | 1.25 | | | | | 1.25 | | | | | (0.15 | )(e) | | | | 35 | |
Year ended 12/31/17 | | | | 23.07 | | | | | (0.08 | ) | | | | 3.69 | | | | | 3.61 | | | | | (0.02 | ) | | | | (1.41 | ) | | | | (1.43 | ) | | | | 25.25 | | | | | 15.55 | | | | | 67,240 | | | | | 1.26 | | | | | 1.26 | | | | | (0.33 | ) | | | | 37 | |
Year ended 12/31/16 | | | | 30.65 | | | | | 0.02 | | | | | (3.23 | ) | | | | (3.21 | ) | | | | - | | | | | (4.37 | ) | | | | (4.37 | ) | | | | 23.07 | | | | | (11.69 | ) | | | | 69,190 | | | | | 1.29 | | | | | 1.29 | | | | | 0.06 | | | | | 23 | |
Year ended 12/31/15 | | | | 32.80 | | | | | (0.08 | ) | | | | 1.04 | | | | | 0.96 | | | | | - | | | | | (3.11 | ) | | | | (3.11 | ) | | | | 30.65 | | | | | 2.89 | | | | | 103,464 | | | | | 1.31 | | | | | 1.32 | | | | | (0.24 | ) | | | | 42 | |
| (a) | Calculated using average shares outstanding. |
| (b) | Includes adjustments in accordance with accounting principles generally accepted in the United States of America and as such, the net asset value for financial reporting purposes and the returns based upon those net asset values may differ from the net asset value and returns for shareholder transactions. Total returns are not annualized for periods less than one year, if applicable, and do not reflect charges assessed in connection with a variable product, which if included would reduce total returns. |
| (c) | Portfolio turnover is calculated at the fund level and is not annualized for periods less than one year, if applicable. |
| (d) | Ratios are based on average daily net assets (000’s omitted) of $136,234 and $64,535 for Series I and Series II shares, respectively. |
| (e) | Net investment income per share and the ratio of net investment income to average net assets include significant dividends received during the year ended December 31, 2018. Net investment income per share and the ratio of net investment income to average net assets excluding the significant dividends are $0.00 and (0.03)%, $(0.07) and (0.28)%, for Series I and Series II shares, respectively. |
See accompanying Notes to Financial Statements which are an integral part of the financial statements.
Invesco V.I. Health Care Fund
Notes to Financial Statements
December 31, 2019
NOTE 1–Significant Accounting Policies
Invesco V.I. Health Care Fund (the “Fund”) is a series portfolio of AIM Variable Insurance Funds (Invesco Variable Insurance Funds) (the “Trust”). The Trust is a Delaware statutory trust registered under the Investment Company Act of 1940, as amended (the “1940 Act”), as anopen-end series management investment company. Information presented in these financial statements pertains only to the Fund. Matters affecting the Fund or each class will be voted on exclusively by the shareholders of the Fund or each class. Current Securities and Exchange Commission (“SEC”) guidance, however, requires participating insurance companies offering separate accounts to vote shares proportionally in accordance with the instructions of the contract owners whose investments are funded by shares of each Fund or class.
The Fund’s investment objective is long-term growth of capital.
The Fund currently offers two classes of shares, Series I and Series II, both of which are offered to insurance company separate accounts funding variable annuity contracts and variable life insurance policies (“variable products”).
The Fund is an investment company and accordingly follows the investment company accounting and reporting guidance in accordance with Financial Accounting Standards Board Accounting Standards Codification Topic 946,Financial Services - Investment Companies.
The following is a summary of the significant accounting policies followed by the Fund in the preparation of its financial statements.
A. Security Valuations– Securities, including restricted securities, are valued according to the following policy.
A security listed or traded on an exchange (except convertible securities) is valued at its last sales price or official closing price as of the close of the customary trading session on the exchange where the security is principally traded, or lacking any sales or official closing price on a particular day, the security may be valued at the closing bid price on that day. Securities traded in theover-the-counter market are valued based on prices furnished by independent pricing services or market makers. When such securities are valued by an independent pricing service they may be considered fair valued. Futures contracts are valued at the final settlement price set by an exchange on which they are principally traded. Listed options are valued at the mean between the last bid and asked prices from the exchange on which they are principally traded. Options not listed on an exchange are valued by an independent source at the mean between the last bid and asked prices. For purposes of determining net asset value (“NAV”) per share, futures and option contracts generally are valued 15 minutes after the close of the customary trading session of the New York Stock Exchange (“NYSE”).
Investments inopen-end andclosed-end registered investment companies that do not trade on an exchange are valued at theend-of-day net asset value per share. Investments inopen-end andclosed-end registered investment companies that trade on an exchange are valued at the last sales price or official closing price as of the close of the customary trading session on the exchange where the security is principally traded.
Debt obligations (including convertible securities) and unlisted equities are fair valued using an evaluated quote provided by an independent pricing service. Evaluated quotes provided by the pricing service may be determined without exclusive reliance on quoted prices, and may reflect appropriate factors such asinstitution-size trading in similar groups of securities, developments related to specific securities, dividend rate (for unlisted equities), yield (for debt obligations), quality, type of issue, coupon rate (for debt obligations), maturity (for debt obligations), individual trading characteristics and other market data. Pricing services generally value debt obligations assuming orderly transactions of institutional round lot size, but a fund may hold or transact in the same securities in smaller, odd lot sizes. Odd lots often trade at lower prices than institutional round lots. Debt obligations are subject to interest rate and credit risks. In addition, all debt obligations involve some risk of default with respect to interest and/or principal payments.
Foreign securities’ (including foreign exchange contracts) prices are converted into U.S. dollar amounts using the applicable exchange rates as of the close of the NYSE. If market quotations are available and reliable for foreign exchange-traded equity securities, the securities will be valued at the market quotations. Because trading hours for certain foreign securities end before the close of the NYSE, closing market quotations may become unreliable. If between the time trading ends on a particular security and the close of the customary trading session on the NYSE, events occur that the investment adviser determines are significant and make the closing price unreliable, the Fund may fair value the security. If the event is likely to have affected the closing price of the security, the security will be valued at fair value in good faith using procedures approved by the Board of Trustees. Adjustments to closing prices to reflect fair value may also be based on a screening process of an independent pricing service to indicate the degree of certainty, based on historical data, that the closing price in the principal market where a foreign security trades is not the current value as of the close of the NYSE. Foreign securities’ prices meeting the approved degree of certainty that the price is not reflective of current value will be priced at the indication of fair value from the independent pricing service. Multiple factors may be considered by the independent pricing service in determining adjustments to reflect fair value and may include information relating to sector indices, American Depositary Receipts and domestic and foreign index futures. Foreign securities may have additional risks including exchange rate changes, potential for sharply devalued currencies and high inflation, political and economic upheaval, the relative lack of issuer information, relatively low market liquidity and the potential lack of strict financial and accounting controls and standards.
Securities for which market prices are not provided by any of the above methods may be valued based upon quotes furnished by independent sources. The last bid price may be used to value equity securities. The mean between the last bid and asked prices is used to value debt obligations, including corporate loans.
Securities for which market quotations are not readily available or became unreliable are valued at fair value as determined in good faith by or under the supervision of the Trust’s officers following procedures approved by the Board of Trustees. Issuer specific events, market trends, bid/asked quotes of brokers and information providers and other market data may be reviewed in the course of making a good faith determination of a security’s fair value.
The Fund may invest in securities that are subject to interest rate risk, meaning the risk that the prices will generally fall as interest rates rise and, conversely, the prices will generally rise as interest rates fall. Specific securities differ in their sensitivity to changes in interest rates depending on their individual characteristics. Changes in interest rates may result in increased market volatility, which may affect the value and/or liquidity of certain Fund investments.
Invesco V.I. Health Care Fund
Valuations change in response to many factors including the historical and prospective earnings of the issuer, the value of the issuer’s assets, general economic conditions, interest rates, investor perceptions and market liquidity. Because of the inherent uncertainties of valuation, the values reflected in the financial statements may materially differ from the value received upon actual sale of those investments.
| B. | Securities Transactions and Investment Income– Securities transactions are accounted for on a trade date basis. Realized gains or losses on sales are computed on the basis of specific identification of the securities sold. Interest income (net of withholding tax, if any) is recorded on the accrual basis from settlement date. Dividend income (net of withholding tax, if any) is recorded on theex-dividend date. |
The Fund may periodically participate in litigation related to Fund investments. As such, the Fund may receive proceeds from litigation settlements. Any proceeds received are included in the Statement of Operations as realized gain (loss) for investments no longer held and as unrealized gain (loss) for investments still held.
Brokerage commissions and mark ups are considered transaction costs and are recorded as an increase to the cost basis of securities purchased and/or a reduction of proceeds on a sale of securities. Such transaction costs are included in the determination of net realized and unrealized gain (loss) from investment securities reported in the Statement of Operations and the Statement of Changes in Net Assets and the net realized and unrealized gains (losses) on securities per share in the Financial Highlights. Transaction costs are included in the calculation of the Fund’s net asset value and, accordingly, they reduce the Fund’s total returns. These transaction costs are not considered operating expenses and are not reflected in net investment income reported in the Statement of Operations and the Statement of Changes in Net Assets, or the net investment income per share and the ratios of expenses and net investment income reported in the Financial Highlights, nor are they limited by any expense limitation arrangements between the Fund and the investment adviser.
The Fund allocates income and realized and unrealized capital gains and losses to a class based on the relative net assets of each class.
| C. | Country Determination – For the purposes of making investment selection decisions and presentation in the Schedule of Investments, the investment adviser may determine the country in which an issuer is located and/or credit risk exposure based on various factors. These factors include the laws of the country under which the issuer is organized, where the issuer maintains a principal office, the country in which the issuer derives 50% or more of its total revenues and the country that has the primary market for the issuer’s securities, as well as other criteria. Among the other criteria that may be evaluated for making this determination are the country in which the issuer maintains 50% or more of its assets, the type of security, financial guarantees and enhancements, the nature of the collateral and the sponsor organization. Country of issuer and/or credit risk exposure has been determined to be the United States of America, unless otherwise noted. |
| D. | Distributions– Distributions from net investment income and net realized capital gain, if any, are generally declared and paid to separate accounts of participating insurance companies annually and recorded on theex-dividend date. |
| E. | Federal Income Taxes –The Fund intends to comply with the requirements of Subchapter M of the Internal Revenue Code of 1986, as amended (the “Internal Revenue Code”), necessary to qualify as a regulated investment company and to distribute substantially all of the Fund’s taxable earnings to shareholders. As such, the Fund will not be subject to federal income taxes on otherwise taxable income (including net realized capital gain) that is distributed to shareholders. Therefore, no provision for federal income taxes is recorded in the financial statements. |
The Fund recognizes the tax benefits of uncertain tax positions only when the position is more likely than not to be sustained. Management has analyzed the Fund’s uncertain tax positions and concluded that no liability for unrecognized tax benefits should be recorded related to uncertain tax positions. Management is not aware of any tax positions for which it is reasonably possible that the total amounts of unrecognized tax benefits will change materially in the next 12 months.
The Fund files tax returns in the U.S. Federal jurisdiction and certain other jurisdictions. Generally, the Fund is subject to examinations by such taxing authorities for up to three years after the filing of the return for the tax period.
| F. | Expenses– Fees provided for under the Rule12b-1 plan of a particular class of the Fund and which are directly attributable to that class are charged to the operations of such class. All other expenses are allocated among the classes based on relative net assets. |
| G. | Accounting Estimates –The preparation of financial statements in conformity with accounting principles generally accepted in the United States of America (“GAAP”) requires management to make estimates and assumptions that affect the reported amounts of assets and liabilities at the date of the financial statements and the reported amounts of revenues and expenses during the reporting period including estimates and assumptions related to taxation. Actual results could differ from those estimates by a significant amount. In addition, the Fund monitors for material events or transactions that may occur or become known after theperiod-end date and before the date the financial statements are released to print. |
| H. | Indemnifications– Under the Trust’s organizational documents, each Trustee, officer, employee or other agent of the Trust is indemnified against certain liabilities that may arise out of the performance of their duties to the Fund. Additionally, in the normal course of business, the Fund enters into contracts, including the Fund’s servicing agreements, that contain a variety of indemnification clauses. The Fund’s maximum exposure under these arrangements is unknown as this would involve future claims that may be made against the Fund that have not yet occurred. The risk of material loss as a result of such indemnification claims is considered remote. |
| I. | Foreign Currency Translations– Foreign currency is valued at the close of the NYSE based on quotations posted by banks and major currency dealers. Portfolio securities and other assets and liabilities denominated in foreign currencies are translated into U.S. dollar amounts at the date of valuation. Purchases and sales of portfolio securities (net of foreign taxes withheld on disposition) and income items denominated in foreign currencies are translated into U.S. dollar amounts on the respective dates of such transactions. The Fund does not separately account for the portion of the results of operations resulting from changes in foreign exchange rates on investments and the fluctuations arising from changes in market prices of securities held. The combined results of changes in foreign exchange rates and the fluctuation of market prices on investments (net of estimated foreign tax withholding) are included with the net realized and unrealized gain or loss from investments in the Statement of Operations. Reported net realized foreign currency gains or losses arise from (1) sales of foreign currencies, (2) currency gains or losses realized between the trade and settlement dates on securities transactions, and (3) the difference between the amounts of dividends, interest, and foreign withholding taxes recorded on the Fund’s books and the U.S. dollar equivalent of the amounts actually received or paid. Net unrealized foreign currency gains and losses arise from changes in the fair values of assets and liabilities, other than investments in securities at fiscal period end, resulting from changes in exchange rates. |
The Fund may invest in foreign securities, which may be subject to foreign taxes on income, gains on investments or currency repatriation, a portion of which may be recoverable. Foreign taxes, if any, are recorded based on the tax regulations and rates that exist in the foreign markets in which the Fund invests and are shown in the Statement of Operations.
Invesco V.I. Health Care Fund
| J. | Forward Foreign Currency Contracts– The Fund may engage in foreign currency transactions either on a spot (i.e. for prompt delivery and settlement) basis, or through forward foreign currency contracts, to manage or minimize currency or exchange rate risk. |
The Fund may also enter into forward foreign currency contracts for the purchase or sale of a security denominated in a foreign currency in order to “lock in” the U.S. dollar price of that security, or the Fund may also enter into forward foreign currency contracts that do not provide for physical settlement of the two currencies, but instead are settled by a single cash payment calculated as the difference between the agreed upon exchange rate and the spot rate at settlement based upon an agreed upon notional amount(non-deliverable forwards). The Fund will set aside liquid assets in an amount equal to the dailymark-to-market obligation for forward foreign currency contracts.
A forward foreign currency contract is an obligation between two parties (“Counterparties”) to purchase or sell a specific currency for an agreed-upon price at a future date. The use of forward foreign currency contracts does not eliminate fluctuations in the price of the underlying securities the Fund owns or intends to acquire but establishes a rate of exchange in advance. Fluctuations in the value of these contracts are measured by the difference in the contract date and reporting date exchange rates and are recorded as unrealized appreciation (depreciation) until the contracts are closed. When the contracts are closed, realized gains (losses) are recorded. Realized and unrealized gains (losses) on the contracts are included in the Statement of Operations. The primary risks associated with forward foreign currency contracts include failure of the Counterparty to meet the terms of the contract and the value of the foreign currency changing unfavorably. These risks may be in excess of the amounts reflected in the Statement of Assets and Liabilities.
| K. | Other Risks- The Fund’s performance is vulnerable to factors affecting the health care industry, including government regulation, obsolescence caused by scientific advances and technological innovations. |
NOTE 2–Advisory Fees and Other Fees Paid to Affiliates
The Trust has entered into a master investment advisory agreement with Invesco Advisers, Inc. (the “Adviser” or “Invesco”). Under the terms of the investment advisory agreement, the Fund accrues daily and pays monthly an advisory fee to the Adviser based on the annual rate of the Fund’s average daily net assets as follows:
| | | | |
| Average Daily Net Assets | | Rate | |
| |
| |
First $250 million | | | 0.750% | |
| |
| |
Next $250 million | | | 0.740% | |
| |
| |
Next $500 million | | | 0.730% | |
| |
| |
Next $1.5 billion | | | 0.720% | |
| |
| |
Next $2.5 billion | | | 0.710% | |
| |
| |
Next $2.5 billion | | | 0.700% | |
| |
| |
Next $2.5 billion | | | 0.690% | |
| |
| |
Over $10 billion | | | 0.680% | |
| |
For the year ended December 31, 2019, the effective advisory fee rate incurred by the Fund was 0.75%.
Under the terms of a mastersub-advisory agreement between the Adviser and each of Invesco Asset Management Deutschland GmbH, Invesco Asset Management Limited, Invesco Asset Management (Japan) Limited, Invesco Hong Kong Limited, Invesco Senior Secured Management, Inc. and Invesco Canada Ltd. and separatesub-advisory agreements with Invesco Capital Management LLC and Invesco Asset Management (India) Private Limited (collectively, the “AffiliatedSub-Advisers”) the Adviser, not the Fund, will pay 40% of the fees paid to the Adviser to any such AffiliatedSub-Adviser(s) that provide(s) discretionary investment management services to the Fund based on the percentage of assets allocated to such AffiliatedSub-Adviser(s).
The Adviser has contractually agreed, through at least June 30, 2020, to waive advisory fees and/or reimburse expenses of all shares to the extent necessary to limit total annual fund operating expenses after fee waiver and/or expense reimbursement (excluding certain items discussed below) of Series I shares to 2.00% and Series II shares to 2.25% of average daily net assets (the “expense limits”). In determining the Adviser’s obligation to waive advisory fees and/or reimburse expenses, the following expenses are not taken into account, and could cause the total annual fund operating expenses after fee waiver and/or expense reimbursement to exceed the numbers reflected above: (1) interest; (2) taxes; (3) dividend expense on short sales; (4) extraordinary ornon-routine items, including litigation expenses; and (5) expenses that the Fund has incurred but did not actually pay because of an expense offset arrangement. Unless Invesco continues the fee waiver agreement, it will terminate on June 30, 2020. During its term, the fee waiver agreement cannot be terminated or amended to increase the expense limits or reduce the advisory fee waiver without approval of the Board of Trustees. The Adviser did not waive fees and/or reimburse expenses during the period under these expense limits.
Further, the Adviser has contractually agreed, through at least June 30, 2021, to waive the advisory fee payable by the Fund in an amount equal to 100% of the net advisory fees the Adviser receives from the affiliated money market funds on investments by the Fund of uninvested cash in such affiliated money market funds.
For the year ended December 31, 2019, the Adviser waived advisory fees of $4,841.
The Trust has entered into a master administrative services agreement with Invesco pursuant to which the Fund has agreed to pay Invesco a fee for costs incurred in providing accounting services and fund administrative services to the Fund and to reimburse Invesco for fees paid to insurance companies that have agreed to provide certain administrative services to the Fund. These administrative services provided by the insurance companies may include, among other things: maintenance of master accounts with the Fund; tracking, recording and transmitting net purchase and redemption orders for Fund shares; maintaining and preserving records related to the purchase, redemption and other account activity of variable product owners; distributing copies of Fund documents such as prospectuses, proxy materials and periodic reports, to variable product owners, and responding to inquiries from variable product owners about the Fund. Pursuant to such agreement, for the year ended December 31, 2019, Invesco was paid $28,452 for accounting and fund administrative services and was reimbursed $298,199 for fees paid to insurance companies. Invesco has entered into asub-administration agreement whereby State Street Bank and Trust Company (“SSB”) serves as fund accountant and provides certain administrative services to the Fund. Pursuant to a custody agreement with the Trust on behalf of the Fund, SSB also serves as the Fund’s custodian.
Invesco V.I. Health Care Fund
The Trust has entered into a transfer agency and service agreement with Invesco Investment Services, Inc. (“IIS”) pursuant to which the Fund has agreed to pay IIS a fee for providing transfer agency and shareholder services to the Fund and reimburse IIS for certain expenses incurred by IIS in the course of providing such services. For the year ended December 31, 2019, expenses incurred under the agreement are shown in the Statement of Operations asTransfer agent fees.
The Trust has entered into a master distribution agreement with Invesco Distributors, Inc. (“IDI”) to serve as the distributor for the Fund. The Trust has adopted a plan pursuant to Rule12b-1 under the 1940 Act with respect to the Fund’s Series II shares (the “Plan”). The Fund, pursuant to the Plan, pays IDI compensation at the annual rate of 0.25% of the Fund’s average daily net assets of Series II shares. The fees are accrued daily and paid monthly. Of the Plan payments, up to 0.25% of the average daily net assets of the Series II shares may be paid to insurance companies who furnish continuing personal shareholder services to customers who purchase and own Series II shares of the Fund. For the year ended December 31, 2019, expenses incurred under the Plan are detailed in the Statement of Operations asDistribution fees.
For the year ended December 31, 2019, the Fund incurred $596 in brokerage commissions with Invesco Capital Markets, Inc., an affiliate of the Adviser and IDI, for portfolio transactions executed on behalf of the Fund.
Certain officers and trustees of the Trust are officers and directors of the Adviser, IIS and/or IDI.
NOTE 3–Additional Valuation Information
GAAP defines fair value as the price that would be received to sell an asset or paid to transfer a liability in an orderly transaction between market participants at the measurement date, under current market conditions. GAAP establishes a hierarchy that prioritizes the inputs to valuation methods, giving the highest priority to readily available unadjusted quoted prices in an active market for identical assets (Level 1) and the lowest priority to significant unobservable inputs (Level 3), generally when market prices are not readily available or are unreliable. Based on the valuation inputs, the securities or other investments are tiered into one of three levels. Changes in valuation methods may result in transfers in or out of an investment’s assigned level:
| | Level 1 - | Prices are determined using quoted prices in an active market for identical assets. |
| | Level 2 - | Prices are determined using other significant observable inputs. Observable inputs are inputs that other market participants may use in pricing a security. These may include quoted prices for similar securities, interest rates, prepayment speeds, credit risk, yield curves, loss severities, default rates, discount rates, volatilities and others. |
| | Level 3 - | Prices are determined using significant unobservable inputs. In situations where quoted prices or observable inputs are unavailable (for example, when there is little or no market activity for an investment at the end of the period), unobservable inputs may be used. Unobservable inputs reflect the Fund’s own assumptions about the factors market participants would use in determining fair value of the securities or instruments and would be based on the best available information. |
The following is a summary of the tiered valuation input levels, as of December 31, 2019. The level assigned to the securities valuations may not be an indication of the risk or liquidity associated with investing in those securities. Because of the inherent uncertainties of valuation, the values reflected in the financial statements may materially differ from the value received upon actual sale of those investments.
| | | | | | | | | | | | | | | | |
| | | Level 1 | | | Level 2 | | | Level 3 | | | Total | |
| |
Investments in Securities | | | | | | | | | | | | | | | | |
| |
| | | | |
Common Stocks & Other Equity Interests | | $ | 194,078,367 | | | $ | 23,125,509 | | | | $– | | | $ | 217,203,876 | |
| |
| | | | |
Money Market Funds | | | 3,822,124 | | | | – | | | | – | | | | 3,822,124 | |
| |
| | | | |
Total Investments | | $ | 197,900,491 | | | $ | 23,125,509 | | | | $– | | | $ | 221,026,000 | |
| |
NOTE 4–Trustees’ and Officers’ Fees and Benefits
Trustees’ and Officers’ Fees and Benefits include amounts accrued by the Fund to pay remuneration to certain Trustees and Officers of the Fund. Trustees have the option to defer compensation payable by the Fund, andTrustees’ and Officers’ Fees and Benefits also include amounts accrued by the Fund to fund such deferred compensation amounts. Those Trustees who defer compensation have the option to select various Invesco Funds in which their deferral accounts shall be deemed to be invested. Finally, certain current Trustees were eligible to participate in a retirement plan that provided for benefits to be paid upon retirement to Trustees over a period of time based on the number of years of service. The Fund may have certain former Trustees who also participate in a retirement plan and receive benefits under such plan.Trustees’ and Officers’ Fees and Benefits include amounts accrued by the Fund to fund such retirement benefits. Obligations under the deferred compensation and retirement plans represent unsecured claims against the general assets of the Fund.
NOTE 5–Cash Balances
The Fund is permitted to temporarily carry a negative or overdrawn balance in its account with SSB, the custodian bank. Such balances, if any atperiod-end, are shown in the Statement of Assets and Liabilities under the payable captionAmount due custodian. To compensate the custodian bank for such overdrafts, the overdrawn Fund may either (1) leave funds as a compensating balance in the account so the custodian bank can be compensated by earning the additional interest; or (2) compensate by paying the custodian bank at a rate agreed upon by the custodian bank and Invesco, not to exceed the contractually agreed upon rate.
Invesco V.I. Health Care Fund
NOTE 6–Distributions to Shareholders and Tax Components of Net Assets
Tax Character of Distributions to Shareholders Paid During the Fiscal Years Ended December 31, 2019 and 2018:
| | | | | | | | |
| | | 2019 | | | 2018 | |
| |
| | |
Ordinary income | | | $1,765,566 | | | $ | 281,491 | |
| |
Long-term capital gain | | | 3,208,080 | | | | 26,331,108 | |
| |
Total distributions | | $ | 4,973,646 | | | $ | 26,612,599 | |
| |
Tax Components of Net Assets atPeriod-End:
| | | | |
| | | 2019 | |
| |
Undistributed ordinary income | | $ | 798,485 | |
| |
Undistributed long-term capital gain | | | 4,586,978 | |
| |
Net unrealized appreciation – investments | | | 73,830,296 | |
| |
Net unrealized appreciation - foreign currencies | | | 210 | |
| |
Temporary book/tax differences | | | (68,997 | ) |
| |
Shares of beneficial interest | | | 141,570,385 | |
| |
Total net assets | | $ | 220,717,357 | |
| |
The difference between book-basis andtax-basis unrealized appreciation (depreciation) is due to differences in the timing of recognition of gains and losses on investments for tax and book purposes. The Fund’s net unrealized appreciation difference is attributable primarily to passive foreign investment companies.
The temporary book/tax differences are a result of timing differences between book and tax recognition of income and/or expenses. The Fund’s temporary book/tax differences are the result of the trustee deferral of compensation and retirement plan benefits.
Capital loss carryforward is calculated and reported as of a specific date. Results of transactions and other activity after that date may affect the amount of capital loss carryforward actually available for the Fund to utilize. Capital losses generated in years beginning after December 22, 2010 can be carried forward for an unlimited period, whereas previous losses expire in eight tax years. Capital losses with an expiration period may not be used to offset capital gains until all net capital losses without an expiration date have been utilized. Capital loss carryforwards with no expiration date will retain their character as either short-term or long-term capital losses instead of as short-term capital losses as under prior law. The ability to utilize capital loss carryforwards in the future may be limited under the Internal Revenue Code and related regulations based on the results of future transactions.
The Fund does not have a capital loss carryforward as of December 31, 2019.
NOTE 7–Investment Transactions
The aggregate amount of investment securities (other than short-term securities, U.S. Treasury obligations and money market funds, if any) purchased and sold by the Fund during the year ended December 31, 2019 was $14,737,400 and $38,795,140, respectively. Cost of investments, including any derivatives, on a tax basis includes the adjustments for financial reporting purposes as of the most recently completed federal income tax reportingperiod-end.
| | | | |
| Unrealized Appreciation (Depreciation) of Investments on a Tax Basis | |
| |
Aggregate unrealized appreciation of investments | | | $76,318,069 | |
| |
Aggregate unrealized (depreciation) of investments | | | (2,487,773 | ) |
| |
Net unrealized appreciation of investments | | | $73,830,296 | |
| |
Cost of investments for tax purposes is $147,195,704.
NOTE 8–Reclassification of Permanent Differences
Primarily as a result of differing book/tax treatment of foreign currency transactions and fair fund settlements, on December 31, 2019, undistributed net investment income was increased by $2,642 and undistributed net realized gain was decreased by $2,642. This reclassification had no effect on the net assets or the distributable earnings of the Fund.
NOTE 9–Share Information
| | | | | | | | | | | | | | | | |
| | | Summary of Share Activity | |
| | | Year ended
December 31, 2019(a) | | | Year ended
December 31, 2018 | |
| | | Shares | | | Amount | | | Shares | | | Amount | |
Sold: | | | | | | | | | | | | | | | | |
Series I | | | 588,096 | | | $ | 15,603,976 | | | | 682,421 | | | $ | 18,324,767 | |
| |
Series II | | | 184,379 | | | | 4,579,271 | | | | 204,677 | | | | 5,112,391 | |
| |
Invesco V.I. Health Care Fund
| | | | | | | | | | | | | | | | |
| | | Summary of Share Activity | |
| |
| | | Year ended
December 31, 2019(a) | | | Year ended
December 31, 2018 | |
| | | | | | | | |
| | | Shares | | | Amount | | | Shares | | | Amount | |
| |
| | | | |
Issued as reinvestment of dividends: | | | | | | | | | | | | | | | | |
Series I | | | 131,915 | | | $ | 3,345,368 | | | | 689,156 | | | $ | 18,007,655 | |
| |
Series II | | | 68,072 | | | | 1,628,278 | | | | 347,815 | | | | 8,604,944 | |
| |
| | | | |
Reacquired: | | | | | | | | | | | | | | | | |
Series I | | | (1,286,131 | ) | | | (33,263,137 | ) | | | (1,292,416 | ) | | | (34,415,503 | ) |
| |
Series II | | | (492,335 | ) | | | (12,210,564 | ) | | | (492,468 | ) | | | (12,523,291 | ) |
| |
Net increase (decrease) in share activity | | | (806,004 | ) | | $ | (20,316,808 | ) | | | 139,185 | | | $ | (3,110,963 | ) |
| |
| (a) | There are entities that are record owners of more than 5% of the outstanding shares of the Fund and in the aggregate own 51% of the outstanding shares of the Fund. The Fund and the Fund’s principal underwriter or adviser, are parties to participation agreements with these entities whereby these entities sell units of interest in separate accounts funding variable products that are invested in the Fund. The Fund, Invesco and/or Invesco affiliates may make payments to these entities, which are considered to be related to the Fund, for providing services to the Fund, Invesco and/or Invesco affiliates including but not limited to services such as, securities brokerage, third party record keeping and account servicing and administrative services. The Fund has no knowledge as to whether all or any portion of the shares owned of record by these entities are also owned beneficially. |
Invesco V.I. Health Care Fund
Report of Independent Registered Public Accounting Firm
To the Board of Trustees of AIM Variable Insurance Funds (Invesco Variable Insurance Funds) and Shareholders of Invesco V.I. Health Care Fund
Opinion on the Financial Statements
We have audited the accompanying statement of assets and liabilities, including the schedule of investments, of Invesco V.I. Health Care Fund (one of the funds constituting AIM Variable Insurance Funds (Invesco Variable Insurance Funds), referred to hereafter as the “Fund”) as of December 31, 2019, the related statement of operations for the year ended December 31, 2019, the statement of changes in net assets for each of the two years in the period ended December 31, 2019, including the related notes, and the financial highlights for each of the five years in the period ended December 31, 2019 (collectively referred to as the “financial statements”). In our opinion, the financial statements present fairly, in all material respects, the financial position of the Fund as of December 31, 2019, the results of its operations for the year then ended, the changes in its net assets for each of the two years in the period ended December 31, 2019 and the financial highlights for each of the five years in the period ended December 31, 2019 in conformity with accounting principles generally accepted in the United States of America.
Basis for Opinion
These financial statements are the responsibility of the Fund’s management. Our responsibility is to express an opinion on the Fund’s financial statements based on our audits. We are a public accounting firm registered with the Public Company Accounting Oversight Board (United States) (PCAOB) and are required to be independent with respect to the Fund in accordance with the U.S. federal securities laws and the applicable rules and regulations of the Securities and Exchange Commission and the PCAOB.
We conducted our audits of these financial statements in accordance with the standards of the PCAOB. Those standards require that we plan and perform the audit to obtain reasonable assurance about whether the financial statements are free of material misstatement, whether due to error or fraud.
Our audits included performing procedures to assess the risks of material misstatement of the financial statements, whether due to error or fraud, and performing procedures that respond to those risks. Such procedures included examining, on a test basis, evidence regarding the amounts and disclosures in the financial statements. Our audits also included evaluating the accounting principles used and significant estimates made by management, as well as evaluating the overall presentation of the financial statements. Our procedures included confirmation of securities owned as of December 31, 2019 by correspondence with the custodian and transfer agent. We believe that our audits provide a reasonable basis for our opinion.
/s/PricewaterhouseCoopers LLP
Houston, Texas
February 18, 2020
We have served as the auditor of one or more of the investment companies in the Invesco group of investment companies since at least 1995. We have not been able to determine the specific year we began serving as auditor.
Invesco V.I. Health Care Fund
Calculating your ongoing Fund expenses
Example
As a shareholder of the Fund, you incur ongoing costs, including management fees; distribution and/or service fees(12b-1); and other Fund expenses. This example is intended to help you understand your ongoing costs (in dollars) of investing in the Fund and to compare these costs with ongoing costs of investing in other mutual funds. The example is based on an investment of $1,000 invested at the beginning of the period and held for the entire period July 1, 2019 through December 31, 2019.
The actual and hypothetical expenses in the examples below do not represent the effect of any fees or other expenses assessed in connection with a variable product; if they did, the expenses shown would be higher while the ending account values shown would be lower.
Actual expenses
The table below provides information about actual account values and actual expenses. You may use the information in this table, together with the amount you invested, to estimate the expenses that you paid over the period. Simply divide your account value by $1,000 (for example, an $8,600 account value divided by $1,000 = 8.6), then multiply the result by the number in the table under the heading entitled “Actual Expenses Paid During Period” to estimate the expenses you paid on your account during this period.
Hypothetical example for comparison purposes
The table below also provides information about hypothetical account values and hypothetical expenses based on the Fund’s actual expense ratio and an assumed rate of return of 5% per year before expenses, which is not the Fund’s actual return.
The hypothetical account values and expenses may not be used to estimate the actual ending account balance or expenses you paid for the period. You may use this information to compare the ongoing costs of investing in the Fund and other funds. To do so, compare this 5% hypothetical example with the 5% hypothetical examples that appear in the shareholder reports of the other funds.
Please note that the expenses shown in the table are meant to highlight your ongoing costs. Therefore, the hypothetical information is useful in comparing ongoing costs, and will not help you determine the relative total costs of owning different funds.
| | | | | | | | | | | | |
| | | | | ACTUAL | | HYPOTHETICAL
(5% annual return before
expenses) | | |
| | Beginning Account Value (07/01/19) | | Ending
Account Value (12/31/19)1 | | Expenses
Paid During Period2 | | Ending
Account Value (12/31/19) | | Expenses
Paid During Period2 | | Annualized Expense Ratio |
| Series I | | $1,000.00 | | $1,147.60 | | $5.25 | | $1,020.32 | | $4.94 | | 0.97% |
| Series II | | 1,000.00 | | 1,145.80 | | 6.60 | | 1,019.06 | | 6.21 | | 1.22�� |
| 1 | The actual ending account value is based on the actual total return of the Fund for the period July 1, 2019 through December 31, 2019, after actual expenses and will differ from the hypothetical ending account value which is based on the Fund’s expense ratio and a hypothetical annual return of 5% before expenses. |
| 2 | Expenses are equal to the Fund’s annualized expense ratio as indicated above multiplied by the average account value over the period, multiplied by 184/365 to reflect the most recent fiscal half year. |
Invesco V.I. Health Care Fund
Tax Information
Form1099-DIV, Form1042-S and other year–end tax information provide shareholders with actual calendar year amounts that should be included in their tax returns. Shareholders should consult their tax advisers.
The following distribution information is being provided as required by the Internal Revenue Code or to meet a specific state’s requirement.
The Fund designates the following amounts or, if subsequently determined to be different, the maximum amount allowable for its fiscal year ended December 31, 2019:
| | | | | | | | |
| Federal and State Income Tax | | | | |
Long-term Capital Gain Distributions | | $ | 3,208,080 | | | | | |
Corporate Dividends Received Deduction* | | | 62.09 | % | | | | |
U.S. Treasury Obligations* | | | 0.00 | % | | | | |
|
* The above percentages are based on ordinary income dividends paid to shareholders during the Fund’s fiscal year. | |
Invesco V.I. Health Care Fund
Trustees and Officers
The address of each trustee and officer is AIM Variable Insurance Funds (Invesco Variable Insurance Funds) (the “Trust”), 11 Greenway Plaza, Suite 1000, Houston, Texas 77046-1173. The trustees serve for the life of the Trust, subject to their earlier death, incapacitation, resignation, retirement or removal as more specifically provided in the Trust’s organizational documents. Each officer serves for a one year term or until their successors are elected and qualified. Column two below includes length of time served with predecessor entities, if any.
| | | | | | | | |
Name, Year of Birth and
Position(s)
Held with the Trust | | Trustee
and/or
Officer
Since | | Principal Occupation(s)
During Past 5 Years | | Number of
Funds in
Fund Complex
Overseen by
Trustee | | Other
Directorship(s)
Held by Trustee
During Past 5
Years |
| Interested Person | | | | | | | | |
Martin L. Flanagan1- 1960
Trustee and Vice Chair | | 2007 | | Executive Director, Chief Executive Officer and President, Invesco Ltd. (ultimate parent of Invesco and a global investment management firm); Trustee and Vice Chair, The Invesco Funds; Vice Chair, Investment Company Institute; and Member of Executive Board, SMU Cox School of Business Formerly: Advisor to the Board, Invesco Advisers, Inc. (formerly known as Invesco Institutional (N.A.), Inc.); Chairman and Chief Executive Officer, Invesco Advisers, Inc. (registered investment adviser); Director, Chairman, Chief Executive Officer and President, Invesco Holding Company (US), Inc. (formerly IVZ Inc.) (holding company), Invesco Group Services, Inc. (service provider) and Invesco North American Holdings, Inc. (holding company); Director, Chief Executive Officer and President, Invesco Holding Company Limited (parent of Invesco and a global investment management firm); Director, Invesco Ltd.; Chairman, Investment Company Institute and President,Co-Chief Executive Officer,Co-President, Chief Operating Officer and Chief Financial Officer, Franklin Resources, Inc. (global investment management organization) | | 229 | | None |
| 1 | Mr. Flanagan is considered an interested person (within the meaning of Section 2(a)(19) of the 1940 Act) of the Trust because he is an officer of the Adviser to the Trust, and an officer and a director of Invesco Ltd., ultimate parent of the Adviser. |
Invesco V.I. Health Care Fund
Trustees and Officers–(continued)
| | | | | | | | |
Name, Year of Birth and
Position(s)
Held with the Trust | | Trustee
and/or
Officer
Since | | Principal Occupation(s)
During Past 5 Years | | Number of
Funds in
Fund Complex
Overseen by
Trustee | | Other
Directorship(s)
Held by Trustee
During Past 5
Years |
| Independent Trustees | | | | | | | | |
Bruce L. Crockett - 1944
Trustee and Chair | | 1993 | | Chairman, Crockett Technologies Associates (technology consulting company) Formerly: Director, Captaris (unified messaging provider); Director, President and Chief Executive Officer, COMSAT Corporation; Chairman, Board of Governors of INTELSAT (international communications company); ACE Limited (insurance company); Independent Directors Council and Investment Company Institute: Member of the Audit Committee, Investment Company Institute; Member of the Executive Committee and Chair of the Governance Committee, Independent Directors Council | | 229 | | Director and Chairman of the Audit Committee, ALPS (Attorneys Liability Protection Society) (insurance company); Director and Member of the Audit Committee and Compensation Committee, Ferroglobe PLC (metallurgical company) |
David C. Arch - 1945
Trustee | | 2010 | | Chairman of Blistex Inc. (consumer health care products manufacturer); Member, World Presidents’ Organization | | 229 | | Board member of the Illinois Manufacturers’ Association |
Beth Ann Brown - 1968
Trustee | | 2019 | | Independent Consultant Formerly: Head of Intermediary Distribution, Managing Director, Strategic Relations, Managing Director, Head of National Accounts, Senior Vice President, National Account Manager and Senior Vice President, Key Account Manager, Columbia Management Investment Advisers LLC; Vice President, Key Account Manager, Liberty Funds Distributor, Inc.; and Trustee of certain Oppenheimer Funds | | 229 | | Director, Board of Directors of Caron Engineering Inc.; Advisor, Board of Advisors of Caron Engineering Inc.; President and Director, Acton Shapleigh Youth Conservation Corps (non - profit); and Vice President and Director of Grahamtastic Connection(non-profit) |
Jack M. Fields - 1952
Trustee | | 1997 | | Chief Executive Officer, Twenty First Century Group, Inc. (government affairs company); and Chairman, Discovery Learning Alliance(non-profit) Formerly: Owner and Chief Executive Officer, Dos Angeles Ranch L.P. (cattle, hunting, corporate entertainment); Director, Insperity, Inc. (formerly known as Administaff) (human resources provider); Chief Executive Officer, Texana Timber LP (sustainable forestry company); Director of Cross Timbers Quail Research Ranch(non-profit); and member of the U.S. House of Representatives | | 229 | | None |
Invesco V.I. Health Care Fund
Trustees and Officers–(continued)
| | | | | | | | |
Name, Year of Birth and
Position(s)
Held with the Trust | | Trustee
and/or
Officer
Since | | Principal Occupation(s)
During Past 5 Years | | Number of
Funds
in
Fund Complex
Overseen by
Trustee | | Other
Directorship(s)
Held by Trustee
During Past 5
Years |
| Independent Trustees–(continued) | | | | |
| Cynthia Hostetler – 1962 Trustee | | 2017 | | Non-Executive Director and Trustee of a number of public and private business corporations Formerly: Director, Aberdeen Investment Funds (4 portfolios); Head of Investment Funds and Private Equity, Overseas Private Investment Corporation; President, First Manhattan Bancorporation, Inc.; Attorney, Simpson Thacher & Bartlett LLP | | 229 | | Vulcan Materials Company (construction materials company); Trilinc Global Impact Fund; Genesee & Wyoming, Inc. (railroads); Artio Global Investment LLC (mutual fund complex); Edgen Group, Inc. (specialized energy and infrastructure products distributor); Investment Company Institute (professional organization); Independent Directors Council (professional organization) |
Eli Jones - 1961
Trustee | | 2016 | | Professor and Dean, Mays Business School - Texas A&M University Formerly: Professor and Dean, Walton College of Business, University of Arkansas and E.J. Ourso College of Business, Louisiana State University; Director, Arvest Bank | | 229 | | Insperity, Inc. (formerly known as Administaff) (human resources provider) |
| Elizabeth Krentzman - 1959 Trustee | | 2019 | | Formerly: Principal and Chief Regulatory Advisor for Asset Management Services and U.S. Mutual Fund Leader of Deloitte & Touche LLP; General Counsel of the Investment Company Institute (trade association); National Director of the Investment Management Regulatory Consulting Practice, Principal, Director and Senior Manager of Deloitte & Touche LLP; Assistant Director of the Division of Investment Management - Office of Disclosure and Investment Adviser Regulation of the U.S. Securities and Exchange Commission and various positions with the Division of Investment Management - Office of Regulatory Policy of the U.S. Securities and Exchange Commission; Associate at Ropes & Gray LLP; Advisory Board Member of the Securities and Exchange Commission Historical Society; and Trustee of certain Oppenheimer Funds | | 229 | | Trustee of the University of Florida National Board Foundation and Audit Committee Member; Member of the Cartica Funds Board of Directors (private investment funds); Member of the University of Florida Law Center Association, Inc. Board of Trustees and Audit Committee Member |
| Anthony J. LaCava, Jr. - 1956 Trustee | | 2019 | | Formerly: Director and Member of the Audit Committee, Blue Hills Bank (publicly traded financial institution) and Managing Partner, KPMG LLP | | 229 | | Blue Hills Bank; Chairman, Bentley University; Member, Business School Advisory Council; and Nominating Committee KPMG LLP |
| Prema Mathai-Davis - 1950 Trustee | | 1998 | | Retired Co-Owner & Partner of Quantalytics Research, LLC, (a FinTech Investment Research Platform for the Self-Directed Investor) | | 229 | | None |
Invesco V.I. Health Care Fund
Trustees and Officers–(continued)
| | | | | | | | |
Name, Year of Birth and
Position(s)
Held with the Trust | | Trustee
and/or
Officer
Since | | Principal Occupation(s)
During Past 5 Years | | Number of
Funds in
Fund Complex
Overseen by
Trustee | | Other
Directorship(s)
Held by Trustee
During Past 5
Years |
| Independent Trustees–(continued) | | | | |
| Joel W. Motley - 1952 Trustee | | 2019 | | Director of Office of Finance, Federal Home Loan Bank; Member of the Vestry of Trinity Wall Street; Managing Director of Carmona Motley Inc. (privately held financial advisor); Member of the Finance and Budget Committee of the Council on Foreign Relations, Member of the Investment Committee and Board of Human Rights Watch and Member of the Investment Committee and Board of Historic Hudson Valley(non-profit cultural organization) Formerly: Managing Director of Public Capital Advisors, LLC (privately held financial advisor); Managing Director of Carmona Motley Hoffman, Inc. (privately held financial advisor); Trustee of certain Oppenheimer Funds; and Director of Columbia Equity Financial Corp. (privately held financial advisor) | | 229 | | Director of Greenwall Foundation (bioethics research foundation); Member of Board and Investment Committee of The Greenwall Foundation; Director of Southern Africa Legal Services Foundation; Board Member and Investment Committee Member of Pulizer Center for Crisis Reporting(non-profit journalism) |
| Teresa M. Ressel - 1962 Trustee | | 2017 | | Non-executive director and trustee of a number of public and private business corporations Formerly: Chief Financial Officer, Olayan America, The Olayan Group (international investor/commercial/industrial); Chief Executive Officer, UBS Securities LLC; Group Chief Operating Officer, Americas, UBS AG; Assistant Secretary for Management & Budget and CFO, US Department of the Treasury | | 229 | | Atlantic Power Corporation (power generation company); ON Semiconductor Corp. (semiconductor supplier) |
| Ann Barnett Stern - 1957 Trustee | | 2017 | | President and Chief Executive Officer, Houston Endowment Inc. (private philanthropic institution) Formerly: Executive Vice President and General Counsel, Texas Children’s Hospital; Attorney, Beck, Redden and Secrest, LLP; Business Law Instructor, University of St. Thomas; Attorney, Andrews & Kurth LLP | | 229 | | Federal Reserve Bank of Dallas |
| Robert C. Troccoli - 1949 Trustee | | 2016 | | Retired | | 229 | | None |
| Daniel S. Vandivort - 1954 Trustee | | 2019 | | Treasurer, Chairman of the Audit and Finance Committee, and Trustee, Board of Trustees, Huntington Disease Foundation of America; and President, Flyway Advisory Services LLC (consulting and property management) Formerly: Trustee and Governance Chair, of certain Oppenheimer Funds | | 229 | | Chairman and Lead Independent Director, Chairman of the Audit Committee, and Director, Board of Directors, Value Line Funds |
| James D. Vaughn - 1945 Trustee | | 2019 | | Retired Formerly: Managing Partner, Deloitte & Touche LLP; Trustee and Chairman of the Audit Committee, Schroder Funds; Board Member, Mile High United Way, Boys and Girls Clubs, Boy Scouts, Colorado Business Committee for the Arts, Economic Club of Colorado and Metro Denver Network (economic development corporation); and Trustee of certain Oppenheimer Funds | | 229 | | Board member and Chairman of Audit Committee of AMG National Trust Bank; Trustee and Investment Committee member, University of South Dakota Foundation; Board member, Audit Committee Member and past Board Chair, Junior Achievement(non-profit) |
Invesco V.I. Health Care Fund
Trustees and Officers–(continued)
| | | | | | | | |
Name, Year of Birth and
Position(s)
Held with the Trust | | Trustee
and/or
Officer
Since | | Principal Occupation(s)
During Past 5 Years | | Number of
Funds in
Fund Complex
Overseen by
Trustee | | Other
Directorship(s)
Held by Trustee
During Past 5
Years |
| Independent Trustees–(continued) | | | | |
Christopher L. WIlson - 1957
Trustee, Vice Chair and Chair Designate | | 2017 | | Retired Formerly: Director, TD Asset Management USA Inc. (mutual fund complex) (22 portfolios); Managing Partner, CT2, LLC (investing and consulting firm); President/Chief Executive Officer, Columbia Funds, Bank of America Corporation; President/Chief Executive Officer, CDC IXIS Asset Management Services, Inc.; Principal & Director of Operations, Scudder Funds, Scudder, Stevens & Clark, Inc.; Assistant Vice President, Fidelity Investments | | 229 | | ISO New England, Inc.(non-profit organization managing regional electricity market) |
Invesco V.I. Health Care Fund
Trustees and Officers–(continued)
| | | | | | | | |
Name, Year of Birth and
Position(s)
Held with the Trust | | Trustee
and/or
Officer
Since | | Principal Occupation(s)
During Past 5 Years | | Number of
Funds in
Fund Complex
Overseen by
Trustee | | Other
Directorship(s)
Held by Trustee
During Past 5
Years |
| Officers | | | | | | | | |
Sheri Morris – 1964
President, Principal Executive
Officer and Treasurer | | 1999 | | Head of Global Fund Services, Invesco Ltd.; President, Principal Executive Officer and Treasurer, The Invesco Funds; Vice President, Invesco Advisers, Inc. (formerly known as Invesco Institutional (N.A.), Inc.) (registered investment adviser); and Vice President, Invesco Exchange-Traded Fund Trust, Invesco Exchange-Traded Fund Trust II, Invesco India Exchange-Traded Fund Trust, Invesco Actively Managed Exchange-Traded Fund Trust, Invesco Actively Managed Exchange-Traded Commodity Fund Trust and Invesco Exchange-Traded Self-Indexed Fund Trust; and Vice President, OppenheimerFunds, Inc. Formerly: Vice President and Principal Financial Officer, The Invesco Funds; Vice President, Invesco AIM Advisers, Inc., Invesco AIM Capital Management, Inc. and Invesco AIM Private Asset Management, Inc.; Assistant Vice President and Assistant Treasurer, The Invesco Funds and Assistant Vice President, Invesco Advisers, Inc., Invesco AIM Capital Management, Inc. and Invesco AIM Private Asset Management, Inc.; and Treasurer, Invesco Exchange-Traded Fund Trust, Invesco Exchange-Traded Fund Trust II, Invesco India Exchange-Traded Fund Trust and Invesco Actively Managed Exchange-Traded Fund Trust | | N/A | | N/A |
Russell C. Burk – 1958
Senior Vice President and Senior Officer | | 2005 | | Senior Vice President and Senior Officer, The Invesco Funds | | N/A | | N/A |
Jeffrey H. Kupor - 1968
Senior Vice President, Chief Legal Officer and Secretary | | 2018 | | Head of Legal of the Americas, Invesco Ltd.; Senior Vice President and Secretary, Invesco Advisers, Inc. (formerly known as Invesco Institutional (N.A.), Inc.) (registered investment adviser); Senior Vice President and Secretary, Invesco Distributors, Inc. (formerly known as Invesco AIM Distributors, Inc.); Vice President and Secretary, Invesco Investment Services, Inc. (formerly known as Invesco AIM Investment Services, Inc.) Senior Vice President, Chief Legal Officer and Secretary, The Invesco Funds; Secretary and General Counsel, Invesco Investment Advisers LLC (formerly known as Van Kampen Asset Management); Secretary and General Counsel, Invesco Capital Markets, Inc. (formerly known as Van Kampen Funds Inc.) and Chief Legal Officer, Invesco Exchange-Traded Fund Trust, Invesco Exchange-Traded Fund Trust II, Invesco India Exchange-Traded Fund Trust, Invesco Actively Managed Exchange-Traded Fund Trust, Invesco Actively Managed Exchange-Traded Commodity Fund Trust and Invesco Exchange-Traded Self-Indexed Fund Trust; Secretary, Invesco Indexing LLC; Secretary, W.L. Ross & Co., LLC Formerly: Secretary and Vice President, Jemstep, Inc.; Head of Legal, Worldwide Institutional, Invesco Ltd.; Secretary and General Counsel, INVESCO Private Capital Investments, Inc.; Senior Vice President, Secretary and General Counsel, Invesco Management Group, Inc. (formerly known as Invesco AIM Management Group, Inc.); Assistant Secretary, INVESCO Asset Management (Bermuda) Ltd.; Secretary and General Counsel, Invesco Private Capital, Inc.; Assistant Secretary and General Counsel, INVESCO Realty, Inc.; Secretary and General Counsel, Invesco Senior Secured Management, Inc.; and Secretary, Sovereign G./P. Holdings Inc. | | N/A | | N/A |
Andrew R. Schlossberg - 1974
Senior Vice President | | 2019 | | Head of the Americas and Senior Managing Director, Invesco Ltd.; Director and Senior Vice President, Invesco Advisers, Inc. (formerly known as Invesco Institutional (N.A.), Inc.) (registered investment adviser); Director and Chairman, Invesco Investment Services, Inc. (formerly known as Invesco AIM Investment Services, Inc.) (registered transfer agent); Senior Vice President, The Invesco Funds; Director, Invesco Investment Advisers LLC (formerly known as Van Kampen Asset Management); Director, President and Chairman, Invesco Insurance Agency, Inc. Formerly: Director, Invesco UK Limited; Director and Chief Executive, Invesco Asset Management Limited and Invesco Fund Managers Limited; Assistant Vice President, The Invesco Funds; Senior Vice President, Invesco Advisers, Inc. (formerly known as Invesco Institutional (N.A.), Inc.) (registered investment adviser); Director and Chief Executive, Invesco Administration Services Limited and Invesco Global Investment Funds Limited; Director, Invesco Distributors, Inc.; Head of EMEA, Invesco Ltd.; President, Invesco Actively Managed Exchange-Traded Commodity Fund Trust, Invesco Actively Managed Exchange-Traded Fund Trust, Invesco Exchange-Traded Fund Trust, Invesco Exchange-Traded Fund Trust II and Invesco India Exchange-Traded Fund Trust; Managing Director and Principal Executive Officer, Invesco Capital Management LLC | | N/A | | N/A |
Invesco V.I. Health Care Fund
Trustees and Officers–(continued)
| | | | | | | | |
Name, Year of Birth and
Position(s)
Held with the Trust | | Trustee
and/or
Officer
Since | | Principal Occupation(s)
During Past 5 Years | | Number of
Funds in
Fund Complex
Overseen by
Trustee | | Other
Directorship(s)
Held by Trustee
During Past 5
Years |
| Officers—(continued) | | | | | | | | |
John M. Zerr – 1962
Senior Vice President | | 2006 | | Chief Operating Officer of the Americas; Senior Vice President, Invesco Advisers, Inc. (formerly known as Invesco Institutional (N.A.), Inc.) (registered investment adviser); Senior Vice President, Invesco Distributors, Inc. (formerly known as Invesco AIM Distributors, Inc.); Director and Vice President, Invesco Investment Services, Inc. (formerly known as Invesco AIM Investment Services, Inc.) Senior Vice President, The Invesco Funds; Managing Director, Invesco Capital Management LLC; Director, Invesco Investment Advisers LLC (formerly known as Van Kampen Asset Management); Senior Vice President, Invesco Capital Markets, Inc. (formerly known as Van Kampen Funds Inc.); Manager, Invesco Indexing LLC; Manager, Invesco Specialized Products, LLC; Director and Senior Vice President, Invesco Insurance Agency, Inc.; Member, Invesco Canada Funds Advisory Board; Director, President and Chief Executive Officer, Invesco Corporate Class Inc. (corporate mutual fund company); and Director, Chairman, President and Chief Executive Officer, Invesco Canada Ltd. (formerly known as Invesco Trimark Ltd./Invesco Trimark Ltèe) (registered investment adviser and registered transfer agent) Formerly: Director and Senior Vice President, Invesco Management Group, Inc. (formerly known as Invesco AIM Management Group, Inc.); Secretary and General Counsel, Invesco Management Group, Inc. (formerly known as Invesco AIM Management Group, Inc.); Secretary, Invesco Investment Services, Inc. (formerly known as Invesco AIM Investment Services, Inc.); Chief Legal Officer and Secretary, The Invesco Funds; Secretary and General Counsel, Invesco Investment Advisers LLC (formerly known as Van Kampen Asset Management); Secretary and General Counsel, Invesco Capital Markets, Inc. (formerly known as Van Kampen Funds Inc.); Chief Legal Officer, Invesco Exchange-Traded Fund Trust, Invesco Exchange-Traded Fund Trust II, Invesco India Exchange-Traded Fund Trust, Invesco Actively Managed Exchange-Traded Fund Trust, Invesco Actively Managed Exchange-Traded Commodity Fund Trust and Invesco Exchange-Traded Self-Indexed Fund Trust; Secretary, Invesco Indexing LLC; Director, Secretary, General Counsel and Senior Vice President, Van Kampen Exchange Corp.; Director, Vice President and Secretary, IVZ Distributors, Inc. (formerly known as INVESCO Distributors, Inc.); Director and Vice President, INVESCO Funds Group, Inc.; Director and Vice President, Van Kampen Advisors Inc.; Director, Vice President, Secretary and General Counsel, Van Kampen Investor Services Inc.; Director and Secretary, Invesco Distributors, Inc. (formerly known as Invesco AIM Distributors, Inc.); Director, Senior Vice President, General Counsel and Secretary, Invesco AIM Advisers, Inc. and Van Kampen Investments Inc.; Director, Vice President and Secretary, Fund Management Company; Director, Senior Vice President, Secretary, General Counsel and Vice President, Invesco AIM Capital Management, Inc.; Chief Operating Officer and General Counsel, Liberty Ridge Capital, Inc. (an investment adviser) | | N/A | | N/A |
Gregory G. McGreevey -1962
Senior Vice President | | 2012 | | Senior Managing Director, Invesco Ltd.; Director, Chairman, President, and Chief Executive Officer, Invesco Advisers, Inc. (formerly known as Invesco Institutional (N.A.), Inc.) (registered investment adviser); Director, Invesco Mortgage Capital, Inc. and Invesco Senior Secured Management, Inc.; and Senior Vice President, The Invesco Funds; and President, SNW Asset Management Corporation Formerly: Senior Vice President, Invesco Management Group, Inc. and Invesco Advisers, Inc.; Assistant Vice President, The Invesco Funds | | N/A | | N/A |
Kelli Gallegos - 1970
Vice President, Principal Financial Officer and Assistant Treasurer | | 2008 | | Principal Financial and Accounting Officer - Investments Pool, Invesco Specialized Products, LLC; Vice President, Principal Financial Officer and Assistant Treasurer, The Invesco Funds; Principal Financial and Accounting Officer - Pooled Investments, Invesco Capital Management LLC; Vice President and Treasurer, Invesco Exchange-Traded Fund Trust, Invesco Exchange-Traded Fund Trust II, Invesco India Exchange-Traded Fund Trust, Invesco Actively Managed Exchange-Traded Fund Trust, Invesco Actively Managed Exchange-Traded Commodity Fund Trust and Invesco Exchange-Traded Self-Indexed Fund Trust Formerly: Assistant Treasurer, Invesco Specialized Products, LLC; Assistant Treasurer, Invesco Exchange-Traded Fund Trust, Invesco Exchange-Traded Fund Trust II, Invesco India Exchange-Traded Fund Trust, Invesco Actively Managed Exchange-Traded Fund Trust, Invesco Actively Managed Exchange-Traded Commodity Fund Trust and Invesco Exchange-Traded Self-Indexed Fund Trust; Assistant Treasurer, Invesco Capital Management LLC; Assistant Vice President, The Invesco Funds | | N/A | | N/A |
Invesco V.I. Health Care Fund
Trustees and Officers–(continued)
| | | | | | | | |
Name, Year of Birth and
Position(s)
Held with the Trust | | Trustee
and/or
Officer
Since | | Principal Occupation(s)
During Past 5 Years | | Number of
Funds in
Fund Complex
Overseen by
Trustee | | Other
Directorship(s)
Held by Trustee
During Past 5
Years |
| Officers–(continued) | | | | | | | | |
| Crissie M. Wisdom - 1969 Anti-Money Laundering Compliance Officer | | 2013 | | Anti-Money Laundering Compliance Officer, Invesco Advisers, Inc. (formerly known as Invesco Institutional (N.A.), Inc.) (registered investment adviser), Invesco Capital Markets, Inc. (formerly known as Van Kampen Funds Inc.), Invesco Distributors, Inc., Invesco Investment Services, Inc., The Invesco Funds, and Invesco Exchange-Traded Fund Trust, Invesco Exchange-Traded Fund Trust II, Invesco India Exchange-Traded Fund Trust, Invesco Actively Managed Exchange-Traded Fund Trust, Invesco Actively Managed Exchange-Traded Commodity Fund Trust and Invesco Exchange-Traded Self-Indexed Fund Trust; Anti-Money Laundering Compliance Officer and Bank Secrecy Act Officer, INVESCO National Trust Company and Invesco Trust Company; and Fraud Prevention Manager and Controls and Risk Analysis Manager for Invesco Investment Services, Inc. Formerly: Anti-Money Laundering Compliance Officer, Van Kampen Exchange Corp. and Invesco Management Group, Inc. | | N/A | | N/A |
Robert R. Leveille - 1969
Chief Compliance Officer | | 2016 | | Chief Compliance Officer, Invesco Advisers, Inc. (registered investment adviser); and Chief Compliance Officer, The Invesco Funds Formerly: Chief Compliance Officer, Putnam Investments and the Putnam Funds | | N/A | | N/A |
The Statement of Additional Information of the Trust includes additional information about the Fund’s Trustees and is available upon request, without charge, by calling 1.800.959.4246. Please refer to the Fund’s Statement of Additional Information for information on the Fund’ssub-advisers.
| | | | | | |
Office of the Fund 11 Greenway Plaza, Suite 1000 Houston, TX 77046-1173 | | Investment Adviser Invesco Advisers, Inc. 1555 Peachtree Street, N.E. Atlanta, GA 30309 | | Distributor Invesco Distributors, Inc. 11 Greenway Plaza, Suite 1000 Houston, TX 77046-1173 | | Auditors PricewaterhouseCoopers LLP 1000 Louisiana Street, Suite 5800 Houston, TX 77002-5678 |
| | | |
Counsel to the Fund Stradley Ronon Stevens & Young, LLP 2005 Market Street, Suite 2600 Philadelphia, PA 19103-7018 | | Counsel to the Independent Trustees Goodwin Procter LLP 901 New York Avenue, N.W. Washington, D.C. 20001 | | Transfer Agent Invesco Investment Services, Inc. 11 Greenway Plaza, Suite 1000 Houston, TX 77046-1173 | | Custodian State Street Bank and Trust Company 225 Franklin Street Boston, MA 02110-2801 |
Invesco V.I. Health Care Fund
| | | | |
 | | Annual Report to Shareholders | | December 31, 2019 |
| | Invesco V.I. High Yield Fund |
| | |
| | |

Beginning on January 1, 2021, as permitted by regulations adopted by the Securities and Exchange Commission, the insurance company that offers your variable annuity or variable life insurance contract may no longer send you paper copies of the Fund’s shareholder reports by mail, unless you specifically request paper copies of the reports from the insurance company or your financial intermediary. Instead of delivering paper copies of the report, the insurance company may choose to make the reports available on a website, and will notify you by mail each time a report is posted and provide you with a website link to access the report. Instructions for requesting paper copies will be provided by your insurance company.
If the insurance company offers electronic delivery, you may elect to receive shareholder reports and other communications about the Fund electronically by following the instructions provided by the insurance company or by contacting your financial intermediary. If you already elected to receive shareholder reports electronically, you will not be affected by this change and you need not take any action.
You may elect to receive all future reports in paper free of charge from the insurance company. You can inform the insurance company or your financial intermediary that you wish to continue receiving paper copies of your shareholder reports by following the instructions provided by the insurance company or by contacting your financial intermediary. Your election to receive reports in paper will apply to all portfolio companies available under your contract with the insurance company.
The Fund provides a complete list of its holdings four times in each fiscal year, at the quarter-ends. For the second and fourth quarters, the lists appear in the Fund’s semiannual and annual reports to shareholders. For the first and third quarters, the Fund files the lists with the Securities and Exchange Commission (SEC) as an exhibit to its reports on FormN-PORT. The Fund’s FormN-PORT filings are available on the SEC website, sec.gov. The SEC file numbers for the Fund are811-07452 and033-57340. The Fund’s most recent portfolio holdings, as filed on FormN-PORT, have also been made available to insurance companies issuing variable annuity contracts and variable life insurance policies (“variable products”) that invest in the Fund.
A description of the policies and procedures that the Fund uses to determine how to vote proxies relating to portfolio securities is available without charge, upon request, from our Client Services department at 800 959 4246 or at invesco.com/proxyguidelines. The information is also available on the SEC website, sec.gov.
Information regarding how the Fund voted proxies related to its portfolio securities during the most recent12-month period ended June 30 is available at invesco.com/proxysearch. The information is also available on the SEC website, sec.gov.
Invesco Advisers, Inc. is an investment adviser; it provides investment advisory services to individual and institutional clients and does not sell securities. Invesco Distributors, Inc. is the US distributor for Invesco Ltd.’s retail mutual funds, exchange-traded funds and institutional money market funds. Both are wholly owned, indirect subsidiaries of Invesco Ltd.
This report must be accompanied or preceded by a currently effective Fund prospectus and variable product prospectus, which contain more complete information, including sales charges and expenses. Investors should read each carefully before investing.
NOT FDIC INSURED | MAY LOSE VALUE | NO BANK GUARANTEE
| | |
Invesco Distributors, Inc. | | VIHYI-AR-1 |
Management’s Discussion of Fund Performance
Performance summary
For the year ended December 31, 2019, Series I shares of Invesco V.I. High Yield Fund (the Fund) underperformed the Bloomberg Barclays U.S. Corporate High Yield 2% Issuer Cap Index, the Fund’s style-specific benchmark.
Your Fund’s long-term performance appears later in this report.
Fund vs. Indexes
Total returns, 12/31/18 to 12/31/19, excluding variable product issuer charges. If variable product issuer charges were included, returns would be lower.
| | | | | |
Series I Shares | | | | 13.51 | % |
Series II Shares | | | | 13.16 | |
Bloomberg Barclays U.S. Aggregate Bond Indexq (Broad Market Index) | | | | 8.72 | |
Bloomberg Barclays U.S. Corporate High Yield 2% Issuer Cap Indexq (Style-Specific Index) | | | | 14.32 | |
Lipper VUF High Yield Bond Funds Classification Average∎(Peer Group) | | | | 13.01 | |
Source(s):qRIMES Technologies Corp.;∎Lipper Inc. | |
Market conditions and your Fund
For the year ended December 31, 2019, US high yield bond returns were positive. The year began with heightened volatility as investors feared that the US Federal Reserve (the Fed) had gone too far in its monetary policy tightening and that the effects would lead to a synchronized global economic growth slowdown. That uncertainty was quickly alleviated when the Fed changed its course in January and indicated it would not raise interest rates in 2019. The renewed risk appetite was further inspired by dovish central banks globally.
The Fed cut interest rates three times during the year to a range of 1.50% to 1.75%.1 The European Central Bank also cut rates to end 2019 at-0.5%.2 This, coupled with easier fiscal and monetary
policy in China and the continued economic woes plaguing the European Union, led to easier financial conditions globally, which in turn drove interest rates lower across maturities.
Against this backdrop, the high yield market posted strong returns for the year. Overall, underlying company fundamentals remained supportive in spite of a weakening outlook for the energy and materials sectors as commodity prices fell. Despite the bullish sentiment of investors throughout the year, thepar-weighted high yield default rate increased over 1% in 2019, and ended the year at 2.94%, compared to 1.89% at the end of 2018.3 New issuance increased more than expected in 2019, due to a surge in refinancing activity in response to the Fed’s interest rate cuts. For the year, total issuance was $287
billion compared to $187 billion in 2018, representing a 53% increase.3 In 2019, high yield mutual funds had inflows of $19 billion at year end, compared to $47 billion of outflows in 2019.3
The Bloomberg Barclays U.S. Corporate High Yield 2% Issuer Cap Index, which measures the performance of the US high yield bond market and is the Fund’s style-specific index, returned 14.32% for the year. Likewise, the Fund generated a positive return for the year.
During the year, the Fund benefited from its positioning in the aerospace and defense and metals and mining industries relative to the style-specific index. While the Fund had an overweight allocation to the independent energy sector relative to the style-specific index, security selection was a significant contributor to the Fund’s relative performance. The Fund’s overweight allocation to construction machinery was also beneficial to relative Fund performance, along with security selection in the pharmaceuticals industry.
The Fund’s underweight allocation to technology during the year, relative to the style-specific index, was the largest detractor from the Fund’s performance. Security selection in retailers was also a drag on the Fund’s relative return. Additionally, an underweight allocation to finance companies, along with security selection in the industry, detracted from the Fund’s relative performance.
During the year, we used currency forward contracts for the purpose of hedging currency exposure ofnon-US-dollar-denominated bonds held in the
| | |
Portfolio Composition* |
By credit quality | | % of total investments |
| | |
| |
A | | 1.8% |
BBB | | 2.7 |
BB | | 33.2 |
B | | 43.3 |
CCC | | 17.6 |
Non-Rated | | 1.4 |
| * | Source: Standard & Poor’s. A credit rating is an assessment provided by a nationally recognized statistical rating organization (NRSRO) of the creditworthiness of an issuer with respect to debt obligations, including specific securities, money market instruments or other debts. Ratings are measured on a scale that generally ranges from AAA (highest) to D (lowest); ratings are subject to change without notice.“Non- Rated” indicates the debtor was not rated, and should not be interpreted as indicating low quality. For more information on Standard & Poor’s rating methodology, please visit standardandpoors.com and select “Understanding Ratings” under Rating Resources on the homepage. |
| | |
Top Five Debt Issuers* | | |
| % of total net assets |
| |
1. CSC Holdings, LLC | | 1.62% |
2. Sprint Corp. | | 1.58 |
3. Bombardier, Inc. | | 1.31 |
4. Tenet Healthcare Corp. | | 1.25 |
5. HCA, Inc. | | 1.13 |
| | |
Total Net Assets | | $155.1 million |
| |
Total Number of Holdings* | | 313 |
The Fund’s holdings are subject to change, and there is no assurance that the Fund will continue to hold any particular security.
*Excluding money market fund holdings, if any.
Data presented here are as of December 31, 2019.
Invesco V.I. High Yield Fund
portfolio. We also used credit default swaps to efficiently manage the portfolio and to take advantage of relative value opportunities. The use of currency, interest rate and credit derivatives had an immaterial impact on the Fund’s performance during the year.
We wish to remind you that the Fund is subject to interest rate risk, meaning when interest rates rise, the value of fixed income securities tends to fall. The degree to which the value of fixed income securities may decline due to rising interest rates may vary depending on the speed and magnitude of the increase in interest rates, as well as individual security characteristics, such as price, maturity, duration and coupon and market forces, such as supply and demand for similar securities. We are monitoring interest rates, and the market, economic and geopolitical factors that may impact the direction, speed and magnitude of changes to interest rates across the maturity spectrum, including the potential impact of monetary policy changes by the Fed and certain foreign central banks. If interest rates rise, markets may experience increased volatility, which may affect the value and/or liquidity of certain of the Fund’s investments.
Thank you for investing in Invesco V.I. High Yield Fund and for sharing our long-term investment horizon.
1 Source: US Federal Reserve
2 Source: European Central Bank
3 Source: JP Morgan
Portfolio managers:
Andrew Geryol
Joseph Portera
Scott Roberts
The views and opinions expressed in management’s discussion of Fund performance are those of Invesco Advisers, Inc. These views and opinions are subject to change at any time based on factors such as market and economic conditions. These views and opinions may not be relied upon as investment advice or recommendations, or as an offer for a particular security. The information is not a complete analysis of every aspect of any market, country, industry, security or the Fund. Statements of fact are from sources considered reliable, but Invesco Advisers, Inc. makes no representation or warranty as to their completeness or accuracy. Although historical performance is no guarantee of future results, these insights may help you understand our investment management philosophy.
See important Fund and, if applicable, index disclosures later in this report.
Invesco V.I. High Yield Fund
Your Fund’s Long-Term Performance
Results of a $10,000 Investment – Oldest Share Class(es)
Fund and index data from 12/31/09
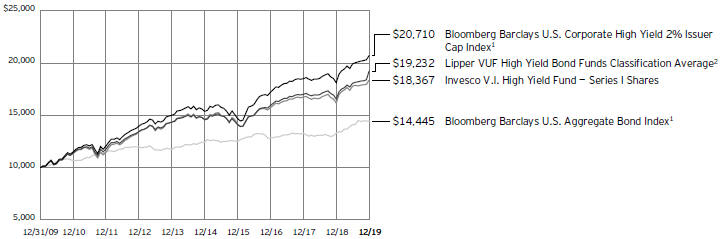
1 Source: RIMES Technologies Corp.
2 Source: Lipper Inc.
Past performance cannot guarantee future results.
| | | | |
| Average Annual Total Returns | |
| As of 12/31/19 | | | | |
| |
| Series I Shares | | | | |
| Inception (5/1/98) | | | 4.38 | % |
| 10 Years | | | 6.27 | |
| 5 Years | | | 4.66 | |
| 1 Year | | | 13.51 | |
| |
| Series II Shares | | | | |
| Inception (3/26/02) | | | 6.60 | % |
| 10 Years | | | 6.03 | |
| 5 Years | | | 4.39 | |
| 1 Year | | | 13.16 | |
The performance of the Fund’s Series I and Series II share classes will differ primarily due to different class expenses.
The performance data quoted represent past performance and cannot guarantee future results; current performance may be lower or higher. Please contact your variable product issuer or financial adviser for the most recentmonth-end variable product performance. Performance figures reflect Fund expenses, reinvested distributions and changes in net asset value. Performance figures do not reflect deduction of taxes a shareholder would pay on Fund distributions or sale of Fund shares. Investment return and principal value will fluctuate so that you may have a gain or loss when you sell shares.
The total annual Fund operating expense ratio set forth in the most recent Fund prospectus as of the date of this report for Series I and Series II shares was 1.18% and 1.43%, respectively. The expense ratios presented above may vary from the
expense ratios presented in other sections of this report that are based on expenses incurred during the period covered by this report.
Invesco V.I. High Yield Fund, a series portfolio of AIM Variable Insurance Funds (Invesco Variable Insurance Funds), is currently offered through insurance companies issuing variable products. You cannot purchase shares of the Fund directly. Performance figures given represent the Fund and are not intended to reflect actual variable product values. They do not reflect sales charges, expenses and fees assessed in connection with a variable product. Sales charges, expenses and fees, which are determined by the variable product issuers, will vary and will lower the total return.
The most recentmonth-end performance data at the Fund level, excluding variable product charges, is available at 800 451 4246. As mentioned above, for the most recentmonth-end performance including variable product charges, please contact your variable product issuer or financial adviser.
Fund performance reflects any applicable fee waivers and/or expense reimbursements. Had the adviser not waived fees and/or reimbursed expenses currently or in the past, returns would have been lower. See current prospectus for more information.
Invesco V.I. High Yield Fund
Invesco V.I. High Yield Fund’s investment objective is total return, comprised of current income and capital appreciation.
| ∎ | Unless otherwise stated, information presented in this report is as of December 31, 2019, and is based on total net assets. |
| ∎ | Unless otherwise noted, all data provided by Invesco. |
| ∎ | To access your Fund’s reports/prospectus, visit invesco.com/fundreports. |
About indexes used in this report
| ∎ | TheBloomberg Barclays U.S. Aggregate Bond Indexis an unmanaged index considered representative of the US investment grade, fixed-rate bond market. |
| ∎ | TheBloomberg Barclays U.S. Corporate High Yield 2% Issuer Cap Indexis an unmanaged index considered representative of the US high-yield, fixed-rate corporate bond market. Index weights for each issuer are capped at 2%. |
| ∎ | TheLipper VUF High Yield Bond Funds Classification Averagerepresents an average of all variable insurance underlying funds in the Lipper High Yield Bond Funds classification. |
| ∎ | The Fund is not managed to track the performance of any particular index, including the index(es) described here, and consequently, the performance of the Fund may deviate significantly from the performance of the index(es). |
| ∎ | A direct investment cannot be made in an index. Unless otherwise indicated, index results include reinvested dividends, and they do not reflect sales charges. Performance of the peer group, if applicable, reflects fund expenses; performance of a market index does not. |
Other information
| ∎ | The returns shown in management’s discussion of Fund performance are based on net asset values calculated for shareholder transactions. Generally accepted accounting principles require adjustments to be made to the net assets of the Fund at period end for financial reporting purposes, and as such, the net asset values for shareholder transactions and the returns based on those net asset values may differ from the net asset values and returns reported in the Financial Highlights. Additionally, the returns and net asset values shown throughout this report are at the Fund level only and do not include variable product issuer charges. If such charges were included, the total returns would be lower. |
Invesco V.I. High Yield Fund
Schedule of Investments(a)
December 31, 2019
| | | | | | |
| | | Principal
Amount | | | Value |
U.S. Dollar Denominated Bonds & Notes–87.25% |
|
Aerospace & Defense–3.63% |
| | |
Bombardier, Inc. (Canada),
| | | | | | |
8.75%, 12/01/2021(b) | | $ | 170,000 | | | $ 186,639 |
5.75%, 03/15/2022(b) | | | 215,000 | | | 222,437 |
6.13%, 01/15/2023(b) | | | 428,000 | | | 439,806 |
7.50%, 03/15/2025(b) | | | 982,000 | | | 1,015,133 |
7.88%, 04/15/2027(b) | | | 161,000 | | | 166,035 |
Moog, Inc., 4.25%, 12/15/2027(b) | | | 239,000 | | | 243,804 |
TransDigm UK Holdings PLC, 6.88%, 05/15/2026 | | | 600,000 | | | 640,708 |
TransDigm, Inc.,
| | | | | | |
6.50%, 07/15/2024 | | | 157,000 | | | 162,249 |
6.50%, 05/15/2025 | | | 574,000 | | | 598,157 |
6.25%, 03/15/2026(b) | | | 871,000 | | | 944,586 |
Triumph Group, Inc.,
| | | | | | |
6.25%, 09/15/2024(b) | | | 148,000 | | | 155,894 |
7.75%, 08/15/2025 | | | 819,000 | | | 856,359 |
| | | | | | | 5,631,807 |
|
Agricultural & Farm Machinery–0.65% |
| | |
Titan International, Inc., 6.50%, 11/30/2023 | | | 1,181,000 | | | 1,013,198 |
| | |
Airlines–0.27% | | | | | | |
| | |
Air Canada (Canada), 7.75%, 04/15/2021(b) | | | 400,000 | | | 426,600 |
|
Alternative Carriers–1.16% |
| | |
CenturyLink, Inc., | | | | | | |
Series S, 6.45%, 06/15/2021 | | | 210,000 | | | 220,290 |
Series Y, 7.50%, 04/01/2024 | | | 696,000 | | | 786,191 |
Level 3 Financing, Inc., | | | | | | |
5.38%, 05/01/2025 | | | 365,000 | | | 378,536 |
5.25%, 03/15/2026 | | | 400,000 | | | 416,740 |
| | | | | | | 1,801,757 |
|
Apparel Retail–0.96% |
| | |
L Brands, Inc., | | | | | | |
6.88%, 11/01/2035 | | | 684,000 | | | 613,394 |
6.75%, 07/01/2036 | | | 101,000 | | | 88,890 |
Michaels Stores, Inc., 8.00%, 07/15/2027(b) | | | 830,000 | | | 794,186 |
| | | | | | | 1,496,470 |
|
Apparel, Accessories & Luxury Goods–0.22% |
| | |
William Carter Co. (The), 5.63%, 03/15/2027(b) | | | 317,000 | | | 341,511 |
| | | | | | |
| | | Principal
Amount | | | Value |
Asset Management & Custody Banks–0.43% |
| | |
Prime Security Services Borrower LLC/Prime Finance, Inc., | | | | | | |
9.25%, 05/15/2023(b) | | $ | 457,000 | | | $ 480,135 |
5.75%, 04/15/2026(b) | | | 172,000 | | | 187,266 |
| | | | | | | 667,401 |
|
Auto Parts & Equipment–1.43% |
| | |
Adient Global Holdings Ltd., 4.88%, 08/15/2026(b) | | | 350,000 | | | 313,259 |
Dana, Inc., | | | | | | |
5.50%, 12/15/2024 | | | 498,000 | | | 513,356 |
5.38%, 11/15/2027 | | | 119,000 | | | 122,867 |
Flexi-Van Leasing, Inc., 10.00%, 02/15/2023(b) | | | 346,000 | | | 329,565 |
Panther BF Aggregator 2 L.P./Panther Finance Co., Inc., | | | | | | |
6.25%, 05/15/2026(b) | | | 215,000 | | | 232,065 |
8.50%, 05/15/2027(b) | | | 354,000 | | | 376,780 |
Tenneco, Inc., 5.00%, 07/15/2026 | | | 365,000 | | | 336,722 |
| | | | | | | 2,224,614 |
|
Automobile Manufacturers–1.50% |
| | |
Ford Motor Credit Co. LLC, | | | | | | |
5.60%, 01/07/2022 | | | 514,000 | | | 541,648 |
5.11%, 05/03/2029 | | | 616,000 | | | 634,580 |
J.B. Poindexter & Co., Inc., 7.13%, 04/15/2026(b) | | | 1,086,000 | | | 1,148,822 |
Motors Liquidation Co., 8.38%, 07/15/2033(c)(d) | | | 1,060,000 | | | 0 |
| | | | | | | 2,325,050 |
|
Automotive Retail–1.99% |
| | |
Capitol Investment Merger Sub 2 LLC, 10.00%, 08/01/2024(b) | | | 646,000 | | | 672,108 |
Lithia Motors, Inc.,
| | | | | | |
5.25%, 08/01/2025(b) | | | 248,000 | | | 260,193 |
4.63%, 12/15/2027(b) | | | 169,000 | | | 174,131 |
Murphy Oil USA, Inc.,
| | | | | | |
5.63%, 05/01/2027 | | | 722,000 | | | 776,401 |
4.75%, 09/15/2029 | | | 202,000 | | | 213,700 |
Penske Automotive Group, Inc., 5.50%, 05/15/2026 | | | 942,000 | | | 988,487 |
| | | | | | | 3,085,020 |
|
Broadcasting–2.21% |
AMC Networks, Inc.,
| | | | | | |
5.00%, 04/01/2024 | | | 486,000 | | | 496,935 |
4.75%, 08/01/2025 | | | 127,000 | | | 127,741 |
Clear Channel Worldwide Holdings, Inc., 9.25%, 02/15/2024(b) | | | 929,000 | | | 1,030,805 |
Gray Television, Inc., 7.00%, 05/15/2027(b) | | | 564,000 | | | 627,788 |
iHeartCommunications, Inc., 8.38%, 05/01/2027 | | | 817,000 | | | 904,296 |
See accompanying Notes to Financial Statements which are an integral part of the financial statements.
Invesco V.I. High Yield Fund
| | | | | | | | |
| | | Principal
Amount | | | Value | |
| |
Broadcasting–(continued) | | | | | | | | |
| | |
TV Azteca S.A.B. de C.V. (Mexico), 8.25%, 08/09/2024 | | $ | 270,000 | | | $ | 241,765 | |
| |
| | | | | | | 3,429,330 | |
| |
|
Building Products–0.42% | |
| | |
Advanced Drainage Systems, Inc., 5.00%, 09/30/2027(b) | | | 219,000 | | | | 226,467 | |
| |
Standard Industries, Inc.,
5.00%, 02/15/2027(b) | | | 400,000 | | | | 417,929 | |
| |
| | | | | | | 644,396 | |
| |
|
Cable & Satellite–6.47% | |
| | |
Altice Financing S.A. (Luxembourg), 7.50%, 05/15/2026(b) | | | 430,000 | | | | 463,046 | |
| |
Altice Luxembourg S.A. (Luxembourg), 10.50%, 05/15/2027(b) | | | 410,000 | | | | 468,179 | |
| |
CCO Holdings LLC/CCO Holdings Capital Corp., | | | | | | | | |
5.75%, 01/15/2024 | | | 6,000 | | | | 6,122 | |
| |
5.75%, 02/15/2026(b) | | | 1,128,000 | | | | 1,192,149 | |
| |
5.13%, 05/01/2027(b) | | | 400,000 | | | | 422,740 | |
| |
CSC Holdings LLC, | | | | | | | | |
10.88%, 10/15/2025(b) | | | 445,000 | | | | 498,122 | |
| |
6.50%, 02/01/2029(b) | | | 1,395,000 | | | | 1,558,041 | |
| |
Dish DBS Corp., | | | | | | | | |
5.88%, 11/15/2024 | | | 986,000 | | | | 1,009,625 | |
| |
7.75%, 07/01/2026 | | | 220,000 | | | | 233,473 | |
| |
DISH Network Corp., Conv., 3.38%, 08/15/2026 | | | 376,000 | | | | 362,614 | |
| |
Intelsat Jackson Holdings S.A. (Luxembourg), | | | | | | | | |
5.50%, 08/01/2023 | | | 967,000 | | | | 832,708 | |
| |
8.50%, 10/15/2024(b) | | | 501,000 | | | | 457,370 | |
| |
9.75%, 07/15/2025(b) | | | 210,000 | | | | 194,688 | |
| |
Telenet Finance Luxembourg Notes S.a r.l. (Belgium), 5.50%, 03/01/2028(b) | | | 400,000 | | | | 430,600 | |
| |
UPCB Finance IV Ltd. (Netherlands), 5.38%, 01/15/2025(b) | | | 450,000 | | | | 463,538 | |
| |
Virgin Media Finance PLC (United Kingdom), 6.00%, 10/15/2024(b) | | | 450,000 | | | | 464,812 | |
| |
Virgin Media Secured Finance PLC (United Kingdom), 5.50%, 08/15/2026(b) | | | 300,000 | | | | 315,697 | |
| |
VTR Finance B.V. (Chile), 6.88%, 01/15/2024(b) | | | 440,000 | | | | 450,817 | |
| |
Ziggo Bond Co. B.V. (Netherlands), 5.88%, 01/15/2025(b) | | | 200,000 | | | | 206,709 | |
| |
| | | | | | | 10,031,050 | |
| |
|
Casinos & Gaming–2.44% | |
| | |
Boyd Gaming Corp., 6.00%, 08/15/2026 | | | 226,000 | | | | 243,311 | |
| |
Cirsa Finance International S.a.r.l. (Spain), 7.88%, 12/20/2023(b) | | | 200,000 | | | | 212,342 | |
| |
Codere Finance 2 (Luxembourg) S.A. (Spain), 7.63%, 11/01/2021(b) | | | 448,000 | | | | 409,838 | |
| |
Melco Resorts Finance Ltd. (Hong Kong), 5.63%, 07/17/2027(b) | | | 229,000 | | | | 238,921 | |
| |
| | | | | | | | |
| | | Principal
Amount | | | Value | |
| |
Casinos & Gaming–(continued) | | | | | |
| | |
MGM China Holdings Ltd. (Macau), 5.88%, 05/15/2026(b) | | $ | 206,000 | | | $ | 218,746 | |
| |
MGM Resorts International,
| | | | | | | | |
7.75%, 03/15/2022 | | | 519,000 | | | | 579,609 | |
| |
6.00%, 03/15/2023 | | | 305,000 | | | | 335,373 | |
| |
Scientific Games International, Inc., 7.00%, 05/15/2028(b) | | | 251,000 | | | | 269,034 | |
| |
Studio City Finance Ltd. (Macau), 7.25%, 02/11/2024(b) | | | 505,000 | | | | 535,090 | |
| |
Wynn Las Vegas LLC/Wynn Las Vegas Capital Corp., 5.50%, 03/01/2025(b) | | | 685,000 | | | | 735,512 | |
| |
| | | | | | | 3,777,776 | |
| |
|
Coal & Consumable Fuels–0.68% | |
| | |
SunCoke Energy Partners L.P./SunCoke Energy Partners Finance Corp., 7.50%, 06/15/2025(b) | | | 1,097,000 | | | | 1,057,684 | |
| |
| | |
Commodity Chemicals–0.82% | | | | | | | | |
| | |
Koppers, Inc., 6.00%, 02/15/2025(b) | | | 460,000 | | | | 482,996 | |
| |
Nufarm Australia Ltd./Nufarm Americas, Inc. (Australia), 5.75%, 04/30/2026(b) | | | 306,000 | | | | 302,281 | |
| |
Olin Corp., 5.63%, 08/01/2029 | | | 466,000 | | | | 493,051 | |
| |
| | | | | | | 1,278,328 | |
| |
|
Communications Equipment–0.75% | |
| | |
CommScope Technologies LLC, 6.00%, 06/15/2025(b) | | | 152,000 | | | | 152,552 | |
| |
Hughes Satellite Systems Corp., 7.63%, 06/15/2021 | | | 942,000 | | | | 1,008,194 | |
| |
| | | | | | | 1,160,746 | |
| |
|
Construction & Engineering–0.48% | |
| | |
William Lyon Homes, Inc., | | | | | | | | |
6.00%, 09/01/2023 | | | 124,000 | | | | 129,632 | |
| |
6.63%, 07/15/2027(b) | | | 562,000 | | | | 611,370 | |
| |
| | | | | | | 741,002 | |
| |
|
Construction Materials–0.18% | |
| | |
Cemex S.A.B. de C.V. (Mexico), 5.45%, 11/19/2029(b) | | | 270,000 | | | | 282,488 | |
| |
|
Consumer Finance–1.78% | |
| | |
Ally Financial, Inc., 5.13%, 09/30/2024 | | | 966,000 | | | | 1,067,309 | |
| |
Navient Corp.,
| | | | | | | | |
8.00%, 03/25/2020 | | | 178,000 | | | | 180,142 | |
| |
7.25%, 01/25/2022 | | | 345,000 | | | | 375,436 | |
| |
7.25%, 09/25/2023 | | | 1,005,000 | | | | 1,138,183 | |
| |
| | | | | | | 2,761,070 | |
| |
|
Copper–1.88% | |
| | |
First Quantum Minerals Ltd. (Zambia), 7.50%,
04/01/2025(b) | | | 1,022,000 | | | | 1,047,126 | |
| |
Freeport-McMoRan, Inc., 5.40%, 11/14/2034 | | | 1,118,000 | | | | 1,173,702 | |
| |
See accompanying Notes to Financial Statements which are an integral part of the financial statements.
Invesco V.I. High Yield Fund
| | | | | | | | |
| | | Principal
Amount | | | Value | |
| |
Copper–(continued) | |
| | |
Taseko Mines Ltd. (Canada), 8.75%, 06/15/2022(b) | | $ | 840,000 | | | $ | 699,562 | |
| |
| | | | | | | 2,920,390 | |
| |
|
Data Processing & Outsourced Services–0.55% | |
| | |
Alliance Data Systems Corp., 4.75%, 12/15/2024(b) | | | 394,000 | | | | 394,000 | |
| |
Cardtronics Inc./Cardtronics USA, Inc., 5.50%, 05/01/2025(b) | | | 440,000 | | | | 457,783 | |
| |
| | | | | | | 851,783 | |
| |
|
Distributors–0.66% | |
| | |
Core & Main Holdings L.P., 9.38% PIK Rate, 8.63% Cash Rate, 09/15/2024(b)(e) | | | 975,000 | | | | 1,016,842 | |
| |
|
Diversified Banks–0.94% | |
| | |
Barclays Bank PLC (United Kingdom), 7.63%, 11/21/2022 | | | 200,000 | | | | 224,893 | |
| |
Credit Agricole S.A. (France), 8.13%(b)(f) | | | 507,000 | | | | 616,449 | |
| |
Societe Generale S.A. (France), 7.38%(b)(f) | | | 308,000 | | | | 327,027 | |
| |
Standard Chartered PLC (United Kingdom), 7.50%(b)(f) | | | 263,000 | | | | 283,957 | |
| |
| | | | | | | 1,452,326 | |
| |
|
Diversified Chemicals–0.53% | |
| | |
Braskem Netherlands Finance B.V. (Brazil), 4.50%,
01/31/2030(b) | | | 320,000 | | | | 318,880 | |
| |
Chemours Co. (The), 7.00%, 05/15/2025 | | | 220,000 | | | | 222,109 | |
| |
Trinseo Materials Operating S.C.A./Trinseo Materials Finance, Inc., 5.38%, 09/01/2025(b) | | | 285,000 | | | | 285,712 | |
| |
| | | | | | | 826,701 | |
| |
|
Diversified Metals & Mining–0.53% | |
| | |
Hudbay Minerals, Inc. (Canada), 7.63%, 01/15/2025(b) | | | 396,000 | | | | 418,804 | |
| |
Vedanta Resources Ltd. (India), 6.38%, 07/30/2022(b) | | | 407,000 | | | | 400,208 | |
| |
| | | | | | | 819,012 | |
| |
|
Diversified REITs–0.73% | |
|
Colony Capital, Inc., Conv., | |
3.88%, 01/15/2021 | | | 34,000 | | | | 33,575 | |
| |
5.00%, 04/15/2023 | | | 268,000 | | | | 267,659 | |
| |
iStar, Inc., 4.75%, 10/01/2024 | | | 803,000 | | | | 833,783 | |
| |
| | | | | | | 1,135,017 | |
| |
|
Diversified Support Services–0.31% | |
| | |
IAA, Inc., 5.50%, 06/15/2027(b) | | | 454,000 | | | | 483,215 | |
| |
|
Electric Utilities–0.25% | |
| | |
DPL, Inc., 4.35%, 04/15/2029(b) | | | 405,000 | | | | 390,729 | |
| |
| | | | | | | | |
| | | Principal
Amount | | | Value | |
| |
Electrical Components & Equipment–0.51% | |
| | |
EnerSys, | | | | | | | | |
5.00%, 04/30/2023(b) | | $ | 598,000 | | | $ | 628,148 | |
| |
4.38%, 12/15/2027(b) | | | 172,000 | | | | 170,297 | |
| |
| | | | | | | 798,445 | |
| |
|
Electronic Equipment & Instruments–0.48% | |
| | |
Itron, Inc., 5.00%, 01/15/2026(b) | | | 452,000 | | | | 469,672 | |
| |
MTS Systems Corp., 5.75%, 08/15/2027(b) | | | 260,000 | | | | 272,440 | |
| |
| | | | | | | 742,112 | |
| |
|
Environmental & Facilities Services–0.47% | |
| | |
GFL Environmental, Inc. (Canada), | | | | | | | | |
7.00%, 06/01/2026(b) | | | 141,000 | | | | 149,354 | |
| |
5.13%, 12/15/2026(b) | | | 103,000 | | | | 108,550 | |
| |
Waste Pro USA, Inc., 5.50%, 02/15/2026(b) | | | 444,000 | | | | 463,901 | |
| |
| | | | | | | 721,805 | |
| |
|
Fertilizers & Agricultural Chemicals–0.32% | |
| | |
OCI N.V. (Netherlands), 6.63%, 04/15/2023(b) | | | 481,000 | | | | 503,126 | |
| |
|
Food Retail–1.29% | |
| | |
Albertsons Cos., Inc./Safeway, Inc./New Albertson’s, Inc./Albertson’s LLC, | | | | | | | | |
6.63%, 06/15/2024 | | | 783,000 | | | | 821,484 | |
| |
7.50%, 03/15/2026(b) | | | 278,000 | | | | 312,576 | |
| |
5.88%, 02/15/2028(b) | | | 309,000 | | | | 328,884 | |
| |
Quatrim S.A.S.U. (France), 5.88%, 01/15/2024(b) | | | 100,000 | | | | 118,455 | |
| |
Simmons Foods, Inc., 5.75%, 11/01/2024(b) | | | 419,000 | | | | 421,969 | |
| |
| | | | | | | 2,003,368 | |
| |
|
Forest Products–0.38% | |
| | |
Norbord, Inc. (Canada), 5.75%, 07/15/2027(b) | | | 560,000 | | | | 582,595 | |
| |
|
Gas Utilities–1.16% | |
| | |
AmeriGas Partners L.P./AmeriGas Finance Corp., 5.88%, 08/20/2026 | | | 741,000 | | | | 818,323 | |
| |
Suburban Propane Partners L.P./Suburban Energy Finance Corp., 5.50%, 06/01/2024 | | | 955,000 | | | | 983,641 | |
| |
| | | | | | | 1,801,964 | |
| |
|
Health Care Facilities–3.18% | |
| | |
Community Health Systems, Inc., | | | | | | | | |
6.25%, 03/31/2023 | | | 777,000 | | | | 790,597 | |
| |
8.00%, 03/15/2026(b) | | | 449,000 | | | | 463,311 | |
| |
HCA, Inc., | | | | | | | | |
7.50%, 02/15/2022 | | | 334,000 | | | | 369,664 | |
| |
5.38%, 02/01/2025 | | | 640,000 | | | | 709,066 | |
| |
5.88%, 02/15/2026 | | | 410,000 | | | | 466,982 | |
| |
5.50%, 06/15/2047 | | | 170,000 | | | | 195,159 | |
| |
See accompanying Notes to Financial Statements which are an integral part of the financial statements.
Invesco V.I. High Yield Fund
| | | | | | | | |
| | | Principal
Amount | | | Value | |
| |
Health Care Facilities–(continued) | |
| | |
Tenet Healthcare Corp., 6.75%, 06/15/2023 | | $ | 1,760,000 | | | $ | 1,937,399 | |
| |
| | | | | | | 4,932,178 | |
| |
|
Health Care REITs–0.27% | |
| | |
MPT Operating Partnership L.P./MPT Finance Corp., 5.00%, 10/15/2027 | | | 395,000 | | | | 419,697 | |
| |
|
Health Care Services–1.95% | |
| | |
Eagle Holding Co. II LLC, 8.38% PIK Rate, 7.63% Cash Rate, 05/15/2022(b)(e) | | | 474,000 | | | | 482,642 | |
| |
Envision Healthcare Corp., 8.75%, 10/15/2026(b) | | | 213,000 | | | | 132,667 | |
| |
Hadrian Merger Sub, Inc., 8.50%, 05/01/2026(b) | | | 795,000 | | | | 816,145 | |
| |
MPH Acquisition Holdings LLC, 7.13%, 06/01/2024(b) | | | 650,000 | | | | 630,494 | |
| |
Polaris Intermediate Corp., 9.25% PIK Rate, 8.50% Cash Rate, 12/01/2022(b)(e) | | | 386,000 | | | | 360,425 | |
| |
Surgery Center Holdings, Inc., 10.00%, 04/15/2027(b) | | | 308,000 | | | | 338,907 | |
| |
Team Health Holdings, Inc., 6.38%, 02/01/2025(b) | | | 384,000 | | | | 257,439 | |
| |
| | | | | | | 3,018,719 | |
| |
|
Home Improvement Retail–0.26% | |
| | |
Hillman Group, Inc. (The), 6.38%, 07/15/2022(b) | | | 438,000 | | | | 408,572 | |
| |
|
Homebuilding–1.86% | |
| | |
Ashton Woods USA LLC/Ashton Woods Finance Co., 9.88%, 04/01/2027(b) | | | 402,000 | | | | 453,395 | |
| |
KB Home, 4.80%, 11/15/2029 | | | 300,000 | | | | 306,750 | |
| |
Lennar Corp., | | | | | | | | |
8.38%, 01/15/2021 | | | 112,000 | | | | 118,765 | |
| |
5.38%, 10/01/2022 | | | 404,000 | | | | 432,406 | |
| |
Mattamy Group Corp. (Canada), 5.25%, 12/15/2027(b) | | | 284,000 | | | | 296,070 | |
| |
Meritage Homes Corp., 5.13%, 06/06/2027 | | | 350,000 | | | | 373,746 | |
| |
PulteGroup, Inc., 6.38%, 05/15/2033 | | | 11,000 | | | | 12,878 | |
| |
Taylor Morrison Communities, Inc., 5.75%, 01/15/2028(b) | | | 320,000 | | | | 349,711 | |
| |
Taylor Morrison Communities, Inc./Taylor Morrison Holdings II, Inc., 5.88%, 04/15/2023(b) | | | 498,000 | | | | 538,047 | |
| |
| | | | | | | 2,881,768 | |
| |
|
Household Products–1.35% | |
| | |
Energizer Holdings, Inc., | | | | | | | | |
6.38%, 07/15/2026(b) | | | 77,000 | | | | 82,147 | |
| |
7.75%, 01/15/2027(b) | | | 275,000 | | | | 307,835 | |
| |
Reynolds Group Issuer, Inc./LLC, 7.00%, 07/15/2024(b) | | | 929,000 | | | | 962,096 | |
| |
Spectrum Brands, Inc., 5.75%, 07/15/2025 | | | 705,000 | | | | 737,613 | |
| |
| | | | | | | 2,089,691 | |
| |
| | | | | | | | |
| | | Principal
Amount | | | Value | |
| |
Human Resource & Employment Services–0.35% | |
| | |
ASGN, Inc., 4.63%, 05/15/2028(b) | | $ | 534,000 | | | $ | 549,876 | |
| |
|
Independent Power Producers & Energy Traders–0.98% | |
| | |
Calpine Corp., 5.50%, 02/01/2024 | | | 334,000 | | | | 339,842 | |
| |
Enviva Partners L.P./Enviva Partners Finance Corp., 6.50%, 01/15/2026(b) | | | 335,000 | | | | 359,498 | |
| |
NRG Energy, Inc., | | | | | | | | |
7.25%, 05/15/2026 | | | 200,000 | | | | 218,870 | |
| |
6.63%, 01/15/2027 | | | 175,000 | | | | 190,199 | |
| |
5.25%, 06/15/2029(b) | | | 374,000 | | | | 405,079 | |
| |
| | | | | | | 1,513,488 | |
| |
|
Industrial Machinery–1.65% | |
| | |
Cleaver-Brooks, Inc., 7.88%, 03/01/2023(b) | | | 866,000 | | | | 866,359 | |
| |
EnPro Industries, Inc., 5.75%, 10/15/2026 | | | 795,000 | | | | 848,939 | |
| |
Mueller Industries, Inc., 6.00%, 03/01/2027 | | | 825,000 | | | | 846,943 | |
| |
| | | | | | | 2,562,241 | |
| |
|
Integrated Oil & Gas–0.47% | |
| | |
Petrobras Global Finance B.V. (Brazil), 5.75%, 02/01/2029 | | | 645,000 | | | | 728,689 | |
| |
|
Integrated Telecommunication Services–2.65% | |
| | |
Altice France S.A. (France), 7.38%, 05/01/2026(b) | | | 764,000 | | | | 821,674 | |
| |
Cincinnati Bell, Inc., | | | | | | | | |
7.00%, 07/15/2024(b) | | | 629,000 | | | | 661,230 | |
| |
8.00%, 10/15/2025(b) | | | 94,000 | | | | 99,914 | |
| |
CommScope, Inc., | | | | | | | | |
6.00%, 03/01/2026(b) | | | 467,000 | | | | 497,646 | |
| |
8.25%, 03/01/2027(b) | | | 536,000 | | | | 565,132 | |
| |
Frontier Communications Corp., | | | | | | | | |
10.50%, 09/15/2022 | | | 1,501,000 | | | | 735,958 | |
| |
11.00%, 09/15/2025 | | | 264,000 | | | | 128,700 | |
| |
Telecom Italia Capital S.A. (Italy), | | | | | | | | |
6.38%, 11/15/2033 | | | 95,000 | | | | 105,626 | |
| |
7.20%, 07/18/2036 | | | 417,000 | | | | 495,146 | |
| |
| | | | | | | 4,111,026 | |
| |
|
Interactive Media & Services–1.49% | |
| | |
Cable Onda S.A. (Panama), 4.50%, 01/30/2030(b) | | | 210,000 | | | | 221,518 | |
| |
Cumulus Media New Holdings, Inc., 6.75%, 07/01/2026(b) | | | 684,000 | | | | 734,017 | |
| |
Diamond Sports Group LLC/Diamond Sports Finance Co., | | | | | | | | |
5.38%, 08/15/2026(b) | | | 579,000 | | | | 586,774 | |
| |
6.63%, 08/15/2027(b) | | | 784,000 | | | | 763,890 | |
| |
| | | | | | | 2,306,199 | |
| |
|
Leisure Products–0.21% | |
| | |
Mattel, Inc., 6.75%, 12/31/2025(b) | | | 303,000 | | | | 326,296 | |
| |
See accompanying Notes to Financial Statements which are an integral part of the financial statements.
Invesco V.I. High Yield Fund
| | | | | | | | |
| | | Principal
Amount | | | Value | |
| |
Managed Health Care–1.10% | |
| | |
Centene Corp., | | | | | | | | |
5.38%, 06/01/2026(b) | | $ | 356,000 | | | $ | 378,464 | |
| |
4.63%, 12/15/2029(b) | | | 250,000 | | | | 263,925 | |
| |
Molina Healthcare, Inc., 4.88%, 06/15/2025(b) | | | 340,000 | | | | 350,341 | |
| |
WellCare Health Plans, Inc., | | | | | | | | |
5.25%, 04/01/2025 | | | 367,000 | | | | 382,594 | |
| |
5.38%, 08/15/2026(b) | | | 310,000 | | | | 330,723 | |
| |
| | | | | | | 1,706,047 | |
| |
|
Metal & Glass Containers–0.95% | |
| | |
Ardagh Packaging Finance PLC/Ardagh Holdings USA, Inc. (Ireland), 6.00%, 02/15/2025(b) | | | 500,000 | | | | 525,625 | |
| |
Flex Acquisition Co., Inc., 7.88%, 07/15/2026(b) | | | 507,000 | | | | 511,980 | |
| |
Trivium Packaging Finance B.V. (Netherlands), | | | | | | | | |
5.50%, 08/15/2026(b) | | | 206,000 | | | | 217,459 | |
| |
8.50%, 08/15/2027(b) | | | 200,000 | | | | 222,870 | |
| |
| | | | | | | 1,477,934 | |
| |
|
Movies & Entertainment–1.29% | |
| | |
AMC Entertainment Holdings, Inc., | | | | | | | | |
5.75%, 06/15/2025 | | | 735,000 | | | | 681,407 | |
| |
6.13%, 05/15/2027 | | | 308,000 | | | | 281,828 | |
| |
Netflix, Inc., | | | | | | | | |
5.75%, 03/01/2024 | | | 355,000 | | | | 393,754 | |
| |
5.88%, 11/15/2028 | | | 577,000 | | | | 640,706 | |
| |
| | | | | | | 1,997,695 | |
| |
|
Oil & Gas Drilling–1.40% | |
| | |
Diamond Offshore Drilling, Inc., 4.88%, 11/01/2043 | | | 240,000 | | | | 131,624 | |
| |
Ensign Drilling, Inc. (Canada), 9.25%, 04/15/2024(b) | | | 395,000 | | | | 373,765 | |
| |
Noble Holding International Ltd., 7.75%, 01/15/2024 | | | 709,000 | | | | 370,392 | |
| |
Precision Drilling Corp. (Canada), | | | | | | | | |
7.75%, 12/15/2023 | | | 94,000 | | | | 94,039 | |
| |
5.25%, 11/15/2024 | | | 405,000 | | | | 372,768 | |
| |
Transocean, Inc., 7.50%, 04/15/2031 | | | 662,000 | | | | 514,722 | |
| |
Valaris PLC, 7.75%, 02/01/2026 | | | 544,000 | | | | 308,707 | |
| |
| | | | | | | 2,166,017 | |
| |
|
Oil & Gas Equipment & Services–0.41% | |
| | |
Calfrac Holdings L.P. (Canada), 8.50%, 06/15/2026(b) | | | 350,000 | | | | 144,384 | |
| |
Hilcorp Energy I L.P./Hilcorp Finance Co., 6.25%,
11/01/2028(b) | | | 153,000 | | | | 145,786 | |
| |
SESI LLC, 7.13%, 12/15/2021 | | | 396,000 | | | | 338,738 | |
| |
| | | | | | | 628,908 | |
| |
|
Oil & Gas Exploration & Production–6.10% | |
| | |
Ascent Resources Utica Holdings LLC/ARU Finance Corp., 10.00%, 04/01/2022(b) | | | 633,000 | | | | 631,179 | |
| |
| | | | | | | | |
| | | Principal
Amount | | | Value | |
| |
Oil & Gas Exploration & Production–(continued) | |
| | |
California Resources Corp., 8.00%, 12/15/2022(b) | | $ | 559,000 | | | $ | 241,768 | |
| |
Callon Petroleum Co.,
| | | | | | | | |
6.13%, 10/01/2024 | | | 441,000 | | | | 450,455 | |
| |
6.38%, 07/01/2026 | | | 169,000 | | | | 171,949 | |
| |
Centennial Resource Production LLC, 6.88%, 04/01/2027(b) | | | 499,000 | | | | 520,119 | |
| |
Chesapeake Energy Corp., 11.50%, 01/01/2025(b) | | | 173,000 | | | | 163,918 | |
| |
Denbury Resources, Inc., | | | | | | | | |
9.00%, 05/15/2021(b) | | | 250,000 | | | | 242,438 | |
| |
5.50%, 05/01/2022 | | | 323,000 | | | | 211,006 | |
| |
EP Energy LLC/Everest Acquisition Finance, Inc., 8.00%,
11/29/2024(b)(c) | | | 420,000 | | | | 211,224 | |
| |
Genesis Energy L.P./Genesis Energy Finance Corp., 6.25%, 05/15/2026 | | | 940,000 | | | | 900,377 | |
| |
Gulfport Energy Corp., | | | | | | | | |
6.63%, 05/01/2023 | | | 608,000 | | | | 513,948 | |
| |
6.00%, 10/15/2024 | | | 747,000 | | | | 532,237 | |
| |
NGL Energy Partners L.P./NGL Energy Finance Corp., 7.50%, 04/15/2026(b) | | | 781,000 | | | | 757,470 | |
| |
Oasis Petroleum, Inc., 6.88%, 01/15/2023 | | | 654,000 | | | | 640,920 | |
| |
QEP Resources, Inc., | | | | | | | | |
5.25%, 05/01/2023 | | | 375,000 | | | | 372,188 | |
| |
5.63%, 03/01/2026 | | | 440,000 | | | | 430,221 | |
| |
SM Energy Co., | | | | | | | | |
6.75%, 09/15/2026 | | | 285,000 | | | | 280,112 | |
| |
6.63%, 01/15/2027 | | | 96,000 | | | | 94,577 | |
| |
Southwestern Energy Co., | | | | | | | | |
7.50%, 04/01/2026 | | | 341,000 | | | | 316,286 | |
| |
7.75%, 10/01/2027 | | | 344,000 | | | | 319,481 | |
| |
Whiting Petroleum Corp., 6.25%, 04/01/2023 | | | 560,000 | | | | 470,400 | |
| |
WPX Energy, Inc., 5.25%, 09/15/2024 | | | 930,000 | | | | 990,441 | |
| |
| | | | | | | 9,462,714 | |
| |
|
Oil & Gas Refining & Marketing–1.38% | |
| | |
Calumet Specialty Products Partners L.P./Calumet Finance Corp., 7.63%, 01/15/2022 | | | 700,000 | | | | 701,968 | |
| |
NuStar Logistics L.P., 6.00%, 06/01/2026 | | | 681,000 | | | | 721,434 | |
| |
Parkland Fuel Corp. (Canada), 6.00%, 04/01/2026(b) | | | 676,000 | | | | 715,310 | |
| |
| | | | | | | 2,138,712 | |
| |
|
Oil & Gas Storage & Transportation–1.03% | |
| | |
Antero Midstream Partners L.P./Antero Midstream Finance Corp., 5.75%, 01/15/2028(b) | | | 813,000 | | | | 709,363 | |
| |
See accompanying Notes to Financial Statements which are an integral part of the financial statements.
Invesco V.I. High Yield Fund
| | | | | | | | |
| | | Principal
Amount | | | Value | |
| |
Oil & Gas Storage & Transportation–(continued) | |
| | |
Targa Resources Partners L.P./Targa Resources Partners Finance Corp., | | | | | | | | |
5.88%, 04/15/2026 | | $ | 743,000 | | | $ | 790,830 | |
| |
5.50%, 03/01/2030(b) | | | 100,000 | | | | 102,875 | |
| |
| | | | | | | 1,603,068 | |
| |
|
Other Diversified Financial Services–1.70% | |
| | |
eG Global Finance PLC (United Kingdom), | | | | | | | | |
6.75%, 02/07/2025(b) | | | 449,000 | | | | 456,671 | |
| |
8.50%, 10/30/2025(b) | | | 212,000 | | | | 225,427 | |
| |
Lions Gate Capital Holdings LLC, 6.38%, 02/01/2024(b) | | | 457,000 | | | | 478,712 | |
| |
LPL Holdings, Inc., 5.75%, 09/15/2025(b) | | | 509,000 | | | | 533,809 | |
| |
Tempo Acquisition LLC/Tempo Acquisition Finance Corp., 6.75%, 06/01/2025(b) | | | 910,000 | | | | 941,841 | |
| |
| | | | | | | 2,636,460 | |
| |
|
Packaged Foods & Meats–1.86% | |
| | |
B&G Foods, Inc., | | | | | | | | |
5.25%, 04/01/2025 | | | 389,000 | | | | 400,832 | |
| |
5.25%, 09/15/2027 | | | 229,000 | | | | 231,576 | |
| |
JBS USA LUX S.A./JBS USA Finance, Inc., 5.75%, 06/15/2025(b) | | | 180,000 | | | | 186,825 | |
| |
JBS USA LUX S.A./JBS USA Food Co./JBS USA Finance, Inc., 5.50%, 01/15/2030(b) | | | 439,000 | | | | 472,342 | |
| |
Pilgrim’s Pride Corp., 5.88%, 09/30/2027(b) | | | 343,000 | | | | 371,503 | |
| |
Post Holdings, Inc., | | | | | | | | |
5.75%, 03/01/2027(b) | | | 355,000 | | | | 381,562 | |
| |
5.63%, 01/15/2028(b) | | | 355,000 | | | | 383,169 | |
| |
TreeHouse Foods, Inc., 6.00%, 02/15/2024(b) | | | 448,000 | | | | 465,174 | |
| |
| | | | | | | 2,892,983 | |
| |
|
Paper Packaging–0.23% | |
| | |
Cascades, Inc./Cascades USA, Inc. (Canada), 5.38%, 01/15/2028(b) | | | 353,000 | | | | 363,590 | |
| |
|
Paper Products–0.90% | |
| | |
Mercer International, Inc. (Germany), | | | | | | | | |
6.50%, 02/01/2024 | | | 442,000 | | | | 459,863 | |
| |
5.50%, 01/15/2026 | | | 162,000 | | | | 165,244 | |
| |
Schweitzer-Mauduit International, Inc., 6.88%, 10/01/2026(b) | | | 713,000 | | | | 770,288 | |
| |
| | | | | | | 1,395,395 | |
| |
|
Pharmaceuticals–1.79% | |
| | |
Bausch Health Americas, Inc., 9.25%, 04/01/2026(b) | | | 372,000 | | | | 427,967 | |
| |
Bausch Health Cos., Inc., 9.00%, 12/15/2025(b) | | | 974,000 | | | | 1,110,068 | |
| |
Endo Dac/Endo Finance LLC/Endo Finco, Inc., 6.00%, 07/15/2023(b) | | | 240,000 | | | | 173,998 | |
| |
| | | | | | | | |
| | | Principal
Amount | | | Value | |
| |
Pharmaceuticals–(continued) | |
| | |
HLF Financing S.a.r.l. LLC/Herbalife International, Inc., 7.25%, 08/15/2026(b) | | $ | 724,000 | | | $ | 768,345 | |
| |
Par Pharmaceutical, Inc., 7.50%, 04/01/2027(b) | | | 293,000 | | | | 292,275 | |
| |
| | | | | | | 2,772,653 | |
| |
|
Property & Casualty Insurance–0.12% | |
| | |
AmWINS Group, Inc., 7.75%, 07/01/2026(b) | | | 169,000 | | | | 187,248 | |
| |
|
Publishing–0.49% | |
| | |
Meredith Corp., 6.88%, 02/01/2026 | | | 735,000 | | | | 766,272 | |
| |
|
Railroads–0.81% | |
| | |
Kenan Advantage Group, Inc. (The), 7.88%, 07/31/2023(b) | | | 1,277,000 | | | | 1,252,526 | |
| |
|
Restaurants–0.58% | |
| | |
1011778 BC ULC/New Red Finance, Inc. (Canada), 5.00%, 10/15/2025(b) | | | 332,000 | | | | 343,482 | |
| |
IRB Holding Corp., 6.75%, 02/15/2026(b) | | | 531,000 | | | | 557,735 | |
| |
| | | | | | | 901,217 | |
| |
|
Security & Alarm Services–0.51% | |
| | |
Brink’s Co. (The), 4.63%, 10/15/2027(b) | | | 545,000 | | | | 562,616 | |
| |
GWB-CR Security Corp. (Canada), 9.50%, 11/01/2027(b) | | | 207,000 | | | | 221,355 | |
| |
| | | | | | | 783,971 | |
| |
|
Specialized Consumer Services–0.56% | |
| | |
ServiceMaster Co. LLC (The), 7.45%, 08/15/2027 | | | 765,000 | | | | 866,628 | |
| |
|
Specialized REITs–1.00% | |
| | |
Iron Mountain US Holdings, Inc., 5.38%, 06/01/2026(b) | | | 248,000 | | | | 259,866 | |
| |
Iron Mountain, Inc.,
| | | | | | | | |
5.75%, 08/15/2024 | | | 377,000 | | | | 382,180 | |
| |
5.25%, 03/15/2028(b) | | | 492,000 | | | | 512,590 | |
| |
Rayonier A.M. Products, Inc., 5.50%, 06/01/2024(b) | | | 518,000 | | | | 391,305 | |
| |
| | | | | | | 1,545,941 | |
| |
|
Specialty Chemicals–0.78% | |
| | |
Element Solutions, Inc., 5.88%, 12/01/2025(b) | | | 578,000 | | | | 606,172 | |
| |
GCP Applied Technologies, Inc., 5.50%, 04/15/2026(b) | | | 567,000 | | | | 596,964 | |
| |
| | | | | | | 1,203,136 | |
| |
|
Systems Software–0.11% | |
| | |
Camelot Finance S.A., 4.50%, 11/01/2026(b) | | | 173,000 | | | | 178,082 | |
| |
See accompanying Notes to Financial Statements which are an integral part of the financial statements.
Invesco V.I. High Yield Fund
| | | | | | | | |
| | | Principal
Amount | | | Value | |
| |
Technology Hardware, Storage & Peripherals–0.27% | |
| | |
Dell International LLC/EMC Corp., 7.13%, 06/15/2024(b) | | $ | 396,000 | | | $ | 418,275 | |
| |
|
Textiles–0.42% | |
| | |
Eagle Intermediate Global Holding B.V./Ruyi US Finance LLC (China), 7.50%,
05/01/2025(b) | | | 814,000 | | | | 653,573 | |
| |
|
Trading Companies & Distributors–2.00% | |
| | |
AerCap Global Aviation Trust (Ireland), 6.50% (3 mo. USD LIBOR + 4.30%),
06/15/2045(b)(g) | | | 434,000 | | | | 479,614 | |
| |
BMC East LLC, 5.50%, 10/01/2024(b) | | | 649,000 | | | | 676,852 | |
| |
Herc Holdings, Inc., 5.50%, 07/15/2027(b) | | | 653,000 | | | | 688,931 | |
| |
United Rentals North America, Inc., | | | | | | | | |
5.50%, 07/15/2025 | | | 41,000 | | | | 42,687 | |
| |
5.88%, 09/15/2026 | | | 375,000 | | | | 403,228 | |
| |
6.50%, 12/15/2026 | | | 188,000 | | | | 206,972 | |
| |
5.25%, 01/15/2030 | | | 562,000 | | | | 605,920 | |
| |
| | | | | | | 3,104,204 | |
| |
|
Trucking–0.37% | |
| | |
Avis Budget Car Rental LLC/Avis Budget Finance, Inc., | | | | | | | | |
6.38%, 04/01/2024(b) | | | 150,000 | | | | 156,062 | |
| |
5.25%, 03/15/2025(b) | | | 400,000 | | | | 412,666 | |
| |
| | | | | | | 568,728 | |
| |
|
Wireless Telecommunication Services–2.96% | |
| | |
Digicel Group One Ltd. (Jamaica), 8.25%,
12/30/2022(b) | | | 205,000 | | | | 114,864 | |
| |
Digicel Group Two Ltd. (Jamaica), 8.25%,
09/30/2022(b) | | | 194,000 | | | | 47,194 | |
| |
Intelsat (Luxembourg) S.A. (Luxembourg), 7.75%, 06/01/2021 | | | 347,000 | | | | 274,911 | |
| |
Intelsat Connect Finance S.A. (Luxembourg), 9.50%, 02/15/2023(b) | | | 159,000 | | | | 111,650 | |
| |
Oztel Holdings SPC Ltd. (Oman), 5.63%, 10/24/2023(b) | | | 477,000 | | | | 509,865 | |
| |
Sprint Capital Corp., 8.75%, 03/15/2032 | | | 297,000 | | | | 361,033 | |
| |
Sprint Corp., | | | | | | | | |
7.25%, 09/15/2021 | | | 457,000 | | | | 484,109 | |
| |
7.88%, 09/15/2023 | | | 1,429,000 | | | | 1,579,638 | |
| |
7.63%, 02/15/2025 | | | 275,000 | | | | 302,459 | |
| |
7.63%, 03/01/2026 | | | 73,000 | | | | 80,640 | |
| |
T-Mobile USA, Inc., 6.50%, 01/15/2026 | | | 671,000 | | | | 720,694 | |
| |
| | | | | | | 4,587,057 | |
| |
Total U.S. Dollar Denominated Bonds & Notes
(Cost $133,674,419) | | | | 135,334,202 | |
| |
| | | | | | | | |
| | | Principal
Amount | | | Value | |
| |
Variable Rate Senior Loan Interests–1.97%(h) | |
| | |
Alternative Carriers–0.30% | | | | | | | | |
| | |
CenturyLink, Inc., Term Loan B, 0.00% (1 mo. USD LIBOR + 2.75%), 01/31/2025 | | $ | 456,835 | | | $ | 459,404 | |
| |
|
Cable & Satellite–0.80% | |
| | |
Altice Financing S.A. (Luxembourg), Term Loan, 4.70% (1 mo. USD LIBOR + 2.75%), 07/15/2025 | | | 326,389 | | | | 326,308 | |
| |
Charter Communications Operating LLC, Term LoanB-1, 3.55% (3 mo. USD LIBOR + 1.75%), 04/30/2025 | | | 452,845 | | | | 456,524 | |
| |
CSC Holdings LLC, Term Loan, 0.00% (1 mo. USD LIBOR + 2.50%), 04/15/2027 | | | 454,000 | | | | 456,742 | |
| |
| | | | | | | 1,239,574 | |
| |
|
Integrated Telecommunication Services–0.29% | |
| | |
Sprint Communications, Inc., Incremental Term Loan, 0.00% (1 mo. USD LIBOR + 3.00%), 02/02/2024 | | | 454,851 | | | | 453,619 | |
| |
|
Paper Packaging–0.29% | |
| | |
Reynolds Group Holdings, Inc., Incremental Term Loan, 0.00% (1 mo. USD LIBOR + 2.75%), 02/05/2023 | | | 451,835 | | | | 453,814 | |
| |
|
Pharmaceuticals–0.29% | |
| | |
Valeant Pharmaceuticals International, Inc. (Canada), First Lien Incremental Term Loan, 0.00% (1 mo. USD LIBOR + 2.75%), 11/27/2025 | | | 440,057 | | | | 442,946 | |
| |
Total Variable Rate Senior Loan Interests
(Cost $3,034,671) | | | | 3,049,357 | |
| |
|
Asset-Backed Securities–1.63% | |
| | |
Apidos CLO XV, Series2013-15A, Class CRR, 3.82% (3 mo. USD LIBOR + 1.85%), 04/20/2031(b)(g) | | | 474,000 | | | | 454,447 | |
| |
Bain Capital Credit CLO Ltd. (Cayman Islands), | | | | | | | | |
Series2019-1A, Class C, 4.75% (3 mo. USD LIBOR + 2.75%), 04/18/2032(b)(g) | | | 420,000 | | | | 420,186 | |
| |
Series2019-3A, Class C, 4.73% (3 mo. USD LIBOR + 2.85%), 10/21/2032(b)(g) | | | 308,000 | | | | 308,610 | |
| |
Magnetite XXIII Ltd., Series2019-23A, Class C, 4.27% (3 mo. USD LIBOR + 2.40%), 10/25/2032(b)(g) | | | 474,000 | | | | 475,217 | |
| |
Neuberger Berman Loan Advisers CLO 34 Ltd., Series2019-34A, Class C1, 4.51% (3 mo. USD LIBOR + 2.60%), 01/20/2033(b)(g) | | | 475,000 | | | | 474,743 | |
| |
Octagon Investment Partners XVII Ltd., Series2013-1A, Class CR2, 3.64% (3 mo. USD LIBOR + 1.70%), 01/25/2031(b)(g) | | | 418,732 | | | | 397,607 | |
| |
Total Asset-Backed Securities (Cost $2,534,955) | | | | 2,530,810 | |
| |
See accompanying Notes to Financial Statements which are an integral part of the financial statements.
Invesco V.I. High Yield Fund
| | | | | | | | |
| | | Principal
Amount | | | Value | |
| |
Non-U.S. Dollar Denominated Bonds & Notes–0.49%(i) | |
|
Diversified Banks–0.17% | |
| | |
Erste Group Bank AG (Austria), 6.50%(f) | | EUR | 200,000 | | | $ | 261,395 | |
| |
| | |
Food Retail–0.26% | | | | | | | | |
| | |
Iceland Bondco PLC (United Kingdom), 4.63%, 03/15/2025(b) | | GBP | 350,000 | | | | 407,059 | |
| |
| | |
Textiles–0.06% | | | | | | | | |
| | |
Eagle Intermediate Global Holding B.V./Ruyi US Finance LLC (China), 5.38%, 05/01/2023(b) | | EUR | 100,000 | | | | 85,810 | |
| |
TotalNon-U.S. Dollar Denominated Bonds & Notes
(Cost $836,582) | | | | 754,264 | |
| |
|
U.S. Treasury Securities–0.18% | |
| | |
U.S. Treasury Bills–0.18% | | | | | | | | |
| | |
1.54%, 04/09/2020 (Cost $283,802)(j)(k) | | $ | 285,000 | | | | 283,821 | |
| |
|
Agency Credit Risk Transfer Notes–0.07% | |
| | |
Freddie Mac Multifamily Connecticut Avenue Securities TrustSeries 2019-01, Class M10, 5.04%, (1 mo. USD LIBOR + 3.25%) 10/15/2049
(Cost $107,000)(b)(g) | | | 107,000 | | | | 111,808 | |
| |
| | |
| | | Shares | | | | |
Common Stocks & Other Equity Interests–0.00% | |
|
Asset Management & Custody Banks–0.00% | |
| | |
Motors Liquidation Co. GUC Trust(l) | | | 1 | | | | 9 | |
| |
Investment Abbreviations:
| CLO | – Collateralized Loan Obligation |
| GBP | – British Pound Sterling |
| GUC | – General Unsecured Creditors |
| LIBOR | – London Interbank Offered Rate |
| REIT | – Real Estate Investment Trust |
| | | | | | | | |
| | |
Shares | | | Value | |
| |
Diversified Support Services–0.00% | |
| | |
ACC Claims Holdings LLC(d)(l) | | | 269,616 | | | $ | 0 | |
| |
|
Other Diversified Financial Services–0.00% | |
| | |
Adelphia Recovery Trust, Series ACC1(m) | | | 318,570 | | | | 3 | |
| |
Adelphia Recovery Trust, Series Arahova(m) | | | 109,170 | | | | 109 | |
| |
| | | | | | | 112 | |
| |
Total Common Stocks & Other Equity Interests (Cost $143,574) | | | | 121 | |
| |
|
Money Market Funds–8.17% | |
| | |
Invesco Government & Agency Portfolio, Institutional Class, 1.50%(n) | | | 4,401,627 | | | | 4,401,627 | |
| |
Invesco Liquid Assets Portfolio, Institutional Class, 1.71%(n) | | | 3,244,628 | | | | 3,245,601 | |
| |
Invesco Treasury Portfolio, Institutional Class, 1.49%(n) | | | 5,030,431 | | | | 5,030,431 | |
| |
Total Money Market Funds
(Cost $12,677,660) | | | | 12,677,659 | |
| |
|
Options Purchased–0.03%
| |
| | |
(Cost $80,190)(o) | | | | | | | 50,008 | |
| |
TOTAL INVESTMENTS IN SECURITIES–99.79% | |
(Cost $153,372,853) | | | | | | | 154,792,050 | |
| |
OTHER ASSETS LESS LIABILITIES–0.21% | | | | 326,232 | |
| |
NET ASSETS–100.00% | | | $ | 155,118,282 | |
| |
See accompanying Notes to Financial Statements which are an integral part of the financial statements.
Invesco V.I. High Yield Fund
Notes to Schedule of Investments:
| (a) | Industry and/or sector classifications used in this report are generally according to the Global Industry Classification Standard, which was developed by and is the exclusive property and a service mark of MSCI Inc. and Standard & Poor’s. |
| (b) | Security purchased or received in a transaction exempt from registration under the Securities Act of 1933, as amended (the “1933 Act”). The security may be resold pursuant to an exemption from registration under the 1933 Act, typically to qualified institutional buyers. The aggregate value of these securities at December 31, 2019 was $80,157,899, which represented 51.68% of the Fund’s Net Assets. |
| (c) | Defaulted security. Currently, the issuer is in default with respect to principal and/or interest payments. The value of this security at December 31, 2019 represented less than 1% of the Fund’s Net Assets. |
| (d) | Security valued using significant unobservable inputs (Level 3). See Note 3. |
| (e) | All or a portion of this security isPay-in-Kind.Pay-in-Kind securities pay interest income in the form of securities. |
| (f) | Perpetual bond with no specified maturity date. |
| (g) | Interest or dividend rate is redetermined periodically. Rate shown is the rate in effect on December 31, 2019. |
| (h) | Variable rate senior loan interests are, at present, not readily marketable, not registered under the 1933 Act and may be subject to contractual and legal restrictions on sale. Variable rate senior loan interests in the Fund’s portfolio generally have variable rates which adjust to a base, such as the London Interbank Offered Rate (“LIBOR”), on set dates, typically every 30 days, but not greater than one year, and/or have interest rates that float at margin above a widely recognized base lending rate such as the Prime Rate of a designated U.S. bank. |
| (i) | Foreign denominated security. Principal amount is denominated in the currency indicated. |
| (j) | All or a portion of the value was designated as collateral to cover margin requirements for swap agreements. See Note 10. |
| (k) | Security traded on a discount basis. The interest rate shown represents the discount rate at the time of purchase by the Fund. |
| (l) | Non-income producing security. |
| (m) | Acquired as part of the Adelphia Communications bankruptcy reorganization. |
| (n) | The money market fund and the Fund are affiliated by having the same investment adviser. The rate shown is the7-day SEC standardized yield as of December 31, 2019. |
| (o) | The table below details options purchased. |
OpenOver-The-Counter Credit Default Swaptions Purchased
| | | | | | | | | | | | | | | | | | | | | | | | | | | | | | | | | | |
| | | | | | | | | | | (Pay)/ | | | | | | | | | | | | | | | | |
| | | | | | | | | | | Receive | | | | | | | | | Implied | | | | | | | |
| | | Type of | | | Exercise | | | Reference | | Fixed | | | Payment | | | Expiration | | | Credit | | | Notional | | | | |
| Counterparty | | Contract | | | Rate | | | Entity | | Rate | | | Frequency | | | Date | | | Spread(a) | | | Value | | | Value | |
| |
Credit Risk | | | | | | | | | | | | | | | | | | | | | | | | | | | | | | | | | | |
| |
J.P. Morgan Chase Bank, N.A. | | | Put | | | | 1.08% | | | Markit CDX North America High Yield Index, Series 33, Version 2 | | | (5.00 | )% | | | Quarterly | | | | 02/19/2020 | | | | 2.798 | % | | $ | 15,000,000 | | | $ | 50,008 | |
| |
| (a) | Implied credit spreads represent the current level, as of December 31, 2019, at which protection could be bought or sold given the terms of the existing credit default swap agreement and serve as an indicator of the current status of the payment/performance risk of the credit default swap agreement. An implied credit spread that has widened or increased since entry into the initial agreement may indicate a deteriorating credit profile and increased risk of default for the reference entity. A declining or narrowing spread may indicate an improving credit profile or decreased risk of default for the reference entity. Alternatively, credit spreads may increase or decrease reflecting the general tolerance for risk in the credit markets generally. |
OpenOver-The-Counter Credit Default Swaptions Written
| | | | | | | | | | | | | | | | | | | | | | | | | | | | | | | | | | | | | | | | | | |
| | | | | | | | | | | (Pay)/ | | | | | | | | | | | | | | | | | | | | | | |
| | | | | | | | | | | Receive | | | | | | | | | Implied | | | | | | | | | | | | | |
| | | Type of | | | Exercise | | | Reference | | Fixed | | | Payment | | | Expiration | | | Credit | | | Premiums | | | Notional | | | | | | Unrealized | |
| Counterparty | | Contract | | | Rate | | | Entity | | Rate | | | Frequency | | | Date | | | Spread(a) | | | Received | | | Value | | | Value | | | Appreciation | |
| |
Credit Risk | | | | | | | | | | | | | | | | | | | | | | | | | | | | | | | | | | | | | | | | | | |
| |
J.P. Morgan Chase Bank, N.A. | | | Put | | | | 1.06 | % | | Markit CDX North America High Yield Index, Series 33, Version 2 | | | 5.00 | % | | | Quarterly | | | | 02/19/2020 | | | | 2.798 | % | | | $(29,700) | | | | $(15,000,000) | | | | $(18,975) | | | | $10,725 | |
| |
| (a) | Implied credit spreads represent the current level, as of December 31, 2019, at which protection could be bought or sold given the terms of the existing credit default swap agreement and serve as an indicator of the current status of the payment/performance risk of the credit default swap agreement. An implied credit spread that has widened or increased since entry into the initial agreement may indicate a deteriorating credit profile and increased risk of default for the reference entity. A declining or narrowing spread may indicate an improving credit profile or decreased risk of default for the reference entity. Alternatively, credit spreads may increase or decrease reflecting the general tolerance for risk in the credit markets generally. |
Open Centrally Cleared Credit Default Swap Agreements
| | | | | | | | | | | | | | | | | | | | | | | | | | | | | | | | | | | | |
| Reference Entity | | Buy/Sell
Protection | | | (Pay)/
Receive
Fixed
Rate | | | Payment
Frequency | | | Maturity Date | | | Implied Credit Spread(a) | | | Notional Value | | | Upfront
Payments Paid
(Received) | | | Value | | | Unrealized Appreciation(b) | |
| |
Credit Risk | | | | | | | | | | | | | | | | | | | | | | | | | | | | | | | | | | | | |
| |
Markit CDX North America High Yield Index, Series 33, Version 2 | | | Sell | | | | 5.00% | | | | Quarterly | | | | 12/20/2024 | | | | 2.80 | % | | | USD 4,950,000 | | | | $471,974 | | | | $476,859 | | | | $4,885 | |
| |
See accompanying Notes to Financial Statements which are an integral part of the financial statements.
Invesco V.I. High Yield Fund
| (a) | Implied credit spreads represent the current level, as of December 31, 2019, at which protection could be bought or sold given the terms of the existing credit default swap agreement and serve as an indicator of the current status of the payment/performance risk of the credit default swap agreement. An implied credit spread that has widened or increased since entry into the initial agreement may indicate a deteriorating credit profile and increased risk of default for the reference entity. A declining or narrowing spread may indicate an improving credit profile or decreased risk of default for the reference entity. Alternatively, credit spreads may increase or decrease reflecting the general tolerance for risk in the credit markets generally. |
| (b) | The daily variation margin receivable (payable) at period end is recorded in the Statement of Assets and Liabilities. |
Open Forward Foreign Currency Contracts
| | | | | | | | | | | | | | |
| | | | | | | | | | | Unrealized | |
| Settlement | | | | Contract to | | | Appreciation | |
| Date | | Counterparty | | Deliver | | | Receive | | | (Depreciation) | |
| |
Currency Risk | | | | | | | | | | | | | | |
| |
02/28/2020 | | Barclays Bank PLC | | | GBP 146,765 | | | | USD 188,952 | | | | $ (5,755) | |
| |
02/28/2020 | | Citibank, N.A. | | | EUR 706,629 | | | | USD 784,315 | | | | (11,080) | |
| |
Total Forward Foreign Currency Contracts | | | | | | | | | | | $(16,835) | |
| |
Abbreviations:
EUR – Euro
GBP – British Pound Sterling
USD – U.S. Dollar
OpenOver-The-Counter Total Return Swap Agreements
| | | | | | | | | | | | | | | | | | | | | | | | | | | | | | | | | | | | | | |
| | | | | | | | | | | | | | | | | | | | | | | Upfront | | | | | | | |
| | | | | | | | | | | | | | | | | | | | | | | Payments | | | | | | | |
| | | Pay/ | | | | | Fixed | | | Payment | | | Number of | | | | | | | | | Paid | | | | | | Unrealized | |
| Counterparty | | Receive | | | Reference Entity | | Rate | | | Frequency | | | Contracts | | | Maturity Date | | | Notional Value | | | (Received) | | | Value | | | Appreciation | |
| |
Equity Risk | | | | | | | | | | | | | | | | | | | | | | | | | | | | | | | | | | | | | | |
| |
Morgan Stanley & Co. LLC | | | Pay | | | Markit iBoxx USD Liquid Liveraged Loan Index | | | 0.00 | % | | | Quarterly | | | | 13,724 | | | | June-2020 | | | $ | 2,440,000 | | | | $- | | | | $10,055 | | | | $10,055 | |
Morgan Stanley & Co. LLC | | | Pay | | | Markit iBoxx USD Liquid Liveraged Loan Index | | | 0.00 | | | | Quarterly | | | | 8,774 | | | | June-2020 | | | | 1,560,000 | | | | - | | | | 6,429 | | | | 6,429 | |
| |
Total – Total Return Swap Agreements | | | | | | | | | | | | | | | | | | | | $- | | | | $16,484 | | | | $16,484 | |
| |
See accompanying Notes to Financial Statements which are an integral part of the financial statements.
Invesco V.I. High Yield Fund
Statement of Assets and Liabilities
December 31, 2019
| | | | |
Assets: | | | | |
| |
Investments in securities, at value
(Cost $140,695,193) | | $ | 142,114,391 | |
| |
Investments in affiliated money market funds, at value (Cost $12,677,660) | | | 12,677,659 | |
| |
Other investments: | | | | |
Unrealized appreciation on swap agreements – OTC | | | 16,484 | |
| |
Cash | | | 44,660 | |
| |
Foreign currencies, at value (Cost $606,205) | | | 617,835 | |
| |
Receivable for: | | | | |
Fund shares sold | | | 73,443 | |
| |
Dividends | | | 16,050 | |
| |
Interest | | | 2,381,617 | |
| |
Investments matured, at value
(Cost $179,953) | | | 0 | |
| |
Investment for trustee deferred compensation and retirement plans | | | 82,205 | |
| |
Total assets | | | 158,024,344 | |
| |
| |
Liabilities: | | | | |
| |
Other investments: | | | | |
Options written, at value (premiums received $29,700) | | | 18,975 | |
| |
Variation margin payable - centrally cleared swap agreements | | | 2,536 | |
| |
Unrealized depreciation on forward foreign currency contracts outstanding | | | 16,835 | |
| |
Swaps payable – OTC | | | 2,544 | |
| |
Payable for: | | | | |
Investments purchased | | | 2,580,957 | |
| |
Fund shares reacquired | | | 29,023 | |
| |
Accrued fees to affiliates | | | 131,613 | |
| |
Accrued other operating expenses | | | 36,212 | |
| |
Trustee deferred compensation and retirement plans | | | 87,367 | |
| |
Total liabilities | | | 2,906,062 | |
| |
Net assets applicable to shares outstanding | | $ | 155,118,282 | |
| |
| |
Net assets consist of: | | | | |
| |
Shares of beneficial interest | | $ | 165,450,183 | |
| |
Distributable earnings (loss) | | | (10,331,901 | ) |
| |
| | | $155,118,282 | |
| |
| |
Net Assets: | | | | |
| |
Series I | | $ | 50,189,730 | |
| |
Series II | | $ | 104,928,552 | |
| |
| |
Shares outstanding, no par value, with an unlimited number of shares authorized: | | | | |
| |
Series I | | | 9,273,670 | |
| |
Series II | | | 19,578,876 | |
| |
Series I: | | | | |
Net asset value per share | | $ | 5.41 | |
| |
Series II: | | | | |
Net asset value per share | | $ | 5.36 | |
| |
Statement of Operations
For the year ended December 31, 2019
| | | | |
Investment income: | | | | |
| |
Interest | | $ | 9,431,686 | |
| |
Dividends from affiliated money market funds | | | 151,658 | |
| |
Dividends | | | 12,001 | |
| |
Total investment income | | | 9,595,345 | |
| |
| |
Expenses: | | | | |
| |
Advisory fees | | | 947,906 | |
| |
Administrative services fees | | | 254,157 | |
| |
Custodian fees | | | 9,650 | |
| |
Distribution fees - Series II | | | 244,522 | |
| |
Transfer agent fees | | | 27,384 | |
| |
Trustees’ and officers’ fees and benefits | | | 20,657 | |
| |
Reports to shareholders | | | 11,087 | |
| |
Professional services fees | | | 65,057 | |
| |
Other | | | 14,005 | |
| |
Total expenses | | | 1,594,425 | |
| |
Less: Fees waived | | | (8,211 | ) |
| |
Net expenses | | | 1,586,214 | |
| |
Net investment income | | | 8,009,131 | |
| |
| |
Realized and unrealized gain (loss) from: | | | | |
| |
Net realized gain (loss) from: | | | | |
Investment securities | | | (7,662,981 | ) |
| |
Foreign currencies | | | (13,793 | ) |
| |
Forward foreign currency contracts | | | 59,398 | |
| |
Option contracts written | | | 156,370 | |
| |
Swap agreements | | | (53,697 | ) |
| |
| | | (7,514,703 | ) |
| |
| |
Change in net unrealized appreciation (depreciation) of: | | | | |
Investment securities | | | 17,909,612 | |
| |
Foreign currencies | | | 8,677 | |
| |
Forward foreign currency contracts | | | (3,630 | ) |
| |
Option contracts written | | | 15,892 | |
| |
Swap agreements | | | 259,731 | |
| |
| | | 18,190,282 | |
| |
Net realized and unrealized gain | | | 10,675,579 | |
| |
Net increase in net assets resulting from operations | | $ | 18,684,710 | |
| |
See accompanying Notes to Financial Statements which are an integral part of the financial statements.
Invesco V.I. High Yield Fund
Statement of Changes in Net Assets
For the years ended December 31, 2019 and 2018
| | | | | | | | |
| | | 2019 | | | 2018 | |
| |
Operations: | | | | | | | | |
| | |
Net investment income | | $ | 8,009,131 | | | $ | 8,275,606 | |
| |
Net realized gain (loss) | | | (7,514,703 | ) | | | (824,052 | ) |
| |
Change in net unrealized appreciation (depreciation) | | | 18,190,282 | | | | (13,592,308 | ) |
| |
Net increase (decrease) in net assets resulting from operations | | | 18,684,710 | | | | (6,140,754 | ) |
| |
| | |
Distributions to shareholders from distributable earnings: | | | | | | | | |
| | |
Series I | | | (3,070,770 | ) | | | (4,211,171 | ) |
| |
Series II | | | (5,696,932 | ) | | | (4,569,006 | ) |
| |
Total distributions from distributable earnings | | | (8,767,702 | ) | | | (8,780,177 | ) |
| |
| | |
Share transactions–net: | | | | | | | | |
| | |
Series I | | | (9,441,935 | ) | | | (17,542,621 | ) |
| |
Series II | | | 12,704,138 | | | | 2,229,098 | |
| |
Net increase (decrease) in net assets resulting from share transactions | | | 3,262,203 | | | | (15,313,523 | ) |
| |
Net increase (decrease) in net assets | | | 13,179,211 | | | | (30,234,454 | ) |
| |
| | |
Net assets: | | | | | | | | |
| | |
Beginning of year | | | 141,939,071 | | | | 172,173,525 | |
| |
End of year | | $ | 155,118,282 | | | $ | 141,939,071 | |
| |
See accompanying Notes to Financial Statements which are an integral part of the financial statements.
Invesco V.I. High Yield Fund
Financial Highlights
The following schedule presents financial highlights for a share of the Fund outstanding throughout the periods indicated.
| | | | | | | | | | | | | | | | | | | | | | | | | | | | | | | | | | | | | | | | | | | | | | | | | | | | | | | | | | | | |
| | | | | | | | | | | | | | | | | | | Ratio of | | Ratio of | | | | |
| | | | | | | | | | | | | | | | | | | expenses | | expenses | | | | |
| | | | | | | Net gains | | | | | | | | | | | | to average | | to average net | | | | |
| | | | | | | (losses) | | | | | | | | | | | | net assets | | assets without | | Ratio of net | | |
| | | Net asset | | | | on securities | | | | Dividends | | | | | | | | with fee waivers | | fee waivers | | investment | | |
| | | value, | | Net | | (both | | Total from | | from net | | Net asset | | | | Net assets, | | and/or | | and/or | | income | | |
| | | beginning | | investment | | realized and | | investment | | investment | | value, end | | Total | | end of period | | expenses | | expenses | | to average | | Portfolio |
| | | of period | | income(a) | | unrealized) | | operations | | income | | of period | | return (b) | | (000’s omitted) | | absorbed | | absorbed | | net assets | | turnover (c) |
Series I | | | | | | | | | | | | | | | | | | | | | | | | | | | | | | | | | | | | | | | | | | | | | | | | | | | | | | | | | | | | |
Year ended 12/31/19 | | | $ | 5.06 | | | | $ | 0.29 | | | | $ | 0.39 | | | | $ | 0.68 | | | | $ | (0.33 | ) | | | $ | 5.41 | | | | | 13.51 | % | | | $ | 50,190 | | | | | 0.88 | %(d) | | | | 0.89 | %(d) | | | | 5.45 | %(d) | | | | 54 | % |
Year ended 12/31/18 | | | | 5.51 | | | | | 0.26 | | | | | (0.43 | ) | | | | (0.17 | ) | | | | (0.28 | ) | | | | 5.06 | | | | | (3.35 | ) | | | | 55,703 | | | | | 1.17 | | | | | 1.17 | | | | | 4.84 | | | | | 66 | |
Year ended 12/31/17 | | | | 5.40 | | | | | 0.26 | | | | | 0.08 | | | | | 0.34 | | | | | (0.23 | ) | | | | 5.51 | | | | | 6.30 | | | | | 80,372 | | | | | 0.99 | | | | | 1.00 | | | | | 4.73 | | | | | 73 | |
Year ended 12/31/16 | | | | 5.06 | | | | | 0.28 | | | | | 0.28 | | | | | 0.56 | | | | | (0.22 | ) | | | | 5.40 | | | | | 11.21 | | | | | 94,653 | | | | | 0.96 | | | | | 0.96 | | | | | 5.25 | | | | | 99 | |
Year ended 12/31/15 | | | | 5.53 | | | | | 0.29 | | | | | (0.46 | ) | | | | (0.17 | ) | | | | (0.30 | ) | | | | 5.06 | | | | | (3.17 | ) | | | | 73,594 | | | | | 1.03 | | | | | 1.03 | | | | | 5.23 | | | | | 99 | |
Series II | | | | | | | | | | | | | | | | | | | | | | | | | | | | | | | | | | | | | | | | | | | | | | | | | | | | | | | | | | | | |
Year ended 12/31/19 | | | | 5.02 | | | | | 0.28 | | | | | 0.37 | | | | | 0.65 | | | | | (0.31 | ) | | | | 5.36 | | | | | 13.16 | | | | | 104,929 | | | | | 1.13 | (d) | | | | 1.14 | (d) | | | | 5.20 | (d) | | | | 54 | |
Year ended 12/31/18 | | | | 5.46 | | | | | 0.25 | | | | | (0.42 | ) | | | | (0.17 | ) | | | | (0.27 | ) | | | | 5.02 | | | | | (3.43 | ) | | | | 86,236 | | | | | 1.42 | | | | | 1.42 | | | | | 4.59 | | | | | 66 | |
Year ended 12/31/17 | | | | 5.36 | | | | | 0.25 | | | | | 0.07 | | | | | 0.32 | | | | | (0.22 | ) | | | | 5.46 | | | | | 5.93 | | | | | 91,802 | | | | | 1.24 | | | | | 1.25 | | | | | 4.48 | | | | | 73 | |
Year ended 12/31/16 | | | | 5.03 | | | | | 0.26 | | | | | 0.28 | | | | | 0.54 | | | | | (0.21 | ) | | | | 5.36 | | | | | 10.83 | | | | | 82,971 | | | | | 1.21 | | | | | 1.21 | | | | | 5.00 | | | | | 99 | |
Year ended 12/31/15 | | | | 5.50 | | | | | 0.27 | | | | | (0.45 | ) | | | | (0.18 | ) | | | | (0.29 | ) | | | | 5.03 | | | | | (3.37 | ) | | | | 70,840 | | | | | 1.28 | | | | | 1.28 | | | | | 4.98 | | | | | 99 | |
| (a) | Calculated using average shares outstanding. |
| (b) | Includes adjustments in accordance with accounting principles generally accepted in the United States of America and as such, the net asset value for financial reporting purposes and the returns based upon those net asset values may differ from the net asset value and returns for shareholder transactions. Total returns are not annualized for periods less than one year, if applicable, and do not reflect charges assessed in connection with a variable product, which if included would reduce total returns. |
| (c) | Portfolio turnover is calculated at the fund level and is not annualized for periods less than one year, if applicable. |
| (d) | Ratios are based on average daily net assets (000’s omitted) of $53,875 and $97,790 for Series I and Series II shares, respectively. |
See accompanying Notes to Financial Statements which are an integral part of the financial statements.
Invesco V.I. High Yield Fund
Notes to Financial Statements
December 31, 2019
NOTE 1–Significant Accounting Policies
Invesco V.I. High Yield Fund (the “Fund”) is a series portfolio of AIM Variable Insurance Funds (Invesco Variable Insurance Funds) (the “Trust”). The Trust is a Delaware statutory trust registered under the Investment Company Act of 1940, as amended (the “1940 Act”), as anopen-end series management investment company. Information presented in these financial statements pertains only to the Fund. Matters affecting the Fund or each class will be voted on exclusively by the shareholders of the Fund or each class. Current Securities and Exchange Commission (“SEC”) guidance, however, requires participating insurance companies offering separate accounts to vote shares proportionally in accordance with the instructions of the contract owners whose investments are funded by shares of each Fund or class.
The Fund’s investment objective is total return, comprised of current income and capital appreciation.
The Fund currently offers two classes of shares, Series I and Series II, both of which are offered to insurance company separate accounts funding variable annuity contracts and variable life insurance policies (“variable products”).
The Fund is an investment company and accordingly follows the investment company accounting and reporting guidance in accordance with Financial Accounting Standards Board Accounting Standards Codification Topic 946,Financial Services - Investment Companies.
The following is a summary of the significant accounting policies followed by the Fund in the preparation of its financial statements.
| A. | Security Valuations– Securities, including restricted securities, are valued according to the following policy. |
Debt obligations (including convertible securities) and unlisted equities are fair valued using an evaluated quote provided by an independent pricing service. Evaluated quotes provided by the pricing service may be determined without exclusive reliance on quoted prices, and may reflect appropriate factors such asinstitution-size trading in similar groups of securities, developments related to specific securities, dividend rate (for unlisted equities), yield (for debt obligations), quality, type of issue, coupon rate (for debt obligations), maturity (for debt obligations), individual trading characteristics and other market data. Pricing services generally value debt obligations assuming orderly transactions of institutional round lot size, but a fund may hold or transact in the same securities in smaller, odd lot sizes. Odd lots often trade at lower prices than institutional round lots. Debt obligations are subject to interest rate and credit risks. In addition, all debt obligations involve some risk of default with respect to interest and/or principal payments.
Variable rate senior loan interests are fair valued using quotes provided by an independent pricing service. Quotes provided by the pricing service may reflect appropriate factors such as ratings, tranche type, industry, company performance, spread, individual trading characteristics,institution-size trading in similar groups of securities and other market data.
A security listed or traded on an exchange (except convertible securities) is valued at its last sales price or official closing price as of the close of the customary trading session on the exchange where the security is principally traded, or lacking any sales or official closing price on a particular day, the security may be valued at the closing bid price on that day. Securities traded in theover-the-counter market are valued based on prices furnished by independent pricing services or market makers. When such securities are valued by an independent pricing service they may be considered fair valued. Futures contracts are valued at the final settlement price set by an exchange on which they are principally traded. Listed options are valued at the mean between the last bid and asked prices from the exchange on which they are principally traded. Options not listed on an exchange are valued by an independent source at the mean between the last bid and asked prices. For purposes of determining net asset value (“NAV”) per share, futures and option contracts generally are valued 15 minutes after the close of the customary trading session of the New York Stock Exchange (“NYSE”).
Investments inopen-end andclosed-end registered investment companies that do not trade on an exchange are valued at theend-of-day net asset value per share. Investments inopen-end andclosed-end registered investment companies that trade on an exchange are valued at the last sales price or official closing price as of the close of the customary trading session on the exchange where the security is principally traded.
Swap agreements are fair valued using an evaluated quote, if available, provided by an independent pricing service. Evaluated quotes provided by the pricing service are valued based on a model which may includeend-of-day net present values, spreads, ratings, industry, company performance and returns of referenced assets. Centrally cleared swap agreements are valued at the daily settlement price determined by the relevant exchange or clearinghouse.
Foreign securities’ (including foreign exchange contracts) prices are converted into U.S. dollar amounts using the applicable exchange rates as of the close of the NYSE. If market quotations are available and reliable for foreign exchange-traded equity securities, the securities will be valued at the market quotations. Because trading hours for certain foreign securities end before the close of the NYSE, closing market quotations may become unreliable. If between the time trading ends on a particular security and the close of the customary trading session on the NYSE, events occur that the investment adviser determines are significant and make the closing price unreliable, the Fund may fair value the security. If the event is likely to have affected the closing price of the security, the security will be valued at fair value in good faith using procedures approved by the Board of Trustees. Adjustments to closing prices to reflect fair value may also be based on a screening process of an independent pricing service to indicate the degree of certainty, based on historical data, that the closing price in the principal market where a foreign security trades is not the current value as of the close of the NYSE. Foreign securities’ prices meeting the approved degree of certainty that the price is not reflective of current value will be priced at the indication of fair value from the independent pricing service. Multiple factors may be considered by the independent pricing service in determining adjustments to reflect fair value and may include information relating to sector indices, American Depositary Receipts and domestic and foreign index futures. Foreign securities may have additional risks including exchange rate changes, potential for sharply devalued currencies and high inflation, political and economic upheaval, the relative lack of issuer information, relatively low market liquidity and the potential lack of strict financial and accounting controls and standards.
Securities for which market prices are not provided by any of the above methods may be valued based upon quotes furnished by independent sources. The last bid price may be used to value equity securities. The mean between the last bid and asked prices is used to value debt obligations, including corporate loans.
Securities for which market quotations are not readily available or became unreliable are valued at fair value as determined in good faith by or under the supervision of the Trust’s officers following procedures approved by the Board of Trustees. Issuer specific events, market trends,
Invesco V.I. High Yield Fund
bid/asked quotes of brokers and information providers and other market data may be reviewed in the course of making a good faith determination of a security’s fair value.
The Fund may invest in securities that are subject to interest rate risk, meaning the risk that the prices will generally fall as interest rates rise and, conversely, the prices will generally rise as interest rates fall. Specific securities differ in their sensitivity to changes in interest rates depending on their individual characteristics. Changes in interest rates may result in increased market volatility, which may affect the value and/or liquidity of certain Fund investments.
Valuations change in response to many factors including the historical and prospective earnings of the issuer, the value of the issuer’s assets, general economic conditions, interest rates, investor perceptions and market liquidity. Because of the inherent uncertainties of valuation, the values reflected in the financial statements may materially differ from the value received upon actual sale of those investments.
| B. | Securities Transactions and Investment Income– Securities transactions are accounted for on a trade date basis. Realized gains or losses on sales are computed on the basis of specific identification of the securities sold. Interest income (net of withholding tax, if any) is recorded on the accrual basis from settlement date. Bond premiums and discounts are amortized and/or accreted over the lives of the respective securities.Pay-in-kind interest income andnon-cash dividend income received in the form of securitiesin-lieu of cash are recorded at the fair value of the securities received. Dividend income (net of withholding tax, if any) is recorded on theex-dividend date. |
The Fund may periodically participate in litigation related to Fund investments. As such, the Fund may receive proceeds from litigation settlements. Any proceeds received are included in the Statement of Operations as realized gain (loss) for investments no longer held and as unrealized gain (loss) for investments still held.
Brokerage commissions and mark ups are considered transaction costs and are recorded as an increase to the cost basis of securities purchased and/or a reduction of proceeds on a sale of securities. Such transaction costs are included in the determination of net realized and unrealized gain (loss) from investment securities reported in the Statement of Operations and the Statement of Changes in Net Assets and the net realized and unrealized gains (losses) on securities per share in the Financial Highlights. Transaction costs are included in the calculation of the Fund’s net asset value and, accordingly, they reduce the Fund’s total returns. These transaction costs are not considered operating expenses and are not reflected in net investment income reported in the Statement of Operations and the Statement of Changes in Net Assets, or the net investment income per share and the ratios of expenses and net investment income reported in the Financial Highlights, nor are they limited by any expense limitation arrangements between the Fund and the investment adviser.
The Fund allocates income and realized and unrealized capital gains and losses to a class based on the relative net assets of each class.
| C. | Country Determination – For the purposes of making investment selection decisions and presentation in the Schedule of Investments, the investment adviser may determine the country in which an issuer is located and/or credit risk exposure based on various factors. These factors include the laws of the country under which the issuer is organized, where the issuer maintains a principal office, the country in which the issuer derives 50% or more of its total revenues and the country that has the primary market for the issuer’s securities, as well as other criteria. Among the other criteria that may be evaluated for making this determination are the country in which the issuer maintains 50% or more of its assets, the type of security, financial guarantees and enhancements, the nature of the collateral and the sponsor organization. Country of issuer and/or credit risk exposure has been determined to be the United States of America, unless otherwise noted. |
| D. | Distributions– Distributions from net investment income and net realized capital gain, if any, are generally declared and paid to separate accounts of participating insurance companies annually and recorded on theex-dividend date. |
| E. | Federal Income Taxes –The Fund intends to comply with the requirements of Subchapter M of the Internal Revenue Code of 1986, as amended (the “Internal Revenue Code”), necessary to qualify as a regulated investment company and to distribute substantially all of the Fund’s taxable earnings to shareholders. As such, the Fund will not be subject to federal income taxes on otherwise taxable income (including net realized capital gain) that is distributed to shareholders. Therefore, no provision for federal income taxes is recorded in the financial statements. |
The Fund recognizes the tax benefits of uncertain tax positions only when the position is more likely than not to be sustained. Management has analyzed the Fund’s uncertain tax positions and concluded that no liability for unrecognized tax benefits should be recorded related to uncertain tax positions. Management is not aware of any tax positions for which it is reasonably possible that the total amounts of unrecognized tax benefits will change materially in the next 12 months.
The Fund files tax returns in the U.S. Federal jurisdiction and certain other jurisdictions. Generally, the Fund is subject to examinations by such taxing authorities for up to three years after the filing of the return for the tax period.
| F. | Expenses– Fees provided for under the Rule12b-1 plan of a particular class of the Fund and which are directly attributable to that class are charged to the operations of such class. All other expenses are allocated among the classes based on relative net assets. |
| G. | Accounting Estimates –The preparation of financial statements in conformity with accounting principles generally accepted in the United States of America (“GAAP”) requires management to make estimates and assumptions that affect the reported amounts of assets and liabilities at the date of the financial statements and the reported amounts of revenues and expenses during the reporting period including estimates and assumptions related to taxation. Actual results could differ from those estimates by a significant amount. In addition, the Fund monitors for material events or transactions that may occur or become known after theperiod-end date and before the date the financial statements are released to print. |
| H. | Indemnifications– Under the Trust’s organizational documents, each Trustee, officer, employee or other agent of the Trust is indemnified against certain liabilities that may arise out of the performance of their duties to the Fund. Additionally, in the normal course of business, the Fund enters into contracts, including the Fund’s servicing agreements, that contain a variety of indemnification clauses. The Fund’s maximum exposure under these arrangements is unknown as this would involve future claims that may be made against the Fund that have not yet occurred. The risk of material loss as a result of such indemnification claims is considered remote. |
| I. | Securities Purchased on a When-Issued and Delayed Delivery Basis– The Fund may purchase and sell interests in corporate loans and corporate debt securities and other portfolio securities on a when-issued and delayed delivery basis, with payment and delivery scheduled for a future date. No income accrues to the Fund on such interests or securities in connection with such transactions prior to the date the Fund actually takes delivery of such interests or securities. These transactions are subject to market fluctuations and are subject to the risk that the value at delivery may be more or less than the trade date purchase price. Although the Fund will generally purchase these securities with the intention of acquiring such securities, they may sell such securities prior to the settlement date. |
| J. | Lower-Rated Securities– The Fund normally invests at least 80% of its net assets in lower-quality debt securities, i.e., “junk bonds”. |
Invesco V.I. High Yield Fund
| | Investments in lower-rated securities or unrated securities of comparable quality tend to be more sensitive to economic conditions than higher rated securities. Junk bonds involve a greater risk of default by the issuer because such securities are generally unsecured and are often subordinated to other creditors’ claims. |
| K. | Foreign Currency Translations– Foreign currency is valued at the close of the NYSE based on quotations posted by banks and major currency dealers. Portfolio securities and other assets and liabilities denominated in foreign currencies are translated into U.S. dollar amounts at the date of valuation. Purchases and sales of portfolio securities (net of foreign taxes withheld on disposition) and income items denominated in foreign currencies are translated into U.S. dollar amounts on the respective dates of such transactions. The Fund does not separately account for the portion of the results of operations resulting from changes in foreign exchange rates on investments and the fluctuations arising from changes in market prices of securities held. The combined results of changes in foreign exchange rates and the fluctuation of market prices on investments (net of estimated foreign tax withholding) are included with the net realized and unrealized gain or loss from investments in the Statement of Operations. Reported net realized foreign currency gains or losses arise from (1) sales of foreign currencies, (2) currency gains or losses realized between the trade and settlement dates on securities transactions, and (3) the difference between the amounts of dividends, interest, and foreign withholding taxes recorded on the Fund’s books and the U.S. dollar equivalent of the amounts actually received or paid. Net unrealized foreign currency gains and losses arise from changes in the fair values of assets and liabilities, other than investments in securities at fiscal period end, resulting from changes in exchange rates. |
The Fund may invest in foreign securities, which may be subject to foreign taxes on income, gains on investments or currency repatriation, a portion of which may be recoverable. Foreign taxes, if any, are recorded based on the tax regulations and rates that exist in the foreign markets in which the Fund invests and are shown in the Statement of Operations.
| L. | Forward Foreign Currency Contracts– The Fund may engage in foreign currency transactions either on a spot (i.e. for prompt delivery and settlement) basis, or through forward foreign currency contracts, to manage or minimize currency or exchange rate risk. |
The Fund may also enter into forward foreign currency contracts for the purchase or sale of a security denominated in a foreign currency in order to “lock in” the U.S. dollar price of that security, or the Fund may also enter into forward foreign currency contracts that do not provide for physical settlement of the two currencies, but instead are settled by a single cash payment calculated as the difference between the agreed upon exchange rate and the spot rate at settlement based upon an agreed upon notional amount(non-deliverable forwards). The Fund will set aside liquid assets in an amount equal to the dailymark-to-market obligation for forward foreign currency contracts.
A forward foreign currency contract is an obligation between two parties (“Counterparties”) to purchase or sell a specific currency for an agreed-upon price at a future date. The use of forward foreign currency contracts does not eliminate fluctuations in the price of the underlying securities the Fund owns or intends to acquire but establishes a rate of exchange in advance. Fluctuations in the value of these contracts are measured by the difference in the contract date and reporting date exchange rates and are recorded as unrealized appreciation (depreciation) until the contracts are closed. When the contracts are closed, realized gains (losses) are recorded. Realized and unrealized gains (losses) on the contracts are included in the Statement of Operations. The primary risks associated with forward foreign currency contracts include failure of the Counterparty to meet the terms of the contract and the value of the foreign currency changing unfavorably. These risks may be in excess of the amounts reflected in the Statement of Assets and Liabilities.
| M. | Call Options Purchased and Written– The Fund may write covered call options and/or buy call options. A covered call option gives the purchaser of such option the right to buy, and the writer the obligation to sell, the underlying security or foreign currency at the stated exercise price during the option period. Options written by the Fund normally will have expiration dates between three and nine months from the date written. The exercise price of a call option may be below, equal to, or above the current market value of the underlying security at the time the option is written. |
Additionally, the Fund may enter into an option on a swap agreement, also called a “swaption”. A swaption is an option that gives the buyer the right, but not the obligation, to enter into a swap on a future date in exchange for paying a market-based premium. A receiver swaption gives the owner the right to receive the total return of a specified asset, reference rate or index. Swaptions also include options that allow an existing swap to be terminated or extended by one of the Counterparties.
When the Fund writes a covered call option, an amount equal to the premium received by the Fund is recorded as an asset and an equivalent liability in the Statement of Assets and Liabilities. The amount of the liability is subsequently“marked-to-market” to reflect the current market value of the option written. If a written covered call option expires on the stipulated expiration date, or if the Fund enters into a closing purchase transaction, the Fund realizes a gain (or a loss if the closing purchase transaction exceeds the premium received when the option was written) without regard to any unrealized gain or loss on the underlying security, and the liability related to such option is extinguished. If a written covered call option is exercised, the Fund realizes a gain or a loss from the sale of the underlying security and the proceeds of the sale are increased by the premium originally received. Realized and unrealized gains and losses on call options written are included in the Statement of Operations as Net realized gain (loss) from and Change in net unrealized appreciation (depreciation) of Option contracts written. A risk in writing a covered call option is that the Fund gives up the opportunity for profit if the market price of the security increases and the option is exercised.
When the Fund buys a call option, an amount equal to the premium paid by the Fund is recorded as an investment on the Statement of Assets and Liabilities. The amount of the investment is subsequently“marked-to-market” to reflect the current value of the option purchased. Realized and unrealized gains and losses on call options purchased are included in the Statement of Operations as Net realized gain (loss) from and Change in net unrealized appreciation (depreciation) of Investment securities. A risk in buying an option is that the Fund pays a premium whether or not the option is exercised. In addition, there can be no assurance that a liquid secondary market will exist for any option purchased.
| N. | Put Options Purchased and Written– The Fund may purchase and write put options including options on securities indexes, or foreign currency and/or futures contracts. By purchasing a put option, the Fund obtains the right (but not the obligation) to sell the option’s underlying instrument at a fixed strike price. In return for this right, the Fund pays an option premium. The option’s underlying instrument may be a security, securities index, or a futures contract. |
Additionally, the Fund may enter into an option on a swap agreement, also called a “swaption”. A swaption is an option that gives the buyer the right, but not the obligation, to enter into a swap on a future date in exchange for paying a market-based premium. A receiver swaption gives the owner the right to receive the total return of a specified asset, reference rate or index. Swaptions also include options that allow an existing swap to be terminated or extended by one of the Counterparties.
Invesco V.I. High Yield Fund
Put options may be used by the Fund to hedge securities it owns by locking in a minimum price at which the Fund can sell. If security prices fall, the put option could be exercised to offset all or a portion of the Fund’s resulting losses. At the same time, because the maximum the Fund has at risk is the cost of the option, purchasing put options does not eliminate the potential for the Fund to profit from an increase in the value of the underlying portfolio securities. The Fund may write put options to earn additional income in the form of option premiums if it expects the price of the underlying instrument to remain stable or rise during the option period so that the option will not be exercised. The risk in this strategy is that the price of the underlying securities may decline by an amount greater than the premium received. Put options written are reported as a liability in the Statement of Assets and Liabilities. Realized and unrealized gains and losses on put options purchased and put options written are included in the Statement of Operations as Net realized gain (loss) from and Change in net unrealized appreciation (depreciation) of Investment securities and Option contracts written, respectively. A risk in buying an option is that the Fund pays a premium whether or not the option is exercised. In addition, there can be no assurance that a liquid secondary market will exist for any option purchased.
| O. | Swap Agreements– The Fund may enter into various swap transactions, including interest rate, total return, index, currency and credit default swap contracts (“CDS”) for investment purposes or to manage interest rate, currency or credit risk. Such transactions are agreements between Counterparties. A swap agreement may be negotiated bilaterally and tradedover-the-counter (“OTC”) between two parties (“uncleared/ OTC”) or, in some instances, must be transacted through a future commission merchant (“FCM”) and cleared through a clearinghouse that serves as a central Counterparty (“centrally cleared swap”). These agreements may contain among other conditions, events of default and termination events, and various covenants and representations such as provisions that require the Fund to maintain apre-determined level of net assets, and/ or provide limits regarding the decline of the Fund’s NAV over specific periods of time. If the Fund were to trigger such provisions and have open derivative positions at that time, the Counterparty may be able to terminate such agreement and request immediate payment in an amount equal to the net liability positions, if any. |
Interest rate, total return, index, and currency swap agreements aretwo-party contracts entered into primarily to exchange the returns (or differentials in rates of returns) earned or realized on particular predetermined investments or instruments. The gross returns to be exchanged or “swapped” between the parties are calculated with respect to a notional amount, i.e., the return on or increase in value of a particular dollar amount invested at a particular interest rate or return of an underlying asset, in a particular foreign currency, or in a “basket” of securities representing a particular index.
In a centrally cleared swap, the Fund’s ultimate Counterparty is a central clearinghouse. The Fund initially will enter into centrally cleared swaps through an executing broker. When a fund enters into a centrally cleared swap, it must deliver to the central Counterparty (via the FCM) an amount referred to as “initial margin.” Initial margin requirements are determined by the central Counterparty, but an FCM may require additional initial margin above the amount required by the central Counterparty. Initial margin deposits required upon entering into centrally cleared swaps are satisfied by cash or securities as collateral at the FCM. Securities deposited as initial margin are designated on the Schedule of Investments and cash deposited is recorded on the Statement of Assets and Liabilities. During the term of a cleared swap agreement, a “variation margin” amount may be required to be paid by the Fund or may be received by the Fund, based on the daily change in price of the underlying reference instrument subject to the swap agreement and is recorded as a receivable or payable for variation margin in the Statement of Assets and Liabilities until the centrally cleared swap is terminated at which time a realized gain or loss is recorded.
A CDS is an agreement between Counterparties to exchange the credit risk of an issuer. A buyer of a CDS is said to buy protection by paying a fixed payment over the life of the agreement and in some situations an upfront payment to the seller of the CDS. If a defined credit event occurs (such as payment default or bankruptcy), the Fund as a protection buyer would cease paying its fixed payment, the Fund would deliver eligible bonds issued by the reference entity to the seller, and the seller would pay the full notional value, or the “par value”, of the referenced obligation to the Fund. A seller of a CDS is said to sell protection and thus would receive a fixed payment over the life of the agreement and an upfront payment, if applicable. If a credit event occurs, the Fund as a protection seller would cease to receive the fixed payment stream, the Fund would pay the buyer “par value” or the full notional value of the referenced obligation, and the Fund would receive the eligible bonds issued by the reference entity. In turn, these bonds may be sold in order to realize a recovery value. Alternatively, the seller of the CDS and its Counterparty may agree to net the notional amount and the market value of the bonds and make a cash payment equal to the difference to the buyer of protection. If no credit event occurs, the Fund receives the fixed payment over the life of the agreement. As the seller, the Fund would effectively add leverage to its portfolio because, in addition to its total net assets, the Fund would be subject to investment exposure on the notional amount of the CDS. In connection with these agreements, cash and securities may be identified as collateral in accordance with the terms of the respective swap agreements to provide assets of value and recourse in the event of default under the swap agreement or bankruptcy/insolvency of a party to the swap agreement. If a Counterparty becomes bankrupt or otherwise fails to perform its obligations due to financial difficulties, the Fund may experience significant delays in obtaining any recovery in a bankruptcy or other reorganization proceeding. The Fund may obtain only limited recovery or may obtain no recovery in such circumstances. The Fund’s maximum risk of loss from Counterparty risk, either as the protection seller or as the protection buyer, is the value of the contract. The risk may be mitigated by having a master netting arrangement between the Fund and the Counterparty and by the designation of collateral by the Counterparty to cover the Fund’s exposure to the Counterparty.
Implied credit spreads represent the current level at which protection could be bought or sold given the terms of the existing CDS contract and serve as an indicator of the current status of the payment/performance risk of the CDS. An implied spread that has widened or increased since entry into the initial contract may indicate a deteriorating credit profile and increased risk of default for the reference entity. A declining or narrowing spread may indicate an improving credit profile or decreased risk of default for the reference entity. Alternatively, credit spreads may increase or decrease reflecting the general tolerance for risk in the credit markets.
An interest rate swap is an agreement between Counterparties pursuant to which the parties exchange a floating rate payment for a fixed rate payment based on a specified notional amount.
Changes in the value of centrally cleared and OTC swap agreements are recognized as unrealized gains (losses) in the Statement of Operations by “marking to market” on a daily basis to reflect the value of the swap agreement at the end of each trading day. Payments received or paid at the beginning of the agreement are reflected as such on the Statement of Assets and Liabilities and may be referred to as upfront payments. The Fund accrues for the fixed payment stream and amortizes upfront payments, if any, on swap agreements on a daily basis with the net amount, recorded as a component of realized gain (loss) on the Statement of Operations. A liquidation payment received or made at the termination of a swap agreement is recorded as realized gain (loss) on the Statement of Operations. The Fund segregates cash or liquid securities having a value at least
Invesco V.I. High Yield Fund
equal to the amount of the potential obligation of a Fund under any swap transaction. Cash held as collateral is recorded as deposits with brokers on the Statement of Assets and Liabilities. Entering into these agreements involves, to varying degrees, lack of liquidity and elements of credit, market, and Counterparty risk in excess of amounts recognized on the Statement of Assets and Liabilities. Such risks involve the possibility that a swap is difficult to sell or liquidate; the Counterparty does not honor its obligations under the agreement and unfavorable interest rates and market fluctuations. It is possible that developments in the swaps market, including potential government regulation, could adversely affect the Fund’s ability to terminate existing swap agreements or to realize amounts to be received under such agreements. A short position in a security poses more risk than holding the same security long. As there is no limit on how much the price of the security can increase, the Fund’s exposure is unlimited.
Notional amounts of each individual credit default swap agreement outstanding as of December 31, 2019 for which the Fund is the seller of protection are disclosed in the open swap agreements table. These potential amounts would be partially offset by any recovery values of the respective referenced obligations, upfront payments received upon entering into the agreement, or net amounts received from the settlement of buy protection credit default swap agreements entered into by the Fund for the same referenced entity or entities.
| P. | Other Risks– The Fund invests in corporate loans from U.S. ornon-U.S. companies (the “Borrowers”). The investment of the Fund in a corporate loan may take the form of participation interests or assignments. If the Fund purchases a participation interest from a syndicate of lenders (“Lenders”) or one of the participants in the syndicate (“Participant”), one or more of which administers the loan on behalf of all the Lenders (the “Agent Bank”), the Fund would be required to rely on the Lender that sold the participation interest not only for the enforcement of the Fund’s rights against the Borrower but also for the receipt and processing of payments due to the Fund under the corporate loans. As such, the Fund is subject to the credit risk of the Borrower and the Participant. Lenders and Participants interposed between the Fund and a Borrower, together with Agent Banks, are referred to as “Intermediate Participants”. |
| Q. | Leverage Risk– Leverage exists when the Fund can lose more than it originally invests because it purchases or sells an instrument or enters into a transaction without investing an amount equal to the full economic exposure of the instrument or transaction. |
| R. | Collateral– To the extent the Fund has designated or segregated a security as collateral and that security is subsequently sold, it is the Fund’s practice to replace such collateral no later than the next business day. |
NOTE 2–Advisory Fees and Other Fees Paid to Affiliates
The Trust has entered into a master investment advisory agreement with Invesco Advisers, Inc. (the “Adviser” or “Invesco”). Under the terms of the investment advisory agreement, the Fund accrues daily and pays monthly an advisory fee to the Adviser based on the annual rate of the Fund’s average daily net assets as follows:
| | | | |
| Average Daily Net Assets | | Rate | |
| |
First $ 200 million | | | 0.625% | |
| |
Next $300 million | | | 0.550% | |
| |
Next $500 million | | | 0.500% | |
| |
Over $1 billion | | | 0.450% | |
| |
For the year ended December 31, 2019, the effective advisory fee rate incurred by the Fund was 0.625%.
Under the terms of a mastersub-advisory agreement between the Adviser and each of Invesco Asset Management Deutschland GmbH, Invesco Asset Management Limited, Invesco Asset Management (Japan) Limited, Invesco Hong Kong Limited, Invesco Senior Secured Management, Inc. and Invesco Canada Ltd. and separatesub-advisory agreements with Invesco Capital Management LLC and Invesco Asset Management (India) Private Limited (collectively, the “AffiliatedSub-Advisers”) the Adviser, not the Fund, will pay 40% of the fees paid to the Adviser to any such AffiliatedSub-Adviser(s) that provide(s) discretionary investment management services to the Fund based on the percentage of assets allocated to such AffiliatedSub-Adviser(s).
The Adviser has contractually agreed, through at least June 30, 2020, to waive advisory fees and/or reimburse expenses of all shares to the extent necessary to limit total annual fund operating expenses after fee waiver and/or expense reimbursement (excluding certain items discussed below) of Series I shares to 1.50% and Series II shares to 1.75% of average daily net assets (the “expense limits”). In determining the Adviser’s obligation to waive advisory fees and/or reimburse expenses, the following expenses are not taken into account, and could cause the total annual fund operating expenses after fee waiver and/or expense reimbursement to exceed the numbers reflected above: (1) interest; (2) taxes; (3) dividend expense on short sales; (4) extraordinary ornon-routine items, including litigation expenses; and (5) expenses that the Fund has incurred but did not actually pay because of an expense offset arrangement. Unless Invesco continues the fee waiver agreement, it will terminate on June 30, 2020. During its term, the fee waiver agreement cannot be terminated or amended to increase the expense limits or reduce the advisory fee waiver without approval of the Board of Trustees. The Adviser did not waive fees and/or reimburse expenses during the period under these expense limits.
Further, the Adviser has contractually agreed, through at least June 30, 2021, to waive the advisory fee payable by the Fund in an amount equal to 100% of the net advisory fees the Adviser receives from the affiliated money market funds on investments by the Fund of uninvested cash in such affiliated money market funds.
For the year ended December 31, 2019, the Adviser waived advisory fees of $8,211.
The Trust has entered into a master administrative services agreement with Invesco pursuant to which the Fund has agreed to pay Invesco a fee for costs incurred in providing accounting services and fund administrative services to the Fund and to reimburse Invesco for fees paid to insurance companies that have agreed to provide certain administrative services to the Fund. These administrative services provided by the insurance companies may include, among other things: maintenance of master accounts with the Fund; tracking, recording and transmitting net purchase and redemption orders for Fund shares; maintaining and preserving records related to the purchase, redemption and other account activity of variable product owners; distributing copies of Fund documents such as prospectuses, proxy materials and periodic reports, to variable product owners, and responding to inquiries from variable product owners about the Fund. Pursuant to such agreement, for the year ended December 31, 2019, Invesco was paid $21,327 for accounting and fund administrative services and was reimbursed $232,830 for fees paid to insurance companies. Invesco has entered into asub-administration agreement whereby State Street Bank and Trust Company (“SSB”) serves as fund accountant and provides certain administrative services to the Fund. Pursuant to a custody agreement with the Trust on behalf of the Fund, SSB also serves as the Fund’s custodian.
Invesco V.I. High Yield Fund
The Trust has entered into a transfer agency and service agreement with Invesco Investment Services, Inc. (“IIS”) pursuant to which the Fund has agreed to pay IIS a fee for providing transfer agency and shareholder services to the Fund and reimburse IIS for certain expenses incurred by IIS in the course of providing such services. For the year ended December 31, 2019, expenses incurred under the agreement are shown in the Statement of Operations asTransfer agent fees.
The Trust has entered into a master distribution agreement with Invesco Distributors, Inc. (“IDI”) to serve as the distributor for the Fund. The Trust has adopted a plan pursuant to Rule12b-1 under the 1940 Act with respect to the Fund’s Series II shares (the “Plan”). The Fund, pursuant to the Plan, pays IDI compensation at the annual rate of 0.25% of the Fund’s average daily net assets of Series II shares. The fees are accrued daily and paid monthly. Of the Plan payments, up to 0.25% of the average daily net assets of the Series II shares may be paid to insurance companies who furnish continuing personal shareholder services to customers who purchase and own Series II shares of the Fund. For the year ended December 31, 2019, expenses incurred under the Plan are detailed in the Statement of Operations asDistribution fees.
Certain officers and trustees of the Trust are officers and directors of the Adviser, IIS and/or IDI.
NOTE 3–Additional Valuation Information
GAAP defines fair value as the price that would be received to sell an asset or paid to transfer a liability in an orderly transaction between market participants at the measurement date, under current market conditions. GAAP establishes a hierarchy that prioritizes the inputs to valuation methods, giving the highest priority to readily available unadjusted quoted prices in an active market for identical assets (Level 1) and the lowest priority to significant unobservable inputs (Level 3), generally when market prices are not readily available or are unreliable. Based on the valuation inputs, the securities or other investments are tiered into one of three levels. Changes in valuation methods may result in transfers in or out of an investment’s assigned level:
| | Level 1 - | Prices are determined using quoted prices in an active market for identical assets. |
| | Level 2 - | Prices are determined using other significant observable inputs. Observable inputs are inputs that other market participants may use in pricing a security. These may include quoted prices for similar securities, interest rates, prepayment speeds, credit risk, yield curves, loss severities, default rates, discount rates, volatilities and others. |
| | Level 3 - | Prices are determined using significant unobservable inputs. In situations where quoted prices or observable inputs are unavailable (for example, when there is little or no market activity for an investment at the end of the period), unobservable inputs may be used. Unobservable inputs reflect the Fund’s own assumptions about the factors market participants would use in determining fair value of the securities or instruments and would be based on the best available information. |
The following is a summary of the tiered valuation input levels, as of December 31, 2019. The level assigned to the securities valuations may not be an indication of the risk or liquidity associated with investing in those securities. Because of the inherent uncertainties of valuation, the values reflected in the financial statements may materially differ from the value received upon actual sale of those investments.
| | | | | | | | | | | | | | | | |
| | | Level 1 | | | Level 2 | | | Level 3 | | | Total | |
| |
Investments in Securities | | | | | | | | | | | | | | | | |
| |
U.S. Dollar Denominated Bonds & Notes | | $ | – | | | $ | 135,334,202 | | | | $– | | | $ | 135,334,202 | |
| |
Variable Rate Senior Loan Interests | | | – | | | | 3,049,357 | | | | – | | | | 3,049,357 | |
| |
Asset-Backed Securities | | | – | | | | 2,530,810 | | | | – | | | | 2,530,810 | |
| |
Non-U.S. Dollar Denominated Bonds & Notes | | | – | | | | 754,264 | | | | – | | | | 754,264 | |
| |
U.S. Treasury Securities | | | – | | | | 283,821 | | | | – | | | | 283,821 | |
| |
Agency Credit Risk Transfer Notes | | | – | | | | 111,808 | | | | – | | | | 111,808 | |
| |
Common Stocks & Other Equity Interests | | | 121 | | | | – | | | | 0 | | | | 121 | |
| |
Money Market Funds | | | 12,677,659 | | | | – | | | | – | | | | 12,677,659 | |
| |
Options Purchased | | | – | | | | 50,008 | | | | – | | | | 50,008 | |
| |
Investments Matured | | | – | | | | – | | | | 0 | | | | 0 | |
| |
Total Investments in Securities | | | 12,677,780 | | | | 142,114,270 | | | | 0 | | | | 154,792,050 | |
| |
| | | | |
Other Investments - Assets* | | | | | | | | | | | | | | | | |
| |
Swap Agreements | | | – | | | | 21,369 | | | | – | | | | 21,369 | |
| |
| | | | |
Other Investments - Liabilities* | | | | | | | | | | | | | | | | |
| |
Forward Foreign Currency Contracts | | | – | | | | (16,835 | ) | | | – | | | | (16,835 | ) |
| |
Options Written | | | – | | | | (18,975 | ) | | | – | | | | (18,975 | ) |
| |
| | | – | | | | (35,810 | ) | | | – | | | | (35,810 | ) |
| |
Total Other Investments | | | – | | | | (14,441 | ) | | | – | | | | (14,441 | ) |
| |
Total Investments | | $ | 12,677,780 | | | $ | 142,099,829 | | | | $0 | | | $ | 154,777,609 | |
| |
| * | Forward foreign currency contracts and swap agreements are valued at unrealized appreciation (depreciation). Options written are shown at value. |
NOTE 4–Derivative Investments
The Fund may enter into an International Swaps and Derivatives Association Master Agreement (“ISDA Master Agreement”) under which a fund may trade OTC derivatives. An OTC transaction entered into under an ISDA Master Agreement typically involves a collateral posting arrangement, payment netting provisions andclose-out netting provisions. These netting provisions allow for reduction of credit risk through netting of contractual
Invesco V.I. High Yield Fund
obligations. The enforceability of the netting provisions of the ISDA Master Agreement depends on the governing law of the ISDA Master Agreement, among other factors.
For financial reporting purposes, the Fund does not offset OTC derivative assets or liabilities that are subject to ISDA Master Agreements in the Statement of Assets and Liabilities.
Value of Derivative Investments atPeriod-End
The table below summarizes the value of the Fund’s derivative investments, detailed by primary risk exposure, held as of December 31, 2019:
| | | | | | | | | | | | | | | | |
| | | Value | |
| | | Credit | | | Currency | | | Equity | | | | |
| Derivative Assets | | Risk | | | Risk | | | Risk | | | Total | |
| |
Unrealized appreciation on swap agreements – Centrally Cleared(a) | | $ | 4,885 | | | $ | - | | | $ | - | | | $ | 4,885 | |
| |
Unrealized appreciation on swap agreements – OTC | | | - | | | | - | | | | 16,484 | | | | 16,484 | |
| |
Options purchased, at value – OTC(b) | | | 50,008 | | | | - | | | | - | | | | 50,008 | |
| |
Total Derivative Assets | | | 54,893 | | | | - | | | | 16,484 | | | | 71,377 | |
| |
Derivatives not subject to master netting agreements | | | (4,885 | ) | | | - | | | | - | | | | (4,885 | ) |
| |
Total Derivative Assets subject to master netting agreements | | $ | 50,008 | | | $ | - | | | $ | 16,484 | | | $ | 66,492 | |
| |
| |
| | | Value | |
| | | Credit | | | Currency | | | Equity | | | | |
| Derivative Liabilities | | Risk | | | Risk | | | Risk | | | Total | |
| |
Unrealized depreciation on forward foreign currency contracts outstanding | | $ | - | | | $ | (16,835 | ) | | $ | - | | | $ | (16,835 | ) |
| |
Options written, at value – OTC | | | (18,975 | ) | | | - | | | | - | | | | (18,975 | ) |
| |
Total Derivative Liabilities | | | (18,975 | ) | | | (16,835 | ) | | | - | | | | (35,810 | ) |
| |
Derivatives not subject to master netting agreements | | | - | | | | - | | | | - | | | | - | |
| |
Total Derivative Liabilities subject to master netting agreements | | $ | (18,975 | ) | | $ | (16,835 | ) | | $ | - | | | $ | (35,810 | ) |
| |
| (a) | The daily variation margin receivable atperiod-end is recorded in the Statement of Assets and Liabilities. |
| (b) | Options purchased, at value as reported in the Schedule of Investments. |
Offsetting Assets and Liabilities
The table below reflects the Fund’s exposure to Counterparties subject to either an ISDA Master Agreement or other agreement for OTC derivative transactions as of December 31, 2019.
| | | | | | | | | | | | | | | | | | | | | | | | | | | | | | | | | | | | | | | | |
| | | | | | | | | | | | | | | | | | | | | | | | Collateral | |
| | | Financial Derivative Assets | | | Financial Derivative Liabilities | | | (Received/Pledged) | |
| |
| | | | | | | | | | | | Forward | | | | | | | | | | | | | | | | | | | | |
| | | | | | | | | | | | Foreign | | | | | | | | | | | | | | | | | | | | |
| | | Options | | | Swap | | | Total | | | Currency | | | Options | | | Swap | | | Total | | | Net Value of | | | | | | | Net | |
| Counterparty | | Purchased | | | Agreements | | | Assets | | | Contracts | | | Written | | | Agreements | | | Liabilities | | | Derivatives | | | Non-Cash | | Cash | | Amount | |
| |
Barclays Bank PLC | | $ | - | | | $ | - | | | $ | - | | | $ | (5,755 | ) | | $ | - | | | $ | - | | | $ | (5,755 | ) | | $ | (5,755 | ) | | $- | | `$- | | $ | (5,755 | ) |
| |
Citibank, N.A. | | | - | | | | - | | | | - | | | | (11,080 | ) | | | - | | | | - | | | | (11,080 | ) | | | (11,080 | ) | | - | | - | | | (11,080 | ) |
| |
J.P. Morgan Chase Bank, N.A. | | | 50,008 | | | | - | | | | 50,008 | | | | - | | | | (18,975 | ) | | | - | | | | (18,975 | ) | | | 31,033 | | | - | | - | | | 31,033 | |
| |
Morgan Stanley Capital Services LLC | | | - | | | | 16,484 | | | | 16,484 | | | | - | | | | - | | | | (2,544 | ) | | | (2,544 | ) | | | 13,940 | | | - | | - | | | 13,940 | |
| |
Total | | $ | 50,008 | | | $ | 16,484 | | | $ | 66,492 | | | $ | (16,835 | ) | | $ | (18,975 | ) | | $ | (2,544 | ) | | $ | (38,354 | ) | | $ | 28,138 | | | $- | | $- | | $ | 28,138 | |
| |
Effect of Derivative Investments for the year ended December 31, 2019
The table below summarizes the gains (losses) on derivative investments, detailed by primary risk exposure, recognized in earnings during the period:
| | | | | | | | | | | | | | | | | | | | |
| | | Location of Gain (Loss) on | |
| | | Statement of Operations | |
| | | Credit | | | Currency | | | Equity | | | Interest | | | | |
| | | Risk | | | Risk | | | Risk | | | Rate Risk | | | Total | |
| |
Realized Gain (Loss): | | | | | | | | | | | | | | | | | | | | |
Forward foreign currency contracts | | $ | - | | | $ | 59,398 | | | $ | - | | | $ | - | | | $ | 59,398 | |
| |
Options purchased(a) | | | - | | | | (13,612 | ) | | | - | | | | (66,538 | ) | | | (80,150 | ) |
| |
Options written | | | - | | | | - | | | | - | | | | 156,370 | | | | 156,370 | |
| |
Swap agreements | | | 78,139 | | | | - | | | | 58,967 | | | | (190,803 | ) | | | (53,697 | ) |
| |
Invesco V.I. High Yield Fund
| | | | | | | | | | | | | | | | | | | | |
| | | Location of Gain (Loss) on | |
| | | Statement of Operations | |
| | | Credit | | | Currency | | | Equity | | | Interest | | | | |
| | | Risk | | | Risk | | | Risk | | | Rate Risk | | | Total | |
| |
Change in Net Unrealized Appreciation (Depreciation): | | | | | | | | | | | | | | | | | | | | |
Forward foreign currency contracts | | $ | - | | | $ | (3,630 | ) | | $ | - | | | $ | - | | | $ | (3,630 | ) |
| |
Options purchased(a) | | | 1,498 | | | | - | | | | - | | | | - | | | | 1,498 | |
| |
Options written | | | 15,892 | | | | - | | | | - | | | | - | | | | 15,892 | |
| |
Swap agreements | | | 243,247 | | | | - | | | | 16,484 | | | | - | | | | 259,731 | |
| |
Total | | $ | 338,776 | | | $ | 42,156 | | | $ | 75,451 | | | $ | (100,971 | ) | | $ | 355,412 | |
| |
| (a) | Options purchased are included in the net realized gain (loss) from investment securities and the change in net unrealized appreciation (depreciation) of investment securities. |
The table below summarizes the average notional value of derivatives held during the period.
| | | | | | | | | | |
| | | Forward | | | | | | | | |
| | | Foreign Currency | | Swaptions | | Options | | Options | | Swap |
| | | Contracts | | Purchased | | Purchased | | Written | | Agreements |
|
Average notional value | | $1,556,371 | | $17,071,429 | | $2,994,200 | | $14,757,143 | | $6,317,636 |
|
NOTE 5–Trustees’ and Officers’ Fees and Benefits
Trustees’ and Officers’ Fees and Benefits include amounts accrued by the Fund to pay remuneration to certain Trustees and Officers of the Fund. Trustees have the option to defer compensation payable by the Fund, andTrustees’ and Officers’ Fees and Benefits also include amounts accrued by the Fund to fund such deferred compensation amounts. Those Trustees who defer compensation have the option to select various Invesco Funds in which their deferral accounts shall be deemed to be invested. Finally, certain current Trustees were eligible to participate in a retirement plan that provided for benefits to be paid upon retirement to Trustees over a period of time based on the number of years of service. The Fund may have certain former Trustees who also participate in a retirement plan and receive benefits under such plan.Trustees’ and Officers’ Fees and Benefits include amounts accrued by the Fund to fund such retirement benefits. Obligations under the deferred compensation and retirement plans represent unsecured claims against the general assets of the Fund.
NOTE 6–Cash Balances
The Fund may borrow for leveraging in an amount up to 5% of the Fund’s total assets (excluding the amount borrowed) at the time the borrowing is made. In doing so, the Fund is permitted to temporarily carry a negative or overdrawn balance in its account with SSB, the custodian bank. Such balances, if any at period end, are shown in the Statement of Assets and Liabilities under the payable caption Amount due custodian. To compensate the custodian bank for such overdrafts, the overdrawn Fund may either (1) leave funds as a compensating balance in the account so the custodian bank can be compensated by earning the additional interest; or (2) compensate by paying the custodian bank at a rate agreed upon by the custodian bank and Invesco, not to exceed the contractually agreed upon rate. The Fund may not purchase additional securities when any borrowings from banks exceed 5% of the Fund’s total assets.
NOTE 7–Distributions to Shareholders and Tax Components of Net Assets
Tax Character of Distributions to Shareholders Paid During the Fiscal Years Ended December 31, 2019 and 2018:
| | | | | | | | |
| | | 2019 | | | 2018 | |
| |
Ordinary income | | $ | 8,767,702 | | | $ | 8,780,177 | |
| |
Tax Components of Net Assets atPeriod-End:
| | | | |
| | | 2019 | |
| |
Undistributed ordinary income | | $ | 7,992,327 | |
| |
Net unrealized appreciation – investments | | | 1,186,593 | |
| |
Net unrealized appreciation - foreign currencies | | | 11,787 | |
| |
Temporary book/tax differences | | | (65,248 | ) |
| |
Capital loss carryforward | | | (19,457,360 | ) |
| |
Shares of beneficial interest | | | 165,450,183 | |
| |
Total net assets | | $ | 155,118,282 | |
| |
The difference between book-basis andtax-basis unrealized appreciation (depreciation) is due to differences in the timing of recognition of gains and losses on investments for tax and book purposes. The Fund’s net unrealized appreciation difference is attributable primarily to wash sales, swap agreements and forward foreign currency contracts.
The temporary book/tax differences are a result of timing differences between book and tax recognition of income and/or expenses. The Fund’s temporary book/tax differences are the result of the trustee deferral of compensation and retirement plan benefits.
Capital loss carryforward is calculated and reported as of a specific date. Results of transactions and other activity after that date may affect the amount of capital loss carryforward actually available for the Fund to utilize. Capital losses generated in years beginning after December 22, 2010
Invesco V.I. High Yield Fund
can be carried forward for an unlimited period, whereas previous losses expire in eight tax years. Capital losses with an expiration period may not be used to offset capital gains until all net capital losses without an expiration date have been utilized. Capital loss carryforwards with no expiration date will retain their character as either short-term or long-term capital losses instead of as short-term capital losses as under prior law. The ability to utilize capital loss carryforwards in the future may be limited under the Internal Revenue Code and related regulations based on the results of future transactions.
The Fund has a capital loss carryforward as of December 31, 2019, as follows:
Capital Loss Carryforward*
| | | | | | | | | | | | |
| |
| Expiration | | Short-Term | | | Long-Term | | | Total | |
| |
Not subject to expiration | | $ | 6,519,207 | | | $ | 12,938,153 | | | $ | 19,457,360 | |
| |
| * | Capital loss carryforward as of the date listed above is reduced for limitations, if any, to the extent required by the Internal Revenue Code and may be further limited depending upon a variety of factors, including the realization of net unrealized gains or losses as of the date of any reorganization. |
NOTE 8–Investment Transactions
The aggregate amount of investment securities (other than short-term securities, U.S. Treasury obligations and money market funds, if any) purchased and sold by the Fund during the year ended December 31, 2019 was $76,208,054 and $82,787,136, respectively. Cost of investments, including any derivatives, on a tax basis includes the adjustments for financial reporting purposes as of the most recently completed federal income tax reportingperiod-end.
Unrealized Appreciation (Depreciation) of Investments on a Tax Basis
| | | | |
| |
Aggregate unrealized appreciation of investments | | $ | 5,676,261 | |
| |
Aggregate unrealized (depreciation) of investments | | | (4,489,668 | ) |
| |
Net unrealized appreciation of investments | | $ | 1,186,593 | |
| |
Cost of investments for tax purposes is $153,591,016.
NOTE 9–Reclassification of Permanent Differences
Primarily as a result of differing book/tax treatment of foreign currency transactions, on December 31, 2019, undistributed net investment income was increased by $62,161 and undistributed net realized gain (loss) was decreased by $62,161. This reclassification had no effect on the net assets or the distributable earnings (loss) of the Fund.
NOTE 10–Share Information
| | | | | | | | | | | | | | | | |
| | | Summary of Share Activity | |
| |
| | | Year ended | | | Year ended | |
| | | December 31, 2019(a) | | | December 31, 2018 | |
| | | | | | | | |
| | | Shares | | | Amount | | | Shares | | | Amount | |
| |
Sold: | | | | | | | | | | | | | | | | |
| | | | |
Series I | | | 10,060,540 | | | $ | 54,316,527 | | | | 14,839,601 | | | $ | 80,754,950 | |
| |
Series II | | | 3,671,455 | | | | 19,825,254 | | | | 3,110,907 | | | | 16,714,977 | |
| |
| | | | |
Issued as reinvestment of dividends: | | | | | | | | | | | | | | | | |
| | | | |
Series I | | | 581,585 | | | | 3,070,770 | | | | 793,064 | | | | 4,211,171 | |
| |
Series II | | | 1,089,280 | | | | 5,696,932 | | | | 866,984 | | | | 4,569,006 | |
| |
| | | | |
Reacquired: | | | | | | | | | | | | | | | | |
| | | | |
Series I | | | (12,378,602 | ) | | | (66,829,232 | ) | | | (19,216,611 | ) | | | (102,508,742 | ) |
| |
Series II | | | (2,376,915 | ) | | | (12,818,048 | ) | | | (3,585,217 | ) | | | (19,054,885 | ) |
| |
Net increase (decrease) in share activity | | | 647,343 | | | $ | 3,262,203 | | | | (3,191,272 | ) | | $ | (15,313,523 | ) |
| |
| (a) | There are entities that are record owners of more than 5% of the outstanding shares of the Fund and in the aggregate own 69% of the outstanding shares of the Fund. The Fund and the Fund’s principal underwriter or adviser, are parties to participation agreements with these entities whereby these entities sell units of interest in separate accounts funding variable products that are invested in the Fund. The Fund, Invesco and/or Invesco affiliates may make payments to these entities, which are considered to be related to the Fund, for providing services to the Fund, Invesco and/or Invesco affiliates including but not limited to services such as, securities brokerage, third party record keeping and account servicing and administrative services. The Fund has no knowledge as to whether all or any portion of the shares owned of record by these entities are also owned beneficially. |
Invesco V.I. High Yield Fund
Report of Independent Registered Public Accounting Firm
To the Board of Trustees of AIM Variable Insurance Funds (Invesco Variable Insurance Funds) and Shareholders of Invesco V.I. High Yield Fund
Opinion on the Financial Statements
We have audited the accompanying statement of assets and liabilities, including the schedule of investments, of Invesco V.I. High Yield Fund (one of the funds constituting AIM Variable Insurance Funds (Invesco Variable Insurance Funds), referred to hereafter as the “Fund”) as of December 31, 2019, the related statement of operations for the year ended December 31, 2019, the statement of changes in net assets for each of the two years in the period ended December 31, 2019, including the related notes, and the financial highlights for each of the five years in the period ended December 31, 2019 (collectively referred to as the “financial statements”). In our opinion, the financial statements present fairly, in all material respects, the financial position of the Fund as of December 31, 2019, the results of its operations for the year then ended, the changes in its net assets for each of the two years in the period ended December 31, 2019 and the financial highlights for each of the five years in the period ended December 31, 2019 in conformity with accounting principles generally accepted in the United States of America.
Basis for Opinion
These financial statements are the responsibility of the Fund’s management. Our responsibility is to express an opinion on the Fund’s financial statements based on our audits. We are a public accounting firm registered with the Public Company Accounting Oversight Board (United States) (PCAOB) and are required to be independent with respect to the Fund in accordance with the U.S. federal securities laws and the applicable rules and regulations of the Securities and Exchange Commission and the PCAOB.
We conducted our audits of these financial statements in accordance with the standards of the PCAOB. Those standards require that we plan and perform the audit to obtain reasonable assurance about whether the financial statements are free of material misstatement, whether due to error or fraud.
Our audits included performing procedures to assess the risks of material misstatement of the financial statements, whether due to error or fraud, and performing procedures that respond to those risks. Such procedures included examining, on a test basis, evidence regarding the amounts and disclosures in the financial statements. Our audits also included evaluating the accounting principles used and significant estimates made by management, as well as evaluating the overall presentation of the financial statements. Our procedures included confirmation of securities owned as of December 31, 2019 by correspondence with the custodian, transfer agent and brokers; when replies were not received from brokers, we performed other auditing procedures. We believe that our audits provide a reasonable basis for our opinion.
/s/PricewaterhouseCoopers LLP
Houston, Texas
February 18, 2020
We have served as the auditor of one or more of the investment companies in the Invesco group of investment companies since at least 1995. We have not been able to determine the specific year we began serving as auditor.
Invesco V.I. High Yield Fund
Calculating your ongoing Fund expenses
Example
As a shareholder of the Fund, you incur ongoing costs, including management fees; distribution and/or service fees(12b-1); and other Fund expenses. This example is intended to help you understand your ongoing costs (in dollars) of investing in the Fund and to compare these costs with ongoing costs of investing in other mutual funds. The example is based on an investment of $1,000 invested at the beginning of the period and held for the entire period July 1, 2019 through December 31, 2019.
The actual and hypothetical expenses in the examples below do not represent the effect of any fees or other expenses assessed in connection with a variable product; if they did, the expenses shown would be higher while the ending account values shown would be lower.
Actual expenses
The table below provides information about actual account values and actual expenses. You may use the information in this table, together with the amount you invested, to estimate the expenses that you paid over the period. Simply divide your account value by $1,000 (for example, an $8,600 account value divided by $1,000 = 8.6), then multiply the result by the number in the table under the heading entitled “Actual Expenses Paid During Period” to estimate the expenses you paid on your account during this period.
Hypothetical example for comparison purposes
The table below also provides information about hypothetical account values and hypothetical expenses based on the Fund’s actual expense ratio and an assumed rate of return of 5% per year before expenses, which is not the Fund’s actual return.
The hypothetical account values and expenses may not be used to estimate the actual ending account balance or expenses you paid for the period. You may use this information to compare the ongoing costs of investing in the Fund and other funds. To do so, compare this 5% hypothetical example with the 5% hypothetical examples that appear in the shareholder reports of the other funds.
Please note that the expenses shown in the table are meant to highlight your ongoing costs. Therefore, the hypothetical information is useful in comparing ongoing costs, and will not help you determine the relative total costs of owning different funds.
| | | | | | | | | | | | |
| | | Beginning
Account Value
(07/01/19) | | ACTUAL | | HYPOTHETICAL
(5% annual return before expenses) | | Annualized
Expense
Ratio |
| | Ending
Account Value
(12/31/19)1 | | Expenses
Paid During
Period2 | | Ending
Account Value
(12/31/19) | | Expenses
Paid During
Period2 |
Series I | | $1,000.00 | | $1,033.00 | | $4.51 | | $1,020.77 | | $4.48 | | 0.88% |
Series II | | 1,000.00 | | 1,031.00 | | 5.78 | | 1,019.51 | | 5.75 | | 1.13 |
| 1 | The actual ending account value is based on the actual total return of the Fund for the period July 1, 2019 through December 31, 2019, after actual expenses and will differ from the hypothetical ending account value which is based on the Fund’s expense ratio and a hypothetical annual return of 5% before expenses. |
| 2 | Expenses are equal to the Fund’s annualized expense ratio as indicated above multiplied by the average account value over the period, multiplied by 184/365 to reflect the most recent fiscal half year. |
Invesco V.I. High Yield Fund
Tax Information
Form1099-DIV, Form1042-S and other year–end tax information provide shareholders with actual calendar year amounts that should be included in their tax returns. Shareholders should consult their tax advisers.
The following distribution information is being provided as required by the Internal Revenue Code or to meet a specific state’s requirement.
The Fund designates the following amounts or, if subsequently determined to be different, the maximum amount allowable for its fiscal year ended December 31, 2019:
| | | | | | | | |
| | Federal and State Income Tax | | | | | | |
| | Corporate Dividends Received Deduction* | | | 0.55 | % | | |
| | Qualified Dividend Income* | | | 0.00 | % | | |
| | U.S. Treasury Obligations* | | | 0.13 | % | | |
* The above percentages are based on ordinary income dividends paid to shareholders during the Fund’s fiscal year.
Invesco V.I. High Yield Fund
Trustees and Officers
The address of each trustee and officer is AIM Variable Insurance Funds (Invesco Variable Insurance Funds) (the “Trust”), 11 Greenway Plaza, Suite 1000, Houston, Texas 77046-1173. The trustees serve for the life of the Trust, subject to their earlier death, incapacitation, resignation, retirement or removal as more specifically provided in the Trust’s organizational documents. Each officer serves for a one year term or until their successors are elected and qualified. Column two below includes length of time served with predecessor entities, if any.
| | | | | | | | |
Name, Year of Birth and Position(s) Held with the Trust | | Trustee and/or Officer Since | | Principal Occupation(s) During Past 5 Years | | Number of
Funds in
Fund Complex
Overseen by
Trustee | | Other Directorship(s) Held by Trustee
During Past 5 Years |
| Interested Person |
Martin L. Flanagan1- 1960 Trustee and Vice Chair | | 2007 | | Executive Director, Chief Executive Officer and President, Invesco Ltd. (ultimate parent of Invesco and a global investment management firm); Trustee and Vice Chair, The Invesco Funds; Vice Chair, Investment Company Institute; and Member of Executive Board, SMU Cox School of Business Formerly: Advisor to the Board, Invesco Advisers, Inc. (formerly known as Invesco Institutional (N.A.), Inc.); Chairman and Chief Executive Officer, Invesco Advisers, Inc. (registered investment adviser); Director, Chairman, Chief Executive Officer and President, Invesco Holding Company (US), Inc. (formerly IVZ Inc.) (holding company), Invesco Group Services, Inc. (service provider) and Invesco North American Holdings, Inc. (holding company); Director, Chief Executive Officer and President, Invesco Holding Company Limited (parent of Invesco and a global investment management firm); Director, Invesco Ltd.; Chairman, Investment Company Institute and President,Co-Chief Executive Officer,Co-President, Chief Operating Officer and Chief Financial Officer, Franklin Resources, Inc. (global investment management organization) | | 229 | | None |
| 1 | Mr. Flanagan is considered an interested person (within the meaning of Section 2(a)(19) of the 1940 Act) of the Trust because he is an officer of the Adviser to the Trust, and an officer and a director of Invesco Ltd., ultimate parent of the Adviser. |
Invesco V.I. High Yield Fund
Trustees and Officers–(continued)
| | | | | | | | |
Name, Year of Birth and Position(s) Held with the Trust | | Trustee and/or Officer Since | | Principal Occupation(s) During Past 5 Years | | Number of
Funds in
Fund Complex
Overseen by
Trustee | | Other Directorship(s) Held by Trustee
During Past 5 Years |
| Independent Trustees |
Bruce L. Crockett - 1944 Trustee and Chair | | 1993 | | Chairman, Crockett Technologies Associates (technology consulting company) Formerly: Director, Captaris (unified messaging provider); Director, President and Chief Executive Officer, COMSAT Corporation; Chairman, Board of Governors of INTELSAT (international communications company); ACE Limited (insurance company); Independent Directors Council and Investment Company Institute: Member of the Audit Committee, Investment Company Institute; Member of the Executive Committee and Chair of the Governance Committee, Independent Directors Council | | 229 | | Director and Chairman of the Audit Committee, ALPS (Attorneys Liability Protection Society) (insurance company); Director and Member of the Audit Committee and Compensation Committee, Ferroglobe PLC (metallurgical company) |
David C. Arch - 1945 Trustee | | 2010 | | Chairman of Blistex Inc. (consumer health care products manufacturer); Member, World Presidents’ Organization | | 229 | | Board member of the Illinois Manufacturers’ Association |
Beth Ann Brown - 1968 Trustee | | 2019 | | Independent Consultant Formerly: Head of Intermediary Distribution, Managing Director, Strategic Relations, Managing Director, Head of National Accounts, Senior Vice President, National Account Manager and Senior Vice President, Key Account Manager, Columbia Management Investment Advisers LLC; Vice President, Key Account Manager, Liberty Funds Distributor, Inc.; and Trustee of certain Oppenheimer Funds | | 229 | | Director, Board of Directors of Caron Engineering Inc.; Advisor, Board of Advisors of Caron Engineering Inc.; President and Director, Acton Shapleigh Youth Conservation Corps (non - profit); and Vice President and Director of Grahamtastic Connection (non-profit) |
Jack M. Fields - 1952 Trustee | | 1997 | | Chief Executive Officer, Twenty First Century Group, Inc. (government affairs company); and Chairman, Discovery Learning Alliance(non-profit) Formerly: Owner and Chief Executive Officer, Dos Angeles Ranch L.P. (cattle, hunting, corporate entertainment); Director, Insperity, Inc. (formerly known as Administaff) (human resources provider); Chief Executive Officer, Texana Timber LP (sustainable forestry company); Director of Cross Timbers Quail Research Ranch(non-profit); and member of the U.S. House of Representatives | | 229 | | None |
Invesco V.I. High Yield Fund
Trustees and Officers–(continued)
| | | | | | | | |
Name, Year of Birth and Position(s) Held with the Trust | | Trustee and/or Officer Since | | Principal Occupation(s) During Past 5 Years | | Number of
Funds in
Fund Complex
Overseen by
Trustee | | Other Directorship(s) Held by Trustee
During Past 5 Years |
| Independent Trustees–(continued) |
Cynthia Hostetler - 1962 Trustee | | 2017 | | Non-Executive Director and Trustee of a number of public and private business corporations Formerly: Director, Aberdeen Investment Funds (4 portfolios); Head of Investment Funds and Private Equity, Overseas Private Investment Corporation; President, First Manhattan Bancorporation, Inc.; Attorney, Simpson Thacher & Bartlett LLP | | 229 | | Vulcan Materials Company (construction materials company); Trilinc Global Impact Fund; Genesee & Wyoming, Inc. (railroads); Artio Global Investment LLC (mutual fund complex); Edgen Group, Inc. (specialized energy and infrastructure products distributor); Investment Company Institute (professional organization); Independent Directors Council (professional organization) |
Eli Jones - 1961 Trustee | | 2016 | | Professor and Dean, Mays Business School - Texas A&M University Formerly: Professor and Dean, Walton College of Business, University of Arkansas and E.J. Ourso College of Business, Louisiana State University; Director, Arvest Bank | | 229 | | Insperity, Inc. (formerly known as Administaff) (human resources provider) |
Elizabeth Krentzman - 1959 Trustee | | 2019 | | Formerly: Principal and Chief Regulatory Advisor for Asset Management Services and U.S. Mutual Fund Leader of Deloitte & Touche LLP; General Counsel of the Investment Company Institute (trade association); National Director of the Investment Management Regulatory Consulting Practice, Principal, Director and Senior Manager of Deloitte & Touche LLP; Assistant Director of the Division of Investment Management - Office of Disclosure and Investment Adviser Regulation of the U.S. Securities and Exchange Commission and various positions with the Division of Investment Management - Office of Regulatory Policy of the U.S. Securities and Exchange Commission; Associate at Ropes & Gray LLP; Advisory Board Member of the Securities and Exchange Commission Historical Society; and Trustee of certain Oppenheimer Funds | | 229 | | Trustee of the University of Florida National Board Foundation and Audit Committee Member; Member of the Cartica Funds Board of Directors (private investment funds); Member of the University of Florida Law Center Association, Inc. Board of Trustees and Audit Committee Member |
Anthony J. LaCava, Jr. - 1956 Trustee | | 2019 | | Formerly: Director and Member of the Audit Committee, Blue Hills Bank (publicly traded financial institution) and Managing Partner, KPMG LLP | | 229 | | Blue Hills Bank; Chairman, Bentley University; Member, Business School Advisory Council; and Nominating Committee KPMG LLP |
Prema Mathai-Davis - 1950 Trustee | | 1998 | | Retired Co-Owner & Partner of Quantalytics Research, LLC, (a FinTech Investment Research Platform for the Self-Directed Investor) | | 229 | | None |
Invesco V.I. High Yield Fund
Trustees and Officers–(continued)
| | | | | | | | |
Name, Year of Birth and Position(s) Held with the Trust | | Trustee and/or Officer Since | | Principal Occupation(s) During Past 5 Years | | Number of
Funds in
Fund Complex
Overseen by
Trustee | | Other Directorship(s) Held by Trustee
During Past 5 Years |
| Independent Trustees–(continued) |
Joel W. Motley - 1952 Trustee | | 2019 | | Director of Office of Finance, Federal Home Loan Bank; Member of the Vestry of Trinity Wall Street; Managing Director of Carmona Motley Inc. (privately held financial advisor); Member of the Finance and Budget Committee of the Council on Foreign Relations, Member of the Investment Committee and Board of Human Rights Watch and Member of the Investment Committee and Board of Historic Hudson Valley(non-profit cultural organization) Formerly: Managing Director of Public Capital Advisors, LLC (privately held financial advisor); Managing Director of Carmona Motley Hoffman, Inc. (privately held financial advisor); Trustee of certain Oppenheimer Funds; and Director of Columbia Equity Financial Corp. (privately held financial advisor) | | 229 | | Director of Greenwall Foundation (bioethics research foundation); Member of Board and Investment Committee of The Greenwall Foundation; Director of Southern Africa Legal Services Foundation; Board Member and Investment Committee Member of Pulizer Center for Crisis Reporting(non-profit journalism) |
Teresa M. Ressel - 1962 Trustee | | 2017 | | Non-executive director and trustee of a number of public and private business corporations Formerly: Chief Financial Officer, Olayan America, The Olayan Group (international investor/commercial/industrial); Chief Executive Officer, UBS Securities LLC; Group Chief Operating Officer, Americas, UBS AG; Assistant Secretary for Management & Budget and CFO, US Department of the Treasury | | 229 | | Atlantic Power Corporation (power generation company); ON Semiconductor Corp. (semiconductor supplier) |
Ann Barnett Stern - 1957 Trustee | | 2017 | | President and Chief Executive Officer, Houston Endowment Inc. (private philanthropic institution) Formerly: Executive Vice President and General Counsel, Texas Children’s Hospital; Attorney, Beck, Redden and Secrest, LLP; Business Law Instructor, University of St. Thomas; Attorney, Andrews & Kurth LLP | | 229 | | Federal Reserve Bank of Dallas |
Robert C. Troccoli - 1949 Trustee | | 2016 | | Retired | | 229 | | None |
| Daniel S. Vandivort - 1954 Trustee | | 2019 | | Treasurer, Chairman of the Audit and Finance Committee, and Trustee, Board of Trustees, Huntington Disease Foundation of America; and President, Flyway Advisory Services LLC (consulting and property management) Formerly: Trustee and Governance Chair, of certain Oppenheimer Funds | | 229 | | Chairman and Lead Independent Director, Chairman of the Audit Committee, and Director, Board of Directors, Value Line Funds |
| James D. Vaughn - 1945 Trustee | | 2019 | | Retired Formerly: Managing Partner, Deloitte & Touche LLP; Trustee and Chairman of the Audit Committee, Schroder Funds; Board Member, Mile High United Way, Boys and Girls Clubs, Boy Scouts, Colorado Business Committee for the Arts, Economic Club of Colorado and Metro Denver Network (economic development corporation); and Trustee of certain Oppenheimer Funds | | 229 | | Board member and Chairman of Audit Committee of AMG National Trust Bank; Trustee and Investment Committee member, University of South Dakota Foundation; Board member, Audit Committee Member and past Board Chair, Junior Achievement(non-profit) |
Invesco V.I. High Yield Fund
Trustees and Officers–(continued)
| | | | | | | | |
Name, Year of Birth and Position(s) Held with the Trust | | Trustee and/or Officer Since | | Principal Occupation(s) During Past 5 Years | | Number of
Funds in
Fund Complex
Overseen by
Trustee | | Other Directorship(s) Held by Trustee
During Past 5 Years |
| Independent Trustees–(continued) |
| Christopher L. WIlson - 1957 Trustee, Vice Chair and Chair Designate | | 2017 | | Retired Formerly: Director, TD Asset Management USA Inc. (mutual fund complex) (22 portfolios); Managing Partner, CT2, LLC (investing and consulting firm); President/Chief Executive Officer, Columbia Funds, Bank of America Corporation; President/Chief Executive Officer, CDC IXIS Asset Management Services, Inc.; Principal & Director of Operations, Scudder Funds, Scudder, Stevens & Clark, Inc.; Assistant Vice President, Fidelity Investments | | 229 | | ISO New England, Inc.(non-profit organization managing regional electricity market) |
Invesco V.I. High Yield Fund
Trustees and Officers–(continued)
| | | | | | | | |
Name, Year of Birth and Position(s) Held with the Trust | | Trustee and/or Officer Since | | Principal Occupation(s) During Past 5 Years | | Number of
Funds in
Fund Complex
Overseen by
Trustee | | Other Directorship(s) Held by Trustee
During Past 5 Years |
| Officers |
Sheri Morris - 1964 President, Principal Executive Officer and Treasurer | | 1999 | | Head of Global Fund Services, Invesco Ltd.; President, Principal Executive Officer and Treasurer, The Invesco Funds; Vice President, Invesco Advisers, Inc. (formerly known as Invesco Institutional (N.A.), Inc.) (registered investment adviser); and Vice President, Invesco Exchange-Traded Fund Trust, Invesco Exchange-Traded Fund Trust II, Invesco India Exchange-Traded Fund Trust, Invesco Actively Managed Exchange-Traded Fund Trust, Invesco Actively Managed Exchange-Traded Commodity Fund Trust and Invesco Exchange-Traded Self-Indexed Fund Trust; and Vice President, OppenheimerFunds, Inc. Formerly: Vice President and Principal Financial Officer, The Invesco Funds; Vice President, Invesco AIM Advisers, Inc., Invesco AIM Capital Management, Inc. and Invesco AIM Private Asset Management, Inc.; Assistant Vice President and Assistant Treasurer, The Invesco Funds and Assistant Vice President, Invesco Advisers, Inc., Invesco AIM Capital Management, Inc. and Invesco AIM Private Asset Management, Inc.; and Treasurer, Invesco Exchange-Traded Fund Trust, Invesco Exchange-Traded Fund Trust II, Invesco India Exchange-Traded Fund Trust and Invesco Actively Managed Exchange-Traded Fund Trust | | N/A | | N/A |
Russell C. Burk - 1958 Senior Vice President and Senior Officer | | 2005 | | Senior Vice President and Senior Officer, The Invesco Funds | | N/A | | N/A |
Jeffrey H. Kupor - 1968 Senior Vice President, Chief Legal Officer and Secretary | | 2018 | | Head of Legal of the Americas, Invesco Ltd.; Senior Vice President and Secretary, Invesco Advisers, Inc. (formerly known as Invesco Institutional (N.A.), Inc.) (registered investment adviser); Senior Vice President and Secretary, Invesco Distributors, Inc. (formerly known as Invesco AIM Distributors, Inc.); Vice President and Secretary, Invesco Investment Services, Inc. (formerly known as Invesco AIM Investment Services, Inc.) Senior Vice President, Chief Legal Officer and Secretary, The Invesco Funds; Secretary and General Counsel, Invesco Investment Advisers LLC (formerly known as Van Kampen Asset Management); Secretary and General Counsel, Invesco Capital Markets, Inc. (formerly known as Van Kampen Funds Inc.) and Chief Legal Officer, Invesco Exchange-Traded Fund Trust, Invesco Exchange-Traded Fund Trust II, Invesco India Exchange-Traded Fund Trust, Invesco Actively Managed Exchange-Traded Fund Trust, Invesco Actively Managed Exchange-Traded Commodity Fund Trust and Invesco Exchange-Traded Self-Indexed Fund Trust; Secretary, Invesco Indexing LLC; Secretary, W.L. Ross & Co., LLC Formerly: Secretary and Vice President, Jemstep, Inc.; Head of Legal, Worldwide Institutional, Invesco Ltd.; Secretary and General Counsel, INVESCO Private Capital Investments, Inc.; Senior Vice President, Secretary and General Counsel, Invesco Management Group, Inc. (formerly known as Invesco AIM Management Group, Inc.); Assistant Secretary, INVESCO Asset Management (Bermuda) Ltd.; Secretary and General Counsel, Invesco Private Capital, Inc.; Assistant Secretary and General Counsel, INVESCO Realty, Inc.; Secretary and General Counsel, Invesco Senior Secured Management, Inc.; and Secretary, Sovereign G./P. Holdings Inc. | | N/A | | N/A |
Andrew R. Schlossberg - 1974 Senior Vice President | | 2019 | | Head of the Americas and Senior Managing Director, Invesco Ltd.; Director and Senior Vice President, Invesco Advisers, Inc. (formerly known as Invesco Institutional (N.A.), Inc.) (registered investment adviser); Director and Chairman, Invesco Investment Services, Inc. (formerly known as Invesco AIM Investment Services, Inc.) (registered transfer agent); Senior Vice President, The Invesco Funds; Director, Invesco Investment Advisers LLC (formerly known as Van Kampen Asset Management); Director, President and Chairman, Invesco Insurance Agency, Inc. Formerly: Director, Invesco UK Limited; Director and Chief Executive, Invesco Asset Management Limited and Invesco Fund Managers Limited; Assistant Vice President, The Invesco Funds; Senior Vice President, Invesco Advisers, Inc. (formerly known as Invesco Institutional (N.A.), Inc.) (registered investment adviser); Director and Chief Executive, Invesco Administration Services Limited and Invesco Global Investment Funds Limited; Director, Invesco Distributors, Inc.; Head of EMEA, Invesco Ltd.; President, Invesco Actively Managed Exchange-Traded Commodity Fund Trust, Invesco Actively Managed Exchange-Traded Fund Trust, Invesco Exchange-Traded Fund Trust, Invesco Exchange-Traded Fund Trust II and Invesco India Exchange-Traded Fund Trust; Managing Director and Principal Executive Officer, Invesco Capital Management LLC | | N/A | | N/A |
Invesco V.I. High Yield Fund
Trustees and Officers–(continued)
| | | | | | | | |
Name, Year of Birth and Position(s) Held with the Trust | | Trustee and/or Officer Since | | Principal Occupation(s) During Past 5 Years | | Number of
Funds in
Fund Complex
Overseen by
Trustee | | Other Directorship(s) Held by Trustee
During Past 5 Years |
| Officers–(continued) |
John M. Zerr - 1962 Senior Vice President | | 2006 | | Chief Operating Officer of the Americas; Senior Vice President, Invesco Advisers, Inc. (formerly known as Invesco Institutional (N.A.), Inc.) (registered investment adviser); Senior Vice President, Invesco Distributors, Inc. (formerly known as Invesco AIM Distributors, Inc.); Director and Vice President, Invesco Investment Services, Inc. (formerly known as Invesco AIM Investment Services, Inc.) Senior Vice President, The Invesco Funds; Managing Director, Invesco Capital Management LLC; Director, Invesco Investment Advisers LLC (formerly known as Van Kampen Asset Management); Senior Vice President, Invesco Capital Markets, Inc. (formerly known as Van Kampen Funds Inc.); Manager, Invesco Indexing LLC; Manager, Invesco Specialized Products, LLC; Director and Senior Vice President, Invesco Insurance Agency, Inc.; Member, Invesco Canada Funds Advisory Board; Director, President and Chief Executive Officer, Invesco Corporate Class Inc. (corporate mutual fund company); and Director, Chairman, President and Chief Executive Officer, Invesco Canada Ltd. (formerly known as Invesco Trimark Ltd./Invesco Trimark Ltèe) (registered investment adviser and registered transfer agent) Formerly: Director and Senior Vice President, Invesco Management Group, Inc. (formerly known as Invesco AIM Management Group, Inc.); Secretary and General Counsel, Invesco Management Group, Inc. (formerly known as Invesco AIM Management Group, Inc.); Secretary, Invesco Investment Services, Inc. (formerly known as Invesco AIM Investment Services, Inc.); Chief Legal Officer and Secretary, The Invesco Funds; Secretary and General Counsel, Invesco Investment Advisers LLC (formerly known as Van Kampen Asset Management); Secretary and General Counsel, Invesco Capital Markets, Inc. (formerly known as Van Kampen Funds Inc.); Chief Legal Officer, Invesco Exchange-Traded Fund Trust, Invesco Exchange-Traded Fund Trust II, Invesco India Exchange-Traded Fund Trust, Invesco Actively Managed Exchange-Traded Fund Trust, Invesco Actively Managed Exchange-Traded Commodity Fund Trust and Invesco Exchange-Traded Self-Indexed Fund Trust; Secretary, Invesco Indexing LLC; Director, Secretary, General Counsel and Senior Vice President, Van Kampen Exchange Corp.; Director, Vice President and Secretary, IVZ Distributors, Inc. (formerly known as INVESCO Distributors, Inc.); Director and Vice President, INVESCO Funds Group, Inc.; Director and Vice President, Van Kampen Advisors Inc.; Director, Vice President, Secretary and General Counsel, Van Kampen Investor Services Inc.; Director and Secretary, Invesco Distributors, Inc. (formerly known as Invesco AIM Distributors, Inc.); Director, Senior Vice President, General Counsel and Secretary, Invesco AIM Advisers, Inc. and Van Kampen Investments Inc.; Director, Vice President and Secretary, Fund Management Company; Director, Senior Vice President, Secretary, General Counsel and Vice President, Invesco AIM Capital Management, Inc.; Chief Operating Officer and General Counsel, Liberty Ridge Capital, Inc. (an investment adviser) | | N/A | | N/A |
Gregory G. McGreevey - 1962 Senior Vice President | | 2012 | | Senior Managing Director, Invesco Ltd.; Director, Chairman, President, and Chief Executive Officer, Invesco Advisers, Inc. (formerly known as Invesco Institutional (N.A.), Inc.) (registered investment adviser); Director, Invesco Mortgage Capital, Inc. and Invesco Senior Secured Management, Inc.; and Senior Vice President, The Invesco Funds; and President, SNW Asset Management Corporation Formerly: Senior Vice President, Invesco Management Group, Inc. and Invesco Advisers, Inc.; Assistant Vice President, The Invesco Funds | | N/A | | N/A |
Kelli Gallegos - 1970 Vice President, Principal Financial Officer and Assistant Treasurer | | 2008 | | Principal Financial and Accounting Officer - Investments Pool, Invesco Specialized Products, LLC; Vice President, Principal Financial Officer and Assistant Treasurer, The Invesco Funds; Principal Financial and Accounting Officer - Pooled Investments, Invesco Capital Management LLC; Vice President and Treasurer, Invesco Exchange-Traded Fund Trust, Invesco Exchange-Traded Fund Trust II, Invesco India Exchange-Traded Fund Trust, Invesco Actively Managed Exchange-Traded Fund Trust, Invesco Actively Managed Exchange-Traded Commodity Fund Trust and Invesco Exchange-Traded Self-Indexed Fund Trust Formerly: Assistant Treasurer, Invesco Specialized Products, LLC; Assistant Treasurer, Invesco Exchange-Traded Fund Trust, Invesco Exchange-Traded Fund Trust II, Invesco India Exchange-Traded Fund Trust, Invesco Actively Managed Exchange-Traded Fund Trust, Invesco Actively Managed Exchange-Traded Commodity Fund Trust and Invesco Exchange-Traded Self-Indexed Fund Trust; Assistant Treasurer, Invesco Capital Management LLC; Assistant Vice President, The Invesco Funds | | N/A | | N/A |
Invesco V.I. High Yield Fund
Trustees and Officers–(continued)
| | | | | | | | |
Name, Year of Birth and Position(s) Held with the Trust | | Trustee and/or Officer Since | | Principal Occupation(s) During Past 5 Years | | Number of
Funds in
Fund Complex
Overseen by
Trustee | | Other Directorship(s) Held by Trustee
During Past 5 Years |
| Officers–(continued) |
Crissie M. Wisdom - 1969 Anti-Money Laundering Compliance Officer | | 2013 | | Anti-Money Laundering Compliance Officer, Invesco Advisers, Inc. (formerly known as Invesco Institutional (N.A.), Inc.) (registered investment adviser), Invesco Capital Markets, Inc. (formerly known as Van Kampen Funds Inc.), Invesco Distributors, Inc., Invesco Investment Services, Inc., The Invesco Funds, and Invesco Exchange-Traded Fund Trust, Invesco Exchange-Traded Fund Trust II, Invesco India Exchange-Traded Fund Trust, Invesco Actively Managed Exchange-Traded Fund Trust, Invesco Actively Managed Exchange-Traded Commodity Fund Trust and Invesco Exchange-Traded Self-Indexed Fund Trust; Anti-Money Laundering Compliance Officer and Bank Secrecy Act Officer, INVESCO National Trust Company and Invesco Trust Company; and Fraud Prevention Manager and Controls and Risk Analysis Manager for Invesco Investment Services, Inc. Formerly: Anti-Money Laundering Compliance Officer, Van Kampen Exchange Corp. and Invesco Management Group, Inc. | | N/A | | N/A |
Robert R. Leveille - 1969 Chief Compliance Officer | | 2016 | | Chief Compliance Officer, Invesco Advisers, Inc. (registered investment adviser); and Chief Compliance Officer, The Invesco Funds Formerly: Chief Compliance Officer, Putnam Investments and the Putnam Funds | | N/A | | N/A |
The Statement of Additional Information of the Trust includes additional information about the Fund’s Trustees and is available upon request, without charge, by calling 1.800.959.4246. Please refer to the Fund’s Statement of Additional Information for information on the Fund’ssub-advisers.
| | | | | | |
| Office of the Fund | | Investment Adviser | | Distributor | | Auditors |
| 11 Greenway Plaza, Suite 1000 | | Invesco Advisers, Inc. | | Invesco Distributors, Inc. | | PricewaterhouseCoopers LLP |
| Houston, TX 77046-1173 | | 1555 Peachtree Street, N.E. | | 11 Greenway Plaza, Suite 1000 | | 1000 Louisiana Street, Suite 5800 |
| | Atlanta, GA 30309 | | Houston, TX 77046-1173 | | Houston, TX 77002-5678 |
| | | |
| Counsel to the Fund | | Counsel to the Independent Trustees | | Transfer Agent | | Custodian |
| Stradley Ronon Stevens & Young, LLP | | Goodwin Procter LLP | | Invesco Investment Services, Inc. | | State Street Bank and Trust Company |
| 2005 Market Street, Suite 2600 | | 901 New York Avenue, N.W. | | 11 Greenway Plaza, Suite 1000 | | 225 Franklin Street |
| Philadelphia, PA 19103-7018 | | Washington, D.C. 20001 | | Houston, TX 77046-1173 | | Boston, MA 02110-2801 |
Invesco V.I. High Yield Fund
| | | | |
 | | Annual Report to Shareholders | | December 31, 2019 |
| | Invesco V.I. International Growth Fund |
| | |
| | |

Beginning on January 1, 2021, as permitted by regulations adopted by the Securities and Exchange Commission, the insurance company that offers your variable annuity or variable life insurance contract may no longer send you paper copies of the Fund’s shareholder reports by mail, unless you specifically request paper copies of the reports from the insurance company or your financial intermediary. Instead of delivering paper copies of the report, the insurance company may choose to make the reports available on a website, and will notify you by mail each time a report is posted and provide you with a website link to access the report. Instructions for requesting paper copies will be provided by your insurance company.
If the insurance company offers electronic delivery, you may elect to receive shareholder reports and other communications about the Fund electronically by following the instructions provided by the insurance company or by contacting your financial intermediary. If you already elected to receive shareholder reports electronically, you will not be affected by this change and you need not take any action.
You may elect to receive all future reports in paper free of charge from the insurance company. You can inform the insurance company or your financial intermediary that you wish to continue receiving paper copies of your shareholder reports by following the instructions provided by the insurance company or by contacting your financial intermediary. Your election to receive reports in paper will apply to all portfolio companies available under your contract with the insurance company.
The Fund provides a complete list of its holdings four times in each fiscal year, at the quarter-ends. For the second and fourth quarters, the lists appear in the Fund’s semiannual and annual reports to shareholders. For the first and third quarters, the Fund files the lists with the Securities and Exchange Commission (SEC) as an exhibit to its reports on FormN-PORT. The Fund’s FormN-PORT filings are available on the SEC website, sec.gov. The SEC file numbers for the Fund are811-07452 and033-57340. The Fund’s most recent portfolio holdings, as filed on FormN-PORT, have also been made available to insurance companies issuing variable annuity contracts and variable life insurance policies (“variable products”) that invest in the Fund.
A description of the policies and procedures that the Fund uses to determine how to vote proxies relating to portfolio securities is available without charge, upon request, from our Client Services department at 800 959 4246 or at invesco.com/proxyguidelines. The information is also available on the SEC website, sec.gov.
Information regarding how the Fund voted proxies related to its portfolio securities during the most recent12-month period ended June 30 is available at invesco.com/proxysearch. The information is also available on the SEC website, sec.gov.
Invesco Advisers, Inc. is an investment adviser; it provides investment advisory services to individual and institutional clients and does not sell securities. Invesco Distributors, Inc. is the US distributor for Invesco Ltd.’s retail mutual funds, exchange-traded funds and institutional money market funds. Both are wholly owned, indirect subsidiaries of Invesco Ltd.
This report must be accompanied or preceded by a currently effective Fund prospectus and variable product prospectus, which contain more complete information, including sales charges and expenses. Investors should read each carefully before investing.
NOT FDIC INSURED | MAY LOSE VALUE | NO BANK GUARANTEE
| | |
Invesco Distributors, Inc. | | VIIGR-AR-1 |
Management’s Discussion of Fund Performance
Performance summary
For the year ended December 31, 2019, Series I shares of Invesco V.I. International Growth Fund (the Fund) outperformed the Custom Invesco International Growth Index, the Fund’s style-specific benchmark.
Your Fund’s long-term performance appears later in this report.
Fund vs. Indexes
Total returns, 12/31/18 to 12/31/19, excluding variable product issuer charges. If variable product issuer charges were included, returns would be lower.
| | | | | |
| Series I Shares | | | | 28.57 | % |
| Series II Shares | | | | 28.24 | |
| MSCI All Country Worldex-USA Indexq(Broad Market Index) | | | | 21.51 | |
| Custom Invesco International Growth Index∎(Style-Specific Index) | | | | 27.34 | |
| Lipper VUF InternationalLarge-Cap Growth Funds Index¨(Peer Group Index) | | | | 28.04 | |
| Source(s):qRIMES Technologies Corp.;∎Invesco, RIMES Technologies Corp.;¨Lipper Inc. | |
Market conditions and your Fund
After a relatively calm start at the beginning of 2019, global equity markets faced greater volatility in the second and third quarters, hampered by ongoing US and China trade issues, potential for new tariffs and weakening global economic growth. Disagreement within the UK about its withdrawal from the European Union increased uncertainty for the UK and eurozone economies.
Much of the year showed slowing manufacturing activity and declining business investment, which was evidence that trade tensions were stifling economic growth across both developed and emerging markets. Global recession concerns caused a sharp equitysell-off in August 2019, as investors crowded into asset classes perceived as safe havens, including US Treasuries and gold.
During the year, third quarter macroeconomic and geopolitical issues mostly abated during the fourth quarter, providing a favorable backdrop for global equity returns. In response to third quarter economic weakness, central banks maintained accommodative policies, with the US Federal Reserve cutting interest rates in October 2019 and the European
Central Bank restarting net purchases in its asset purchase program in November. Better economic data and signs of progress in US and China trade talks also supported global equities. The UK’s general election in December delivered a decisive victory to the conservative party, reaffirming the original Brexit vote and the UK’s eventual exit from the European Union. In this environment, global equity markets had robust gains for the year, with developed markets outperforming emerging markets.
Regardless of the macroeconomic environment, we remain focused on ourbottom-up investment approach of identifying attractive companies that fit our earnings, quality and valuation (EQV) process.
During the year, relative outperformance versus the Fund’s style-specific benchmark was primarily driven by strong stock selection in the consumer staples sector. Within the sector, Chinese spirits producersWuliangye YibinandKweichow Moutaicontributed favorably to both absolute and relative results. The companies benefited from the consumption upgrade cycle in China with the popularity of its premium Baiju brands. Denmark-based brewerCarlsbergwas
another notable relative contributor within consumer staples. Stock selection and underweight exposure to the communication services sector contributed to the Fund’s relative performance as well. Within the sector,UK-basedInformawas a key contributor to absolute and relative performance during the year. Geographically, strong stock selection in China added to both absolute and relative returns. Stock selection and underweight exposure to Japan was beneficial as well.
Stock selection in the energy and information technology (IT) sectors were key detractors from the Fund’s relative return compared to its style-specific benchmark for the year. Within energy, Canada-basedPrairieSky RoyaltyandUK-basedTechnipFMCunderperformed and were notable relative detractors during the year. We sold our position in PrairieSky Royalty during the year as falling commodity prices and declining production volumes caused deteriorating earnings. Within the IT sector, lack of exposure to strong performers within the Fund’s style-specific benchmark including ASML and Shopify hampered relative results. Geographically, the portfolio’s holdings in Canada and the Netherlands underperformed those of the style-specific benchmark, detracting from relative return.
Given the rising equity market during the year, the Fund’s cash position detracted from relative results compared to its style-specific benchmark. It is important to note that cash is a residual of ourbottom-up investment process and not the result of anytop-down tactical asset allocation or risk-management allocation decision.
During the year, we looked for opportunities to improve the growth potential and quality of the Fund’s portfolio by adding companies based on our EQV outlook for each company. We added
| | |
Portfolio Composition |
By sector | | % of total net assets |
| | |
| |
| Industrials | | 17.61% |
| Financials | | 17.41 |
| Information Technology | | 16.75 |
| Consumer Staples | | 16.55 |
| Consumer Discretionary | | 12.17 |
| Health Care | | 6.83 |
| Communication Services | | 4.69 |
| Energy | | 2.53 |
| Materials | | 2.24 |
| Money Market Funds Plus Other Assets Less Liabilities | | 3.22 |
| | |
Top 10 Equity Holdings* | | |
| % of total net assets |
| |
1. CGI, Inc., Class A | | 3.90% |
2. SAP SE | | 3.01 |
3. Investor AB, Class B | | 2.82 |
4. Wolters Kluwer N.V. | | 2.73 |
5. Taiwan Semiconductor Manufacturing Co. Ltd., ADR | | 2.65 |
6. Allianz SE | | 2.64 |
7. Philip Morris International, Inc. | | 2.60 |
8. Deutsche Boerse AG | | 2.37 |
9. Samsung Electronics Co. Ltd. | | 2.34 |
10. RELX PLC | | 2.30 |
| | |
Total Net Assets | | $1.5 billion |
| |
Total Number of Holdings* | | 63 |
The Fund’s holdings are subject to change, and there is no assurance that the Fund will continue to hold any particular security.
*Excluding money market fund holdings, if any.
Data presented here are as of December 31, 2019.
Invesco V.I. International Growth Fund
several new holdings, including France-based testing, inspection and certification services companyBureau Veritas,Brazil-based beer and soft drink distributorAmbevand Hong Kong-based life insurance companyAIA Group.We sold several holdings, including China-based consumer staples companyHenan Shuanghui Investment & Development, Australia-based industrials companyBramblesandUK-based consumer staples companyUnilever.After owning consumer products maker Unilever for over a decade, we exited our position in early 2019 driven by concerns about rising valuation levels, higher risks to the business, as well as turnover in management.
As always, regardless of the macroeconomic environment, we remain focused on abottom-up investment approach of identifying attractive companies that fit ourEQV-focused investment process. We continue to look for companies that exhibit the following characteristics: strong organic growth, high returns on capital, pricing power, strong balance sheets, cash generation, and reasonable valuations. In addition, we continue to favor companies that are able to consistently generate cash during weak economic environments. We believe that this balancedEQV-focused approach may help deliver attractive risk-adjusted returns over the long term.
We thank you for your continued investment in Invesco V.I. International Growth Fund.
Portfolio managers:
Brent Bates
Matthew Dennis
Mark Jason
Richard Nield
Clas Olsson
The views and opinions expressed in management’s discussion of Fund performance are those of Invesco Advisers, Inc. These views and opinions are subject to change at any time based on factors such as market and economic conditions. These views and opinions may not be relied upon as investment advice or recommendations, or as an offer for a particular security. The information is not a complete analysis of every aspect of any market, country, industry, security or the Fund. Statements of fact are from sources considered reliable, but Invesco Advisers, Inc. makes no representation or warranty as to their completeness or accuracy. Although historical performance is no guarantee of future results, these insights may help you understand our investment management philosophy.
See important Fund and, if applicable, index disclosures later in this report.
Invesco V.I. International Growth Fund
Your Fund’s Long-Term Performance
Results of a $10,000 Investment – Oldest Share Class(es)
Fund and index data from 12/31/09
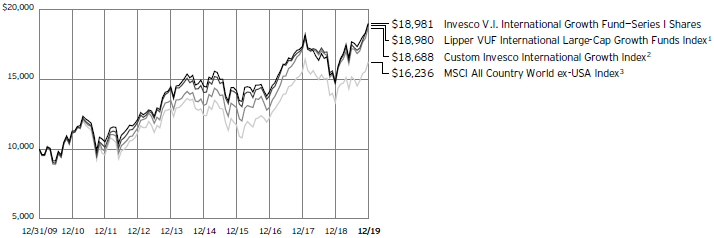
1 Source: Lipper Inc.
2 Source: Invesco, RIMES Technologies Corp.
3 Source: RIMES Technologies Corp.
Past performance cannot guarantee future
results.
| | | | |
Average Annual Total Returns | |
As of 12/31/19 | | | | |
| |
Series I Shares | | | | |
Inception (5/5/93) | | | 7.18 | % |
10 Years | | | 6.62 | |
5 Years | | | 5.50 | |
1 Year | | | 28.57 | |
Series II Shares | | | | |
Inception (9/19/01) | | | 7.34 | % |
10 Years | | | 6.35 | |
5 Years | | | 5.23 | |
1 Year | | | 28.24 | |
The performance of the Fund’s Series I and Series II share classes will differ primarily due to different class expenses.
The performance data quoted represent past performance and cannot guarantee future results; current performance may be lower or higher. Please contact your variable product issuer or financial adviser for the most recentmonth-end variable product performance. Performance figures reflect Fund expenses, reinvested distributions and changes in net asset value. Performance figures do not reflect deduction of taxes a shareholder would pay on Fund distributions or sale of Fund shares. Investment return and principal value will fluctuate so that you may have a gain or loss when you sell shares.
The net annual Fund operating expense ratio set forth in the most recent Fund prospectus as of the date of this report for Series I and Series II shares was 0.93% and 1.18%, respectively.1 The total annual
Fund operating expense ratio set forth in the most recent Fund prospectus as of the date of this report for Series I and Series II shares was 0.94% and 1.19%, respectively. The expense ratios presented above may vary from the expense ratios presented in other sections of this report that are based on expenses incurred during the period covered by this report.
Invesco V.I. International Growth Fund, a series portfolio of AIM Variable Insurance Funds (Invesco Variable Insurance Funds), is currently offered through insurance companies issuing variable products. You cannot purchase shares of the Fund directly. Performance figures given represent the Fund and are not intended to reflect actual variable product values. They do not reflect sales charges, expenses and fees assessed in connection with a variable product. Sales charges, expenses and fees, which are determined by the variable product issuers, will vary and will lower the total return.
The most recentmonth-end performance at the Fund level, excluding variable product charges, is available at 800 451 4246. As mentioned above, for the most recentmonth-end performance including variable product charges, please contact your variable product issuer or financial adviser.
Fund performance reflects any applicable fee waivers and/or expense reimbursements. Had the adviser not waived fees and/or reimbursed expenses currently or in the past, returns would have been lower. See current prospectus for more information.
| 1 | Total annual Fund operating expenses after any contractual fee waivers and/or expense reimbursements by the adviser in effect through at least June 30, 2021. See current prospectus for more information. |
Invesco V.I. International Growth Fund
Invesco V.I. International Growth Fund’s investment objective is long-term growth of capital.
| ∎ | Unless otherwise stated, information presented in this report is as of December 31, 2019, and is based on total net assets. |
| ∎ | Unless otherwise noted, all data provided by Invesco. |
| ∎ | To access your Fund’s reports/prospectus, visit invesco.com/fundreports. |
About indexes used in this report
| ∎ | TheMSCI All Country World ex USA® Indexis an index considered representative of developed and emerging market stock markets, excluding the US. The index is computed using the net return, which withholds applicable taxes for nonresident investors. |
| ∎ | TheCustom Invesco International Growth Indexis composed of the MSCI EAFE Growth Index through February 28, 2013, and the MSCI All Country Worldex-U.S. Growth Index thereafter. |
| ∎ | TheLipper VUF InternationalLarge-Cap Growth Funds Indexis an unmanaged index considered representative of internationallarge-cap growth variable insurance underlying funds tracked by Lipper. |
| ∎ | TheMSCI EAFE® Growth Indexis an unmanaged index considered representative of the growth stocks of Europe, Australasia and the Far East. The index is computed using the net return, which withholds applicable taxes fornon-resident investors. |
| ∎ | TheMSCI All Country Worldex-U.S. Growth Indexis a market capitalization weighted index that includes growth companies in developed and emerging markets, excluding the US. The index is computed using the net return, which withholds applicable taxes fornon-resident investors. |
| ∎ | The Fund is not managed to track the performance of any particular index, including the index(es) described here, and consequently, the performance of the Fund may deviate significantly from the performance of the index(es). |
| ∎ | A direct investment cannot be made in an index. Unless otherwise indicated, index results include reinvested dividends, and they do not reflect sales charges. Performance of the peer group, if applicable, reflects fund expenses; performance of a market index does not. |
Other information
| ∎ | The returns shown in management’s discussion of Fund performance are based on net asset values calculated for shareholder transactions. Generally accepted accounting principles |
| | require adjustments to be made to the net assets of the Fund at period end for financial reporting purposes, and as such, the net asset values for shareholder transactions and the returns based on those net asset values may differ from the net asset values and returns reported in the Financial Highlights. Additionally, the returns and net asset values shown throughout this report are at the Fund level only and do not include variable product issuer charges. If such charges were included, the total returns would be lower. |
| ∎ | Industry classifications used in this report are generally according to the Global Industry Classification Standard, which was developed by and is the exclusive property and a service mark of MSCI Inc. and Standard & Poor’s. |
Invesco V.I. International Growth Fund
Schedule of Investments
December 31, 2019
| | | | | | |
| | | Shares | | | Value |
|
Common Stocks & Other Equity Interests–96.78% |
| | |
Australia–0.76% | | | | | | |
CSL Ltd. | | | 57,302 | | | $ 11,120,663 |
| | |
Brazil–3.71% | | | | | | |
| | |
Ambev S.A., ADR | | | 4,491,636 | | | 20,931,024 |
B3 S.A. - Brasil Bolsa Balcao | | | 1,678,734 | | | 17,938,616 |
Banco Bradesco S.A., ADR | | | 1,757,928 | | | 15,733,456 |
| | | | | | | 54,603,096 |
| | |
Canada–7.86% | | | | | | |
| | |
Canadian National Railway Co. | | | 296,817 | | | 26,850,790 |
CGI, Inc., Class A(a) | | | 685,973 | | | 57,406,096 |
Nutrien Ltd. | | | 265,006 | | | 12,687,554 |
Suncor Energy, Inc. | | | 574,525 | | | 18,830,067 |
| | | | | | | 115,774,507 |
| | |
China–7.16% | | | | | | |
| | |
Alibaba Group Holding Ltd.,
ADR(a) | | | 154,102 | | | 32,685,034 |
Kweichow Moutai Co. Ltd., A Shares | | | 71,413 | | | 12,141,518 |
New Oriental Education & Technology Group, Inc., ADR(a) | | | 130,804 | | | 15,859,985 |
Wuliangye Yibin Co. Ltd., A Shares | | | 929,497 | | | 17,751,526 |
Yum China Holdings, Inc. | | | 562,849 | | | 27,022,380 |
| | | | | | | 105,460,443 |
| | |
Denmark–1.59% | | | | | | |
| | |
Carlsberg A/S, Class B | | | 156,524 | | | 23,349,599 |
| | |
France–9.87% | | | | | | |
| | |
Bureau Veritas S.A. | | | 1,094,365 | | | 28,596,651 |
EssilorLuxottica S.A. | | | 108,839 | | | 16,625,988 |
Pernod Ricard S.A. | | | 90,095 | | | 16,127,499 |
Schneider Electric SE | | | 289,919 | | | 29,823,422 |
Vinci S.A. | | | 278,771 | | | 30,970,170 |
Vivendi S.A. | | | 796,082 | | | 23,074,505 |
| | | | | | | 145,218,235 |
| | |
Germany–8.63% | | | | | | |
| | |
Allianz SE | | | 158,718 | | | 38,919,364 |
Beiersdorf AG | | | 74,761 | | | 8,945,771 |
Deutsche Boerse AG | | | 221,893 | | | 34,896,710 |
SAP SE | | | 328,270 | | | 44,240,885 |
| | | | | | | 127,002,730 |
| | |
Hong Kong–1.17% | | | | | | |
| | |
AIA Group Ltd. | | | 1,637,800 | | | 17,232,367 |
| | |
Ireland–1.13% | | | | | | |
| | |
ICON PLC(a) | | | 96,780 | | | 16,668,419 |
| | |
Italy–2.38% | | | | | | |
| | |
FinecoBank Banca Fineco S.p.A. | | | 1,898,302 | | | 22,785,703 |
| | | | | | |
| | | Shares | | | Value |
| | |
Italy–(continued) | | | | | | |
| | |
Mediobanca Banca di Credito Finanziario S.p.A. | | | 1,105,547 | | | $ 12,177,553 |
| | | | | | | 34,963,256 |
| | |
Japan–9.85% | | | | | | |
| | |
Asahi Group Holdings Ltd. | | | 601,900 | | | 27,494,608 |
FANUC Corp. | | | 67,400 | | | 12,447,984 |
Hoya Corp. | | | 324,200 | | | 30,954,660 |
Kao Corp. | | | 166,200 | | | 13,707,840 |
Keyence Corp. | | | 51,400 | | | 18,193,194 |
Koito Manufacturing Co. Ltd. | | | 270,800 | | | 12,533,515 |
Komatsu Ltd. | | | 507,700 | | | 12,172,295 |
SMC Corp. | | | 38,200 | | | 17,461,539 |
| | | | | | | 144,965,635 |
| | |
Macau–1.82% | | | | | | |
| | |
Galaxy Entertainment Group Ltd. | | | 3,639,000 | | | 26,822,362 |
| | |
Mexico–1.37% | | | | | | |
| | |
Fomento Economico Mexicano S.A.B. de C.V., ADR | | | 212,813 | | | 20,112,957 |
| | |
Netherlands–4.14% | | | | | | |
ING Groep N.V. | | | 1,725,688 | | | 20,739,390 |
Wolters Kluwer N.V. | | | 550,758 | | | 40,256,645 |
| | | | | | | 60,996,035 |
| | |
Singapore–1.51% | | | | | | |
| | |
United Overseas Bank Ltd. | | | 1,128,366 | | | 22,194,866 |
| | |
South Korea–3.48% | | | | | | |
NAVER Corp.(a) | | | 104,209 | | | 16,787,355 |
Samsung Electronics Co. Ltd. | | | 715,957 | | | 34,497,911 |
| | | | | | | 51,285,266 |
| | |
Spain–1.60% | | | | | | |
Amadeus IT Group S.A. | | | 288,008 | | | 23,598,462 |
| | |
Sweden–2.82% | | | | | | |
| | |
Investor AB, Class B | | | 759,317 | | | 41,486,452 |
| | |
Switzerland–6.17% | | | | | | |
Alcon, Inc.(a) | | | 237,980 | | | 13,481,498 |
Cie Financiere Richemont S.A. | | | 150,589 | | | 11,820,858 |
Julius Baer Group Ltd.(a) | | | 234,815 | | | 12,126,862 |
Kuehne + Nagel International AG | | | 148,591 | | | 25,047,562 |
Novartis AG | | | 299,214 | | | 28,348,242 |
| | | | | | | 90,825,022 |
| | |
Taiwan–2.65% | | | | | | |
| | |
Taiwan Semiconductor Manufacturing Co. Ltd., ADR | | | 670,183 | | | 38,937,632 |
See accompanying Notes to Financial Statements which are an integral part of the financial statements.
Invesco V.I. International Growth Fund
| | | | | | |
| | | Shares | | | Value |
| | |
United Kingdom–9.80% | | | | | | |
| | |
British American Tobacco PLC | | | 602,786 | | | $ 25,681,836 |
Compass Group PLC | | | 654,772 | | | 16,402,601 |
Informa PLC | | | 2,565,697 | | | 29,165,172 |
Melrose Industries PLC | | | 544,296 | | | 1,739,768 |
Reckitt Benckiser Group PLC | | | 234,399 | | | 19,034,603 |
RELX PLC | | | 1,341,186 | | | 33,834,333 |
TechnipFMC PLC | | | 869,204 | | | 18,465,674 |
| | | | | | | 144,323,987 |
| | |
United States–7.31% | | | | | | |
| | |
Amcor PLC, CDI | | | 1,854,087 | | | 20,317,649 |
Booking Holdings, Inc.(a) | | | 9,437 | | | 19,381,050 |
Broadcom, Inc. | | | 93,917 | | | 29,679,650 |
Philip Morris International, Inc. | | | 449,584 | | | 38,255,103 |
| | | | | | | 107,633,452 |
Total Common Stocks & Other Equity Interests
(Cost $944,085,433) | | | 1,424,575,443 |
| | | | | | |
| | | Shares | | | Value |
| | |
Money Market Funds–2.77% | | | | | | |
| | |
Invesco Government & Agency Portfolio, Institutional Class, 1.50%(b) | | | 14,279,963 | | | $ 14,279,963 |
Invesco Liquid Assets Portfolio, Institutional Class, 1.71%(b) | | | 10,200,528 | | | 10,203,588 |
Invesco Treasury Portfolio, Institutional Class, 1.49%(b) | | | 16,319,957 | | | 16,319,957 |
Total Money Market Funds
(Cost $40,801,515) | | | 40,803,508 |
TOTAL INVESTMENTS IN
SECURITIES–99.55%
(Cost $984,886,948) | | | 1,465,378,951 |
OTHER ASSETS LESS LIABILITIES–0.45% | | | 6,653,763 |
NET ASSETS–100.00% | | | $1,472,032,714 |
Investment Abbreviations:
ADR – American Depositary Receipt
CDI – CREST Depository Interest
Notes to Schedule of Investments:
| (a) | Non-income producing security. |
| (b) | The money market fund and the Fund are affiliated by having the same investment adviser. The rate shown is the7-day SEC standardized yield as of December 31, 2019. |
See accompanying Notes to Financial Statements which are an integral part of the financial statements.
Invesco V.I. International Growth Fund
Statement of Assets and Liabilities
December 31, 2019
| | |
Assets: | | |
Investments in securities, at value (Cost $944,085,433) | | $1,424,575,443 |
Investments in affiliated money market funds, at value (Cost $40,801,515) | | 40,803,508 |
Foreign currencies, at value (Cost $804,052) | | 808,683 |
Receivable for: | | |
Investments sold | | 3,847,468 |
Fund shares sold | | 780,907 |
Dividends | | 4,370,464 |
Investment for trustee deferred compensation and retirement plans | | 271,007 |
Total assets | | 1,475,457,480 |
| |
Liabilities: | | |
| |
Payable for: | | |
Investments purchased | | 707,147 |
Fund shares reacquired | | 558,143 |
Amount due custodian | | 613,073 |
Accrued fees to affiliates | | 1,193,336 |
Accrued trustees’ and officers’ fees and benefits | | 4,167 |
Accrued other operating expenses | | 53,693 |
Trustee deferred compensation and retirement plans | | 295,207 |
Total liabilities | | 3,424,766 |
Net assets applicable to shares outstanding | | $1,472,032,714 |
| |
Net assets consist of: | | |
| |
Shares of beneficial interest | | $963,320,855 |
Distributable earnings | | 508,711,859 |
| | | $1,472,032,714 |
| |
Net Assets: | | |
| |
Series I | | $ 466,400,776 |
Series II | | $1,005,631,938 |
| |
Shares outstanding, no par value, with an unlimited number of shares authorized: | | |
| |
Series I | | 11,942,228 |
Series II | | 26,130,889 |
Series I: | | |
Net asset value per share | | $ 39.05 |
Series II: | | |
Net asset value per share | | $ 38.48 |
Statement of Operations
For the year ended December 31, 2019
| | | | |
Investment income: | | | | |
| |
Dividends (net of foreign withholding taxes of $3,407,783) | | $ | 33,365,751 | |
| |
Dividends from affiliated money market funds | | | 1,198,441 | |
| |
Total investment income | | | 34,564,192 | |
| |
| |
Expenses: | | | | |
| |
Advisory fees | | | 10,096,407 | |
| |
Administrative services fees | | | 2,323,954 | |
| |
Custodian fees | | | 110,269 | |
| |
Distribution fees - Series II | | | 2,426,952 | |
| |
Transfer agent fees | | | 85,195 | |
| |
Trustees’ and officers’ fees and benefits | | | 41,285 | |
| |
Reports to shareholders | | | 7,881 | |
| |
Professional services fees | | | 57,252 | |
| |
Other | | | 17,741 | |
| |
Total expenses | | | 15,166,936 | |
| |
Less: Fees waived | | | (63,247 | ) |
| |
Net expenses | | | 15,103,689 | |
| |
Net investment income | | | 19,460,503 | |
| |
| |
Realized and unrealized gain (loss) from: | | | | |
| |
Net realized gain (loss) from: | | | | |
Investment securities | | | 36,687,689 | |
| |
Foreign currencies | | | (201,463 | ) |
| |
| | | 36,486,226 | |
| |
Change in net unrealized appreciation of: | | | | |
Investment securities (net of foreign taxes of $24,371) | | | 292,272,666 | |
| |
Foreign currencies | | | 17,319 | |
| |
| | | 292,289,985 | |
| |
Net realized and unrealized gain | | | 328,776,211 | |
| |
Net increase in net assets resulting from operations | | $ | 348,236,714 | |
| |
See accompanying Notes to Financial Statements which are an integral part of the financial statements.
Invesco V.I. International Growth Fund
Statement of Changes in Net Assets
For the years ended December 31, 2019 and 2018
| | | | | | | | |
| | | 2019 | | | 2018 | |
| |
Operations: | | | | | | | | |
Net investment income | | $ | 19,460,503 | | | $ | 27,428,724 | |
| |
Net realized gain | | | 36,486,226 | | | | 141,516,648 | |
| |
Change in net unrealized appreciation (depreciation) | | | 292,289,985 | | | | (430,688,387 | ) |
| |
Net increase (decrease) in net assets resulting from operations | | | 348,236,714 | | | | (261,743,015 | ) |
| |
| | |
Distributions to shareholders from distributable earnings: | | | | | | | | |
Series I | | | (35,398,141 | ) | | | (14,207,500 | ) |
| |
Series II | | | (74,537,058 | ) | | | (29,812,608 | ) |
| |
Total distributions from distributable earnings | | | (109,935,199 | ) | | | (44,020,108 | ) |
| |
| | |
Share transactions–net: | | | | | | | | |
Series I | | | (25,039,724 | ) | | | (118,679,986 | ) |
| |
Series II | | | (18,732,098 | ) | | | (374,671,558 | ) |
| |
Net increase (decrease) in net assets resulting from share transactions | | | (43,771,822 | ) | | | (493,351,544 | ) |
| |
Net increase (decrease) in net assets | | | 194,529,693 | | | | (799,114,667 | ) |
| |
| | |
Net assets: | | | | | | | | |
Beginning of year | | | 1,277,503,021 | | | | 2,076,617,688 | |
| |
End of year | | $ | 1,472,032,714 | | | $ | 1,277,503,021 | |
| |
See accompanying Notes to Financial Statements which are an integral part of the financial statements.
Invesco V.I. International Growth Fund
Financial Highlights
The following schedule presents financial highlights for a share of the Fund outstanding throughout the periods indicated.
| | | | | | | | | | | | | | | | | | | | | | | | | | | | | | | | | | | | | | | | | | | | | | | | | | | | | | | | | | | | | | | | | | | | | | |
| | | | | | | | | | | | | | | | | | | | | | | Ratio of | | Ratio of | | | | |
| | | | | | | | | | | | | | | | | | | | | | | expenses | | expenses | | | | |
| | | | | | | Net gains | | | | | | | | | | | | | | | | to average | | to average net | | | | |
| | | | | | | (losses) | | | | | | | | | | | | | | | | net assets | | assets without | | Ratio of net | | |
| | | Net asset | | | | on securities | | | | Dividends | | Distributions | | | | | | | | | | with fee waivers | | fee waivers | | investment | | |
| | | value, | | Net | | (both | | Total from | | from net | | from net | | | | Net asset | | | | Net assets, | | and/or | | and/or | | income | | |
| | | beginning | | investment | | realized and | | investment | | investment | | realized | | Total | | value, end | | Total | | end of period | | expenses | | expenses | | to average | | Portfolio |
| | | of period | | income(a) | | unrealized) | | operations | | income | | gains | | distributions | | of period | | return (b) | | (000’s omitted) | | absorbed | | absorbed | | net assets | | turnover (c) |
Series I | | | | | | | | | | | | | | | | | | | | | | | | | | | | | | | | | | | | | | | | | | | | | | | | | | | | | | | | | | | | | | | | | | | | | | |
Year ended 12/31/19 | | | $ | 32.98 | | | | $ | 0.58 | | | | $ | 8.60 | | | | $ | 9.18 | | | | $ | (0.62 | ) | | | $ | (2.49 | ) | | | $ | (3.11 | ) | | | $ | 39.05 | | | | | 28.54 | % | | | $ | 466,401 | | | | | 0.89 | %(d) | | | | 0.89 | %(d) | | | | 1.54 | %(d) | | | | 31 | % |
Year ended 12/31/18 | | | | 39.89 | | | | | 0.66 | | | | | (6.51 | ) | | | | (5.85 | ) | | | | (0.79 | ) | | | | (0.27 | ) | | | | (1.06 | ) | | | | 32.98 | | | | | (14.97 | ) | | | | 414,774 | | | | | 0.92 | | | | | 0.93 | | | | | 1.74 | | | | | 35 | |
Year ended 12/31/17 | | | | 32.89 | | | | | 0.49 | | | | | 7.06 | | | | | 7.55 | | | | | (0.55 | ) | | | | — | | | | | (0.55 | ) | | | | 39.89 | | | | | 23.00 | | | | | 627,894 | | | | | 0.92 | | | | | 0.93 | | | | | 1.34 | | | | | 34 | |
Year ended 12/31/16 | | | | 33.49 | | | | | 0.50 | | | | | (0.63 | ) | | | | (0.13 | ) | | | | (0.47 | ) | | | | — | | | | | (0.47 | ) | | | | 32.89 | | | | | (0.45 | ) | | | | 540,460 | | | | | 0.95 | | | | | 0.96 | | | | | 1.51 | | | | | 18 | |
Year ended 12/31/15 | | | | 34.87 | | | | | 0.48 | | | | | (1.33 | ) | | | | (0.85 | ) | | | | (0.53 | ) | | | | — | | | | | (0.53 | ) | | | | 33.49 | | | | | (2.34 | ) | | | | 601,760 | | | | | 1.00 | | | | | 1.01 | | | | | 1.35 | | | | | 22 | |
Series II | | | | | | | | | | | | | | | | | | | | | | | | | | | | | | | | | | | | | | | | | | | | | | | | | | | | | | | | | | | | | | | | | | | | | | |
Year ended 12/31/19 | | | | 32.52 | | | | | 0.48 | | | | | 8.47 | | | | | 8.95 | | | | | (0.50 | ) | | | | (2.49 | ) | | | | (2.99 | ) | | | | 38.48 | | | | | 28.20 | | | | | 1,005,632 | | | | | 1.14 | (d) | | | | 1.14 | (d) | | | | 1.29 | (d) | | | | 31 | |
Year ended 12/31/18 | | | | 39.33 | | | | | 0.56 | | | | | (6.42 | ) | | | | (5.86 | ) | | | | (0.68 | ) | | | | (0.27 | ) | | | | (0.95 | ) | | | | 32.52 | | | | | (15.18 | ) | | | | 862,729 | | | | | 1.17 | | | | | 1.18 | | | | | 1.49 | | | | | 35 | |
Year ended 12/31/17 | | | | 32.44 | | | | | 0.40 | | | | | 6.96 | | | | | 7.36 | | | | | (0.47 | ) | | | | — | | | | | (0.47 | ) | | | | 39.33 | | | | | 22.73 | | | | | 1,448,723 | | | | | 1.17 | | | | | 1.18 | | | | | 1.09 | | | | | 34 | |
Year ended 12/31/16 | | | | 33.04 | | | | | 0.41 | | | | | (0.62 | ) | | | | (0.21 | ) | | | | (0.39 | ) | | | | — | | | | | (0.39 | ) | | | | 32.44 | | | | | (0.70 | ) | | | | 1,167,820 | | | | | 1.20 | | | | | 1.21 | | | | | 1.26 | | | | | 18 | |
Year ended 12/31/15 | | | | 34.42 | | | | | 0.38 | | | | | (1.31 | ) | | | | (0.93 | ) | | | | (0.45 | ) | | | | — | | | | | (0.45 | ) | | | | 33.04 | | | | | (2.61 | ) | | | | 1,169,823 | | | | | 1.25 | | | | | 1.26 | | | | | 1.10 | | | | | 22 | |
| (a) | Calculated using average shares outstanding. |
| (b) | Includes adjustments in accordance with accounting principles generally accepted in the United States of America and as such, the net asset value for financial reporting purposes and the returns based upon those net asset values may differ from the net asset value and returns for shareholder transactions. Total returns are not annualized for periods less than one year, if applicable, and do not reflect charges assessed in connection with a variable product, which if included would reduce total returns. |
| (c) | Portfolio turnover is calculated at the fund level and is not annualized for periods less than one year, if applicable. |
| (d) | Ratios are based on average daily net assets (000’s omitted) of $453,636 and $970,851 for Series I and Series II shares, respectively. |
See accompanying Notes to Financial Statements which are an integral part of the financial statements.
Invesco V.I. International Growth Fund
Notes to Financial Statements
December 31, 2019
NOTE 1–Significant Accounting Policies
Invesco V.I. International Growth Fund (the “Fund”) is a series portfolio of AIM Variable Insurance Funds (Invesco Variable Insurance Funds) (the “Trust”). The Trust is a Delaware statutory trust registered under the Investment Company Act of 1940, as amended (the “1940 Act”), as anopen-end series management investment company. Information presented in these financial statements pertains only to the Fund. Matters affecting the Fund or each class will be voted on exclusively by the shareholders of the Fund or each class. Current Securities and Exchange Commission (“SEC”) guidance, however, requires participating insurance companies offering separate accounts to vote shares proportionally in accordance with the instructions of the contract owners whose investments are funded by shares of each Fund or class.
The Fund’s investment objective is long-term growth of capital.
The Fund currently offers two classes of shares, Series I and Series II, both of which are offered to insurance company separate accounts funding variable annuity contracts and variable life insurance policies (“variable products”).
The Fund is an investment company and accordingly follows the investment company accounting and reporting guidance in accordance with Financial Accounting Standards Board Accounting Standards Codification Topic 946,Financial Services - Investment Companies.
The following is a summary of the significant accounting policies followed by the Fund in the preparation of its financial statements.
| A. | Security Valuations– Securities, including restricted securities, are valued according to the following policy. |
A security listed or traded on an exchange (except convertible securities) is valued at its last sales price or official closing price as of the close of the customary trading session on the exchange where the security is principally traded, or lacking any sales or official closing price on a particular day, the security may be valued at the closing bid price on that day. Securities traded in theover-the-counter market are valued based on prices furnished by independent pricing services or market makers. When such securities are valued by an independent pricing service they may be considered fair valued. Futures contracts are valued at the final settlement price set by an exchange on which they are principally traded. Listed options are valued at the mean between the last bid and asked prices from the exchange on which they are principally traded. Options not listed on an exchange are valued by an independent source at the mean between the last bid and asked prices. For purposes of determining net asset value (“NAV”) per share, futures and option contracts generally are valued 15 minutes after the close of the customary trading session of the New York Stock Exchange (“NYSE”).
Investments inopen-end andclosed-end registered investment companies that do not trade on an exchange are valued at theend-of-day net asset value per share. Investments inopen-end andclosed-end registered investment companies that trade on an exchange are valued at the last sales price or official closing price as of the close of the customary trading session on the exchange where the security is principally traded.
Debt obligations (including convertible securities) and unlisted equities are fair valued using an evaluated quote provided by an independent pricing service. Evaluated quotes provided by the pricing service may be determined without exclusive reliance on quoted prices, and may reflect appropriate factors such asinstitution-size trading in similar groups of securities, developments related to specific securities, dividend rate (for unlisted equities), yield (for debt obligations), quality, type of issue, coupon rate (for debt obligations), maturity (for debt obligations), individual trading characteristics and other market data. Pricing services generally value debt obligations assuming orderly transactions of institutional round lot size, but a fund may hold or transact in the same securities in smaller, odd lot sizes. Odd lots often trade at lower prices than institutional round lots. Debt obligations are subject to interest rate and credit risks. In addition, all debt obligations involve some risk of default with respect to interest and/or principal payments.
Foreign securities’ (including foreign exchange contracts) prices are converted into U.S. dollar amounts using the applicable exchange rates as of the close of the NYSE. If market quotations are available and reliable for foreign exchange-traded equity securities, the securities will be valued at the market quotations. Because trading hours for certain foreign securities end before the close of the NYSE, closing market quotations may become unreliable. If between the time trading ends on a particular security and the close of the customary trading session on the NYSE, events occur that the investment adviser determines are significant and make the closing price unreliable, the Fund may fair value the security. If the event is likely to have affected the closing price of the security, the security will be valued at fair value in good faith using procedures approved by the Board of Trustees. Adjustments to closing prices to reflect fair value may also be based on a screening process of an independent pricing service to indicate the degree of certainty, based on historical data, that the closing price in the principal market where a foreign security trades is not the current value as of the close of the NYSE. Foreign securities’ prices meeting the approved degree of certainty that the price is not reflective of current value will be priced at the indication of fair value from the independent pricing service. Multiple factors may be considered by the independent pricing service in determining adjustments to reflect fair value and may include information relating to sector indices, American Depositary Receipts and domestic and foreign index futures. Foreign securities may have additional risks including exchange rate changes, potential for sharply devalued currencies and high inflation, political and economic upheaval, the relative lack of issuer information, relatively low market liquidity and the potential lack of strict financial and accounting controls and standards.
Securities for which market prices are not provided by any of the above methods may be valued based upon quotes furnished by independent sources. The last bid price may be used to value equity securities. The mean between the last bid and asked prices is used to value debt obligations, including corporate loans.
Securities for which market quotations are not readily available or became unreliable are valued at fair value as determined in good faith by or under the supervision of the Trust’s officers following procedures approved by the Board of Trustees. Issuer specific events, market trends, bid/asked quotes of brokers and information providers and other market data may be reviewed in the course of making a good faith determination of a security’s fair value.
The Fund may invest in securities that are subject to interest rate risk, meaning the risk that the prices will generally fall as interest rates rise and, conversely, the prices will generally rise as interest rates fall. Specific securities differ in their sensitivity to changes in interest rates depending on their individual characteristics. Changes in interest rates may result in increased market volatility, which may affect the value and/or liquidity of certain Fund investments.
Invesco V.I. International Growth Fund
Valuations change in response to many factors including the historical and prospective earnings of the issuer, the value of the issuer’s assets, general economic conditions, interest rates, investor perceptions and market liquidity. Because of the inherent uncertainties of valuation, the values reflected in the financial statements may materially differ from the value received upon actual sale of those investments.
| B. | Securities Transactions and Investment Income– Securities transactions are accounted for on a trade date basis. Realized gains or losses on sales are computed on the basis of specific identification of the securities sold. Interest income (net of withholding tax, if any) is recorded on the accrual basis from settlement date. Dividend income (net of withholding tax, if any) is recorded on theex-dividend date. |
The Fund may periodically participate in litigation related to Fund investments. As such, the Fund may receive proceeds from litigation settlements. Any proceeds received are included in the Statement of Operations as realized gain (loss) for investments no longer held and as unrealized gain (loss) for investments still held.
Brokerage commissions and mark ups are considered transaction costs and are recorded as an increase to the cost basis of securities purchased and/or a reduction of proceeds on a sale of securities. Such transaction costs are included in the determination of net realized and unrealized gain (loss) from investment securities reported in the Statement of Operations and the Statement of Changes in Net Assets and the net realized and unrealized gains (losses) on securities per share in the Financial Highlights. Transaction costs are included in the calculation of the Fund’s net asset value and, accordingly, they reduce the Fund’s total returns. These transaction costs are not considered operating expenses and are not reflected in net investment income reported in the Statement of Operations and the Statement of Changes in Net Assets, or the net investment income per share and the ratios of expenses and net investment income reported in the Financial Highlights, nor are they limited by any expense limitation arrangements between the Fund and the investment adviser.
The Fund allocates income and realized and unrealized capital gains and losses to a class based on the relative net assets of each class.
| C. | Country Determination – For the purposes of making investment selection decisions and presentation in the Schedule of Investments, the investment adviser may determine the country in which an issuer is located and/or credit risk exposure based on various factors. These factors include the laws of the country under which the issuer is organized, where the issuer maintains a principal office, the country in which the issuer derives 50% or more of its total revenues and the country that has the primary market for the issuer’s securities, as well as other criteria. Among the other criteria that may be evaluated for making this determination are the country in which the issuer maintains 50% or more of its assets, the type of security, financial guarantees and enhancements, the nature of the collateral and the sponsor organization. Country of issuer and/or credit risk exposure has been determined to be the United States of America, unless otherwise noted. |
| D. | Distributions– Distributions from net investment income and net realized capital gain, if any, are generally declared and paid to separate accounts of participating insurance companies annually and recorded on theex-dividend date. |
| E. | Federal Income Taxes–The Fund intends to comply with the requirements of Subchapter M of the Internal Revenue Code of 1986, as amended (the “Internal Revenue Code”), necessary to qualify as a regulated investment company and to distribute substantially all of the Fund’s taxable earnings to shareholders. As such, the Fund will not be subject to federal income taxes on otherwise taxable income (including net realized capital gain) that is distributed to shareholders. Therefore, no provision for federal income taxes is recorded in the financial statements. |
The Fund recognizes the tax benefits of uncertain tax positions only when the position is more likely than not to be sustained. Management has analyzed the Fund’s uncertain tax positions and concluded that no liability for unrecognized tax benefits should be recorded related to uncertain tax positions. Management is not aware of any tax positions for which it is reasonably possible that the total amounts of unrecognized tax benefits will change materially in the next 12 months.
The Fund files tax returns in the U.S. Federal jurisdiction and certain other jurisdictions. Generally, the Fund is subject to examinations by such taxing authorities for up to three years after the filing of the return for the tax period.
| F. | Expenses– Fees provided for under the Rule12b-1 plan of a particular class of the Fund and which are directly attributable to that class are charged to the operations of such class. All other expenses are allocated among the classes based on relative net assets. |
| G. | Accounting Estimates–The preparation of financial statements in conformity with accounting principles generally accepted in the United States of America (“GAAP”) requires management to make estimates and assumptions that affect the reported amounts of assets and liabilities at the date of the financial statements and the reported amounts of revenues and expenses during the reporting period including estimates and assumptions related to taxation. Actual results could differ from those estimates by a significant amount. In addition, the Fund monitors for material events or transactions that may occur or become known after theperiod-end date and before the date the financial statements are released to print. |
| H. | Indemnifications– Under the Trust’s organizational documents, each Trustee, officer, employee or other agent of the Trust is indemnified against certain liabilities that may arise out of the performance of their duties to the Fund. Additionally, in the normal course of business, the Fund enters into contracts, including the Fund’s servicing agreements, that contain a variety of indemnification clauses. The Fund’s maximum exposure under these arrangements is unknown as this would involve future claims that may be made against the Fund that have not yet occurred. The risk of material loss as a result of such indemnification claims is considered remote. |
| I. | Foreign Currency Translations– Foreign currency is valued at the close of the NYSE based on quotations posted by banks and major currency dealers. Portfolio securities and other assets and liabilities denominated in foreign currencies are translated into U.S. dollar amounts at the date of valuation. Purchases and sales of portfolio securities (net of foreign taxes withheld on disposition) and income items denominated in foreign currencies are translated into U.S. dollar amounts on the respective dates of such transactions. The Fund does not separately account for the portion of the results of operations resulting from changes in foreign exchange rates on investments and the fluctuations arising from changes in market prices of securities held. The combined results of changes in foreign exchange rates and the fluctuation of market prices on investments (net of estimated foreign tax withholding) are included with the net realized and unrealized gain or loss from investments in the Statement of Operations. Reported net realized foreign currency gains or losses arise from (1) sales of foreign currencies, (2) currency gains or losses realized between the trade and settlement dates on securities transactions, and (3) the difference between the amounts of dividends, interest, and foreign withholding taxes recorded on the Fund’s books and the U.S. dollar equivalent of the amounts actually received or paid. Net unrealized foreign currency gains and losses arise from changes in the fair values of assets and liabilities, other than investments in securities at fiscal period end, resulting from changes in exchange rates. |
The Fund may invest in foreign securities, which may be subject to foreign taxes on income, gains on investments or currency repatriation, a portion of which may be recoverable. Foreign taxes, if any, are recorded based on the tax regulations and rates that exist in the foreign markets in which the Fund invests and are shown in the Statement of Operations.
Invesco V.I. International Growth Fund
| J. | Forward Foreign Currency Contracts– The Fund may engage in foreign currency transactions either on a spot (i.e. for prompt delivery and settlement) basis, or through forward foreign currency contracts, to manage or minimize currency or exchange rate risk. |
The Fund may also enter into forward foreign currency contracts for the purchase or sale of a security denominated in a foreign currency in order to “lock in” the U.S. dollar price of that security, or the Fund may also enter into forward foreign currency contracts that do not provide for physical settlement of the two currencies, but instead are settled by a single cash payment calculated as the difference between the agreed upon exchange rate and the spot rate at settlement based upon an agreed upon notional amount(non-deliverable forwards). The Fund will set aside liquid assets in an amount equal to the dailymark-to-market obligation for forward foreign currency contracts.
A forward foreign currency contract is an obligation between two parties (“Counterparties”) to purchase or sell a specific currency for an agreed-upon price at a future date. The use of forward foreign currency contracts does not eliminate fluctuations in the price of the underlying securities the Fund owns or intends to acquire but establishes a rate of exchange in advance. Fluctuations in the value of these contracts are measured by the difference in the contract date and reporting date exchange rates and are recorded as unrealized appreciation (depreciation) until the contracts are closed. When the contracts are closed, realized gains (losses) are recorded. Realized and unrealized gains (losses) on the contracts are included in the Statement of Operations. The primary risks associated with forward foreign currency contracts include failure of the Counterparty to meet the terms of the contract and the value of the foreign currency changing unfavorably. These risks may be in excess of the amounts reflected in the Statement of Assets and Liabilities.
NOTE 2–Advisory Fees and Other Fees Paid to Affiliates
The Trust has entered into a master investment advisory agreement with Invesco Advisers, Inc. (the “Adviser” or “Invesco”). Under the terms of the investment advisory agreement, the Fund accrues daily and pays monthly an advisory fee to the Adviser based on the annual rate of the Fund’s average daily net assets as follows:
| | | | |
| Average Daily Net Assets | | Rate | |
| |
First $250 million | | | 0.750% | |
| |
Over $250 million | | | 0.700% | |
| |
For the year ended December 31, 2019, the effective advisory fee rate incurred by the Fund was 0.71%.
Under the terms of a mastersub-advisory agreement between the Adviser and each of Invesco Asset Management Deutschland GmbH, Invesco Asset Management Limited, Invesco Asset Management (Japan) Limited, Invesco Hong Kong Limited, Invesco Senior Secured Management, Inc. and Invesco Canada Ltd. and separatesub-advisory agreements with Invesco Capital Management LLC and Invesco Asset Management (India) Private Limited (collectively, the “AffiliatedSub-Advisers”) the Adviser, not the Fund, will pay 40% of the fees paid to the Adviser to any such AffiliatedSub-Adviser(s) that provide(s) discretionary investment management services to the Fund based on the percentage of assets allocated to such AffiliatedSub-Adviser(s).
The Adviser has contractually agreed, through at least June 30, 2020, to waive advisory fees and/or reimburse expenses of all shares to the extent necessary to limit total annual fund operating expenses after fee waiver and/or expense reimbursement (excluding certain items discussed below) of Series I shares to 2.25% and Series II shares to 2.50% of average daily net assets (the “expense limits”). In determining the Adviser’s obligation to waive advisory fees and/or reimburse expenses, the following expenses are not taken into account, and could cause the total annual fund operating expenses after fee waiver and/or expense reimbursement to exceed the numbers reflected above: (1) interest; (2) taxes; (3) dividend expense on short sales; (4) extraordinary ornon-routine items, including litigation expenses; and (5) expenses that the Fund has incurred but did not actually pay because of an expense offset arrangement. Unless Invesco continues the fee waiver agreement, it will terminate on June 30, 2020. During its term, the fee waiver agreement cannot be terminated or amended to increase the expense limits or reduce the advisory fee waiver without approval of the Board of Trustees. The Adviser did not waive fees and/or reimburse expenses during the period under these expense limits.
Further, the Adviser has contractually agreed, through at least June 30, 2021, to waive the advisory fee payable by the Fund in an amount equal to 100% of the net advisory fees the Adviser receives from the affiliated money market funds on investments by the Fund of uninvested cash in such affiliated money market funds.
For the year ended December 31, 2019, the Adviser waived advisory fees of $63,247.
The Trust has entered into a master administrative services agreement with Invesco pursuant to which the Fund has agreed to pay Invesco a fee for costs incurred in providing accounting services and fund administrative services to the Fund and to reimburse Invesco for fees paid to insurance companies that have agreed to provide certain administrative services to the Fund. These administrative services provided by the insurance companies may include, among other things: maintenance of master accounts with the Fund; tracking, recording and transmitting net purchase and redemption orders for Fund shares; maintaining and preserving records related to the purchase, redemption and other account activity of variable product owners; distributing copies of Fund documents such as prospectuses, proxy materials and periodic reports, to variable product owners, and responding to inquiries from variable product owners about the Fund. Pursuant to such agreement, for the year ended December 31, 2019, Invesco was paid $201,937 for accounting and fund administrative services and was reimbursed $2,122,017 for fees paid to insurance companies. Invesco has entered into asub-administration agreement whereby State Street Bank and Trust Company (“SSB”) serves as fund accountant and provides certain administrative services to the Fund. Pursuant to a custody agreement with the Trust on behalf of the Fund, SSB also serves as the Fund’s custodian.
The Trust has entered into a transfer agency and service agreement with Invesco Investment Services, Inc. (“IIS”) pursuant to which the Fund has agreed to pay IIS a fee for providing transfer agency and shareholder services to the Fund and reimburse IIS for certain expenses incurred by IIS in the course of providing such services. For the year ended December 31, 2019, expenses incurred under the agreement are shown in the Statement of Operations asTransfer agent fees.
The Trust has entered into a master distribution agreement with Invesco Distributors, Inc. (“IDI”) to serve as the distributor for the Fund. The Trust has adopted a plan pursuant to Rule12b-1 under the 1940 Act with respect to the Fund’s Series II shares (the “Plan”). The Fund, pursuant to the Plan, pays IDI compensation at the annual rate of 0.25% of the Fund’s average daily net assets of Series II shares. The fees are accrued daily and paid monthly. Of the Plan payments, up to 0.25% of the average daily net assets of the Series II shares may be paid to insurance companies who furnish continuing personal shareholder services to customers who purchase and own Series II shares of the Fund. For the year ended December 31, 2019, expenses incurred under the Plan are detailed in the Statement of Operations asDistribution fees.
Invesco V.I. International Growth Fund
Certain officers and trustees of the Trust are officers and directors of the Adviser, IIS and/or IDI.
NOTE 3–Additional Valuation Information
GAAP defines fair value as the price that would be received to sell an asset or paid to transfer a liability in an orderly transaction between market participants at the measurement date, under current market conditions. GAAP establishes a hierarchy that prioritizes the inputs to valuation methods, giving the highest priority to readily available unadjusted quoted prices in an active market for identical assets (Level 1) and the lowest priority to significant unobservable inputs (Level 3), generally when market prices are not readily available or are unreliable. Based on the valuation inputs, the securities or other investments are tiered into one of three levels. Changes in valuation methods may result in transfers in or out of an investment’s assigned level:
| | Level 1 - | Prices are determined using quoted prices in an active market for identical assets. |
| | Level 2 - | Prices are determined using other significant observable inputs. Observable inputs are inputs that other market participants may use in pricing a security. These may include quoted prices for similar securities, interest rates, prepayment speeds, credit risk, yield curves, loss severities, default rates, discount rates, volatilities and others. |
| | Level 3 - | Prices are determined using significant unobservable inputs. In situations where quoted prices or observable inputs are unavailable (for example, when there is little or no market activity for an investment at the end of the period), unobservable inputs may be used. Unobservable inputs reflect the Fund’s own assumptions about the factors market participants would use in determining fair value of the securities or instruments and would be based on the best available information. |
The following is a summary of the tiered valuation input levels, as of December 31, 2019. The level assigned to the securities valuations may not be an indication of the risk or liquidity associated with investing in those securities. Because of the inherent uncertainties of valuation, the values reflected in the financial statements may materially differ from the value received upon actual sale of those investments.
| | | | | | | | | | | | | | | | |
| | | Level 1 | | | Level 2 | | | Level 3 | | | Total | |
| |
Investments in Securities | | | | | | | | | | | | | | | | |
| |
Australia | | $ | – | | | $ | 11,120,663 | | | | $– | | | $ | 11,120,663 | |
| |
Brazil | | | 36,664,480 | | | | 17,938,616 | | | | – | | | | 54,603,096 | |
| |
Canada | | | 115,774,507 | | | | – | | | | – | | | | 115,774,507 | |
| |
China | | | 75,567,399 | | | | 29,893,044 | | | | – | | | | 105,460,443 | |
| |
Denmark | | | – | | | | 23,349,599 | | | | – | | | | 23,349,599 | |
| |
France | | | – | | | | 145,218,235 | | | | – | | | | 145,218,235 | |
| |
Germany | | | – | | | | 127,002,730 | | | | – | | | | 127,002,730 | |
| |
Hong Kong | | | – | | | | 17,232,367 | | | | – | | | | 17,232,367 | |
| |
Ireland | | | 16,668,419 | | | | – | | | | – | | | | 16,668,419 | |
| |
Italy | | | – | | | | 34,963,256 | | | | – | | | | 34,963,256 | |
| |
Japan | | | – | | | | 144,965,635 | | | | – | | | | 144,965,635 | |
| |
Macau | | | – | | | | 26,822,362 | | | | – | | | | 26,822,362 | |
| |
Mexico | | | 20,112,957 | | | | – | | | | – | | | | 20,112,957 | |
| |
Netherlands | | | – | | | | 60,996,035 | | | | – | | | | 60,996,035 | |
| |
Singapore | | | – | | | | 22,194,866 | | | | – | | | | 22,194,866 | |
| |
South Korea | | | – | | | | 51,285,266 | | | | – | | | | 51,285,266 | |
| |
Spain | | | – | | | | 23,598,462 | | | | – | | | | 23,598,462 | |
| |
Sweden | | | – | | | | 41,486,452 | | | | – | | | | 41,486,452 | |
| |
Switzerland | | | – | | | | 90,825,022 | | | | – | | | | 90,825,022 | |
| |
Taiwan | | | 38,937,632 | | | | – | | | | – | | | | 38,937,632 | |
| |
United Kingdom | | | – | | | | 144,323,987 | | | | – | | | | 144,323,987 | |
| |
United States | | | 87,315,803 | | | | 20,317,649 | | | | – | | | | 107,633,452 | |
| |
Money Market Funds | | | 40,803,508 | | | | – | | | | – | | | | 40,803,508 | |
| |
Total Investments | | $ | 431,844,705 | | | $ | 1,033,534,246 | | | | $– | | | $ | 1,465,378,951 | |
| |
NOTE 4–Trustees’ and Officers’ Fees and Benefits
Trustees’ and Officers’ Fees and Benefits include amounts accrued by the Fund to pay remuneration to certain Trustees and Officers of the Fund. Trustees have the option to defer compensation payable by the Fund, andTrustees’ and Officers’ Fees and Benefits also include amounts accrued by the Fund to fund such deferred compensation amounts. Those Trustees who defer compensation have the option to select various Invesco Funds in which their deferral accounts shall be deemed to be invested. Finally, certain current Trustees were eligible to participate in a retirement plan that provided for benefits to be paid upon retirement to Trustees over a period of time based on the number of years of service. The Fund may have certain former Trustees who also participate in a retirement plan and receive benefits under such plan.Trustees’ and Officers’ Fees and Benefits include amounts accrued by the Fund to fund such retirement benefits. Obligations under the deferred compensation and retirement plans represent unsecured claims against the general assets of the Fund.
Invesco V.I. International Growth Fund
NOTE 5–Cash Balances
The Fund is permitted to temporarily carry a negative or overdrawn balance in its account with SSB, the custodian bank. Such balances, if any atperiod-end, are shown in the Statement of Assets and Liabilities under the payable caption Amount due custodian. To compensate the custodian bank for such overdrafts, the overdrawn Fund may either (1) leave funds as a compensating balance in the account so the custodian bank can be compensated by earning the additional interest; or (2) compensate by paying the custodian bank at a rate agreed upon by the custodian bank and Invesco, not to exceed the contractually agreed upon rate.
NOTE 6–Distributions to Shareholders and Tax Components of Net Assets
Tax Character of Distributions to Shareholders Paid During the Fiscal Years Ended December 31, 2019 and 2018:
| | | | | | | | |
| | | 2019 | | | 2018 | |
| |
Ordinary income | | $ | 19,392,737 | | | $ | 32,026,526 | |
| |
Long-term capital gain | | | 90,542,462 | | | | 11,993,582 | |
| |
Total distributions | | $ | 109,935,199 | | | $ | 44,020,108 | |
| |
Tax Components of Net Assets atPeriod-End:
| | | | |
| | | 2019 | |
| |
Undistributed ordinary income | | $ | 30,974,896 | |
| |
Undistributed long-term capital gain | | | 26,510,218 | |
| |
Net unrealized appreciation – investments | | | 451,409,604 | |
| |
Net unrealized appreciation - foreign currencies | | | 44,653 | |
| |
Temporary book/tax differences | | | (227,512 | ) |
| |
Shares of beneficial interest | | | 963,320,855 | |
| |
Total net assets | | $ | 1,472,032,714 | |
| |
The difference between book-basis andtax-basis unrealized appreciation (depreciation) is due to differences in the timing of recognition of gains and losses on investments for tax and book purposes. The Fund’s net unrealized appreciation (depreciation) difference is attributable primarily to wash sales and passive foreign investment companies.
The temporary book/tax differences are a result of timing differences between book and tax recognition of income and/or expenses. The Fund’s temporary book/tax differences are the result of the trustee deferral of compensation and retirement plan benefits.
Capital loss carryforward is calculated and reported as of a specific date. Results of transactions and other activity after that date may affect the amount of capital loss carryforward actually available for the Fund to utilize. Capital losses generated in years beginning after December 22, 2010 can be carried forward for an unlimited period, whereas previous losses expire in eight tax years. Capital losses with an expiration period may not be used to offset capital gains until all net capital losses without an expiration date have been utilized. Capital loss carryforwards with no expiration date will retain their character as either short-term or long-term capital losses instead of as short-term capital losses as under prior law. The ability to utilize capital loss carryforwards in the future may be limited under the Internal Revenue Code and related regulations based on the results of future transactions.
The Fund does not have a capital loss carryforward as of December 31, 2019.
NOTE 7–Investment Transactions
The aggregate amount of investment securities (other than short-term securities, U.S. Treasury obligations and money market funds, if any) purchased and sold by the Fund during the year ended December 31, 2019 was $419,062,364 and $556,912,377, respectively. Cost of investments, including any derivatives, on a tax basis includes the adjustments for financial reporting purposes as of the most recently completed federal income tax reportingperiod-end.
Unrealized Appreciation (Depreciation) of Investments on a Tax Basis
| | | | |
| |
Aggregate unrealized appreciation of investments | | $ | 471,357,717 | |
| |
Aggregate unrealized (depreciation) of investments | | | (19,948,113 | ) |
| |
Net unrealized appreciation of investments | | $ | 451,409,604 | |
| |
Cost of investments for tax purposes is $1,013,969,347.
NOTE 8–Reclassification of Permanent Differences
Primarily as a result of differing book/tax treatment of passive foreign investment companies and foreign currency transactions, on December 31, 2019, undistributed net investment income was increased by $83,624 and undistributed net realized gain was decreased by $83,624. This reclassification had no effect on the net assets or the distributable earnings of the Fund.
Invesco V.I. International Growth Fund
NOTE 9–Share Information
| | | | | | | | | | | | | | | | |
| | | Summary of Share Activity | |
| |
| | | Year ended | | | Year ended | |
| | | December 31, 2019(a) | | | December 31, 2018 | |
| | | | | | | | |
| | | Shares | | | Amount | | | Shares | | | Amount | |
| |
Sold: | | | | | | | | | | | | | | | | |
Series I | | | 1,348,893 | | | $ | 50,918,059 | | | | 1,795,725 | | | $ | 68,266,200 | |
| |
Series II | | | 2,347,857 | | | | 86,070,698 | | | | 3,256,967 | | | | 122,515,503 | |
| |
| | | | |
Issued as reinvestment of dividends: | | | | | | | | | | | | | | | | |
Series I | | | 964,334 | | | | 35,063,198 | | | | 378,411 | | | | 14,076,897 | |
| |
Series II | | | 2,079,137 | | | | 74,537,058 | | | | 812,333 | | | | 29,812,608 | |
| |
| | | | |
Reacquired: | | | | | | | | | | | | | | | | |
Series I | | | (2,946,756 | ) | | | (111,020,981 | ) | | | (5,338,737 | ) | | | (201,023,083 | ) |
| |
Series II | | | (4,827,830 | ) | | | (179,339,854 | ) | | | (14,373,620 | ) | | | (526,999,669 | ) |
| |
Net increase (decrease) in share activity | | | (1,034,365 | ) | | $ | (43,771,822 | ) | | | (13,468,921 | ) | | $ | (493,351,544 | ) |
| |
| (a) | There are entities that are record owners of more than 5% of the outstanding shares of the Fund and in the aggregate own 50% of the outstanding shares of the Fund. The Fund and the Fund’s principal underwriter or adviser, are parties to participation agreements with these entities whereby these entities sell units of interest in separate accounts funding variable products that are invested in the Fund. The Fund, Invesco and/or Invesco affiliates may make payments to these entities, which are considered to be related to the Fund, for providing services to the Fund, Invesco and/or Invesco affiliates including but not limited to services such as, securities brokerage, third party record keeping and account servicing and administrative services. The Fund has no knowledge as to whether all or any portion of the shares owned of record by these entities are also owned beneficially. |
Invesco V.I. International Growth Fund
Report of Independent Registered Public Accounting Firm
To the Board of Trustees of AIM Variable Insurance Funds (Invesco Variable Insurance Funds) and Shareholders of Invesco V.I. International Growth Fund
Opinion on the Financial Statements
We have audited the accompanying statement of assets and liabilities, including the schedule of investments, of Invesco V.I. International Growth Fund (one of the funds constituting AIM Variable Insurance Funds (Invesco Variable Insurance Funds), referred to hereafter as the “Fund”) as of December 31, 2019, the related statement of operations for the year ended December 31, 2019, the statement of changes in net assets for each of the two years in the period ended December 31, 2019, including the related notes, and the financial highlights for each of the five years in the period ended December 31, 2019 (collectively referred to as the “financial statements”). In our opinion, the financial statements present fairly, in all material respects, the financial position of the Fund as of December 31, 2019, the results of its operations for the year then ended, the changes in its net assets for each of the two years in the period ended December 31, 2019 and the financial highlights for each of the five years in the period ended December 31, 2019 in conformity with accounting principles generally accepted in the United States of America.
Basis for Opinion
These financial statements are the responsibility of the Fund’s management. Our responsibility is to express an opinion on the Fund’s financial statements based on our audits. We are a public accounting firm registered with the Public Company Accounting Oversight Board (United States) (PCAOB) and are required to be independent with respect to the Fund in accordance with the U.S. federal securities laws and the applicable rules and regulations of the Securities and Exchange Commission and the PCAOB.
We conducted our audits of these financial statements in accordance with the standards of the PCAOB. Those standards require that we plan and perform the audit to obtain reasonable assurance about whether the financial statements are free of material misstatement, whether due to error or fraud.
Our audits included performing procedures to assess the risks of material misstatement of the financial statements, whether due to error or fraud, and performing procedures that respond to those risks. Such procedures included examining, on a test basis, evidence regarding the amounts and disclosures in the financial statements. Our audits also included evaluating the accounting principles used and significant estimates made by management, as well as evaluating the overall presentation of the financial statements. Our procedures included confirmation of securities owned as of December 31, 2019 by correspondence with the custodian, transfer agent and brokers; when replies were not received from brokers, we performed other auditing procedures. We believe that our audits provide a reasonable basis for our opinion.
/s/PricewaterhouseCoopers LLP
Houston, Texas
February 18, 2020
We have served as the auditor of one or more of the investment companies in the Invesco group of investment companies since at least 1995. We have not been able to determine the specific year we began serving as auditor.
Invesco V.I. International Growth Fund
Calculating your ongoing Fund expenses
Example
As a shareholder of the Fund, you incur ongoing costs, including management fees; distribution and/or service fees(12b-1); and other Fund expenses. This example is intended to help you understand your ongoing costs (in dollars) of investing in the Fund and to compare these costs with ongoing costs of investing in other mutual funds. The example is based on an investment of $1,000 invested at the beginning of the period and held for the entire period July 1, 2019 through December 31, 2019.
The actual and hypothetical expenses in the examples below do not represent the effect of any fees or other expenses assessed in connection with a variable product; if they did, the expenses shown would be higher while the ending account values shown would be lower.
Actual expenses
The table below provides information about actual account values and actual expenses. You may use the information in this table, together with the amount you invested, to estimate the expenses that you paid over the period. Simply divide your account value by $1,000 (for example, an $8,600 account value divided by $1,000 = 8.6), then multiply the result by the number in the table under the heading entitled “Actual Expenses Paid During Period” to estimate the expenses you paid on your account during this period.
Hypothetical example for comparison purposes
The table below also provides information about hypothetical account values and hypothetical expenses based on the Fund’s actual expense ratio and an assumed rate of return of 5% per year before expenses, which is not the Fund’s actual return.
The hypothetical account values and expenses may not be used to estimate the actual ending account balance or expenses you paid for the period. You may use this information to compare the ongoing costs of investing in the Fund and other funds. To do so, compare this 5% hypothetical example with the 5% hypothetical examples that appear in the shareholder reports of the other funds.
Please note that the expenses shown in the table are meant to highlight your ongoing costs. Therefore, the hypothetical information is useful in comparing ongoing costs, and will not help you determine the relative total costs of owning different funds.
| | | | | | | | | | | | |
| | | Beginning
Account Value
(07/01/19) | | ACTUAL | | HYPOTHETICAL
(5% annual return before expenses) | | Annualized
Expense
Ratio |
| | Ending
Account Value
(12/31/19)1 | | Expenses
Paid During
Period2 | | Ending
Account Value
(12/31/19) | | Expenses
Paid During
Period2 |
Series I | | $1,000.00 | | $1,072.70 | | $4.55 | | $1,020.82 | | $4.43 | | 0.87% |
Series II | | 1,000.00 | | 1,070.90 | | 5.85 | | 1,019.56 | | 5.70 | | 1.12 |
| 1 | The actual ending account value is based on the actual total return of the Fund for the period July 1, 2019 through December 31, 2019, after actual expenses and will differ from the hypothetical ending account value which is based on the Fund’s expense ratio and a hypothetical annual return of 5% before expenses. |
| 2 | Expenses are equal to the Fund’s annualized expense ratio as indicated above multiplied by the average account value over the period, multiplied by 184/365 to reflect the most recent fiscal half year. |
Invesco V.I. International Growth Fund
Tax Information
Form1099-DIV, Form1042-S and other year–end tax information provide shareholders with actual calendar year amounts that should be included in their tax returns. Shareholders should consult their tax advisors.
The following distribution information is being provided as required by the Internal Revenue Code or to meet a specific state’s requirement.
The Fund designates the following amounts or, if subsequently determined to be different, the maximum amount allowable for its fiscal year ended December 31, 2019:
| | | | | | | | |
| | Federal and State Income Tax | | | | | | |
| | Long-Term Capital Gain Distributions | | $ | 90,542,462 | | | |
| | Corporate Dividends Received Deduction* | | | 10.19 | % | | |
| | U.S. Treasury Obligations* | | | 0.00 | % | | |
| | Foreign Taxes | | $ | 0.0876 | | | per share |
| | Foreign Source Income | | $ | 0.9393 | | | per share |
* The above percentages are based on ordinary income dividends paid to shareholders during the Fund’s fiscal year.
Invesco V.I. International Growth Fund
Trustees and Officers
The address of each trustee and officer is AIM Variable Insurance Funds (Invesco Variable Insurance Funds) (the “Trust”), 11 Greenway Plaza, Suite 1000, Houston, Texas 77046-1173. The trustees serve for the life of the Trust, subject to their earlier death, incapacitation, resignation, retirement or removal as more specifically provided in the Trust’s organizational documents. Each officer serves for a one year term or until their successors are elected and qualified. Column two below includes length of time served with predecessor entities, if any.
| | | | | | | | |
Name, Year of Birth and Position(s) Held with the Trust | | Trustee and/or Officer Since | | Principal Occupation(s) During Past 5 Years | | Number of
Funds in
Fund Complex
Overseen by
Trustee | | Other Directorship(s) Held by Trustee
During Past 5 Years |
| Interested Person |
Martin L. Flanagan1- 1960 Trustee and Vice Chair | | 2007 | | Executive Director, Chief Executive Officer and President, Invesco Ltd. (ultimate parent of Invesco and a global investment management firm); Trustee and Vice Chair, The Invesco Funds; Vice Chair, Investment Company Institute; and Member of Executive Board, SMU Cox School of Business Formerly: Advisor to the Board, Invesco Advisers, Inc. (formerly known as Invesco Institutional (N.A.), Inc.); Chairman and Chief Executive Officer, Invesco Advisers, Inc. (registered investment adviser); Director, Chairman, Chief Executive Officer and President, Invesco Holding Company (US), Inc. (formerly IVZ Inc.) (holding company), Invesco Group Services, Inc. (service provider) and Invesco North American Holdings, Inc. (holding company); Director, Chief Executive Officer and President, Invesco Holding Company Limited (parent of Invesco and a global investment management firm); Director, Invesco Ltd.; Chairman, Investment Company Institute and President,Co-Chief Executive Officer,Co-President, Chief Operating Officer and Chief Financial Officer, Franklin Resources, Inc. (global investment management organization) | | 229 | | None |
| 1 | Mr. Flanagan is considered an interested person (within the meaning of Section 2(a)(19) of the 1940 Act) of the Trust because he is an officer of the Adviser to the Trust, and an officer and a director of Invesco Ltd., ultimate parent of the Adviser. |
Invesco V.I. International Growth Fund
Trustees and Officers–(continued)
| | | | | | | | |
Name, Year of Birth and Position(s) Held with the Trust | | Trustee and/or Officer Since | | Principal Occupation(s) During Past 5 Years | | Number of
Funds in
Fund Complex
Overseen by
Trustee | | Other Directorship(s) Held by Trustee
During Past 5 Years |
| Independent Trustees |
Bruce L. Crockett - 1944 Trustee and Chair | | 1993 | | Chairman, Crockett Technologies Associates (technology consulting company) Formerly: Director, Captaris (unified messaging provider); Director, President and Chief Executive Officer, COMSAT Corporation; Chairman, Board of Governors of INTELSAT (international communications company); ACE Limited (insurance company); Independent Directors Council and Investment Company Institute: Member of the Audit Committee, Investment Company Institute; Member of the Executive Committee and Chair of the Governance Committee, Independent Directors Council | | 229 | | Director and Chairman of the Audit Committee, ALPS (Attorneys Liability Protection Society) (insurance company); Director and Member of the Audit Committee and Compensation Committee, Ferroglobe PLC (metallurgical company) |
David C. Arch - 1945 Trustee | | 2010 | | Chairman of Blistex Inc. (consumer health care products manufacturer); Member, World Presidents’ Organization | | 229 | | Board member of the Illinois Manufacturers’ Association |
Beth Ann Brown - 1968 Trustee | | 2019 | | Independent Consultant Formerly: Head of Intermediary Distribution, Managing Director, Strategic Relations, Managing Director, Head of National Accounts, Senior Vice President, National Account Manager and Senior Vice President, Key Account Manager, Columbia Management Investment Advisers LLC; Vice President, Key Account Manager, Liberty Funds Distributor, Inc.; and Trustee of certain Oppenheimer Funds | | 229 | | Director, Board of Directors of Caron Engineering Inc.; Advisor, Board of Advisors of Caron Engineering Inc.; President and Director, Acton Shapleigh Youth Conservation Corps (non - profit); and Vice President and Director of Grahamtastic Connection (non-profit) |
Jack M. Fields - 1952 Trustee | | 1997 | | Chief Executive Officer, Twenty First Century Group, Inc. (government affairs company); and Chairman, Discovery Learning Alliance(non-profit) Formerly: Owner and Chief Executive Officer, Dos Angeles Ranch L.P. (cattle, hunting, corporate entertainment); Director, Insperity, Inc. (formerly known as Administaff) (human resources provider); Chief Executive Officer, Texana Timber LP (sustainable forestry company); Director of Cross Timbers Quail Research Ranch(non-profit); and member of the U.S. House of Representatives | | 229 | | None |
Invesco V.I. International Growth Fund
Trustees and Officers–(continued)
| | | | | | | | |
Name, Year of Birth and Position(s) Held with the Trust | | Trustee and/or Officer Since | | Principal Occupation(s) During Past 5 Years | | Number of
Funds in
Fund Complex
Overseen by
Trustee | | Other Directorship(s) Held by Trustee
During Past 5 Years |
| Independent Trustees–(continued) |
Cynthia Hostetler -1962 Trustee | | 2017 | | Non-Executive Director and Trustee of a number of public and private business corporations Formerly: Director, Aberdeen Investment Funds (4 portfolios); Head of Investment Funds and Private Equity, Overseas Private Investment Corporation; President, First Manhattan Bancorporation, Inc.; Attorney, Simpson Thacher & Bartlett LLP | | 229 | | Vulcan Materials Company (construction materials company); Trilinc Global Impact Fund; Genesee & Wyoming, Inc. (railroads); Artio Global Investment LLC (mutual fund complex); Edgen Group, Inc. (specialized energy and infrastructure products distributor); Investment Company Institute (professional organization); Independent Directors Council (professional organization) |
Eli Jones - 1961 Trustee | | 2016 | | Professor and Dean, Mays Business School - Texas A&M University Formerly: Professor and Dean, Walton College of Business, University of Arkansas and E.J. Ourso College of Business, Louisiana State University; Director, Arvest Bank | | 229 | | Insperity, Inc. (formerly known as Administaff) (human resources provider) |
Elizabeth Krentzman - 1959 Trustee | | 2019 | | Formerly: Principal and Chief Regulatory Advisor for Asset Management Services and U.S. Mutual Fund Leader of Deloitte & Touche LLP; General Counsel of the Investment Company Institute (trade association); National Director of the Investment Management Regulatory Consulting Practice, Principal, Director and Senior Manager of Deloitte & Touche LLP; Assistant Director of the Division of Investment Management - Office of Disclosure and Investment Adviser Regulation of the U.S. Securities and Exchange Commission and various positions with the Division of Investment Management - Office of Regulatory Policy of the U.S. Securities and Exchange Commission; Associate at Ropes & Gray LLP; Advisory Board Member of the Securities and Exchange Commission Historical Society; and Trustee of certain Oppenheimer Funds | | 229 | | Trustee of the University of Florida National Board Foundation and Audit Committee Member; Member of the Cartica Funds Board of Directors (private investment funds); Member of the University of Florida Law Center Association, Inc. Board of Trustees and Audit Committee Member |
Anthony J. LaCava, Jr. - 1956 Trustee | | 2019 | | Formerly: Director and Member of the Audit Committee, Blue Hills Bank (publicly traded financial institution) and Managing Partner, KPMG LLP | | 229 | | Blue Hills Bank; Chairman, Bentley University; Member, Business School Advisory Council; and Nominating Committee KPMG LLP |
Prema Mathai-Davis - 1950 Trustee | | 1998 | | Retired Co-Owner & Partner of Quantalytics Research, LLC, (a FinTech Investment Research Platform for the Self-Directed Investor) | | 229 | | None |
Invesco V.I. International Growth Fund
Trustees and Officers–(continued)
| | | | | | | | |
Name, Year of Birth and Position(s) Held with the Trust | | Trustee and/or Officer Since | | Principal Occupation(s) During Past 5 Years | | Number of
Funds in
Fund Complex
Overseen by
Trustee | | Other Directorship(s) Held by Trustee
During Past 5 Years |
| Independent Trustees–(continued) |
Joel W. Motley - 1952 Trustee | | 2019 | | Director of Office of Finance, Federal Home Loan Bank; Member of the Vestry of Trinity Wall Street; Managing Director of Carmona Motley Inc. (privately held financial advisor); Member of the Finance and Budget Committee of the Council on Foreign Relations, Member of the Investment Committee and Board of Human Rights Watch and Member of the Investment Committee and Board of Historic Hudson Valley(non-profit cultural organization) Formerly: Managing Director of Public Capital Advisors, LLC (privately held financial advisor); Managing Director of Carmona Motley Hoffman, Inc. (privately held financial advisor); Trustee of certain Oppenheimer Funds; and Director of Columbia Equity Financial Corp. (privately held financial advisor) | | 229 | | Director of Greenwall Foundation (bioethics research foundation); Member of Board and Investment Committee of The Greenwall Foundation; Director of Southern Africa Legal Services Foundation; Board Member and Investment Committee Member of Pulizer Center for Crisis Reporting(non-profit journalism) |
Teresa M. Ressel - 1962 Trustee | | 2017 | | Non-executive director and trustee of a number of public and private business corporations Formerly: Chief Financial Officer, Olayan America, The Olayan Group (international investor/commercial/industrial); Chief Executive Officer, UBS Securities LLC; Group Chief Operating Officer, Americas, UBS AG; Assistant Secretary for Management & Budget and CFO, US Department of the Treasury | | 229 | | Atlantic Power Corporation (power generation company); ON Semiconductor Corp. (semiconductor supplier) |
Ann Barnett Stern - 1957 Trustee | | 2017 | | President and Chief Executive Officer, Houston Endowment Inc. (private philanthropic institution) Formerly: Executive Vice President and General Counsel, Texas Children’s Hospital; Attorney, Beck, Redden and Secrest, LLP; Business Law Instructor, University of St. Thomas; Attorney, Andrews & Kurth LLP | | 229 | | Federal Reserve Bank of Dallas |
Robert C. Troccoli - 1949 Trustee | | 2016 | | Retired | | 229 | | None |
| Daniel S. Vandivort - 1954 Trustee | | 2019 | | Treasurer, Chairman of the Audit and Finance Committee, and Trustee, Board of Trustees, Huntington Disease Foundation of America; and President, Flyway Advisory Services LLC (consulting and property management) Formerly: Trustee and Governance Chair, of certain Oppenheimer Funds | | 229 | | Chairman and Lead Independent Director, Chairman of the Audit Committee, and Director, Board of Directors, Value Line Funds |
| James D. Vaughn - 1945 Trustee | | 2019 | | Retired Formerly: Managing Partner, Deloitte & Touche LLP; Trustee and Chairman of the Audit Committee, Schroder Funds; Board Member, Mile High United Way, Boys and Girls Clubs, Boy Scouts, Colorado Business Committee for the Arts, Economic Club of Colorado and Metro Denver Network (economic development corporation); and Trustee of certain Oppenheimer Funds | | 229 | | Board member and Chairman of Audit Committee of AMG National Trust Bank; Trustee and Investment Committee member, University of South Dakota Foundation; Board member, Audit Committee Member and past Board Chair, Junior Achievement(non-profit) |
Invesco V.I. International Growth Fund
Trustees and Officers–(continued)
| | | | | | | | |
Name, Year of Birth and Position(s) Held with the Trust | | Trustee and/or Officer Since | | Principal Occupation(s) During Past 5 Years | | Number of
Funds in
Fund Complex
Overseen by
Trustee | | Other Directorship(s) Held by Trustee
During Past 5 Years |
| Independent Trustees–(continued) |
| Christopher L. WIlson - 1957 Trustee, Vice Chair and Chair Designate | | 2017 | | Retired Formerly: Director, TD Asset Management USA Inc. (mutual fund complex) (22 portfolios); Managing Partner, CT2, LLC (investing and consulting firm); President/Chief Executive Officer, Columbia Funds, Bank of America Corporation; President/Chief Executive Officer, CDC IXIS Asset Management Services, Inc.; Principal & Director of Operations, Scudder Funds, Scudder, Stevens & Clark, Inc.; Assistant Vice President, Fidelity Investments | | 229 | | ISO New England, Inc.(non-profit organization managing regional electricity market) |
Invesco V.I. International Growth Fund
Trustees and Officers–(continued)
| | | | | | | | |
Name, Year of Birth and Position(s) Held with the Trust | | Trustee and/or Officer Since | | Principal Occupation(s) During Past 5 Years | | Number of
Funds in
Fund Complex
Overseen by
Trustee | | Other Directorship(s) Held by Trustee
During Past 5 Years |
| Officers |
Sheri Morris - 1964 President, Principal Executive Officer and Treasurer | | 1999 | | Head of Global Fund Services, Invesco Ltd.; President, Principal Executive Officer and Treasurer, The Invesco Funds; Vice President, Invesco Advisers, Inc. (formerly known as Invesco Institutional (N.A.), Inc.) (registered investment adviser); and Vice President, Invesco Exchange-Traded Fund Trust, Invesco Exchange-Traded Fund Trust II, Invesco India Exchange-Traded Fund Trust, Invesco Actively Managed Exchange-Traded Fund Trust, Invesco Actively Managed Exchange-Traded Commodity Fund Trust and Invesco Exchange-Traded Self-Indexed Fund Trust; and Vice President, OppenheimerFunds, Inc. Formerly: Vice President and Principal Financial Officer, The Invesco Funds; Vice President, Invesco AIM Advisers, Inc., Invesco AIM Capital Management, Inc. and Invesco AIM Private Asset Management, Inc.; Assistant Vice President and Assistant Treasurer, The Invesco Funds and Assistant Vice President, Invesco Advisers, Inc., Invesco AIM Capital Management, Inc. and Invesco AIM Private Asset Management, Inc.; and Treasurer, Invesco Exchange-Traded Fund Trust, Invesco Exchange-Traded Fund Trust II, Invesco India Exchange-Traded Fund Trust and Invesco Actively Managed Exchange-Traded Fund Trust | | N/A | | N/A |
Russell C. Burk - 1958 Senior Vice President and Senior Officer | | 2005 | | Senior Vice President and Senior Officer, The Invesco Funds | | N/A | | N/A |
Jeffrey H. Kupor - 1968 Senior Vice President, Chief Legal Officer and Secretary | | 2018 | | Head of Legal of the Americas, Invesco Ltd.; Senior Vice President and Secretary, Invesco Advisers, Inc. (formerly known as Invesco Institutional (N.A.), Inc.) (registered investment adviser); Senior Vice President and Secretary, Invesco Distributors, Inc. (formerly known as Invesco AIM Distributors, Inc.); Vice President and Secretary, Invesco Investment Services, Inc. (formerly known as Invesco AIM Investment Services, Inc.) Senior Vice President, Chief Legal Officer and Secretary, The Invesco Funds; Secretary and General Counsel, Invesco Investment Advisers LLC (formerly known as Van Kampen Asset Management); Secretary and General Counsel, Invesco Capital Markets, Inc. (formerly known as Van Kampen Funds Inc.) and Chief Legal Officer, Invesco Exchange-Traded Fund Trust, Invesco Exchange-Traded Fund Trust II, Invesco India Exchange-Traded Fund Trust, Invesco Actively Managed Exchange-Traded Fund Trust, Invesco Actively Managed Exchange-Traded Commodity Fund Trust and Invesco Exchange-Traded Self-Indexed Fund Trust; Secretary, Invesco Indexing LLC; Secretary, W.L. Ross & Co., LLC Formerly: Secretary and Vice President, Jemstep, Inc.; Head of Legal, Worldwide Institutional, Invesco Ltd.; Secretary and General Counsel, INVESCO Private Capital Investments, Inc.; Senior Vice President, Secretary and General Counsel, Invesco Management Group, Inc. (formerly known as Invesco AIM Management Group, Inc.); Assistant Secretary, INVESCO Asset Management (Bermuda) Ltd.; Secretary and General Counsel, Invesco Private Capital, Inc.; Assistant Secretary and General Counsel, INVESCO Realty, Inc.; Secretary and General Counsel, Invesco Senior Secured Management, Inc.; and Secretary, Sovereign G./P. Holdings Inc. | | N/A | | N/A |
Andrew R. Schlossberg - 1974 Senior Vice President | | 2019 | | Head of the Americas and Senior Managing Director, Invesco Ltd.; Director and Senior Vice President, Invesco Advisers, Inc. (formerly known as Invesco Institutional (N.A.), Inc.) (registered investment adviser); Director and Chairman, Invesco Investment Services, Inc. (formerly known as Invesco AIM Investment Services, Inc.) (registered transfer agent); Senior Vice President, The Invesco Funds; Director, Invesco Investment Advisers LLC (formerly known as Van Kampen Asset Management); Director, President and Chairman, Invesco Insurance Agency, Inc. Formerly: Director, Invesco UK Limited; Director and Chief Executive, Invesco Asset Management Limited and Invesco Fund Managers Limited; Assistant Vice President, The Invesco Funds; Senior Vice President, Invesco Advisers, Inc. (formerly known as Invesco Institutional (N.A.), Inc.) (registered investment adviser); Director and Chief Executive, Invesco Administration Services Limited and Invesco Global Investment Funds Limited; Director, Invesco Distributors, Inc.; Head of EMEA, Invesco Ltd.; President, Invesco Actively Managed Exchange-Traded Commodity Fund Trust, Invesco Actively Managed Exchange-Traded Fund Trust, Invesco Exchange-Traded Fund Trust, Invesco Exchange-Traded Fund Trust II and Invesco India Exchange-Traded Fund Trust; Managing Director and Principal Executive Officer, Invesco Capital Management LLC | | N/A | | N/A |
Invesco V.I. International Growth Fund
Trustees and Officers–(continued)
| | | | | | | | |
Name, Year of Birth and Position(s) Held with the Trust | | Trustee and/or Officer Since | | Principal Occupation(s) During Past 5 Years | | Number of
Funds in
Fund Complex
Overseen by
Trustee | | Other Directorship(s) Held by Trustee
During Past 5 Years |
| Officers–(continued) |
John M. Zerr - 1962 Senior Vice President | | 2006 | | Chief Operating Officer of the Americas; Senior Vice President, Invesco Advisers, Inc. (formerly known as Invesco Institutional (N.A.), Inc.) (registered investment adviser); Senior Vice President, Invesco Distributors, Inc. (formerly known as Invesco AIM Distributors, Inc.); Director and Vice President, Invesco Investment Services, Inc. (formerly known as Invesco AIM Investment Services, Inc.) Senior Vice President, The Invesco Funds; Managing Director, Invesco Capital Management LLC; Director, Invesco Investment Advisers LLC (formerly known as Van Kampen Asset Management); Senior Vice President, Invesco Capital Markets, Inc. (formerly known as Van Kampen Funds Inc.); Manager, Invesco Indexing LLC; Manager, Invesco Specialized Products, LLC; Director and Senior Vice President, Invesco Insurance Agency, Inc.; Member, Invesco Canada Funds Advisory Board; Director, President and Chief Executive Officer, Invesco Corporate Class Inc. (corporate mutual fund company); and Director, Chairman, President and Chief Executive Officer, Invesco Canada Ltd. (formerly known as Invesco Trimark Ltd./Invesco Trimark Ltèe) (registered investment adviser and registered transfer agent) Formerly: Director and Senior Vice President, Invesco Management Group, Inc. (formerly known as Invesco AIM Management Group, Inc.); Secretary and General Counsel, Invesco Management Group, Inc. (formerly known as Invesco AIM Management Group, Inc.); Secretary, Invesco Investment Services, Inc. (formerly known as Invesco AIM Investment Services, Inc.); Chief Legal Officer and Secretary, The Invesco Funds; Secretary and General Counsel, Invesco Investment Advisers LLC (formerly known as Van Kampen Asset Management); Secretary and General Counsel, Invesco Capital Markets, Inc. (formerly known as Van Kampen Funds Inc.); Chief Legal Officer, Invesco Exchange-Traded Fund Trust, Invesco Exchange-Traded Fund Trust II, Invesco India Exchange-Traded Fund Trust, Invesco Actively Managed Exchange-Traded Fund Trust, Invesco Actively Managed Exchange-Traded Commodity Fund Trust and Invesco Exchange-Traded Self-Indexed Fund Trust; Secretary, Invesco Indexing LLC; Director, Secretary, General Counsel and Senior Vice President, Van Kampen Exchange Corp.; Director, Vice President and Secretary, IVZ Distributors, Inc. (formerly known as INVESCO Distributors, Inc.); Director and Vice President, INVESCO Funds Group, Inc.; Director and Vice President, Van Kampen Advisors Inc.; Director, Vice President, Secretary and General Counsel, Van Kampen Investor Services Inc.;Director and Secretary, Invesco Distributors, Inc. (formerly known as Invesco AIM Distributors, Inc.); Director, Senior Vice President, General Counsel and Secretary, Invesco AIM Advisers, Inc. and Van Kampen Investments Inc.; Director, Vice President and Secretary, Fund Management Company; Director, Senior Vice President, Secretary, General Counsel and Vice President, Invesco AIM Capital Management, Inc.; Chief Operating Officer and General Counsel, Liberty Ridge Capital, Inc. (an investment adviser) | | N/A | | N/A |
Gregory G. McGreevey - 1962 Senior Vice President | | 2012 | | Senior Managing Director, Invesco Ltd.; Director, Chairman, President, and Chief Executive Officer, Invesco Advisers, Inc. (formerly known as Invesco Institutional (N.A.), Inc.) (registered investment adviser); Director, Invesco Mortgage Capital, Inc. and Invesco Senior Secured Management, Inc.; and Senior Vice President, The Invesco Funds; and President, SNW Asset Management Corporation Formerly: Senior Vice President, Invesco Management Group, Inc. and Invesco Advisers, Inc.; Assistant Vice President, The Invesco Funds | | N/A | | N/A |
Kelli Gallegos - 1970 Vice President, Principal Financial Officer and Assistant Treasurer | | 2008 | | Principal Financial and Accounting Officer - Investments Pool, Invesco Specialized Products, LLC; Vice President, Principal Financial Officer and Assistant Treasurer, The Invesco Funds; Principal Financial and Accounting Officer - Pooled Investments, Invesco Capital Management LLC; Vice President and Treasurer, Invesco Exchange-Traded Fund Trust, Invesco Exchange-Traded Fund Trust II, Invesco India Exchange-Traded Fund Trust, Invesco Actively Managed Exchange-Traded Fund Trust, Invesco Actively Managed Exchange-Traded Commodity Fund Trust and Invesco Exchange-Traded Self-Indexed Fund Trust Formerly: Assistant Treasurer, Invesco Specialized Products, LLC; Assistant Treasurer, Invesco Exchange-Traded Fund Trust, Invesco Exchange-Traded Fund Trust II, Invesco India Exchange-Traded Fund Trust, Invesco Actively Managed Exchange-Traded Fund Trust, Invesco Actively Managed Exchange-Traded Commodity Fund Trust and Invesco Exchange-Traded Self-Indexed Fund Trust; Assistant Treasurer, Invesco Capital Management LLC; Assistant Vice President, The Invesco Funds | | N/A | | N/A |
Invesco V.I. International Growth Fund
Trustees and Officers–(continued)
| | | | | | | | |
Name, Year of Birth and Position(s) Held with the Trust | | Trustee and/or Officer Since | | Principal Occupation(s) During Past 5 Years | | Number of
Funds in
Fund Complex
Overseen by
Trustee | | Other Directorship(s) Held by Trustee
During Past 5 Years |
| Officers–(continued) |
Crissie M. Wisdom - 1969 Anti-Money Laundering Compliance Officer | | 2013 | | Anti-Money Laundering Compliance Officer, Invesco Advisers, Inc. (formerly known as Invesco Institutional (N.A.), Inc.) (registered investment adviser), Invesco Capital Markets, Inc. (formerly known as Van Kampen Funds Inc.), Invesco Distributors, Inc., Invesco Investment Services, Inc., The Invesco Funds, and Invesco Exchange-Traded Fund Trust, Invesco Exchange-Traded Fund Trust II, Invesco India Exchange-Traded Fund Trust, Invesco Actively Managed Exchange-Traded Fund Trust, Invesco Actively Managed Exchange-Traded Commodity Fund Trust and Invesco Exchange-Traded Self-Indexed Fund Trust; Anti-Money Laundering Compliance Officer and Bank Secrecy Act Officer, INVESCO National Trust Company and Invesco Trust Company; and Fraud Prevention Manager and Controls and Risk Analysis Manager for Invesco Investment Services, Inc. Formerly: Anti-Money Laundering Compliance Officer, Van Kampen Exchange Corp. and Invesco Management Group, Inc. | | N/A | | N/A |
Robert R. Leveille - 1969 Chief Compliance Officer | | 2016 | | Chief Compliance Officer, Invesco Advisers, Inc. (registered investment adviser); and Chief Compliance Officer, The Invesco Funds Formerly: Chief Compliance Officer, Putnam Investments and the Putnam Funds | | N/A | | N/A |
The Statement of Additional Information of the Trust includes additional information about the Fund’s Trustees and is available upon request, without charge, by calling 1.800.959.4246. Please refer to the Fund’s Statement of Additional Information for information on the Fund’ssub-advisers.
| | | | | | |
| Office of the Fund | | Investment Adviser | | Distributor | | Auditors |
| 11 Greenway Plaza, Suite 1000 | | Invesco Advisers, Inc. | | Invesco Distributors, Inc. | | PricewaterhouseCoopers LLP |
| Houston, TX 77046-1173 | | 1555 Peachtree Street, N.E. | | 11 Greenway Plaza, Suite 1000 | | 1000 Louisiana Street, Suite 5800 |
| | Atlanta, GA 30309 | | Houston, TX 77046-1173 | | Houston, TX 77002-5678 |
| | | |
| Counsel to the Fund | | Counsel to the Independent Trustees | | Transfer Agent | | Custodian |
| Stradley Ronon Stevens & Young, LLP | | Goodwin Procter LLP | | Invesco Investment Services, Inc. | | State Street Bank and Trust Company |
| 2005 Market Street, Suite 2600 | | 901 New York Avenue, N.W. | | 11 Greenway Plaza, Suite 1000 | | 225 Franklin Street |
| Philadelphia, PA 19103-7018 | | Washington, D.C. 20001 | | Houston, TX 77046-1173 | | Boston, MA 02110-2801 |
Invesco V.I. International Growth Fund
| | | | |
| | |
 | | Annual Report to Shareholders | | December 31, 2019 |
| | |
| | Invesco V.I. Managed Volatility Fund |
| | |
| | |

Beginning on January 1, 2021, as permitted by regulations adopted by the Securities and Exchange Commission, the insurance company that offers your variable annuity or variable life insurance contract may no longer send you paper copies of the Fund’s shareholder reports by mail, unless you specifically request paper copies of the reports from the insurance company or your financial intermediary. Instead of delivering paper copies of the report, the insurance company may choose to make the reports available on a website, and will notify you by mail each time a report is posted and provide you with a website link to access the report. Instructions for requesting paper copies will be provided by your insurance company.
If the insurance company offers electronic delivery, you may elect to receive shareholder reports and other communications about the Fund electronically by following the instructions provided by the insurance company or by contacting your financial intermediary. If you already elected to receive shareholder reports electronically, you will not be affected by this change and you need not take any action.
You may elect to receive all future reports in paper free of charge from the insurance company. You can inform the insurance company or your financial intermediary that you wish to continue receiving paper copies of your shareholder reports by following the instructions provided by the insurance company or by contacting your financial intermediary. Your election to receive reports in paper will apply to all portfolio companies available under your contract with the insurance company.
The Fund provides a complete list of its holdings four times in each fiscal year, at the quarter-ends. For the second and fourth quarters, the lists appear in the Fund’s semiannual and annual reports to shareholders. For the first and third quarters, the Fund files the lists with the Securities and Exchange Commission (SEC) as an exhibit to its reports on Form N-PORT. The Fund’s Form N-PORT filings are available on the SEC website, sec.gov. The SEC file numbers for the Fund are 811-07452 and 033-57340. The Fund’s most recent portfolio holdings, as filed on Form N-PORT, have also been made available to insurance companies issuing variable annuity contracts and variable life insurance policies (“variable products”) that invest in the Fund.
A description of the policies and procedures that the Fund uses to determine how to vote proxies relating to portfolio securities is available without charge, upon request, from our Client Services department at 800 959 4246 or at invesco.com/proxyguidelines. The information is also available on the SEC website, sec.gov.
Information regarding how the Fund voted proxies related to its portfolio securities during the most recent 12-month period ended June 30 is available at invesco.com/proxysearch. The information is also available on the SEC website, sec.gov.
Invesco Advisers, Inc. is an investment adviser; it provides investment advisory services to individual and institutional clients and does not sell securities. Invesco Distributors, Inc. is the US distributor for Invesco Ltd.’s retail mutual funds, exchange-traded funds and institutional money market funds. Both are wholly owned, indirect subsidiaries of Invesco Ltd.
This report must be accompanied or preceded by a currently effective Fund prospectus and variable product prospectus, which contain more complete information, including sales charges and expenses. Investors should read each carefully before investing.
NOT FDIC INSURED | MAY LOSE VALUE | NO BANK GUARANTEE
| | |
| Invesco Distributors, Inc. | | I-VIMGV-AR-1 |
Management’s Discussion of Fund Performance
Performance summary
For the year ended December 31, 2019, Series I shares of Invesco V.I. Managed Volatility Fund (the Fund) underperformed the Russell 1000 Value Index.
Your Fund’s long-term performance appears later in this report.
Fund vs. Indexes
Total returns, 12/31/18 to 12/31/19, excluding variable product issuer charges. If variable product issuer charges were included, returns would be lower.
| | | | | |
| Series I Shares | | | | 18.58 | % |
| Series II Shares | | | | 18.30 | |
| Russell 1000 Value Indexq(Broad Market Index) | | | | 26.54 | |
| Bloomberg Barclays U.S. Government/Credit Indexq(Style-Specific Index) | | | | 9.71 | |
| Lipper VUF Mixed-Asset Target Allocation Growth Funds Index∎(Peer Group Index) | | | | 20.66 | |
Source(s):qRIMES Technologies Corp.;∎Lipper Inc. | |
Market conditions and your Fund
Equity markets rallied in the first quarter of 2019, fueled by optimism about a potential US-China trade deal and indication that the US Federal Reserve (the Fed) would not raise interest rates in 2019, a surprising shift in monetary policy. The Fed’s more accommodative stance provided a supportive environment for equities and fixed income, even as US economic data were mixed and overseas growth appeared to be slowing. Against this backdrop, the S&P 500 Index posted its best first quarter returns since 1998.
Although the S&P 500 Index posted modest gains for the second quarter of 2019, the US stock market experienced increased volatility. After four consecutive months of rising stock markets, the market sold off in May 2019, along with bond yields and oil prices, as investors weighed the impact of the lingering trade war between the US and China, as well as potential tariffs imposed on Mexico. In addition, economic data showed a slowing domestic and global economy.
Key issues that concerned investors in the second quarter of 2019 carried over into the third quarter. The US-China trade conflict worried investors and stifled business investment, even as the Fed cut interest rates by 0.25% in July and again in September 2019.1 This environment, combined with evidence of slowing global economic growth, fueled market volatility in August 2019. The US Treasury yield curve inverted several times, increasing fears of a possible US recession. As a result, August saw increased risk aversion, with investors crowding into asset classes perceived as safe havens, such as US Treasuries and gold. However, the Fed’s accommodative tone provided some support for risk assets.
Macroeconomic issues that concerned investors in the third quarter of 2019 mostly abated during the fourth quarter, providing the backdrop for strong equity market returns. Risk assets surged higher as a result of a delay in the Brexit agreement until January 2020, optimism that phase one of a US-China trade deal would be completed and better-than-
expected third-quarter corporate earnings results. The US economy rose higher than expected, at 2.1% during the third quarter of 2019.2 During its October meeting, the Fed cut interest rates again by 0.25% based on business investment and exports remaining weak.1 Investors were also encouraged by a resilient US economy and corporate earnings, putting the US equity market on track for its largest annual rise since 2013.
All sectors within the Russell 1000 Value Index had positive returns for the year, and except for energy, all had double digit returns, with the information technology and industrials posting the strongest gains.
Security selection in the financials sector was the largest contributor to the Fund’s performance relative to the Russell 1000 Value Index for the year. Several key relative contributors for the year were concentrated in the banking industry, includingCitigroup,Citizens Financial,PNC FinancialsandBank of America. Following a sharp selloff in the fourth quarter of 2018, banks rebounded in the first quarter of 2019, and performed well throughout 2019 as revenues have generally improved and companies continue to return capital to shareholders through stock buybacks (reducing outstanding shares) and increased dividends.
Good stock selection in the health care, communication services and consumer staples sectors also contributed to the Fund’s performance relative to the Russell 1000 Value Index during the year. Within the health care sector, the Fund’s holdings inCelgeneandPfizerwere strong contributors. During the year, Celgene was acquired byBristol Meyers Squibb(also a Fund holding) at a significant premium, and shares of the
| | | | |
| | | Portfolio Composition |
| | By sector | | % of total net assets |
| | | | |
| | |
| | | Financials | | 24.29% |
| | | Health Care | | 14.85 |
| | | Information Technology | | 10.63 |
| | | U.S. Treasury Securities | | 7.78 |
| | | Communication Services | | 7.56 |
| | | Consumer Discretionary | | 7.06 |
| | | Energy | | 6.96 |
| | | Consumer Staples | | 5.88 |
| | | Industrials | | 5.03 |
| | | Materials | | 2.57 |
| | | Other Sectors, Each Less than 2% of Net Assets | | 2.50 |
| | | Money Market Funds Plus Other Assets Less Liabilities | | 4.89 |
| | |
Top 10 Equity Holdings* | | |
| % of total net assets |
| |
1. Johnson & Johnson | | 2.24% |
2. Bank of America Corp. | | 2.19 |
3. Philip Morris International, Inc. | | 2.06 |
4. Citigroup, Inc. | | 1.98 |
5. American International Group, Inc. | | 1.85 |
6. General Motors Co. | | 1.61 |
7. PNC Financial Services Group, Inc. (The) | | 1.59 |
8. Morgan Stanley | | 1.57 |
9. General Dynamics Corp. | | 1.35 |
10. Bristol-Myers Squibb Co. | | 1.28 |
| | | | |
Total Net Assets | | | $36.7 million | |
| |
Total Number of Holdings* | | | 250 | |
The Fund’s holdings are subject to change, and there is no assurance that the Fund will continue to hold any particular security.
*Excluding money market fund holdings, if any.
Data presented here are as of December 31, 2019.
Invesco V.I. Managed Volatility Fund
acquisition target rose sharply following the announcement. We sold Celgene after the bid was announced, and the deal ultimately closed in November. At the close of the year, we maintained our holding in Bristol Meyers.
Charter Communicationswas a key absolute and relative contributor (versus the Russell 1000 Value Index) in the communication services sector during the year. The company reported strong revenues during the year as the company focused on adding broadband subscribers to drive future growth. At the close of the year, we maintained our position in the company.
Within the consumer staples sector,Mondelez was a strong absolute and relative contributor (versus the Russell 1000 Value Index) to Fund performance for the year. The company has made progress on its plan to increase profitability, with revenues and earnings growth accelerating during the year. Additionally, the Fund’s lack of exposure to Walgreens Boots Alliance (an underperforming component of the Russell 1000 Value Index) contributed to relative Fund performance.
Given the strong equity market, the Fund’s allocation to cash, although averaging less than 5% for the year, was the Fund’s largest relative detractor compared to the Russell 1000 Value Index.
Security selection in the consumer discretionary sector also detracted from the Fund’s relative performance compared to the Russell 1000 Value Index during the year, due largely toCapri HoldingsandCarnival. Capri Holdings suffered as its Michael Kors brand witnessed declining sales, and reduced its 2020 outlook. However, the company’s Jimmy Choo and Versace brands have shown improvement, and the company is focusing more on accessories which we believe should help boost margins. Shares of cruise operator Carnival declined in June after the company reported a decline in profits and a weaker outlook for the remainder of 2019.
The materials and information technology sectors also detracted from the Fund’s relative return versus the Russell 1000 Value Index during the year. Within the materials sector, this was due largely toThe Mosaic Company, a potash and phosphate supplier which announced plans to reduce phosphate production, an intended long-term benefit that has the potential to negatively affect short-term earnings. We liquidated our position in The Mosaic Company during the year.
The Fund uses high grade bonds as a source of income and to dampen return volatility. While bonds fared well on an absolute basis during the year, the bond portion of the Fund’s portfolio underperformed the Russell 1000 Value Index. Similarly, the Fund’s allocation to convertible securities, while positive, underperformed the Russell 1000 Value Index, detracting from the Fund’s relative returns.
The Fund held currency forward contracts during the year for the purpose of hedging currency exposure of non-US-based companies held in the Fund. These derivatives were not for speculative purposes or leverage, and these positions had a small negative impact on the Fund’s performance relative to the Russell 1000 Value Index for the year.
As part of our mandate, and to potentially reduce portfolio volatility during a market downturn, we sold short S&P 500 futures contracts during the year. Derivatives were used solely for the purpose of reducing volatility and not for speculative purposes. The use of S&P 500 futures contracts had a negative impact on the Fund’s performance relative to the Russell 1000 Value Index for the year. However, the Fund was less volatile, as measured by standard deviation, than the Russell 1000 Value Index for the year.
During the year, within the equity portion of the Fund, we reduced the Fund’s relative overweight exposures to the financials and energy sectors, and increased exposures to the consumer staples, communication services and materials sectors. At the end of the year, the Fund’s largest equity overweight exposures relative to the style-specific benchmark were in the information technology, health care and financials sectors, while the largest underweight exposures were in the real estate, utilities and communication services sectors.
Thank you for your investment in Invesco V.I. Managed Volatility Fund and for sharing our long-term investment horizon.
| 1 | Source: US Federal Reserve |
| 2 | Source: Bureau of Economic Analysis |
Portfolio managers:
Jacob Borbidge
Chuck Burge
Brian Jurkash - Lead
Sergio Marcheli
Matthew Titus - Lead
The views and opinions expressed in management’s discussion of Fund performance are those of Invesco Advisers, Inc. These views and opinions are subject to change at any time based on factors such as market and economic conditions. These views and opinions may not be relied upon as investment advice or recommendations, or as an offer for a particular security. The information is not a complete analysis of every aspect of any market, country, industry, security or the Fund. Statements of fact are from sources considered reliable, but Invesco Advisers, Inc. makes no representation or warranty as to their completeness or accuracy. Although historical performance is no guarantee of future results, these insights may help you understand our investment management philosophy.
See important Fund and, if applicable, index disclosures later in this report.
Invesco V.I. Managed Volatility Fund
Your Fund’s Long-Term Performance
Results of a $10,000 Investment – Oldest Share Class(es)
Fund and index data from 12/31/09
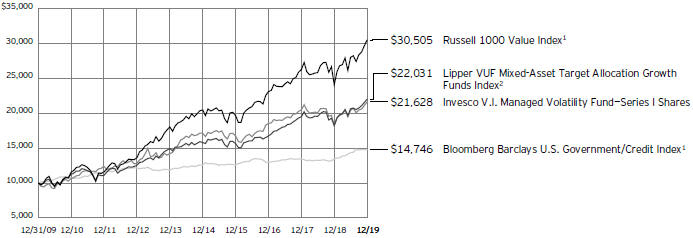
| 1 | Source: RIMES Technologies Corp. |
Past performance cannot guarantee future results.
| | | | |
Average Annual Total Returns | |
As of 12/31/19 | | | | |
| |
Series I Shares | | | | |
Inception (12/30/94) | | | 7.10 | % |
10 Years | | | 8.02 | |
5 Years | | | 4.78 | |
1 Year | | | 18.58 | |
| |
Series II Shares | | | | |
Inception (4/30/04) | | | 8.38 | % |
10 Years | | | 7.74 | |
5 Years | | | 4.51 | |
1 Year | | | 18.30 | |
The performance of the Fund’s Series I and Series II share classes will differ primarily due to different class expenses.
The performance data quoted represent past performance and cannot guarantee future results; current performance may be lower or higher. Please contact your variable product issuer or financial adviser for the most recent month-end variable product performance. Performance figures reflect Fund expenses, reinvested distributions and changes in net asset value. Performance figures do not reflect deduction of taxes a shareholder would pay on Fund distributions or sale of Fund shares. Investment return and principal value will fluctuate so that you may have a gain or loss when you sell shares.
The net annual Fund operating expense ratio set forth in the most recent Fund prospectus as of the date of this report for Series I and Series II shares was 1.13% and 1.38%, respectively.1 The total annual Fund operating expense ratio set forth in
the most recent Fund prospectus as of the date of this report for Series I and Series II shares was 1.14% and 1.39%, respectively. The expense ratios presented above may vary from the expense ratios presented in other sections of this report that are based on expenses incurred during the period covered by this report.
Invesco V.I. Managed Volatility Fund, a series portfolio of AIM Variable Insurance Funds (Invesco Variable Insurance Funds), is currently offered through insurance companies issuing variable products. You cannot purchase shares of the Fund directly. Performance figures given represent the Fund and are not intended to reflect actual variable product values. They do not reflect sales charges, expenses and fees assessed in connection with a variable product. Sales charges, expenses and fees, which are determined by the variable product issuers, will vary and will lower the total return.
The most recent month-end performance at the Fund level, excluding variable product charges, is available at 800 451 4246. As mentioned above, for the most recent month-end performance including variable product charges, please contact your variable product issuer or financial adviser.
Fund performance reflects any applicable fee waivers and/or expense reimbursements. Had the adviser not waived fees and/or reimbursed expenses currently or in the past, returns would have been lower. See current prospectus for more information.
| 1 | Total annual Fund operating expenses after any contractual fee waivers and/or expense reimbursements by the adviser in effect through at least June 30, 2021. See current prospectus for more information. |
Invesco V.I. Managed Volatility Fund
Invesco V.I. Managed Volatility Fund’s investment objective is both capital appreciation and current income while managing portfolio volatility.
| ∎ | Unless otherwise stated, information presented in this report is as of December 31, 2019, and is based on total net assets. |
| ∎ | Unless otherwise noted, all data provided by Invesco. |
| ∎ | To access your Fund’s reports/prospectus, visit invesco.com/fundreports. |
About indexes used in this report
| ∎ | TheRussell 1000® Value Indexis an unmanaged index considered representative of large-cap value stocks. The Russell 1000 Value Index is a trademark/service mark of the Frank Russell Co. Russell® is a trademark of the Frank Russell Co. |
| ∎ | TheBloomberg Barclays U.S. Government/Credit Indexis a broad-based benchmark that includes investment grade, US dollar-denominated, fixed-rate Treasuries, government-related and corporate securities. |
| ∎ | TheLipper VUF Mixed-Asset Target Allocation Growth Funds Indexis an unmanaged index considered representative of mixed-asset target allocation growth variable insurance underlying funds tracked by Lipper. |
| ∎ | The Fund is not managed to track the performance of any particular index, including the index(es) described here, and consequently, the performance of the Fund may deviate significantly from the performance of the index(es). |
| ∎ | A direct investment cannot be made in an index. Unless otherwise indicated, index results include reinvested dividends, and they do not reflect sales charges. Performance of the peer group, if applicable, reflects fund expenses; performance of a market index does not. |
Other information
∎ The returns shown in management’s discussion of Fund performance are based on net asset values calculated for shareholder transactions. Generally accepted accounting principles require adjustments to be made to the net assets of the Fund at period end for financial reporting purposes, and as such, the net asset values for shareholder transactions and the returns based on those net asset values may differ from the net asset values and returns reported in the Financial Highlights. Additionally, the returns and net asset values shown throughout this report are at the Fund level only and do not include variable product issuer charges. If such charges were included, the total returns would be lower.
| ∎ | Industry classifications used in this report are generally according to the Global Industry Classification Standard, which was developed by and is the exclusive property and a service mark of MSCI Inc. and Standard & Poor’s. |
Invesco V.I. Managed Volatility Fund
Schedule of Investments(a)
December 31, 2019
| | | | | | | | |
| | | Shares | | | Value | |
|
Common Stocks & Other Equity Interests–60.40% | |
| | |
Aerospace & Defense–1.35% | | | | | | | | |
| | |
General Dynamics Corp. | | | 2,806 | | | $ | 494,838 | |
|
Apparel, Accessories & Luxury Goods–1.22% | |
| | |
Capri Holdings Ltd.(b) | | | 11,788 | | | | 449,712 | |
| | |
Automobile Manufacturers–1.61% | | | | | | | | |
| | |
General Motors Co. | | | 16,195 | | | | 592,737 | |
| | |
Building Products–0.88% | | | | | | | | |
| | |
Johnson Controls International PLC | | | 7,908 | | | | 321,935 | |
|
Cable & Satellite–1.70% | |
| | |
Charter Communications, Inc., Class A(b) | | | 726 | | | | 352,168 | |
Comcast Corp., Class A | | | 6,023 | | | | 270,854 | |
| | | | | | | | 623,022 | |
| | |
Commodity Chemicals–0.59% | | | | | | | | |
| | |
Dow, Inc. | | | 3,990 | | | | 218,373 | |
| | |
Communications Equipment–0.60% | | | | | | | | |
| | |
Cisco Systems, Inc. | | | 4,585 | | | | 219,897 | |
|
Diversified Banks–5.97% | |
| | |
Bank of America Corp. | | | 22,834 | | | | 804,214 | |
Citigroup, Inc. | | | 9,097 | | | | 726,759 | |
JPMorgan Chase & Co. | | | 2,853 | | | | 397,708 | |
Wells Fargo & Co. | | | 4,897 | | | | 263,459 | |
| | | | | | | | 2,192,140 | |
|
Electric Utilities–1.31% | |
| | |
Duke Energy Corp. | | | 1,353 | | | | 123,407 | |
Exelon Corp. | | | 4,026 | | | | 183,545 | |
FirstEnergy Corp. | | | 3,571 | | | | 173,551 | |
| | | | | | | | 480,503 | |
|
Fertilizers & Agricultural Chemicals–1.45% | |
| | |
Corteva, Inc. | | | 12,616 | | | | 372,929 | |
Nutrien Ltd. (Canada) | | | 3,364 | | | | 161,169 | |
| | | | | | | | 534,098 | |
|
Food Distributors–1.06% | |
| | |
US Foods Holding Corp.(b) | | | 9,326 | | | | 390,666 | |
|
Health Care Distributors–0.83% | |
| | |
McKesson Corp. | | | 2,214 | | | | 306,241 | |
|
Health Care Equipment–1.62% | |
| | |
Medtronic PLC | | | 2,537 | | | | 287,823 | |
Zimmer Biomet Holdings, Inc. | | | 2,058 | | | | 308,041 | |
| | | | | | | | 595,864 | |
| | | | | | | | |
| | | Shares | | | Value | |
|
Health Care Services–0.98% | |
| | |
CVS Health Corp. | | | 4,863 | | | $ | 361,272 | |
|
Health Care Supplies–0.40% | |
| | |
Alcon, Inc. (Switzerland)(b) | | | 2,584 | | | | 146,383 | |
|
Home Improvement Retail–0.56% | |
| | |
Kingfisher PLC (United Kingdom) | | | 70,708 | | | | 205,058 | |
|
Hotels, Resorts & Cruise Lines–1.26% | |
| | |
Carnival Corp. | | | 9,078 | | | | 461,435 | |
|
Industrial Machinery–0.98% | |
| | |
Ingersoll-Rand PLC | | | 2,700 | | | | 358,884 | |
|
Insurance Brokers–0.91% | |
| | |
Willis Towers Watson PLC | | | 1,660 | | | | 335,220 | |
|
Integrated Oil & Gas–3.01% | |
| | |
BP PLC (United Kingdom) | | | 56,053 | | | | 351,864 | |
Chevron Corp. | | | 2,861 | | | | 344,779 | |
Royal Dutch Shell PLC, Class A (United Kingdom) | | | 13,814 | | | | 410,614 | |
| | | | | | | | 1,107,257 | |
|
Internet & Direct Marketing Retail–0.78% | |
| | |
eBay, Inc. | | | 7,963 | | | | 287,544 | |
|
Investment Banking & Brokerage–2.82% | |
| | |
Goldman Sachs Group, Inc. (The) | | | 1,987 | | | | 456,871 | |
Morgan Stanley | | | 11,308 | | | | 578,065 | |
| | | | | | | | 1,034,936 | |
|
IT Consulting & Other Services–1.00% | |
| | |
Cognizant Technology Solutions Corp., Class A | | | 5,937 | | | | 368,213 | |
|
Managed Health Care–0.72% | |
| | |
Anthem, Inc. | | | 872 | | | | 263,370 | |
|
Multi-line Insurance–1.85% | |
| | |
American International Group, Inc. | | | 13,249 | | | | 680,071 | |
|
Oil & Gas Equipment & Services–0.74% | |
| | |
TechnipFMC PLC (United Kingdom) | | | 12,662 | | | | 271,473 | |
|
Oil & Gas Exploration & Production–2.34% | |
| | |
Canadian Natural Resources Ltd. (Canada) | | | 7,614 | | | | 246,265 | |
Devon Energy Corp. | | | 12,105 | | | | 314,367 | |
Marathon Oil Corp. | | | 21,901 | | | | 297,416 | |
| | | | | | | | 858,048 | |
|
Other Diversified Financial Services–1.37% | |
| | |
AXA Equitable Holdings, Inc. | | | 8,100 | | | | 200,718 | |
Voya Financial, Inc. | | | 4,935 | | | | 300,936 | |
| | | | | | | | 501,654 | |
Invesco V.I. Managed Volatility Fund
| | | | | | | | |
| | | Shares | | | Value | |
|
Packaged Foods & Meats–1.87% | |
| | |
Kellogg Co. | | | 3,625 | | | $ | 250,705 | |
Mondelez International, Inc., Class A | | | 7,908 | | | | 435,573 | |
| | | | | | | | 686,278 | |
|
Pharmaceuticals–5.40% | |
| | |
Bristol-Myers Squibb Co. | | | 7,312 | | | | 469,357 | |
GlaxoSmithKline PLC (United Kingdom) | | | 7,350 | | | | 172,915 | |
Johnson & Johnson | | | 5,635 | | | | 821,977 | |
Pfizer, Inc. | | | 5,538 | | | | 216,979 | |
Sanofi (France) | | | 3,005 | | | | 301,814 | |
| | | | | | | | 1,983,042 | |
|
Railroads–1.00% | |
| | |
CSX Corp. | | | 5,054 | | | | 365,708 | |
|
Regional Banks–3.98% | |
| | |
Citizens Financial Group, Inc. | | | 11,541 | | | | 468,680 | |
PNC Financial Services Group, Inc. (The) | | | 3,652 | | | | 582,969 | |
Truist Financial Corp. | | | 7,280 | | | | 410,009 | |
| | | | | | | | 1,461,658 | |
|
Semiconductors–2.68% | |
| | |
Intel Corp. | | | 6,595 | | | | 394,711 | |
NXP Semiconductors N.V. (Netherlands) | | | 1,902 | | | | 242,048 | |
QUALCOMM, Inc. | | | 3,918 | | | | 345,685 | |
| | | | | | | | 982,444 | |
|
Specialty Chemicals–0.51% | |
| | |
DuPont de Nemours, Inc. | | | 2,944 | | | | 189,005 | |
|
Systems Software–1.16% | |
| | |
Oracle Corp. | | | 8,046 | | | | 426,277 | |
|
Technology Hardware, Storage & Peripherals–1.05% | |
| | |
Apple, Inc. | | | 1,317 | | | | 386,737 | |
|
Tobacco–2.06% | |
| | |
Philip Morris International, Inc. | | | 8,887 | | | | 756,195 | |
|
Wireless Telecommunication Services–0.78% | |
| | |
Vodafone Group PLC (United Kingdom) | | | 147,262 | | | | 285,890 | |
Total Common Stocks & Other Equity Interests (Cost $17,598,002) | | | | 22,184,078 | |
| | |
| | | Principal
Amount | | | | |
|
U.S. Dollar Denominated Bonds & Notes–26.70% | |
|
Aerospace & Defense–0.25% | |
| | |
General Dynamics Corp., 2.88%, 05/11/2020 | | $ | 10,000 | | | | 10,035 | |
Northrop Grumman Corp., 2.08%, 10/15/2020 | | | 35,000 | | | | 35,042 | |
Raytheon Co., 3.13%, 10/15/2020 | | | 35,000 | | | | 35,340 | |
United Technologies Corp., 4.45%, 11/16/2038 | | | 9,000 | | | | 10,649 | |
| | | | | | | | 91,066 | |
| | | | | | | | |
| | | Principal
Amount | | | Value | |
|
Air Freight & Logistics–0.01% | |
| | |
United Parcel Service, Inc., 3.40%, 11/15/2046 | | $ | 4,000 | | | $ | 3,990 | |
|
Airlines–0.16% | |
| | |
American Airlines Pass Through Trust, Series 2014-1, Class A, 3.70%, 04/01/2028 | | | 18,163 | | | | 19,142 | |
United Airlines Pass Through Trust,
Series 2014-2, Class A, 3.75%, 09/03/2026 | | | 23,208 | | | | 24,503 | |
Series 2018-1, Class AA, 3.50%, 03/01/2030 | | | 16,283 | | | | 16,791 | |
| | | | | 60,436 | |
|
Alternative Carriers–0.32% | |
| | |
GCI Liberty, Inc., Conv., 1.75%, 10/05/2023(c)(d) | | | 85,000 | | | | 117,428 | |
|
Application Software–0.85% | |
| | |
Nuance Communications, Inc., Conv., | | | | | | | | |
1.00%, 12/15/2022(d) | | | 127,000 | | | | 128,191 | |
1.25%, 04/01/2025 | | | 49,000 | | | | 54,674 | |
RealPage, Inc., Conv., 1.50%, 11/15/2022 | | | 24,000 | | | | 33,510 | |
Workday, Inc., Conv., 0.25%, 10/01/2022 | | | 75,000 | | | | 96,182 | |
| | | | | 312,557 | |
|
Asset Management & Custody Banks–0.48% | |
| | |
Apollo Management Holdings L.P., 4.00%, 05/30/2024(c) | | | 40,000 | | | | 42,363 | |
Brookfield Asset Management, Inc. (Canada), 4.00%, 01/15/2025 | | | 25,000 | | | | 26,885 | |
Carlyle Holdings Finance LLC, 3.88%,
02/01/2023(c) | | | 5,000 | | | | 5,167 | |
KKR Group Finance Co. III LLC, 5.13%,
06/01/2044(c) | | | 85,000 | | | | 100,546 | |
| | | | | 174,961 | |
|
Automobile Manufacturers–0.67% | |
| | |
Ford Motor Credit Co. LLC, 4.13%, 08/04/2025 | | | 200,000 | | | | 202,770 | |
General Motors Co., 6.60%, 04/01/2036 | | | 16,000 | | | | 18,876 | |
General Motors Financial Co., Inc., 5.25%, 03/01/2026 | | | 21,000 | | | | 23,322 | |
| | | | | 244,968 | |
|
Biotechnology–1.03% | |
| | |
AbbVie, Inc., | | | | | | | | |
4.50%, 05/14/2035 | | | 38,000 | | | | 43,073 | |
4.05%, 11/21/2039(c) | | | 34,000 | | | | 36,053 | |
| | |
BioMarin Pharmaceutical, Inc., Conv., 1.50%, 10/15/2020 | | | 117,000 | | | | 127,390 | |
| | |
Gilead Sciences, Inc., | | | | | | | | |
2.55%, 09/01/2020 | | | 50,000 | | | | 50,218 | |
4.40%, 12/01/2021 | | | 25,000 | | | | 26,087 | |
Invesco V.I. Managed Volatility Fund
| | | | | | | | |
| | | Principal Amount | | | Value | |
|
Biotechnology–(continued) | |
| | |
Neurocrine Biosciences, Inc., Conv., 2.25%, 05/15/2024 | | $ | 62,000 | | | $ | 95,250 | |
| | | | | | | | 378,071 | |
|
Brewers–0.44% | |
| | |
Anheuser-Busch Cos. LLC/Anheuser-Busch InBev Worldwide, Inc. (Belgium), | | | | | | | | |
4.70%, 02/01/2036 | | | 45,000 | | | | 51,980 | |
4.90%, 02/01/2046 | | | 47,000 | | | | 55,670 | |
Heineken N.V. (Netherlands), 3.50%, 01/29/2028(c) | | | 35,000 | | | | 37,082 | |
Molson Coors Beverage Co., 4.20%, 07/15/2046 | | | 16,000 | | | | 15,951 | |
| | | | | | | | 160,683 | |
|
Broadcasting–1.26% | |
| | |
Liberty Media Corp., Conv., | | | | | | | | |
2.25%, 10/05/2021(d) | | | 55,000 | | | | 31,927 | |
1.38%, 10/15/2023 | | | 299,000 | | | | 403,082 | |
Liberty Formula One, Conv., 1.00%, 01/30/2023 | | | 20,000 | | | | 26,654 | |
| | | | | | | | 461,663 | |
|
Cable & Satellite–1.34% | |
| | |
Charter Communications Operating LLC/Charter Communications Operating Capital Corp., 4.46%, 07/23/2022 | | | 60,000 | | | | 63,060 | |
Comcast Corp., | | | | | | | | |
4.15%, 10/15/2028 | | | 30,000 | | | | 33,774 | |
3.90%, 03/01/2038 | | | 10,000 | | | | 11,070 | |
4.60%, 10/15/2038 | | | 10,000 | | | | 11,914 | |
Discovery Communications LLC, 2.80%, 06/15/2020 | | | 85,000 | | | | 85,226 | |
DISH Network Corp., Conv., 3.38%, 08/15/2026 | | | 216,000 | | | | 208,310 | |
Liberty Latin America Ltd. (Chile), Conv., 2.00%, 07/15/2024(c) | | | 74,000 | | | | 79,458 | |
| | | | | | | | 492,812 | |
|
Communications Equipment–0.59% | |
| | |
Finisar Corp., Conv., 0.50%, 12/15/2021(d) | | | 39,000 | | | | 38,961 | |
Viavi Solutions, Inc., Conv., | | | | | | | | |
1.75%, 06/01/2023 | | | 71,000 | | | | 89,456 | |
1.00%, 03/01/2024 | | | 68,000 | | | | 87,890 | |
| | | | | | | | 216,307 | |
|
Consumer Finance–0.12% | |
| | |
American Express Co., 3.63%, 12/05/2024 | | | 18,000 | | | | 19,025 | |
Capital One Financial Corp., 3.20%, 01/30/2023 | | | 15,000 | | | | 15,423 | |
Synchrony Financial, 3.95%, 12/01/2027 | | | 10,000 | | | | 10,507 | |
| | | | | | | | 44,955 | |
| | | | | | | | |
| | | Principal Amount | | | Value | |
|
Data Processing & Outsourced Services–0.10% | |
| | |
Euronet Worldwide, Inc., Conv., 0.75%,
03/15/2025(c)(d) | | $ | 17,000 | | | $ | 20,320 | |
Fiserv, Inc., 3.80%, 10/01/2023 | | | 15,000 | | | | 15,843 | |
| | | | | | | | 36,163 | |
|
Diversified Banks–2.00% | |
| | |
Bank of America Corp., 3.25%, 10/21/2027 | | | 10,000 | | | | 10,421 | |
Citigroup, Inc., | | | | | | | | |
4.00%, 08/05/2024 | | | 60,000 | | | | 64,249 | |
3.67%, (3 mo. USD LIBOR + 1.39%), 07/24/2028(e) | | | 15,000 | | | | 15,985 | |
4.75%, 05/18/2046 | | | 15,000 | | | | 18,001 | |
Commonwealth Bank of Australia (Australia), 2.25%, 03/10/2020(c) | | | 40,000 | | | | 40,024 | |
JPMorgan Chase & Co., Series V, 5.23%(f) | | | 150,000 | | | | 151,312 | |
3.20%, 06/15/2026 | | | 15,000 | | | | 15,669 | |
3.51%, (3 mo. USD LIBOR + 0.95%), 01/23/2029(e) | | | 15,000 | | | | 15,936 | |
4.26%, (3 mo. USD LIBOR + 1.58%), 02/22/2048(e) | | | 10,000 | | | | 11,853 | |
3.90%, (3 mo. USD LIBOR + 1.22%), 01/23/2049(e) | | | 15,000 | | | | 16,853 | |
Toronto-Dominion Bank (The) (Canada), 2.65%, 06/12/2024 | | | 15,000 | | | | 15,362 | |
U.S. Bancorp, Series W, 3.10%, 04/27/2026 | | | 10,000 | | | | 10,408 | |
Wells Fargo & Co., | | | | | | | | |
3.55%, 09/29/2025 | | | 30,000 | | | | 31,769 | |
4.10%, 06/03/2026 | | | 95,000 | | | | 102,441 | |
4.65%, 11/04/2044 | | | 100,000 | | | | 117,444 | |
Westpac Banking Corp. (Australia), 2.10%, 05/13/2021 | | | 95,000 | | | | 95,284 | |
| | | | | | | | 733,011 | |
|
Diversified Capital Markets–0.68% | |
| | |
Credit Suisse AG (Switzerland), Conv., 0.50%, 06/24/2024(c) | | | 260,000 | | | | 249,340 | |
|
Drug Retail–0.16% | |
| | |
Walgreens Boots Alliance, Inc., | | | | | | | | |
3.30%, 11/18/2021 | | | 32,000 | | | | 32,607 | |
4.50%, 11/18/2034 | | | 24,000 | | | | 25,029 | |
| | | | | | | | 57,636 | |
|
Electric Utilities–0.15% | |
| | |
Georgia Power Co., 2.00%, 03/30/2020 | | | 35,000 | | | | 34,996 | |
NextEra Energy Capital Holdings, Inc., 3.55%, 05/01/2027 | | | 11,000 | | | | 11,684 | |
Xcel Energy, Inc., 3.50%, 12/01/2049 | | | 7,000 | | | | 7,125 | |
| | | | | | | | 53,805 | |
|
Environmental & Facilities Services–0.07% | |
| | |
Waste Management, Inc., 3.90%, 03/01/2035 | | | 25,000 | | | | 27,544 | |
Invesco V.I. Managed Volatility Fund
| | | | | | | | |
| | | Principal Amount | | | Value | |
|
Food Retail–0.03% | |
| | |
Kraft Heinz Foods Co., 4.63%, 10/01/2039(c) | | $ | 10,000 | | | $ | 10,414 | |
|
General Merchandise Stores–0.06% | |
| | |
Dollar General Corp., 3.25%, 04/15/2023 | | | 20,000 | | | | 20,657 | |
|
Health Care Equipment–1.70% | |
| | |
Becton, Dickinson and Co., 4.88%, 05/15/2044 | | | 86,000 | | | | 99,505 | |
DexCom, Inc., Conv., | | | | | | | | |
0.75%, 05/15/2022 | | | 32,000 | | | | 71,237 | |
0.75%, 12/01/2023 | | | 86,000 | | | | 127,598 | |
Medtronic, Inc., | | | | | | | | |
3.15%, 03/15/2022 | | | 23,000 | | | | 23,653 | |
4.38%, 03/15/2035 | | | 15,000 | | | | 17,761 | |
NuVasive, Inc., Conv., 2.25%, 03/15/2021 | | | 80,000 | | | | 106,785 | |
Wright Medical Group N.V., Conv., 2.25%, 11/15/2021 | | | 39,000 | | | | 56,630 | |
Wright Medical Group, Inc., Conv., 1.63%, 06/15/2023 | | | 113,000 | | | | 119,643 | |
| | | | | | | | 622,812 | |
|
Health Care REITs–0.07% | |
| | |
Healthpeak Properties, Inc., 3.88%, 08/15/2024 | | | 25,000 | | | | 26,591 | |
|
Health Care Services–0.29% | |
| | |
Cigna Corp., 4.80%, 08/15/2038 | | | 9,000 | | | | 10,506 | |
CVS Health Corp., | | | | | | | | |
3.38%, 08/12/2024 | | | 20,000 | | | | 20,815 | |
4.10%, 03/25/2025 | | | 16,000 | | | | 17,173 | |
Laboratory Corp. of America Holdings, | | | | | | | | |
3.20%, 02/01/2022 | | | 33,000 | | | | 33,750 | |
4.70%, 02/01/2045 | | | 22,000 | | | | 24,739 | |
| | | | | | | | 106,983 | |
|
Home Improvement Retail–0.07% | |
| | |
Home Depot, Inc. (The), 2.00%, 04/01/2021 | | | 27,000 | | | | 27,059 | |
|
Insurance Brokers–0.01% | |
| | |
Willis North America, Inc., 3.60%, 05/15/2024 | | | 5,000 | | | | 5,223 | |
|
Integrated Oil & Gas–0.11% | |
| | |
Occidental Petroleum Corp., | | | | | | | | |
3.40%, 04/15/2026 | | | 15,000 | | | | 15,399 | |
3.20%, 08/15/2026 | | | 7,000 | | | | 7,089 | |
Suncor Energy, Inc. (Canada), 3.60%, 12/01/2024 | | | 18,000 | | | | 19,099 | |
| | | | | | | | 41,587 | |
| | | | | | | | |
| | | Principal Amount | | | Value | |
|
Integrated Telecommunication Services–1.75% | |
| | |
AT&T, Inc., | | | | | | | | |
3.00%, 06/30/2022 | | $ | 28,000 | | | $ | 28,617 | |
3.40%, 05/15/2025 | | | 15,000 | | | | 15,723 | |
4.50%, 05/15/2035 | | | 25,000 | | | | 27,844 | |
5.15%, 03/15/2042 | | | 150,000 | | | | 175,144 | |
4.80%, 06/15/2044 | | | 40,000 | | | | 45,583 | |
Telefonica Emisiones S.A. (Spain), 7.05%, 06/20/2036 | | | 150,000 | | | | 209,815 | |
Verizon Communications, Inc., 4.40%, 11/01/2034 | | | 120,000 | | | | 139,045 | |
| | | | | | | | 641,771 | |
|
Interactive Media & Services–0.17% | |
| | |
JOYY, Inc. (China), Conv., 1.38%, 06/15/2024(c)(d) | | | 69,000 | | | | 62,423 | |
|
Internet & Direct Marketing Retail–0.77% | |
| | |
Amazon.com, Inc., 4.80%, 12/05/2034 | | | 9,000 | | | | 11,342 | |
IAC Financeco 3, Inc., Conv., 2.00%, 01/15/2030(c) | | | 94,000 | | | | 110,036 | |
QVC, Inc., 5.45%, 08/15/2034 | | | 50,000 | | | | 47,996 | |
Trip.com Group Ltd. (China), Conv., 1.25%, 09/15/2022 | | | 113,000 | | | | 112,847 | |
| | | | | | | | 282,221 | |
|
Investment Banking & Brokerage–0.74% | |
| | |
Goldman Sachs Group, Inc. (The), 4.25%, 10/21/2025 | | | 27,000 | | | | 29,318 | |
GS Finance Corp., Series 0001, Conv., 0.25%, 07/08/2024 | | | 198,000 | | | | 203,544 | |
Morgan Stanley, 4.00%, 07/23/2025 | | | 35,000 | | | | 37,873 | |
| | | | | | | | 270,735 | |
|
Life & Health Insurance–0.42% | |
| | |
Athene Global Funding, 4.00%, 01/25/2022(c) | | | 45,000 | | | | 46,483 | |
Guardian Life Global Funding, 2.90%, 05/06/2024(c) | | | 20,000 | | | | 20,554 | |
Jackson National Life Global Funding, 2.10%, 10/25/2021(c) | | | 10,000 | | | | 10,025 | |
3.25%, 01/30/2024(c) | | | 15,000 | | | | 15,561 | |
Nationwide Financial Services, Inc., 5.30%, 11/18/2044(c) | | | 35,000 | | | | 39,886 | |
Reliance Standard Life Global Funding II, 3.05%, 01/20/2021(c) | | | 20,000 | | | | 20,216 | |
| | | | | | | | 152,725 | |
|
Managed Health Care–0.04% | |
| | |
UnitedHealth Group, Inc., 3.50%, 08/15/2039 | | | 16,000 | | | | 16,794 | |
|
Movies & Entertainment–0.21% | |
| | |
Live Nation Entertainment, Inc., Conv., 2.50%, 03/15/2023 | | | 62,000 | | | | 75,758 | |
|
Multi-line Insurance–0.18% | |
| | |
American Financial Group, Inc., 4.50%, 06/15/2047 | | | 20,000 | | | | 21,615 | |
Invesco V.I. Managed Volatility Fund
| | | | | | | | |
| | | Principal
Amount | | | Value | |
|
Multi-line Insurance–(continued) | |
| | |
American International Group, Inc., 4.38%, 01/15/2055 | | $ | 40,000 | | | $ | 43,847 | |
| | | | | 65,462 | |
|
Multi-Utilities–0.05% | |
| | |
NiSource, Inc., 4.38%, 05/15/2047 | | | 9,000 | | | | 9,969 | |
Sempra Energy, 3.80%, 02/01/2038 | | | 8,000 | | | | 8,351 | |
| | | | | 18,320 | |
|
Office REITs–0.48% | |
| | |
Highwoods Realty L.P., 3.20%, 06/15/2021 | | | 150,000 | | | | 151,928 | |
Office Properties Income Trust, 4.00%, 07/15/2022 | | | 25,000 | | | | 25,588 | |
| | | | | 177,516 | |
|
Oil & Gas Equipment & Services–0.23% | |
| | |
Helix Energy Solutions Group, Inc., Conv., 4.25%, 05/01/2022 | | | 40,000 | | | | 42,852 | |
Oil States International, Inc., Conv., 1.50%, 02/15/2023 | | | 46,000 | | | | 41,520 | |
| | | | | 84,372 | |
|
Oil & Gas Exploration & Production–0.08% | |
| | |
Cameron LNG LLC, 3.70%, 01/15/2039(c) | | | 16,000 | | | | 16,341 | |
ConocoPhillips Co., 4.15%, 11/15/2034 | | | 13,000 | | | | 14,594 | |
| | | | | 30,935 | |
|
Oil & Gas Storage & Transportation–0.44% | |
| | |
Energy Transfer Operating L.P., | | | | | | | | |
7.50%, 10/15/2020 | | | 20,000 | | | | 20,788 | |
4.20%, 09/15/2023 | | | 2,000 | | | | 2,100 | |
4.90%, 03/15/2035 | | | 19,000 | | | | 19,952 | |
Enterprise Products Operating LLC,
4.25%, 02/15/2048 | | | 10,000 | | | | 10,729 | |
Kinder Morgan, Inc., 5.30%, 12/01/2034 | | | 23,000 | | | | 27,085 | |
MPLX L.P., | | | | | | | | |
4.50%, 07/15/2023 | | | 65,000 | | | | 69,073 | |
4.50%, 04/15/2038 | | | 11,000 | | | | 11,186 | |
| | | | | 160,913 | |
|
Other Diversified Financial Services–1.93% | |
| | |
Convertible Trust - Consumer, Series 2018-1, 0.25%, 01/17/2024 | | | 160,000 | | | | 164,896 | |
Convertible Trust - Energy, Series 2019-1, 0.33%, 09/19/2024 | | | 168,000 | | | | 173,997 | |
Convertible Trust - Healthcare, Series 2018-1, 0.25%, 02/05/2024 | | | 168,000 | | | | 182,952 | |
Convertible Trust - Media, Series 2019, Class 1, 0.25%, 12/04/2024 | | | 168,000 | | | | 186,329 | |
| | | | | 708,174 | |
|
Packaged Foods & Meats–0.14% | |
| | |
J. M. Smucker Co. (The), 2.50%, 03/15/2020 | | | 50,000 | | | | 50,043 | |
| | | | | | | | |
| | | Principal Amount | | | Value | |
|
Packaged Foods & Meats–(continued) | |
| | |
Mead Johnson Nutrition Co. (United Kingdom), 4.13%, 11/15/2025 | | $ | 3,000 | | | $ | 3,279 | |
| | | | | 53,322 | |
|
Pharmaceuticals–1.83% | |
| | |
Allergan Funding S.C.S., 4.85%, 06/15/2044 | | | 150,000 | | | | 163,286 | |
Bayer US Finance LLC (Germany), 3.00%, 10/08/2021(c) | | | 200,000 | | | | 202,566 | |
Bristol-Myers Squibb Co., | | | | | | | | |
4.13%, 06/15/2039(c) | | | 18,000 | | | | 20,761 | |
4.63%, 05/15/2044(c) | | | 100,000 | | | | 121,169 | |
Jazz Investments I Ltd., Conv., 1.88%, 08/15/2021 | | | 76,000 | | | | 78,441 | |
Mylan N.V., 3.15%, 06/15/2021 | | | 17,000 | | | | 17,224 | |
Pacira BioSciences, Inc., Conv., 2.38%, 04/01/2022 | | | 39,000 | | | | 40,639 | |
Supernus Pharmaceuticals, Inc., Conv., 0.63%, 04/01/2023 | | | 33,000 | | | | 30,036 | |
| | | | | 674,122 | |
|
Property & Casualty Insurance–0.44% | |
| | |
Allstate Corp. (The), 3.28%, 12/15/2026 | | | 10,000 | | | | 10,562 | |
Liberty Mutual Group, Inc., 4.85%, 08/01/2044(c) | | | 115,000 | | | | 131,876 | |
Markel Corp., 5.00%, 05/20/2049 | | | 15,000 | | | | 17,650 | |
| | | | | 160,088 | |
|
Railroads–0.09% | |
| | |
Norfolk Southern Corp., 3.40%, 11/01/2049 | | | 5,000 | | | | 4,973 | |
Union Pacific Corp., 4.15%, 01/15/2045 | | | 25,000 | | | | 27,398 | |
| | | | | 32,371 | |
|
Regional Banks–0.10% | |
| | |
Citizens Financial Group, Inc., 2.38%, 07/28/2021 | | | 15,000 | | | | 15,074 | |
PNC Financial Services Group, Inc. (The), 3.45%, 04/23/2029 | | | 20,000 | | | | 21,335 | |
| | | | | 36,409 | |
|
Reinsurance–0.08% | |
| | |
PartnerRe Finance B LLC, 3.70%, 07/02/2029 | | | 30,000 | | | | 31,204 | |
|
Renewable Electricity–0.43% | |
| | |
Oglethorpe Power Corp., 4.55%, 06/01/2044 | | | 150,000 | | | | 157,343 | |
|
Restaurants–0.06% | |
| | |
Starbucks Corp., 3.55%, 08/15/2029 | | | 20,000 | | | | 21,684 | |
|
Retail REITs–0.01% | |
| | |
Regency Centers L.P., 2.95%, 09/15/2029 | | | 5,000 | | | | 4,996 | |
Invesco V.I. Managed Volatility Fund
| | | | | | | | |
| | | Principal Amount | | | Value | |
|
Semiconductor Equipment–0.18% | |
| | |
Applied Materials, Inc., 2.63%, 10/01/2020 | | $ | 65,000 | | | $ | 65,360 | |
|
Semiconductors–1.09% | |
| | |
Broadcom Corp./Broadcom Cayman Finance Ltd., 3.63%, 01/15/2024 | | | 30,000 | | | | 31,089 | |
Cree, Inc., Conv., 0.88%, 09/01/2023 | | | 98,000 | | | | 104,137 | |
Microchip Technology, Inc., Conv., 1.63%, 02/15/2027 | | | 74,000 | | | | 105,635 | |
NXP B.V./NXP Funding LLC (Netherlands), 5.35%, 03/01/2026(c) | | | 20,000 | | | | 22,553 | |
ON Semiconductor Corp., Conv., 1.00%, 12/01/2020 | | | 76,000 | | | | 103,473 | |
Silicon Laboratories, Inc., Conv., 1.38%, 03/01/2022 | | | 21,000 | | | | 27,963 | |
Texas Instruments, Inc., 2.63%, 05/15/2024 | | | 5,000 | | | | 5,132 | |
| | | | | 399,982 | |
|
Specialty Chemicals–0.01% | |
| | |
Sherwin-Williams Co. (The), 4.50%, 06/01/2047 | | | 3,000 | | | | 3,404 | |
|
Systems Software–0.52% | |
| | |
FireEye, Inc., | | | | | | | | |
Series A, Conv., 1.00%, 06/01/2020(d) | | | 76,000 | | | | 75,773 | |
Series B, Conv., 1.63%, 06/01/2022(d) | | | 77,000 | | | | 74,707 | |
Microsoft Corp., 3.50%, 02/12/2035 | | | 37,000 | | | | 40,737 | |
| | | | | 191,217 | |
|
Technology Distributors–0.09% | |
| | |
Avnet, Inc., 4.63%, 04/15/2026 | | | 30,000 | | | | 31,742 | |
|
Technology Hardware, Storage & Peripherals–0.72% | |
| | |
Apple, Inc., | | | | | | | | |
2.15%, 02/09/2022 | | | 39,000 | | | | 39,327 | |
3.35%, 02/09/2027 | | | 10,000 | | | | 10,649 | |
Dell International LLC/EMC Corp., 5.45%, 06/15/2023(c) | | | 26,000 | | | | 28,201 | |
SanDisk LLC, Conv., 0.50%, 10/15/2020 | | | 140,000 | | | | 127,530 | |
Western Digital Corp., Conv., 1.50%, 02/01/2024 | | | 61,000 | | | | 60,047 | |
| | | | | 265,754 | |
|
Tobacco–0.11% | |
| | |
Altria Group, Inc., 5.80%, 02/14/2039 | | | 36,000 | | | | 42,338 | |
|
Trading Companies & Distributors–0.13% | |
| | |
Air Lease Corp., 4.25%, 09/15/2024 | | | 35,000 | | | | 37,486 | |
| | | | | | | | |
| | | Principal Amount | | | Value | |
|
Trading Companies & Distributors–(continued) | |
| | |
Aircastle Ltd., 4.40%, 09/25/2023 | | $ | 10,000 | | | $ | 10,573 | |
| | | | | 48,059 | |
|
Trucking–0.12% | |
| | |
Aviation Capital Group LLC, 4.88%, 10/01/2025(c) | | | 40,000 | | | | 43,086 | |
|
Wireless Telecommunication Services–0.04% | |
| | |
Rogers Communications, Inc. (Canada),
4.30%, 02/15/2048 | | | 15,000 | | | | 16,685 | |
Total U.S. Dollar Denominated Bonds & Notes (Cost $8,969,250) | | | | 9,806,007 | |
|
U.S. Treasury Securities–7.78% | |
|
U.S. Treasury Bonds–0.49% | |
| | |
4.50%, 02/15/2036 | | | 75,000 | | | | 99,378 | |
2.25%, 08/15/2049 | | | 84,500 | | | | 81,901 | |
| | | | | | | | 181,279 | |
|
U.S. Treasury Floating Rate Notes–0.29% | |
| | |
1.75%, 12/31/2024 | | | 88,200 | | | | 88,400 | |
1.75%, 12/31/2026 | | | 19,300 | | | | 19,188 | |
| | | | | 107,588 | |
|
U.S. Treasury Notes–7.00% | |
| | |
1.63%, 12/31/2021 | | | 2,218,000 | | | | 2,220,238 | |
1.63%, 12/15/2022 | | | 290,000 | | | | 290,138 | |
1.75%, 11/15/2029 | | | 59,300 | | | | 58,366 | |
| | | | | | | | 2,568,742 | |
Total U.S. Treasury Securities
(Cost $2,844,883) | | | | 2,857,609 | |
| | |
| | | Shares | | | | |
|
Preferred Stocks–0.23% | |
|
Asset Management & Custody Banks–0.23% | |
| | |
AMG Capital Trust II, 5.15%, Conv. Pfd. (Cost $106,269) | | | 1,700 | | | | 82,450 | |
|
Money Market Funds–4.82% | |
| | |
Invesco Government & Agency Portfolio, Institutional Class, 1.50%(g) | | | 619,911 | | | | 619,911 | |
Invesco Liquid Assets Portfolio, Institutional Class, 1.71%(g) | | | 441,688 | | | | 441,820 | |
Invesco Treasury Portfolio, Institutional Class, 1.49%(g) | | | 708,469 | | | | 708,469 | |
Total Money Market Funds
(Cost $1,770,200) | | | | 1,770,200 | |
TOTAL INVESTMENTS IN
SECURITIES–99.93%
(Cost $31,288,604) | | | | 36,700,344 | |
OTHER ASSETS LESS LIABILITIES–0.07% | | | | 25,951 | |
NET ASSETS–100.00% | | | $ | 36,726,295 | |
Investment Abbreviations:
| | | | |
| Conv. | | - | | Convertible |
| LIBOR | | - | | London Interbank Offered Rate |
| Pfd. | | - | | Preferred |
| REIT | | - | | Real Estate Investment Trust |
| USD | | - | | U.S. Dollar |
Invesco V.I. Managed Volatility Fund
Notes to Schedule of Investments:
| (a) | Industry and/or sector classifications used in this report are generally according to the Global Industry Classification Standard, which was developed by and is the exclusive property and a service mark of MSCI Inc. and Standard & Poor’s. |
| (b) | Non-income producing security. |
| (c) | Security purchased or received in a transaction exempt from registration under the Securities Act of 1933, as amended (the “1933 Act”). The security may be resold pursuant to an exemption from registration under the 1933 Act, typically to qualified institutional buyers. The aggregate value of these securities at December 31, 2019 was $1,649,932, which represented 4.49% of the Fund’s Net Assets. |
| (d) | Security has an irrevocable call by the issuer or mandatory put by the holder. Maturity date reflects such call or put. |
| (e) | Interest or dividend rate is redetermined periodically. Rate shown is the rate in effect on December 31, 2019. |
| (f) | Perpetual bond with no specified maturity date. |
| (g) | The money market fund and the Fund are affiliated by having the same investment adviser. The rate shown is the 7-day SEC standardized yield as of December 31, 2019. |
| | | | | | | | | | | | | | |
| Open Forward Foreign Currency Contracts | |
| |
| | | | | | | | | | | Unrealized | |
| Settlement | | | | Contract to | | | Appreciation | |
| | | | | | | | | | |
| Date | | Counterparty | | Deliver | | | Receive | | | (Depreciation) | |
| |
| Currency Risk | | | | | | | | | | | |
| |
01/17/2020 | | State Street Bank & Trust Co. | | USD | 3,895 | | | CAD | 5,139 | | | | $ 63 | |
| |
01/17/2020 | | State Street Bank & Trust Co. | | USD | 1,939 | | | CHF | 1,899 | | | | 25 | |
| |
01/17/2020 | | State Street Bank & Trust Co. | | USD | 10,076 | | | EUR | 9,059 | | | | 94 | |
| |
01/17/2020 | | State Street Bank & Trust Co. | | USD | 34,413 | | | GBP | 26,132 | | | | 215 | |
| |
Subtotal–Appreciation | | | | | | | | 397 | |
| |
| | | | |
Currency Risk | | | | | | | | | | | | | | |
| |
01/17/2020 | | Bank of New York Mellon (The) | | GBP | 387,927 | | | USD | 502,284 | | | | (11,772) | |
| |
01/17/2020 | | State Street Bank & Trust Co. | | CAD | 242,467 | | | USD | 182,612 | | | | (4,125) | |
| |
01/17/2020 | | State Street Bank & Trust Co. | | CHF | 110,640 | | | USD | 111,799 | | | | (2,612) | |
| |
01/17/2020 | | State Street Bank & Trust Co. | | EUR | 213,249 | | | USD | 236,926 | | | | (2,484) | |
| |
01/17/2020 | | State Street Bank & Trust Co. | | GBP | 451,409 | | | USD | 585,784 | | | | (12,393) | |
| |
01/17/2020 | | State Street Bank & Trust Co. | | USD | 2,626 | | | CHF | 2,539 | | | | (1) | |
| |
Subtotal–Depreciation | | | | | | | | (33,387) | |
| |
Total Forward Foreign Currency Contracts | | | | | | | | $(32,990) | |
| |
Abbreviations:
CAD - Canadian Dollar
CHF - Swiss Franc
EUR - Euro
GBP - British Pound Sterling
USD - U.S. Dollar
Invesco V.I. Managed Volatility Fund
Statement of Assets and Liabilities
December 31, 2019
| | |
Assets: | | |
| |
Investments in securities, at value (Cost $29,518,404) | | $34,930,144 |
Investments in affiliated money market funds, at value (Cost $1,770,200) | | 1,770,200 |
Other investments: | | |
Unrealized appreciation on forward foreign currency contracts outstanding | | 397 |
Cash | | 840 |
Foreign currencies, at value (Cost $28,719) | | 28,825 |
Receivable for: | | |
Fund shares sold | | 30,856 |
Dividends | | 38,409 |
Interest | | 61,551 |
Investment for trustee deferred compensation and retirement plans | | 71,613 |
Total assets | | 36,932,835 |
| |
Liabilities: | | |
| |
Other investments: | | |
Unrealized depreciation on forward foreign currency contracts outstanding | | 33,387 |
Payable for: | | |
Investments purchased | | 1,831 |
Fund shares reacquired | | 19,339 |
Accrued fees to affiliates | | 17,159 |
Accrued other operating expenses | | 58,838 |
Trustee deferred compensation and retirement plans | | 75,986 |
Total liabilities | | 206,540 |
Net assets applicable to shares outstanding | | $36,726,295 |
| |
Net assets consist of: | | |
| |
Shares of beneficial interest | | $30,328,254 |
Distributable earnings | | 6,398,041 |
| | | $36,726,295 |
| |
Net Assets: | | |
| |
Series I | | $35,408,916 |
Series II | | $ 1,317,379 |
|
Shares outstanding, no par value, with an unlimited number of shares authorized: |
| |
Series I | | 2,852,985 |
Series II | | 107,410 |
Series I: | | |
Net asset value per share | | $ 12.41 |
Series II: | | |
Net asset value per share | | $ 12.26 |
Statement of Operations
For the year ended December 31, 2019
| | | | |
Investment income: | | | | |
| |
Dividends (net of foreign withholding taxes of $10,035) | | $ | 596,028 | |
| |
Interest | | | 327,206 | |
| |
Dividends from affiliated money market funds | | | 48,005 | |
| |
Total investment income | | | 971,239 | |
| |
| |
Expenses: | | | | |
| |
Advisory fees | | | 222,843 | |
| |
Administrative services fees | | | 61,341 | |
| |
Custodian fees | | | 9,572 | |
| |
Distribution fees - Series II | | | 3,219 | |
| |
Transfer agent fees | | | 18,521 | |
| |
Trustees’ and officers’ fees and benefits | | | 18,995 | |
| |
Reports to shareholders | | | 10,467 | |
| |
Professional services fees | | | 53,471 | |
| |
Other | | | 5,608 | |
| |
Total expenses | | | 404,037 | |
| |
Less: Fees waived | | | (2,546 | ) |
| |
Net expenses | | | 401,491 | |
| |
Net investment income | | | 569,748 | |
| |
| |
Realized and unrealized gain (loss) from: | | | | |
| |
Net realized gain (loss) from: | | | | |
Investment securities | | | 1,314,895 | |
| |
Foreign currencies | | | 9,796 | |
| |
Forward foreign currency contracts | | | 4,611 | |
| |
Futures contracts | | | (620,303 | ) |
| |
| | | 708,999 | |
| |
Change in net unrealized appreciation (depreciation) of: | |
Investment securities | | | 4,868,935 | |
| |
Foreign currencies | | | 308 | |
| |
Forward foreign currency contracts | | | (30,101 | ) |
| |
Futures contracts | | | 172,631 | |
| |
| | | 5,011,773 | |
| |
Net realized and unrealized gain | | | 5,720,772 | |
| |
Net increase in net assets resulting from operations | | $ | 6,290,520 | |
| |
See accompanying Notes to Financial Statements which are an integral part of the financial statements.
Invesco V.I. Managed Volatility Fund
Statement of Changes in Net Assets
For the years ended December 31, 2019 and 2018
| | | | | | | | |
| | | 2019 | | | 2018 | |
| |
Operations: | | | | | | | | |
Net investment income | | $ | 569,748 | | | $ | 521,300 | |
| |
Net realized gain | | | 708,999 | | | | 1,584,562 | |
| |
Change in net unrealized appreciation (depreciation) | | | 5,011,773 | | | | (6,547,229 | ) |
| |
Net increase (decrease) in net assets resulting from operations | | | 6,290,520 | | | | (4,441,367 | ) |
| |
| | |
Distributions to shareholders from distributable earnings: | | | | | | | | |
Series I | | | (1,896,583 | ) | | | (2,054,218 | ) |
| |
Series II | | | (63,708 | ) | | | (66,296 | ) |
| |
Total distributions from distributable earnings | | | (1,960,291 | ) | | | (2,120,514 | ) |
| |
| | |
Share transactions–net: | | | | | | | | |
Series I | | | (3,190,164 | ) | | | (3,342,378 | ) |
| |
Series II | | | (47,952 | ) | | | (11,717 | ) |
| |
Net increase (decrease) in net assets resulting from share transactions | | | (3,238,116 | ) | | | (3,354,095 | ) |
| |
Net increase (decrease) in net assets | | | 1,092,113 | | | | (9,915,976 | ) |
| |
| | |
Net assets: | | | | | | | | |
Beginning of year | | | 35,634,182 | | | | 45,550,158 | |
| |
End of year | | $ | 36,726,295 | | | $ | 35,634,182 | |
| |
See accompanying Notes to Financial Statements which are an integral part of the financial statements.
Invesco V.I. Managed Volatility Fund
Financial Highlights
The following schedule presents financial highlights for a share of the Fund outstanding throughout the periods indicated.
| | | | | | | | | | | | | | | | | | | | | | | | | | | | | | | | | | | | | | | | | | | | | | | | | | | | | | | | | | | | | | | | | | | | | | |
| | | | | | | | | | | | | | | | | | | | | | | Ratio of | | Ratio of | | | | |
| | | | | | | | | | | | | | | | | | | | | | | expenses | | expenses | | | | |
| | | | | | | Net gains | | | | | | | | | | | | | | | | to average | | to average net | | | | |
| | | | | | | (losses) | | | | | | | | | | | | | | | | net assets | | assets without | | Ratio of net | | |
| | | Net asset | | | | on securities | | | | Dividends | | Distributions | | | | | | | | | | with fee waivers | | fee waivers | | investment | | |
| | | value, | | Net | | (both | | Total from | | from net | | from net | | | | Net asset | | | | Net assets, | | and/or | | and/or | | income | | |
| | | beginning | | investment | | realized and | | investment | | investment | | realized | | Total | | value, end | | Total | | end of period | | expenses | | expenses | | to average | | Portfolio |
| | | of period | | income(a) | | unrealized) | | operations | | income | | gains | | distributions | | of period | | return (b) | | (000’s omitted) | | absorbed | | absorbed | | net assets | | turnover (c) |
Series I | | | | | | | | | | | | | | | | | | | | | | | | | | | | | | | | | | | | | | | | | | | | | | | | | | | | | | | | | | | | | | | | | | | | | | |
Year ended 12/31/19 | | | $ | 11.04 | | | | $ | 0.19 | | | | $ | 1.82 | | | | $ | 2.01 | | | | $ | (0.17 | ) | | | $ | (0.47 | ) | | | $ | (0.64 | ) | | | $ | 12.41 | | | | | 18.58 | % | | | $ | 35,409 | | | | | 1.07 | %(d) | | | | 1.08 | %(d) | | | | 1.55 | %(d) | | | | 109 | % |
Year ended 12/31/18 | | | | 13.06 | | | | | 0.16 | | | | | (1.51 | ) | | | | (1.35 | ) | | | | (0.22 | ) | | | | (0.45 | ) | | | | (0.67 | ) | | | | 11.04 | | | | | (11.00 | ) | | | | 34,420 | | | | | 1.23 | | | | | 1.24 | | | | | 1.24 | | | | | 111 | |
Year ended 12/31/17 | | | | 11.97 | | | | | 0.18 | (e) | | | | 1.08 | | | | | 1.26 | | | | | (0.17 | ) | | | | – | | | | | (0.17 | ) | | | | 13.06 | | | | | 10.56 | | | | | 44,104 | | | | | 1.13 | | | | | 1.13 | | | | | 1.42 | (e) | | | | 91 | |
Year ended 12/31/16 | | | | 11.38 | | | | | 0.14 | | | | | 1.03 | | | | | 1.17 | | | | | (0.22 | ) | | | | (0.36 | ) | | | | (0.58 | ) | | | | 11.97 | | | | | 10.61 | | | | | 50,183 | | | | | 1.15 | | | | | 1.16 | | | | | 1.26 | | | | | 92 | |
Year ended 12/31/15 | | | | 19.02 | | | | | 0.18 | | | | | (0.74 | ) | | | | (0.56 | ) | | | | (0.27 | ) | | | | (6.81 | ) | | | | (7.08 | ) | | | | 11.38 | | | | | (2.15 | ) | | | | 52,360 | | | | | 1.08 | | | | | 1.10 | | | | | 1.07 | | | | | 117 | |
Series II | | | | | | | | | | | | | | | | | | | | | | | | | | | | | | | | | | | | | | | | | | | | | | | | | | | | | | | | | | | | | | | | | | | | | | |
Year ended 12/31/19 | | | | 10.91 | | | | | 0.15 | | | | | 1.81 | | | | | 1.96 | | | | | (0.14 | ) | | | | (0.47 | ) | | | | (0.61 | ) | | | | 12.26 | | | | | 18.30 | | | | | 1,317 | | | | | 1.32 | (d) | | | | 1.33 | (d) | | | | 1.30 | (d) | | | | 109 | |
Year ended 12/31/18 | | | | 12.92 | | | | | 0.12 | | | | | (1.49 | ) | | | | (1.37 | ) | | | | (0.19 | ) | | | | (0.45 | ) | | | | (0.64 | ) | | | | 10.91 | | | | | (11.28 | ) | | | | 1,214 | | | | | 1.48 | | | | | 1.49 | | | | | 0.99 | | | | | 111 | |
Year ended 12/31/17 | | | | 11.84 | | | | | 0.15 | (e) | | | | 1.07 | | | | | 1.22 | | | | | (0.14 | ) | | | | – | | | | | (0.14 | ) | | | | 12.92 | | | | | 10.33 | | | | | 1,446 | | | | | 1.38 | | | | | 1.38 | | | | | 1.17 | (e) | | | | 91 | |
Year ended 12/31/16 | | | | 11.26 | | | | | 0.11 | | | | | 1.02 | | | | | 1.13 | | | | | (0.19 | ) | | | | (0.36 | ) | | | | (0.55 | ) | | | | 11.84 | | | | | 10.31 | | | | | 1,462 | | | | | 1.40 | | | | | 1.41 | | | | | 1.01 | | | | | 92 | |
Year ended 12/31/15 | | | | 18.88 | | | | | 0.13 | | | | | (0.72 | ) | | | | (0.59 | ) | | | | (0.22 | ) | | | | (6.81 | ) | | | | (7.03 | ) | | | | 11.26 | | | | | (2.37 | ) | | | | 1,500 | | | | | 1.33 | | | | | 1.35 | | | | | 0.82 | | | | | 117 | |
| (a) | Calculated using average shares outstanding. |
| (b) | Includes adjustments in accordance with accounting principles generally accepted in the United States of America and as such, the net asset value for financial reporting purposes and the returns based upon those net asset values may differ from the net asset value and returns for shareholder transactions. Total returns are not annualized for periods less than one year, if applicable, and do not reflect charges assessed in connection with a variable product, which if included would reduce total returns. |
| (c) | Portfolio turnover is calculated at the fund level and is not annualized for periods less than one year, if applicable. |
| (d) | Ratios are based on average daily net assets (000’s omitted) of $35,853 and $1,288 for Series I and Series II shares, respectively. |
| (e) | Net investment income per share and the ratio of net investment income to average net assets includes significant dividends received during the year ended December 31, 2017. Net investment income per share and the ratio of net investment income to average net assets excluding the significant dividends are $0.14 and 1.11% and $0.11 and 0.86% for Series I and Series II shares, respectively. |
See accompanying Notes to Financial Statements which are an integral part of the financial statements.
Invesco V.I. Managed Volatility Fund
Notes to Financial Statements
December 31, 2019
NOTE 1–Significant Accounting Policies
Invesco V.I. Managed Volatility Fund (the “Fund”) is a series portfolio of AIM Variable Insurance Funds (Invesco Variable Insurance Funds) (the “Trust”). The Trust is a Delaware statutory trust registered under the Investment Company Act of 1940, as amended (the “1940 Act”), as an open-end series management investment company. Information presented in these financial statements pertains only to the Fund. Matters affecting the Fund or each class will be voted on exclusively by the shareholders of the Fund or each class. Current Securities and Exchange Commission (“SEC”) guidance, however, requires participating insurance companies offering separate accounts to vote shares proportionally in accordance with the instructions of the contract owners whose investments are funded by shares of each Fund or class.
The Fund’s investment objective is both capital appreciation and current income while managing portfolio volatility.
The Fund currently offers two classes of shares, Series I and Series II, both of which are offered to insurance company separate accounts funding variable annuity contracts and variable life insurance policies (“variable products”).
The Fund is an investment company and accordingly follows the investment company accounting and reporting guidance in accordance with Financial Accounting Standards Board Accounting Standards Codification Topic 946,Financial Services – Investment Companies.
The following is a summary of the significant accounting policies followed by the Fund in the preparation of its financial statements.
| A. | Security Valuations– Securities, including restricted securities, are valued according to the following policy. |
A security listed or traded on an exchange (except convertible securities) is valued at its last sales price or official closing price as of the close of the customary trading session on the exchange where the security is principally traded, or lacking any sales or official closing price on a particular day, the security may be valued at the closing bid price on that day. Securities traded in the over-the-counter market are valued based on prices furnished by independent pricing services or market makers. When such securities are valued by an independent pricing service they may be considered fair valued. Futures contracts are valued at the final settlement price set by an exchange on which they are principally traded. Listed options are valued at the mean between the last bid and asked prices from the exchange on which they are principally traded. Options not listed on an exchange are valued by an independent source at the mean between the last bid and asked prices. For purposes of determining net asset value (“NAV”) per share, futures and option contracts generally are valued 15 minutes after the close of the customary trading session of the New York Stock Exchange (“NYSE”).
Investments in open-end and closed-end registered investment companies that do not trade on an exchange are valued at the end-of-day net asset value per share. Investments in open-end and closed-end registered investment companies that trade on an exchange are valued at the last sales price or official closing price as of the close of the customary trading session on the exchange where the security is principally traded.
Debt obligations (including convertible securities) and unlisted equities are fair valued using an evaluated quote provided by an independent pricing service. Evaluated quotes provided by the pricing service may be determined without exclusive reliance on quoted prices, and may reflect appropriate factors such as institution-size trading in similar groups of securities, developments related to specific securities, dividend rate (for unlisted equities), yield (for debt obligations), quality, type of issue, coupon rate (for debt obligations), maturity (for debt obligations), individual trading characteristics and other market data. Pricing services generally value debt obligations assuming orderly transactions of institutional round lot size, but a fund may hold or transact in the same securities in smaller, odd lot sizes. Odd lots often trade at lower prices than institutional round lots. Debt obligations are subject to interest rate and credit risks. In addition, all debt obligations involve some risk of default with respect to interest and/or principal payments.
Foreign securities’ (including foreign exchange contracts) prices are converted into U.S. dollar amounts using the applicable exchange rates as of the close of the NYSE. If market quotations are available and reliable for foreign exchange-traded equity securities, the securities will be valued at the market quotations. Because trading hours for certain foreign securities end before the close of the NYSE, closing market quotations may become unreliable. If between the time trading ends on a particular security and the close of the customary trading session on the NYSE, events occur that the investment adviser determines are significant and make the closing price unreliable, the Fund may fair value the security. If the event is likely to have affected the closing price of the security, the security will be valued at fair value in good faith using procedures approved by the Board of Trustees. Adjustments to closing prices to reflect fair value may also be based on a screening process of an independent pricing service to indicate the degree of certainty, based on historical data, that the closing price in the principal market where a foreign security trades is not the current value as of the close of the NYSE. Foreign securities’ prices meeting the approved degree of certainty that the price is not reflective of current value will be priced at the indication of fair value from the independent pricing service. Multiple factors may be considered by the independent pricing service in determining adjustments to reflect fair value and may include information relating to sector indices, American Depositary Receipts and domestic and foreign index futures. Foreign securities may have additional risks including exchange rate changes, potential for sharply devalued currencies and high inflation, political and economic upheaval, the relative lack of issuer information, relatively low market liquidity and the potential lack of strict financial and accounting controls and standards.
Securities for which market prices are not provided by any of the above methods may be valued based upon quotes furnished by independent sources. The last bid price may be used to value equity securities. The mean between the last bid and asked prices is used to value debt obligations, including corporate loans.
Securities for which market quotations are not readily available or became unreliable are valued at fair value as determined in good faith by or under the supervision of the Trust’s officers following procedures approved by the Board of Trustees. Issuer specific events, market trends, bid/asked quotes of brokers and information providers and other market data may be reviewed in the course of making a good faith determination of a security’s fair value.
The Fund may invest in securities that are subject to interest rate risk, meaning the risk that the prices will generally fall as interest rates rise and, conversely, the prices will generally rise as interest rates fall. Specific securities differ in their sensitivity to changes in interest rates depending on their individual characteristics. Changes in interest rates may result in increased market volatility, which may affect the value and/or liquidity of certain Fund investments.
Invesco V.I. Managed Volatility Fund
Valuations change in response to many factors including the historical and prospective earnings of the issuer, the value of the issuer’s assets, general economic conditions, interest rates, investor perceptions and market liquidity. Because of the inherent uncertainties of valuation, the values reflected in the financial statements may materially differ from the value received upon actual sale of those investments.
| B. | Securities Transactions and Investment Income– Securities transactions are accounted for on a trade date basis. Realized gains or losses on sales are computed on the basis of specific identification of the securities sold. Interest income (net of withholding tax, if any) is recorded on the accrual basis from settlement date. Bond premiums and discounts are amortized and/or accreted over the lives of the respective securities. Pay-in-kind interest income and non-cash dividend income received in the form of securities in-lieu of cash are recorded at the fair value of the securities received. Dividend income (net of withholding tax, if any) is recorded on the ex-dividend date. |
The Fund may periodically participate in litigation related to Fund investments. As such, the Fund may receive proceeds from litigation settlements. Any proceeds received are included in the Statement of Operations as realized gain (loss) for investments no longer held and as unrealized gain (loss) for investments still held.
Brokerage commissions and mark ups are considered transaction costs and are recorded as an increase to the cost basis of securities purchased and/or a reduction of proceeds on a sale of securities. Such transaction costs are included in the determination of net realized and unrealized gain (loss) from investment securities reported in the Statement of Operations and the Statement of Changes in Net Assets and the net realized and unrealized gains (losses) on securities per share in the Financial Highlights. Transaction costs are included in the calculation of the Fund’s net asset value and, accordingly, they reduce the Fund’s total returns. These transaction costs are not considered operating expenses and are not reflected in net investment income reported in the Statement of Operations and the Statement of Changes in Net Assets, or the net investment income per share and the ratios of expenses and net investment income reported in the Financial Highlights, nor are they limited by any expense limitation arrangements between the Fund and the investment adviser.
The Fund allocates income and realized and unrealized capital gains and losses to a class based on the relative net assets of each class.
| C. | Country Determination– For the purposes of making investment selection decisions and presentation in the Schedule of Investments, the investment adviser may determine the country in which an issuer is located and/or credit risk exposure based on various factors. These factors include the laws of the country under which the issuer is organized, where the issuer maintains a principal office, the country in which the issuer derives 50% or more of its total revenues and the country that has the primary market for the issuer’s securities, as well as other criteria. Among the other criteria that may be evaluated for making this determination are the country in which the issuer maintains 50% or more of its assets, the type of security, financial guarantees and enhancements, the nature of the collateral and the sponsor organization. Country of issuer and/or credit risk exposure has been determined to be the United States of America, unless otherwise noted. |
| D. | Distributions– Distributions from net investment income and net realized capital gain, if any, are generally declared and paid to separate accounts of participating insurance companies annually and recorded on the ex-dividend date. |
| E. | Federal Income Taxes– The Fund intends to comply with the requirements of Subchapter M of the Internal Revenue Code of 1986, as amended (the “Internal Revenue Code”), necessary to qualify as a regulated investment company and to distribute substantially all of the Fund’s taxable earnings to shareholders. As such, the Fund will not be subject to federal income taxes on otherwise taxable income (including net realized capital gain) that is distributed to shareholders. Therefore, no provision for federal income taxes is recorded in the financial statements. |
The Fund recognizes the tax benefits of uncertain tax positions only when the position is more likely than not to be sustained. Management has analyzed the Fund’s uncertain tax positions and concluded that no liability for unrecognized tax benefits should be recorded related to uncertain tax positions. Management is not aware of any tax positions for which it is reasonably possible that the total amounts of unrecognized tax benefits will change materially in the next 12 months.
The Fund files tax returns in the U.S. Federal jurisdiction and certain other jurisdictions. Generally, the Fund is subject to examinations by such taxing authorities for up to three years after the filing of the return for the tax period.
| F. | Expenses– Fees provided for under the Rule 12b-1 plan of a particular class of the Fund and which are directly attributable to that class are charged to the operations of such class. All other expenses are allocated among the classes based on relative net assets. |
| G. | Accounting Estimates– The preparation of financial statements in conformity with accounting principles generally accepted in the United States of America (“GAAP”) requires management to make estimates and assumptions that affect the reported amounts of assets and liabilities at the date of the financial statements and the reported amounts of revenues and expenses during the reporting period including estimates and assumptions related to taxation. Actual results could differ from those estimates by a significant amount. In addition, the Fund monitors for material events or transactions that may occur or become known after the period-end date and before the date the financial statements are released to print. |
| H. | Indemnifications– Under the Trust’s organizational documents, each Trustee, officer, employee or other agent of the Trust is indemnified against certain liabilities that may arise out of the performance of their duties to the Fund. Additionally, in the normal course of business, the Fund enters into contracts, including the Fund’s servicing agreements, that contain a variety of indemnification clauses. The Fund’s maximum exposure under these arrangements is unknown as this would involve future claims that may be made against the Fund that have not yet occurred. The risk of material loss as a result of such indemnification claims is considered remote. |
| I. | Foreign Currency Translations– Foreign currency is valued at the close of the NYSE based on quotations posted by banks and major currency dealers. Portfolio securities and other assets and liabilities denominated in foreign currencies are translated into U.S. dollar amounts at the date of valuation. Purchases and sales of portfolio securities (net of foreign taxes withheld on disposition) and income items denominated in foreign currencies are translated into U.S. dollar amounts on the respective dates of such transactions. The Fund does not separately account for the portion of the results of operations resulting from changes in foreign exchange rates on investments and the fluctuations arising from changes in market prices of securities held. The combined results of changes in foreign exchange rates and the fluctuation of market prices on investments (net of estimated foreign tax withholding) are included with the net realized and unrealized gain or loss from investments in the Statement of Operations. Reported net realized foreign currency gains or losses arise from (1) sales of foreign currencies, (2) currency gains or losses realized between the trade and settlement dates on securities transactions, and (3) the difference between the amounts of dividends, interest, and foreign withholding taxes recorded on the Fund’s books and the U.S. dollar equivalent of the amounts actually received or paid. Net |
Invesco V.I. Managed Volatility Fund
unrealized foreign currency gains and losses arise from changes in the fair values of assets and liabilities, other than investments in securities at fiscal period end, resulting from changes in exchange rates.
The Fund may invest in foreign securities, which may be subject to foreign taxes on income, gains on investments or currency repatriation, a portion of which may be recoverable. Foreign taxes, if any, are recorded based on the tax regulations and rates that exist in the foreign markets in which the Fund invests and are shown in the Statement of Operations.
| J. | Forward Foreign Currency Contracts– The Fund may engage in foreign currency transactions either on a spot (i.e. for prompt delivery and settlement) basis, or through forward foreign currency contracts, to manage or minimize currency or exchange rate risk. |
The Fund may also enter into forward foreign currency contracts for the purchase or sale of a security denominated in a foreign currency in order to “lock in” the U.S. dollar price of that security, or the Fund may also enter into forward foreign currency contracts that do not provide for physical settlement of the two currencies, but instead are settled by a single cash payment calculated as the difference between the agreed upon exchange rate and the spot rate at settlement based upon an agreed upon notional amount (non-deliverable forwards). The Fund will set aside liquid assets in an amount equal to the daily mark-to-market obligation for forward foreign currency contracts.
A forward foreign currency contract is an obligation between two parties (“Counterparties”) to purchase or sell a specific currency for an agreed-upon price at a future date. The use of forward foreign currency contracts does not eliminate fluctuations in the price of the underlying securities the Fund owns or intends to acquire but establishes a rate of exchange in advance. Fluctuations in the value of these contracts are measured by the difference in the contract date and reporting date exchange rates and are recorded as unrealized appreciation (depreciation) until the contracts are closed. When the contracts are closed, realized gains (losses) are recorded. Realized and unrealized gains (losses) on the contracts are included in the Statement of Operations. The primary risks associated with forward foreign currency contracts include failure of the Counterparty to meet the terms of the contract and the value of the foreign currency changing unfavorably. These risks may be in excess of the amounts reflected in the Statement of Assets and Liabilities.
| K. | Futures Contracts– The Fund may enter into futures contracts to manage exposure to interest rate, equity and market price movements and/or currency risks. A futures contract is an agreement between two parties (“Counterparties”) to purchase or sell a specified underlying security, currency or commodity (or delivery of a cash settlement price, in the case of an index future) for a fixed price at a future date. The Fund currently invests only in exchange-traded futures and they are standardized as to maturity date and underlying financial instrument. Initial margin deposits required upon entering into futures contracts are satisfied by the segregation of specific securities or cash as collateral at the futures commission merchant (broker). During the period the futures contracts are open, changes in the value of the contracts are recognized as unrealized gains or losses by recalculating the value of the contracts on a daily basis. Subsequent or variation margin payments are received or made depending upon whether unrealized gains or losses are incurred. These amounts are reflected as receivables or payables on the Statement of Assets and Liabilities. When the contracts are closed or expire, the Fund recognizes a realized gain or loss equal to the difference between the proceeds from, or cost of, the closing transaction and the Fund’s basis in the contract. The net realized gain (loss) and the change in unrealized gain (loss) on futures contracts held during the period is included on the Statement of Operations. The primary risks associated with futures contracts are market risk and the absence of a liquid secondary market. If the Fund were unable to liquidate a futures contract and/or enter into an offsetting closing transaction, the Fund would continue to be subject to market risk with respect to the value of the contracts and continue to be required to maintain the margin deposits on the futures contracts. Futures contracts have minimal Counterparty risk since the exchange’s clearinghouse, as Counterparty to all exchange-traded futures, guarantees the futures against default. Risks may exceed amounts recognized in the Statement of Assets and Liabilities. |
| L. | Other Risks– Active trading of portfolio securities may result in added expenses, a lower return and increased tax liability. |
NOTE 2–Advisory Fees and Other Fees Paid to Affiliates
The Trust has entered into a master investment advisory agreement with Invesco Advisers, Inc. (the “Adviser” or “Invesco”). Under the terms of the investment advisory agreement, the Fund accrues daily and pays monthly an advisory fee to the Adviser at the annual rate of 0.60% of the Fund’s average daily net assets.
For the year ended December 31, 2019, the effective advisory fee rate incurred by the Fund was 0.60%.
Under the terms of a master sub-advisory agreement between the Adviser and each of Invesco Asset Management Deutschland GmbH, Invesco Asset Management Limited, Invesco Asset Management (Japan) Limited, Invesco Hong Kong Limited, Invesco Senior Secured Management, Inc. and Invesco Canada Ltd. and separate sub-advisory agreements with Invesco Capital Management LLC and Invesco Asset Management (India) Private Limited (collectively, the “Affiliated Sub-Advisers”) the Adviser, not the Fund, will pay 40% of the fees paid to the Adviser to any such Affiliated Sub-Adviser(s) that provide(s) discretionary investment management services to the Fund based on the percentage of assets allocated to such Affiliated Sub-Adviser(s).
The Adviser has contractually agreed, through at least June 30, 2020, to waive advisory fees and/or reimburse expenses of all shares to the extent necessary to limit total annual fund operating expenses after fee waiver and/or expense reimbursement (excluding certain items discussed below) of Series I shares to 2.00% and Series II shares to 2.25% of average daily net assets (the “expense limits”). In determining the Adviser’s obligation to waive advisory fees and/or reimburse expenses, the following expenses are not taken into account, and could cause the total annual fund operating expenses after fee waiver and/or expense reimbursement to exceed the numbers reflected above: (1) interest; (2) taxes; (3) dividend expense on short sales; (4) extraordinary or non-routine items, including litigation expenses; and (5) expenses that the Fund has incurred but did not actually pay because of an expense offset arrangement. Unless Invesco continues the fee waiver agreement, it will terminate on June 30, 2020. During its term, the fee waiver agreement cannot be terminated or amended to increase the expense limits or reduce the advisory fee waiver without approval of the Board of Trustees. The Adviser did not waive fees and/or reimburse expenses during the period under these expense limits.
Further, the Adviser has contractually agreed, through at least June 30, 2021, to waive the advisory fee payable by the Fund in an amount equal to 100% of the net advisory fees the Adviser receives from the affiliated money market funds on investments by the Fund of uninvested cash in such affiliated money market funds.
For the year ended December 31, 2019, the Adviser waived advisory fees of $2,546.
The Trust has entered into a master administrative services agreement with Invesco pursuant to which the Fund has agreed to pay Invesco a fee for costs incurred in providing accounting services and fund administrative services to the Fund and to reimburse Invesco for fees paid to insurance companies that have agreed to provide certain administrative services to the Fund. These administrative services provided by the insurance companies
Invesco V.I. Managed Volatility Fund
may include, among other things: maintenance of master accounts with the Fund; tracking, recording and transmitting net purchase and redemption orders for Fund shares; maintaining and preserving records related to the purchase, redemption and other account activity of variable product owners; distributing copies of Fund documents such as prospectuses, proxy materials and periodic reports, to variable product owners, and responding to inquiries from variable product owners about the Fund. Pursuant to such agreement, for the year ended December 31, 2019, Invesco was paid $5,271 for accounting and fund administrative services and was reimbursed $56,070 for fees paid to insurance companies. Invesco has entered into a sub-administration agreement whereby State Street Bank and Trust Company (“SSB”) serves as fund accountant and provides certain administrative services to the Fund. Pursuant to a custody agreement with the Trust on behalf of the Fund, SSB also serves as the Fund’s custodian.
The Trust has entered into a transfer agency and service agreement with Invesco Investment Services, Inc. (“IIS”) pursuant to which the Fund has agreed to pay IIS a fee for providing transfer agency and shareholder services to the Fund and reimburse IIS for certain expenses incurred by IIS in the course of providing such services. For the year ended December 31, 2019, expenses incurred under the agreement are shown in the Statement of Operations asTransfer agent fees.
The Trust has entered into a master distribution agreement with Invesco Distributors, Inc. (“IDI”) to serve as the distributor for the Fund. The Trust has adopted a plan pursuant to Rule 12b-1 under the 1940 Act with respect to the Fund’s Series II shares (the “Plan”). The Fund, pursuant to the Plan, pays IDI compensation at the annual rate of 0.25% of the Fund’s average daily net assets of Series II shares. The fees are accrued daily and paid monthly. Of the Plan payments, up to 0.25% of the average daily net assets of the Series II shares may be paid to insurance companies who furnish continuing personal shareholder services to customers who purchase and own Series II shares of the Fund. For the year ended December 31, 2019, expenses incurred under the Plan are detailed in the Statement of Operations asDistribution fees.
For the year ended December 31, 2019, the Fund incurred $477 in brokerage commissions with Invesco Capital Markets, Inc., an affiliate of the Adviser and IDI, for portfolio transactions executed on behalf of the Fund.
Certain officers and trustees of the Trust are officers and directors of the Adviser, IIS and/or IDI.
NOTE 3–Additional Valuation Information
GAAP defines fair value as the price that would be received to sell an asset or paid to transfer a liability in an orderly transaction between market participants at the measurement date, under current market conditions. GAAP establishes a hierarchy that prioritizes the inputs to valuation methods, giving the highest priority to readily available unadjusted quoted prices in an active market for identical assets (Level 1) and the lowest priority to significant unobservable inputs (Level 3), generally when market prices are not readily available or are unreliable. Based on the valuation inputs, the securities or other investments are tiered into one of three levels. Changes in valuation methods may result in transfers in or out of an investment’s assigned level:
| | Level 1 – | Prices are determined using quoted prices in an active market for identical assets. |
| | Level 2 – | Prices are determined using other significant observable inputs. Observable inputs are inputs that other market participants may use in pricing a security. These may include quoted prices for similar securities, interest rates, prepayment speeds, credit risk, yield curves, loss severities, default rates, discount rates, volatilities and others. |
| | Level 3 – | Prices are determined using significant unobservable inputs. In situations where quoted prices or observable inputs are unavailable (for example, when there is little or no market activity for an investment at the end of the period), unobservable inputs may be used. Unobservable inputs reflect the Fund’s own assumptions about the factors market participants would use in determining fair value of the securities or instruments and would be based on the best available information. |
The following is a summary of the tiered valuation input levels, as of December 31, 2019. The level assigned to the securities valuations may not be an indication of the risk or liquidity associated with investing in those securities. Because of the inherent uncertainties of valuation, the values reflected in the financial statements may materially differ from the value received upon actual sale of those investments.
| | | | | | | | | | | | | | | | |
| | | Level 1 | | | Level 2 | | | Level 3 | | | Total | |
| |
Investments in Securities | | | | | | | | | | | | | | | | |
| |
Common Stocks & Other Equity Interests | | $ | 20,309,540 | | | $ | 1,874,538 | | | | $– | | | $ | 22,184,078 | |
| |
U.S. Dollar Denominated Bonds & Notes | | | – | | | | 9,806,007 | | | | – | | | | 9,806,007 | |
| |
U.S. Treasury Securities | | | – | | | | 2,857,609 | | | | – | | | | 2,857,609 | |
| |
Preferred Stocks | | | 82,450 | | | | – | | | | – | | | | 82,450 | |
| |
Money Market Funds | | | 1,770,200 | | | | – | | | | – | | | | 1,770,200 | |
| |
Total Investments in Securities | | | 22,162,190 | | | | 14,538,154 | | | | – | | | | 36,700,344 | |
| |
| | | | |
Other Investments - Assets* | | | | | | | | | | | | | | | | |
| |
Forward Foreign Currency Contracts | | | – | | | | 397 | | | | – | | | | 397 | |
| |
| | | | |
Other Investments - Liabilities* | | | | | | | | | | | | | | | | |
| |
Forward Foreign Currency Contracts | | | – | | | | (33,387 | ) | | | – | | | | (33,387 | ) |
| |
Total Other Investments | | | – | | | | (32,990 | ) | | | – | | | | (32,990 | ) |
| |
Total Investments | | $ | 22,162,190 | | | $ | 14,505,164 | | | | $– | | | $ | 36,667,354 | |
| |
| * | Unrealized appreciation (depreciation). |
NOTE 4–Derivative Investments
The Fund may enter into an International Swaps and Derivatives Association Master Agreement (“ISDA Master Agreement”) under which a fund may trade OTC derivatives. An OTC transaction entered into under an ISDA Master Agreement typically involves a collateral posting arrangement, payment netting provisions and close-out netting provisions. These netting provisions allow for reduction of credit risk through netting of contractual
Invesco V.I. Managed Volatility Fund
obligations. The enforceability of the netting provisions of the ISDA Master Agreement depends on the governing law of the ISDA Master Agreement, among other factors.
For financial reporting purposes, the Fund does not offset OTC derivative assets or liabilities that are subject to ISDA Master Agreements in the Statement of Assets and Liabilities.
Value of Derivative Investments at Period-End
The table below summarizes the value of the Fund’s derivative investments, detailed by primary risk exposure, held as of December 31, 2019:
| | | | |
| | | Value | |
| | | Currency | |
| Derivative Assets | | Risk | |
| |
Unrealized appreciation on forward foreign currency contracts outstanding | | $ | 397 | |
| |
Derivatives not subject to master netting agreements | | | - | |
| |
Total Derivative Assets subject to master netting agreements | | $ | 397 | |
| |
| |
| | | Value | |
| | | Currency | |
| Derivative Liabilities | | Risk | |
| |
Unrealized depreciation on forward foreign currency contracts outstanding | | $ | (33,387 | ) |
| |
Derivatives not subject to master netting agreements | | | - | |
| |
Total Derivative Liabilities subject to master netting agreements | | $ | (33,387 | ) |
| |
Offsetting Assets and Liabilities
The table below reflects the Fund’s exposure to Counterparties subject to either an ISDA Master Agreement or other agreement for OTC derivative transactions as of December 31, 2019.
| | | | | | | | | | | | | | | | | | | | | | | | |
| | | Financial
Derivative
Assets | | | Financial
Derivative
Liabilities | | | | | | Collateral
(Received)/Pledged | | | | |
| Counterparty | | Forward Foreign
Currency Contracts | | | Forward Foreign
Currency Contracts | | | Net Value of
Derivatives | | | Non-Cash | | | Cash | | | Net
Amount | |
| |
Bank of New York Mellon (The) | | | $ – | | | | $(11,772) | | | | $(11,772) | | | | $– | | | | $– | | | $ | (11,772 | ) |
| |
State Street Bank & Trust Co. | | | 397 | | | | (21,615) | | | | (21,218) | | | | – | | | | – | | | | (21,218 | ) |
| |
Total | | | $397 | | | | $(33,387) | | | | $(32,990) | | | | $– | | | | $– | | | $ | (32,990 | ) |
| |
Effect of Derivative Investments for the year ended December 31, 2019
The table below summarizes the gains (losses) on derivative investments, detailed by primary risk exposure, recognized in earnings during the period:
| | | | | | | | | | | | |
| | | Location of Gain (Loss) on
Statement of Operations | |
| | | Currency
Risk | | | Equity
Risk | | | Total | |
| |
Realized Gain (Loss): | | | | | | | | | | | | |
Forward foreign currency contracts | | | $ 4,611 | | | | $ - | | | | $ 4,611 | |
| |
Futures contracts | | | - | | | | (620,303 | ) | | | (620,303 | ) |
| |
Change in Net Unrealized Appreciation (Depreciation): | | | | | | | | | | | | |
Forward foreign currency contracts | | | (30,101 | ) | | | - | | | | (30,101 | ) |
| |
Futures contracts | | | - | | | | 172,631 | | | | 172,631 | |
| |
Total | | | $(25,490 | ) | | | $(447,672 | ) | | | $(473,162 | ) |
| |
The table below summarizes the average notional value of derivatives held during the period.
| | | | |
| | | Forward
Foreign Currency
Contracts | | Futures
Contracts |
|
Average notional value | | $2,322,134 | | $2,286,424 |
|
NOTE 5–Trustees’ and Officers’ Fees and Benefits
Trustees’ and Officers’ Fees and Benefits include amounts accrued by the Fund to pay remuneration to certain Trustees and Officers of the Fund. Trustees have the option to defer compensation payable by the Fund, andTrustees’ and Officers’ Fees and Benefits also include amounts accrued by the Fund to fund such deferred compensation amounts. Those Trustees who defer compensation have the option to select various Invesco Funds in which their deferral accounts shall be deemed to be invested. Finally, certain current Trustees were eligible to participate in a retirement plan that provided
Invesco V.I. Managed Volatility Fund
for benefits to be paid upon retirement to Trustees over a period of time based on the number of years of service. The Fund may have certain former Trustees who also participate in a retirement plan and receive benefits under such plan. Trustees’ and Officers’ Fees and Benefits include amounts accrued by the Fund to fund such retirement benefits. Obligations under the deferred compensation and retirement plans represent unsecured claims against the general assets of the Fund.
NOTE 6–Cash Balances
The Fund is permitted to temporarily carry a negative or overdrawn balance in its account with SSB, the custodian bank. Such balances, if any at period-end, are shown in the Statement of Assets and Liabilities under the payable caption Amount due custodian. To compensate the custodian bank for such overdrafts, the overdrawn Fund may either (1) leave funds as a compensating balance in the account so the custodian bank can be compensated by earning the additional interest; or (2) compensate by paying the custodian bank at a rate agreed upon by the custodian bank and Invesco, not to exceed the contractually agreed upon rate.
NOTE 7–Distributions to Shareholders and Tax Components of Net Assets
Tax Character of Distributions to Shareholders Paid During the Fiscal Years Ended December 31, 2019 and 2018:
| | | | | | | | |
| | | 2019 | | | 2018 | |
| |
Ordinary income | | $ | 514,166 | | | $ | 700,251 | |
| |
Long-term capital gain | | | 1,446,125 | | | | 1,420,263 | |
| |
Total distributions | | $ | 1,960,291 | | | $ | 2,120,514 | |
| |
Tax Components of Net Assets at Period-End:
| | | | |
| | | 2019 | |
| |
Undistributed ordinary income | | $ | 621,474 | |
| |
Undistributed long-term capital gain | | | 690,387 | |
| |
Net unrealized appreciation – investments | | | 5,142,726 | |
| |
Net unrealized appreciation - foreign currencies | | | 326 | |
| |
Temporary book/tax differences | | | (56,872 | ) |
| |
Shares of beneficial interest | | | 30,328,254 | |
| |
Total net assets | | $ | 36,726,295 | |
| |
The difference between book-basis and tax-basis unrealized appreciation (depreciation) is due to differences in the timing of recognition of gains and losses on investments for tax and book purposes. The Fund’s net unrealized appreciation difference is attributable primarily to wash sales, tax treatment of forward contracts and adjustments to contingent payment debt instruments.
The temporary book/tax differences are a result of timing differences between book and tax recognition of income and/or expenses. The Fund’s temporary book/tax differences are the result of the trustee deferral of compensation and retirement plan benefits.
Capital loss carryforward is calculated and reported as of a specific date. Results of transactions and other activity after that date may affect the amount of capital loss carryforward actually available for the Fund to utilize. Capital losses generated in years beginning after December 22, 2010 can be carried forward for an unlimited period, whereas previous losses expire in eight tax years. Capital losses with an expiration period may not be used to offset capital gains until all net capital losses without an expiration date have been utilized. Capital loss carryforwards with no expiration date will retain their character as either short-term or long-term capital losses instead of as short-term capital losses as under prior law. The ability to utilize capital loss carryforwards in the future may be limited under the Internal Revenue Code and related regulations based on the results of future transactions.
The Fund does not have a capital loss carryforward as of December 31, 2019.
NOTE 8–Investment Transactions
The aggregate amount of investment securities (other than short-term securities, U.S. Treasury obligations and money market funds, if any) purchased and sold by the Fund during the year ended December 31, 2019 was $6,742,855 and $10,980,156, respectively. During the same period, purchases and sales of U.S. Treasury obligations were $30,943,773 and $31,731,190, respectively. Cost of investments, including any derivatives, on a tax basis includes the adjustments for financial reporting purposes as of the most recently completed federal income tax reporting period-end.
Unrealized Appreciation (Depreciation) of Investments on a Tax Basis
| | | | |
| |
Aggregate unrealized appreciation of investments | | $ | 5,833,149 | |
| |
Aggregate unrealized (depreciation) of investments | | | (690,423 | ) |
| |
Net unrealized appreciation of investments | | $ | 5,142,726 | |
| |
Cost of investments for tax purposes is $31,524,628.
Invesco V.I. Managed Volatility Fund
NOTE 9–Reclassification of Permanent Differences
Primarily as a result of differing book/tax treatment of foreign currency transactions, on December 31, 2019, undistributed net investment income was increased by $9,796 and undistributed net realized gain was decreased by $9,796. This reclassification had no effect on the net assets or the distributable earnings of the Fund.
NOTE 10–Share Information
| | | | | | | | | | | | | | | | |
| | | Summary of Share Activity | |
| |
| | | Year ended | | | Year ended | |
| | | December 31, 2019(a) | | | December 31, 2018 | |
| | | | | | | | |
| | | Shares | | | Amount | | | Shares | | | Amount | |
| |
Sold: | | | | | | | | | | | | | | | | |
Series I | | | 262,050 | | | $ | 3,173,461 | | | | 209,264 | | | $ | 2,541,868 | |
| |
Series II | | | 2,709 | | | | 32,332 | | | | 5,870 | | | | 72,638 | |
| |
| | | | |
Issued as reinvestment of dividends: | | | | | | | | | | | | | | | | |
Series I | | | 161,687 | | | | 1,896,583 | | | | 162,517 | | | | 2,054,218 | |
| |
Series II | | | 5,492 | | | | 63,708 | | | | 5,304 | | | | 66,295 | |
| |
| | | | |
Reacquired: | | | | | | | | | | | | | | | | |
Series I | | | (688,807 | ) | | | (8,260,208 | ) | | | (630,388 | ) | | | (7,938,464 | ) |
| |
Series II | | | (12,075 | ) | | | (143,992 | ) | | | (11,831 | ) | | | (150,650 | ) |
| |
Net increase (decrease) in share activity | | | (268,944 | ) | | $ | (3,238,116 | ) | | | (259,264 | ) | | $ | (3,354,095 | ) |
| |
| (a) | There are entities that are record owners of more than 5% of the outstanding shares of the Fund and in the aggregate own 59% of the outstanding shares of the Fund. The Fund and the Fund’s principal underwriter or adviser, are parties to participation agreements with these entities whereby these entities sell units of interest in separate accounts funding variable products that are invested in the Fund. The Fund, Invesco and/or Invesco affiliates may make payments to these entities, which are considered to be related to the Fund, for providing services to the Fund, Invesco and/or Invesco affiliates including but not limited to services such as, securities brokerage, third party record keeping and account servicing and administrative services. The Fund has no knowledge as to whether all or any portion of the shares owned of record by these entities are also owned beneficially. |
Invesco V.I. Managed Volatility Fund
Report of Independent Registered Public Accounting Firm
To the Board of Trustees of AIM Variable Insurance Funds (Invesco Variable Insurance Funds) and Shareholders of Invesco V.I. Managed Volatility Fund
Opinion on the Financial Statements
We have audited the accompanying statement of assets and liabilities, including the schedule of investments, of Invesco V.I. Managed Volatility Fund (one of the funds constituting AIM Variable Insurance Funds (Invesco Variable Insurance Funds), referred to hereafter as the “Fund”) as of December 31, 2019, the related statement of operations for the year ended December 31, 2019, the statement of changes in net assets for each of the two years in the period ended December 31, 2019, including the related notes, and the financial highlights for each of the five years in the period ended December 31, 2019 (collectively referred to as the “financial statements”). In our opinion, the financial statements present fairly, in all material respects, the financial position of the Fund as of December 31, 2019, the results of its operations for the year then ended, the changes in its net assets for each of the two years in the period ended December 31, 2019 and the financial highlights for each of the five years in the period ended December 31, 2019 in conformity with accounting principles generally accepted in the United States of America.
Basis for Opinion
These financial statements are the responsibility of the Fund’s management. Our responsibility is to express an opinion on the Fund’s financial statements based on our audits. We are a public accounting firm registered with the Public Company Accounting Oversight Board (United States) (PCAOB) and are required to be independent with respect to the Fund in accordance with the U.S. federal securities laws and the applicable rules and regulations of the Securities and Exchange Commission and the PCAOB.
We conducted our audits of these financial statements in accordance with the standards of the PCAOB. Those standards require that we plan and perform the audit to obtain reasonable assurance about whether the financial statements are free of material misstatement, whether due to error or fraud.
Our audits included performing procedures to assess the risks of material misstatement of the financial statements, whether due to error or fraud, and performing procedures that respond to those risks. Such procedures included examining, on a test basis, evidence regarding the amounts and disclosures in the financial statements. Our audits also included evaluating the accounting principles used and significant estimates made by management, as well as evaluating the overall presentation of the financial statements. Our procedures included confirmation of securities owned as of December 31, 2019 by correspondence with the custodian, transfer agent and brokers; when replies were not received from brokers, we performed other auditing procedures. We believe that our audits provide a reasonable basis for our opinion.
/s/PricewaterhouseCoopers LLP
Houston, Texas
February 18, 2020
We have served as the auditor of one or more of the investment companies in the Invesco group of investment companies since at least 1995. We have not been able to determine the specific year we began serving as auditor.
Invesco V.I. Managed Volatility Fund
Calculating your ongoing Fund expenses
Example
As a shareholder of the Fund, you incur ongoing costs, including management fees; distribution and/or service fees (12b-1); and other Fund expenses. This example is intended to help you understand your ongoing costs (in dollars) of investing in the Fund and to compare these costs with ongoing costs of investing in other mutual funds. The example is based on an investment of $1,000 invested at the beginning of the period and held for the entire period July 1, 2019 through December 31, 2019.
The actual and hypothetical expenses in the examples below do not represent the effect of any fees or other expenses assessed in connection with a variable product; if they did, the expenses shown would be higher while the ending account values shown would be lower.
Actual expenses
The table below provides information about actual account values and actual expenses. You may use the information in this table, together with the amount you invested, to estimate the expenses that you paid over the period. Simply divide your account value by $1,000 (for example, an $8,600 account value divided by $1,000 = 8.6), then multiply the result by the number in the table under the heading entitled “Actual Expenses Paid During Period” to estimate the expenses you paid on your account during this period.
Hypothetical example for comparison purposes
The table below also provides information about hypothetical account values and hypothetical expenses based on the Fund’s actual expense ratio and an assumed rate of return of 5% per year before expenses, which is not the Fund’s actual return.
The hypothetical account values and expenses may not be used to estimate the actual ending account balance or expenses you paid for the period. You may use this information to compare the ongoing costs of investing in the Fund and other funds. To do so, compare this 5% hypothetical example with the 5% hypothetical examples that appear in the shareholder reports of the other funds.
Please note that the expenses shown in the table are meant to highlight your ongoing costs. Therefore, the hypothetical information is useful in comparing ongoing costs, and will not help you determine the relative total costs of owning different funds.
| | | | | | | | | | | | |
| | | Beginning
Account Value
(07/01/19) | | ACTUAL | | HYPOTHETICAL
(5% annual return before expenses) | | Annualized
Expense Ratio |
| | Ending
Account Value
(12/31/19)1 | | Expenses
Paid During
Period2 | | Ending
Account Value
(12/31/19) | | Expenses
Paid During
Period2 |
Series I | | $1,000.00 | | $1,058.30 | | $5.55 | | $1,019.81 | | $5.45 | | 1.07% |
Series II | | 1,000.00 | | 1,057.00 | | 6.84 | | 1,018.55 | | 6.72 | | 1.32 |
| 1 | The actual ending account value is based on the actual total return of the Fund for the period July 1, 2019 through December 31, 2019, after actual expenses and will differ from the hypothetical ending account value which is based on the Fund’s expense ratio and a hypothetical annual return of 5% before expenses. |
| 2 | Expenses are equal to the Fund’s annualized expense ratio as indicated above multiplied by the average account value over the period, multiplied by 184/365 to reflect the most recent fiscal half year. |
Invesco V.I. Managed Volatility Fund
Tax Information
Form 1099-DIV, Form 1042-S and other year-end tax information provide shareholders with actual calendar year amounts that should be included in their tax returns. Shareholders should consult their tax advisers.
The following distribution information is being provided as required by the Internal Revenue Code or to meet a specific state’s requirement.
The Fund designates the following amounts or, if subsequently determined to be different, the maximum amount allowable for its fiscal year ended December 31, 2019:
| | | | | | |
| | Federal and State Income Tax | | | | |
| | Long-Term Capital Gain Distributions | | $ | 1,446,125 | |
| | Qualified Dividend Income* | | | 0.00 | % |
| | Corporate Dividends Received Deduction* | | | 90.19 | % |
| | U.S. Treasury Obligations* | | | 6.05 | % |
* The above percentages are based on ordinary income dividends paid to shareholders during the Fund’s fiscal year.
Invesco V.I. Managed Volatility Fund
Trustees and Officers
The address of each trustee and officer is AIM Variable Insurance Funds (Invesco Variable Insurance Funds) (the “Trust”), 11 Greenway Plaza, Suite 1000, Houston, Texas 77046-1173. The trustees serve for the life of the Trust, subject to their earlier death, incapacitation, resignation, retirement or removal as more specifically provided in the Trust’s organizational documents. Each officer serves for a one year term or until their successors are elected and qualified. Column two below includes length of time served with predecessor entities, if any.
| | | | | | | | |
Name, Year of Birth and Position(s) Held with the Trust | | Trustee and/or Officer Since | | Principal Occupation(s) During Past 5 Years | | Number of
Funds in
Fund Complex
Overseen by
Trustee | | Other Directorship(s) Held by Trustee
During Past 5 Years |
| Interested Person |
Martin L. Flanagan1- 1960 Trustee and Vice Chair | | 2007 | | Executive Director, Chief Executive Officer and President, Invesco Ltd. (ultimate parent of Invesco and a global investment management firm); Trustee and Vice Chair, The Invesco Funds; Vice Chair, Investment Company Institute; and Member of Executive Board, SMU Cox School of Business Formerly: Advisor to the Board, Invesco Advisers, Inc. (formerly known as Invesco Institutional (N.A.), Inc.); Chairman and Chief Executive Officer, Invesco Advisers, Inc. (registered investment adviser); Director, Chairman, Chief Executive Officer and President, Invesco Holding Company (US), Inc. (formerly IVZ Inc.) (holding company), Invesco Group Services, Inc. (service provider) and Invesco North American Holdings, Inc. (holding company); Director, Chief Executive Officer and President, Invesco Holding Company Limited (parent of Invesco and a global investment management firm); Director, Invesco Ltd.; Chairman, Investment Company Institute and President,Co-Chief Executive Officer,Co-President, Chief Operating Officer and Chief Financial Officer, Franklin Resources, Inc. (global investment management organization) | | 229 | | None |
| 1 | Mr. Flanagan is considered an interested person (within the meaning of Section 2(a)(19) of the 1940 Act) of the Trust because he is an officer of the Adviser to the Trust, and an officer and a director of Invesco Ltd., ultimate parent of the Adviser. |
Invesco V.I. Managed Volatility Fund
Trustees and Officers–(continued)
| | | | | | | | |
Name, Year of Birth and Position(s) Held with the Trust | | Trustee and/or Officer Since | | Principal Occupation(s) During Past 5 Years | | Number of
Funds in
Fund Complex
Overseen by
Trustee | | Other Directorship(s) Held by Trustee
During Past 5 Years |
| Independent Trustees |
Bruce L. Crockett - 1944 Trustee and Chair | | 1993 | | Chairman, Crockett Technologies Associates (technology consulting company) Formerly: Director, Captaris (unified messaging provider); Director, President and Chief Executive Officer, COMSAT Corporation; Chairman, Board of Governors of INTELSAT (international communications company); ACE Limited (insurance company); Independent Directors Council and Investment Company Institute: Member of the Audit Committee, Investment Company Institute; Member of the Executive Committee and Chair of the Governance Committee, Independent Directors Council | | 229 | | Director and Chairman of the Audit Committee, ALPS (Attorneys Liability Protection Society) (insurance company); Director and Member of the Audit Committee and Compensation Committee, Ferroglobe PLC (metallurgical company) |
David C. Arch - 1945 Trustee | | 2010 | | Chairman of Blistex Inc. (consumer health care products manufacturer); Member, World Presidents’ Organization | | 229 | | Board member of the Illinois Manufacturers’ Association |
Beth Ann Brown - 1968 Trustee | | 2019 | | Independent Consultant Formerly: Head of Intermediary Distribution, Managing Director, Strategic Relations, Managing Director, Head of National Accounts, Senior Vice President, National Account Manager and Senior Vice President, Key Account Manager, Columbia Management Investment Advisers LLC; Vice President, Key Account Manager, Liberty Funds Distributor, Inc.; and Trustee of certain Oppenheimer Funds | | 229 | | Director, Board of Directors of Caron Engineering Inc.; Advisor, Board of Advisors of Caron Engineering Inc.; President and Director, Acton Shapleigh Youth Conservation Corps (non-profit); and Vice President and Director of Grahamtastic Connection (non-profit) |
Jack M. Fields - 1952 Trustee | | 1997 | | Chief Executive Officer, Twenty First Century Group, Inc. (government affairs company); and Chairman, Discovery Learning Alliance(non-profit) Formerly: Owner and Chief Executive Officer, Dos Angeles Ranch L.P. (cattle, hunting, corporate entertainment); Director, Insperity, Inc. (formerly known as Administaff) (human resources provider); Chief Executive Officer, Texana Timber LP (sustainable forestry company); Director of Cross Timbers Quail Research Ranch(non-profit); and member of the U.S. House of Representatives | | 229 | | None |
Invesco V.I. Managed Volatility Fund
Trustees and Officers–(continued)
| | | | | | | | |
Name, Year of Birth and Position(s) Held with the Trust | | Trustee and/or Officer Since | | Principal Occupation(s) During Past 5 Years | | Number of
Funds in
Fund Complex
Overseen by
Trustee | | Other Directorship(s) Held by Trustee
During Past 5 Years |
| Independent Trustees–(continued) |
Cynthia Hostetler -1962 Trustee | | 2017 | | Non-Executive Director and Trustee of a number of public and private business corporations Formerly: Director, Aberdeen Investment Funds (4 portfolios); Head of Investment Funds and Private Equity, Overseas Private Investment Corporation; President, First Manhattan Bancorporation, Inc.; Attorney, Simpson Thacher & Bartlett LLP | | 229 | | Vulcan Materials Company (construction materials company); Trilinc Global Impact Fund; Genesee & Wyoming, Inc. (railroads); Artio Global Investment LLC (mutual fund complex); Edgen Group, Inc. (specialized energy and infrastructure products distributor); Investment Company Institute (professional organization); Independent Directors Council (professional organization) |
Eli Jones - 1961 Trustee | | 2016 | | Professor and Dean, Mays Business School - Texas A&M University Formerly: Professor and Dean, Walton College of Business, University of Arkansas and E.J. Ourso College of Business, Louisiana State University; Director, Arvest Bank | | 229 | | Insperity, Inc. (formerly known as Administaff) (human resources provider) |
Elizabeth Krentzman - 1959 Trustee | | 2019 | | Formerly: Principal and Chief Regulatory Advisor for Asset Management Services and U.S. Mutual Fund Leader of Deloitte & Touche LLP; General Counsel of the Investment Company Institute (trade association); National Director of the Investment Management Regulatory Consulting Practice, Principal, Director and Senior Manager of Deloitte & Touche LLP; Assistant Director of the Division of Investment Management - Office of Disclosure and Investment Adviser Regulation of the U.S. Securities and Exchange Commission and various positions with the Division of Investment Management - Office of Regulatory Policy of the U.S. Securities and Exchange Commission; Associate at Ropes & Gray LLP; Advisory Board Member of the Securities and Exchange Commission Historical Society; and Trustee of certain Oppenheimer Funds | | 229 | | Trustee of the University of Florida National Board Foundation and Audit Committee Member; Member of the Cartica Funds Board of Directors (private investment funds); Member of the University of Florida Law Center Association, Inc. Board of Trustees and Audit Committee Member |
Anthony J. LaCava, Jr. - 1956 Trustee | | 2019 | | Formerly: Director and Member of the Audit Committee, Blue Hills Bank (publicly traded financial institution) and Managing Partner, KPMG LLP | | 229 | | Blue Hills Bank; Chairman, Bentley University; Member, Business School Advisory Council; and Nominating Committee KPMG LLP |
Prema Mathai-Davis - 1950 Trustee | | 1998 | | Retired Co-Owner & Partner of Quantalytics Research, LLC, (a FinTech Investment Research Platform for the Self-Directed Investor) | | 229 | | None |
Invesco V.I. Managed Volatility Fund
Trustees and Officers–(continued)
| | | | | | | | |
Name, Year of Birth and Position(s) Held with the Trust | | Trustee and/or Officer Since | | Principal Occupation(s) During Past 5 Years | | Number of
Funds in
Fund Complex
Overseen by
Trustee | | Other Directorship(s) Held by Trustee
During Past 5 Years |
| Independent Trustees–(continued) |
Joel W. Motley - 1952 Trustee | | 2019 | | Director of Office of Finance, Federal Home Loan Bank; Member of the Vestry of Trinity Wall Street; Managing Director of Carmona Motley Inc. (privately held financial advisor); Member of the Finance and Budget Committee of the Council on Foreign Relations, Member of the Investment Committee and Board of Human Rights Watch and Member of the Investment Committee and Board of Historic Hudson Valley(non-profit cultural organization) Formerly: Managing Director of Public Capital Advisors, LLC (privately held financial advisor); Managing Director of Carmona Motley Hoffman, Inc. (privately held financial advisor); Trustee of certain Oppenheimer Funds; and Director of Columbia Equity Financial Corp. (privately held financial advisor) | | 229 | | Director of Greenwall Foundation (bioethics research foundation); Member of Board and Investment Committee of The Greenwall Foundation; Director of Southern Africa Legal Services Foundation; Board Member and Investment Committee Member of Pulizer Center for Crisis Reporting(non-profit journalism) |
Teresa M. Ressel - 1962 Trustee | | 2017 | | Non-executive director and trustee of a number of public and private business corporations Formerly: Chief Financial Officer, Olayan America, The Olayan Group (international investor/commercial/industrial); Chief Executive Officer, UBS Securities LLC; Group Chief Operating Officer, Americas, UBS AG; Assistant Secretary for Management & Budget and CFO, US Department of the Treasury | | 229 | | Atlantic Power Corporation (power generation company); ON Semiconductor Corp. (semiconductor supplier) |
Ann Barnett Stern - 1957 Trustee | | 2017 | | President and Chief Executive Officer, Houston Endowment Inc. (private philanthropic institution) Formerly: Executive Vice President and General Counsel, Texas Children’s Hospital; Attorney, Beck, Redden and Secrest, LLP; Business Law Instructor, University of St. Thomas; Attorney, Andrews & Kurth LLP | | 229 | | Federal Reserve Bank of Dallas |
Robert C. Troccoli - 1949 Trustee | | 2016 | | Retired | | 229 | | None |
| Daniel S. Vandivort - 1954 Trustee | | 2019 | | Treasurer, Chairman of the Audit and Finance Committee, and Trustee, Board of Trustees, Huntington Disease Foundation of America; and President, Flyway Advisory Services LLC (consulting and property management) Formerly: Trustee and Governance Chair, of certain Oppenheimer Funds | | 229 | | Chairman and Lead Independent Director, Chairman of the Audit Committee, and Director, Board of Directors, Value Line Funds |
| James D. Vaughn - 1945 Trustee | | 2019 | | Retired Formerly: Managing Partner, Deloitte & Touche LLP; Trustee and Chairman of the Audit Committee, Schroder Funds; Board Member, Mile High United Way, Boys and Girls Clubs, Boy Scouts, Colorado Business Committee for the Arts, Economic Club of Colorado and Metro Denver Network (economic development corporation); and Trustee of certain Oppenheimer Funds | | 229 | | Board member and Chairman of Audit Committee of AMG National Trust Bank; Trustee and Investment Committee member, University of South Dakota Foundation; Board member, Audit Committee Member and past Board Chair, Junior Achievement(non-profit) |
Invesco V.I. Managed Volatility Fund
Trustees and Officers–(continued)
| | | | | | | | |
Name, Year of Birth and Position(s) Held with the Trust | | Trustee and/or Officer Since | | Principal Occupation(s) During Past 5 Years | | Number of
Funds in
Fund Complex
Overseen by
Trustee | | Other Directorship(s) Held by Trustee
During Past 5 Years |
| Independent Trustees–(continued) |
| Christopher L. WIlson - 1957 Trustee, Vice Chair and Chair Designate | | 2017 | | Retired Formerly: Director, TD Asset Management USA Inc. (mutual fund complex) (22 portfolios); Managing Partner, CT2, LLC (investing and consulting firm); President/Chief Executive Officer, Columbia Funds, Bank of America Corporation; President/Chief Executive Officer, CDC IXIS Asset Management Services, Inc.; Principal & Director of Operations, Scudder Funds, Scudder, Stevens & Clark, Inc.; Assistant Vice President, Fidelity Investments | | 229 | | ISO New England, Inc.(non-profit organization managing regional electricity market) |
Invesco V.I. Managed Volatility Fund
Trustees and Officers–(continued)
| | | | | | | | |
Name, Year of Birth and Position(s) Held with the Trust | | Trustee and/or Officer Since | | Principal Occupation(s) During Past 5 Years | | Number of
Funds in
Fund Complex
Overseen by
Trustee | | Other Directorship(s) Held by Trustee
During Past 5 Years |
| Officers |
Sheri Morris - 1964 President, Principal Executive Officer and Treasurer | | 1999 | | Head of Global Fund Services, Invesco Ltd.; President, Principal Executive Officer and Treasurer, The Invesco Funds; Vice President, Invesco Advisers, Inc. (formerly known as Invesco Institutional (N.A.), Inc.) (registered investment adviser); and Vice President, Invesco Exchange-Traded Fund Trust, Invesco Exchange-Traded Fund Trust II, Invesco India Exchange-Traded Fund Trust, Invesco Actively Managed Exchange-Traded Fund Trust, Invesco Actively Managed Exchange-Traded Commodity Fund Trust and Invesco Exchange-Traded Self-Indexed Fund Trust; and Vice President, OppenheimerFunds, Inc. Formerly: Vice President and Principal Financial Officer, The Invesco Funds; Vice President, Invesco AIM Advisers, Inc., Invesco AIM Capital Management, Inc. and Invesco AIM Private Asset Management, Inc.; Assistant Vice President and Assistant Treasurer, The Invesco Funds and Assistant Vice President, Invesco Advisers, Inc., Invesco AIM Capital Management, Inc. and Invesco AIM Private Asset Management, Inc.; and Treasurer, Invesco Exchange-Traded Fund Trust, Invesco Exchange-Traded Fund Trust II, Invesco India Exchange-Traded Fund Trust and Invesco Actively Managed Exchange-Traded Fund Trust | | N/A | | N/A |
Russell C. Burk - 1958 Senior Vice President and Senior Officer | | 2005 | | Senior Vice President and Senior Officer, The Invesco Funds | | N/A | | N/A |
Jeffrey H. Kupor - 1968 Senior Vice President, Chief Legal Officer and Secretary | | 2018 | | Head of Legal of the Americas, Invesco Ltd.; Senior Vice President and Secretary, Invesco Advisers, Inc. (formerly known as Invesco Institutional (N.A.), Inc.) (registered investment adviser); Senior Vice President and Secretary, Invesco Distributors, Inc. (formerly known as Invesco AIM Distributors, Inc.); Vice President and Secretary, Invesco Investment Services, Inc. (formerly known as Invesco AIM Investment Services, Inc.) Senior Vice President, Chief Legal Officer and Secretary, The Invesco Funds; Secretary and General Counsel, Invesco Investment Advisers LLC (formerly known as Van Kampen Asset Management); Secretary and General Counsel, Invesco Capital Markets, Inc. (formerly known as Van Kampen Funds Inc.) and Chief Legal Officer, Invesco Exchange-Traded Fund Trust, Invesco Exchange-Traded Fund Trust II, Invesco India Exchange-Traded Fund Trust, Invesco Actively Managed Exchange-Traded Fund Trust, Invesco Actively Managed Exchange-Traded Commodity Fund Trust and Invesco Exchange-Traded Self-Indexed Fund Trust; Secretary, Invesco Indexing LLC; Secretary, W.L. Ross & Co., LLC Formerly: Secretary and Vice President, Jemstep, Inc.; Head of Legal, Worldwide Institutional, Invesco Ltd.; Secretary and General Counsel, INVESCO Private Capital Investments, Inc.; Senior Vice President, Secretary and General Counsel, Invesco Management Group, Inc. (formerly known as Invesco AIM Management Group, Inc.); Assistant Secretary, INVESCO Asset Management (Bermuda) Ltd.; Secretary and General Counsel, Invesco Private Capital, Inc.; Assistant Secretary and General Counsel, INVESCO Realty, Inc.; Secretary and General Counsel, Invesco Senior Secured Management, Inc.; and Secretary, Sovereign G./P. Holdings Inc. | | N/A | | N/A |
Andrew R. Schlossberg - 1974 Senior Vice President | | 2019 | | Head of the Americas and Senior Managing Director, Invesco Ltd.; Director and Senior Vice President, Invesco Advisers, Inc. (formerly known as Invesco Institutional (N.A.), Inc.) (registered investment adviser); Director and Chairman, Invesco Investment Services, Inc. (formerly known as Invesco AIM Investment Services, Inc.) (registered transfer agent); Senior Vice President, The Invesco Funds; Director, Invesco Investment Advisers LLC (formerly known as Van Kampen Asset Management); Director, President and Chairman, Invesco Insurance Agency, Inc. Formerly: Director, Invesco UK Limited; Director and Chief Executive, Invesco Asset Management Limited and Invesco Fund Managers Limited; Assistant Vice President, The Invesco Funds; Senior Vice President, Invesco Advisers, Inc. (formerly known as Invesco Institutional (N.A.), Inc.) (registered investment adviser); Director and Chief Executive, Invesco Administration Services Limited and Invesco Global Investment Funds Limited; Director, Invesco Distributors, Inc.; Head of EMEA, Invesco Ltd.; President, Invesco Actively Managed Exchange-Traded Commodity Fund Trust, Invesco Actively Managed Exchange-Traded Fund Trust, Invesco Exchange-Traded Fund Trust, Invesco Exchange-Traded Fund Trust II and Invesco India Exchange-Traded Fund Trust; Managing Director and Principal Executive Officer, Invesco Capital Management LLC | | N/A | | N/A |
Invesco V.I. Managed Volatility Fund
Trustees and Officers–(continued)
| | | | | | | | |
Name, Year of Birth and Position(s) Held with the Trust | | Trustee and/or Officer Since | | Principal Occupation(s) During Past 5 Years | | Number of
Funds in
Fund Complex
Overseen by
Trustee | | Other Directorship(s) Held by Trustee
During Past 5 Years |
| Officers–(continued) |
John M. Zerr - 1962 Senior Vice President | | 2006 | | Chief Operating Officer of the Americas; Senior Vice President, Invesco Advisers, Inc. (formerly known as Invesco Institutional (N.A.), Inc.) (registered investment adviser); Senior Vice President, Invesco Distributors, Inc. (formerly known as Invesco AIM Distributors, Inc.); Director and Vice President, Invesco Investment Services, Inc. (formerly known as Invesco AIM Investment Services, Inc.) Senior Vice President, The Invesco Funds; Managing Director, Invesco Capital Management LLC; Director, Invesco Investment Advisers LLC (formerly known as Van Kampen Asset Management); Senior Vice President, Invesco Capital Markets, Inc. (formerly known as Van Kampen Funds Inc.); Manager, Invesco Indexing LLC; Manager, Invesco Specialized Products, LLC; Director and Senior Vice President, Invesco Insurance Agency, Inc.; Member, Invesco Canada Funds Advisory Board; Director, President and Chief Executive Officer, Invesco Corporate Class Inc. (corporate mutual fund company); and Director, Chairman, President and Chief Executive Officer, Invesco Canada Ltd. (formerly known as Invesco Trimark Ltd./Invesco Trimark Ltèe) (registered investment adviser and registered transfer agent) Formerly: Director and Senior Vice President, Invesco Management Group, Inc. (formerly known as Invesco AIM Management Group, Inc.); Secretary and General Counsel, Invesco Management Group, Inc. (formerly known as Invesco AIM Management Group, Inc.); Secretary, Invesco Investment Services, Inc. (formerly known as Invesco AIM Investment Services, Inc.); Chief Legal Officer and Secretary, The Invesco Funds; Secretary and General Counsel, Invesco Investment Advisers LLC (formerly known as Van Kampen Asset Management); Secretary and General Counsel, Invesco Capital Markets, Inc. (formerly known as Van Kampen Funds Inc.); Chief Legal Officer, Invesco Exchange-Traded Fund Trust, Invesco Exchange-Traded Fund Trust II, Invesco India Exchange-Traded Fund Trust, Invesco Actively Managed Exchange-Traded Fund Trust, Invesco Actively Managed Exchange-Traded Commodity Fund Trust and Invesco Exchange-Traded Self-Indexed Fund Trust; Secretary, Invesco Indexing LLC; Director, Secretary, General Counsel and Senior Vice President, Van Kampen Exchange Corp.; Director, Vice President and Secretary, IVZ Distributors, Inc. (formerly known as INVESCO Distributors, Inc.); Director and Vice President, INVESCO Funds Group, Inc.; Director and Vice President, Van Kampen Advisors Inc.; Director, Vice President, Secretary and General Counsel, Van Kampen Investor Services Inc.; Director and Secretary, Invesco Distributors, Inc. (formerly known as Invesco AIM Distributors, Inc.); Director, Senior Vice President, General Counsel and Secretary, Invesco AIM Advisers, Inc. and Van Kampen Investments Inc.; Director, Vice President and Secretary, Fund Management Company; Director, Senior Vice President, Secretary, General Counsel and Vice President, Invesco AIM Capital Management, Inc.; Chief Operating Officer and General Counsel, Liberty Ridge Capital, Inc. (an investment adviser) | | N/A | | N/A |
Gregory G. McGreevey - 1962 Senior Vice President | | 2012 | | Senior Managing Director, Invesco Ltd.; Director, Chairman, President, and Chief Executive Officer, Invesco Advisers, Inc. (formerly known as Invesco Institutional (N.A.), Inc.) (registered investment adviser); Director, Invesco Mortgage Capital, Inc. and Invesco Senior Secured Management, Inc.; and Senior Vice President, The Invesco Funds; and President, SNW Asset Management Corporation Formerly: Senior Vice President, Invesco Management Group, Inc. and Invesco Advisers, Inc.; Assistant Vice President, The Invesco Funds | | N/A | | N/A |
Kelli Gallegos - 1970 Vice President, Principal Financial Officer and Assistant Treasurer | | 2008 | | Principal Financial and Accounting Officer - Investments Pool, Invesco Specialized Products, LLC; Vice President, Principal Financial Officer and Assistant Treasurer, The Invesco Funds; Principal Financial and Accounting Officer - Pooled Investments, Invesco Capital Management LLC; Vice President and Treasurer, Invesco Exchange-Traded Fund Trust, Invesco Exchange-Traded Fund Trust II, Invesco India Exchange-Traded Fund Trust, Invesco Actively Managed Exchange-Traded Fund Trust, Invesco Actively Managed Exchange-Traded Commodity Fund Trust and Invesco Exchange-Traded Self-Indexed Fund Trust Formerly: Assistant Treasurer, Invesco Specialized Products, LLC; Assistant Treasurer, Invesco Exchange-Traded Fund Trust, Invesco Exchange-Traded Fund Trust II, Invesco India Exchange-Traded Fund Trust, Invesco Actively Managed Exchange-Traded Fund Trust, Invesco Actively Managed Exchange-Traded Commodity Fund Trust and Invesco Exchange-Traded Self-Indexed Fund Trust; Assistant Treasurer, Invesco Capital Management LLC; Assistant Vice President, The Invesco Funds | | N/A | | N/A |
Invesco V.I. Managed Volatility Fund
Trustees and Officers–(continued)
| | | | | | | | |
Name, Year of Birth and Position(s) Held with the Trust | | Trustee and/or Officer Since | | Principal Occupation(s) During Past 5 Years | | Number of
Funds in
Fund Complex
Overseen by
Trustee | | Other Directorship(s) Held by Trustee
During Past 5 Years |
| Officers–(continued) |
Crissie M. Wisdom - 1969 Anti-Money Laundering Compliance Officer | | 2013 | | Anti-Money Laundering Compliance Officer, Invesco Advisers, Inc. (formerly known as Invesco Institutional (N.A.), Inc.) (registered investment adviser), Invesco Capital Markets, Inc. (formerly known as Van Kampen Funds Inc.), Invesco Distributors, Inc., Invesco Investment Services, Inc., The Invesco Funds, and Invesco Exchange-Traded Fund Trust, Invesco Exchange-Traded Fund Trust II, Invesco India Exchange-Traded Fund Trust, Invesco Actively Managed Exchange-Traded Fund Trust, Invesco Actively Managed Exchange-Traded Commodity Fund Trust and Invesco Exchange-Traded Self-Indexed Fund Trust; Anti-Money Laundering Compliance Officer and Bank Secrecy Act Officer, INVESCO National Trust Company and Invesco Trust Company; and Fraud Prevention Manager and Controls and Risk Analysis Manager for Invesco Investment Services, Inc. Formerly: Anti-Money Laundering Compliance Officer, Van Kampen Exchange Corp. and Invesco Management Group, Inc. | | N/A | | N/A |
Robert R. Leveille - 1969 Chief Compliance Officer | | 2016 | | Chief Compliance Officer, Invesco Advisers, Inc. (registered investment adviser); and Chief Compliance Officer, The Invesco Funds Formerly: Chief Compliance Officer, Putnam Investments and the Putnam Funds | | N/A | | N/A |
The Statement of Additional Information of the Trust includes additional information about the Fund’s Trustees and is available upon request, without charge, by calling 1.800.959.4246. Please refer to the Fund’s Statement of Additional Information for information on the Fund’ssub-advisers.
| | | | | | |
| Office of the Fund | | Investment Adviser | | Distributor | | Auditors |
| 11 Greenway Plaza, Suite 1000 | | Invesco Advisers, Inc. | | Invesco Distributors, Inc. | | PricewaterhouseCoopers LLP |
| Houston, TX 77046-1173 | | 1555 Peachtree Street, N.E. | | 11 Greenway Plaza, Suite 1000 | | 1000 Louisiana Street, Suite 5800 |
| | Atlanta, GA 30309 | | Houston, TX 77046-1173 | | Houston, TX 77002-5678 |
| | | |
| Counsel to the Fund | | Counsel to the Independent Trustees | | Transfer Agent | | Custodian |
| Stradley Ronon Stevens & Young, LLP | | Goodwin Procter LLP | | Invesco Investment Services, Inc. | | State Street Bank and Trust Company |
| 2005 Market Street, Suite 2600 | | 901 New York Avenue, N.W. | | 11 Greenway Plaza, Suite 1000 | | 225 Franklin Street |
| Philadelphia, PA 19103-7018 | | Washington, D.C. 20001 | | Houston, TX 77046-1173 | | Boston, MA 02110-2801 |
Invesco V.I. Managed Volatility Fund
| | | | |
| | |
 | | Annual Report to Shareholders | | December 31, 2019 |
| | |
| | Invesco V.I. Mid Cap Core Equity Fund |

Beginning on January 1, 2021, as permitted by regulations adopted by the Securities and Exchange Commission, the insurance company that offers your variable annuity or variable life insurance contract may no longer send you paper copies of the Fund’s shareholder reports by mail, unless you specifically request paper copies of the reports from the insurance company or your financial intermediary. Instead of delivering paper copies of the report, the insurance company may choose to make the reports available on a website, and will notify you by mail each time a report is posted and provide you with a website link to access the report. Instructions for requesting paper copies will be provided by your insurance company.
If the insurance company offers electronic delivery, you may elect to receive shareholder reports and other communications about the Fund electronically by following the instructions provided by the insurance company or by contacting your financial intermediary. If you already elected to receive shareholder reports electronically, you will not be affected by this change and you need not take any action.
You may elect to receive all future reports in paper free of charge from the insurance company. You can inform the insurance company or your financial intermediary that you wish to continue receiving paper copies of your shareholder reports by following the instructions provided by the insurance company or by contacting your financial intermediary. Your election to receive reports in paper will apply to all portfolio companies available under your contract with the insurance company.
The Fund provides a complete list of its holdings four times in each fiscal year, at the quarter-ends. For the second and fourth quarters, the lists appear in the Fund’s semiannual and annual reports to shareholders. For the first and third quarters, the Fund files the lists with the Securities and Exchange Commission (SEC) as an exhibit to its reports on FormN-PORT. The Fund’s FormN-PORT filings are available on the SEC website, sec.gov. The SEC file numbers for the Fund are811-07452 and033-57340. The Fund’s most recent portfolio holdings, as filed on FormN-PORT, have also been made available to insurance companies issuing variable annuity contracts and variable life insurance policies (“variable products”) that invest in the Fund.
A description of the policies and procedures that the Fund uses to determine how to vote proxies relating to portfolio securities is available without charge, upon request, from our Client Services department at 800 959 4246 or at invesco.com/proxyguidelines. The information is also available on the SEC website, sec.gov.
Information regarding how the Fund voted proxies related to its portfolio securities during the most recent12-month period ended June 30 is available at invesco.com/proxysearch. The information is also available on the SEC website, sec.gov.
Invesco Advisers, Inc. is an investment adviser; it provides investment advisory services to individual and institutional clients and does not sell securities. Invesco Distributors, Inc. is the US distributor for Invesco Ltd.’s retail mutual funds, exchange-traded funds and institutional money market funds. Both are wholly owned, indirect subsidiaries of Invesco Ltd.
This report must be accompanied or preceded by a currently effective Fund prospectus and variable product prospectus, which contain more complete information, including sales charges and expenses. Investors should read each carefully before investing.
| | | | |
| | | |
| NOT FDIC INSURED | MAY LOSE VALUE | NO BANK GUARANTEE | | | | |
| | |
Invesco Distributors, Inc. | | VIMCCE-AR-1 | | |
Management’s Discussion of Fund Performance
Performance summary
For the year ended December 31, 2019, Series I shares of Invesco V.I. Mid Cap
Core Equity Fund (the Fund) underperformed the Russell Midcap Index, the Fund’s style-specific benchmark.
Your Fund’s long-term performance appears later in this report.
Fund vs. Indexes
Total returns, 12/31/18 to 12/31/19, excluding variable product issuer charges. If variable product issuer charges were included, returns would be lower.
| | | | | |
| Series I Shares | | | | 25.28 | % |
| Series II Shares | | | | 25.04 | |
| S&P 500 Indexq(Broad Market Index) | | | | 31.49 | |
| Russell Midcap Indexq(Style-Specific Index) | | | | 30.54 | |
| Lipper VUFMid-Cap Core Funds Index∎(Peer Group Index) | | | | 26.84 | |
| |
| Source(s):qRIMES Technologies Corp.;∎Lipper Inc. | | | | | |
Market conditions and your Fund
Equity markets rallied in the first quarter of 2019, fueled by optimism about a potentialUS-China trade deal and indication that the US Federal Reserve (the Fed) would not raise interest rates in 2019, a surprising shift in monetary policy. The Fed’s more accommodative stance provided a supportive environment for equities and fixed income, even as US economic data were mixed and overseas growth appeared to be slowing. Against this backdrop, the S&P 500 Index posted its best first quarter returns since 1998.
Although the S&P 500 Index posted modest gains for the second quarter of 2019, the US stock market experienced increased volatility. After four consecutive months of rising stock markets, the market sold off in May 2019, along with bond yields and oil prices, as investors weighed the impact of the lingering trade war between the US and China, as well as potential tariffs imposed on Mexico. In addition, economic data showed a slowing domestic and global economy.
Key issues that concerned investors in the second quarter of 2019 carried over
into the third quarter. TheUS-China trade conflict worried investors and stifled business investment, even as the Fed cut interest rates by 0.25% in July and again in September 2019.1 This environment, combined with evidence of slowing global economic growth, fueled market volatility in August 2019. The US Treasury yield curve inverted several times, increasing fears of a possible US recession. As a result, August saw increased risk aversion, with investors crowding into asset classes perceived as safe havens, such as US Treasuries and gold. However, the Fed’s accommodative tone provided some support for risk assets.
Macroeconomic issues that concerned investors in the third quarter of 2019 mostly abated during the fourth quarter, providing the backdrop for strong equity market returns. Risk assets surged higher as a result of a delay in the Brexit agreement until January 2020, optimism that phase one of aUS-China trade deal would be completed and better-than-expected third-quarter corporate earnings results. The US economy rose higher than expected, at 2.1% during the third
quarter of 2019.2 During its October meeting, the Fed cut interest rates again by 0.25% based on business investment and exports remaining weak.1 Investors were also encouraged by a resilient US economy and corporate earnings, putting the US equity market on track for its largest annual rise since 2013.
During the year, the Fund produced a strong absolute return but underperformed its style-specific benchmark. Key detractors from the Fund’s relative performance included stock selection in the industrials, consumer staples and materials sectors. A significant cash position during the first half of the year was also a large drag on the Fund’s relative performance. The Fund’s cash position was significantly reduced and ended the year at less than 2% of the portfolio, down from over 20% in March. Top contributors to the Fund’s relative performance included stock selection in the information technology (IT), consumer discretionary and financials sectors.
Key individual contributors to the Fund’s absolute returns includedKLA, Keysight TechnologiesandEPAM Systemsas IT stocks generally performed well during the year.
KLA, a semiconductor manufacturing company, delivered strong revenue and earnings results during the year.
Keysight Technologies, a manufacturer of electronic test and measurement equipment and software, also benefited from the strength across the IT sector.
EPAM Systems provides software engineering solutions and technology services. The company benefited from an increased demand for digital products, which resulted in strong growth rates and increasing margins. We exited this holding before the close of the year.
Key individual detractors from the Fund’s absolute returns includedSpirit
| | |
| Portfolio Composition |
By sector | | % of total net assets |
| | |
| |
| Industrials | | 17.52% |
| Health Care | | 14.96 |
| Information Technology | | 14.50 |
| Energy | | 10.34 |
| Financials | | 9.24 |
| Consumer Discretionary | | 7.64 |
| Real Estate | | 6.49 |
| Consumer Staples | | 6.35 |
| Utilities | | 6.30 |
| Communication Services | | 3.28 |
| Materials | | 2.95 |
| Money Market Funds Plus Other Assets Less Liabilities | | 0.43 |
| | |
| Top 10 Equity Holdings* |
% of total net assets |
| | |
| |
| 1. Fiserv, Inc. | | 3.11% |
2. Schlumberger Ltd. | | 3.10 |
3. Noble Energy, Inc. | | 2.78 |
4. Westinghouse Air Brake Technologies Corp. | | 2.68 |
5. UGI Corp. | | 2.65 |
6. Prologis, Inc. | | 2.60 |
7. Coca-Cola European Partners PLC | | 2.50 |
8. Elanco Animal Health, Inc. | | 2.39 |
9. Eastman Chemical Co. | | 2.37 |
10.T-Mobile US, Inc. | | 2.33 |
| | |
| Total Net Assets | | $247.0 million |
| |
| Total Number of Holdings* | | 78 |
The Fund’s holdings are subject to change, and there is no assurance that the Fund will continue to hold any particular security.
*Excluding money market fund holdings, if any.
Data presented here are as of December 31, 2019.
Invesco V.I. Mid Cap Core Equity Fund
Airlines, UGIandNordstrom.Spirit Airlines, a provider ofultra-low-cost airline fares, sold off during the third quarter. The company reported a spike in costs driven by poor execution from stretching its network too thin, runway construction at its Fort Lauderdale hub and the impact of Hurricane Dorian.
Utility provider UGI was purchased during the second half of the year. During this time, however, the utilities sector performed poorly asso-called “bond proxies” were out of favor.
Nordstrom was negatively impacted by general weakness across department store stocks, which challenged the consumer goods sector and broader market as commerce continued to shift online. We exited this holding before the close of the year.
At the close of the year, we expected that in the short-term, the US economy would continue to show economic growth, albeit at a slower rate than experienced in 2018 and early 2019, driven by increased consumer confidence, fewer regulatory hurdles and technological innovation. However, we saw several warning signs on the horizon including less synchronized global growth, weakening transport volumes, poor ISM purchasing managers surveys and a recent flattening/inversion of the US Treasury yield curve. While a recession toward the end of 2020 would not surprise us, it was not our base case assumption atyear-end.
Please note that a new portfolio management team began managing the Fund on June 21, 2019.
We thank you for your continued investment in Invesco V.I. Mid Cap Core Equity Fund.
| 1 | Source: US Federal Reserve |
| 2 | Source: Bureau of Economic Analysis |
Portfolio managers:
Raymond Anello - Lead
Joy Budzinski
Kristin Ketner
Magnus Krantz
Raman Vardharaj
Adam Weiner
Matthew Ziehl
The views and opinions expressed in management’s discussion of Fund performance are those of Invesco Advisers, Inc. These views and opinions are subject to change at any time based on factors such as market and economic conditions. These views and opinions may not be relied upon as investment advice or recommendations, or as an
offer for a particular security. The information is not a complete analysis of every aspect of any market, country, industry, security or the Fund. Statements of fact are from sources considered reliable, but Invesco Advisers, Inc. makes no representation or warranty as to their completeness or accuracy. Although historical performance is no guarantee of future results, these insights may help you understand our investment management philosophy.
See important Fund and, if applicable, index disclosures later in this report.
Invesco V.I. Mid Cap Core Equity Fund
Your Fund’s Long-Term Performance
Results of a $10,000 Investment – Oldest Share Class(es)
Fund and index data from 12/31/09
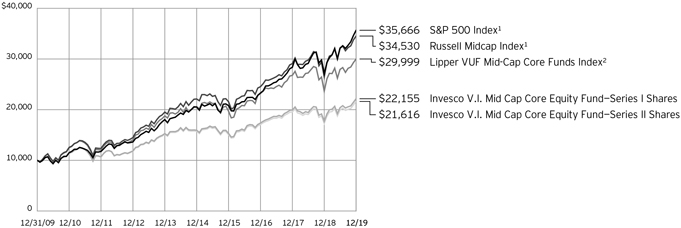
| 1 | Source: RIMES Technologies Corp. |
Past performance cannot guarantee
future results.
| | | | |
| Average Annual Total Returns | |
As of 12/31/19 | | | | |
| |
| Series I Shares | | | | |
| Inception (9/10/01) | | | 7.47 | % |
| 10 Years | | | 8.28 | |
| 5 Years | | | 6.80 | |
| 1 Year | | | 25.28 | |
| |
Series II Shares | | | | |
| Inception (9/10/01) | | | 7.21 | % |
| 10 Years | | | 8.01 | |
| 5 Years | | | 6.54 | |
| 1 Year | | | 25.04 | |
The performance of the Fund’s Series I and Series II share classes will differ primarily due to different class expenses.
The performance data quoted represent past performance and cannot guarantee future results; current performance may be lower or higher. Please contact your variable product issuer or financial adviser for the most recentmonth-end variable product performance. Performance figures reflect Fund expenses, reinvested distributions and changes in net asset value. Performance figures do not reflect deduction of taxes a shareholder would pay on Fund distributions or sale of Fund shares. Investment return and principal value will fluctuate so that you may have a gain or loss when you sell shares.
The net annual Fund operating expense ratio set forth in the most recent Fund prospectus as of the date of this report for Series I and Series II shares was 0.95% and 1.20%, respectively.1 The total annual Fund operating expense ratio set forth in
the most recent Fund prospectus as of the date of this report for Series I and Series II shares was 0.98% and 1.23%, respectively. The expense ratios presented above may vary from the expense ratios presented in other sections of this report that are based on expenses incurred during the period covered by this report.
Invesco V.I. Mid Cap Core Equity Fund, a series portfolio of AIM Variable Insurance Funds (Invesco Variable Insurance Funds), is currently offered through insurance companies issuing variable products. You cannot purchase shares of the Fund directly. Performance figures given represent the Fund and are not intended to reflect actual variable product values. They do not reflect sales charges, expenses and fees assessed in connection with a variable product. Sales charges, expenses and fees, which are determined by the variable product issuers, will vary and will lower the total return.
The most recentmonth-end performance at the Fund level, excluding variable product charges, is available at 800 451 4246. As mentioned above, for the most recentmonth-end performance including variable product charges, please contact your variable product issuer or financial adviser.
Fund performance reflects any applicable fee waivers and/or expense reimbursements. Had the adviser not waived fees and/or reimbursed expenses currently or in the past, returns would have been lower. See current prospectus for more information.
| 1 | Total annual Fund operating expenses after any |
| | contractual fee waivers and/or expense reimbursements by the adviser in effect through at least June 30, 2021. See current prospectus for more information. |
Invesco V.I. Mid Cap Core Equity Fund
Invesco V.I. Mid Cap Core Equity Fund’s investment objective is long-term growth of capital.
| ∎ | | Unless otherwise stated, information presented in this report is as of December 31, 2019, and is based on total net assets. |
| ∎ | | Unless otherwise noted, all data provided by Invesco. |
| ∎ | | To access your Fund’s reports/prospectus, visit invesco.com/fundreports. |
About indexes used in this report
| ∎ | | TheS&P 500® Indexis an unmanaged index considered representative of the US stock market. |
| ∎ | | TheRussell Midcap® Indexis an unmanaged index considered representative ofmid-cap stocks. The Russell Midcap Index is a trademark/service mark of the Frank Russell Co. Russell® is a trademark of the Frank Russell Co. |
| ∎ | | TheLipper VUFMid-Cap Core Funds Indexis an unmanaged index considered representative ofmid-cap core variable insurance underlying funds tracked by Lipper. |
| ∎ | | The Fund is not managed to track the performance of any particular index, including the index(es) described here, and consequently, the performance of the Fund may deviate significantly from the performance of the index(es). |
| ∎ | | A direct investment cannot be made in an index. Unless otherwise indicated, index results include reinvested dividends, and they do not reflect sales charges. Performance of the peer group, if applicable, reflects fund expenses; performance of a market index does not. |
Other information
| ∎ | | The returns shown in management’s discussion of Fund performance are based on net asset values calculated for shareholder transactions. Generally accepted accounting principles require adjustments to be made to the net assets of the Fund at period end for financial reporting purposes, and as such, the net asset values for shareholder transactions and the returns based on those net asset values may differ from the net asset values and returns reported in the Financial Highlights. Additionally, the returns and net asset values shown throughout this report are at the Fund level only and do not include variable product issuer charges. If such charges were included, the total returns would be lower. |
| ∎ | | Industry classifications used in this report are generally according to the Global Industry Classification Standard, which was developed by and is |
the exclusive property and a service mark of MSCI Inc. and Standard & Poor’s.
Invesco V.I. Mid Cap Core Equity Fund
Schedule of Investments(a)
December 31, 2019
| | | | | | | | |
| | | Shares | | | Value | |
Common Stocks & Other Equity Interests–99.57% | |
| Aerospace & Defense–2.08% | |
L3Harris Technologies, Inc. | | | 25,981 | | | $ | 5,140,861 | |
| |
|
| Airlines–1.40% | |
Spirit Airlines, Inc.(b) | | | 86,022 | | | | 3,467,547 | |
| |
|
| Apparel Retail–1.21% | |
Burlington Stores, Inc.(b) | | | 13,067 | | | | 2,979,668 | |
| |
|
| Application Software–1.63% | |
Q2 Holdings, Inc.(b) | | | 17,191 | | | | 1,393,846 | |
| |
Synopsys, Inc.(b) | | | 18,953 | | | | 2,638,258 | |
| |
| | | | | | | 4,032,104 | |
| |
|
| Auto Parts & Equipment–1.60% | |
Visteon Corp.(b) | | | 45,755 | | | | 3,961,925 | |
| |
|
| Automotive Retail–0.60% | |
O’Reilly Automotive, Inc.(b) | | | 3,409 | | | | 1,494,028 | |
| |
|
| Biotechnology–2.10% | |
Sarepta Therapeutics, Inc.(b) | | | 9,009 | | | | 1,162,521 | |
| |
Seattle Genetics, Inc.(b) | | | 19,349 | | | | 2,210,817 | |
| |
Vertex Pharmaceuticals, Inc.(b) | | | 8,235 | | | | 1,803,053 | |
| |
| | | | | | | 5,176,391 | |
| |
|
| Communications Equipment–1.50% | |
Motorola Solutions, Inc. | | | 22,951 | | | | 3,698,324 | |
| |
|
| Construction Machinery & Heavy Trucks–2.68% | |
Westinghouse Air Brake Technologies Corp. | | | 85,037 | | | | 6,615,879 | |
| |
|
| Consumer Finance–1.07% | |
Capital One Financial Corp. | | | 25,734 | | | | 2,648,286 | |
| |
|
| Data Processing & Outsourced Services–3.11% | |
Fiserv, Inc.(b) | | | 66,499 | | | | 7,689,279 | |
| |
|
| Distillers & Vintners–1.24% | |
Constellation Brands, Inc., Class A | | | 16,192 | | | | 3,072,432 | |
| |
|
| Diversified Chemicals–2.37% | |
Eastman Chemical Co. | | | 73,873 | | | | 5,855,174 | |
| |
|
| Diversified Support Services–0.89% | |
IAA, Inc.(b) | | | 46,804 | | | | 2,202,596 | |
| |
|
| Electric Utilities–0.80% | |
PPL Corp. | | | 55,300 | | | | 1,984,164 | |
| |
|
| Electronic Equipment & Instruments–1.30% | |
Keysight Technologies, Inc.(b) | | | 31,260 | | | | 3,208,214 | |
| |
|
| Environmental & Facilities Services–1.11% | |
Republic Services, Inc. | | | 30,562 | | | | 2,739,272 | |
| |
| | | | | | | | |
| | | Shares | | | Value | |
| Financial Exchanges & Data–0.74% | |
Tradeweb Markets, Inc., Class A | | | 39,336 | | | $ | 1,823,224 | |
| |
|
| Gas Utilities–2.65% | |
UGI Corp. | | | 145,012 | | | | 6,548,742 | |
| |
|
| Gold–0.58% | |
Franco-Nevada Corp. (Canada) | | | 13,805 | | | | 1,426,057 | |
| |
|
| Health Care Equipment–6.12% | |
Boston Scientific Corp.(b) | | | 58,278 | | | | 2,635,331 | |
| |
DexCom, Inc.(b) | | | 11,336 | | | | 2,479,637 | |
| |
IDEXX Laboratories, Inc.(b) | | | 4,721 | | | | 1,232,795 | |
| |
Intuitive Surgical, Inc.(b) | | | 3,376 | | | | 1,995,722 | |
| |
Teleflex, Inc. | | | 3,378 | | | | 1,271,614 | |
| |
Zimmer Biomet Holdings, Inc. | | | 36,713 | | | | 5,495,202 | |
| |
| | | | | | | 15,110,301 | |
| |
|
| Health Care Facilities–0.67% | |
HCA Healthcare, Inc. | | | 11,224 | | | | 1,659,019 | |
| |
|
| Health Care Services–1.36% | |
Guardant Health, Inc.(b) | | | 14,819 | | | | 1,157,957 | |
| |
LHC Group, Inc.(b) | | | 15,974 | | | | 2,200,578 | |
| |
| | | | | | | 3,358,535 | |
| |
|
| Health Care Supplies–1.03% | |
Alcon, Inc. (Switzerland)(b) | | | 45,120 | | | | 2,552,438 | |
| |
|
| Homebuilding–0.95% | |
D.R. Horton, Inc. | | | 44,503 | | | | 2,347,533 | |
| |
|
| Human Resource & Employment Services–1.40% | |
Korn Ferry | | | 81,811 | | | | 3,468,786 | |
| |
|
| Hypermarkets & Super Centers–1.44% | |
BJ’s Wholesale Club Holdings, Inc.(b) | | | 156,451 | | | | 3,557,696 | |
| |
|
| Industrial Machinery–4.97% | |
Chart Industries, Inc.(b) | | | 20,799 | | | | 1,403,724 | |
| |
Ingersoll-Rand PLC | | | 32,935 | | | | 4,377,720 | |
| |
ITT, Inc. | | | 43,494 | | | | 3,214,642 | |
| |
Stanley Black & Decker, Inc. | | | 19,850 | | | | 3,289,939 | |
| |
| | | | | | | 12,286,025 | |
| |
|
| Industrial REITs–2.60% | |
Prologis, Inc. | | | 72,047 | | | | 6,422,270 | |
| |
|
| Insurance Brokers–1.12% | |
Arthur J. Gallagher & Co. | | | 29,071 | | | | 2,768,431 | |
| |
|
| Interactive Home Entertainment–0.95% | |
Zynga, Inc., Class A(b) | | | 383,197 | | | | 2,345,166 | |
| |
|
| Investment Banking & Brokerage–0.67% | |
E*TRADE Financial Corp. | | | 36,226 | | | | 1,643,574 | |
| |
See accompanying Notes to Financial Statements which are an integral part of the financial statements.
Invesco V.I. Mid Cap Core Equity Fund
| | | | | | | | |
| | | Shares | | | Value | |
| IT Consulting & Other Services–2.25% | |
Amdocs Ltd. | | | 41,237 | | | $ | 2,976,899 | |
| |
KBR, Inc. | | | 84,485 | | | | 2,576,793 | |
| |
| | | | | | | 5,553,692 | |
| |
|
| Leisure Products–0.54% | |
Peloton Interactive, Inc., Class A(b)(c) | | | 46,651 | | | | 1,324,888 | |
| |
|
| Life & Health Insurance–0.72% | |
Lincoln National Corp. | | | 30,134 | | | | 1,778,207 | |
| |
|
| Managed Health Care–1.30% | |
Humana, Inc. | | | 8,732 | | | | 3,200,453 | |
| |
|
| Multi-Utilities–2.85% | |
CMS Energy Corp. | | | 16,483 | | | | 1,035,792 | |
| |
Dominion Energy, Inc. | | | 49,716 | | | | 4,117,479 | |
| |
Public Service Enterprise Group, Inc. | | | 31,739 | | | | 1,874,188 | |
| |
| | | | | | | 7,027,459 | |
| |
|
| Office REITs–1.47% | |
SL Green Realty Corp. | | | 39,452 | | | | 3,624,850 | |
| |
|
| Oil & Gas Equipment & Services–3.10% | |
Schlumberger Ltd. | | | 190,352 | | | | 7,652,150 | |
| |
|
| Oil & Gas Exploration & Production–5.20% | |
Diamondback Energy, Inc. | | | 47,061 | | | | 4,370,084 | |
| |
Matador Resources Co.(b) | | | 89,290 | | | | 1,604,541 | |
| |
Noble Energy, Inc. | | | 276,952 | | | | 6,879,488 | |
| |
| | | | | | | 12,854,113 | |
| |
|
| Oil & Gas Storage & Transportation–2.04% | |
Magellan Midstream Partners L.P. | | | 80,079 | | | | 5,034,567 | |
| |
|
| Packaged Foods & Meats–1.17% | |
Conagra Brands, Inc. | | | 84,398 | | | | 2,889,788 | |
| |
|
| Pharmaceuticals–2.39% | |
Elanco Animal Health, Inc.(b) | | | 200,262 | | | | 5,897,716 | |
| |
|
| Property & Casualty Insurance–0.87% | |
Fidelity National Financial, Inc. | | | 47,637 | | | | 2,160,338 | |
| |
|
| Railroads–2.22% | |
Canadian Pacific Railway Ltd. (Canada) | | | 21,461 | | | | 5,471,482 | |
| |
|
| Regional Banks–4.05% | |
East West Bancorp, Inc. | | | 52,945 | | | | 2,578,422 | |
| |
Huntington Bancshares, Inc. | | | 74,905 | | | | 1,129,567 | |
| |
Sterling Bancorp | | | 95,377 | | | | 2,010,547 | |
| |
SVB Financial Group(b) | | | 7,804 | | | | 1,959,116 | |
| |
TCF Financial Corp. | | | 49,810 | | | | 2,331,108 | |
| |
| | | | | | | 10,008,760 | |
| |
|
| Restaurants–2.01% | |
Wendy’s Co. (The) | | | 223,382 | | | | 4,961,314 | |
| |
| | | | | | | | |
| | | Shares | | | Value | |
| Semiconductor Equipment–3.05% | |
Applied Materials, Inc. | | | 61,781 | | | $ | 3,771,112 | |
| |
KLA Corp. | | | 21,175 | | | | 3,772,750 | |
| |
| | | | | | | 7,543,862 | |
| |
|
| Semiconductors–1.66% | |
Microchip Technology, Inc. | | | 39,083 | | | | 4,092,772 | |
| |
|
| Soft Drinks–2.50% | |
Coca-Cola European Partners PLC (United Kingdom) | | | 121,411 | | | | 6,177,392 | |
| |
|
| Specialized REITs–2.43% | |
EPR Properties | | | 20,803 | | | | 1,469,524 | |
| |
Lamar Advertising Co., Class A | | | 23,568 | | | | 2,103,679 | |
| |
Outfront Media, Inc. | | | 90,162 | | | | 2,418,145 | |
| |
| | | | | | | 5,991,348 | |
| |
|
| Specialty Stores–0.72% | |
Ulta Beauty, Inc.(b) | | | 7,071 | | | | 1,789,953 | |
| |
|
| Trading Companies & Distributors–0.76% | |
Fastenal Co. | | | 50,911 | | | | 1,881,161 | |
| |
|
| Wireless Telecommunication Services–2.33% | |
T-Mobile US, Inc.(b) | | | 73,533 | | | | 5,766,458 | |
| |
Total Common Stocks & Other Equity Interests (Cost $212,532,897) | | | | 245,966,664 | |
| |
|
| Money Market Funds–1.08% | |
Invesco Government & Agency Portfolio, Institutional Class, 1.50%(d) | | | 1,051,777 | | | | 1,051,777 | |
| |
Invesco Liquid Assets Portfolio, Institutional Class, 1.71%(d) | | | 401,713 | | | | 401,834 | |
| |
Invesco Treasury Portfolio, Institutional Class, 1.49%(d) | | | 1,202,031 | | | | 1,202,031 | |
| |
Total Money Market Funds
(Cost $2,655,636) | | | | | | | 2,655,642 | |
| |
TOTAL INVESTMENTS IN SECURITIES (excluding investments purchased with cash collateral from securities onloan)-100.65%
(Cost $215,188,533) | | | | 248,622,306 | |
| |
| Investments Purchased with Cash Collateral from Securities on Loan | |
|
| Money Market Funds–0.36% | |
Invesco Government & Agency Portfolio, Institutional Class, 1.50%(d)(e) | | | 674,953 | | | | 674,953 | |
| |
Invesco Liquid Assets Portfolio, Institutional Class, 1.71%(d)(e) | | | 224,917 | | | | 224,984 | |
| |
Total Investments Purchased with Cash Collateral from Securities on Loan
(Cost $899,958) | | | | 899,937 | |
| |
TOTAL INVESTMENTS IN SECURITIES–101.01% (Cost $216,088,491) | | | | 249,522,243 | |
| |
OTHER ASSETS LESS LIABILITIES-(1.01)% | | | | (2,505,841 | ) |
| |
NET ASSETS–100.00% | | | | | | $ | 247,016,402 | |
| |
See accompanying Notes to Financial Statements which are an integral part of the financial statements.
Invesco V.I. Mid Cap Core Equity Fund
Investment Abbreviations:
REIT – Real Estate Investment Trust
Notes to Schedule of Investments:
| (a) | Industry and/or sector classifications used in this report are generally according to the Global Industry Classification Standard, which was developed by and is the exclusive property and a service mark of MSCI Inc. and Standard & Poor’s. |
| (b) | Non-income producing security. |
| (c) | All or a portion of this security was out on loan at December 31, 2019. |
| (d) | The money market fund and the Fund are affiliated by having the same investment adviser. The rate shown is the7-day SEC standardized yield as of December 31, 2019. |
| (e) | The security has been segregated to satisfy the commitment to return the cash collateral received in securities lending transactions upon the borrower’s return of the securities loaned. See Note 1I. |
See accompanying Notes to Financial Statements which are an integral part of the financial statements.
Invesco V.I. Mid Cap Core Equity Fund
Statement of Assets and Liabilities
December 31, 2019
| | | | |
Assets: | | | | |
Investments in securities, at value
(Cost $ 212,532,897)* | | $ | 245,966,664 | |
| |
Investments in affiliated money market funds, at value (Cost $3,555,594) | | | 3,555,579 | |
| |
Cash | | | 2,326,922 | |
| |
Receivable for: | | | | |
Investments sold | | | 1,235,095 | |
| |
Fund shares sold | | | 12,779 | |
| |
Dividends | | | 327,306 | |
| |
Investment for trustee deferred compensation and retirement plans | | | 126,301 | |
| |
Total assets | | | 253,550,646 | |
| |
| |
Liabilities: | | | | |
Payable for: | | | | |
Investments purchased | | | 4,162,486 | |
| |
Fund shares reacquired | | | 1,138,143 | |
| |
Collateral upon return of securities loaned | | | 899,958 | |
| |
Accrued fees to affiliates | | | 152,513 | |
| |
Accrued other operating expenses | | | 45,014 | |
| |
Trustee deferred compensation and retirement plans | | | 136,130 | |
| |
Total liabilities | | | 6,534,244 | |
| |
Net assets applicable to shares outstanding | | $ | 247,016,402 | |
| |
| |
Net assets consist of: | | | | |
| |
Shares of beneficial interest | | $ | 167,461,127 | |
| |
Distributable earnings | | | 79,555,275 | |
| |
| | $ | 247,016,402 | |
| |
| |
Net Assets: | | | | |
Series I | | $ | 157,959,388 | |
| |
Series II | | $ | 89,057,014 | |
| |
|
Shares outstanding, no par value, with an unlimited number of shares authorized: | |
Series I | | | 12,968,112 | |
| |
Series II | | | 7,499,519 | |
| |
Series I: | | | | |
Net asset value per share | | $ | 12.18 | |
| |
Series II: | | | | |
Net asset value per share | | $ | 11.88 | |
| |
| * | At December 31, 2019, securities with an aggregate value of $882,120 were on loan to brokers. |
Statement of Operations
For the year ended December 31, 2019
| | | | |
Investment income: | | | | |
Dividends (net of foreign withholding taxes of $24,792) | | $ | 3,252,730 | |
| |
Dividends from affiliated money market funds (includes securities lending income of $7,470) | | | 670,458 | |
| |
Total investment income | | | 3,923,188 | |
| |
| |
Expenses: | | | | |
Advisory fees | | | 1,742,463 | |
| |
Administrative services fees | | | 395,603 | |
| |
Custodian fees | | | 5,759 | |
| |
Distribution fees - Series II | | | 207,918 | |
| |
Transfer agent fees | | | 37,558 | |
| |
Trustees’ and officers’ fees and benefits | | | 21,744 | |
| |
Reports to shareholders | | | 6,770 | |
| |
Professional services fees | | | 50,021 | |
| |
Other | | | 4,422 | |
| |
Total expenses | | | 2,472,258 | |
| |
Less: Fees waived | | | (36,831 | ) |
| |
Net expenses | | | 2,435,427 | |
| |
Net investment income | | | 1,487,761 | |
| |
| |
Realized and unrealized gain (loss) from: | | | | |
Net realized gain (loss) from: | | | | |
Investment securities (includes net gains from securities sold to affiliates of $240,609) | | | 45,992,857 | |
| |
Foreign currencies | | | (656 | ) |
| |
| | | 45,992,201 | |
| |
Change in net unrealized appreciation of: | | | | |
Investment securities | | | 5,911,870 | |
| |
Foreign currencies | | | 151 | |
| |
| | | 5,912,021 | |
| |
Net realized and unrealized gain | | | 51,904,222 | |
| |
Net increase in net assets resulting from operations | | $ | 53,391,983 | |
| |
See accompanying Notes to Financial Statements which are an integral part of the financial statements.
Invesco V.I. Mid Cap Core Equity Fund
Statement of Changes in Net Assets
For the years ended December 31, 2019 and 2018
| | | | | | | | |
| | | 2019 | | | 2018 | |
| |
Operations: | | | | | | | | |
Net investment income | | $ | 1,487,761 | | | $ | 999,300 | |
| |
Net realized gain | | | 45,992,201 | | | | 26,580,216 | |
| |
Change in net unrealized appreciation (depreciation) | | | 5,912,021 | | | | (58,167,791 | ) |
| |
Net increase (decrease) in net assets resulting from operations | | | 53,391,983 | | | | (30,588,275 | ) |
| |
| | |
Distributions to shareholders from distributable earnings: | | | | | | | | |
Series I | | | (17,475,575 | ) | | | (25,354,121 | ) |
| |
Series II | | | (9,551,503 | ) | | | (12,182,243 | ) |
| |
Total distributions from distributable earnings | | | (27,027,078 | ) | | | (37,536,364 | ) |
| |
| | |
Share transactions–net: | | | | | | | | |
Series I | | | (7,906,038 | ) | | | 350,737 | |
| |
Series II | | | 8,650,685 | | | | (45,715,623 | ) |
| |
Net increase (decrease) in net assets resulting from share transactions | | | 744,647 | | | | (45,364,886 | ) |
| |
Net increase (decrease) in net assets | | | 27,109,552 | | | | (113,489,525 | ) |
| |
| | |
Net assets: | | | | | | | | |
Beginning of year | | | 219,906,850 | | | | 333,396,375 | |
| |
End of year | | $ | 247,016,402 | | | $ | 219,906,850 | |
| |
See accompanying Notes to Financial Statements which are an integral part of the financial statements.
Invesco V.I. Mid Cap Core Equity Fund
Financial Highlights
The following schedule presents financial highlights for a share of the Fund outstanding throughout the periods indicated.
| | | | | | | | | | | | | | | | | | | | | | | | | | | | | | | | | | | | | | | | | | | | | | | | | | | | | | | | |
| | | Net asset
value,
beginning
of period | | | Net investment
income (loss)(a) | | | Net gains
(losses)
on securities
(both realized and unrealized) | | | Total from
investment operations | | | Dividends from net investment income | | | Distributions from net realized
gains | | | Total
distributions | | | Net asset
value, end of period | | | Total
return (b) | | | Net assets,
end of period (000’s omitted) | | | Ratio of
expenses
to average
net assets
with fee waivers
and/or
expenses
absorbed | | | Ratio of
expenses
to average net
assets without fee waivers
and/or
expenses
absorbed | | | Ratio of net investment
income (loss) to average
net assets | | | Portfolio turnover (c) | |
Series I | | | | | | | | | | | | | | | | | | | | | | | | | | | | | | | | | | | | | | | | | | | | | | | | | | | | | | | | |
Year ended 12/31/19 | | $ | 10.97 | | | $ | 0.09 | | | $ | 2.57 | | | $ | 2.66 | | | $ | (0.06 | ) | | $ | (1.39 | ) | | $ | (1.45 | ) | | $ | 12.18 | | | | 25.28 | % | | $ | 157,959 | | | | 0.93 | %(d) | | | 0.94 | %(d) | | | 0.70 | %(d) | | | 114 | % |
Year ended 12/31/18 | | | 14.41 | | | | 0.06 | | | | (1.39 | ) | | | (1.33 | ) | | | (0.07 | ) | | | (2.04 | ) | | | (2.11 | ) | | | 10.97 | | | | (11.35 | ) | | | 148,078 | | | | 0.91 | | | | 0.94 | | | | 0.46 | | | | 27 | |
Year ended 12/31/17 | | | 12.87 | | | | 0.05 | | | | 1.85 | | | | 1.90 | | | | (0.07 | ) | | | (0.29 | ) | | | (0.36 | ) | | | 14.41 | | | | 14.92 | | | | 192,277 | | | | 0.94 | | | | 0.96 | | | | 0.37 | | | | 45 | |
Year ended 12/31/16 | | | 12.12 | | | | 0.07 | | | | 1.54 | | | | 1.61 | | | | (0.01 | ) | | | (0.85 | ) | | | (0.86 | ) | | | 12.87 | | | | 13.43 | | | | 195,464 | | | | 0.98 | | | | 1.00 | | | | 0.57 | | | | 29 | |
Year ended 12/31/15 | | | 14.06 | | | | 0.02 | | | | (0.58 | ) | | | (0.56 | ) | | | (0.05 | ) | | | (1.33 | ) | | | (1.38 | ) | | | 12.12 | | | | (4.03 | ) | | | 201,685 | | | | 1.01 | | | | 1.03 | | | | 0.17 | | | | 44 | |
Series II | | | | | | | | | | | | | | | | | | | | | | | | | | | | | | | | | | | | | | | | | | | | | | | | | | | | | | | | |
Year ended 12/31/19 | | | 10.72 | | | | 0.05 | | | | 2.53 | | | | 2.58 | | | | (0.03 | ) | | | (1.39 | ) | | | (1.42 | ) | | | 11.88 | | | | 25.04 | | | | 89,057 | | | | 1.18 | (d) | | | 1.19 | (d) | | | 0.45 | (d) | | | 114 | |
Year ended 12/31/18 | | | 14.11 | | | | 0.03 | | | | (1.36 | ) | | | (1.33 | ) | | | (0.02 | ) | | | (2.04 | ) | | | (2.06 | ) | | | 10.72 | | | | (11.60 | ) | | | 71,829 | | | | 1.16 | | | | 1.19 | | | | 0.21 | | | | 27 | |
Year ended 12/31/17 | | | 12.61 | | | | 0.02 | | | | 1.81 | | | | 1.83 | | | | (0.04 | ) | | | (0.29 | ) | | | (0.33 | ) | | | 14.11 | | | | 14.65 | | | | 141,120 | | | | 1.19 | | | | 1.21 | | | | 0.12 | | | | 45 | |
Year ended 12/31/16 | | | 11.91 | | | | 0.04 | | | | 1.51 | | | | 1.55 | | | | - | | | | (0.85 | ) | | | (0.85 | ) | | | 12.61 | | | | 13.16 | | | | 130,118 | | | | 1.23 | | | | 1.25 | | | | 0.32 | | | | 29 | |
Year ended 12/31/15 | | | 13.84 | | | | (0.01 | ) | | | (0.57 | ) | | | (0.58 | ) | | | (0.02 | ) | | | (1.33 | ) | | | (1.35 | ) | | | 11.91 | | | | (4.28 | ) | | | 118,276 | | | | 1.26 | | | | 1.28 | | | | (0.08 | ) | | | 44 | |
| (a) | Calculated using average shares outstanding. |
| (b) | Includes adjustments in accordance with accounting principles generally accepted in the United States of America and as such, the net asset value for financial reporting purposes and the returns based upon those net asset values may differ from the net asset value and returns for shareholder transactions. Total returns are not annualized for periods less than one year, if applicable, and do not reflect charges assessed in connection with a variable product, which if included would reduce total returns. |
| (c) | Portfolio turnover is calculated at the fund level and is not annualized for periods less than one year, if applicable. |
| (d) | Ratios are based on average daily net assets (000’s omitted) of $157,183 and $83,157 for Series I and Series II shares, respectively. |
See accompanying Notes to Financial Statements which are an integral part of the financial statements.
Invesco V.I. Mid Cap Core Equity Fund
Notes to Financial Statements
December 31, 2019
NOTE 1 – Significant Accounting Policies
Invesco V.I. Mid Cap Core Equity Fund (the “Fund”) is a series portfolio of AIM Variable Insurance Funds (Invesco Variable Insurance Funds) (the “Trust”). The Trust is a Delaware statutory trust registered under the Investment Company Act of 1940, as amended (the “1940 Act”), as anopen-end series management investment company. Information presented in these financial statements pertains only to the Fund. Matters affecting the Fund or each class will be voted on exclusively by the shareholders of the Fund or each class. Current Securities and Exchange Commission (“SEC”) guidance, however, requires participating insurance companies offering separate accounts to vote shares proportionally in accordance with the instructions of the contract owners whose investments are funded by shares of each Fund or class.
The Fund’s investment objective is long-term growth of capital.
The Fund currently offers two classes of shares, Series I and Series II, both of which are offered to insurance company separate accounts funding variable annuity contracts and variable life insurance policies (“variable products”).
The Fund is an investment company and accordingly follows the investment company accounting and reporting guidance in accordance with Financial Accounting Standards Board Accounting Standards Codification Topic 946,Financial Services – Investment Companies.
The following is a summary of the significant accounting policies followed by the Fund in the preparation of its financial statements.
| A. | Security Valuations – Securities, including restricted securities, are valued according to the following policy. |
A security listed or traded on an exchange (except convertible securities) is valued at its last sales price or official closing price as of the close of the customary trading session on the exchange where the security is principally traded, or lacking any sales or official closing price on a particular day, the security may be valued at the closing bid price on that day. Securities traded in theover-the-counter market are valued based on prices furnished by independent pricing services or market makers. When such securities are valued by an independent pricing service they may be considered fair valued. Futures contracts are valued at the final settlement price set by an exchange on which they are principally traded. Listed options are valued at the mean between the last bid and asked prices from the exchange on which they are principally traded. Options not listed on an exchange are valued by an independent source at the mean between the last bid and asked prices. For purposes of determining net asset value (“NAV”) per share, futures and option contracts generally are valued 15 minutes after the close of the customary trading session of the New York Stock Exchange (“NYSE”).
Investments inopen-end andclosed-end registered investment companies that do not trade on an exchange are valued at theend-of-day net asset value per share. Investments inopen-end andclosed-end registered investment companies that trade on an exchange are valued at the last sales price or official closing price as of the close of the customary trading session on the exchange where the security is principally traded.
Debt obligations (including convertible securities) and unlisted equities are fair valued using an evaluated quote provided by an independent pricing service. Evaluated quotes provided by the pricing service may be determined without exclusive reliance on quoted prices, and may reflect appropriate factors such asinstitution-size trading in similar groups of securities, developments related to specific securities, dividend rate (for unlisted equities), yield (for debt obligations), quality, type of issue, coupon rate (for debt obligations), maturity (for debt obligations), individual trading characteristics and other market data. Pricing services generally value debt obligations assuming orderly transactions of institutional round lot size, but a fund may hold or transact in the same securities in smaller, odd lot sizes. Odd lots often trade at lower prices than institutional round lots. Debt obligations are subject to interest rate and credit risks. In addition, all debt obligations involve some risk of default with respect to interest and/or principal payments.
Foreign securities’ (including foreign exchange contracts) prices are converted into U.S. dollar amounts using the applicable exchange rates as of the close of the NYSE. If market quotations are available and reliable for foreign exchange-traded equity securities, the securities will be valued at the market quotations. Because trading hours for certain foreign securities end before the close of the NYSE, closing market quotations may become unreliable. If between the time trading ends on a particular security and the close of the customary trading session on the NYSE, events occur that the investment adviser determines are significant and make the closing price unreliable, the Fund may fair value the security. If the event is likely to have affected the closing price of the security, the security will be valued at fair value in good faith using procedures approved by the Board of Trustees. Adjustments to closing prices to reflect fair value may also be based on a screening process of an independent pricing service to indicate the degree of certainty, based on historical data, that the closing price in the principal market where a foreign security trades is not the current value as of the close of the NYSE. Foreign securities’ prices meeting the approved degree of certainty that the price is not reflective of current value will be priced at the indication of fair value from the independent pricing service. Multiple factors may be considered by the independent pricing service in determining adjustments to reflect fair value and may include information relating to sector indices, American Depositary Receipts and domestic and foreign index futures. Foreign securities may have additional risks including exchange rate changes, potential for sharply devalued currencies and high inflation, political and economic upheaval, the relative lack of issuer information, relatively low market liquidity and the potential lack of strict financial and accounting controls and standards.
Securities for which market prices are not provided by any of the above methods may be valued based upon quotes furnished by independent sources. The last bid price may be used to value equity securities. The mean between the last bid and asked prices is used to value debt obligations, including corporate loans.
Securities for which market quotations are not readily available or became unreliable are valued at fair value as determined in good faith by or under the supervision of the Trust’s officers following procedures approved by the Board of Trustees. Issuer specific events, market trends, bid/asked quotes of brokers and information providers and other market data may be reviewed in the course of making a good faith determination of a security’s fair value.
The Fund may invest in securities that are subject to interest rate risk, meaning the risk that the prices will generally fall as interest rates rise and, conversely, the prices will generally rise as interest rates fall. Specific securities differ in their sensitivity to changes in interest rates depending on their individual characteristics. Changes in interest rates may result in increased market volatility, which may affect the value and/or liquidity of certain Fund investments.
Invesco V.I. Mid Cap Core Equity Fund
Valuations change in response to many factors including the historical and prospective earnings of the issuer, the value of the issuer’s assets, general economic conditions, interest rates, investor perceptions and market liquidity. Because of the inherent uncertainties of valuation, the values reflected in the financial statements may materially differ from the value received upon actual sale of those investments.
| B. | Securities Transactions and Investment Income– Securities transactions are accounted for on a trade date basis. Realized gains or losses on sales are computed on the basis of specific identification of the securities sold. Interest income (net of withholding tax, if any) is recorded on the accrual basis from settlement date. Dividend income (net of withholding tax, if any) is recorded on theex-dividend date. |
The Fund may periodically participate in litigation related to Fund investments. As such, the Fund may receive proceeds from litigation settlements. Any proceeds received are included in the Statement of Operations as realized gain (loss) for investments no longer held and as unrealized gain (loss) for investments still held.
Brokerage commissions and mark ups are considered transaction costs and are recorded as an increase to the cost basis of securities purchased and/or a reduction of proceeds on a sale of securities. Such transaction costs are included in the determination of net realized and unrealized gain (loss) from investment securities reported in the Statement of Operations and the Statement of Changes in Net Assets and the net realized and unrealized gains (losses) on securities per share in the Financial Highlights. Transaction costs are included in the calculation of the Fund’s net asset value and, accordingly, they reduce the Fund’s total returns. These transaction costs are not considered operating expenses and are not reflected in net investment income reported in the Statement of Operations and the Statement of Changes in Net Assets, or the net investment income per share and the ratios of expenses and net investment income reported in the Financial Highlights, nor are they limited by any expense limitation arrangements between the Fund and the investment adviser.
The Fund allocates income and realized and unrealized capital gains and losses to a class based on the relative net assets of each class.
The Fund recharacterizes distributions received from REIT investments based on information provided by the REIT into the following categories: ordinary income, long-term and short-term capital gains, and return of capital. If information is not available on a timely basis from the REIT, the recharacterization will be based on available information which may include the previous year’s allocation. If new or additional information becomes available from the REIT at a later date, a recharacterization will be made in the following year. The Fund records as dividend income the amount recharacterized as ordinary income and as realized gain the amount recharacterized as capital gain in the Statement of Operations, and the amount recharacterized as return of capital as a reduction of the cost of the related investment. These recharacterizations are reflected in the accompanying financial statements.
| C. | Country Determination– For the purposes of making investment selection decisions and presentation in the Schedule of Investments, the investment adviser may determine the country in which an issuer is located and/or credit risk exposure based on various factors. These factors include the laws of the country under which the issuer is organized, where the issuer maintains a principal office, the country in which the issuer derives 50% or more of its total revenues and the country that has the primary market for the issuer’s securities, as well as other criteria. Among the other criteria that may be evaluated for making this determination are the country in which the issuer maintains 50% or more of its assets, the type of security, financial guarantees and enhancements, the nature of the collateral and the sponsor organization. Country of issuer and/or credit risk exposure has been determined to be the United States of America, unless otherwise noted. |
| D. | Distributions– Distributions from net investment income and net realized capital gain, if any, are generally declared and paid to separate accounts of participating insurance companies annually and recorded on theex-dividend date. |
| E. | Federal Income Taxes –The Fund intends to comply with the requirements of Subchapter M of the Internal Revenue Code of 1986, as amended (the “Internal Revenue Code”), necessary to qualify as a regulated investment company and to distribute substantially all of the Fund’s taxable earnings to shareholders. As such, the Fund will not be subject to federal income taxes on otherwise taxable income (including net realized capital gain) that is distributed to shareholders. Therefore, no provision for federal income taxes is recorded in the financial statements. |
The Fund recognizes the tax benefits of uncertain tax positions only when the position is more likely than not to be sustained. Management has analyzed the Fund’s uncertain tax positions and concluded that no liability for unrecognized tax benefits should be recorded related to uncertain tax positions. Management is not aware of any tax positions for which it is reasonably possible that the total amounts of unrecognized tax benefits will change materially in the next 12 months.
The Fund files tax returns in the U.S. Federal jurisdiction and certain other jurisdictions. Generally, the Fund is subject to examinations by such taxing authorities for up to three years after the filing of the return for the tax period.
| F. | Expenses– Fees provided for under the Rule12b-1 plan of a particular class of the Fund and which are directly attributable to that class are charged to the operations of such class. All other expenses are allocated among the classes based on relative net assets. |
| G. | Accounting Estimates –The preparation of financial statements in conformity with accounting principles generally accepted in the United States of America (“GAAP”) requires management to make estimates and assumptions that affect the reported amounts of assets and liabilities at the date of the financial statements and the reported amounts of revenues and expenses during the reporting period including estimates and assumptions related to taxation. Actual results could differ from those estimates by a significant amount. In addition, the Fund monitors for material events or transactions that may occur or become known after theperiod-end date and before the date the financial statements are released to print. |
| H. | Indemnifications– Under the Trust’s organizational documents, each Trustee, officer, employee or other agent of the Trust is indemnified against certain liabilities that may arise out of the performance of their duties to the Fund. Additionally, in the normal course of business, the Fund enters into contracts, including the Fund’s servicing agreements, that contain a variety of indemnification clauses. The Fund’s maximum exposure under these arrangements is unknown as this would involve future claims that may be made against the Fund that have not yet occurred. The risk of material loss as a result of such indemnification claims is considered remote. |
| I. | Securities Lending– The Fund may lend portfolio securities having a market value up toone-third of the Fund’s total assets. Such loans are secured by collateral equal to no less than the market value of the loaned securities determined daily by the securities lending provider. Such collateral will be cash or debt securities issued or guaranteed by the U.S. Government or any of its sponsored agencies. Cash collateral received in connection with these loans is invested in short-term money market instruments or affiliated money market funds and is shown as such on the Schedule of Investments. The Fund bears the risk of loss with respect to the investment of collateral. It is the Fund’s policy to obtain additional collateral from or return excess collateral to the borrower by the end of the next business day, following the valuation date of the securities loaned. Therefore, the value of the collateral held may be temporarily less than the value of the securities on loan. When loaning securities, the Fund retains certain benefits of owning the securities, including the economic equivalent of dividends or interest generated by the security. |
Invesco V.I. Mid Cap Core Equity Fund
| | Lending securities entails a risk of loss to the Fund if, and to the extent that, the market value of the securities loaned were to increase and the borrower did not increase the collateral accordingly, and the borrower failed to return the securities. The securities loaned are subject to termination at the option of the borrower or the Fund. Upon termination, the borrower will return to the Fund the securities loaned and the Fund will return the collateral. Upon the failure of the borrower to return the securities, collateral may be liquidated and the securities may be purchased on the open market to replace the loaned securities. The Fund could experience delays and costs in gaining access to the collateral and the securities may lose value during the delay which could result in potential losses to the Fund. Some of these losses may be indemnified by the lending agent. The Fund bears the risk of any deficiency in the amount of the collateral available for return to the borrower due to any loss on the collateral invested. Dividends received on cash collateral investments for securities lending transactions, which are net of compensation to counterparties, are included in Dividends from affiliated money market funds on the Statement of Operations. The aggregate value of securities out on loan, if any, is shown as a footnote on the Statement of Assets and Liabilities. |
| J. | Foreign Currency Translations– Foreign currency is valued at the close of the NYSE based on quotations posted by banks and major currency dealers. Portfolio securities and other assets and liabilities denominated in foreign currencies are translated into U.S. dollar amounts at the date of valuation. Purchases and sales of portfolio securities (net of foreign taxes withheld on disposition) and income items denominated in foreign currencies are translated into U.S. dollar amounts on the respective dates of such transactions. The Fund does not separately account for the portion of the results of operations resulting from changes in foreign exchange rates on investments and the fluctuations arising from changes in market prices of securities held. The combined results of changes in foreign exchange rates and the fluctuation of market prices on investments (net of estimated foreign tax withholding) are included with the net realized and unrealized gain or loss from investments in the Statement of Operations. Reported net realized foreign currency gains or losses arise from (1) sales of foreign currencies, (2) currency gains or losses realized between the trade and settlement dates on securities transactions, and (3) the difference between the amounts of dividends, interest, and foreign withholding taxes recorded on the Fund’s books and the U.S. dollar equivalent of the amounts actually received or paid. Net unrealized foreign currency gains and losses arise from changes in the fair values of assets and liabilities, other than investments in securities at fiscal period end, resulting from changes in exchange rates. |
The Fund may invest in foreign securities, which may be subject to foreign taxes on income, gains on investments or currency repatriation, a portion of which may be recoverable. Foreign taxes, if any, are recorded based on the tax regulations and rates that exist in the foreign markets in which the Fund invests and are shown in the Statement of Operations.
| K. | Forward Foreign Currency Contracts– The Fund may engage in foreign currency transactions either on a spot (i.e. for prompt delivery and settlement) basis, or through forward foreign currency contracts, to manage or minimize currency or exchange rate risk. |
The Fund may also enter into forward foreign currency contracts for the purchase or sale of a security denominated in a foreign currency in order to “lock in” the U.S. dollar price of that security, or the Fund may also enter into forward foreign currency contracts that do not provide for physical settlement of the two currencies, but instead are settled by a single cash payment calculated as the difference between the agreed upon exchange rate and the spot rate at settlement based upon an agreed upon notional amount(non-deliverable forwards). The Fund will set aside liquid assets in an amount equal to the dailymark-to-market obligation for forward foreign currency contracts.
A forward foreign currency contract is an obligation between two parties (“Counterparties”) to purchase or sell a specific currency for an agreed-upon price at a future date. The use of forward foreign currency contracts does not eliminate fluctuations in the price of the underlying securities the Fund owns or intends to acquire but establishes a rate of exchange in advance. Fluctuations in the value of these contracts are measured by the difference in the contract date and reporting date exchange rates and are recorded as unrealized appreciation (depreciation) until the contracts are closed. When the contracts are closed, realized gains (losses) are recorded. Realized and unrealized gains (losses) on the contracts are included in the Statement of Operations. The primary risks associated with forward foreign currency contracts include failure of the Counterparty to meet the terms of the contract and the value of the foreign currency changing unfavorably. These risks may be in excess of the amounts reflected in the Statement of Assets and Liabilities.
| L. | Other Risks– Active trading of portfolio securities may result in added expenses, a lower return and increased tax liability. |
NOTE 2–Advisory Fees and Other Fees Paid to Affiliates
The Trust has entered into a master investment advisory agreement with Invesco Advisers, Inc. (the “Adviser” or “Invesco”). Under the terms of the investment advisory agreement, the Fund accrues daily and pays monthly an advisory fee to the Adviser based on the annual rate of the Fund’s average daily net assets as follows:
| | | | |
| Average Daily Net Assets | | Rate | |
| |
| |
First $ 500 million | | | 0.725% | |
| |
| |
Next $500 million | | | 0.700% | |
| |
| |
Next $500 million | | | 0.675% | |
| |
| |
Over $1.5 billion | | | 0.650% | |
| |
For the year ended December 31, 2019, the effective advisory fee rate incurred by the Fund was 0.725%.
Under the terms of a mastersub-advisory agreement between the Adviser and each of Invesco Asset Management Deutschland GmbH, Invesco Asset Management Limited, Invesco Asset Management (Japan) Limited, Invesco Hong Kong Limited, Invesco Senior Secured Management, Inc. and Invesco Canada Ltd. and separatesub-advisory agreements with Invesco Capital Management LLC and Invesco Asset Management (India) Private Limited (collectively, the “AffiliatedSub-Advisers”) the Adviser, not the Fund, will pay 40% of the fees paid to the Adviser to any such AffiliatedSub-Adviser(s) that provide(s) discretionary investment management services to the Fund based on the percentage of assets allocated to such AffiliatedSub-Adviser(s).
The Adviser has contractually agreed, through at least June 30, 2020, to waive advisory fees and/or reimburse expenses of all shares to the extent necessary to limit total annual fund operating expenses after fee waiver and/or expense reimbursement (excluding certain items discussed below) of Series I shares to 2.00% and Series II shares to 2.25% of average daily net assets (the “expense limits”). In determining the Adviser’s obligation to waive advisory fees and/or reimburse expenses, the following expenses are not taken into account, and could cause the total annual fund operating expenses after fee waiver and/or expense reimbursement to exceed the numbers reflected above: (1) interest; (2) taxes; (3) dividend
Invesco V.I. Mid Cap Core Equity Fund
expense on short sales; (4) extraordinary ornon-routine items, including litigation expenses; and (5) expenses that the Fund has incurred but did not actually pay because of an expense offset arrangement. Unless Invesco continues the fee waiver agreement, it will terminate on June 30, 2020. During its term, the fee waiver agreement cannot be terminated or amended to increase the expense limits or reduce the advisory fee waiver without approval of the Board of Trustees. The Adviser did not waive fees and/or reimburse expenses during the period under these expense limits.
Further, the Adviser has contractually agreed, through at least June 30, 2021, to waive the advisory fee payable by the Fund in an amount equal to 100% of the net advisory fees the Adviser receives from the affiliated money market funds on investments by the Fund of uninvested cash in such affiliated money market funds.
For the year ended December 31, 2019, the Adviser waived advisory fees of $36,831.
The Trust has entered into a master administrative services agreement with Invesco pursuant to which the Fund has agreed to pay Invesco a fee for costs incurred in providing accounting services and fund administrative services to the Fund and to reimburse Invesco for fees paid to insurance companies that have agreed to provide certain administrative services to the Fund. These administrative services provided by the insurance companies may include, among other things: maintenance of master accounts with the Fund; tracking, recording and transmitting net purchase and redemption orders for Fund shares; maintaining and preserving records related to the purchase, redemption and other account activity of variable product owners; distributing copies of Fund documents such as prospectuses, proxy materials and periodic reports, to variable product owners, and responding to inquiries from variable product owners about the Fund. Pursuant to such agreement, for the year ended December 31, 2019, Invesco was paid $34,184 for accounting and fund administrative services and was reimbursed $361,419 for fees paid to insurance companies. Invesco has entered into asub-administration agreement whereby State Street Bank and Trust Company (“SSB”) serves as fund accountant and provides certain administrative services to the Fund. Pursuant to a custody agreement with the Trust on behalf of the Fund, SSB also serves as the Fund’s custodian.
The Trust has entered into a transfer agency and service agreement with Invesco Investment Services, Inc. (“IIS”) pursuant to which the Fund has agreed to pay IIS a fee for providing transfer agency and shareholder services to the Fund and reimburse IIS for certain expenses incurred by IIS in the course of providing such services. IIS may make payments to intermediaries that provide omnibus account services,sub-accounting services and/or networking services. All fees payable by IIS to intermediaries that provide omnibus account services orsub-accounting services are charged back to the Fund, subject to certain limitations approved by the Trust’s Board of Trustees. For the year ended December 31, 2019, expenses incurred under the agreement are shown in the Statement of Operations asTransfer agent fees.
The Trust has entered into a master distribution agreement with Invesco Distributors, Inc. (“IDI”) to serve as the distributor for the Fund. The Trust has adopted a plan pursuant to Rule12b-1 under the 1940 Act with respect to the Fund’s Series II shares (the “Plan”). The Fund, pursuant to the Plan, pays IDI compensation at the annual rate of 0.25% of the Fund’s average daily net assets of Series II shares. The fees are accrued daily and paid monthly. Of the Plan payments, up to 0.25% of the average daily net assets of the Series II shares may be paid to insurance companies who furnish continuing personal shareholder services to customers who purchase and own Series II shares of the Fund. For the year ended December 31, 2019, expenses incurred under the Plan are detailed in the Statement of Operations asDistribution fees.
For the year ended December 31, 2019, the Fund incurred $216 in brokerage commissions with Invesco Capital Markets, Inc., an affiliate of the Adviser and IDI, for portfolio transactions executed on behalf of the Fund.
Certain officers and trustees of the Trust are officers and directors of the Adviser, IIS and/or IDI.
NOTE 3–Additional Valuation Information
GAAP defines fair value as the price that would be received to sell an asset or paid to transfer a liability in an orderly transaction between market participants at the measurement date, under current market conditions. GAAP establishes a hierarchy that prioritizes the inputs to valuation methods, giving the highest priority to readily available unadjusted quoted prices in an active market for identical assets (Level 1) and the lowest priority to significant unobservable inputs (Level 3), generally when market prices are not readily available or are unreliable. Based on the valuation inputs, the securities or other investments are tiered into one of three levels. Changes in valuation methods may result in transfers in or out of an investment’s assigned level:
| | Level 1 – | Prices are determined using quoted prices in an active market for identical assets. |
| | Level 2 – | Prices are determined using other significant observable inputs. Observable inputs are inputs that other market participants may use in pricing a security. These may include quoted prices for similar securities, interest rates, prepayment speeds, credit risk, yield curves, loss severities, default rates, discount rates, volatilities and others. |
| | Level 3 – | Prices are determined using significant unobservable inputs. In situations where quoted prices or observable inputs are unavailable (for example, when there is little or no market activity for an investment at the end of the period), unobservable inputs may be used. Unobservable inputs reflect the Fund’s own assumptions about the factors market participants would use in determining fair value of the securities or instruments and would be based on the best available information. |
As of December 31, 2019, all of the securities in this Fund were valued based on Level 1 inputs (see the Schedule of Investments for security categories). The level assigned to the securities valuations may not be an indication of the risk or liquidity associated with investing in those securities. Because of the inherent uncertainties of valuation, the values reflected in the financial statements may materially differ from the value received upon actual sale of those investments.
NOTE 4–Security Transactions with Affiliated Funds
The Fund is permitted to purchase or sell securities from or to certain other Invesco Funds under specified conditions outlined in procedures adopted by the Board of Trustees of the Trust. The procedures have been designed to ensure that any purchase or sale of securities by the Fund from or to another fund or portfolio that is or could be considered an affiliate by virtue of having a common investment adviser (or affiliated investment advisers), common Trustees and/or common officers complies with Rule17a-7 of the 1940 Act. Further, as defined under the procedures, each transaction is effected at the current market price. Pursuant to these procedures, for the year ended December 31, 2019, the Fund engaged in securities purchases of $6,101,712 and securities sales of $3,169,164, which resulted in net realized gains of $240,609.
Invesco V.I. Mid Cap Core Equity Fund
NOTE 5–Trustees’ and Officers’ Fees and Benefits
Trustees’ and Officers’ Fees and Benefits include amounts accrued by the Fund to pay remuneration to certain Trustees and Officers of the Fund. Trustees have the option to defer compensation payable by the Fund, andTrustees’ and Officers’ Fees and Benefits also include amounts accrued by the Fund to fund such deferred compensation amounts. Those Trustees who defer compensation have the option to select various Invesco Funds in which their deferral accounts shall be deemed to be invested. Finally, certain current Trustees were eligible to participate in a retirement plan that provided for benefits to be paid upon retirement to Trustees over a period of time based on the number of years of service. The Fund may have certain former Trustees who also participate in a retirement plan and receive benefits under such plan.Trustees’and Officers’Feesand Benefits include amounts accrued by the Fund to fund such retirement benefits. Obligations under the deferred compensation and retirement plans represent unsecured claims against the general assets of the Fund.
NOTE 6–Cash Balances
The Fund is permitted to temporarily carry a negative or overdrawn balance in its account with SSB, the custodian bank. Such balances, if any atperiod-end, are shown in the Statement of Assets and Liabilities under the payable caption Amount due custodian. To compensate the custodian bank for such overdrafts, the overdrawn Fund may either (1) leave funds as a compensating balance in the account so the custodian bank can be compensated by earning the additional interest; or (2) compensate by paying the custodian bank at a rate agreed upon by the custodian bank and Invesco, not to exceed the contractually agreed upon rate.
The Fund is permitted to temporarily carry a negative or overdrawn balance in its account with SSB, the custodian bank. Such balances, if any atperiod-end, are shown in the Statement of Assets and Liabilities under the payable captionAmount due custodian. To compensate the custodian bank for such overdrafts, the overdrawn Fund may either (1) leave funds as a compensating balance in the account so the custodian bank can be compensated by earning the additional interest; or (2) compensate by paying the custodian bank at a rate agreed upon by the custodian bank and Invesco, not to exceed the contractually agreed upon rate.
NOTE 7–Distributions to Shareholders and Tax Components of Net Assets
Tax Character of Distributions to Shareholders Paid During the Fiscal Years Ended December 31, 2019 and 2018:
| | | | | | | | |
| | | 2019 | | | 2018 | |
| |
| | |
Ordinary income | | $ | 944,716 | | | $ | 978,585 | |
| |
| | |
Long-term capital gain | | | 26,082,362 | | | | 36,557,779 | |
| |
| | |
Total distributions | | $ | 27,027,078 | | | $ | 37,536,364 | |
| |
Tax Components of Net Assets atPeriod-End:
| | | | |
| | | 2019 | |
| |
Undistributed ordinary income | | $ | 1,478,403 | |
| |
Undistributed long-term capital gain | | | 44,893,335 | |
| |
Net unrealized appreciation - investments | | | 33,287,707 | |
| |
Net unrealized appreciation - foreign currencies | | | 96 | |
| |
Temporary book/tax differences | | | (104,266 | ) |
| |
Shares of beneficial interest | | | 167,461,127 | |
| |
Total net assets | | $ | 247,016,402 | |
| |
The difference between book-basis andtax-basis unrealized appreciation (depreciation) is due to differences in the timing of recognition of gains and losses on investments for tax and book purposes. The Fund’s net unrealized appreciation difference is attributable primarily to wash sales.
The temporary book/tax differences are a result of timing differences between book and tax recognition of income and/or expenses. The Fund’s temporary book/tax differences are the result of the trustee deferral of compensation and retirement plan benefits.
Capital loss carryforward is calculated and reported as of a specific date. Results of transactions and other activity after that date may affect the amount of capital loss carryforward actually available for the Fund to utilize. Capital losses generated in years beginning after December 22, 2010 can be carried forward for an unlimited period, whereas previous losses expire in eight tax years. Capital losses with an expiration period may not be used to offset capital gains until all net capital losses without an expiration date have been utilized. Capital loss carryforwards with no expiration date will retain their character as either short-term or long-term capital losses instead of as short-term capital losses as under prior law. The ability to utilize capital loss carryforwards in the future may be limited under the Internal Revenue Code and related regulations based on the results of future transactions.
The Fund does not have a capital loss carryforward as of December 31, 2019.
NOTE 8–Investment Transactions
The aggregate amount of investment securities (other than short-term securities, U.S. Treasury obligations and money market funds, if any) purchased and sold by the Fund during the year ended December 31, 2019 was $268,645,725 and $240,773,523, respectively. Cost of
Invesco V.I. Mid Cap Core Equity Fund
investments, including any derivatives, on a tax basis includes the adjustments for financial reporting purposes as of the most recently completed federal income tax reportingperiod-end.
| | | | |
| Unrealized Appreciation (Depreciation) of Investments on a Tax Basis | |
| |
Aggregate unrealized appreciation of investments | | | $36,828,213 | |
| |
Aggregate unrealized (depreciation) of investments | | | (3,540,506 | ) |
| |
Net unrealized appreciation of investments | | | $33,287,707 | |
| |
Cost of investments for tax purposes is $216,234,536.
NOTE 9–Reclassification of Permanent Differences
Primarily as a result of differing book/tax treatment of foreign currency transactions, on December 31, 2019, undistributed net investment income was decreased by $657 and undistributed net realized gain was increased by $657. This reclassification had no effect on the net assets or the distributable earnings of the Fund.
NOTE 10–Share Information
| | | | | | | | | | | | | | | | |
| | | Summary of Share Activity | |
| |
| | | Year ended
December 31, 2019(a) | | | Year ended
December 31, 2018 | |
| | | Shares | | | Amount | | | Shares | | | Amount | |
| |
Sold: | | | | | | | | | | | | | | | | |
Series I | | | 261,011 | | | $ | 3,199,054 | | | | 300,113 | | | $ | 3,835,156 | |
| |
Series II | | | 1,214,662 | | | | 14,406,495 | | | | 740,161 | | | | 9,893,417 | |
| |
| | | | |
Issued as reinvestment of dividends: | | | | | | | | | | | | | | | | |
Series I | | | 1,542,416 | | | | 17,475,575 | | | | 1,976,159 | | | | 25,354,119 | |
| |
Series II | | | 864,389 | | | | 9,551,503 | | | | 970,697 | | | | 12,182,244 | |
| |
| | | | |
Reacquired: | | | | | | | | | | | | | | | | |
Series I | | | (2,338,334 | ) | | | (28,580,667 | ) | | | (2,114,524 | ) | | | (28,838,538 | ) |
| |
Series II | | | (1,281,486 | ) | | | (15,307,313 | ) | | | (5,009,103 | ) | | | (67,791,284 | ) |
| |
Net increase (decrease) in share activity | | | 262,658 | | | $ | 744,647 | | | | (3,136,497 | ) | | $ | (45,364,886 | ) |
| |
| (a) | There are entities that are record owners of more than 5% of the outstanding shares of the Fund and in the aggregate own 72% of the outstanding shares of the Fund. The Fund and the Fund’s principal underwriter or adviser, are parties to participation agreements with these entities whereby these entities sell units of interest in separate accounts funding variable products that are invested in the Fund. The Fund, Invesco and/or Invesco affiliates may make payments to these entities, which are considered to be related to the Fund, for providing services to the Fund, Invesco and/or Invesco affiliates including but not limited to services such as, securities brokerage, third party record keeping and account servicing and administrative services. The Fund has no knowledge as to whether all or any portion of the shares owned of record by these entities are also owned beneficially. |
Invesco V.I. Mid Cap Core Equity Fund
Report of Independent Registered Public Accounting Firm
To the Board of Trustees of AIM Variable Insurance Funds (Invesco Variable Insurance Funds) and Shareholders of Invesco V.I. Mid Cap Core Equity Fund
Opinion on the Financial Statements
We have audited the accompanying statement of assets and liabilities, including the schedule of investments, of Invesco V.I. Mid Cap Core Equity Fund (one of the funds constituting AIM Variable Insurance Funds (Invesco Variable Insurance Funds), referred to hereafter as the “Fund”) as of December 31, 2019, the related statement of operations for the year ended December 31, 2019, the statement of changes in net assets for each of the two years in the period ended December 31, 2019, including the related notes, and the financial highlights for each of the five years in the period ended December 31, 2019 (collectively referred to as the “financial statements”). In our opinion, the financial statements present fairly, in all material respects, the financial position of the Fund as of December 31, 2019, the results of its operations for the year then ended, the changes in its net assets for each of the two years in the period ended December 31, 2019 and the financial highlights for each of the five years in the period ended December 31, 2019 in conformity with accounting principles generally accepted in the United States of America.
Basis for Opinion
These financial statements are the responsibility of the Fund’s management. Our responsibility is to express an opinion on the Fund’s financial statements based on our audits. We are a public accounting firm registered with the Public Company Accounting Oversight Board (United States) (PCAOB) and are required to be independent with respect to the Fund in accordance with the U.S. federal securities laws and the applicable rules and regulations of the Securities and Exchange Commission and the PCAOB.
We conducted our audits of these financial statements in accordance with the standards of the PCAOB. Those standards require that we plan and perform the audit to obtain reasonable assurance about whether the financial statements are free of material misstatement, whether due to error or fraud.
Our audits included performing procedures to assess the risks of material misstatement of the financial statements, whether due to error or fraud, and performing procedures that respond to those risks. Such procedures included examining, on a test basis, evidence regarding the amounts and disclosures in the financial statements. Our audits also included evaluating the accounting principles used and significant estimates made by management, as well as evaluating the overall presentation of the financial statements. Our procedures included confirmation of securities owned as of December 31, 2019 by correspondence with the custodian, transfer agent and brokers; when replies were not received from brokers, we performed other auditing procedures. We believe that our audits provide a reasonable basis for our opinion.
/s/PricewaterhouseCoopers LLP
Houston, Texas
February 18, 2020
We have served as the auditor of one or more of the investment companies in the Invesco group of investment companies since at least 1995. We have not been able to determine the specific year we began serving as auditor.
Invesco V.I. Mid Cap Core Equity Fund
Calculating your ongoing Fund expenses
Example
As a shareholder of the Fund, you incur ongoing costs, including management fees; distribution and/or service fees(12b-1); and other Fund expenses. This example is intended to help you understand your ongoing costs (in dollars) of investing in the Fund and to compare these costs with ongoing costs of investing in other mutual funds. The example is based on an investment of $1,000 invested at the beginning of the period and held for the entire period July 1, 2019 through December 31, 2019.
The actual and hypothetical expenses in the examples below do not represent the effect of any fees or other expenses assessed in connection with a variable product; if they did, the expenses shown would be higher while the ending account values shown would be lower.
Actual expenses
The table below provides information about actual account values and actual expenses. You may use the information in this table, together with the amount you invested, to estimate the expenses that you paid over the period. Simply divide your account value by $1,000 (for example, an $8,600 account value divided by $1,000 = 8.6), then multiply the result by the number in the table under the heading entitled “Actual Expenses Paid During Period” to estimate the expenses you paid on your account during this period.
Hypothetical example for comparison purposes
The table below also provides information about hypothetical account values and hypothetical expenses based on the Fund’s actual expense ratio and an assumed rate of return of 5% per year before expenses, which is not the Fund’s actual return.
The hypothetical account values and expenses may not be used to estimate the actual ending account balance or expenses you paid for the period. You may use this information to compare the ongoing costs of investing in the Fund and other funds. To do so, compare this 5% hypothetical example with the 5% hypothetical examples that appear in the shareholder reports of the other funds.
Please note that the expenses shown in the table are meant to highlight your ongoing costs. Therefore, the hypothetical information is useful in comparing ongoing costs, and will not help you determine the relative total costs of owning different funds.
| | | | | | | | | | | | |
| | | Beginning
Account Value
(07/01/19) | | ACTUAL | | HYPOTHETICAL (5% annual return before
expenses) | | Annualized
Expense
Ratio |
| | Ending
Account Value
(12/31/19)1 | | Expenses
Paid During
Period2 | | Ending
Account Value
(12/31/19) | | Expenses
Paid During
Period2 |
Series I | | $1,000.00 | | $1,086.40 | | $4.94 | | $1,020.47 | | $4.79 | | 0.94% |
Series II | | 1,000.00 | | 1,085.40 | | 6.26 | | 1,019.21 | | 6.06 | | 1.19 |
| 1 | The actual ending account value is based on the actual total return of the Fund for the period July 1, 2019 through December 31, 2019, after actual expenses and will differ from the hypothetical ending account value which is based on the Fund’s expense ratio and a hypothetical annual return of 5% before expenses. |
| 2 | Expenses are equal to the Fund’s annualized expense ratio as indicated above multiplied by the average account value over the period, multiplied by 184/365 to reflect the most recent fiscal half year. |
Invesco V.I. Mid Cap Core Equity Fund
Tax Information
Form1099-DIV, Form1042-S and other year-end tax information provide shareholders with actual calendar year amounts that should be included in their tax returns. Shareholders should consult their tax advisers.
The following distribution information is being provided as required by the Internal Revenue Code or to meet a specific state’s requirement.
The Fund designates the following amounts or, if subsequently determined to be different, the maximum amount allowable for its fiscal year ended December 31, 2019:
| | | | | | | | |
| Federal and State Income Tax | | | | |
Long-Term Capital Gain Distributions | | $ | 26,082,362 | | | | | |
Qualified Business Income* | | | 0.02 | % | | | | |
Corporate Dividends Received Deduction* | | | 100.00 | % | | | | |
U.S. Treasury Obligations* | | | 0.00 | % | | | | |
| | * | The above percentages are based on ordinary income dividends paid to shareholders during the Fund’s fiscal year. |
Invesco V.I. Mid Cap Core Equity Fund
Trustees and Officers
The address of each trustee and officer is AIM Variable Insurance Funds (Invesco Variable Insurance Funds) (the “Trust”), 11 Greenway Plaza, Suite 1000, Houston, Texas 77046-1173. The trustees serve for the life of the Trust, subject to their earlier death, incapacitation, resignation, retirement or removal as more specifically provided in the Trust’s organizational documents. Each officer serves for a one year term or until their successors are elected and qualified. Column two below includes length of time served with predecessor entities, if any.
| | | | | | | | |
Name, Year of Birth and
Position(s)
Held with the Trust | | Trustee
and/or
Officer
Since | | Principal Occupation(s)
During Past 5 Years | | Number of
Funds in
Fund Complex
Overseen by
Trustee | | Other
Directorship(s)
Held by Trustee
During Past 5
Years |
| Interested Person | | |
Martin L. Flanagan1– 1960 Trustee and Vice Chair | | 2007 | | Executive Director, Chief Executive Officer and President, Invesco Ltd. (ultimate parent of Invesco and a global investment management firm); Trustee and Vice Chair, The Invesco Funds; Vice Chair, Investment Company Institute; and Member of Executive Board, SMU Cox School of Business Formerly: Advisor to the Board, Invesco Advisers, Inc. (formerly known as Invesco Institutional (N.A.), Inc.); Chairman and Chief Executive Officer, Invesco Advisers, Inc. (registered investment adviser); Director, Chairman, Chief Executive Officer and President, Invesco Holding Company (US), Inc. (formerly IVZ Inc.) (holding company), Invesco Group Services, Inc. (service provider) and Invesco North American Holdings, Inc. (holding company); Director, Chief Executive Officer and President, Invesco Holding Company Limited (parent of Invesco and a global investment management firm); Director, Invesco Ltd.; Chairman, Investment Company Institute and President,Co-Chief Executive Officer,Co-President, Chief Operating Officer and Chief Financial Officer, Franklin Resources, Inc. (global investment management organization) | | 229 | | None |
| 1 | Mr. Flanagan is considered an interested person (within the meaning of Section 2(a)(19) of the 1940 Act) of the Trust because he is an officer of the Adviser to the Trust, and an officer and a director of Invesco Ltd., ultimate parent of the Adviser. |
Invesco V.I. Mid Cap Core Equity Fund
Trustees and Officers–(continued)
| | | | | | | | |
Name, Year of Birth and
Position(s)
Held with the Trust | | Trustee
and/or
Officer
Since | | Principal Occupation(s)
During Past 5 Years | | Number of
Funds in
Fund Complex
Overseen by
Trustee | | Other
Directorship(s)
Held by Trustee
During Past 5
Years |
| Independent Trustees | | |
Bruce L. Crockett - 1944
Trustee and Chair | | 1993 | | Chairman, Crockett Technologies Associates (technology consulting company) Formerly: Director, Captaris (unified messaging provider); Director, President and Chief Executive Officer, COMSAT Corporation; Chairman, Board of Governors of INTELSAT (international communications company); ACE Limited (insurance company); Independent Directors Council and Investment Company Institute: Member of the Audit Committee, Investment Company Institute; Member of the Executive Committee and Chair of the Governance Committee, Independent Directors Council | | 229 | | Director and Chairman of the Audit Committee, ALPS (Attorneys Liability Protection Society) (insurance company); Director and Member of the Audit Committee and Compensation Committee, Ferroglobe PLC (metallurgical company) |
| David C. Arch - 1945 Trustee | | 2010 | | Chairman of Blistex Inc. (consumer health care products manufacturer); Member, World Presidents’ Organization | | 229 | | Board member of the Illinois Manufacturers’ Association |
| Beth Ann Brown - 1968 Trustee | | 2019 | | Independent Consultant Formerly: Head of Intermediary Distribution, Managing Director, Strategic Relations, Managing Director, Head of National Accounts, Senior Vice President, National Account Manager and Senior Vice President, Key Account Manager, Columbia Management Investment Advisers LLC; Vice President, Key Account Manager, Liberty Funds Distributor, Inc.; and Trustee of certain Oppenheimer Funds | | 229 | | Director, Board of Directors of Caron Engineering Inc.; Advisor, Board of Advisors of Caron Engineering Inc.; President and Director, Acton Shapleigh Youth Conservation Corps (non-profit); and Vice President and Director of Grahamtastic Connection (non-profit) |
| Jack M. Fields - 1952 Trustee | | 1997 | | Chief Executive Officer, Twenty First Century Group, Inc. (government affairs company); and Chairman, Discovery Learning Alliance(non-profit) Formerly: Owner and Chief Executive Officer, Dos Angeles Ranch L.P. (cattle, hunting, corporate entertainment); Director, Insperity, Inc. (formerly known as Administaff) (human resources provider); Chief Executive Officer, Texana Timber LP (sustainable forestry company); Director of Cross Timbers Quail Research Ranch(non-profit); and member of the U.S. House of Representatives | | 229 | | None |
Invesco V.I. Mid Cap Core Equity Fund
Trustees and Officers–(continued)
| | | | | | | | |
Name, Year of Birth and
Position(s)
Held with the Trust | | Trustee
and/or
Officer
Since | | Principal Occupation(s)
During Past 5 Years | | Number of
Funds in
Fund Complex
Overseen by
Trustee | | Other
Directorship(s)
Held by Trustee
During Past 5 Years |
| Independent Trustees–(continued) | | |
Cynthia Hostetler - 1962
Trustee | | 2017 | | Non-Executive Director and Trustee of a number of public and private business corporations Formerly: Director, Aberdeen Investment Funds (4 portfolios); Head of Investment Funds and Private Equity, Overseas Private Investment Corporation; President, First Manhattan Bancorporation, Inc.; Attorney, Simpson Thacher & Bartlett LLP | | 229 | | Vulcan Materials Company (construction materials company); Trilinc Global Impact Fund; Genesee & Wyoming, Inc. (railroads); Artio Global Investment LLC (mutual fund complex); Edgen Group, Inc. (specialized energy and infrastructure products distributor); Investment Company Institute (professional organization); Independent Directors Council (professional organization) |
Eli Jones - 1961
Trustee | | 2016 | | Professor and Dean, Mays Business School - Texas A&M University Formerly: Professor and Dean, Walton College of Business, University of Arkansas and E.J. Ourso College of Business, Louisiana State University; Director, Arvest Bank | | 229 | | Insperity, Inc. (formerly known as Administaff) (human resources provider) |
Elizabeth Krentzman - 1959
Trustee | | 2019 | | Formerly: Principal and Chief Regulatory Advisor for Asset Management Services and U.S. Mutual Fund Leader of Deloitte & Touche LLP; General Counsel of the Investment Company Institute (trade association); National Director of the Investment Management Regulatory Consulting Practice, Principal, Director and Senior Manager of Deloitte & Touche LLP; Assistant Director of the Division of Investment Management - Office of Disclosure and Investment Adviser Regulation of the U.S. Securities and Exchange Commission and various positions with the Division of Investment Management - Office of Regulatory Policy of the U.S. Securities and Exchange Commission; Associate at Ropes & Gray LLP; Advisory Board Member of the Securities and Exchange Commission Historical Society; and Trustee of certain Oppenheimer Funds | | 229 | | Trustee of the University of Florida National Board Foundation and Audit Committee Member; Member of the Cartica Funds Board of Directors (private investment funds); Member of the University of Florida Law Center Association, Inc. Board of Trustees and Audit Committee Member |
Anthony J. LaCava, Jr. - 1956
Trustee | | 2019 | | Formerly: Director and Member of the Audit Committee, Blue Hills Bank (publicly traded financial institution) and Managing Partner, KPMG LLP | | 229 | | Blue Hills Bank; Chairman, Bentley University; Member, Business School Advisory Council; and Nominating Committee KPMG LLP |
Prema Mathai-Davis - 1950
Trustee | | 1998 | | Retired Co-Owner & Partner of Quantalytics Research, LLC, (a FinTech Investment Research Platform for the Self-Directed Investor) | | 229 | | None |
Invesco V.I. Mid Cap Core Equity Fund
Trustees and Officers–(continued)
| | | | | | | | |
Name, Year of Birth and
Position(s)
Held with the Trust | | Trustee
and/or
Officer
Since | | Principal Occupation(s)
During Past 5 Years | | Number of
Funds in
Fund Complex
Overseen by
Trustee | | Other
Directorship(s)
Held by Trustee During
Past 5 Years |
| Independent Trustees–(continued) | | |
Joel W. Motley - 1952
Trustee | | 2019 | | Director of Office of Finance, Federal Home Loan Bank; Member of the Vestry of Trinity Wall Street; Managing Director of Carmona Motley Inc. (privately held financial advisor); Member of the Finance and Budget Committee of the Council on Foreign Relations, Member of the Investment Committee and Board of Human Rights Watch and Member of the Investment Committee and Board of Historic Hudson Valley(non-profit cultural organization) Formerly: Managing Director of Public Capital Advisors, LLC (privately held financial advisor); Managing Director of Carmona Motley Hoffman, Inc. (privately held financial advisor); Trustee of certain Oppenheimer Funds; and Director of Columbia Equity Financial Corp. (privately held financial advisor) | | 229 | | Director of Greenwall Foundation (bioethics research foundation); Member of Board and Investment Committee of The Greenwall Foundation; Director of Southern Africa Legal Services Foundation; Board Member and Investment Committee Member of Pulizer Center for Crisis Reporting(non-profit journalism) |
Teresa M. Ressel - 1962
Trustee | | 2017 | | Non-executive director and trustee of a number of public and private business corporations Formerly: Chief Financial Officer, Olayan America, The Olayan Group (international investor/commercial/industrial); Chief Executive Officer, UBS Securities LLC; Group Chief Operating Officer, Americas, UBS AG; Assistant Secretary for Management & Budget and CFO, US Department of the Treasury | | 229 | | Atlantic Power Corporation (power generation company); ON Semiconductor Corp. (semiconductor supplier) |
Ann Barnett Stern - 1957
Trustee | | 2017 | | President and Chief Executive Officer, Houston Endowment Inc. (private philanthropic institution) Formerly: Executive Vice President and General Counsel, Texas Children’s Hospital; Attorney, Beck, Redden and Secrest, LLP; Business Law Instructor, University of St. Thomas; Attorney, Andrews & Kurth LLP | | 229 | | Federal Reserve Bank of Dallas |
Robert C. Troccoli - 1949
Trustee | | 2016 | | Retired | | 229 | | None |
Daniel S. Vandivort - 1954
Trustee | | 2019 | | Treasurer, Chairman of the Audit and Finance Committee, and Trustee, Board of Trustees, Huntington Disease Foundation of America; and President, Flyway Advisory Services LLC (consulting and property management) Formerly: Trustee and Governance Chair, of certain Oppenheimer Funds | | 229 | | Chairman and Lead Independent Director, Chairman of the Audit Committee, and Director, Board of Directors, Value Line Funds |
James D. Vaughn - 1945
Trustee | | 2019 | | Retired Formerly: Managing Partner, Deloitte & Touche LLP; Trustee and Chairman of the Audit Committee, Schroder Funds; Board Member, Mile High United Way, Boys and Girls Clubs, Boy Scouts, Colorado Business Committee for the Arts, Economic Club of Colorado and Metro Denver Network (economic development corporation); and Trustee of certain Oppenheimer Funds | | 229 | | Board member and Chairman of Audit Committee of AMG National Trust Bank; Trustee and Investment Committee member, University of South Dakota Foundation; Board member, Audit Committee Member and past Board Chair, Junior Achievement(non-profit) |
Invesco V.I. Mid Cap Core Equity Fund
Trustees and Officers–(continued)
| | | | | | | | |
Name, Year of Birth and
Position(s)
Held with the Trust | | Trustee
and/or
Officer
Since | | Principal Occupation(s)
During Past 5 Years | | Number of
Funds in
Fund Complex
Overseen by
Trustee | | Other
Directorship(s)
Held by Trustee
During Past 5
Years |
| Independent Trustees–(continued) | | |
Christopher L. WIlson - 1957 Trustee, Vice Chair and Chair Designate | | 2017 | | Retired Formerly: Director, TD Asset Management USA Inc. (mutual fund complex) (22 portfolios); Managing Partner, CT2, LLC (investing and consulting firm); President/Chief Executive Officer, Columbia Funds, Bank of America Corporation; President/Chief Executive Officer, CDC IXIS Asset Management Services, Inc.; Principal & Director of Operations, Scudder Funds, Scudder, Stevens & Clark, Inc.; Assistant Vice President, Fidelity Investments | | 229 | | ISO New England, Inc.(non-profit organization managing regional electricity market) |
Invesco V.I. Mid Cap Core Equity Fund
Trustees and Officers–(continued)
| | | | | | | | |
Name, Year of Birth and
Position(s)
Held with the Trust | | Trustee
and/or
Officer
Since | | Principal Occupation(s) During Past 5 Years | | Number of
Funds in
Fund Complex
Overseen by
Trustee | | Other
Directorship(s)
Held by Trustee
During Past 5
Years |
| Officers | | |
Sheri Morris - 1964
President, Principal Executive Officer and Treasurer | | 1999 | | Head of Global Fund Services, Invesco Ltd.; President, Principal Executive Officer and Treasurer, The Invesco Funds; Vice President, Invesco Advisers, Inc. (formerly known as Invesco Institutional (N.A.), Inc.) (registered investment adviser); and Vice President, Invesco Exchange-Traded Fund Trust, Invesco Exchange-Traded Fund Trust II, Invesco India Exchange-Traded Fund Trust, Invesco Actively Managed Exchange-Traded Fund Trust, Invesco Actively Managed Exchange-Traded Commodity Fund Trust and Invesco Exchange-Traded Self-Indexed Fund Trust; and Vice President, OppenheimerFunds, Inc. Formerly: Vice President and Principal Financial Officer, The Invesco Funds; Vice President, Invesco AIM Advisers, Inc., Invesco AIM Capital Management, Inc. and Invesco AIM Private Asset Management, Inc.; Assistant Vice President and Assistant Treasurer, The Invesco Funds and Assistant Vice President, Invesco Advisers, Inc., Invesco AIM Capital Management, Inc. and Invesco AIM Private Asset Management, Inc.; and Treasurer, Invesco Exchange-Traded Fund Trust, Invesco Exchange-Traded Fund Trust II, Invesco India Exchange-Traded Fund Trust and Invesco Actively Managed Exchange-Traded Fund Trust | | N/A | | N/A |
Russell C. Burk - 1958
Senior Vice President and Senior Officer | | 2005 | | Senior Vice President and Senior Officer, The Invesco Funds | | N/A | | N/A |
Jeffrey H. Kupor - 1968
Senior Vice President, Chief Legal Officer and Secretary | | 2018 | | Head of Legal of the Americas, Invesco Ltd.; Senior Vice President and Secretary, Invesco Advisers, Inc. (formerly known as Invesco Institutional (N.A.), Inc.) (registered investment adviser); Senior Vice President and Secretary, Invesco Distributors, Inc. (formerly known as Invesco AIM Distributors, Inc.); Vice President and Secretary, Invesco Investment Services, Inc. (formerly known as Invesco AIM Investment Services, Inc.) Senior Vice President, Chief Legal Officer and Secretary, The Invesco Funds; Secretary and General Counsel, Invesco Investment Advisers LLC (formerly known as Van Kampen Asset Management); Secretary and General Counsel, Invesco Capital Markets, Inc. (formerly known as Van Kampen Funds Inc.) and Chief Legal Officer, Invesco Exchange-Traded Fund Trust, Invesco Exchange-Traded Fund Trust II, Invesco India Exchange-Traded Fund Trust, Invesco Actively Managed Exchange-Traded Fund Trust, Invesco Actively Managed Exchange-Traded Commodity Fund Trust and Invesco Exchange-Traded Self-Indexed Fund Trust; Secretary, Invesco Indexing LLC; Secretary, W.L. Ross & Co., LLC Formerly: Secretary and Vice President, Jemstep, Inc.; Head of Legal, Worldwide Institutional, Invesco Ltd.; Secretary and General Counsel, INVESCO Private Capital Investments, Inc.; Senior Vice President, Secretary and General Counsel, Invesco Management Group, Inc. (formerly known as Invesco AIM Management Group, Inc.); Assistant Secretary, INVESCO Asset Management (Bermuda) Ltd.; Secretary and General Counsel, Invesco Private Capital, Inc.; Assistant Secretary and General Counsel, INVESCO Realty, Inc.; Secretary and General Counsel, Invesco Senior Secured Management, Inc.; and Secretary, Sovereign G./P. Holdings Inc. | | N/A | | N/A |
Andrew R. Schlossberg - 1974
Senior Vice President | | 2019 | | Head of the Americas and Senior Managing Director, Invesco Ltd.; Director and Senior Vice President, Invesco Advisers, Inc. (formerly known as Invesco Institutional (N.A.), Inc.) (registered investment adviser); Director and Chairman, Invesco Investment Services, Inc. (formerly known as Invesco AIM Investment Services, Inc.) (registered transfer agent); Senior Vice President, The Invesco Funds; Director, Invesco Investment Advisers LLC (formerly known as Van Kampen Asset Management); Director, President and Chairman, Invesco Insurance Agency, Inc. Formerly: Director, Invesco UK Limited; Director and Chief Executive, Invesco Asset Management Limited and Invesco Fund Managers Limited; Assistant Vice President, The Invesco Funds; Senior Vice President, Invesco Advisers, Inc. (formerly known as Invesco Institutional (N.A.), Inc.) (registered investment adviser); Director and Chief Executive, Invesco Administration Services Limited and Invesco Global Investment Funds Limited; Director, Invesco Distributors, Inc.; Head of EMEA, Invesco Ltd.; President, Invesco Actively Managed Exchange-Traded Commodity Fund Trust, Invesco Actively Managed Exchange-Traded Fund Trust, Invesco Exchange-Traded Fund Trust, Invesco Exchange-Traded Fund Trust II and Invesco India Exchange-Traded Fund Trust; Managing Director and Principal Executive Officer, Invesco Capital Management LLC | | N/A | | N/A |
Invesco V.I. Mid Cap Core Equity Fund
Trustees and Officers–(continued)
| | | | | | | | |
Name, Year of Birth and
Position(s)
Held with the Trust | | Trustee
and/or
Officer
Since | | Principal Occupation(s)
During Past 5 Years | | Number of
Funds in
Fund Complex
Overseen by
Trustee | | Other
Directorship(s)
Held by Trustee
During Past 5 Years |
| Officers–(continued) | | |
John M. Zerr – 1962
Senior Vice President | | 2006 | | Chief Operating Officer of the Americas; Senior Vice President, Invesco Advisers, Inc. (formerly known as Invesco Institutional (N.A.), Inc.) (registered investment adviser); Senior Vice President, Invesco Distributors, Inc. (formerly known as Invesco AIM Distributors, Inc.); Director and Vice President, Invesco Investment Services, Inc. (formerly known as Invesco AIM Investment Services, Inc.) Senior Vice President, The Invesco Funds; Managing Director, Invesco Capital Management LLC; Director, Invesco Investment Advisers LLC (formerly known as Van Kampen Asset Management); Senior Vice President, Invesco Capital Markets, Inc. (formerly known as Van Kampen Funds Inc.); Manager, Invesco Indexing LLC; Manager, Invesco Specialized Products, LLC; Director and Senior Vice President, Invesco Insurance Agency, Inc.; Member, Invesco Canada Funds Advisory Board; Director, President and Chief Executive Officer, Invesco Corporate Class Inc. (corporate mutual fund company); and Director, Chairman, President and Chief Executive Officer, Invesco Canada Ltd. (formerly known as Invesco Trimark Ltd./Invesco Trimark Ltèe) (registered investment adviser and registered transfer agent) Formerly: Director and Senior Vice President, Invesco Management Group, Inc. (formerly known as Invesco AIM Management Group, Inc.); Secretary and General Counsel, Invesco Management Group, Inc. (formerly known as Invesco AIM Management Group, Inc.); Secretary, Invesco Investment Services, Inc. (formerly known as Invesco AIM Investment Services, Inc.); Chief Legal Officer and Secretary, The Invesco Funds; Secretary and General Counsel, Invesco Investment Advisers LLC (formerly known as Van Kampen Asset Management); Secretary and General Counsel, Invesco Capital Markets, Inc. (formerly known as Van Kampen Funds Inc.); Chief Legal Officer, Invesco Exchange-Traded Fund Trust, Invesco Exchange-Traded Fund Trust II, Invesco India Exchange-Traded Fund Trust, Invesco Actively Managed Exchange-Traded Fund Trust, Invesco Actively Managed Exchange-Traded Commodity Fund Trust and Invesco Exchange-Traded Self-Indexed Fund Trust; Secretary, Invesco Indexing LLC; Director, Secretary, General Counsel and Senior Vice President, Van Kampen Exchange Corp.; Director, Vice President and Secretary, IVZ Distributors, Inc. (formerly known as INVESCO Distributors, Inc.); Director and Vice President, INVESCO Funds Group, Inc.; Director and Vice President, Van Kampen Advisors Inc.; Director, Vice President, Secretary and General Counsel, Van Kampen Investor Services Inc.;Director and Secretary, Invesco Distributors, Inc. (formerly known as Invesco AIM Distributors, Inc.); Director, Senior Vice President, General Counsel and Secretary, Invesco AIM Advisers, Inc. and Van Kampen Investments Inc.; Director, Vice President and Secretary, Fund Management Company; Director, Senior Vice President, Secretary, General Counsel and Vice President, Invesco AIM Capital Management, Inc.; Chief Operating Officer and General Counsel, Liberty Ridge Capital, Inc. (an investment adviser) | | N/A | | N/A |
Gregory G. McGreevey - 1962
Senior Vice President | | 2012 | | Senior Managing Director, Invesco Ltd.; Director, Chairman, President, and Chief Executive Officer, Invesco Advisers, Inc. (formerly known as Invesco Institutional (N.A.), Inc.) (registered investment adviser); Director, Invesco Mortgage Capital, Inc. and Invesco Senior Secured Management, Inc.; and Senior Vice President, The Invesco Funds; and President, SNW Asset Management Corporation Formerly: Senior Vice President, Invesco Management Group, Inc. and Invesco Advisers, Inc.; Assistant Vice President, The Invesco Funds | | N/A | | N/A |
Kelli Gallegos - 1970
Vice President, Principal Financial Officer and Assistant Treasurer | | 2008 | | Principal Financial and Accounting Officer – Investments Pool, Invesco Specialized Products, LLC; Vice President, Principal Financial Officer and Assistant Treasurer, The Invesco Funds; Principal Financial and Accounting Officer – Pooled Investments, Invesco Capital Management LLC; Vice President and Treasurer, Invesco Exchange-Traded Fund Trust, Invesco Exchange-Traded Fund Trust II, Invesco India Exchange-Traded Fund Trust, Invesco Actively Managed Exchange-Traded Fund Trust, Invesco Actively Managed Exchange-Traded Commodity Fund Trust and Invesco Exchange-Traded Self-Indexed Fund Trust Formerly: Assistant Treasurer, Invesco Specialized Products, LLC; Assistant Treasurer, Invesco Exchange-Traded Fund Trust, Invesco Exchange-Traded Fund Trust II, Invesco India Exchange-Traded Fund Trust, Invesco Actively Managed Exchange-Traded Fund Trust, Invesco Actively Managed Exchange-Traded Commodity Fund Trust and Invesco Exchange-Traded Self-Indexed Fund Trust; Assistant Treasurer, Invesco Capital Management LLC; Assistant Vice President, The Invesco Funds | | N/A | | N/A |
Invesco V.I. Mid Cap Core Equity Fund
Trustees and Officers–(continued)
| | | | | | | | |
Name, Year of Birth and
Position(s)
Held with the Trust | | Trustee
and/or
Officer
Since | | Principal Occupation(s)
During Past 5 Years | | Number of
Funds in
Fund Complex
Overseen by
Trustee | | Other
Directorship(s)
Held by Trustee
During Past 5 Years |
| Officers–(continued) | | |
Crissie M. Wisdom - 1969
Anti-Money Laundering Compliance Officer | | 2013 | | Anti-Money Laundering Compliance Officer, Invesco Advisers, Inc. (formerly known as Invesco Institutional (N.A.), Inc.) (registered investment adviser), Invesco Capital Markets, Inc. (formerly known as Van Kampen Funds Inc.), Invesco Distributors, Inc., Invesco Investment Services, Inc., The Invesco Funds, and Invesco Exchange-Traded Fund Trust, Invesco Exchange-Traded Fund Trust II, Invesco India Exchange-Traded Fund Trust, Invesco Actively Managed Exchange-Traded Fund Trust, Invesco Actively Managed Exchange-Traded Commodity Fund Trust and Invesco Exchange-Traded Self-Indexed Fund Trust; Anti-Money Laundering Compliance Officer and Bank Secrecy Act Officer, INVESCO National Trust Company and Invesco Trust Company; and Fraud Prevention Manager and Controls and Risk Analysis Manager for Invesco Investment Services, Inc. Formerly: Anti-Money Laundering Compliance Officer, Van Kampen Exchange Corp. and Invesco Management Group, Inc. | | N/A | | N/A |
Robert R. Leveille - 1969
Chief Compliance Officer | | 2016 | | Chief Compliance Officer, Invesco Advisers, Inc. (registered investment adviser); and Chief Compliance Officer, The Invesco Funds Formerly: Chief Compliance Officer, Putnam Investments and the Putnam Funds | | N/A | | N/A |
The Statement of Additional Information of the Trust includes additional information about the Fund’s Trustees and is available upon request, without charge, by calling 1.800.959.4246. Please refer to the Fund’s Statement of Additional Information for information on the Fund’ssub-advisers.
| | | | | | |
| Office of the Fund | | Investment Adviser | | Distributor | | Auditors |
11 Greenway Plaza, Suite 1000 Houston, TX 77046-1173 | | Invesco Advisers, Inc. 1555 Peachtree Street, N.E. Atlanta, GA 30309 | | Invesco Distributors, Inc. 11 Greenway Plaza, Suite 1000 Houston, TX 77046-1173 | | PricewaterhouseCoopers LLP 1000 Louisiana Street, Suite 5800 Houston, TX 77002-5678 |
| | | |
| Counsel to the Fund | | Counsel to the Independent Trustees | | Transfer Agent | | Custodian |
Stradley Ronon Stevens & Young, LLP 2005 Market Street, Suite 2600
Philadelphia, PA 19103-7018 | | Goodwin Procter LLP 901 New York Avenue, N.W. Washington, D.C. 20001 | | Invesco Investment Services, Inc. 11 Greenway Plaza, Suite 1000 Houston, TX 77046-1173 | | State Street Bank and Trust Company 225 Franklin Street Boston, MA 02110-2801 |
Invesco V.I. Mid Cap Core Equity Fund
| | | | |
 | | Annual Report to Shareholders | | December 31, 2019 |
| | Invesco V.I. Mid Cap Growth Fund |
| | |
| | |

Beginning on January 1, 2021, as permitted by regulations adopted by the Securities and Exchange Commission, the insurance company that offers your variable annuity or variable life insurance contract may no longer send you paper copies of the Fund’s shareholder reports by mail, unless you specifically request paper copies of the reports from the insurance company or your financial intermediary. Instead of delivering paper copies of the report, the insurance company may choose to make the reports available on a website, and will notify you by mail each time a report is posted and provide you with a website link to access the report. Instructions for requesting paper copies will be provided by your insurance company.
If the insurance company offers electronic delivery, you may elect to receive shareholder reports and other communications about the Fund electronically by following the instructions provided by the insurance company or by contacting your financial intermediary. If you already elected to receive shareholder reports electronically, you will not be affected by this change and you need not take any action.
You may elect to receive all future reports in paper free of charge from the insurance company. You can inform the insurance company or your financial intermediary that you wish to continue receiving paper copies of your shareholder reports by following the instructions provided by the insurance company or by contacting your financial intermediary. Your election to receive reports in paper will apply to all portfolio companies available under your contract with the insurance company.
The Fund provides a complete list of its holdings four times in each fiscal year, at the quarter-ends. For the second and fourth quarters, the lists appear in the Fund’s semiannual and annual reports to shareholders. For the first and third quarters, the Fund files the lists with the Securities and Exchange Commission (SEC) as an exhibit to its reports on FormN-PORT. The Fund’s FormN-PORT filings are available on the SEC website, sec.gov. The SEC file numbers for the Fund are811-07452 and033-57340. The Fund’s most recent portfolio holdings, as filed on FormN-PORT, have also been made available to insurance companies issuing variable annuity contracts and variable life insurance policies (“variable products”) that invest in the Fund.
A description of the policies and procedures that the Fund uses to determine how to vote proxies relating to portfolio securities is available without charge, upon request, from our Client Services department at 800 959 4246 or at invesco.com/proxyguidelines. The information is also available on the SEC website, sec.gov.
Information regarding how the Fund voted proxies related to its portfolio securities during the most recent12-month period ended June 30 is available at invesco.com/proxysearch. The information is also available on the SEC website, sec.gov.
Invesco Advisers, Inc. is an investment adviser; it provides investment advisory services to individual and institutional clients and does not sell securities. Invesco Distributors, Inc. is the US distributor for Invesco Ltd.’s retail mutual funds, exchange-traded funds and institutional money market funds. Both are wholly owned, indirect subsidiaries of Invesco Ltd.
This report must be accompanied or preceded by a currently effective Fund prospectus and variable product prospectus, which contain more complete information, including sales charges and expenses. Investors should read each carefully before investing.
NOT FDIC INSURED | MAY LOSE VALUE | NO BANK GUARANTEE
| | |
| Invesco Distributors, Inc. | | VK-VIMCG-AR-1 |
Management’s Discussion of Fund Performance
Performance summary
For the year ended December 31, 2019, Series I shares of Invesco V.I. Mid Cap Growth Fund (the Fund) underperformed the Russell Midcap Growth Index, the Fund’s style-specific benchmark.
Your Fund’s long-term performance appears later in this report.
Fund vs. Indexes
Total returns, 12/31/18 to 12/31/19, excluding variable product issuer charges. If variable product issuer charges were included, returns would be lower.
| | | | | |
| Series I Shares | | | | 34.34 | % |
| Series II Shares | | | | 34.00 | |
| S&P 500 Indexq(Broad Market Index) | | | | 31.49 | |
| Russell Midcap Growth Indexq(Style-Specific Index) | | | | 35.47 | |
| Lipper VUFMid-Cap Growth Funds Index∎(Peer Group Index) | | | | 35.06 | |
| Source(s):qRIMES Technologies Corp.;∎Lipper Inc. | |
Market conditions and your Fund
Equity markets rallied in the first quarter of 2019, fueled by optimism about a potentialUS-China trade deal and indication that the US Federal Reserve (the Fed) would not raise interest rates in 2019, a surprising shift in monetary policy. The Fed’s more accommodative stance provided a supportive environment for equities and fixed income, even as US economic data were mixed and overseas growth appeared to be slowing. Against this backdrop, the S&P 500 Index posted its best first quarter returns since 1998.
Although the S&P 500 Index posted modest gains for the second quarter of 2019, the US stock market experienced increased volatility. After four consecutive months of rising stock markets, the market sold off in May 2019, along with bond yields and oil prices, as investors weighed the impact of the lingering trade war between the US and China, as well as potential tariffs imposed on Mexico. In addition, economic data showed a slowing domestic and global economy.
Key issues that concerned investors in the second quarter of 2019 carried over into the third quarter. TheUS-China
trade conflict worried investors and stifled business investment, even as the Fed cut interest rates by 0.25% in July and again in September 2019.1 This environment, combined with evidence of slowing global economic growth, fueled market volatility in August 2019. The US Treasury yield curve inverted several times, increasing fears of a possible US recession. As a result, August saw increased risk aversion, with investors crowding into asset classes perceived as safe havens, such as US Treasuries and gold. However, the Fed’s accommodative tone provided some support for risk assets.
Macroeconomic issues that concerned investors in the third quarter of 2019 mostly abated during the fourth quarter, providing the backdrop for strong equity market returns. Risk assets surged higher as a result of a delay in the Brexit agreement until January 2020, optimism that phase one of aUS-China trade deal would be completed and better-than-expected third-quarter corporate earnings results. The US economy rose higher than expected, at 2.1% during the third quarter of 2019.2 During its October meeting, the Fed cut interest rates again
by 0.25% based on business investment and exports remaining weak.1 Investors were also encouraged by a resilient US economy and corporate earnings, putting the US equity market on track for its largest annual rise since 2013.
During the year, the Fund produced a strong, double-digit return but slightly underperformed its style-specific benchmark. Stock selection in the health care, consumer discretionary and financials sectors was a key detractor from the Fund’s performance relative to the style-specific benchmark. This performance was partially offset by stronger stock selection in the industrials, information technology (IT) and communication services sectors, which contributed to the Fund’s relative performance.
Key individual detractors from the Fund’s absolute performance for the year includedTractor Supply,LivaNovaandAerie Pharmaceuticals. Tractor Supply is a rural lifestyle retailer that provides home improvement, agriculture, lawn and garden maintenance, livestock, equine and pet care products. Shares of the company declined as concerns around profit margin trends weighed on investor sentiment. LivaNova, a global medical technology company, and Aerie Pharmaceuticals, a leading ophthalmic pharmaceuticals company, both under-performed during the first half of 2019. As such, we exited our positions in both companies before the close of the year.
Key individual contributors to the Fund’s absolute performance includedCoStar Group,ServiceNowandDexcom. CoStar provides information, analytics and marketing services to the commercial real estate industry. The company experienced robust organic growth across its segments and saw an increase in its profit margins.Service-Now, a provider of IT services for enterprises, experienced strong billings and
| | |
Portfolio Composition |
By sector | | % of total net assets |
| | |
| |
| Information Technology | | 29.69% |
| Industrials | | 20.69 |
| Health Care | | 14.78 |
| Consumer Discretionary | | 13.96 |
| Financials | | 7.34 |
| Communication Services | | 3.59 |
| Real Estate | | 3.49 |
| Materials | | 3.19 |
| Consumer Staples | | 2.09 |
| Energy | | 0.45 |
| Money Market Funds Plus Other Assets Less Liabilities | | 0.73 |
| | |
Top 10 Equity Holdings* | | |
| % of total net assets |
| |
1. O’Reilly Automotive, Inc. | | 2.26% |
2. KLA Corp. | | 2.11 |
3. DexCom, Inc. | | 2.07 |
4. Synopsys, Inc. | | 1.98 |
5. Lam Research Corp. | | 1.92 |
6. RingCentral, Inc., Class A | | 1.90 |
7. TransDigm Group, Inc. | | 1.89 |
8. Pool Corp. | | 1.87 |
9. CDW Corp. | | 1.82 |
10. CoStar Group, Inc. | | 1.79 |
| | |
Total Net Assets | | $225.4 million |
| |
Total Number of Holdings* | | 92 |
The Fund’s holdings are subject to change, and there is no assurance that the Fund will continue to hold any particular security.
*Excluding money market fund holdings, if any.
Data presented here are as of December 31, 2019.
Invesco V.I. Mid Cap Growth Fund
provided guidance early in the year for future subscription revenue that was above consensus estimates, which drove the stock higher. We exited our position in the company before the close of the year. Dexcom, a medical device company, reported strong earnings throughout the year and saw an accelerated demand for its continuous glucose monitoring systems.
At the close of the year, we expected the US economy to generate about 2.5% growth in 2020, in line with the 2.4% experienced in 2019 and representing the 11th consecutive year of growth.1 A stable Fed monetary policy, along with the resolution of uncertainties regarding trade disputes, Brexit, the annual federal budget and US presidential impeachment all support the case for sustaining this long expansion. Meanwhile, interest rates and inflation remained low by historical standards and we believe corporate earnings may regain some vigor after a tough stretch in recent quarters. In our view, equity valuations remained relatively high but also appear reasonable when placed in context of the favorable macroeconomic environment. At the end of the year, our opportunity set of premier growth companies remained compelling in our opinion, and we believe stock selection can continue to drive the Fund’s relative performance.
Please note that a new portfolio management team began managing the Fund on June 21, 2019.
We thank you for your commitment to Invesco V.I. Mid Cap Growth Fund and for sharing our long-term investment horizon.
1 Source: US Federal Reserve
2 Source: Bureau of Economic Analysis
Portfolio managers:
Justin Livengood
Ronald Zibeli, Jr.
The views and opinions expressed in management’s discussion of Fund performance are those of Invesco Advisers, Inc. These views and opinions are subject to change at any time based on factors such as market and economic conditions. These views and opinions may not be relied upon as investment advice or recommendations, or as an offer for a particular security. The information is not a complete analysis of every aspect of any market, country, industry, security or the Fund. Statements of fact are from sources considered reliable, but Invesco Advisers, Inc. makes no representation or warranty as to their completeness or accuracy. Although historical performance is no guarantee of future results, these insights may help you understand our investment management philosophy.
See important Fund and, if applicable, index disclosures later in this report.
Invesco V.I. Mid Cap Growth Fund
Your Fund’s Long-Term Performance
Results of a $10,000 Investment – Oldest Share Class(es)
Fund and index data from 12/31/09
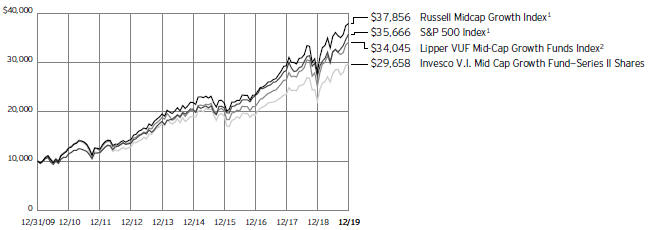
1 Source: RIMES Technologies Corp.
2 Source: Lipper Inc.
Past performance cannot guarantee future
results.
| | | | |
Average Annual Total Returns | |
As of 12/31/19 | | | | |
| |
Series I Shares | | | | |
10 Years | | | 11.71 | % |
5 Years | | | 9.64 | |
1 Year | | | 34.34 | |
| |
Series II Shares | | | | |
Inception (9/25/00) | | | 2.71 | % |
10 Years | | | 11.48 | |
5 Years | | | 9.38 | |
1 Year | | | 34.00 | |
Effective June 1, 2010, Class II shares of the predecessor fund, Van Kampen Life Investment Trust Mid Cap Growth Portfolio, advised by Van Kampen Asset Management were reorganized into Series II shares, of Invesco Van Kampen V.I. Mid Cap Growth Fund (renamed Invesco V.I. Mid Cap Growth Fund on April 29, 2013). Returns shown above, prior to June 1, 2010, for Series II shares are blended returns of the predecessor fund and Invesco V.I. Mid Cap Growth Fund. Share class returns will differ from the predecessor fund because of different expenses.
Series I shares incepted on June 1, 2010. Series I share performance shown prior to that date is that of the predecessor fund’s Class II shares and includes the12b-1 fees applicable to the predecessor fund’s Class II shares.
The performance data quoted represent past performance and cannot guarantee future results; current performance may be lower or higher. Please contact your variable product issuer or financial adviser for
the most recentmonth-end variable product performance. Performance figures reflect Fund expenses, reinvested distributions and changes in net asset value. Performance figures do not reflect deduction of taxes a shareholder would pay on Fund distributions or sale of Fund shares. Investment return and principal value will fluctuate so that you may have a gain or loss when you sell shares.
The total annual Fund operating expense ratio set forth in the most recent Fund prospectus as of the date of this report for Series I and Series II shares was 1.00% and 1.25%, respectively. The expense ratios presented above may vary from the expense ratios presented in other sections of this report that are based on expenses incurred during the period covered by this report.
Invesco V.I. Mid Cap Growth Fund, a series portfolio of AIM Variable Insurance Funds (Invesco Variable Insurance Funds), is currently offered through insurance companies issuing variable products. You cannot purchase shares of the Fund directly. Performance figures given represent the Fund and are not intended to reflect actual variable product values. They do not reflect sales charges, expenses and fees assessed in connection with a variable product. Sales charges, expenses and fees, which are determined by the variable product issuers, will vary and will lower the total return.
The most recentmonth-end performance at the Fund level, excluding variable product charges, is available at 800 451 4246. As mentioned above, for the most recent
month-end performance including variable product charges, please contact your variable product issuer or financial adviser.
Fund performance reflects any applicable fee waivers and/or expense reimbursements. Had the adviser not waived fees and/or reimbursed expenses currently or in the past, returns would have been lower. See current prospectus for more information.
Invesco V.I. Mid Cap Growth Fund
Invesco V.I. Mid Cap Growth Fund’s investment objective is to seek capital growth.
| ∎ | Unless otherwise stated, information presented in this report is as of December 31, 2019, and is based on total net assets. |
| ∎ | Unless otherwise noted, all data provided by Invesco. |
| ∎ | To access your Fund’s reports/prospectus, visit invesco.com/fundreports. |
About indexes used in this report
| ∎ | TheS&P 500® Indexis an unmanaged index considered representative of the US stock market. |
| ∎ | TheRussell Midcap® Growth Indexis an unmanaged index considered representative ofmid-cap growth stocks. The Russell Midcap Growth Index is a trademark/service mark of the Frank Russell Co. Russell® is a trademark of the Frank Russell Co. |
| ∎ | TheLipper VUFMid-Cap Growth Funds Indexis an unmanaged index considered representative ofmid-cap growth variable insurance underlying funds tracked by Lipper. |
| ∎ | The Fund is not managed to track the performance of any particular index, including the index(es) described here, and consequently, the performance of the Fund may deviate significantly from the performance of the index(es). |
| ∎ | A direct investment cannot be made in an index. Unless otherwise indicated, index results include reinvested dividends, and they do not reflect sales charges. Performance of the peer group, if applicable, reflects fund expenses; performance of a market index does not. |
Other information
| ∎ | The returns shown in management’s discussion of Fund performance are based on net asset values calculated for shareholder transactions. Generally accepted accounting principles require adjustments to be made to the net assets of the Fund at period end for financial reporting purposes, and as such, the net asset values for shareholder transactions and the returns based on those net asset values may differ from the net asset values and returns reported in the Financial Highlights. Additionally, the returns and net asset values shown throughout this report are at the Fund level only and do not include variable product issuer charges. If such charges were included, the total returns would be lower. |
| ∎ | Industry classifications used in this report are generally according to the Global Industry Classification Standard, which was developed by and is |
| | the exclusive property and a service mark of MSCI Inc. and Standard & Poor’s. |
Invesco V.I. Mid Cap Growth Fund
Schedule of Investments(a)
December 31, 2019
| | | | | | | | |
| | | Shares | | | Value | |
| |
|
Common Stocks & Other Equity Interests–99.27% | |
|
Aerospace & Defense–3.10% | |
| | |
HEICO Corp. | | | 23,779 | | | $ | 2,714,373 | |
| |
TransDigm Group, Inc. | | | 7,621 | | | | 4,267,760 | |
| |
| | | | | | | 6,982,133 | |
| |
|
Apparel Retail–0.80% | |
| | |
Burlington Stores, Inc.(b) | | | 7,868 | | | | 1,794,140 | |
| |
|
Apparel, Accessories & Luxury Goods–1.79% | |
| | |
Lululemon Athletica, Inc.(b) | | | 17,398 | | | | 4,030,595 | |
| |
|
Application Software–10.04% | |
| | |
ANSYS, Inc.(b) | | | 8,131 | | | | 2,093,001 | |
| |
Aspen Technology, Inc.(b) | | | 12,983 | | | | 1,570,034 | |
| |
Atlassian Corp. PLC, Class A(b) | | | 21,249 | | | | 2,557,105 | |
| |
Coupa Software, Inc.(b) | | | 12,580 | | | | 1,839,825 | |
| |
Paycom Software, Inc.(b) | | | 7,056 | | | | 1,868,147 | |
| |
RingCentral, Inc., Class A(b) | | | 25,398 | | | | 4,283,881 | |
| |
Splunk, Inc.(b) | | | 14,834 | | | | 2,221,688 | |
| |
Synopsys, Inc.(b) | | | 32,137 | | | | 4,473,470 | |
| |
Trade Desk, Inc. (The), Class A(b) | | | 6,666 | | | | 1,731,693 | |
| |
| | | | | | | 22,638,844 | |
| |
|
Asset Management & Custody Banks–0.74% | |
| | |
KKR & Co., Inc., Class A | | | 57,040 | | | | 1,663,857 | |
| |
|
Auto Parts & Equipment–0.72% | |
| | |
Aptiv PLC | | | 17,097 | | | | 1,623,702 | |
| |
|
Automotive Retail–2.92% | |
| | |
CarMax, Inc.(b) | | | 16,981 | | | | 1,488,725 | |
| |
O’Reilly Automotive, Inc.(b) | | | 11,624 | | | | 5,094,334 | |
| |
| | | | | | | 6,583,059 | |
| |
|
Biotechnology–0.50% | |
| | |
Seattle Genetics, Inc.(b) | | | 9,779 | | | | 1,117,349 | |
| |
|
Building Products–0.94% | |
| | |
Masco Corp. | | | 44,127 | | | | 2,117,655 | |
| |
|
Cable & Satellite–0.97% | |
| | |
Cable One, Inc. | | | 1,469 | | | | 2,186,562 | |
| |
|
Communications Equipment–1.26% | |
| | |
Motorola Solutions, Inc. | | | 17,569 | | | | 2,831,069 | |
| |
|
Construction Materials–0.94% | |
| | |
Martin Marietta Materials, Inc. | | | 7,588 | | | | 2,121,908 | |
| |
|
Consumer Electronics–0.52% | |
| | |
Garmin Ltd. | | | 12,051 | | | | 1,175,696 | |
| |
|
Data Processing & Outsourced Services–3.30% | |
| | |
Euronet Worldwide, Inc.(b) | | | 14,178 | | | | 2,233,886 | |
| |
| | | | | | | | |
| | | Shares | | | Value | |
| |
|
Data Processing & Outsourced Services–(continued) | |
| | |
Global Payments, Inc. | | | 16,385 | | | $ | 2,991,320 | |
| |
WEX, Inc.(b) | | | 10,602 | | | | 2,220,695 | |
| |
| | | | | | | 7,445,901 | |
| |
|
Distributors–1.87% | |
| | |
Pool Corp. | | | 19,887 | | | | 4,223,601 | |
| |
|
Diversified Chemicals–0.37% | |
| | |
Huntsman Corp. | | | 34,344 | | | | 829,751 | |
| |
|
Diversified Support Services–2.82% | |
| | |
Cintas Corp. | | | 12,788 | | | | 3,440,995 | |
| |
Copart, Inc.(b) | | | 32,148 | | | | 2,923,539 | |
| |
| | | | | | | 6,364,534 | |
| |
|
Education Services–1.22% | |
| | |
Bright Horizons Family Solutions, Inc.(b) | | | 18,348 | | | | 2,757,521 | |
| |
|
Electrical Components & Equipment–1.19% | |
| | |
AMETEK, Inc. | | | 27,004 | | | | 2,693,379 | |
| |
|
Electronic Equipment & Instruments–1.77% | |
| | |
Keysight Technologies, Inc.(b) | | | 38,814 | | | | 3,983,481 | |
| |
|
Environmental & Facilities Services–1.93% | |
| | |
Clean Harbors, Inc.(b) | | | 13,333 | | | | 1,143,305 | |
| |
Republic Services, Inc. | | | 35,891 | | | | 3,216,910 | |
| |
| | | | | | | 4,360,215 | |
| |
|
Fertilizers & Agricultural Chemicals–0.61% | |
| | |
FMC Corp. | | | 13,828 | | | | 1,380,311 | |
| |
|
Financial Exchanges & Data–3.20% | |
| | |
MarketAxess Holdings, Inc. | | | 5,179 | | | | 1,963,411 | |
| |
MSCI, Inc. | | | 15,545 | | | | 4,013,408 | |
| |
Tradeweb Markets, Inc., Class A | | | 26,510 | | | | 1,228,738 | |
| |
| | | | | | | 7,205,557 | |
| |
|
Health Care Equipment–7.91% | |
| | |
DexCom, Inc.(b) | | | 21,302 | | | | 4,659,599 | |
| |
Edwards Lifesciences Corp.(b) | | | 12,120 | | | | 2,827,475 | |
| |
IDEXX Laboratories, Inc.(b) | | | 8,712 | | | | 2,274,965 | |
| |
Masimo Corp.(b) | | | 15,140 | | | | 2,393,028 | |
| |
Novocure Ltd.(b) | | | 12,258 | | | | 1,032,982 | |
| |
STERIS PLC | | | 16,574 | | | | 2,526,209 | |
| |
Teleflex, Inc. | | | 5,604 | | | | 2,109,570 | |
| |
| | | | | | | 17,823,828 | |
| |
|
Health Care Supplies–1.52% | |
| | |
Cooper Cos., Inc. (The) | | | 3,619 | | | | 1,162,749 | |
| |
West Pharmaceutical Services, Inc. | | | 15,025 | | | | 2,258,708 | |
| |
| | | | | | | 3,421,457 | |
| |
See accompanying Notes to Financial Statements which are an integral part of the financial statements.
Invesco V.I. Mid Cap Growth Fund
| | | | | | | | |
| | | Shares | | | Value | |
| |
|
Health Care Technology–0.74% | |
| | |
Veeva Systems, Inc., Class A(b) | | | 11,906 | | | $ | 1,674,698 | |
| |
|
Hotels, Resorts & Cruise Lines–0.87% | |
| | |
Hilton Worldwide Holdings, Inc. | | | 17,632 | | | | 1,955,565 | |
| |
|
Industrial Conglomerates–2.75% | |
| | |
Carlisle Cos., Inc. | | | 13,751 | | | | 2,225,462 | |
| |
Roper Technologies, Inc. | | | 11,219 | | | | 3,974,106 | |
| |
| | | | | | | 6,199,568 | |
| |
|
Industrial Machinery–1.63% | |
| | |
IDEX Corp. | | | 14,882 | | | | 2,559,704 | |
| |
Nordson Corp. | | | 6,836 | | | | 1,113,174 | |
| |
| | | | | | | 3,672,878 | |
| |
|
Industrial REITs–0.46% | |
| | |
Americold Realty Trust | | | 29,764 | | | | 1,043,526 | |
| |
|
Insurance Brokers–1.25% | |
| | |
Arthur J. Gallagher & Co. | | | 29,525 | | | | 2,811,666 | |
| |
|
Interactive Media & Services–1.11% | |
| | |
IAC/InterActiveCorp.(b) | | | 10,020 | | | | 2,496,082 | |
| |
|
Internet Services & Infrastructure–0.75% | |
| | |
Twilio, Inc., Class A(b) | | | 17,229 | | | | 1,693,266 | |
| |
|
Investment Banking & Brokerage–1.06% | |
| | |
LPL Financial Holdings, Inc. | | | 25,815 | | | | 2,381,434 | |
| |
|
IT Consulting & Other Services–2.11% | |
| | |
Booz Allen Hamilton Holding Corp. | | | 37,830 | | | | 2,690,848 | |
| |
EPAM Systems, Inc.(b) | | | 9,705 | | | | 2,059,013 | |
| |
| | | | | | | 4,749,861 | |
| |
|
Leisure Facilities–0.77% | |
| | |
Planet Fitness, Inc., Class A(b) | | | 23,368 | | | | 1,745,122 | |
| |
|
Life Sciences Tools & Services–4.12% | |
| | |
Bio-Rad Laboratories, Inc., Class A(b) | | | 5,715 | | | | 2,114,721 | |
| |
Bio-Techne Corp. | | | 8,211 | | | | 1,802,397 | |
| |
ICON PLC (Ireland)(b) | | | 14,856 | | | | 2,558,649 | |
| |
IQVIA Holdings, Inc.(b) | | | 18,132 | | | | 2,801,575 | |
| |
| | | | | | | 9,277,342 | |
| |
|
Metal & Glass Containers–0.75% | |
| | |
Ball Corp. | | | 26,256 | | | | 1,697,976 | |
| |
|
Movies & Entertainment–1.51% | |
| | |
Live Nation Entertainment, Inc.(b) | | | 34,473 | | | | 2,463,785 | |
| |
Roku, Inc.(b) | | | 7,034 | | | | 941,853 | |
| |
| | | | | | | 3,405,638 | |
| |
|
Office REITs–0.87% | |
| | |
Alexandria Real Estate Equities, Inc. | | | 12,106 | | | | 1,956,087 | |
| |
|
Oil & Gas Storage & Transportation–0.45% | |
| | |
Cheniere Energy, Inc.(b) | | | 16,707 | | | | 1,020,296 | |
| |
| | | | | | | | |
| | | Shares | | | Value | |
| |
|
Packaged Foods & Meats–2.09% | |
| | |
McCormick & Co., Inc. | | | 16,722 | | | $ | 2,838,225 | |
| |
Simply Good Foods Co. (The)(b) | | | 26,311 | | | | 750,916 | |
| |
Tyson Foods, Inc., Class A | | | 12,408 | | | | 1,129,624 | |
| |
| | | | | | | 4,718,765 | |
| |
|
Paper Packaging–0.51% | |
| | |
Avery Dennison Corp. | | | 8,844 | | | | 1,156,972 | |
| |
|
Railroads–1.16% | |
| | |
Kansas City Southern | | | 17,026 | | | | 2,607,702 | |
| |
|
Real Estate Services–1.14% | |
| | |
CBRE Group, Inc., Class A(b) | | | 42,108 | | | | 2,580,799 | |
| |
|
Regional Banks–1.10% | |
| | |
First Republic Bank | | | 21,071 | | | | 2,474,789 | |
| |
|
Research & Consulting Services–4.24% | |
| | |
CoStar Group, Inc.(b) | | | 6,737 | | | | 4,030,747 | |
| |
IHS Markit Ltd.(b) | | | 30,674 | | | | 2,311,286 | |
| |
TransUnion | | | 37,515 | | | | 3,211,659 | |
| |
| | | | | | | 9,553,692 | |
| |
|
Restaurants–1.48% | |
| | |
Chipotle Mexican Grill, Inc.(b) | | | 3,987 | | | | 3,337,558 | |
| |
|
Semiconductor Equipment–4.03% | |
| | |
KLA Corp. | | | 26,671 | | | | 4,751,972 | |
| |
Lam Research Corp. | | | 14,824 | | | | 4,334,538 | |
| |
| | | | | | | 9,086,510 | |
| |
|
Semiconductors–4.61% | |
| | |
Advanced Micro Devices, Inc.(b) | | | 80,652 | | | | 3,698,700 | |
| |
Marvell Technology Group Ltd. | | | 80,123 | | | | 2,128,067 | |
| |
Monolithic Power Systems, Inc. | | | 16,136 | | | | 2,872,531 | |
| |
NXP Semiconductors N.V. (Netherlands) | | | 13,342 | | | | 1,697,903 | |
| |
| | | | | | | 10,397,201 | |
| |
|
Specialized REITs–1.01% | |
| | |
SBA Communications Corp., Class A | | | 9,470 | | | | 2,282,175 | |
| |
|
Specialty Stores–1.00% | |
| | |
Tractor Supply Co. | | | 24,146 | | | | 2,256,202 | |
| |
|
Technology Distributors–1.82% | |
| | |
CDW Corp. | | | 28,760 | | | | 4,108,078 | |
| |
|
Trucking–0.93% | |
| | |
Old Dominion Freight Line, Inc. | | | 10,998 | | | | 2,087,200 | |
| |
Total Common Stocks & Other Equity Interests
(Cost $188,161,551) | | | | | | | 223,784,753 | |
| |
|
Money Market Funds–0.73% | |
| | |
Invesco Government & Agency Portfolio, Institutional Class, 1.50%(c) | | | 632,628 | | | | 632,628 | |
| |
Invesco Liquid Assets Portfolio, Institutional Class, 1.71%(c) | | | 289,675 | | | | 289,762 | |
| |
See accompanying Notes to Financial Statements which are an integral part of the financial statements.
Invesco V.I. Mid Cap Growth Fund
| | | | | | | | |
| | | Shares | | | Value | |
| |
| | |
Invesco Treasury Portfolio, Institutional Class, 1.49%(c) | | | 723,003 | | | $ | 723,003 | |
| |
Total Money Market Funds (Cost $1,645,393) | | | | 1,645,393 | |
| |
TOTAL INVESTMENTS IN
SECURITIES–100.00%
(Cost $189,806,944) | | | | 225,430,146 | |
| |
OTHER ASSETS LESS LIABILITIES–(0.00)% | | | | (3,022 | ) |
| |
NET ASSETS–100.00% | | | | | | $ | 225,427,124 | |
| |
Investment Abbreviations:
REIT - Real Estate Investment Trust
Notes to Schedule of Investments:
| (a) | Industry and/or sector classifications used in this report are generally according to the Global Industry Classification Standard, which was developed by and is the exclusive property and a service mark of MSCI Inc. and Standard & Poor’s. |
| (b) | Non-income producing security. |
| (c) | The money market fund and the Fund are affiliated by having the same investment adviser. The rate shown is the7-day SEC standardized yield as of December 31, 2019. |
See accompanying Notes to Financial Statements which are an integral part of the financial statements.
Invesco V.I. Mid Cap Growth Fund
Statement of Assets and Liabilities
December 31, 2019
| | | | |
Assets: | | | | |
| |
Investments in securities, at value
(Cost $ 188,161,551) | | $ | 223,784,753 | |
| |
Investments in affiliated money market funds, at value
(Cost $ 1,645,393) | | | 1,645,393 | |
| |
Receivable for: | | | | |
Investments sold | | | 832,868 | |
| |
Fund shares sold | | | 21,925 | |
| |
Dividends | | | 350,608 | |
| |
Investment for trustee deferred compensation and retirement plans | | | 124,895 | |
| |
Total assets | | | 226,760,442 | |
| |
| |
Liabilities: | | | | |
| |
Payable for: | | | | |
Investments purchased | | | 717,377 | |
| |
Fund shares reacquired | | | 186,885 | |
| |
Amount due custodian | | | 105,244 | |
| |
Accrued fees to affiliates | | | 158,130 | |
| |
Accrued other operating expenses | | | 32,443 | |
| |
Trustee deferred compensation and retirement plans | | | 133,239 | |
| |
Total liabilities | | | 1,333,318 | |
| |
Net assets applicable to shares outstanding | | $ | 225,427,124 | |
| |
| |
Net assets consist of: | | | | |
| |
Shares of beneficial interest | | $ | 144,575,847 | |
| |
Distributable earnings | | | 80,851,277 | |
| |
| | $ | 225,427,124 | |
| |
| |
Net Assets: | | | | |
| |
Series I | | $ | 106,960,873 | |
| |
Series II | | $ | 118,466,251 | |
| |
|
Shares outstanding, no par value, with an unlimited number of shares authorized: | |
| |
Series I | | | 19,591,036 | |
| |
Series II | | | 22,306,972 | |
| |
Series I: | | | | |
Net asset value per share | | $ | 5.46 | |
| |
Series II: | | | | |
Net asset value per share | | $ | 5.31 | |
| |
Statement of Operations
For the year ended December 31, 2019
| | | | |
Investment income: | | | | |
| |
Dividends (net of foreign withholding taxes of $5,397) | | $ | 1,768,103 | |
| |
Dividends from affiliated money market funds (includes securities lending income of $13,248) | | | 74,245 | |
| |
Total investment income | | | 1,842,348 | |
| |
| |
Expenses: | | | | |
| |
Advisory fees | | | 1,633,947 | |
| |
Administrative services fees | | | 355,060 | |
| |
Custodian fees | | | 5,753 | |
| |
Distribution fees - Series II | | | 282,726 | |
| |
Transfer agent fees | | | 45,504 | |
| |
Trustees’ and officers’ fees and benefits | | | 21,376 | |
| |
Reports to shareholders | | | 7,413 | |
| |
Professional services fees | | | 41,290 | |
| |
Other | | | 4,057 | |
| |
Total expenses | | | 2,397,126 | |
| |
Less: Fees waived, expenses reimbursed and/or expense offset arrangement(s) | | | (3,191 | ) |
| |
Net expenses | | | 2,393,935 | |
| |
Net investment income (loss) | | | (551,587 | ) |
| |
| |
Realized and unrealized gain (loss) from: | | | | |
| |
Net realized gain (loss) from: | | | | |
Investment securities (includes net gains from securities sold to affiliates of $605,290) | | | 48,152,599 | |
| |
Foreign currencies | | | (556 | ) |
| |
| | | 48,152,043 | |
| |
Change in net unrealized appreciation (depreciation) of: | | | | |
Investment securities | | | 13,601,011 | |
| |
Foreign currencies | | | (187 | ) |
| |
| | | 13,600,824 | |
| |
Net realized and unrealized gain | | | 61,752,867 | |
| |
Net increase in net assets resulting from operations | | $ | 61,201,280 | |
| |
See accompanying Notes to Financial Statements which are an integral part of the financial statements.
Invesco V.I. Mid Cap Growth Fund
Statement of Changes in Net Assets
For the years ended December 31, 2019 and 2018
| | | | | | | | |
| | | 2019 | | | 2018 | |
| |
Operations: | | | | | | | | |
Net investment income (loss) | | $ | (551,587 | ) | | $ | (1,121,299 | ) |
| |
Net realized gain | | | 48,152,043 | | | | 32,029,158 | |
| |
Change in net unrealized appreciation (depreciation) | | | 13,600,824 | | | | (40,227,712 | ) |
| |
Net increase (decrease) in net assets resulting from operations | | | 61,201,280 | | | | (9,319,853 | ) |
| |
| | |
Distributions to shareholders from distributable earnings: | | | | | | | | |
| | |
Series I | | | (15,327,683 | ) | | | (11,710,806 | ) |
| |
Series II | | | (17,108,194 | ) | | | (12,842,411 | ) |
| |
Total distributions from distributable earnings | | | (32,435,877 | ) | | | (24,553,217 | ) |
| |
| | |
Share transactions–net: | | | | | | | | |
| | |
Series I | | | 861,000 | | | | (1,294,488 | ) |
| |
Series II | | | 12,504,595 | | | | (13,180,099 | ) |
| |
Net increase (decrease) in net assets resulting from share transactions | | | 13,365,595 | | | | (14,474,587 | ) |
| |
Net increase (decrease) in net assets | | | 42,130,998 | | | | (48,347,657 | ) |
| |
| | |
Net assets: | | | | | | | | |
Beginning of year | | | 183,296,126 | | | | 231,643,783 | |
| |
End of year | | $ | 225,427,124 | | | $ | 183,296,126 | |
| |
See accompanying Notes to Financial Statements which are an integral part of the financial statements.
Invesco V.I. Mid Cap Growth Fund
Financial Highlights
The following schedule presents financial highlights for a share of the Fund outstanding throughout the periods indicated.
| | | | | | | | | | | | | | | | | | | | | | | | | | | | | | | | | | | | | | | | | | | | | | | | | | | | | | | | | | | | |
| | | | | | | | | | | | | | | | | | | Ratio of | | Ratio of | | | | |
| | | | | | | | | | | | | | | | | | | expenses | | expenses | | | | |
| | | | | | | Net gains | | | | | | | | | | | | to average | | to average net | | Ratio of net | | |
| | | | | | | (losses) | | | | | | | | | | | | net assets | | assets without | | investment | | |
| | | Net asset | | Net | | on securities | | | | Distributions | | | | | | | | with fee waivers | | fee waivers | | income | | |
| | | value, | | investment | | (both | | Total from | | from net | | Net asset | | | | Net assets, | | and/or | | and/or | | (loss) | | |
| | | beginning | | income | | realized and | | investment | | realized | | value, end | | Total | | end of period | | expenses | | expenses | | to average | | Portfolio |
| | | of period | | (loss)(a) | | unrealized) | | operations | | gains | | of period | | return (b) | | (000’s omitted) | | absorbed | | absorbed | | net assets | | turnover (c)
|
Series I | | | | | | | | | | | | | | | | | | | | | | | | | | | | | | | | | | | | | | | | | | | | | | | | | | | | | | | | | | | | |
Year ended 12/31/19 | | | $ | 4.77 | | | | $ | (0.01 | ) | | | $ | 1.59 | | | | $ | 1.58 | | | | $ | (0.89 | ) | | | $ | 5.46 | | | | | 34.34 | % | | | $ | 106,961 | | | | | 0.97 | %(d) | | | | 0.97 | %(d) | | | | (0.12 | )%(d) | | | | 122 | % |
Year ended 12/31/18 | | | | 5.62 | | | | | (0.02 | ) | | | | (0.18 | ) | | | | (0.20 | ) | | | | (0.65 | ) | | | | 4.77 | | | | | (5.58 | ) | | | | 91,501 | | | | | 1.00 | | | | | 1.00 | | | | | (0.37 | ) | | | | 57 | |
Year ended 12/31/17 | | | | 4.89 | | | | | (0.02 | ) | | | | 1.10 | | | | | 1.08 | | | | | (0.35 | ) | | | | 5.62 | | | | | 22.49 | | | | | 109,197 | | | | | 1.00 | | | | | 1.00 | | | | | (0.34 | ) | | | | 46 | |
Year ended 12/31/16 | | | | 5.38 | | | | | (0.02 | ) | | | | 0.07 | | | | | 0.05 | | | | | (0.54 | ) | | | | 4.89 | | | | | 0.76 | | | | | 97,444 | | | | | 1.03 | | | | | 1.03 | | | | | (0.39 | ) | | | | 60 | |
Year ended 12/31/15 | | | | 5.78 | | | | | (0.02 | ) | | | | 0.08 | | | | | 0.06 | | | | | (0.46 | ) | | | | 5.38 | | | | | 1.21 | | | | | 103,632 | | | | | 1.07 | | | | | 1.07 | | | | | (0.33 | ) | | | | 62 | |
Series II | | | | | | | | | | | | | | | | | | | | | | | | | | | | | | | | | | | | | | | | | | | | | | | | | | | | | | | | | | | | |
Year ended 12/31/19 | | | | 4.67 | | | | | (0.02 | ) | | | | 1.55 | | | | | 1.53 | | | | | (0.89 | ) | | | | 5.31 | | | | | 34.00 | | | | | 118,466 | | | | | 1.22 | (d) | | | | 1.22 | (d) | | | | (0.37 | )(d) | | | | 122 | |
Year ended 12/31/18 | | | | 5.53 | | | | | (0.03 | ) | | | | (0.18 | ) | | | | (0.21 | ) | | | | (0.65 | ) | | | | 4.67 | | | | | (5.87 | ) | | | | 91,795 | | | | | 1.25 | | | | | 1.25 | | | | | (0.62 | ) | | | | 57 | |
Year ended 12/31/17 | | | | 4.83 | | | | | (0.03 | ) | | | | 1.08 | | | | | 1.05 | | | | | (0.35 | ) | | | | 5.53 | | | | | 22.14 | | | | | 122,447 | | | | | 1.25 | | | | | 1.25 | | | | | (0.59 | ) | | | | 46 | |
Year ended 12/31/16 | | | | 5.33 | | | | | (0.03 | ) | | | | 0.07 | | | | | 0.04 | | | | | (0.54 | ) | | | | 4.83 | | | | | 0.57 | | | | | 114,282 | | | | | 1.28 | | | | | 1.28 | | | | | (0.64 | ) | | | | 60 | |
Year ended 12/31/15 | | | | 5.74 | | | | | (0.03 | ) | | | | 0.08 | | | | | 0.05 | | | | | (0.46 | ) | | | | 5.33 | | | | | 1.04 | | | | | 158,684 | | | | | 1.32 | | | | | 1.32 | | | | | (0.58 | ) | | | | 62 | |
| (a) | Calculated using average shares outstanding. |
| (b) | Includes adjustments in accordance with accounting principles generally accepted in the United States of America and as such, the net asset value for financial reporting purposes and the returns based upon those net asset values may differ from the net asset value and returns for shareholder transactions. Total returns are not annualized for periods less than one year, if applicable, and do not reflect charges assessed in connection with a variable product, which if included would reduce total returns. |
| (c) | Portfolio turnover is calculated at the fund level and is not annualized for periods less than one year, if applicable. |
| (d) | Ratios are based on average daily net assets (000’s omitted) of $104,733 and $113,126 for Series I and Series II shares, respectively. |
See accompanying Notes to Financial Statements which are an integral part of the financial statements.
Invesco V.I. Mid Cap Growth Fund
Notes to Financial Statements
December 31, 2019
NOTE 1–Significant Accounting Policies
Invesco V.I. Mid Cap Growth Fund (the “Fund”) is a series portfolio of AIM Variable Insurance Funds (Invesco Variable Insurance Funds) (the “Trust”). The Trust is a Delaware statutory trust registered under the Investment Company Act of 1940, as amended (the “1940 Act”), as anopen-end series management investment company. Information presented in these financial statements pertains only to the Fund. Matters affecting the Fund or each class will be voted on exclusively by the shareholders of the Fund or each class. Current Securities and Exchange Commission (“SEC”) guidance, however, requires participating insurance companies offering separate accounts to vote shares proportionally in accordance with the instructions of the contract owners whose investments are funded by shares of each Fund or class.
The Fund’s investment objective is to seek capital growth.
The Fund currently offers two classes of shares, Series I and Series II, both of which are offered to insurance company separate accounts funding variable annuity contracts and variable life insurance policies (“variable products”).
The Fund is an investment company and accordingly follows the investment company accounting and reporting guidance in accordance with Financial Accounting Standards Board Accounting Standards Codification Topic 946,Financial Services – Investment Companies.
The following is a summary of the significant accounting policies followed by the Fund in the preparation of its financial statements.
| A. | Security Valuations– Securities, including restricted securities, are valued according to the following policy. |
A security listed or traded on an exchange (except convertible securities) is valued at its last sales price or official closing price as of the close of the customary trading session on the exchange where the security is principally traded, or lacking any sales or official closing price on a particular day, the security may be valued at the closing bid price on that day. Securities traded in theover-the-counter market are valued based on prices furnished by independent pricing services or market makers. When such securities are valued by an independent pricing service they may be considered fair valued. Futures contracts are valued at the final settlement price set by an exchange on which they are principally traded. Listed options are valued at the mean between the last bid and asked prices from the exchange on which they are principally traded. Options not listed on an exchange are valued by an independent source at the mean between the last bid and asked prices. For purposes of determining net asset value (“NAV”) per share, futures and option contracts generally are valued 15 minutes after the close of the customary trading session of the New York Stock Exchange (“NYSE”).
Investments inopen-end andclosed-end registered investment companies that do not trade on an exchange are valued at theend-of-day net asset value per share. Investments inopen-end andclosed-end registered investment companies that trade on an exchange are valued at the last sales price or official closing price as of the close of the customary trading session on the exchange where the security is principally traded.
Debt obligations (including convertible securities) and unlisted equities are fair valued using an evaluated quote provided by an independent pricing service. Evaluated quotes provided by the pricing service may be determined without exclusive reliance on quoted prices, and may reflect appropriate factors such asinstitution-size trading in similar groups of securities, developments related to specific securities, dividend rate (for unlisted equities), yield (for debt obligations), quality, type of issue, coupon rate (for debt obligations), maturity (for debt obligations), individual trading characteristics and other market data. Pricing services generally value debt obligations assuming orderly transactions of institutional round lot size, but a fund may hold or transact in the same securities in smaller, odd lot sizes. Odd lots often trade at lower prices than institutional round lots. Debt obligations are subject to interest rate and credit risks. In addition, all debt obligations involve some risk of default with respect to interest and/or principal payments.
Foreign securities’ (including foreign exchange contracts) prices are converted into U.S. dollar amounts using the applicable exchange rates as of the close of the NYSE. If market quotations are available and reliable for foreign exchange-traded equity securities, the securities will be valued at the market quotations. Because trading hours for certain foreign securities end before the close of the NYSE, closing market quotations may become unreliable. If between the time trading ends on a particular security and the close of the customary trading session on the NYSE, events occur that the investment adviser determines are significant and make the closing price unreliable, the Fund may fair value the security. If the event is likely to have affected the closing price of the security, the security will be valued at fair value in good faith using procedures approved by the Board of Trustees. Adjustments to closing prices to reflect fair value may also be based on a screening process of an independent pricing service to indicate the degree of certainty, based on historical data, that the closing price in the principal market where a foreign security trades is not the current value as of the close of the NYSE. Foreign securities’ prices meeting the approved degree of certainty that the price is not reflective of current value will be priced at the indication of fair value from the independent pricing service. Multiple factors may be considered by the independent pricing service in determining adjustments to reflect fair value and may include information relating to sector indices, American Depositary Receipts and domestic and foreign index futures. Foreign securities may have additional risks including exchange rate changes, potential for sharply devalued currencies and high inflation, political and economic upheaval, the relative lack of issuer information, relatively low market liquidity and the potential lack of strict financial and accounting controls and standards.
Securities for which market prices are not provided by any of the above methods may be valued based upon quotes furnished by independent sources. The last bid price may be used to value equity securities. The mean between the last bid and asked prices is used to value debt obligations, including corporate loans.
Securities for which market quotations are not readily available or became unreliable are valued at fair value as determined in good faith by or under the supervision of the Trust’s officers following procedures approved by the Board of Trustees. Issuer specific events, market trends, bid/asked quotes of brokers and information providers and other market data may be reviewed in the course of making a good faith determination of a security’s fair value.
The Fund may invest in securities that are subject to interest rate risk, meaning the risk that the prices will generally fall as interest rates rise and, conversely, the prices will generally rise as interest rates fall. Specific securities differ in their sensitivity to changes in interest rates depending on their individual characteristics. Changes in interest rates may result in increased market volatility, which may affect the value and/or liquidity of certain Fund investments.
Invesco V.I. Mid Cap Growth Fund
Valuations change in response to many factors including the historical and prospective earnings of the issuer, the value of the issuer’s assets, general economic conditions, interest rates, investor perceptions and market liquidity. Because of the inherent uncertainties of valuation, the values reflected in the financial statements may materially differ from the value received upon actual sale of those investments.
| B. | Securities Transactions and Investment Income– Securities transactions are accounted for on a trade date basis. Realized gains or losses on sales are computed on the basis of specific identification of the securities sold. Interest income (net of withholding tax, if any) is recorded on the accrual basis from settlement date. Dividend income (net of withholding tax, if any) is recorded on theex-dividend date. |
The Fund may periodically participate in litigation related to Fund investments. As such, the Fund may receive proceeds from litigation settlements. Any proceeds received are included in the Statement of Operations as realized gain (loss) for investments no longer held and as unrealized gain (loss) for investments still held.
Brokerage commissions and mark ups are considered transaction costs and are recorded as an increase to the cost basis of securities purchased and/or a reduction of proceeds on a sale of securities. Such transaction costs are included in the determination of net realized and unrealized gain (loss) from investment securities reported in the Statement of Operations and the Statement of Changes in Net Assets and the net realized and unrealized gains (losses) on securities per share in the Financial Highlights. Transaction costs are included in the calculation of the Fund’s net asset value and, accordingly, they reduce the Fund’s total returns. These transaction costs are not considered operating expenses and are not reflected in net investment income reported in the Statement of Operations and the Statement of Changes in Net Assets, or the net investment income per share and the ratios of expenses and net investment income reported in the Financial Highlights, nor are they limited by any expense limitation arrangements between the Fund and the investment adviser.
The Fund allocates income and realized and unrealized capital gains and losses to a class based on the relative net assets of each class.
| C. | Country Determination – For the purposes of making investment selection decisions and presentation in the Schedule of Investments, the investment adviser may determine the country in which an issuer is located and/or credit risk exposure based on various factors. These factors include the laws of the country under which the issuer is organized, where the issuer maintains a principal office, the country in which the issuer derives 50% or more of its total revenues and the country that has the primary market for the issuer’s securities, as well as other criteria. Among the other criteria that may be evaluated for making this determination are the country in which the issuer maintains 50% or more of its assets, the type of security, financial guarantees and enhancements, the nature of the collateral and the sponsor organization. Country of issuer and/or credit risk exposure has been determined to be the United States of America, unless otherwise noted. |
| D. | Distributions– Distributions from net investment income and net realized capital gain, if any, are generally declared and paid to separate accounts of participating insurance companies annually and recorded on theex-dividend date. |
| E. | Federal Income Taxes –The Fund intends to comply with the requirements of Subchapter M of the Internal Revenue Code of 1986, as amended (the “Internal Revenue Code”), necessary to qualify as a regulated investment company and to distribute substantially all of the Fund’s taxable earnings to shareholders. As such, the Fund will not be subject to federal income taxes on otherwise taxable income (including net realized capital gain) that is distributed to shareholders. Therefore, no provision for federal income taxes is recorded in the financial statements. |
The Fund recognizes the tax benefits of uncertain tax positions only when the position is more likely than not to be sustained. Management has analyzed the Fund’s uncertain tax positions and concluded that no liability for unrecognized tax benefits should be recorded related to uncertain tax positions. Management is not aware of any tax positions for which it is reasonably possible that the total amounts of unrecognized tax benefits will change materially in the next 12 months.
The Fund files tax returns in the U.S. Federal jurisdiction and certain other jurisdictions. Generally, the Fund is subject to examinations by such taxing authorities for up to three years after the filing of the return for the tax period.
| F. | Expenses– Fees provided for under the Rule12b-1 plan of a particular class of the Fund and which are directly attributable to that class are charged to the operations of such class. All other expenses are allocated among the classes based on relative net assets. |
| G. | Accounting Estimates –The preparation of financial statements in conformity with accounting principles generally accepted in the United States of America (“GAAP”) requires management to make estimates and assumptions that affect the reported amounts of assets and liabilities at the date of the financial statements and the reported amounts of revenues and expenses during the reporting period including estimates and assumptions related to taxation. Actual results could differ from those estimates by a significant amount. In addition, the Fund monitors for material events or transactions that may occur or become known after theperiod-end date and before the date the financial statements are released to print. |
| H. | Indemnifications– Under the Trust’s organizational documents, each Trustee, officer, employee or other agent of the Trust is indemnified against certain liabilities that may arise out of the performance of their duties to the Fund. Additionally, in the normal course of business, the Fund enters into contracts, including the Fund’s servicing agreements, that contain a variety of indemnification clauses. The Fund’s maximum exposure under these arrangements is unknown as this would involve future claims that may be made against the Fund that have not yet occurred. The risk of material loss as a result of such indemnification claims is considered remote. |
| I. | Securities Lending– The Fund may lend portfolio securities having a market value up toone-third of the Fund’s total assets. Such loans are secured by collateral equal to no less than the market value of the loaned securities determined daily by the securities lending provider. Such collateral will be cash or debt securities issued or guaranteed by the U.S. Government or any of its sponsored agencies. Cash collateral received in connection with these loans is invested in short-term money market instruments or affiliated money market funds and is shown as such on the Schedule of Investments. The Fund bears the risk of loss with respect to the investment of collateral. It is the Fund’s policy to obtain additional collateral from or return excess collateral to the borrower by the end of the next business day, following the valuation date of the securities loaned. Therefore, the value of the collateral held may be temporarily less than the value of the securities on loan. When loaning securities, the Fund retains certain benefits of owning the securities, including the economic equivalent of dividends or interest generated by the security. Lending securities entails a risk of loss to the Fund if, and to the extent that, the market value of the securities loaned were to increase and the borrower did not increase the collateral accordingly, and the borrower failed to return the securities. The securities loaned are subject to termination at the option of the borrower or the Fund. Upon termination, the borrower will return to the Fund the securities loaned and the Fund will return the collateral. Upon the failure of the borrower to return the securities, collateral may be liquidated and the securities may be purchased on the open market to replace the loaned securities. The Fund could experience delays and costs in gaining access to the collateral and the securities may lose value during the delay which could result in potential losses to the Fund. Some of these losses may be indemnified by the lending agent. The Fund bears the risk of any deficiency in the amount of the collateral available for return to the borrower due to any loss on the |
Invesco V.I. Mid Cap Growth Fund
collateral invested. Dividends received on cash collateral investments for securities lending transactions, which are net of compensation to counterparties, are included inDividends from affiliated money market funds on the Statement of Operations. The aggregate value of securities out on loan, if any, is shown as a footnote on the Statement of Assets and Liabilities.
| J. | Foreign Currency Translations– Foreign currency is valued at the close of the NYSE based on quotations posted by banks and major currency dealers. Portfolio securities and other assets and liabilities denominated in foreign currencies are translated into U.S. dollar amounts at the date of valuation. Purchases and sales of portfolio securities (net of foreign taxes withheld on disposition) and income items denominated in foreign currencies are translated into U.S. dollar amounts on the respective dates of such transactions. The Fund does not separately account for the portion of the results of operations resulting from changes in foreign exchange rates on investments and the fluctuations arising from changes in market prices of securities held. The combined results of changes in foreign exchange rates and the fluctuation of market prices on investments (net of estimated foreign tax withholding) are included with the net realized and unrealized gain or loss from investments in the Statement of Operations. Reported net realized foreign currency gains or losses arise from (1) sales of foreign currencies, (2) currency gains or losses realized between the trade and settlement dates on securities transactions, and (3) the difference between the amounts of dividends, interest, and foreign withholding taxes recorded on the Fund’s books and the U.S. dollar equivalent of the amounts actually received or paid. Net unrealized foreign currency gains and losses arise from changes in the fair values of assets and liabilities, other than investments in securities at fiscal period end, resulting from changes in exchange rates. |
The Fund may invest in foreign securities, which may be subject to foreign taxes on income, gains on investments or currency repatriation, a portion of which may be recoverable. Foreign taxes, if any, are recorded based on the tax regulations and rates that exist in the foreign markets in which the Fund invests and are shown in the Statement of Operations.
| K. | Forward Foreign Currency Contracts– The Fund may engage in foreign currency transactions either on a spot (i.e. for prompt delivery and settlement) basis, or through forward foreign currency contracts, to manage or minimize currency or exchange rate risk. |
The Fund may also enter into forward foreign currency contracts for the purchase or sale of a security denominated in a foreign currency in order to “lock in” the U.S. dollar price of that security, or the Fund may also enter into forward foreign currency contracts that do not provide for physical settlement of the two currencies, but instead are settled by a single cash payment calculated as the difference between the agreed upon exchange rate and the spot rate at settlement based upon an agreed upon notional amount(non-deliverable forwards). The Fund will set aside liquid assets in an amount equal to the dailymark-to-market obligation for forward foreign currency contracts.
A forward foreign currency contract is an obligation between two parties (“Counterparties”) to purchase or sell a specific currency for an agreed-upon price at a future date. The use of forward foreign currency contracts does not eliminate fluctuations in the price of the underlying securities the Fund owns or intends to acquire but establishes a rate of exchange in advance. Fluctuations in the value of these contracts are measured by the difference in the contract date and reporting date exchange rates and are recorded as unrealized appreciation (depreciation) until the contracts are closed. When the contracts are closed, realized gains (losses) are recorded. Realized and unrealized gains (losses) on the contracts are included in the Statement of Operations. The primary risks associated with forward foreign currency contracts include failure of the Counterparty to meet the terms of the contract and the value of the foreign currency changing unfavorably. These risks may be in excess of the amounts reflected in the Statement of Assets and Liabilities.
| L. | Other Risks– Active trading of portfolio securities may result in added expenses, a lower return and increased tax liability. |
NOTE 2–Advisory Fees and Other Fees Paid to Affiliates
The Trust has entered into a master investment advisory agreement with Invesco Advisers, Inc. (the “Adviser” or “Invesco”). Under the terms of the investment advisory agreement, the Fund accrues daily and pays monthly an advisory fee to the Adviser based on the annual rate of the Fund’s average daily net assets as follows:
| | | | |
| Average Daily Net Assets | | Rate | |
| |
First $ 500 million | | | 0.750% | |
| |
Next $500 million | | | 0.700% | |
| |
Over $1 billion | | | 0.650% | |
| |
For the year ended December 31, 2019, the effective advisory fee rate incurred by the Fund was 0.75%.
Under the terms of a mastersub-advisory agreement between the Adviser and each of Invesco Asset Management Deutschland GmbH, Invesco Asset Management Limited, Invesco Asset Management (Japan) Limited, Invesco Hong Kong Limited, Invesco Senior Secured Management, Inc. and Invesco Canada Ltd. and separatesub-advisory agreements with Invesco Capital Management LLC and Invesco Asset Management (India) Private Limited (collectively, the “AffiliatedSub-Advisers”) the Adviser, not the Fund, will pay 40% of the fees paid to the Adviser to any such AffiliatedSub-Adviser(s) that provide(s) discretionary investment management services to the Fund based on the percentage of assets allocated to such AffiliatedSub-Adviser(s).
The Adviser has contractually agreed, through at least June 30, 2020, to waive advisory fees and/or reimburse expenses of all shares to the extent necessary to limit total annual fund operating expenses after fee waiver and/or expense reimbursement (excluding certain items discussed below) of Series I shares to 2.00% and Series II shares to 2.25% of average daily net assets (the “expense limits”). In determining the Adviser’s obligation to waive advisory fees and/or reimburse expenses, the following expenses are not taken into account, and could cause the total annual fund operating expenses after fee waiver and/or expense reimbursement to exceed the numbers reflected above: (1) interest; (2) taxes; (3) dividend expense on short sales; (4) extraordinary ornon-routine items, including litigation expenses; and (5) expenses that the Fund has incurred but did not actually pay because of an expense offset arrangement. Unless Invesco continues the fee waiver agreement, it will terminate on June 30, 2020. During its term, the fee waiver agreement cannot be terminated or amended to increase the expense limits or reduce the advisory fee waiver without approval of the Board of Trustees. The Adviser did not waive fees and/or reimburse expenses during the period under these expense limits.
Further, the Adviser has contractually agreed, through at least June 30, 2021, to waive the advisory fee payable by the Fund in an amount equal to 100% of the net advisory fees the Adviser receives from the affiliated money market funds on investments by the Fund of uninvested cash (excluding investments of cash collateral from securities lending) in such affiliated money market funds.
For the year ended December 31, 2019, the Adviser waived advisory fees of $3,191.
Invesco V.I. Mid Cap Growth Fund
The Trust has entered into a master administrative services agreement with Invesco pursuant to which the Fund has agreed to pay Invesco a fee for costs incurred in providing accounting services and fund administrative services to the Fund and to reimburse Invesco for fees paid to insurance companies that have agreed to provide certain administrative services to the Fund. These administrative services provided by the insurance companies may include, among other things: maintenance of master accounts with the Fund; tracking, recording and transmitting net purchase and redemption orders for Fund shares; maintaining and preserving records related to the purchase, redemption and other account activity of variable product owners; distributing copies of Fund documents such as prospectuses, proxy materials and periodic reports, to variable product owners, and responding to inquiries from variable product owners about the Fund. Pursuant to such agreement, for the year ended December 31, 2019, Invesco was paid $30,911 for accounting and fund administrative services and was reimbursed $324,149 for fees paid to insurance companies. Invesco has entered into asub-administration agreement whereby State Street Bank and Trust Company (“SSB”) serves as fund accountant and provides certain administrative services to the Fund. Pursuant to a custody agreement with the Trust on behalf of the Fund, SSB also serves as the Fund’s custodian.
The Trust has entered into a transfer agency and service agreement with Invesco Investment Services, Inc. (“IIS”) pursuant to which the Fund has agreed to pay IIS a fee for providing transfer agency and shareholder services to the Fund and reimburse IIS for certain expenses incurred by IIS in the course of providing such services. For the year ended December 31, 2019, expenses incurred under the agreement are shown in the Statement of Operations asTransfer agent fees.
The Trust has entered into a master distribution agreement with Invesco Distributors, Inc. (“IDI”) to serve as the distributor for the Fund. The Trust has adopted a plan pursuant to Rule12b-1 under the 1940 Act with respect to the Fund’s Series II shares (the “Plan”). The Fund, pursuant to the Plan, pays IDI compensation at the annual rate of 0.25% of the Fund’s average daily net assets of Series II shares. The fees are accrued daily and paid monthly. Of the Plan payments, up to 0.25% of the average daily net assets of the Series II shares may be paid to insurance companies who furnish continuing personal shareholder services to customers who purchase and own Series II shares of the Fund. For the year ended December 31, 2019, expenses incurred under the Plan are detailed in the Statement of Operations asDistribution fees.
For the year ended December 31, 2019, the Fund incurred $1,165 in brokerage commissions with Invesco Capital Markets, Inc., an affiliate of the Adviser and IDI, for portfolio transactions executed on behalf of the Fund.
Certain officers and trustees of the Trust are officers and directors of the Adviser, IIS and/or IDI.
NOTE 3–Additional Valuation Information
GAAP defines fair value as the price that would be received to sell an asset or paid to transfer a liability in an orderly transaction between market participants at the measurement date, under current market conditions. GAAP establishes a hierarchy that prioritizes the inputs to valuation methods, giving the highest priority to readily available unadjusted quoted prices in an active market for identical assets (Level 1) and the lowest priority to significant unobservable inputs (Level 3), generally when market prices are not readily available or are unreliable. Based on the valuation inputs, the securities or other investments are tiered into one of three levels. Changes in valuation methods may result in transfers in or out of an investment’s assigned level:
| | Level 1 - | Prices are determined using quoted prices in an active market for identical assets. |
| | Level 2 - | Prices are determined using other significant observable inputs. Observable inputs are inputs that other market participants may use in pricing a security. These may include quoted prices for similar securities, interest rates, prepayment speeds, credit risk, yield curves, loss severities, default rates, discount rates, volatilities and others. |
| | Level 3 - | Prices are determined using significant unobservable inputs. In situations where quoted prices or observable inputs are unavailable (for example, when there is little or no market activity for an investment at the end of the period), unobservable inputs may be used. Unobservable inputs reflect the Fund’s own assumptions about the factors market participants would use in determining fair value of the securities or instruments and would be based on the best available information. |
The following is a summary of the tiered valuation input levels, as of December 31, 2019. The level assigned to the securities valuations may not be an indication of the risk or liquidity associated with investing in those securities. Because of the inherent uncertainties of valuation, the values reflected in the financial statements may materially differ from the value received upon actual sale of those investments.
| | | | | | | | | | | | | | | | |
| | | Level 1 | | | Level 2 | | | Level 3 | | | Total | |
| |
Investments in Securities | | | | | | | | | | | | | | | | |
| |
Common Stocks & Other Equity Interests | | | $223,784,753 | | | | $- | | | | $- | | | | $223,784,753 | |
| |
Money Market Funds | | | 1,645,393 | | | | - | | | | - | | | | 1,645,393 | |
| |
Total Investments | | | $225,430,146 | | | | $- | | | | $- | | | | $225,430,146 | |
| |
NOTE 4–Security Transactions with Affiliated Funds
The Fund is permitted to purchase or sell securities from or to certain other Invesco Funds under specified conditions outlined in procedures adopted by the Board of Trustees of the Trust. The procedures have been designed to ensure that any purchase or sale of securities by the Fund from or to another fund or portfolio that is or could be considered an affiliate by virtue of having a common investment adviser (or affiliated investment advisers), common Trustees and/or common officers complies with Rule17a-7 of the 1940 Act. Further, as defined under the procedures, each transaction is effected at the current market price. Pursuant to these procedures, for the year ended December 31, 2019, the Fund engaged in securities purchases of $7,395,590 and securities sales of $2,999,451, which resulted in net realized gains of $605,290.
NOTE 5–Trustees’ and Officers’ Fees and Benefits
Trustees’ and Officers’ Fees and Benefits include amounts accrued by the Fund to pay remuneration to certain Trustees and Officers of the Fund. Trustees have the option to defer compensation payable by the Fund, andTrustees’ and Officers’Fees and Benefits also include amounts accrued by the Fund to fund such deferred compensation amounts. Those Trustees who defer compensation have the option to select various Invesco Funds in which their deferral accounts shall be deemed to be invested. Finally, certain current Trustees were eligible to participate in a retirement plan that provided for benefits to be paid upon retirement to Trustees over a period of time based on the number of years of service. The Fund may have certain former
Invesco V.I. Mid Cap Growth Fund
Trustees who also participate in a retirement plan and receive benefits under such plan.Trustees’ and Officers’ Fees and Benefits include amounts accrued by the Fund to fund such retirement benefits. Obligations under the deferred compensation and retirement plans represent unsecured claims against the general assets of the Fund.
NOTE 6–Cash Balances
The Fund is permitted to temporarily carry a negative or overdrawn balance in its account with SSB, the custodian bank. Such balances, if any atperiod-end, are shown in the Statement of Assets and Liabilities under the payable caption Amount due custodian. To compensate the custodian bank for such overdrafts, the overdrawn Fund may either (1) leave funds as a compensating balance in the account so the custodian bank can be compensated by earning the additional interest; or (2) compensate by paying the custodian bank at a rate agreed upon by the custodian bank and Invesco, not to exceed the contractually agreed upon rate.
NOTE 7–Distributions to Shareholders and Tax Components of Net Assets
Tax Character of Distributions to Shareholders Paid During the Fiscal Years Ended December 31, 2019 and 2018:
| | | | | | | | |
| | | 2019 | | | 2018 | |
| |
Long-term capital gain | | $ | 32,435,877 | | | $ | 24,553,217 | |
| |
Tax Components of Net Assets atPeriod-End:
| | | | |
| | | 2019 | |
| |
Undistributed long-term capital gain | | $ | 45,482,421 | |
| |
Net unrealized appreciation – investments | | | 35,471,980 | |
| |
Temporary book/tax differences | | | (103,124 | ) |
| |
Shares of beneficial interest | | | 144,575,847 | |
| |
Total net assets | | $ | 225,427,124 | |
| |
The difference between book-basis andtax-basis unrealized appreciation (depreciation) is due to differences in the timing of recognition of gains and losses on investments for tax and book purposes. The Fund’s net unrealized appreciation difference is attributable primarily to wash sales.
The temporary book/tax differences are a result of timing differences between book and tax recognition of income and/or expenses. The Fund’s temporary book/tax differences are the result of the trustee deferral of compensation and retirement plan benefits.
Capital loss carryforward is calculated and reported as of a specific date. Results of transactions and other activity after that date may affect the amount of capital loss carryforward actually available for the Fund to utilize. Capital losses generated in years beginning after December 22, 2010 can be carried forward for an unlimited period, whereas previous losses expire in eight tax years. Capital losses with an expiration period may not be used to offset capital gains until all net capital losses without an expiration date have been utilized. Capital loss carryforwards with no expiration date will retain their character as either short-term or long-term capital losses instead of as short-term capital losses as under prior law. The ability to utilize capital loss carryforwards in the future may be limited under the Internal Revenue Code and related regulations based on the results of future transactions.
The Fund does not have a capital loss carryforward as of December 31, 2019.
NOTE 8–Investment Transactions
The aggregate amount of investment securities (other than short-term securities, U.S. Treasury obligations and money market funds, if any) purchased and sold by the Fund during the year ended December 31, 2019 was $261,472,493 and $281,691,510, respectively. Cost of investments, including any derivatives, on a tax basis includes the adjustments for financial reporting purposes as of the most recently completed federal income tax reportingperiod-end.
Unrealized Appreciation (Depreciation) of Investments on a Tax Basis
| | | | |
| |
Aggregate unrealized appreciation of investments | | $ | 37,401,580 | |
| |
Aggregate unrealized (depreciation) of investments | | | (1,929,600 | ) |
| |
Net unrealized appreciation of investments | | $ | 35,471,980 | |
| |
Cost of investments for tax purposes is $189,958,166.
NOTE 9–Reclassification of Permanent Differences
Primarily as a result of differing book/tax treatment of net operating losses, on December 31, 2019, undistributed net investment income (loss) was increased by $554,035, undistributed net realized gain was increased by $556 and shares of beneficial interest was decreased by $554,591. This reclassification had no effect on the net assets of the Fund.
Invesco V.I. Mid Cap Growth Fund
NOTE 10–Share Information
| | | | | | | | | | | | | | | | |
| | | Summary of Share Activity | |
| |
| | | Year ended | | | Year ended | |
| | | December 31, 2019(a) | | | December 31, 2018 | |
| | | | | | | | |
| | | Shares | | | Amount | | | Shares | | | Amount | |
| |
Sold: | | | | | | | | | | | | | | | | |
| | | | |
Series I | | | 1,676,924 | | | $ | 9,326,165 | | | | 1,634,000 | | | $ | 9,588,108 | |
| |
Series II | | | 3,129,705 | | | | 16,917,490 | | | | 1,697,932 | | | | 9,678,387 | |
| |
| | | | |
Issued as reinvestment of dividends: | | | | | | | | | | | | | | | | |
| | | | |
Series I | | | 3,005,428 | | | | 15,327,683 | | | | 2,026,091 | | | | 11,710,806 | |
| |
Series II | | | 3,449,233 | | | | 17,108,194 | | | | 2,264,976 | | | | 12,842,411 | |
| |
| | | | |
Reacquired: | | | | | | | | | | | | | | | | |
| | | | |
Series I | | | (4,258,394 | ) | | | (23,792,848 | ) | | | (3,918,877 | ) | | | (22,593,402 | ) |
| |
Series II | | | (3,908,716 | ) | | | (21,521,089 | ) | | | (6,472,581 | ) | | | (35,700,897 | ) |
| |
Net increase (decrease) in share activity | | | 3,094,180 | | | $ | 13,365,595 | | | | (2,768,459 | ) | | $ | (14,474,587 | ) |
| |
| (a) | There are entities that are record owners of more than 5% of the outstanding shares of the Fund and in the aggregate own 55% of the outstanding shares of the Fund. The Fund and the Fund’s principal underwriter or adviser, are parties to participation agreements with these entities whereby these entities sell units of interest in separate accounts funding variable products that are invested in the Fund. The Fund, Invesco and/or Invesco affiliates may make payments to these entities, which are considered to be related to the Fund, for providing services to the Fund, Invesco and/or Invesco affiliates including but not limited to services such as, securities brokerage, third party record keeping and account servicing and administrative services. The Fund has no knowledge as to whether all or any portion of the shares owned of record by these entities are also owned beneficially. |
NOTE 11–Significant Event
The Board of Trustees of the Fund unanimously approved an Agreement and Plan of Reorganization (the “Agreement”) pursuant to which the Fund would transfer all of its assets and liabilities to Invesco Oppenheimer V.I. Discovery Mid Cap Growth Fund (the “Acquiring Fund”).
The Agreement requires approval of the Fund’s shareholders and will be submitted to the shareholders for their consideration at a meeting to be held in or around April 2020. The reorganization is expected to be consummated shortly thereafter. Upon closing of the reorganization, shareholders of the Fund will receive shares of the Acquiring Fund in exchange for their shares of the Fund, and the Fund will liquidate and cease operations.
Invesco V.I. Mid Cap Growth Fund
Report of Independent Registered Public Accounting Firm
To the Board of Trustees of AIM Variable Insurance Funds (Invesco Variable Insurance Funds) and Shareholders of Invesco V.I. Mid Cap Growth Fund
Opinion on the Financial Statements
We have audited the accompanying statement of assets and liabilities, including the schedule of investments, of Invesco V.I. Mid Cap Growth Fund (one of the funds constituting AIM Variable Insurance Funds (Invesco Variable Insurance Funds), referred to hereafter as the “Fund”) as of December 31, 2019, the related statement of operations for the year ended December 31, 2019, the statement of changes in net assets for each of the two years in the period ended December 31, 2019, including the related notes, and the financial highlights for each of the five years in the period ended December 31, 2019 (collectively referred to as the “financial statements”). In our opinion, the financial statements present fairly, in all material respects, the financial position of the Fund as of December 31, 2019, the results of its operations for the year then ended, the changes in its net assets for each of the two years in the period ended December 31, 2019 and the financial highlights for each of the five years in the period ended December 31, 2019 in conformity with accounting principles generally accepted in the United States of America.
Basis for Opinion
These financial statements are the responsibility of the Fund’s management. Our responsibility is to express an opinion on the Fund’s financial statements based on our audits. We are a public accounting firm registered with the Public Company Accounting Oversight Board (United States) (PCAOB) and are required to be independent with respect to the Fund in accordance with the U.S. federal securities laws and the applicable rules and regulations of the Securities and Exchange Commission and the PCAOB.
We conducted our audits of these financial statements in accordance with the standards of the PCAOB. Those standards require that we plan and perform the audit to obtain reasonable assurance about whether the financial statements are free of material misstatement, whether due to error or fraud.
Our audits included performing procedures to assess the risks of material misstatement of the financial statements, whether due to error or fraud, and performing procedures that respond to those risks. Such procedures included examining, on a test basis, evidence regarding the amounts and disclosures in the financial statements. Our audits also included evaluating the accounting principles used and significant estimates made by management, as well as evaluating the overall presentation of the financial statements. Our procedures included confirmation of securities owned as of December 31, 2019 by correspondence with the custodian, transfer agent and brokers; when replies were not received from brokers, we performed other auditing procedures. We believe that our audits provide a reasonable basis for our opinion.
/s/PricewaterhouseCoopers LLP
Houston, Texas
February 18, 2020
We have served as the auditor of one or more of the investment companies in the Invesco group of investment companies since at least 1995. We have not been able to determine the specific year we began serving as auditor.
Invesco V.I. Mid Cap Growth Fund
Calculating your ongoing Fund expenses
Example
As a shareholder of the Fund, you incur ongoing costs, including management fees; distribution and/or service fees(12b-1); and other Fund expenses. This example is intended to help you understand your ongoing costs (in dollars) of investing in the Fund and to compare these costs with ongoing costs of investing in other mutual funds. The example is based on an investment of $1,000 invested at the beginning of the period and held for the entire period July 1, 2019 through December 31, 2019.
The actual and hypothetical expenses in the examples below do not represent the effect of any fees or other expenses assessed in connection with a variable product; if they did, the expenses shown would be higher while the ending account values shown would be lower.
Actual expenses
The table below provides information about actual account values and actual expenses. You may use the information in this table, together with the amount you invested, to estimate the expenses that you paid over the period. Simply divide your account value by $1,000 (for example, an $8,600 account value divided by $1,000 = 8.6), then multiply the result by the number in the table under the heading entitled “Actual Expenses Paid During Period” to estimate the expenses you paid on your account during this period.
Hypothetical example for comparison purposes
The table below also provides information about hypothetical account values and hypothetical expenses based on the Fund’s actual expense ratio and an assumed rate of return of 5% per year before expenses, which is not the Fund’s actual return.
The hypothetical account values and expenses may not be used to estimate the actual ending account balance or expenses you paid for the period. You may use this information to compare the ongoing costs of investing in the Fund and other funds. To do so, compare this 5% hypothetical example with the 5% hypothetical examples that appear in the shareholder reports of the other funds.
Please note that the expenses shown in the table are meant to highlight your ongoing costs. Therefore, the hypothetical information is useful in comparing ongoing costs, and will not help you determine the relative total costs of owning different funds.
| | | | | | | | | | | | |
| | | Beginning
Account Value
(07/01/19) | | ACTUAL | | HYPOTHETICAL
(5% annual return before expenses) | | Annualized
Expense
Ratio |
| | Ending
Account Value
(12/31/19)1 | | Expenses
Paid During
Period2 | | Ending
Account Value
(12/31/19) | | Expenses
Paid During
Period2 |
Series I | | $1,000.00 | | $1,073.40 | | $5.07 | | $1,020.32 | | $4.94 | | 0.97% |
Series II | | 1,000.00 | | 1,071.60 | | 6.37 | | 1,019.06 | | 6.21 | | 1.22 |
| 1 | The actual ending account value is based on the actual total return of the Fund for the period July 1, 2019 through December 31, 2019, after actual expenses and will differ from the hypothetical ending account value which is based on the Fund’s expense ratio and a hypothetical annual return of 5% before expenses. |
| 2 | Expenses are equal to the Fund’s annualized expense ratio as indicated above multiplied by the average account value over the period, multiplied by 184/365 to reflect the most recent fiscal half year. |
Invesco V.I. Mid Cap Growth Fund
Tax Information
Form1099-DIV, Form1042-S and other year–end tax information provide shareholders with actual calendar year amounts that should be included in their tax returns. Shareholders should consult their tax advisers.
The following distribution information is being provided as required by the Internal Revenue Code or to meet a specific state’s requirement.
The Fund designates the following amounts or, if subsequently determined to be different, the maximum amount allowable for its fiscal year ended December 31, 2019:
| | | | | | | | |
| | Federal and State Income Tax | | | | | | |
| | Long-Term Capital Gain Distributions | | $ | 32,435,877 | | | |
| | Corporate Dividends Received Deduction* | | | 0.00 | % | | |
| | U.S. Treasury Obligations* | | | 0.00 | % | | |
* The above percentages are based on ordinary income dividends paid to shareholders during the Fund’s fiscal year.
Invesco V.I. Mid Cap Growth Fund
Trustees and Officers
The address of each trustee and officer is AIM Variable Insurance Funds (Invesco Variable Insurance Funds) (the “Trust”), 11 Greenway Plaza, Suite 1000, Houston, Texas 77046-1173. The trustees serve for the life of the Trust, subject to their earlier death, incapacitation, resignation, retirement or removal as more specifically provided in the Trust’s organizational documents. Each officer serves for a one year term or until their successors are elected and qualified. Column two below includes length of time served with predecessor entities, if any.
| | | | | | | | |
Name, Year of Birth and Position(s) Held with the Trust | | Trustee and/or Officer Since | | Principal Occupation(s) During Past 5 Years | | Number of
Funds in
Fund Complex
Overseen by
Trustee | | Other Directorship(s) Held by Trustee
During Past 5 Years |
| Interested Person |
Martin L. Flanagan1- 1960 Trustee and Vice Chair | | 2007 | | Executive Director, Chief Executive Officer and President, Invesco Ltd. (ultimate parent of Invesco and a global investment management firm); Trustee and Vice Chair, The Invesco Funds; Vice Chair, Investment Company Institute; and Member of Executive Board, SMU Cox School of Business Formerly: Advisor to the Board, Invesco Advisers, Inc. (formerly known as Invesco Institutional (N.A.), Inc.); Chairman and Chief Executive Officer, Invesco Advisers, Inc. (registered investment adviser); Director, Chairman, Chief Executive Officer and President, Invesco Holding Company (US), Inc. (formerly IVZ Inc.) (holding company), Invesco Group Services, Inc. (service provider) and Invesco North American Holdings, Inc. (holding company); Director, Chief Executive Officer and President, Invesco Holding Company Limited (parent of Invesco and a global investment management firm); Director, Invesco Ltd.; Chairman, Investment Company Institute and President,Co-Chief Executive Officer,Co-President, Chief Operating Officer and Chief Financial Officer, Franklin Resources, Inc. (global investment management organization) | | 229 | | None |
| 1 | Mr. Flanagan is considered an interested person (within the meaning of Section 2(a)(19) of the 1940 Act) of the Trust because he is an officer of the Adviser to the Trust, and an officer and a director of Invesco Ltd., ultimate parent of the Adviser. |
Invesco V.I. Mid Cap Growth Fund
Trustees and Officers–(continued)
| | | | | | | | |
Name, Year of Birth and Position(s) Held with the Trust | | Trustee and/or Officer Since | | Principal Occupation(s) During Past 5 Years | | Number of
Funds in
Fund Complex
Overseen by
Trustee | | Other Directorship(s) Held by Trustee
During Past 5 Years |
| Independent Trustees |
Bruce L. Crockett - 1944 Trustee and Chair | | 1993 | | Chairman, Crockett Technologies Associates (technology consulting company) Formerly: Director, Captaris (unified messaging provider); Director, President and Chief Executive Officer, COMSAT Corporation; Chairman, Board of Governors of INTELSAT (international communications company); ACE Limited (insurance company); Independent Directors Council and Investment Company Institute: Member of the Audit Committee, Investment Company Institute; Member of the Executive Committee and Chair of the Governance Committee, Independent Directors Council | | 229 | | Director and Chairman of the Audit Committee, ALPS (Attorneys Liability Protection Society) (insurance company); Director and Member of the Audit Committee and Compensation Committee, Ferroglobe PLC (metallurgical company) |
David C. Arch - 1945 Trustee | | 2010 | | Chairman of Blistex Inc. (consumer health care products manufacturer); Member, World Presidents’ Organization | | 229 | | Board member of the Illinois Manufacturers’ Association |
Beth Ann Brown - 1968 Trustee | | 2019 | | Independent Consultant Formerly: Head of Intermediary Distribution, Managing Director, Strategic Relations, Managing Director, Head of National Accounts, Senior Vice President, National Account Manager and Senior Vice President, Key Account Manager, Columbia Management Investment Advisers LLC; Vice President, Key Account Manager, Liberty Funds Distributor, Inc.; and Trustee of certain Oppenheimer Funds | | 229 | | Director, Board of Directors of Caron Engineering Inc.; Advisor, Board of Advisors of Caron Engineering Inc.; President and Director, Acton Shapleigh Youth Conservation Corps (non-profit); and Vice President and Director of Grahamtastic Connection (non-profit) |
Jack M. Fields - 1952 Trustee | | 1997 | | Chief Executive Officer, Twenty First Century Group, Inc. (government affairs company); and Chairman, Discovery Learning Alliance(non-profit) Formerly: Owner and Chief Executive Officer, Dos Angeles Ranch L.P. (cattle, hunting, corporate entertainment); Director, Insperity, Inc. (formerly known as Administaff) (human resources provider); Chief Executive Officer, Texana Timber LP (sustainable forestry company); Director of Cross Timbers Quail Research Ranch(non-profit); and member of the U.S. House of Representatives | | 229 | | None |
Invesco V.I. Mid Cap Growth Fund
Trustees and Officers–(continued)
| | | | | | | | |
Name, Year of Birth and Position(s) Held with the Trust | | Trustee and/or Officer Since | | Principal Occupation(s) During Past 5 Years | | Number of
Funds in
Fund Complex
Overseen by
Trustee | | Other Directorship(s) Held by Trustee
During Past 5 Years |
| Independent Trustees–(continued) |
Cynthia Hostetler -1962 Trustee | | 2017 | | Non-Executive Director and Trustee of a number of public and private business corporations Formerly: Director, Aberdeen Investment Funds (4 portfolios); Head of Investment Funds and Private Equity, Overseas Private Investment Corporation; President, First Manhattan Bancorporation, Inc.; Attorney, Simpson Thacher & Bartlett LLP | | 229 | | Vulcan Materials Company (construction materials company); Trilinc Global Impact Fund; Genesee & Wyoming, Inc. (railroads); Artio Global Investment LLC (mutual fund complex); Edgen Group, Inc. (specialized energy and infrastructure products distributor); Investment Company Institute (professional organization); Independent Directors Council (professional organization) |
Eli Jones - 1961 Trustee | | 2016 | | Professor and Dean, Mays Business School - Texas A&M University Formerly: Professor and Dean, Walton College of Business, University of Arkansas and E.J. Ourso College of Business, Louisiana State University; Director, Arvest Bank | | 229 | | Insperity, Inc. (formerly known as Administaff) (human resources provider) |
Elizabeth Krentzman - 1959 Trustee | | 2019 | | Formerly: Principal and Chief Regulatory Advisor for Asset Management Services and U.S. Mutual Fund Leader of Deloitte & Touche LLP; General Counsel of the Investment Company Institute (trade association); National Director of the Investment Management Regulatory Consulting Practice, Principal, Director and Senior Manager of Deloitte & Touche LLP; Assistant Director of the Division of Investment Management - Office of Disclosure and Investment Adviser Regulation of the U.S. Securities and Exchange Commission and various positions with the Division of Investment Management - Office of Regulatory Policy of the U.S. Securities and Exchange Commission; Associate at Ropes & Gray LLP; Advisory Board Member of the Securities and Exchange Commission Historical Society; and Trustee of certain Oppenheimer Funds | | 229 | | Trustee of the University of Florida National Board Foundation and Audit Committee Member; Member of the Cartica Funds Board of Directors (private investment funds); Member of the University of Florida Law Center Association, Inc. Board of Trustees and Audit Committee Member |
Anthony J. LaCava, Jr. - 1956 Trustee | | 2019 | | Formerly: Director and Member of the Audit Committee, Blue Hills Bank (publicly traded financial institution) and Managing Partner, KPMG LLP | | 229 | | Blue Hills Bank; Chairman, Bentley University; Member, Business School Advisory Council; and Nominating Committee KPMG LLP |
Prema Mathai-Davis - 1950 Trustee | | 1998 | | Retired Co-Owner & Partner of Quantalytics Research, LLC, (a FinTech Investment Research Platform for the Self-Directed Investor) | | 229 | | None |
Invesco V.I. Mid Cap Growth Fund
Trustees and Officers–(continued)
| | | | | | | | |
Name, Year of Birth and Position(s) Held with the Trust | | Trustee and/or Officer Since | | Principal Occupation(s) During Past 5 Years | | Number of
Funds in
Fund Complex
Overseen by
Trustee | | Other Directorship(s) Held by Trustee
During Past 5 Years |
| Independent Trustees–(continued) |
Joel W. Motley - 1952 Trustee | | 2019 | | Director of Office of Finance, Federal Home Loan Bank; Member of the Vestry of Trinity Wall Street; Managing Director of Carmona Motley Inc. (privately held financial advisor); Member of the Finance and Budget Committee of the Council on Foreign Relations, Member of the Investment Committee and Board of Human Rights Watch and Member of the Investment Committee and Board of Historic Hudson Valley(non-profit cultural organization) Formerly: Managing Director of Public Capital Advisors, LLC (privately held financial advisor); Managing Director of Carmona Motley Hoffman, Inc. (privately held financial advisor); Trustee of certain Oppenheimer Funds; and Director of Columbia Equity Financial Corp. (privately held financial advisor) | | 229 | | Director of Greenwall Foundation (bioethics research foundation); Member of Board and Investment Committee of The Greenwall Foundation; Director of Southern Africa Legal Services Foundation; Board Member and Investment Committee Member of Pulizer Center for Crisis Reporting(non-profit journalism) |
Teresa M. Ressel - 1962 Trustee | | 2017 | | Non-executive director and trustee of a number of public and private business corporations Formerly: Chief Financial Officer, Olayan America, The Olayan Group (international investor/commercial/industrial); Chief Executive Officer, UBS Securities LLC; Group Chief Operating Officer, Americas, UBS AG; Assistant Secretary for Management & Budget and CFO, US Department of the Treasury | | 229 | | Atlantic Power Corporation (power generation company); ON Semiconductor Corp. (semiconductor supplier) |
Ann Barnett Stern - 1957 Trustee | | 2017 | | President and Chief Executive Officer, Houston Endowment Inc. (private philanthropic institution) Formerly: Executive Vice President and General Counsel, Texas Children’s Hospital; Attorney, Beck, Redden and Secrest, LLP; Business Law Instructor, University of St. Thomas; Attorney, Andrews & Kurth LLP | | 229 | | Federal Reserve Bank of Dallas |
Robert C. Troccoli - 1949 Trustee | | 2016 | | Retired | | 229 | | None |
| Daniel S. Vandivort - 1954 Trustee | | 2019 | | Treasurer, Chairman of the Audit and Finance Committee, and Trustee, Board of Trustees, Huntington Disease Foundation of America; and President, Flyway Advisory Services LLC (consulting and property management) Formerly: Trustee and Governance Chair, of certain Oppenheimer Funds | | 229 | | Chairman and Lead Independent Director, Chairman of the Audit Committee, and Director, Board of Directors, Value Line Funds |
| James D. Vaughn - 1945 Trustee | | 2019 | | Retired Formerly: Managing Partner, Deloitte & Touche LLP; Trustee and Chairman of the Audit Committee, Schroder Funds; Board Member, Mile High United Way, Boys and Girls Clubs, Boy Scouts, Colorado Business Committee for the Arts, Economic Club of Colorado and Metro Denver Network (economic development corporation); and Trustee of certain Oppenheimer Funds | | 229 | | Board member and Chairman of Audit Committee of AMG National Trust Bank; Trustee and Investment Committee member, University of South Dakota Foundation; Board member, Audit Committee Member and past Board Chair, Junior Achievement(non-profit) |
Invesco V.I. Mid Cap Growth Fund
Trustees and Officers–(continued)
| | | | | | | | |
Name, Year of Birth and Position(s) Held with the Trust | | Trustee and/or Officer Since | | Principal Occupation(s) During Past 5 Years | | Number of
Funds in
Fund Complex
Overseen by
Trustee | | Other Directorship(s) Held by Trustee
During Past 5 Years |
| Independent Trustees–(continued) |
| Christopher L. WIlson - 1957 Trustee, Vice Chair and Chair Designate | | 2017 | | Retired Formerly: Director, TD Asset Management USA Inc. (mutual fund complex) (22 portfolios); Managing Partner, CT2, LLC (investing and consulting firm); President/Chief Executive Officer, Columbia Funds, Bank of America Corporation; President/Chief Executive Officer, CDC IXIS Asset Management Services, Inc.; Principal & Director of Operations, Scudder Funds, Scudder, Stevens & Clark, Inc.; Assistant Vice President, Fidelity Investments | | 229 | | ISO New England, Inc.(non-profit organization managing regional electricity market) |
Invesco V.I. Mid Cap Growth Fund
Trustees and Officers–(continued)
| | | | | | | | |
Name, Year of Birth and Position(s) Held with the Trust | | Trustee and/or Officer Since | | Principal Occupation(s) During Past 5 Years | | Number of
Funds in
Fund Complex
Overseen by
Trustee | | Other Directorship(s) Held by Trustee
During Past 5 Years |
| Officers |
Sheri Morris - 1964 President, Principal Executive Officer and Treasurer | | 1999 | | Head of Global Fund Services, Invesco Ltd.; President, Principal Executive Officer and Treasurer, The Invesco Funds; Vice President, Invesco Advisers, Inc. (formerly known as Invesco Institutional (N.A.), Inc.) (registered investment adviser); and Vice President, Invesco Exchange-Traded Fund Trust, Invesco Exchange-Traded Fund Trust II, Invesco India Exchange-Traded Fund Trust, Invesco Actively Managed Exchange-Traded Fund Trust, Invesco Actively Managed Exchange-Traded Commodity Fund Trust and Invesco Exchange-Traded Self-Indexed Fund Trust; and Vice President, OppenheimerFunds, Inc. Formerly: Vice President and Principal Financial Officer, The Invesco Funds; Vice President, Invesco AIM Advisers, Inc., Invesco AIM Capital Management, Inc. and Invesco AIM Private Asset Management, Inc.; Assistant Vice President and Assistant Treasurer, The Invesco Funds and Assistant Vice President, Invesco Advisers, Inc., Invesco AIM Capital Management, Inc. and Invesco AIM Private Asset Management, Inc.; and Treasurer, Invesco Exchange-Traded Fund Trust, Invesco Exchange-Traded Fund Trust II, Invesco India Exchange-Traded Fund Trust and Invesco Actively Managed Exchange-Traded Fund Trust | | N/A | | N/A |
Russell C. Burk - 1958 Senior Vice President and Senior Officer | | 2005 | | Senior Vice President and Senior Officer, The Invesco Funds | | N/A | | N/A |
Jeffrey H. Kupor - 1968 Senior Vice President, Chief Legal Officer and Secretary | | 2018 | | Head of Legal of the Americas, Invesco Ltd.; Senior Vice President and Secretary, Invesco Advisers, Inc. (formerly known as Invesco Institutional (N.A.), Inc.) (registered investment adviser); Senior Vice President and Secretary, Invesco Distributors, Inc. (formerly known as Invesco AIM Distributors, Inc.); Vice President and Secretary, Invesco Investment Services, Inc. (formerly known as Invesco AIM Investment Services, Inc.) Senior Vice President, Chief Legal Officer and Secretary, The Invesco Funds; Secretary and General Counsel, Invesco Investment Advisers LLC (formerly known as Van Kampen Asset Management); Secretary and General Counsel, Invesco Capital Markets, Inc. (formerly known as Van Kampen Funds Inc.) and Chief Legal Officer, Invesco Exchange-Traded Fund Trust, Invesco Exchange-Traded Fund Trust II, Invesco India Exchange-Traded Fund Trust, Invesco Actively Managed Exchange-Traded Fund Trust, Invesco Actively Managed Exchange-Traded Commodity Fund Trust and Invesco Exchange-Traded Self-Indexed Fund Trust; Secretary, Invesco Indexing LLC; Secretary, W.L. Ross & Co., LLC Formerly: Secretary and Vice President, Jemstep, Inc.; Head of Legal, Worldwide Institutional, Invesco Ltd.; Secretary and General Counsel, INVESCO Private Capital Investments, Inc.; Senior Vice President, Secretary and General Counsel, Invesco Management Group, Inc. (formerly known as Invesco AIM Management Group, Inc.); Assistant Secretary, INVESCO Asset Management (Bermuda) Ltd.; Secretary and General Counsel, Invesco Private Capital, Inc.; Assistant Secretary and General Counsel, INVESCO Realty, Inc.; Secretary and General Counsel, Invesco Senior Secured Management, Inc.; and Secretary, Sovereign G./P. Holdings Inc. | | N/A | | N/A |
Andrew R. Schlossberg - 1974 Senior Vice President | | 2019 | | Head of the Americas and Senior Managing Director, Invesco Ltd.; Director and Senior Vice President, Invesco Advisers, Inc. (formerly known as Invesco Institutional (N.A.), Inc.) (registered investment adviser); Director and Chairman, Invesco Investment Services, Inc. (formerly known as Invesco AIM Investment Services, Inc.) (registered transfer agent); Senior Vice President, The Invesco Funds; Director, Invesco Investment Advisers LLC (formerly known as Van Kampen Asset Management); Director, President and Chairman, Invesco Insurance Agency, Inc. Formerly: Director, Invesco UK Limited; Director and Chief Executive, Invesco Asset Management Limited and Invesco Fund Managers Limited; Assistant Vice President, The Invesco Funds; Senior Vice President, Invesco Advisers, Inc. (formerly known as Invesco Institutional (N.A.), Inc.) (registered investment adviser); Director and Chief Executive, Invesco Administration Services Limited and Invesco Global Investment Funds Limited; Director, Invesco Distributors, Inc.; Head of EMEA, Invesco Ltd.; President, Invesco Actively Managed Exchange-Traded Commodity Fund Trust, Invesco Actively Managed Exchange-Traded Fund Trust, Invesco Exchange-Traded Fund Trust, Invesco Exchange-Traded Fund Trust II and Invesco India Exchange-Traded Fund Trust; Managing Director and Principal Executive Officer, Invesco Capital Management LLC | | N/A | | N/A |
Invesco V.I. Mid Cap Growth Fund
Trustees and Officers–(continued)
| | | | | | | | |
Name, Year of Birth and Position(s) Held with the Trust | | Trustee and/or Officer Since | | Principal Occupation(s) During Past 5 Years | | Number of
Funds in
Fund Complex
Overseen by
Trustee | | Other Directorship(s) Held by Trustee
During Past 5 Years |
| Officers–(continued) |
John M. Zerr - 1962 Senior Vice President | | 2006 | | Chief Operating Officer of the Americas; Senior Vice President, Invesco Advisers, Inc. (formerly known as Invesco Institutional (N.A.), Inc.) (registered investment adviser); Senior Vice President, Invesco Distributors, Inc. (formerly known as Invesco AIM Distributors, Inc.); Director and Vice President, Invesco Investment Services, Inc. (formerly known as Invesco AIM Investment Services, Inc.) Senior Vice President, The Invesco Funds; Managing Director, Invesco Capital Management LLC; Director, Invesco Investment Advisers LLC (formerly known as Van Kampen Asset Management); Senior Vice President, Invesco Capital Markets, Inc. (formerly known as Van Kampen Funds Inc.); Manager, Invesco Indexing LLC; Manager, Invesco Specialized Products, LLC; Director and Senior Vice President, Invesco Insurance Agency, Inc.; Member, Invesco Canada Funds Advisory Board; Director, President and Chief Executive Officer, Invesco Corporate Class Inc. (corporate mutual fund company); and Director, Chairman, President and Chief Executive Officer, Invesco Canada Ltd. (formerly known as Invesco Trimark Ltd./Invesco Trimark Ltèe) (registered investment adviser and registered transfer agent) Formerly: Director and Senior Vice President, Invesco Management Group, Inc. (formerly known as Invesco AIM Management Group, Inc.); Secretary and General Counsel, Invesco Management Group, Inc. (formerly known as Invesco AIM Management Group, Inc.); Secretary, Invesco Investment Services, Inc. (formerly known as Invesco AIM Investment Services, Inc.); Chief Legal Officer and Secretary, The Invesco Funds; Secretary and General Counsel, Invesco Investment Advisers LLC (formerly known as Van Kampen Asset Management); Secretary and General Counsel, Invesco Capital Markets, Inc. (formerly known as Van Kampen Funds Inc.); Chief Legal Officer, Invesco Exchange-Traded Fund Trust, Invesco Exchange-Traded Fund Trust II, Invesco India Exchange-Traded Fund Trust, Invesco Actively Managed Exchange-Traded Fund Trust, Invesco Actively Managed Exchange-Traded Commodity Fund Trust and Invesco Exchange-Traded Self-Indexed Fund Trust; Secretary, Invesco Indexing LLC; Director, Secretary, General Counsel and Senior Vice President, Van Kampen Exchange Corp.; Director, Vice President and Secretary, IVZ Distributors, Inc. (formerly known as INVESCO Distributors, Inc.); Director and Vice President, INVESCO Funds Group, Inc.; Director and Vice President, Van Kampen Advisors Inc.; Director, Vice President, Secretary and General Counsel, Van Kampen Investor Services Inc.; Director and Secretary, Invesco Distributors, Inc. (formerly known as Invesco AIM Distributors, Inc.); Director, Senior Vice President, General Counsel and Secretary, Invesco AIM Advisers, Inc. and Van Kampen Investments Inc.; Director, Vice President and Secretary, Fund Management Company; Director, Senior Vice President, Secretary, General Counsel and Vice President, Invesco AIM Capital Management, Inc.; Chief Operating Officer and General Counsel, Liberty Ridge Capital, Inc. (an investment adviser) | | N/A | | N/A |
Gregory G. McGreevey - 1962 Senior Vice President | | 2012 | | Senior Managing Director, Invesco Ltd.; Director, Chairman, President, and Chief Executive Officer, Invesco Advisers, Inc. (formerly known as Invesco Institutional (N.A.), Inc.) (registered investment adviser); Director, Invesco Mortgage Capital, Inc. and Invesco Senior Secured Management, Inc.; and Senior Vice President, The Invesco Funds; and President, SNW Asset Management Corporation Formerly: Senior Vice President, Invesco Management Group, Inc. and Invesco Advisers, Inc.; Assistant Vice President, The Invesco Funds | | N/A | | N/A |
Kelli Gallegos - 1970 Vice President, Principal Financial Officer and Assistant Treasurer | | 2008 | | Principal Financial and Accounting Officer - Investments Pool, Invesco Specialized Products, LLC; Vice President, Principal Financial Officer and Assistant Treasurer, The Invesco Funds; Principal Financial and Accounting Officer - Pooled Investments, Invesco Capital Management LLC; Vice President and Treasurer, Invesco Exchange-Traded Fund Trust, Invesco Exchange-Traded Fund Trust II, Invesco India Exchange-Traded Fund Trust, Invesco Actively Managed Exchange-Traded Fund Trust, Invesco Actively Managed Exchange-Traded Commodity Fund Trust and Invesco Exchange-Traded Self-Indexed Fund Trust Formerly: Assistant Treasurer, Invesco Specialized Products, LLC; Assistant Treasurer, Invesco Exchange-Traded Fund Trust, Invesco Exchange-Traded Fund Trust II, Invesco India Exchange-Traded Fund Trust, Invesco Actively Managed Exchange-Traded Fund Trust, Invesco Actively Managed Exchange-Traded Commodity Fund Trust and Invesco Exchange-Traded Self-Indexed Fund Trust; Assistant Treasurer, Invesco Capital Management LLC; Assistant Vice President, The Invesco Funds | | N/A | | N/A |
Invesco V.I. Mid Cap Growth Fund
Trustees and Officers–(continued)
| | | | | | | | |
Name, Year of Birth and Position(s) Held with the Trust | | Trustee and/or Officer Since | | Principal Occupation(s) During Past 5 Years | | Number of
Funds in
Fund Complex
Overseen by
Trustee | | Other Directorship(s) Held by Trustee
During Past 5 Years |
| Officers–(continued) |
Crissie M. Wisdom - 1969 Anti-Money Laundering Compliance Officer | | 2013 | | Anti-Money Laundering Compliance Officer, Invesco Advisers, Inc. (formerly known as Invesco Institutional (N.A.), Inc.) (registered investment adviser), Invesco Capital Markets, Inc. (formerly known as Van Kampen Funds Inc.), Invesco Distributors, Inc., Invesco Investment Services, Inc., The Invesco Funds, and Invesco Exchange-Traded Fund Trust, Invesco Exchange-Traded Fund Trust II, Invesco India Exchange-Traded Fund Trust, Invesco Actively Managed Exchange-Traded Fund Trust, Invesco Actively Managed Exchange-Traded Commodity Fund Trust and Invesco Exchange-Traded Self-Indexed Fund Trust; Anti-Money Laundering Compliance Officer and Bank Secrecy Act Officer, INVESCO National Trust Company and Invesco Trust Company; and Fraud Prevention Manager and Controls and Risk Analysis Manager for Invesco Investment Services, Inc. Formerly: Anti-Money Laundering Compliance Officer, Van Kampen Exchange Corp. and Invesco Management Group, Inc. | | N/A | | N/A |
Robert R. Leveille - 1969 Chief Compliance Officer | | 2016 | | Chief Compliance Officer, Invesco Advisers, Inc. (registered investment adviser); and Chief Compliance Officer, The Invesco Funds Formerly: Chief Compliance Officer, Putnam Investments and the Putnam Funds | | N/A | | N/A |
The Statement of Additional Information of the Trust includes additional information about the Fund’s Trustees and is available upon request, without charge, by calling 1.800.959.4246. Please refer to the Fund’s Statement of Additional Information for information on the Fund’ssub-advisers.
| | | | | | |
| Office of the Fund | | Investment Adviser | | Distributor | | Auditors |
| 11 Greenway Plaza, Suite 1000 | | Invesco Advisers, Inc. | | Invesco Distributors, Inc. | | PricewaterhouseCoopers LLP |
| Houston, TX 77046-1173 | | 1555 Peachtree Street, N.E. | | 11 Greenway Plaza, Suite 1000 | | 1000 Louisiana Street, Suite 5800 |
| | Atlanta, GA 30309 | | Houston, TX 77046-1173 | | Houston, TX 77002-5678 |
| | | |
| Counsel to the Fund | | Counsel to the Independent Trustees | | Transfer Agent | | Custodian |
| Stradley Ronon Stevens & Young, LLP | | Goodwin Procter LLP | | Invesco Investment Services, Inc. | | State Street Bank and Trust Company |
| 2005 Market Street, Suite 2600 | | 901 New York Avenue, N.W. | | 11 Greenway Plaza, Suite 1000 | | 225 Franklin Street |
| Philadelphia, PA 19103-7018 | | Washington, D.C. 20001 | | Houston, TX 77046-1173 | | Boston, MA 02110-2801 |
Invesco V.I. Mid Cap Growth Fund
| | | | |
| | |

| | Annual Report to Shareholders | | December 31, 2019 |
| | |
| | Invesco V.I. S&P 500 Index Fund |

Beginning on January 1, 2021, as permitted by regulations adopted by the Securities and Exchange Commission, the insurance company that offers your variable annuity or variable life insurance contract may no longer send you paper copies of the Fund’s shareholder reports by mail, unless you specifically request paper copies of the reports from the insurance company or your financial intermediary. Instead of delivering paper copies of the report, the insurance company may choose to make the reports available on a website, and will notify you by mail each time a report is posted and provide you with a website link to access the report. Instructions for requesting paper copies will be provided by your insurance company.
If the insurance company offers electronic delivery, you may elect to receive shareholder reports and other communications about the Fund electronically by following the instructions provided by the insurance company or by contacting your financial intermediary. If you already elected to receive shareholder reports electronically, you will not be affected by this change and you need not take any action.
You may elect to receive all future reports in paper free of charge from the insurance company. You can inform the insurance company or your financial intermediary that you wish to continue receiving paper copies of your shareholder reports by following the instructions provided by the insurance company or by contacting your financial intermediary. Your election to receive reports in paper will apply to all portfolio companies available under your contract with the insurance company.
The Fund provides a complete list of its holdings four times in each fiscal year, at the quarter-ends. For the second and fourth quarters, the lists appear in the Fund’s semiannual and annual reports to shareholders. For the first and third quarters, the Fund files the lists with the Securities and Exchange Commission (SEC) as an exhibit to its reports on FormN-PORT. The Fund’s FormN-PORT filings are available on the SEC website, sec.gov. The SEC file numbers for the Fund are811-07452 and033-57340. The Fund’s most recent portfolio holdings, as filed on FormN-PORT, have also been made available to insurance companies issuing variable annuity contracts and variable life insurance policies (“variable products”) that invest in the Fund.
A description of the policies and procedures that the Fund uses to determine how to vote proxies relating to portfolio securities is available without charge, upon request, from our Client Services department at 800 959 4246 or at invesco.com/proxyguidelines. The information is also available on the SEC website, sec.gov.
Information regarding how the Fund voted proxies related to its portfolio securities during the most recent12-month period ended June 30 is available at invesco.com/proxysearch. The information is also available on the SEC website, sec.gov.
Invesco Advisers, Inc. is an investment adviser; it provides investment advisory services to individual and institutional clients and does not sell securities. Invesco Distributors, Inc. is the US distributor for Invesco Ltd.’s retail mutual funds, exchange-traded funds and institutional money market funds. Both are wholly owned, indirect subsidiaries of Invesco Ltd.
This report must be accompanied or preceded by a currently effective Fund prospectus and variable product prospectus, which contain more complete information, including sales charges and expenses. Investors should read each carefully before investing.
| | | | |
| NOT FDIC INSURED | MAY LOSE VALUE | NO BANK GUARANTEE |
| Invesco Distributors, Inc. | | | | MS-VISPI-AR-1 |
Management’s Discussion of Fund Performance
| | | | |
| Performance summary | | | | |
| For the year ended December 31, 2019, Series I shares of Invesco V.I. S&P 500 Index Fund (the Fund) underperformed the S&P 500 Index, the Fund’s broad market/style-specific benchmark. | |
Your Fund’s long-term performance appears later in this report. | | | | |
| Fund vs. Indexes | | | | |
| Total returns, 12/31/18 to 12/31/19, excluding variable product issuer charges. If variable product issuer charges were included, returns would be lower. | | | | |
| Series I Shares | | | 30.90 | % |
| Series II Shares | | | 30.62 | |
| S&P 500 Indexq(Broad Market/Style-Specific Index) | | | 31.49 | |
| Lipper VUF S&P 500 Funds Index∎(Peer Group Index) | | | 31.20 | |
| Source(s):qRIMES Technologies Corp.;∎Lipper Inc. | | | | |
Market conditions and your Fund
Equity markets rallied in the first quarter of 2019, fueled by optimism about a potentialUS-China trade deal and indication that the US Federal Reserve (the Fed) would not raise interest rates in 2019, a surprising shift in monetary policy. The Fed’s more accommodative stance provided a supportive environment for equities and fixed income, even as US economic data were mixed and overseas growth appeared to be slowing. Against this backdrop, the S&P 500 Index posted its best first quarter returns since 1998.
Although the S&P 500 Index posted modest gains for the second quarter of 2019, the US stock market experienced increased volatility. After four consecutive months of rising stock markets, the market sold off in May 2019, along with bond yields and oil prices, as investors weighed the impact of the lingering trade war between the US and China, as well as potential tariffs imposed on Mexico. In addition, economic data showed a slowing domestic and global economy.
Key issues that concerned investors in the second quarter of 2019 carried over into the third quarter. TheUS-China
trade conflict worried investors and stifled business investment, even as the Fed cut interest rates by 0.25% in July and again in September 2019.1This environment, combined with evidence of slowing global economic growth, fueled market volatility in August 2019. The US Treasury yield curve inverted several times, increasing fears of a possible US recession. As a result, August saw increased risk aversion, with investors crowding into asset classes perceived as safe havens, such as US Treasuries and gold. However, the Fed’s accommodative tone provided some support for risk assets.
Macroeconomic issues that concerned investors in the third quarter of 2019 mostly abated during the fourth quarter, providing the backdrop for strong equity market returns. Risk assets surged higher as a result of a delay in the Brexit agreement until January 2020, optimism that phase one of aUS-China trade deal would be completed and better-than-expected third-quarter corporate earnings results. The US economy rose higher than expected, at 2.1% during the third quarter of 2019.2 During its October meeting, the Fed cut interest rates again
by 0.25% based on business investment and exports remaining weak.1 Investors were also encouraged by a resilient US economy and corporate earnings, putting the US equity market on track for its largest annual rise since 2013.
Invesco V.I. S&P 500 Index Fund invests in stocks in approximately the same proportion as they are represented in the S&P 500 Index. While all sectors contributed to the Fund’s overall performance during the year, information technology (IT), financials and communication services stocks were the most significant contributors. Stocks in the energy, health care and materials sectors delivered positive absolute performance but lagged the Fund’s overall performance for the year.
The largest contributor to overall Fund performance for the year wasApple. Despite slower growth in iPhone sales, Apple delivered higher-than-expected revenue from its watches, iPads and other services.Microsoft, the largest position in the Fund’s portfolio, was another strong contributor. The company benefited from increased demand for its cloud-based services and other products. In addition,Facebook, which has been under regulatory scrutiny due to privacy concerns, delivered a 30% increase in revenue over the year and announced that 2.2 billion unique visits to either its website, Instagram, Messenger or WhatsApp sites occurred daily. Amazon.com was another top contributor although its shares underperformed peers due antitrust concerns.JP Morgan Chasewas another key contributor.
Pharmaceutical companyPfizerwas the largest detractor from overall Fund performance for the year. After Pfizer announced a corporate spinoff, investors were concerned over the valuation of its
| | | | |
Portfolio Composition | |
By sector | | | % of total net assets | |
| |
| Information Technology | | | 23.57% | |
| Health Care | | | 14.44 | |
| Financials | | | 13.16 | |
| Communication Services | | | 10.56 | |
| Consumer Discretionary | | | 9.92 | |
| Industrials | | | 9.20 | |
| Consumer Staples | | | 7.32 | |
| Energy | | | 4.42 | |
| Utilities | | | 3.37 | |
| Real Estate | | | 2.97 | |
| Materials | | | 2.70 | |
| Money Market Funds Plus Other | | | | |
| Assets Less Liabilities | | | (1.63) | |
|
Top 10 Equity Holdings* |
% of total net assets |
| | |
1. Apple, Inc. | | 4.66% |
2. Microsoft Corp. | | 4.57 |
3. Amazon.com, Inc. | | 2.92 |
4. Facebook, Inc., Class A | | 1.88 |
5. Berkshire Hathaway, Inc., Class B | | 1.68 |
6. JPMorgan Chase & Co. | | 1.66 |
7. Alphabet, Inc., Class A | | 1.52 |
8. Alphabet, Inc., Class C | | 1.52 |
9. Johnson & Johnson | | 1.46 |
10.Visa, Inc., Class A | | 1.22 |
| | | | |
Total Net Assets | | $ | 89.6 million | |
| |
Total Number of Holdings* | | | 505 | |
The Fund’s holdings are subject to change, and there is no assurance that the Fund will continue to hold any particular security.
*Excluding money market fund holdings, if any.
Data presented here are as of December 31, 2019.
Invesco V.I. S&P 500 Index Fund
current business. During the year,Occidental Petroleumpurchased Anadarko Petroleum at a valuation that investors feared was too high, which subsequently drove shares lower. Shares of utility providerPG&Efell over 70% as liabilities mounted from wildfires in the California region.DuPont de NemoursandWalgreens Boots Alliancewere also key detractors. In January,Teleflexreplaced PG&E in the S&P 500 Index. As such, we made the same adjustment to the Fund’s positioning before the close of the fiscal year.
Please note, the Fund’s strategy is principally implemented through equity investments, but the Fund may also use S&P 500 futures contracts, which are derivative instruments used to gain exposure to the equity market. During the year, the Fund invested in S&P 500 futures contracts, which generated a negative return and detracted from absolute Fund performance. Derivatives can be a cost-effective way to gain exposure to
asset classes. However, derivatives may amplify traditional investment risks through the creation of leverage and may be less liquid than traditional securities.
We welcome new investors who joined the Fund during the year and thank you for your investment in Invesco V.I. S&P 500 Index Fund.
1 Source: US Federal Reserve
2 Source: Bureau of Economic Analysis
Portfolio managers:
Anthony Munchak
Glen Murphy
Francis Orlando
Daniel Tsai
The views and opinions expressed in management’s discussion of Fund performance are those of Invesco Advisers, Inc. These views and opinions are subject to change at any time based on factors such as market and economic conditions. These views and opinions may not be relied upon as investment advice or recommendations, or as an offer for a particular security. The information is not a complete analysis of every aspect of any market, country, industry, security or the Fund. Statements of fact are from sources considered reliable, but Invesco Advisers, Inc. makes no representation or warranty as to their completeness or accuracy. Although historical performance is no guarantee of future results, these insights may help you understand our investment management philosophy.
See important Fund and, if applicable, index disclosures later in this report.
Invesco V.I. S&P 500 Index Fund
Your Fund’s Long-Term Performance
Results of a $10,000 Investment – Oldest Share Class(es)
Fund and index data from 12/31/09
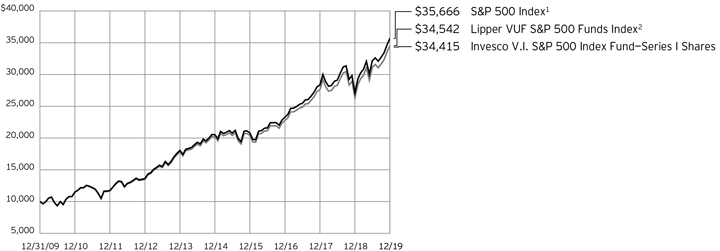
| 1 | Source: RIMES Technologies Corp. |
Past performance cannot guarantee
future results.
| | | | |
| Average Annual Total Returns | |
As of 12/31/19 | | | | |
| |
| Series I Shares | | | | |
| Inception (5/18/98) | | | 6.74 | % |
| 10 Years | | | 13.16 | |
| 5 Years | | | 11.22 | |
| 1 Year | | | 30.90 | |
| |
| Series II Shares | | | | |
| Inception (6/5/00) | | | 5.56 | % |
| 10 Years | | | 12.88 | |
| 5 Years | | | 10.95 | |
| 1 Year | | | 30.62 | |
Effective June 1, 2010, Class X and Class Y shares of the predecessor fund, Morgan Stanley Variable Investment S&P 500 Index Portfolio advised by Morgan Stanley Investment Advisors Inc. were reorganized into Series I and Series II shares, respectively, of Invesco V.I. S&P 500 Index Fund. Returns shown above, prior to June 1, 2010, for Series I and Series II shares are blended returns of the predecessor fund and Invesco V.I. S&P 500 Index Fund. Share class returns will differ from the predecessor fund because of different expenses.
The performance data quoted represent past performance and cannot guarantee future results; current performance may be lower or higher. Please contact your variable product issuer or financial adviser for the most recentmonth-end variable product performance. Performance figures reflect Fund expenses, reinvested distributions and changes in net asset value. Performance figures do not reflect deduction
of taxes a shareholder would pay on Fund distributions or sale of Fund shares. Investment return and principal value will fluctuate so that you may have a gain or loss when you sell shares.
The total annual Fund operating expense ratio set forth in the most recent Fund prospectus as of the date of this report for Series I and Series II shares was 0.51% and 0.76%, respectively. The expense ratios presented above may vary from the expense ratios presented in other sections of this report that are based on expenses incurred during the period covered by this report.
Invesco V.I. S&P 500 Index Fund, a series portfolio of AIM Variable Insurance Funds (Invesco Variable Insurance Funds), is currently offered through insurance companies issuing variable products. You cannot purchase shares of the Fund directly. Performance figures given represent the Fund and are not intended to reflect actual variable product values. They do not reflect sales charges, expenses and fees assessed in connection with a variable product. Sales charges, expenses and fees, which are determined by the variable product issuers, will vary and will lower the total return.
The most recentmonth-end performance at the Fund level, excluding variable product charges, is available at 800 451 4246. As mentioned above, for the most recentmonth-end performance including variable product charges, please contact your variable product issuer or financial adviser.
Fund performance reflects any applicable fee waivers and/or expense
reimbursements. Had the adviser not waived fees and/or reimbursed expenses currently or in the past, returns would have been lower. See current prospectus for more information.
Invesco V.I. S&P 500 Index Fund
Invesco V.I. S&P 500 Index Fund’s investment objective is to provide investment results that, before expenses, correspond to the total return (i.e., the combination of capital changes and income) of the Standard & Poor’s® 500 Composite Stock Price Index.
| | ∎ | | Unless otherwise stated, information presented in this report is as of December 31, 2019, and is based on total net assets. |
| | ∎ | | Unless otherwise noted, all data provided by Invesco. |
| | ∎ | | To access your Fund’s reports/prospectus, visit invesco.com/fundreports. |
About indexes used in this report
| | ∎ | | TheS&P 500® Indexis an unmanaged index considered representative of the US stock market. |
| | ∎ | | TheLipper VUF S&P 500 Funds Indexis an unmanaged index considered representative of S&P 500 variable insurance underlying funds tracked by Lipper. |
| | ∎ | | A direct investment cannot be made in an index. Unless otherwise indicated, index results include reinvested dividends, and they do not reflect sales charges. Performance of the peer group, if applicable, reflects fund expenses; performance of a market index does not. |
Other information
| | ∎ | | The returns shown in management’s discussion of Fund performance are based on net asset values calculated for shareholder transactions. Generally accepted accounting principles require adjustments to be made to the net assets of the Fund at period end for financial reporting purposes, and as such, the net asset values for shareholder transactions and the returns based on those net asset values may differ from the net asset values and returns reported in the Financial Highlights. Additionally, the returns and net asset values shown throughout this report are at the Fund level only and do not include variable product issuer charges. If such charges were included, the total returns would be lower. |
| | ∎ | | Industry classifications used in this report are generally according to the Global Industry Classification Standard, which was developed by and is the exclusive property and a service mark of MSCI Inc. and Standard & Poor’s. |
Invesco V.I. S&P 500 Index Fund
Schedule of Investments(a)
December 31, 2019
| | | | | | | | |
| | | Shares | | | Value | |
Common Stocks & Other Equity Interests-101.63% | |
| Advertising-0.10% | |
Interpublic Group of Cos., Inc. (The) | | | 1,299 | | | $ | 30,007 | |
| |
Omnicom Group, Inc. | | | 736 | | | | 59,631 | |
| |
| | | | | | | 89,638 | |
| |
|
| Aerospace & Defense-2.48% | |
Arconic, Inc. | | | 1,338 | | | | 41,170 | |
| |
Boeing Co. (The) | | | 1,818 | | | | 592,232 | |
| |
General Dynamics Corp. | | | 797 | | | | 140,551 | |
| |
Huntington Ingalls Industries, Inc. | | | 142 | | | | 35,625 | |
| |
L3Harris Technologies, Inc. | | | 755 | | | | 149,392 | |
| |
Lockheed Martin Corp. | | | 844 | | | | 328,637 | |
| |
Northrop Grumman Corp. | | | 532 | | | | 182,992 | |
| |
Raytheon Co. | | | 947 | | | | 208,094 | |
| |
Textron, Inc. | | | 795 | | | | 35,457 | |
| |
TransDigm Group, Inc. | | | 169 | | | | 94,640 | |
| |
United Technologies Corp. | | | 2,760 | | | | 413,337 | |
| |
| | | | | | | 2,222,127 | |
| |
|
| Agricultural & Farm Machinery-0.21% | |
Deere & Co. | | | 1,066 | | | | 184,695 | |
| |
|
| Agricultural Products-0.10% | |
Archer-Daniels-Midland Co. | | | 1,886 | | | | 87,416 | |
| |
|
| Air Freight & Logistics-0.54% | |
C.H. Robinson Worldwide, Inc. | | | 469 | | | | 36,676 | |
| |
Expeditors International of Washington, Inc. | | | 577 | | | | 45,018 | |
| |
FedEx Corp. | | | 812 | | | | 122,782 | |
| |
United Parcel Service, Inc., Class B | | | 2,383 | | | | 278,954 | |
| |
| | | | | | | 483,430 | |
| |
|
| Airlines-0.37% | |
Alaska Air Group, Inc. | | | 416 | | | | 28,184 | |
| |
American Airlines Group, Inc. | | | 1,342 | | | | 38,488 | |
| |
Delta Air Lines, Inc. | | | 1,960 | | | | 114,621 | |
| |
Southwest Airlines Co. | | | 1,611 | | | | 86,962 | |
| |
United Airlines Holdings, Inc.(b) | | | 747 | | | | 65,803 | |
| |
| | | | | | | 334,058 | |
| |
|
| Alternative Carriers-0.05% | |
CenturyLink, Inc. | | | 3,292 | | | | 43,487 | |
| |
|
| Apparel Retail-0.47% | |
Gap, Inc. (The) | | | 761 | | | | 13,454 | |
| |
L Brands, Inc. | | | 833 | | | | 15,094 | |
| |
Ross Stores, Inc. | | | 1,234 | | | | 143,662 | |
| |
TJX Cos., Inc. (The) | | | 4,125 | | | | 251,873 | |
| |
| | | | | | | 424,083 | |
| |
| | | | | | | | |
| | | Shares | | | Value | |
Apparel, Accessories & Luxury Goods-0.28% | |
Capri Holdings Ltd.(b) | | | 512 | | | $ | 19,533 | |
| |
Hanesbrands, Inc. | | | 1,228 | | | | 18,236 | |
| |
PVH Corp. | | | 257 | | | | 27,024 | |
| |
Ralph Lauren Corp. | | | 174 | | | | 20,396 | |
| |
Tapestry, Inc. | | | 938 | | | | 25,298 | |
| |
Under Armour, Inc., Class A(b) | | | 669 | | | | 14,450 | |
| |
Under Armour, Inc., Class C(b) | | | 671 | | | | 12,870 | |
| |
VF Corp. | | | 1,105 | | | | 110,124 | |
| |
| | | | | | | 247,931 | |
| |
|
| Application Software-1.85% | |
Adobe, Inc.(b) | | | 1,644 | | | | 542,208 | |
| |
ANSYS, Inc.(b) | | | 288 | | | | 74,134 | |
| |
Autodesk, Inc.(b) | | | 748 | | | | 137,228 | |
| |
Cadence Design Systems, Inc.(b) | | | 948 | | | | 65,753 | |
| |
Citrix Systems, Inc. | | | 416 | | | | 46,135 | |
| |
Intuit, Inc. | | | 885 | | | | 231,808 | |
| |
salesforce.com, inc.(b) | | | 3,022 | | | | 491,498 | |
| |
Synopsys, Inc.(b) | | | 515 | | | | 71,688 | |
| |
| | | | | | | 1,660,452 | |
| |
|
| Asset Management & Custody Banks-0.82% | |
Ameriprise Financial, Inc. | | | 430 | | | | 71,629 | |
| |
Bank of New York Mellon Corp. (The) | | | 2,855 | | | | 143,692 | |
| |
BlackRock, Inc. | | | 401 | | | | 201,583 | |
| |
Franklin Resources, Inc. | | | 974 | | | | 25,305 | |
| |
Invesco Ltd.(c) | | | 1,219 | | | | 21,918 | |
| |
Northern Trust Corp. | | | 727 | | | | 77,236 | |
| |
State Street Corp. | | | 1,236 | | | | 97,768 | |
| |
T. Rowe Price Group, Inc. | | | 797 | | | | 97,106 | |
| |
| | | | | | | 736,237 | |
| |
|
| Auto Parts & Equipment-0.13% | |
Aptiv PLC | | | 867 | | | | 82,339 | |
| |
BorgWarner, Inc. | | | 698 | | | | 30,279 | |
| |
| | | | | | | 112,618 | |
| |
|
| Automobile Manufacturers-0.31% | |
Ford Motor Co. | | | 13,280 | | | | 123,504 | |
| |
General Motors Co. | | | 4,277 | | | | 156,538 | |
| |
| | | | | | | 280,042 | |
| |
|
| Automotive Retail-0.33% | |
Advance Auto Parts, Inc. | | | 240 | | | | 38,439 | |
| |
AutoZone, Inc.(b) | | | 81 | | | | 96,496 | |
| |
CarMax, Inc.(b) | | | 560 | | | | 49,095 | |
| |
O’Reilly Automotive, Inc.(b) | | | 258 | | | | 113,071 | |
| |
| | | | | | | 297,101 | |
| |
|
| Biotechnology-2.03% | |
AbbVie, Inc. | | | 5,031 | | | | 445,445 | |
| |
See accompanying Notes to Financial Statements which are an integral part of the financial statements.
Invesco V.I. S&P 500 Index Fund
| | | | | | | | |
| | | Shares | | | Value | |
| Biotechnology-(continued) | |
Alexion Pharmaceuticals, Inc.(b) | | | 758 | | | $ | 81,978 | |
| |
Amgen, Inc. | | | 2,021 | | | | 487,202 | |
| |
Biogen, Inc.(b) | | | 613 | | | | 181,896 | |
| |
Gilead Sciences, Inc. | | | 4,290 | | | | 278,764 | |
| |
Incyte Corp.(b) | | | 612 | | | | 53,440 | |
| |
Regeneron Pharmaceuticals, Inc.(b) | | | 269 | | | | 101,004 | |
| |
Vertex Pharmaceuticals, Inc.(b) | | | 874 | | | | 191,362 | |
| |
| | | | | | | 1,821,091 | |
| |
|
| Brewers-0.04% | |
Molson Coors Beverage Co., Class B | | | 645 | | | | 34,765 | |
| |
|
| Broadcasting-0.22% | |
Discovery, Inc., Class A(b) | | | 542 | | | | 17,745 | |
| |
Discovery, Inc., Class C(b) | | | 1,167 | | | | 35,582 | |
| |
Fox Corp., Class A | | | 1,200 | | | | 44,484 | |
| |
Fox Corp., Class B | | | 549 | | | | 19,984 | |
| |
ViacomCBS, Inc. , Class B | | | 1,825 | | | | 76,595 | |
| |
| | | | | | | 194,390 | |
| |
|
| Building Products-0.27% | |
A.O. Smith Corp. | | | 467 | | | | 22,248 | |
| |
Allegion PLC | | | 315 | | | | 39,230 | |
| |
Fortune Brands Home & Security, Inc. | | | 480 | | | | 31,363 | |
| |
Johnson Controls International PLC | | | 2,624 | | | | 106,823 | |
| |
Masco Corp. | | | 966 | | | | 46,359 | |
| |
| | | | | | | 246,023 | |
| |
|
| Cable & Satellite-1.10% | |
Charter Communications, Inc.,
Class A(b) | | | 533 | | | | 258,548 | |
| |
Comcast Corp., Class A | | | 15,469 | | | | 695,641 | |
| |
DISH Network Corp., Class A(b) | | | 867 | | | | 30,752 | |
| |
| | | | | | | 984,941 | |
| |
|
| Casinos & Gaming-0.20% | |
Las Vegas Sands Corp. | | | 1,146 | | | | 79,120 | |
| |
MGM Resorts International | | | 1,766 | | | | 58,755 | |
| |
Wynn Resorts Ltd. | | | 327 | | | | 45,410 | |
| |
| | | | | | | 183,285 | |
| |
|
| Commodity Chemicals-0.25% | |
Dow, Inc. | | | 2,517 | | | | 137,755 | |
| |
LyondellBasell Industries N.V., Class A | | | 873 | | | | 82,481 | |
| |
| | | | | | | 220,236 | |
| |
|
| Communications Equipment-0.98% | |
Arista Networks, Inc.(b) | | | 188 | | | | 38,239 | |
| |
Cisco Systems, Inc. | | | 14,435 | | | | 692,303 | |
| |
F5 Networks, Inc.(b) | | | 202 | | | | 28,209 | |
| |
Juniper Networks, Inc. | | | 1,138 | | | | 28,029 | |
| |
Motorola Solutions, Inc. | | | 582 | | | | 93,784 | |
| |
| | | | | | | 880,564 | |
| |
|
| Computer & Electronics Retail-0.08% | |
Best Buy Co., Inc. | | | 774 | | | | 67,957 | |
| |
| | | | | | | | |
| | | Shares | | | Value | |
| Construction & Engineering-0.07% | |
Jacobs Engineering Group, Inc. | | | 468 | | | $ | 42,040 | |
| |
Quanta Services, Inc. | | | 480 | | | | 19,541 | |
| |
| | | | | | | 61,581 | |
| |
|
| Construction Machinery & Heavy Trucks-0.57% | |
Caterpillar, Inc. | | | 1,879 | | | | 277,491 | |
| |
Cummins, Inc. | | | 521 | | | | 93,238 | |
| |
PACCAR, Inc. | | | 1,172 | | | | 92,705 | |
| |
Westinghouse Air Brake Technologies Corp. | | | 626 | | | | 48,703 | |
| |
| | | | | | | 512,137 | |
| |
|
| Construction Materials-0.14% | |
Martin Marietta Materials, Inc. | | | 210 | | | | 58,724 | |
| |
Vulcan Materials Co. | | | 454 | | | | 65,372 | |
| |
| | | | | | | 124,096 | |
| |
|
| Consumer Electronics-0.05% | |
Garmin Ltd. | | | 488 | | | | 47,609 | |
| |
|
| Consumer Finance-0.68% | |
American Express Co. | | | 2,282 | | | | 284,086 | |
| |
Capital One Financial Corp. | | | 1,592 | | | | 163,833 | |
| |
Discover Financial Services | | | 1,077 | | | | 91,351 | |
| |
Synchrony Financial | | | 2,022 | | | | 72,812 | |
| |
| | | | | | | 612,082 | |
| |
|
| Copper-0.07% | |
Freeport-McMoRan, Inc. | | | 4,971 | | | | 65,220 | |
| |
|
| Data Processing & Outsourced Services-4.13% | |
Alliance Data Systems Corp. | | | 135 | | | | 15,147 | |
| |
Automatic Data Processing, Inc. | | | 1,469 | | | | 250,465 | |
| |
Broadridge Financial Solutions, Inc. | | | 386 | | | | 47,686 | |
| |
Fidelity National Information Services, Inc. | | | 2,090 | | | | 290,698 | |
| |
Fiserv, Inc.(b) | | | 1,942 | | | | 224,553 | |
| |
FleetCor Technologies, Inc.(b) | | | 292 | | | | 84,014 | |
| |
Global Payments, Inc. | | | 1,022 | | | | 186,576 | |
| |
Jack Henry & Associates, Inc. | | | 264 | | | | 38,457 | |
| |
Mastercard, Inc., Class A | | | 3,020 | | | | 901,742 | |
| |
Paychex, Inc. | | | 1,082 | | | | 92,035 | |
| |
PayPal Holdings, Inc.(b) | | | 3,986 | | | | 431,166 | |
| |
Visa, Inc., Class A | | | 5,824 | | | | 1,094,330 | |
| |
Western Union Co. (The) | | | 1,435 | | | | 38,429 | |
| |
| | | | | | | 3,695,298 | |
| |
|
| Department Stores-0.07% | |
Kohl’s Corp. | | | 549 | | | | 27,972 | |
| |
Macy’s, Inc. | | | 1,085 | | | | 18,445 | |
| |
Nordstrom, Inc. | | | 381 | | | | 15,594 | |
| |
| | | | | | | 62,011 | |
| |
|
| Distillers & Vintners-0.17% | |
Brown-Forman Corp., Class B | | | 628 | | | | 42,453 | |
| |
Constellation Brands, Inc., Class A | | | 565 | | | | 107,209 | |
| |
| | | | | | | 149,662 | |
| |
See accompanying Notes to Financial Statements which are an integral part of the financial statements.
Invesco V.I. S&P 500 Index Fund
| | | | | | | | |
| | | Shares | | | Value | |
| Distributors-0.10% | |
Genuine Parts Co. | | | 502 | | | $ | 53,327 | |
| |
LKQ Corp.(b) | | | 1,064 | | | | 37,985 | |
| |
| | | | | | | 91,312 | |
| |
|
| Diversified Banks-4.51% | |
Bank of America Corp. | | | 27,547 | | | | 970,205 | |
| |
Citigroup, Inc. | | | 7,428 | | | | 593,423 | |
| |
JPMorgan Chase & Co. | | | 10,672 | | | | 1,487,677 | |
| |
U.S. Bancorp | | | 4,835 | | | | 286,667 | |
| |
Wells Fargo & Co. | | | 13,096 | | | | 704,565 | |
| |
| | | | | | | 4,042,537 | |
| |
|
| Diversified Chemicals-0.04% | |
Eastman Chemical Co. | | | 463 | | | | 36,697 | |
| |
|
| Diversified Support Services-0.16% | |
Cintas Corp. | | | 285 | | | | 76,688 | |
| |
Copart, Inc.(b) | | | 693 | | | | 63,021 | |
| |
| | | | | | | 139,709 | |
| |
|
| Drug Retail-0.17% | |
Walgreens Boots Alliance, Inc. | | | 2,550 | | | | 150,348 | |
| |
|
| Electric Utilities-2.06% | |
Alliant Energy Corp. | | | 813 | | | | 44,487 | |
| |
American Electric Power Co., Inc. | | | 1,672 | | | | 158,021 | |
| |
Duke Energy Corp. | | | 2,479 | | | | 226,109 | |
| |
Edison International | | | 1,212 | | | | 91,397 | |
| |
Entergy Corp. | | | 672 | | | | 80,506 | |
| |
Evergy, Inc. | | | 775 | | | | 50,445 | |
| |
Eversource Energy | | | 1,095 | | | | 93,152 | |
| |
Exelon Corp. | | | 3,291 | | | | 150,037 | |
| |
FirstEnergy Corp. | | | 1,828 | | | | 88,841 | |
| |
NextEra Energy, Inc. | | | 1,662 | | | | 402,470 | |
| |
Pinnacle West Capital Corp. | | | 379 | | | | 34,083 | |
| |
PPL Corp. | | | 2,446 | | | | 87,762 | |
| |
Southern Co. (The) | | | 3,568 | | | | 227,282 | |
| |
Xcel Energy, Inc. | | | 1,776 | | | | 112,758 | |
| |
| | | | | | | 1,847,350 | |
| |
|
| Electrical Components & Equipment-0.50% | |
AMETEK, Inc. | | | 772 | | | | 76,999 | |
| |
Eaton Corp. PLC | | | 1,406 | | | | 133,176 | |
| |
Emerson Electric Co. | | | 2,083 | | | | 158,850 | |
| |
Rockwell Automation, Inc. | | | 395 | | | | 80,055 | |
| |
| | | | | | | 449,080 | |
| |
|
| Electronic Components-0.21% | |
Amphenol Corp., Class A | | | 1,007 | | | | 108,988 | |
| |
Corning, Inc. | | | 2,645 | | | | 76,996 | |
| |
| | | | | | | 185,984 | |
| |
|
| Electronic Equipment & Instruments-0.15% | |
FLIR Systems, Inc. | | | 458 | | | | 23,848 | |
| |
Keysight Technologies, Inc.(b) | | | 634 | | | | 65,067 | |
| |
| | | | | | | | |
| | | Shares | | | Value | |
| Electronic Equipment & Instruments-(continued) | |
Zebra Technologies Corp., Class A(b) | | | 183 | | | $ | 46,746 | |
| |
| | | | | | | 135,661 | |
| |
| |
| Electronic Manufacturing Services-0.14% | | | | | |
IPG Photonics Corp.(b) | | | 121 | | | | 17,535 | |
| |
TE Connectivity Ltd. | | | 1,137 | | | | 108,970 | |
| |
| | | | | | | 126,505 | |
| |
| |
| Environmental & Facilities Services-0.26% | | | | | |
Republic Services, Inc. | | | 716 | | | | 64,175 | |
| |
Rollins, Inc. | | | 476 | | | | 15,784 | |
| |
Waste Management, Inc. | | | 1,321 | | | | 150,541 | |
| |
| | | | | | | 230,500 | |
| |
|
| Fertilizers & Agricultural Chemicals-0.20% | |
CF Industries Holdings, Inc. | | | 754 | | | | 35,996 | |
| |
Corteva, Inc. | | | 2,536 | | | | 74,964 | |
| |
FMC Corp. | | | 450 | | | | 44,919 | |
| |
Mosaic Co. (The) | | | 1,147 | | | | 24,821 | |
| |
| | | | | | | 180,700 | |
| |
| |
| Financial Exchanges & Data-1.11% | | | | | |
Cboe Global Markets, Inc. | | | 383 | | | | 45,960 | |
| |
CME Group, Inc., Class A | | | 1,218 | | | | 244,477 | |
| |
Intercontinental Exchange, Inc. | | | 1,898 | | | | 175,660 | |
| |
MarketAxess Holdings, Inc. | | | 128 | | | | 48,526 | |
| |
Moody’s Corp. | | | 550 | | | | 130,575 | |
| |
MSCI, Inc. | | | 290 | | | | 74,872 | |
| |
Nasdaq, Inc. | | | 398 | | | | 42,626 | |
| |
S&P Global, Inc. | | | 833 | | | | 227,451 | |
| |
| | | | | | | 990,147 | |
| |
| |
| Food Distributors-0.17% | | | | | |
Sysco Corp. | | | 1,738 | | | | 148,669 | |
| |
| | |
| Food Retail-0.09% | | | | | | | | |
Kroger Co. (The) | | | 2,729 | | | | 79,114 | |
| |
| | |
| Footwear-0.48% | | | | | | | | |
NIKE, Inc., Class B | | | 4,241 | | | | 429,656 | |
| |
| | |
| Gas Utilities-0.05% | | | | | | | | |
Atmos Energy Corp. | | | 402 | | | | 44,968 | |
| |
| |
| General Merchandise Stores-0.48% | | | | | |
Dollar General Corp. | | | 870 | | | | 135,703 | |
| |
Dollar Tree, Inc.(b) | | | 800 | | | | 75,240 | |
| |
Target Corp. | | | 1,730 | | | | 221,803 | |
| |
| | | | | | | 432,746 | |
| |
| | |
| Gold-0.13% | | | | | | | | |
Newmont Goldcorp Corp. | | | 2,777 | | | | 120,661 | |
| |
| |
| Health Care Distributors-0.24% | | | | | |
AmerisourceBergen Corp. | | | 514 | | | | 43,700 | |
| |
Cardinal Health, Inc. | | | 1,009 | | | | 51,035 | |
| |
See accompanying Notes to Financial Statements which are an integral part of the financial statements.
Invesco V.I. S&P 500 Index Fund
| | | | | | | | |
| | | Shares | | | Value | |
|
| Health Care Distributors-(continued) | |
Henry Schein, Inc.(b) | | | 512 | | | $ | 34,161 | |
| |
McKesson Corp. | | | 612 | | | | 84,652 | |
| |
| | | | | | | 213,548 | |
| |
|
| Health Care Equipment-3.45% | |
Abbott Laboratories | | | 6,013 | | | | 522,289 | |
| |
ABIOMED, Inc.(b) | | | 157 | | | | 26,783 | |
| |
Baxter International, Inc. | | | 1,729 | | | | 144,579 | |
| |
Becton, Dickinson and Co. | | | 919 | | | | 249,940 | |
| |
Boston Scientific Corp.(b) | | | 4,742 | | | | 214,433 | |
| |
Danaher Corp. | | | 2,174 | | | | 333,666 | |
| |
Edwards Lifesciences Corp.(b) | | | 709 | | | | 165,403 | |
| |
Hologic, Inc.(b) | | | 922 | | | | 48,138 | |
| |
IDEXX Laboratories, Inc.(b) | | | 295 | | | | 77,033 | |
| |
Intuitive Surgical, Inc.(b) | | | 393 | | | | 232,322 | |
| |
Medtronic PLC | | | 4,560 | | | | 517,332 | |
| |
ResMed, Inc. | | | 492 | | | | 76,245 | |
| |
STERIS PLC | | | 288 | | | | 43,897 | |
| |
Stryker Corp. | | | 1,095 | | | | 229,884 | |
| |
Teleflex, Inc. | | | 155 | | | | 58,348 | |
| |
Varian Medical Systems, Inc.(b) | | | 307 | | | | 43,597 | |
| |
Zimmer Biomet Holdings, Inc. | | | 694 | | | | 103,878 | |
| |
| | | | | | | 3,087,767 | |
| |
|
| Health Care Facilities-0.19% | |
HCA Healthcare, Inc. | | | 900 | | | | 133,029 | |
| |
Universal Health Services, Inc., Class B | | | 274 | | | | 39,308 | |
| |
| | | | | | | 172,337 | |
| |
|
| Health Care REITs-0.27% | |
Healthpeak Properties, Inc. | | | 1,663 | | | | 57,324 | |
| |
Ventas, Inc. | | | 1,261 | | | | 72,810 | |
| |
Welltower, Inc. | | | 1,372 | | | | 112,202 | |
| |
| | | | | | | 242,336 | |
| |
|
| Health Care Services-0.80% | |
Cigna Corp. | | | 1,270 | | | | 259,702 | |
| |
CVS Health Corp. | | | 4,426 | | | | 328,808 | |
| |
DaVita, Inc.(b) | | | 306 | | | | 22,959 | |
| |
Laboratory Corp. of America Holdings(b) | | | 330 | | | | 55,826 | |
| |
Quest Diagnostics, Inc. | | | 461 | | | | 49,230 | |
| |
| | | | | | | 716,525 | |
| |
|
| Health Care Supplies-0.18% | |
Align Technology, Inc.(b) | | | 245 | | | | 68,365 | |
| |
Cooper Cos., Inc. (The) | | | 167 | | | | 53,655 | |
| |
DENTSPLY SIRONA, Inc. | | | 756 | | | | 42,782 | |
| |
| | | | | | | 164,802 | |
| |
|
| Health Care Technology-0.09% | |
Cerner Corp. | | | 1,078 | | | | 79,114 | |
| |
|
| Home Furnishings-0.06% | |
Leggett & Platt, Inc. | | | 451 | | | | 22,925 | |
| |
| | | | | | | | |
| | | Shares | | | Value | |
|
| Home Furnishings-(continued) | |
Mohawk Industries, Inc.(b) | | | 206 | | | $ | 28,094 | |
| |
| | | | | | | 51,019 | |
| |
|
| Home Improvement Retail-1.25% | |
Home Depot, Inc. (The) | | | 3,710 | | | | 810,190 | |
| |
Lowe’s Cos., Inc. | | | 2,614 | | | | 313,052 | |
| |
| | | | | | | 1,123,242 | |
| |
|
| Homebuilding-0.21% | |
D.R. Horton, Inc. | | | 1,139 | | | | 60,082 | |
| |
Lennar Corp., Class A | | | 962 | | | | 53,670 | |
| |
NVR, Inc.(b) | | | 11 | | | | 41,892 | |
| |
PulteGroup, Inc. | | | 877 | | | | 34,028 | |
| |
| | | | | | | 189,672 | |
| |
|
| Hotel & Resort REITs-0.05% | |
Host Hotels & Resorts, Inc. | | | 2,414 | | | | 44,780 | |
| |
|
| Hotels, Resorts & Cruise Lines-0.49% | |
Carnival Corp. | | | 1,355 | | | | 68,875 | |
| |
Hilton Worldwide Holdings, Inc. | | | 959 | | | | 106,363 | |
| |
Marriott International, Inc., Class A | | | 925 | | | | 140,073 | |
| |
Norwegian Cruise Line Holdings Ltd.(b) | | | 723 | | | | 42,230 | |
| |
Royal Caribbean Cruises Ltd. | | | 581 | | | | 77,569 | |
| |
| | | | | | | 435,110 | |
| |
|
| Household Appliances-0.04% | |
Whirlpool Corp. | | | 221 | | | | 32,604 | |
| |
|
| Household Products-1.72% | |
Church & Dwight Co., Inc. | | | 847 | | | | 59,578 | |
| |
Clorox Co. (The) | | | 425 | | | | 65,254 | |
| |
Colgate-Palmolive Co. | | | 2,906 | | | | 200,049 | |
| |
Kimberly-Clark Corp. | | | 1,165 | | | | 160,246 | |
| |
Procter & Gamble Co. (The) | | | 8,480 | | | | 1,059,152 | |
| |
| | | | | | | 1,544,279 | |
| |
|
| Housewares & Specialties-0.03% | |
Newell Brands, Inc. | | | 1,310 | | | | 25,178 | |
| |
|
| Human Resource & Employment Services-0.03% | |
Robert Half International, Inc. | | | 397 | | | | 25,071 | |
| |
|
| Hypermarkets & Super Centers-1.13% | |
Costco Wholesale Corp. | | | 1,502 | | | | 441,468 | |
| |
Walmart, Inc. | | | 4,826 | | | | 573,522 | |
| |
| | | | | | | 1,014,990 | |
| |
|
| Independent Power Producers & Energy Traders-0.09% | |
AES Corp. (The) | | | 2,239 | | | | 44,556 | |
| |
NRG Energy, Inc. | | | 856 | | | | 34,026 | |
| |
| | | | | | | 78,582 | |
| |
|
| Industrial Conglomerates-1.38% | |
3M Co. | | | 1,956 | | | | 345,077 | |
| |
General Electric Co.(d) | | | 29,718 | | | | 331,653 | |
| |
See accompanying Notes to Financial Statements which are an integral part of the financial statements.
Invesco V.I. S&P 500 Index Fund
| | | | | | | | |
| | | Shares | | | Value | |
| Industrial Conglomerates-(continued) | |
Honeywell International, Inc. | | | 2,435 | | | $ | 430,995 | |
| |
Roper Technologies, Inc. | | | 351 | | | | 124,335 | |
| |
| | | | | | | 1,232,060 | |
| |
|
| Industrial Gases-0.63% | |
Air Products and Chemicals, Inc. | | | 749 | | | | 176,007 | |
| |
Linde PLC (United Kingdom) | | | 1,831 | | | | 389,820 | |
| |
| | | | | | | 565,827 | |
| |
|
| Industrial Machinery-0.86% | |
Dover Corp. | | | 491 | | | | 56,593 | |
| |
Flowserve Corp. | | | 450 | | | | 22,396 | |
| |
Fortive Corp. | | | 999 | | | | 76,314 | |
| |
IDEX Corp. | | | 256 | | | | 44,032 | |
| |
Illinois Tool Works, Inc. | | | 996 | | | | 178,911 | |
| |
Ingersoll-Rand PLC | | | 817 | | | | 108,596 | |
| |
Parker-Hannifin Corp. | | | 434 | | | | 89,326 | |
| |
Pentair PLC | | | 580 | | | | 26,605 | |
| |
Snap-on, Inc. | | | 189 | | | | 32,016 | |
| |
Stanley Black & Decker, Inc. | | | 513 | | | | 85,025 | |
| |
Xylem, Inc. | | | 618 | | | | 48,692 | |
| |
| | | | | | | 768,506 | |
| |
|
| Industrial REITs-0.26% | |
Duke Realty Corp. | | | 1,237 | | | | 42,887 | |
| |
Prologis, Inc. | | | 2,148 | | | | 191,473 | |
| |
| | | | | | | 234,360 | |
| |
|
| Insurance Brokers-0.57% | |
Aon PLC | | | 798 | | | | 166,215 | |
| |
Arthur J. Gallagher & Co. | | | 637 | | | | 60,661 | |
| |
Marsh & McLennan Cos., Inc. | | | 1,714 | | | | 190,957 | |
| |
Willis Towers Watson PLC | | | 436 | | | | 88,046 | |
| |
| | | | | | | 505,879 | |
| |
|
| Integrated Oil & Gas-2.13% | |
Chevron Corp. | | | 6,432 | | | | 775,120 | |
| |
Exxon Mobil Corp. | | | 14,397 | | | | 1,004,623 | |
| |
Occidental Petroleum Corp. | | | 3,030 | | | | 124,866 | |
| |
| | | | | | | 1,904,609 | |
| |
|
| Integrated Telecommunication Services-2.05% | |
AT&T, Inc. | | | 24,871 | | | | 971,958 | |
| |
Verizon Communications, Inc. | | | 14,072 | | | | 864,021 | |
| |
| | | | | | | 1,835,979 | |
| |
|
| Interactive Home Entertainment-0.35% | |
Activision Blizzard, Inc. | | | 2,598 | | | | 154,373 | |
| |
Electronic Arts, Inc.(b) | | | 997 | | | | 107,188 | |
| |
Take-Two Interactive Software, Inc.(b) | | | 386 | | | | 47,258 | |
| |
| | | | | | | 308,819 | |
| |
|
| Interactive Media & Services-5.01% | |
Alphabet, Inc., Class A(b) | | | 1,019 | | | | 1,364,839 | |
| |
Alphabet, Inc., Class C(b) | | | 1,016 | | | | 1,358,412 | |
| |
| | | | | | | | |
| | | Shares | | | Value | |
| Interactive Media & Services-(continued) | |
Facebook, Inc., Class A(b) | | | 8,188 | | | $ | 1,680,587 | |
| |
Twitter, Inc.(b) | | | 2,618 | | | | 83,907 | |
| |
| | | | | | | 4,487,745 | |
| |
|
| Internet & Direct Marketing Retail-3.41% | |
Amazon.com, Inc.(b) | | | 1,416 | | | | 2,616,541 | |
| |
Booking Holdings, Inc.(b) | | | 142 | | | | 291,630 | |
| |
eBay, Inc. | | | 2,602 | | | | 93,958 | |
| |
Expedia Group, Inc. | | | 483 | | | | 52,232 | |
| |
| | | | | | | 3,054,361 | |
| |
|
| Internet Services & Infrastructure-0.13% | |
Akamai Technologies, Inc.(b) | | | 549 | | | | 47,423 | |
| |
VeriSign, Inc.(b) | | | 352 | | | | 67,823 | |
| |
| | | | | | | 115,246 | |
| |
|
| Investment Banking & Brokerage-0.80% | |
Charles Schwab Corp. (The) | | | 3,889 | | | | 184,961 | |
| |
E*TRADE Financial Corp. | | | 767 | | | | 34,799 | |
| |
Goldman Sachs Group, Inc. (The) | | | 1,083 | | | | 249,014 | |
| |
Morgan Stanley | | | 4,185 | | | | 213,937 | |
| |
Raymond James Financial, Inc. | | | 417 | | | | 37,305 | |
| |
| | | | | | | 720,016 | |
| |
|
| IT Consulting & Other Services-1.23% | |
Accenture PLC, Class A | | | 2,158 | | | | 454,410 | |
| |
Cognizant Technology Solutions Corp., Class A | | | 1,870 | | | | 115,977 | |
| |
DXC Technology Co. | | | 886 | | | | 33,305 | |
| |
Gartner, Inc.(b) | | | 309 | | | | 47,617 | |
| |
International Business Machines Corp. | | | 3,013 | | | | 403,862 | |
| |
Leidos Holdings, Inc. | | | 452 | | | | 44,246 | |
| |
| | | | | | | 1,099,417 | |
| |
|
| Leisure Products-0.05% | |
Hasbro, Inc. | | | 425 | | | | 44,884 | |
| |
|
| Life & Health Insurance-0.61% | |
Aflac, Inc. | | | 2,508 | | | | 132,673 | |
| |
Globe Life, Inc. | | | 339 | | | | 35,680 | |
| |
Lincoln National Corp. | | | 677 | | | | 39,950 | |
| |
MetLife, Inc. | | | 2,659 | | | | 135,529 | |
| |
Principal Financial Group, Inc. | | | 891 | | | | 49,005 | |
| |
Prudential Financial, Inc. | | | 1,361 | | | | 127,580 | |
| |
Unum Group | | | 728 | | | | 21,229 | |
| |
| | | | | | | 541,646 | |
| |
|
| Life Sciences Tools & Services-1.06% | |
Agilent Technologies, Inc. | | | 1,047 | | | | 89,320 | |
| |
Illumina, Inc.(b) | | | 500 | | | | 165,870 | |
| |
IQVIA Holdings, Inc.(b) | | | 616 | | | | 95,178 | |
| |
Mettler-Toledo International, Inc.(b) | | | 84 | | | | 66,636 | |
| |
PerkinElmer, Inc. | | | 375 | | | | 36,412 | |
| |
Thermo Fisher Scientific, Inc. | | | 1,363 | | | | 442,798 | |
| |
See accompanying Notes to Financial Statements which are an integral part of the financial statements.
Invesco V.I. S&P 500 Index Fund
| | | | | | | | |
| | | Shares | | | Value | |
| Life Sciences Tools & Services-(continued) | |
Waters Corp.(b) | | | 219 | | | $ | 51,169 | |
| |
| | | | | | | 947,383 | |
| |
|
| Managed Health Care-1.70% | |
Anthem, Inc. | | | 864 | | | | 260,954 | |
| |
Centene Corp.(b) | | | 1,400 | | | | 88,018 | |
| |
Humana, Inc. | | | 450 | | | | 164,934 | |
| |
UnitedHealth Group, Inc. | | | 3,223 | | | | 947,498 | |
| |
WellCare Health Plans, Inc.(b) | | | 172 | | | | 56,796 | |
| |
| | | | | | | 1,518,200 | |
| |
|
| Metal & Glass Containers-0.08% | |
Ball Corp. | | | 1,124 | | | | 72,689 | |
| |
|
| Motorcycle Manufacturers-0.02% | |
Harley-Davidson, Inc. | | | 547 | | | | 20,343 | |
| |
|
| Movies & Entertainment-1.57% | |
Live Nation Entertainment, Inc.(b) | | | 479 | | | | 34,234 | |
| |
Netflix, Inc.(b) | | | 1,490 | | | | 482,120 | |
| |
Walt Disney Co. (The) | | | 6,132 | | | | 886,871 | |
| |
| | | | | | | 1,403,225 | |
| |
|
| Multi-line Insurance-0.28% | |
American International Group, Inc. | | | 2,947 | | | | 151,270 | |
| |
Assurant, Inc. | | | 210 | | | | 27,527 | |
| |
Hartford Financial Services Group, Inc. (The) | | | 1,224 | | | | 74,382 | |
| |
| | | | | | | 253,179 | |
| |
|
| Multi-Sector Holdings-1.68% | |
Berkshire Hathaway, Inc., Class B(b) | | | 6,655 | | | | 1,507,357 | |
| |
|
| Multi-Utilities-1.08% | |
Ameren Corp. | | | 832 | | | | 63,898 | |
| |
CenterPoint Energy, Inc. | | | 1,728 | | | | 47,122 | |
| |
CMS Energy Corp. | | | 976 | | | | 61,332 | |
| |
Consolidated Edison, Inc. | | | 1,124 | | | | 101,688 | |
| |
Dominion Energy, Inc. | | | 2,800 | | | | 231,896 | |
| |
DTE Energy Co. | | | 653 | | | | 84,805 | |
| |
NiSource, Inc. | | | 1,264 | | | | 35,190 | |
| |
Public Service Enterprise Group, Inc. | | | 1,712 | | | | 101,093 | |
| |
Sempra Energy | | | 958 | | | | 145,118 | |
| |
WEC Energy Group, Inc. | | | 1,068 | | | | 98,502 | |
| |
| | | | | | | 970,644 | |
| |
|
| Office REITs-0.21% | |
Alexandria Real Estate Equities, Inc. | | | 388 | | | | 62,693 | |
| |
Boston Properties, Inc. | | | 486 | | | | 67,000 | |
| |
SL Green Realty Corp. | | | 277 | | | | 25,451 | |
| |
Vornado Realty Trust | | | 547 | | | | 36,375 | |
| |
| | | | | | | 191,519 | |
| |
|
| Oil & Gas Drilling-0.02% | |
Helmerich & Payne, Inc. | | | 379 | | | | 17,218 | |
| |
| | | | | | | | |
| | | Shares | | | Value | |
|
| Oil & Gas Equipment & Services-0.43% | |
Baker Hughes Co., Class A | | | 2,174 | | | $ | 55,719 | |
| |
Halliburton Co. | | | 3,009 | | | | 73,630 | |
| |
National Oilwell Varco, Inc. | | | 1,333 | | | | 33,392 | |
| |
Schlumberger Ltd. | | | 4,710 | | | | 189,342 | |
| |
TechnipFMC PLC (United Kingdom) | | | 1,429 | | | | 30,638 | |
| |
| | | | | | | 382,721 | |
| |
|
| Oil & Gas Exploration & Production-0.95% | |
Apache Corp. | | | 1,294 | | | | 33,113 | |
| |
Cabot Oil & Gas Corp. | | | 1,387 | | | | 24,148 | |
| |
Cimarex Energy Co. | | | 350 | | | | 18,372 | |
| |
Concho Resources, Inc. | | | 690 | | | | 60,423 | |
| |
ConocoPhillips | | | 3,733 | | | | 242,757 | |
| |
Devon Energy Corp. | | | 1,329 | | | | 34,514 | |
| |
Diamondback Energy, Inc. | | | 548 | | | | 50,887 | |
| |
EOG Resources, Inc. | | | 1,978 | | | | 165,677 | |
| |
Hess Corp. | | | 876 | | | | 58,526 | |
| |
Marathon Oil Corp. | | | 2,715 | | | | 36,870 | |
| |
Noble Energy, Inc. | | | 1,626 | | | | 40,390 | |
| |
Pioneer Natural Resources Co. | | | 565 | | | | 85,524 | |
| |
| | | | | | | 851,201 | |
| |
|
| Oil & Gas Refining & Marketing-0.51% | |
HollyFrontier Corp. | | | 523 | | | | 26,521 | |
| |
Marathon Petroleum Corp. | | | 2,208 | | | | 133,032 | |
| |
Phillips 66 | | | 1,519 | | | | 169,232 | |
| |
Valero Energy Corp. | | | 1,403 | | | | 131,391 | |
| |
| | | | | | | 460,176 | |
| |
|
| Oil & Gas Storage & Transportation-0.38% | |
Kinder Morgan, Inc. | | | 6,596 | | | | 139,637 | |
| |
ONEOK, Inc. | | | 1,398 | | | | 105,787 | |
| |
Williams Cos., Inc. (The) | | | 4,088 | | | | 96,967 | |
| |
| | | | | | | 342,391 | |
| |
|
| Packaged Foods & Meats-1.06% | |
Campbell Soup Co. | | | 582 | | | | 28,762 | |
| |
Conagra Brands, Inc. | | | 1,672 | | | | 57,249 | |
| |
General Mills, Inc. | | | 2,044 | | | | 109,477 | |
| |
Hershey Co. (The) | | | 503 | | | | 73,931 | |
| |
Hormel Foods Corp. | | | 959 | | | | 43,260 | |
| |
JM Smucker Co. (The) | | | 385 | | | | 40,090 | |
| |
Kellogg Co. | | | 855 | | | | 59,132 | |
| |
Kraft Heinz Co. (The) | | | 2,107 | | | | 67,698 | |
| |
Lamb Weston Holdings, Inc. | | | 492 | | | | 42,327 | |
| |
McCormick & Co., Inc. | | | 420 | | | | 71,286 | |
| |
Mondelez International, Inc., Class A | | | 4,884 | | | | 269,011 | |
| |
Tyson Foods, Inc., Class A | | | 997 | | | | 90,767 | |
| |
| | | | | | | 952,990 | |
| |
|
| Paper Packaging-0.28% | |
Amcor PLC | | | 5,489 | | | | 59,501 | |
| |
Avery Dennison Corp. | | | 289 | | | | 37,807 | |
| |
International Paper Co. | | | 1,330 | | | | 61,246 | |
| |
See accompanying Notes to Financial Statements which are an integral part of the financial statements.
Invesco V.I. S&P 500 Index Fund
| | | | | | | | |
| | | Shares | | | Value | |
| Paper Packaging-(continued) | |
Packaging Corp. of America | | | 324 | | | $ | 36,285 | |
| |
Sealed Air Corp. | | | 535 | | | | 21,309 | |
| |
Westrock Co. | | | 871 | | | | 37,375 | |
| |
| | | | | | | 253,523 | |
| |
|
| Personal Products-0.19% | |
Coty, Inc., Class A | | | 977 | | | | 10,991 | |
| |
Estee Lauder Cos., Inc. (The), Class A | | | 757 | | | | 156,351 | |
| |
| | | | | | | 167,342 | |
| |
|
| Pharmaceuticals-4.70% | |
Allergan PLC | | | 1,116 | | | | 213,346 | |
| |
Bristol-Myers Squibb Co. | | | 7,976 | | | | 511,979 | |
| |
Eli Lilly and Co. | | | 2,878 | | | | 378,256 | |
| |
Johnson & Johnson | | | 8,955 | | | | 1,306,266 | |
| |
Merck & Co., Inc. | | | 8,663 | | | | 787,900 | |
| |
Mylan N.V.(b) | | | 1,771 | | | | 35,597 | |
| |
Perrigo Co. PLC | | | 470 | | | | 24,280 | |
| |
Pfizer, Inc. | | | 18,850 | | | | 738,543 | |
| |
Zoetis, Inc. | | | 1,617 | | | | 214,010 | |
| |
| | | | | | | 4,210,177 | |
| |
|
| Property & Casualty Insurance-0.85% | |
Allstate Corp. (The) | | | 1,101 | | | | 123,808 | |
| |
Chubb Ltd. | | | 1,543 | | | | 240,183 | |
| |
Cincinnati Financial Corp. | | | 521 | | | | 54,783 | |
| |
Loews Corp. | | | 870 | | | | 45,666 | |
| |
Progressive Corp. (The) | | | 1,980 | | | | 143,332 | |
| |
Travelers Cos., Inc. (The) | | | 881 | | | | 120,653 | |
| |
W.R. Berkley Corp. | | | 490 | | | | 33,859 | |
| |
| | | | | | | 762,284 | |
| |
|
| Publishing-0.03% | |
News Corp., Class A | | | 1,299 | | | | 18,368 | |
| |
News Corp., Class B | | | 442 | | | | 6,413 | |
| |
| | | | | | | 24,781 | |
| |
|
| Railroads-0.94% | |
CSX Corp. | | | 2,646 | | | | 191,465 | |
| |
Kansas City Southern | | | 339 | | | | 51,921 | |
| |
Norfolk Southern Corp. | | | 891 | | | | 172,970 | |
| |
Union Pacific Corp. | | | 2,361 | | | | 426,845 | |
| |
| | | | | | | 843,201 | |
| |
|
| Real Estate Services-0.08% | |
CBRE Group, Inc., Class A(b) | | | 1,138 | | | | 69,748 | |
| |
|
| Regional Banks-1.21% | |
Citizens Financial Group, Inc. | | | 1,478 | | | | 60,022 | |
| |
Comerica, Inc. | | | 490 | | | | 35,157 | |
| |
Fifth Third Bancorp | | | 2,404 | | | | 73,899 | |
| |
First Republic Bank | | | 569 | | | | 66,829 | |
| |
Huntington Bancshares, Inc. | | | 3,478 | | | | 52,448 | |
| |
KeyCorp | | | 3,351 | | | | 67,824 | |
| |
M&T Bank Corp. | | | 451 | | | | 76,557 | |
| |
| | | | | | | | |
| | | Shares | | | Value | |
| Regional Banks-(continued) | |
People’s United Financial, Inc. | | | 1,502 | | | $ | 25,384 | |
| |
PNC Financial Services Group, Inc. (The) | | | 1,490 | | | | 237,849 | |
| |
Regions Financial Corp. | | | 3,280 | | | | 56,285 | |
| |
SVB Financial Group(b) | | | 173 | | | | 43,430 | |
| |
Truist Financial Corp. | | | 4,562 | | | | 256,932 | |
| |
Zions Bancorporation N.A. | | | 579 | | | | 30,062 | |
| |
| | | | | | | 1,082,678 | |
| |
|
| Reinsurance-0.04% | |
Everest Re Group Ltd. | | | 137 | | | | 37,927 | |
| |
|
| Research & Consulting Services-0.30% | |
Equifax, Inc. | | | 415 | | | | 58,150 | |
| |
IHS Markit Ltd.(b) | | | 1,358 | | | | 102,325 | |
| |
Nielsen Holdings PLC | | | 1,249 | | | | 25,355 | |
| |
Verisk Analytics, Inc. | | | 553 | | | | 82,585 | |
| |
| | | | | | | 268,415 | |
| |
|
| Residential REITs-0.43% | |
Apartment Investment & Management Co., Class A | | | 511 | | | | 26,393 | |
| |
AvalonBay Communities, Inc. | | | 472 | | | | 98,978 | |
| |
Equity Residential | | | 1,180 | | | | 95,486 | |
| |
Essex Property Trust, Inc. | | | 225 | | | | 67,694 | |
| |
Mid-America Apartment Communities, Inc. | | | 391 | | | | 51,557 | |
| |
UDR, Inc. | | | 991 | | | | 46,280 | |
| |
| | | | | | | 386,388 | |
| |
|
| Restaurants-1.21% | |
Chipotle Mexican Grill, Inc.(b) | | | 85 | | | | 71,154 | |
| |
Darden Restaurants, Inc. | | | 422 | | | | 46,002 | |
| |
McDonald’s Corp. | | | 2,561 | | | | 506,079 | |
| |
Starbucks Corp. | | | 4,018 | | | | 353,263 | |
| |
Yum! Brands, Inc. | | | 1,030 | | | | 103,752 | |
| |
| | | | | | | 1,080,250 | |
| |
|
| Retail REITs-0.37% | |
Federal Realty Investment Trust | | | 240 | | | | 30,895 | |
| |
Kimco Realty Corp. | | | 1,458 | | | | 30,195 | |
| |
Realty Income Corp. | | | 1,108 | | | | 81,582 | |
| |
Regency Centers Corp. | | | 574 | | | | 36,214 | |
| |
Simon Property Group, Inc. | | | 1,042 | | | | 155,216 | |
| |
| | | | | | | 334,102 | |
| |
|
| Semiconductor Equipment-0.48% | |
Applied Materials, Inc. | | | 3,129 | | | | 190,994 | |
| |
KLA Corp. | | | 538 | | | | 95,856 | |
| |
Lam Research Corp. | | | 493 | | | | 144,153 | |
| |
| | | | | | | 431,003 | |
| |
|
| Semiconductors-3.82% | |
Advanced Micro Devices, Inc.(b) | | | 3,789 | | | | 173,764 | |
| |
Analog Devices, Inc. | | | 1,250 | | | | 148,550 | |
| |
Broadcom, Inc. | | | 1,348 | | | | 425,995 | |
| |
Intel Corp. | | | 14,801 | | | | 885,840 | |
| |
Maxim Integrated Products, Inc. | | | 918 | | | | 56,466 | |
| |
See accompanying Notes to Financial Statements which are an integral part of the financial statements.
Invesco V.I. S&P 500 Index Fund
| | | | | | | | |
| | | Shares | | | Value | |
| Semiconductors–(continued) | |
Microchip Technology, Inc. | | | 805 | | | $ | 84,300 | |
| |
Micron Technology, Inc.(b) | | | 3,766 | | | | 202,536 | |
| |
NVIDIA Corp. | | | 2,081 | | | | 489,659 | |
| |
Qorvo, Inc.(b) | | | 398 | | | | 46,260 | |
| |
QUALCOMM, Inc. | | | 3,884 | | | | 342,685 | |
| |
Skyworks Solutions, Inc. | | | 580 | | | | 70,110 | |
| |
Texas Instruments, Inc. | | | 3,180 | | | | 407,962 | |
| |
Xilinx, Inc. | | | 855 | | | | 83,593 | |
| |
| | | | | | | 3,417,720 | |
| |
|
| Soft Drinks–1.63% | |
Coca-Cola Co. (The) | | | 13,121 | | | | 726,247 | |
| |
Monster Beverage Corp.(b) | | | 1,310 | | | | 83,251 | |
| |
PepsiCo., Inc. | | | 4,737 | | | | 647,406 | |
| |
| | | | | | | 1,456,904 | |
| |
|
| Specialized Consumer Services–0.02% | |
H&R Block, Inc. | | | 664 | | | | 15,591 | |
| |
|
| Specialized REITs-1.29% | |
American Tower Corp. | | | 1,506 | | | | 346,109 | |
| |
Crown Castle International Corp. | | | 1,414 | | | | 201,000 | |
| |
Digital Realty Trust, Inc. | | | 705 | | | | 84,417 | |
| |
Equinix, Inc. | | | 290 | | | | 169,273 | |
| |
Extra Space Storage, Inc. | | | 438 | | | | 46,261 | |
| |
Iron Mountain, Inc. | | | 971 | | | | 30,946 | |
| |
Public Storage | | | 507 | | | | 107,971 | |
| |
SBA Communications Corp., Class A | | | 382 | | | | 92,058 | |
| |
Weyerhaeuser Co. | | | 2,523 | | | | 76,195 | |
| |
| | | | | | | 1,154,230 | |
| |
|
| Specialty Chemicals–0.81% | |
Albemarle Corp. | | | 364 | | | | 26,587 | |
| |
Celanese Corp. | | | 418 | | | | 51,464 | |
| |
DuPont de Nemours, Inc. | | | 2,525 | | | | 162,105 | |
| |
Ecolab, Inc. | | | 853 | | | | 164,620 | |
| |
International Flavors & Fragrances, Inc. | | | 368 | | | | 47,479 | |
| |
PPG Industries, Inc. | | | 799 | | | | 106,659 | |
| |
Sherwin-Williams Co. (The) | | | 279 | | | | 162,808 | |
| |
| | | | | | | 721,722 | |
| |
|
| Specialty Stores–0.15% | |
Tiffany & Co. | | | 371 | | | | 49,584 | |
| |
Tractor Supply Co. | | | 403 | | | | 37,657 | |
| |
Ulta Beauty, Inc.(b) | | | 194 | | | | 49,109 | |
| |
| | | | | | | 136,350 | |
| |
| Steel-0.06% | |
Nucor Corp. | | | 1,026 | | | | 57,743 | |
| |
|
| Systems Software-5.32% | |
Fortinet, Inc.(b) | | | 479 | | | | 51,138 | |
| |
Microsoft Corp. | | | 25,959 | | | | 4,093,734 | |
| |
| | | | | | | | |
| | | Shares | | | Value | |
| Systems Software-(continued) | |
NortonLifeLock, Inc. | | | 1,925 | | | $ | 49,126 | |
| |
Oracle Corp. | | | 7,360 | | | | 389,933 | |
| |
ServiceNow, Inc.(b) | | | 641 | | | | 180,967 | |
| |
| | | | | | | 4,764,898 | |
| |
|
| Technology Distributors-0.08% | |
CDW Corp. | | | 489 | | | | 69,849 | |
| |
|
| Technology Hardware, Storage & Peripherals-5.06% | |
Apple, Inc. | | | 14,211 | | | | 4,173,060 | |
| |
Hewlett Packard Enterprise Co. | | | 4,395 | | | | 69,705 | |
| |
HP, Inc. | | | 5,021 | | | | 103,182 | |
| |
NetApp, Inc. | | | 776 | | | | 48,306 | |
| |
Seagate Technology PLC | | | 786 | | | | 46,767 | |
| |
Western Digital Corp. | | | 1,002 | | | | 63,597 | |
| |
Xerox Holdings Corp. | | | 643 | | | | 23,707 | |
| |
| | | | | | | 4,528,324 | |
| |
|
| Tobacco-0.86% | |
Altria Group, Inc. | | | 6,356 | | | | 317,228 | |
| |
Philip Morris International, Inc. | | | 5,294 | | | | 450,466 | |
| |
| | | | | | | 767,694 | |
| |
|
| Trading Companies & Distributors-0.18% | |
Fastenal Co. | | | 1,942 | | | | 71,757 | |
| |
United Rentals, Inc.(b) | | | 260 | | | | 43,360 | |
| |
W.W. Grainger, Inc. | | | 148 | | | | 50,101 | |
| |
| | | | | | | 165,218 | |
| |
|
| Trucking-0.08% | |
J.B. Hunt Transport Services, Inc. | | | 295 | | | | 34,450 | |
| |
Old Dominion Freight Line, Inc. | | | 217 | | | | 41,182 | |
| |
| | | | | | | 75,632 | |
| |
|
| Water Utilities-0.08% | |
American Water Works Co., Inc. | | | 611 | | | | 75,061 | |
| |
|
| Wireless Telecommunication Services-0.09% | |
T-Mobile US, Inc.(b) | | | 1,070 | | | | 83,909 | |
| |
Total Common Stocks & Other Equity Interests
(Cost $24,846,256) | | | | | | | 91,022,817 | |
| |
|
| Money Market Funds-0.92% | |
Invesco Government & Agency Portfolio, Institutional Class, 1.50%(e) | | | 281,283 | | | | 281,283 | |
| |
Invesco Liquid Assets Portfolio, Institutional Class, 1.71%(e) | | | 221,928 | | | | 221,995 | |
| |
Invesco Treasury Portfolio, Institutional Class, 1.49%(e) | | | 321,467 | | | | 321,467 | |
| |
Total Money Market Funds
(Cost $824,767) | | | | | | | 824,745 | |
| |
TOTAL INVESTMENTS IN SECURITIES - 102.55%
(Cost $25,671,023) | | | | | | | 91,847,562 | |
| |
OTHER ASSETS LESS LIABILITIES - (2.55)% | | | | | | | (2,284,694 | ) |
| |
NET ASSETS-100.00% | | | | | | $ | 89,562,868 | |
| |
See accompanying Notes to Financial Statements which are an integral part of the financial statements.
Invesco V.I. S&P 500 Index Fund
Investment Abbreviations:
REIT - Real Estate Investment Trust
Notes to Schedule of Investments:
| (a) | Industry and/or sector classifications used in this report are generally according to the Global Industry Classification Standard, which was developed by and is the exclusive property and a service mark of MSCI Inc. and Standard & Poor’s. |
| (b) | Non-income producing security. |
| (c) | The Fund’s Adviser is a wholly-owned subsidiary of Invesco Ltd. and therefore, Invesco Ltd. is considered to be affiliated. The table below shows the Fund’s transactions in, and earnings from, its investments in affiliates (excluding affiliated money market funds) for the fiscal year ended December 31, 2019. |
| | | | | | | | | | | | | | |
| | Value
December 31, 2018 | | Purchases
at Cost | | Proceeds
from Sales | | Change in
Unrealized
Appreciation | | Realized Gain
(Loss) | | Value
December 31, 2019 | | Dividend
Income |
|
Invesco Ltd. | | $25,428 | | $- | | $(5,462) | | $4,213 | | $(2,261) | | $21,918 | | $1,744 |
|
| (d) | All or a portion of the value was pledged as collateral to cover margin requirements for open futures contracts. See Note 1J. |
| (e) | The money market fund and the Fund are affiliated by having the same investment adviser. The rate shown is the7-day SEC standardized yield as of December 31, 2019. |
| | | | | | | | | | | | | | | | | | |
| Open Futures Contracts | |
| |
| Long Futures Contracts | | Number of
Contracts | | | Expiration
Month | | Notional
Value | | | Value | | | Unrealized
Appreciation | |
| |
Equity Risk | | | | | | | | | | | | | | | | | | |
| |
E-Mini S&P 500 Index | | | 5 | | | March-2020 | | | $807,775 | | | | $21,780 | | | | $21,780 | |
| |
See accompanying Notes to Financial Statements which are an integral part of the financial statements.
Invesco V.I. S&P 500 Index Fund
Statement of Assets and Liabilities
December 31, 2019
| | | | |
| |
Assets: | | | | |
Investments in securities, at value
(Cost $ 24,817,739) | | $ | 91,000,899 | |
| |
Investments in affiliates, at value
(Cost $ 853,284) | | | 846,663 | |
| |
Other investments: | | | | |
Variation margin receivable - futures contracts | | | 1,728 | |
| |
Receivable for: Dividends | | | 93,945 | |
| |
Investment for trustee deferred compensation and retirement plans | | | 41,109 | |
| |
Total assets | | | 91,984,344 | |
| |
| |
Liabilities: | | | | |
Payable for: | | | | |
Fund shares reacquired | | | 2,249,272 | |
| |
Accrued fees to affiliates | | | 65,747 | |
| |
Accrued other operating expenses | | | 59,135 | |
| |
Trustee deferred compensation and retirement plans | | | 47,322 | |
| |
Total liabilities | | | 2,421,476 | |
| |
Net assets applicable to shares outstanding | | $ | 89,562,868 | |
| |
| |
Net assets consist of: | | | | |
Shares of beneficial interest | | $ | 18,735,574 | |
| |
Distributable earnings | | | 70,827,294 | |
| |
| | $ | 89,562,868 | |
| |
| |
Net Assets: | | | | |
Series I | | $ | 36,805,923 | |
| |
Series II | | $ | 52,756,945 | |
| |
|
Shares outstanding, no par value, with an unlimited number of shares authorized: | |
Series I | | | 1,966,695 | |
| |
Series II | | | 2,837,985 | |
| |
Series I: | | | | |
Net asset value per share | | $ | 18.71 | |
| |
Series II: | | | | |
Net asset value per share | | $ | 18.59 | |
| |
Statement of Operations
For the year ended December 31, 2019
| | | | |
Investment income: | | | | |
Dividends | | $ | 1,733,752 | |
| |
Dividends from affiliates (includes securities lending income of $77) | | | 20,156 | |
| |
Total investment income | | | 1,753,908 | |
| |
| |
Expenses: | | | | |
Advisory fees | | | 104,132 | |
| |
Administrative services fees | | | 141,013 | |
| |
Custodian fees | | | 6,422 | |
| |
Distribution fees - Series II | | | 124,835 | |
| |
Transfer agent fees | | | 4,061 | |
| |
Trustees’ and officers’ fees and benefits | | | 19,619 | |
| |
Licensing fees | | | 17,050 | |
| |
Reports to shareholders | | | 11,400 | |
| |
Professional services fees | | | 39,117 | |
| |
Other | | | 17,003 | |
| |
Total expenses | | | 484,652 | |
| |
Less: Fees waived | | | (1,057 | ) |
| |
Net expenses | | | 483,595 | |
| |
Net investment income | | | 1,270,313 | |
| |
| |
Realized and unrealized gain from: | | | | |
Net realized gain from: | | | | |
Investment securities | | | 5,760,353 | |
| |
Futures contracts | | | 154,758 | |
| |
| | | 5,915,111 | |
| |
Change in net unrealized appreciation of: | | | | |
Investment securities | | | 15,766,908 | |
| |
Futures contracts | | | 86,806 | |
| |
| | | 15,853,714 | |
| |
Net realized and unrealized gain | | | 21,768,825 | |
| |
Net increase in net assets resulting from operations | | $ | 23,039,138 | |
| |
See accompanying Notes to Financial Statements which are an integral part of the financial statements.
Invesco V.I. S&P 500 Index Fund
Statement of Changes in Net Assets
For the years ended December 31, 2019 and 2018
| | | | | | | | |
| | | 2019 | | | 2018 | |
| |
Operations: | | | | | | | | |
Net investment income | | $ | 1,270,313 | | | $ | 1,125,215 | |
| |
Net realized gain | | | 5,915,111 | | | | 8,831,060 | |
| |
Change in net unrealized appreciation (depreciation) | | | 15,853,714 | | | | (13,888,492 | ) |
| |
Net increase (decrease) in net assets resulting from operations | | | 23,039,138 | | | | (3,932,217 | ) |
| |
| | |
Distributions to shareholders from distributable earnings: | | | | | | | | |
Series I | | | (4,162,074 | ) | | | (3,325,539 | ) |
| |
Series II | | | (5,597,313 | ) | | | (4,552,548 | ) |
| |
Total distributions from distributable earnings | | | (9,759,387 | ) | | | (7,878,087 | ) |
| |
| | |
Share transactions-net: | | | | | | | | |
Series I | | | (2,676,121 | ) | | | 268,373 | |
| |
Series II | | | 98,753 | | | | (3,137,670 | ) |
| |
Net increase (decrease) in net assets resulting from share transactions | | | (2,577,368 | ) | | | (2,869,297 | ) |
| |
Net increase (decrease) in net assets | | | 10,702,383 | | | | (14,679,601 | ) |
| |
| | |
Net assets: | | | | | | | | |
Beginning of year | | | 78,860,485 | | | | 93,540,086 | |
| |
End of year | | $ | 89,562,868 | | | $ | 78,860,485 | |
| |
See accompanying Notes to Financial Statements which are an integral part of the financial statements.
Invesco V.I. S&P 500 Index Fund
Financial Highlights
The following schedule presents financial highlights for a share of the Fund outstanding throughout the periods indicated.
| | | | | | | | | | | | | | | | | | | | | | | | | | | | | | | | | | | | | | | | | | | | | | | | | | | | | | | | |
| | | Net asset
value,
beginning
of period | | | Net investment
income(a) | | | Net gains
(losses)
on securities
(both realized and unrealized) | | | Total from
investment operations | | | Dividends from net investment income | | | Distributions from net realized
gains | | | Total
distributions | | | Net asset
value, end of period | | | Total
return (b) | | | Net assets,
end of period (000’s omitted) | | | Ratio of
expenses
to average
net assets
with fee waivers
and/or
expenses
absorbed | | | Ratio of
expenses
to average net
assets without fee waivers
and/or
expenses
absorbed | | | Ratio of net investment
income
to average
net assets | | | Portfolio turnover (c) | |
Series I | | | | | | | | | | | | | | | | | | | | | | | | | | | | | | | | | | | | | | | | | | | | | | | | | | | | | | | | |
Year ended 12/31/19 | | $ | 16.12 | | | $ | 0.29 | | | $ | 4.51 | | | $ | 4.80 | | | $ | (0.28 | ) | | $ | (1.93 | ) | | $ | (2.21 | ) | | $ | 18.71 | | | | 30.98 | % | | $ | 36,806 | | | | 0.41 | %(d) | | | 0.41 | %(d) | | | 1.61 | %(d) | | | 3 | % |
Year ended 12/31/18 | | | 18.53 | | | | 0.26 | | | | (0.91 | ) | | | (0.65 | ) | | | (0.30 | ) | | | (1.46 | ) | | | (1.76 | ) | | | 16.12 | | | | (4.86 | ) | | | 33,758 | | | | 0.51 | | | | 0.51 | | | | 1.41 | | | | 3 | |
Year ended 12/31/17 | | | 16.78 | | | | 0.26 | | | | 3.18 | | | | 3.44 | | | | (0.31 | ) | | | (1.38 | ) | | | (1.69 | ) | | | 18.53 | | | | 21.26 | | | | 38,450 | | | | 0.48 | | | | 0.48 | | | | 1.46 | | | | 3 | |
Year ended 12/31/16 | | | 16.58 | | | | 0.30 | | | | 1.55 | | | | 1.85 | | | | (0.31 | ) | | | (1.34 | ) | | | (1.65 | ) | | | 16.78 | | | | 11.45 | | | | 34,812 | | | | 0.41 | | | | 0.41 | | | | 1.81 | | | | 4 | |
Year ended 12/31/15 | | | 18.52 | | | | 0.30 | | | | (0.24 | ) | | | 0.06 | | | | (0.33 | ) | | | (1.67 | ) | | | (2.00 | ) | | | 16.58 | | | | 1.03 | | | | 35,586 | | | | 0.41 | | | | 0.41 | | | | 1.66 | | | | 7 | |
| |
Series II | | | | | | | | | | | | | | | | | | | | | | | | | | | | | | | | | | | | | | | | | | | | | | | | | | | | | | | | |
Year ended 12/31/19 | | | 16.03 | | | | 0.25 | | | | 4.47 | | | | 4.72 | | | | (0.23 | ) | | | (1.93 | ) | | | (2.16 | ) | | | 18.59 | | | | 30.62 | | | | 52,757 | | | | 0.66 | (d) | | | 0.66 | (d) | | | 1.36 | (d) | | | 3 | |
Year ended 12/31/18 | | | 18.43 | | | | 0.22 | | | | (0.91 | ) | | | (0.69 | ) | | | (0.25 | ) | | | (1.46 | ) | | | (1.71 | ) | | | 16.03 | | | | (5.07 | ) | | | 45,102 | | | | 0.76 | | | | 0.76 | | | | 1.16 | | | | 3 | |
Year ended 12/31/17 | | | 16.69 | | | | 0.22 | | | | 3.17 | | | | 3.39 | | | | (0.27 | ) | | | (1.38 | ) | | | (1.65 | ) | | | 18.43 | | | | 21.00 | | | | 55,090 | | | | 0.73 | | | | 0.73 | | | | 1.21 | | | | 3 | |
Year ended 12/31/16 | | | 16.49 | | | | 0.26 | | | | 1.54 | | | | 1.80 | | | | (0.26 | ) | | | (1.34 | ) | | | (1.60 | ) | | | 16.69 | | | | 11.20 | | | | 52,212 | | | | 0.66 | | | | 0.66 | | | | 1.56 | | | | 4 | |
Year ended 12/31/15 | | | 18.43 | | | | 0.25 | | | | (0.24 | ) | | | 0.01 | | | | (0.28 | ) | | | (1.67 | ) | | | (1.95 | ) | | | 16.49 | | | | 0.72 | | | | 58,268 | | | | 0.66 | | | | 0.66 | | | | 1.41 | | | | 7 | |
| (a) | Calculated using average shares outstanding. |
| (b) | Includes adjustments in accordance with accounting principles generally accepted in the United States of America and as such, the net asset value for financial reporting purposes and the returns based upon those net asset values may differ from the net asset value and returns for shareholder transactions. Total returns are not annualized for periods less than one year, if applicable, and do not reflect charges assessed in connection with a variable product, which if included would reduce total returns. |
| (c) | Portfolio turnover is calculated at the fund level and is not annualized for periods less than one year, if applicable. |
| (d) | Ratios are based on average daily net assets (000’s omitted) of $36,848 and $49,928 for Series I and Series II shares, respectively. |
See accompanying Notes to Financial Statements which are an integral part of the financial statements.
Invesco V.I. S&P 500 Index Fund
Notes to Financial Statements
December 31, 2019
NOTE 1–Significant Accounting Policies
Invesco V.I. S&P 500 Index Fund (the “Fund”) is a series portfolio of AIM Variable Insurance Funds (Invesco Variable Insurance Funds) (the “Trust”). The Trust is a Delaware statutory trust registered under the Investment Company Act of 1940, as amended (the “1940 Act”), as anopen-end series management investment company. Information presented in these financial statements pertains only to the Fund. Matters affecting the Fund or each class will be voted on exclusively by the shareholders of the Fund or each class. Current Securities and Exchange Commission (“SEC”) guidance, however, requires participating insurance companies offering separate accounts to vote shares proportionally in accordance with the instructions of the contract owners whose investments are funded by shares of each Fund or class.
The Fund’s investment objective is to provide investment results that, before expenses, correspond to the total return (i.e., the combination of capital changes and income) of the Standard & Poor’s 500® Composite Stock Price Index.
The Fund currently offers two classes of shares, Series I and Series II, both of which are offered to insurance company separate accounts funding variable annuity contracts and variable life insurance policies (“variable products”).
The Fund is an investment company and accordingly follows the investment company accounting and reporting guidance in accordance with Financial Accounting Standards Board Accounting Standards Codification Topic 946,Financial Services – Investment Companies.
The following is a summary of the significant accounting policies followed by the Fund in the preparation of its financial statements.
A. Security Valuations– Securities, including restricted securities, are valued according to the following policy.
A security listed or traded on an exchange (except convertible securities) is valued at its last sales price or official closing price as of the close of the customary trading session on the exchange where the security is principally traded, or lacking any sales or official closing price on a particular day, the security may be valued at the closing bid price on that day. Securities traded in theover-the-counter market are valued based on prices furnished by independent pricing services or market makers. When such securities are valued by an independent pricing service they may be considered fair valued. Futures contracts are valued at the final settlement price set by an exchange on which they are principally traded. Listed options are valued at the mean between the last bid and asked prices from the exchange on which they are principally traded. Options not listed on an exchange are valued by an independent source at the mean between the last bid and asked prices. For purposes of determining net asset value (“NAV”) per share, futures and option contracts generally are valued 15 minutes after the close of the customary trading session of the New York Stock Exchange (“NYSE”).
Investments inopen-end andclosed-end registered investment companies that do not trade on an exchange are valued at theend-of-day net asset value per share. Investments inopen-end andclosed-end registered investment companies that trade on an exchange are valued at the last sales price or official closing price as of the close of the customary trading session on the exchange where the security is principally traded.
Debt obligations (including convertible securities) and unlisted equities are fair valued using an evaluated quote provided by an independent pricing service. Evaluated quotes provided by the pricing service may be determined without exclusive reliance on quoted prices, and may reflect appropriate factors such asinstitution-size trading in similar groups of securities, developments related to specific securities, dividend rate (for unlisted equities), yield (for debt obligations), quality, type of issue, coupon rate (for debt obligations), maturity (for debt obligations), individual trading characteristics and other market data. Pricing services generally value debt obligations assuming orderly transactions of institutional round lot size, but a fund may hold or transact in the same securities in smaller, odd lot sizes. Odd lots often trade at lower prices than institutional round lots. Debt obligations are subject to interest rate and credit risks. In addition, all debt obligations involve some risk of default with respect to interest and/or principal payments.
Foreign securities’ (including foreign exchange contracts) prices are converted into U.S. dollar amounts using the applicable exchange rates as of the close of the NYSE. If market quotations are available and reliable for foreign exchange-traded equity securities, the securities will be valued at the market quotations. Because trading hours for certain foreign securities end before the close of the NYSE, closing market quotations may become unreliable. If between the time trading ends on a particular security and the close of the customary trading session on the NYSE, events occur that the investment adviser determines are significant and make the closing price unreliable, the Fund may fair value the security. If the event is likely to have affected the closing price of the security, the security will be valued at fair value in good faith using procedures approved by the Board of Trustees. Adjustments to closing prices to reflect fair value may also be based on a screening process of an independent pricing service to indicate the degree of certainty, based on historical data, that the closing price in the principal market where a foreign security trades is not the current value as of the close of the NYSE. Foreign securities’ prices meeting the approved degree of certainty that the price is not reflective of current value will be priced at the indication of fair value from the independent pricing service. Multiple factors may be considered by the independent pricing service in determining adjustments to reflect fair value and may include information relating to sector indices, American Depositary Receipts and domestic and foreign index futures. Foreign securities may have additional risks including exchange rate changes, potential for sharply devalued currencies and high inflation, political and economic upheaval, the relative lack of issuer information, relatively low market liquidity and the potential lack of strict financial and accounting controls and standards.
Securities for which market prices are not provided by any of the above methods may be valued based upon quotes furnished by independent sources. The last bid price may be used to value equity securities. The mean between the last bid and asked prices is used to value debt obligations, including corporate loans.
Securities for which market quotations are not readily available or became unreliable are valued at fair value as determined in good faith by or under the supervision of the Trust’s officers following procedures approved by the Board of Trustees. Issuer specific events, market trends, bid/asked quotes of brokers and information providers and other market data may be reviewed in the course of making a good faith determination of a security’s fair value.
The Fund may invest in securities that are subject to interest rate risk, meaning the risk that the prices will generally fall as interest rates rise and, conversely, the prices will generally rise as interest rates fall. Specific securities differ in their sensitivity to changes in interest rates depending on their individual characteristics. Changes in interest rates may result in increased market volatility, which may affect the value and/or liquidity of certain Fund investments.
Invesco V.I. S&P 500 Index Fund
Valuations change in response to many factors including the historical and prospective earnings of the issuer, the value of the issuer’s assets, general economic conditions, interest rates, investor perceptions and market liquidity. Because of the inherent uncertainties of valuation, the values reflected in the financial statements may materially differ from the value received upon actual sale of those investments.
| B. | Securities Transactions and Investment Income– Securities transactions are accounted for on a trade date basis. Realized gains or losses on sales are computed on the basis of specific identification of the securities sold. Interest income (net of withholding tax, if any) is recorded on the accrual basis from settlement date. Dividend income (net of withholding tax, if any) is recorded on theex-dividend date. |
The Fund may periodically participate in litigation related to Fund investments. As such, the Fund may receive proceeds from litigation settlements. Any proceeds received are included in the Statement of Operations as realized gain (loss) for investments no longer held and as unrealized gain (loss) for investments still held.
Brokerage commissions and mark ups are considered transaction costs and are recorded as an increase to the cost basis of securities purchased and/or a reduction of proceeds on a sale of securities. Such transaction costs are included in the determination of net realized and unrealized gain (loss) from investment securities reported in the Statement of Operations and the Statement of Changes in Net Assets and the net realized and unrealized gains (losses) on securities per share in the Financial Highlights. Transaction costs are included in the calculation of the Fund’s net asset value and, accordingly, they reduce the Fund’s total returns. These transaction costs are not considered operating expenses and are not reflected in net investment income reported in the Statement of Operations and the Statement of Changes in Net Assets, or the net investment income per share and the ratios of expenses and net investment income reported in the Financial Highlights, nor are they limited by any expense limitation arrangements between the Fund and the investment adviser.
The Fund allocates income and realized and unrealized capital gains and losses to a class based on the relative net assets of each class.
| C. | Country Determination – For the purposes of making investment selection decisions and presentation in the Schedule of Investments, the investment adviser may determine the country in which an issuer is located and/or credit risk exposure based on various factors. These factors include the laws of the country under which the issuer is organized, where the issuer maintains a principal office, the country in which the issuer derives 50% or more of its total revenues and the country that has the primary market for the issuer’s securities, as well as other criteria. Among the other criteria that may be evaluated for making this determination are the country in which the issuer maintains 50% or more of its assets, the type of security, financial guarantees and enhancements, the nature of the collateral and the sponsor organization. Country of issuer and/or credit risk exposure has been determined to be the United States of America, unless otherwise noted. |
| D. | Distributions– Distributions from net investment income and net realized capital gain, if any, are generally declared and paid to separate accounts of participating insurance companies annually and recorded on theex-dividend date. |
| E. | Federal Income Taxes –The Fund intends to comply with the requirements of Subchapter M of the Internal Revenue Code of 1986, as amended (the “Internal Revenue Code”), necessary to qualify as a regulated investment company and to distribute substantially all of the Fund’s taxable earnings to shareholders. As such, the Fund will not be subject to federal income taxes on otherwise taxable income (including net realized capital gain) that is distributed to shareholders. Therefore, no provision for federal income taxes is recorded in the financial statements. |
The Fund recognizes the tax benefits of uncertain tax positions only when the position is more likely than not to be sustained. Management has analyzed the Fund’s uncertain tax positions and concluded that no liability for unrecognized tax benefits should be recorded related to uncertain tax positions. Management is not aware of any tax positions for which it is reasonably possible that the total amounts of unrecognized tax benefits will change materially in the next 12 months.
The Fund files tax returns in the U.S. Federal jurisdiction and certain other jurisdictions. Generally, the Fund is subject to examinations by such taxing authorities for up to three years after the filing of the return for the tax period.
| F. | Expenses– Fees provided for under the Rule12b-1 plan of a particular class of the Fund and which are directly attributable to that class are charged to the operations of such class. All other expenses are allocated among the classes based on relative net assets. |
| G. | Accounting Estimates –The preparation of financial statements in conformity with accounting principles generally accepted in the United States of America (“GAAP”) requires management to make estimates and assumptions that affect the reported amounts of assets and liabilities at the date of the financial statements and the reported amounts of revenues and expenses during the reporting period including estimates and assumptions related to taxation. Actual results could differ from those estimates by a significant amount. In addition, the Fund monitors for material events or transactions that may occur or become known after theperiod-end date and before the date the financial statements are released to print. |
| H. | Indemnifications– Under the Trust’s organizational documents, each Trustee, officer, employee or other agent of the Trust is indemnified against certain liabilities that may arise out of the performance of their duties to the Fund. Additionally, in the normal course of business, the Fund enters into contracts, including the Fund’s servicing agreements, that contain a variety of indemnification clauses. The Fund’s maximum exposure under these arrangements is unknown as this would involve future claims that may be made against the Fund that have not yet occurred. The risk of material loss as a result of such indemnification claims is considered remote. |
| I. | Securities Lending– The Fund may lend portfolio securities having a market value up toone-third of the Fund’s total assets. Such loans are secured by collateral equal to no less than the market value of the loaned securities determined daily by the securities lending provider. Such collateral will be cash or debt securities issued or guaranteed by the U.S. Government or any of its sponsored agencies. Cash collateral received in connection with these loans is invested in short-term money market instruments or affiliated money market funds and is shown as such on the Schedule of Investments. The Fund bears the risk of loss with respect to the investment of collateral. It is the Fund’s policy to obtain additional collateral from or return excess collateral to the borrower by the end of the next business day, following the valuation date of the securities loaned. Therefore, the value of the collateral held may be temporarily less than the value of the securities on loan. When loaning securities, the Fund retains certain benefits of owning the securities, including the economic equivalent of dividends or interest generated by the security. Lending securities entails a risk of loss to the Fund if, and to the extent that, the market value of the securities loaned were to increase and the borrower did not increase the collateral accordingly, and the borrower failed to return the securities. The securities loaned are subject to termination at the option of the borrower or the Fund. Upon termination, the borrower will return to the Fund the securities loaned and the Fund will return the collateral. Upon the failure of the borrower to return the securities, collateral may be liquidated and the securities may be purchased on the open market to replace the loaned securities. The Fund could experience delays and costs in gaining access to the collateral and the securities may lose value during the delay which could result in potential losses to the Fund. Some of these losses may be indemnified by the lending agent. The Fund bears the risk of any deficiency in the amount of the collateral available for return to the borrower due to any loss on the |
Invesco V.I. S&P 500 Index Fund
| | collateral invested. Dividends received on cash collateral investments for securities lending transactions, which are net of compensation to counterparties, are included inDividends from affiliated money market funds on the Statement of Operations. The aggregate value of securities out on loan, if any, is shown as a footnote on the Statement of Assets and Liabilities. |
| J. | Futures Contracts– The Fund may enter into futures contracts to manage exposure to interest rate, equity and market price movements and/or currency risks. A futures contract is an agreement between two parties (“Counterparties”) to purchase or sell a specified underlying security, currency or commodity (or delivery of a cash settlement price, in the case of an index future) for a fixed price at a future date. The Fund currently invests only in exchange-traded futures and they are standardized as to maturity date and underlying financial instrument. Initial margin deposits required upon entering into futures contracts are satisfied by the segregation of specific securities or cash as collateral at the futures commission merchant (broker). During the period the futures contracts are open, changes in the value of the contracts are recognized as unrealized gains or losses by recalculating the value of the contracts on a daily basis. Subsequent or variation margin payments are received or made depending upon whether unrealized gains or losses are incurred. These amounts are reflected as receivables or payables on the Statement of Assets and Liabilities. When the contracts are closed or expire, the Fund recognizes a realized gain or loss equal to the difference between the proceeds from, or cost of, the closing transaction and the Fund’s basis in the contract. The net realized gain (loss) and the change in unrealized gain (loss) on futures contracts held during the period is included on the Statement of Operations. The primary risks associated with futures contracts are market risk and the absence of a liquid secondary market. If the Fund were unable to liquidate a futures contract and/or enter into an offsetting closing transaction, the Fund would continue to be subject to market risk with respect to the value of the contracts and continue to be required to maintain the margin deposits on the futures contracts. Futures contracts have minimal Counterparty risk since the exchange’s clearinghouse, as Counterparty to all exchange-traded futures, guarantees the futures against default. Risks may exceed amounts recognized in the Statement of Assets and Liabilities. |
| K. | Collateral– To the extent the Fund has designated or segregated a security as collateral and that security is subsequently sold, it is the Fund’s practice to replace such collateral no later than the next business day. |
NOTE 2–Advisory Fees and Other Fees Paid to Affiliates
The Trust has entered into a master investment advisory agreement with Invesco Advisers, Inc. (the “Adviser” or “Invesco”). Under the terms of the investment advisory agreement, the Fund accrues daily and pays monthly an advisory fee to the Adviser based on the annual rate of the Fund’s average daily net assets as follows:
| | | | |
| Average Daily Net Assets | | Rate | |
| |
| |
First $2 billion | | | 0.120% | |
| |
| |
Over $2 billion | | | 0.100% | |
| |
For the year ended December 31, 2019, the effective advisory fee rate incurred by the Fund was 0.12%.
Under the terms of a mastersub-advisory agreement between the Adviser and each of Invesco Asset Management Deutschland GmbH, Invesco Asset Management Limited, Invesco Asset Management (Japan) Limited, Invesco Hong Kong Limited, Invesco Senior Secured Management, Inc. and Invesco Canada Ltd. and separatesub-advisory agreements with Invesco Capital Management LLC and Invesco Asset Management (India) Private Limited (collectively, the “AffiliatedSub-Advisers”) the Adviser, not the Fund, will pay 40% of the fees paid to the Adviser to any such AffiliatedSub-Adviser(s) that provide(s) discretionary investment management services to the Fund based on the percentage of assets allocated to such AffiliatedSub-Adviser(s).
The Adviser has contractually agreed, through at least June 30, 2020, to waive advisory fees and/or reimburse expenses of all shares to the extent necessary to limit total annual fund operating expenses after fee waiver and/or expense reimbursement (excluding certain items discussed below) of Series I shares to 2.00% and Series II shares to 2.25% of average daily net assets (the “expense limits”). In determining the Adviser’s obligation to waive advisory fees and/or reimburse expenses, the following expenses are not taken into account, and could cause the total annual fund operating expenses after fee waiver and/or expense reimbursement to exceed the numbers reflected above: (1) interest; (2) taxes; (3) dividend expense on short sales; (4) extraordinary ornon-routine items, including litigation expenses; and (5) expenses that the Fund has incurred but did not actually pay because of an expense offset arrangement. Unless Invesco continues the fee waiver agreement, it will terminate on June 30, 2020. During its term, the fee waiver agreement cannot be terminated or amended to increase the expense limits or reduce the advisory fee waiver without approval of the Board of Trustees. The Adviser did not waive fees and/or reimburse expenses during the period under these expense limits.
Further, the Adviser has contractually agreed, through at least June 30, 2021, to waive the advisory fee payable by the Fund in an amount equal to 100% of the net advisory fees the Adviser receives from the affiliated money market funds on investments by the Fund of uninvested cash (excluding investments of cash collateral from securities lending) in such affiliated money market funds.
For the year ended December 31, 2019, the Adviser waived advisory fees of $1,057.
The Trust has entered into a master administrative services agreement with Invesco pursuant to which the Fund has agreed to pay Invesco a fee for costs incurred in providing accounting services and fund administrative services to the Fund and to reimburse Invesco for fees paid to insurance companies that have agreed to provide certain administrative services to the Fund. These administrative services provided by the insurance companies may include, among other things: maintenance of master accounts with the Fund; tracking, recording and transmitting net purchase and redemption orders for Fund shares; maintaining and preserving records related to the purchase, redemption and other account activity of variable product owners; distributing copies of Fund documents such as prospectuses, proxy materials and periodic reports, to variable product owners, and responding to inquiries from variable product owners about the Fund. Pursuant to such agreement, for the year ended December 31, 2019, Invesco was paid $12,250 for accounting and fund administrative services and was reimbursed $128,763 for fees paid to insurance companies. Invesco has entered into a sub-administration agreement whereby State Street Bank and Trust Company (“SSB”) serves as fund accountant and provides certain administrative services to the Fund. Pursuant to a custody agreement with the Trust on behalf of the Fund, SSB also serves as the Fund’s custodian.
The Trust has entered into a transfer agency and service agreement with Invesco Investment Services, Inc. (“IIS”) pursuant to which the Fund has agreed to pay IIS a fee for providing transfer agency and shareholder services to the Fund and reimburse IIS for certain expenses incurred by IIS in the course of providing such services. For the year ended December 31, 2019, expenses incurred under the agreement are shown in the Statement of Operations asTransfer agent fees.
Invesco V.I. S&P 500 Index Fund
The Trust has entered into a master distribution agreement with Invesco Distributors, Inc. (“IDI”) to serve as the distributor for the Fund. The Trust has adopted a plan pursuant to Rule12b-1 under the 1940 Act with respect to the Fund’s Series II shares (the “Plan”). The Fund, pursuant to the Plan, pays IDI compensation at the annual rate of 0.25% of the Fund’s average daily net assets of Series II shares. The fees are accrued daily and paid monthly. Of the Plan payments, up to 0.25% of the average daily net assets of the Series II shares may be paid to insurance companies who furnish continuing personal shareholder services to customers who purchase and own Series II shares of the Fund. For the year ended December 31, 2019, expenses incurred under the Plan are detailed in the Statement of Operations asDistribution fees.
Certain officers and trustees of the Trust are officers and directors of the Adviser, IIS and/or IDI.
NOTE 3–Additional Valuation Information
GAAP defines fair value as the price that would be received to sell an asset or paid to transfer a liability in an orderly transaction between market participants at the measurement date, under current market conditions. GAAP establishes a hierarchy that prioritizes the inputs to valuation methods, giving the highest priority to readily available unadjusted quoted prices in an active market for identical assets (Level 1) and the lowest priority to significant unobservable inputs (Level 3), generally when market prices are not readily available or are unreliable. Based on the valuation inputs, the securities or other investments are tiered into one of three levels. Changes in valuation methods may result in transfers in or out of an investment’s assigned level:
| | Level 1 - | Prices are determined using quoted prices in an active market for identical assets. |
| | Level 2 - | Prices are determined using other significant observable inputs. Observable inputs are inputs that other market participants may use in pricing a security. These may include quoted prices for similar securities, interest rates, prepayment speeds, credit risk, yield curves, loss severities, default rates, discount rates, volatilities and others. |
| | Level 3 - | Prices are determined using significant unobservable inputs. In situations where quoted prices or observable inputs are unavailable (for example, when there is little or no market activity for an investment at the end of the period), unobservable inputs may be used. Unobservable inputs reflect the Fund’s own assumptions about the factors market participants would use in determining fair value of the securities or instruments and would be based on the best available information. |
The following is a summary of the tiered valuation input levels, as of December 31, 2019. The level assigned to the securities valuations may not be an indication of the risk or liquidity associated with investing in those securities. Because of the inherent uncertainties of valuation, the values reflected in the financial statements may materially differ from the value received upon actual sale of those investments.
| | | | | | | | | | | | | | | | |
| | | Level 1 | | | Level 2 | | | Level 3 | | | Total | |
| |
Investments in Securities | | | | | | | | | | | | | | | | |
| |
Common Stocks & Other Equity Interests | | $ | 91,022,817 | | | $ | - | | | $ | - | | | $ | 91,022,817 | |
| |
| | | | |
Money Market Funds | | | 824,745 | | | | - | | | | - | | | | 824,745 | |
| |
Total Investments in Securities | | | 91,847,562 | | | | - | | | | - | | | | 91,847,562 | |
| |
Other Investments - Assets* | | | | | | | | | | | | | | | | |
| |
Futures Contracts | | | 21,780 | | | | - | | | | - | | | | 21,780 | |
| |
| | | | |
Total Investments | | $ | 91,869,342 | | | $ | - | | | | $- | | | $ | 91,869,342 | |
| |
| * | Unrealized appreciation. |
NOTE 4–Derivative Investments
The Fund may enter into an International Swaps and Derivatives Association Master Agreement (“ISDA Master Agreement”) under which a fund may trade OTC derivatives. An OTC transaction entered into under an ISDA Master Agreement typically involves a collateral posting arrangement, payment netting provisions andclose-out netting provisions. These netting provisions allow for reduction of credit risk through netting of contractual obligations. The enforceability of the netting provisions of the ISDA Master Agreement depends on the governing law of the ISDA Master Agreement, among other factors.
For financial reporting purposes, the Fund does not offset OTC derivative assets or liabilities that are subject to ISDA Master Agreements in the Statement of Assets and Liabilities.
Value of Derivative Investments atPeriod-End
The table below summarizes the value of the Fund’s derivative investments, detailed by primary risk exposure, held as of December 31, 2019:
| | | | |
| | | Value | |
| Derivative Assets | | Equity
Risk | |
Unrealized appreciation on futures contracts - Exchange-Traded(a) | | $ | 21,780 | |
| |
Derivatives not subject to master netting agreements | | | (21,780 | ) |
| |
Total Derivative Assets subject to master netting agreements | | $ | - | |
| |
| (a) | The daily variation margin receivable atperiod-end is recorded in the Statement of Assets and Liabilities. |
Invesco V.I. S&P 500 Index Fund
Effect of Derivative Investments for the year ended December 31, 2019
The table below summarizes the gains on derivative investments, detailed by primary risk exposure, recognized in earnings during the period:
| | | | |
| | | Location of Gain on
Statement of Operations | |
| | | Equity Risk | |
| |
Realized Gain: | | | | |
Futures contracts | | | $154,758 | |
| |
Change in Net Unrealized Appreciation: | | | | |
Futures contracts | | | 86,806 | |
| |
Total | | | $241,564 | |
| |
The table below summarizes the average notional value of derivatives held during the period.
| | | | |
| | | Futures
Contracts | |
| |
Average notional value | | $ | 981,273 | |
| |
NOTE 5–Trustees’ and Officers’ Fees and Benefits
Trustees’ and Officers’ Fees and Benefits include amounts accrued by the Fund to pay remuneration to certain Trustees and Officers of the Fund. Trustees have the option to defer compensation payable by the Fund, andTrustees’ and Officers’ Fees and Benefits also include amounts accrued by the Fund to fund such deferred compensation amounts. Those Trustees who defer compensation have the option to select various Invesco Funds in which their deferral accounts shall be deemed to be invested. Finally, certain current Trustees were eligible to participate in a retirement plan that provided for benefits to be paid upon retirement to Trustees over a period of time based on the number of years of service. The Fund may have certain former Trustees who also participate in a retirement plan and receive benefits under such plan.Trustees’ and Officers’ Fees and Benefits include amounts accrued by the Fund to fund such retirement benefits. Obligations under the deferred compensation and retirement plans represent unsecured claims against the general assets of the Fund.
NOTE 6–Cash Balances
The Fund is permitted to temporarily carry a negative or overdrawn balance in its account with SSB, the custodian bank. Such balances, if any atperiod-end, are shown in the Statement of Assets and Liabilities under the payable caption Amount due custodian. To compensate the custodian bank for such overdrafts, the overdrawn Fund may either (1) leave funds as a compensating balance in the account so the custodian bank can be compensated by earning the additional interest; or (2) compensate by paying the custodian bank at a rate agreed upon by the custodian bank and Invesco, not to exceed the contractually agreed upon rate.
NOTE 7–Distributions to Shareholders and Tax Components of Net Assets
Tax Character of Distributions to Shareholders Paid During the Fiscal Years Ended December 31, 2019 and 2018:
| | | | | | | | |
| | | 2019 | | | 2018 | |
| |
| | |
Ordinary income | | $ | 1,124,398 | | | $ | 1,343,960 | |
| |
| | |
Long-term capital gain | | | 8,634,989 | | | | 6,534,127 | |
| |
| | |
Total distributions | | $ | 9,759,387 | | | $ | 7,878,087 | |
| |
Tax Components of Net Assets atPeriod-End:
| | | | |
| | | 2019 | |
| |
Undistributed ordinary income | | $ | 1,424,678 | |
| |
Undistributed long-term capital gain | | | 5,156,583 | |
| |
Net unrealized appreciation – investments | | | 64,282,341 | |
| |
Temporary book/tax differences | | | (36,308 | ) |
| |
Shares of beneficial interest | | | 18,735,574 | |
| |
Total net assets | | $ | 89,562,868 | |
| |
The difference between book-basis andtax-basis unrealized appreciation (depreciation) is due to differences in the timing of recognition of gains and losses on investments for tax and book purposes. The Fund’s net unrealized appreciation difference is attributable primarily to wash sales.
The temporary book/tax differences are a result of timing differences between book and tax recognition of income and/or expenses. The Fund’s temporary book/tax differences are the result of the trustee deferral of compensation and retirement plan benefits.
Capital loss carryforward is calculated and reported as of a specific date. Results of transactions and other activity after that date may affect the amount of capital loss carryforward actually available for the Fund to utilize. Capital losses generated in years beginning after December 22, 2010 can be carried forward for an unlimited period, whereas previous losses expire in eight tax years. Capital losses with an expiration period may not be used to offset capital gains until all net capital losses without an expiration date have been utilized. Capital loss carryforwards with no expiration date
Invesco V.I. S&P 500 Index Fund
will retain their character as either short-term or long-term capital losses instead of as short-term capital losses as under prior law. The ability to utilize capital loss carryforwards in the future may be limited under the Internal Revenue Code and related regulations based on the results of future transactions.
The Fund does not have a capital loss carryforward as of December 31, 2019.
NOTE 8–Investment Transactions
The aggregate amount of investment securities (other than short-term securities, U.S. Treasury obligations and money market funds, if any) purchased and sold by the Fund during the year ended December 31, 2019 was $2,724,085 and $10,355,954, respectively. Cost of investments, including any derivatives, on a tax basis includes the adjustments for financial reporting purposes as of the most recently completed federal income tax reportingperiod-end.
| | | | |
| Unrealized Appreciation (Depreciation) of Investments on a Tax Basis | |
| |
Aggregate unrealized appreciation of investments | | | $65,194,258 | |
| |
Aggregate unrealized (depreciation) of investments | | | (911,917 | ) |
| |
Net unrealized appreciation of investments | | | $64,282,341 | |
| |
Cost of investments for tax purposes is $27,587,001.
NOTE 9–Reclassification of Permanent Differences
Primarily as a result of differing book/tax treatment of real estate investment trusts and fair fund settlements, on December 31, 2019, undistributed net investment income was increased by $1,028, undistributed net realized gain was decreased by $1,074 and shares of beneficial interest was increased by $46. This reclassification had no effect on the net assets of the Fund.
NOTE 10–Share Information
| | | | | | | | | | | | | | | | |
| | | Summary of Share Activity | |
| | | Year ended
December 31, 2019(a) | | | Year ended
December 31, 2018 | |
| | | Shares | | | Amount | | | Shares | | | Amount | |
Sold: | | | | | | | | | | | | | | | | |
Series I | | | 101,728 | | | $ | 1,853,921 | | | | 197,507 | | | $ | 3,659,064 | |
| |
Series II | | | 79,690 | | | | 1,455,975 | | | | 126,250 | | | | 2,450,887 | |
| |
| | | | |
Issued as reinvestment of dividends: | | | | | | | | | | | | | | | | |
Series I | | | 242,328 | | | | 4,160,777 | | | | 177,118 | | | | 3,324,539 | |
| |
Series II | | | 327,904 | | | | 5,597,313 | | | | 243,843 | | | | 4,552,548 | |
| |
| | | | |
Reacquired: | | | | | | | | | | | | | | | | |
Series I | | | (470,895 | ) | | | (8,690,819 | ) | | | (355,679 | ) | | | (6,715,230 | ) |
| |
Series II | | | (383,854 | ) | | | (6,954,535 | ) | | | (544,977 | ) | | | (10,141,105 | ) |
| |
Net increase (decrease) in share activity | | | (103,099 | ) | | $ | (2,577,368 | ) | | | (155,938 | ) | | $ | (2,869,297 | ) |
| |
| (a) | There are entities that are record owners of more than 5% of the outstanding shares of the Fund and in the aggregate own 91% of the outstanding shares of the Fund. The Fund and the Fund’s principal underwriter or adviser, are parties to participation agreements with these entities whereby these entities sell units of interest in separate accounts funding variable products that are invested in the Fund. The Fund, Invesco and/or Invesco affiliates may make payments to these entities, which are considered to be related to the Fund, for providing services to the Fund, Invesco and/or Invesco affiliates including but not limited to services such as, securities brokerage, third party record keeping and account servicing and administrative services. The Fund has no knowledge as to whether all or any portion of the shares owned of record by these entities are also owned beneficially. |
Invesco V.I. S&P 500 Index Fund
Report of Independent Registered Public Accounting Firm
To the Board of Trustees of AIM Variable Insurance Funds (Invesco Variable Insurance Funds) and Shareholders of Invesco V.I. S&P 500 Index Fund
Opinion on the Financial Statements
We have audited the accompanying statement of assets and liabilities, including the schedule of investments, of Invesco V.I. S&P 500 Index Fund (one of the funds constituting AIM Variable Insurance Funds (Invesco Variable Insurance Funds), referred to hereafter as the “Fund”) as of December 31, 2019, the related statement of operations for the year ended December 31, 2019, the statement of changes in net assets for each of the two years in the period ended December 31, 2019, including the related notes, and the financial highlights for each of the five years in the period ended December 31, 2019 (collectively referred to as the “financial statements”). In our opinion, the financial statements present fairly, in all material respects, the financial position of the Fund as of December 31, 2019, the results of its operations for the year then ended, the changes in its net assets for each of the two years in the period ended December 31, 2019 and the financial highlights for each of the five years in the period ended December 31, 2019 in conformity with accounting principles generally accepted in the United States of America.
Basis for Opinion
These financial statements are the responsibility of the Fund’s management. Our responsibility is to express an opinion on the Fund’s financial statements based on our audits. We are a public accounting firm registered with the Public Company Accounting Oversight Board (United States) (PCAOB) and are required to be independent with respect to the Fund in accordance with the U.S. federal securities laws and the applicable rules and regulations of the Securities and Exchange Commission and the PCAOB.
We conducted our audits of these financial statements in accordance with the standards of the PCAOB. Those standards require that we plan and perform the audit to obtain reasonable assurance about whether the financial statements are free of material misstatement, whether due to error or fraud.
Our audits included performing procedures to assess the risks of material misstatement of the financial statements, whether due to error or fraud, and performing procedures that respond to those risks. Such procedures included examining, on a test basis, evidence regarding the amounts and disclosures in the financial statements. Our audits also included evaluating the accounting principles used and significant estimates made by management, as well as evaluating the overall presentation of the financial statements. Our procedures included confirmation of securities owned as of December 31, 2019 by correspondence with the custodian, transfer agent and brokers; when replies were not received from brokers, we performed other auditing procedures. We believe that our audits provide a reasonable basis for our opinion.
/s/PricewaterhouseCoopers LLP
Houston, Texas
February 18, 2020
We have served as the auditor of one or more of the investment companies in the Invesco group of investment companies since at least 1995. We have not been able to determine the specific year we began serving as auditor.
Invesco V.I. S&P 500 Index Fund
Calculating your ongoing Fund expenses
Example
As a shareholder of the Fund, you incur ongoing costs, including management fees; distribution and/or service fees(12b-1); and other Fund expenses. This example is intended to help you understand your ongoing costs (in dollars) of investing in the Fund and to compare these costs with ongoing costs of investing in other mutual funds. The example is based on an investment of $1,000 invested at the beginning of the period and held for the entire period July 1, 2019 through December 31, 2019.
The actual and hypothetical expenses in the examples below do not represent the effect of any fees or other expenses assessed in connection with a variable product; if they did, the expenses shown would be higher while the ending account values shown would be lower.
Actual expenses
The table below provides information about actual account values and actual expenses. You may use the information in this table, together with the amount you invested, to estimate the expenses that you paid over the period. Simply divide your account value by $1,000 (for example, an $8,600 account value divided by $1,000 = 8.6), then multiply the result by the number in the table under the heading entitled “Actual Expenses Paid During Period” to estimate the expenses you paid on your account during this period.
Hypothetical example for comparison purposes
The table below also provides information about hypothetical account values and hypothetical expenses based on the Fund’s actual expense ratio and an assumed rate of return of 5% per year before expenses, which is not the Fund’s actual return.
The hypothetical account values and expenses may not be used to estimate the actual ending account balance or expenses you paid for the period. You may use this information to compare the ongoing costs of investing in the Fund and other funds. To do so, compare this 5% hypothetical example with the 5% hypothetical examples that appear in the shareholder reports of the other funds.
Please note that the expenses shown in the table are meant to highlight your ongoing costs. Therefore, the hypothetical information is useful in comparing ongoing costs, and will not help you determine the relative total costs of owning different funds.
| | | | | | | | | | | | | | | | | | | | |
| | | Beginning
Account Value
(07/01/19) | | ACTUAL | | | HYPOTHETICAL
(5% annual return before
expenses) | | | Annualized
Expense
Ratio |
| | Ending
Account Value
(12/31/19)1 | | | Expenses
Paid During
Period2 | | | Ending
Account Value
(12/31/19) | | | Expenses
Paid During
Period2 | |
| Series I | | $1,000.00 | | | $1,107.20 | | | | $2.07 | | | | $1,023.24 | | | | $1.99 | | | 0.39% |
| Series II | | 1,000.00 | | | 1,106.10 | | | | 3.40 | | | | 1,021.98 | | | | 3.26 | | | 0.64 |
| 1 | The actual ending account value is based on the actual total return of the Fund for the period July 1, 2019 through December 31, 2019, after actual expenses and will differ from the hypothetical ending account value which is based on the Fund’s expense ratio and a hypothetical annual return of 5% before expenses. |
| 2 | Expenses are equal to the Fund’s annualized expense ratio as indicated above multiplied by the average account value over the period, multiplied by 184/365 to reflect the most recent fiscal half year. |
Invesco V.I. S&P 500 Index Fund
Tax Information
Form1099-DIV, Form1042-S and other year–end tax information provide shareholders with actual calendar year amounts that should be included in their tax returns. Shareholders should consult their tax advisers.
The following distribution information is being provided as required by the Internal Revenue Code or to meet a specific state’s requirement.
The Fund designates the following amounts or, if subsequently determined to be different, the maximum amount allowable for its fiscal year ended December 31, 2019:
| | | | | | | | |
| Federal and State Income Tax | | | | |
Long-Term Capital Gain Distributions | | $ | 8,634,989 | | | | | |
Corporate Dividends Received Deduction* | | | 100.00 | % | | | | |
U.S. Treasury Obligations* | | | 0.00 | % | | | | |
| | * | The above percentages are based on ordinary income dividends paid to shareholders during the Fund’s fiscal year. |
Invesco V.I. S&P 500 Index Fund
Trustees and Officers
The address of each trustee and officer is AIM Variable Insurance Funds (Invesco Variable Insurance Funds) (the “Trust”), 11 Greenway Plaza, Suite 1000, Houston, Texas 77046-1173. The trustees serve for the life of the Trust, subject to their earlier death, incapacitation, resignation, retirement or removal as more specifically provided in the Trust’s organizational documents. Each officer serves for a one year term or until their successors are elected and qualified. Column two below includes length of time served with predecessor entities, if any.
| | | | | | | | |
Name, Year of Birth and
Position(s)
Held with the Trust | | Trustee
and/or
Officer
Since | | Principal Occupation(s)
During Past 5 Years | | Number of
Funds in
Fund Complex
Overseen by
Trustee | | Other
Directorship(s)
Held by Trustee
During Past
5 Years |
| Interested Person | | | | | | | | |
Martin L. Flanagan1– 1960
Trustee and Vice Chair | | 2007 | | Executive Director, Chief Executive Officer and President, Invesco Ltd. (ultimate parent of Invesco and a global investment management firm); Trustee and Vice Chair, The Invesco Funds; Vice Chair, Investment Company Institute; and Member of Executive Board, SMU Cox School of Business Formerly: Advisor to the Board, Invesco Advisers, Inc. (formerly known as Invesco Institutional (N.A.), Inc.); Chairman and Chief Executive Officer, Invesco Advisers, Inc. (registered investment adviser); Director, Chairman, Chief Executive Officer and President, Invesco Holding Company (US), Inc. (formerly IVZ Inc.) (holding company), Invesco Group Services, Inc. (service provider) and Invesco North American Holdings, Inc. (holding company); Director, Chief Executive Officer and President, Invesco Holding Company Limited (parent of Invesco and a global investment management firm); Director, Invesco Ltd.; Chairman, Investment Company Institute and President,Co-Chief Executive Officer,Co-President, Chief Operating Officer and Chief Financial Officer, Franklin Resources, Inc. (global investment management organization) | | 229 | | None |
| 1 | Mr. Flanagan is considered an interested person (within the meaning of Section 2(a)(19) of the 1940 Act) of the Trust because he is an officer of the Adviser to the Trust, and an officer and a director of Invesco Ltd., ultimate parent of the Adviser. |
Invesco V.I. S&P 500 Index Fund
Trustees and Officers–(continued)
| | | | | | | | |
Name, Year of Birth and
Position(s)
Held with the Trust | | Trustee
and/or
Officer
Since | | Principal Occupation(s)
During Past 5 Years | | Number of
Funds in
Fund Complex
Overseen by
Trustee | | Other
Directorship(s)
Held by Trustee
During Past
5 Years |
| Independent Trustees | | | | | | | | |
Bruce L. Crockett - 1944
Trustee and Chair | | 1993 | | Chairman, Crockett Technologies Associates (technology consulting company) Formerly: Director, Captaris (unified messaging provider); Director, President and Chief Executive Officer, COMSAT Corporation; Chairman, Board of Governors of INTELSAT (international communications company); ACE Limited (insurance company); Independent Directors Council and Investment Company Institute: Member of the Audit Committee, Investment Company Institute; Member of the Executive Committee and Chair of the Governance Committee, Independent Directors Council | | 229 | | Director and Chairman of the Audit Committee, ALPS (Attorneys Liability Protection Society) (insurance company); Director and Member of the Audit Committee and Compensation Committee, Ferroglobe PLC (metallurgical company) |
David C. Arch - 1945
Trustee | | 2010 | | Chairman of Blistex Inc. (consumer health care products manufacturer); Member, World Presidents’ Organization | | 229 | | Board member of the Illinois Manufacturers’ Association |
Beth Ann Brown - 1968
Trustee | | 2019 | | Independent Consultant Formerly: Head of Intermediary Distribution, Managing Director, Strategic Relations, Managing Director, Head of National Accounts, Senior Vice President, National Account Manager and Senior Vice President, Key Account Manager, Columbia Management Investment Advisers LLC; Vice President, Key Account Manager, Liberty Funds Distributor, Inc.; and Trustee of certain Oppenheimer Funds | | 229 | | Director, Board of Directors of Caron Engineering Inc.; Advisor, Board of Advisors of Caron Engineering Inc.; President and Director, Acton Shapleigh Youth Conservation Corps (non - profit); and Vice President and Director of Grahamtastic Connection (non-profit) |
Jack M. Fields - 1952
Trustee | | 1997 | | Chief Executive Officer, Twenty First Century Group, Inc. (government affairs company); and Chairman, Discovery Learning Alliance(non-profit) Formerly: Owner and Chief Executive Officer, Dos Angeles Ranch L.P. (cattle, hunting, corporate entertainment); Director, Insperity, Inc. (formerly known as Administaff) (human resources provider); Chief Executive Officer, Texana Timber LP (sustainable forestry company); Director of Cross Timbers Quail Research Ranch(non-profit); and member of the U.S. House of Representatives | | 229 | | None |
Invesco V.I. S&P 500 Index Fund
Trustees and Officers–(continued)
| | | | | | | | |
Name, Year of Birth and
Position(s)
Held with the Trust | | Trustee
and/or
Officer
Since | | Principal Occupation(s)
During Past 5 Years | | Number of
Funds
in
Fund Complex
Overseen by
Trustee | | Other
Directorship(s)
Held by Trustee
During Past
5 Years |
| Independent Trustees–(continued) | | | | |
Cynthia Hostetler - 1962
Trustee | | 2017 | | Non-Executive Director and Trustee of a number of public and private business corporations Formerly: Director, Aberdeen Investment Funds (4 portfolios); Head of Investment Funds and Private Equity, Overseas Private Investment Corporation; President, First Manhattan Bancorporation, Inc.; Attorney, Simpson Thacher & Bartlett LLP | | 229 | | Vulcan Materials Company (construction materials company); Trilinc Global Impact Fund; Genesee & Wyoming, Inc. (railroads); Artio Global Investment LLC (mutual fund complex); Edgen Group, Inc. (specialized energy and infrastructure products distributor); Investment Company Institute (professional organization); Independent Directors Council (professional organization) |
| | | | | |
Eli Jones - 1961
Trustee | | 2016 | | Professor and Dean, Mays Business School - Texas A&M University Formerly: Professor and Dean, Walton College of Business, University of Arkansas and E.J. Ourso College of Business, Louisiana State University; Director, Arvest Bank | | 229 | | Insperity, Inc. (formerly known as Administaff) (human resources provider) |
| | | | | |
Elizabeth Krentzman - 1959
Trustee | | 2019 | | Formerly: Principal and Chief Regulatory Advisor for Asset Management Services and U.S. Mutual Fund Leader of Deloitte & Touche LLP; General Counsel of the Investment Company Institute (trade association); National Director of the Investment Management Regulatory Consulting Practice, Principal, Director and Senior Manager of Deloitte & Touche LLP; Assistant Director of the Division of Investment Management - Office of Disclosure and Investment Adviser Regulation of the U.S. Securities and Exchange Commission and various positions with the Division of Investment Management - Office of Regulatory Policy of the U.S. Securities and Exchange Commission; Associate at Ropes & Gray LLP; Advisory Board Member of the Securities and Exchange Commission Historical Society; and Trustee of certain Oppenheimer Funds | | 229 | | Trustee of the University of Florida National Board Foundation and Audit Committee Member; Member of the Cartica Funds Board of Directors (private investment funds); Member of the University of Florida Law Center Association, Inc. Board of Trustees and Audit Committee Member |
| | | | | |
Anthony J. LaCava, Jr. - 1956
Trustee | | 2019 | | Formerly: Director and Member of the Audit Committee, Blue Hills Bank (publicly traded financial institution) and Managing Partner, KPMG LLP | | 229 | | Blue Hills Bank; Chairman, Bentley University; Member, Business School Advisory Council; and Nominating Committee KPMG LLP |
| | | | | |
Prema Mathai-Davis - 1950
Trustee | | 1998 | | Retired Co-Owner & Partner of Quantalytics Research, LLC, (a FinTech Investment Research Platform for the Self-Directed Investor) | | 229 | | None |
Invesco V.I. S&P 500 Index Fund
Trustees and Officers–(continued)
| | | | | | | | |
Name, Year of Birth and
Position(s)
Held with the Trust | | Trustee
and/or
Officer
Since | | Principal Occupation(s)
During Past 5 Years | | Number of
Funds
in
Fund Complex
Overseen by
Trustee | | Other
Directorship(s)
Held by Trustee
During Past
5 Years |
| Independent Trustees–(continued) | | | | |
Joel W. Motley - 1952
Trustee | | 2019 | | Director of Office of Finance, Federal Home Loan Bank; Member of the Vestry of Trinity Wall Street; Managing Director of Carmona Motley Inc. (privately held financial advisor); Member of the Finance and Budget Committee of the Council on Foreign Relations, Member of the Investment Committee and Board of Human Rights Watch and Member of the Investment Committee and Board of Historic Hudson Valley(non-profit cultural organization) Formerly: Managing Director of Public Capital Advisors, LLC (privately held financial advisor); Managing Director of Carmona Motley Hoffman, Inc. (privately held financial advisor); Trustee of certain Oppenheimer Funds; and Director of Columbia Equity Financial Corp. (privately held financial advisor) | | 229 | | Director of Greenwall Foundation (bioethics research foundation); Member of Board and Investment Committee of The Greenwall Foundation; Director of Southern Africa Legal Services Foundation; Board Member and Investment Committee Member of Pulizer Center for Crisis Reporting(non-profit journalism) |
Teresa M. Ressel - 1962
Trustee | | 2017 | | Non-executive director and trustee of a number of public and private business corporations Formerly: Chief Financial Officer, Olayan America, The Olayan Group (international investor/commercial/industrial); Chief Executive Officer, UBS Securities LLC; Group Chief Operating Officer, Americas, UBS AG; Assistant Secretary for Management & Budget and CFO, US Department of the Treasury | | 229 | | Atlantic Power Corporation (power generation company); ON Semiconductor Corp. (semiconductor supplier) |
Ann Barnett Stern - 1957
Trustee | | 2017 | | President and Chief Executive Officer, Houston Endowment Inc. (private philanthropic institution) Formerly: Executive Vice President and General Counsel, Texas Children’s Hospital; Attorney, Beck, Redden and Secrest, LLP; Business Law Instructor, University of St. Thomas; Attorney, Andrews & Kurth LLP | | 229 | | Federal Reserve Bank of Dallas |
Robert C. Troccoli - 1949
Trustee | | 2016 | | Retired | | 229 | | None |
Daniel S. Vandivort - 1954
Trustee | | 2019 | | Treasurer, Chairman of the Audit and Finance Committee, and Trustee, Board of Trustees, Huntington Disease Foundation of America; and President, Flyway Advisory Services LLC (consulting and property management) Formerly: Trustee and Governance Chair, of certain Oppenheimer Funds | | 229 | | Chairman and Lead Independent Director, Chairman of the Audit Committee, and Director, Board of Directors, Value Line Funds |
James D. Vaughn - 1945
Trustee | | 2019 | | Retired Formerly: Managing Partner, Deloitte & Touche LLP; Trustee and Chairman of the Audit Committee, Schroder Funds; Board Member, Mile High United Way, Boys and Girls Clubs, Boy Scouts, Colorado Business Committee for the Arts, Economic Club of Colorado and Metro Denver Network (economic development corporation); and Trustee of certain Oppenheimer Funds | | 229 | | Board member and Chairman of Audit Committee of AMG National Trust Bank; Trustee and Investment Committee member, University of South Dakota Foundation; Board member, Audit Committee Member and past Board Chair, Junior Achievement(non-profit) |
Invesco V.I. S&P 500 Index Fund
Trustees and Officers–(continued)
| | | | | | | | |
Name, Year of Birth and
Position(s)
Held with the Trust | | Trustee
and/or
Officer
Since | | Principal Occupation(s)
During Past 5 Years | | Number of
Funds
in
Fund Complex
Overseen by
Trustee | | Other
Directorship(s)
Held by Trustee
During Past 5
Years |
| Independent Trustees–(continued) | | | | |
| Christopher L. WIlson - 1957 Trustee, Vice Chair and Chair Designate | | 2017 | | Retired Formerly: Director, TD Asset Management USA Inc. (mutual fund complex) (22 portfolios); Managing Partner, CT2, LLC (investing and consulting firm); President/Chief Executive Officer, Columbia Funds, Bank of America Corporation; President/Chief Executive Officer, CDC IXIS Asset Management Services, Inc.; Principal & Director of Operations, Scudder Funds, Scudder, Stevens & Clark, Inc.; Assistant Vice President, Fidelity Investments | | 229 | | ISO New England, Inc.(non-profit organization managing regional electricity market) |
Invesco V.I. S&P 500 Index Fund
Trustees and Officers–(continued)
| | | | | | | | |
Name, Year of Birth and
Position(s)
Held with the Trust | | Trustee
and/or
Officer
Since | | Principal Occupation(s)
During Past 5 Years | | Number of
Funds in
Fund Complex
Overseen by
Trustee | | Other
Directorship(s)
Held by Trustee
During Past 5
Years |
| Officers | | | | | | | | |
Sheri Morris - 1964 President, Principal Executive Officer and Treasurer | | 1999 | | Head of Global Fund Services, Invesco Ltd.; President, Principal Executive Officer and Treasurer, The Invesco Funds; Vice President, Invesco Advisers, Inc. (formerly known as Invesco Institutional (N.A.), Inc.) (registered investment adviser); and Vice President, Invesco Exchange-Traded Fund Trust, Invesco Exchange-Traded Fund Trust II, Invesco India Exchange-Traded Fund Trust, Invesco Actively Managed Exchange-Traded Fund Trust, Invesco Actively Managed Exchange-Traded Commodity Fund Trust and Invesco Exchange-Traded Self-Indexed Fund Trust; and Vice President, OppenheimerFunds, Inc. Formerly: Vice President and Principal Financial Officer, The Invesco Funds; Vice President, Invesco AIM Advisers, Inc., Invesco AIM Capital Management, Inc. and Invesco AIM Private Asset Management, Inc.; Assistant Vice President and Assistant Treasurer, The Invesco Funds and Assistant Vice President, Invesco Advisers, Inc., Invesco AIM Capital Management, Inc. and Invesco AIM Private Asset Management, Inc.; and Treasurer, Invesco Exchange-Traded Fund Trust, Invesco Exchange-Traded Fund Trust II, Invesco India Exchange-Traded Fund Trust and Invesco Actively Managed Exchange-Traded Fund Trust | | N/A | | N/A |
Russell C. Burk - 1958 Senior Vice President and Senior Officer | | 2005 | | Senior Vice President and Senior Officer, The Invesco Funds | | N/A | | N/A |
Jeffrey H. Kupor - 1968 Senior Vice President, Chief Legal Officer and Secretary | | 2018 | | Head of Legal of the Americas, Invesco Ltd.; Senior Vice President and Secretary, Invesco Advisers, Inc. (formerly known as Invesco Institutional (N.A.), Inc.) (registered investment adviser); Senior Vice President and Secretary, Invesco Distributors, Inc. (formerly known as Invesco AIM Distributors, Inc.); Vice President and Secretary, Invesco Investment Services, Inc. (formerly known as Invesco AIM Investment Services, Inc.) Senior Vice President, Chief Legal Officer and Secretary, The Invesco Funds; Secretary and General Counsel, Invesco Investment Advisers LLC (formerly known as Van Kampen Asset Management); Secretary and General Counsel, Invesco Capital Markets, Inc. (formerly known as Van Kampen Funds Inc.) and Chief Legal Officer, Invesco Exchange-Traded Fund Trust, Invesco Exchange-Traded Fund Trust II, Invesco India Exchange-Traded Fund Trust, Invesco Actively Managed Exchange-Traded Fund Trust, Invesco Actively Managed Exchange-Traded Commodity Fund Trust and Invesco Exchange-Traded Self-Indexed Fund Trust; Secretary, Invesco Indexing LLC; Secretary, W.L. Ross & Co., LLC Formerly: Secretary and Vice President, Jemstep, Inc.; Head of Legal, Worldwide Institutional, Invesco Ltd.; Secretary and General Counsel, INVESCO Private Capital Investments, Inc.; Senior Vice President, Secretary and General Counsel, Invesco Management Group, Inc. (formerly known as Invesco AIM Management Group, Inc.); Assistant Secretary, INVESCO Asset Management (Bermuda) Ltd.; Secretary and General Counsel, Invesco Private Capital, Inc.; Assistant Secretary and General Counsel, INVESCO Realty, Inc.; Secretary and General Counsel, Invesco Senior Secured Management, Inc.; and Secretary, Sovereign G./P. Holdings Inc. | | N/A | | N/A |
| Andrew R. Schlossberg - 1974 Senior Vice President | | 2019 | | Head of the Americas and Senior Managing Director, Invesco Ltd.; Director and Senior Vice President, Invesco Advisers, Inc. (formerly known as Invesco Institutional (N.A.), Inc.) (registered investment adviser); Director and Chairman, Invesco Investment Services, Inc. (formerly known as Invesco AIM Investment Services, Inc.) (registered transfer agent); Senior Vice President, The Invesco Funds; Director, Invesco Investment Advisers LLC (formerly known as Van Kampen Asset Management); Director, President and Chairman, Invesco Insurance Agency, Inc. Formerly: Director, Invesco UK Limited; Director and Chief Executive, Invesco Asset Management Limited and Invesco Fund Managers Limited; Assistant Vice President, The Invesco Funds; Senior Vice President, Invesco Advisers, Inc. (formerly known as Invesco Institutional (N.A.), Inc.) (registered investment adviser); Director and Chief Executive, Invesco Administration Services Limited and Invesco Global Investment Funds Limited; Director, Invesco Distributors, Inc.; Head of EMEA, Invesco Ltd.; President, Invesco Actively Managed Exchange-Traded Commodity Fund Trust, Invesco Actively Managed Exchange-Traded Fund Trust, Invesco Exchange-Traded Fund Trust, Invesco Exchange-Traded Fund Trust II and Invesco India Exchange-Traded Fund Trust; Managing Director and Principal Executive Officer, Invesco Capital Management LLC | | N/A | | N/A |
Invesco V.I. S&P 500 Index Fund
Trustees and Officers–(continued)
| | | | | | | | |
Name, Year of Birth and
Position(s)
Held with the Trust | | Trustee
and/or
Officer
Since | | Principal Occupation(s)
During Past 5 Years | | Number of
Funds in
Fund Complex
Overseen by
Trustee | | Other
Directorship(s)
Held by Trustee
During Past 5
Years |
| Officers–(continued) | | | | | | | | |
John M. Zerr - 1962 Senior Vice President | | 2006 | | Chief Operating Officer of the Americas; Senior Vice President, Invesco Advisers, Inc. (formerly known as Invesco Institutional (N.A.), Inc.) (registered investment adviser); Senior Vice President, Invesco Distributors, Inc. (formerly known as Invesco AIM Distributors, Inc.); Director and Vice President, Invesco Investment Services, Inc. (formerly known as Invesco AIM Investment Services, Inc.) Senior Vice President, The Invesco Funds; Managing Director, Invesco Capital Management LLC; Director, Invesco Investment Advisers LLC (formerly known as Van Kampen Asset Management); Senior Vice President, Invesco Capital Markets, Inc. (formerly known as Van Kampen Funds Inc.); Manager, Invesco Indexing LLC; Manager, Invesco Specialized Products, LLC; Director and Senior Vice President, Invesco Insurance Agency, Inc.; Member, Invesco Canada Funds Advisory Board; Director, President and Chief Executive Officer, Invesco Corporate Class Inc. (corporate mutual fund company); and Director, Chairman, President and Chief Executive Officer, Invesco Canada Ltd. (formerly known as Invesco Trimark Ltd./Invesco Trimark Ltèe) (registered investment adviser and registered transfer agent) Formerly: Director and Senior Vice President, Invesco Management Group, Inc. (formerly known as Invesco AIM Management Group, Inc.); Secretary and General Counsel, Invesco Management Group, Inc. (formerly known as Invesco AIM Management Group, Inc.); Secretary, Invesco Investment Services, Inc. (formerly known as Invesco AIM Investment Services, Inc.); Chief Legal Officer and Secretary, The Invesco Funds; Secretary and General Counsel, Invesco Investment Advisers LLC (formerly known as Van Kampen Asset Management); Secretary and General Counsel, Invesco Capital Markets, Inc. (formerly known as Van Kampen Funds Inc.); Chief Legal Officer, Invesco Exchange-Traded Fund Trust, Invesco Exchange-Traded Fund Trust II, Invesco India Exchange-Traded Fund Trust, Invesco Actively Managed Exchange-Traded Fund Trust, Invesco Actively Managed Exchange-Traded Commodity Fund Trust and Invesco Exchange-Traded Self-Indexed Fund Trust; Secretary, Invesco Indexing LLC; Director, Secretary, General Counsel and Senior Vice President, Van Kampen Exchange Corp.; Director, Vice President and Secretary, IVZ Distributors, Inc. (formerly known as INVESCO Distributors, Inc.); Director and Vice President, INVESCO Funds Group, Inc.; Director and Vice President, Van Kampen Advisors Inc.; Director, Vice President, Secretary and General Counsel, Van Kampen Investor Services Inc.;Director and Secretary, Invesco Distributors, Inc. (formerly known as Invesco AIM Distributors, Inc.); Director, Senior Vice President, General Counsel and Secretary, Invesco AIM Advisers, Inc. and Van Kampen Investments Inc.; Director, Vice President and Secretary, Fund Management Company; Director, Senior Vice President, Secretary, General Counsel and Vice President, Invesco AIM Capital Management, Inc.; Chief Operating Officer and General Counsel, Liberty Ridge Capital, Inc. (an investment adviser) | | N/A | | N/A |
| Gregory G. McGreevey - 1962 Senior Vice President | | 2012 | | Senior Managing Director, Invesco Ltd.; Director, Chairman, President, and Chief Executive Officer, Invesco Advisers, Inc. (formerly known as Invesco Institutional (N.A.), Inc.) (registered investment adviser); Director, Invesco Mortgage Capital, Inc. and Invesco Senior Secured Management, Inc.; and Senior Vice President, The Invesco Funds; and President, SNW Asset Management Corporation Formerly: Senior Vice President, Invesco Management Group, Inc. and Invesco Advisers, Inc.; Assistant Vice President, The Invesco Funds | | N/A | | N/A |
Kelli Gallegos - 1970 Vice President, Principal Financial Officer and Assistant Treasurer | | 2008 | | Principal Financial and Accounting Officer - Investments Pool, Invesco Specialized Products, LLC; Vice President, Principal Financial Officer and Assistant Treasurer, The Invesco Funds; Principal Financial and Accounting Officer - Pooled Investments, Invesco Capital Management LLC; Vice President and Treasurer, Invesco Exchange-Traded Fund Trust, Invesco Exchange-Traded Fund Trust II, Invesco India Exchange-Traded Fund Trust, Invesco Actively Managed Exchange-Traded Fund Trust, Invesco Actively Managed Exchange-Traded Commodity Fund Trust and Invesco Exchange-Traded Self-Indexed Fund Trust Formerly: Assistant Treasurer, Invesco Specialized Products, LLC; Assistant Treasurer, Invesco Exchange-Traded Fund Trust, Invesco Exchange-Traded Fund Trust II, Invesco India Exchange-Traded Fund Trust, Invesco Actively Managed Exchange-Traded Fund Trust, Invesco Actively Managed Exchange-Traded Commodity Fund Trust and Invesco Exchange-Traded Self-Indexed Fund Trust; Assistant Treasurer, Invesco Capital Management LLC; Assistant Vice President, The Invesco Funds | | N/A | | N/A |
Invesco V.I. S&P 500 Index Fund
Trustees and Officers–(continued)
| | | | | | | | |
Name, Year of Birth and
Position(s)
Held with the Trust | | Trustee
and/or
Officer
Since | | Principal Occupation(s)
During Past 5 Years | | Number of
Funds in
Fund Complex
Overseen by
Trustee | | Other
Directorship(s) Held by Trustee
During Past 5 Years |
| Officers–(continued) | | | | | | | | |
| Crissie M. Wisdom - 1969 Anti-Money Laundering Compliance Officer | | 2013 | | Anti-Money Laundering Compliance Officer, Invesco Advisers, Inc. (formerly known as Invesco Institutional (N.A.), Inc.) (registered investment adviser), Invesco Capital Markets, Inc. (formerly known as Van Kampen Funds Inc.), Invesco Distributors, Inc., Invesco Investment Services, Inc., The Invesco Funds, and Invesco Exchange-Traded Fund Trust, Invesco Exchange-Traded Fund Trust II, Invesco India Exchange-Traded Fund Trust, Invesco Actively Managed Exchange-Traded Fund Trust, Invesco Actively Managed Exchange-Traded Commodity Fund Trust and Invesco Exchange-Traded Self-Indexed Fund Trust; Anti-Money Laundering Compliance Officer and Bank Secrecy Act Officer, INVESCO National Trust Company and Invesco Trust Company; and Fraud Prevention Manager and Controls and Risk Analysis Manager for Invesco Investment Services, Inc. Formerly: Anti-Money Laundering Compliance Officer, Van Kampen Exchange Corp. and Invesco Management Group, Inc. | | N/A | | N/A |
| Robert R. Leveille - 1969 Chief Compliance Officer | | 2016 | | Chief Compliance Officer, Invesco Advisers, Inc. (registered investment adviser); and Chief Compliance Officer, The Invesco Funds Formerly: Chief Compliance Officer, Putnam Investments and the Putnam Funds | | N/A | | N/A |
The Statement of Additional Information of the Trust includes additional information about the Fund’s Trustees and is available upon request, without charge, by calling 1.800.959.4246. Please refer to the Fund’s Statement of Additional Information for information on the Fund’ssub-advisers.
| | | | | | |
Office of the Fund 11 Greenway Plaza, Suite 1000 Houston, TX 77046-1173 | | Investment Adviser Invesco Advisers, Inc. 1555 Peachtree Street, N.E. Atlanta, GA 30309 | | Distributor Invesco Distributors, Inc. 11 Greenway Plaza, Suite 1000 Houston, TX 77046-1173 | | Auditors PricewaterhouseCoopers LLP 1000 Louisiana Street, Suite 5800 Houston, TX 77002-5678 |
| | | |
Counsel to the Fund Stradley Ronon Stevens & Young, LLP 2005 Market Street, Suite 2600 Philadelphia, PA 19103-7018 | | Counsel to the Independent Trustees Goodwin Procter LLP 901 New York Avenue, N.W. Washington, D.C. 20001 | | Transfer Agent Invesco Investment Services, Inc. 11 Greenway Plaza, Suite 1000 Houston, TX 77046-1173 | | Custodian State Street Bank and Trust Company 225 Franklin Street Boston, MA 02110-2801 |
Invesco V.I. S&P 500 Index Fund
| | | | |
| | |
 | | Annual Report to Shareholders | | December 31, 2019 |
| | |
| | Invesco V.I. Small Cap Equity Fund |
| | |
| | |

Beginning on January 1, 2021, as permitted by regulations adopted by the Securities and Exchange Commission, the insurance company that offers your variable annuity or variable life insurance contract may no longer send you paper copies of the Fund’s shareholder reports by mail, unless you specifically request paper copies of the reports from the insurance company or your financial intermediary. Instead of delivering paper copies of the report, the insurance company may choose to make the reports available on a website, and will notify you by mail each time a report is posted and provide you with a website link to access the report. Instructions for requesting paper copies will be provided by your insurance company.
If the insurance company offers electronic delivery, you may elect to receive shareholder reports and other communications about the Fund electronically by following the instructions provided by the insurance company or by contacting your financial intermediary. If you already elected to receive shareholder reports electronically, you will not be affected by this change and you need not take any action.
You may elect to receive all future reports in paper free of charge from the insurance company. You can inform the insurance company or your financial intermediary that you wish to continue receiving paper copies of your shareholder reports by following the instructions provided by the insurance company or by contacting your financial intermediary. Your election to receive reports in paper will apply to all portfolio companies available under your contract with the insurance company.
The Fund provides a complete list of its holdings four times in each fiscal year, at the quarter-ends. For the second and fourth quarters, the lists appear in the Fund’s semiannual and annual reports to shareholders. For the first and third quarters, the Fund files the lists with the Securities and Exchange Commission (SEC) as an exhibit to its reports on FormN-PORT. The Fund’s FormN-PORT filings are available on the SEC website, sec.gov. The SEC file numbers for the Fund are811-07452 and033-57340. The Fund’s most recent portfolio holdings, as filed on FormN-PORT, have also been made available to insurance companies issuing variable annuity contracts and variable life insurance policies (“variable products”) that invest in the Fund.
A description of the policies and procedures that the Fund uses to determine how to vote proxies relating to portfolio securities is available without charge, upon request, from our Client Services department at 800 959 4246 or at invesco.com/proxyguidelines. The information is also available on the SEC website, sec.gov.
Information regarding how the Fund voted proxies related to its portfolio securities during the most recent12-month period ended June 30 is available at invesco.com/proxysearch. The information is also available on the SEC website, sec.gov.
Invesco Advisers, Inc. is an investment adviser; it provides investment advisory services to individual and institutional clients and does not sell securities. Invesco Distributors, Inc. is the US distributor for Invesco Ltd.’s retail mutual funds, exchange-traded funds and institutional money market funds. Both are wholly owned, indirect subsidiaries of Invesco Ltd.
This report must be accompanied or preceded by a currently effective Fund prospectus and variable product prospectus, which contain more complete information, including sales charges and expenses. Investors should read each carefully before investing.
NOT FDIC INSURED | MAY LOSE VALUE | NO BANK GUARANTEE
| | |
Invesco Distributors, Inc. | | VISCE-AR-1 |
Management’s Discussion of Fund Performance
Performance summary
For the year ended December 31, 2019, Series I shares of Invesco V.I. Small Cap Equity Fund (the Fund) outperformed the Russell 2000 Index, the Fund’s style-specific benchmark.
Your Fund’s long-term performance appears later in this report.
Fund vs. Indexes
Total returns, 12/31/18 to 12/31/19, excluding variable product issuer charges. If variable product issuer charges were included, returns would be lower.
| | | | | |
| Series I Shares | | | | 26.60 | % |
| Series II Shares | | | | 26.32 | |
| S&P 500 Indexq (Broad Market Index) | | | | 31.49 | |
| Russell 2000 Indexq (Style-Specific Index) | | | | 25.52 | |
| Lipper VUF Small-Cap Core Funds Index∎ (Peer Group Index) | | | | 23.69 | |
| Source(s):qRIMES Technologies Corp.;∎Lipper Inc. | |
Market conditions and your Fund
Equity markets rallied in the first quarter of 2019, fueled by optimism about a potentialUS-China trade deal and indication that the US Federal Reserve (the Fed) would not raise interest rates in 2019, a surprising shift in monetary policy. The Fed’s more accommodative stance provided a supportive environment for equities and fixed income, even as US economic data were mixed and overseas growth appeared to be slowing. Against this backdrop, the S&P 500 Index posted its best first quarter returns since 1998.
Although the S&P 500 Index posted modest gains for the second quarter of 2019, the US stock market experienced increased volatility. After four consecutive months of rising stock markets, the market sold off in May 2019, along with bond yields and oil prices, as investors weighed the impact of the lingering trade war between the US and China, as well as potential tariffs imposed on Mexico. In addition, economic data showed a slowing domestic and global economy.
Key issues that concerned investors in the second quarter of 2019 carried over
into the third quarter. TheUS-China trade conflict worried investors and stifled business investment, even as the Fed cut interest rates by 0.25% in July and again in September 2019.1 This environment, combined with evidence of slowing global economic growth, fueled market volatility in August 2019. The US Treasury yield curve inverted several times, increasing fears of a possible US recession. As a result, August saw increased risk aversion, with investors crowding into asset classes perceived as safe havens, such as US Treasuries and gold. However, the Fed’s accommodative tone provided some support for risk assets.
Macroeconomic issues that concerned investors in the third quarter of 2019 mostly abated during the fourth quarter, providing the backdrop for strong equity market returns. Risk assets surged higher as a result of a delay in the Brexit agreement until January 2020, optimism that phase one of aUS-China trade deal would be completed and better-than-expected third-quarter corporate earnings results. The US economy rose higher than expected, at 2.1% during the third
quarter of 2019.2 During its October meeting, the Fed cut interest rates again by 0.25% based on business investment and exports remaining weak.1 Investors were also encouraged by a resilient US economy and corporate earnings, putting the US equity market on track for its largest annual rise since 2013.
Given this landscape, the Fund produced a strong, double-digit return and outperformed its style-specific benchmark during the year. Relative performance was primarily driven by stock selection in the health care, information technology (IT), industrials and energy sectors. Overweight exposures in IT and industrials also benefited the Fund’s relative performance. Conversely, stock selection in the financials and consumer staples sector detracted from the Fund’s relative performance. Ancillary cash also hurt the Fund’s relative returns, given strong stock market performance during the year.
Top individual contributors to the Fund’s performance during the year includedArray BioPharma, AvalaraandSPX.
Array BioPharma is a Colorado-based biotechnology company that experienced strong sales from its two drugs to treat metastatic melanoma in patients with a BRAF gene mutation. In May, Array reported positive phase 3 data for its BRAF-mutant colorectal cancer (CRC) treatment. This was significant as there was a very substantial unmet need that could add significant sales to Array’s franchise. In June, on the heels of the CRC data and the early commercial success of Array’s combination drug treatment for BRAF-mutant melanoma, Pfizer (not a Fund holding) announced its intent to acquire Array at a roughly 60% premium to its prior day trading price.
| | |
Portfolio Composition |
By sector | | % of total net assets |
| | |
| |
| Industrials | | 18.05% |
| Financials | | 17.87 |
| Information Technology | | 17.59 |
| Consumer Discretionary | | 12.63 |
| Health Care | | 12.54 |
| Real Estate | | 6.33 |
| Materials | | 4.30 |
| Energy | | 3.13 |
| Utilities | | 2.08 |
| Other Sectors, Each Less than 2% of Net Assets | | 3.80 |
| Money Market Funds Plus Other | | |
| Assets Less Liabilities | | 1.68 |
| | |
Top 10 Equity Holdings* | | |
| % of total net assets |
| |
1. SPX Corp. | | 1.88% |
2. Iridium Communications, Inc. | | 1.85 |
3. Lumentum Holdings, Inc. | | 1.63 |
4. Wolverine World Wide, Inc. | | 1.49 |
5. Boot Barn Holdings, Inc. | | 1.49 |
6. NeoGenomics, Inc. | | 1.46 |
7. HealthEquity, Inc. | | 1.40 |
8. Curtiss-Wright Corp. | | 1.35 |
9. LPL Financial Holdings, Inc. | | 1.33 |
10. Graphic Packaging Holding Co. | | 1.27 |
| | |
Total Net Assets | | $216.3 million |
| | |
| |
Total Number of Holdings* | | 94 |
The Fund’s holdings are subject to change, and there is no assurance that the Fund will continue to hold any particular security.
*Excluding money market fund holdings, if any.
Data presented here are as of December 31, 2019.
Invesco V.I. Small Cap Equity Fund
Seattle-based software company Avalara experienced better-than-expected revenues and bookings growth driven by new clients seeking to automate online sales taxes before state mandates take effect. A 2018 US Supreme Court ruling gave states the authority to require retailers to collect state taxes for online purchases. Since then, many states have revised their sales tax laws. California began taxing sales byout-of-state sellers in April. By October, 14 states required marketplace facilitators to charge sales tax. Given this, we believed Avalara’s bookings would continue even as more states implement new sales tax laws.
SPX, a global supplier of heating, ventilating and air conditioning infrastructure equipment, benefited from gradual improvements and decreasing operational risk since the company separated from its parent company a few years ago. During the year, SPX reported strong organic growth, executed strategic acquisitions to increase its profitability and strengthened its portfolio via divestitures.
Top individual detractors from the Fund’s performance for the year includedRetrophin,American Eagle OutfittersandICU Medical.
Biopharmaceutical firm Retrophin suffered from a phase 3 drug trial failure, which, in our view, essentially removed one of the company’s two key value drivers. We sold the stock given the limited upside until its next phase 3 data is released in 2021.
Clothing retailer American Eagle Outfitters sold off in May after President Trump threatened to impose tariffs on apparel sourced from China. Investors’ fears remained heightened that the potential for these List 4 tariffs would result in lower earnings and profits for American Eagle Outfitters. We continued to hold the stock as the company’s management team had high conviction that it would be able to mitigate any impacts from tariffs based on their conversations with suppliers.
During the year, ICU Medical announced it would exit the intravenous solutions business, which is primarily serviced through short-term contracts, and instead focus on its long-term contracts business. Essentially, the company decided to sacrifice short-term sales and profits that can be volatile in favor of longer, more stable sales and profits. We viewed weakness in the share price as transitory and continued to hold the stock.
We wish to remind you that all positioning changes are based on a
bottom-up stock selection process. Our portfolio construction process seeks to manage risk and ensure alignment withsmall-cap market sector exposure within modest over- and underweight allocations relative to the style-specific benchmark. At the close of the year, the Fund’s underweight exposures relative to the Russell 2000 Index were in the health care, utilities, real estate, consumer staples, communication services and energy sectors. Conversely, the Fund’s overweight exposures relative to the Russell 2000 Index were in the IT, industrials, consumer discretionary, materials and financials sectors.
Central bank actions in 2019 supported continued growth by keeping the cost of debt low. At the end of the year, the labor market remained healthy with employment and wage gains, which was beneficial to consumers. However, these were clearly the late innings of the economic cycle and, therefore, we expect only modest growth from here, as well as continued volatility spurred by trade and election headlines. Prolonged cyclical growth is likely to be scarce and we believe the market will continue to favor companies that can produce sustainable, above-average earnings and cash flow growth despite the economic cycle.
Thank you for investing in Invesco V.I. Small Cap Equity Fund and for sharing our long-term investment horizon.
1 Source: US Federal Reserve
2 Source: Bureau of Economic Analysis
Portfolio managers:
Juan Hartsfield - Lead
Davis Paddock
The views and opinions expressed in management’s discussion of Fund performance are those of Invesco Advisers, Inc. These views and opinions are subject to change at any time based on factors such as market and economic conditions. These views and opinions may not be relied upon as investment advice or recommendations, or as an offer for a particular security. The information is not a complete analysis of every aspect of any market, country, industry, security or the Fund. Statements of fact are from sources considered reliable, but Invesco Advisers, Inc. makes no representation or warranty as to their completeness or accuracy. Although historical performance is no guarantee of future results, these insights may help you understand our investment management philosophy.
See important Fund and, if applicable, index disclosures later in this report.
Invesco V.I. Small Cap Equity Fund
Your Fund’s Long-Term Performance
Results of a $10,000 Investment – Oldest Share Class(es)
Fund and index data from 12/31/09
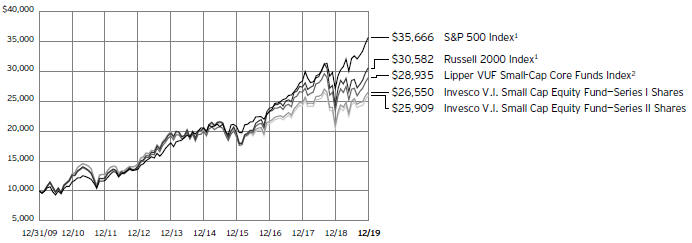
1 Source: RIMES Technologies Corp.
2 Source: Lipper Inc.
Past performance cannot guarantee future
results.
| | | | |
Average Annual Total Returns | |
As of 12/31/19 | | | | |
| |
Series I Shares | | | | |
Inception (8/29/03) | | | 8.31 | % |
10 Years | | | 10.26 | |
5 Years | | | 5.36 | |
1 Year | | | 26.60 | |
| |
Series II Shares | | | | |
Inception (8/29/03) | | | 8.05 | % |
10 Years | | | 9.99 | |
5 Years | | | 5.11 | |
1 Year | | | 26.32 | |
The performance of the Fund’s Series I and Series II share classes will differ primarily due to different class expenses.
The performance data quoted represent past performance and cannot guarantee future results; current performance may be lower or higher. Please contact your variable product issuer or financial adviser for the most recentmonth-end variable product performance. Performance figures reflect Fund expenses, reinvested distributions and changes in net asset value. Performance figures do not reflect deduction of taxes a shareholder would pay on Fund distributions or sale of Fund shares. Investment return and principal value will fluctuate so that you may have a gain or loss when you sell shares.
The total annual Fund operating expense ratio set forth in the most recent Fund prospectus as of the date of this report for Series I and Series II shares was 0.96% and 1.21%, respectively. The expense ratios presented above may vary from the
expense ratios presented in other sections of this report that are based on expenses incurred during the period covered by this report.
Invesco V.I. Small Cap Equity Fund, a series portfolio of AIM Variable Insurance Funds (Invesco Variable Insurance Funds), is currently offered through insurance companies issuing variable products. You cannot purchase shares of the Fund directly. Performance figures given represent the Fund and are not intended to reflect actual variable product values. They do not reflect sales charges, expenses and fees assessed in connection with a variable product. Sales charges, expenses and fees, which are determined by the variable product issuers, will vary and will lower the total return.
The most recentmonth-end performance at the Fund level, excluding variable product charges, is available at 800 451 4246. As mentioned above, for the most recentmonth-end performance including variable product charges, please contact your variable product issuer or financial adviser.
Fund performance reflects any applicable fee waivers and/or expense reimbursements. Had the adviser not waived fees and/or reimbursed expenses currently or in the past, returns would have been lower. See current prospectus for more information.
Invesco V.I. Small Cap Equity Fund
Invesco V.I. Small Cap Equity Fund’s investment objective is long-term growth of capital.
| ∎ | Unless otherwise stated, information presented in this report is as of December 31, 2019, and is based on total net assets. |
| ∎ | Unless otherwise noted, all data provided by Invesco. |
| ∎ | To access your Fund’s reports/prospectus, visit invesco.com/fundreports. |
About indexes in this report
| ∎ | TheS&P 500® Indexis an unmanaged index considered representative of the US stock market. |
| ∎ | TheRussell 2000® Indexis an unmanaged index considered representative ofsmall-cap stocks. The Russell 2000 Index is a trademark/service mark of the Frank Russell Co. Russell® is a trademark of the Frank Russell Co. |
| ∎ | TheLipper VUFSmall-Cap Core Funds Indexis an unmanaged index considered representative ofsmall-cap core variable insurance underlying funds tracked by Lipper. |
| ∎ | The Fund is not managed to track the performance of any particular index, including the index(es) described here, and consequently, the performance of the Fund may deviate significantly from the performance of the index(es). |
| ∎ | A direct investment cannot be made in an index. Unless otherwise indicated, index results include reinvested dividends, and they do not reflect sales charges. Performance of the peer group, if applicable, reflects fund expenses; performance of a market index does not. |
Other information
| ∎ | The returns shown in management’s discussion of Fund performance are based on net asset values calculated for shareholder transactions. Generally accepted accounting principles require adjustments to be made to the net assets of the Fund at period end for financial reporting purposes, and as such, the net asset values for shareholder transactions and the returns based on those net asset values may differ from the net asset values and returns reported in the Financial Highlights. Additionally, the returns and net asset values shown throughout this report are at the Fund level only and do not include variable product issuer charges. If such charges were included, the total returns would be lower. |
| ∎ | Industry classifications used in this report are generally according to the Global Industry Classification Standard, which was developed by and is |
| | the exclusive property and a service mark of MSCI Inc. and Standard & Poor’s. |
Invesco V.I. Small Cap Equity Fund
Schedule of Investments(a)
December 31, 2019
| | | | | | |
| | | Shares | | | Value |
Common Stocks & Other Equity Interests–98.32% |
| | |
Aerospace & Defense–3.75% | | | | | | |
| | |
BWX Technologies, Inc. | | | 41,812 | | | $ 2,595,689 |
Cubic Corp. | | | 40,938 | | | 2,602,429 |
Curtiss-Wright Corp. | | | 20,740 | | | 2,922,058 |
| | | | | | | 8,120,176 |
| | |
Alternative Carriers–1.85% | | | | | | |
| | |
Iridium Communications, Inc.(b) | | | 162,059 | | | 3,993,134 |
| | |
Apparel Retail–2.79% | | | | | | |
| | |
American Eagle Outfitters, Inc. | | | 109,533 | | | 1,610,135 |
Boot Barn Holdings, Inc.(b) | | | 72,296 | | | 3,219,341 |
Children’s Place, Inc. (The)(c) | | | 19,092 | | | 1,193,632 |
| | | | | | | 6,023,108 |
| | |
Application Software–4.84% | | | | | | |
| | |
Avalara, Inc.(b) | | | 32,809 | | | 2,403,259 |
Blackbaud, Inc. | | | 25,841 | | | 2,056,944 |
Cornerstone OnDemand, Inc.(b) | | | 36,983 | | | 2,165,355 |
Manhattan Associates, Inc.(b) | | | 19,494 | | | 1,554,646 |
Q2 Holdings, Inc.(b) | | | 28,232 | | | 2,289,051 |
| | | | | | | 10,469,255 |
|
Asset Management & Custody Banks–0.59% |
| | |
Blucora, Inc.(b) | | | 48,861 | | | 1,277,227 |
| | |
Auto Parts & Equipment–1.06% | | | | | | |
| | |
Visteon Corp.(b) | | | 26,580 | | | 2,301,562 |
| | |
Biotechnology–1.25% | | | | | | |
| | |
Neurocrine Biosciences, Inc.(b) | | | 25,236 | | | 2,712,618 |
| | |
Building Products–0.47% | | | | | | |
| | |
Trex Co., Inc.(b) | | | 11,355 | | | 1,020,587 |
| | |
Casinos & Gaming–1.94% | | | | | | |
| | |
Boyd Gaming Corp. | | | 69,244 | | | 2,073,165 |
Penn National Gaming, Inc.(b) | | | 82,702 | | | 2,113,863 |
| | | | | | | 4,187,028 |
|
Communications Equipment–2.66% |
| | |
Ciena Corp.(b) | | | 52,184 | | | 2,227,735 |
Lumentum Holdings, Inc.(b) | | | 44,529 | | | 3,531,150 |
| | | | | | | 5,758,885 |
| |
Construction & Engineering–1.45% | | | |
| | |
Dycom Industries, Inc.(b) | | | 25,622 | | | 1,208,078 |
Primoris Services Corp. | | | 86,951 | | | 1,933,790 |
| | | | | | | 3,141,868 |
| |
Construction Materials–0.97% | | | |
| | |
Summit Materials, Inc., Class A(b) | | | 87,678 | | | 2,095,504 |
| | | | | | |
| | | Shares | | | Value |
Data Processing & Outsourced Services–2.02% |
| | |
Euronet Worldwide, Inc.(b) | | | 13,012 | | | $ 2,050,171 |
Jack Henry & Associates, Inc. | | | 15,954 | | | 2,324,019 |
| | | | | | | 4,374,190 |
|
Diversified Support Services–1.14% |
| | |
Mobile Mini, Inc. | | | 64,816 | | | 2,457,175 |
|
Education Services–1.02% |
| | |
Strategic Education, Inc. | | | 13,865 | | | 2,203,149 |
|
Electric Utilities–1.01% |
| | |
IDACORP, Inc. | | | 20,458 | | | 2,184,914 |
|
Electrical Components & Equipment–1.18% |
| | |
EnerSys | | | 34,071 | | | 2,549,533 |
|
Electronic Equipment & Instruments–2.21% |
| | |
Badger Meter, Inc. | | | 33,287 | | | 2,161,325 |
FLIR Systems, Inc. | | | 50,275 | | | 2,617,819 |
| | | | | | | 4,779,144 |
|
Environmental & Facilities Services–3.12% |
| | |
ABM Industries, Inc. | | | 55,632 | | | 2,097,883 |
BrightView Holdings, Inc.(b) | | | 131,958 | | | 2,226,131 |
Casella Waste Systems, Inc.,
Class A(b) | | | 52,831 | | | 2,431,811 |
| | | | | | | 6,755,825 |
|
Fertilizers & Agricultural Chemicals–1.12% |
| | |
ScottsMiracle-Gro Co. (The) | | | 22,880 | | | 2,429,398 |
|
Financial Exchanges & Data–1.11% |
| | |
TMX Group Ltd. (Canada) | | | 27,641 | | | 2,393,616 |
|
Food Retail–0.93% |
| | |
Sprouts Farmers Market, Inc.(b) | | | 104,386 | | | 2,019,869 |
|
Footwear–1.49% |
| | |
Wolverine World Wide, Inc. | | | 95,792 | | | 3,232,022 |
|
General Merchandise Stores–0.59% |
| | |
Big Lots, Inc. | | | 44,693 | | | 1,283,583 |
|
Health Care Equipment–3.37% |
| | |
Hill-Rom Holdings, Inc. | | | 22,156 | | | 2,515,371 |
STERIS PLC | | | 14,761 | | | 2,249,871 |
Wright Medical Group N.V.(b) | | | 82,727 | | | 2,521,519 |
| | | | | | | 7,286,761 |
|
Health Care Facilities–2.01% |
| | |
Acadia Healthcare Co., Inc.(b) | | | 60,154 | | | 1,998,316 |
Encompass Health Corp. | | | 33,947 | | | 2,351,509 |
| | | | | | | 4,349,825 |
|
Health Care REITs–1.03% |
| | |
Healthcare Trust of America, Inc., Class A | | | 73,219 | | | 2,217,071 |
Invesco V.I. Small Cap Equity Fund
| | | | | | |
| | | Shares | | | Value |
Health Care Supplies–1.78% |
| | |
ICU Medical, Inc.(b) | | | 9,297 | | | $ 1,739,655 |
Lantheus Holdings, Inc.(b) | | | 103,201 | | | 2,116,652 |
| | | | | | | 3,856,307 |
| | |
Industrial Machinery–3.85% | | | | | | |
| | |
Albany International Corp. | | | 26,639 | | | 2,022,433 |
Altra Industrial Motion Corp. | | | 61,782 | | | 2,237,126 |
SPX Corp.(b) | | | 79,899 | | | 4,065,261 |
| | | | | | | 8,324,820 |
| | |
Industrial REITs–1.04% | | | | | | |
| | |
EastGroup Properties, Inc. | | | 16,878 | | | 2,239,204 |
|
Investment Banking & Brokerage–2.52% |
| | |
LPL Financial Holdings, Inc. | | | 31,155 | | | 2,874,049 |
Piper Sandler Cos. | | | 32,097 | | | 2,565,834 |
| | | | | | | 5,439,883 |
| | |
Life & Health Insurance–1.07% | | | | | | |
| | |
Primerica, Inc. | | | 17,647 | | | 2,303,992 |
|
Life Sciences Tools & Services–1.46% |
| | |
NeoGenomics, Inc.(b) | | | 108,170 | | | 3,163,973 |
| | |
Managed Health Care–1.40% | | | | | | |
| | |
HealthEquity, Inc.(b) | | | 40,787 | | | 3,021,093 |
| | |
Multi-line Insurance–1.03% | | | | | | |
| | |
Assurant, Inc. | | | 16,922 | | | 2,218,136 |
| | |
Office REITs–1.08% | | | | | | |
| | |
Highwoods Properties, Inc. | | | 47,655 | | | 2,330,806 |
|
Oil & Gas Equipment & Services–0.96% |
| | |
Apergy Corp.(b) | | | 61,510 | | | 2,077,808 |
|
Oil & Gas Exploration & Production–2.17% |
| | |
Matador Resources Co.(b) | | | 82,789 | | | 1,487,718 |
Parsley Energy, Inc., Class A(b) | | | 83,969 | | | 1,587,854 |
Viper Energy Partners L.P. | | | 65,293 | | | 1,610,125 |
| | | | | | | 4,685,697 |
| | |
Packaged Foods & Meats–1.02% | | | | | | |
| | |
Calavo Growers, Inc.(b) | | | 24,342 | | | 2,205,142 |
| | |
Paper Packaging–1.27% | | | | | | |
| | |
Graphic Packaging Holding Co. | | | 165,228 | | | 2,751,046 |
| | |
Pharmaceuticals–1.26% | | | | | | |
| | |
Horizon Therapeutics PLC(b) | | | 75,212 | | | 2,722,674 |
|
Property & Casualty Insurance–1.70% |
| | |
Hanover Insurance Group, Inc. (The) | | | 14,334 | | | 1,959,028 |
Selective Insurance Group, Inc. | | | 26,204 | | | 1,708,239 |
| | | | | | | 3,667,267 |
| | |
Real Estate Services–1.11% | | | | | | |
| | |
FirstService Corp. (Canada) | | | 25,703 | | | 2,392,850 |
| | | | | | |
| | | Shares | | | Value |
Regional Banks–8.80% |
| | |
CenterState Bank Corp. | | | 84,405 | | | $ 2,108,437 |
Columbia Banking System, Inc. | | | 63,294 | | | 2,575,116 |
Community Bank System, Inc. | | | 31,996 | | | 2,269,796 |
Glacier Bancorp, Inc. | | | 49,391 | | | 2,271,492 |
Pacific Premier Bancorp, Inc. | | | 65,657 | | | 2,140,747 |
Pinnacle Financial Partners, Inc. | | | 35,085 | | | 2,245,440 |
Webster Financial Corp. | | | 50,741 | | | 2,707,540 |
Western Alliance Bancorporation(b) | | | 47,576 | | | 2,711,832 |
| | | | | | | 19,030,400 |
|
Restaurants–1.96% |
| | |
Papa John’s International, Inc. | | | 33,421 | | | 2,110,536 |
Wendy’s Co. (The) | | | 95,882 | | | 2,129,539 |
| | | | | | | 4,240,075 |
|
Semiconductor Equipment–1.95% |
| | |
Brooks Automation, Inc. | | | 48,070 | | | 2,017,017 |
Entegris, Inc. | | | 44,143 | | | 2,211,123 |
| | | | | | | 4,228,140 |
|
Semiconductors–2.95% |
| | |
Lattice Semiconductor Corp.(b) | | | 110,051 | | | 2,106,376 |
Power Integrations, Inc. | | | 18,695 | | | 1,849,122 |
Semtech Corp.(b) | | | 45,661 | | | 2,415,467 |
| | | | | | | 6,370,965 |
|
Specialized Consumer Services–0.94% |
| | |
ServiceMaster Global Holdings, Inc.(b) | | | 52,640 | | | 2,035,062 |
|
Specialized REITs–2.09% |
| | |
CubeSmart | | | 63,327 | | | 1,993,534 |
CyrusOne, Inc. | | | 38,606 | | | 2,525,991 |
| | | | | | | 4,519,525 |
|
Specialty Chemicals–0.94% |
| | |
Sensient Technologies Corp. | | | 30,750 | | | 2,032,268 |
|
Systems Software–0.95% |
| | |
Rapid7, Inc.(b) | | | 36,648 | | | 2,053,021 |
|
Thrifts & Mortgage Finance–1.07% |
| | |
Essent Group Ltd. | | | 44,535 | | | 2,315,375 |
|
Tires & Rubber–0.84% |
| | |
Cooper Tire & Rubber Co. | | | 62,950 | | | 1,809,813 |
|
Trading Companies & Distributors–0.99% |
| | |
Univar Solutions, Inc.(b) | | | 88,708 | | | 2,150,282 |
|
Trucking–2.08% |
| | |
Knight-Swift Transportation Holdings, Inc. | | | 60,320 | | | 2,161,869 |
Old Dominion Freight Line, Inc. | | | 12,338 | | | 2,341,505 |
| | | | | | | 4,503,374 |
Invesco V.I. Small Cap Equity Fund
| | | | | | |
| | | Shares | | | Value |
Water Utilities–1.07% | | | | | | |
| | |
California Water Service Group | | | 44,810 | | | $ 2,310,404 |
Total Common Stocks & Other Equity Interests
(Cost $180,299,972) | | | 212,616,429 |
| | |
Money Market Funds–1.92% | | | | | | |
| | |
Invesco Government & Agency Portfolio, Institutional Class,
1.50%(d) | | | 1,445,484 | | | 1,445,484 |
Invesco Liquid Assets Portfolio, Institutional Class, 1.71%(d) | | | 1,043,304 | | | 1,043,617 |
Invesco Treasury Portfolio, Institutional Class, 1.49%(d) | | | 1,651,983 | | | 1,651,983 |
Total Money Market Funds
(Cost $4,140,976) | | | 4,141,084 |
TOTAL INVESTMENTS IN SECURITIES (excluding investments purchased with cash collateral from securities onloan)-100.24% (Cost $184,440,948) | | | 216,757,513 |
| | | | | | | | |
| | | Shares | | | Value | |
| |
Investments Purchased with Cash Collateral from Securities on Loan | |
| | |
Money Market Funds–0.49% | | | | | | | | |
| | |
Invesco Government & Agency Portfolio, Institutional Class,
1.50%(d)(e) | | | 795,743 | | | $ | 795,743 | |
| |
Invesco Liquid Assets Portfolio, Institutional Class, 1.71%(d)(e) | | | 265,168 | | | | 265,247 | |
| |
Total Investments Purchased with Cash Collateral from Securities on Loan
(Cost $1,061,014) | | | | 1,060,990 | |
| |
TOTAL INVESTMENTS IN
SECURITIES-100.73%
(Cost $185,501,962) | | | | 217,818,503 | |
| |
OTHER ASSETS LESS LIABILITIES–(0.73)% | | | | (1,567,977 | ) |
| |
NET ASSETS–100.00% | | | $ | 216,250,526 | |
| |
Investment Abbreviations:
REIT - Real Estate Investment Trust
Notes to Schedule of Investments:
| (a) | Industry and/or sector classifications used in this report are generally according to the Global Industry Classification Standard, which was developed by and is the exclusive property and a service mark of MSCI Inc. and Standard & Poor’s. |
| (b) | Non-income producing security. |
| (c) | All or a portion of this security was out on loan at December 31, 2019. |
| (d) | The money market fund and the Fund are affiliated by having the same investment adviser. The rate shown is the7-day SEC standardized yield as of December 31, 2019. |
| (e) | The security has been segregated to satisfy the commitment to return the cash collateral received in securities lending transactions upon the borrower’s return of the securities loaned. See Note 11. |
Invesco V.I. Small Cap Equity Fund
Statement of Assets and Liabilities
December 31, 2019
| | |
Assets: | | |
| |
Investments in securities, at value
(Cost $180,299,972)* | | $212,616,429 |
Investments in affiliated money market funds, at value (Cost $5,201,990) | | 5,202,074 |
Foreign currencies, at value (Cost $11,735) | | 11,912 |
Receivable for: | | |
Investments sold | | 160,945 |
Fund shares sold | | 58,884 |
Dividends | | 169,033 |
Investment for trustee deferred compensation and retirement plans | | 83,555 |
Total assets | | 218,302,832 |
| |
Liabilities: | | |
| |
Payable for: | | |
Investments purchased | | 496,355 |
Fund shares reacquired | | 121,486 |
Amount due custodian | | 80,987 |
Collateral upon return of securities loaned | | 1,061,014 |
Accrued fees to affiliates | | 153,971 |
Accrued trustees’ and officers’ fees and benefits | | 634 |
Accrued other operating expenses | | 46,084 |
Trustee deferred compensation and retirement plans | | 91,775 |
Total liabilities | | 2,052,306 |
Net assets applicable to shares outstanding | | $216,250,526 |
| |
Net assets consist of: | | |
| |
Shares of beneficial interest | | $165,597,385 |
Distributable earnings | | 50,653,141 |
| | | $216,250,526 |
| |
Net Assets: | | |
| |
Series I | | $118,207,696 |
Series II | | $ 98,042,830 |
|
Shares outstanding, no par value, with an unlimited number of shares authorized: |
| |
Series I | | 6,665,467 |
Series II | | 5,907,926 |
Series I: | | |
Net asset value per share | | $ 17.73 |
Series II: | | |
Net asset value per share | | $ 16.60 |
| * | At December 31, 2019, securities with an aggregate value of $1,039,949 were on loan to brokers. |
Statement of Operations
For the year ended December 31, 2019
| | | | |
Investment income: | | | | |
| |
Dividends (net of foreign withholding taxes of $15,662) | | $ | 3,021,188 | |
| |
Dividends from affiliated money market funds (includes securities lending income of $23,847) | | | 205,088 | |
| |
Total investment income | | | 3,226,276 | |
| |
| |
Expenses: | | | | |
| |
Advisory fees | | | 1,846,907 | |
| |
Administrative services fees | | | 405,422 | |
| |
Custodian fees | | | 8,464 | |
| |
Distribution fees - Series II | | | 328,000 | |
| |
Transfer agent fees | | | 31,180 | |
| |
Trustees’ and officers’ fees and benefits | | | 22,762 | |
| |
Reports to shareholders | | | 8,822 | |
| |
Professional services fees | | | 48,624 | |
| |
Other | | | 5,568 | |
| |
Total expenses | | | 2,705,749 | |
| |
Less: Fees waived | | | (9,439 | ) |
| |
Net expenses | | | 2,696,310 | |
| |
Net investment income | | | 529,966 | |
| |
| |
Realized and unrealized gain from: | | | | |
| |
Net realized gain from: | | | | |
Investment securities | | | 29,137,269 | |
| |
Foreign currencies | | | 363 | |
| |
Forward foreign currency contracts | | | 133 | |
| |
| | | 29,137,765 | |
| |
Change in net unrealized appreciation of: | | | | |
Investment securities | | | 25,301,337 | |
| |
Foreign currencies | | | 177 | |
| |
| | | 25,301,514 | |
| |
Net realized and unrealized gain | | | 54,439,279 | |
| |
Net increase in net assets resulting from operations | | $ | 54,969,245 | |
| |
See accompanying Notes to Financial Statements which are an integral part of the financial statements.
Invesco V.I. Small Cap Equity Fund
Statement of Changes in Net Assets
For the years ended December 31, 2019 and 2018
| | | | | | | | |
| | | 2019 | | | 2018 | |
| |
Operations: | | | | | | | | |
| | |
Net investment income (loss) | | $ | 529,966 | | | $ | (76,606 | ) |
| |
Net realized gain | | | 29,137,765 | | | | 31,854,197 | |
| |
Change in net unrealized appreciation (depreciation) | | | 25,301,514 | | | | (70,466,254 | ) |
| |
Net increase (decrease) in net assets resulting from operations | | | 54,969,245 | | | | (38,688,663 | ) |
| |
| | |
Distributions to shareholders from distributable earnings: | | | | | | | | |
| | |
Series I | | | (13,821,130 | ) | | | (8,819,904 | ) |
| |
Series II | | | (18,517,603 | ) | | | (10,565,170 | ) |
| |
Total distributions from distributable earnings | | | (32,338,733 | ) | | | (19,385,074 | ) |
| |
| | |
Share transactions–net: | | | | | | | | |
| | |
Series I | | | (1,229,864 | ) | | | (16,916,326 | ) |
| |
Series II | | | (30,878,941 | ) | | | (6,035,415 | ) |
| |
Net increase (decrease) in net assets resulting from share transactions | | | (32,108,805 | ) | | | (22,951,741 | ) |
| |
Net increase (decrease) in net assets | | | (9,478,293 | ) | | | (81,025,478 | ) |
| |
| | |
Net assets: | | | | | | | | |
| | |
Beginning of year | | | 225,728,819 | | | | 306,754,297 | |
| |
End of year | | $ | 216,250,526 | | | $ | 225,728,819 | |
| |
See accompanying Notes to Financial Statements which are an integral part of the financial statements.
Invesco V.I. Small Cap Equity Fund
Financial Highlights
The following schedule presents financial highlights for a share of the Fund outstanding throughout the periods indicated.
| | | | | | | | | | | | | | | | | | | | | | | | | | | | | | | | | | | | | | | | | | | | | | | | | | | | | | | | | | | | |
| | | Net asset value, beginning
of period | | Net investment income (loss)(a) | | Net gains
(losses)
on securities
(both
realized and
unrealized) | | Total from investment
operations | | Distributions
from net
realized
gains | | Net asset
value, end
of period | | Total
return (b) | | Net assets,
end of period
(000’s omitted) | | Ratio of
expenses
to average
net assets
with fee waivers
and/or
expenses
absorbed | | Ratio of
expenses
to average net
assets without
fee waivers
and/or
expenses
absorbed | | Ratio of net
investment
income
(loss)
to average
net assets | | Portfolio turnover (c) |
Series I | | | | | | | | | | | | | | | | | | | | | | | | | | | | | | | | | | | | | | | | | | | | | | | | | | | | | | | | | | | | |
Year ended 12/31/19 | | | $ | 15.93 | | | | $ | 0.06 | | | | $ | 4.03 | | | | $ | 4.09 | | | | $ | (2.29 | ) | | | $ | 17.73 | | | | | 26.60 | % | | | $ | 118,208 | | | | | 0.96 | %(d) | | | | 0.96 | %(d) | | | | 0.34 | %(d) | | | | 44 | % |
Year ended 12/31/18 | | | | 20.02 | | | | | 0.02 | | | | | (2.74 | ) | | | | (2.72 | ) | | | | (1.37 | ) | | | | 15.93 | | | | | (15.08 | ) | | | | 106,064 | | | | | 0.96 | | | | | 0.96 | | | | | 0.10 | | | | | 22 | |
Year ended 12/31/17 | | | | 18.38 | | | | | (0.01 | ) | | | | 2.53 | | | | | 2.52 | | | | | (0.88 | ) | | | | 20.02 | | | | | 14.06 | | | | | 149,405 | | | | | 0.97 | | | | | 0.97 | | | | | (0.02 | ) | | | | 20 | |
Year ended 12/31/16 | | | | 17.64 | | | | | 0.01 | | | | | 2.06 | | | | | 2.07 | | | | | (1.33 | ) | | | | 18.38 | | | | | 12.06 | | | | | 161,727 | | | | | 1.01 | | | | | 1.01 | | | | | 0.04 | | | | | 37 | |
Year ended 12/31/15 | | | | 23.64 | | | | | 0.00 | | | | | (1.27 | ) | | | | (1.27 | ) | | | | (4.73 | ) | | | | 17.64 | | | | | (5.52 | ) | | | | 166,407 | | | | | 1.04 | | | | | 1.04 | | | | | 0.02 | | | | | 31 | |
Series II | | | | | | | | | | | | | | | | | | | | | | | | | | | | | | | | | | | | | | | | | | | | | | | | | | | | | | | | | | | | |
Year ended 12/31/19 | | | | 15.07 | | | | | 0.02 | | | | | 3.80 | | | | | 3.82 | | | | | (2.29 | ) | | | | 16.60 | | | | | 26.32 | | | | | 98,043 | | | | | 1.21 | (d) | | | | 1.21 | (d) | | | | 0.09 | (d) | | | | 44 | |
Year ended 12/31/18 | | | | 19.05 | | | | | (0.03 | ) | | | | (2.58 | ) | | | | (2.61 | ) | | | | (1.37 | ) | | | | 15.07 | | | | | (15.27 | ) | | | | 119,664 | | | | | 1.21 | | | | | 1.21 | | | | | (0.15 | ) | | | | 22 | |
Year ended 12/31/17 | | | | 17.58 | | | | | (0.05 | ) | | | | 2.40 | | | | | 2.35 | | | | | (0.88 | ) | | | | 19.05 | | | | | 13.73 | | | | | 157,349 | | | | | 1.22 | | | | | 1.22 | | | | | (0.27 | ) | | | | 20 | |
Year ended 12/31/16 | | | | 16.96 | | | | | (0.03 | ) | | | | 1.98 | | | | | 1.95 | | | | | (1.33 | ) | | | | 17.58 | | | | | 11.84 | | | | | 148,883 | | | | | 1.26 | | | | | 1.26 | | | | | (0.21 | ) | | | | 37 | |
Year ended 12/31/15 | | | | 22.97 | | | | | (0.05 | ) | | | | (1.23 | ) | | | | (1.28 | ) | | | | (4.73 | ) | | | | 16.96 | | | | | (5.74 | ) | | | | 128,614 | | | | | 1.29 | | | | | 1.29 | | | | | (0.23 | ) | | | | 31 | |
| (a) | Calculated using average shares outstanding. |
| (b) | Includes adjustments in accordance with accounting principles generally accepted in the United States of America and as such, the net asset value for financial reporting purposes and the returns based upon those net asset values may differ from the net asset value and returns for shareholder transactions. Total returns are not annualized for periods less than one year, if applicable, and do not reflect charges assessed in connection with a variable product, which if included would reduce total returns. |
| (c) | Portfolio turnover is calculated at the fund level and is not annualized for periods less than one year, if applicable. |
| (d) | Ratios are based on average daily net assets (000’s omitted) of $116,766 and $131,141 for Series I and Series II shares, respectively. |
See accompanying Notes to Financial Statements which are an integral part of the financial statements.
Invesco V.I. Small Cap Equity Fund
Notes to Financial Statements
December 31, 2019
NOTE 1–Significant Accounting Policies
Invesco V.I. Small Cap Equity Fund (the “Fund”) is a series portfolio of AIM Variable Insurance Funds (Invesco Variable Insurance Funds) (the “Trust”). The Trust is a Delaware statutory trust registered under the Investment Company Act of 1940, as amended (the “1940 Act”), as anopen-end series management investment company. Information presented in these financial statements pertains only to the Fund. Matters affecting the Fund or each class will be voted on exclusively by the shareholders of the Fund or each class. Current Securities and Exchange Commission (“SEC”) guidance, however, requires participating insurance companies offering separate accounts to vote shares proportionally in accordance with the instructions of the contract owners whose investments are funded by shares of each Fund or class.
The Fund’s investment objective is long-term growth of capital.
The Fund currently offers two classes of shares, Series I and Series II, both of which are offered to insurance company separate accounts funding variable annuity contracts and variable life insurance policies (“variable products”).
The Fund is an investment company and accordingly follows the investment company accounting and reporting guidance in accordance with Financial Accounting Standards Board Accounting Standards Codification Topic 946,Financial Services - Investment Companies.
The following is a summary of the significant accounting policies followed by the Fund in the preparation of its financial statements.
A. Security Valuations– Securities, including restricted securities, are valued according to the following policy.
A security listed or traded on an exchange (except convertible securities) is valued at its last sales price or official closing price as of the close of the customary trading session on the exchange where the security is principally traded, or lacking any sales or official closing price on a particular day, the security may be valued at the closing bid price on that day. Securities traded in theover-the-counter market are valued based on prices furnished by independent pricing services or market makers. When such securities are valued by an independent pricing service they may be considered fair valued. Futures contracts are valued at the final settlement price set by an exchange on which they are principally traded. Listed options are valued at the mean between the last bid and asked prices from the exchange on which they are principally traded. Options not listed on an exchange are valued by an independent source at the mean between the last bid and asked prices. For purposes of determining net asset value (“NAV”) per share, futures and option contracts generally are valued 15 minutes after the close of the customary trading session of the New York Stock Exchange (“NYSE”).
Investments inopen-end andclosed-end registered investment companies that do not trade on an exchange are valued at theend-of-day net asset value per share. Investments inopen-end andclosed-end registered investment companies that trade on an exchange are valued at the last sales price or official closing price as of the close of the customary trading session on the exchange where the security is principally traded.
Debt obligations (including convertible securities) and unlisted equities are fair valued using an evaluated quote provided by an independent pricing service. Evaluated quotes provided by the pricing service may be determined without exclusive reliance on quoted prices, and may reflect appropriate factors such asinstitution-size trading in similar groups of securities, developments related to specific securities, dividend rate (for unlisted equities), yield (for debt obligations), quality, type of issue, coupon rate (for debt obligations), maturity (for debt obligations), individual trading characteristics and other market data. Pricing services generally value debt obligations assuming orderly transactions of institutional round lot size, but a fund may hold or transact in the same securities in smaller, odd lot sizes. Odd lots often trade at lower prices than institutional round lots. Debt obligations are subject to interest rate and credit risks. In addition, all debt obligations involve some risk of default with respect to interest and/or principal payments.
Foreign securities’ (including foreign exchange contracts) prices are converted into U.S. dollar amounts using the applicable exchange rates as of the close of the NYSE. If market quotations are available and reliable for foreign exchange-traded equity securities, the securities will be valued at the market quotations. Because trading hours for certain foreign securities end before the close of the NYSE, closing market quotations may become unreliable. If between the time trading ends on a particular security and the close of the customary trading session on the NYSE, events occur that the investment adviser determines are significant and make the closing price unreliable, the Fund may fair value the security. If the event is likely to have affected the closing price of the security, the security will be valued at fair value in good faith using procedures approved by the Board of Trustees. Adjustments to closing prices to reflect fair value may also be based on a screening process of an independent pricing service to indicate the degree of certainty, based on historical data, that the closing price in the principal market where a foreign security trades is not the current value as of the close of the NYSE. Foreign securities’ prices meeting the approved degree of certainty that the price is not reflective of current value will be priced at the indication of fair value from the independent pricing service. Multiple factors may be considered by the independent pricing service in determining adjustments to reflect fair value and may include information relating to sector indices, American Depositary Receipts and domestic and foreign index futures. Foreign securities may have additional risks including exchange rate changes, potential for sharply devalued currencies and high inflation, political and economic upheaval, the relative lack of issuer information, relatively low market liquidity and the potential lack of strict financial and accounting controls and standards.
Securities for which market prices are not provided by any of the above methods may be valued based upon quotes furnished by independent sources. The last bid price may be used to value equity securities. The mean between the last bid and asked prices is used to value debt obligations, including corporate loans.
Securities for which market quotations are not readily available or became unreliable are valued at fair value as determined in good faith by or under the supervision of the Trust’s officers following procedures approved by the Board of Trustees. Issuer specific events, market trends, bid/asked quotes of brokers and information providers and other market data may be reviewed in the course of making a good faith determination of a security’s fair value.
The Fund may invest in securities that are subject to interest rate risk, meaning the risk that the prices will generally fall as interest rates rise and, conversely, the prices will generally rise as interest rates fall. Specific securities differ in their sensitivity to changes in interest rates depending on their individual characteristics. Changes in interest rates may result in increased market volatility, which may affect the value and/or liquidity of certain Fund investments.
Invesco V.I. Small Cap Equity Fund
Valuations change in response to many factors including the historical and prospective earnings of the issuer, the value of the issuer’s assets, general economic conditions, interest rates, investor perceptions and market liquidity. Because of the inherent uncertainties of valuation, the values reflected in the financial statements may materially differ from the value received upon actual sale of those investments.
| B. | Securities Transactions and Investment Income– Securities transactions are accounted for on a trade date basis. Realized gains or losses on sales are computed on the basis of specific identification of the securities sold. Interest income (net of withholding tax, if any) is recorded on the accrual basis from settlement date. Dividend income (net of withholding tax, if any) is recorded on theex-dividend date. |
The Fund may periodically participate in litigation related to Fund investments. As such, the Fund may receive proceeds from litigation settlements. Any proceeds received are included in the Statement of Operations as realized gain (loss) for investments no longer held and as unrealized gain (loss) for investments still held.
Brokerage commissions and mark ups are considered transaction costs and are recorded as an increase to the cost basis of securities purchased and/or a reduction of proceeds on a sale of securities. Such transaction costs are included in the determination of net realized and unrealized gain (loss) from investment securities reported in the Statement of Operations and the Statement of Changes in Net Assets and the net realized and unrealized gains (losses) on securities per share in the Financial Highlights. Transaction costs are included in the calculation of the Fund’s net asset value and, accordingly, they reduce the Fund’s total returns. These transaction costs are not considered operating expenses and are not reflected in net investment income reported in the Statement of Operations and the Statement of Changes in Net Assets, or the net investment income per share and the ratios of expenses and net investment income reported in the Financial Highlights, nor are they limited by any expense limitation arrangements between the Fund and the investment adviser.
The Fund allocates income and realized and unrealized capital gains and losses to a class based on the relative net assets of each class.
| C. | Country Determination – For the purposes of making investment selection decisions and presentation in the Schedule of Investments, the investment adviser may determine the country in which an issuer is located and/or credit risk exposure based on various factors. These factors include the laws of the country under which the issuer is organized, where the issuer maintains a principal office, the country in which the issuer derives 50% or more of its total revenues and the country that has the primary market for the issuer’s securities, as well as other criteria. Among the other criteria that may be evaluated for making this determination are the country in which the issuer maintains 50% or more of its assets, the type of security, financial guarantees and enhancements, the nature of the collateral and the sponsor organization. Country of issuer and/or credit risk exposure has been determined to be the United States of America, unless otherwise noted. |
| D. | Distributions– Distributions from net investment income and net realized capital gain, if any, are generally declared and paid to separate accounts of participating insurance companies annually and recorded on theex-dividend date. |
| E. | Federal Income Taxes–The Fund intends to comply with the requirements of Subchapter M of the Internal Revenue Code of 1986, as amended (the “Internal Revenue Code”), necessary to qualify as a regulated investment company and to distribute substantially all of the Fund’s taxable earnings to shareholders. As such, the Fund will not be subject to federal income taxes on otherwise taxable income (including net realized capital gain) that is distributed to shareholders. Therefore, no provision for federal income taxes is recorded in the financial statements. |
The Fund recognizes the tax benefits of uncertain tax positions only when the position is more likely than not to be sustained. Management has analyzed the Fund’s uncertain tax positions and concluded that no liability for unrecognized tax benefits should be recorded related to uncertain tax positions. Management is not aware of any tax positions for which it is reasonably possible that the total amounts of unrecognized tax benefits will change materially in the next 12 months.
The Fund files tax returns in the U.S. Federal jurisdiction and certain other jurisdictions. Generally, the Fund is subject to examinations by such taxing authorities for up to three years after the filing of the return for the tax period.
| F. | Expenses– Fees provided for under the Rule12b-1 plan of a particular class of the Fund and which are directly attributable to that class are charged to the operations of such class. All other expenses are allocated among the classes based on relative net assets. |
| G. | Accounting Estimates–The preparation of financial statements in conformity with accounting principles generally accepted in the United States of America (“GAAP”) requires management to make estimates and assumptions that affect the reported amounts of assets and liabilities at the date of the financial statements and the reported amounts of revenues and expenses during the reporting period including estimates and assumptions related to taxation. Actual results could differ from those estimates by a significant amount. In addition, the Fund monitors for material events or transactions that may occur or become known after theperiod-end date and before the date the financial statements are released to print. |
| H. | Indemnifications– Under the Trust’s organizational documents, each Trustee, officer, employee or other agent of the Trust is indemnified against certain liabilities that may arise out of the performance of their duties to the Fund. Additionally, in the normal course of business, the Fund enters into contracts, including the Fund’s servicing agreements, that contain a variety of indemnification clauses. The Fund’s maximum exposure under these arrangements is unknown as this would involve future claims that may be made against the Fund that have not yet occurred. The risk of material loss as a result of such indemnification claims is considered remote. |
| I. | Securities Lending– The Fund may lend portfolio securities having a market value up toone-third of the Fund’s total assets. Such loans are secured by collateral equal to no less than the market value of the loaned securities determined daily by the securities lending provider. Such collateral will be cash or debt securities issued or guaranteed by the U.S. Government or any of its sponsored agencies. Cash collateral received in connection with these loans is invested in short-term money market instruments or affiliated money market funds and is shown as such on the Schedule of Investments. The Fund bears the risk of loss with respect to the investment of collateral. It is the Fund’s policy to obtain additional collateral from or return excess collateral to the borrower by the end of the next business day, following the valuation date of the securities loaned. Therefore, the value of the collateral held may be temporarily less than the value of the securities on loan. When loaning securities, the Fund retains certain benefits of owning the securities, including the economic equivalent of dividends or interest generated by the security. Lending securities entails a risk of loss to the Fund if, and to the extent that, the market value of the securities loaned were to increase and the borrower did not increase the collateral accordingly, and the borrower failed to return the securities. The securities loaned are subject to termination at the option of the borrower or the Fund. Upon termination, the borrower will return to the Fund the securities loaned and the Fund will return the collateral. Upon the failure of the borrower to return the securities, collateral may be liquidated and the securities may be purchased on the open market to replace the loaned securities. The Fund could experience delays and costs in gaining access to the collateral and the securities may lose value during the delay which could result in potential losses to the Fund. Some of these losses may be indemnified by the lending agent. The Fund bears the risk of any deficiency in the amount of the collateral available for return to the borrower due to any loss on the |
Invesco V.I. Small Cap Equity Fund
| | collateral invested. Dividends received on cash collateral investments for securities lending transactions, which are net of compensation to counterparties, are included inDividends from affiliated money market funds on the Statement of Operations. The aggregate value of securities out on loan, if any, is shown as a footnote on the Statement of Assets and Liabilities. |
| J. | Foreign Currency Translations– Foreign currency is valued at the close of the NYSE based on quotations posted by banks and major currency dealers. Portfolio securities and other assets and liabilities denominated in foreign currencies are translated into U.S. dollar amounts at the date of valuation. Purchases and sales of portfolio securities (net of foreign taxes withheld on disposition) and income items denominated in foreign currencies are translated into U.S. dollar amounts on the respective dates of such transactions. The Fund does not separately account for the portion of the results of operations resulting from changes in foreign exchange rates on investments and the fluctuations arising from changes in market prices of securities held. The combined results of changes in foreign exchange rates and the fluctuation of market prices on investments (net of estimated foreign tax withholding) are included with the net realized and unrealized gain or loss from investments in the Statement of Operations. Reported net realized foreign currency gains or losses arise from (1) sales of foreign currencies, (2) currency gains or losses realized between the trade and settlement dates on securities transactions, and (3) the difference between the amounts of dividends, interest, and foreign withholding taxes recorded on the Fund’s books and the U.S. dollar equivalent of the amounts actually received or paid. Net unrealized foreign currency gains and losses arise from changes in the fair values of assets and liabilities, other than investments in securities at fiscal period end, resulting from changes in exchange rates. |
The Fund may invest in foreign securities, which may be subject to foreign taxes on income, gains on investments or currency repatriation, a portion of which may be recoverable. Foreign taxes, if any, are recorded based on the tax regulations and rates that exist in the foreign markets in which the Fund invests and are shown in the Statement of Operations.
| K. | Forward Foreign Currency Contracts– The Fund may engage in foreign currency transactions either on a spot (i.e. for prompt delivery and settlement) basis, or through forward foreign currency contracts, to manage or minimize currency or exchange rate risk. |
The Fund may also enter into forward foreign currency contracts for the purchase or sale of a security denominated in a foreign currency in order to “lock in” the U.S. dollar price of that security, or the Fund may also enter into forward foreign currency contracts that do not provide for physical settlement of the two currencies, but instead are settled by a single cash payment calculated as the difference between the agreed upon exchange rate and the spot rate at settlement based upon an agreed upon notional amount(non-deliverable forwards). The Fund will set aside liquid assets in an amount equal to the dailymark-to-market obligation for forward foreign currency contracts.
A forward foreign currency contract is an obligation between two parties (“Counterparties”) to purchase or sell a specific currency for an agreed-upon price at a future date. The use of forward foreign currency contracts does not eliminate fluctuations in the price of the underlying securities the Fund owns or intends to acquire but establishes a rate of exchange in advance. Fluctuations in the value of these contracts are measured by the difference in the contract date and reporting date exchange rates and are recorded as unrealized appreciation (depreciation) until the contracts are closed. When the contracts are closed, realized gains (losses) are recorded. Realized and unrealized gains (losses) on the contracts are included in the Statement of Operations. The primary risks associated with forward foreign currency contracts include failure of the Counterparty to meet the terms of the contract and the value of the foreign currency changing unfavorably. These risks may be in excess of the amounts reflected in the Statement of Assets and Liabilities.
NOTE 2–Advisory Fees and Other Fees Paid to Affiliates
The Trust has entered into a master investment advisory agreement with Invesco Advisers, Inc. (the “Adviser” or “Invesco”). Under the terms of the investment advisory agreement, the Fund accrues daily and pays monthly an advisory fee to the Adviser based on the annual rate of the Fund’s average daily net assets as follows:
| | | | |
| Average Daily Net Assets | | Rate | |
| |
First $ 250 million | | | 0.745% | |
| |
Next $250 million | | | 0.730% | |
| |
Next $500 million | | | 0.715% | |
| |
Next $1.5 billion | | | 0.700% | |
| |
Next $2.5 billion | | | 0.685% | |
| |
Next $2.5 billion | | | 0.670% | |
| |
Next $2.5 billion | | | 0.655% | |
| |
Over $10 billion | | | 0.640% | |
| |
For the year ended December 31, 2019, the effective advisory fee rate incurred by the Fund was 0.74%.
Under the terms of a mastersub-advisory agreement between the Adviser and each of Invesco Asset Management Deutschland GmbH, Invesco Asset Management Limited, Invesco Asset Management (Japan) Limited, Invesco Hong Kong Limited, Invesco Senior Secured Management, Inc. and Invesco Canada Ltd. and separatesub-advisory agreements with Invesco Capital Management LLC and Invesco Asset Management (India) Private Limited (collectively, the “AffiliatedSub-Advisers”) the Adviser, not the Fund, will pay 40% of the fees paid to the Adviser to any such AffiliatedSub-Adviser(s) that provide(s) discretionary investment management services to the Fund based on the percentage of assets allocated to such AffiliatedSub-Adviser(s).
The Adviser has contractually agreed, through at least June 30, 2020, to waive advisory fees and/or reimburse expenses of all shares to the extent necessary to limit total annual fund operating expenses after fee waiver and/or expense reimbursement (excluding certain items discussed below) of Series I shares to 2.00% and Series II shares to 2.25% of average daily net assets (the “expense limits”). In determining the Adviser’s obligation to waive advisory fees and/or reimburse expenses, the following expenses are not taken into account, and could cause the total annual fund operating expenses after fee waiver and/or expense reimbursement to exceed the numbers reflected above: (1) interest; (2) taxes; (3) dividend expense on short sales; (4) extraordinary ornon-routine items, including litigation expenses; and (5) expenses that the Fund has incurred but did not actually pay because of an expense offset arrangement. Unless Invesco continues the fee waiver agreement, it will terminate on June 30, 2020.
Invesco V.I. Small Cap Equity Fund
During its term, the fee waiver agreement cannot be terminated or amended to increase the expense limits or reduce the advisory fee waiver without approval of the Board of Trustees. The Adviser did not waive fees and/or reimburse expenses during the period under these expense limits.
Further, the Adviser has contractually agreed, through at least June 30, 2021, to waive the advisory fee payable by the Fund in an amount equal to 100% of the net advisory fees the Adviser receives from the affiliated money market funds on investments by the Fund of uninvested cash (excluding investments of cash collateral from securities lending) in such affiliated money market funds.
For the year ended December 31, 2019, the Adviser waived advisory fees of $9,439.
The Trust has entered into a master administrative services agreement with Invesco pursuant to which the Fund has agreed to pay Invesco a fee for costs incurred in providing accounting services and fund administrative services to the Fund and to reimburse Invesco for fees paid to insurance companies that have agreed to provide certain administrative services to the Fund. These administrative services provided by the insurance companies may include, among other things: maintenance of master accounts with the Fund; tracking, recording and transmitting net purchase and redemption orders for Fund shares; maintaining and preserving records related to the purchase, redemption and other account activity of variable product owners; distributing copies of Fund documents such as prospectuses, proxy materials and periodic reports, to variable product owners, and responding to inquiries from variable product owners about the Fund. Pursuant to such agreement, for the year ended December 31, 2019, Invesco was paid $36,616 for accounting and fund administrative services and was reimbursed $368,806 for fees paid to insurance companies. Invesco has entered into asub-administration agreement whereby State Street Bank and Trust Company (“SSB”) serves as fund accountant and provides certain administrative services to the Fund. Pursuant to a custody agreement with the Trust on behalf of the Fund, SSB also serves as the Fund’s custodian.
The Trust has entered into a transfer agency and service agreement with Invesco Investment Services, Inc. (“IIS”) pursuant to which the Fund has agreed to pay IIS a fee for providing transfer agency and shareholder services to the Fund and reimburse IIS for certain expenses incurred by IIS in the course of providing such services. IIS may make payments to intermediaries that provide omnibus account services,sub-accounting services and/or networking services. All fees payable by IIS to intermediaries that provide omnibus account services orsub-accounting services are charged back to the Fund, subject to certain limitations approved by the Trust’s Board of Trustees. For the year ended December 31, 2019, expenses incurred under the agreement are shown in the Statement of Operations asTransfer agent fees.
The Trust has entered into a master distribution agreement with Invesco Distributors, Inc. (“IDI”) to serve as the distributor for the Fund. The Trust has adopted a plan pursuant to Rule12b-1 under the 1940 Act with respect to the Fund’s Series II shares (the “Plan”). The Fund, pursuant to the Plan, pays IDI compensation at the annual rate of 0.25% of the Fund’s average daily net assets of Series II shares. The fees are accrued daily and paid monthly. Of the Plan payments, up to 0.25% of the average daily net assets of the Series II shares may be paid to insurance companies who furnish continuing personal shareholder services to customers who purchase and own Series II shares of the Fund. For the year ended December 31, 2019, expenses incurred under the Plan are detailed in the Statement of Operations asDistribution fees.
For the year ended December 31, 2019, the Fund incurred $3,770 in brokerage commissions with Invesco Capital Markets, Inc., an affiliate of the Adviser and IDI, for portfolio transactions executed on behalf of the Fund.
Certain officers and trustees of the Trust are officers and directors of the Adviser, IIS and/or IDI.
NOTE 3–Additional Valuation Information
GAAP defines fair value as the price that would be received to sell an asset or paid to transfer a liability in an orderly transaction between market participants at the measurement date, under current market conditions. GAAP establishes a hierarchy that prioritizes the inputs to valuation methods, giving the highest priority to readily available unadjusted quoted prices in an active market for identical assets (Level 1) and the lowest priority to significant unobservable inputs (Level 3), generally when market prices are not readily available or are unreliable. Based on the valuation inputs, the securities or other investments are tiered into one of three levels. Changes in valuation methods may result in transfers in or out of an investment’s assigned level:
| | Level 1 - | Prices are determined using quoted prices in an active market for identical assets. |
| | Level 2 - | Prices are determined using other significant observable inputs. Observable inputs are inputs that other market participants may use in pricing a security. These may include quoted prices for similar securities, interest rates, prepayment speeds, credit risk, yield curves, loss severities, default rates, discount rates, volatilities and others. |
| | Level 3 - | Prices are determined using significant unobservable inputs. In situations where quoted prices or observable inputs are unavailable (for example, when there is little or no market activity for an investment at the end of the period), unobservable inputs may be used. Unobservable inputs reflect the Fund’s own assumptions about the factors market participants would use in determining fair value of the securities or instruments and would be based on the best available information. |
As of December 31, 2019, all of the securities in this Fund were valued based on Level 1 inputs (see the Schedule of Investments for security categories). The level assigned to the securities valuations may not be an indication of the risk or liquidity associated with investing in those securities. Because of the inherent uncertainties of valuation, the values reflected in the financial statements may materially differ from the value received upon actual sale of those investments.
NOTE 4–Derivative Investments
The Fund may enter into an International Swaps and Derivatives Association Master Agreement (“ISDA Master Agreement”) under which a fund may trade OTC derivatives. An OTC transaction entered into under an ISDA Master Agreement typically involves a collateral posting arrangement, payment netting provisions andclose-out netting provisions. These netting provisions allow for reduction of credit risk through netting of contractual obligations. The enforceability of the netting provisions of the ISDA Master Agreement depends on the governing law of the ISDA Master Agreement, among other factors.
For financial reporting purposes, the Fund does not offset OTC derivative assets or liabilities that are subject to ISDA Master Agreements in the Statement of Assets and Liabilities.
Invesco V.I. Small Cap Equity Fund
Effect of Derivative Investments for the year ended December 31, 2019
The table below summarizes the gains (losses) on derivative investments, detailed by primary risk exposure, recognized in earnings during the period:
| | | | |
| | | Location of Gain on | |
| | | Statement of Operations | |
| | | Currency | |
| | | Risk | |
| |
Realized Gain: | | | | |
Forward foreign currency contracts | | | $133 | |
| |
The table below summarizes the average notional value of derivatives held during the period.
| | |
| | | Forward |
| | | Foreign Currency |
| | | Contracts |
|
Average notional value | | $47,267 |
|
NOTE 5–Security Transactions with Affiliated Funds
The Fund is permitted to purchase or sell securities from or to certain other Invesco Funds under specified conditions outlined in procedures adopted by the Board of Trustees of the Trust. The procedures have been designed to ensure that any purchase or sale of securities by the Fund from or to another fund or portfolio that is or could be considered an affiliate by virtue of having a common investment adviser (or affiliated investment advisers), common Trustees and/or common officers complies with Rule17a-7 of the 1940 Act. Further, as defined under the procedures, each transaction is effected at the current market price. Pursuant to these procedures, for the year ended December 31, 2019, the Fund engaged in securities purchases of $6,530,544 and securities sales of $0, which did not result in any net realized gains (losses).
NOTE 6–Trustees’ and Officers’ Fees and Benefits
Trustees’ and Officers’ Fees and Benefits include amounts accrued by the Fund to pay remuneration to certain Trustees and Officers of the Fund. Trustees have the option to defer compensation payable by the Fund, andTrustees’ and Officers’ Fees and Benefits also include amounts accrued by the Fund to fund such deferred compensation amounts. Those Trustees who defer compensation have the option to select various Invesco Funds in which their deferral accounts shall be deemed to be invested. Finally, certain current Trustees were eligible to participate in a retirement plan that provided for benefits to be paid upon retirement to Trustees over a period of time based on the number of years of service. The Fund may have certain former Trustees who also participate in a retirement plan and receive benefits under such plan.Trustees’ and Officers’ Fees and Benefits include amounts accrued by the Fund to fund such retirement benefits. Obligations under the deferred compensation and retirement plans represent unsecured claims against the general assets of the Fund.
NOTE 7–Cash Balances
The Fund is permitted to temporarily carry a negative or overdrawn balance in its account with SSB, the custodian bank. Such balances, if any atperiod-end, are shown in the Statement of Assets and Liabilities under the payable caption Amount due custodian. To compensate the custodian bank for such overdrafts, the overdrawn Fund may either (1) leave funds as a compensating balance in the account so the custodian bank can be compensated by earning the additional interest; or (2) compensate by paying the custodian bank at a rate agreed upon by the custodian bank and Invesco, not to exceed the contractually agreed upon rate.
NOTE 8–Distributions to Shareholders and Tax Components of Net Assets
Tax Character of Distributions to Shareholders Paid During the Fiscal Years Ended December 31, 2019 and 2018:
| | | | | | | | |
| | | 2019 | | | 2018 | |
| |
Ordinary income | | $ | 179,127 | | | $ | 4,111,298 | |
| |
Long-term capital gain | | | 32,159,606 | | | | 15,273,776 | |
| |
Total distributions | | $ | 32,338,733 | | | $ | 19,385,074 | |
| |
Tax Components of Net Assets atPeriod-End:
| | | | |
| | | 2019 | |
| |
Undistributed ordinary income | | $ | 2,399,023 | |
| |
Undistributed long-term capital gain | | | 16,110,859 | |
| |
Net unrealized appreciation – investments | | | 32,213,097 | |
| |
Net unrealized appreciation - foreign currencies | | | 177 | |
| |
Temporary book/tax differences | | | (70,015 | ) |
| |
Shares of beneficial interest | | | 165,597,385 | |
| |
Total net assets | | $ | 216,250,526 | |
| |
Invesco V.I. Small Cap Equity Fund
The difference between book-basis andtax-basis unrealized appreciation (depreciation) is due to differences in the timing of recognition of gains and losses on investments for tax and book purposes. The Fund’s net unrealized appreciation (depreciation) difference is attributable primarily to wash sales.
The temporary book/tax differences are a result of timing differences between book and tax recognition of income and/or expenses. The Fund’s temporary book/tax differences are the result of the trustee deferral of compensation and retirement plan benefits.
Capital loss carryforward is calculated and reported as of a specific date. Results of transactions and other activity after that date may affect the amount of capital loss carryforward actually available for the Fund to utilize. Capital losses generated in years beginning after December 22, 2010 can be carried forward for an unlimited period, whereas previous losses expire in eight tax years. Capital losses with an expiration period may not be used to offset capital gains until all net capital losses without an expiration date have been utilized. Capital loss carryforwards with no expiration date will retain their character as either short-term or long-term capital losses instead of as short-term capital losses as under prior law. The ability to utilize capital loss carryforwards in the future may be limited under the Internal Revenue Code and related regulations based on the results of future transactions.
The Fund does not have a capital loss carryforward as of December 31, 2019.
During the year ended December 31, 2019, 3,350,087 Series II shares of the Fund valued at $51,926,351 were redeemed by significant shareholders and settled through aredemption-in-kind transaction, of which $2,436,366 consisted of cash, which resulted in a realized gain of $9,896,530 to the Fund for book purposes. From a federal income tax perspective, the realized gains are not recognized.
NOTE 9–Investment Transactions
The aggregate amount of investment securities (other than short-term securities, U.S. Treasury obligations and money market funds, if any) purchased and sold by the Fund during the year ended December 31, 2019 was $103,008,921 and $115,451,288, respectively. Cost of investments, including any derivatives, on a tax basis includes the adjustments for financial reporting purposes as of the most recently completed federal income tax reportingperiod-end.
| | | | |
| Unrealized Appreciation (Depreciation) of Investments on a Tax Basis | |
| |
Aggregate unrealized appreciation of investments | | $ | 43,836,938 | |
| |
Aggregate unrealized (depreciation) of investments | | | (11,623,841 | ) |
| |
Net unrealized appreciation of investments | | $ | 32,213,097 | |
| |
Cost of investments for tax purposes is $185,605,406.
NOTE 10–Reclassification of Permanent Differences
Primarily as a result of differing book/tax treatment ofredemption-in-kind, on December 31, 2019, undistributed net investment income was decreased by $89,268, undistributed net realized gain was decreased by $9,650,087 and shares of beneficial interest was increased by $9,739,355. This reclassification had no effect on the net assets of the Fund.
NOTE 11–Share Information
| | | | | | | | | | | | | | | | |
| | | Summary of Share Activity | |
| |
| | | Year ended | | | Year ended | |
| | | December 31, 2019(a) | | | December 31, 2018 | |
| | | Shares | | | Amount | | | Shares | | | Amount | |
| |
Sold: | | | | | | | | | | | | | | | | |
Series I | | | 501,715 | | | $ | 8,900,799 | | | | 705,274 | | | $ | 13,617,305 | |
| |
Series II | | | 1,589,687 | | | | 27,357,249 | | | | 610,379 | | | | 11,139,397 | |
| |
| | | | |
Issued as reinvestment of dividends: | | | | | | | | | | | | | | | | |
Series I | | | 828,605 | | | | 13,821,130 | | | | 433,837 | | | | 8,819,904 | |
| |
Series II | | | 1,185,506 | | | | 18,517,603 | | | | 549,125 | | | | 10,565,170 | |
| |
| | | | |
Reacquired: | | | | | | | | | | | | | | | | |
Series I | | | (1,321,243 | ) | | | (23,951,793 | ) | | | (1,946,379 | ) | | | (39,353,535 | ) |
| |
Series II | | | (4,807,788 | ) | | | (76,753,793 | ) | | | (1,480,032 | ) | | | (27,739,982 | ) |
| |
Net increase (decrease) in share activity | | | (2,023,518 | ) | | $ | (32,108,805 | ) | | | (1,127,796 | ) | | $ | (22,951,741 | ) |
| |
| (a) | There are entities that are record owners of more than 5% of the outstanding shares of the Fund and in the aggregate own 72% of the outstanding shares of the Fund. The Fund and the Fund’s principal underwriter or adviser, are parties to participation agreements with these entities whereby these entities sell units of interest in separate accounts funding variable products that are invested in the Fund. The Fund, Invesco and/or Invesco affiliates may make payments to these entities, which are considered to be related to the Fund, for providing services to the Fund, Invesco and/or Invesco affiliates including but not limited to services such as, securities brokerage, third party record keeping and account servicing and administrative services. The Fund has no knowledge as to whether all or any portion of the shares owned of record by these entities are also owned beneficially. |
Invesco V.I. Small Cap Equity Fund
Report of Independent Registered Public Accounting Firm
To the Board of Trustees of AIM Variable Insurance Funds (Invesco Variable Insurance Funds) and Shareholders of Invesco V.I. Small Cap Equity Fund
Opinion on the Financial Statements
We have audited the accompanying statement of assets and liabilities, including the schedule of investments, of Invesco V.I. Small Cap Equity Fund (one of the funds constituting AIM Variable Insurance Funds (Invesco Variable Insurance Funds), referred to hereafter as the “Fund”) as of December 31, 2019, the related statement of operations for the year ended December 31, 2019, the statement of changes in net assets for each of the two years in the period ended December 31, 2019, including the related notes, and the financial highlights for each of the five years in the period ended December 31, 2019 (collectively referred to as the “financial statements”). In our opinion, the financial statements present fairly, in all material respects, the financial position of the Fund as of December 31, 2019, the results of its operations for the year then ended, the changes in its net assets for each of the two years in the period ended December 31, 2019 and the financial highlights for each of the five years in the period ended December 31, 2019 in conformity with accounting principles generally accepted in the United States of America.
Basis for Opinion
These financial statements are the responsibility of the Fund’s management. Our responsibility is to express an opinion on the Fund’s financial statements based on our audits. We are a public accounting firm registered with the Public Company Accounting Oversight Board (United States) (PCAOB) and are required to be independent with respect to the Fund in accordance with the U.S. federal securities laws and the applicable rules and regulations of the Securities and Exchange Commission and the PCAOB.
We conducted our audits of these financial statements in accordance with the standards of the PCAOB. Those standards require that we plan and perform the audit to obtain reasonable assurance about whether the financial statements are free of material misstatement, whether due to error or fraud.
Our audits included performing procedures to assess the risks of material misstatement of the financial statements, whether due to error or fraud, and performing procedures that respond to those risks. Such procedures included examining, on a test basis, evidence regarding the amounts and disclosures in the financial statements. Our audits also included evaluating the accounting principles used and significant estimates made by management, as well as evaluating the overall presentation of the financial statements. Our procedures included confirmation of securities owned as of December 31, 2019 by correspondence with the custodian, transfer agent and brokers; when replies were not received from brokers, we performed other auditing procedures. We believe that our audits provide a reasonable basis for our opinion.
/s/PricewaterhouseCoopers LLP
Houston, Texas
February 18, 2020
We have served as the auditor of one or more of the investment companies in the Invesco group of investment companies since at least 1995. We have not been able to determine the specific year we began serving as auditor.
Invesco V.I. Small Cap Equity Fund
Calculating your ongoing Fund expenses
Example
As a shareholder of the Fund, you incur two types of costs: (1) transaction costs, which may include sales charges (loads) on purchase payments or contingent deferred sales charges on redemptions, if any; and (2) ongoing costs, including management fees, distribution and/or service(12b-1) fees, and other Fund expenses. This example is intended to help you understand your ongoing costs (in dollars) of investing in the Fund and to compare these costs with ongoing costs of investing in other mutual funds. The example is based on an investment of $1,000 invested at the beginning of the period and held for the entire period July 1, 2019 through December 31, 2019.
Actual expenses
The table below provides information about actual account values and actual expenses. You may use the information in this table, together with the amount you invested, to estimate the expenses that you paid over the period. Simply divide your account value by $1,000 (for example, an $8,600 account value divided by $1,000 = 8.6), then multiply the result by the number in the table under the heading entitled “Actual Expenses Paid During Period” to estimate the expenses you paid on your account during this period.
Hypothetical example for comparison purposes
The table below also provides information about hypothetical account values and hypothetical expenses based on the Fund’s actual expense ratio and an assumed rate of return of 5% per year before expenses, which is not the Fund’s actual return.
The hypothetical account values and expenses may not be used to estimate the actual ending account balance or expenses you paid for the period. You may use this information to compare the ongoing costs of investing in the Fund and other funds. To do so, compare this 5% hypothetical example with the 5% hypothetical examples that appear in the shareholder reports of the other funds.
Please note that the expenses shown in the table are meant to highlight your ongoing costs only and do not reflect any transaction costs, such as sales charges (loads) on purchase payments or contingent deferred sales charges on redemptions, if any. Therefore, the hypothetical information is useful in comparing ongoing costs only, and will not help you determine the relative total costs of owning different funds. In addition, if these transaction costs were included, your costs would have been higher.
| | | | | | | | | | | | |
| | | Beginning
Account Value
(07/01/19) | | ACTUAL | | HYPOTHETICAL
(5% annual return before expenses) | | Annualized
Expense
Ratio |
| | Ending
Account Value
(12/31/19)1 | | Expenses Paid During Period2 | | Ending Account Value (12/31/19) | | Expenses
Paid During
Period2 |
Series I | | $1,000.00 | | $1,060.90 | | $4.99 | | $1,020.37 | | $4.89 | | 0.96% |
Series II | | 1,000.00 | | 1,060.50 | | 6.23 | | 1,019.16 | | 6.11 | | 1.21 |
| 1 | The actual ending account value is based on the actual total return of the Fund for the period July 1, 2019 through December 31, 2019, after actual expenses and will differ from the hypothetical ending account value which is based on the Fund’s expense ratio and a hypothetical annual return of 5% before expenses. |
| 2 | Expenses are equal to the Fund’s annualized expense ratio as indicated above multiplied by the average account value over the period, multiplied by 184/365 to reflect the most recent fiscal half year. |
Invesco V.I. Small Cap Equity Fund
Form1099-DIV, Form1042-S and other year-end tax information provide shareholders with actual calendar year amounts that should be included in their tax returns. Shareholders should consult their tax advisors.
The following distribution information is being provided as required by the Internal Revenue Code or to meet a specific state’s requirement.
The Fund designates the following amounts or, if subsequently determined to be different, the maximum amount allowable for its fiscal year ended December 31, 2019:
| | | | | | |
| | Federal and State Income Tax | | | | |
| | Long-Term Capital Gain Distributions | | $ | 32,159,606 | |
| | Corporate Dividends Received Deduction* | | | 99.99 | % |
| | Qualified Dividend Income* | | | 0.00 | % |
| | U.S. Treasury Obligations* | | | 0.00 | % |
* The above percentages are based on ordinary income dividends paid to shareholders during the Fund’s fiscal year.
Invesco V.I. Small Cap Equity Fund
Trustees and Officers
The address of each trustee and officer is AIM Variable Insurance Funds (Invesco Variable Insurance Funds) (the “Trust”), 11 Greenway Plaza, Suite 1000, Houston, Texas 77046-1173. The trustees serve for the life of the Trust, subject to their earlier death, incapacitation, resignation, retirement or removal as more specifically provided in the Trust’s organizational documents. Each officer serves for a one year term or until their successors are elected and qualified. Column two below includes length of time served with predecessor entities, if any.
| | | | | | | | |
Name, Year of Birth and Position(s) Held with the Trust | | Trustee and/or Officer Since | | Principal Occupation(s) During Past 5 Years | | Number of
Funds in
Fund Complex
Overseen by
Trustee | | Other Directorship(s) Held by Trustee
During Past 5 Years |
| Interested Person |
Martin L. Flanagan1- 1960 Trustee and Vice Chair | | 2007 | | Executive Director, Chief Executive Officer and President, Invesco Ltd. (ultimate parent of Invesco and a global investment management firm); Trustee and Vice Chair, The Invesco Funds; Vice Chair, Investment Company Institute; and Member of Executive Board, SMU Cox School of Business Formerly: Advisor to the Board, Invesco Advisers, Inc. (formerly known as Invesco Institutional (N.A.), Inc.); Chairman and Chief Executive Officer, Invesco Advisers, Inc. (registered investment adviser); Director, Chairman, Chief Executive Officer and President, Invesco Holding Company (US), Inc. (formerly IVZ Inc.) (holding company), Invesco Group Services, Inc. (service provider) and Invesco North American Holdings, Inc. (holding company); Director, Chief Executive Officer and President, Invesco Holding Company Limited (parent of Invesco and a global investment management firm); Director, Invesco Ltd.; Chairman, Investment Company Institute and President,Co-Chief Executive Officer,Co-President, Chief Operating Officer and Chief Financial Officer, Franklin Resources, Inc. (global investment management organization) | | 229 | | None |
| 1 | Mr. Flanagan is considered an interested person (within the meaning of Section 2(a)(19) of the 1940 Act) of the Trust because he is an officer of the Adviser to the Trust, and an officer and a director of Invesco Ltd., ultimate parent of the Adviser. |
| | | | | | | | |
Name, Year of Birth and Position(s) Held with the Trust | | Trustee and/or Officer Since | | Principal Occupation(s) During Past 5 Years | | Number of
Funds in
Fund Complex
Overseen by
Trustee | | Other Directorship(s) Held by Trustee
During Past 5 Years |
| Independent Trustees |
Bruce L. Crockett - 1944 Trustee and Chair | | 1993 | | Chairman, Crockett Technologies Associates (technology consulting company) Formerly: Director, Captaris (unified messaging provider); Director, President and Chief Executive Officer, COMSAT Corporation; Chairman, Board of Governors of INTELSAT (international communications company); ACE Limited (insurance company); Independent Directors Council and Investment Company Institute: Member of the Audit Committee, Investment Company Institute; Member of the Executive Committee and Chair of the Governance Committee, Independent Directors Council | | 229 | | Director and Chairman of the Audit Committee, ALPS (Attorneys Liability Protection Society) (insurance company); Director and Member of the Audit Committee and Compensation Committee, Ferroglobe PLC (metallurgical company) |
David C. Arch - 1945 Trustee | | 2010 | | Chairman of Blistex Inc. (consumer health care products manufacturer); Member, World Presidents’ Organization | | 229 | | Board member of the Illinois Manufacturers’ Association |
Beth Ann Brown - 1968 Trustee | | 2019 | | Independent Consultant Formerly: Head of Intermediary Distribution, Managing Director, Strategic Relations, Managing Director, Head of National Accounts, Senior Vice President, National Account Manager and Senior Vice President, Key Account Manager, Columbia Management Investment Advisers LLC; Vice President, Key Account Manager, Liberty Funds Distributor, Inc.; and Trustee of certain Oppenheimer Funds | | 229 | | Director, Board of Directors of Caron Engineering Inc.; Advisor, Board of Advisors of Caron Engineering Inc.; President and Director, Acton Shapleigh Youth Conservation Corps (non-profit); and Vice President and Director of Grahamtastic Connection (non-profit) |
Invesco V.I. Small Cap Equity Fund
Trustees and Officers–(continued)
| | | | | | | | |
Name, Year of Birth and Position(s) Held with the Trust | | Trustee and/or Officer Since | | Principal Occupation(s) During Past 5 Years | | Number of
Funds in
Fund Complex
Overseen by
Trustee | | Other Directorship(s) Held by Trustee
During Past 5 Years |
| Independent Trustees–(continued) |
Jack M. Fields - 1952 Trustee | | 1997 | | Chief Executive Officer, Twenty First Century Group, Inc. (government affairs company); and Chairman, Discovery Learning Alliance(non-profit) Formerly: Owner and Chief Executive Officer, Dos Angeles Ranch L.P. (cattle, hunting, corporate entertainment); Director, Insperity, Inc. (formerly known as Administaff) (human resources provider); Chief Executive Officer, Texana Timber LP (sustainable forestry company); Director of Cross Timbers Quail Research Ranch(non-profit); and member of the U.S. House of Representatives | | 229 | | None |
Cynthia Hostetler - 1962 Trustee | | 2017 | | Non-Executive Director and Trustee of a number of public and private business corporations Formerly: Director, Aberdeen Investment Funds (4 portfolios); Head of Investment Funds and Private Equity, Overseas Private Investment Corporation; President, First Manhattan Bancorporation, Inc.; Attorney, Simpson Thacher & Bartlett LLP | | 229 | | Vulcan Materials Company (construction materials company); Trilinc Global Impact Fund; Genesee & Wyoming, Inc. (railroads); Artio Global Investment LLC (mutual fund complex); Edgen Group, Inc. (specialized energy and infrastructure products distributor); Investment Company Institute (professional organization); Independent Directors Council (professional organization) |
Eli Jones - 1961 Trustee | | 2016 | | Professor and Dean, Mays Business School - Texas A&M University Formerly: Professor and Dean, Walton College of Business, University of Arkansas and E.J. Ourso College of Business, Louisiana State University; Director, Arvest Bank | | 229 | | Insperity, Inc. (formerly known as Administaff) (human resources provider) |
Elizabeth Krentzman - 1959 Trustee | | 2019 | | Formerly: Principal and Chief Regulatory Advisor for Asset Management Services and U.S. Mutual Fund Leader of Deloitte & Touche LLP; General Counsel of the Investment Company Institute (trade association); National Director of the Investment Management Regulatory Consulting Practice, Principal, Director and Senior Manager of Deloitte & Touche LLP; Assistant Director of the Division of Investment Management - Office of Disclosure and Investment Adviser Regulation of the U.S. Securities and Exchange Commission and various positions with the Division of Investment Management - Office of Regulatory Policy of the U.S. Securities and Exchange Commission; Associate at Ropes & Gray LLP; Advisory Board Member of the Securities and Exchange Commission Historical Society; and Trustee of certain Oppenheimer Funds | | 229 | | Trustee of the University of Florida National Board Foundation and Audit Committee Member; Member of the Cartica Funds Board of Directors (private investment funds); Member of the University of Florida Law Center Association, Inc. Board of Trustees and Audit Committee Member |
Anthony J. LaCava, Jr. - 1956 Trustee | | 2019 | | Formerly: Director and Member of the Audit Committee, Blue Hills Bank (publicly traded financial institution) and Managing Partner, KPMG LLP | | 229 | | Blue Hills Bank; Chairman, Bentley University; Member, Business School Advisory Council; and Nominating Committee KPMG LLP |
Prema Mathai-Davis - 1950 Trustee | | 1998 | | Retired Co-Owner & Partner of Quantalytics Research, LLC, (a FinTech Investment Research Platform for the Self-Directed Investor) | | 229 | | None |
Invesco V.I. Small Cap Equity Fund
Trustees and Officers–(continued)
| | | | | | | | |
Name, Year of Birth and Position(s) Held with the Trust | | Trustee and/or Officer Since | | Principal Occupation(s) During Past 5 Years | | Number of
Funds in
Fund Complex
Overseen by
Trustee | | Other Directorship(s) Held by Trustee
During Past 5 Years |
| Independent Trustees–(continued) |
Joel W. Motley - 1952 Trustee | | 2019 | | Director of Office of Finance, Federal Home Loan Bank; Member of the Vestry of Trinity Wall Street; Managing Director of Carmona Motley Inc. (privately held financial advisor); Member of the Finance and Budget Committee of the Council on Foreign Relations, Member of the Investment Committee and Board of Human Rights Watch and Member of the Investment Committee and Board of Historic Hudson Valley(non-profit cultural organization) Formerly: Managing Director of Public Capital Advisors, LLC (privately held financial advisor); Managing Director of Carmona Motley Hoffman, Inc. (privately held financial advisor); Trustee of certain Oppenheimer Funds; and Director of Columbia Equity Financial Corp. (privately held financial advisor) | | 229 | | Director of Greenwall Foundation (bioethics research foundation); Member of Board and Investment Committee of The Greenwall Foundation; Director of Southern Africa Legal Services Foundation; Board Member and Investment Committee Member of Pulizer Center for Crisis Reporting(non-profit journalism) |
Teresa M. Ressel - 1962 Trustee | | 2017 | | Non-executive director and trustee of a number of public and private business corporations Formerly: Chief Financial Officer, Olayan America, The Olayan Group (international investor/commercial/industrial); Chief Executive Officer, UBS Securities LLC; Group Chief Operating Officer, Americas, UBS AG; Assistant Secretary for Management & Budget and CFO, US Department of the Treasury | | 229 | | Atlantic Power Corporation (power generation company); ON Semiconductor Corp. (semiconductor supplier) |
Ann Barnett Stern - 1957 Trustee | | 2017 | | President and Chief Executive Officer, Houston Endowment Inc. (private philanthropic institution) Formerly: Executive Vice President and General Counsel, Texas Children’s Hospital; Attorney, Beck, Redden and Secrest, LLP; Business Law Instructor, University of St. Thomas; Attorney, Andrews & Kurth LLP | | 229 | | Federal Reserve Bank of Dallas |
Robert C. Troccoli - 1949 Trustee | | 2016 | | Retired | | 229 | | None |
| Daniel S. Vandivort - 1954 Trustee | | 2019 | | Treasurer, Chairman of the Audit and Finance Committee, and Trustee, Board of Trustees, Huntington Disease Foundation of America; and President, Flyway Advisory Services LLC (consulting and property management) Formerly: Trustee and Governance Chair, of certain Oppenheimer Funds | | 229 | | Chairman and Lead Independent Director, Chairman of the Audit Committee, and Director, Board of Directors, Value Line Funds |
| James D. Vaughn - 1945 Trustee | | 2019 | | Retired Formerly: Managing Partner, Deloitte & Touche LLP; Trustee and Chairman of the Audit Committee, Schroder Funds; Board Member, Mile High United Way, Boys and Girls Clubs, Boy Scouts, Colorado Business Committee for the Arts, Economic Club of Colorado and Metro Denver Network (economic development corporation); and Trustee of certain Oppenheimer Funds | | 229 | | Board member and Chairman of Audit Committee of AMG National Trust Bank; Trustee and Investment Committee member, University of South Dakota Foundation; Board member, Audit Committee Member and past Board Chair, Junior Achievement(non-profit) |
Invesco V.I. Small Cap Equity Fund
Trustees and Officers–(continued)
| | | | | | | | |
Name, Year of Birth and Position(s) Held with the Trust | | Trustee and/or Officer Since | | Principal Occupation(s) During Past 5 Years | | Number of
Funds in
Fund Complex
Overseen by
Trustee | | Other Directorship(s) Held by Trustee
During Past 5 Years |
| Independent Trustees–(continued) |
| Christopher L. WIlson - 1957 Trustee, Vice Chair and Chair Designate | | 2017 | | Retired Formerly: Director, TD Asset Management USA Inc. (mutual fund complex) (22 portfolios); Managing Partner, CT2, LLC (investing and consulting firm); President/Chief Executive Officer, Columbia Funds, Bank of America Corporation; President/Chief Executive Officer, CDC IXIS Asset Management Services, Inc.; Principal & Director of Operations, Scudder Funds, Scudder, Stevens & Clark, Inc.; Assistant Vice President, Fidelity Investments | | 229 | | ISO New England, Inc.(non-profit organization managing regional electricity market) |
Invesco V.I. Small Cap Equity Fund
Trustees and Officers–(continued)
| | | | | | | | |
Name, Year of Birth and Position(s) Held with the Trust | | Trustee and/or Officer Since | | Principal Occupation(s) During Past 5 Years | | Number of
Funds in
Fund Complex
Overseen by
Trustee | | Other Directorship(s) Held by Trustee
During Past 5 Years |
| Officers |
Sheri Morris - 1964 President, Principal Executive Officer and Treasurer | | 1999 | | Head of Global Fund Services, Invesco Ltd.; President, Principal Executive Officer and Treasurer, The Invesco Funds; Vice President, Invesco Advisers, Inc. (formerly known as Invesco Institutional (N.A.), Inc.) (registered investment adviser); and Vice President, Invesco Exchange-Traded Fund Trust, Invesco Exchange-Traded Fund Trust II, Invesco India Exchange-Traded Fund Trust, Invesco Actively Managed Exchange-Traded Fund Trust, Invesco Actively Managed Exchange-Traded Commodity Fund Trust and Invesco Exchange-Traded Self-Indexed Fund Trust; and Vice President, OppenheimerFunds, Inc. Formerly: Vice President and Principal Financial Officer, The Invesco Funds; Vice President, Invesco AIM Advisers, Inc., Invesco AIM Capital Management, Inc. and Invesco AIM Private Asset Management, Inc.; Assistant Vice President and Assistant Treasurer, The Invesco Funds and Assistant Vice President, Invesco Advisers, Inc., Invesco AIM Capital Management, Inc. and Invesco AIM Private Asset Management, Inc.; and Treasurer, Invesco Exchange-Traded Fund Trust, Invesco Exchange-Traded Fund Trust II, Invesco India Exchange-Traded Fund Trust and Invesco Actively Managed Exchange-Traded Fund Trust | | N/A | | N/A |
Russell C. Burk - 1958 Senior Vice President and Senior Officer | | 2005 | | Senior Vice President and Senior Officer, The Invesco Funds | | N/A | | N/A |
Jeffrey H. Kupor - 1968 Senior Vice President, Chief Legal Officer and Secretary | | 2018 | | Head of Legal of the Americas, Invesco Ltd.; Senior Vice President and Secretary, Invesco Advisers, Inc. (formerly known as Invesco Institutional (N.A.), Inc.) (registered investment adviser); Senior Vice President and Secretary, Invesco Distributors, Inc. (formerly known as Invesco AIM Distributors, Inc.); Vice President and Secretary, Invesco Investment Services, Inc. (formerly known as Invesco AIM Investment Services, Inc.) Senior Vice President, Chief Legal Officer and Secretary, The Invesco Funds; Secretary and General Counsel, Invesco Investment Advisers LLC (formerly known as Van Kampen Asset Management); Secretary and General Counsel, Invesco Capital Markets, Inc. (formerly known as Van Kampen Funds Inc.) and Chief Legal Officer, Invesco Exchange-Traded Fund Trust, Invesco Exchange-Traded Fund Trust II, Invesco India Exchange-Traded Fund Trust, Invesco Actively Managed Exchange-Traded Fund Trust, Invesco Actively Managed Exchange-Traded Commodity Fund Trust and Invesco Exchange-Traded Self-Indexed Fund Trust; Secretary, Invesco Indexing LLC; Secretary, W.L. Ross & Co., LLC Formerly: Secretary and Vice President, Jemstep, Inc.; Head of Legal, Worldwide Institutional, Invesco Ltd.; Secretary and General Counsel, INVESCO Private Capital Investments, Inc.; Senior Vice President, Secretary and General Counsel, Invesco Management Group, Inc. (formerly known as Invesco AIM Management Group, Inc.); Assistant Secretary, INVESCO Asset Management (Bermuda) Ltd.; Secretary and General Counsel, Invesco Private Capital, Inc.; Assistant Secretary and General Counsel, INVESCO Realty, Inc.; Secretary and General Counsel, Invesco Senior Secured Management, Inc.; and Secretary, Sovereign G./P. Holdings Inc. | | N/A | | N/A |
Andrew R. Schlossberg - 1974 Senior Vice President | | 2019 | | Head of the Americas and Senior Managing Director, Invesco Ltd.; Director and Senior Vice President, Invesco Advisers, Inc. (formerly known as Invesco Institutional (N.A.), Inc.) (registered investment adviser); Director and Chairman, Invesco Investment Services, Inc. (formerly known as Invesco AIM Investment Services, Inc.) (registered transfer agent); Senior Vice President, The Invesco Funds; Director, Invesco Investment Advisers LLC (formerly known as Van Kampen Asset Management); Director, President and Chairman, Invesco Insurance Agency, Inc. Formerly: Director, Invesco UK Limited; Director and Chief Executive, Invesco Asset Management Limited and Invesco Fund Managers Limited; Assistant Vice President, The Invesco Funds; Senior Vice President, Invesco Advisers, Inc. (formerly known as Invesco Institutional (N.A.), Inc.) (registered investment adviser); Director and Chief Executive, Invesco Administration Services Limited and Invesco Global Investment Funds Limited; Director, Invesco Distributors, Inc.; Head of EMEA, Invesco Ltd.; President, Invesco Actively Managed Exchange-Traded Commodity Fund Trust, Invesco Actively Managed Exchange-Traded Fund Trust, Invesco Exchange-Traded Fund Trust, Invesco Exchange-Traded Fund Trust II and Invesco India Exchange-Traded Fund Trust; Managing Director and Principal Executive Officer, Invesco Capital Management LLC | | N/A | | N/A |
Invesco V.I. Small Cap Equity Fund
Trustees and Officers–(continued)
| | | | | | | | |
Name, Year of Birth and Position(s) Held with the Trust | | Trustee and/or Officer Since | | Principal Occupation(s) During Past 5 Years | | Number of
Funds in
Fund Complex
Overseen by
Trustee | | Other Directorship(s) Held by Trustee
During Past 5 Years |
| Officers–(continued) |
John M. Zerr - 1962 Senior Vice President | | 2006 | | Chief Operating Officer of the Americas; Senior Vice President, Invesco Advisers, Inc. (formerly known as Invesco Institutional (N.A.), Inc.) (registered investment adviser); Senior Vice President, Invesco Distributors, Inc. (formerly known as Invesco AIM Distributors, Inc.); Director and Vice President, Invesco Investment Services, Inc. (formerly known as Invesco AIM Investment Services, Inc.) Senior Vice President, The Invesco Funds; Managing Director, Invesco Capital Management LLC; Director, Invesco Investment Advisers LLC (formerly known as Van Kampen Asset Management); Senior Vice President, Invesco Capital Markets, Inc. (formerly known as Van Kampen Funds Inc.); Manager, Invesco Indexing LLC; Manager, Invesco Specialized Products, LLC; Director and Senior Vice President, Invesco Insurance Agency, Inc.; Member, Invesco Canada Funds Advisory Board; Director, President and Chief Executive Officer, Invesco Corporate Class Inc. (corporate mutual fund company); and Director, Chairman, President and Chief Executive Officer, Invesco Canada Ltd. (formerly known as Invesco Trimark Ltd./Invesco Trimark Ltèe) (registered investment adviser and registered transfer agent) Formerly: Director and Senior Vice President, Invesco Management Group, Inc. (formerly known as Invesco AIM Management Group, Inc.); Secretary and General Counsel, Invesco Management Group, Inc. (formerly known as Invesco AIM Management Group, Inc.); Secretary, Invesco Investment Services, Inc. (formerly known as Invesco AIM Investment Services, Inc.); Chief Legal Officer and Secretary, The Invesco Funds; Secretary and General Counsel, Invesco Investment Advisers LLC (formerly known as Van Kampen Asset Management); Secretary and General Counsel, Invesco Capital Markets, Inc. (formerly known as Van Kampen Funds Inc.); Chief Legal Officer, Invesco Exchange-Traded Fund Trust, Invesco Exchange-Traded Fund Trust II, Invesco India Exchange-Traded Fund Trust, Invesco Actively Managed Exchange-Traded Fund Trust, Invesco Actively Managed Exchange-Traded Commodity Fund Trust and Invesco Exchange-Traded Self-Indexed Fund Trust; Secretary, Invesco Indexing LLC; Director, Secretary, General Counsel and Senior Vice President, Van Kampen Exchange Corp.; Director, Vice President and Secretary, IVZ Distributors, Inc. (formerly known as INVESCO Distributors, Inc.); Director and Vice President, INVESCO Funds Group, Inc.; Director and Vice President, Van Kampen Advisors Inc.; Director, Vice President, Secretary and General Counsel, Van Kampen Investor Services Inc.; Director and Secretary, Invesco Distributors, Inc. (formerly known as Invesco AIM Distributors, Inc.); Director, Senior Vice President, General Counsel and Secretary, Invesco AIM Advisers, Inc. and Van Kampen Investments Inc.; Director, Vice President and Secretary, Fund Management Company; Director, Senior Vice President, Secretary, General Counsel and Vice President, Invesco AIM Capital Management, Inc.; Chief Operating Officer and General Counsel, Liberty Ridge Capital, Inc. (an investment adviser) | | N/A | | N/A |
Gregory G. McGreevey - 1962 Senior Vice President | | 2012 | | Senior Managing Director, Invesco Ltd.; Director, Chairman, President, and Chief Executive Officer, Invesco Advisers, Inc. (formerly known as Invesco Institutional (N.A.), Inc.) (registered investment adviser); Director, Invesco Mortgage Capital, Inc. and Invesco Senior Secured Management, Inc.; and Senior Vice President, The Invesco Funds; and President, SNW Asset Management Corporation Formerly: Senior Vice President, Invesco Management Group, Inc. and Invesco Advisers, Inc.; Assistant Vice President, The Invesco Funds | | N/A | | N/A |
Kelli Gallegos - 1970 Vice President, Principal Financial Officer and Assistant Treasurer | | 2008 | | Principal Financial and Accounting Officer - Investments Pool, Invesco Specialized Products, LLC; Vice President, Principal Financial Officer and Assistant Treasurer, The Invesco Funds; Principal Financial and Accounting Officer - Pooled Investments, Invesco Capital Management LLC; Vice President and Treasurer, Invesco Exchange-Traded Fund Trust, Invesco Exchange-Traded Fund Trust II, Invesco India Exchange-Traded Fund Trust, Invesco Actively Managed Exchange-Traded Fund Trust, Invesco Actively Managed Exchange-Traded Commodity Fund Trust and Invesco Exchange-Traded Self-Indexed Fund Trust Formerly: Assistant Treasurer, Invesco Specialized Products, LLC; Assistant Treasurer, Invesco Exchange-Traded Fund Trust, Invesco Exchange-Traded Fund Trust II, Invesco India Exchange-Traded Fund Trust, Invesco Actively Managed Exchange-Traded Fund Trust, Invesco Actively Managed Exchange-Traded Commodity Fund Trust and Invesco Exchange-Traded Self-Indexed Fund Trust; Assistant Treasurer, Invesco Capital Management LLC; Assistant Vice President, The Invesco Funds | | N/A | | N/A |
Invesco V.I. Small Cap Equity Fund
Trustees and Officers–(continued)
| | | | | | | | |
Name, Year of Birth and Position(s) Held with the Trust | | Trustee and/or Officer Since | | Principal Occupation(s) During Past 5 Years | | Number of
Funds in
Fund Complex
Overseen by
Trustee | | Other Directorship(s) Held by Trustee
During Past 5 Years |
| Officers–(continued) |
Crissie M. Wisdom - 1969 Anti-Money Laundering Compliance Officer | | 2013 | | Anti-Money Laundering Compliance Officer, Invesco Advisers, Inc. (formerly known as Invesco Institutional (N.A.), Inc.) (registered investment adviser), Invesco Capital Markets, Inc. (formerly known as Van Kampen Funds Inc.), Invesco Distributors, Inc., Invesco Investment Services, Inc., The Invesco Funds, and Invesco Exchange-Traded Fund Trust, Invesco Exchange-Traded Fund Trust II, Invesco India Exchange-Traded Fund Trust, Invesco Actively Managed Exchange-Traded Fund Trust, Invesco Actively Managed Exchange-Traded Commodity Fund Trust and Invesco Exchange-Traded Self-Indexed Fund Trust; Anti-Money Laundering Compliance Officer and Bank Secrecy Act Officer, INVESCO National Trust Company and Invesco Trust Company; and Fraud Prevention Manager and Controls and Risk Analysis Manager for Invesco Investment Services, Inc. Formerly: Anti-Money Laundering Compliance Officer, Van Kampen Exchange Corp. and Invesco Management Group, Inc. | | N/A | | N/A |
Robert R. Leveille - 1969 Chief Compliance Officer | | 2016 | | Chief Compliance Officer, Invesco Advisers, Inc. (registered investment adviser); and Chief Compliance Officer, The Invesco Funds Formerly: Chief Compliance Officer, Putnam Investments and the Putnam Funds | | N/A | | N/A |
The Statement of Additional Information of the Trust includes additional information about the Fund’s Trustees and is available upon request, without charge, by calling 1.800.959.4246. Please refer to the Fund’s Statement of Additional Information for information on the Fund’ssub-advisers.
| | | | | | |
| Office of the Fund | | Investment Adviser | | Distributor | | Auditors |
| 11 Greenway Plaza, Suite 1000 | | Invesco Advisers, Inc. | | Invesco Distributors, Inc. | | PricewaterhouseCoopers LLP |
| Houston, TX 77046-1173 | | 1555 Peachtree Street, N.E. | | 11 Greenway Plaza, Suite 1000 | | 1000 Louisiana Street, Suite 5800 |
| | Atlanta, GA 30309 | | Houston, TX 77046-1173 | | Houston, TX 77002-5678 |
| | | |
| Counsel to the Fund | | Counsel to the Independent Trustees | | Transfer Agent | | Custodian |
| Stradley Ronon Stevens & Young, LLP | | Goodwin Procter LLP | | Invesco Investment Services, Inc. | | State Street Bank and Trust Company |
| 2005 Market Street, Suite 2600 | | 901 New York Avenue, N.W. | | 11 Greenway Plaza, Suite 1000 | | 225 Franklin Street |
| Philadelphia, PA 19103-7018 | | Washington, D.C. 20001 | | Houston, TX 77046-1173 | | Boston, MA 02110-2801 |
Invesco V.I. Small Cap Equity Fund
| | | | |
| | |

| | Annual Report to Shareholders | | December 31, 2019 |
| | |
| | Invesco V.I. Technology Fund |

Beginning on January 1, 2021, as permitted by regulations adopted by the Securities and Exchange Commission, the insurance company that offers your variable annuity or variable life insurance contract may no longer send you paper copies of the Fund’s shareholder reports by mail, unless you specifically request paper copies of the reports from the insurance company or your financial intermediary. Instead of delivering paper copies of the report, the insurance company may choose to make the reports available on a website, and will notify you by mail each time a report is posted and provide you with a website link to access the report. Instructions for requesting paper copies will be provided by your insurance company.
If the insurance company offers electronic delivery, you may elect to receive shareholder reports and other communications about the Fund electronically by following the instructions provided by the insurance company or by contacting your financial intermediary. If you already elected to receive shareholder reports electronically, you will not be affected by this change and you need not take any action.
You may elect to receive all future reports in paper free of charge from the insurance company. You can inform the insurance company or your financial intermediary that you wish to continue receiving paper copies of your shareholder reports by following the instructions provided by the insurance company or by contacting your financial intermediary. Your election to receive reports in paper will apply to all portfolio companies available under your contract with the insurance company.
The Fund provides a complete list of its holdings four times in each fiscal year, at the quarter-ends. For the second and fourth quarters, the lists appear in the Fund’s semiannual and annual reports to shareholders. For the first and third quarters, the Fund files the lists with the Securities and Exchange Commission (SEC) as an exhibit to its reports on FormN-PORT. The Fund’s FormN-PORT filings are available on the SEC website, sec.gov. The SEC file numbers for the Fund are811-07452 and033-57340. The Fund’s most recent portfolio holdings, as filed on FormN-PORT, have also been made available to insurance companies issuing variable annuity contracts and variable life insurance policies (“variable products”) that invest in the Fund.
A description of the policies and procedures that the Fund uses to determine how to vote proxies relating to portfolio securities is available without charge, upon request, from our Client Services department at 800 959 4246 or at invesco.com/proxyguidelines. The information is also available on the SEC website, sec.gov.
Information regarding how the Fund voted proxies related to its portfolio securities during the most recent12-month period ended June 30 is available at invesco.com/proxysearch. The information is also available on the SEC website, sec.gov.
Invesco Advisers, Inc. is an investment adviser; it provides investment advisory services to individual and institutional clients and does not sell securities. Invesco Distributors, Inc. is the US distributor for Invesco Ltd.’s retail mutual funds, exchange-traded funds and institutional money market funds. Both are wholly owned, indirect subsidiaries of Invesco Ltd.
This report must be accompanied or preceded by a currently effective Fund prospectus and variable product prospectus, which contain more complete information, including sales charges and expenses. Investors should read each carefully before investing.
| | | | |
| |
NOT FDIC INSURED | MAY LOSE VALUE | NO BANK GUARANTEE |
| Invesco Distributors, Inc. | | | | I-VITEC-AR-1 |
Management’s Discussion of Fund Performance
| | | | |
| Performance summary | | | | |
For the year ended December 31, 2019, Series I shares of Invesco V.I. Technology Fund (the Fund) underperformed the NASDAQ Composite Index, the Fund’s broad market/style-specific benchmark. Your Fund’s long-term performance appears later in this report. | |
| Fund vs. Indexes | | | | |
| Total returns, 12/31/18 to 12/31/19, excluding variable product issuer charges. If variable product issuer charges were included, returns would be lower. | | | | |
| Series I Shares | | | 35.88 | % |
| Series II Shares | | | 35.56 | |
| NASDAQ Composite Indexq(Broad Market/Style-Specific Index) | | | 36.69 | |
| Lipper VUF Science & Technology Funds Classification Average∎ (Peer Group) | | | 39.68 | |
| |
| Source(s):qBloomberg LP;∎Lipper Inc. | | | | |
Market conditions and your Fund
Equity markets rallied in the first quarter of 2019, fueled by optimism about a potentialUS-China trade deal and indication that the US Federal Reserve (the Fed) would not raise interest rates in 2019, a surprising shift in monetary policy. The Fed’s more accommodative stance provided a supportive environment for equities and fixed income, even as US economic data were mixed and overseas growth appeared to be slowing. Against this backdrop, the S&P 500 Index posted its best first quarter returns since 1998.
Although the S&P 500 Index posted modest gains for the second quarter of 2019, the US stock market experienced increased volatility. After four consecutive months of rising stock markets, the market sold off in May 2019, along with bond yields and oil prices, as investors weighed the impact of the lingering trade war between the US and China, as well as potential tariffs imposed on Mexico. In addition, economic data showed a slowing domestic and global economy.
Key issues that concerned investors in the second quarter of 2019 carried over into the third quarter. TheUS-China trade conflict worried investors and stifled business investment, even as the
Fed cut interest rates by 0.25% in July and again in September 2019.1 This environment, combined with evidence of slowing global economic growth, fueled market volatility in August 2019. The US Treasury yield curve inverted several times, increasing fears of a possible US recession. As a result, August saw increased risk aversion, with investors crowding into asset classes perceived as safe havens, such as US Treasuries and gold. However, the Fed’s accommodative tone provided some support for risk assets.
Macroeconomic issues that concerned investors in the third quarter of 2019 mostly abated during the fourth quarter, providing the backdrop for strong equity market returns. Risk assets surged higher as a result of a delay in the Brexit agreement until January 2020, optimism that phase one of aUS-China trade deal would be completed and better-than-expected third-quarter corporate earnings results. The US economy rose higher than expected, at 2.1% during the third quarter of 2019.2 During its October meeting, the Fed cut interest rates again by 0.25% based on business investment and exports remaining weak.1 Investors were also encouraged by a resilient US economy and corporate earnings, putting
the US equity market on track for its largest annual rise since 2013.
Given this landscape, the Fund produced a strong, double-digit return but underperformed its style-specific benchmark during the year. Relative underperformance was primarily driven by stock selection in and overweight exposure to the diversified telecommunication services industry and an underweight allocation to the technology hardware, storage and peripherals industry, as well as stock selection in the software industry. Conversely, stock selection in the entertainment, biotechnology, interactive media & services and internet & direct marketing retail industries contributed to the Fund’s relative performance.
Top individual detractors from the Fund’s performance for the year includedIntelsat,LyftandUber. Intelsat operates satellite services and our thesis for owning the stock was based on our positive view of its spectrum assets, given growing bottlenecks in wireless capacity driven by trends in smartphone usage. Spectrum is the term for invisible radio frequencies that wireless signals travel over. In November, the Federal Communications Commission surprised investors by pursuing a public auction of the highly valuableC-Band spectrum, which is required for the rollout of 5G in the US, rather than allowing a consortium (of which Intelsat was a member) to clear the spectrum. While the impact on Intel-sat’s stock was disappointing, we added to our position in the company, as we believed the situation remains fluid and we continued to be bullish on the potential value of its spectrum.
Ridesharing companies Lyft and Uber both issued initial public offerings (IPOs) during the year. The Fund did not participate in Uber’s IPO and instead purchased shares in the secondary trading market. Both companies faced pressure in the second half of the year due to regulatory
| | | | |
Portfolio Composition | |
By sector | | | % of total net assets | |
| |
| Information Technology | | | 47.40 | % |
| Communication Services | | | 24.63 | |
| Consumer Discretionary | | | 15.35 | |
| Health Care | | | 12.14 | |
| Industrials | | | 0.33 | |
| Money Market Funds Plus Other | | | | |
| Assets Less Liabilities | | | 0.15 | |
| | | | |
Top 10 Equity Holdings* | |
% of total net assets | |
| |
| 1. Amazon.com, Inc. | | | 7.38 | % |
| 2. Microsoft Corp. | | | 6.41 | |
| 3. Apple, Inc. | | | 5.75 | |
4. Alibaba Group Holding Ltd., ADR | | | 5.48 | |
5. Alphabet, Inc., Class A | | | 5.18 | |
6. Facebook, Inc., Class A | | | 4.97 | |
| 7. Broadcom, Inc. | | | 3.84 | |
| 8. Applied Materials, Inc. | | | 3.65 | |
| 9. Illumina, Inc. | | | 3.18 | |
10. Activision Blizzard, Inc. | | | 2.94 | |
| | | | |
| Total Net Assets | | $ | 137.5 million | |
| |
| Total Number of Holdings* | | | 46 | |
The Fund’s holdings are subject to change, and there is no assurance that the Fund will continue to hold any particular security.
*Excluding money market fund holdings, if any.
Data presented here are as of December 31, 2019.
Invesco V.I. Technology Fund
headwinds related to the advancement of California Assembly Bill 5 (AB5), which is designed to extend employee classification status to rideshare drivers, giving them greater benefits, such as a protected minimum wage, sick days and health insurance. Though AB5 is not yet in effect, and a settlement or appeal of the law could still materialize, the advancement of the law has increased uncertainty for the ridesharing business model in California. In the long term, we believed the ridesharing industry has a large, underpenetrated market and potential to benefit from autonomous driving. Thus, we continued to hold Lyft but exited our position in Uber before the close of the year.
Top individual contributors to the Fund’s performance during the year includedApple,MicrosoftandFacebook. Though Apple benefited the Fund’s absolute performance, an underweight position in the stock detracted from the Fund’s performance relative to the style-specific benchmark. At the beginning of the year, the Fund’s underweight exposure was based on our belief that Apple, while offering a number of positive characteristics, was not fully pricing in real risks associated with geopolitics, slowing global growth and foreign exchange rates. We later reduced our underweight exposure, as our analysis revealed that demand for the new iPhone was exceeding orders in the supply chain.
During the year, Microsoft contributed to the Fund on an absolute basis. However, the Fund’s underweight exposure versus its style-specific benchmark detracted from the Fund’s performance. Investor confidence in Microsoft grew following strong growth in Azure, its cloud computing platform. Additionally, Microsoft was awarded the $10 billion Joint Enterprise Defense Infrastructure (JEDI) contract from the US Department of Defense, further strengthening its competitive position. We see opportunity for Microsoft to grow revenue and profits as customers continue their digital transformation into the cloud.
Social media giant Facebook reported strong earnings results during the year, showcasing an increase in the number of users worldwide, as well as increased revenue. Going forward, we believed increasing monetization for areas of Facebook, such as “Stories,” “Watch” and “Messenger,” as well as improving margins from slowing regulatory and privacy costs would be more impactful to the company in the future.
Atyear-end, based on our fundamental,bottom-up research approach, the Fund maintained overweight exposures to the communication services, information technology (IT), consumer discretionary and health care sectors relative to the style-specific benchmark. Within the communication services and consumer discretionary sectors, we are focused on technology-driven share shift capabilities, demographics and changing behaviors. Within IT, the Fund had overweight positions in the semiconductors, IT services and software industries. Within health care, given the potential for increased volatility during an election year, the Fund remained relatively underweight in the biopharmaceutical industry. The Fund also held underweight exposure to the industrials sector relative to the style-specific benchmark. Additionally, the Fund lacked exposure to the financials and consumer staples sectors, two sectors where the style-specific benchmark maintained slight exposure.
Central bank actions in 2019 supported continued growth by keeping the cost of debt low. The labor market remains healthy with employment and wage gains, which is beneficial to consumers. However, these are clearly the late innings of the economic cycle and, therefore, we expect only modest growth from here, as well as continued volatility spurred by trade and election headlines. Prolonged cyclical growth is likely to be scarce and we believe the market will continue to favor companies that can produce growth and compound earnings despite the economic cycle. We believe change is the fuel for growth. Thus, we are seeking to identify “share-takers,” companies that can gain market share through technology-enabled advantages in their business models and from disruptive shifts in consumer behavior.
Thank you for your commitment to the Invesco V.I. Technology Fund and for sharing our long-term investment horizon.
1 Source: US Federal Reserve
2 Source: Bureau of Economic Analysis
Portfolio managers:
Janet Luby
Erik Voss - Lead
The views and opinions expressed in management’s discussion of Fund performance are those of Invesco Advisers, Inc. These views and opinions are subject to change at any time based on factors such as
market and economic conditions. These views and opinions may not be relied upon as investment advice or recommendations, or as an
offer for a particular security. The information is not a complete analysis of every aspect of any market, country, industry, security or the Fund. Statements of fact are from sources considered reliable, but Invesco Advisers, Inc. makes no representation or warranty as to their completeness or accuracy. Although historical performance is no guarantee of future results, these insights may help you understand our investment management philosophy.
See important Fund and, if applicable, index disclosures later in this report.
Invesco V.I. Technology Fund
Your Fund’s Long-Term Performance
Results of a $10,000 Investment – Oldest Share Class(es)
Fund and index data from 12/31/09
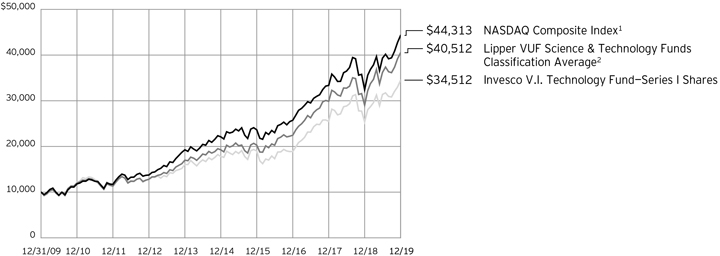
Past performance cannot guarantee future
results.
| | | | |
| Average Annual Total Returns | |
As of 12/31/19 | | | | |
| |
| Series I Shares | | | | |
| Inception (5/20/97) | | | 6.97% | |
| 10 Years | | | 13.19 | |
| 5 Years | | | 14.14 | |
| 1 Year | | | 35.88 | |
| |
| Series II Shares | | | | |
| Inception (4/30/04) | | | 9.14% | |
| 10 Years | | | 12.91 | |
| 5 Years | | | 13.85 | |
| 1 Year | | | 35.56 | |
The performance of the Fund’s Series I and Series II share classes will differ primarily due to different class expenses.
The performance data quoted represent past performance and cannot guarantee future results; current performance may be lower or higher. Please contact your variable product issuer or financial adviser for the most recentmonth-end variable product performance. Performance figures reflect Fund expenses, reinvested distributions and changes in net asset value. Performance figures do not reflect deduction of taxes a shareholder would pay on Fund distributions or sale of Fund shares. Investment return and principal value will fluctuate so that you may have a gain or loss when you sell shares.
The total annual Fund operating expense ratio set forth in the most recent Fund prospectus as of the date of this report for Series I and Series II shares was 1.03% and 1.28%, respectively. The expense ratios presented above may vary from the ex-
pense ratios presented in other sections of this report that are based on expenses incurred during the period covered by this report.
Invesco V.I. Technology Fund, a series portfolio of AIM Variable Insurance Funds (Invesco Variable Insurance Funds), is currently offered through insurance companies issuing variable products. You cannot purchase shares of the Fund directly. Performance figures given represent the Fund and are not intended to reflect actual variable product values. They do not reflect sales charges, expenses and fees assessed in connection with a variable product. Sales charges, expenses and fees, which are determined by the variable product issuers, will vary and will lower the total return.
The most recentmonth-end performance at the Fund level, excluding variable product charges, is available at 800 451 4246. As mentioned above, for the most recentmonth-end performance including variable product charges, please contact your variable product issuer or financial adviser.
Fund performance reflects any applicable fee waivers and/or expense reimbursements. Had the adviser not waived fees and/or reimbursed expenses currently or in the past, returns would have been lower. See current prospectus for more information.
Invesco V.I. Technology Fund
Invesco V.I. Technology Fund’s investment objective is long-term growth of capital.
| ∎ | | Unless otherwise stated, information presented in this report is as of December 31, 2019, and is based on total net assets. |
| ∎ | | Unless otherwise noted, all data provided by Invesco. |
| ∎ | | To access your Fund’s reports/prospectus, visit invesco.com/fundreports. |
About indexes used in this report
| ∎ | | TheNASDAQ Composite Indexis a broad-based, market index of the common stocks and similar securities listed on the Nasdaq stock market. |
| ∎ | | TheLipper VUF Science & Technology Funds Classification Averagerepresents an average of all variable insurance underlying funds in the Lipper Science & Technology Funds classification. |
| ∎ | | The Fund is not managed to track the performance of any particular index, including the index(es) described here, and consequently, the performance of the Fund may deviate significantly from the performance of the index(es). |
| ∎ | | A direct investment cannot be made in an index. Unless otherwise indicated, index results include reinvested dividends, and they do not reflect sales charges. Performance of the peer group, if applicable, reflects fund expenses; performance of a market index does not. |
Other information
| ∎ | | The returns shown in management’s discussion of Fund performance are based on net asset values calculated for shareholder transactions. Generally accepted accounting principles require adjustments to be made to the net assets of the Fund at period end for financial reporting purposes, and as such, the net asset values for shareholder transactions and the returns based on those net asset values may differ from the net asset values and returns reported in the Financial Highlights. Additionally, the returns and net asset values shown throughout this report are at the Fund level only and do not include variable product issuer charges. If such charges were included, the total returns would be lower. |
| ∎ | | Industry classifications used in this report are generally according to the Global Industry Classification Standard, which was developed by and is the exclusive property and a service mark of MSCI Inc. and Standard & Poor’s. |
Invesco V.I. Technology Fund
Schedule of Investments(a)
December 31, 2019
| | | | | | | | |
| | | Shares | | | Value | |
Common Stocks & Other Equity Interests–99.85% | |
| Alternative Carriers–1.05% | |
Intelsat S.A.(b) | | | 204,319 | | | $ | 1,436,363 | |
| |
|
| Application Software–5.24% | |
Adobe, Inc.(b) | | | 4,935 | | | | 1,627,612 | |
| |
salesforce.com, inc.(b) | | | 21,023 | | | | 3,419,181 | |
| |
Splunk, Inc.(b) | | | 14,430 | | | | 2,161,181 | |
| |
| | | | | | | 7,207,974 | |
| |
|
| Consumer Electronics–1.82% | |
Sony Corp. (Japan) | | | 36,800 | | | | 2,504,858 | |
| |
|
| Data Processing & Outsourced Services–9.08% | |
Fidelity National Information Services, Inc. | | | 7,416 | | | | 1,031,491 | |
| |
Fiserv, Inc.(b) | | | 26,835 | | | | 3,102,931 | |
| |
Mastercard, Inc., Class A | | | 7,909 | | | | 2,361,548 | |
| |
PayPal Holdings, Inc.(b) | | | 18,256 | | | | 1,974,752 | |
| |
Visa, Inc., Class A | | | 21,378 | | | | 4,016,926 | |
| |
| | | | | | | 12,487,648 | |
| |
|
| Health Care Equipment–5.94% | |
Abbott Laboratories | | | 19,443 | | | | 1,688,819 | |
| |
Boston Scientific Corp.(b) | | | 47,650 | | | | 2,154,733 | |
| |
DexCom, Inc.(b) | | | 2,178 | | | | 476,416 | |
| |
Intuitive Surgical, Inc.(b) | | | 2,345 | | | | 1,386,247 | |
| |
Teleflex, Inc. | | | 6,519 | | | | 2,454,012 | |
| |
| | | | | | | 8,160,227 | |
| |
|
| Interactive Home Entertainment–10.22% | |
Activision Blizzard, Inc. | | | 68,117 | | | | 4,047,512 | |
| |
Electronic Arts, Inc.(b) | | | 16,027 | | | | 1,723,063 | |
| |
Nintendo Co. Ltd. (Japan) | | | 9,700 | | | | 3,915,368 | |
| |
Sea Ltd., ADR (Taiwan)(b) | | | 58,676 | | | | 2,359,949 | |
| |
Take-Two Interactive Software, Inc.(b) | | | 11,553 | | | | 1,414,434 | |
| |
Ubisoft Entertainment S.A. (France)(b) | | | 8,589 | | | | 594,158 | |
| |
| | | | | | | 14,054,484 | |
| |
|
| Interactive Media & Services–11.81% | |
Alphabet, Inc., Class A(b) | | | 5,316 | | | | 7,120,197 | |
| |
Alphabet, Inc., Class C(b) | | | 1,114 | | | | 1,489,440 | |
| |
Facebook, Inc., Class A(b) | | | 33,269 | | | | 6,828,462 | |
| |
Match Group, Inc.(b)(c) | | | 9,695 | | | | 796,057 | |
| |
| | | | | | | 16,234,156 | |
| |
|
| Internet & Direct Marketing Retail–13.53% | |
Alibaba Group Holding Ltd., ADR (China)(b) | | | 35,555 | | | | 7,541,215 | |
| |
Amazon.com, Inc.(b) | | | 5,489 | | | | 10,142,794 | |
| |
Booking Holdings, Inc.(b) | | | 446 | | | | 915,964 | |
| |
| | | | | | | 18,599,973 | |
| |
| | | | | | | | |
| | | Shares | | | Value | |
| Life Sciences Tools & Services–5.96% | |
10X Genomics, Inc., Class A(b) | | | 13,746 | | | $ | 1,048,132 | |
| |
Illumina, Inc.(b) | | | 13,181 | | | | 4,372,665 | |
| |
IQVIA Holdings, Inc.(b) | | | 7,951 | | | | 1,228,509 | |
| |
Thermo Fisher Scientific, Inc. | | | 4,762 | | | | 1,547,031 | |
| |
| | | | | | | 8,196,337 | |
| |
|
| Managed Health Care–0.25% | |
UnitedHealth Group, Inc. | | | 1,161 | | | | 341,311 | |
| |
|
| Movies & Entertainment–1.55% | |
Netflix, Inc.(b) | | | 6,591 | | | | 2,132,650 | |
| |
|
| Semiconductor Equipment–5.50% | |
Applied Materials, Inc. | | | 82,340 | | | | 5,026,034 | |
| |
ASML Holding N.V., New York Shares (Netherlands) | | | 8,575 | | | | 2,537,685 | |
| |
| | | | | | | 7,563,719 | |
| |
|
| Semiconductors–12.55% | |
Broadcom, Inc. | | | 16,700 | | | | 5,277,534 | |
| |
NVIDIA Corp. | | | 9,264 | | | | 2,179,819 | |
| |
QUALCOMM, Inc. | | | 30,781 | | | | 2,715,808 | |
| |
Semtech Corp.(b) | | | 68,797 | | | | 3,639,361 | |
| |
Silicon Motion Technology Corp., ADR (Taiwan) | | | 67,967 | | | | 3,446,607 | |
| |
| | | | | | | 17,259,129 | |
| |
|
| Systems Software–9.27% | |
Microsoft Corp. | | | 55,915 | | | | 8,817,796 | |
| |
Palo Alto Networks, Inc.(b) | | | 7,496 | | | | 1,733,450 | |
| |
ServiceNow, Inc.(b) | | | 7,770 | | | | 2,193,626 | |
| |
| | | | | | | 12,744,872 | |
| |
|
| Technology Hardware, Storage & Peripherals–5.75% | |
Apple, Inc. | | | 26,921 | | | | 7,905,352 | |
| |
|
| Trucking–0.33% | |
Lyft, Inc., Class A(b) | | | 10,458 | | | | 449,903 | |
| |
Total Common Stocks & Other Equity Interests
(Cost $67,796,639) | | | | | | | 137,278,956 | |
| |
|
| Money Market Funds–0.72% | |
Invesco Government & Agency Portfolio, Institutional Class, 1.50%(d) | | | 344,022 | | | | 344,022 | |
| |
Invesco Liquid Assets Portfolio, Institutional Class, 1.71%(d) | | | 253,945 | | | | 254,021 | |
| |
Invesco Treasury Portfolio, Institutional Class, 1.49%(d) | | | 393,168 | | | | 393,168 | |
| |
Total Money Market Funds (Cost $991,221) | | | | | | | 991,211 | |
| |
TOTAL INVESTMENTS IN SECURITIES
(excluding investments purchased with cash collateral from securities onloan)-100.57% (Cost $68,787,860) | | | | | | | 138,270,167 | |
| |
See accompanying Notes to Financial Statements which are an integral part of the financial statements.
Invesco V.I. Technology Fund
| | | | | | | | |
| | | Shares | | | Value | |
Investments Purchased with Cash Collateral from Securities on Loan | | | | | |
|
| Money Market Funds-0.53% | |
Invesco Government & Agency Portfolio, Institutional Class, 1.50%(d)(e) | | �� | 550,517 | | | $ | 550,517 | |
| |
Invesco Liquid Assets Portfolio, Institutional Class, 1.71%(d)(e) | | | 183,450 | | | | 183,505 | |
| |
Total Investments Purchased with Cash Collateral from Securities on Loan
(Cost $734,022) | | | | 734,022 | |
| |
TOTAL INVESTMENTS IN SECURITIES-101.10%
(Cost $69,521,882) | | | | 139,004,189 | |
| |
OTHER ASSETS LESS LIABILITIES-(1.10)% | | | | (1,512,100 | ) |
| |
NET ASSETS-100.00% | | | | | | $ | 137,492,089 | |
| |
Investment Abbreviations:
| | |
ADR - American Depositary Receipt |
Notes to Schedule of Investments:
| (a) | Industry and/or sector classifications used in this report are generally according to the Global Industry Classification Standard, which was developed by and is the exclusive property and a service mark of MSCI Inc. and Standard & Poor’s. |
| (b) | Non-income producing security. |
| (c) | All or a portion of this security was out on loan at December 31, 2019. |
| (d) | The money market fund and the Fund are affiliated by having the same investment adviser. The rate shown is the7-day SEC standardized yield as of December 31, 2019. |
| (e) | The security has been segregated to satisfy the commitment to return the cash collateral received in securities lending transactions upon the borrower’s return of the securities loaned. See Note 1I. |
See accompanying Notes to Financial Statements which are an integral part of the financial statements.
Invesco V.I. Technology Fund
Statement of Assets and Liabilities
December 31, 2019
| | | | |
Assets: | | | | |
Investments in securities, at value
(Cost $67,796,639)* | | $ | 137,278,956 | |
| |
Investments in affiliated money market funds, at value
(Cost $1,725,243) | | | 1,725,233 | |
| |
Foreign currencies, at value (Cost $149) | | | 150 | |
| |
Receivable for: | | | | |
Fund shares sold | | | 79,958 | |
| |
Dividends | | | 1,933 | |
| |
Investment for trustee deferred compensation and retirement plans | | | 70,594 | |
| |
Total assets | | | 139,156,824 | |
| |
| |
Liabilities: | | | | |
Payable for: | | | | |
Fund shares reacquired | | | 730,695 | |
| |
Amount due custodian | | | 18,072 | |
| |
Collateral upon return of securities loaned | | | 734,022 | |
| |
Accrued fees to affiliates | | | 60,492 | |
| |
Accrued other operating expenses | | | 44,159 | |
| |
Trustee deferred compensation and retirement plans | | | 77,295 | |
| |
Total liabilities | | | 1,664,735 | |
| |
Net assets applicable to shares outstanding | | $ | 137,492,089 | |
| |
| |
Net assets consist of: | | | | |
Shares of beneficial interest | | $ | 54,325,192 | |
| |
Distributable earnings | | | 83,166,897 | |
| |
| | $ | 137,492,089 | |
| |
| |
Net Assets: | | | | |
Series I | | $ | 127,308,321 | |
| |
Series II | | $ | 10,183,768 | |
| |
|
Shares outstanding, no par value, with an unlimited number of shares authorized: | |
Series I | | | 4,675,574 | |
| |
Series II | | | 397,340 | |
| |
Series I: | | | | |
Net asset value per share | | $ | 27.23 | |
| |
Series II: | | | | |
Net asset value per share | | $ | 25.63 | |
| |
| * | At December 31, 2019, securities with an aggregate value of $718,690 were on loan to brokers. |
Statement of Operations
For the year ended December 31, 2019
| | | | |
Investment income: | | | | |
Dividends (net of foreign withholding taxes of $19,550) | | $ | 763,880 | |
| |
Dividends from affiliated money market funds (includes securities lending income of $28,845) | | | 58,473 | |
| |
Total investment income | | | 822,353 | |
| |
| |
Expenses: | | | | |
Advisory fees | | | 984,595 | |
| |
Administrative services fees | | | 215,203 | |
| |
Custodian fees | | | 11,650 | |
| |
Distribution fees - Series II | | | 25,871 | |
| |
Transfer agent fees | | | 27,146 | |
| |
Trustees’ and officers’ fees and benefits | | | 20,270 | |
| |
Reports to shareholders | | | 7,284 | |
| |
Professional services fees | | | 36,711 | |
| |
Other | | | 2,120 | |
| |
Total expenses | | | 1,330,850 | |
| |
Less: Fees waived | | | (1,657 | ) |
| |
Net expenses | | | 1,329,193 | |
| |
Net investment income (loss) | | | (506,840 | ) |
| |
| |
Realized and unrealized gain (loss) from: | | | | |
Net realized gain from: | | | | |
Investment securities (includes net gains from securities sold to affiliates of $188,543) | | | 15,220,855 | |
| |
Foreign currencies | | | 2,964 | |
| |
| | | 15,223,819 | |
| |
Change in net unrealized appreciation (depreciation) of: | | | | |
Investment securities | | | 25,304,086 | |
| |
Foreign currencies | | | (4 | ) |
| |
| | | 25,304,082 | |
| |
Net realized and unrealized gain | | | 40,527,901 | |
| |
Net increase in net assets resulting from operations | | $ | 40,021,061 | |
| |
See accompanying Notes to Financial Statements which are an integral part of the financial statements.
Invesco V.I. Technology Fund
Statement of Changes in Net Assets
For the years ended December 31, 2019 and 2018
| | | | | | | | |
| | | 2019 | | | 2018 | |
| |
Operations: | | | | | | | | |
Net investment income (loss) | | $ | (506,840 | ) | | $ | (667,086 | ) |
| |
Net realized gain | | | 15,223,819 | | | | 10,614,800 | |
| |
Change in net unrealized appreciation (depreciation) | | | 25,304,082 | | | | (10,726,385 | ) |
| |
Net increase (decrease) in net assets resulting from operations | | | 40,021,061 | | | | (778,671 | ) |
| |
| | |
Distributions to shareholders from distributable earnings: | | | | | | | | |
Series I | | | (10,151,000 | ) | | | (5,582,826 | ) |
| |
Series II | | | (904,027 | ) | | | (539,546 | ) |
| |
Total distributions from distributable earnings | | | (11,055,027 | ) | | | (6,122,372 | ) |
| |
| | |
Share transactions–net: | | | | | | | | |
Series I | | | (9,079,975 | ) | | | 2,448,136 | |
| |
Series II | | | (1,576,636 | ) | | | 844,764 | |
| |
Net increase (decrease) in net assets resulting from share transactions | | | (10,656,611 | ) | | | 3,292,900 | |
| |
Net increase (decrease) in net assets | | | 18,309,423 | | | | (3,608,143 | ) |
| |
| | |
Net assets: | | | | | | | | |
Beginning of year | | | 119,182,666 | | | | 122,790,809 | |
| |
End of year | | $ | 137,492,089 | | | $ | 119,182,666 | |
| |
See accompanying Notes to Financial Statements which are an integral part of the financial statements.
Invesco V.I. Technology Fund
Financial Highlights
The following schedule presents financial highlights for a share of the Fund outstanding throughout the periods indicated.
| | | | | | | | | | | | | | | | | | | | | | | | | | | | | | | | | | | | | | | | | | | | | | | | |
| | | Net asset
value,
beginning
of period | | | Net
investment
income
(loss)(a) | | | Net gains
(losses)
on securities
(both
realized and
unrealized) | | | Total from
investment
operations | | | Distributions
from net
realized
gains | | | Net asset
value, end
of period | | | Total
return (b) | | | Net assets,
end of period
(000’s omitted) | | | Ratio of
expenses
to average net assets
with fee waivers
and/or
expenses
absorbed | | | Ratio of
expenses
to average net
assets without
fee waivers
and/or
expenses
absorbed | | | Ratio of net
investment income (loss)
to average
net assets | | | Portfolio
turnover (c) | |
Series I | | | | | | | | | | | | | | | | | | | | | | | | | | | | | | | | | | | | | | | | | | | | | | | | |
Year ended 12/31/19 | | | $21.92 | | | | $(0.09) | | | | $ 7.71 | | | | $ 7.62 | | | | $(2.31) | | | | $27.23 | | | | 35.88% | | | | $127,308 | | | | 0.99%(d) | | | | 0.99%(d) | | | | (0.36)%(d) | | | | 46% | |
Year ended 12/31/18 | | | 22.97 | | | | (0.12) | | | | 0.22 | | | | 0.10 | | | | (1.15) | | | | 21.92 | | | | (0.45) | | | | 109,596 | | | | 1.03 | | | | 1.03 | | | | (0.47) | | | | 48 | |
Year ended 12/31/17 | | | 17.89 | | | | (0.09) | | | | 6.34 | | | | 6.25 | | | | (1.17) | | | | 22.97 | | | | 35.13 | | | | 113,352 | | | | 1.06 | | | | 1.06 | | | | (0.41) | | | | 43 | |
Year ended 12/31/16 | | | 18.83 | | | | (0.06) | | | | (0.06) | | | | (0.12) | | | | (0.82) | | | | 17.89 | | | | (0.76) | | | | 87,632 | | | | 1.10 | | | | 1.10 | | | | (0.33) | | | | 52 | |
Year ended 12/31/15 | | | 19.75 | | | | (0.11) | | | | 1.29 | | | | 1.18 | | | | (2.10) | | | | 18.83 | | | | 6.82 | | | | 107,257 | | | | 1.15 | | | | 1.15 | | | | (0.53) | | | | 61 | |
Series II | | | | | | | | | | | | | | | | | | | | | | | | | | | | | | | | | | | | | | | | | | | | | | | | |
Year ended 12/31/19 | | | 20.79 | | | | (0.15) | | | | 7.30 | | | | 7.15 | | | | (2.31) | | | | 25.63 | | | | 35.56 | | | | 10,184 | | | | 1.24(d) | | | | 1.24(d) | | | | (0.61)(d) | | | | 46 | |
Year ended 12/31/18 | | | 21.89 | | | | (0.17) | | | | 0.22 | | | | 0.05 | | | | (1.15) | | | | 20.79 | | | | (0.71) | | | | 9,587 | | | | 1.28 | | | | 1.28 | | | | (0.72) | | | | 48 | |
Year ended 12/31/17 | | | 17.14 | | | | (0.14) | | | | 6.06 | | | | 5.92 | | | | (1.17) | | | | 21.89 | | | | 34.74 | | | | 9,439 | | | | 1.31 | | | | 1.31 | | | | (0.66) | | | | 43 | |
Year ended 12/31/16 | | | 18.12 | | | | (0.10) | | | | (0.06) | | | | (0.16) | | | | (0.82) | | | | 17.14 | | | | (1.01) | | | | 6,799 | | | | 1.35 | | | | 1.35 | | | | (0.58) | | | | 52 | |
Year ended 12/31/15 | | | 19.13 | | | | (0.15) | | | | 1.24 | | | | 1.09 | | | | (2.10) | | | | 18.12 | | | | 6.56 | | | | 8,043 | | | | 1.40 | | | | 1.40 | | | | (0.78) | | | | 61 | |
| (a) | Calculated using average shares outstanding. |
| (b) | Includes adjustments in accordance with accounting principles generally accepted in the United States of America and as such, the net asset value for financial reporting purposes and the returns based upon those net asset values may differ from the net asset value and returns for shareholder transactions. Total returns are not annualized for periods less than one year, if applicable, and do not reflect charges assessed in connection with a variable product, which if included would reduce total returns. |
| (c) | Portfolio turnover is calculated at the fund level and is not annualized for periods less than one year, if applicable. |
| (d) | Ratios are based on average daily net assets (000’s omitted) of $120,927 and $10,352 for Series I and Series II shares, respectively. |
See accompanying Notes to Financial Statements which are an integral part of the financial statements.
Invesco V.I. Technology Fund
Notes to Financial Statements
December 31, 2019
NOTE 1–Significant Accounting Policies
Invesco V.I. Technology Fund (the “Fund”) is a series portfolio of AIM Variable Insurance Funds (Invesco Variable Insurance Funds) (the “Trust”). The Trust is a Delaware statutory trust registered under the Investment Company Act of 1940, as amended (the “1940 Act”), as anopen-end series management investment company. Information presented in these financial statements pertains only to the Fund. Matters affecting the Fund or each class will be voted on exclusively by the shareholders of the Fund or each class. Current Securities and Exchange Commission (“SEC”) guidance, however, requires participating insurance companies offering separate accounts to vote shares proportionally in accordance with the instructions of the contract owners whose investments are funded by shares of each Fund or class.
The Fund’s investment objective is long-term growth of capital.
The Fund currently offers two classes of shares, Series I and Series II, both of which are offered to insurance company separate accounts funding variable annuity contracts and variable life insurance policies (“variable products”).
The Fund is an investment company and accordingly follows the investment company accounting and reporting guidance in accordance with Financial Accounting Standards Board Accounting Standards Codification Topic 946,Financial Services – Investment Companies.
The following is a summary of the significant accounting policies followed by the Fund in the preparation of its financial statements.
A. Security Valuations– Securities, including restricted securities, are valued according to the following policy.
A security listed or traded on an exchange (except convertible securities) is valued at its last sales price or official closing price as of the close of the customary trading session on the exchange where the security is principally traded, or lacking any sales or official closing price on a particular day, the security may be valued at the closing bid price on that day. Securities traded in theover-the-counter market are valued based on prices furnished by independent pricing services or market makers. When such securities are valued by an independent pricing service they may be considered fair valued. Futures contracts are valued at the final settlement price set by an exchange on which they are principally traded. Listed options are valued at the mean between the last bid and asked prices from the exchange on which they are principally traded. Options not listed on an exchange are valued by an independent source at the mean between the last bid and asked prices. For purposes of determining net asset value (“NAV”) per share, futures and option contracts generally are valued 15 minutes after the close of the customary trading session of the New York Stock Exchange (“NYSE”).
Investments inopen-end andclosed-end registered investment companies that do not trade on an exchange are valued at theend-of-day net asset value per share. Investments inopen-end andclosed-end registered investment companies that trade on an exchange are valued at the last sales price or official closing price as of the close of the customary trading session on the exchange where the security is principally traded.
Debt obligations (including convertible securities) and unlisted equities are fair valued using an evaluated quote provided by an independent pricing service. Evaluated quotes provided by the pricing service may be determined without exclusive reliance on quoted prices, and may reflect appropriate factors such asinstitution-size trading in similar groups of securities, developments related to specific securities, dividend rate (for unlisted equities), yield (for debt obligations), quality, type of issue, coupon rate (for debt obligations), maturity (for debt obligations), individual trading characteristics and other market data. Pricing services generally value debt obligations assuming orderly transactions of institutional round lot size, but a fund may hold or transact in the same securities in smaller, odd lot sizes. Odd lots often trade at lower prices than institutional round lots. Debt obligations are subject to interest rate and credit risks. In addition, all debt obligations involve some risk of default with respect to interest and/or principal payments.
Foreign securities’ (including foreign exchange contracts) prices are converted into U.S. dollar amounts using the applicable exchange rates as of the close of the NYSE. If market quotations are available and reliable for foreign exchange-traded equity securities, the securities will be valued at the market quotations. Because trading hours for certain foreign securities end before the close of the NYSE, closing market quotations may become unreliable. If between the time trading ends on a particular security and the close of the customary trading session on the NYSE, events occur that the investment adviser determines are significant and make the closing price unreliable, the Fund may fair value the security. If the event is likely to have affected the closing price of the security, the security will be valued at fair value in good faith using procedures approved by the Board of Trustees. Adjustments to closing prices to reflect fair value may also be based on a screening process of an independent pricing service to indicate the degree of certainty, based on historical data, that the closing price in the principal market where a foreign security trades is not the current value as of the close of the NYSE. Foreign securities’ prices meeting the approved degree of certainty that the price is not reflective of current value will be priced at the indication of fair value from the independent pricing service. Multiple factors may be considered by the independent pricing service in determining adjustments to reflect fair value and may include information relating to sector indices, American Depositary Receipts and domestic and foreign index futures. Foreign securities may have additional risks including exchange rate changes, potential for sharply devalued currencies and high inflation, political and economic upheaval, the relative lack of issuer information, relatively low market liquidity and the potential lack of strict financial and accounting controls and standards.
Securities for which market prices are not provided by any of the above methods may be valued based upon quotes furnished by independent sources. The last bid price may be used to value equity securities. The mean between the last bid and asked prices is used to value debt obligations, including corporate loans.
Securities for which market quotations are not readily available or became unreliable are valued at fair value as determined in good faith by or under the supervision of the Trust’s officers following procedures approved by the Board of Trustees. Issuer specific events, market trends, bid/asked quotes of brokers and information providers and other market data may be reviewed in the course of making a good faith determination of a security’s fair value.
The Fund may invest in securities that are subject to interest rate risk, meaning the risk that the prices will generally fall as interest rates rise and, conversely, the prices will generally rise as interest rates fall. Specific securities differ in their sensitivity to changes in interest rates depending on their individual characteristics. Changes in interest rates may result in increased market volatility, which may affect the value and/or liquidity of certain Fund investments.
Invesco V.I. Technology Fund
Valuations change in response to many factors including the historical and prospective earnings of the issuer, the value of the issuer’s assets, general economic conditions, interest rates, investor perceptions and market liquidity. Because of the inherent uncertainties of valuation, the values reflected in the financial statements may materially differ from the value received upon actual sale of those investments.
| B. | Securities Transactions and Investment Income– Securities transactions are accounted for on a trade date basis. Realized gains or losses on sales are computed on the basis of specific identification of the securities sold. Interest income (net of withholding tax, if any) is recorded on the accrual basis from settlement date. Dividend income (net of withholding tax, if any) is recorded on theex-dividend date. |
The Fund may periodically participate in litigation related to Fund investments. As such, the Fund may receive proceeds from litigation settlements. Any proceeds received are included in the Statement of Operations as realized gain (loss) for investments no longer held and as unrealized gain (loss) for investments still held.
Brokerage commissions and mark ups are considered transaction costs and are recorded as an increase to the cost basis of securities purchased and/or a reduction of proceeds on a sale of securities. Such transaction costs are included in the determination of net realized and unrealized gain (loss) from investment securities reported in the Statement of Operations and the Statement of Changes in Net Assets and the net realized and unrealized gains (losses) on securities per share in the Financial Highlights. Transaction costs are included in the calculation of the Fund’s net asset value and, accordingly, they reduce the Fund’s total returns. These transaction costs are not considered operating expenses and are not reflected in net investment income reported in the Statement of Operations and the Statement of Changes in Net Assets, or the net investment income per share and the ratios of expenses and net investment income reported in the Financial Highlights, nor are they limited by any expense limitation arrangements between the Fund and the investment adviser.
The Fund allocates income and realized and unrealized capital gains and losses to a class based on the relative net assets of each class.
| C. | Country Determination– For the purposes of making investment selection decisions and presentation in the Schedule of Investments, the investment adviser may determine the country in which an issuer is located and/or credit risk exposure based on various factors. These factors include the laws of the country under which the issuer is organized, where the issuer maintains a principal office, the country in which the issuer derives 50% or more of its total revenues and the country that has the primary market for the issuer’s securities, as well as other criteria. Among the other criteria that may be evaluated for making this determination are the country in which the issuer maintains 50% or more of its assets, the type of security, financial guarantees and enhancements, the nature of the collateral and the sponsor organization. Country of issuer and/or credit risk exposure has been determined to be the United States of America, unless otherwise noted. |
| D. | Distributions– Distributions from net investment income and net realized capital gain, if any, are generally declared and paid to separate accounts of participating insurance companies annually and recorded on theex-dividend date. |
| E. | Federal Income Taxes –The Fund intends to comply with the requirements of Subchapter M of the Internal Revenue Code of 1986, as amended (the “Internal Revenue Code”), necessary to qualify as a regulated investment company and to distribute substantially all of the Fund’s taxable earnings to shareholders. As such, the Fund will not be subject to federal income taxes on otherwise taxable income (including net realized capital gain) that is distributed to shareholders. Therefore, no provision for federal income taxes is recorded in the financial statements. |
The Fund recognizes the tax benefits of uncertain tax positions only when the position is more likely than not to be sustained. Management has analyzed the Fund’s uncertain tax positions and concluded that no liability for unrecognized tax benefits should be recorded related to uncertain tax positions. Management is not aware of any tax positions for which it is reasonably possible that the total amounts of unrecognized tax benefits will change materially in the next 12 months.
The Fund files tax returns in the U.S. Federal jurisdiction and certain other jurisdictions. Generally, the Fund is subject to examinations by such taxing authorities for up to three years after the filing of the return for the tax period.
| F. | Expenses– Fees provided for under the Rule12b-1 plan of a particular class of the Fund and which are directly attributable to that class are charged to the operations of such class. All other expenses are allocated among the classes based on relative net assets. |
| G. | Accounting Estimates –The preparation of financial statements in conformity with accounting principles generally accepted in the United States of America (“GAAP”) requires management to make estimates and assumptions that affect the reported amounts of assets and liabilities at the date of the financial statements and the reported amounts of revenues and expenses during the reporting period including estimates and assumptions related to taxation. Actual results could differ from those estimates by a significant amount. In addition, the Fund monitors for material events or transactions that may occur or become known after theperiod-end date and before the date the financial statements are released to print. |
| H. | Indemnifications– Under the Trust’s organizational documents, each Trustee, officer, employee or other agent of the Trust is indemnified against certain liabilities that may arise out of the performance of their duties to the Fund. Additionally, in the normal course of business, the Fund enters into contracts, including the Fund’s servicing agreements, that contain a variety of indemnification clauses. The Fund’s maximum exposure under these arrangements is unknown as this would involve future claims that may be made against the Fund that have not yet occurred. The risk of material loss as a result of such indemnification claims is considered remote. |
| I. | Securities Lending– The Fund may lend portfolio securities having a market value up toone-third of the Fund’s total assets. Such loans are secured by collateral equal to no less than the market value of the loaned securities determined daily by the securities lending provider. Such collateral will be cash or debt securities issued or guaranteed by the U.S. Government or any of its sponsored agencies. Cash collateral received in connection with these loans is invested in short-term money market instruments or affiliated money market funds and is shown as such on the Schedule of Investments. The Fund bears the risk of loss with respect to the investment of collateral. It is the Fund’s policy to obtain additional collateral from or return excess collateral to the borrower by the end of the next business day, following the valuation date of the securities loaned. Therefore, the value of the collateral held may be temporarily less than the value of the securities on loan. When loaning securities, the Fund retains certain benefits of owning the securities, including the economic equivalent of dividends or interest generated by the security.Lending securities entails a risk of loss to the Fund if, and to the extent that, the market value of the securities loaned were to increase and the borrower did not increase the collateral accordingly, and the borrower failed to return the securities. The securities loaned are subject to termination at the option of the borrower or the Fund. Upon termination, the borrower will return to the Fund the securities loaned and the Fund will return the collateral. Upon the failure of the borrower to return the securities, collateral may be liquidated and the securities may be purchased on the open market to replace the loaned securities. The Fund could experience delays and costs in gaining access to the collateral and the securities may lose value during the delay which could result in potential losses to the Fund. Some of these losses may be indemnified by the lending agent. The Fund bears the risk of any deficiency in the amount of the collateral available for return to the borrower due to any loss on the |
Invesco V.I. Technology Fund
| | collateral invested. Dividends received on cash collateral investments for securities lending transactions, which are net of compensation to counterparties, are included inDividends from affiliated money market funds on the Statement of Operations. The aggregate value of securities out on loan, if any, is shown as a footnote on the Statement of Assets and Liabilities. |
| J. | Foreign Currency Translations– Foreign currency is valued at the close of the NYSE based on quotations posted by banks and major currency dealers. Portfolio securities and other assets and liabilities denominated in foreign currencies are translated into U.S. dollar amounts at the date of valuation. Purchases and sales of portfolio securities (net of foreign taxes withheld on disposition) and income items denominated in foreign currencies are translated into U.S. dollar amounts on the respective dates of such transactions. The Fund does not separately account for the portion of the results of operations resulting from changes in foreign exchange rates on investments and the fluctuations arising from changes in market prices of securities held. The combined results of changes in foreign exchange rates and the fluctuation of market prices on investments (net of estimated foreign tax withholding) are included with the net realized and unrealized gain or loss from investments in the Statement of Operations. Reported net realized foreign currency gains or losses arise from (1) sales of foreign currencies, (2) currency gains or losses realized between the trade and settlement dates on securities transactions, and (3) the difference between the amounts of dividends, interest, and foreign withholding taxes recorded on the Fund’s books and the U.S. dollar equivalent of the amounts actually received or paid. Net unrealized foreign currency gains and losses arise from changes in the fair values of assets and liabilities, other than investments in securities at fiscal period end, resulting from changes in exchange rates. |
The Fund may invest in foreign securities, which may be subject to foreign taxes on income, gains on investments or currency repatriation, a portion of which may be recoverable. Foreign taxes, if any, are recorded based on the tax regulations and rates that exist in the foreign markets in which the Fund invests and are shown in the Statement of Operations.
| K. | Forward Foreign Currency Contracts– The Fund may engage in foreign currency transactions either on a spot (i.e. for prompt delivery and settlement) basis, or through forward foreign currency contracts, to manage or minimize currency or exchange rate risk. |
The Fund may also enter into forward foreign currency contracts for the purchase or sale of a security denominated in a foreign currency in order to “lock in” the U.S. dollar price of that security, or the Fund may also enter into forward foreign currency contracts that do not provide for physical settlement of the two currencies, but instead are settled by a single cash payment calculated as the difference between the agreed upon exchange rate and the spot rate at settlement based upon an agreed upon notional amount(non-deliverable forwards). The Fund will set aside liquid assets in an amount equal to the dailymark-to-market obligation for forward foreign currency contracts.
A forward foreign currency contract is an obligation between two parties (“Counterparties”) to purchase or sell a specific currency for an agreed-upon price at a future date. The use of forward foreign currency contracts does not eliminate fluctuations in the price of the underlying securities the Fund owns or intends to acquire but establishes a rate of exchange in advance. Fluctuations in the value of these contracts are measured by the difference in the contract date and reporting date exchange rates and are recorded as unrealized appreciation (depreciation) until the contracts are closed. When the contracts are closed, realized gains (losses) are recorded. Realized and unrealized gains (losses) on the contracts are included in the Statement of Operations. The primary risks associated with forward foreign currency contracts include failure of the Counterparty to meet the terms of the contract and the value of the foreign currency changing unfavorably. These risks may be in excess of the amounts reflected in the Statement of Assets and Liabilities.
| L. | Other Risks– The Fund’s investments are concentrated in a comparatively narrow segment of the economy, which may make the Fund more volatile. |
Many products and services offered in technology-related industries are subject to rapid obsolescence, which may lower the value of the issuers in this sector.
NOTE 2–Advisory Fees and Other Fees Paid to Affiliates
The Trust has entered into a master investment advisory agreement with Invesco Advisers, Inc. (the “Adviser” or “Invesco”). Under the terms of the investment advisory agreement, the Fund accrues daily and pays monthly an advisory fee to the Adviser based on the annual rate of the Fund’s average daily net assets as follows:
| | |
| Average Daily Net Assets | | Rate |
|
First $250 million | | 0.750% |
|
Next $250 million | | 0.740% |
|
Next $500 million | | 0.730% |
|
Next $1.5 billion | | 0.720% |
|
Next $2.5 billion | | 0.710% |
|
Next $2.5 billion | | 0.700% |
|
Next $2.5 billion | | 0.690% |
|
Over $10 billion | | 0.680% |
|
For the year ended December 31, 2019, the effective advisory fee rate incurred by the Fund was 0.75%.
Under the terms of a mastersub-advisory agreement between the Adviser and each of Invesco Asset Management Deutschland GmbH, Invesco Asset Management Limited, Invesco Asset Management (Japan) Limited, Invesco Hong Kong Limited, Invesco Senior Secured Management, Inc. and Invesco Canada Ltd. and separatesub-advisory agreements with Invesco Capital Management LLC and Invesco Asset Management (India) Private Limited (collectively, the “AffiliatedSub-Advisers”) the Adviser, not the Fund, will pay 40% of the fees paid to the Adviser to any such AffiliatedSub-Adviser(s) that provide(s) discretionary investment management services to the Fund based on the percentage of assets allocated to such AffiliatedSub-Adviser(s).
The Adviser has contractually agreed, through at least June 30, 2020, to waive advisory fees and/or reimburse expenses of all shares to the extent necessary to limit total annual fund operating expenses after fee waiver and/or expense reimbursement (excluding certain items discussed below) of Series I shares to 2.00% and Series II shares to 2.25% of average daily net assets (the “expense limits”). In determining the Adviser’s obligation to waive advisory fees and/or reimburse expenses, the following expenses are not taken into account, and could cause the total annual fund
Invesco V.I. Technology Fund
operating expenses after fee waiver and/or expense reimbursement to exceed the numbers reflected above: (1) interest; (2) taxes; (3) dividend expense on short sales; (4) extraordinary ornon-routine items, including litigation expenses; and (5) expenses that the Fund has incurred but did not actually pay because of an expense offset arrangement. Unless Invesco continues the fee waiver agreement, it will terminate on June 30, 2020. During its term, the fee waiver agreement cannot be terminated or amended to increase the expense limits or reduce the advisory fee waiver without approval of the Board of Trustees. The Adviser did not waive fees and/or reimburse expenses during the period under these expense limits.
Further, the Adviser has contractually agreed, through at least June 30, 2021, to waive the advisory fee payable by the Fund in an amount equal to 100% of the net advisory fees the Adviser receives from the affiliated money market funds on investments by the Fund of uninvested cash (excluding investments of cash collateral from securities lending) in such affiliated money market funds.
For the year ended December 31, 2019, the Adviser waived advisory fees of $1,657.
The Trust has entered into a master administrative services agreement with Invesco pursuant to which the Fund has agreed to pay Invesco a fee for costs incurred in providing accounting services and fund administrative services to the Fund and to reimburse Invesco for fees paid to insurance companies that have agreed to provide certain administrative services to the Fund. These administrative services provided by the insurance companies may include, among other things: maintenance of master accounts with the Fund; tracking, recording and transmitting net purchase and redemption orders for Fund shares; maintaining and preserving records related to the purchase, redemption and other account activity of variable product owners; distributing copies of Fund documents such as prospectuses, proxy materials and periodic reports, to variable product owners, and responding to inquiries from variable product owners about the Fund. Pursuant to such agreement, for the year ended December 31, 2019, Invesco was paid $18,669 for accounting and fund administrative services and was reimbursed $196,534 for fees paid to insurance companies. Invesco has entered into asub-administration agreement whereby State Street Bank and Trust Company (“SSB”) serves as fund accountant and provides certain administrative services to the Fund. Pursuant to a custody agreement with the Trust on behalf of the Fund, SSB also serves as the Fund’s custodian.
The Trust has entered into a transfer agency and service agreement with Invesco Investment Services, Inc. (“IIS”) pursuant to which the Fund has agreed to pay IIS a fee for providing transfer agency and shareholder services to the Fund and reimburse IIS for certain expenses incurred by IIS in the course of providing such services. For the year ended December 31, 2019, expenses incurred under the agreement are shown in the Statement of Operations asTransfer agent fees.
The Trust has entered into a master distribution agreement with Invesco Distributors, Inc. (“IDI”) to serve as the distributor for the Fund. The Trust has adopted a plan pursuant to Rule12b-1 under the 1940 Act with respect to the Fund’s Series II shares (the “Plan”). The Fund, pursuant to the Plan, pays IDI compensation at the annual rate of 0.25% of the Fund’s average daily net assets of Series II shares. The fees are accrued daily and paid monthly. Of the Plan payments, up to 0.25% of the average daily net assets of the Series II shares may be paid to insurance companies who furnish continuing personal shareholder services to customers who purchase and own Series II shares of the Fund. For the year ended December 31, 2019, expenses incurred under the Plan are detailed in the Statement of Operations asDistribution fees.
For the year ended December 31, 2019, the Fund incurred $882 in brokerage commissions with Invesco Capital Markets, Inc., an affiliate of the Adviser and IDI, for portfolio transactions executed on behalf of the Fund.
Certain officers and trustees of the Trust are officers and directors of the Adviser, IIS and/or IDI.
NOTE 3–Additional Valuation Information
GAAP defines fair value as the price that would be received to sell an asset or paid to transfer a liability in an orderly transaction between market participants at the measurement date, under current market conditions. GAAP establishes a hierarchy that prioritizes the inputs to valuation methods, giving the highest priority to readily available unadjusted quoted prices in an active market for identical assets (Level 1) and the lowest priority to significant unobservable inputs (Level 3), generally when market prices are not readily available or are unreliable. Based on the valuation inputs, the securities or other investments are tiered into one of three levels. Changes in valuation methods may result in transfers in or out of an investment’s assigned level:
| | Level 1 – | Prices are determined using quoted prices in an active market for identical assets. |
| | Level 2 – | Prices are determined using other significant observable inputs. Observable inputs are inputs that other market participants may use in pricing a security. These may include quoted prices for similar securities, interest rates, prepayment speeds, credit risk, yield curves, loss severities, default rates, discount rates, volatilities and others. |
| | Level 3 – | Prices are determined using significant unobservable inputs. In situations where quoted prices or observable inputs are unavailable (for example, when there is little or no market activity for an investment at the end of the period), unobservable inputs may be used.Unobservable inputs reflect the Fund’s own assumptions about the factors market participants would use in determining fair value of the securities or instruments and would be based on the best available information. |
The following is a summary of the tiered valuation input levels, as of December 31, 2019. The level assigned to the securities valuations may not be an indication of the risk or liquidity associated with investing in those securities. Because of the inherent uncertainties of valuation, the values reflected in the financial statements may materially differ from the value received upon actual sale of those investments.
| | | | | | | | | | | | | | | | |
| | | Level 1 | | | Level 2 | | | Level 3 | | | Total | |
| |
Investments in Securities | | | | | | | | | | | | | | | | |
| |
Common Stocks & Other Equity Interests | | $ | 130,264,572 | | | $ | 7,014,384 | | | | $– | | | $ | 137,278,956 | |
| |
Money Market Funds | | | 1,725,233 | | | | – | | | | – | | | | 1,725,233 | |
| |
Total Investments | | $ | 131,989,805 | | | $ | 7,014,384 | | | $ | – | | | $ | 139,004,189 | |
| |
NOTE 4–Security Transactions with Affiliated Funds
The Fund is permitted to purchase or sell securities from or to certain other Invesco Funds under specified conditions outlined in procedures adopted by the Board of Trustees of the Trust. The procedures have been designed to ensure that any purchase or sale of securities by the Fund from or to another fund or portfolio that is or could be considered an affiliate by virtue of having a common investment adviser (or affiliated investment advisers), common Trustees and/or common officers complies with Rule17a-7 of the 1940 Act. Further, as defined under the procedures, each
Invesco V.I. Technology Fund
transaction is effected at the current market price. Pursuant to these procedures, for the year ended December 31, 2019, the Fund engaged in securities purchases of $0 and securities sales of $318,708, which resulted in net realized gains of $188,543.
NOTE 5–Trustees’ and Officers’ Fees and Benefits
Trustees’ and Officers’Fees and Benefits include amounts accrued by the Fund to pay remuneration to certain Trustees and Officers of the Fund. Trustees have the option to defer compensation payable by the Fund, andTrustees’ and Officers’Fees and Benefits also include amounts accrued by the Fund to fund such deferred compensation amounts. Those Trustees who defer compensation have the option to select various Invesco Funds in which their deferral accounts shall be deemed to be invested. Finally, certain current Trustees were eligible to participate in a retirement plan that provided for benefits to be paid upon retirement to Trustees over a period of time based on the number of years of service. The Fund may have certain former Trustees who also participate in a retirement plan and receive benefits under such plan.Trustees’ and Officers’Fees and Benefits include amounts accrued by the Fund to fund such retirement benefits. Obligations under the deferred compensation and retirement plans represent unsecured claims against the general assets of the Fund.
NOTE 6–Cash Balances
The Fund is permitted to temporarily carry a negative or overdrawn balance in its account with SSB, the custodian bank. Such balances, if any atperiod-end, are shown in the Statement of Assets and Liabilities under the payable caption Amount due custodian. To compensate the custodian bank for such overdrafts, the overdrawn Fund may either (1) leave funds as a compensating balance in the account so the custodian bank can be compensated by earning the additional interest; or (2) compensate by paying the custodian bank at a rate agreed upon by the custodian bank and Invesco, not to exceed the contractually agreed upon rate.
NOTE 7–Distributions to Shareholders and Tax Components of Net Assets
Tax Character of Distributions to Shareholders Paid During the Fiscal Years Ended December 31, 2019 and 2018:
| | | | | | | | |
| | | 2019 | | | 2018 | |
| |
Ordinary income | | $ | – | | | $ | 1,229,123 | |
| |
Long-term capital gain | | | 11,055,027 | | | | 4,893,249 | |
| |
Total distributions | | $ | 11,055,027 | | | $ | 6,122,372 | |
| |
Tax Components of Net Assets atPeriod-End:
| | | | |
| | | 2019 | |
| |
Undistributed ordinary income | | $ | 1,042,665 | |
| |
Undistributed long-term capital gain | | | 13,547,179 | |
| |
Net unrealized appreciation – investments | | | 68,635,759 | |
| |
Net unrealized appreciation (depreciation) - foreign currencies | | | (4 | ) |
| |
Temporary book/tax differences | | | (58,702 | ) |
| |
Shares of beneficial interest | | | 54,325,192 | |
| |
Total net assets | | $ | 137,492,089 | |
| |
The difference between book-basis andtax-basis unrealized appreciation (depreciation) is due to differences in the timing of recognition of gains and losses on investments for tax and book purposes. The Fund’s net unrealized appreciation difference is attributable primarily to wash sales.
The temporary book/tax differences are a result of timing differences between book and tax recognition of income and/or expenses. The Fund’s temporary book/tax differences are the result of the trustee deferral of compensation and retirement plan benefits.
Capital loss carryforward is calculated and reported as of a specific date. Results of transactions and other activity after that date may affect the amount of capital loss carryforward actually available for the Fund to utilize. Capital losses generated in years beginning after December 22, 2010 can be carried forward for an unlimited period, whereas previous losses expire in eight tax years. Capital losses with an expiration period may not be used to offset capital gains until all net capital losses without an expiration date have been utilized. Capital loss carryforwards with no expiration date will retain their character as either short-term or long-term capital losses instead of as short-term capital losses as under prior law. The ability to utilize capital loss carryforwards in the future may be limited under the Internal Revenue Code and related regulations based on the results of future transactions.
The Fund does not have a capital loss carryforward as of December 31, 2019.
NOTE 8–Investment Transactions
The aggregate amount of investment securities (other than short-term securities, U.S. Treasury obligations and money market funds, if any) purchased and sold by the Fund during the year ended December 31, 2019 was $59,438,476 and $80,706,888, respectively. Cost of
Invesco V.I. Technology Fund
investments, including any derivatives, on a tax basis includes the adjustments for financial reporting purposes as of the most recently completed federal income tax reportingperiod-end.
Unrealized Appreciation (Depreciation) of Investments on a Tax Basis
| | | | |
| |
Aggregate unrealized appreciation of investments | | | $70,979,125 | |
| |
Aggregate unrealized (depreciation) of investments | | | (2,343,366) | |
| |
Net unrealized appreciation of investments | | | $68,635,759 | |
| |
|
Cost of investments for tax purposes is $70,368,430. | |
NOTE 9–Reclassification of Permanent Differences
Primarily as a result of differing book/tax treatment of net operating losses, on December 31, 2019, undistributed net investment income (loss) was increased by $508,705 and undistributed net realized gain was decreased by $508,705. This reclassification had no effect on the net assets or the distributable earnings of the Fund.
NOTE 10–Share Information
| | | | | | | | | | | | | | | | |
| | | | | | Summary of Share Activity | | | | |
| | | Year ended
December 31, 2019(a) | | | Year ended
December 31, 2018 | |
| | | Shares | | | Amount | | | Shares | | | Amount | |
Sold: | | | | | | | | | | | | | | | | |
Series I | | | 672,084 | | | $ | 16,955,731 | | | | 1,041,909 | | | $ | 26,582,108 | |
| |
Series II | | | 39,526 | | | | 966,364 | | | | 86,082 | | | | 2,113,927 | |
| |
| | | | |
Issued as reinvestment of dividends: | | | | | | | | | | | | | | | | |
Series I | | | 412,475 | | | | 10,151,000 | | | | 209,251 | | | | 5,582,826 | |
| |
Series II | | | 39,000 | | | | 904,027 | | | | 21,301 | | | | 539,546 | |
| |
| | | | |
Reacquired: | | | | | | | | | | | | | | | | |
Series I | | | (1,409,534 | ) | | | (36,186,706 | ) | | | (1,185,392 | ) | | | (29,716,798 | ) |
| |
Series II | | | (142,286 | ) | | | (3,447,027 | ) | | | (77,423 | ) | | | (1,808,709 | ) |
| |
Net increase (decrease) in share activity | | | (388,735 | ) | | $ | (10,656,611 | ) | | | 95,728 | | | $ | 3,292,900 | |
| |
| (a) | There are entities that are record owners of more than 5% of the outstanding shares of the Fund and in the aggregate own 59% of the outstanding shares of the Fund. The Fund and the Fund’s principal underwriter or adviser, are parties to participation agreements with these entities whereby these entities sell units of interest in separate accounts funding variable products that are invested in the Fund. The Fund, Invesco and/or Invesco affiliates may make payments to these entities, which are considered to be related to the Fund, for providing services to the Fund, Invesco and/or Invesco affiliates including but not limited to services such as, securities brokerage, third party record keeping and account servicing and administrative services. The Fund has no knowledge as to whether all or any portion of the shares owned of record by these entities are also owned beneficially. |
Invesco V.I. Technology Fund
Report of Independent Registered Public Accounting Firm
To the Board of Trustees of AIM Variable Insurance Funds (Invesco Variable Insurance Funds) and Shareholders of Invesco V.I. Technology Fund
Opinion on the Financial Statements
We have audited the accompanying statement of assets and liabilities, including the schedule of investments, of Invesco V.I. Technology Fund (one of the funds constituting AIM Variable Insurance Funds (Invesco Variable Insurance Funds), referred to hereafter as the “Fund”) as of December 31, 2019, the related statement of operations for the year ended December 31, 2019, the statement of changes in net assets for each of the two years in the period ended December 31, 2019, including the related notes, and the financial highlights for each of the five years in the period ended December 31, 2019 (collectively referred to as the “financial statements”). In our opinion, the financial statements present fairly, in all material respects, the financial position of the Fund as of December 31, 2019, the results of its operations for the year then ended, the changes in its net assets for each of the two years in the period ended December 31, 2019 and the financial highlights for each of the five years in the period ended December 31, 2019 in conformity with accounting principles generally accepted in the United States of America..
Basis for Opinion
These financial statements are the responsibility of the Fund’s management. Our responsibility is to express an opinion on the Fund’s financial statements based on our audits. We are a public accounting firm registered with the Public Company Accounting Oversight Board (United States) (PCAOB) and are required to be independent with respect to the Fund in accordance with the U.S. federal securities laws and the applicable rules and regulations of the Securities and Exchange Commission and the PCAOB.
We conducted our audits of these financial statements in accordance with the standards of the PCAOB. Those standards require that we plan and perform the audit to obtain reasonable assurance about whether the financial statements are free of material misstatement, whether due to error or fraud.
Our audits included performing procedures to assess the risks of material misstatement of the financial statements, whether due to error or fraud, and performing procedures that respond to those risks. Such procedures included examining, on a test basis, evidence regarding the amounts and disclosures in the financial statements. Our audits also included evaluating the accounting principles used and significant estimates made by management, as well as evaluating the overall presentation of the financial statements. Our procedures included confirmation of securities owned as of December 31, 2019 by correspondence with the custodian, transfer agent and brokers; when replies were not received from brokers, we performed other auditing procedures. We believe that our audits provide a reasonable basis for our opinion.
/s/PricewaterhouseCoopers LLP
Houston, Texas
February 18, 2020
We have served as the auditor of one or more of the investment companies in the Invesco group of investment companies since at least 1995. We have not been able to determine the specific year we began serving as auditor.
Invesco V.I. Technology Fund
Calculating your ongoing Fund expenses
Example
As a shareholder of the Fund, you incur ongoing costs, including management fees; distribution and/or service fees(12b-1); and other Fund expenses. This example is intended to help you understand your ongoing costs (in dollars) of investing in the Fund and to compare these costs with ongoing costs of investing in other mutual funds. The example is based on an investment of $1,000 invested at the beginning of the period and held for the entire period July 1, 2019 through December 31, 2019.
The actual and hypothetical expenses in the examples below do not represent the effect of any fees or other expenses assessed in connection with a variable product; if they did, the expenses shown would be higher while the ending account values shown would be lower.
Actual expenses
The table below provides information about actual account values and actual expenses. You may use the information in this table, together with the amount you invested, to estimate the expenses that you paid over the period. Simply divide your account value by $1,000 (for example, an $8,600 account value divided by $1,000 = 8.6), then multiply the result by the number in the table under the heading entitled “Actual Expenses Paid During Period” to estimate the expenses you paid on your account during this period.
Hypothetical example for comparison purposes
The table below also provides information about hypothetical account values and hypothetical expenses based on the Fund’s actual expense ratio and an assumed rate of return of 5% per year before expenses, which is not the Fund’s actual return.
The hypothetical account values and expenses may not be used to estimate the actual ending account balance or expenses you paid for the period. You may use this information to compare the ongoing costs of investing in the Fund and other funds. To do so, compare this 5% hypothetical example with the 5% hypothetical examples that appear in the shareholder reports of the other funds.
Please note that the expenses shown in the table are meant to highlight your ongoing costs. Therefore, the hypothetical information is useful in comparing ongoing costs, and will not help you determine the relative total costs of owning different funds.
| | | | | | | | | | | | |
| | | | | ACTUAL | | HYPOTHETICAL (5% annual return before
expenses) | | |
| | | Beginning Account Value (07/01/19) | | Ending Account Value (12/31/19)1 | | Expenses Paid During Period2 | | Ending Account Value (12/31/19) | | Expenses Paid During Period2 | | Annualized Expense Ratio |
Series I | | $1,000.00 | | $1,099.50 | | $5.24 | | $1,020.21 | | $5.04 | | 0.99% |
Series II | | 1,000.00 | | 1,097.90 | | 6.56 | | 1,018.95 | | 6.31 | | 1.24 |
| 1 | The actual ending account value is based on the actual total return of the Fund for the period July 1, 2019 through December 31, 2019, after actual expenses and will differ from the hypothetical ending account value which is based on the Fund’s expense ratio and a hypothetical annual return of 5% before expenses. |
| 2 | Expenses are equal to the Fund’s annualized expense ratio as indicated above multiplied by the average account value over the period, multiplied by 184/365 to reflect the most recent fiscal half year. |
Invesco V.I. Technology Fund
Tax Information
Form1099-DIV, Form1042-S and otheryear-end tax information provide shareholders with actual calendar year amounts that should be included in their tax returns. Shareholders should consult their tax advisors.
The following distribution information is being provided as required by the Internal Revenue Code or to meet a specific state’s requirement.
The Funds designate the following amounts or, if subsequently determined to be different, the maximum amount allowable for their fiscal year ended December 31, 2019:
| | | | | | |
| | | Federal and State Income Tax | |
| | Long-term Capital Gain Distribution | | $ | 11,055,027 | |
| | Corporate Dividends Received Deduction* | | | 0.00 | % |
| | U.S. Treasury Obligations* | | | 0.00 | % |
| |
| | * The above percentages are based on ordinary income dividends paid to shareholders during the Fund’s fiscal year. | |
Invesco V.I. Technology Fund
Trustees and Officers
The address of each trustee and officer is AIM Variable Insurance Funds (Invesco Variable Insurance Funds) (the “Trust”), 11 Greenway Plaza, Suite 1000, Houston, Texas 77046-1173. The trustees serve for the life of the Trust, subject to their earlier death, incapacitation, resignation, retirement or removal as more specifically provided in the Trust’s organizational documents. Each officer serves for a one year term or until their successors are elected and qualified. Column two below includes length of time served with predecessor entities, if any.
| | | | | | | | |
Name, Year of Birth and
Position(s)
Held with the Trust | | Trustee
and/or
Officer
Since | | Principal Occupation(s)
During Past 5 Years | | Number of
Funds in
Fund Complex
Overseen by
Trustee | | Other
Directorship(s)
Held by Trustee
During Past 5
Years |
| Interested Person | | | | | | | | |
Martin L. Flanagan1 – 1960
Trustee and Vice Chair | | 2007 | | Executive Director, Chief Executive Officer and President, Invesco Ltd. (ultimate parent of Invesco and a global investment management firm); Trustee and Vice Chair, The Invesco Funds; Vice Chair, Investment Company Institute; and Member of Executive Board, SMU Cox School of Business Formerly: Advisor to the Board, Invesco Advisers, Inc. (formerly known as Invesco Institutional (N.A.), Inc.); Chairman and Chief Executive Officer, Invesco Advisers, Inc. (registered investment adviser); Director, Chairman, Chief Executive Officer and President, Invesco Holding Company (US), Inc. (formerly IVZ Inc.) (holding company), Invesco Group Services, Inc. (service provider) and Invesco North American Holdings, Inc. (holding company); Director, Chief Executive Officer and President, Invesco Holding Company Limited (parent of Invesco and a global investment management firm); Director, Invesco Ltd.; Chairman, Investment Company Institute and President,Co-Chief Executive Officer,Co-President, Chief Operating Officer and Chief Financial Officer, Franklin Resources, Inc. (global investment management organization) | | 229 | | None |
| 1 | Mr. Flanagan is considered an interested person (within the meaning of Section 2(a)(19) of the 1940 Act) of the Trust because he is an officer of the Adviser to the Trust, and an officer and a director of Invesco Ltd., ultimate parent of the Adviser. |
Invesco V.I. Technology Fund
Trustees and Officers–(continued)
| | | | | | | | |
Name, Year of Birth and
Position(s)
Held with the Trust | | Trustee
and/or
Officer
Since | | Principal Occupation(s)
During Past 5 Years | | Number of
Funds
in
Fund Complex
Overseen by
Trustee | | Other
Directorship(s)
Held by Trustee
During Past 5
Years |
| Independent Trustees | | | | | | | | |
Bruce L. Crockett - 1944
Trustee and Chair | | 1993 | | Chairman, Crockett Technologies Associates (technology consulting company) Formerly: Director, Captaris (unified messaging provider); Director, President and Chief Executive Officer, COMSAT Corporation; Chairman, Board of Governors of INTELSAT (international communications company); ACE Limited (insurance company); Independent Directors Council and Investment Company Institute: Member of the Audit Committee, Investment Company Institute; Member of the Executive Committee and Chair of the Governance Committee, Independent Directors Council | | 229 | | Director and Chairman of the Audit Committee, ALPS (Attorneys Liability Protection Society) (insurance company); Director and Member of the Audit Committee and Compensation Committee, Ferroglobe PLC (metallurgical company) |
David C. Arch - 1945
Trustee | | 2010 | | Chairman of Blistex Inc. (consumer health care products manufacturer); Member, World Presidents’ Organization | | 229 | | Board member of the Illinois Manufacturers’ Association |
Beth Ann Brown - 1968
Trustee | | 2019 | | Independent Consultant Formerly: Head of Intermediary Distribution, Managing Director, Strategic Relations, Managing Director, Head of National Accounts, Senior Vice President, National Account Manager and Senior Vice President, Key Account Manager, Columbia Management Investment Advisers LLC; Vice President, Key Account Manager, Liberty Funds Distributor, Inc.; and Trustee of certain Oppenheimer Funds | | 229 | | Director, Board of Directors of Caron Engineering Inc.; Advisor, Board of Advisors of Caron Engineering Inc.; President and Director, Acton Shapleigh Youth Conservation Corps (non - profit); and Vice President and Director of Grahamtastic Connection(non-profit) |
Jack M. Fields - 1952
Trustee | | 1997 | | Chief Executive Officer, Twenty First Century Group, Inc. (government affairs company); and Chairman, Discovery Learning Alliance(non-profit) Formerly: Owner and Chief Executive Officer, Dos Angeles Ranch L.P. (cattle, hunting, corporate entertainment); Director, Insperity, Inc. (formerly known as Administaff) (human resources provider); Chief Executive Officer, Texana Timber LP (sustainable forestry company); Director of Cross Timbers Quail Research Ranch(non-profit); and member of the U.S. House of Representatives | | 229 | | None |
Invesco V.I. Technology Fund
Trustees and Officers–(continued)
| | | | | | | | |
Name, Year of Birth and
Position(s)
Held with the Trust | | Trustee
and/or
Officer
Since | | Principal Occupation(s)
During Past 5 Years | | Number of
Funds
in
Fund Complex
Overseen by
Trustee | | Other
Directorship(s) Held by Trustee
During Past 5
Years |
| Independent Trustees–(continued) | | | | |
Cynthia Hostetler – 1962
Trustee | | 2017 | | Non-Executive Director and Trustee of a number of public and private business corporations Formerly: Director, Aberdeen Investment Funds (4 portfolios); Head of Investment Funds and Private Equity, Overseas Private Investment Corporation; President, First Manhattan Bancorporation, Inc.; Attorney, Simpson Thacher & Bartlett LLP | | 229 | | Vulcan Materials Company (construction materials company); Trilinc Global Impact Fund; Genesee & Wyoming, Inc. (railroads); Artio Global Investment LLC (mutual fund complex); Edgen Group, Inc. (specialized energy and infrastructure products distributor); Investment Company Institute (professional organization); Independent Directors Council (professional organization) |
Eli Jones - 1961
Trustee | | 2016 | | Professor and Dean, Mays Business School - Texas A&M University Formerly: Professor and Dean, Walton College of Business, University of Arkansas and E.J. Ourso College of Business, Louisiana State University; Director, Arvest Bank | | 229 | | Insperity, Inc. (formerly known as Administaff) (human resources provider) |
Elizabeth Krentzman - 1959
Trustee | | 2019 | | Formerly: Principal and Chief Regulatory Advisor for Asset Management Services and U.S. Mutual Fund Leader of Deloitte & Touche LLP; General Counsel of the Investment Company Institute (trade association); National Director of the Investment Management Regulatory Consulting Practice, Principal, Director and Senior Manager of Deloitte & Touche LLP; Assistant Director of the Division of Investment Management - Office of Disclosure and Investment Adviser Regulation of the U.S. Securities and Exchange Commission and various positions with the Division of Investment Management - Office of Regulatory Policy of the U.S. Securities and Exchange Commission; Associate at Ropes & Gray LLP; Advisory Board Member of the Securities and Exchange Commission Historical Society; and Trustee of certain Oppenheimer Funds | | 229 | | Trustee of the University of Florida National Board Foundation and Audit Committee Member; Member of the Cartica Funds Board of Directors (private investment funds); Member of the University of Florida Law Center Association, Inc. Board of Trustees and Audit Committee Member |
Anthony J. LaCava, Jr. - 1956
Trustee | | 2019 | | Formerly: Director and Member of the Audit Committee, Blue Hills Bank (publicly traded financial institution) and Managing Partner, KPMG LLP | | 229 | | Blue Hills Bank; Chairman, Bentley University; Member, Business School Advisory Council; and Nominating Committee KPMG LLP |
| Prema Mathai-Davis - 1950 Trustee | | 1998 | | Retired Co-Owner & Partner of Quantalytics Research, LLC, (a FinTech Investment Research Platform for the Self-Directed Investor) | | 229 | | None |
Invesco V.I. Technology Fund
Trustees and Officers–(continued)
| | | | | | | | |
Name, Year of Birth and
Position(s)
Held with the Trust | | Trustee
and/or
Officer
Since | | Principal Occupation(s)
During Past 5 Years | | Number of
Funds
in Fund Complex
Overseen by
Trustee | | Other
Directorship(s) Held by Trustee
During Past 5
Years |
| Independent Trustees–(continued) | | | | |
Joel W. Motley - 1952
Trustee | | 2019 | | Director of Office of Finance, Federal Home Loan Bank; Member of the Vestry of Trinity Wall Street; Managing Director of Carmona Motley Inc. (privately held financial advisor); Member of the Finance and Budget Committee of the Council on Foreign Relations, Member of the Investment Committee and Board of Human Rights Watch and Member of the Investment Committee and Board of Historic Hudson Valley(non-profit cultural organization) Formerly: Managing Director of Public Capital Advisors, LLC (privately held financial advisor); Managing Director of Carmona Motley Hoffman, Inc. (privately held financial advisor); Trustee of certain Oppenheimer Funds; and Director of Columbia Equity Financial Corp. (privately held financial advisor) | | 229 | | Director of Greenwall Foundation (bioethics research foundation); Member of Board and Investment Committee of The Greenwall Foundation; Director of Southern Africa Legal Services Foundation; Board Member and Investment Committee Member of Pulizer Center for Crisis Reporting(non-profit journalism) |
Teresa M. Ressel - 1962
Trustee | | 2017 | | Non-executive director and trustee of a number of public and private business corporations Formerly: Chief Financial Officer, Olayan America, The Olayan Group (international investor/commercial/industrial); Chief Executive Officer, UBS Securities LLC; Group Chief Operating Officer, Americas, UBS AG; Assistant Secretary for Management & Budget and CFO, US Department of the Treasury | | 229 | | Atlantic Power Corporation (power generation company); ON Semiconductor Corp. (semiconductor supplier) |
Ann Barnett Stern - 1957
Trustee | | 2017 | | President and Chief Executive Officer, Houston Endowment Inc. (private philanthropic institution) Formerly: Executive Vice President and General Counsel, Texas Children’s Hospital; Attorney, Beck, Redden and Secrest, LLP; Business Law Instructor, University of St. Thomas; Attorney, Andrews & Kurth LLP | | 229 | | Federal Reserve Bank of Dallas |
Robert C. Troccoli - 1949
Trustee | | 2016 | | Retired | | 229 | | None |
Daniel S. Vandivort - 1954
Trustee | | 2019 | | Treasurer, Chairman of the Audit and Finance Committee, and Trustee, Board of Trustees, Huntington Disease Foundation of America; and President, Flyway Advisory Services LLC (consulting and property management) Formerly: Trustee and Governance Chair, of certain Oppenheimer Funds | | 229 | | Chairman and Lead Independent Director, Chairman of the Audit Committee, and Director, Board of Directors, Value Line Funds |
James D. Vaughn - 1945
Trustee | | 2019 | | Retired Formerly: Managing Partner, Deloitte & Touche LLP; Trustee and Chairman of the Audit Committee, Schroder Funds; Board Member, Mile High United Way, Boys and Girls Clubs, Boy Scouts, Colorado Business Committee for the Arts, Economic Club of Colorado and Metro Denver Network (economic development corporation); and Trustee of certain Oppenheimer Funds | | 229 | | Board member and Chairman of Audit Committee of AMG National Trust Bank; Trustee and Investment Committee member, University of South Dakota Foundation; Board member, Audit Committee Member and past Board Chair, Junior Achievement(non-profit) |
Invesco V.I. Technology Fund
Trustees and Officers–(continued)
| | | | | | | | |
Name, Year of Birth and
Position(s)
Held with the Trust | | Trustee
and/or
Officer
Since | | Principal Occupation(s)
During Past 5 Years | | Number of
Funds in Fund Complex
Overseen by
Trustee | | Other
Directorship(s) Held by Trustee
During Past 5
Years |
| Independent Trustees–(continued) | | | | |
Christopher L. WIlson - 1957
Trustee, Vice Chair and Chair Designate | | 2017 | | Retired Formerly: Director, TD Asset Management USA Inc. (mutual fund complex) (22 portfolios); Managing Partner, CT2, LLC (investing and consulting firm); President/Chief Executive Officer, Columbia Funds, Bank of America Corporation; President/Chief Executive Officer, CDC IXIS Asset Management Services, Inc.; Principal & Director of Operations, Scudder Funds, Scudder, Stevens & Clark, Inc.; Assistant Vice President, Fidelity Investments | | 229 | | ISO New England, Inc.(non-profit organization managing regional electricity market) |
Invesco V.I. Technology Fund
Trustees and Officers–(continued)
| | | | | | | | |
Name, Year of Birth and
Position(s)
Held with the Trust | | Trustee
and/or
Officer
Since | | Principal Occupation(s)
During Past 5 Years | | Number of
Funds in
Fund Complex
Overseen by
Trustee | | Other
Directorship(s)
Held by Trustee
During Past 5
Years |
| Officers | | | | | | | | |
Sheri Morris - 1964 President, Principal Executive Officer and Treasurer | | 1999 | | Head of Global Fund Services, Invesco Ltd.; President, Principal Executive Officer and Treasurer, The Invesco Funds; Vice President, Invesco Advisers, Inc. (formerly known as Invesco Institutional (N.A.), Inc.) (registered investment adviser); and Vice President, Invesco Exchange-Traded Fund Trust, Invesco Exchange-Traded Fund Trust II, Invesco India Exchange-Traded Fund Trust, Invesco Actively Managed Exchange-Traded Fund Trust, Invesco Actively Managed Exchange-Traded Commodity Fund Trust and Invesco Exchange-Traded Self-Indexed Fund Trust; and Vice President, OppenheimerFunds, Inc. Formerly: Vice President and Principal Financial Officer, The Invesco Funds; Vice President, Invesco AIM Advisers, Inc., Invesco AIM Capital Management, Inc. and Invesco AIM Private Asset Management, Inc.; Assistant Vice President and Assistant Treasurer, The Invesco Funds and Assistant Vice President, Invesco Advisers, Inc., Invesco AIM Capital Management, Inc. and Invesco AIM Private Asset Management, Inc.; and Treasurer, Invesco Exchange-Traded Fund Trust, Invesco Exchange-Traded Fund Trust II, Invesco India Exchange-Traded Fund Trust and Invesco Actively Managed Exchange-Traded Fund Trust | | N/A | | N/A |
Russell C. Burk - 1958 Senior Vice President and Senior Officer | | 2005 | | Senior Vice President and Senior Officer, The Invesco Funds | | N/A | | N/A |
Jeffrey H. Kupor - 1968 Senior Vice President, Chief Legal Officer and Secretary | | 2018 | | Head of Legal of the Americas, Invesco Ltd.; Senior Vice President and Secretary, Invesco Advisers, Inc. (formerly known as Invesco Institutional (N.A.), Inc.) (registered investment adviser); Senior Vice President and Secretary, Invesco Distributors, Inc. (formerly known as Invesco AIM Distributors, Inc.); Vice President and Secretary, Invesco Investment Services, Inc. (formerly known as Invesco AIM Investment Services, Inc.) Senior Vice President, Chief Legal Officer and Secretary, The Invesco Funds; Secretary and General Counsel, Invesco Investment Advisers LLC (formerly known as Van Kampen Asset Management); Secretary and General Counsel, Invesco Capital Markets, Inc. (formerly known as Van Kampen Funds Inc.) and Chief Legal Officer, Invesco Exchange-Traded Fund Trust, Invesco Exchange-Traded Fund Trust II, Invesco India Exchange-Traded Fund Trust, Invesco Actively Managed Exchange-Traded Fund Trust, Invesco Actively Managed Exchange-Traded Commodity Fund Trust and Invesco Exchange-Traded Self-Indexed Fund Trust; Secretary, Invesco Indexing LLC; Secretary, W.L. Ross & Co., LLC Formerly: Secretary and Vice President, Jemstep, Inc.; Head of Legal, Worldwide Institutional, Invesco Ltd.; Secretary and General Counsel, INVESCO Private Capital Investments, Inc.; Senior Vice President, Secretary and General Counsel, Invesco Management Group, Inc. (formerly known as Invesco AIM Management Group, Inc.); Assistant Secretary, INVESCO Asset Management (Bermuda) Ltd.; Secretary and General Counsel, Invesco Private Capital, Inc.; Assistant Secretary and General Counsel, INVESCO Realty, Inc.; Secretary and General Counsel, Invesco Senior Secured Management, Inc.; and Secretary, Sovereign G./P. Holdings Inc. | | N/A | | N/A |
| Andrew R. Schlossberg - 1974 Senior Vice President | | 2019 | | Head of the Americas and Senior Managing Director, Invesco Ltd.; Director and Senior Vice President, Invesco Advisers, Inc. (formerly known as Invesco Institutional (N.A.), Inc.) (registered investment adviser); Director and Chairman, Invesco Investment Services, Inc. (formerly known as Invesco AIM Investment Services, Inc.) (registered transfer agent); Senior Vice President, The Invesco Funds; Director, Invesco Investment Advisers LLC (formerly known as Van Kampen Asset Management); Director, President and Chairman, Invesco Insurance Agency, Inc. Formerly: Director, Invesco UK Limited; Director and Chief Executive, Invesco Asset Management Limited and Invesco Fund Managers Limited; Assistant Vice President, The Invesco Funds; Senior Vice President, Invesco Advisers, Inc. (formerly known as Invesco Institutional (N.A.), Inc.) (registered investment adviser); Director and Chief Executive, Invesco Administration Services Limited and Invesco Global Investment Funds Limited; Director, Invesco Distributors, Inc.; Head of EMEA, Invesco Ltd.; President, Invesco Actively Managed Exchange-Traded Commodity Fund Trust, Invesco Actively Managed Exchange-Traded Fund Trust, Invesco Exchange-Traded Fund Trust, Invesco Exchange-Traded Fund Trust II and Invesco India Exchange-Traded Fund Trust; Managing Director and Principal Executive Officer, Invesco Capital Management LLC | | N/A | | N/A |
Invesco V.I. Technology Fund
Trustees and Officers–(continued)
| | | | | | | | |
Name, Year of Birth and
Position(s)
Held with the Trust | | Trustee
and/or
Officer
Since | | Principal Occupation(s)
During Past 5 Years | | Number of
Funds in
Fund Complex
Overseen by
Trustee | | Other
Directorship(s)
Held by Trustee
During Past 5
Years |
| Officers—(continued) | | | | | | | | |
John M. Zerr – 1962
Senior Vice President | | 2006 | | Chief Operating Officer of the Americas; Senior Vice President, Invesco Advisers, Inc. (formerly known as Invesco Institutional (N.A.), Inc.) (registered investment adviser); Senior Vice President, Invesco Distributors, Inc. (formerly known as Invesco AIM Distributors, Inc.); Director and Vice President, Invesco Investment Services, Inc. (formerly known as Invesco AIM Investment Services, Inc.) Senior Vice President, The Invesco Funds; Managing Director, Invesco Capital Management LLC; Director, Invesco Investment Advisers LLC (formerly known as Van Kampen Asset Management); Senior Vice President, Invesco Capital Markets, Inc. (formerly known as Van Kampen Funds Inc.); Manager, Invesco Indexing LLC; Manager, Invesco Specialized Products, LLC; Director and Senior Vice President, Invesco Insurance Agency, Inc.; Member, Invesco Canada Funds Advisory Board; Director, President and Chief Executive Officer, Invesco Corporate Class Inc. (corporate mutual fund company); and Director, Chairman, President and Chief Executive Officer, Invesco Canada Ltd. (formerly known as Invesco Trimark Ltd./Invesco Trimark Ltèe) (registered investment adviser and registered transfer agent) Formerly: Director and Senior Vice President, Invesco Management Group, Inc. (formerly known as Invesco AIM Management Group, Inc.); Secretary and General Counsel, Invesco Management Group, Inc. (formerly known as Invesco AIM Management Group, Inc.); Secretary, Invesco Investment Services, Inc. (formerly known as Invesco AIM Investment Services, Inc.); Chief Legal Officer and Secretary, The Invesco Funds; Secretary and General Counsel, Invesco Investment Advisers LLC (formerly known as Van Kampen Asset Management); Secretary and General Counsel, Invesco Capital Markets, Inc. (formerly known as Van Kampen Funds Inc.); Chief Legal Officer, Invesco Exchange-Traded Fund Trust, Invesco Exchange-Traded Fund Trust II, Invesco India Exchange-Traded Fund Trust, Invesco Actively Managed Exchange-Traded Fund Trust, Invesco Actively Managed Exchange-Traded Commodity Fund Trust and Invesco Exchange-Traded Self-Indexed Fund Trust; Secretary, Invesco Indexing LLC; Director, Secretary, General Counsel and Senior Vice President, Van Kampen Exchange Corp.; Director, Vice President and Secretary, IVZ Distributors, Inc. (formerly known as INVESCO Distributors, Inc.); Director and Vice President, INVESCO Funds Group, Inc.; Director and Vice President, Van Kampen Advisors Inc.; Director, Vice President, Secretary and General Counsel, Van Kampen Investor Services Inc.;Director and Secretary, Invesco Distributors, Inc. (formerly known as Invesco AIM Distributors, Inc.); Director, Senior Vice President, General Counsel and Secretary, Invesco AIM Advisers, Inc. and Van Kampen Investments Inc.; Director, Vice President and Secretary, Fund Management Company; Director, Senior Vice President, Secretary, General Counsel and Vice President, Invesco AIM Capital Management, Inc.; Chief Operating Officer and General Counsel, Liberty Ridge Capital, Inc. (an investment adviser) | | N/A | | N/A |
| Gregory G. McGreevey - 1962 Senior Vice President | | 2012 | | Senior Managing Director, Invesco Ltd.; Director, Chairman, President, and Chief Executive Officer, Invesco Advisers, Inc. (formerly known as Invesco Institutional (N.A.), Inc.) (registered investment adviser); Director, Invesco Mortgage Capital, Inc. and Invesco Senior Secured Management, Inc.; and Senior Vice President, The Invesco Funds; and President, SNW Asset Management Corporation Formerly: Senior Vice President, Invesco Management Group, Inc. and Invesco Advisers, Inc.; Assistant Vice President, The Invesco Funds | | N/A | | N/A |
Kelli Gallegos - 1970 Vice President, Principal Financial Officer
and Assistant Treasurer | | 2008 | | Principal Financial and Accounting Officer – Investments Pool, Invesco Specialized Products, LLC; Vice President, Principal Financial Officer and Assistant Treasurer, The Invesco Funds; Principal Financial and Accounting Officer – Pooled Investments, Invesco Capital Management LLC; Vice President and Treasurer, Invesco Exchange-Traded Fund Trust, Invesco Exchange-Traded Fund Trust II, Invesco India Exchange-Traded Fund Trust, Invesco Actively Managed Exchange-Traded Fund Trust, Invesco Actively Managed Exchange-Traded Commodity Fund Trust and Invesco Exchange-Traded Self-Indexed Fund Trust Formerly: Assistant Treasurer, Invesco Specialized Products, LLC; Assistant Treasurer, Invesco Exchange-Traded Fund Trust, Invesco Exchange-Traded Fund Trust II, Invesco India Exchange-Traded Fund Trust, Invesco Actively Managed Exchange-Traded Fund Trust, Invesco Actively Managed Exchange-Traded Commodity Fund Trust and Invesco Exchange-Traded Self-Indexed Fund Trust; Assistant Treasurer, Invesco Capital Management LLC; Assistant Vice President, The Invesco Funds | | N/A | | N/A |
Invesco V.I. Technology Fund
Trustees and Officers–(continued)
| | | | | | | | |
Name, Year of Birth and
Position(s)
Held with the Trust | | Trustee
and/or
Officer
Since | | Principal Occupation(s)
During Past 5 Years | | Number of
Funds in
Fund Complex
Overseen by
Trustee | | Other
Directorship(s)
Held by Trustee
During Past 5
Years |
| Officers–(continued) | | | | | | | | |
Crissie M. Wisdom – 1969 Anti-Money Laundering Compliance Officer | | 2013 | | Anti-Money Laundering Compliance Officer, Invesco Advisers, Inc. (formerly known as Invesco Institutional (N.A.), Inc.) (registered investment adviser), Invesco Capital Markets, Inc. (formerly known as Van Kampen Funds Inc.), Invesco Distributors, Inc., Invesco Investment Services, Inc., The Invesco Funds, and Invesco Exchange-Traded Fund Trust, Invesco Exchange-Traded Fund Trust II, Invesco India Exchange-Traded Fund Trust, Invesco Actively Managed Exchange-Traded Fund Trust, Invesco Actively Managed Exchange-Traded Commodity Fund Trust and Invesco Exchange-Traded Self-Indexed Fund Trust; Anti-Money Laundering Compliance Officer and Bank Secrecy Act Officer, INVESCO National Trust Company and Invesco Trust Company; and Fraud Prevention Manager and Controls and Risk Analysis Manager for Invesco Investment Services, Inc. Formerly: Anti-Money Laundering Compliance Officer, Van Kampen Exchange Corp. and Invesco Management Group, Inc. | | N/A | | N/A |
Robert R. Leveille – 1969 Chief Compliance Officer | | 2016 | | Chief Compliance Officer, Invesco Advisers, Inc. (registered investment adviser); and Chief Compliance Officer, The Invesco Funds Formerly: Chief Compliance Officer, Putnam Investments and the Putnam Funds | | N/A | | N/A |
The Statement of Additional Information of the Trust includes additional information about the Fund’s Trustees and is available upon request, without charge, by calling 1.800.959.4246. Please refer to the Fund’s Statement of Additional Information for information on the Fund’ssub-advisers.
| | | | | | |
Office of the Fund 11 Greenway Plaza, Suite 1000 Houston, TX 77046-1173 | | Investment Adviser Invesco Advisers, Inc. 1555 Peachtree Street, N.E. Atlanta, GA 30309 | | Distributor Invesco Distributors, Inc. 11 Greenway Plaza, Suite 1000 Houston, TX 77046-1173 | | Auditors PricewaterhouseCoopers LLP 1000 Louisiana Street, Suite 5800 Houston, TX 77002-5678 |
| | | |
Counsel to the Fund Stradley Ronon Stevens & Young, LLP 2005 Market Street, Suite 2600 Philadelphia, PA 19103-7018 | | Counsel to the Independent Trustees Goodwin Procter LLP 901 New York Avenue, N.W. Washington, D.C. 20001 | | Transfer Agent Invesco Investment Services, Inc. 11 Greenway Plaza, Suite 1000 Houston, TX 77046-1173 | | Custodian State Street Bank and Trust Company 225 Franklin Street Boston, MA 02110-2801 |
Invesco V.I. Technology Fund
| | | | |
 | | Annual Report to Shareholders | | December 31, 2019 |
| | Invesco V.I. Value Opportunities Fund |
| | |
| | |

Beginning on January 1, 2021, as permitted by regulations adopted by the Securities and Exchange Commission, the insurance company that offers your variable annuity or variable life insurance contract may no longer send you paper copies of the Fund’s shareholder reports by mail, unless you specifically request paper copies of the reports from the insurance company or your financial intermediary. Instead of delivering paper copies of the report, the insurance company may choose to make the reports available on a website, and will notify you by mail each time a report is posted and provide you with a website link to access the report. Instructions for requesting paper copies will be provided by your insurance company.
If the insurance company offers electronic delivery, you may elect to receive shareholder reports and other communications about the Fund electronically by following the instructions provided by the insurance company or by contacting your financial intermediary. If you already elected to receive shareholder reports electronically, you will not be affected by this change and you need not take any action.
You may elect to receive all future reports in paper free of charge from the insurance company. You can inform the insurance company or your financial intermediary that you wish to continue receiving paper copies of your shareholder reports by following the instructions provided by the insurance company or by contacting your financial intermediary. Your election to receive reports in paper will apply to all portfolio companies available under your contract with the insurance company.
The Fund provides a complete list of its holdings four times in each fiscal year, at the quarter-ends. For the second and fourth quarters, the lists appear in the Fund’s semiannual and annual reports to shareholders. For the first and third quarters, the Fund files the lists with the Securities and Exchange Commission (SEC) as an exhibit to its reports on FormN-PORT. The Fund’s FormN-PORT filings are available on the SEC website, sec.gov. The SEC file numbers for the Fund are811-07452 and033-57340. The Fund’s most recent portfolio holdings, as filed on FormN-PORT, have also been made available to insurance companies issuing variable annuity contracts and variable life insurance policies (“variable products”) that invest in the Fund.
A description of the policies and procedures that the Fund uses to determine how to vote proxies relating to portfolio securities is available without charge, upon request, from our Client Services department at 800 959 4246 or at invesco.com/proxyguidelines. The information is also available on the SEC website, sec.gov.
Information regarding how the Fund voted proxies related to its portfolio securities during the most recent12-month period ended June 30 is available at invesco.com/proxysearch. The information is also available on the SEC website, sec.gov.
Invesco Advisers, Inc. is an investment adviser; it provides investment advisory services to individual and institutional clients and does not sell securities. Invesco Distributors, Inc. is the US distributor for Invesco Ltd.’s retail mutual funds, exchange-traded funds and institutional money market funds. Both are wholly owned, indirect subsidiaries of Invesco Ltd.
This report must be accompanied or preceded by a currently effective Fund prospectus and variable product prospectus, which contain more complete information, including sales charges and expenses. Investors should read each carefully before investing.
NOT FDIC INSURED | MAY LOSE VALUE | NO BANK GUARANTEE
| | |
| Invesco Distributors, Inc. | | VK-VIVOPP-AR-1 |
Management’s Discussion of Fund Performance
| | | | |
Performance summary For the year ended December 31, 2019, Series I shares of Invesco V.I. Value Opportunities Fund (the Fund) underperformed the S&P 1500 Value Index, the Fund’s style-specific benchmark. Your Fund’s long-term performance appears later in this report. | |
Fund vs. Indexes Total returns, 12/31/18 to 12/31/19, excluding variable product issuer charges. If variable product issuer charges were included, returns would be lower. | |
Series I Shares | | | 30.61% | |
Series II Shares | | | 30.12 | |
S&P 500 Indexq(Broad Market Index) | | | 31.49 | |
S&P 1500 Value Indexq(Style-Specific Index) | | | 31.31 | |
Lipper VUFMulti-Cap Value Funds Index∎(Peer Group Index) | | | 26.30 | |
|
Source(s):qRIMES Technologies Corp.;∎Lipper Inc. | |
Market conditions and your Fund
Equity markets rallied in the first quarter of 2019, fueled by optimism about a potentialUS-China trade deal and indication that the US Federal Reserve (the Fed) would not raise interest rates in 2019, a surprising shift in monetary policy. The Fed’s more accommodative stance provided a supportive environment for equities and fixed income, even as US economic data were mixed and overseas growth appeared to be slowing. Against this backdrop, the S&P 500 Index posted its best first quarter returns since 1998.
Although the S&P 500 Index posted modest gains for the second quarter of 2019, the US stock market experienced increased volatility. After four consecutive months of rising stock markets, the market sold off in May 2019, along with bond yields and oil prices, as investors weighed the impact of the lingering trade war between the US and China, as well as potential tariffs imposed on Mexico. In addition, economic data showed a slowing domestic and global economy.
Key issues that concerned investors in the second quarter of 2019 carried over into the third quarter. TheUS-China trade conflict worried investors and
stifled business investment, even as the Fed cut interest rates by 0.25% in July and again in September 2019.1 This environment, combined with evidence of slowing global economic growth, fueled market volatility in August 2019. The US Treasury yield curve inverted several times, increasing fears of a possible US recession. As a result, August saw increased risk aversion, with investors crowding into asset classes perceived as safe havens, such as US Treasuries and gold. However, the Fed’s accommodative tone provided some support for risk assets.
Macroeconomic issues that concerned investors in the third quarter of 2019 mostly abated during the fourth quarter, providing the backdrop for strong equity market returns. Risk assets surged higher as a result of a delay in the Brexit agreement until January 2020, optimism that phase one of aUS-China trade deal would be completed and better-than-expected third-quarter corporate earnings results. The US economy rose higher than expected, at 2.1% during the third quarter of 2019.2 During its October meeting, the Fed cut interest rates again by 0.25% based on business investment and exports remaining weak.1 All sectors
within the S&P 500 Index posted double-digit gains with information technology performing the best and energy performing the worst.
During the year, we continued implementing our intrinsic value strategy, seeking to create wealth by maintaining a long-term investment horizon and investing in companies selling at a significant discount to our estimate of their intrinsic value. We believe intrinsic value represents the fair economic worth of a business. Since our application of this strategy is highly disciplined and relatively unique, it is important to understand the benefits and limitations of our process. First, the investment strategy is intended to preserve capital while growing it at above market rates over the long term. Second, the investments generally have little in common with popular stock market indexes and most of our peers. And third, the Fund’s short-term relative performance will naturally be different from stock market indexes and peers and have little information value since we typically structure the portfolio significantly differently than these benchmarks.
During the year, drivers of Fund performance were mainly stock-specific.Crown Holdingswas the largest contributor to Fund performance. The company is one of the world’s largest producers of metal packaging. Shares of Crown Holdings rose as tighter capacity utilization in North America drove pricing improvements in the core packaging business. We sold some of our position in the company during the year, as the stock price appreciated. Engineering and construction companyAECOMwas also a large contributor to Fund performance. The company is one of the largest global providers of design, construction and management services for end markets, such as water, transportation and energy. Shares of AECOM rose after management reported strong financial results
| | | | |
Portfolio Composition | | | | |
| By sector | | % of total net assets | |
| | | | |
| |
Industrials | | | 23.45 | % |
Financials | | | 18.95 | |
Consumer Discretionary | | | 11.67 | |
Health Care | | | 11.39 | |
Materials | | | 11.17 | |
Energy | | | 10.81 | |
Information Technology | | | 6.59 | |
Consumer Staples | | | 3.77 | |
Communication Services | | | 0.20 | |
Money Market Funds Plus Other Assets Less Liabilities | | | 2.00 | |
| | | | |
Top 10 Equity Holdings* | | | | |
% of total net assets | |
| | | | |
| |
1. Owens Corning | | | 4.65 | % |
2. AECOM | | | 4.26 | |
3. LKQ Corp. | | | 4.09 | |
4. Masco Corp. | | | 4.01 | |
5. MGIC Investment Corp. | | | 3.81 | |
6. Spectrum Brands Holdings, Inc. | | | 3.77 | |
7. Citigroup, Inc. | | | 3.59 | |
8. Flex Ltd. | | | 3.53 | |
9. Sealed Air Corp. | | | 3.45 | |
10. Oracle Corp. | | | 3.06 | |
| | | | |
Total Net Assets | | $ | 91.4 million | |
Total Number of Holdings* | | | 43 | |
The Fund’s holdings are subject to change, and there is no assurance that the Fund will continue to hold any particular security.
*Excluding money market fund holdings, if any.
Data presented here are as of December 31, 2019.
Invesco V.I. Value Opportunities Fund
and announced the intent to spinoff the company’s government services segment, citing the market’s failure to appreciate the value of this business.
Specialty chemicals companyChemourswas the largest detractor from the Fund’s performance during the year. The company was negatively affected by investor concern surrounding possible legal and environmental liabilities. We believe the stock’s decline was an overreaction and we added to the Fund’s position at lower prices during the year. Engineering and construction companyFluor was also a large detractor from Fund performance. Fluor is one of the largest global providers of engineering, procurement, construction, fabrication, operations and maintenance services for markets such as, oil and gas, chemicals, mining and metals. Shares of the company fell after management announced larger-than-expected project costs following the replacement of its chief executive officer in the second quarter and reported disappointing financial results for the third quarter.
For some time, we have found very limited investment opportunities in the yield-oriented sectors of utilities and real estate investment trusts, given their unattractive valuations. Our underweight exposure to these sectors helped the Fund’s performance relative to the S&P 1500 Value Index, as these defensive sectors underperformed during the year.
At the close of the year, given our focus on intrinsic value and a long-term investment horizon, the Fund was positioned toward more economically-sensitive stocks than its peers. We believe the single most important indicator of how the Fund is positioned for potential future success is not our recent investment results or popular statistical measures, but rather the difference between current market prices and the Fund’s estimated intrinsic value – the aggregate business value of the portfolio based on our estimate of intrinsic value for each individual holding.
At the end of the year, the difference between the market price and the estimated intrinsic value of the Fund was very attractive, according to our estimation. While there is no assurance that market value will ever reflect our estimate of the Fund’s intrinsic value, we believe the gap between price and estimated intrinsic value may provide above-average capital appreciation.
We will continue to work hard to protect and grow the Fund’s estimated
intrinsic value. We thank you for your investment and for sharing our long-term investment perspective.
1 Source: US Federal Reserve
2 Source: Bureau of Economic Analysis
Portfolio managers:
Jonathan Edwards - Lead
Jonathan Mueller
The views and opinions expressed in management’s discussion of Fund performance are those of Invesco Advisers, Inc. These views and opinions are subject to change at any time based on factors such as market and economic conditions. These views and opinions may not be relied upon as investment advice or recommendations, or as an offer for a particular security. The information is not a complete analysis of every aspect of any market, country, industry, security or the Fund. Statements of fact are from sources considered reliable, but Invesco Advisers, Inc. makes no representation or warranty as to their completeness or accuracy. Although historical performance is no guarantee of future results, these insights may help you understand our investment management philosophy.
See important Fund and, if applicable, index disclosures later in this report.
Invesco V.I. Value Opportunities Fund
Your Fund’s Long-Term Performance
Results of a $10,000 Investment – Oldest Share Class(es)
Fund and index data from 12/31/09
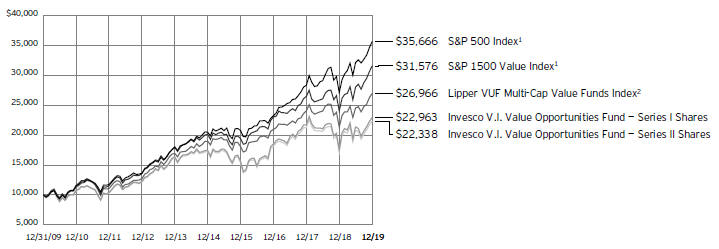
1 Source: RIMES Technologies Corp.
2 Source: Lipper Inc.
Past performance cannot guarantee future results.
| | | | |
Average Annual Total Returns | |
As of 12/31/19 | | | | |
| |
Series I Shares | | | | |
Inception (9/10/01) | | | 4.81 | % |
10 Years | | | 8.67 | |
5 Years | | | 5.62 | |
1 Year | | | 30.61 | |
Series II Shares | | | | |
Inception (9/10/01) | | | 4.54 | % |
10 Years | | | 8.37 | |
5 Years | | | 5.32 | |
1 Year | | | 30.12 | |
Performance includes litigation proceeds. Had these proceeds not been received, total returns would have been lower. | |
The performance of the Fund’s Series I and Series II share classes will differ primarily due to different class expenses.
The performance data quoted represent past performance and cannot guarantee future results; current performance may be lower or higher. Please contact your variable product issuer or financial adviser for the most recentmonth-end variable product performance. Performance figures reflect Fund expenses, reinvested distributions and changes in net asset value. Performance figures do not reflect deduction of taxes a shareholder would pay on Fund distributions or sale of Fund shares. Investment return and principal value will fluctuate so that you may have a gain or loss when you sell shares.
The total annual Fund operating expense ratio set forth in the most recent Fund prospectus as of the date of this report for Series I and Series II shares was 1.01% and
1.26%, respectively. The expense ratios presented above may vary from the expense ratios presented in other sections of this report that are based on expenses incurred during the period covered by this report.
Invesco V.I. Value Opportunities Fund, a series portfolio of AIM Variable Insurance Funds (Invesco Variable Insurance Funds), is currently offered through insurance companies issuing variable products. You cannot purchase shares of the Fund directly. Performance figures given represent the Fund and are not intended to reflect actual variable product values. They do not reflect sales charges, expenses and fees assessed in connection with a variable product. Sales charges, expenses and fees, which are determined by the variable product issuers, will vary and will lower the total return.
The most recentmonth-end performance at the Fund level, excluding variable product charges, is available at 800 451 4246. As mentioned above, for the most recentmonth-end performance including variable product charges, please contact your variable product issuer or financial adviser.
Fund performance reflects any applicable fee waivers and/or expense reimbursements. Had the adviser not waived fees and/or reimbursed expenses currently or in the past, returns would have been lower. See current prospectus for more information.
Invesco V.I. Value Opportunities Fund
Invesco V.I. Value Opportunities Fund’s investment objective is long-term growth of capital.
| ∎ | Unless otherwise stated, information presented in this report is as of December 31, 2019, and is based on total net assets. |
| ∎ | Unless otherwise noted, all data provided by Invesco. |
| ∎ | To access your Fund’s reports/prospectus, visit invesco.com/fundreports. |
About indexes used in this report
| ∎ | TheS&P 500® Indexis an unmanaged index considered representative of the US stock market. |
| ∎ | TheS&P 1500® Value Indextracks the performance of US large-,mid-andsmall-cap value stocks. |
| ∎ | TheLipper VUFMulti-Cap Value Funds Indexis an unmanaged index considered representative of multicap value variable insurance underlying funds tracked by Lipper. |
| ∎ | The Fund is not managed to track the performance of any particular index, including the index(es) described here, and consequently, the performance of the Fund may deviate significantly from the performance of the index(es). |
| ∎ | A direct investment cannot be made in an index. Unless otherwise indicated, index results include reinvested dividends, and they do not reflect sales charges. Performance of the peer group, if applicable, reflects fund expenses; performance of a market index does not. |
Other information
| ∎ | The returns shown in management’s discussion of Fund performance are based on net asset values calculated for shareholder transactions. Generally accepted accounting principles require adjustments to be made to the net assets of the Fund at period end for financial reporting purposes, and as such, the net asset values for shareholder transactions and the returns based on those net asset values may differ from the net asset values and returns reported in the Financial Highlights. Additionally, the returns and net asset values shown throughout this report are at the Fund level only and do not include variable product issuer charges. If such charges were included, the total returns would be lower. |
| ∎ | Industry classifications used in this report are generally according to the Global Industry Classification Standard, which was developed by and is the exclusive property and a service mark of MSCI Inc. and Standard & Poor’s. |
Invesco V.I. Value Opportunities Fund
Schedule of Investments(a)
December 31, 2019
| | | | | | | | |
| | | Shares | | | Value | |
|
Common Stocks & Other Equity Interests–98.00% | |
| | |
Advertising–0.20% | | | | | | | | |
| | |
Interpublic Group of Cos., Inc. (The) | | | 4,100 | | | $ | 94,710 | |
Omnicom Group, Inc. | | | 1,115 | | | | 90,337 | |
| | | | | | | | 185,047 | |
|
Agricultural & Farm Machinery–2.35% | |
| | |
AGCO Corp. | | | 27,789 | | | | 2,146,700 | |
|
Auto Parts & Equipment–5.11% | |
| | |
Dana, Inc. | | | 137,327 | | | | 2,499,351 | |
Delphi Technologies PLC | | | 168,809 | | | | 2,165,820 | |
| | | | | | | | 4,665,171 | |
|
Building Products–8.66% | |
| | |
Masco Corp. | | | 76,308 | | | | 3,662,021 | |
Owens Corning | | | 65,200 | | | | 4,245,824 | |
| | | | | | | | 7,907,845 | |
|
Construction & Engineering–5.29% | |
| | |
AECOM(b) | | | 90,245 | | | | 3,892,267 | |
Fluor Corp. | | | 49,900 | | | | 942,112 | |
| | | | | | | | 4,834,379 | |
|
Consumer Finance–1.11% | |
| | |
SLM Corp. | | | 113,400 | | | | 1,010,394 | |
|
Distributors–4.09% | |
| | |
LKQ Corp.(b) | | | 104,600 | | | | 3,734,220 | |
|
Diversified Banks–5.46% | |
| | |
Bank of America Corp. | | | 48,374 | | | | 1,703,732 | |
| | |
Citigroup, Inc. | | | 41,072 | | | | 3,281,242 | |
| | | | | | | | 4,984,974 | |
|
Diversified Chemicals–4.20% | |
| | |
Chemours Co. (The) | | | 66,137 | | | | 1,196,418 | |
Huntsman Corp. | | | 109,500 | | | | 2,645,520 | |
| | | | | | | | 3,841,938 | |
|
Electrical Components & Equipment–2.07% | |
| | |
nVent Electric PLC | | | 74,100 | | | | 1,895,478 | |
|
Electronic Manufacturing Services–3.53% | |
| | |
Flex Ltd.(b) | | | 255,765 | | | | 3,227,754 | |
|
Health Care Distributors–2.15% | |
| | |
McKesson Corp. | | | 14,200 | | | | 1,964,144 | |
|
Health Care Facilities–1.99% | |
| | |
Brookdale Senior Living, Inc.(b) | | | 249,851 | | | | 1,816,417 | |
|
Health Care Services–1.66% | |
| | |
Cigna Corp. | | | 7,400 | | | | 1,513,226 | |
| | | | | | | | |
| | | Shares | | | Value | |
|
Hotels, Resorts & Cruise Lines–0.37% | |
| | |
Norwegian Cruise Line Holdings Ltd.(b) | | | 5,800 | | | $ | 338,778 | |
|
Household Products–3.77% | |
| | |
Spectrum Brands Holdings, Inc. | | | 53,509 | | | | 3,440,094 | |
|
Industrial Conglomerates–2.90% | |
| | |
Carlisle Cos., Inc. | | | 16,400 | | | | 2,654,176 | |
|
Industrial Machinery–2.17% | |
| | |
Crane Co. | | | 16,800 | | | | 1,451,184 | |
Timken Co. (The) | | | 9,500 | | | | 534,945 | |
| | | | | | | | 1,986,129 | |
|
Internet & Direct Marketing Retail–2.10% | |
| | |
Booking Holdings, Inc.(b) | | | 935 | | | | 1,920,238 | |
|
Investment Banking & Brokerage–3.02% | |
| | |
Goldman Sachs Group, Inc. (The) | | | 12,000 | | | | 2,759,160 | |
|
Life & Health Insurance–0.06% | |
| | |
MetLife, Inc. | | | 1,017 | | | | 51,837 | |
|
Managed Health Care–2.35% | |
| | |
Anthem, Inc. | | | 7,100 | | | | 2,144,413 | |
|
Metal & Glass Containers–1.27% | |
| | |
Crown Holdings, Inc.(b) | | | 16,000 | | | | 1,160,640 | |
|
Oil & Gas Exploration & Production–8.45% | |
| | |
Diamondback Energy, Inc. | | | 18,400 | | | | 1,708,624 | |
Noble Energy, Inc. | | | 84,800 | | | | 2,106,432 | |
Parsley Energy, Inc., Class A(b) | | | 100,600 | | | | 1,902,346 | |
Pioneer Natural Resources Co. | | | 13,200 | | | | 1,998,084 | |
| | | | | | | | 7,715,486 | |
|
Oil & Gas Refining & Marketing–2.36% | |
| | |
Marathon Petroleum Corp. | | | 35,800 | | | | 2,156,950 | |
|
Other Diversified Financial Services–2.96% | |
| | |
AXA Equitable Holdings, Inc. | | | 109,200 | | | | 2,705,976 | |
| | |
Paper Packaging–3.45% | | | | | | | | |
| | |
Sealed Air Corp. | | | 79,100 | | | | 3,150,553 | |
|
Pharmaceuticals–3.25% | |
| | |
Mylan N.V.(b) | | | 104,600 | | | | 2,102,460 | |
Novartis AG (Switzerland) | | | 9,152 | | | | 867,082 | |
| | | | | | | | 2,969,542 | |
|
Steel–2.24% | |
| | |
Allegheny Technologies, Inc.(b) | | | 99,105 | | | | 2,047,509 | |
|
Systems Software–3.06% | |
| | |
Oracle Corp. | | | 52,795 | | | | 2,797,079 | |
See accompanying Notes to Financial Statements which are an integral part of the financial statements.
Invesco V.I. Value Opportunities Fund
| | | | | | | | |
| | | Shares | | | Value | |
Thrifts & Mortgage Finance–6.35% | | | | | | | | |
| | |
MGIC Investment Corp. | | | 245,821 | | | $ | 3,483,284 | |
Radian Group, Inc. | | | 91,976 | | | | 2,314,116 | |
| | | | | | | | 5,797,400 | |
Total Common Stocks & Other Equity Interests
(Cost $79,266,028) | | | | 89,523,647 | |
| | |
Money Market Funds–1.77% | | | | | | | | |
| | |
Invesco Government & Agency Portfolio, Institutional Class,
1.50%(c) | | | 563,912 | | | | 563,912 | |
| | | | | | | | |
| | | Shares | | | Value | |
Invesco Liquid Assets Portfolio, Institutional Class, 1.71%(c) | | | 412,234 | | | $ | 412,357 | |
Invesco Treasury Portfolio, Institutional Class, 1.49%(c) | | | 644,471 | | | | 644,471 | |
Total Money Market Funds
(Cost $1,620,651) | | | | 1,620,740 | |
TOTAL INVESTMENTS IN
SECURITIES–99.77%
(Cost $80,886,679) | | | | 91,144,387 | |
OTHER ASSETS LESS LIABILITIES–0.23% | | | | 209,691 | |
NET ASSETS–100.00% | | | | | | $ | 91,354,078 | |
Notes to Schedule of Investments:
| (a) | Industry and/or sector classifications used in this report are generally according to the Global Industry Classification Standard, which was developed by and is the exclusive property and a service mark of MSCI Inc. and Standard & Poor’s. |
| (b) | Non-income producing security. |
| (c) | The money market fund and the Fund are affiliated by having the same investment adviser. The rate shown is the7-day SEC standardized yield as of December 31, 2019. |
See accompanying Notes to Financial Statements which are an integral part of the financial statements.
Invesco V.I. Value Opportunities Fund
Statement of Assets and Liabilities
December 31, 2019
| | | | |
Assets: | | | | |
Investments in securities, at value
(Cost $79,266,028) | | $ | 89,523,647 | |
Investments in affiliated money market funds, at value (Cost $1,620,651) | | | 1,620,740 | |
Foreign currencies, at value (Cost $3,103) | | | 3,374 | |
Receivable for: | | | | |
Investments sold | | | 397,772 | |
Fund shares sold | | | 950 | |
Dividends | | | 37,345 | |
Investment for trustee deferred compensation and retirement plans | | | 118,198 | |
Total assets | | | 91,702,026 | |
| |
Liabilities: | | | | |
| |
Payable for: | | | | |
Fund shares reacquired | | | 108,147 | |
Amount due custodian | | | 9,293 | |
Accrued fees to affiliates | | | 54,741 | |
Accrued other operating expenses | | | 49,261 | |
Trustee deferred compensation and retirement plans | | | 126,506 | |
Total liabilities | | | 347,948 | |
Net assets applicable to shares outstanding | | $ | 91,354,078 | |
| |
Net assets consist of: | | | | |
| |
Shares of beneficial interest | | $ | 78,090,386 | |
Distributable earnings | | | 13,263,692 | |
| | | $ | 91,354,078 | |
| |
Net Assets: | | | | |
| |
Series I | | $ | 67,691,431 | |
Series II | | $ | 23,662,647 | |
|
Shares outstanding, no par value, with an unlimited number of shares authorized: | |
| |
Series I | | | 12,095,555 | |
Series II | | | 4,237,787 | |
Series I: | | | | |
Net asset value per share | | $ | 5.60 | |
Series II: | | | | |
Net asset value per share | | $ | 5.58 | |
Statement of Operations
For the year ended December 31, 2019
| | | | |
Investment income: | | | | |
Dividends (net of foreign withholding taxes of $4,085) | | $ | 1,102,064 | |
Dividends from affiliated money market funds | | | 66,468 | |
Total investment income | | | 1,168,532 | |
| |
Expenses: | | | | |
| |
Advisory fees | | | 627,946 | |
Administrative services fees | | | 152,113 | |
Custodian fees | | | 3,899 | |
Distribution fees - Series II | | | 59,069 | |
Transfer agent fees | | | 22,756 | |
Trustees’ and officers’ fees and benefits | | | 20,047 | |
Reports to shareholders | | | 8,248 | |
Professional services fees | | | 41,930 | |
Other | | | 2,648 | |
Total expenses | | | 938,656 | |
Less: Fees waived | | | (3,464 | ) |
Net expenses | | | 935,192 | |
Net investment income | | | 233,340 | |
| |
Realized and unrealized gain (loss) from: | | | | |
| |
Net realized gain from: | | | | |
Investment securities (includes net gains from securities sold to affiliates of $198,261) | | | 4,534,348 | |
Foreign currencies | | | 497 | |
| | | | 4,534,845 | |
Change in net unrealized appreciation (depreciation) of: | | | | |
Investment securities | | | 18,922,271 | |
Foreign currencies | | | (45 | ) |
| | | | 18,922,226 | |
Net realized and unrealized gain | | | 23,457,071 | |
Net increase in net assets resulting from operations | | $ | 23,690,411 | |
See accompanying Notes to Financial Statements which are an integral part of the financial statements.
Invesco V.I. Value Opportunities Fund
Statement of Changes in Net Assets
For the years ended December 31, 2019 and 2018
| | | | | | | | |
| | | 2019 | | | 2018 | |
Operations: | | | | | | | | |
| | |
Net investment income | | $ | 233,340 | | | $ | 162,392 | |
Net realized gain | | | 4,534,845 | | | | 18,204,360 | |
Change in net unrealized appreciation (depreciation) | | | 18,922,226 | | | | (37,763,094 | ) |
Net increase (decrease) in net assets resulting from operations | | | 23,690,411 | | | | (19,396,342 | ) |
| | |
Distributions to shareholders from distributable earnings: | | | | | | | | |
| | |
Series I | | | (13,915,883 | ) | | | (8,093,985 | ) |
Series II | | | (4,877,021 | ) | | | (2,790,803 | ) |
Total distributions from distributable earnings | | | (18,792,904 | ) | | | (10,884,788 | ) |
| | |
Share transactions–net: | | | | | | | | |
| | |
Series I | | | 4,066,968 | | | | (4,794,903 | ) |
Series II | | | 1,082,646 | | | | (6,176,982 | ) |
Net increase (decrease) in net assets resulting from share transactions | | | 5,149,614 | | | | (10,971,885 | ) |
Net increase (decrease) in net assets | | | 10,047,121 | | | | (41,253,015 | ) |
| | |
Net assets: | | | | | | | | |
| | |
Beginning of year | | | 81,306,957 | | | | 122,559,972 | |
End of year | | $ | 91,354,078 | | | $ | 81,306,957 | |
See accompanying Notes to Financial Statements which are an integral part of the financial statements.
Invesco V.I. Value Opportunities Fund
Financial Highlights
The following schedule presents financial highlights for a share of the Fund outstanding throughout the periods indicated.
| | | | | | | | | | | | | | | | | | | | | | | | | | | | | | | | | | | | | | | | | | | | | | | | | | | | | | | | | | | | | | | | | | | | | | |
| | | | | | | | | | | | | | | | | | | | | | | Ratio of | | Ratio of | | | | |
| | | | | | | | | | | | | | | | | | | | | | | expenses | | expenses | | | | |
| | | | | | | Net gains | | | | | | | | | | | | | | | | to average | | to average net | | Ratio of net | | |
| | | | | | | (losses) | | | | | | | | | | | | | | | | net assets | | assets without | | investment | | |
| | | Net asset | | Net | | on securities | | | | Dividends | | Distributions | | | | | | | | | | with fee waivers | | fee waivers | | income | | |
| | | value, | | investment | | (both | | Total from | | from net | | from net | | | | Net asset | | | | Net assets, | | and/or | | and/or | | (loss) | | |
| | | beginning | | income | | realized and | | investment | | investment | | realized | | Total | | value, end | | Total | | end of period | | expenses | | expenses | | to average | | Portfolio |
| | | of period | | (loss)(a) | | unrealized) | | operations | | income | | gains | | distributions | | of period | | return (b) | | (000’s omitted) | | absorbed | | absorbed | | net assets | | turnover (c) |
Series I | | | | | | | | | | | | | | | | | | | | | | | | | | | | | | | | | | | | | | | | | | | | | | | | | | | | | | | | | | | | | | | | | | | | | | |
Year ended 12/31/19 | | | $ | 5.50 | | | | $ | 0.02 | | | | $ | 1.51 | (d) | | | $ | 1.53 | | | | $ | (0.02 | ) | | | $ | (1.41 | ) | | | $ | (1.43 | ) | | | $ | 5.60 | | | | | 30.61 | %(d) | | | $ | 67,691 | | | | | 0.97 | %(e) | | |
| 0.97
| %(e)
| | |
| 0.32
| %(e)
| | | | 34 | % |
Year ended 12/31/18 | | | | 7.58 | | | | | 0.01 | | | | | (1.30 | ) | | | | (1.29 | ) | | | | (0.02 | ) | | | | (0.77 | ) | | | | (0.79 | ) | | | | 5.50 | | | | | (19.18 | ) | | | | 59,998 | | | | | 1.01 | | | | | 1.01 | | | | | 0.22 | | | | | 45 | |
Year ended 12/31/17 | | | | 6.48 | | | | | 0.02 | | | | | 1.11 | (f) | | | | 1.13 | | | | | (0.03 | ) | | | | – | | | | | (0.03 | ) | | | | 7.58 | | | | | 17.44 | (f) | | | | 87,232 | | | | | 0.98 | | | | | 0.98 | | | | | 0.30 | | | | | 28 | |
Year ended 12/31/16 | | | | 7.82 | | | | | 0.03 | | | | | 1.10 | | | | | 1.13 | | | | | (0.03 | ) | | | | (2.44 | ) | | | | (2.47 | ) | | | | 6.48 | | | | | 18.34 | | | | | 85,722 | | | | | 1.01 | | | | | 1.02 | | | | | 0.43 | | | | | 36 | |
Year ended 12/31/15 | | | | 9.84 | | | | | 0.05 | | | | | (1.09 | ) | | | | (1.04 | ) | | | | (0.26 | ) | | | | (0.72 | ) | | | | (0.98 | ) | | | | 7.82 | | | | | (10.40 | ) | | | | 83,889 | | | | | 1.04 | | | | | 1.04 | | | | | 0.51 | | | | | 82 | |
Series II | | | | | | | | | | | | | | | | | | | | | | | | | | | | | | | | | | | | | | | | | | | | | | | | | | | | | | | | | | | | | | | | | | | | | | |
Year ended 12/31/19 | | | | 5.49 | | | | | 0.00 | | | | | 1.50 | (d) | | | | 1.50 | | | | | – | | | | | (1.41 | ) | | | | (1.41 | ) | | | | 5.58 | | | | | 30.12 | (d) | | | | 23,663 | | | | | 1.22 | (e) | | | | 1.22 | (e) | | | | 0.07 | (e) | | | | 34 | |
Year ended 12/31/18 | | | | 7.56 | | | | | (0.00 | ) | | | | (1.30 | ) | | | | (1.30 | ) | | | | – | | | | | (0.77 | ) | | | | (0.77 | ) | | | | 5.49 | | | | | (19.35 | ) | | | | 21,309 | | | | | 1.26 | | | | | 1.26 | | | | | (0.03 | ) | | | | 45 | |
Year ended 12/31/17 | | | | 6.45 | | | | | 0.00 | | | | | 1.11 | (f) | | | | 1.11 | | | | | 0.00 | | | | | – | | | | | 0.00 | | | | | 7.56 | | | | | 17.23 | (f) | | | | 35,328 | | | | | 1.23 | | | | | 1.23 | | | | | 0.05 | | | | | 28 | |
Year ended 12/31/16 | | | | 7.79 | | | | | 0.01 | | | | | 1.10 | | | | | 1.11 | | | | | (0.01 | ) | | | | (2.44 | ) | | | | (2.45 | ) | | | | 6.45 | | | | | 17.92 | | | | | 54,438 | | | | | 1.26 | | | | | 1.27 | | | | | 0.18 | | | | | 36 | |
Year ended 12/31/15 | | | | 9.79 | | | | | 0.02 | | | | | (1.08 | ) | | | | (1.06 | ) | | | | (0.22 | ) | | | | (0.72 | ) | | | | (0.94 | ) | | | | 7.79 | | | | | (10.65 | ) | | | | 54,887 | | | | | 1.29 | | | | | 1.29 | | | | | 0.26 | | | | | 82 | |
| (a) | Calculated using average shares outstanding. |
| (b) | Includes adjustments in accordance with accounting principles generally accepted in the United States of America and as such, the net asset value for financial reporting purposes and the returns based upon those net asset values may differ from the net asset value and returns for shareholder transactions. Total returns are not annualized for periods less than one year, if applicable, and do not reflect charges assessed in connection with a variable product, which if included would reduce total returns. |
| (c) | Portfolio turnover is calculated at the fund level and is not annualized for periods less than one year, if applicable. |
| (d) | Includes litigation proceeds received during the period. Had these litigation proceeds not been received, Net gains (losses) on securities (both realized and unrealized) per share would have been $1.44 and $1.43 for Series I and Series II shares, respectively. Total returns would have been lower. |
| (e) | Ratios are based on average daily net assets (000’s omitted) of $66,731 and $23,621 for Series I and Series II shares, respectively. |
| (f) | Includes litigation proceeds received during the period. Had these litigation proceeds not been received, Net gains (losses) on securities (both realized and unrealized) per share would have been $1.09 and $1.09 for Series I and Series II shares, respectively. Total returns would have been lower. |
See accompanying Notes to Financial Statements which are an integral part of the financial statements.
Invesco V.I. Value Opportunities Fund
Notes to Financial Statements
December 31, 2019
NOTE 1–Significant Accounting Policies
Invesco V.I. Value Opportunities Fund (the “Fund”) is a series portfolio of AIM Variable Insurance Funds (Invesco Variable Insurance Funds) (the “Trust”). The Trust is a Delaware statutory trust registered under the Investment Company Act of 1940, as amended (the “1940 Act”), as anopen-end series management investment company. Information presented in these financial statements pertains only to the Fund. Matters affecting the Fund or each class will be voted on exclusively by the shareholders of the Fund or each class. Current Securities and Exchange Commission (“SEC”) guidance, however, requires participating insurance companies offering separate accounts to vote shares proportionally in accordance with the instructions of the contract owners whose investments are funded by shares of each Fund or class.
The Fund’s investment objective is long-term growth of capital.
The Fund currently offers two classes of shares, Series I and Series II, both of which are offered to insurance company separate accounts funding variable annuity contracts and variable life insurance policies (“variable products”).
The Fund is an investment company and accordingly follows the investment company accounting and reporting guidance in accordance with Financial Accounting Standards Board Accounting Standards Codification Topic 946,Financial Services - Investment Companies.
The following is a summary of the significant accounting policies followed by the Fund in the preparation of its financial statements.
| A. | Security Valuations– Securities, including restricted securities, are valued according to the following policy. |
A security listed or traded on an exchange (except convertible securities) is valued at its last sales price or official closing price as of the close of the customary trading session on the exchange where the security is principally traded, or lacking any sales or official closing price on a particular day, the security may be valued at the closing bid price on that day. Securities traded in theover-the-counter market are valued based on prices furnished by independent pricing services or market makers. When such securities are valued by an independent pricing service they may be considered fair valued. Futures contracts are valued at the final settlement price set by an exchange on which they are principally traded. Listed options are valued at the mean between the last bid and asked prices from the exchange on which they are principally traded. Options not listed on an exchange are valued by an independent source at the mean between the last bid and asked prices. For purposes of determining net asset value (“NAV”) per share, futures and option contracts generally are valued 15 minutes after the close of the customary trading session of the New York Stock Exchange (“NYSE”).
Investments inopen-end andclosed-end registered investment companies that do not trade on an exchange are valued at theend-of-day net asset value per share. Investments inopen-end andclosed-end registered investment companies that trade on an exchange are valued at the last sales price or official closing price as of the close of the customary trading session on the exchange where the security is principally traded.
Debt obligations (including convertible securities) and unlisted equities are fair valued using an evaluated quote provided by an independent pricing service. Evaluated quotes provided by the pricing service may be determined without exclusive reliance on quoted prices, and may reflect appropriate factors such asinstitution-size trading in similar groups of securities, developments related to specific securities, dividend rate (for unlisted equities), yield (for debt obligations), quality, type of issue, coupon rate (for debt obligations), maturity (for debt obligations), individual trading characteristics and other market data. Pricing services generally value debt obligations assuming orderly transactions of institutional round lot size, but a fund may hold or transact in the same securities in smaller, odd lot sizes. Odd lots often trade at lower prices than institutional round lots. Debt obligations are subject to interest rate and credit risks. In addition, all debt obligations involve some risk of default with respect to interest and/or principal payments.
Foreign securities’ (including foreign exchange contracts) prices are converted into U.S. dollar amounts using the applicable exchange rates as of the close of the NYSE. If market quotations are available and reliable for foreign exchange-traded equity securities, the securities will be valued at the market quotations. Because trading hours for certain foreign securities end before the close of the NYSE, closing market quotations may become unreliable. If between the time trading ends on a particular security and the close of the customary trading session on the NYSE, events occur that the investment adviser determines are significant and make the closing price unreliable, the Fund may fair value the security. If the event is likely to have affected the closing price of the security, the security will be valued at fair value in good faith using procedures approved by the Board of Trustees. Adjustments to closing prices to reflect fair value may also be based on a screening process of an independent pricing service to indicate the degree of certainty, based on historical data, that the closing price in the principal market where a foreign security trades is not the current value as of the close of the NYSE. Foreign securities’ prices meeting the approved degree of certainty that the price is not reflective of current value will be priced at the indication of fair value from the independent pricing service. Multiple factors may be considered by the independent pricing service in determining adjustments to reflect fair value and may include information relating to sector indices, American Depositary Receipts and domestic and foreign index futures. Foreign securities may have additional risks including exchange rate changes, potential for sharply devalued currencies and high inflation, political and economic upheaval, the relative lack of issuer information, relatively low market liquidity and the potential lack of strict financial and accounting controls and standards.
Securities for which market prices are not provided by any of the above methods may be valued based upon quotes furnished by independent sources. The last bid price may be used to value equity securities. The mean between the last bid and asked prices is used to value debt obligations, including corporate loans.
Securities for which market quotations are not readily available or became unreliable are valued at fair value as determined in good faith by or under the supervision of the Trust’s officers following procedures approved by the Board of Trustees. Issuer specific events, market trends, bid/asked quotes of brokers and information providers and other market data may be reviewed in the course of making a good faith determination of a security’s fair value.
The Fund may invest in securities that are subject to interest rate risk, meaning the risk that the prices will generally fall as interest rates rise and, conversely, the prices will generally rise as interest rates fall. Specific securities differ in their sensitivity to changes in interest rates depending on their individual characteristics. Changes in interest rates may result in increased market volatility, which may affect the value and/or liquidity of certain Fund investments.
Invesco V.I. Value Opportunities Fund
Valuations change in response to many factors including the historical and prospective earnings of the issuer, the value of the issuer’s assets, general economic conditions, interest rates, investor perceptions and market liquidity. Because of the inherent uncertainties of valuation, the values reflected in the financial statements may materially differ from the value received upon actual sale of those investments.
| B. | Securities Transactions and Investment Income– Securities transactions are accounted for on a trade date basis. Realized gains or losses on sales are computed on the basis of specific identification of the securities sold. Interest income (net of withholding tax, if any) is recorded on the accrual basis from settlement date. Dividend income (net of withholding tax, if any) is recorded on theex-dividend date. |
The Fund may periodically participate in litigation related to Fund investments. As such, the Fund may receive proceeds from litigation settlements. Any proceeds received are included in the Statement of Operations as realized gain (loss) for investments no longer held and as unrealized gain (loss) for investments still held.
Brokerage commissions and mark ups are considered transaction costs and are recorded as an increase to the cost basis of securities purchased and/or a reduction of proceeds on a sale of securities. Such transaction costs are included in the determination of net realized and unrealized gain (loss) from investment securities reported in the Statement of Operations and the Statement of Changes in Net Assets and the net realized and unrealized gains (losses) on securities per share in the Financial Highlights. Transaction costs are included in the calculation of the Fund’s net asset value and, accordingly, they reduce the Fund’s total returns. These transaction costs are not considered operating expenses and are not reflected in net investment income reported in the Statement of Operations and the Statement of Changes in Net Assets, or the net investment income per share and the ratios of expenses and net investment income reported in the Financial Highlights, nor are they limited by any expense limitation arrangements between the Fund and the investment adviser.
The Fund allocates income and realized and unrealized capital gains and losses to a class based on the relative net assets of each class.
| C. | Country Determination – For the purposes of making investment selection decisions and presentation in the Schedule of Investments, the investment adviser may determine the country in which an issuer is located and/or credit risk exposure based on various factors. These factors include the laws of the country under which the issuer is organized, where the issuer maintains a principal office, the country in which the issuer derives 50% or more of its total revenues and the country that has the primary market for the issuer’s securities, as well as other criteria. Among the other criteria that may be evaluated for making this determination are the country in which the issuer maintains 50% or more of its assets, the type of security, financial guarantees and enhancements, the nature of the collateral and the sponsor organization. Country of issuer and/or credit risk exposure has been determined to be the United States of America, unless otherwise noted. |
| D. | Distributions– Distributions from net investment income and net realized capital gain, if any, are generally declared and paid to separate accounts of participating insurance companies annually and recorded on theex-dividend date. |
| E. | Federal Income Taxes–The Fund intends to comply with the requirements of Subchapter M of the Internal Revenue Code of 1986, as amended (the “Internal Revenue Code”), necessary to qualify as a regulated investment company and to distribute substantially all of the Fund’s taxable earnings to shareholders. As such, the Fund will not be subject to federal income taxes on otherwise taxable income (including net realized capital gain) that is distributed to shareholders. Therefore, no provision for federal income taxes is recorded in the financial statements. |
The Fund recognizes the tax benefits of uncertain tax positions only when the position is more likely than not to be sustained. Management has analyzed the Fund’s uncertain tax positions and concluded that no liability for unrecognized tax benefits should be recorded related to uncertain tax positions. Management is not aware of any tax positions for which it is reasonably possible that the total amounts of unrecognized tax benefits will change materially in the next 12 months.
The Fund files tax returns in the U.S. Federal jurisdiction and certain other jurisdictions. Generally, the Fund is subject to examinations by such taxing authorities for up to three years after the filing of the return for the tax period.
| F. | Expenses– Fees provided for under the Rule12b-1 plan of a particular class of the Fund and which are directly attributable to that class are charged to the operations of such class. All other expenses are allocated among the classes based on relative net assets. |
| G. | Accounting Estimates–The preparation of financial statements in conformity with accounting principles generally accepted in the United States of America (“GAAP”) requires management to make estimates and assumptions that affect the reported amounts of assets and liabilities at the date of the financial statements and the reported amounts of revenues and expenses during the reporting period including estimates and assumptions related to taxation. Actual results could differ from those estimates by a significant amount. In addition, the Fund monitors for material events or transactions that may occur or become known after theperiod-end date and before the date the financial statements are released to print. |
| H. | Indemnifications– Under the Trust’s organizational documents, each Trustee, officer, employee or other agent of the Trust is indemnified against certain liabilities that may arise out of the performance of their duties to the Fund. Additionally, in the normal course of business, the Fund enters into contracts, including the Fund’s servicing agreements, that contain a variety of indemnification clauses. The Fund’s maximum exposure under these arrangements is unknown as this would involve future claims that may be made against the Fund that have not yet occurred. The risk of material loss as a result of such indemnification claims is considered remote. |
| I. | Foreign Currency Translations– Foreign currency is valued at the close of the NYSE based on quotations posted by banks and major currency dealers. Portfolio securities and other assets and liabilities denominated in foreign currencies are translated into U.S. dollar amounts at the date of valuation. Purchases and sales of portfolio securities (net of foreign taxes withheld on disposition) and income items denominated in foreign currencies are translated into U.S. dollar amounts on the respective dates of such transactions. The Fund does not separately account for the portion of the results of operations resulting from changes in foreign exchange rates on investments and the fluctuations arising from changes in market prices of securities held. The combined results of changes in foreign exchange rates and the fluctuation of market prices on investments (net of estimated foreign tax withholding) are included with the net realized and unrealized gain or loss from investments in the Statement of Operations. Reported net realized foreign currency gains or losses arise from (1) sales of foreign currencies, (2) currency gains or losses realized between the trade and settlement dates on securities transactions, and (3) the difference between the amounts of dividends, interest, and foreign withholding taxes recorded on the Fund’s books and the U.S. dollar equivalent of the amounts actually received or paid. Net unrealized foreign currency gains and losses arise from changes in the fair values of assets and liabilities, other than investments in securities at fiscal period end, resulting from changes in exchange rates. |
The Fund may invest in foreign securities, which may be subject to foreign taxes on income, gains on investments or currency repatriation, a portion of which may be recoverable. Foreign taxes, if any, are recorded based on the tax regulations and rates that exist in the foreign markets in which the Fund invests and are shown in the Statement of Operations.
Invesco V.I. Value Opportunities Fund
| J. | Forward Foreign Currency Contracts– The Fund may engage in foreign currency transactions either on a spot (i.e. for prompt delivery and settlement) basis, or through forward foreign currency contracts, to manage or minimize currency or exchange rate risk. |
The Fund may also enter into forward foreign currency contracts for the purchase or sale of a security denominated in a foreign currency in order to “lock in” the U.S. dollar price of that security, or the Fund may also enter into forward foreign currency contracts that do not provide for physical settlement of the two currencies, but instead are settled by a single cash payment calculated as the difference between the agreed upon exchange rate and the spot rate at settlement based upon an agreed upon notional amount(non-deliverable forwards). The Fund will set aside liquid assets in an amount equal to the dailymark-to-market obligation for forward foreign currency contracts.
A forward foreign currency contract is an obligation between two parties (“Counterparties”) to purchase or sell a specific currency for an agreed-upon price at a future date. The use of forward foreign currency contracts does not eliminate fluctuations in the price of the underlying securities the Fund owns or intends to acquire but establishes a rate of exchange in advance. Fluctuations in the value of these contracts are measured by the difference in the contract date and reporting date exchange rates and are recorded as unrealized appreciation (depreciation) until the contracts are closed. When the contracts are closed, realized gains (losses) are recorded. Realized and unrealized gains (losses) on the contracts are included in the Statement of Operations. The primary risks associated with forward foreign currency contracts include failure of the Counterparty to meet the terms of the contract and the value of the foreign currency changing unfavorably. These risks may be in excess of the amounts reflected in the Statement of Assets and Liabilities.
NOTE 2–Advisory Fees and Other Fees Paid to Affiliates
The Trust has entered into a master investment advisory agreement with Invesco Advisers, Inc. (the “Adviser” or “Invesco”). Under the terms of the investment advisory agreement, the Fund accrues daily and pays monthly an advisory fee to the Adviser based on the annual rate of the Fund’s average daily net assets as follows:
| | | | |
| Average Daily Net Assets | | Rate | |
First $ 250 million | | | 0.695 | % |
First $ 250 million | | | 0.670 | % |
First $ 500 million | | | 0.645 | % |
Next $1.5 billion | | | 0.620 | % |
Next $2.5 billion | | | 0.595 | % |
Next $2.5 billion | | | 0.570 | % |
Next $2.5 billion | | | 0.545 | % |
Over $10 billion | | | 0.520 | % |
For the year ended December 31, 2019, the effective advisory fee rate incurred by the Fund was 0.695%.
Under the terms of a mastersub-advisory agreement between the Adviser and each of Invesco Asset Management Deutschland GmbH, Invesco Asset Management Limited, Invesco Asset Management (Japan) Limited, Invesco Hong Kong Limited, Invesco Senior Secured Management, Inc. and Invesco Canada Ltd. and separatesub-advisory agreements with Invesco Capital Management LLC and Invesco Asset Management (India) Private Limited (collectively, the “AffiliatedSub-Advisers”) the Adviser, not the Fund, will pay 40% of the fees paid to the Adviser to any such AffiliatedSub-Adviser(s) that provide(s) discretionary investment management services to the Fund based on the percentage of assets allocated to such AffiliatedSub-Adviser(s).
The Adviser has contractually agreed, through at least June 30, 2020, to waive advisory fees and/or reimburse expenses of all shares to the extent necessary to limit total annual fund operating expenses after fee waiver and/or expense reimbursement (excluding certain items discussed below) of Series I shares to 2.00% and Series II shares to 2.25% of average daily net assets (the “expense limits”). In determining the Adviser’s obligation to waive advisory fees and/or reimburse expenses, the following expenses are not taken into account, and could cause the total annual fund operating expenses after fee waiver and/or expense reimbursement to exceed the numbers reflected above: (1) interest; (2) taxes; (3) dividend expense on short sales; (4) extraordinary ornon-routine items, including litigation expenses; and (5) expenses that the Fund has incurred but did not actually pay because of an expense offset arrangement. Unless Invesco continues the fee waiver agreement, it will terminate on June 30, 2020. During its term, the fee waiver agreement cannot be terminated or amended to increase the expense limits or reduce the advisory fee waiver without approval of the Board of Trustees. The Adviser did not waive fees and/or reimburse expenses during the period under these expense limits.
Further, the Adviser has contractually agreed, through at least June 30, 2021, to waive the advisory fee payable by the Fund in an amount equal to 100% of the net advisory fees the Adviser receives from the affiliated money market funds on investments by the Fund of uninvested cash in such affiliated money market funds.
For the year ended December 31, 2019, the Adviser waived advisory fees of $3,464.
The Trust has entered into a master administrative services agreement with Invesco pursuant to which the Fund has agreed to pay Invesco a fee for costs incurred in providing accounting services and fund administrative services to the Fund and to reimburse Invesco for fees paid to insurance companies that have agreed to provide certain administrative services to the Fund. These administrative services provided by the insurance companies may include, among other things: maintenance of master accounts with the Fund; tracking, recording and transmitting net purchase and redemption orders for Fund shares; maintaining and preserving records related to the purchase, redemption and other account activity of variable product owners; distributing copies of Fund documents such as prospectuses, proxy materials and periodic reports, to variable product owners, and responding to inquiries from variable product owners about the Fund. Pursuant to such agreement, for the year ended December 31, 2019, Invesco was paid $12,953 for accounting and fund administrative services and was reimbursed $139,160 for fees paid to insurance companies. Invesco has entered into asub-administration agreement whereby State Street Bank and Trust Company (“SSB”) serves as fund accountant and provides certain administrative services to the Fund. Pursuant to a custody agreement with the Trust on behalf of the Fund, SSB also serves as the Fund’s custodian.
The Trust has entered into a transfer agency and service agreement with Invesco Investment Services, Inc. (“IIS”) pursuant to which the Fund has agreed to pay IIS a fee for providing transfer agency and shareholder services to the Fund and reimburse IIS for certain expenses incurred by IIS in the
Invesco V.I. Value Opportunities Fund
course of providing such services. For the year ended December 31, 2019, expenses incurred under the agreement are shown in the Statement of Operations asTransfer agent fees.
The Trust has entered into a master distribution agreement with Invesco Distributors, Inc. (“IDI”) to serve as the distributor for the Fund. The Trust has adopted a plan pursuant to Rule12b-1 under the 1940 Act with respect to the Fund’s Series II shares (the “Plan”). The Fund, pursuant to the Plan, pays IDI compensation at the annual rate of 0.25% of the Fund’s average daily net assets of Series II shares. The fees are accrued daily and paid monthly. Of the Plan payments, up to 0.25% of the average daily net assets of the Series II shares may be paid to insurance companies who furnish continuing personal shareholder services to customers who purchase and own Series II shares of the Fund. For the year ended December 31, 2019, expenses incurred under the Plan are detailed in the Statement of Operations asDistribution fees.
For the year ended December 31, 2019, the Fund incurred $558 in brokerage commissions with Invesco Capital Markets, Inc., an affiliate of the Adviser and IDI, for portfolio transactions executed on behalf of the Fund.
Certain officers and trustees of the Trust are officers and directors of the Adviser, IIS and/or IDI.
NOTE 3–Additional Valuation Information
GAAP defines fair value as the price that would be received to sell an asset or paid to transfer a liability in an orderly transaction between market participants at the measurement date, under current market conditions. GAAP establishes a hierarchy that prioritizes the inputs to valuation methods, giving the highest priority to readily available unadjusted quoted prices in an active market for identical assets (Level 1) and the lowest priority to significant unobservable inputs (Level 3), generally when market prices are not readily available or are unreliable. Based on the valuation inputs, the securities or other investments are tiered into one of three levels. Changes in valuation methods may result in transfers in or out of an investment’s assigned level:
| | |
| Level 1 - | | Prices are determined using quoted prices in an active market for identical assets. |
| Level 2 - | | Prices are determined using other significant observable inputs. Observable inputs are inputs that other market participants may use in pricing a security. These may include quoted prices for similar securities, interest rates, prepayment speeds, credit risk, yield curves, loss severities, default rates, discount rates, volatilities and others. |
| Level 3 - | | Prices are determined using significant unobservable inputs. In situations where quoted prices or observable inputs are unavailable (for example, when there is little or no market activity for an investment at the end of the period), unobservable inputs may be used. Unobservable inputs reflect the Fund’s own assumptions about the factors market participants would use in determining fair value of the securities or instruments and would be based on the best available information. |
The following is a summary of the tiered valuation input levels, as of December 31, 2019. The level assigned to the securities valuations may not be an indication of the risk or liquidity associated with investing in those securities. Because of the inherent uncertainties of valuation, the values reflected in the financial statements may materially differ from the value received upon actual sale of those investments.
| | | | | | | | | | | | | | | | |
| | | Level 1 | | | Level 2 | | | Level 3 | | | Total | |
Investments in Securities | | | | | | | | | | | | | | | | |
Common Stocks & Other Equity Interests | | | $88,656,565 | | | | $867,082 | | | | $– | | | | $89,523,647 | |
Money Market Funds | | | 1,620,740 | | | | – | | | | – | | | | 1,620,740 | |
Total Investments | | | $90,277,305 | | | | $867,082 | | | | $– | | | | $91,144,387 | |
NOTE 4–Security Transactions with Affiliated Funds
The Fund is permitted to purchase or sell securities from or to certain other Invesco Funds under specified conditions outlined in procedures adopted by the Board of Trustees of the Trust. The procedures have been designed to ensure that any purchase or sale of securities by the Fund from or to another fund or portfolio that is or could be considered an affiliate by virtue of having a common investment adviser (or affiliated investment advisers), common Trustees and/or common officers complies with Rule17a-7 of the 1940 Act. Further, as defined under the procedures, each transaction is effected at the current market price. Pursuant to these procedures, for the year ended December 31, 2019, the Fund engaged in securities purchases of $0 and securities sales of $258,385, which resulted in net realized gains of $198,261.
NOTE 5–Trustees’ and Officers’ Fees and Benefits
Trustees’ and Officers’ Fees and Benefits include amounts accrued by the Fund to pay remuneration to certain Trustees and Officers of the Fund. Trustees have the option to defer compensation payable by the Fund, andTrustees’ and Officers’ Fees and Benefits also include amounts accrued by the Fund to fund such deferred compensation amounts. Those Trustees who defer compensation have the option to select various Invesco Funds in which their deferral accounts shall be deemed to be invested. Finally, certain current Trustees were eligible to participate in a retirement plan that provided for benefits to be paid upon retirement to Trustees over a period of time based on the number of years of service. The Fund may have certain former Trustees who also participate in a retirement plan and receive benefits under such plan.Trustees’ and Officers’ Fees and Benefits include amounts accrued by the Fund to fund such retirement benefits. Obligations under the deferred compensation and retirement plans represent unsecured claims against the general assets of the Fund.
NOTE 6–Cash Balances
The Fund is permitted to temporarily carry a negative or overdrawn balance in its account with SSB, the custodian bank. Such balances, if any atperiod-end, are shown in the Statement of Assets and Liabilities under the payable caption Amount due custodian. To compensate the custodian bank for such overdrafts, the overdrawn Fund may either (1) leave funds as a compensating balance in the account so the custodian bank can be compensated by earning the additional interest; or (2) compensate by paying the custodian bank at a rate agreed upon by the custodian bank and Invesco, not to exceed the contractually agreed upon rate.
Invesco V.I. Value Opportunities Fund
NOTE 7–Distributions to Shareholders and Tax Components of Net Assets
Tax Character of Distributions to Shareholders Paid During the Fiscal Years Ended December 31, 2019 and 2018:
| | | | | | | | |
| | | 2019 | | | 2018 | |
| |
Ordinary income | | $ | 2,447,612 | | | $ | 1,027,667 | |
| |
Long-term capital gain | | | 16,345,292 | | | | 9,857,121 | |
| |
Total distributions | | $ | 18,792,904 | | | $ | 10,884,788 | |
| |
Tax Components of Net Assets atPeriod-End:
| | | | |
| | | 2019 | |
| |
Undistributed ordinary income | | $ | 1,173,212 | |
| |
Undistributed long-term capital gain | | | 2,374,680 | |
| |
Net unrealized appreciation – investments | | | 9,812,315 | |
| |
Net unrealized appreciation – foreign currencies | | | 138 | |
| |
Temporary book/tax differences | | | (96,653 | ) |
| |
Shares of beneficial interest | | | 78,090,386 | |
| |
Total net assets | | $ | 91,354,078 | |
| |
The difference between book-basis andtax-basis unrealized appreciation (depreciation) is due to differences in the timing of recognition of gains and losses on investments for tax and book purposes. The Fund’s net unrealized appreciation difference is attributable primarily to wash sales.
The temporary book/tax differences are a result of timing differences between book and tax recognition of income and/or expenses. The Fund’s temporary book/tax differences are the result of the trustee deferral of compensation and retirement plan benefits.
Capital loss carryforward is calculated and reported as of a specific date. Results of transactions and other activity after that date may affect the amount of capital loss carryforward actually available for the Fund to utilize. Capital losses generated in years beginning after December 22, 2010 can be carried forward for an unlimited period, whereas previous losses expire in eight tax years. Capital losses with an expiration period may not be used to offset capital gains until all net capital losses without an expiration date have been utilized. Capital loss carryforwards with no expiration date will retain their character as either short-term or long-term capital losses instead of as short-term capital losses as under prior law. The ability to utilize capital loss carryforwards in the future may be limited under the Internal Revenue Code and related regulations based on the results of future transactions.
The Fund does not have a capital loss carryforward as of December 31, 2019.
NOTE 8–Investment Transactions
The aggregate amount of investment securities (other than short-term securities, U.S. Treasury obligations and money market funds, if any) purchased and sold by the Fund during the year ended December 31, 2019 was $29,156,610 and $40,983,898, respectively. Cost of investments, including any derivatives, on a tax basis includes the adjustments for financial reporting purposes as of the most recently completed federal income tax reportingperiod-end.
Unrealized Appreciation (Depreciation) of Investments on a Tax Basis
| | | | |
| |
Aggregate unrealized appreciation of investments | | $ | 17,436,075 | |
| |
Aggregate unrealized (depreciation) of investments | | | (7,623,760 | ) |
| |
Net unrealized appreciation of investments | | $ | 9,812,315 | |
| |
Cost of investments for tax purposes is $81,332,072.
NOTE 9–Reclassification of Permanent Differences
Primarily as a result of differing book/tax treatment of fair fund adjustments and foreign currency transactions, on December 31, 2019, undistributed net investment income was increased by $1,644 and undistributed net realized gain was decreased by $1,644. This reclassification had no effect on the net assets or the distributable earnings of the Fund.
NOTE 10–Share Information
| | | | | | | | | | | | | | | | |
| | | Summary of Share Activity | |
| |
| | | Year ended | | | Year ended | |
| | | December 31, 2019(a) | | | December 31, 2018 | |
| | | Shares | | | Amount | | | Shares | | | Amount | |
| |
Sold: | | | | | | | | | | | | | | | | |
| | | | |
Series I | | | 585,705 | | | $ | 3,555,762 | | | | 246,902 | | | $ | 1,647,873 | |
| |
Series II | | | 183,035 | | | | 1,127,174 | | | | 230,991 | | | | 1,598,135 | |
| |
| | | | |
Issued as reinvestment of dividends: | | | | | | | | | | | | | | | | |
| | | | |
Series I | | | 2,766,577 | | | | 13,915,883 | | | | 1,156,284 | | | | 8,093,985 | |
| |
Series II | | | 971,518 | | | | 4,877,021 | | | | 399,257 | | | | 2,790,803 | |
| |
Invesco V.I. Value Opportunities Fund
| | | | | | | | | | | | | | | | |
| | | Summary of Share Activity | |
| | | Year ended | | | Year ended | |
| | | December 31, 2019(a) | | | December 31, 2018 | |
| | | Shares | | | Amount | | | Shares | | | Amount | |
| | | | |
Reacquired: | | | | | | | | | | | | | | | | |
| | | | |
Series I | | | (2,173,905 | ) | | $ | (13,404,677 | ) | | | (1,997,013 | ) | | $ | (14,536,761 | ) |
| |
Series II | | | (801,319 | ) | | | (4,921,549 | ) | | | (1,418,342 | ) | | | (10,565,920 | ) |
| |
Net increase (decrease) in share activity | | | 1,531,611 | | | $ | 5,149,614 | | | | (1,381,921 | ) | | $ | (10,971,885 | ) |
| |
| (a) | There are entities that are record owners of more than 5% of the outstanding shares of the Fund and in the aggregate own 74% of the outstanding shares of the Fund. The Fund and the Fund’s principal underwriter or adviser, are parties to participation agreements with these entities whereby these entities sell units of interest in separate accounts funding variable products that are invested in the Fund. The Fund, Invesco and/or Invesco affiliates may make payments to these entities, which are considered to be related to the Fund, for providing services to the Fund, Invesco and/or Invesco affiliates including but not limited to services such as, securities brokerage, third party record keeping and account servicing and administrative services. The Fund has no knowledge as to whether all or any portion of the shares owned of record by these entities are also owned beneficially. |
Invesco V.I. Value Opportunities Fund
Report of Independent Registered Public Accounting Firm
To the Board of Trustees of AIM Variable Insurance Funds (Invesco Variable Insurance Funds) and Shareholders of Invesco V.I. Value Opportunities Fund
Opinion on the Financial Statements
We have audited the accompanying statement of assets and liabilities, including the schedule of investments, of Invesco V.I. Value Opportunities Fund (one of the funds constituting AIM Variable Insurance Funds (Invesco Variable Insurance Funds), referred to hereafter as the “Fund”) as of December 31, 2019, the related statement of operations for the year ended December 31, 2019, the statement of changes in net assets for each of the two years in the period ended December 31, 2019, including the related notes, and the financial highlights for each of the five years in the period ended December 31, 2019 (collectively referred to as the “financial statements”). In our opinion, the financial statements present fairly, in all material respects, the financial position of the Fund as of December 31, 2019, the results of its operations for the year then ended, the changes in its net assets for each of the two years in the period ended December 31, 2019 and the financial highlights for each of the five years in the period ended December 31, 2019 in conformity with accounting principles generally accepted in the United States of America.
Basis for Opinion
These financial statements are the responsibility of the Fund’s management. Our responsibility is to express an opinion on the Fund’s financial statements based on our audits. We are a public accounting firm registered with the Public Company Accounting Oversight Board (United States) (PCAOB) and are required to be independent with respect to the Fund in accordance with the U.S. federal securities laws and the applicable rules and regulations of the Securities and Exchange Commission and the PCAOB.
We conducted our audits of these financial statements in accordance with the standards of the PCAOB. Those standards require that we plan and perform the audit to obtain reasonable assurance about whether the financial statements are free of material misstatement, whether due to error or fraud.
Our audits included performing procedures to assess the risks of material misstatement of the financial statements, whether due to error or fraud, and performing procedures that respond to those risks. Such procedures included examining, on a test basis, evidence regarding the amounts and disclosures in the financial statements. Our audits also included evaluating the accounting principles used and significant estimates made by management, as well as evaluating the overall presentation of the financial statements. Our procedures included confirmation of securities owned as of December 31, 2019 by correspondence with the custodian and transfer agent; We believe that our audits provide a reasonable basis for our opinion.
/s/PricewaterhouseCoopers LLP
Houston, Texas
February 18, 2020
We have served as the auditor of one or more of the investment companies in the Invesco group of investment companies since at least 1995. We have not been able to determine the specific year we began serving as auditor.
Invesco V.I. Value Opportunities Fund
Calculating your ongoing Fund expenses
Example
As a shareholder of the Fund, you incur ongoing costs, including management fees; distribution and/or service fees(12b-1); and other Fund expenses. This example is intended to help you understand your ongoing costs (in dollars) of investing in the Fund and to compare these costs with ongoing costs of investing in other mutual funds. The example is based on an investment of $1,000 invested at the beginning of the period and held for the entire period July 1, 2019 through December 31, 2019.
The actual and hypothetical expenses in the examples below do not represent the effect of any fees or other expenses assessed in connection with a variable product; if they did, the expenses shown would be higher while the ending account values shown would be lower.
Actual expenses
The table below provides information about actual account values and actual expenses. You may use the information in this table, together with the amount you invested, to estimate the expenses that you paid over the period. Simply divide your account value by $1,000 (for example, an $8,600 account value divided by $1,000 = 8.6), then multiply the result by the number in the table under the heading entitled “Actual Expenses Paid During Period” to estimate the expenses you paid on your account during this period.
Hypothetical example for comparison purposes
The table below also provides information about hypothetical account values and hypothetical expenses based on the Fund’s actual expense ratio and an assumed rate of return of 5% per year before expenses, which is not the Fund’s actual return.
The hypothetical account values and expenses may not be used to estimate the actual ending account balance or expenses you paid for the period. You may use this information to compare the ongoing costs of investing in the Fund and other funds. To do so, compare this 5% hypothetical example with the 5% hypothetical examples that appear in the shareholder reports of the other funds.
Please note that the expenses shown in the table are meant to highlight your ongoing costs. Therefore, the hypothetical information is useful in comparing ongoing costs, and will not help you determine the relative total costs of owning different funds.
| | | | | | | | | | | | |
| | | Beginning
Account Value
(07/01/19) | | ACTUAL | | HYPOTHETICAL (5% annual return before
expenses) | | Annualized
Expense
Ratio |
| | Ending
Account Value
(12/31/19)1 | | Expenses
Paid During
Period2 | | Ending
Account Value
(12/31/19) | | Expenses
Paid During
Period2 |
Series I | | $1,000.00 | | $1,073.80 | | $5.17 | | $1,020.21 | | $5.04 | | 0.99% |
Series II | | 1,000.00 | | 1,071.00 | | 6.47 | | 1,018.95 | | 6.31 | | 1.24 |
| 1 | The actual ending account value is based on the actual total return of the Fund for the period July 1, 2019 through December 31, 2019, after actual expenses and will differ from the hypothetical ending account value which is based on the Fund’s expense ratio and a hypothetical annual return of 5% before expenses. |
| 2 | Expenses are equal to the Fund’s annualized expense ratio as indicated above multiplied by the average account value over the period, multiplied by 184/365 to reflect the most recent fiscal half year. |
Invesco V.I. Value Opportunities Fund
Tax Information
Form1099-DIV, Form1042-S and other year–end tax information provide shareholders with actual calendar year amounts that should be included in their tax returns. Shareholders should consult their tax advisers.
The following distribution information is being provided as required by the Internal Revenue Code or to meet a specific state’s requirement.
The Fund designates the following amounts or, if subsequently determined to be different, the maximum amount allowable for its fiscal year ended December 31, 2019:
| | | | | | | | |
| | Federal and State Income Tax | | | | | | |
| | Long-Term Capital Gain Distributions | | $ | 16,345,292 | | | |
| | Corporate Dividends Received Deduction* | | | 49.46 | % | | |
| | Qualified Dividend Income* | | | 0.00 | % | | |
| | U.S. Treasury Obligations* | | | 0.00 | % | | |
* The above percentages are based on ordinary income dividends paid to shareholders during the Fund’s fiscal year.
Invesco V.I. Value Opportunities Fund
Trustees and Officers
The address of each trustee and officer is AIM Variable Insurance Funds (Invesco Variable Insurance Funds) (the “Trust”), 11 Greenway Plaza, Suite 1000, Houston, Texas 77046-1173. The trustees serve for the life of the Trust, subject to their earlier death, incapacitation, resignation, retirement or removal as more specifically provided in the Trust’s organizational documents. Each officer serves for a one year term or until their successors are elected and qualified. Column two below includes length of time served with predecessor entities, if any.
| | | | | | | | |
Name, Year of Birth and Position(s) Held with the Trust | | Trustee and/or Officer Since | | Principal Occupation(s) During Past 5 Years | | Number of
Funds in
Fund Complex
Overseen by
Trustee | | Other Directorship(s) Held by Trustee
During Past 5 Years |
| Interested Person |
Martin L. Flanagan1- 1960 Trustee and Vice Chair | | 2007 | | Executive Director, Chief Executive Officer and President, Invesco Ltd. (ultimate parent of Invesco and a global investment management firm); Trustee and Vice Chair, The Invesco Funds; Vice Chair, Investment Company Institute; and Member of Executive Board, SMU Cox School of Business Formerly: Advisor to the Board, Invesco Advisers, Inc. (formerly known as Invesco Institutional (N.A.), Inc.); Chairman and Chief Executive Officer, Invesco Advisers, Inc. (registered investment adviser); Director, Chairman, Chief Executive Officer and President, Invesco Holding Company (US), Inc. (formerly IVZ Inc.) (holding company), Invesco Group Services, Inc. (service provider) and Invesco North American Holdings, Inc. (holding company); Director, Chief Executive Officer and President, Invesco Holding Company Limited (parent of Invesco and a global investment management firm); Director, Invesco Ltd.; Chairman, Investment Company Institute and President,Co-Chief Executive Officer,Co-President, Chief Operating Officer and Chief Financial Officer, Franklin Resources, Inc. (global investment management organization) | | 229 | | None |
| 1 | Mr. Flanagan is considered an interested person (within the meaning of Section 2(a)(19) of the 1940 Act) of the Trust because he is an officer of the Adviser to the Trust, and an officer and a director of Invesco Ltd., ultimate parent of the Adviser. |
Invesco V.I. Value Opportunities Fund
Trustees and Officers–(continued)
| | | | | | | | |
Name, Year of Birth and Position(s) Held with the Trust | | Trustee and/or Officer Since | | Principal Occupation(s) During Past 5 Years | | Number of
Funds in
Fund Complex
Overseen by
Trustee | | Other Directorship(s) Held by Trustee
During Past 5 Years |
| Independent Trustees |
Bruce L. Crockett - 1944 Trustee and Chair | | 1993 | | Chairman, Crockett Technologies Associates (technology consulting company) Formerly: Director, Captaris (unified messaging provider); Director, President and Chief Executive Officer, COMSAT Corporation; Chairman, Board of Governors of INTELSAT (international communications company); ACE Limited (insurance company); Independent Directors Council and Investment Company Institute: Member of the Audit Committee, Investment Company Institute; Member of the Executive Committee and Chair of the Governance Committee, Independent Directors Council | | 229 | | Director and Chairman of the Audit Committee, ALPS (Attorneys Liability Protection Society) (insurance company); Director and Member of the Audit Committee and Compensation Committee, Ferroglobe PLC (metallurgical company) |
David C. Arch - 1945 Trustee | | 2010 | | Chairman of Blistex Inc. (consumer health care products manufacturer); Member, World Presidents’ Organization | | 229 | | Board member of the Illinois Manufacturers’ Association |
Beth Ann Brown - 1968 Trustee | | 2019 | | Independent Consultant Formerly: Head of Intermediary Distribution, Managing Director, Strategic Relations, Managing Director, Head of National Accounts, Senior Vice President, National Account Manager and Senior Vice President, Key Account Manager, Columbia Management Investment Advisers LLC; Vice President, Key Account Manager, Liberty Funds Distributor, Inc.; and Trustee of certain Oppenheimer Funds | | 229 | | Director, Board of Directors of Caron Engineering Inc.; Advisor, Board of Advisors of Caron Engineering Inc.; President and Director, Acton Shapleigh Youth Conservation Corps (non - profit); and Vice President and Director of Grahamtastic Connection (non-profit) |
Jack M. Fields - 1952 Trustee | | 1997 | | Chief Executive Officer, Twenty First Century Group, Inc. (government affairs company); and Chairman, Discovery Learning Alliance(non-profit) Formerly: Owner and Chief Executive Officer, Dos Angeles Ranch L.P. (cattle, hunting, corporate entertainment); Director, Insperity, Inc. (formerly known as Administaff) (human resources provider); Chief Executive Officer, Texana Timber LP (sustainable forestry company); Director of Cross Timbers Quail Research Ranch(non-profit); and member of the U.S. House of Representatives | | 229 | | None |
Invesco V.I. Value Opportunities Fund
Trustees and Officers–(continued)
| | | | | | | | |
Name, Year of Birth and Position(s) Held with the Trust | | Trustee and/or Officer Since | | Principal Occupation(s) During Past 5 Years | | Number of
Funds in
Fund Complex
Overseen by
Trustee | | Other Directorship(s) Held by Trustee
During Past 5 Years |
| Independent Trustees–(continued) |
Cynthia Hostetler - 1962 Trustee | | 2017 | | Non-Executive Director and Trustee of a number of public and private business corporations Formerly: Director, Aberdeen Investment Funds (4 portfolios); Head of Investment Funds and Private Equity, Overseas Private Investment Corporation; President, First Manhattan Bancorporation, Inc.; Attorney, Simpson Thacher & Bartlett LLP | | 229 | | Vulcan Materials Company (construction materials company); Trilinc Global Impact Fund; Genesee & Wyoming, Inc. (railroads); Artio Global Investment LLC (mutual fund complex); Edgen Group, Inc. (specialized energy and infrastructure products distributor); Investment Company Institute (professional organization); Independent Directors Council (professional organization) |
Eli Jones - 1961 Trustee | | 2016 | | Professor and Dean, Mays Business School - Texas A&M University Formerly: Professor and Dean, Walton College of Business, University of Arkansas and E.J. Ourso College of Business, Louisiana State University; Director, Arvest Bank | | 229 | | Insperity, Inc. (formerly known as Administaff) (human resources provider) |
Elizabeth Krentzman - 1959 Trustee | | 2019 | | Formerly: Principal and Chief Regulatory Advisor for Asset Management Services and U.S. Mutual Fund Leader of Deloitte & Touche LLP; General Counsel of the Investment Company Institute (trade association); National Director of the Investment Management Regulatory Consulting Practice, Principal, Director and Senior Manager of Deloitte & Touche LLP; Assistant Director of the Division of Investment Management - Office of Disclosure and Investment Adviser Regulation of the U.S. Securities and Exchange Commission and various positions with the Division of Investment Management - Office of Regulatory Policy of the U.S. Securities and Exchange Commission; Associate at Ropes & Gray LLP; Advisory Board Member of the Securities and Exchange Commission Historical Society; and Trustee of certain Oppenheimer Funds | | 229 | | Trustee of the University of Florida National Board Foundation and Audit Committee Member; Member of the Cartica Funds Board of Directors (private investment funds); Member of the University of Florida Law Center Association, Inc. Board of Trustees and Audit Committee Member |
Anthony J. LaCava, Jr. - 1956 Trustee | | 2019 | | Formerly: Director and Member of the Audit Committee, Blue Hills Bank (publicly traded financial institution) and Managing Partner, KPMG LLP | | 229 | | Blue Hills Bank; Chairman, Bentley University; Member, Business School Advisory Council; and Nominating Committee KPMG LLP |
Prema Mathai-Davis - 1950 Trustee | | 1998 | | Retired Co-Owner & Partner of Quantalytics Research, LLC, (a FinTech Investment Research Platform for the Self-Directed Investor) | | 229 | | None |
Invesco V.I. Value Opportunities Fund
Trustees and Officers–(continued)
| | | | | | | | |
Name, Year of Birth and Position(s) Held with the Trust | | Trustee and/or Officer Since | | Principal Occupation(s) During Past 5 Years | | Number of
Funds in
Fund Complex
Overseen by
Trustee | | Other Directorship(s) Held by Trustee
During Past 5 Years |
| Independent Trustees–(continued) |
Joel W. Motley - 1952 Trustee | | 2019 | | Director of Office of Finance, Federal Home Loan Bank; Member of the Vestry of Trinity Wall Street; Managing Director of Carmona Motley Inc. (privately held financial advisor); Member of the Finance and Budget Committee of the Council on Foreign Relations, Member of the Investment Committee and Board of Human Rights Watch and Member of the Investment Committee and Board of Historic Hudson Valley(non-profit cultural organization) Formerly: Managing Director of Public Capital Advisors, LLC (privately held financial advisor); Managing Director of Carmona Motley Hoffman, Inc. (privately held financial advisor); Trustee of certain Oppenheimer Funds; and Director of Columbia Equity Financial Corp. (privately held financial advisor) | | 229 | | Director of Greenwall Foundation (bioethics research foundation); Member of Board and Investment Committee of The Greenwall Foundation; Director of Southern Africa Legal Services Foundation; Board Member and Investment Committee Member of Pulizer Center for Crisis Reporting(non-profit journalism) |
Teresa M. Ressel - 1962 Trustee | | 2017 | | Non-executive director and trustee of a number of public and private business corporations Formerly: Chief Financial Officer, Olayan America, The Olayan Group (international investor/commercial/industrial); Chief Executive Officer, UBS Securities LLC; Group Chief Operating Officer, Americas, UBS AG; Assistant Secretary for Management & Budget and CFO, US Department of the Treasury | | 229 | | Atlantic Power Corporation (power generation company); ON Semiconductor Corp. (semiconductor supplier) |
Ann Barnett Stern - 1957 Trustee | | 2017 | | President and Chief Executive Officer, Houston Endowment Inc. (private philanthropic institution) Formerly: Executive Vice President and General Counsel, Texas Children’s Hospital; Attorney, Beck, Redden and Secrest, LLP; Business Law Instructor, University of St. Thomas; Attorney, Andrews & Kurth LLP | | 229 | | Federal Reserve Bank of Dallas |
Robert C. Troccoli - 1949 Trustee | | 2016 | | Retired | | 229 | | None |
| Daniel S. Vandivort - 1954 Trustee | | 2019 | | Treasurer, Chairman of the Audit and Finance Committee, and Trustee, Board of Trustees, Huntington Disease Foundation of America; and President, Flyway Advisory Services LLC (consulting and property management) Formerly: Trustee and Governance Chair, of certain Oppenheimer Funds | | 229 | | Chairman and Lead Independent Director, Chairman of the Audit Committee, and Director, Board of Directors, Value Line Funds |
| James D. Vaughn - 1945 Trustee | | 2019 | | Retired Formerly: Managing Partner, Deloitte & Touche LLP; Trustee and Chairman of the Audit Committee, Schroder Funds; Board Member, Mile High United Way, Boys and Girls Clubs, Boy Scouts, Colorado Business Committee for the Arts, Economic Club of Colorado and Metro Denver Network (economic development corporation); and Trustee of certain Oppenheimer Funds | | 229 | | Board member and Chairman of Audit Committee of AMG National Trust Bank; Trustee and Investment Committee member, University of South Dakota Foundation; Board member, Audit Committee Member and past Board Chair, Junior Achievement(non-profit) |
Invesco V.I. Value Opportunities Fund
Trustees and Officers–(continued)
| | | | | | | | |
Name, Year of Birth and Position(s) Held with the Trust | | Trustee and/or Officer Since | | Principal Occupation(s) During Past 5 Years | | Number of
Funds in
Fund Complex
Overseen by
Trustee | | Other Directorship(s) Held by Trustee
During Past 5 Years |
| Independent Trustees–(continued) |
| Christopher L. WIlson - 1957 Trustee, Vice Chair and Chair Designate | | 2017 | | Retired Formerly: Director, TD Asset Management USA Inc. (mutual fund complex) (22 portfolios); Managing Partner, CT2, LLC (investing and consulting firm); President/Chief Executive Officer, Columbia Funds, Bank of America Corporation; President/Chief Executive Officer, CDC IXIS Asset Management Services, Inc.; Principal & Director of Operations, Scudder Funds, Scudder, Stevens & Clark, Inc.; Assistant Vice President, Fidelity Investments | | 229 | | ISO New England, Inc.(non-profit organization managing regional electricity market) |
Invesco V.I. Value Opportunities Fund
Trustees and Officers–(continued)
| | | | | | | | |
Name, Year of Birth and Position(s) Held with the Trust | | Trustee and/or Officer Since | | Principal Occupation(s) During Past 5 Years | | Number of
Funds in
Fund Complex
Overseen by
Trustee | | Other Directorship(s) Held by Trustee
During Past 5 Years |
| Officers |
Sheri Morris - 1964 President, Principal Executive Officer and Treasurer | | 1999 | | Head of Global Fund Services, Invesco Ltd.; President, Principal Executive Officer and Treasurer, The Invesco Funds; Vice President, Invesco Advisers, Inc. (formerly known as Invesco Institutional (N.A.), Inc.) (registered investment adviser); and Vice President, Invesco Exchange-Traded Fund Trust, Invesco Exchange-Traded Fund Trust II, Invesco India Exchange-Traded Fund Trust, Invesco Actively Managed Exchange-Traded Fund Trust, Invesco Actively Managed Exchange-Traded Commodity Fund Trust and Invesco Exchange-Traded Self-Indexed Fund Trust; and Vice President, OppenheimerFunds, Inc. Formerly: Vice President and Principal Financial Officer, The Invesco Funds; Vice President, Invesco AIM Advisers, Inc., Invesco AIM Capital Management, Inc. and Invesco AIM Private Asset Management, Inc.; Assistant Vice President and Assistant Treasurer, The Invesco Funds and Assistant Vice President, Invesco Advisers, Inc., Invesco AIM Capital Management, Inc. and Invesco AIM Private Asset Management, Inc.; and Treasurer, Invesco Exchange-Traded Fund Trust, Invesco Exchange-Traded Fund Trust II, Invesco India Exchange-Traded Fund Trust and Invesco Actively Managed Exchange-Traded Fund Trust | | N/A | | N/A |
Russell C. Burk - 1958 Senior Vice President and Senior Officer | | 2005 | | Senior Vice President and Senior Officer, The Invesco Funds | | N/A | | N/A |
Jeffrey H. Kupor - 1968 Senior Vice President, Chief Legal Officer and Secretary | | 2018 | | Head of Legal of the Americas, Invesco Ltd.; Senior Vice President and Secretary, Invesco Advisers, Inc. (formerly known as Invesco Institutional (N.A.), Inc.) (registered investment adviser); Senior Vice President and Secretary, Invesco Distributors, Inc. (formerly known as Invesco AIM Distributors, Inc.); Vice President and Secretary, Invesco Investment Services, Inc. (formerly known as Invesco AIM Investment Services, Inc.) Senior Vice President, Chief Legal Officer and Secretary, The Invesco Funds; Secretary and General Counsel, Invesco Investment Advisers LLC (formerly known as Van Kampen Asset Management); Secretary and General Counsel, Invesco Capital Markets, Inc. (formerly known as Van Kampen Funds Inc.) and Chief Legal Officer, Invesco Exchange-Traded Fund Trust, Invesco Exchange-Traded Fund Trust II, Invesco India Exchange-Traded Fund Trust, Invesco Actively Managed Exchange-Traded Fund Trust, Invesco Actively Managed Exchange-Traded Commodity Fund Trust and Invesco Exchange-Traded Self-Indexed Fund Trust; Secretary, Invesco Indexing LLC; Secretary, W.L. Ross & Co., LLC Formerly: Secretary and Vice President, Jemstep, Inc.; Head of Legal, Worldwide Institutional, Invesco Ltd.; Secretary and General Counsel, INVESCO Private Capital Investments, Inc.; Senior Vice President, Secretary and General Counsel, Invesco Management Group, Inc. (formerly known as Invesco AIM Management Group, Inc.); Assistant Secretary, INVESCO Asset Management (Bermuda) Ltd.; Secretary and General Counsel, Invesco Private Capital, Inc.; Assistant Secretary and General Counsel, INVESCO Realty, Inc.; Secretary and General Counsel, Invesco Senior Secured Management, Inc.; and Secretary, Sovereign G./P. Holdings Inc. | | N/A | | N/A |
Andrew R. Schlossberg - 1974 Senior Vice President | | 2019 | | Head of the Americas and Senior Managing Director, Invesco Ltd.; Director and Senior Vice President, Invesco Advisers, Inc. (formerly known as Invesco Institutional (N.A.), Inc.) (registered investment adviser); Director and Chairman, Invesco Investment Services, Inc. (formerly known as Invesco AIM Investment Services, Inc.) (registered transfer agent); Senior Vice President, The Invesco Funds; Director, Invesco Investment Advisers LLC (formerly known as Van Kampen Asset Management); Director, President and Chairman, Invesco Insurance Agency, Inc. Formerly: Director, Invesco UK Limited; Director and Chief Executive, Invesco Asset Management Limited and Invesco Fund Managers Limited; Assistant Vice President, The Invesco Funds; Senior Vice President, Invesco Advisers, Inc. (formerly known as Invesco Institutional (N.A.), Inc.) (registered investment adviser); Director and Chief Executive, Invesco Administration Services Limited and Invesco Global Investment Funds Limited; Director, Invesco Distributors, Inc.; Head of EMEA, Invesco Ltd.; President, Invesco Actively Managed Exchange-Traded Commodity Fund Trust, Invesco Actively Managed Exchange-Traded Fund Trust, Invesco Exchange-Traded Fund Trust, Invesco Exchange-Traded Fund Trust II and Invesco India Exchange-Traded Fund Trust; Managing Director and Principal Executive Officer, Invesco Capital Management LLC | | N/A | | N/A |
Invesco V.I. Value Opportunities Fund
Trustees and Officers–(continued)
| | | | | | | | |
Name, Year of Birth and Position(s) Held with the Trust | | Trustee and/or Officer Since | | Principal Occupation(s) During Past 5 Years | | Number of
Funds in
Fund Complex
Overseen by
Trustee | | Other Directorship(s) Held by Trustee
During Past 5 Years |
| Officers–(continued) |
John M. Zerr - 1962 Senior Vice President | | 2006 | | Chief Operating Officer of the Americas; Senior Vice President, Invesco Advisers, Inc. (formerly known as Invesco Institutional (N.A.), Inc.) (registered investment adviser); Senior Vice President, Invesco Distributors, Inc. (formerly known as Invesco AIM Distributors, Inc.); Director and Vice President, Invesco Investment Services, Inc. (formerly known as Invesco AIM Investment Services, Inc.) Senior Vice President, The Invesco Funds; Managing Director, Invesco Capital Management LLC; Director, Invesco Investment Advisers LLC (formerly known as Van Kampen Asset Management); Senior Vice President, Invesco Capital Markets, Inc. (formerly known as Van Kampen Funds Inc.); Manager, Invesco Indexing LLC; Manager, Invesco Specialized Products, LLC; Director and Senior Vice President, Invesco Insurance Agency, Inc.; Member, Invesco Canada Funds Advisory Board; Director, President and Chief Executive Officer, Invesco Corporate Class Inc. (corporate mutual fund company); and Director, Chairman, President and Chief Executive Officer, Invesco Canada Ltd. (formerly known as Invesco Trimark Ltd./Invesco Trimark Ltèe) (registered investment adviser and registered transfer agent) Formerly: Director and Senior Vice President, Invesco Management Group, Inc. (formerly known as Invesco AIM Management Group, Inc.); Secretary and General Counsel, Invesco Management Group, Inc. (formerly known as Invesco AIM Management Group, Inc.); Secretary, Invesco Investment Services, Inc. (formerly known as Invesco AIM Investment Services, Inc.); Chief Legal Officer and Secretary, The Invesco Funds; Secretary and General Counsel, Invesco Investment Advisers LLC (formerly known as Van Kampen Asset Management); Secretary and General Counsel, Invesco Capital Markets, Inc. (formerly known as Van Kampen Funds Inc.); Chief Legal Officer, Invesco Exchange-Traded Fund Trust, Invesco Exchange-Traded Fund Trust II, Invesco India Exchange-Traded Fund Trust, Invesco Actively Managed Exchange-Traded Fund Trust, Invesco Actively Managed Exchange-Traded Commodity Fund Trust and Invesco Exchange-Traded Self-Indexed Fund Trust; Secretary, Invesco Indexing LLC; Director, Secretary, General Counsel and Senior Vice President, Van Kampen Exchange Corp.; Director, Vice President and Secretary, IVZ Distributors, Inc. (formerly known as INVESCO Distributors, Inc.); Director and Vice President, INVESCO Funds Group, Inc.; Director and Vice President, Van Kampen Advisors Inc.; Director, Vice President, Secretary and General Counsel, Van Kampen Investor Services Inc.; Director and Secretary, Invesco Distributors, Inc. (formerly known as Invesco AIM Distributors, Inc.); Director, Senior Vice President, General Counsel and Secretary, Invesco AIM Advisers, Inc. and Van Kampen Investments Inc.; Director, Vice President and Secretary, Fund Management Company; Director, Senior Vice President, Secretary, General Counsel and Vice President, Invesco AIM Capital Management, Inc.; Chief Operating Officer and General Counsel, Liberty Ridge Capital, Inc. (an investment adviser) | | N/A | | N/A |
Gregory G. McGreevey - 1962 Senior Vice President | | 2012 | | Senior Managing Director, Invesco Ltd.; Director, Chairman, President, and Chief Executive Officer, Invesco Advisers, Inc. (formerly known as Invesco Institutional (N.A.), Inc.) (registered investment adviser); Director, Invesco Mortgage Capital, Inc. and Invesco Senior Secured Management, Inc.; and Senior Vice President, The Invesco Funds; and President, SNW Asset Management Corporation Formerly: Senior Vice President, Invesco Management Group, Inc. and Invesco Advisers, Inc.; Assistant Vice President, The Invesco Funds | | N/A | | N/A |
Kelli Gallegos - 1970 Vice President, Principal Financial Officer and Assistant Treasurer | | 2008 | | Principal Financial and Accounting Officer - Investments Pool, Invesco Specialized Products, LLC; Vice President, Principal Financial Officer and Assistant Treasurer, The Invesco Funds; Principal Financial and Accounting Officer - Pooled Investments, Invesco Capital Management LLC; Vice President and Treasurer, Invesco Exchange-Traded Fund Trust, Invesco Exchange-Traded Fund Trust II, Invesco India Exchange-Traded Fund Trust, Invesco Actively Managed Exchange-Traded Fund Trust, Invesco Actively Managed Exchange-Traded Commodity Fund Trust and Invesco Exchange-Traded Self-Indexed Fund Trust Formerly: Assistant Treasurer, Invesco Specialized Products, LLC; Assistant Treasurer, Invesco Exchange-Traded Fund Trust, Invesco Exchange-Traded Fund Trust II, Invesco India Exchange-Traded Fund Trust, Invesco Actively Managed Exchange-Traded Fund Trust, Invesco Actively Managed Exchange-Traded Commodity Fund Trust and Invesco Exchange-Traded Self-Indexed Fund Trust; Assistant Treasurer, Invesco Capital Management LLC; Assistant Vice President, The Invesco Funds | | N/A | | N/A |
Invesco V.I. Value Opportunities Fund
Trustees and Officers–(continued)
| | | | | | | | |
Name, Year of Birth and Position(s) Held with the Trust | | Trustee and/or Officer Since | | Principal Occupation(s) During Past 5 Years | | Number of
Funds in
Fund Complex
Overseen by
Trustee | | Other Directorship(s) Held by Trustee
During Past 5 Years |
| Officers–(continued) |
Crissie M. Wisdom - 1969 Anti-Money Laundering Compliance Officer | | 2013 | | Anti-Money Laundering Compliance Officer, Invesco Advisers, Inc. (formerly known as Invesco Institutional (N.A.), Inc.) (registered investment adviser), Invesco Capital Markets, Inc. (formerly known as Van Kampen Funds Inc.), Invesco Distributors, Inc., Invesco Investment Services, Inc., The Invesco Funds, and Invesco Exchange-Traded Fund Trust, Invesco Exchange-Traded Fund Trust II, Invesco India Exchange-Traded Fund Trust, Invesco Actively Managed Exchange-Traded Fund Trust, Invesco Actively Managed Exchange-Traded Commodity Fund Trust and Invesco Exchange-Traded Self-Indexed Fund Trust; Anti-Money Laundering Compliance Officer and Bank Secrecy Act Officer, INVESCO National Trust Company and Invesco Trust Company; and Fraud Prevention Manager and Controls and Risk Analysis Manager for Invesco Investment Services, Inc. Formerly: Anti-Money Laundering Compliance Officer, Van Kampen Exchange Corp. and Invesco Management Group, Inc. | | N/A | | N/A |
Robert R. Leveille - 1969 Chief Compliance Officer | | 2016 | | Chief Compliance Officer, Invesco Advisers, Inc. (registered investment adviser); and Chief Compliance Officer, The Invesco Funds Formerly: Chief Compliance Officer, Putnam Investments and the Putnam Funds | | N/A | | N/A |
The Statement of Additional Information of the Trust includes additional information about the Fund’s Trustees and is available upon request, without charge, by calling 1.800.959.4246. Please refer to the Fund’s Statement of Additional Information for information on the Fund’ssub-advisers.
| | | | | | |
| Office of the Fund | | Investment Adviser | | Distributor | | Auditors |
| 11 Greenway Plaza, Suite 1000 | | Invesco Advisers, Inc. | | Invesco Distributors, Inc. | | PricewaterhouseCoopers LLP |
| Houston, TX 77046-1173 | | 1555 Peachtree Street, N.E. | | 11 Greenway Plaza, Suite 1000 | | 1000 Louisiana Street, Suite 5800 |
| | Atlanta, GA 30309 | | Houston, TX 77046-1173 | | Houston, TX 77002-5678 |
| | | |
| Counsel to the Fund | | Counsel to the Independent Trustees | | Transfer Agent | | Custodian |
| Stradley Ronon Stevens & Young, LLP | | Goodwin Procter LLP | | Invesco Investment Services, Inc. | | State Street Bank and Trust Company |
| 2005 Market Street, Suite 2600 | | 901 New York Avenue, N.W. | | 11 Greenway Plaza, Suite 1000 | | 225 Franklin Street |
| Philadelphia, PA 19103-7018 | | Washington, D.C. 20001 | | Houston, TX 77046-1173 | | Boston, MA 02110-2801 |
Invesco V.I. Value Opportunities Fund
| | | | |
 | | Annual Report | | 12/31/2019 |
| | |
| | Invesco Oppenheimer V.I. Capital Appreciation Fund* | | |
| |
| | Beginning on January 1, 2021, as permitted by regulations adopted by the Securities and Exchange Commission, the insurance company that offers your variable annuity or variable life insurance contract may no longer send you paper copies of the Fund’s shareholder reports by mail, unless you specifically request paper copies of the reports from the insurance company or your financial intermediary. Instead of delivering paper copies of the report, the insurance company may choose to make the reports available on a website, and will notify you by mail each time a report is posted and provide you with a website link to access the report. Instructions for requesting paper copies will be provided by your insurance company. If the insurance company offers electronic delivery, you may elect to receive shareholder reports and other communications about the Fund electronically by following the instructions provided by the insurance company or by contacting your financial intermediary. If you already elected to receive shareholder reports electronically, you will not be affected by this change and you need not take any action. You may elect to receive all future reports in paper free of charge from the insurance company. You can inform the insurance company or your financial intermediary that you wish to continue receiving paper copies of your shareholder reports by following the instructions provided by the insurance company or by contacting your financial intermediary. Your election to receive reports in paper will apply to all portfolio companies available under your contract with the insurance company. The Fund provides a complete list of its holdings four times in each fiscal year, at the quarter ends. For the second and fourth quarters, the lists appear in the Fund’s semi annual and annual reports to shareholders. For the first and third quarters, the Fund files the lists with the Securities and Exchange Commission (SEC) as an exhibit to its reports on FormN-PORT. The Fund’s FormN-PORT filings are available on the SEC website, sec.gov. The Fund’s most recent portfolio holdings, as filed on FormN-PORT, have also been made available to insurance companies issuing variable annuity contracts and variable life insurance policies (“variable products”) that invest in the Fund. A description of the policies and procedures that the Fund uses to determine how to vote proxies relating to portfolio securities is available without charge, upon request, from our Client Services department at 800 959 4246 or at invesco.com/proxyguidelines. The information is also available on the SEC website, sec.gov. Information regarding how the Fund voted proxies related to its portfolio securities during the most recent12-month period ended June 30 is available at invesco.com/proxysearch. The information is also available on the SEC website, sec.gov. Invesco Advisers, Inc. is an investment adviser; it provides investment advisory services to individual and institutional clients and does not sell securities. Invesco Distributors, Inc. is the US distributor for Invesco Ltd.’s retail mutual funds, exchange- traded funds and institutional money market funds. Both are wholly owned, indirect subsidiaries of Invesco Ltd. This report must be accompanied or preceded by a currently effective Fund prospectus and variable product prospectus, which contain more complete information, including sales charges and expenses. Investors should read each carefully before investing. *Prior to the close of business on May 24, 2019, the Fund’s name was Oppenheimer Capital Appreciation Fund/VA. See Important Update on the following page for more information. |
Important Update
On October 18, 2018, Massachusetts Mutual Life Insurance Company, an indirect corporate parent of OppenheimerFunds, Inc. and its subsidiaries OFI Global Asset Management, Inc., OFI SteelPath, Inc. and OFI Advisors, LLC, announced that it had entered into an agreement whereby Invesco Ltd., a global investment management company would acquire OppenheimerFunds and its subsidiaries (together, “OppenheimerFunds”). After the close of business on May 24, 2019 Invesco Ltd. completed the acquisition of OppenheimerFunds. This Fund was included in that acquisition and as of that date, became part of the Invesco family of funds. Please visit invesco.com for more information or call Invesco’s Client Services team at800-959-4246.
PORTFOLIO MANAGER:Erik Voss, Ido Cohen1
AVERAGE ANNUAL TOTAL RETURNS FOR THE PERIODS ENDED 12/31/19
| | | | | | | | | | | | | | | | |
| | | Inception Date | | | 1-Year | | | 5-Year | | | 10-Year | |
Series I Shares2 | | | 4/3/85 | | | | 36.20 | % | | | 10.52 | % | | | 11.79 | % |
Series II Shares2 | | | 9/18/01 | | | | 35.84 | | | | 10.24 | | | | 11.51 | |
S&P 500 Index | | | | | | | 31.49 | | | | 11.70 | | | | 13.56 | |
Russell 1000 Growth Index | | | | | | | 36.39 | | | | 14.63 | | | | 15.22 | |
Performance quoted is past performance and cannot guarantee comparable future results; current performance may be lower or higher. Visit invesco.com for the most recentmonth-end performance. Performance figures reflect reinvested distributions and changes in net asset value (NAV). Investment return and principal value will vary so that you may have a gain or a loss when you sell shares. Fund returns include changes in share price, reinvested distributions. Performance figures given represent the Fund and are not intended to reflect actual variable product values. They do not reflect sales charges, expenses and fees assessed in connection with a variable product. Sales charges, expenses and fees, which are determined by the variable product issuers, will vary and will lower the total return. Returns for periods of less than one year are cumulative and not annualized. As the result of a reorganization after the close of business on May 24, 2019, theNon-Service and Service share classes of the predecessor fund were reorganized into Series I and Series II Shares, respectively, of the Fund. Returns shown for Series I and Series II shares are blended returns of the predecessor fund and the Fund. Share class returns will differ from those of the Oppenheimer predecessor fund because of different expenses. See Fund prospectuses and summary prospectuses for more information on share classes, sales charges and new fee agreements, if any. Fund literature is available at invesco.com.
TOP HOLDINGS AND ALLOCATIONS
TOP TEN COMMON STOCK HOLDINGS
| | | | |
Amazon.com, Inc. | | | 8.3 | % |
Alphabet, Inc., Cl. C | | | 5.3 | |
Facebook, Inc., Cl. A | | | 5.0 | |
Mastercard, Inc., Cl. A | | | 4.3 | |
Microsoft Corp. | | | 4.2 | |
Lowe’s Cos., Inc. | | | 3.1 | |
Alibaba Group Holding Ltd., Sponsored ADR | | | 2.8 | |
Apple, Inc. | | | 2.7 | |
salesforce.com, Inc. | | | 2.4 | |
Activision Blizzard, Inc. | | | 2.2 | |
Holdings and allocations are subject to change and are not buy/sell recommendations. Percentages are as of December 31, 2019, and are based on net assets.
SECTOR ALLOCATION
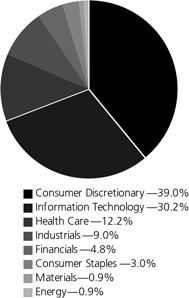
Holdings and allocations are subject to change and are not buy/sell recommendations. Percentages are as of December 31, 2019 and are based on total market value of investments.
For more current Fund holdings, please visit invesco.com.
1. Erik Voss and Ido Chen were named Portfolio Managers of the Fund effective June 21, 2019.
2. Effective after the close of business on May 24, 2019, theNon-Service and Service share classes of the predecessor fund were reorganized into Series I and Series II Shares, respectively, of the Fund. Returns shown for Series I and Series II shares are blended returns of the predecessor fund and the Fund. Share class returns will differ from those of the predecessor fund because of different expenses.
3 INVESCO OPPENHEIMER V.I. CAPITAL APPRECIATION FUND
Fund Performance Discussion
PERFORMANCE SUMMARY
For the year ended December 31, 2019, Series I shares of Invesco Oppenheimer V.I. Capital Appreciation Fund (the Fund) performedin-line with the Russell 1000 Growth Index, the Fund’s benchmark.
On June 21, 2019, Erik Voss and Ido Cohen became the Lead Portfolio Manager andCo-Portfolio Manager, respectively, of the Fund.
Your Fund’s long-term performance appears later in this report.
MARKET CONDITIONS AND YOUR FUND
Equity markets rallied in the first quarter of 2019, fueled by optimism about a potentialUS-China trade deal and indication that the US Federal Reserve (the Fed) would not raise interest rates in 2019, a surprising shift in monetary policy. The Fed’s more accommodative stance provided a supportive environment for equities and fixed income, even as US economic data were mixed and overseas growth appeared to be slowing. Against this backdrop, the S&P 500 Index posted its best first quarter returns since 1998.
Although the S&P 500 Index posted modest gains for the second quarter of 2019, the US stock market experienced increased volatility. After four consecutive months of rising stock markets, the market sold off in May 2019, along with bond yields and oil prices, as investors weighed the impact of the lingering trade war between the US and China, as well as potential tariffs imposed on Mexico. In addition, economic data showed a slowing domestic and global economy.
Key issues that concerned investors in the second quarter of 2019 carried over into the third quarter. TheUS-China trade conflict worried investors and stifled business investment, even as the Fed cut interest rates by 0.25% in July and again in September 2019.1 This environment, combined with evidence of slowing global economic growth, fueled market volatility in August 2019. The US Treasury yield curve inverted several times, increasing fears of a possible US recession. As a result, August saw increased risk aversion, with investors crowding into asset classes perceived as safe havens, such as US Treasuries and gold. However, the Fed’s accommodative tone provided some support for risk assets.
Macroeconomic issues that concerned investors in the third quarter of 2019 mostly abated during the fourth quarter, providing the backdrop for strong equity market returns. Risk assets surged higher as a result of a delay in the Brexit agreement until January 2020, optimism that phase one of aUS-China trade deal would be completed and better-than-expected third-quarter corporate earnings results. The US economy rose higher than expected, at 2.1% during the third quarter of 2019.2 During its October meeting, the Fed cut interest rates again by 0.25% based on business investment and exports remaining weak.2 Investors were also encouraged by a resilient US economy and corporate earnings, putting the US equity market on track for its largest annual rise since 2013.
Given this landscape, the Fund produced a strong, double digit return, performingin-line with its benchmark during the year. Relative detractors included an overweight exposure in energy and stock selection within industrials. Ancillary cash also hurt relative performance given strong equity market returns. Relative contributors included stock selection in consumer discretionary, consumer staples and health care. An underweight exposure in health care and consumer staples was also beneficial.
Top individual detractors from Fund performance included Lyft and Uber. Ridesharing companies Lyft and Uber faced pressure on regulatory headwinds related to the advancement of California’s AB5 regulation which seeks to treat ridesharing drivers as employees rather than contractors which would require greater benefits for drivers such as a protected minimum wage, sick days and health insurance. Though this law is not yet in effect and a settlement or appeal of the law could still materialize, the advancement of the law to this stage has increased uncertainty for the ridesharing business model in California. Longer term, we believed the industry has a large, underpenetrated market and potential to benefit from autonomous driving. Thus, we continued to hold both stocks.
Top individual contributors to Fund performance during the year included Microsoft and Facebook. Investor confidence in Microsoft has grown following strong growth in its cloud platform Azure. Additionally, during the year, Microsoft was awarded the $10 billion JEDI contract from the US Department of Defense, further strengthening its competitive position. We continued to see opportunity for Microsoft to grow revenue and profits as customers continue their digital transformation into the cloud.
4 INVESCO OPPENHEIMER V.I. CAPITAL APPRECIATION FUND
Social media giant Facebook reported strong earnings results during the year that showed increases in its number of users across the world and increased revenue. Going forward, we believed Facebook would improve monetization for areas such as Stories, Watch and Messenger, as well as experience potentially better profits from slowing regulatory and privacy costs.
Our fundamentalbottom-up research led us to overweight exposures in communication services, consumer discretionary and financials at year end, relative to the Fund’s style-specific index. Within consumer discretionary, we are focused on technology-driven share shift, demographics and changing behaviors. Our financials position remains a small portion overall and was focused primarily on alternative asset managers which we believed had potential for sales growth and profit expansion. Underweight exposures included IT and health care. Within IT, semiconductors were the only overweight industry, given a current preference for technology-driven companies within the communication services and consumer discretionary sectors. Our health care underweight is primarily located in biopharma, given potential for increased volatility during an election year. Our industrials positioning leans into defensive, US based, highly consolidated industries with pricing power.
Central bank actions in 2019 supported continued growth by keeping the cost of debt low. The labor market remains healthy with job and wage gains, which is beneficial to consumers.
However, these are clearly the late innings of the economic cycle and, therefore, we expect only modest growth from here, as well as continued volatility spurred by trade and election headlines. Prolonged cyclical growth is likely to be scarce and we believe the market will continue to favor companies that can produce growth and compound earnings in spite of the economic cycle. We believe change is the fuel for growth. Thus, we are seeking to identify “share-takers,” companies that can gain market share through technology-enabled advantages in their business models and from disruptive shifts in consumer behavior.
Thank you for your commitment to the Invesco Oppenheimer V.I. Capital Appreciation Fund and for sharing our long-term investment horizon.
1 Source: US Federal Reserve
2 Source: Bureau of Economic Analysis
Before investing, investors should carefully read the prospectus and/or summary prospectus and carefully consider the investment objectives, risks, charges and expenses. For this and more complete information about the fund(s), investors should ask their advisors for a prospectus/summary prospectus or visit invesco.com/fundprospectus.
Shares of Invesco funds are not deposits or obligations of any bank, are not guaranteed by any bank, are not insured by the FDIC or any other agency, and involve investment risks, including the possible loss of the principal amount invested.
Comparing the Fund’s Performance to the Market.The graphs that follow show the performance of a hypothetical $10,000 investment in each share class of the Fund held until December 31, 2019. Performance is measured over aten-fiscal-year period for both Classes. Performance information does not reflect charges that apply to separate accounts investing in the Fund. If these charges were taken into account, performance would be lower. The graphs assume that all dividends and capital gains distributions were reinvested in additional shares.
The Fund’s performance is compared to the performance of the S&P 500 Index and the Russell 1000 Growth Index. The S&P 500 Index is a broad-based measure of domestic stock performance. The Russell 1000 Growth Index measures the performance of thelarge-cap growth segment of the U.S. equity universe. It includes those Russell 1000 companies with higherprice-to-book ratios and higher forecasted growth values. The indices are unmanaged and cannot be purchased directly by investors. While index comparisons may be useful to provide a benchmark for the Fund’s performance, it must be noted that the Fund’s investments are not limited to the investments comprising the indices. Index performance includes reinvestment of income, but does not reflect transaction costs, fees, expenses or taxes. Index performance is shown for illustrative purposes only as a benchmark for the Fund’s performance and does not predict or depict performance of the Fund. The Fund’s performance reflects the effects of the Fund’s business and operating expenses.
5 INVESCO OPPENHEIMER V.I. CAPITAL APPRECIATION FUND
COMPARISON OF CHANGE IN VALUE OF $10,000 HYPOTHETICAL INVESTMENTS IN:
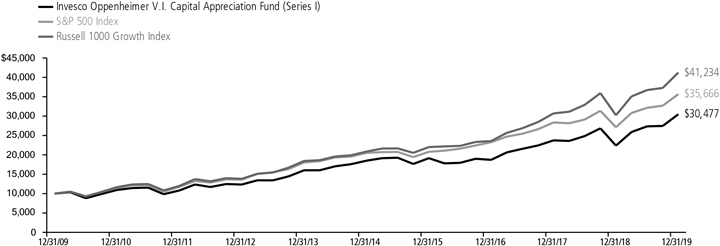
Average Annual Total Returns of Series I Shares of the Fund at 12/31/19
1-Year 36.20% 5-Year 10.52% 10-Year 11.79%
COMPARISON OF CHANGE IN VALUE OF $10,000 HYPOTHETICAL INVESTMENTS IN:
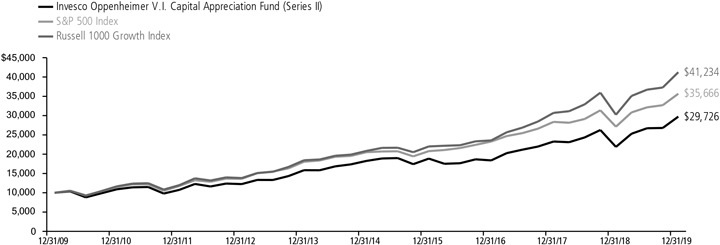
Average Annual Total Returns of Series II Shares of the Fund at 12/31/19
1-Year 35.84% 5-Year 10.24% 10-Year 11.51%
Performance data quoted represents past performance, which does not guarantee future results.The investment return and principal value of an investment in the Fund will fluctuate so that an investor’s shares, when redeemed, may be worth more or less than their original cost. Current performance may be lower or higher than the performance quoted. For performance data current to the most recent month end, call us at 1.800.988.8287. The Fund’s total returns should not be expected to be the same as the returns of other funds, whether or not both funds have the same portfolio managers and/or similar names. The Fund’s total returns include changes in share price and reinvested distributions but do not include the charges associated with the separate account products that offer this Fund. Such performance would have been lower if such charges were taken into account.
6 INVESCO OPPENHEIMER V.I. CAPITAL APPRECIATION FUND
Fund Expenses
Fund Expenses.As a shareholder of the Fund, you incur two types of costs: (1) transaction costs and (2) ongoing costs, including management fees; distribution and service fees; and other Fund expenses. These examples are intended to help you understand your ongoing costs (in dollars) of investing in the Fund and to compare these costs with the ongoing costs of investing in other mutual funds.
The examples are based on an investment of $1,000.00 invested at the beginning of the period and held for the entire6-month period ended December 31, 2019.
Actual Expenses. The first section of the table provides information about actual account values and actual expenses. You may use the information in this section for the class of shares you hold, together with the amount you invested, to estimate the expense that you paid over the period. Simply divide your account value by $1,000.00 (for example, an $8,600.00 account value divided by $1,000.00 = 8.60), then multiply the result by the number in the first section under the heading entitled “Expenses Paid During 6 Months Ended December 31, 2019” to estimate the expenses you paid on your account during this period.
Hypothetical Example for Comparison Purposes.
The second section of the table provides information about hypothetical account values and hypothetical expenses based on the Fund’s actual expense ratio for each class of shares, and an assumed rate of return of 5% per year for each class before expenses, which is not the actual return. The hypothetical account values and expenses may not be used to estimate the actual ending account balance or expenses you paid for the period. You may use this information to compare the ongoing costs of investing in the Fund and other funds. To do so, compare this 5% hypothetical example for the class of shares you hold with the 5% hypothetical examples that appear in the shareholder reports of the other funds.
Please note that the expenses shown in the table are meant to highlight your ongoing costs only and do not reflect any charges associated with the separate accounts that offer this Fund. Therefore, the “hypothetical” lines of the table are useful in comparing ongoing costs only, and will not help you determine the relative total costs of owning different funds. In addition, if these separate account charges were included your costs would have been higher.
| | | | | | | | | | | | | | | | |
| Actual | | Beginning
Account
Value
July 1, 2019 | | | Ending
Account
Value
December 31, 2019 | | | Expenses
Paid During
6 Months Ended
December 31, 2019 | | | | |
Series I shares | | $ | 1,000.00 | | | | $ 1,114.10 | | | | $ 4.27 | | | | | |
Series II shares | | | 1,000.00 | | | | 1,112.70 | | | | 5.61 | | | | | |
| | | | |
Hypothetical (5% return before expenses) | | | | | | | | | | | | | | | | |
Series I shares | | | 1,000.00 | | | | 1,021.17 | | | | 4.08 | | | | | |
Series II shares | | | 1,000.00 | | | | 1,019.91 | | | | 5.36 | | | | | |
Expenses are equal to the Fund’s annualized expense ratio for that class, multiplied by the average account value over the period, multiplied by 184/365 (to reflect theone-half year period). Those annualized expense ratios, excluding indirect expenses from affiliated funds, based on the6-month period ended December 31, 2019 are as follows:
| | | | | | | | | | |
| Class | | Expense Ratios | | |
Series I shares | | | | 0.80% | | | | | | |
Series II shares | | | | 1.05 | | | | | | |
The expense ratios reflect voluntary and/or contractual waivers and/or reimbursements of expenses by the Fund’s Manager. Some of these undertakings may be modified or terminated at any time, as indicated in the Fund’s prospectus. The “Financial Highlights” tables in the Fund’s financial statements, included in this report, also show the gross expense ratios, without such waivers or reimbursements and reduction to custodian expenses, if applicable.
7 INVESCO OPPENHEIMER V.I. CAPITAL APPRECIATION FUND
SCHEDULE OF INVESTMENTSDecember 31, 2019
| | | | | | | | |
| | | Shares | | | Value | |
Common Stocks—100.5% | | | | | | | | |
| Consumer Discretionary—39.3% | |
| Diversified Consumer Services—0.3% | |
| Service Corp. International | | | 51,957 | | | $ | 2,391,581 | |
| Entertainment—7.5% | |
| Activision Blizzard, Inc. | | | 269,552 | | | | 16,016,780 | |
| Electronic Arts, Inc.1 | | | 85,345 | | | | 9,175,441 | |
| IMAX Corp.1 | | | 98,964 | | | | 2,021,834 | |
| Netflix, Inc.1 | | | 11,142 | | | | 3,605,217 | |
| Nintendo Co. Ltd. | | | 33,700 | | | | 13,602,879 | |
| Take-Two Interactive Software, Inc.1 | | | 66,595 | | | | 8,153,226 | |
| Vivendi SA | | | 90,329 | | | | 2,618,194 | |
| | | | | | | | 55,193,571 | |
| Hotels, Restaurants & Leisure—3.0% | |
| Cedar Fair LP | | | 76,716 | | | | 4,253,135 | |
| Norwegian Cruise Line Holdings Ltd.1 | | | 213,314 | | | | 12,459,670 | |
| Restaurant Brands International, Inc. | | | 21,875 | | | | 1,394,969 | |
| Royal Caribbean Cruises Ltd. | | | 30,847 | | | | 4,118,383 | |
| | | | | | | | 22,226,157 | |
| Household Durables—1.5% | |
| Sony Corp. | | | 165,800 | | | | 11,285,474 | |
| Interactive Media & Services—10.3% | |
| Alphabet, Inc., Cl. C1 | | | 28,989 | | | | 38,758,873 | |
| Facebook, Inc., Cl. A1 | | | 180,188 | | | | 36,983,587 | |
| | | | | | | | 75,742,460 | |
| Internet & Catalog Retail—12.2% | |
Alibaba Group Holding Ltd., Sponsored
ADR1 | | | 97,463 | | | | 20,671,902 | |
| Amazon.com, Inc.1 | | | 32,962 | | | | 60,908,502 | |
| Booking Holdings, Inc.1 | | | 4,101 | | | | 8,422,347 | |
| | | | | | | | 90,002,751 | |
| Media—1.2% | |
| Altice USA, Inc., Cl. A1 | | | 181,210 | | | | 4,954,281 | |
| Charter Communications, Inc., Cl. A1 | | | 6,194 | | | | 3,004,586 | |
| DISH Network Corp., Cl. A1 | | | 35,517 | | | | 1,259,788 | |
| | | | | | | | 9,218,655 | |
| Specialty Retail—3.3% | |
| CarMax, Inc.1 | | | 18,660 | | | | 1,635,922 | |
| Lowe’s Cos., Inc. | | | 188,209 | | | | 22,539,910 | |
| | | | | | | | 24,175,832 | |
| Consumer Staples—3.0% | |
| Food Products—3.0% | |
| Conagra Brands, Inc. | | | 101,685 | | | | 3,481,694 | |
| Lamb Weston Holdings, Inc. | | | 33,068 | | | | 2,844,840 | |
| Mondelez International, Inc., Cl. A | | | 61,202 | | | | 3,371,006 | |
| Nomad Foods Ltd.1 | | | 118,026 | | | | 2,640,242 | |
| Tyson Foods, Inc., Cl. A | | | 108,323 | | | | 9,861,726 | |
| | | | | | | | 22,199,508 | |
| Energy—0.9% | |
| Oil, Gas & Consumable Fuels—0.9% | |
| Marathon Petroleum Corp. | | | 30,481 | | | | 1,836,480 | |
| PBF Energy, Inc., Cl. A | | | 89,194 | | | | 2,798,016 | |
| Viper Energy Partners LP | | | 87,455 | | | | 2,156,640 | |
| | | | | | | | 6,791,136 | |
| Financials—4.8% | |
| Capital Markets—4.3% | |
| Apollo Global Management, Inc., Cl. A | | | 166,139 | | | | 7,926,492 | |
| Ares Management Corp., Cl. A | | | 219,953 | | | | 7,850,122 | |
| Carlyle Group LP (The) | | | 136,658 | | | | 4,383,989 | |
| Goldman Sachs Group, Inc. (The) | | | 9,898 | | | | 2,275,847 | |
| Intercontinental Exchange, Inc. | | | 26,126 | | | | 2,417,961 | |
| KKR & Co., Inc., Cl. A | | | 62,134 | | | | 1,812,449 | |
| London Stock Exchange Group plc | | | 18,672 | | | | 1,928,671 | |
| | | | | | | | |
| | | Shares | | | Value | |
| Capital Markets (Continued) | |
| LPL Financial Holdings, Inc. | | | 31,516 | | | $ | 2,907,351 | |
| | | | | | | | 31,502,882 | |
| Commercial Banks—0.3% | |
| SVB Financial Group1 | | | 8,345 | | | | 2,094,929 | |
| Insurance—0.2% | |
| Athene Holding Ltd., Cl. A1 | | | 40,676 | | | | 1,912,992 | |
| Health Care—12.2% | |
| Biotechnology—0.9% | |
| Alnylam Pharmaceuticals, Inc.1 | | | 19,347 | | | | 2,228,194 | |
| BeiGene Ltd., ADR1 | | | 11,148 | | | | 1,847,892 | |
| Bluebird Bio, Inc.1 | | | 4,956 | | | | 434,889 | |
| Moderna, Inc.1 | | | 95,330 | | | | 1,864,655 | |
| | | | | | | | 6,375,630 | |
| Health Care Equipment & Supplies—5.3% | |
| Baxter International, Inc. | | | 67,515 | | | | 5,645,604 | |
| Boston Scientific Corp.1 | | | 215,322 | | | | 9,736,861 | |
| DexCom, Inc.1 | | | 10,032 | | | | 2,194,400 | |
| Intuitive Surgical, Inc.1 | | | 11,781 | | | | 6,964,338 | |
| Teleflex, Inc. | | | 24,757 | | | | 9,319,525 | |
| Zimmer Biomet Holdings, Inc. | | | 35,828 | | | | 5,362,735 | |
| | | | | | | | 39,223,463 | |
| Health Care Providers & Services—3.2% | |
| Humana, Inc. | | | 14,513 | | | | 5,319,305 | |
| Laboratory Corp. of America Holdings1 | | | 21,919 | | | | 3,708,037 | |
| LHC Group, Inc.1 | | | 41,246 | | | | 5,682,049 | |
| UnitedHealth Group, Inc. | | | 30,372 | | | | 8,928,761 | |
| | | | | | | | 23,638,152 | |
| Life Sciences Tools & Services—2.2% | |
| Avantor, Inc.1 | | | 102,133 | | | | 1,853,714 | |
| Illumina, Inc.1 | | | 39,154 | | | | 12,988,948 | |
| Thermo Fisher Scientific, Inc. | | | 5,028 | | | | 1,633,446 | |
| | | | | | | | 16,476,108 | |
| Pharmaceuticals—0.6% | |
| Merck & Co., Inc. | | | 8,517 | | | | 774,621 | |
| Novo Nordisk AS, Cl. B | | | 53,056 | | | | 3,077,231 | |
| Zoetis, Inc., Cl. A | | | 6,451 | | | | 853,790 | |
| | | | | | | | 4,705,642 | |
| Industrials—9.1% | |
| Aerospace & Defense—3.4% | |
| Airbus SE | | | 65,445 | | | | 9,601,940 | |
| Boeing Co. (The) | | | 4,537 | | | | 1,477,973 | |
| L3Harris Technologies, Inc. | | | 10,604 | | | | 2,098,213 | |
| Lockheed Martin Corp. | | | 12,125 | | | | 4,721,233 | |
| Teledyne Technologies, Inc.1 | | | 20,163 | | | | 6,987,286 | |
| | | | | | | | 24,886,645 | |
| Commercial Services & Supplies—2.7% | |
| Cintas Corp. | | | 29,931 | | | | 8,053,833 | |
| Clean Harbors, Inc.1 | | | 58,749 | | | | 5,037,727 | |
| Waste Connections, Inc. | | | 22,197 | | | | 2,015,266 | |
| Waste Management, Inc. | | | 38,772 | | | | 4,418,457 | |
| | | | | | | | 19,525,283 | |
| Industrial Conglomerates—0.4% | |
| Roper Technologies, Inc. | | | 8,415 | | | | 2,980,846 | |
| Machinery—0.9% | |
| Deere & Co. | | | 22,573 | | | | 3,910,998 | |
| Stanley Black & Decker, Inc. | | | 16,804 | | | | 2,785,095 | |
| | | | | | | | 6,696,093 | |
| Road & Rail—1.7% | |
| Kansas City Southern | | | 36,572 | | | | 5,601,367 | |
| Lyft, Inc., Cl. A1 | | | 47,426 | | | | 2,040,267 | |
| Uber Technologies, Inc.1 | | | 60,929 | | | | 1,812,028 | |
| Union Pacific Corp. | | | 18,726 | | | | 3,385,474 | |
| | | | | | | 12,839,136 | |
8 INVESCO OPPENHEIMER V.I. CAPITAL APPRECIATION FUND
| | | | | | | | |
| | | Shares | | | Value | |
| Information Technology—30.3% | |
| Communications Equipment—1.5% | | | | | | | | |
| Motorola Solutions, Inc. | | | 68,967 | | | $ | 11,113,342 | |
| IT Services—8.1% | | | | | | | | |
| Fidelity National Information Services, Inc. | | | 47,444 | | | | 6,598,986 | |
| Mastercard, Inc., Cl. A | | | 106,962 | | | | 31,937,783 | |
| PayPal Holdings, Inc.1 | | | 58,194 | | | | 6,294,845 | |
| Visa, Inc., Cl. A | | | 78,892 | | | | 14,823,807 | |
| | | | | | | | 59,655,421 | |
| Semiconductors & Semiconductor Equipment—6.2% | |
| Applied Materials, Inc. | | | 134,051 | | | | 8,182,473 | |
| ASML Holding NV | | | 25,246 | | | | 7,471,301 | |
| NVIDIA Corp. | | | 21,519 | | | | 5,063,421 | |
| QUALCOMM, Inc. | | | 80,789 | | | | 7,128,014 | |
| Semtech Corp.1 | | | 144,006 | | | | 7,617,917 | |
| Silicon Motion Technology Corp., ADR | | | 211,429 | | | | 10,721,565 | |
| | | | | | | | 46,184,691 | |
| Software—11.8% | |
| Adobe, Inc.1 | | | 16,011 | | | | 5,280,588 | |
| | | | | | | | |
| | | Shares | | | Value | |
| Software (Continued) | |
| Microsoft Corp. | | | 195,629 | | | $ | 30,850,693 | |
| Palo Alto Networks, Inc.1 | | | 38,851 | | | | 8,984,294 | |
| RealPage, Inc.1 | | | 90,967 | | | | 4,889,476 | |
| salesforce.com, Inc.1 | | | 109,557 | | | | 17,818,351 | |
| ServiceNow, Inc.1 | | | 22,070 | | | | 6,230,803 | |
| Splunk, Inc.1 | | | 50,761 | | | | 7,602,475 | |
| Trade Desk, Inc. (The), Cl. A1 | | | 21,203 | | | | 5,508,115 | |
| | | | | | | | 87,164,795 | |
| Technology Hardware, Storage & Peripherals—2.7% | |
| Apple, Inc. | | | 68,796 | | | | 20,201,945 | |
| Materials—0.9% | |
| Chemicals—0.9% | |
| Linde plc | | | 6,106 | | | | 1,299,967 | |
| Sherwin-Williams Co. (The) | | | 5,038 | | | | 2,939,875 | |
| Westlake Chemical Corp. | | | 33,296 | | | | 2,335,714 | |
| | | | | | | | 6,575,556 | |
| Total Investments, at Value (Cost $517,163,117) | | | 100.5 | % | | | 742,980,676 | |
| Net Other Assets (Liabilities) | | | (0.5 | ) | | | (3,992,790 | ) |
| Net Assets | | | 100.0 | % | | $ | 738,987,886 | |
| | | | | | | | |
Footnotes to Schedule of Investments
1.Non-income producing security.
| | |
Glossary: Definitions | | |
ADR | | American Depositary Receipt |
See accompanying Notes to Financial Statements.
9 INVESCO OPPENHEIMER V.I. CAPITAL APPRECIATION FUND
STATEMENT OF ASSETS AND LIABILITIESDecember 31, 2019
| | | | |
| | |
| Assets | | | | |
Investments, at value—unaffiliated companies (cost $517,163,117)—see accompanying schedule of investments | | | $ 742,980,676 | |
Receivables and other assets: | | | | |
Investments sold | | | 1,018,570 | |
Dividends | | | 409,285 | |
Shares of beneficial interest sold | | | 109,596 | |
Other | | | 115,704 | |
| | | | |
Total assets | | | 744,633,831 | |
| | |
| Liabilities | | | | |
Amount due to custodian | | | 448,291 | |
Payables and other liabilities: | | | | |
Shares of beneficial interest redeemed | | | 4,642,696 | |
Administration fee | | | 257,820 | |
Trustees’ compensation | | | 109,017 | |
Shareholder communications | | | 68,256 | |
Distribution and service plan fees | | | 42,250 | |
Transfer and shareholder servicing agent fees | | | 17,540 | |
Advisory fee | | | 14,235 | |
Other | | | 45,840 | |
| | | | |
Total liabilities | | | 5,645,945 | |
| | | | | |
| |
Net Assets | | | $ 738,987,886 | |
| | | | |
| | | | |
| | |
| Composition of Net Assets | | | | |
Shares of beneficial interest | | | $407,917,227 | |
Total distributable earnings | | | 331,070,659 | |
| | | | |
Net Assets | | | $ 738,987,886 | |
| | | | |
| | | | |
| | |
| Net Asset Value Per Share | | | | |
| |
Series I Shares: | | | | |
| |
| Net asset value, redemption price per share and offering price per share (based on net assets of $538,247,140 and 9,005,233 shares of beneficial interest outstanding) | | | $59.77 | |
Series II Shares: | | | | |
| Net asset value, redemption price per share and offering price per share (based on net assets of $200,740,746 and 3,421,444 shares of beneficial interest outstanding) | | | $58.67 | |
See accompanying Notes to Financial Statements.
10 INVESCO OPPENHEIMER V.I. CAPITAL APPRECIATION FUND
STATEMENT OF OPERATIONSFor the Year Ended December 31, 2019
| | | | |
| | |
| Investment Income | | | | |
Dividends: | | | | |
Unaffiliated companies (net of foreign withholding taxes of $42,230) | | $ | 6,171,392 | |
Affiliated companies | | | 175,006 | |
Interest | | | 72 | |
| | | | |
Total investment income | | | 6,346,470 | |
| | | | |
| | |
| Expenses | | | | |
Advisory fees | | | 4,941,455 | |
Administration fees | | | 675,119 | |
Distribution and service plan fees: | | | | |
Series II shares | | | 472,196 | |
Transfer and shareholder servicing agent fees: | | | | |
Series I shares | | | 274,035 | |
Series II shares | | | 97,800 | |
Shareholder communications: | | | | |
Series I shares | | | 55,390 | |
Series II shares | | | 20,153 | |
Trustees’ compensation | | | 22,437 | |
Custodian fees and expenses | | | 11,192 | |
Borrowing fees | | | 8,475 | |
Other | | | 76,593 | |
| | | | |
Total expenses | | | 6,654,845 | |
Less waivers, reimbursement of expenses and offset arrangement(s) | | | (543,358) | |
| | | | |
Net expenses | | | 6,111,487 | |
| | | | | |
Net Investment Income | | | 234,983 | |
| | | | |
| Realized and Unrealized Gain | | | | |
Net realized gain on: | | | | |
Investment transactions in unaffiliated companies (includes net gains from securities sold to affiliates of $215,597) | | | 107,241,836 | |
Foreign currency transactions | | | 12,535 | |
| | | | |
Net realized gain | | | 107,254,371 | |
Net change in unrealized appreciation/(depreciation) on: | | | | |
Investment transactions in unaffiliated companies | | | 103,527,211 | |
Translation of assets and liabilities denominated in foreign currencies | | | 4,068 | |
| | | | |
Net change in unrealized appreciation/(depreciation) | | | 103,531,279 | |
| | | | | |
Net Increase in Net Assets Resulting from Operations | | $ | 211,020,633 | |
| | | | |
See accompanying Notes to Financial Statements.
11 INVESCO OPPENHEIMER V.I. CAPITAL APPRECIATION FUND
STATEMENT OF CHANGES IN NET ASSETS
| | | | | | | | |
| | | Year Ended
December 31, 2019 | | | Year Ended
December 31, 2018 | |
| Operations | | | | | | | | |
Net investment income | | $ | 234,983 | | | | $ 689,854 | |
| |
Net realized gain | | | 107,254,371 | | | | 77,503,315 | |
| |
Net change in unrealized appreciation/(depreciation) | | | 103,531,279 | | | | (110,172,740) | |
| | | | |
Net increase (decrease) in net assets resulting from operations | | | 211,020,633 | | | | (31,979,571) | |
|
| |
| Dividends and/or Distributions to Shareholders | | | | | | | | |
Distributions to shareholders from distributable earnings: | | | | | | | | |
Series I shares | | | (49,378,533 | ) | | | (43,131,733) | |
Series II shares | | | (18,651,335 | ) | | | (16,387,466) | |
| | | | |
Total distributions from distributable earnings | | | (68,029,868 | ) | | | (59,519,199) | |
|
| |
| Beneficial Interest Transactions | | | | | | | | |
Net increase (decrease) in net assets resulting from beneficial interest transactions: | | | | | | | | |
Series I shares | | | (29,869,839 | ) | | | (28,802,499) | |
Series II shares | | | 23,369,205 | | | | (150,292,452) | |
| | | | |
Total beneficial interest transactions | | | (6,500,634 | ) | | | (179,094,951) | |
|
| |
| Net Assets | | | | | | | | |
Total increase (decrease) | | | 136,490,131 | | | | (270,593,721) | |
| |
Beginning of period | | | 602,497,755 | | | | 873,091,476 | |
| | | | |
End of period | | $ | 738,987,886 | | | | $ 602,497,755 | |
| | | | |
See accompanying Notes to Financial Statements.
12 INVESCO OPPENHEIMER V.I. CAPITAL APPRECIATION FUND
FINANCIAL HIGHLIGHTS
| | | | | | | | | | | | | | | | | | | | |
| Series I Shares | | Year Ended
December 31,
2019 | | | Year Ended
December 31,
2018 | | | Year Ended
December 31,
2017 | | | Year Ended
December 31,
2016 | | | Year Ended
December 31,
2015 | |
| Per Share Operating Data | | | | | | | | | | | | | | | | | | | | |
Net asset value, beginning of period | | | $48.50 | | | | $55.70 | | | | $48.36 | | | | $55.49 | | | | $64.87 | |
Income (loss) from investment operations: | | | | | | | | | | | | | | | | | | | | |
Net investment income1 | | | 0.06 | | | | 0.09 | | | | 0.15 | | | | 0.12 | | | | 0.22 | |
Net realized and unrealized gain (loss) | | | 16.80 | | | | (2.71) | | | | 12.33 | | | | (1.57) | | | | 2.25 | |
| | | | |
Total from investment operations | | | 16.86 | | | | (2.62) | | | | 12.48 | | | | (1.45) | | | | 2.47 | |
| |
Dividends and/or distributions to shareholders: | | | | | | | | | | | | | | | | | | | | |
Dividends from net investment income | | | (0.04) | | | | (0.19) | | | | (0.13) | | | | (0.22) | | | | (0.06) | |
Distributions from net realized gain | | | (5.55) | | | | (4.39) | | | | (5.01) | | | | (5.46) | | | | (11.79) | |
| | | | |
Total dividends and/or distributions to shareholders | | | (5.59) | | | | (4.58) | | | | (5.14) | | | | (5.68) | | | | (11.85) | |
|
| |
Net asset value, end of period | | | $59.77 | | | | $48.50 | | | | $55.70 | | | | $48.36 | | | | $55.49 | |
| | | | |
|
| |
| Total Return, at Net Asset Value2 | | | 36.20% | | | | (5.73)% | | | | 26.83% | | | | (2.20)% | | | | 3.54% | |
|
| |
| Ratios/Supplemental Data | | | | | | | | | | | | | | | | | | | | |
Net assets, end of period (in thousands) | | | $538,247 | | | | $460,708 | | | | $556,227 | | | | $501,756 | | | | $564,514 | |
|
| |
Average net assets (in thousands) | | | $515,169 | | | | $542,971 | | | | $539,255 | | | | $514,525 | | | | $601,110 | |
|
| |
Ratios to average net assets:3 | | | | | | | | | | | | | | | | | | | | |
Net investment income | | | 0.10% | | | | 0.16% | | | | 0.29% | | | | 0.25% | | | | 0.36% | |
Expenses excluding specific expenses listed below | | | 0.88% | | | | 0.85% | | | | 0.82% | | | | 0.83% | | | | 0.81% | |
Interest and fees from borrowings | | | 0.00%4 | | | | 0.00%4 | | | | 0.00%4 | | | | 0.00%4 | | | | 0.00%4 | |
| | | | |
Total expenses5 | | | 0.88% | | | | 0.85% | | | | 0.82% | | | | 0.83% | | | | 0.81% | |
| Expenses after payments, waivers and/or reimbursements and reduction to custodian expenses | | | 0.80% | | | | 0.80% | | | | 0.80% | | | | 0.80% | | | | 0.80% | |
|
| |
Portfolio turnover rate6 | | | 73% | | | | 27% | | | | 26% | | | | 114% | | | | 60% | |
1. Calculated based on the average shares outstanding during the period.
2. Includes adjustments in accordance with accounting principles generally accepted in the United States of America and as such, the net asset value for financial reporting purposes and the returns based upon those net asset values may differ from the net asset value and returns for shareholder transactions. Total returns are not annualized for periods less than one year, if applicable and do not reflect charges assessed in connection with a variable product, which if included would reduce total returns.
3. Annualized for periods less than one full year.
4. Less than 0.005%.
5. Total expenses including indirect expenses from fund fees and expenses were as follows:
| | | | | | |
| | Year Ended December 31, 2019 | | | 0.88% | |
| | Year Ended December 31, 2018 | | | 0.85% | |
| | Year Ended December 31, 2017 | | | 0.82% | |
| | Year Ended December 31, 2016 | | | 0.83% | |
| | Year Ended December 31, 2015 | | | 0.81% | |
6. Portfolio turnover is calculated at the fund level and is not annualized for periods less than one year, if applicable.
See accompanying Notes to Financial Statements.
13 INVESCO OPPENHEIMER V.I. CAPITAL APPRECIATION FUND
FINANCIAL HIGHLIGHTSContinued
| | | | | | | | | | | | | | | | | | | | |
| Series II Shares | | Year Ended
December 31,
2019 | | | Year Ended
December 31,
2018 | | | Year Ended
December 31,
2017 | | | Year Ended
December 31,
2016 | | | Year Ended
December 31,
2015 | |
| Per Share Operating Data | | | | | | | | | | | | | | | | | | | | |
Net asset value, beginning of period | | | $47.78 | | | | $54.89 | | | | $47.73 | | | | $54.80 | | | | $64.30 | |
|
| |
Income (loss) from investment operations: | | | | | | | | | | | | | | | | | | | | |
Net investment income (loss)1 | | | (0.08) | | | | (0.05) | | | | 0.02 | | | | 0.002 | | | | 0.07 | |
Net realized and unrealized gain (loss) | | | 16.52 | | | | (2.67) | | | | 12.16 | | | | (1.55) | | | | 2.22 | |
| | | | |
Total from investment operations | | | 16.44 | | | | (2.72) | | | | 12.18 | | | | (1.55) | | | | 2.29 | |
|
| |
Dividends and/or distributions to shareholders: | | | | | | | | | | | | | | | | | | | | |
Dividends from net investment income | | | 0.00 | | | | 0.00 | | | | (0.01) | | | | (0.06) | | | | 0.00 | |
Distributions from net realized gain | | | (5.55) | | | | (4.39) | | | | (5.01) | | | | (5.46) | | | | (11.79) | |
| | | | |
Total dividends and/or distributions to shareholders | | | (5.55) | | | | (4.39) | | | | (5.02) | | | | (5.52) | | | | (11.79) | |
|
| |
Net asset value, end of period | | | $58.67 | | | | $47.78 | | | | $54.89 | | | | $47.73 | | | | $54.80 | |
| | | | |
|
| |
| Total Return, at Net Asset Value3 | | | 35.84% | | | | (5.96)% | | | | 26.50% | | | | (2.43)% | | | | 3.27% | |
|
| |
| Ratios/Supplemental Data | | | | | | | | | | | | | | | | | | | | |
Net assets, end of period (in thousands) | | | $200,741 | | | | $141,790 | | | | $316,864 | | | | $295,226 | | | | $317,737 | |
|
| |
Average net assets (in thousands) | | | $188,894 | | | | $232,457 | | | | $314,506 | | | | $287,933 | | | | $332,468 | |
|
| |
Ratios to average net assets:4 | | | | | | | | | | | | | | | | | | | | |
Net investment income (loss) | | | (0.15)% | | | | (0.09)% | | | | 0.04% | | | | 0.00%5 | | | | 0.12% | |
Expenses excluding specific expenses listed below | | | 1.13% | | | | 1.10% | | | | 1.07% | | | | 1.08% | | | | 1.06% | |
Interest and fees from borrowings | | | 0.00%5 | | | | 0.00%5 | | | | 0.00%5 | | | | 0.00%5 | | | | 0.00%5 | |
| | | | |
Total expenses6 | | | 1.13% | | | | 1.10% | | | | 1.07% | | | | 1.08% | | | | 1.06% | |
| Expenses after payments, waivers and/or reimbursements and reduction to custodian expenses | | | 1.05% | | | | 1.05% | | | | 1.05% | | | | 1.05% | | | | 1.05% | |
|
| |
Portfolio turnover rate7 | | | 73% | | | | 27% | | | | 26% | | | | 114% | | | | 60% | |
1. Calculated based on the average shares outstanding during the period.
2. Less than $0.005 per share.
3. Includes adjustments in accordance with accounting principles generally accepted in the United States of America and as such, the net asset value for financial reporting purposes and the returns based upon those net asset values may differ from the net asset value and returns for shareholder transactions. Total returns are not annualized for periods less than one year, if applicable and do not reflect charges assessed in connection with a variable product, which if included would reduce total returns.
4. Annualized for periods less than one full year.
5. Less than 0.005%.
6. Total expenses including indirect expenses from fund fees and expenses were as follows:
| | | | | | | | | | |
| | Year Ended December 31, 2019 | | | 1.13% | | | | | |
| | Year Ended December 31, 2018 | | | 1.10% | |
| | Year Ended December 31, 2017 | | | 1.07% | |
| | Year Ended December 31, 2016 | | | 1.08% | |
| | Year Ended December 31, 2015 | | | 1.06% | |
7. Portfolio turnover is calculated at the fund level and is not annualized for periods less than one year, if applicable.
See accompanying Notes to Financial Statements.
14 INVESCO OPPENHEIMER V.I. CAPITAL APPRECIATION FUND
NOTES TO FINANCIAL STATEMENTSDecember 31, 2019
Note 1 - Significant Accounting Policies
Invesco Oppenheimer V.I. Capital Appreciation Fund (the “Fund”) is a series portfolio of AIM Variable Insurance Funds (Invesco Variable Insurance Funds) (the “Trust”). The Trust is a Delaware statutory trust registered under the Investment Company Act of 1940, as amended (the “1940 Act”), as anopen-end series management investment company authorized to issue an unlimited number of shares of beneficial interest. Information presented in these financial statements pertains only to the Fund. Matters affecting the Fund or each class will be voted on exclusively by the shareholders of such Fund or each class.
Prior to the close of business on May 24, 2019, the Fund operated as Oppenheimer Capital Appreciation Fund/VA (the “Acquired Fund” or “Predecessor Fund”). The Acquired Fund was reorganized after the close of business on May 24, 2019 (the “Reorganization Date”) through the transfer of all of its assets and liabilities to the Fund (the “Reorganization”).
Upon closing of the Reorganization, holders of the Acquired Fund’sNon-Service and Service shares received Series I and Series II shares of the Fund, respectively. Information for the Acquired Fund’sNon-Service and Service shares prior to the Reorganization is included with Series I and Series II, respectively, throughout this report.
The Fund’s investment objective is to seek capital appreciation.
The Fund currently offers two classes of shares, Series I and Series II, both of which are offered to insurance company separate accounts funding variable annuity contracts and variable life insurance policies (“variable products”).
The Fund is an investment company and accordingly follows the investment company accounting and reporting guidance in accordance with Financial Accounting Standards Board Accounting Standards Codification Topic 946, Financial Services – Investment Companies.
The following is a summary of the significant accounting policies followed by the Fund in the preparation of its financial statements.
| A. | Security Valuations–Securities, including restricted securities, are valued according to the following policy. |
A security listed or traded on an exchange (except convertible securities) is valued at its last sales price or official closing price as of the close of the customary trading session on the exchange where the security is principally traded, or lacking any sales or official closing price on a particular day, the security may be valued at the closing bid price on that day. Securities traded in theover-the-counter market are valued based on prices furnished by independent pricing services or market makers. When such securities are valued by an independent pricing service they may be considered fair valued. Futures contracts are valued at the final settlement price set by an exchange on which they are principally traded. Listed options are valued at the mean between the last bid and asked prices from the exchange on which they are principally traded. Options not listed on an exchange are valued by an independent source at the mean between the last bid and asked prices. For purposes of determining net asset value (“NAV”) per share, futures and option contracts generally are valued 15 minutes after the close of the customary trading session of the New York Stock Exchange (“NYSE”).
Investments inopen-end andclosed-end registered investment companies that do not trade on an exchange are valued at theend-of-day net asset value per share. Investments inopen-end andclosed-end registered investment companies that trade on an exchange are valued at the last sales price or official closing price as of the close of the customary trading session on the exchange where the security is principally traded.
Debt obligations (including convertible securities) and unlisted equities are fair valued using an evaluated quote provided by an independent pricing service. Evaluated quotes provided by the pricing service may be determined without exclusive reliance on quoted prices, and may reflect appropriate factors such asinstitution-size trading in similar groups of securities, developments related to specific securities, dividend rate (for unlisted equities), yield (for debt obligations), quality, type of issue, coupon rate (for debt obligations), maturity (for debt obligations), individual trading characteristics and other market data. Pricing services generally value debt obligations assuming orderly transactions of institutional round lot size, but a fund may hold or transact in the same securities in smaller, odd lot sizes. Odd lots often trade at lower prices than institutional round lots. Debt obligations are subject to interest rate and credit risks. In addition, all debt obligations involve some risk of default with respect to interest and/or principal payments.
Foreign securities’ (including foreign exchange contracts) prices are converted into U.S. dollar amounts using the applicable exchange rates as of the close of the NYSE. If market quotations are available and reliable for foreign exchange-traded equity securities, the securities will be valued at the market quotations. Because trading hours for certain foreign securities end before the close of the NYSE, closing market quotations may become unreliable. If between the time trading ends on a particular security and the close of the customary trading session on the NYSE, events occur that the investment adviser determines are significant and make the closing price unreliable, the Fund may fair value the security. If the event is likely to have affected the closing price of the security, the security will be valued at fair value in good faith using procedures approved by the Board of Trustees. Adjustments to closing prices to reflect fair value may also be based on a screening process of an independent pricing service to indicate the degree of certainty, based on historical data, that the closing price in the principal market where a foreign security trades is not the current value as of the close of the NYSE. Foreign securities’ prices meeting the approved degree of certainty that the price is not reflective of current value will be priced at the indication of fair value from the independent pricing service. Multiple factors may be considered by the independent pricing service in determining adjustments to reflect fair value and may include information relating to sector indices, American Depositary Receipts and domestic and foreign index futures. Foreign securities may have additional risks including exchange rate changes, potential for sharply devalued currencies and high inflation, political and economic upheaval, the relative lack of issuer information, relatively low market liquidity and the potential lack of strict financial and accounting controls and standards.
Securities for which market prices are not provided by any of the above methods may be valued based upon quotes furnished by independent sources. The last bid price may be used to value equity securities. The mean between the last bid and asked prices is used to value debt obligations, including corporate loans.
Securities for which market quotations are not readily available or became unreliable are valued at fair value as determined in good faith by or under the supervision of the Trust’s officers following procedures approved by the Board of Trustees. Issuer specific events, market trends, bid/ asked quotes of brokers and information providers and other market data may be reviewed in the course of making a good faith determination of a
15 INVESCO OPPENHEIMER V.I. CAPITAL APPRECIATION FUND
NOTES TO FINANCIAL STATEMENTSContinued
security’s fair value.
The Fund may invest in securities that are subject to interest rate risk, meaning the risk that the prices will generally fall as interest rates rise and, conversely, the prices will generally rise as interest rates fall. Specific securities differ in their sensitivity to changes in interest rates depending on their individual characteristics. Changes in interest rates may result in increased market volatility, which may affect the value and/or liquidity of certain Fund investments.
Valuations change in response to many factors including the historical and prospective earnings of the issuer, the value of the issuer’s assets, general economic conditions, interest rates, investor perceptions and market liquidity. Because of the inherent uncertainties of valuation, the values reflected in the financial statements may materially differ from the value received upon actual sale of those investments.
| B. | Securities Transactions and Investment Income -Securities transactions are accounted for on a trade date basis. Realized gains or losses on sales are computed on the basis of specific identification of the securities sold. Interest income (net of withholding tax, if any) is recorded on the accrual basis from settlement date. Dividend income (net of withholding tax, if any) is recorded on theex-dividend date. |
The Fund may periodically participate in litigation related to Fund investments. As such, the Fund may receive proceeds from litigation settlements. Any proceeds received are included in the Statement of Operations as realized gain (loss) for investments no longer held and as unrealized gain (loss) for investments still held.
Brokerage commissions and mark ups are considered transaction costs and are recorded as an increase to the cost basis of securities purchased and/or a reduction of proceeds on a sale of securities. Such transaction costs are included in the determination of net realized and unrealized gain (loss) from investment transactions reported in the Statement of Operations and the Statement of Changes in Net Assets and the net realized and unrealized gains (losses) on securities per share in the Financial Highlights. Transaction costs are included in the calculation of the Fund’s net asset value and, accordingly, they reduce the Fund’s total returns. These transaction costs are not considered operating expenses and are not reflected in net investment income reported in the Statement of Operations and the Statement of Changes in Net Assets, or the net investment income per share and the ratios of expenses and net investment income reported in the Financial Highlights, nor are they limited by any expense limitation arrangements between the Fund and the investment adviser.
The Fund allocates income and realized and unrealized capital gains and losses to a class based on the relative net assets of each class.
| C. | Country Determination - For the purposes of making investment selection decisions and presentation in the Schedule of Investments, the investment adviser may determine the country in which an issuer is located and/or credit risk exposure based on various factors. These factors include the laws of the country under which the issuer is organized, where the issuer maintains a principal office, the country in which the issuer derives 50% or more of its total revenues and the country that has the primary market for the issuer’s securities, as well as other criteria. Among the other criteria that may be evaluated for making this determination are the country in which the issuer maintains 50% or more of its assets, the type of security, financial guarantees and enhancements, the nature of the collateral and the sponsor organization. |
| D. | Distributions - Dividends and distributions to shareholders, which are determined in accordance with income tax regulations and may differ from accounting principles generally accepted in the United States of America (“GAAP”), are recorded on theex-dividend date. Income distributions, if any, are declared and paid quarterly. Capital gain distributions, if any, are declared and paid annually to separate accounts of participating insurance companies or at other times as determined necessary by the Adviser. |
| E. | Master Limited Partnerships - The Fund invests in Master Limited Partnerships (“MLPs”). MLPs are publicly traded partnerships and limited liability companies taxed as partnerships under the Internal Revenue Code of 1986, as amended (the “Internal Revenue Code”). The Fund invests in MLPs engaged in, among other things, the transportation, storage, processing, refining, marketing, exploration, production and mining of minerals and natural resources. The Fund is a partner in each MLP; accordingly, the Fund is required to take into account the Fund’s allocable share of income, gains, losses, deductions, expenses, and tax credits recognized by each MLP. |
MLP’s may be less liquid and subject to more abrupt or erratic price movements than conventional publicly traded securities.
| F. | Return of Capital -Distributions received from the Fund’s investments in MLPs generally are comprised of income and return of capital. The Fund records investment income and return of capital based on estimates made at the time such distributions are received. The return of capital portion of the distribution is a reduction to investment income that results in an equivalent reduction in the cost basis of the associated investments and increases net realized gains (losses) and change in unrealized appreciation (depreciation). Such estimates are based on historical information available from each MLP and other industry sources. These estimates will subsequently be revised and may materially differ primarily based on information received from the MLPs after their tax reporting periods are concluded. |
| G. | Federal Income Taxes -The Fund intends to comply with the requirements of Subchapter M of the Internal Revenue Code of 1986, as amended (the “Internal Revenue Code”), necessary to qualify as a regulated investment company and to distribute substantially all of the Fund’s taxable earnings to shareholders. As such, the Fund will not be subject to federal income taxes on otherwise taxable income (including net realized capital gain) that is distributed to shareholders. Therefore, no provision for federal income taxes is recorded in the financial statements. |
The Fund recognizes the tax benefits of uncertain tax positions only when the position is more likely than not to be sustained. Management has analyzed the Fund’s uncertain tax positions and concluded that no liability for unrecognized tax benefits should be recorded related to uncertain tax positions. Management is not aware of any tax positions for which it is reasonably possible that the total amounts of unrecognized tax benefits will change materially in the next 12 months.
The Fund files tax returns in the U.S. Federal jurisdiction and certain other jurisdictions. Generally, the Fund is subject to examinations by such taxing authorities for up to three years after the filing of the return for the tax period.
| H. | Expenses -Fees provided for under the Rule12b-1 plan of a particular class of the Fund are charged to the operations of such class. Transfer agency fees and expenses and other shareholder recordkeeping fees and expenses relating to all other classes are allocated among those classes based on relative net assets. All other expenses are allocated among the classes based on relative net assets. |
16 INVESCO OPPENHEIMER V.I. CAPITAL APPRECIATION FUND
| I. | Accounting Estimates -The financial statements are prepared on a basis in conformity with GAAP, which requires management to make estimates and assumptions that affect the reported amounts of assets and liabilities at the date of the financial statements and the reported amounts of revenues and expenses during the reporting period including estimates and assumptions related to taxation. Actual results could differ from those estimates by a significant amount. In addition, the Fund monitors for material events or transactions that may occur or become known after theperiod-end date and before the date the financial statements are released to print. |
| J. | Indemnifications -Under the Trust’s organizational documents, each Trustee, officer, employee or other agent of the Trust is indemnified against certain liabilities that may arise out of the performance of their duties to the Fund. Additionally, in the normal course of business, the Fund enters into contracts, including the Fund’s servicing agreements, that contain a variety of indemnification clauses. The Fund’s maximum exposure under these arrangements is unknown as this would involve future claims that may be made against the Fund that have not yet occurred. The risk of material loss as a result of such indemnification claims is considered remote. |
| K. | Foreign Currency Translations -Foreign currency is valued at the close of the NYSE based on quotations posted by banks and major currency dealers. Portfolio securities and other assets and liabilities denominated in foreign currencies are translated into U.S. dollar amounts at the date of valuation. Purchases and sales of portfolio securities (net of foreign taxes withheld on disposition) and income items denominated in foreign currencies are translated into U.S. dollar amounts on the respective dates of such transactions. The Fund does not separately account for the portion of the results of operations resulting from changes in foreign exchange rates on investments and the fluctuations arising from changes in market prices of securities held. The combined results of changes in foreign exchange rates and the fluctuation of market prices on investments (net of estimated foreign tax withholding) are included with the net realized and unrealized gain or loss from investments in the Statement of Operations. Reported net realized foreign currency gains or losses arise from (1) sales of foreign currencies, (2) currency gains or losses realized between the trade and settlement dates on securities transactions, and (3) the difference between the amounts of dividends, interest, and foreign withholding taxes recorded on the Fund’s books and the U.S. dollar equivalent of the amounts actually received or paid. Net unrealized foreign currency gains and losses arise from changes in the fair values of assets and liabilities, other than investments in securities at fiscal period end, resulting from changes in exchange rates. The Fund may invest in foreign securities, which may be subject to foreign taxes on income, gains on investments or currency repatriation, a portion of which may be recoverable. Foreign taxes, if any, are recorded based on the tax regulations and rates that exist in the foreign markets in which the Fund invests and are shown in the Statement of Operations. |
Note 2 - Advisory Fees and Other Fees Paid to Affiliates
The Trust has entered into a master investment advisory agreement with Invesco Advisers, Inc. (the “Adviser” or “Invesco”). Under the terms of the investment advisory agreement, the Fund accrues daily and pays monthly an advisory fee to the Adviser based on the annual rate of the Fund’s average daily net assets as follows:
| | | | |
| Fee Schedule* | | | |
Up to $200 million | | | 0.75 | % |
Next $200 million | | | 0.72 | |
Next $200 million | | | 0.69 | |
Next $200 million | | | 0.66 | |
Next $200 million | | | 0.60 | |
Over $1 billion | | | 0.58 | |
* The advisory fee paid by the Fund shall be reduced by any amounts paid by the Fund under the administrative services agreement with the Adviser.
For the yearended December 31, 2019, the effective advisory fees incurred by the Fund was 0.70%.
From the beginning of the fiscal period until the date of the Reorganization, the Acquired Fund paid $1,938,757in advisory fees to OFI Global Asset Management, Inc. based on the annual rates above of the Acquired Fund’s average daily net assets.
Under the terms of a mastersub-advisory agreement between the Adviser and each of Invesco Asset Management Deutschland GmbH, Invesco Asset Management Limited, Invesco Asset Management (Japan) Limited, Invesco Hong Kong Limited, Invesco Senior Secured Management, Inc. and Invesco Canada Ltd. and separatesub-advisory agreements with Invesco Capital Management LLC, and Invesco Asset Management (India) Private Limited (collectively, the “AffiliatedSub-Advisers”) the Adviser, not the Fund, will pay 40% of the fees paid to the Adviser to any such AffiliatedSub-Adviser(s) that provide(s) discretionary investment management services to the Fund based on the percentage of assets allocated to such AffiliatedSub-Adviser(s). Invesco has also entered into aSub-Advisory Agreement with OppenheimerFunds, Inc. to provide discretionary management services to the Funds.
Effective on the Reorganization Date, the Adviser has contractually agreed, through May 31, 2021, to waive advisory fees and/or reimburse expenses of all shares to the extent necessary to limit the total annual fund operating expenses after fee waiver and/or expense reimbursement (excluding certain items discussed below) ofSeries I and Series II shares to 0.80% and 1.05%, respectively, of the Fund’s average daily net assets (the “expense limits”). In determining the Adviser’s obligation to waive advisory fees and/or reimburse expenses, the following expenses are not taken into account, and could cause total annual fund operating expenses after fee waivers and/or expense reimbursement to exceed the numbers reflected above: (1) interest; (2) taxes; (3) dividend expenses on short sales; (4) extraordinary ornon-routine items, including litigation expenses; and (5) expenses that the Fund has incurred but did not actually pay because of an expense offset arrangement. Unless Invesco continues the fee waiver agreement, it will terminate on May 31, 2021. During its term, the fee waiver agreement cannot be terminated or amended to increase the expense limits or reduce the advisory fee waiver without approval of the Board of Trustees.
Further, the Adviser has contractually agreed, through at least June 30, 2021, to waive the advisory fee payable by the Fund in an amount equal to 100% of the net advisory fees the Adviser receives from the affiliated money market funds on investments by the Fund of uninvested cash in such
17 INVESCO OPPENHEIMER V.I. CAPITAL APPRECIATION FUND
NOTES TO FINANCIAL STATEMENTSContinued
affiliated money market funds.
For the yearended December 31, 2019, the Adviser waived advisory fees of $7,210 and reimbursed Fund expenses of $384,508 and $145,217for Series I and Series II shares, respectively.
Prior to the Reorganization, OFI Global Asset Management, Inc. had contractually agreed to waive fees and/or reimburse expenses ofNon-Service and Service shares to 0.80% and 1.05%,respectively, of the Acquired Fund’s average daily net assets.
The Trust has entered into a master administrative services agreement with Invesco pursuant to which the Fund has agreed to pay Invesco a fee for costs incurred in providing accounting services and fund administrative services to the Fund and to reimburse Invesco for fees paid to insurance companies that have agreed to provide certain administrative services to the Fund. These administrative services provided by the insurance companies may include, among other things: maintenance of master accounts with the Fund; tracking, recording and transmitting net purchase and redemption orders for Fund shares; maintaining and preserving records related to the purchase, redemption and other account activity of variable product owners; distributing copies of Fund documents such as prospectuses, proxy materials and periodic reports, to variable product owners, and responding to inquiries from variable product owners about the Fund. Pursuant to such agreement, for the year ended December 31, 2019, Invesco was paid $60,528 for accounting and fund administrative services and was reimbursed $614,591 for fees paid to insurance companies. Additionally, Invesco has entered into service agreements whereby JP Morgan Chase Bank serves as custodian to the Fund. Prior to the Reorganization, the Acquired Fund paid administrative fees to OFI Global Asset Management., Inc.
The Trust has entered into a transfer agency and service agreement with Invesco Investment Services, Inc. (“IIS”) pursuant to which the Fund has agreed to pay IIS a fee for providing transfer agency and shareholder services to the Fund and reimburse IIS for certain expenses incurred by IIS in the course of providing such services. Prior to the Reorganization, the Acquired Fund paid transfer agent fees to OFI Global Asset Management, Inc. and Shareholder Services, Inc. For the yearended December 31, 2019, expenses incurred under these agreements are shown in the Statement of Operations as Transfer and shareholder servicing agent fees.
The Trust has entered into master distribution agreements with Invesco Distributors, Inc. (“IDI”) to serve as the distributor for the Series II shares of the Fund. The Trust has adopted a plan pursuant to Rule12b-1 under the 1940 Act with respect to the Fund’s Series II shares (the “Plan”). The Fund, pursuant to the Plan, pays IDI at an annual rate of 0.25% of the average daily net assets of Series II shares. The fees are accrued daily and paid monthly. Of the Plan payments, up to 0.25% of the average daily net assets of the class of shares may be paid to insurance companies who furnish continuing personal shareholder services to customers who purchase and own shares of such class. Any amounts not paid as a service fee under the Plan would constitute an asset-based sales charge. Rules of the Financial Industry Regulatory Authority (“FINRA”) impose a cap on the total sales charges, including asset-based sales charges, that may be paid by any class of shares of the Fund plans. Prior to the Reorganization, the Acquired Fund paid distribution fees to OppenheimerFunds Distributor, Inc. For the year ended December 31, 2019, expenses incurred under the plans are shown in the Statement of Operations as Distribution and service plan fees.
Certain officers and trustees of the Trust are officers and directors of the Adviser, IIS and/or IDI.
Note 3 - Additional Valuation Information
GAAP defines fair value as the price that would be received to sell an asset or paid to transfer a liability in an orderly transaction between market participants at the measurement date, under current market conditions. GAAP establishes a hierarchy that prioritizes the inputs to valuation methods, giving the highest priority to readily available unadjusted quoted prices in an active market for identical assets (Level 1) and the lowest priority to significant unobservable inputs (Level 3), generally when market prices are not readily available or are unreliable. Based on the valuation inputs, the securities or other investments are tiered into one of three levels. Changes in valuation methods may result in transfers in or out of an investment’s assigned level:
Level 1 — Prices are determined using quoted prices in an active market for identical assets.
Level 2 — Prices are determined using other significant observable inputs. Observable inputs are inputs that other market participants may use in pricing a security. These may include quoted prices for similar securities, interest rates, prepayment speeds, credit risk, yield curves, loss severities, default rates, discount rates, volatilities and others.
Level 3 — Prices are determined using significant unobservable inputs. In situations where quoted prices or observable inputs are unavailable (for example, when there is little or no market activity for an investment at the end of the period), unobservable inputs may be used. Unobservable inputs reflect the Fund’s own assumptions about the factors market participants would use in determining fair value of the securities or instruments and would be based on the best available information.
The following is a summary of the tiered valuation input levels, as of December 31, 2019. The level assigned to the securities valuations may not be an indication of the risk or liquidity associated with investing in those securities. Because of the inherent uncertainties of valuation, the values reflected in the financial statements may materially differ from the value received upon actual sale of those investments.
| | | | | | | | | | | | | | | | |
| | | Level 1—
Unadjusted
Quoted Prices | | | Level 2—
Other Significant
Observable Inputs | | | Level 3— Significant
Unobservable
Inputs | | | Value | |
Assets Table | | | | | | | | | | | | | | | | |
Investments, at Value: | | | | | | | | | | | | | | | | |
| Common Stocks | | | | | | | | | | | | | | | | |
Consumer Discretionary | | $ | 262,729,934 | | | $ | 27,506,547 | | | $ | — | | | $ | 290,236,481 | |
Consumer Staples | | | 22,199,508 | | | | — | | | | — | | | | 22,199,508 | |
18 INVESCO OPPENHEIMER V.I. CAPITAL APPRECIATION FUND
| | | | | | | | | | | | | | |
| | | Level 1— Unadjusted
Quoted Prices | | | Level 2— Other Significant
Observable Inputs | | | Level 3—
Significant
Unobservable
Inputs | | | Value |
| Common Stocks (Continued) | | | | | | | | | | | | | | |
Energy | | $ | 6,791,136 | | | $ | — | | | $ | — | | | $ 6,791,136 |
Financials | | | 33,582,132 | | | | 1,928,671 | | | | — | | | 35,510,803 |
Health Care | | | 87,341,764 | | | | 3,077,231 | | | | — | | | 90,418,995 |
Industrials | | | 57,326,063 | | | | 9,601,940 | | | | — | | | 66,928,003 |
Information Technology | | | 224,320,194 | | | | — | | | | — | | | 224,320,194 |
Materials | | | 6,575,556 | | | | — | | | | — | | | 6,575,556 |
| | | |
| Total Assets | | $ | 700,866,287 | | | $ | 42,114,389 | | | $ | — | | | $ 742,980,676 |
| | | |
Forward currency exchange contracts and futures contracts, if any, are reported at their unrealized appreciation/depreciation at measurement date, which represents the change in the contract’s value from trade date. All additional assets and liabilities included in the above table are reported at their market value at measurement date.
Note 4 - Security Transactions with Affiliated Funds
The Fund is permitted to purchase or sell securities from or to certain other Invesco Funds under specified conditions outlined in procedures adopted by the Board of Trustees of the Trust. The procedures have been designed to ensure that any purchase or sale of securities by the Fund from or to another fund or portfolio that is or could be considered an affiliate by virtue of having a common investment adviser (or affiliated investment advisers), common Trustees and/or common officers complies with Rule17a-7 of the 1940 Act. Further, as defined under the procedures, each transaction is effected at the current market price. Pursuant to these procedures for the period January 1, 2019 to May 24, 2019,the Predecessor Fund engaged in transactions with affiliates as listed: Securities purchases of $3,806,485 and securities sales of $611,914, which resulted in net realized gains of $215,597. For the period May 25, 2019 to December 31, 2019, the Fund engaged in transactions with affiliates as listed: Securities purchases of $9,976,512 which resulted in net realized gains (losses)of $0.
Note 5 – Expense Offset Arrangement
The expense offset arrangement is comprised of custodian credits which result from periodic overnight cash balances at the custodian. For theyearended December 31, 2019, the Fund received credits from this arrangement, which resulted in the reduction of the Fund’s total expenses of $6,423.
Note 6 – Trustee and Officer Fees and Benefits
Certain Trustees have executed Deferred Compensation Agreement(s) pursuant to which they have the option to elect to defer receipt of all or a portion of the annual compensation they are entitled to receive from the Fund. For purposes of determining the amount owed to the Trustees under the plan(s), deferred amounts are treated as though equal dollar amounts had been invested in shares of the Fund or in other Invesco and/or Invesco Oppenheimer funds selected by the Trustees. The Fund purchases shares of the funds selected for deferral by the Trustees in amounts equal to his or her deemed investment, resulting in a Fund asset equal to the deferred compensation liability. Such assets are included as a component of “Other” within the asset section of the Statement of Assets and Liabilities. Deferral of Trustees’ fees under the plan(s) will not affect the net assets of the Fund and will not materially affect the Fund’s assets, liabilities or net investment income per share. Amounts will be deferred until distributed in accordance with the Deferred Compensation Agreement(s).
Note 7 – Cash Balances
The Fund is permitted to temporarily carry a negative or overdrawn balance in its account with JPMorgan Chase Bank, the custodian bank. Such balances, if any atperiod-end, are shown in the Statement of Assets and Liabilities under the payable caption Amount due custodian. To compensate the custodian bank for such overdrafts, the overdrawn Fund may either (1) leave funds as a compensating balance in the account so the custodian bank can be compensated by earning the additional interest; or (2) compensate by paying the custodian bank at a rate agreed upon by the custodian bank and Invesco, not to exceed the contractually agreed upon rate.
Note 8 – Distributions to Shareholders and Tax Components of Net Assets
Tax Character of Distributions to Shareholders Paid During the Fiscal Years Ended December 31, 2019 and 2018:
| | | | | | | | |
| | | 2019 | | | 2018 | |
Ordinary income | | $ | 2,174,989 | | | $ | 26,045,927 | |
Long-term capital gain | | | 65,854,879 | | | | 33,473,272 | |
| | | | |
Total distributions | | $ | 68,029,868 | | | $ | 59,519,199 | |
| | | | |
19 INVESCO OPPENHEIMER V.I. CAPITAL APPRECIATION FUND
NOTES TO FINANCIAL STATEMENTSContinued
Tax Components of Net Assets atPeriod-End:
| | | | |
| | | 2019 | |
Undistributed ordinary income | | $ | 2,813,981 | |
Undistributed long-term gain | | | 106,097,903 | |
Net unrealized appreciation - investments | | | 222,265,771 | |
Temporary book/tax differences | | | (106,996) | |
Shares of beneficial interest | | | 407,917,227 | |
| | | | |
Total net assets | | $ | 738,987,886 | |
| | | | |
The difference between book-basis andtax-basis unrealized appreciation (depreciation) is due to differences in the timing of recognition of gains and losses on investments for tax and book purposes. The Fund’s net unrealized appreciation (depreciation) difference is attributable primarily to wash sales and partnership transactions.
The temporary book/tax differences are a result of timing differences between book and tax recognition of income and/or expenses. The Fund’s temporary book/tax differences are the result of the trustee deferral of compensation and retirement plan benefits.
Capital loss carryforward is calculated and reported as of a specific date. Results of transactions and other activity after that date may affect the amount of capital loss carryforward actually available for the Fund to utilize. Capital losses generated in years beginning after December 22, 2010 can be carried forward for an unlimited period, whereas previous losses expire in eight tax years. Capital losses with an expiration period may not be used to offset capital gains until all net capital losses without an expiration date have been utilized. Capital loss carryforwards with no expiration date will retain their character as either short-term or long-term capital losses instead of as short-term capital losses as under prior law. The ability to utilize capital loss carryforwards in the future may be limited under the Internal Revenue Code and related regulations based on the results of future transactions.
Note 9 – Investment Transactions
The aggregate amount of investment securities (other than short-term securities, U.S. Treasury obligations and money market funds, if any) purchased and sold by the Fund during the yearended December 31, 2019 was $504,576,604 and $563,591,117, respectively. Cost of investments, including any derivatives, on a tax basis includes the adjustments for financial reporting purposes as of the most recently completed federal income tax reportingperiod-end.
| | | | |
| Unrealized Appreciation (Depreciation) of Investments on a Tax Basis | |
Aggregate unrealized appreciation of investments | | $ | 228,410,977 | |
Aggregate unrealized (depreciation) of investments | | | (6,145,206) | |
| | | | |
Net unrealized appreciation of investments | | $ | 222,265,771 | |
| | | | |
|
Cost of investments for tax purposes is $521,421,994. |
Note 10 – Reclassification of Permanent Differences
Primarily as a result of differing book/tax treatment of partnership transactions, net operating loss and post financial statement adjustments, on December 31, 2019, undistributed net investment loss was increased by $3,388,685, undistributed net realized gain was increased by $4,561,572 shares of beneficial interest was decreased by $1,172,887. This reclassification had no effect on the net assets of the Fund.
Note 11 – Share Information
Transactions in shares of beneficial interest were as follows:
| | | | | | | | | | | | | | | | |
| | | Year Ended December 31,
20191 | | | Year Ended December 31,
2018 | |
| | | | |
| | | Shares | | | Amount | | | Shares | | | Amount | |
Series I Shares | | | | | | | | | | | | | | | | |
Sold | | | 222,808 | | | $ | 12,378,336 | | | | 363,347 | | | $ | 19,418,739 | |
Dividends and/or distributions reinvested | | | 930,266 | | | | 49,378,533 | | | | 779,254 | | | | 43,131,733 | |
Redeemed | | | (1,646,179 | ) | | | (91,626,708 | ) | | | (1,630,524 | ) | | | (91,352,971 | ) |
| | | | |
Net increase (decrease) | | | (493,105 | ) | | $ | (29,869,839 | ) | | | (487,923 | ) | | $ | (28,802,499 | ) |
| | | | |
| | | | |
| | | | | | | | | | | | | | | | |
Series II Shares | | | | | | | | | | | | | | | | |
Sold | | | 809,631 | | | $ | 43,673,830 | | | | 124,097 | | | $ | 6,689,300 | |
Dividends and/or distributions reinvested | | | 357,511 | | | | 18,651,335 | | | | 300,192 | | | | 16,387,466 | |
Redeemed | | | (713,247 | ) | | | (38,955,960 | ) | | | (3,229,296 | ) | | | (173,369,218 | ) |
| | | | |
Net increase (decrease) | | | 453,895 | | | $ | 23,369,205 | | | | (2,805,007 | ) | | $ | (150,292,452 | ) |
| | | | |
| | | | |
1. There are entities that are record owners of more than 5% of the outstanding shares of the Fund and own 32% of the outstanding shares of the Fund. The Fund and the Fund’s principal underwriter or adviser, are parties to participation agreements with these entities whereby these entities sell units of interest in separate accounts funding variable products that are invested
20 INVESCO OPPENHEIMER V.I. CAPITAL APPRECIATION FUND
in the Fund. The Fund, Invesco and/or Invesco affiliates may make payments to these entities, which are considered to be related to the Fund, for providing services to the Fund, Invesco and/or Invesco affiliates, including, but not limited to services such as securities brokerage, distribution, third party record keeping and account servicing. The Fund has no knowledge as to whether all or any portion of the shares owned of record by these entities are also owned beneficially.
Note 12 - Borrowings
Joint Credit Facility.A number of mutual funds managed by the Adviser participate in a $1.95 billion revolving credit facility (the “Facility”) intended to provide short-term financing, if necessary, subject to certain restrictions in connection with atypical redemption activity. Expenses and fees related to the Facility are paid by the participating funds and are disclosed separately or as other expenses on the Statement of Operations. The Fund did not utilize the Facility during the reporting period.The Facility terminated May 24, 2019.
21 INVESCO OPPENHEIMER V.I. CAPITAL APPRECIATION FUND
REPORT OF INDEPENDENT REGISTERED PUBLIC ACCOUNTING FIRM
To the Board of Trustees of AIM Variable Insurance Funds (Invesco Variable Insurance Funds) and Shareholders of Invesco Oppenheimer V.I. Capital Appreciation Fund
Opinion on the Financial Statements
We have audited the accompanying statement of assets and liabilities, including the schedule of investments, of Invesco Oppenheimer V.I. Capital Appreciation Fund (one of the funds constituting AIM Variable Insurance Funds (Invesco Variable Insurance Funds), referred to hereafter as the “Fund”) as of December 31, 2019, the related statements of operations and of changes in net assets for the year ended December 31, 2019, including the related notes, and the financial highlights for the period ended December 31, 2019 (collectively referred to as the “financial statements”). In our opinion, the financial statements present fairly, in all material respects, the financial position of the Fund as of December 31, 2019, the results of its operations and changes in its net assets for the year ended December 31, 2019 and the financial highlights for the period ended December 31, 2019 in conformity with accounting principles generally accepted in the United States of America.
The financial statements of Invesco Oppenheimer V.I. Capital Appreciation Fund (formerly known as Oppenheimer Capital Appreciation Fund/VA) as of and for the year ended December 31, 2018 and the financial highlights for each of the periods ended on or prior to December 31, 2018 (not presented herein, other than the statement of changes in net assets and the financial highlights) were audited by other auditors whose report dated February 14, 2019 expressed an unqualified opinion on those financial statements and financial highlights.
Basis for Opinion
These financial statements are the responsibility of the Fund’s management. Our responsibility is to express an opinion on the Fund’s financial statements based on our audit. We are a public accounting firm registered with the Public Company Accounting Oversight Board (United States) (PCAOB) and are required to be independent with respect to the Fund in accordance with the U.S. federal securities laws and the applicable rules and regulations of the Securities and Exchange Commission and the PCAOB.
We conducted our audit of these financial statements in accordance with the standards of the PCAOB. Those standards require that we plan and perform the audit to obtain reasonable assurance about whether the financial statements are free of material misstatement, whether due to error or fraud.
Our audit included performing procedures to assess the risks of material misstatement of the financial statements, whether due to error or fraud, and performing procedures that respond to those risks. Such procedures included examining, on a test basis, evidence regarding the amounts and disclosures in the financial statements. Our audit also included evaluating the accounting principles used and significant estimates made by management, as well as evaluating the overall presentation of the financial statements. Our procedures included confirmation of securities owned as of December 31, 2019 by correspondence with the custodian. We believe that our audit provides a reasonable basis for our opinion.
/s/PricewaterhouseCoopers LLP
Houston, Texas
February 18, 2020
We have served as the auditor of one or more of the investment companies in the Invesco group of investment companies since at least 1995. We have not been able to determine the specific year we began serving as auditor.
22 INVESCO OPPENHEIMER V.I. CAPITAL APPRECIATION FUND
TAX INFORMATION
Form1099-DIV, Form1042-S and other year–end tax information provide shareholders with actual calendar year amounts that should be included in their tax returns. Shareholders should consult their tax advisers.
The following distribution information is being provided as required by the Internal Revenue Code or to meet a specific state’s requirement.
The Fund designates the following amounts or, if subsequently determined to be different, the maximum amount allowable for its fiscal year ended December 31, 2019:
Federal and State Income Tax
| | | | |
Long-Term Capital Gain Distributions | | $ | 65,854,879 | |
Corporate Dividends Received Deduction* | | | 100.00 | % |
* The above percentages are based on ordinary income dividends paid to shareholders during the Fund’s fiscal year.
23 INVESCO OPPENHEIMER V.I. CAPITAL APPRECIATION FUND
PORTFOLIO PROXY VOTING POLICIES AND GUIDELINES; UPDATES TO SCHEDULE OF INVESTMENTS
Go paperless with eDelivery
Visit invesco.com/edelivery to enjoy the convenience and security of anytime electronic access to your investment documents.
With eDelivery, you can elect to have any or all of the following materials delivered straight to your inbox to download, save and print from your own computer:
• Fund reports and prospectuses
• Quarterly statements
• Daily confirmations
• Tax forms
Invesco mailing information
Send general correspondence to Invesco Investment Services, Inc., P.O. Box 219078, Kansas City, MO 64121-9078.
Important notice regarding delivery of security holder documents
To reduce Fund expenses, only one copy of most shareholder documents may be mailed to shareholders with multiple accounts at the same address (Householding). Mailing of your shareholder documents may be householded indefinitely unless you instruct us otherwise. If you do not want the mailing of these documents to be combined with those for other members of your household, please contact Invesco Investment Services, Inc. at 800 959 4246 or contact your financial institution. We will begin sending you individual copies for each account within 30 days after receiving your request.
Fund holdings and proxy voting information
The Fund provides a complete list of its holdings four times in each fiscal year, at the quarter ends. For the second and fourth quarters, the lists appear in the Fund’s semiannual and annual reports to shareholders. For the first and third quarters, the Fund files the lists with the Securities and Exchange Commission (SEC) as an exhibit to its reports on FormN-PORT. The most recent list of portfolio holdings is available at invesco.com/completeqtrholdings. Shareholders can also look up the Fund’s FormsN-PORT on the SEC website at sec.gov.
A description of the policies and procedures that the Fund uses to determine how to vote proxies relating to portfolio securities is available without charge, upon request, from our Client Services department at 800 959 4246 or at invesco.com/proxyguidelines. The information is also available on the SEC website, sec.gov.
Information regarding how the Fund voted proxies related to its portfolio securities during the most recent12-month period ended June 30 is available at invesco. com/proxysearch. The information is also available on the SEC website, sec.gov.
Invesco Advisers, Inc. is an investment adviser; it provides investment advisory services to individual and institutional clients and does not sell securities. Invesco Distributors, Inc. is the US distributor for Invesco Ltd.’s retail mutual funds, exchange-traded funds and institutional money market funds. Both are wholly owned, indirect subsidiaries of Invesco Ltd.
24 INVESCO OPPENHEIMER V.I. CAPITAL APPRECIATION FUND
TRUSTEES AND OFFICERS
The address of each trustee and officer is AIM Variable Insurance Funds (Invesco Variable Insurance Funds) (the “Trust”), 11 Greenway Plaza, Suite 1000, Houston, Texas 77046-1173. The trustees serve for the life of the Trust, subject to their earlier death, incapacitation, resignation, retirement or removal as more specifically provided in the Trust’s organizational documents. Each officer serves for a one year term or until their successors are elected and qualified. Column two below includes length of time served with predecessor entities, if any.
| | | | | | | | |
| | | | | |
Name, Year of Birth and Position(s) Held with
the Trust | | Trustee
and/or
Officer Since | | Principal Occupation(s)
During Past 5 Years | | Number of Funds
in Fund Complex
Overseen by Trustee | | Other Directorship(s)
Held by Trustee During
Past 5 Years |
| INTERESTED PERSON | | | | | | | | |
Martin L. Flanagan1 — 1960
Trustee and Vice Chair | | 2007 | | Executive Director, Chief Executive Officer and President, Invesco Ltd. (ultimate parent of Invesco and a global investment management firm); Trustee and Vice Chair, The Invesco Funds; Vice Chair, Investment Company Institute; and Member of Executive Board, SMU Cox School of Business Formerly: Advisor to the Board, Invesco Advisers, Inc. (formerly known as Invesco Institutional (N.A.), Inc.); Chairman and Chief Executive Officer, Invesco Advisers, Inc. (registered investment adviser); Director, Chairman, Chief Executive Officer and President, Invesco Holding Company (US), Inc. (formerly IVZ Inc.) (holding company), Invesco Group Services, Inc. (service provider) and Invesco North American Holdings, Inc. (holding company); Director, Chief Executive Officer and President, Invesco Holding Company Limited (parent of Invesco and a global investment management firm); Director, Invesco Ltd.; Chairman, Investment Company Institute and President,Co-Chief Executive Officer,Co-President, Chief Operating Officer and Chief Financial Officer, Franklin Resources, Inc. (global investment management organization) | | 229 | | None |
| 1 Mr. Flanagan is considered an interested person (within the meaning of Section 2(a)(19) of the 1940 Act) of the Trust because he is an officer of the Adviser to the Trust, and an officer and a director of Invesco Ltd., ultimate parent of the Adviser. |
25 INVESCO OPPENHEIMER V.I. CAPITAL APPRECIATION FUND
TRUSTEES AND OFFICERSContinued
| | | | | | | | |
Name, Year of Birth and Position(s)
Held with the Trust | | Trustee and/or
Officer Since | | Principal Occupation(s)
During Past 5 Years | | Number of Funds in Fund Complex
Overseen by Trustee | | Other Directorship(s)
Held by Trustee During Past
5 Years |
| INDEPENDENT TRUSTEES | | | | | | | | |
Bruce L. Crockett – 1944
Trustee and Chair | | 2003 | | Chairman, Crockett Technologies Associates (technology consulting company) Formerly: Director, Captaris (unified messaging provider); Director, President and Chief Executive Officer, COMSAT Corporation; Chairman, Board of Governors of INTELSAT (international communications company); ACE Limited (insurance company); Independent Directors Council and Investment Company Institute: Member of the Audit Committee, Investment Company Institute; Member of the Executive Committee and Chair of the Governance Committee, Independent Directors Council | | 229 | | Director and Chairman of the Audit Committee, ALPS (Attorneys Liability Protection Society) (insurance company); Director and Member of the Audit Committee and Compensation Committee, Ferroglobe PLC (metallurgical company) |
David C. Arch – 1945
Trustee | | 2010 | | Chairman of Blistex Inc. (consumer health care products manufacturer); Member, World Presidents’ Organization | | 229 | | Board member of the Illinois Manufacturers’ Association |
Beth Ann Brown – 1968
Trustee | | 2019 | | Independent Consultant Formerly: Head of Intermediary Distribution, Managing Director, Strategic Relations, Managing Director, Head of National Accounts, Senior Vice President, National Account Manager and Senior Vice President, Key Account Manager, Columbia Management Investment Advisers LLC; Vice President, Key Account Manager, Liberty Funds Distributor, Inc.; and Trustee of certain Oppenheimer Funds | | 229 | | Director, Board of Directors of Caron Engineering Inc.; Advisor, Board of Advisors of Caron Engineering Inc.; President and Director, of Acton Shapleigh Youth Conservation Corps (non -profit); and Vice President and Director of Grahamtastic Connection(non-profit) |
Jack M. Fields – 1952
Trustee | | 2003 | | Chief Executive Officer, Twenty First Century Group, Inc. (government affairs company); and Chairman, Discovery Learning Alliance(non-profit) Formerly: Owner and Chief Executive Officer, Dos Angeles Ranch L.P. (cattle, hunting, corporate entertainment); Director, Insperity, Inc. (formerly known as Administaff) (human resources provider); Chief Executive Officer, Texana Timber LP (sustainable forestry company); Director of Cross Timbers Quail Research Ranch(non-profit); and member of the U.S. House of Representatives | | 229 | | None |
Cynthia Hostetler —1962
Trustee | | 2017 | | Non-Executive Director and Trustee of a number of public and private business corporations Formerly: Director, Aberdeen Investment Funds (4 portfolios); Head of Investment Funds and Private Equity, Overseas Private Investment Corporation; President, First Manhattan Bancorporation, Inc.; Attorney, Simpson Thacher & Bartlett LLP | | 229 | | Vulcan Materials Company (construction materials company); Trilinc Global Impact Fund; Genesee & Wyoming, Inc. (railroads); Artio Global Investment LLC (mutual fund complex); Edgen Group, Inc. (specialized energy and infrastructure products distributor); Investment Company Institute (professional organization); Independent Directors Council (professional organization) |
Eli Jones – 1961
Trustee | | 2016 | | Professor and Dean, Mays Business School - Texas A&M University Formerly: Professor and Dean, Walton College of Business, University of Arkansas and E.J. Ourso College of Business, Louisiana State University; Director, Arvest Bank | | 229 | | Insperity, Inc. (formerly known as Administaff) (human resources provider) |
Elizabeth Krentzman – 1959
Trustee | | 2019 | | Formerly: Principal and Chief Regulatory Advisor for Asset Management Services and U.S. Mutual Fund Leader of Deloitte & Touche LLP; General Counsel of the Investment Company Institute (trade association); National Director of the Investment Management Regulatory Consulting Practice, Principal, Director and Senior Manager of Deloitte & Touche LLP; Assistant Director of the Division of Investment Management - Office of Disclosure and Investment Adviser Regulation of the U.S. Securities and Exchange Commission and various positions with the Division of Investment Management – Office of Regulatory Policy of the U.S. Securities and Exchange Commission; Associate at Ropes & Gray LLP.; Advisory Board Member of the Securities and Exchange Commission Historical Society; and Trustee of certain Oppenheimer Funds | | 229 | | Trustee of the University of Florida National Board Foundation and Audit Committee Member; Member of the Cartica Funds Board of Directors (private investment funds); Member of the University of Florida Law Center Association, Inc. Board of Trustees and Audit Committee Member |
Anthony J. LaCava, Jr. – 1956
Trustee | | 2019 | | Formerly: Director and Member of the Audit Committee, Blue Hills Bank (publicly traded financial institution) and Managing Partner, KPMG LLP | | 229* | | Blue Hills Bank; Chairman of Bentley University; Member, Business School Advisory Council; and Nominating Committee, KPMG LLP |
26 INVESCO OPPENHEIMER V.I. CAPITAL APPRECIATION FUND
| | | | | | | | |
| | | | | |
Name, Year of Birth and Position(s) Held with
the Trust | | Trustee and/or
Officer Since | | Principal Occupation(s) During Past 5 Years | | Number of Funds in Fund Complex
Overseen by Trustee | | Other Directorship(s)
Held by Trustee During Past 5
Years |
INDEPENDENT TRUSTEES (CONTINUED) | | | | | | | | |
| | | | | |
Prema Mathai-Davis – 1950 Trustee | | 2003 | | Retired Co-Owner & Partner of Quantalytics Research, LLC, (a FinTech Investment Research Platform for the Self-Directed Investor) | | 229 | | None |
| | | | | |
Joel W. Motley – 1952 Trustee | | 2019 | | Director of Office of Finance, Federal Home Loan Bank; Member of the Vestry of Trinity Wall Street; Managing Director of Carmona Motley Hoffman, Inc. (privately held financial advisor); Member of the Finance and Budget Committee of the Council on Foreign Relations, Member of the Investment Committee and Board of Human Rights Watch and Member of the Investment Committee and Board of Historic Hudson Valley(non-profit cultural organization). Formerly: Managing Director of Public Capital Advisors, LLC (privately held financial advisor); Managing Director of Carmona Motley Hoffman, Inc. (privately held financial advisor); Trustee of certain Oppenheimer Funds; and Director of Columbia Equity Financial Corp. (privately held financial advisor) | | 229 | | Director of Greenwall Foundation (bioethics research foundation); Member of Board and Investment Committee of The Greenwall Foundation; Director of Southern Africa Legal Services Foundation; Board Member and Investment Committee Member of Pulitzer Center for Crisis Reporting (non-profit journalism) |
| | | | | |
Teresa M. Ressel — 1962 Trustee | | 2017 | | Non-executive director and trustee of a number of public and private business corporations Formerly: Chief Financial Officer, Olayan America, The Olayan Group (international investor/commercial/industrial); Chief Executive Officer, UBS Securities LLC; Group Chief Operating Officer, Americas, UBS AG; Assistant Secretary for Management & Budget and CFO, US Department of the Treasury | | 229 | | Atlantic Power Corporation (power generation company); ON Semiconductor Corp. (semiconductor supplier) |
| | | | | |
Ann Barnett Stern – 1957 Trustee | | 2017 | | President and Chief Executive Officer, Houston Endowment Inc. (private philanthropic institution) Formerly: Executive Vice President and General Counsel, Texas Children’s Hospital; Attorney, Beck, Redden and Secrest, LLP; Business Law Instructor, University of St. Thomas; Attorney, Andrews & Kurth LLP | | 229 | | Federal Reserve Bank of Dallas |
| | | | | |
Robert C. Troccoli – 1949 Trustee | | 2016 | | Retired Formerly: Adjunct Professor, University of Denver – Daniels College of Business, Senior Partner, KPMG LLP | | 229 | | None |
| | | | | |
Daniel S. Vandivort –1954 Trustee | | 2019 | | Treasurer, Chairman of the Audit and Finance Committee, and Trustee, Board of Trustees, Huntington Disease Foundation of America; and President, Flyway Advisory Services LLC (consulting and property management). Formerly: Trustee and Governance Chair, of certain Oppenheimer Funds | | 229 | | Chairman and Lead Independent Director, Chairman of the Audit Committee, and Director, Board of Directors, Value Line Funds |
| | | | | |
James D. Vaughn – 1945 Trustee | | 2019 | | Retired Formerly: Managing Partner, Deloitte & Touche LLP; Trustee and Chairman of the Audit Committee, Schroder Funds; Board Member, Mile High United Way, Boys and Girls Clubs, Boy Scouts, Colorado Business Committee for the Arts, Economic Club of Colorado and Metro Denver Network (economic development corporation); and Trustee of certain Oppenheimer Funds | | 229 | | Board member and Chairman of Audit Committee of AMG National Trust Bank; Trustee and Investment Committee member, University of South Dakota Foundation; Board member, Audit Committee Member and past Board Chair, Junior Achievement(non-profit) |
| | | | | |
Christopher L. Wilson – 1957 Trustee, Vice Chair and Chair Designate | | 2017 | | Retired Formerly: Director, TD Asset Management USA Inc. (mutual fund complex) (22 portfolios); Managing Partner, CT2, LLC (investing and consulting firm); President/ Chief Executive Officer, Columbia Funds, Bank of America Corporation; President/ Chief Executive Officer, CDC IXIS Asset Management Services, Inc.; Principal & Director of Operations, Scudder Funds, Scudder, Stevens & Clark, Inc.; Assistant Vice President, Fidelity Investments | | 229 | | ISO New England, Inc. (non- profit organization managing regional electricity market) |
27 INVESCO OPPENHEIMER V.I. CAPITAL APPRECIATION FUND
TRUSTEES AND OFFICERSContinued
| | | | | | | | |
| | | | | |
Name, Year of Birth and Position(s) Held with
the Trust | | Trustee and/or
Officer Since | | Principal Occupation(s) During Past 5 Years | | Number of Funds in Fund Complex
Overseen by Trustee | | Other Directorship(s)
Held by Trustee During Past 5
Years |
OTHER OFFICERS | | | | | | | | |
| | | | | |
Sheri Morris — 1964 President, Principal Executive Officer and Treasurer | | 2003 | | Head of Global Fund Services, Invesco Ltd.; President, Principal Executive Officer and Treasurer, The Invesco Funds; Vice President, Invesco Advisers, Inc. (formerly known as Invesco Institutional (N.A.), Inc.) (registered investment adviser); and Vice President, Invesco Exchange-Traded Fund Trust, Invesco Exchange- Traded Fund Trust II, Invesco India Exchange-Traded Fund Trust, Invesco Actively Managed Exchange-Traded Fund Trust, Invesco Actively Managed Exchange- Traded Commodity Fund Trust and Invesco Exchange-Traded Self-Indexed Fund Trust, and Vice President, OppenheimerFunds, Inc. Formerly: Vice President and Principal Financial Officer, The Invesco Funds; Vice President, Invesco AIM Advisers, Inc., Invesco AIM Capital Management, Inc. and Invesco AIM Private Asset Management, Inc.; Assistant Vice President and Assistant Treasurer, The Invesco Funds and Assistant Vice President, Invesco Advisers, Inc., Invesco AIM Capital Management, Inc. and Invesco AIM Private Asset Management, Inc.; and Treasurer, Invesco Exchange-Traded Fund Trust, Invesco Exchange-Traded Fund Trust II, Invesco India Exchange-Traded Fund Trust and Invesco Actively Managed Exchange-Traded Fund Trust | | N/A | | N/A |
| | | | | |
Russell C. Burk — 1958 Senior Vice President and Senior Officer | | 2005 | | Senior Vice President and Senior Officer, The Invesco Funds | | N/A | | N/A |
| | | | | |
Jeffrey H. Kupor – 1968 Senior Vice President, Chief Legal Officer and Secretary | | 2018 | | Head of Legal of the Americas, Invesco Ltd.; Senior Vice President and Secretary, Invesco Advisers, Inc. (formerly known as Invesco Institutional (N.A.), Inc.) (registered investment adviser); Senior Vice President and Secretary, Invesco Distributors, Inc. (formerly known as Invesco AIM Distributors, Inc.); Vice President and Secretary, Invesco Investment Services, Inc. (formerly known as Invesco AIM Investment Services, Inc.) Senior Vice President, Chief Legal Officer and Secretary, The Invesco Funds; Secretary and General Counsel, Invesco Investment Advisers LLC (formerly known as Van Kampen Asset Management); Secretary and General Counsel, Invesco Capital Markets, Inc. (formerly known as Van Kampen Funds Inc.) and Chief Legal Officer, Invesco Exchange-Traded Fund Trust, Invesco Exchange-Traded Fund Trust II, Invesco India Exchange-Traded Fund Trust, Invesco Actively Managed Exchange-Traded Fund Trust, Invesco Actively Managed Exchange-Traded Commodity Fund Trust and Invesco Exchange-Traded Self-Indexed Fund Trust; Secretary, Invesco Indexing LLC; Secretary, W.L. Ross & Co., LLC Formerly: Secretary and Vice President, Jemstep, Inc.; Head of Legal, Worldwide Institutional, Invesco Ltd.; Secretary and General Counsel, INVESCO Private Capital Investments, Inc.; Senior Vice President, Secretary and General Counsel, Invesco Management Group, Inc. (formerly known as Invesco AIM Management Group, Inc.); Assistant Secretary, INVESCO Asset Management (Bermuda) Ltd.; Secretary and General Counsel, Invesco Private Capital, Inc.; Assistant Secretary and General Counsel, INVESCO Realty, Inc.; Secretary and General Counsel, Invesco Senior Secured Management, Inc.; and Secretary, Sovereign G./P. Holdings Inc. | | N/A | | N/A |
| | | | | |
Andrew R. Schlossberg – 1974 Senior Vice President | | 2019 | | Head of the Americas and Senior Managing Director, Invesco Ltd.; Director and Senior Vice President, Invesco Advisers, Inc. (formerly known as Invesco Institutional (N.A.), Inc.) (registered investment adviser); Director and Chairman, Invesco Investment Services, Inc. (formerly known as Invesco AIM Investment Services, Inc.) (registered transfer agent); Senior Vice President, The Invesco Funds; Director, Invesco Investment Advisers LLC (formerly known as Van Kampen Asset Management); Director, President and Chairman, Invesco Insurance Agency, Inc. Formerly: Director, Invesco UK Limited; Director and Chief Executive, Invesco Asset Management Limited and Invesco Fund Managers Limited; Assistant Vice President, The Invesco Funds; Senior Vice President, Invesco Advisers, Inc. (formerly known as Invesco Institutional (N.A.), Inc.) (registered investment adviser); Director and Chief Executive, Invesco Administration Services Limited and Invesco Global Investment Funds Limited; Director, Invesco Distributors, Inc.; Head of EMEA, Invesco Ltd.; President, Invesco Actively Managed Exchange- Traded Commodity Fund Trust, Invesco Actively Managed Exchange-Traded Fund Trust, Invesco Exchange-Traded Fund Trust, Invesco Exchange-Traded Fund Trust II and Invesco India Exchange-Traded Fund Trust; Managing Director and Principal Executive Officer, Invesco Capital Management LLC | | N/A | | N/A |
28 INVESCO OPPENHEIMER V.I. CAPITAL APPRECIATION FUND
| | | | | | | | |
| | | | | |
Name, Year of Birth and Position(s) Held with
the Trust | | Trustee and/or
Officer Since | | Principal Occupation(s) During Past 5 Years | | Number of Funds in Fund Complex
Overseen by Trustee | | Other Directorship(s)
Held by Trustee During Past 5
Years |
OTHER OFFICERS (CONTINUED) | | | | | | | | |
| | | | | |
John M. Zerr — 1962 Senior Vice President | | 2006 | | Chief Operating Officer of the Americas; Senior Vice President, Invesco Advisers, Inc. (formerly known as Invesco Institutional (N.A.), Inc.) (registered investment adviser); Senior Vice President, Invesco Distributors, Inc. (formerly known as Invesco AIM Distributors, Inc.); Director and Vice President, Invesco Investment Services, Inc. (formerly known as Invesco AIM Investment Services, Inc.) Senior Vice President, The Invesco Funds; Managing Director, Invesco Capital Management LLC; Director, Invesco Investment Advisers LLC (formerly known as Van Kampen Asset Management); Senior Vice President, Invesco Capital Markets, Inc. (formerly known as Van Kampen Funds Inc.); Manager, Invesco Indexing LLC; Manager, Invesco Specialized Products, LLC; Director and Senior Vice President, Invesco Insurance Agency, Inc.; Member, Invesco Canada Funds Advisory Board; Director, President and Chief Executive Officer, Invesco Corporate Class Inc. (corporate mutual fund company); and Director, Chairman, President and Chief Executive Officer, Invesco Canada Ltd. (formerly known as Invesco Trimark Ltd./ Invesco Trimark Ltèe) (registered investment adviser and registered transfer agent) Formerly: Director and Senior Vice President, Invesco Management Group, Inc. (formerly known as Invesco AIM Management Group, Inc.); Secretary and General Counsel, Invesco Management Group, Inc. (formerly known as Invesco AIM Management Group, Inc.); Secretary, Invesco Investment Services, Inc. (formerly known as Invesco AIM Investment Services, Inc.); Chief Legal Officer and Secretary, The Invesco Funds; Secretary and General Counsel, Invesco Investment Advisers LLC (formerly known as Van Kampen Asset Management); Secretary and General Counsel, Invesco Capital Markets, Inc. (formerly known as Van Kampen Funds Inc.); Chief Legal Officer, Invesco Exchange-Traded Fund Trust, Invesco Exchange-Traded Fund Trust II, Invesco India Exchange-Traded Fund Trust, Invesco Actively Managed Exchange-Traded Fund Trust, Invesco Actively Managed Exchange-Traded Commodity Fund Trust and Invesco Exchange-Traded Self-Indexed Fund Trust; Secretary, Invesco Indexing LLC; Director, Secretary, General Counsel and Senior Vice President, Van Kampen Exchange Corp.; Director, Vice President and Secretary, IVZ Distributors, Inc. (formerly known as INVESCO Distributors, Inc.); Director and Vice President, INVESCO Funds Group, Inc.; Director and Vice President, Van Kampen Advisors Inc.; Director, Vice President, Secretary and General Counsel, Van Kampen Investor Services Inc.; Director and Secretary, Invesco Distributors, Inc. (formerly known as Invesco AIM Distributors, Inc.); Director, Senior Vice President, General Counsel and Secretary, Invesco AIM Advisers, Inc. and Van Kampen Investments Inc.; Director, Vice President and Secretary, Fund Management Company; Director, Senior Vice President, Secretary, General Counsel and Vice President, Invesco AIM Capital Management, Inc.; Chief Operating Officer and General Counsel, Liberty Ridge Capital, Inc. (an investment adviser) | | N/A | | N/A |
| | | | | |
Gregory G. McGreevey - 1962 Senior Vice President | | 2012 | | Senior Managing Director, Invesco Ltd.; Director, Chairman, President, and Chief Executive Officer, Invesco Advisers, Inc. (formerly known as Invesco Institutional (N.A.), Inc.) (registered investment adviser); Director, Invesco Mortgage Capital, Inc. and Invesco Senior Secured Management, Inc.; and Senior Vice President, The Invesco Funds; and President, SNW Asset Management Corporation Formerly: Senior Vice President, Invesco Management Group, Inc. and Invesco Advisers, Inc.; Assistant Vice President, The Invesco Funds | | N/A | | N/A |
| | | | | |
Kelli Gallegos – 1970 Vice President, Principal Financial Officer and Assistant Treasurer | | 2008 | | Principal Financial and Accounting Officer – Investments Pool, Invesco Specialized Products, LLC; Vice President, Principal Financial Officer and Assistant Treasurer, The Invesco Funds; Principal Financial and Accounting Officer – Pooled Investments, Invesco Capital Management LLC; Vice President and Treasurer, Invesco Exchange-Traded Fund Trust, Invesco Exchange-Traded Fund Trust II, Invesco India Exchange-Traded Fund Trust, Invesco Actively Managed Exchange- Traded Fund Trust, Invesco Actively Managed Exchange-Traded Commodity Fund Trust and Invesco Exchange-Traded Self-Indexed Fund Trust Formerly: Assistant Treasurer, Invesco Specialized Products, LLC; Assistant Treasurer, Invesco Exchange-Traded Fund Trust, Invesco Exchange-Traded Fund Trust II, Invesco India Exchange-Traded Fund Trust, Invesco Actively Managed Exchange-Traded Fund Trust, Invesco Actively Managed Exchange-Traded Commodity Fund Trust and Invesco Exchange-Traded Self-Indexed Fund Trust; Assistant Treasurer, Invesco Capital Management LLC; Assistant Vice President, The Invesco Funds | | N/A | | N/A |
29 INVESCO OPPENHEIMER V.I. CAPITAL APPRECIATION FUND
TRUSTEES AND OFFICERSContinued
| | | | | | | | |
| | | | | |
Name, Year of Birth and Position(s) Held with
the Trust | | Trustee and/or
Officer Since | | Principal Occupation(s) During Past 5 Years | | Number of Funds in
Fund Complex
Overseen by Trustee | | Other Directorship(s)
Held by Trustee During Past 5
Years |
OTHER OFFICERS (CONTINUED) | | | | | | | | |
| | | | | |
Crissie M. Wisdom – 1969
Anti-Money Laundering Compliance Officer | | 2013 | | Anti-Money Laundering Compliance Officer, Invesco Advisers, Inc. (formerly known as Invesco Institutional (N.A.), Inc.) (registered investment adviser), Invesco Capital Markets, Inc. (formerly known as Van Kampen Funds Inc.), Invesco Distributors, Inc., Invesco Investment Services, Inc., The Invesco Funds, and Invesco Exchange-Traded Fund Trust, Invesco Exchange-Traded Fund Trust II, Invesco India Exchange-Traded Fund Trust, Invesco Actively Managed Exchange- Traded Fund Trust, Invesco Actively Managed Exchange-Traded Commodity Fund Trust and Invesco Exchange-Traded Self-Indexed Fund Trust; Anti-Money Laundering Compliance Officer and Bank Secrecy Act Officer, INVESCO National Trust Company and Invesco Trust Company; and Fraud Prevention Manager and Controls and Risk Analysis Manager for Invesco Investment Services, Inc. Formerly: Anti-Money Laundering Compliance Officer, Van Kampen Exchange Corp. and Invesco Management Group, Inc. | | N/A | | N/A |
| | | | | |
Robert R. Leveille – 1969
Chief Compliance Officer | | 2016 | | Chief Compliance Officer, Invesco Advisers, Inc. (registered investment adviser); and Chief Compliance Officer, The Invesco Funds Formerly: Chief Compliance Officer, Putnam Investments and the Putnam Funds | | N/A | | N/A |
The Statement of Additional Information of the Trust includes additional information about the Fund’s Trustees and is available upon request, without charge, by calling 1.800.959.4246. Please refer to the Fund’s Statement of Additional Information for information on the Fund’ssub-advisers.
| | | | | | | | |
Office of the Fund 11 Greenway Plaza,
Suite 1000
Houston, TX 77046-1173 | | Investment Adviser Invesco Advisers, Inc. 1555 Peachtree Street, N.E. Atlanta, GA 30309 | | Distributor Invesco Distributors, Inc. 11 Greenway Plaza, Suite 1000 Houston, TX 77046-1173 | | Auditors PricewaterhouseCoopers LLP
1000 Louisiana Street, Suite 5800 Houston, TX 77002-5021 | | |
Counsel to the Fund Stradley Ronon Stevens & Young, LLP 2005 Market Street, Suite 2600 Philadelphia, PA 19103-7018 | | Counsel to the Independent Trustees Goodwin Procter LLP 901 New York Avenue, N.W. Washington, D.C. 20001 | | Transfer Agent Invesco Investment Services, Inc. 11 Greenway Plaza, Suite 1000 Houston, TX 77046-1173 | | Custodian JPMorgan Chase Bank 4 Chase Metro Tech Center Brooklyn, NY 11245 | | |
30 INVESCO OPPENHEIMER V.I. CAPITAL APPRECIATION FUND
THIS PAGE INTENTIONALLY LEFT BLANK.


|
Invesco Oppenheimer V.I. Conservative Balanced Fund* Beginning on January 1, 2021, as permitted by regulations adopted by the Securities and Exchange Commission, the insurance company that offers your variable annuity or variable life insurance contract may no longer send you paper copies of the Fund’s shareholder reports by mail, unless you specifically request paper copies of the reports from the insurance company or your financial intermediary. Instead of delivering paper copies of the report, the insurance company may choose to make the reports available on a website, and will notify you by mail each time a report is posted and provide you with a website link to access the report. Instructions for requesting paper copies will be provided by your insurance company. If the insurance company offers electronic delivery, you may elect to receive shareholder reports and other communications about the Fund electronically by following the instructions provided by the insurance company or by contacting your financial intermediary. If you already elected to receive shareholder reports electronically, you will not be affected by this change and you need not take any action. You may elect to receive all future reports in paper free of charge from the insurance company. You can inform the insurance company or your financial intermediary that you wish to continue receiving paper copies of your shareholder reports by following the instructions provided by the insurance company or by contacting your financial intermediary. Your election to receive reports in paper will apply to all portfolio companies available under your contract with the insurance company. The Fund provides a complete list of its holdings four times in each fiscal year, at the quarter ends. For the second and fourth quarters, the lists appear in the Fund’s semi annual and annual reports to shareholders. For the first and third quarters, the Fund files the lists with the Securities and Exchange Commission (SEC) as an exhibit to its reports on Form N-PORT. The Fund’s Form N-PORT filings are available on the SEC website, sec.gov. The Fund’s most recent portfolio holdings, as filed on Form N-PORT, have also been made available to insurance companies issuing variable annuity contracts and variable life insurance policies (“variable products”) that invest in the Fund. A description of the policies and procedures that the Fund uses to determine how to vote proxies relating to portfolio securities is available without charge, upon request, from our Client Services department at 800 959 4246 or at invesco.com/proxyguidelines. The information is also available on the SEC website, sec.gov. Information regarding how the Fund voted proxies related to its portfolio securities during the most recent 12-month period ended June 30 is available at invesco.com/proxysearch. The information is also available on the SEC website, sec.gov. Invesco Advisers, Inc. is an investment adviser; it provides investment advisory services to individual and institutional clients and does not sell securities. Invesco Distributors, Inc. is the US distributor for Invesco Ltd.’s retail mutual funds, exchange- traded funds and institutional money market funds. Both are wholly owned, indirect subsidiaries of Invesco Ltd. This report must be accompanied or preceded by a currently effective Fund prospectus and variable product prospectus, which contain more complete information, including sales charges and expenses. Investors should read each carefully before investing. *Prior to the close of business on May 24, 2019, the Fund’s name was Oppenheimer Conservative Balanced Fund/VA. See Important Update on the following page for more information. |
Important Update
On October 18, 2018, Massachusetts Mutual Life Insurance Company, an indirect corporate parent of OppenheimerFunds, Inc. and its subsidiaries OFI Global Asset Management, Inc., OFI SteelPath, Inc. and OFI Advisors, LLC, announced that it had entered into an agreement whereby Invesco Ltd., a global investment management company would acquire OppenheimerFunds and its subsidiaries (together, “OppenheimerFunds”). After the close of business on May 24, 2019 Invesco Ltd. completed the acquisition of OppenheimerFunds. This Fund was included in that acquisition and as of that date, became part of the Invesco family of funds. Please visit invesco.com for more information or call Invesco’s Client Services team at 800-959-4246.
PORTFOLIO MANAGER:Michael Hyman1 and Magnus Krantz
AVERAGE ANNUAL TOTAL RETURNS FOR THE PERIODS ENDED 12/31/19
| | | | | | | | | | | | | | |
| | | Inception Date | | 1-Year | | | 5-Year | | | 10-Year |
Series I Shares2 | | 2/9/87 | | | 17.51 | | | | 5.23 | | | | 7.27 | |
Series II Shares2 | | 5/1/02 | | | 17.22 | | | | 4.95 | | | | 7.00 | |
Russell 3000 Index | | | | | 31.02 | | | | 11.24 | | | | 13.42 | |
Bloomberg Barclays U.S. Aggregate Bond Index | | | | | 8.72 | | | | 3.05 | | | | 3.75 | |
Custom Invesco Oppenheimer V.I. Conservative Balanced Index | | | | | 16.33 | | | | 6.11 | | | | 7.37 | |
Performance quoted is past performance and cannot guarantee future results; current performance may be lower or higher.Visit invesco.com for the most recent month-end performance. Performance figures reflect reinvested distributions and changes in net asset value (NAV). Investment return and principal value will vary so that you may have a gain or a loss when you sell shares. Fund returns include changes in share price and reinvested distributions. Performance figures given represent the Fund and are not intended to reflect actual variable product values. They do not reflect sales charges, expenses and fees assessed in connection with a variable product. Sales charges, expenses and fees, which are determined by the variable product issuers, will vary and will lower the total return. Returns for periods of less than one year are cumulative and not annualized. As the result of a reorganization after the close of business on May 24, 2019, the Non-Service and Service share classes of the predecessor fund were reorganized into Series I and Series II Shares, respectively, of the Fund. Returns shown for Series I and Series II shares are blended returns of the predecessor fund and the Fund. Share class returns will differ from those of the Oppenheimer predecessor fund because of different expenses. See Fund prospectuses and summary prospectuses for more information on share classes, sales charges and new fee agreements, if any. Fund literature is available at invesco.com.
TOP HOLDINGS AND ALLOCATIONS
TOP TEN COMMON STOCK HOLDINGS
| | | | |
| Microsoft Corp. | | | 1.9 | % |
| JPMorgan Chase & Co. | | | 1.6 | |
| Facebook, Inc., Cl. A | | | 1.1 | |
| Amazon.com, Inc. | | | 1.0 | |
| Apple, Inc. | | | 0.9 | |
| Mastercard, Inc., Cl. A | | | 0.9 | |
| Verizon Communications, Inc. | | | 0.9 | |
| Exxon Mobil Corp. | | | 0.8 | |
| Walmart, Inc. | | | 0.8 | |
| Johnson & Johnson | | | 0.8 | |
Holdings and allocations are subject to change and are not buy/sell recommendations. Percentages are as of December 31, 2019, and are based on net assets.
| | | | |
PORTFOLIO ALLOCATION | | | | |
| Common Stocks | | | 37.3 | % |
| Non-Convertible Corporate Bonds and Notes | | | 30.5 | |
| Mortgage-Backed Obligations | | | | |
Agency | | | 11.9 | |
CMOs | | | 2.0 | |
Non-Agency | | | 5.3 | |
| Asset-Backed Securities | | | 10.6 | |
| U.S. Government Obligations | | | 2.4 | |
Holdings and allocations are subject to change and are not buy/sell recommendations. Percentages are as of December 31, 2019, and are based on the total market value of investments.
For more current Fund holdings, please visit invesco.com.
1. Michael Hyman was named Portfolio Manager of the Fund effective July 3, 2019.
2. Effective after the close of business on May 24, 2019, the Non-Service and Service share classes of the predecessor fund were reorganized into Series I and Series II Shares, respectively, of the Fund. Returns shown for Series I and Series II shares are blended returns of the predecessor fund and the Fund. Share class returns will differ from those of the predecessor fund because of different expenses.
3 INVESCO OPPENHEIMER V.I. CONSERVATIVE BALANCED FUND
Fund Performance Discussion
For the twelve months ended December 31, 2019, the Fund’s Series I shares had a return of 17.51%, outperforming its benchmark, the Custom Invesco Oppenheimer V.I. Conservative Balanced Index (the “Custom Index”), which returned 16.33%. The Russell 3000 Index and the Bloomberg Barclays U.S. Aggregate Bond Index, both components of the Custom Index, returned 31.02% and 8.72%, respectively, over the period.
Equity markets rallied in the first quarter of 2019, fueled by optimism about a potential US-China trade deal and indication that the US Federal Reserve (the Fed) would not raise interest rates in 2019, a surprising shift in monetary policy. The Fed’s more accommodative stance provided a supportive environment for equities and fixed income, even as US economic data were mixed and overseas growth appeared to be slowing. Against this backdrop, the S&P 500 Index posted its best first quarter returns since 1998.
Although the S&P 500 Index posted modest gains for the second quarter of 2019, the US stock market experienced increased volatility. After four consecutive months of rising stock markets, the market sold off in May 2019, along with bond yields and oil prices, as investors weighed the impact of the lingering trade war between the US and China, as well as potential tariffs imposed on Mexico. In addition, economic data showed a slowing domestic and global economy.
Key issues that concerned investors in the second quarter of 2019 carried over into the third quarter. The US-China trade conflict worried investors and stifled business investment, even as the Fed cut interest rates by 0.25% in July and again in September 2019.1 This environment, combined with evidence of slowing global economic growth, fueled market volatility in August 2019. The US Treasury yield curve inverted several times, increasing fears of a possible US recession. As a result, August saw increased risk aversion, with investors crowding into asset classes perceived as safe havens, such as US Treasuries and gold. However, the Fed’s accommodative tone provided some support for risk assets.
Macroeconomic issues that concerned investors in the third quarter of 2019 mostly abated during the fourth quarter, providing the backdrop for strong equity market returns. Risk assets surged higher as a result of a delay in the Brexit agreement until January 2020, optimism that phase one of a US-China trade deal would be completed and better-than-expected third-quarter corporate earnings results. The US economy rose higher than expected, at 2.1% during the third quarter of 2019. During its October meeting, the Fed cut interest rates again by 0.25% based on business investment and exports remaining weak.1 Investors were also encouraged by a resilient US economy and corporate earnings, putting the US equity market on track for its largest annual rise since 2013.
EQUITY STRATEGY REVIEW
The equity portion of the portfolio outperformed the Russell 3000 Index during the reporting period as the broad equity market experienced healthy gains. The outperformance was driven by strong, broad-based stock selection with positive relative results in 8 of 11 GICS sectors. The biggest contributors included stock selection within the information technology, health care, and financials sectors. This was partially offset by weaker stock selection within the utilities and industrials sectors and slight underweight positioning to the information technology sector.
The particularly strong returns within the information technology sector were mainly driven by several holdings including First Data (no longer held at period–end), Snap, Applied Materials, and NVIDIA. The key detractors included EQT Corp., PG&E (no longer held at period–end), and Spirit Airlines. An underweight exposure to Apple also detracted from relative returns.
FIXED-INCOME STRATEGY REVIEW
In a period where credit outperformed US Treasuries, the Fund’s overweight position to credit and underweight to US Treasuries were the top contributors to relative returns. Additionally, the Fund had a small off-benchmark allocation to high yield during the reporting period which was beneficial, while an overweight to asset-backed securities and an underweight to agency mortgage-backed securities were both detractors.
1. Federal Reserve
The views and opinions expressed in management’s discussion of Fund performance are those of Invesco Advisers, Inc. These views and opinions are subject to change at any time based on factors such as market and economic conditions. These views and opinions may not be relied upon as investment advice or recommendations, or as an offer for a particular security. The information is not a complete analysis of every aspect of any market, country, industry, security or the Fund. Statements of fact are from sources considered reliable, but Invesco Advisers, Inc. makes no representation or warranty as to their completeness or accuracy. Although historical performance is no guarantee of future results, these insights may help you understand our investment management philosophy.
4 INVESCO OPPENHEIMER V.I. CONSERVATIVE BALANCED FUND
Before investing, investors should carefully read the prospectus and/or summary prospectus and carefully consider the investment objectives, risks, charges and expenses. For this and more complete information about the fund(s), investors should ask their advisors for a prospectus/summary prospectus or visit invesco.com/fundprospectus.
Shares of Invesco funds are not deposits or obligations of any bank, are not guaranteed by any bank, are not insured by the FDIC or any other agency, and involve investment risks, including the possible loss of the principal amount invested.
Comparing the Fund’s Performance to the Market.The graphs that follow show the performance of a hypothetical $10,000 investment in each share class of the Fund held until December 31, 2019. Performance is measured over a ten-fiscal-year period for both Classes. Performance information does not reflect charges that apply to separate accounts investing in the Fund. If these charges were taken into account, performance would be lower. The graphs assume that all dividends and capital gains distributions were reinvested in additional shares.
The Fund’s performance is compared to the performance of the Russell 3000 Index, the Bloomberg Barclays U.S. Aggregate Bond Index and the Custom Invesco Oppenheimer V.I. Conservative Balanced Index. The Russell 3000 Index measures the performance of the largest 3,000 U.S. companies, representing approximately 98% of the investable U.S. equity market. The Bloomberg Barclays U.S. Aggregate Bond Index is an index of U.S dollar-denominated, investment-grade U.S. corporate government and mortgage-backed securities. The Custom Invesco Oppenheimer V.I. Conservative Balanced Index is a customized weighted index currently comprised of 65% of the Bloomberg Barclays U.S. Aggregate Bond Index and 35% of the Russell 3000 Index. The indices are unmanaged and cannot be purchased directly by investors. While index comparisons may be useful to provide a benchmark for the Fund’s performance, it must be noted that the Fund’s investments are not limited to the investments comprising the indices. Index performance includes reinvestment of income, but does not reflect transaction costs, fees, expenses or taxes. Index performance is shown for illustrative purposes only as a benchmark for the Fund’s performance, and does not predict or depict performance of the Fund. The Fund’s performance reflects the effects of the Fund’s business and operating expenses.
5 INVESCO OPPENHEIMER V.I. CONSERVATIVE BALANCED FUND
COMPARISON OF CHANGE IN VALUE OF $10,000 HYPOTHETICAL INVESTMENTS IN:
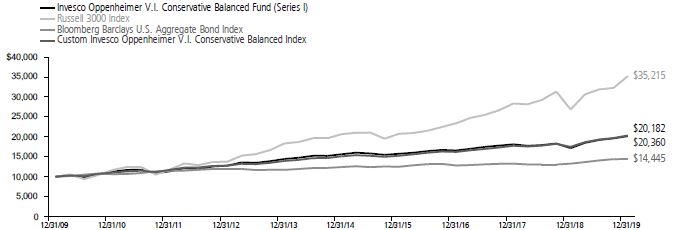
Average Annual Total Returns of Series I Shares of the Fund at 12/31/19
1-Year 17.51% 5-Year 5.23% 10-Year7.27%
COMPARISON OF CHANGE IN VALUE OF $10,000 HYPOTHETICAL INVESTMENTS IN:
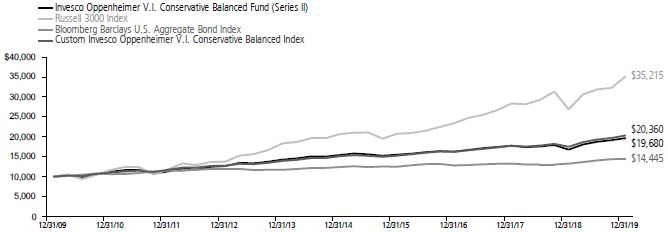
Average Annual Total Returns of Series II Shares of the Fund at 12/31/19
1-Year 17.22% 5-Year 4.95% 10-Year7.00%
Performance data quoted represents past performance, which does not guarantee future results. The investment return and principal value of an investment in the Fund will fluctuate so that an investor’s shares, when redeemed, may be worth more or less than their original cost. Current performance may be lower or higher than the performance quoted. For performance data current to the most recent month end, call us at 1.800.988.8287. The Fund’s total returns should not be expected to be the same as the returns of other funds, whether or not both funds have the same portfolio managers and/or similar names. The Fund’s total returns include changes in share price and reinvested distributions but do not include the charges associated with the separate account products that offer this Fund. Such performance would have been lower if such charges were taken into account.
6 INVESCO OPPENHEIMER V.I. CONSERVATIVE BALANCED FUND
Fund Expenses
Fund Expenses.As a shareholder of the Fund, you incur two types of costs: (1) transaction costs and (2) ongoing costs, including management fees; distribution and service fees; and other Fund expenses. These examples are intended to help you understand your ongoing costs (in dollars) of investing in the Fund and to compare these costs with the ongoing costs of investing in other mutual funds. The examples are based on an investment of $1,000.00 invested at the beginning of the period and held for the entire 6-month period ended December 31, 2019.
Actual Expenses. The first section of the table provides information about actual account values and actual expenses. You may use the information in this section for the class of shares you hold, together with the amount you invested, to estimate the expense that you paid over the period. Simply divide your account value by $1,000.00 (for example, an $8,600.00 account value divided by $1,000.00 = 8.60), then multiply the result by the number in the first section under the heading entitled “Expenses Paid During 6 Months Ended December 31, 2019” to estimate the expenses you paid on your account during this period.
Hypothetical Example for Comparison Purposes.
The second section of the table provides information about hypothetical account values and hypothetical expenses based on the Fund’s actual expense ratio for each class of shares, and an assumed rate of return of 5% per year for each class before expenses, which is not the actual return. The hypothetical account values and expenses may not be used to estimate the actual ending account balance or expenses you paid for the period. You may use this information to compare the ongoing costs of investing in the Fund and other funds. To do so, compare this 5% hypothetical example for the class of shares you hold with the 5% hypothetical examples that appear in the shareholder reports of the other funds.
Please note that the expenses shown in the table are meant to highlight your ongoing costs only and do not reflect any charges associated with the separate accounts that offer this Fund. Therefore, the “hypothetical” lines of the table are useful in comparing ongoing costs only, and will not help you determine the relative total costs of owning different funds. In addition, if these separate account charges were included your costs would have been higher.
| | | | | | | | | | | | | | | | | | | | | | | | |
| Actual | | Beginning
Account
Value
July 1, 2019 | | | | | Ending Account Value
December 31, 2019 | | | | | Expenses Paid During 6 Months Ended
December 31, 2019 | | | |
| Series I shares | | | $ 1,000.00 | | | | | | | | $ 1,049.50 | | | | | | | | $ 3.47 | | | | | |
| Series II shares | | | 1,000.00 | | | | | | | | 1,048.20 | | | | | | | | 4.76 | | | | | |
| | | | | | |
| Hypothetical | | | | | | | | | | | | | | | | | | | | | | | | |
| (5% return before expenses) | | | | | | | | | | | | | | | | | | | | | | | | |
| Series I shares | | | 1,000.00 | | | | | | | | 1,021.83 | | | | | | | | 3.42 | | | | | |
| Series II shares | | | 1,000.00 | | | | | | | | 1,020.57 | | | | | | | | 4.70 | | | | | |
Expenses are equal to the Fund’s annualized expense ratio for that class, multiplied by the average account value over the period, multiplied by 184/365 (to reflect the one-half year period). Those annualized expense ratios, excluding indirect expenses from affiliated funds, based on the 6-month period ended December 31, 2019 are as follows:
| | | | | | |
| Class | | Expense Ratios | | | |
| Series I shares | | 0.67% | | | | |
| Series II shares | | 0.92 | | | | |
The expense ratios reflect voluntary and/or contractual waivers and/or reimbursements of expenses by the Fund’s Manager. Some of these undertakings may be modified or terminated at any time, as indicated in the Fund’s prospectus. The “Financial Highlights” tables in the Fund’s financial statements, included in this report, also show the gross expense ratios, without such waivers or reimbursements and reduction to custodian expenses, if applicable.
7 INVESCO OPPENHEIMER V.I. CONSERVATIVE BALANCED FUND
SCHEDULE OF INVESTMENTSDecember 31, 2019
| | | | | | | | |
| | | Shares | | | Value | |
| Common Stocks—36.3% | | | | | | | | |
| Consumer Discretionary—5.9% | |
| Automobiles—0.2% | | | | | | | | |
| General Motors Co. | | | 10,091 | | | $ | 369,331 | |
| Entertainment—0.3% | |
| Zynga, Inc., Cl. A1 | | | 106,890 | | | | 654,167 | |
| Hotels, Restaurants & Leisure—0.7% | |
| Cedar Fair LP | | | 5,485 | | | | 304,088 | |
| McDonald’s Corp. | | | 5,300 | | | | 1,047,333 | |
| | | | | | | 1,351,421 | |
| Household Durables—0.3% | | | | | | | | |
| DR Horton, Inc. | | | 10,580 | | | | 558,095 | |
| Interactive Media & Services—1.4% | |
| Facebook, Inc., Cl. A1 | | | 10,090 | | | | 2,070,972 | |
| Snap, Inc., Cl. A1 | | | 33,890 | | | | 553,424 | |
| | | | | | | 2,624,396 | |
| Internet & Catalog Retail—1.0% | |
| Amazon.com, Inc.1 | | | 1,090 | | | | 2,014,146 | |
| Specialty Retail—1.5% | | | | | | | | |
| Burlington Stores, Inc.1 | | | 3,351 | | | | 764,128 | |
| CarMax, Inc.1 | | | 9,070 | | | | 795,167 | |
| Home Depot, Inc. (The) | | | 5,770 | | | | 1,260,053 | |
| | | | | | | 2,819,348 | |
| Textiles, Apparel & Luxury Goods—0.5% | |
| NIKE, Inc., Cl. B | | | 8,910 | | | | 902,672 | |
| Consumer Staples—1.9% | |
| Beverages—0.6% | |
| Coca-Cola Co. (The) | | | 21,420 | | | | 1,185,597 | |
| Food & Staples Retailing—0.8% | |
| Walmart, Inc. | | | 12,693 | | | | 1,508,436 | |
| Household Products—0.5% | |
| Procter & Gamble Co. (The) | | | 7,430 | | | | 928,007 | |
| Energy—1.8% | |
| Energy Equipment & Services—0.3% | |
| Schlumberger Ltd. | | | 15,410 | | | | 619,482 | |
| Oil, Gas & Consumable Fuels—1.5% | |
| Cabot Oil & Gas Corp. | | | 18,270 | | | | 318,081 | |
| EQT Corp. | | | 37,169 | | | | 405,142 | |
| Exxon Mobil Corp. | | | 21,820 | | | | 1,522,599 | |
| Shell Midstream Partners LP | | | 29,695 | | | | 600,136 | |
| | | | | | | 2,845,958 | |
| Financials—7.5% | |
| Capital Markets—0.6% | |
| Intercontinental Exchange, Inc. | | | 12,900 | | | | 1,193,895 | |
| Commercial Banks—3.8% | |
| Citigroup, Inc. | | | 11,360 | | | | 907,550 | |
| East West Bancorp, Inc. | | | 21,220 | | | | 1,033,414 | |
| IBERIABANK Corp. | | | 7,010 | | | | 524,558 | |
| JPMorgan Chase & Co. | | | 21,510 | | | | 2,998,494 | |
| Signature Bank (New York) | | | 2,860 | | | | 390,705 | |
| SVB Financial Group1 | | | 5,240 | | | | 1,315,450 | |
| | | | | | | 7,170,171 | |
| Insurance—1.4% | |
| American International Group, Inc. | | | 12,200 | | | | 626,226 | |
| Arthur J. Gallagher & Co. | | | 4,190 | | | | 399,014 | |
| Fidelity National Financial, Inc. | | | 17,030 | | | | 772,310 | |
| Progressive Corp. (The) | | | 12,480 | | | | 903,427 | |
| | | | | | | 2,700,977 | |
| Real Estate Investment Trusts (REITs)—1.7% | |
| AGNC Investment Corp. | | | 31,530 | | | | 557,451 | |
| EPR Properties | | | 8,940 | | | | 631,522 | |
| Prologis, Inc. | | | 15,367 | | | | 1,369,814 | |
| | | | | | | | |
| | | Shares | | | Value | |
| Real Estate Investment Trusts (REITs) (Continued) | |
| SL Green Realty Corp. | | | 6,340 | | | $ | 582,519 | |
| | | | | | | 3,141,306 | |
| Health Care—5.3% | |
| Biotechnology—0.5% | | | | | | | | |
| uniQure NV1 | | | 5,100 | | | | 365,466 | |
| Vertex Pharmaceuticals, Inc.1 | | | 2,790 | | | | 610,871 | |
| | | | | | | 976,337 | |
| Health Care Equipment & Supplies—1.8% | |
| Becton Dickinson & Co. | | | 2,550 | | | | 693,524 | |
| Boston Scientific Corp.1 | | | 15,750 | | | | 712,215 | |
| CryoPort, Inc.1 | | | 16,840 | | | | 277,186 | |
| Intuitive Surgical, Inc.1 | | | 1,380 | | | | 815,787 | |
| Zimmer Biomet Holdings, Inc. | | | 6,590 | | | | 986,391 | |
| | | | | | | 3,485,103 | |
| Health Care Providers & Services—0.5% | |
| Anthem, Inc. | | | 3,110 | | | | 939,313 | |
| Health Care Technology—0.3% | |
| Teladoc Health, Inc.1 | | | 5,340 | | | | 447,065 | |
| Pharmaceuticals—2.2% | |
| AstraZeneca plc, Sponsored ADR | | | 12,000 | | | | 598,320 | |
| Bayer AG, Sponsored ADR | | | 39,950 | | | | 810,186 | |
| Johnson & Johnson | | | 10,160 | | | | 1,482,039 | |
| Merck & Co., Inc. | | | 14,100 | | | | 1,282,395 | |
| TherapeuticsMD, Inc.1 | | | 30,050 | | | | 72,721 | |
| | | | | | | 4,245,661 | |
| Industrials—3.3% | |
| Aerospace & Defense—0.5% | |
| Lockheed Martin Corp. | | | 2,250 | | | | 876,105 | |
| Airlines—0.2% | |
| Spirit Airlines, Inc.1 | | | 10,570 | | | | 426,077 | |
| Commercial Services & Supplies—0.7% | |
| ACCO Brands Corp. | | | 48,950 | | | | 458,172 | |
| IAA, Inc.1 | | | 7,380 | | | | 347,303 | |
| Republic Services, Inc., Cl. A | | | 5,920 | | | | 530,609 | |
| | | | | | | 1,336,084 | |
| Industrial Conglomerates—0.6% | |
| Honeywell International, Inc. | | | 6,178 | | | | 1,093,506 | |
| Machinery—0.3% | |
| Stanley Black & Decker, Inc. | | | 3,200 | | | | 530,368 | |
| Professional Services—0.3% | |
| Korn Ferry | | | 12,820 | | | | 543,568 | |
| Road & Rail—0.4% | |
| Canadian Pacific Railway Ltd. | | | 3,140 | | | | 800,543 | |
| Trading Companies & Distributors—0.3% | |
| Fastenal Co. | | | 16,040 | | | | 592,678 | |
| Information Technology—7.6% | |
| Communications Equipment—0.5% | |
| Motorola Solutions, Inc. | | | 6,353 | | | | 1,023,722 | |
| IT Services—1.9% | |
| Accenture plc, Cl. A | | | 3,830 | | | | 806,483 | |
| Fiserv, Inc.1 | | | 6,281 | | | | 726,272 | |
| Mastercard, Inc., Cl. A | | | 5,440 | | | | 1,624,329 | |
| Perspecta, Inc. | | | 16,597 | | | | 438,825 | |
| | | | | | | 3,595,909 | |
| Semiconductors & Semiconductor Equipment—2.2% | |
| Applied Materials, Inc. | | | 18,890 | | | | 1,153,046 | |
| NVIDIA Corp. | | | 6,001 | | | | 1,412,035 | |
| QUALCOMM, Inc. | | | 8,550 | | | | 754,367 | |
| Texas Instruments, Inc. | | | 5,860 | | | | 751,779 | |
| | | | | | | 4,071,227 | |
8 INVESCO OPPENHEIMER V.I. CONSERVATIVE BALANCED FUND
| | | | | | | | |
| | | Shares | | | Value | |
| Software—2.1% | | | | | | | | |
| Microsoft Corp. | | | 23,140 | | | $ | 3,649,178 | |
| Q2 Holdings, Inc.1 | | | 4,970 | | | | 402,968 | |
| | | | | | | 4,052,146 | |
| Technology Hardware, Storage & Peripherals—0.9% | |
| Apple, Inc. | | | 5,950 | | | | 1,747,218 | |
| Materials—0.5% | | | | | | | | |
| Chemicals—0.2% | | | | | | | | |
| Valvoline, Inc. | | | 15,300 | | | | 327,573 | |
| Metals & Mining—0.3% | | | | | | | | |
| Compass Minerals International, Inc. | | | 9,440 | | | | 575,462 | |
| Telecommunication Services—1.2% | |
| Diversified Telecommunication Services—0.9% | |
| ORBCOMM, Inc.1 | | | 375 | | | | 1,579 | |
| Verizon Communications, Inc. | | | 26,070 | | | | 1,600,698 | |
| | | | | | | | 1,602,277 | |
| Wireless Telecommunication Services—0.3% | |
| T-Mobile US, Inc.1 | | | 8,070 | | | | 632,849 | |
| Utilities—1.3% | | | | | | | | |
| Electric Utilities—0.4% | | | | | | | | |
| Duke Energy Corp. | | | 8,430 | | | | 768,901 | |
| Gas Utilities—0.2% | | | | | | | | |
| Suburban Propane Partners LP | | | 22,085 | | | | 482,557 | |
| Multi-Utilities—0.7% | | | | | | | | |
| Avista Corp. | | | 7,410 | | | | 356,347 | |
| Dominion Energy, Inc. | | | 11,260 | | | | 932,553 | |
| | | | | | | 1,288,900 | |
| Total Common Stocks (Cost $52,929,500) | | | | 69,048,554 | |
| | |
| | | Principal
Amount | | | | |
| Asset-Backed Securities—10.3% | | | | | | | | |
| Auto Loans/Leases—7.5% | | | | | | | | |
| American Credit Acceptance Receivables Trust: | |
| Series 2017-4,Cl. C, 2.94%, 1/10/242 | | $ | 90,282 | | | | 90,394 | |
| Series 2017-4,Cl. D, 3.57%, 1/10/242 | | | 246,000 | | | | 248,513 | |
| Series 2018-2,Cl. C, 3.70%, 7/10/242 | | | 275,000 | | | | 276,671 | |
| Series 2018-3,Cl. B, 3.49%, 6/13/222 | | | 61,208 | | | | 61,314 | |
| Series 2018-3,Cl. D, 4.14%, 10/15/242 | | | 25,000 | | | | 25,487 | |
| Series 2018-4,Cl. C, 3.97%, 1/13/252 | | | 180,000 | | | | 182,372 | |
| Series 2019-2,Cl. D, 3.41%, 6/12/252 | | | 140,000 | | | | 141,772 | |
| Series 2019-3,Cl. C, 2.76%, 9/12/252 | | | 155,000 | | | | 155,592 | |
| AmeriCredit Automobile Receivables Trust: | |
| Series 2017-2,Cl. D, 3.42%, 4/18/23 | | | 320,000 | | | | 325,616 | |
| Series 2017-4,Cl. D, 3.08%, 12/18/23 | | | 205,000 | | | | 208,257 | |
| Series 2018-3,Cl. C, 3.74%, 10/18/24 | | | 260,000 | | | | 270,030 | |
| Series 2019-2,Cl. C, 2.74%, 4/18/25 | | | 100,000 | | | | 100,909 | |
| Series 2019-2,Cl. D, 2.99%, 6/18/25 | | | 270,000 | | | | 273,058 | |
| Series 2019-3,Cl. D, 2.58%, 9/18/25 | | | 130,000 | | | | 128,764 | |
| Capital Auto Receivables Asset Trust: | | | | | |
| Series 2017-1,Cl. D, 3.15%, 2/20/252 | | | 40,000 | | | | 40,454 | |
| Series 2018-2,Cl. B, 3.48%, 10/20/232 | | | 125,000 | | | | 126,452 | |
| Series 2018-2,Cl. C, 3.69%, 12/20/232 | | | 120,000 | | | | 121,761 | |
| CarMax Auto Owner Trust: | | | | | | | | |
| Series 2016-1,Cl. D, 3.11%, 8/15/22 | | | 220,000 | | | | 220,258 | |
| Series 2017-1,Cl. D, 3.43%, 7/17/23 | | | 245,000 | | | | 247,980 | |
| Series 2017-4,Cl. D, 3.30%, 5/15/24 | | | 110,000 | | | | 111,417 | |
| Series 2018-1,Cl. D, 3.37%, 7/15/24 | | | 75,000 | | | | 76,225 | |
| Series 2018-4,Cl. C, 3.85%, 7/15/24 | | | 90,000 | | | | 93,501 | |
| CPS Auto Receivables Trust: | | | | | | | | |
| Series 2018-A,Cl. B, 2.77%, 4/18/222 | | | 97,633 | | | | 97,760 | |
| Series 2018-B,Cl. B, 3.23%, 7/15/222 | | | 155,000 | | | | 155,486 | |
| Credit Acceptance Auto Loan Trust: | | | | | |
| Series 2017-3A,Cl. C, 3.48%, 10/15/262 | | | 220,000 | | | | 223,179 | |
| Series 2018-1A,Cl. B, 3.60%, 4/15/272 | | | 170,000 | | | | 172,890 | |
| Series 2018-1A,Cl. C, 3.77%, 6/15/272 | | | 250,000 | | | | 254,908 | |
| | | | | | | | |
| | | Principal
Amount | | | Value | |
| Auto Loans/Leases (Continued) | |
| Credit Acceptance Auto Loan Trust: (Continued) | |
| Series 2018-2A,Cl. C, 4.16%, 9/15/272 | | $ | 160,000 | | | $ | 165,368 | |
| Series 2018-3A,Cl. C, 4.04%, 12/15/272 | | | 220,000 | | | | 226,575 | |
| Series 2019-1A,Cl. B, 3.75%, 4/17/282 | | | 100,000 | | | | 102,990 | |
| Series 2019-1A,Cl. C, 3.94%, 6/15/282 | | | 105,000 | | | | 108,505 | |
| Drive Auto Receivables Trust: | | | | | | | | |
| Series 2017-1,Cl. D, 3.84%, 3/15/23 | | | 360,000 | | | | 363,675 | |
| Series 2018-1,Cl. D, 3.81%, 5/15/24 | | | 160,000 | | | | 162,665 | |
| Series 2018-2,Cl. D, 4.14%, 8/15/24 | | | 230,000 | | | | 234,694 | |
| Series 2018-3,Cl. D, 4.30%, 9/16/24 | | | 215,000 | | | | 220,567 | |
| Series 2018-5,Cl. C, 3.99%, 1/15/25 | | | 210,000 | | | | 214,012 | |
| Series 2019-1,Cl. C, 3.78%, 4/15/25 | | | 340,000 | | | | 345,926 | |
| Series 2019-3,Cl. D, 3.18%, 10/15/26 | | | 210,000 | | | | 213,084 | |
| Series 2019-4,Cl. D, 2.70%, 2/16/27 | | | 85,000 | | | | 84,420 | |
| DT Auto Owner Trust: | | | | | | | | |
| Series 2016-4A,Cl. E, 6.49%, 9/15/232 | | | 75,000 | | | | 76,934 | |
| Series 2017-1A,Cl. D, 3.55%, 11/15/222 | | | 118,437 | | | | 119,093 | |
| Series 2017-2A,Cl. D, 3.89%, 1/15/232 | | | 167,921 | | | | 169,113 | |
| Series 2017-3A,Cl. D, 3.58%, 5/15/232 | | | 75,000 | | | | 75,539 | |
| Series 2017-3A,Cl. E, 5.60%, 8/15/242 | | | 195,000 | | | | 201,978 | |
| Series 2017-4A,Cl. D, 3.47%, 7/17/232 | | | 205,000 | | | | 206,471 | |
| Series 2017-4A,Cl. E, 5.15%, 11/15/242 | | | 225,000 | | | | 231,882 | |
| Series 2018-3A,Cl. B, 3.56%, 9/15/222 | | | 270,000 | | | | 272,401 | |
| Series 2018-3A,Cl. C, 3.79%, 7/15/242 | | | 105,000 | | | | 106,701 | |
| Series 2019-2A,Cl. D, 3.48%, 2/18/252 | | | 130,000 | | | | 131,855 | |
| Series 2019-3A,Cl. D, 2.96%, 4/15/252 | | | 75,000 | | | | 75,064 | |
| Series 2019-4A,Cl. D, 2.85%, 7/15/252 | | | 220,000 | | | | 220,203 | |
| Exeter Automobile Receivables Trust: | | | | | |
| Series 2018-1A,Cl. B, 2.75%, 4/15/222 | | | 38,698 | | | | 38,714 | |
| Series 2018-4A,Cl. B, 3.64%, 11/15/222 | | | 220,000 | | | | 221,081 | |
| Series 2019-1A,Cl. D, 4.13%, 12/16/242 | | | 255,000 | | | | 263,311 | |
| Series 2019-2A,Cl. C, 3.30%, 3/15/242 | | | 322,000 | | | | 326,820 | |
| Series 2019-4A,Cl. D, 2.58%, 9/15/252 | | | 230,000 | | | | 228,017 | |
| Flagship Credit Auto Trust, Series 2016-1, Cl. C, 6.22%, 6/15/222 | | | 380,000 | | | | 389,922 | |
| GLS Auto Receivables Trust, Series2018-1A, Cl. A, 2.82%, 7/15/222 | | | 105,589 | | | | 105,836 | |
| GM Financial Automobile Leasing Trust: | | | | | |
| Series 2017-3,Cl. C, 2.73%, 9/20/21 | | | 120,000 | | | | 120,131 | |
| Series 2018-2,Cl. C, 3.50%, 4/20/22 | | | 145,000 | | | | 146,413 | |
| Prestige Auto Receivables Trust, Series 2019-1A, Cl. C, 2.70%, 10/15/242 | | | 115,000 | | | | 115,686 | |
| Santander Drive Auto Receivables Trust: | | | | | |
| Series 2017-1,Cl. E, 5.05%, 7/15/242 | | | 410,000 | | | | 421,265 | |
| Series 2017-3,Cl. D, 3.20%, 11/15/23 | | | 295,000 | | | | 298,658 | |
| Series 2018-1,Cl. D, 3.32%, 3/15/24 | | | 110,000 | | | | 111,172 | |
| Series 2018-2,Cl. D, 3.88%, 2/15/24 | | | 170,000 | | | | 174,121 | |
| Series 2018-5,Cl. C, 3.81%, 12/16/24 | | | 225,000 | | | | 228,395 | |
| Series 2019-2,Cl. D, 3.22%, 7/15/25 | | | 195,000 | | | | 198,947 | |
| Series 2019-3,Cl. D, 2.68%, 10/15/25 | | | 165,000 | | | | 164,433 | |
| Santander Retail Auto Lease Trust: | | | | | | | | |
| Series 2019-A,Cl. C, 3.30%, 5/22/232 | | | 320,000 | | | | 325,748 | |
| Series 2019-B,Cl. C, 2.77%, 8/21/232 | | | 115,000 | | | | 115,545 | |
| Series 2019-C,Cl. C, 2.39%, 11/20/232 | | | 205,000 | | | | 203,577 | |
| United Auto Credit Securitization Trust, Series 2019-1, Cl. C, 3.16%, 8/12/242 | | | 150,000 | | | | 151,152 | |
| Westlake Automobile Receivables Trust: | | | | | |
| Series 2017-2A,Cl. E, 4.63%, 7/15/242 | | | 320,000 | | | | 326,305 | |
| Series 2018-1A,Cl. D, 3.41%, 5/15/232 | | | 315,000 | | | | 318,610 | |
| Series 2018-3A,Cl. B, 3.32%, 10/16/232 | | | 252,000 | | | | 253,986 | |
9 INVESCO OPPENHEIMER V.I. CONSERVATIVE BALANCED FUND
SCHEDULE OF INVESTMENTSContinued
| | | | | | | | |
| | | Principal
Amount | | | Value | |
| Auto Loans/Leases (Continued) | |
| Westlake Automobile Receivables Trust: (Continued) | |
| Series 2019-3A,Cl. C, 2.49%, 10/15/242 | | $ | 265,000 | | | $ | 265,159 | |
| | | | | | | 14,273,739 | |
| Credit Cards—1.0% | | | | | | | | |
| World Financial Network Credit Card Master Trust: | | | | | | | | |
| Series 2018-A,Cl. A, 3.07%, 12/16/24 | | | 540,000 | | | | 546,079 | |
| Series 2018-B,Cl. A, 3.46%, 7/15/25 | | | 245,000 | | | | 250,631 | |
| Series 2018-C,Cl. A, 3.55%, 8/15/25 | | | 490,000 | | | | 502,290 | |
| Series 2019-A,Cl. A, 3.14%, 12/15/25 | | | 75,000 | | | | 76,681 | |
| Series 2019-B,Cl. A, 2.49%, 4/15/26 | | | 260,000 | | | | 262,228 | |
| Series 2019-C,Cl. A, 2.21%, 7/15/26 | | | 225,000 | | | | 225,364 | |
| | | | | | | 1,863,273 | |
| Home Equity Loans—0.0% | | | | | | | | |
| Ameriquest Mortgage Securities, Inc. Asset-Backed Pass-Through Certificates, Series 2005-R5, Cl. M2, 2.482% [US0001M+69], 7/25/353 | | | 5,903 | | | | 5,919 | |
| CNH Equipment Trust, Series 2017-C, Cl. B, 2.54%, 5/15/25 | | | 70,000 | | | | 70,624 | |
| | | | | | | 76,543 | |
| Leases—0.9% | | | | | | | | |
| CCG Receivables Trust: | | | | | | | | |
| Series 2017-1,Cl. B, 2.75%, 11/14/232 | | | 250,000 | | | | 250,287 | |
| Series 2018-1,Cl. B, 3.09%, 6/16/252 | | | 90,000 | | | | 90,699 | |
| Series 2018-1,Cl. C, 3.42%, 6/16/252 | | | 25,000 | | | | 25,299 | |
| Series 2018-2,Cl. C, 3.87%, 12/15/252 | | | 60,000 | | | | 61,589 | |
| Series 2019-1,Cl. B, 3.22%, 9/14/262 | | | 170,000 | | | | 173,376 | |
| Series 2019-1,Cl. C, 3.57%, 9/14/262 | | | 40,000 | | | | 40,831 | |
| Series 2019-2,Cl. B, 2.55%, 3/15/272 | | | 105,000 | | | | 104,935 | |
| Series 2019-2,Cl. C, 2.89%, 3/15/272 | | | 100,000 | | | | 99,884 | |
| CNH Equipment Trust, Series 2019-A, Cl. A4, 3.22%, 1/15/26 | | | 120,000 | | | | 124,257 | |
| Dell Equipment Finance Trust: | | | | | | | | |
| Series 2017-2,Cl. B, 2.47%, 10/24/222 | | | 75,000 | | | | 75,104 | |
| Series 2018-1,Cl. B, 3.34%, 6/22/232 | | | 90,000 | | | | 91,152 | |
| Series 2019-1,Cl. C, 3.14%, 3/22/242 | | | 330,000 | | | | 334,905 | |
| Series 2019-2,Cl. D, 2.48%, 4/22/252 | | | 110,000 | | | | 109,358 | |
| Element Rail Leasing I LLC, Series 2014-1A, Cl. A1, 2.299%, 4/19/442 | | | 66,031 | | | | 66,074 | |
| | | | | | | 1,647,750 | |
| Loans—0.9% | | | | | | | | |
| Ford Credit Floorplan Master Owner Trust A, Series 2019-3, Cl. A2, 2.34% [US0001M+60], 9/15/243 | | | 550,000 | | | | 552,432 | |
| GMF Floorplan Owner Revolving Trust: | | | | | | | | |
| Series 2018-3,Cl. B, 3.49%, 9/15/222 | | | 250,000 | | | | 252,104 | |
| Series 2018-3,Cl. C, 3.68%, 9/15/222 | | | 210,000 | | | | 211,917 | |
| Series 2018-4,Cl. B, 3.68%, 9/15/232 | | | 210,000 | | | | 214,789 | |
| Series 2018-4,Cl. C, 3.88%, 9/15/232 | | | 265,000 | | | | 271,316 | |
| Navistar Financial Dealer Note Master Owner Trust II: | |
| Series 2018-1,Cl. A, 2.422% [US0001M+63], 9/25/232,3 | | | 115,000 | | | | 115,209 | |
| Series 2018-1,Cl. B, 2.592% [US0001M+80], 9/25/232,3 | | | 135,000 | | | | 135,164 | |
| Series 2019-1,Cl. C, 2.742% [US0001M+95], 5/25/242,3 | | | 25,000 | | | | 25,055 | |
| Series 2019-1,Cl. D, 3.242% [US0001M+145], 5/25/242,3 | | | 25,000 | | | | 25,029 | |
| | | | | | | 1,803,015 | |
| Total Asset-Backed Securities (Cost $19,417,179) | | | | | | | 19,664,320 | |
| | | | | | | | |
| | | Principal
Amount | | | Value | |
| Mortgage-Backed Obligations—18.7% | | | | | | | | |
| Agency—11.6% | | | | | | | | |
| U.S. Agency Securities—11.6% | | | | | | | | |
| Federal Home Loan Mortgage Corp. Gold Pool: | |
| 5.00%, 12/1/34 | | $ | 1,672 | | | $ | 1,827 | |
| 5.50%, 9/1/39 | | | 181,321 | | | | 202,759 | |
| 6.50%, 7/1/28-4/1/34 | | | 13,242 | | | | 14,721 | |
| 7.00%, 10/1/31-10/1/37 | | | 46,462 | | | | 52,247 | |
| 9.00%, 8/1/22-5/1/25 | | | 578 | | | | 624 | |
| Federal Home Loan Mortgage Corp., Interest-Only Stripped Mtg.-Backed Security: | |
| Series 183,Cl. IO, 99.999%, 4/1/274 | | | 34,467 | | | | 5,310 | |
| Series 192,Cl. IO, 99.999%, 2/1/284 | | | 9,179 | | | | 1,370 | |
| Series 243,Cl. 6, 8.178%, 12/15/324 | | | 27,788 | | | | 4,685 | |
| Series 304,Cl. C31, 7.929%, 12/15/274 | | | 128,632 | | | | 8,542 | |
| Series 304,Cl. C45, 7.906%, 12/15/274 | | | 102,538 | | | | 6,816 | |
| Series 304,Cl. C47, 5.708%, 12/15/274 | | | 60,011 | | | | 4,059 | |
| Federal Home Loan Mortgage Corp., Mtg.-Linked Amortizing Global Debt Securities, Series 2012-1, Cl. A10, 2.06%, 1/15/22 | | | 99,576 | | | | 99,947 | |
| Federal Home Loan Mortgage Corp., Multifamily Structured Pass-Through Certificates, | |
| Interest-Only Stripped Mtg.-Backed Security: | | | | | | | | |
| Series K734,Cl. X1, 0.00%, 2/25/264,5 | | | 2,068,796 | | | | 71,396 | |
| Series KC02,Cl. X1, 0.00%, 3/25/244,5 | | | 4,858,528 | | | | 73,457 | |
| Federal Home Loan Mortgage Corp., Principal-Only Stripped Mtg.-Backed Security, Series 176, Cl. PO, 4.198%, 6/1/266 | | | 9,593 | | | | 9,007 | |
| Federal Home Loan Mortgage Corp., Real Estate Mtg. Investment Conduit Multiclass Pass-Through Certificates: | |
| Series 2427,Cl. ZM, 6.50%, 3/15/32 | | | 57,207 | | | | 64,097 | |
| Series 2461,Cl. PZ, 6.50%, 6/15/32 | | | 25,618 | | | | 28,682 | |
| Series 2635,Cl. AG, 3.50%, 5/15/32 | | | 20,839 | | | | 21,512 | |
| Series 3025,Cl. SJ, 18.371% [-3.667 x LIBOR01M+2,475], 8/15/353 | | | 9,487 | | | | 13,078 | |
| Series 3030,Cl. FL, 2.14% [US0001M+40], 9/15/353 | | | 50,396 | | | | 50,309 | |
| Series 3822,Cl. JA, 5.00%, 6/15/40 | | | 7,453 | | | | 7,506 | |
| Series 3857,Cl. GL, 3.00%, 5/15/40 | | | 2,790 | | | | 2,833 | |
| Series 4221,Cl. HJ, 1.50%, 7/15/23 | | | 235,708 | | | | 234,153 | |
| Federal Home Loan Mortgage Corp., Real Estate Mtg. Investment Conduit Multiclass Pass-Through Certificates, Interest-Only Stripped Mtg.-Backed Security: | |
| Series 2130,Cl. SC, 88.434%, 3/15/294 | | | 26,105 | | | | 4,008 | |
| Series 2796,Cl. SD, 63.175%, 7/15/264 | | | 44,949 | | | | 5,604 | |
| Series 2920,Cl. S, 19.418%, 1/15/354 | | | 258,137 | | | | 44,305 | |
| Series 3397,Cl. GS, 0.00%, 12/15/374,5 | | | 16,351 | | | | 3,363 | |
| Series 3424,Cl. EI, 0.00%, 4/15/384,5 | | | 6,679 | | | | 998 | |
| Series 3450,Cl. BI, 17.378%, 5/15/384 | | | 48,719 | | | | 8,690 | |
| Series 3606,Cl. SN, 19.453%, 12/15/394 | | | 24,229 | | | | 3,694 | |
| Series 4057,Cl. QI, 4.397%, 6/15/274 | | | 416,034 | | | | 27,050 | |
| Series 4146,Cl. AI, 8.004%, 12/15/274 | | | 162,251 | | | | 10,661 | |
| Series 4205,Cl. AI, 7.296%, 5/15/284 | | | 105,883 | | | | 6,223 | |
| Series 4316,Cl. JS, 0.00%, 1/15/444,5 | | | 170,417 | | | | 22,794 | |
| Series 4818,Cl. BI, 0.00%, 3/15/454,5 | | | 189,417 | | | | 20,609 | |
| Federal National Mortgage Assn. Pool: | |
| 5.00%, 3/1/21 | | | 30 | | | | 31 | |
| 5.50%, 9/1/20 | | | 128 | | | | 128 | |
| 6.00%, 3/1/37 | | | 77,819 | | | | 89,059 | |
| 7.00%, 10/1/35 | | | 2,922 | | | | 2,926 | |
| 7.50%, 1/1/33 | | | 37,347 | | | | 43,444 | |
| 8.50%, 7/1/32 | | | 1,136 | | | | 1,147 | |
| Federal National Mortgage Assn., Interest-Only Stripped Mtg.-Backed Security: | |
| Series 222,Cl. 2, 99.999%, 6/25/234 | | | 48,337 | | | | 4,319 | |
| Series 233,Cl. 2, 59.512%, 8/25/234 | | | 29,076 | | | | 2,436 | |
| Series 252,Cl. 2, 99.999%, 11/25/234 | | | 41,895 | | | | 3,948 | |
| Series 319,Cl. 2, 32.502%, 2/25/324 | | | 16,372 | | | | 3,132 | |
| Series 320,Cl. 2, 75.353%, 4/25/324 | | | 6,059 | | | | 1,326 | |
| Series 321,Cl. 2, 40.011%, 4/25/324 | | | 60,126 | | | | 11,528 | |
10 INVESCO OPPENHEIMER V.I. CONSERVATIVE BALANCED FUND
| | | | | | | | |
| | | Principal Amount | | | Value | |
| U.S. Agency Securities (Continued) | | | | | | | | |
| Federal National Mortgage Assn., Interest-Only Stripped Mtg.-Backed Security: (Continued) | |
| Series 331,Cl. 9, 15.627%, 2/25/334 | | $ | 67,659 | | | $ | 13,174 | |
| Series 334,Cl. 17, 44.776%, 2/25/334 | | | 38,085 | | | | 7,533 | |
| Series 339,Cl. 12, 0.00%, 6/25/334,5 | | | 48,870 | | | | 9,830 | |
| Series 339,Cl. 7, 0.00%, 11/25/334,5 | | | 143,779 | | | | 28,610 | |
| Series 343,Cl. 13, 0.00%, 9/25/334,5 | | | 55,024 | | | | 10,674 | |
| Series 345,Cl. 9, 0.00%, 1/25/344,5 | | | 49,011 | | | | 9,031 | |
| Series 351,Cl. 10, 0.00%, 4/25/344,5 | | | 6,320 | | | | 1,198 | |
| Series 351,Cl. 8, 0.00%, 4/25/344,5 | | | 22,649 | | | | 4,313 | |
| Series 356,Cl. 10, 0.00%, 6/25/354,5 | | | 15,866 | | | | 2,744 | |
| Series 356,Cl. 12, 0.00%, 2/25/354,5 | | | 8,578 | | | | 1,604 | |
| Series 362,Cl. 13, 0.00%, 8/25/354,5 | | | 60,242 | | | | 12,052 | |
| Series 364,Cl. 16, 0.00%, 9/25/354,5 | | | 43,586 | | | | 8,243 | |
| Federal National Mortgage Assn., Real Estate Mtg. Investment Conduit Multiclass Pass-Through Certificates: | |
| Series 1998-61,Cl. PL, 6.00%, 11/25/28 | | | 24,972 | | | | 27,623 | |
| Series 2003-130,Cl. CS, 10.516% [-2 x LIBOR01M+1,410], 12/25/333 | | | 581 | | | | 599 | |
| Series 2005-104,Cl. MC, 5.50%, 12/25/25 | | | 74,631 | | | | 77,850 | |
| Series 2005-31,Cl. PB, 5.50%, 4/25/35 | | | 250,000 | | | | 278,667 | |
| Series 2005-73,Cl. DF, 2.042% [US0001M+25], 8/25/353 | | | 35,047 | | | | 34,867 | |
| Series 2006-11,Cl. PS, 17.996% [-3.667 x LIBOR01M+2,456.67], 3/25/363 | | | 40,415 | | | | 60,161 | |
| Series 2006-46,Cl. SW, 17.629% [-3.667 x LIBOR01M+2,419.92], 6/25/363 | | | 25,787 | | | | 37,757 | |
| Series 2006-50,Cl. KS, 17.629% [-3.667 x LIBOR01M+2,420], 6/25/363 | | | 4,776 | | | | 6,904 | |
| Series 2009-113,Cl. DB, 3.00%, 12/25/20 | | | 541 | | | | 541 | |
| Series 2009-36,Cl. FA, 2.732% [US0001M+94], 6/25/373 | | | 18,895 | | | | 19,223 | |
| Series 2010-43,Cl. KG, 3.00%, 1/25/21 | | | 1,161 | | | | 1,162 | |
| Series 2011-15,Cl. DA, 4.00%, 3/25/41 | | | 10,753 | | | | 11,175 | |
| Series 2011-3,Cl. EL, 3.00%, 5/25/20 | | | 113 | | | | 113 | |
| Series 2011-3,Cl. KA, 5.00%, 4/25/40 | | | 64,249 | | | | 67,265 | |
| Series 2011-82,Cl. AD, 4.00%, 8/25/26 | | | 7,591 | | | | 7,622 | |
| Federal National Mortgage Assn., Real Estate Mtg. Investment Conduit Multiclass Pass-Through Certificates, Interest-Only Stripped Mtg.-Backed Security: | |
| Series 2001-65,Cl. S, 27.134%, 11/25/314 | | | 62,904 | | | | 10,726 | |
| Series 2001-81,Cl. S, 29.864%, 1/25/324 | | | 15,332 | | | | 2,706 | |
| Series 2002-47,Cl. NS, 25.606%, 4/25/324 | | | 45,673 | | | | 8,726 | |
| Series 2002-51,Cl. S, 25.772%, 8/25/324 | | | 41,938 | | | | 8,017 | |
| Series 2002-77,Cl. SH, 37.44%, 12/18/324 | | | 21,771 | | | | 3,572 | |
| Series 2002-84,Cl. SA, 17.206%, 12/25/324 | | | 57,875 | | | | 10,222 | |
| Series 2002-9,Cl. MS, 31.496%, 3/25/324 | | | 17,149 | | | | 3,344 | |
| Series 2003-33,Cl. SP, 19.357%, 5/25/334 | | | 65,075 | | | | 13,984 | |
| Series 2003-4,Cl. S, 14.047%, 2/25/334 | | | 34,763 | | | | 7,169 | |
| Series 2003-46,Cl. IH, 0.00%, 6/25/234,5 | | | 74,550 | | | | 4,905 | |
| Series 2004-54,Cl. DS, 62.446%, 11/25/304 | | | 45,600 | | | | 7,187 | |
| Series 2004-56,Cl. SE, 13.677%, 10/25/334 | | | 12,415 | | | | 2,388 | |
| | | | | | | | |
| | | Principal Amount | | | Value | |
| U.S. Agency Securities (Continued) | |
| Federal National Mortgage Assn., Real Estate Mtg. Investment Conduit Multiclass Pass-Through Certificates, Interest-Only Stripped Mtg.-Backed Security: (Continued) | |
| Series 2005-14,Cl. SE, 21.483%, 3/25/354 | | $ | 24,023 | | | $ | 3,657 | |
| Series 2005-40,Cl. SA, 31.304%, 5/25/354 | | | 129,679 | | | | 21,971 | |
| Series 2005-52,Cl. JH, 30.668%, 5/25/354 | | | 333,969 | | | | 45,275 | |
| Series 2005-93,Cl. SI, 5.884%, 10/25/354 | | | 30,277 | | | | 5,209 | |
| Series 2007-88,Cl. XI, 0.00%, 6/25/374,5 | | | 61,818 | | | | 11,563 | |
| Series 2008-55,Cl. SA, 0.00%, 7/25/384,5 | | | 16,971 | | | | 2,353 | |
| Series 2009-8,Cl. BS, 0.00%, 2/25/244,5 | | | 151 | | | | 9 | |
| Series 2011-96,Cl. SA, 10.947%, 10/25/414 | | | 82,662 | | | | 14,075 | |
| Series 2012-121,Cl. IB, 6.596%, 11/25/274 | | | 177,968 | | | | 11,362 | |
| Series 2012-134,Cl. SA, 0.82%, 12/25/424 | | | 326,979 | | | | 61,184 | |
| Series 2012-40,Cl. PI, 21.50%, 4/25/414 | | | 159,803 | | | | 16,844 | |
| Series 2015-57,Cl. LI, 5.94%, 8/25/354 | | | 403,816 | | | | 52,497 | |
| Series 2016-45,Cl. MI, 7.899%, 7/25/464 | | | 115,601 | | | | 21,661 | |
| Series 2017-60,Cl. LI, 0.00%, 8/25/474,5 | | | 191,826 | | | | 19,278 | |
| Series 2017-66,Cl. AS, 0.00%, 9/25/474,5 | | | 951,126 | | | | 148,396 | |
| Series 2018-16,Cl. NI, 0.841%, 12/25/444 | | | 95,325 | | | | 9,761 | |
| Series 2018-69,Cl. CI, 0.00%, 10/25/464,5 | | | 138,993 | | | | 5,951 | |
| Federal National Mortgage Assn., Real Estate Mtg. Investment Conduit Multiclass Pass-Through Certificates, Principal-Only Stripped Mtg.-Backed Security, Series 1993-184, Cl. M, 5.343%, 9/25/236 | | | 18,378 | | | | 17,640 | |
| Federal National Mortgage Assn., TBA: | | | | | | | | |
| 2.50%, 1/1/347 | | | 1,435,000 | | | | 1,447,236 | |
| 3.00%, 1/1/34-1/1/497 | | | 7,505,000 | | | | 7,620,754 | |
| 3.50%, 1/1/497 | | | 4,340,000 | | | | 4,462,512 | |
| FREMF Mortgage Trust: | | | | | | | | |
| Series 2013-K25,Cl. C, 3.619%, 11/25/452,8 | | | 60,000 | | | | 61,143 | |
| Series 2013-K26,Cl. C, 3.597%, 12/25/452,8 | | | 40,000 | | | | 40,784 | |
| Series 2013-K28,Cl. C, 3.49%, 6/25/462,8 | | | 450,000 | | | | 458,184 | |
| Series 2013-K713,Cl. C, 3.169%, 4/25/462,8 | | | 275,000 | | | | 275,000 | |
| Series 2014-K715,Cl. C, 4.117%, 2/25/462,8 | | | 180,000 | | | | 182,792 | |
| Government National Mortgage Assn. I Pool: | |
| 7.00%, 1/15/24 | | | 6,465 | | | | 6,477 | |
| 7.50%, 1/15/23-6/15/24 | | | 10,087 | | | | 10,262 | |
| 8.00%, 4/15/23 | | | 4,021 | | | | 4,101 | |
| Government National Mortgage Assn. TBA, 3.50%, 1/1/497 | | | 4,465,000 | | | | 4,601,247 | |
| Government National Mortgage Assn., Interest-Only Stripped Mtg.-Backed Security: | |
| Series 2002-15,Cl. SM, 86.083%, 2/16/324 | | | 59,991 | | | | 145 | |
| Series 2011-52,Cl. HS, 22.007%, 4/16/414 | | | 104,031 | | | | 16,213 | |
| Series 2017-136,Cl. LI, 4.251%, 9/16/474 | | | 348,609 | | | | 57,284 | |
11 INVESCO OPPENHEIMER V.I. CONSERVATIVE BALANCED FUND
SCHEDULE OF INVESTMENTSContinued
| | | | | | | | |
| | | Principal Amount | | | Value | |
| U.S. Agency Securities (Continued) | |
| Government National Mortgage Assn., Interest-Only Stripped Mtg.-Backed Security: (Continued) | |
| Series 2017-149,Cl. GS, 2.127%, 10/16/474 | | $ | 359,704 | | | $ | 52,596 | |
| Structured Agency Credit Risk Debt Nts., Series 2018-HQA1, Cl. M2, 4.092% [US0001M+230], 9/25/303 | | | 110,000 | | | | 111,338 | |
| | | | | | | 22,000,595 | |
| CMOs—1.9% | |
| Collateralized Mortgage Obligations—1.9% | |
| Banc of America Mortgage Trust, Series 2004-E, Cl. 2A6, 4.777%, 6/25/348 | | | 34,461 | | | | 34,778 | |
| BANK, Interest-Only Stripped Mtg.- Backed Security, Series 2019-BN16, Cl. XA, 10.958%, 2/15/524 | | | 1,573,061 | | | | 110,078 | |
| Bear Stearns ARM Trust, Series 2006- 1, Cl. A1, 3.84% [H15T1Y+225], 2/25/363 | | | 86,997 | | | | 89,366 | |
| COMM Mortgage Trust, Series 2014- CR20, Cl. ASB, 3.305%, 11/10/47 | | | 67,821 | | | | 69,518 | |
| Connecticut Avenue Securities: | | | | | | | | |
| Series 2014-C01,Cl. M2, 6.192% [US0001M+440], 1/25/243 | | | 270,868 | | | | 294,572 | |
| Series 2014-C02,Cl. 1M2, 4.392% [US0001M+260], 5/25/243 | | | 105,839 | | | | 110,292 | |
| Series 2014-C03,Cl. 1M2, 4.792% [US0001M+300], 7/25/243 | | | 272,701 | | | | 287,063 | |
| Series 2014-C04,Cl. 2M2, 6.792% [US0001M+500], 11/25/243 | | | 291,875 | | | | 315,590 | |
| Series 2016-C03,Cl. 1M1, 3.792% [US0001M+200], 10/25/283 | | | 8,079 | | | | 8,090 | |
| Series 2016-C06,Cl. 1M2, 6.042% [US0001M+425], 4/25/293 | | | 280,000 | | | | 300,998 | |
| Federal Home Loan Mortgage Corp., Multifamily Structured Pass Through Certificates, Interest-Only Stripped Mtg.-Backed Security, Series K735, Cl. X1, 0.00%, 5/25/264,5 | | | 2,144,151 | | | | 115,449 | |
| Federal Home Loan Mortgage Corp., Multifamily Structured Pass-Through Certificates, Interest-Only Stripped Mtg.-Backed Security, Series K093, Cl. X1, 0.00%, 5/25/294,5 | | | 1,653,540 | | | | 124,848 | |
| Federal Home Loan Mortgage Corp., Real Estate Mtg. Investment Conduit Multiclass Pass-Through Certificates: | |
| Series 3010,Cl. WB, 4.50%, 7/15/20 | | | 309 | | | | 310 | |
| Series 3848,Cl. WL, 4.00%, 4/15/40 | | | 39,416 | | | | 40,106 | |
| Federal Home Loan Mortgage Corp., Real Estate Mtg. Investment Conduit Multiclass Pass-Through Certificates, Interest-Only Stripped Mtg.-Backed Security: | |
| Series 2922,Cl. SE, 25.041%, 2/15/354 | | | 15,297 | | | | 2,400 | |
| Series 2981,Cl. AS, 4.40%, 5/15/354 | | | 123,025 | | | | 16,676 | |
| Federal National Mortgage Assn., Real Estate Mtg. Investment Conduit Multiclass Pass-Through Certificates, Series 2014-20, Cl. HL, 1.50%, 1/25/40 | | | 153,476 | | | | 152,375 | |
| Federal National Mortgage Assn., Real Estate Mtg. Investment Conduit Multiclass Pass-Through Certificates, Interest-Only Stripped Mtg.-Backed Security: | |
| Series 2002-52,Cl. SD, 63.401%, 9/25/324 | | | 65,078 | | | | 12,623 | |
| Series 2005-12,Cl. SC, 28.85%, 3/25/354 | | | 6,877 | | | | 1,065 | |
| FREMF Mortgage Trust: | | | | | | | | |
| Series 2010-K6,Cl. B, 5.397%, 12/25/462,8 | | | 60,000 | | | | 59,904 | |
| Series 2013-K27,Cl. C, 3.496%, 1/25/462,8 | | | 110,000 | | | | 112,772 | |
| | | | | | | | |
| | | Principal Amount | | | Value | |
| Collateralized Mortgage Obligations (Continued) | |
| Government National Mortgage Assn., Interest-Only Stripped Mtg.-Backed Security, Series 2007-17, Cl. AI, 49.40%, 4/16/374 | | $ | 222,039 | | | $ | 39,420 | |
| JP Morgan Chase Commercial Mortgage Securities Trust: | | | | | | | | |
| Series 2013-C10,Cl. AS, 3.372%, 12/15/47 | | | 325,000 | | | | 333,215 | |
| Series 2014-C20,Cl. AS, 4.043%, 7/15/47 | | | 245,000 | | | | 257,905 | |
| RBSSP Resecuritization Trust, Series 2010-1, Cl. 2A1, 4.269%, 7/26/452,8 | | | 5,607 | | | | 5,729 | |
| Structured Agency Credit Risk Debt Nts.: | | | | | | | | |
| Series 2014-DN1,Cl. M2, 3.992% [US0001M+220], 2/25/243 | | | 26,194 | | | | 26,485 | |
| Series 2014-DN3,Cl. M3, 5.792% [US0001M+400], 8/25/243 | | | 159,030 | | | | 169,568 | |
| Series 2014-HQ2,Cl. M3, 5.542% [US0001M+375], 9/25/243 | | | 335,000 | | | | 362,154 | |
| Series 2015-HQA2,Cl. M2, 4.592% [US0001M+280], 5/25/283 | | | 1,575 | | | | 1,584 | |
| WF-RBS Commercial Mortgage Trust, Series 2013-C14, Cl. AS, 3.488%, 6/15/46 | | | 155,000 | | | | 159,641 | |
| | | | | | | 3,614,574 | |
| Non-Agency—5.2% | |
| Adjustable-Rate Mortgages—5.2% | |
| Alternative Loan Trust, Series 2005- 29CB, Cl. A4, 5.00%, 7/25/35 | | | 161,680 | | | | 139,495 | |
| Banc of America Funding Trust: | | | | | | | | |
| Series 2007-1,Cl. 1A3, 6.00%, 1/25/37 | | | 34,838 | | | | 34,148 | |
| Series 2007-C,Cl. 1A4, 4.366%, 5/20/368 | | | 11,709 | | | | 11,729 | |
| Bear Stearns ARM Trust, Series2005-9, Cl. A1, 4.27% [H15T1Y+230], 10/25/353 | | | 238,155 | | | | 245,225 | |
| Benchmark Mortgage Trust, Interest- Only Commercial Mtg. Pass-Through Certificates, Series 2018-B1, Cl. XA, 10.80%, 1/15/514 | | | 2,186,728 | | | | 73,814 | |
| CD Mortgage Trust, Interest-Only Commercial Mtg. Pass-Through Certificates, Series 2017-CD6, Cl. XA, 0.00%, 11/13/504,5 | | | 873,012 | | | | 45,760 | |
| Chase Home Lending Mortgage Trust, Series 2019-ATR1, Cl. A15, 4.00%, 4/25/492,8 | | | 61,617 | | | | 63,127 | |
| Chase Mortgage Finance Trust, Series 2005-A2, Cl. 1A3, 4.086%, 1/25/368 | | | 83,609 | | | | 82,904 | |
| CHL Mortgage Pass-Through Trust: | | | | | | | | |
| Series 2005-26,Cl. 1A8, 5.50%, 11/25/35 | | | 46,767 | | | | 43,347 | |
| Series 2006-6,Cl. A3, 6.00%, 4/25/36 | | | 30,444 | | | | 24,430 | |
| Citigroup Commercial Mortgage Trust, Series 2014-GC21, Cl. AAB, 3.477%, 5/10/47 | | | 93,097 | | | | 95,604 | |
| Citigroup Commercial Mortgage Trust, Interest-Only Commercial Mtg. Pass-Through Certificates: | |
| Series 2013-GC17,Cl. XA, 0.00%, 11/10/464,5 | | | 415,466 | | | | 14,204 | |
| Series 2017-C4,Cl. XA, 0.00%, 10/12/504,5 | | | 2,339,427 | | | | 148,469 | |
| Citigroup Mortgage Loan Trust, Inc., Series 2006-AR1, Cl. 1A1, 4.97% [H15T1Y+240], 10/25/353 | | | 208,397 | | | | 208,777 | |
| COMM Mortgage Trust: | | | | | | | | |
| Series 2013-CR6,Cl. AM, 3.147%, 3/10/462 | | | 255,000 | | | | 259,613 | |
12 INVESCO OPPENHEIMER V.I. CONSERVATIVE BALANCED FUND
| | | | | | | | |
| | | Principal Amount | | | Value |
| Adjustable-Rate Mortgages (Continued) | |
| COMM Mortgage Trust: (Continued) | | | | | |
| Series 2014-CR21,Cl. AM, 3.987%, 12/10/47 | | $ | 865,000 | | | $ | 918,782 | |
| Series 2014-LC15,Cl. AM, 4.198%, 4/10/47 | | | 140,000 | | | | 148,827 | |
| Series 2014-UBS6,Cl. AM, 4.048%, 12/10/47 | | | 495,000 | | | | 520,810 | |
| COMM Mortgage Trust, Interest-Only Stripped Mtg.-Backed Security, Series 2012-CR5, Cl. XA, 23.628%, 12/10/454 | | | 310,873 | | | | 11,974 | |
| Connecticut Avenue Securities: | | | | | | | | |
| Series 2014-C03,Cl. 2M2, 4.692% [US0001M+290], 7/25/243 | | | 28,603 | | | | 29,830 | |
| Series 2016-C01,Cl. 1M2, 8.542% [US0001M+675], 8/25/283 | | | 141,042 | | | | 157,085 | |
| Series 2016-C02,Cl. 1M2, 7.792% [US0001M+600], 9/25/283 | | | 253,413 | | | | 279,078 | |
| Series 2017-C01,Cl. 1M2, 5.342% [US0001M+355], 7/25/293 | | | 180,000 | | | | 190,642 | |
| Series 2017-C03,Cl. 1M1, 2.742% [US0001M+95], 10/25/293 | | | 50,530 | | | | 50,613 | |
| Series 2018-C01,Cl. 1M1, 2.392% [US0001M+60], 7/25/303 | | | 256,978 | | | | 256,967 | |
| Series 2018-C03,Cl. 1M1, 2.472% [US0001M+68], 10/25/303 | | | 116,221 | | | | 116,269 | |
| Series 2018-C05,Cl. 1M1, 2.512% [US0001M+72], 1/25/313 | | | 47,176 | | | | 47,196 | |
| Series 2018-C06,Cl. 2M1, 2.342% [US0001M+55], 3/25/313 | | | 11,285 | | | | 11,284 | |
| Connecticut Avenue Securities Trust, Series 2019-R02, Cl. 1M1, 2.642% [US0001M+85], 8/25/312,3 | | | 20,724 | | | | 20,726 | |
| CSMC Mortgage-Backed Trust, Series 2006-6, Cl. 1A4, 6.00%, 7/25/36 | | | 106,239 | | | | 87,426 | |
| Federal Home Loan Mortgage Corp., Multifamily Structured Pass-Through Certificates, Interest-Only Stripped Mtg.-Backed Security, Series KC03, Cl. X1, 0.00%, 11/25/244,5 | | | 2,714,969 | | | | 60,160 | |
| Federal Home Loan Mortgage Corp., STACR Trust: | | | | | |
| Series 2018-HQA2,Cl. M1, 2.542% [US0001M+75], 10/25/482,3 | | | 256,774 | | | | 256,851 | |
| Series 2019-HRP1,Cl. M2, 3.192% [US0001M+140], 2/25/492,3 | | | 60,000 | | | | 60,056 | |
| First Horizon Alternative Mortgage Securities Trust, Series 2005-FA8, Cl. 1A6, 2.442% [US0001M+65], 11/25/353 | | | 65,835 | | | | 42,341 | |
| GS Mortgage Securities Trust: | | | | | | | | |
| Series 2012-GC6,Cl. A3, 3.482%, 1/10/45 | | | 54,793 | | | | 55,779 | |
| Series 2013-GC12,Cl. AAB, 2.678%, 6/10/46 | | | 23,574 | | | | 23,722 | |
| Series 2013-GC16,Cl. AS, 4.649%, 11/10/46 | | | 65,000 | | | | 69,987 | |
| Series 2014-GC18,Cl. AAB, 3.648%, 1/10/47 | | | 74,255 | | | | 76,228 | |
| GSR Mortgage Loan Trust, Series 2005-AR4, Cl. 6A1, 4.657%, 7/25/358 | | | 12,356 | | | | 12,640 | |
| HomeBanc Mortgage Trust, Series 2005-3, Cl. A2, 2.102% [US0001M+31], 7/25/353 | | | 10,984 | | | | 11,032 | |
| JP Morgan Chase Commercial Mortgage Securities Trust: | |
| Series 2013-C16,Cl. AS, 4.517%, 12/15/46 | | | 330,000 | | | | 353,939 | |
| Series 2013-LC11,Cl. AS, 3.216%, 4/15/46 | | | 78,000 | | | | 79,300 | |
| | | | | | | | |
| | | Principal
Amount | | | Value |
| Adjustable-Rate Mortgages (Continued) | |
| JP Morgan Chase Commercial Mortgage Securities Trust: (Continued) | |
| Series 2016-JP3,Cl. A2, 2.435%, 8/15/49 | | $ | 153,751 | | | $ | 153,743 | |
| JP Morgan Mortgage Trust: | | | | | | | | |
| Series 2007-A1,Cl. 5A1, 4.305%, 7/25/358 | | | 57,141 | | | | 58,491 | |
| Series 2018-8,Cl. A17, 4.00%, 1/25/492,8 | | | 50,000 | | | | 50,873 | |
| JPMBB Commercial Mortgage Securities Trust: | | | | | |
Series 2014-C24,Cl. B, 4.116%, 11/15/478 | | | 270,000 | | | | 280,683 | |
| Series 2014-C25,Cl. AS, 4.065%, 11/15/47 | | | 105,000 | | | | 111,096 | |
| JPMBB Commercial Mortgage Securities Trust., Interest-Only Stripped Mtg.-Backed Security, Series 2015-C27, Cl. XA, 16.833%, 2/15/484 | | | 2,327,828 | | | | 111,457 | |
| MASTR Adjustable Rate Mortgages Trust, Series 2004-13, Cl. 2A2, 4.606%, 4/21/348 | | | 19,036 | | | | 19,494 | |
| Morgan Stanley Bank of America Merrill Lynch Trust: | | | | | |
Series 2013-C9,Cl. AS, 3.456%, 5/15/46 | | | 240,000 | | | | 247,846 | |
| Series 2014-C19,Cl. AS, 3.832%, 12/15/47 | | | 720,000 | | | | 758,583 | |
| Morgan Stanley Capital I Trust, Series 2011-C2, Cl. A4, 4.661%, 6/15/442 | | | 70,000 | | | | 71,570 | |
| Morgan Stanley Capital I, Inc., Interest- Only Commercial Mtg. Pass-Through Certificates, Series 2017-HR2, Cl. XA, 0.00%, 12/15/504,5 | | | 767,813 | | | | 39,431 | |
| Morgan Stanley Re-Remic Trust, Series 2012-R3, Cl. 1B, 3.271%, 11/26/362,8 | | | 216,410 | | | | 208,942 | |
| RALI Trust, Series 2006-QS13, Cl. 1A8, 6.00%, 9/25/36 | | | 6,940 | | | | 6,254 | |
| STACR Trust: | | | | | | | | |
| Series 2018-DNA2,Cl. M1, 2.592% [US0001M+80], 12/25/302,3 | | | 247,795 | | | | 248,008 | |
| Series 2018-DNA3,Cl. M1, 2.542% [US0001M+75], 9/25/482,3 | | | 40,531 | | | | 40,558 | |
| Series 2018-HRP2,Cl. M2, 3.042% [US0001M+125], 2/25/472,3 | | | 215,000 | | | | 215,412 | |
| Structured Agency Credit Risk Debt Nts.: | | | | | | | | |
| Series 2016-DNA1,Cl. M2, 4.692% [US0001M+290], 7/25/283 | | | 36,864 | | | | 37,022 | |
| Series 2016-DNA2,Cl. M3, 6.442% [US0001M+465], 10/25/283 | | | 233,268 | | | | 251,422 | |
| Series 2016-DNA4,Cl. M2, 3.092% [US0001M+130], 3/25/293 | | | 115,360 | | | | 115,616 | |
| Series 2017-HQA1,Cl. M1, 2.992% [US0001M+120], 8/25/293 | | | 87,490 | | | | 87,561 | |
| Series 2018-DNA1,Cl. M1, 2.242% [US0001M+45], 7/25/303 | | | 243,966 | | | | 243,786 | |
| UBS Commercial Mortgage Trust, Interest-Only Commercial Mtg. Pass- Through Certificates, Series 2017-C5, Cl. XA, 12.545%, 11/15/504 | | | 1,507,761 | | | | 85,761 | |
| WaMu Mortgage Pass-Through Certificates Trust: | | | | | |
| Series 2003-AR10,Cl. A7, 4.19%, 10/25/338 | | | 55,353 | | | | 55,751 | |
| Series 2005-AR14,Cl. 1A4, 3.844%, 12/25/358 | | | 56,786 | | | | 56,860 | |
| Series 2005-AR16,Cl. 1A1, 3.748%, 12/25/358 | | | 56,488 | | | | 56,440 | |
| Wells Fargo Commercial Mortgage Trust, Series 2015-NXS1, Cl. ASB, 2.934%, 5/15/48 | | | 355,000 | | | | 360,663 | |
13 INVESCO OPPENHEIMER V.I. CONSERVATIVE BALANCED FUND
SCHEDULE OF INVESTMENTSContinued
| | | | | | | | |
| | | Principal Amount | | | Value |
| Adjustable-Rate Mortgages (Continued) | |
| Wells Fargo Commercial Mortgage Trust, Interest-Only Commercial Mtg. Pass-Through Certificates, Series 2017-C42, Cl. XA, 10.48%, 12/15/504 | | $ | 1,070,528 | | | $ | 63,076 | |
| Wells Fargo Mortgage Backed Securities Trust, Series 2019-1, Cl. A7, 4.00%, 11/25/482,8 | | | 65,906 | | | | 65,982 | |
| WF-RBS Commercial Mortgage Trust: | | | | | | | | |
| Series 2014-C20,Cl. AS, 4.176%, 5/15/47 | | | 150,000 | | | | 159,060 | |
| Series 2014-LC14,Cl. AS, 4.351%, 3/15/478 | | | 165,000 | | | | 175,924 | |
| WF-RBS Commercial Mortgage Trust, Interest-Only Commercial Mtg. Pass- Through Certificates, Series 2011-C3, Cl. XA, 0.00%, 3/15/442,4,5 | | | 1,953,579 | | | | 25,711 | |
| | | | | | | 9,903,266 | |
| Total Mortgage-Backed Obligations (Cost $35,799,547) | | | | | | | 35,518,435 | |
| U.S. Government Obligations—2.3% | |
| United States Treasury Bond, 2.25%, 8/15/49 | | | 585,800 | | | | 567,779 | |
| United States Treasury Nts.: | | | | | | | | |
| 1.625%, 12/31/21-12/15/22 | | | 1,083,000 | | | | 1,083,651 | |
| 1.75%, 12/31/24-11/15/29 | | | 2,738,200 | | | | 2,727,786 | |
| Total U.S. Government Obligations (Cost $4,380,584) | | | | | | | 4,379,216 | |
| Non-Convertible Corporate Bonds and Notes—29.7% | |
| Consumer Discretionary—3.7% | |
| Automobiles—1.3% | |
| Daimler Finance North America LLC, 2.55% Sr. Unsec. Nts., 8/15/222 | | | 315,000 | | | | 317,327 | |
| Ford Motor Credit Co. LLC, 5.584% Sr. Unsec. Nts., 3/18/24 | | | 200,000 | | | | 216,473 | |
| General Motors Co., 6.25% Sr. Unsec. Nts., 10/2/43 | | | 82,000 | | | | 92,043 | |
| General Motors Financial Co., Inc.: | | | | | | | | |
| 4.15% Sr. Unsec. Nts., 6/19/23 | | | 310,000 | | | | 326,205 | |
| 4.20% Sr. Unsec. Nts., 11/6/21 | | | 259,000 | | | | 268,548 | |
| Harley-Davidson Financial Services, Inc., 2.55% Sr. Unsec. Nts., 6/9/222 | | | 317,000 | | | | 318,181 | |
| Hyundai Capital America, 4.125% Sr. Unsec. Nts., 6/8/232 | | | 336,000 | | | | 351,008 | |
| Nissan Motor Acceptance Corp., 3.65% Sr. Unsec. Nts., 9/21/212 | | | 326,000 | | | | 332,791 | |
| Volkswagen Group of America Finance LLC, 4.00% Sr. Unsec. Nts., 11/12/212 | | | 311,000 | | | | 321,669 | |
| | | | | | | 2,544,245 | |
| Hotels, Restaurants & Leisure—0.2% | |
| Las Vegas Sands Corp., 3.50% Sr. Unsec. Nts., 8/18/26 | | | 247,000 | | | | 254,205 | |
| McDonald’s Corp., 3.625% Sr. Unsec. Nts., 9/1/49 | | | 72,000 | | | | 73,322 | |
| | | | | | | 327,527 | |
| Household Durables—0.5% | | | | | | | | |
| DR Horton, Inc., 4.75% Sr. Unsec. Nts., 2/15/23 | | | 290,000 | | | | 309,439 | |
| Lennar Corp., 4.75% Sr. Unsec. Nts., 5/30/25 | | | 343,000 | | | | 369,440 | |
| Toll Brothers Finance Corp.: | | | | | | | | |
| 4.375% Sr. Unsec. Nts., 4/15/23 | | | 298,000 | | | | 313,024 | |
| 4.875% Sr. Unsec. Nts., 3/15/27 | | | 45,000 | | | | 48,728 | |
| | | | | | | 1,040,631 | |
| | | | | | | | |
| | | Principal Amount | | | Value |
| Internet & Catalog Retail—0.3% | |
QVC, Inc., 4.45% Sr. Sec. Nts., 2/15/25 | | $ | 505,000 | | | $ | 522,414 | |
| Media—1.0% | |
| Charter Communications Operating LLC/Charter Communications Operating Capital, 5.125% Sr. Sec. Nts., 7/1/49 | | | 84,000 | | | | 91,303 | |
| Comcast Corp.: | | | | | | | | |
| 2.65% Sr. Unsec. Nts., 2/1/30 | | | 80,000 | | | | 80,323 | |
| 4.00% Sr. Unsec. Nts., 3/1/48 | | | 86,000 | | | | 95,482 | |
| Discovery Communications LLC, 4.125% Sr. Unsec. Nts., 5/15/29 | | | 189,000 | | | | 204,173 | |
| Interpublic Group of Cos., Inc. (The): | | | | | | | | |
| 3.75% Sr. Unsec. Nts., 10/1/21 | | | 265,000 | | | | 272,377 | |
| 4.20% Sr. Unsec. Nts., 4/15/24 | | | 330,000 | | | | 355,248 | |
| Time Warner Cable LLC, 4.50% Sr. Sec. Nts., 9/15/42 | | | 111,000 | | | | 113,431 | |
| ViacomCBS, Inc.: | | | | | | | | |
| 4.20% Sr. Unsec. Nts., 6/1/29 | | | 159,000 | | | | 173,574 | |
| 4.375% Sr. Unsec. Nts., 3/15/43 | | | 105,000 | | | | 111,282 | |
| WPP Finance 2010, 3.75% Sr. Unsec. Nts., 9/19/24 | | | 322,000 | | | | 339,724 | |
| | | | | | | 1,836,917 | |
| Specialty Retail—0.2% | |
Ross Stores, Inc., 3.375% Sr. Unsec. Nts., 9/15/24 | | | 344,000 | | | | 359,196 | |
| Textiles, Apparel & Luxury Goods—0.2% | |
Hanesbrands, Inc., 4.875% Sr. Unsec. Nts., 5/15/262 | | | 320,000 | | | | 339,392 | |
| Consumer Staples—2.9% | |
| Beverages—0.6% | |
| Anheuser-Busch InBev Worldwide, Inc., 8.20% Sr. Unsec. Nts., 1/15/39 | | | 197,000 | | | | 309,966 | |
| Bacardi Ltd., 4.70% Sr. Unsec. Nts., 5/15/282 | | | 171,000 | | | | 186,331 | |
| Keurig Dr Pepper, Inc., 4.057% Sr. Unsec. Nts., 5/25/23 | | | 305,000 | | | | 321,666 | |
| Pernod Ricard SA, 4.25% Sr. Unsec. Nts., 7/15/222 | | | 299,000 | | | | 314,588 | |
| | | | | | | 1,132,551 | |
| Food & Staples Retailing—0.2% | |
| Kroger Co. (The), 4.45% Sr. Unsec. Nts., 2/1/47 | | | 93,000 | | | | 98,818 | |
| Walgreen Co., 3.10% Sr. Unsec. Nts., 9/15/22 | | | 295,000 | | | | 301,028 | |
| | | | | | | 399,846 | |
| Food Products—1.4% | |
| Bunge Ltd. Finance Corp.: | | | | | | | | |
| 3.25% Sr. Unsec. Nts., 8/15/26 | | | 232,000 | | | | 232,006 | |
| 3.50% Sr. Unsec. Nts., 11/24/20 | | | 311,000 | | | | 314,929 | |
| Conagra Brands, Inc.: | | | | | | | | |
| 3.80% Sr. Unsec. Nts., 10/22/21 | | | 252,000 | | | | 260,049 | |
| 4.60% Sr. Unsec. Nts., 11/1/25 | | | 317,000 | | | | 350,118 | |
| Lamb Weston Holdings, Inc., 4.875% | | | | | | | | |
| Sr. Unsec. Nts., 11/1/262 | | | 306,000 | | | | 324,926 | |
| Mondelez International Holdings Netherlands BV, 2.00% Sr. Unsec. Nts., 10/28/212 | | | 339,000 | | | | 339,032 | |
| Smithfield Foods, Inc.: | | | | | | | | |
| 3.35% Sr. Unsec. Nts., 2/1/222 | | | 183,000 | | | | 183,558 | |
| 5.20% Sr. Unsec. Nts., 4/1/292 | | | 252,000 | | | | 279,337 | |
| Tyson Foods, Inc.: | | | | | | | | |
| 3.90% Sr. Unsec. Nts., 9/28/23 | | | 271,000 | | | | 287,458 | |
| 5.10% Sr. Unsec. Nts., 9/28/48 | | | 88,000 | | | | 110,637 | |
| | | | | | | 2,682,050 | |
14 INVESCO OPPENHEIMER V.I. CONSERVATIVE BALANCED FUND
| | | | | | | | |
| | | Principal
Amount | | | Value |
| Tobacco—0.7% | |
| Altria Group, Inc., 3.49% Sr. Unsec. Nts., 2/14/22 | | $ | 206,000 | | | $ | 211,968 | |
| BAT Capital Corp., 3.557% Sr. Unsec. Nts., 8/15/27 | | | 177,000 | | | | 180,661 | |
| BAT International Finance plc, 3.25% Sr. Unsec. Nts., 6/7/222 | | | 318,000 | | | | 325,003 | |
| Imperial Brands Finance plc, 3.75% Sr. Unsec. Nts., 7/21/222 | | | 328,000 | | | | 337,668 | |
| Imperial Tobacco Finance plc, 2.95% Sr. Unsec. Nts., 7/21/202 | | | 230,000 | | | | 230,670 | |
| | | | | | | | |
| | | | | | | 1,285,970 | |
| Energy—2.8% | | | | | | | | |
| Energy Equipment & Services—0.1% | |
Schlumberger Holdings Corp., 4.00% Sr. Unsec. Nts., 12/21/252 | | | 196,000 | | | | 211,034 | |
| Oil, Gas & Consumable Fuels—2.7% | |
| Apache Corp., 4.375% Sr. Unsec. Nts., 10/15/28 | | | 251,000 | | | | 262,261 | |
| Boardwalk Pipelines LP, 4.95% Sr. Unsec. Nts., 12/15/24 | | | 162,000 | | | | 175,293 | |
| Cenovus Energy, Inc., 4.25% Sr. Unsec. Nts., 4/15/27 | | | 184,000 | | | | 194,891 | |
| Cimarex Energy Co., 4.375% Sr. Unsec. Nts., 3/15/29 | | | 158,000 | | | | 167,232 | |
| Continental Resources, Inc., 4.375% Sr. Unsec. Nts., 1/15/28 | | | 174,000 | | | | 185,116 | |
| Devon Energy Corp., 4.75% Sr. Unsec. Nts., 5/15/42 | | | 63,000 | | | | 70,206 | |
| Energy Transfer Operating LP: | | | | | | | | |
| 4.25% Sr. Unsec. Nts., 3/15/23 | | | 260,000 | | | | 271,606 | |
| 5.30% Sr. Unsec. Nts., 4/15/47 | | | 100,000 | | | | 106,639 | |
| Enterprise Products Operating LLC, 4.20% Sr. Unsec. Nts., 1/31/50 | | | 113,000 | | | | 121,397 | |
| EQT Corp.: | | | | | | | | |
| 2.50% Sr. Unsec. Nts., 10/1/20 | | | 155,000 | | | | 154,984 | |
| 3.00% Sr. Unsec. Nts., 10/1/22 | | | 174,000 | | | | 170,974 | |
| Kinder Morgan Energy Partners LP, 5.80% Sr. Unsec. Nts., 3/1/21 | | | 132,000 | | | | 137,421 | |
| Kinder Morgan, Inc., 5.20% Sr. Unsec. Nts., 3/1/48 | | | 125,000 | | | | 144,946 | |
| Marathon Petroleum Corp., 4.50% Sr. Unsec. Nts., 4/1/48 | | | 69,000 | | | | 73,317 | |
| MPLX LP: | | | | | | | | |
| 2.985% [US0003M+110] Sr. Unsec. Nts., 9/9/223 | | | 144,000 | | | | 144,590 | |
| 4.25% Sr. Unsec. Nts., 12/1/272 | | | 192,000 | | | | 202,254 | |
| Newfield Exploration Co., 5.625% Sr. Unsec. Nts., 7/1/24 | | | 283,000 | | | | 311,161 | |
| Occidental Petroleum Corp.: | | | | | | | | |
| 2.90% Sr. Unsec. Nts., 8/15/24 | | | 338,000 | | | | 343,584 | |
| 3.50% Sr. Unsec. Nts., 8/15/29 | | | 154,000 | | | | 157,116 | |
| 4.50% Sr. Unsec. Nts., 7/15/44 | | | 72,000 | | | | 72,629 | |
| ONEOK, Inc., 4.35% Sr. Unsec. Nts., 3/15/29 | | | 156,000 | | | | 168,891 | |
| Plains All American Pipeline LP/PAA Finance Corp., 3.55% Sr. Unsec. Nts., 12/15/29 | | | 149,000 | | | | 146,959 | |
| Rockies Express Pipeline LLC, 4.95% Sr. Unsec. Nts., 7/15/292 | | | 162,000 | | | | 161,493 | |
| Sabine Pass Liquefaction LLC: | | | | | | | | |
| 4.20% Sr. Sec. Nts., 3/15/28 | | | 180,000 | | | | 190,736 | |
| 5.75% Sr. Sec. Nts., 5/15/24 | | | 280,000 | | | | 312,329 | |
| Sunoco Logistics Partners Operations LP, 4.00% Sr. Unsec. Nts., 10/1/27 | | | 207,000 | | | | 214,096 | |
| Valero Energy Corp., 4.00% Sr. Unsec. Nts., 4/1/29 | | | 154,000 | | | | 166,189 | |
| | | | | | | | |
| | | Principal
Amount | | | Value |
| Oil, Gas & Consumable Fuels (Continued) | |
| Williams Cos., Inc. (The), 3.70% Sr. Unsec. Nts., 1/15/23 | | $ | 334,000 | | | $ | 345,945 | |
| | | | | | | | |
| | | | | | | 5,174,255 | |
| Financials—9.8% | |
| Capital Markets—1.2% | |
| Apollo Management Holdings LP, 4.95% [H15T5Y+326.6] Sub. Nts., 1/14/502,3 | | | 215,000 | | | | 217,909 | |
| Brookfield Asset Management, Inc., 4.00% Sr. Unsec. Nts., 1/15/25 | | | 250,000 | | | | 268,847 | |
| Carlyle Finance Subsidiary LLC, 3.50% Sr. Unsec. Nts., 9/19/292 | | | 153,000 | | | | 152,590 | |
| Credit Suisse Group Funding Guernsey Ltd., 4.55% Sr. Unsec. Nts., 4/17/26 | | | 154,000 | | | | 170,935 | |
| Goldman Sachs Group, Inc. (The): | | | | | | | | |
| 3.50% Sr. Unsec. Nts., 11/16/26 | | | 166,000 | | | | 174,595 | |
| 3.75% Sr. Unsec. Nts., 2/25/26 | | | 163,000 | | | | 172,503 | |
| Morgan Stanley: | | | | | | | | |
| 4.431% [US0003M+162.8] Sr. Unsec. Nts., 1/23/303 | | | 235,000 | | | | 265,646 | |
| 5.00% Sub. Nts., 11/24/25 | | | 257,000 | | | | 289,466 | |
| Northern Trust Corp., 3.375% [US0003M+113.1] Sub. Nts., 5/8/323 | | | 115,000 | | | | 118,140 | |
| Raymond James Financial, Inc., 3.625% Sr. Unsec. Nts., 9/15/26 | | | 153,000 | | | | 161,697 | |
| UBS Group AG: | | | | | | | | |
| 4.125% Sr. Unsec. Nts., 4/15/262 | | | 160,000 | | | | 173,979 | |
| 4.253% Sr. Unsec. Nts., 3/23/282 | | | 147,000 | | | | 160,702 | |
| | | | | | | | |
| | | | | | | 2,327,009 | |
| Commercial Banks—5.1% | |
| Bank of America Corp.: | | | | | | | | |
| 3.366% [US0003M+81] Sr. Unsec. Nts., 1/23/263 | | | 286,000 | | | | 299,209 | |
| 3.824% [US0003M+157.5] Sr. Unsec. Nts., 1/20/283 | | | 191,000 | | | | 205,571 | |
| 4.271% [US0003M+131] Sr. Unsec. Nts., 7/23/293 | | | 154,000 | | | | 171,083 | |
| 7.75% Sub. Nts., 5/14/38 | | | 226,000 | | | | 355,942 | |
| Bank of Ireland Group plc, 4.50% Sr. Unsec. Nts., 11/25/232 | | | 263,000 | | | | 281,408 | |
| Bank of Montreal, Series E, 3.30% Sr. Unsec. Nts., 2/5/24 | | | 245,000 | | | | 255,342 | |
| BBVA USA, 2.50% Sr. Unsec. Nts., 8/27/24 | | | 252,000 | | | | 249,905 | |
| BNP Paribas SA, 4.375% [USSW5+148.3] Sub. Nts., 3/1/332,3 | | | 177,000 | | | | 191,145 | |
| Citigroup, Inc.: | | | | | | | | |
| 4.075% [US0003M+119.2] Sr. Unsec. Nts., 4/23/293 | | | 269,000 | | | | 294,745 | |
| 5.00% [SOFRRATE+381.3] Jr. Sub. Perpetual Bonds3,9 | | | 240,000 | | | | 251,550 | |
| Citizens Bank NA (Providence RI), 2.65% Sr. Unsec. Nts., 5/26/22 | | | 68,000 | | | | 68,837 | |
| Credit Agricole SA, 4.375% Sub. Nts., 3/17/252 | | | 304,000 | | | | 326,876 | |
| Credit Suisse AG (New York), 3.625% Sr. Unsec. Nts., 9/9/24 | | | 197,000 | | | | 209,528 | |
| Danske Bank AS, 3.244% [US0003M+159.1] Sr. Unsec. Nts., 12/20/252,3 | | | 200,000 | | | | 202,366 | |
| Discover Bank, 4.65% Sr. Unsec. Nts., 9/13/28 | | | 122,000 | | | | 137,468 | |
| Fifth Third Bank (Cincinnati OH), 3.85% Sub. Nts., 3/15/26 | | | 160,000 | | | | 170,424 | |
| HSBC Holdings plc: | | | | | | | | |
| 3.95% [US0003M+98.72] Sr. Unsec. Nts., 5/18/243 | | | 109,000 | | | | 114,671 | |
15 INVESCO OPPENHEIMER V.I. CONSERVATIVE BALANCED FUND
SCHEDULE OF INVESTMENTSContinued
| | | | | | | | |
| | | Principal
Amount | | | Value |
| Commercial Banks (Continued) | |
| HSBC Holdings plc: (Continued) | | | | | | | | |
| 4.041% [US0003M+154.6] Sr. Unsec. Nts., 3/13/283 | | $ | 135,000 | | | $ | 144,393 | |
| 4.583% [US0003M+153.46] Sr. Unsec. Nts., 6/19/293 | | | 183,000 | | | | 204,532 | |
| Huntington Bancshares, Inc., 4.00% Sr. Unsec. Nts., 5/15/25 | | | 334,000 | | | | 360,849 | |
| JPMorgan Chase & Co.: | | | | | | | | |
| 3.54% [US0003M+138] Sr. Unsec. Nts., 5/1/283 | | | 252,000 | | | | 267,652 | |
| 3.782% [US0003M+133.7] Sr. Unsec. Nts., 2/1/283 | | | 332,000 | | | | 357,891 | |
| 3.797% [US0003M+89] Sr. Unsec. Nts., 7/23/243 | | | 335,000 | | | | 353,083 | |
| KeyCorp, 4.15% Sr. Unsec. Nts., 10/29/25 | | | 106,000 | | | | 116,162 | |
| Lloyds Bank plc, 2.25% Sr. Unsec. Nts., 8/14/22 | | | 250,000 | | | | 251,206 | |
| Lloyds Banking Group plc, 6.657% [US0003M+127] Jr. Sub. Perpetual Bonds2,3,9 | | | 300,000 | | | | 357,109 | |
| Mitsubishi UFJ Financial Group, Inc., 3.741% Sr. Unsec. Nts., 3/7/29 | | | 194,000 | | | | 209,252 | |
| National Australia Bank Ltd., 3.933% [H15T5Y+188] Sub. Nts., 8/2/342,3 | | | 154,000 | | | | 160,031 | |
| Nordea Bank Abp, 4.625% [USSW5+169] Sub. Nts., 9/13/332,3 | | | 118,000 | | | | 128,681 | |
| PNC Financial Services Group, Inc. (The), 3.15% Sr. Unsec. Nts., 5/19/27 | | | 253,000 | | | | 265,297 | |
| Royal Bank of Canada, 3.70% Sr. Unsec. Nts., 10/5/23 | | | 290,000 | | | | 306,556 | |
| Santander Holdings USA, Inc., 3.50% Sr. Unsec. Nts., 6/7/24 | | | 248,000 | | | | 255,103 | |
| Societe Generale SA, 3.875% Sr. Unsec. Nts., 3/28/242 | | | 250,000 | | | | 262,890 | |
| Standard Chartered plc, 2.744% [US0003M+120] Sr. Unsec. Nts., 9/10/222,3 | | | 233,000 | | | | 234,628 | |
| Synovus Financial Corp., 3.125% Sr. Unsec. Nts., 11/1/22 | | | 177,000 | | | | 179,226 | |
| Truist Bank: | | | | | | | | |
| 2.636% [H15T5Y+115] Sub. Nts., 9/17/293 | | | 376,000 | | | | 375,852 | |
| 3.30% Sub. Nts., 5/15/26 | | | 112,000 | | | | 116,657 | |
| 4.05% Sr. Unsec. Nts., 11/3/25 | | | 141,000 | | | | 154,857 | |
| US Bancorp, 3.10% Sub. Nts., 4/27/26 | | | 199,000 | | | | 207,122 | |
| Wells Fargo & Co.: | | | | | | | | |
| 3.584% [US0003M+131] Sr. Unsec. Nts., 5/22/283 | | | 248,000 | | | | 263,564 | |
| 4.75% Sub. Nts., 12/7/46 | | | 157,000 | | | | 188,250 | |
| Zions Bancorp NA, 3.25% Sub. Nts., 10/29/29 | | | 250,000 | | | | 245,446 | |
| | | | | | | | |
| | | | | | | 9,752,359 | |
| Consumer Finance—0.6% | | | | | | | | |
| American Express Co.: | | | | | | | | |
| 3.125% Sr. Unsec. Nts., 5/20/26 | | | 189,000 | | | | 196,527 | |
| 4.90% [US0003M+328.5] Jr. Sub. Perpetual Bonds3,9 | | | 246,000 | | | | 247,296 | |
| Capital One Financial Corp.: | | | | | | | | |
| 3.75% Sr. Unsec. Nts., 3/9/27 | | | 111,000 | | | | 118,373 | |
| 3.80% Sr. Unsec. Nts., 1/31/28 | | | 92,000 | | | | 98,887 | |
| Discover Financial Services, 3.75% Sr. Unsec. Nts., 3/4/25 | | | 108,000 | | | | 114,334 | |
| Synchrony Financial, 4.25% Sr. Unsec. Nts., 8/15/24 | | | 248,000 | | | | 264,641 | |
| | | | | | | | |
| | | | | | | 1,040,058 | |
| | | | | | | | |
| | | Principal
Amount | | | Value |
| Diversified Financial Services—0.5% | |
| AerCap Ireland Capital DAC/AerCap | | | | | | | | |
| Global Aviation Trust, 3.50% Sr. Unsec. Nts., 5/26/22 | | $ | 289,000 | | | $ | 297,055 | |
| AXA Equitable Holdings, Inc., 4.35% Sr. Unsec. Nts., 4/20/28 | | | 163,000 | | | | 176,956 | |
| Blackstone Holdings Finance Co. LLC, 3.15% Sr. Unsec. Nts., 10/2/272 | | | 117,000 | | | | 120,223 | |
| BPCE SA, 4.50% Sub. Nts., 3/15/252 | | | 184,000 | | | | 198,277 | |
| EDP Finance BV, 3.625% Sr. Unsec. Nts., 7/15/242 | | | 231,000 | | | | 240,493 | |
| | | | | | | | |
| | | | | | | 1,033,004 | |
| Insurance—1.0% | | | | | | | | |
| Athene Global Funding, 2.95% Sec. Nts., 11/12/262 | | | 405,000 | | | | 404,455 | |
| Brighthouse Financial, Inc., 3.70% Sr. Unsec. Nts., 6/22/27 | | | 68,000 | | | | 67,825 | |
| CNA Financial Corp., 3.45% Sr. Unsec. Nts., 8/15/27 | | | 231,000 | | | | 240,667 | |
| Lincoln National Corp., 3.80% Sr. Unsec. Nts., 3/1/28 | | | 188,000 | | | | 200,334 | |
| Manulife Financial Corp., 4.061% [USISDA05+164.7] Sub. Nts., 2/24/323 | | | 191,000 | | | | 198,164 | |
| Marsh & McLennan Cos., Inc., 4.35% Sr. Unsec. Nts., 1/30/47 | | | 113,000 | | | | 129,973 | |
| Principal Financial Group, Inc., 3.70% Sr. Unsec. Nts., 5/15/29 | | | 192,000 | | | | 209,273 | |
| Prudential Financial, Inc.: | | | | | | | | |
| 3.70% Sr. Unsec. Nts., 3/13/51 | | | 144,000 | | | | 151,483 | |
| 5.20% [US0003M+304] Jr. Sub. Nts., 3/15/443 | | | 246,000 | | | | 262,785 | |
| Willis North America, Inc., 3.875% Sr. Unsec. Nts., 9/15/49 | | | 72,000 | | | | 71,911 | |
| | | | | | | | |
| | | | | | | 1,936,870 | |
| Real Estate Investment Trusts (REITs)—1.3% | |
| American Tower Corp.: | | | | | | | | |
| 3.00% Sr. Unsec. Nts., 6/15/23 | | | 274,000 | | | | 280,611 | |
| 4.00% Sr. Unsec. Nts., 6/1/25 | | | 169,000 | | | | 180,937 | |
| Brixmor Operating Partnership LP, 4.125% Sr. Unsec. Nts., 5/15/29 | | | 159,000 | | | | 170,738 | |
| Crown Castle International Corp., 3.65% Sr. Unsec. Nts., 9/1/27 | | | 176,000 | | | | 186,200 | |
| Equinix, Inc., 3.20% Sr. Unsec. Nts., 11/18/29 | | | 145,000 | | | | 145,808 | |
| Essex Portfolio LP, 3.00% Sr. Unsec. Nts., 1/15/30 | | | 149,000 | | | | 150,766 | |
| Healthcare Trust of America Holdings LP, 3.50% Sr. Unsec. Nts., 8/1/26 | | | 211,000 | | | | 220,212 | |
| Healthpeak Properties, Inc., 3.00% Sr. Unsec. Nts., 1/15/30 | | | 272,000 | | | | 273,009 | |
| Host Hotels & Resorts LP, 3.375% Sr. Unsec. Nts., 12/15/29 | | | 48,000 | | | | 48,487 | |
| Kite Realty Group LP, 4.00% Sr. Unsec. Nts., 10/1/26 | | | 197,000 | | | | 196,891 | |
| Regency Centers LP, 2.95% Sr. Unsec. Nts., 9/15/29 | | | 221,000 | | | | 220,822 | |
| Spirit Realty LP, 3.20% Sr. Unsec. Nts., 1/15/27 | | | 203,000 | | | | 203,287 | |
| Welltower, Inc., 2.70% Sr. Unsec. Nts., 2/15/27 | | | 130,000 | | | | 130,527 | |
| | | | | | | | |
| | | | | | | 2,408,295 | |
| Thrifts & Mortgage Finance—0.1% | | | | | | | | |
| Nationwide Building Society, 3.96% [US0003M+185.5] Sr. Unsec. Nts., 7/18/302,3 | | | 150,000 | | | | 161,116 | |
16 INVESCO OPPENHEIMER V.I. CONSERVATIVE BALANCED FUND
| | | | | | | | |
| | | Principal Amount | | | Value |
| Health Care—2.4% | |
| Biotechnology—0.5% | |
| AbbVie, Inc.: | |
| 2.95% Sr. Unsec. Nts., 11/21/262 | | $ | 104,000 | | | $ | 105,715 | |
| 3.20% Sr. Unsec. Nts., 11/21/292 | | | 350,000 | | | | 356,277 | |
| 4.05% Sr. Unsec. Nts., 11/21/392 | | | 118,000 | | | | 125,127 | |
| 4.875% Sr. Unsec. Nts., 11/14/48 | | | 133,000 | | | | 152,550 | |
| Amgen, Inc., 4.563% Sr. Unsec. Nts., 6/15/48 | | | 87,000 | | | | 101,010 | |
| Gilead Sciences, Inc., 4.75% Sr. Unsec. Nts., 3/1/46 | | | 128,000 | | | | 153,707 | |
| | | | 994,386 | |
| Health Care Equipment & Supplies—0.3% | |
| Becton Dickinson & Co., 3.70% Sr. Unsec. Nts., 6/6/27 | | | 175,000 | | | | 186,449 | |
| Hologic, Inc., 4.375% Sr. Unsec. Nts., 10/15/252 | | | 310,000 | | | | 320,721 | |
| | | | 507,170 | |
| Health Care Providers & Services—0.6% | |
| Anthem, Inc., 3.125% Sr. Unsec. Nts., 5/15/22 | | | 300,000 | | | | 307,499 | |
| Cigna Corp., 4.125% Sr. Unsec. Nts., 11/15/25 | | | 250,000 | | | | 271,369 | |
| CVS Health Corp., 5.05% Sr. Unsec. Nts., 3/25/48 | | | 196,000 | | | | 231,939 | |
| Fresenius Medical Care US Finance II, Inc., 5.875% Sr. Unsec. Nts., 1/31/222 | | | 291,000 | | | | 311,368 | |
| | | | 1,122,175 | |
| Life Sciences Tools & Services—0.2% | |
| IQVIA, Inc., 5.00% Sr. Unsec. Nts., 10/15/262 | | | 308,000 | | | | 325,655 | |
| Pharmaceuticals—0.8% | |
| Allergan Funding SCS, 3.85% Sr. Unsec. Nts., 6/15/24 | | | 297,000 | | | | 311,916 | |
| Bayer US Finance II LLC, 3.875% Sr. Unsec. Nts., 12/15/232 | | | 335,000 | | | | 351,629 | |
| Bristol-Myers Squibb Co., 3.40% Sr. Unsec. Nts., 7/26/292 | | | 226,000 | | | | 241,717 | |
| Elanco Animal Health, Inc., 4.90% Sr. Unsec. Nts., 8/28/28 | | | 145,000 | | | | 157,723 | |
| Mylan, Inc., 3.125% Sr. Unsec. Nts., 1/15/232 | | | 304,000 | | | | 308,500 | |
| Takeda Pharmaceutical Co. Ltd., 5.00% Sr. Unsec. Nts., 11/26/28 | | | 160,000 | | | | 186,317 | |
| | | | 1,557,802 | |
| Industrials—2.4% | |
| Aerospace & Defense—0.6% | |
| BAE Systems Holdings, Inc., 3.85% Sr. Unsec. Nts., 12/15/252 | | | 245,000 | | | | 259,990 | |
| L3Harris Technologies, Inc., 3.85% Sr. Unsec. Nts., 6/15/232 | | | 335,000 | | | | 352,924 | |
| Northrop Grumman Corp., 4.75% Sr. Unsec. Nts., 6/1/43 | | | 190,000 | | | | 229,402 | |
| United Technologies Corp., 3.95% Sr. Unsec. Nts., 8/16/25 | | | 205,000 | | | | 223,615 | |
| | | | 1,065,931 | |
| Air Freight & Couriers—0.1% | |
| Penske Truck Leasing Co. LP/PTL Finance Corp., 3.65% Sr. Unsec. Nts., 7/29/212 | | | 110,000 | | | | 112,540 | |
| Airlines—0.3% | |
| Delta Air Lines, Inc., 2.90% Sr. Unsec. Nts., 10/28/24 | | | 367,000 | | | | 367,923 | |
| United Airlines2019-2 Class AA Pass Through Trust, 2.70%, 5/1/32 | | | 145,000 | | | | 145,728 | |
| | | | 513,651 | |
| | | | | | | | |
| | | Principal Amount | | | Value |
| Building Products—0.2% | |
| Fortune Brands Home & Security, Inc.: | |
| 3.25% Sr. Unsec. Nts., 9/15/29 | | $ | 149,000 | | | $ | 150,788 | |
| 4.00% Sr. Unsec. Nts., 9/21/23 | | | 313,000 | | | | 330,744 | |
| | | | 481,532 | |
| Commercial Services & Supplies—0.2% | |
| Experian Finance plc, 2.75% Sr. Unsec. Nts., 3/8/302 | | | 311,000 | | | | 306,330 | |
| Industrial Conglomerates—0.2% | |
| GE Capital International Funding Co. Unlimited Co., 3.373% Sr. Unsec. Nts., 11/15/25 | | | 160,000 | | | | 166,667 | |
| General Electric Co., 2.70% Sr. Unsec. Nts., 10/9/22 | | | 315,000 | | | | 319,291 | |
| | | | 485,958 | |
| Machinery—0.2% | |
| Ingersoll-Rand Luxembourg Finance SA, 3.80% Sr. Unsec. Nts., 3/21/29 | | | 154,000 | | | | 165,303 | |
| nVent Finance Sarl, 4.55% Sr. Unsec. Nts., 4/15/28 | | | 176,000 | | | | 182,635 | |
| | | | 347,938 | |
| Professional Services—0.1% | |
| IHS Markit Ltd., 4.125% Sr. Unsec. Nts., 8/1/23 | | | 211,000 | | | | 224,466 | |
| Road & Rail—0.3% | |
| Penske Truck Leasing Co. LP/PTL Finance Corp., 3.40% Sr. Unsec. Nts., 11/15/262 | | | 269,000 | | | | 274,586 | |
| Ryder System, Inc., 2.50% Sr. Unsec. Nts., 9/1/24 | | | 308,000 | | | | 309,510 | |
| | | | 584,096 | |
| Trading Companies & Distributors—0.2% | |
| Air Lease Corp.: | |
| 3.25% Sr. Unsec. Nts., 3/1/25 | | | 108,000 | | | | 111,169 | |
| 3.625% Sr. Unsec. Nts., 4/1/27 | | | 102,000 | | | | 105,760 | |
| GATX Corp., 3.50% Sr. Unsec. Nts., 3/15/28 | | | 197,000 | | | | 203,015 | |
| | | | 419,944 | |
| Information Technology—2.3% | |
| Communications Equipment—0.3% | |
| British Telecommunications plc, 4.50% Sr. Unsec. Nts., 12/4/23 | | | 202,000 | | | | 217,435 | |
| Deutsche Telekom International Finance BV, 4.375% Sr. Unsec. Nts., 6/21/282 | | | 146,000 | | | | 162,978 | |
| Motorola Solutions, Inc., 4.60% Sr. Unsec. Nts., 2/23/28 | | | 256,000 | | | | 277,639 | |
| | | | 658,052 | |
| Electronic Equipment, Instruments, & Components—0.5% | |
| Arrow Electronics, Inc., 3.875% Sr. Unsec. Nts., 1/12/28 | | | 248,000 | | | | 254,036 | |
| Corning, Inc., 5.45% Sr. Unsec. Nts., 11/15/79 | | | 80,000 | | | | 87,753 | |
| FLIR Systems, Inc., 3.125% Sr. Unsec. Nts., 6/15/21 | | | 307,000 | | | | 309,499 | |
| Tech Data Corp., 4.95% Sr. Unsec. Nts., 2/15/27 | | | 271,000 | | | | 279,830 | |
| | | | 931,118 | |
| IT Services—0.6% | |
| DXC Technology Co., 4.75% Sr. Unsec. Nts., 4/15/27 | | | 246,000 | | | | 264,886 | |
| Fidelity National Information Services, Inc., 4.25% Sr. Unsec. Nts., 5/15/28 | | | 159,000 | | | | 178,003 | |
| Fiserv, Inc., 3.50% Sr. Unsec. Nts., 7/1/29 | | | 224,000 | | | | 235,575 | |
17 INVESCO OPPENHEIMER V.I. CONSERVATIVE BALANCED FUND
SCHEDULE OF INVESTMENTSContinued
| | | | | | | | |
| | | Principal Amount | | | Value | |
| IT Services (Continued) | |
| Global Payments, Inc., 3.20% Sr. Unsec. Nts., 8/15/29 | | $ | 149,000 | | | $ | 152,270 | |
| VeriSign, Inc.: | |
| 4.75% Sr. Unsec. Nts., 7/15/27 | | | 189,000 | | | | 199,745 | |
| 5.25% Sr. Unsec. Nts., 4/1/25 | | | 105,000 | | | | 115,961 | |
| | | | 1,146,440 | |
| Semiconductors & Semiconductor Equipment—0.5% | |
| Microchip Technology, Inc., 3.922% Sr. Sec. Nts., 6/1/21 | | | 335,000 | | | | 342,639 | |
| NXP BV/NXP Funding LLC, 4.125% Sr. Unsec. Nts., 6/1/212 | | | 304,000 | | | | 311,725 | |
| NXP BV/NXP Funding LLC/NXP USA, Inc., 3.875% Sr. Unsec. Nts., 6/18/262 | | | 198,000 | | | | 210,101 | |
| | | | 864,465 | |
| Software—0.1% | |
| Autodesk, Inc., 4.375% Sr. Unsec. Nts., 6/15/25 | | | 104,000 | | | | 113,562 | |
| VMware, Inc., 3.90% Sr. Unsec. Nts., 8/21/27 | | | 170,000 | | | | 177,905 | |
| | | | 291,467 | |
| Technology Hardware, Storage & Peripherals—0.3% | |
| Apple, Inc., 4.375% Sr. Unsec. Nts., 5/13/45 | | | 186,000 | | | | 225,073 | |
| Dell International LLC/EMC Corp., 5.30% Sr. Sec. Nts., 10/1/292 | | | 312,000 | | | | 351,626 | |
| | | | 576,699 | |
| Materials—1.2% | |
| Chemicals—0.4% | |
| Dow Chemical Co. (The), 3.625% Sr. Unsec. Nts., 5/15/26 | | | 206,000 | | | | 216,736 | |
| Eastman Chemical Co., 3.50% Sr. Unsec. Nts., 12/1/21 | | | 130,000 | | | | 133,349 | |
| Nutrien Ltd.: | |
| 4.875% Sr. Unsec. Nts., 3/30/20 | | | 40,000 | | | | 40,264 | |
| 5.00% Sr. Unsec. Nts., 4/1/49 | | | 85,000 | | | | 101,220 | |
| RPM International, Inc., 3.45% Sr. Unsec. Nts., 11/15/22 | | | 329,000 | | | | 337,346 | |
| | | | 828,915 | |
| Construction Materials—0.1% | |
| Martin Marietta Materials, Inc., 3.50% Sr. Unsec. Nts., 12/15/27 | | | 171,000 | | | | 177,500 | |
| Containers & Packaging—0.5% | |
| International Paper Co., 4.35% Sr. Unsec. Nts., 8/15/48 | | | 83,000 | | | | 88,253 | |
| Packaging Corp. of America, 3.65% Sr. Unsec. Nts., 9/15/24 | | | 274,000 | | | | 288,007 | |
| Silgan Holdings, Inc., 4.75% Sr. Unsec. Nts., 3/15/25 | | | 290,000 | | | | 297,370 | |
| WRKCo, Inc., 3.90% Sr. Unsec. Nts., 6/1/28 | | | 189,000 | | | | 200,625 | |
| | | | 874,255 | |
| Metals & Mining—0.2% | |
| Anglo American Capital plc, 3.625% Sr. Unsec. Nts., 9/11/242 | | | 86,000 | | | | 89,198 | |
| ArcelorMittal SA, 4.25% Sr. Unsec. Nts., 7/16/29 | | | 159,000 | | | | 166,216 | |
| Newmont Goldcorp Corp., 2.80% Sr. Unsec. Nts., 10/1/29 | | | 148,000 | | | | 146,722 | |
| | | | | 402,136 | |
| Telecommunication Services—0.8% | |
| Diversified Telecommunication Services—0.5% | |
| AT&T, Inc.: | |
| 4.30% Sr. Unsec. Nts., 2/15/30 | | | 331,000 | | | | 368,045 | |
| 4.35% Sr. Unsec. Nts., 6/15/45 | | | 48,000 | | | | 51,758 | |
| 4.50% Sr. Unsec. Nts., 3/9/48 | | | 142,000 | | | | 156,923 | |
| | | | | | | | |
| | | Principal Amount | | | Value | |
| Diversified Telecommunication Services (Continued) | |
| Telefonica Emisiones SA, 4.103% Sr. Unsec. Nts., 3/8/27 | | $ | 85,000 | | | $ | 91,990 | |
| Verizon Communications, Inc., 4.522% Sr. Unsec. Nts., 9/15/48 | | | 173,000 | | | | 207,241 | |
| | | | 875,957 | |
| Wireless Telecommunication Services—0.3% | |
| T-Mobile USA, Inc., 6.50% Sr. Unsec. Nts., 1/15/26 | | | 280,000 | | | | 300,737 | |
| Vodafone Group plc, 3.75% Sr. Unsec. Nts., 1/16/24 | | | 332,000 | | | | 351,135 | |
| | | | | 651,872 | |
| Utilities—1.4% | |
| Electric Utilities—0.9% | |
| AEP Texas, Inc., 3.95% Sr. Unsec. Nts., 6/1/282 | | | 172,000 | | | | 186,958 | |
| Berkshire Hathaway Energy Co., 3.80% Sr. Unsec. Nts., 7/15/48 | | | 81,000 | | | | 87,031 | |
| Duke Energy Corp., 3.75% Sr. Unsec. Nts., 9/1/46 | | | 69,000 | | | | 71,272 | |
| Emera US Finance LP, 2.70% Sr. Unsec. Nts., 6/15/21 | | | 179,000 | | | | 180,664 | |
| Enel Finance International NV, 2.875% Sr. Unsec. Nts., 5/25/222 | | | 313,000 | | | | 316,998 | |
| Exelon Corp., 4.45% Sr. Unsec. Nts., 4/15/46 | | | 87,000 | | | | 97,667 | |
| FirstEnergy Corp., 3.90% Sr. Unsec. Nts., 7/15/27 | | | 184,000 | | | | 196,760 | |
| Fortis, Inc., 3.055% Sr. Unsec. Nts., 10/4/26 | | | 123,000 | | | | 125,603 | |
| Mid-Atlantic Interstate Transmission LLC, 4.10% Sr. Unsec. Nts., 5/15/282 | | | 171,000 | | | | 187,074 | |
| PPL WEM Ltd./Western Power Distribution Ltd., 5.375% Sr. Unsec. Nts., 5/1/212 | | | 317,000 | | | | 326,352 | |
| | | | | 1,776,379 | |
| Independent Power and Renewable Electricity Producers—0.1% | |
| NRG Energy, Inc., 4.45% Sr. Sec. Nts., 6/15/292 | | | 156,000 | | | | 163,452 | |
| Multi-Utilities—0.4% | |
| Ameren Corp., 2.50% Sr. Unsec. Nts., 9/15/24 | | | 203,000 | | | | 204,802 | |
| CenterPoint Energy, Inc., 4.25% Sr. Unsec. Nts., 11/1/28 | | | 147,000 | | | | 159,554 | |
| Dominion Energy, Inc., 2.715% Jr. Sub. Nts., 8/15/218 | | | 197,000 | | | | 198,525 | |
| Sempra Energy, 3.40% Sr. Unsec. Nts., 2/1/28 | | | 173,000 | | | | 179,281 | |
| | | | | | | 742,162 | |
| TotalNon-Convertible Corporate Bonds and Notes (Cost $53,600,520) | | | | | | | 56,525,182 | |
| Total Investments, at Value (Cost $166,127,330) | | | 97.3% | | | | 185,135,707 | |
| | | | |
| Net Other Assets (Liabilities) | | | 2.7 | | | | 5,101,088 | |
| | | | |
| Net Assets | | | 100.0% | | | $ | 190,236,795 | |
| | | | |
18 INVESCO OPPENHEIMER V.I. CONSERVATIVE BALANCED FUND
Footnotes to Schedule of Investments
1.Non-income producing security.
2.Security purchased or received in a transaction exempt from registration under the Securities Act of 1933, as amended (the “1933 Act”). The security may be resold pursuant to an exemption from registration under the 1933 Act, typically to qualified institutional buyers. The aggregate value of these securities at December 31, 2019 was $29,604,905, which represented 15.56% of the Fund’s Net Assets.
3.Represents the current interest rate for a variable or increasing rate security, which may be fixed for a predetermined period. The interest rate is, or will be as of an established date, determined as [Referenced Rate + Basis-point spread].
4.Interest-Only Strips represent the right to receive the monthly interest payments on an underlying pool of mortgage loans. These securities typically decline in price as interest rates decline. Most other fixed income securities increase in price when interest rates decline. The principal amount of the underlying pool represents the notional amount on which current interest is calculated. The price of these securities is typically more sensitive to changes in prepayment rates than traditional mortgage-backed securities (for example, GNMA pass-throughs). Interest rates disclosed represent current yields based upon the current cost basis and estimated timing and amount of future cash flows. These securities amount to $2,231,935 or 1.17% of the Fund’s net assets at period end.
5.Interest rate is less than 0.0005%.
6.Principal-Only Strips represent the right to receive the monthly principal payments on an underlying pool of mortgage loans. The value of these securities generally increases as interest rates decline and prepayment rates rise. The price of these securities is typically more volatile than that of coupon-bearing bonds of the same maturity. Interest rates disclosed represent current yields based upon the current cost basis and estimated timing of future cash flows. These securities amount to $26,647 or 0.01% of the Fund’s net assets at period end.
7.All or a portion of the security position is when-issued or delayed delivery to be delivered and settled after period end. See Note 1 of the accompanying Notes.
8.This interest rate resets periodically. Interest rate shown reflects the rate in effect at period end. The rate on this variable rate security is not based on a published reference rate and spread but is determined by the issuer or agent based on current market conditions.
9.This bond has no contractual maturity date, is not redeemable and contractually pays an indefinite stream of interest.
| | | | | | | | | | | | | | | | | | | | | | | | | | | | | | |
| Futures Contracts as of December 31, 2019 | | | | | | | |
| Description | | Buy/Sell | | | Expiration Date | | | Number of Contracts | | | | | | Notional Amount (000’s) | | | Value | | | | | Unrealized Appreciation/ (Depreciation) | |
| United States Treasury Long Bonds | | | Buy | | | | 3/20/20 | | | | 5 | | | | USD | | | | 797 | | | $ | 779,531 | | | | | $ | (17,198 | ) |
| United States Treasury Nts., 10 yr. | | | Sell | | | | 3/20/20 | | | | 17 | | | | USD | | | | 2,203 | | | | 2,183,172 | | | | | | 19,620 | |
| United States Treasury Nts., 2 yr. | | | Buy | | | | 3/31/20 | | | | 20 | | | | USD | | | | 4,314 | | | | 4,310,000 | | | | | | (4,288 | ) |
| United States Treasury Nts., 5 yr. | | | Sell | | | | 3/31/20 | | | | 71 | | | | USD | | | | 8,452 | | | | 8,421,265 | | | | | | 30,364 | |
| United States Ultra Bonds | | | Buy | | | | 3/20/20 | | | | 64 | | | | USD | | | | 12,009 | | | | 11,626,000 | | | | | | (382,642 | ) |
| | | | | | | | | | | | | | | | | | | | | | | | | | | | $ | (354,144 | ) |
| | | | | | | | | | | | | | | | | | | | | | | | | | | | | | |
| | |
| Glossary: | | |
| Definitions | | |
| ADR | | American Depositary Receipts |
| H15T5Y | | US Treasury Yield Curve Rate T Note Constant Maturity 5 Year |
| H15T1Y | | US Treasury Yield Curve Rate T Note Constant Maturity 1 Year |
| LIBOR01M | | Intercontinental Exchange London Interbank Offered Rate USD 1 Month |
| SOFRRATE | | United States Secured Overnight Financing Rate |
| US0001M | | Intercontinental Exchange London Interbank Offered Rate USD 1 Month |
| US0003M | | Intercontinental Exchange London Interbank Offered Rate USD 3 Month |
| USISDA05 | | USD ICE Swap Rate 11:00am NY 5 Year |
| USSW5 | | USD Swap Semi 30/360 5 Year |
See accompanying Notes to Financial Statements.
19 INVESCO OPPENHEIMER V.I. CONSERVATIVE BALANCED FUND
STATEMENT OF ASSETS AND LIABILITIESDecember 31, 2019
| | | | |
| | |
| Assets | | | | |
| |
| Investments, at value (cost $166,127,330) — see accompanying schedule of investments | | $ | 185,135,707 | |
| Cash | | | 22,556,193 | |
| Receivables and other assets: | | | | |
| |
| Interest and dividends | | | 721,441 | |
| |
| Variation margin receivable - futures contracts | | | 248,785 | |
| |
| Shares of beneficial interest sold | | | 15,613 | |
| |
| Other | | | 61,134 | |
| |
| Total assets | | | 208,738,873 | |
| | |
| Liabilities | | | | |
| |
| Payables and other liabilities: | | | | |
| |
| Investments purchased | | | 18,146,705 | |
| |
| Administration fees | | | 65,984 | |
| |
| Shares of beneficial interest redeemed | | | 63,779 | |
| |
| Trustees’ compensation | | | 56,485 | |
| |
| Shareholder communications | | | 53,750 | |
| |
| Distribution and service plan fees | | | 9,734 | |
| |
| Transfer and shareholder servicing agent fees | | | 6,072 | |
| |
| Advisory fees | | | 3,868 | |
| |
| Other | | | 95,701 | |
| |
| Total liabilities | | | 18,502,078 | |
| | |
| Net Assets | | $ | 190,236,795 | |
| | | | |
| | | | |
| | |
| Composition of Net Assets | | | | |
Shares of beneficial interest | | $ | 163,312,739 | |
| Total distributable earnings | | | 26,924,056 | |
| |
| Net Assets | | $ | 190,236,795 | |
| | | | |
| | | | |
| | |
| Net Asset Value Per Share | | | | |
| |
| Series I Shares: | | | | |
| |
| Net asset value, redemption price per share and offering price per share (based on net assets of $144,383,537 and 8,853,833 shares of beneficial interest outstanding) | | | $16.31 | |
| |
| Series II Shares: | | | | |
| |
| Net asset value, redemption price per share and offering price per share (based on net assets of $45,853,258 and 2,849,968 shares of beneficial interest outstanding) | | | $16.09 | |
See accompanying Notes to Financial Statements.
20 INVESCO OPPENHEIMER V.I. CONSERVATIVE BALANCED FUND
STATEMENT OF OPERATIONSFor the Year Ended December 31, 2019
| | | | |
| | |
| Investment Income | | | | |
| |
| Interest | | $ | 3,916,102 | |
| |
| Dividends: | | | | |
| |
| Unaffiliated companies (net of foreign withholding taxes of $4,640) | | | 1,319,999 | |
| |
| Affiliated companies | | | 82,154 | |
| |
| Total investment income | | | 5,318,255 | |
| | |
| Expenses | | | | |
| |
| Advisory fees | | | 1,417,062 | |
| |
| Administration fees | | | 175,349 | |
| |
| Distribution and service plan fees: | | | | |
| |
| Series II shares | | | 113,349 | |
| |
| Transfer and shareholder servicing agent fees: | | | | |
| |
| Series I shares | | | 82,660 | |
| |
| Series II shares | | | 25,476 | |
| |
| Shareholder communications: | | | | |
| |
| Series I shares | | | 54,090 | |
| |
| Series II shares | | | 16,885 | |
| |
| Custodian fees and expenses | | | 55,408 | |
| |
| Trustees’ compensation | | | 14,566 | |
| |
| Borrowing fees | | | 2,380 | |
| |
| Other | | | 62,954 | |
| |
| Total expenses | | | 2,020,179 | |
| |
| Less waivers, reimbursement of expenses and offset arrangement(s) | | | (624,236 | ) |
| |
| Net expenses | | | 1,395,943 | |
| | |
| Net Investment Income | | | 3,922,312 | |
| | |
| Realized and Unrealized Gain (Loss) | | | | |
| |
| Net realized gain (loss) on: | | | | |
| |
| Investment transactions in unaffiliated companies (includes net gains (losses) from securities sold to affiliates of $(107,880)) | | | 3,277,965 | |
| |
| Futures contracts | | | 2,194,445 | |
| |
| Foreign currency transactions | | | 1,362 | |
| |
| Swap contracts | | | (499,179 | ) |
| |
| Net realized gain | | | 4,974,593 | |
| |
| Net change in unrealized appreciation/(depreciation) on: | | | | |
| |
| Investment transactions in unaffiliated companies | | | 22,390,493 | |
| |
| Translation of assets and liabilities denominated in foreign currencies | | | 657 | |
| |
| Futures contracts | | | (700,415 | ) |
| |
| Net change in unrealized appreciation/(depreciation) | | | 21,690,735 | �� |
| | |
| Net Increase in Net Assets Resulting from Operations | | $ | 30,587,640 | |
| | | | |
See accompanying Notes to Financial Statements.
21 INVESCO OPPENHEIMER V.I. CONSERVATIVE BALANCED FUND
STATEMENT OF CHANGES IN NET ASSETS
| | | | | | | | |
| | | Year Ended December 31, 2019 | | Year Ended December 31, 2018 | |
| Operations | | | | | | | | |
| | |
| Net investment income | | $ | 3,922,312 | | | $ | 4,046,190 | |
| | |
| Net realized gain | | | 4,974,593 | | | | 3,099,921 | |
| | |
| Net change in unrealized appreciation/(depreciation) | | | 21,690,735 | | | | (17,786,939 | ) |
| | |
| Net increase (decrease) in net assets resulting from operations | | | 30,587,640 | | | | (10,640,828 | ) |
| | | |
| Dividends and/or Distributions to Shareholders | | | | | | | | |
| | |
| Distributions to shareholders from distributable earnings: | | | | | | | | |
| | |
| Series I shares | | | (5,596,424 | ) | | | (6,688,120 | ) |
| | |
| Series II shares | | | (1,648,251 | ) | | | (1,986,593 | ) |
| | |
| Total distributions from distributable earnings | | | (7,244,675 | ) | | | (8,674,713 | ) |
| | | |
| Beneficial Interest Transactions | | | | | | | | |
| | |
| Net increase (decrease) in net assets resulting from beneficial interest transactions: | | | | | | | | |
| | |
| Series I shares | | | (13,751,593 | ) | | | (10,990,551 | ) |
| | |
| Series II shares | | | (2,673,730 | ) | | | (4,022,754 | ) |
| | |
| Total beneficial interest transactions | | | (16,425,323 | ) | | | (15,013,305 | ) |
| | | |
| Net Assets | | | | | | | | |
| | |
| Total increase (decrease) | | | 6,917,642 | | | | (34,328,846 | ) |
| | |
| Beginning of period | | | 183,319,153 | | | | 217,647,999 | |
| | |
| End of period | | $ | 190,236,795 | | | $ | 183,319,153 | |
| | | | |
See accompanying Notes to Financial Statements.
22 INVESCO OPPENHEIMER V.I. CONSERVATIVE BALANCED FUND
FINANCIAL HIGHLIGHTS
| | | | | | | | | | | | | | | | | | | | |
| Series I Shares | | Year Ended
December 31,
2019 | | | Year Ended
December 31,
2018 | | | Year Ended
December 31,
2017 | | | Year Ended
December 31,
2016 | | | Year Ended
December 31,
2015 | |
| Per Share Operating Data | | | | | | | | | | | | | | | | | | | | |
| Net asset value, beginning of period | | | $ 14.43 | | | | $ 15.92 | | | | $ 14.86 | | | | $ 14.46 | | | | $ 14.67 | |
| Income (loss) from investment operations: | | | | | | | | | | | | | | | | | | | | |
| Net investment income1 | | | 0.33 | | | | 0.32 | | | | 0.27 | | | | 0.26 | | | | 0.31 | |
| Net realized and unrealized gain (loss) | | | 2.16 | | | | (1.13) | | | | 1.09 | | | | 0.49 | | | | (0.18) | |
| Total from investment operations | | | 2.49 | | | | (0.81) | | | | 1.36 | | | | 0.75 | | | | 0.13 | |
| Dividends and/or distributions to shareholders: | | | | | | | | | | | | | | | | | | | | |
| Dividends from net investment income | | | (0.36) | | | | (0.31) | | | | (0.30) | | | | (0.35) | | | | (0.34) | |
| Distributions from net realized gain | | | (0.25) | | | | (0.37) | | | | 0.00 | | | | 0.00 | | | | 0.00 | |
| Total dividends and/or distributions to shareholders | | | (0.61) | | | | (0.68) | | | | (0.30) | | | | (0.35) | | | | (0.34) | |
| Net asset value, end of period | | | $16.31 | | | | $14.43 | | | | $15.92 | | | | $14.86 | | | | $14.46 | |
| | | | |
| | | | | | | | | | | | | | | | | | | | |
| Total Return, at Net Asset Value2 | | | 17.51% | | | | (5.32)% | | | | 9.25% | | | | 5.26% | | | | 0.83% | |
| | | | | | | | | | | | | | | | | | | | |
| Ratios/Supplemental Data | | | | | | | | | | | | | | | | | | | | |
| Net assets, end of period (in thousands) | | | $ 144,384 | | | | $ 140,290 | | | | $ 166,015 | | | | $ 172,573 | | | | $ 182,406 | |
| Average net assets (in thousands) | | | $ 145,820 | | | | $ 155,024 | | | | $ 170,438 | | | | $ 177,368 | | | | $ 194,208 | |
| Ratios to average net assets:3 | | | | | | | | | | | | | | | | | | | | |
| Net investment income | | | 2.11% | | | | 2.05% | | | | 1.74% | | | | 1.78% | | | | 2.09% | |
| Expenses excluding specific expenses listed below | | | 1.00% | | | | 0.98% | | | | 0.94% | | | | 0.94% | | | | 0.91% | |
| Interest and fees from borrowings4 | | | 0.00% | | | | 0.00% | | | | 0.00% | | | | 0.00% | | | | 0.00% | |
| Total expenses5 | | | 1.00% | | | | 0.98% | | | | 0.94% | | | | 0.94% | | | | 0.91% | |
| Expenses after payments, waivers and/or reimbursements and reduction to custodian expenses | | | 0.67% | | | | 0.67% | | | | 0.67% | | | | 0.67% | | | | 0.67% | |
| Portfolio turnover rate6,7 | | | 68% | | | | 60% | | | | 76% | | | | 68% | | | | 68% | |
1.Calculated based on the average shares outstanding during the period.
2.Includes adjustments in accordance with accounting principles generally accepted in the United States of America and as such, the net asset value for financial reporting purposes and the returns based upon those net asset values may differ from the net asset value and returns for shareholder transactions. Total returns are not annualized for periods less than one year, if applicable and do not reflect charges assessed in connection with a variable product, which if included would reduce total returns.
3.Annualized for periods less than one full year.
4.Less than 0.005%.
5.Total expenses including indirect expenses from fund fees and expenses were as follows:
| | | | | | |
| Year Ended December 31, 2019 | | | | 1.00% | | |
| Year Ended December 31, 2018 | | | | 0.98% | | |
| Year Ended December 31, 2017 | | | | 0.94% | | |
| Year Ended December 31, 2016 | | | | 0.94% | | |
| Year Ended December 31, 2015 | | | | 0.91% | | |
6. The portfolio turnover rate excludes purchase and sale transactions of To Be Announced (TBA) mortgage-related securities as follows:
| | | | | | | | |
| | | | | Purchase Transactions | | Sale Transactions | | |
Year Ended December 31, 2019 | | | | $489,567,330 | | $509,769,207 | | |
Year Ended December 31, 2018 | | | | $685,887,902 | | $703,549,464 | | |
Year Ended December 31, 2017 | | | | $729,295,309 | | $711,803,922 | | |
Year Ended December 31, 2016 | | | | $737,550,642 | | $742,753,245 | | |
Year Ended December 31, 2015 | | | | $829,988,104 | | $849,696,153 | | |
7.Portfolio turnover is calculated at the fund level and is not annualized for periods less than one year, if applicable.
See accompanying Notes to Financial Statements.
23 INVESCO OPPENHEIMER V.I. CONSERVATIVE BALANCED FUND
FINANCIAL HIGHLIGHTSContinued
| | | | | | | | | | | | | | | | | | | | |
| Series II Shares | | Year Ended
December 31,
2019 | | | Year Ended
December 31,
2018 | | | Year Ended
December 31,
2017 | | | Year Ended
December 31,
2016 | | | Year Ended
December 31,
2015 | |
| Per Share Operating Data | | | | | | | | | | | | | | | | | | | | |
| Net asset value, beginning of period | | | $14.24 | | | | $15.71 | | | | $14.67 | | | | $14.28 | | | | $14.49 | |
| Income (loss) from investment operations: | | | | | | | | | | | | | | | | | | | | |
| Net investment income1 | | | 0.29 | | | | 0.27 | | | | 0.23 | | | | 0.22 | | | | 0.27 | |
| Net realized and unrealized gain (loss) | | | 2.13 | | | | (1.10) | | | | 1.07 | | | | 0.48 | | | | (0.18) | |
| Total from investment operations | | | 2.42 | | | | (0.83) | | | | 1.30 | | | | 0.70 | | | | 0.09 | |
| Dividends and/or distributions to shareholders: | | | | | | | | | | | | | | | | | | | | |
| Dividends from net investment income | | | (0.32) | | | | (0.27) | | | | (0.26) | | | | (0.31) | | | | (0.30) | |
| Distributions from net realized gain | | | (0.25) | | | | (0.37) | | | | 0.00 | | | | 0.00 | | | | 0.00 | |
| Total dividends and/or distributions to shareholders | | | (0.57) | | | | (0.64) | | | | (0.26) | | | | (0.31) | | | | (0.30) | |
| Net asset value, end of period | | | $16.09 | | | | $14.24 | | | | $15.71 | | | | $14.67 | | | | $14.28 | |
| | | | |
| | | | |
| Total Return, at Net Asset Value2 | | | 17.22% | | | | (5.53)% | | | | 8.95% | | | | 4.96% | | | | 0.57% | |
| | | | | | | | | | | | | | | | | | | | |
| | | | | | | | | | | | | | | | | | | | |
| Ratios/Supplemental Data | | | | | | | | | | | | | | | | | | | | |
| Net assets, end of period (in thousands) | | | $45,853 | | | | $43,029 | | | | $51,633 | | | | $51,743 | | | | $52,226 | |
| Average net assets (in thousands) | | | $45,343 | | | | $48,109 | | | | $51,345 | | | | $53,914 | | | | $59,085 | |
| Ratios to average net assets:3 | | | | | | | | | | | | | | | | | | | | |
| Net investment income | | | 1.86% | | | | 1.80% | | | | 1.49% | | | | 1.53% | | | | 1.84% | |
| Expenses excluding specific expenses listed below | | | 1.25% | | | | 1.23% | | | | 1.19% | | | | 1.19% | | | | 1.16% | |
| Interest and fees from borrowings4 | | | 0.00% | | | | 0.00% | | | | 0.00% | | | | 0.00% | | | | 0.00% | |
| Total expenses5 | | | 1.25% | | | | 1.23% | | | | 1.19% | | | | 1.19% | | | | 1.16% | |
| Expenses after payments, waivers and/or reimbursements and reduction to custodian expenses | | | 0.92% | | | | 0.92% | | | | 0.92% | | | | 0.92% | | | | 0.92% | |
| Portfolio turnover rate6,7 | | | 68% | | | | 60% | | | | 76% | | | | 68% | | | | 68% | |
1.Calculated based on the average shares outstanding during the period.
2.Includes adjustments in accordance with accounting principles generally accepted in the United States of America and as such, the net asset value for financial reporting purposes and the returns based upon those net asset values may differ from the net asset value and returns for shareholder transactions. Total returns are not annualized for periods less than one year, if applicable and do not reflect charges assessed in connection with a variable product, which if included would reduce total returns.
3.Annualized for periods less than one full year.
4.Less than 0.005%.
5.Total expenses including indirect expenses from fund fees and expenses were as follows:
| | | | | | |
| Year Ended December 31, 2019 | | | | 1.25% | | |
| Year Ended December 31, 2018 | | | | 1.23% | | |
| Year Ended December 31, 2017 | | | | 1.19% | | |
| Year Ended December 31, 2016 | | | | 1.19% | | |
| Year Ended December 31, 2015 | | | | 1.16% | | |
6. The portfolio turnover rate excludes purchase and sale transactions of To Be Announced (TBA) mortgage-related securities as follows:
| | | | | | | | |
| | | | | Purchase Transactions | | Sale Transactions | | |
| | |
Year Ended December 31, 2019 | | | | $489,567,330 | | $509,769,207 | | |
Year Ended December 31, 2018 | | | | $685,887,902 | | $703,549,464 | | |
Year Ended December 31, 2017 | | | | $729,295,309 | | $711,803,922 | | |
Year Ended December 31, 2016 | | | | $737,550,642 | | $742,753,245 | | |
Year Ended December 31, 2015 | | | | $829,988,104 | | $849,696,153 | | |
7.Portfolio turnover is calculated at the fund level and is not annualized for periods less than one year, if applicable.
See accompanying Notes to Financial Statements.
24 INVESCO OPPENHEIMER V.I. CONSERVATIVE BALANCED FUND
NOTES TO FINANCIAL STATEMENTSDecember 31, 2019
Note 1 - Significant Accounting Policies
Invesco Oppenheimer V.I. Conservative Balanced Fund (the “Fund”) is a series portfolio of AIM Variable Insurance Funds (Invesco Variable Insurance Funds) (the “Trust”). The Trust is a Delaware statutory trust registered under the Investment Company Act of 1940, as amended (the “1940 Act”), as an open-end series management investment company authorized to issue an unlimited number of shares of beneficial interest. Information presented in these financial statements pertains only to the Fund. Matters affecting the Fund or each class will be voted on exclusively by the shareholders of such Fund or each class.
Prior to the close of business on May 24, 2019, the Fund operated as Oppenheimer Conservative Balanced/VA Fund (the “Acquired Fund” or “Predecessor Fund”). The Acquired Fund was reorganized after the close of business on May 24, 2019 (the “Reorganization Date”) through the transfer of all of its assets and liabilities to the Fund (the “Reorganization”).
Upon closing of the Reorganization, holders of the Acquired Fund’s Non-Service and Service shares received Series I and Series II shares of the Fund, respectively. Information for the Acquired Fund’s Non-Service and Service shares prior to the Reorganization is included with Series I and Series II, respectively, throughout this report.
The Fund’s investment objective is to seek total return
The Fund currently offers two classes of shares, Series I and Series II, both of which are offered to insurance company separate accounts funding variable annuity contracts and variable life insurance policies (“variable products”).
The Fund is an investment company and accordingly follows the investment company accounting and reporting guidance in accordance with Financial Accounting Standards Board Accounting Standards Codification Topic 946, Financial Services – Investment Companies.
The following is a summary of the significant accounting policies followed by the Fund in the preparation of its financial statements.
| A. | Security Valuations - Securities, including restricted securities, are valued according to the following policy. |
Debt obligations (including convertible securities) and unlisted equities are fair valued using an evaluated quote provided by an independent pricing service. Evaluated quotes provided by the pricing service may be determined without exclusive reliance on quoted prices, and may reflect appropriate factors such as institution-size trading in similar groups of securities, developments related to specific securities, dividend rate (for unlisted equities), yield (for debt obligations), quality, type of issue, coupon rate (for debt obligations), maturity (for debt obligations), individual trading characteristics and other market data. Pricing services generally value debt obligations assuming orderly transactions of institutional round lot size, but a fund may hold or transact in the same securities in smaller, odd lot sizes. Odd lots often trade at lower prices than institutional round lots. Debt obligations are subject to interest rate and credit risks. In addition, all debt obligations involve some risk of default with respect to interest and/or principal payments.
A security listed or traded on an exchange (except convertible securities) is valued at its last sales price or official closing price as of the close of the customary trading session on the exchange where the security is principally traded, or lacking any sales or official closing price on a particular day, the security may be valued at the closing bid price on that day. Securities traded in the over-the-counter market are valued based on prices furnished by independent pricing services or market makers. When such securities are valued by an independent pricing service they may be considered fair valued. Futures contracts are valued at the final settlement price set by an exchange on which they are principally traded. Listed options are valued at the mean between the last bid and asked prices from the exchange on which they are principally traded. Options not listed on an exchange are valued by an independent source at the mean between the last bid and asked prices. For purposes of determining net asset value (“NAV”) per share, futures and option contracts generally are valued 15 minutes after the close of the customary trading session of the New York Stock Exchange (“NYSE”).
Investments in open-end and closed-end registered investment companies that do not trade on an exchange are valued at the end-of-day net asset value per share. Investments in open-end and closed-end registered investment companies that trade on an exchange are valued at the last sales price or official closing price as of the close of the customary trading session on the exchange where the security is principally traded.
Swap agreements are fair valued using an evaluated quote, if available, provided by an independent pricing service. Evaluated quotes provided by the pricing service are valued based on a model which may include end-of-day net present values, spreads, ratings, industry, company performance and returns of referenced assets. Centrally cleared swap agreements are valued at the daily settlement price determined by the relevant exchange or clearinghouse.
Foreign securities’ (including foreign exchange contracts) prices are converted into U.S. dollar amounts using the applicable exchange rates as of the close of the NYSE. If market quotations are available and reliable for foreign exchange-traded equity securities, the securities will be valued at the market quotations. Because trading hours for certain foreign securities end before the close of the NYSE, closing market quotations may become unreliable. If between the time trading ends on a particular security and the close of the customary trading session on the NYSE, events occur that the investment adviser determines are significant and make the closing price unreliable, the Fund may fair value the security. If the event is likely to have affected the closing price of the security, the security will be valued at fair value in good faith using procedures approved by the Board of Trustees. Adjustments to closing prices to reflect fair value may also be based on a screening process of an independent pricing service to indicate the degree of certainty, based on historical data, that the closing price in the principal market where a foreign security trades is not the current value as of the close of the NYSE. Foreign securities’ prices meeting the approved degree of certainty that the price is not reflective of current value will be priced at the indication of fair value from the independent pricing service. Multiple factors may be considered by the independent pricing service in determining adjustments to reflect fair value and may include information relating to sector indices, American Depositary Receipts and domestic and foreign index futures. Foreign securities may have additional risks including exchange rate changes, potential for sharply devalued currencies and high inflation, political and economic upheaval, the relative lack of issuer information, relatively low market liquidity and the potential lack of strict financial and accounting controls and standards.
Securities for which market prices are not provided by any of the above methods may be valued based upon quotes furnished by independent sources. The last bid price may be used to value equity securities. The mean between the last bid and asked prices is used to value debt obligations,
25 INVESCO OPPENHEIMER V.I. CONSERVATIVE BALANCED FUND
NOTES TO FINANCIAL STATEMENTSContinued
including corporate loans.
Securities for which market quotations are not readily available or became unreliable are valued at fair value as determined in good faith by or under the supervision of the Trust’s officers following procedures approved by the Board of Trustees. Issuer specific events, market trends, bid/ asked quotes of brokers and information providers and other market data may be reviewed in the course of making a good faith determination of a security’s fair value.
The Fund may invest in securities that are subject to interest rate risk, meaning the risk that the prices will generally fall as interest rates rise and, conversely, the prices will generally rise as interest rates fall. Specific securities differ in their sensitivity to changes in interest rates depending on their individual characteristics. Changes in interest rates may result in increased market volatility, which may affect the value and/or liquidity of certain Fund investments.
Valuations change in response to many factors including the historical and prospective earnings of the issuer, the value of the issuer’s assets, general economic conditions, interest rates, investor perceptions and market liquidity. Because of the inherent uncertainties of valuation, the values reflected in the financial statements may materially differ from the value received upon actual sale of those investments.
| B. | Securities Transactions and Investment Income -Securities transactions are accounted for on a trade date basis. Realized gains or losses on sales are computed on the basis of specific identification of the securities sold. Interest income (net of withholding tax, if any) is recorded on the accrual basis from settlement date. Bond premiums and discounts are amortized and/or accreted over the lives of the respective securities. Pay-in-kind interest income and non-cash dividend income received in the form of securities in-lieu of cash are recorded at the fair value of the securities received. Paydown gains and losses on mortgage and asset-backed securities are recorded as adjustments to interest income. Dividend income (net of withholding tax, if any) is recorded on the ex-dividend date. |
The Fund may periodically participate in litigation related to Fund investments. As such, the Fund may receive proceeds from litigation settlements. Any proceeds received are included in the Statement of Operations as realized gain (loss) for investments no longer held and as unrealized gain (loss) for investments still held.
Brokerage commissions and mark ups are considered transaction costs and are recorded as an increase to the cost basis of securities purchased and/or a reduction of proceeds on a sale of securities. Such transaction costs are included in the determination of net realized and unrealized gain (loss) from investment transactions reported in the Statement of Operations and the Statement of Changes in Net Assets and the net realized and unrealized gains (losses) on securities per share in the Financial Highlights. Transaction costs are included in the calculation of the Fund’s net asset value and, accordingly, they reduce the Fund’s total returns. These transaction costs are not considered operating expenses and are not reflected in net investment income reported in the Statement of Operations and the Statement of Changes in Net Assets, or the net investment income per share and the ratios of expenses and net investment income reported in the Financial Highlights, nor are they limited by any expense limitation arrangements between the Fund and the investment adviser.
The Fund allocates income and realized and unrealized capital gains and losses to a class based on the relative net assets of each class.
| C. | Country Determination- For the purposes of making investment selection decisions and presentation in the Schedule of Investments, the investment adviser may determine the country in which an issuer is located and/or credit risk exposure based on various factors. These factors include the laws of the country under which the issuer is organized, where the issuer maintains a principal office, the country in which the issuer derives 50% or more of its total revenues and the country that has the primary market for the issuer’s securities, as well as other criteria. Among the other criteria that may be evaluated for making this determination are the country in which the issuer maintains 50% or more of its assets, the type of security, financial guarantees and enhancements, the nature of the collateral and the sponsor organization. |
| D. | Distributions -Dividends and distributions to shareholders, which are determined in accordance with income tax regulations and may differ from accounting principles generally accepted in the United States of America (“GAAP”), are recorded on the ex-dividend date. Income distributions, if any, are declared and paid annually to separate accounts of participating insurance companies. Capital gain distributions, if any, are declared and paid annually or at other times as determined necessary by the Adviser. |
| E. | Federal Income Taxes -The Fund intends to comply with the requirements of Subchapter M of the Internal Revenue Code of 1986, as amended (the “Internal Revenue Code”), necessary to qualify as a regulated investment company and to distribute substantially all of the Fund’s taxable earnings to shareholders. As such, the Fund will not be subject to federal income taxes on otherwise taxable income (including net realized capital gain) that is distributed to shareholders. Therefore, no provision for federal income taxes is recorded in the financial statements. |
The Fund recognizes the tax benefits of uncertain tax positions only when the position is more likely than not to be sustained. Management has analyzed the Fund’s uncertain tax positions and concluded that no liability for unrecognized tax benefits should be recorded related to uncertain tax positions. Management is not aware of any tax positions for which it is reasonably possible that the total amounts of unrecognized tax benefits will change materially in the next 12 months.
The Fund files tax returns in the U.S. Federal jurisdiction and certain other jurisdictions. Generally, the Fund is subject to examinations by such taxing authorities for up to three years after the filing of the return for the tax period.
| F. | Expenses -Fees provided for under the Rule 12b-1 plan of a particular class of the Fund are charged to the operations of such class. Transfer agency fees and expenses and other shareholder recordkeeping fees and expenses relating to all other classes are allocated among those classes based on relative net assets. All other expenses are allocated among the classes based on relative net assets. |
| G. | Accounting Estimates -The financial statements are prepared on a basis in conformity with GAAP, which requires management to make estimates and assumptions that affect the reported amounts of assets and liabilities at the date of the financial statements and the reported amounts of revenues and expenses during the reporting period including estimates and assumptions related to taxation. Actual results could differ from those estimates by a significant amount. In addition, the Fund monitors for material events or transactions that may occur or become known after the period-end date and before the date the financial statements are released to print. |
26 INVESCO OPPENHEIMER V.I. CONSERVATIVE BALANCED FUND
| H. | Indemnifications -Under the Trust’s organizational documents, each Trustee, officer, employee or other agent of the Trust is indemnified against certain liabilities that may arise out of the performance of their duties to the Fund. Additionally, in the normal course of business, the Fund enters into contracts, including the Fund’s servicing agreements, that contain a variety of indemnification clauses. The Fund’s maximum exposure under these arrangements is unknown as this would involve future claims that may be made against the Fund that have not yet occurred. The risk of material loss as a result of such indemnification claims is considered remote. |
| I. | Foreign Currency Translations -Foreign currency is valued at the close of the NYSE based on quotations posted by banks and major currency dealers. Portfolio securities and other assets and liabilities denominated in foreign currencies are translated into U.S. dollar amounts at the date of valuation. Purchases and sales of portfolio securities (net of foreign taxes withheld on disposition) and income items denominated in foreign currencies are translated into U.S. dollar amounts on the respective dates of such transactions. The Fund does not separately account for the portion of the results of operations resulting from changes in foreign exchange rates on investments and the fluctuations arising from changes in market prices of securities held. The combined results of changes in foreign exchange rates and the fluctuation of market prices on investments (net of estimated foreign tax withholding) are included with the net realized and unrealized gain or loss from investments in the Statement of Operations. Reported net realized foreign currency gains or losses arise from (1) sales of foreign currencies, (2) currency gains or losses realized between the trade and settlement dates on securities transactions, and (3) the difference between the amounts of dividends, interest, and foreign withholding taxes recorded on the Fund’s books and the U.S. dollar equivalent of the amounts actually received or paid. Net unrealized foreign currency gains and losses arise from changes in the fair values of assets and liabilities, other than investments in securities at fiscal period end, resulting from changes in exchange rates. The Fund may invest in foreign securities, which may be subject to foreign taxes on income, gains on investments or currency repatriation, a portion of which may be recoverable. Foreign taxes, if any, are recorded based on the tax regulations and rates that exist in the foreign markets in which the Fund invests and are shown in the Statement of Operations. |
| J. | Futures Contracts -The Fund may enter into futures contracts to manage exposure to interest rate, equity and market price movements and/or currency risks. A futures contract is an agreement between two parties (“Counterparties”) to purchase or sell a specified underlying security, currency or commodity (or delivery of a cash settlement price, in the case of an index future) for a fixed price at a future date. The Fund currently invests only in exchange-traded futures and they are standardized as to maturity date and underlying financial instrument. Initial margin deposits required upon entering into futures contracts are satisfied by the segregation of specific securities or cash as collateral at the futures commission merchant (broker). During the period the futures contracts are open, changes in the value of the contracts are recognized as unrealized gains or losses by recalculating the value of the contracts on a daily basis. Subsequent or variation margin payments are received or made depending upon whether unrealized gains or losses are incurred. These amounts are reflected as receivables or payables on the Statement of Assets and Liabilities. When the contracts are closed or expire, the Fund recognizes a realized gain or loss equal to the difference between the proceeds from, or cost of, the closing transaction and the Fund’s basis in the contract. The net realized gain (loss) and the change in unrealized gain (loss) on futures contracts held during the period is included on the Statement of Operations. The primary risks associated with futures contracts are market risk and the absence of a liquid secondary market. If the Fund were unable to liquidate a futures contract and/or enter into an offsetting closing transaction, the Fund would continue to be subject to market risk with respect to the value of the contracts and continue to be required to maintain the margin deposits on the futures contracts. Futures contracts have minimal Counterparty risk since the exchange’s clearinghouse, as Counterparty to all exchange-traded futures, guarantees the futures against default. Risks may exceed amounts recognized in the Statement of Assets and Liabilities. |
| K. | Swap Agreements - The Fund may enter into various swap transactions, including interest rate, total return, index, currency and credit default swap contracts (“CDS”) for investment purposes or to manage interest rate, currency or credit risk. Such transactions are agreements between Counterparties. A swap agreement may be negotiated bilaterally and traded over-the-counter (“OTC”) between two parties (“uncleared/OTC”) or, in some instances, must be transacted through a future commission merchant (“FCM”) and cleared through a clearinghouse that serves as a central Counterparty (“centrally cleared swap”). These agreements may contain among other conditions, events of default and termination events, and various covenants and representations such as provisions that require the Fund to maintain a pre-determined level of net assets, and/or provide limits regarding the decline of the Fund’s NAV over specific periods of time. If the Fund were to trigger such provisions and have open derivative positions at that time, the Counterparty may be able to terminate such agreement and request immediate payment in an amount equal to the net liability positions, if any. |
Interest rate, total return, index, and currency swap agreements are two-party contracts entered into primarily to exchange the returns (or differentials in rates of returns) earned or realized on particular predetermined investments or instruments. The gross returns to be exchanged or “swapped” between the parties are calculated with respect to a notional amount, i.e., the return on or increase in value of a particular dollar amount invested at a particular interest rate or return of an underlying asset, in a particular foreign currency, or in a “basket” of securities representing a particular index.
In a centrally cleared swap, the Fund’s ultimate Counterparty is a central clearinghouse. The Fund initially will enter into centrally cleared swaps through an executing broker. When a fund enters into a centrally cleared swap, it must deliver to the central Counterparty (via the FCM) an amount referred to as “initial margin.” Initial margin requirements are determined by the central Counterparty, but an FCM may require additional initial margin above the amount required by the central Counterparty. Initial margin deposits required upon entering into centrally cleared swaps are satisfied by cash or securities as collateral at the FCM. Securities deposited as initial margin are designated on the Schedule of Investments and cash deposited is recorded on the Statement of Assets and Liabilities. During the term of a cleared swap agreement, a “variation margin” amount may be required to be paid by the Fund or may be received by the Fund, based on the daily change in price of the underlying reference instrument subject to the swap agreement and is recorded as a receivable or payable for variation margin in the Statement of Assets and Liabilities until the centrally cleared swap is terminated at which time a realized gain or loss is recorded.
A CDS is an agreement between Counterparties to exchange the credit risk of an issuer. A buyer of a CDS is said to buy protection by paying a fixed
27 INVESCO OPPENHEIMER V.I. CONSERVATIVE BALANCED FUND
NOTES TO FINANCIAL STATEMENTSContinued
payment over the life of the agreement and in some situations an upfront payment to the seller of the CDS. If a defined credit event occurs (such as payment default or bankruptcy), the Fund as a protection buyer would cease paying its fixed payment, the Fund would deliver eligible bonds issued by the reference entity to the seller, and the seller would pay the full notional value, or the “par value”, of the referenced obligation to the Fund. A seller of a CDS is said to sell protection and thus would receive a fixed payment over the life of the agreement and an upfront payment, if applicable. If a credit event occurs, the Fund as a protection seller would cease to receive the fixed payment stream, the Fund would pay the buyer “par value” or the full notional value of the referenced obligation, and the Fund would receive the eligible bonds issued by the reference entity. In turn, these bonds may be sold in order to realize a recovery value. Alternatively, the seller of the CDS and its Counterparty may agree to net the notional amount and the market value of the bonds and make a cash payment equal to the difference to the buyer of protection. If no credit event occurs, the Fund receives the fixed payment over the life of the agreement. As the seller, the Fund would effectively add leverage to its portfolio because, in addition to its total net assets, the Fund would be subject to investment exposure on the notional amount of the CDS. In connection with these agreements, cash and securities may be identified as collateral in accordance with the terms of the respective swap agreements to provide assets of value and recourse in the event of default under the swap agreement or bankruptcy/insolvency of a party to the swap agreement. If a Counterparty becomes bankrupt or otherwise fails to perform its obligations due to financial difficulties, the Fund may experience significant delays in obtaining any recovery in a bankruptcy or other reorganization proceeding. The Fund may obtain only limited recovery or may obtain no recovery in such circumstances. The Fund’s maximum risk of loss from Counterparty risk, either as the protection seller or as the protection buyer, is the value of the contract. The risk may be mitigated by having a master netting arrangement between the Fund and the Counterparty and by the designation of collateral by the Counterparty to cover the Fund’s exposure to the Counterparty.
Implied credit spreads represent the current level at which protection could be bought or sold given the terms of the existing CDS contract and serve as an indicator of the current status of the payment/performance risk of the CDS. An implied spread that has widened or increased since entry into the initial contract may indicate a deteriorating credit profile and increased risk of default for the reference entity. A declining or narrowing spread may indicate an improving credit profile or decreased risk of default for the reference entity. Alternatively, credit spreads may increase or decrease reflecting the general tolerance for risk in the credit markets.
An interest rate swap is an agreement between Counterparties pursuant to which the parties exchange a floating rate payment for a fixed rate payment based on a specified notional amount.
Changes in the value of centrally cleared and OTC swap agreements are recognized as unrealized gains (losses) in the Statement of Operations by “marking to market” on a daily basis to reflect the value of the swap agreement at the end of each trading day. Payments received or paid at the beginning of the agreement are reflected as such on the Statement of Assets and Liabilities and may be referred to as upfront payments. The Fund accrues for the fixed payment stream and amortizes upfront payments, if any, on swap agreements on a daily basis with the net amount, recorded as a component of realized gain (loss) on the Statement of Operations. A liquidation payment received or made at the termination of a swap agreement is recorded as realized gain (loss) on the Statement of Operations. The Fund segregates cash or liquid securities having a value at least equal to the amount of the potential obligation of a Fund under any swap transaction. Cash held as collateral is recorded as deposits with brokers on the Statement of Assets and Liabilities. Entering into these agreements involves, to varying degrees, lack of liquidity and elements of credit, market, and Counterparty risk in excess of amounts recognized on the Statement of Assets and Liabilities. Such risks involve the possibility that a swap is difficult to sell or liquidate; the Counterparty does not honor its obligations under the agreement and unfavorable interest rates and market fluctuations. It is possible that developments in the swaps market, including potential government regulation, could adversely affect the Fund’s ability to terminate existing swap agreements or to realize amounts to be received under such agreements. A short position in a security poses more risk than holding the same security long. As there is no limit on how much the price of the security can increase, the Fund’s exposure is unlimited..
| L. | Securities on a When-Issued or Delayed Delivery Basis -The Fund may purchase securities on a “when-issued” basis, and may purchase or sell securities on a “delayed delivery” basis, with payment and delivery scheduled for a future date. No income accrues to the Fund on the securities in connection with such transactions prior to the date the Fund actually takes delivery of the securities. These transactions are subject to market fluctuations and are subject to the risk that the value at delivery may be more or less than the trade date purchase price. Although the Fund will generally purchase these securities with the intention on acquiring such securities, they may sell such securities prior to the settlement date. |
| M. | Leverage Risk- Leverage exists when the Fund can lose more than it originally invests because it purchases or sells an instrument or enters into a transaction without investing an amount equal to the full economic exposure of the instrument or transaction. |
| N. | Collateral- To the extent the Fund has designated or segregated a security as collateral and that security is subsequently sold, it is the Fund’s practice to replace such collateral no later than the next business day. |
Note 2 – Advisory Fees and Other Fees Paid to Affiliates
The Trust has entered into a master investment advisory agreement with Invesco Advisers, Inc. (the “Adviser” or “Invesco”). Under the terms of the investment advisory agreement, the Fund accrues daily and pays monthly an advisory fee to the Adviser based on the annual rate of the Fund’s average daily net assets as follows:
| | | | |
Fee Schedule* | |
| Up to $200 million | | | 0.75% | |
| Next $200 million | | | 0.72 | |
| Next $200 million | | | 0.69 | |
| Next $200 million | | | 0.66 | |
| Over $800 million | | | 0.60 | |
*The advisory fee paid by the Fund shall be reduced by any amounts paid by the Fund under the administrative services agreement with the Adviser.
28 INVESCO OPPENHEIMER V.I. CONSERVATIVE BALANCED FUND
For the year ended December 31, 2019, the effective advisory fees incurred by the Fund was 0.74%.
From the beginning of the fiscal period until the date of the Reorganization, the Acquired Fund paid $564,060 in advisory fees to OFI Global Asset Management, Inc. based on the annual rates above of the Acquired Fund’s average daily net assets.
Under the terms of a master sub-advisory agreement between the Adviser and each of Invesco Asset Management Deutschland GmbH, Invesco Asset Management Limited, Invesco Asset Management (Japan) Limited, Invesco Hong Kong Limited, Invesco Senior Secured Management, Inc. and Invesco Canada Ltd. and separate sub-advisory agreements with Invesco Capital Management LLC, and Invesco Asset Management (India) Private Limited (collectively, the “Affiliated Sub-Advisers”) the Adviser, not the Fund, will pay 40% of the fees paid to the Adviser to any such Affiliated Sub-Adviser(s) that provide(s) discretionary investment management services to the Fund based on the percentage of assets allocated to such Affiliated Sub-Adviser(s). Invesco has also entered into a Sub-Advisory Agreement with OppenheimerFunds, Inc. to provide discretionary management services to the Funds.
Effective on the Reorganization Date, the Adviser has contractually agreed, through May 31, 2021, to waive advisory fees and/or reimburse expenses of all shares to the extent necessary to limit the total annual fund operating expenses after fee waiver and/or expense reimbursement (excluding certain items discussed below) of Series I and Series II shares to 0.67% and 0.92%, respectively, of the Fund’s average daily net assets (the “expense limits”). In determining the Adviser’s obligation to waive advisory fees and/or reimburse expenses, the following expenses are not taken into account, and could cause total annual fund operating expenses after fee waivers and/or expense reimbursement to exceed the numbers reflected above: (1) interest; (2) taxes; (3) dividend expenses on short sales; (4) extraordinary or non-routine items, including litigation expenses; and (5) expenses that the Fund has incurred but did not actually pay because of an expense offset arrangement. Unless Invesco continues the fee waiver agreement, it will terminate on May 31, 2021. During its term, the fee waiver agreement cannot be terminated or amended to increase the expense limits or reduce the advisory fee waiver without approval of the Board of Trustees.
Further, the Adviser has contractually agreed, through at least June 30, 2021, to waive the advisory fee payable by the Fund in an amount equal to 100% of the net advisory fees the Adviser receives from the affiliated money market funds on investments by the Fund of uninvested cash in such affiliated money market funds.
For the year ended December 31, 2019, the Adviser waived advisory fees of $3,324 and reimbursed Fund expenses of $472,685 and $147,186 for Series I and Series II shares, respectively.
Prior to the Reorganization, OFI Global Asset Management, Inc. had contractually agreed to waive fees and/or reimburse expenses of Non-Service and Service shares to 0.67% and 0.92%, respectively, of the Acquired Fund’s average daily net assets.
The Trust has entered into a master administrative services agreement with Invesco pursuant to which the Fund has agreed to pay Invesco a fee for costs incurred in providing accounting services and fund administrative services to the Fund and to reimburse Invesco for fees paid to insurance companies that have agreed to provide certain administrative services to the Fund. These administrative services provided by the insurance companies may include, among other things: maintenance of master accounts with the Fund; tracking, recording and transmitting net purchase and redemption orders for Fund shares; maintaining and preserving records related to the purchase, redemption and other account activity of variable product owners; distributing copies of Fund documents such as prospectuses, proxy materials and periodic reports, to variable product owners, and responding to inquiries from variable product owners about the Fund. Pursuant to such agreement, for the year ended December 31, 2019, Invesco was paid $16,263 for accounting and fund administrative services and was reimbursed $159,086 for fees paid to insurance companies. Additionally, Invesco has entered into service agreements whereby JP Morgan Chase Bank serves as custodian to the Fund. Prior to the Reorganization, the Acquired Fund paid administrative fees to OFI Global Asset Management, Inc.
The Trust has entered into a transfer agency and service agreement with Invesco Investment Services, Inc. (“IIS”) pursuant to which the Fund has agreed to pay IIS a fee for providing transfer agency and shareholder services to the Fund and reimburse IIS for certain expenses incurred by IIS in the course of providing such services. Prior to the Reorganization, the Acquired Fund paid transfer agent fees to OFI Global Asset Management, Inc. and Shareholder Services, Inc. For the year ended December 31, 2019, expenses incurred under these agreements are shown in the Statement of Operations as Transfer and shareholder servicing agent fees.
The Trust has entered into master distribution agreements with Invesco Distributors, Inc. (“IDI”) to serve as the distributor for the Series II shares of the Fund. The Trust has adopted a plan pursuant to Rule 12b-1 under the 1940 Act with respect to the Fund’s Series II shares (the “Plan”). The Fund, pursuant to the Plan, pays IDI at an annual rate of 0.25% of the average daily net assets of Series II shares. The fees are accrued daily and paid monthly. Of the Plan payments, up to 0.25% of the average daily net assets of the class of shares may be paid to insurance companies who furnish continuing personal shareholder services to customers who purchase and own shares of such class. Any amounts not paid as a service fee under the Plan would constitute an asset-based sales charge. Rules of the Financial Industry Regulatory Authority (“FINRA”) impose a cap on the total sales charges, including asset-based sales charges, that may be paid by any class of shares of the Fund plans. Prior to the Reorganization, the Acquired Fund paid distribution fees to OppenheimerFunds Distributor, Inc. For the year ended December 31, 2019, expenses incurred under the plans are shown in the Statement of Operations as Distribution and service plan fees.
Certain officers and trustees of the Trust are officers and directors of the Adviser, IIS and/or IDI.
Note 3 – Additional Valuation Information
GAAP defines fair value as the price that would be received to sell an asset or paid to transfer a liability in an orderly transaction between market participants at the measurement date, under current market conditions. GAAP establishes a hierarchy that prioritizes the inputs to valuation methods, giving the highest priority to readily available unadjusted quoted prices in an active market for identical assets (Level 1) and the lowest priority to significant unobservable inputs (Level 3), generally when market prices are not readily available or are unreliable. Based on the valuation inputs, the securities or other investments are tiered into one of three levels. Changes in valuation methods may result in transfers in or out of an investment’s
29 INVESCO OPPENHEIMER V.I. CONSERVATIVE BALANCED FUND
NOTES TO FINANCIAL STATEMENTSContinued
assigned level:
Level 1 — Prices are determined using quoted prices in an active market for identical assets.
Level 2 — Prices are determined using other significant observable inputs. Observable inputs are inputs that other market participants may use in pricing a security. These may include quoted prices for similar securities, interest rates, prepayment speeds, credit risk, yield curves, loss severities, default rates, discount rates, volatilities and others.
Level 3 — Prices are determined using significant unobservable inputs. In situations where quoted prices or observable inputs are unavailable (for example, when there is little or no market activity for an investment at the end of the period), unobservable inputs may be used. Unobservable inputs reflect the Fund’s own assumptions about the factors market participants would use in determining fair value of the securities or instruments and would be based on the best available information.
The following is a summary of the tiered valuation input levels, as of December 31, 2019. The level assigned to the securities valuations may not be an indication of the risk or liquidity associated with investing in those securities. Because of the inherent uncertainties of valuation, the values reflected in the financial statements may materially differ from the value received upon actual sale of those investments.
| | | | | | | | | | | | | | | | |
| | | Level 1— Unadjusted Quoted Prices | | | Level 2— Other Significant Observable Inputs | | | Level 3— Significant
Unobservable Inputs | | | Value | |
| |
| Assets Table | | | | | | | | | | | | | | | | |
| Investments, at Value: | | | | | | | | | | | | | | | | |
| Common Stocks | | | | | | | | | | | | | | | | |
Consumer Discretionary | | $ | 11,293,576 | | | $ | — | | | $ | — | | | $ | 11,293,576 | |
Consumer Staples | | | 3,622,040 | | | | — | | | | — | | | | 3,622,040 | |
Energy | | | 3,465,440 | | | | — | | | | — | | | | 3,465,440 | |
Financials | | | 14,206,349 | | | | — | | | | — | | | | 14,206,349 | |
Health Care | | | 10,093,479 | | | | — | | | | — | | | | 10,093,479 | |
Industrials | | | 6,198,929 | | | | — | | | | — | | | | 6,198,929 | |
Information Technology | | | 14,490,222 | | | | — | | | | — | | | | 14,490,222 | |
Materials | | | 903,035 | | | | — | | | | — | | | | 903,035 | |
Telecommunication Services | | | 2,235,126 | | | | — | | | | — | | | | 2,235,126 | |
Utilities | | | 2,540,358 | | | | — | | | | — | | | | 2,540,358 | |
| Asset-Backed Securities | | | — | | | | 19,664,320 | | | | — | | | | 19,664,320 | |
| Mortgage-Backed Obligations | | | — | | | | 35,518,435 | | | | — | | | | 35,518,435 | |
| U.S. Government Obligations | | | — | | | | 4,379,216 | | | | — | | | | 4,379,216 | |
| Non-Convertible Corporate Bonds and Notes | | | — | | | | 56,525,182 | | | | — | | | | 56,525,182 | |
| | | | |
| Total Investments, at Value | | | 69,048,554 | | | | 116,087,153 | | | | — | | | | 185,135,707 | |
| Other Financial Instruments: | | | | | | | | | | | | | | | | |
| Futures contracts | | | 49,984 | | | | — | | | | — | | | | 49,984 | |
| | | | |
| Total Assets | | $ | 69,098,538 | | | $ | 116,087,153 | | | $ | — | | | $ | 185,185,691 | |
| | | | |
| Liabilities Table | | | | | | | | | | | | | | | | |
| Other Financial Instruments: | | | | | | | | | | | | | | | | |
| Futures contracts | | $ | (404,128 | ) | | $ | — | | | $ | — | | | $ | (404,128) | |
| | | | |
| Total liabilities | | $ | (404,128 | ) | | $ | — | | | $ | — | | | $ | (404,128) | |
| | | | |
Forward currency exchange contracts and futures contracts, if any, are reported at their unrealized appreciation/depreciation at measurement date, which represents the change in the contract’s value from trade date. All additional assets and liabilities included in the above table are reported at their market value at measurement date.
Note 4 - Security Transactions with Affiliated Funds
The Fund is permitted to purchase or sell securities from or to certain other Invesco Funds under specified conditions outlined in procedures adopted by the Board of Trustees of the Trust. The procedures have been designed to ensure that any purchase or sale of securities by the Fund from or to another fund or portfolio that is or could be considered an affiliate by virtue of having a common investment adviser (or affiliated investment advisers), common Trustees and/or common officers complies with Rule 17a-7 of the 1940 Act. Further, as defined under the procedures, each transaction is effected at the current market price. Pursuant to these procedures for the period January 1, 2019 to May 24, 2019,the Predecessor Fund engaged in transactions with affiliates as listed: Securities purchases of $135,576 and securities sales of $533,049, which resulted in net realized (losses) of ($107,880). For the period May 25, 2019 to December 31, 2019, the Fund engaged in transactions with affiliates as listed: Securities purchases of $502,904.
Note 5 - Derivative Investments
The Fund may enter into an International Swaps and Derivatives Association Master Agreement (“ISDA Master Agreement”) under which a fund may trade OTC derivatives. An OTC transaction entered into under an ISDA Master Agreement typically involves a collateral posting arrangement, payment netting provisions and close-out netting provisions. These netting provisions allow for reduction of credit risk through netting of contractual obligations. The enforceability of the netting provisions of the ISDA Master Agreement depends on the governing law of the ISDA Master Agreement, among other
30 INVESCO OPPENHEIMER V.I. CONSERVATIVE BALANCED FUND
factors.
For financial reporting purposes, the Fund does not offset OTC derivative assets or liabilities that are subject to ISDA Master Agreements in the Statement of Assets and Liabilities.
Value of Derivative Instruments at Period-End
The table below reflects the Fund’s exposure to Counterparties subject to either an ISDA Master Agreement or other agreement for OTC derivative liability transactions as of December 31, 2019:
| | | | | | | | | | | | |
| | | Asset Derivatives | | | Liability Derivatives | |
Derivatives Not Accounted for as Hedging Instruments | | Statement of Assets
and Liabilities Location | | Value | | | Statement of Assets
and Liabilities Location | | Value | |
| |
| Interest rate contracts Futures Contracts | | $ | 49,984 | * | | Futures Contracts | | $ | 404,128* | |
* Includes only the current day’s variation margin. Prior variation margin movements have been reflected in cash on the Statement of Assets and Liabilities upon receipt or payment.
Effect of Derivative Investments for the Year Ended December 31, 2019
The tables below summarize the gains (losses) on derivative investments, detailed by primary risk exposure, recognized in earnings during the period:
| | | | | | | | | | | | |
| Amount of Realized Gain or (Loss) Recognized on Derivatives | |
| |
Derivatives Not Accounted for as Hedging Instruments | | Futures
contracts | | | Swap contracts | | | Total |
| |
| Credit contracts | | $ | — | | | $ | (499,179 | ) | | $ | (499,179) | |
| Interest rate contracts | | | 2,194,445 | | | | — | | | | 2,194,445 | |
| | | | |
| Total | | $ | 2,194,445 | | | $ | (499,179 | ) | | $ | 1,695,266 | |
| | | | |
| | | | |
| Amount of Change in Unrealized Gain or (Loss) Recognized on Derivatives | |
Derivatives Not Accounted for as Hedging Instruments | | Futures
contracts | |
| |
| Interest rate contracts | | $ | (700,415) | |
| | | | |
| Total | | $ | (700,415) | |
| | | | |
The table below summarizes the year ended average notional value of futures contracts and swap agreements during the period.
| | | | | | | | |
| | | Futures
contracts | | | Swap
contracts | |
| Average notional amount | | $ | 28,059,112 | | | $ | 5,236,910 | |
Note 6 – Expense Offset Arrangement
The expense offset arrangement is comprised of custodian credits which result from periodic overnight cash balances at the custodian. For the year ended December 31, 2019, the Fund received credits from this arrangement, which resulted in the reduction of the Fund’s total expenses of $1,041.
Note 7 – Trustee and Officer Fees and Benefits
Certain Trustees have executed Deferred Compensation Agreement(s) pursuant to which they have the option to elect to defer receipt of all or a portion of the annual compensation they are entitled to receive from the Fund. For purposes of determining the amount owed to the Trustees under the plan(s), deferred amounts are treated as though equal dollar amounts had been invested in shares of the Fund or in other Invesco and/or Invesco Oppenheimer funds selected by the Trustees. The Fund purchases shares of the funds selected for deferral by the Trustees in amounts equal to his or her deemed investment, resulting in a Fund asset equal to the deferred compensation liability. Such assets are included as a component of “Other” within the asset section of the Statement of Assets and Liabilities. Deferral of Trustees’ fees under the plan(s) will not affect the net assets of the Fund and will not materially affect the Fund’s assets, liabilities or net investment income per share. Amounts will be deferred until distributed in accordance with the Deferred Compensation Agreement(s).
31 INVESCO OPPENHEIMER V.I. CONSERVATIVE BALANCED FUND
NOTES TO FINANCIAL STATEMENTSContinued
Note 8 – Cash Balances
The Fund is permitted to temporarily carry a negative or overdrawn balance in its account with JPMorgan Chase Bank, the custodian bank. Such balances, if any at period-end, are shown in the Statement of Assets and Liabilities under the payable caption Amount due custodian. To compensate the custodian bank for such overdrafts, the overdrawn Fund may either (1) leave funds as a compensating balance in the account so the custodian bank can be compensated by earning the additional interest; or (2) compensate by paying the custodian bank at a rate agreed upon by the custodian bank and Invesco, not to exceed the contractually agreed upon rate.
Note 9 – Distributions to Shareholders and Tax Components of Net Assets
Tax Character of Distributions to Shareholders Paid During the Fiscal Years Ended December 31, 2019 and 2018:
| | | | | | | | |
| | | 2019 | | | 2018 | |
| |
| Ordinary income | | $ | 4,189,683 | | | $ | 3,901,246 | |
| Long-term capital gain | | | 3,054,992 | | | | 4,773,467 | |
| | | | |
| Total distributions | | $ | 7,244,675 | | | $ | 8,674,713 | |
| | | | |
Tax Components of Net Assets at Period-End:
| | | | |
| | | 2019 | |
| |
| Undistributed ordinary income | | $ | 6,159,167 | |
| Undistributed long-term capital gain | | | 1,893,195 | |
| Net unrealized appreciation - investments | | | 18,926,519 | |
| Temporary book/tax differences | | | (54,825) | |
| Shares of beneficial interest | | | 163,312,739 | |
| | | | |
| Total net assets | | $ | 190,236,795 | |
| | | | |
The difference between book-basis and tax-basis unrealized appreciation (depreciation) is due to differences in the timing of recognition of gains and losses on investments for tax and book purposes. The Fund’s net unrealized appreciation (depreciation) difference is attributable primarily to wash sales, future contracts and partnerships.
The temporary book/tax differences are a result of timing differences between book and tax recognition of income and/or expenses. The Fund’s temporary book/tax differences are the result of the trustee deferral of compensation and retirement plan benefits.
Capital loss carryforward is calculated and reported as of a specific date. Results of transactions and other activity after that date may affect the amount of capital loss carryforward actually available for the Fund to utilize. Capital losses generated in years beginning after December 22, 2010 can be carried forward for an unlimited period, whereas previous losses expire in eight tax years. Capital losses with an expiration period may not be used to offset capital gains until all net capital losses without an expiration date have been utilized. Capital loss carryforwards with no expiration date will retain their character as either short-term or long-term capital losses instead of as short-term capital losses as under prior law. The ability to utilize capital loss carryforwards in the future may be limited under the Internal Revenue Code and related regulations based on the results of future transactions.
The Fund does not have a capital loss carryforward as of December 31, 2019.
Note 10 – Investments Transactions
The aggregate amount of investment securities (other than short-term securities, U.S. Treasury obligations and money market funds, if any) purchased and sold by the Fund during the year ended December 31, 2019 was $95,659,422 and $130,323,785, respectively. During the same period, purchases and sales of U.S. Treasury obligations were $17,583,226 and $13,797,026, respectively. Cost of investments, including any derivatives, on a tax basis includes the adjustments for financial reporting purposes as of the most recently completed federal income tax reporting period-end.
| | | | |
| Unrealized Appreciation (Depreciation) of Investments on a Tax Basis | |
| Aggregate unrealized appreciation of investments | | $ | 22,277,455 | |
| Aggregate unrealized (depreciation) of investments | | | (3,350,936) | |
| | | | |
| Net unrealized appreciation of investments | | $ | 18,926,519 | |
| | | | |
Cost of investments for tax purposes is $172,320,404.
Note 11 – Reclassification of Permanent Differences
Primarily as a result of differing book/tax treatment of paydowns, on December 31, 2019 undistributed net investment income was increased by $75,251, undistributed net realized gain was decreased by $75,109, and shares of beneficial interest was decreased by $142. This reclassification had no effect on the net assets of the Fund.
32 INVESCO OPPENHEIMER V.I. CONSERVATIVE BALANCED FUND
Note 12 – Share Information
Transactions in shares of beneficial interest were as follows:
| | | | | | | | | | | | | | | | |
| | | Year Ended December 31, 20191 | | Year Ended December 31, 2018 | |
| | | | |
| | | Shares | | Amount | | | Shares | | | Amount |
| | |
| Series I Shares | | | | | | | | | | | | | | | | |
| Sold | | | 137,278 | | | $ | 2,146,719 | | | | 165,620 | | | $ | 2,527,555 | |
| Dividends and/or distributions reinvested | | | 362,933 | | | | 5,596,424 | | | | 439,719 | | | | 6,688,120 | |
| Redeemed | | | (1,371,558 | ) | | | (21,494,736 | ) | | | (1,310,778 | ) | | | (20,206,226) | |
| | | | |
| Net increase (decrease) | | | (871,347 | ) | | $ | (13,751,593 | ) | | | (705,439 | ) | | $ | (10,990,551) | |
| | | | |
|
| | |
| Series II Shares | | | | | | | | | | | | | | | | |
| Sold | | | 190,204 | | | $ | 2,932,620 | | | | 158,863 | | | $ | 2,411,795 | |
| Dividends and/or distributions reinvested | | | 108,224 | | | | 1,648,251 | | | | 132,175 | | | | 1,986,593 | |
| Redeemed | | | (470,960 | ) | | | (7,254,601 | ) | | | (554,938 | ) | | | (8,421,142) | |
| | | | |
| Net increase (decrease) | | | (172,532 | ) | | $ | (2,673,730 | ) | | | (263,900 | ) | | $ | (4,022,754) | |
| | | | |
1. There are entities that are record owners of more than 5% of the outstanding shares of the Fund and own 72% of the outstanding shares of the Fund. IDI has an agreement with these entities to sell Fund shares. The Fund, Invesco and/or Invesco affiliates may make payments to these entities, which are considered to be related to the Fund, for providing services to the Fund, Invesco and/or Invesco affiliates, including but not limited to services such as securities brokerage, distribution, third party record keeping and account servicing. The Fund has no knowledge as to whether all or any portion of the shares owned of record by these entities are also owned beneficially.
Note 13 – Borrowings
Joint Credit Facility.A number of mutual funds managed by the Adviser participate in a $1.95 billion revolving credit facility (the “Facility”) intended to provide short-term financing, if necessary, subject to certain restrictions in connection with atypical redemption activity. Expenses and fees related to the Facility are paid by the participating funds and are disclosed separately or as other expenses on the Statement of Operations. The Fund did not utilize the Facility during the reporting period.The Facility terminated May 24, 2019.
33 INVESCO OPPENHEIMER V.I. CONSERVATIVE BALANCED FUND
REPORT OF INDEPENDENT REGISTERED PUBLIC ACCOUNTING FIRM
To the Board of Trustees of AIM Variable Insurance Funds (Invesco Variable Insurance Funds) and Shareholders of Invesco Oppenheimer V.I. Conservative Balanced Fund
Opinion on the Financial Statements
We have audited the accompanying statement of assets and liabilities, including the schedule of investments, of Invesco Oppenheimer V.I. Conservative Balanced Fund (one of the funds constituting AIM Variable Insurance Funds (Invesco Variable Insurance Funds), referred to hereafter as the “Fund”) as of December 31, 2019, the related statements of operations and of changes in net assets for the year ended December 31, 2019, including the related notes, and the financial highlights for the period ended December 31, 2019 (collectively referred to as the “financial statements”). In our opinion, the financial statements present fairly, in all material respects, the financial position of the Fund as of December 31, 2019, the results of its operations and changes in its net assets for the year ended December 31, 2019 and the financial highlights for the period ended December 31, 2019 in conformity with accounting principles generally accepted in the United States of America.
The financial statements of Invesco Oppenheimer V.I. Conservative Balanced Fund (formerly known as Oppenheimer Conservative Balanced Fund/VA) as of and for the year ended December 31, 2018 and the financial highlights for each of the periods ended on or prior to December 31, 2018 (not presented herein, other than the statement of changes in net assets and the financial highlights) were audited by other auditors whose report dated February 14, 2019 expressed an unqualified opinion on those financial statements and financial highlights.
Basis for Opinion
These financial statements are the responsibility of the Fund’s management. Our responsibility is to express an opinion on the Fund’s financial statements based on our audit. We are a public accounting firm registered with the Public Company Accounting Oversight Board (United States) (PCAOB) and are required to be independent with respect to the Fund in accordance with the U.S. federal securities laws and the applicable rules and regulations of the Securities and Exchange Commission and the PCAOB.
We conducted our audit of these financial statements in accordance with the standards of the PCAOB. Those standards require that we plan and perform the audit to obtain reasonable assurance about whether the financial statements are free of material misstatement, whether due to error or fraud.
Our audit included performing procedures to assess the risks of material misstatement of the financial statements, whether due to error or fraud, and performing procedures that respond to those risks. Such procedures included examining, on a test basis, evidence regarding the amounts and disclosures in the financial statements. Our audit also included evaluating the accounting principles used and significant estimates made by management, as well as evaluating the overall presentation of the financial statements. Our procedures included confirmation of securities owned as of December 31, 2019 by correspondence with the custodian and brokers; when replies were not received from brokers, we performed other auditing procedures. We believe that our audit provides a reasonable basis for our opinion.
/s/ PricewaterhouseCoopers LLP
Houston, Texas
February 18, 2020
We have served as the auditor of one or more of the investment companies in the Invesco group of investment companies since at least 1995.We have not been able to determine the specific year we began serving as auditor.
34 INVESCO OPPENHEIMER V.I. CONSERVATIVE BALANCED FUND
TAX INFORMATION
Form 1099-DIV, Form 1042-S and other year–end tax information provide shareholders with actual calendar year amounts that should be included in their tax returns. Shareholders should consult their tax advisers.
The following distribution information is being provided as required by the Internal Revenue Code or to meet a specific state’s requirement.
The Fund designates the following amounts or, if subsequently determined to be different, the maximum amount allowable for its fiscal year ended December 31, 2019:
Federal and State Income Tax
| | | | |
| |
| Long-Term Capital Gain Distributions | | $ | 3,054,992 | |
| Qualified Dividend Income* | | | 0.41 | % |
| Corporate Dividends Received Deduction* | | | 22.37 | % |
| U.S. Treasury Obligations* | | | 0.40 | % |
* The above percentages are based on ordinary income dividends paid to shareholders during the Fund’s fiscal year.
35 INVESCO OPPENHEIMER V.I. CONSERVATIVE BALANCED FUND
PORTFOLIO PROXY VOTING POLICIES AND GUIDELINES; UPDATES TO SCHEDULE OF INVESTMENTS
Go paperless with eDelivery
Visit invesco.com/edelivery to enjoy the convenience and security of anytime electronic access to your investment documents.
With eDelivery, you can elect to have any or all of the following materials delivered straight to your inbox to download, save and print from your own computer:
| · | | Fund reports and prospectuses |
Invesco mailing information
Send general correspondence to Invesco Investment Services, Inc., P.O. Box 219078, Kansas City, MO 64121-9078.
Important notice regarding delivery of security holder documents
To reduce Fund expenses, only one copy of most shareholder documents may be mailed to shareholders with multiple accounts at the same address (Householding). Mailing of your shareholder documents may be householded indefinitely unless you instruct us otherwise. If you do not want the mailing of these documents to be combined with those for other members of your household, please contact Invesco Investment Services, Inc. at 800 959 4246 or contact your financial institution. We will begin sending you individual copies for each account within 30 days after receiving your request.
Fund holdings and proxy voting information
The Fund provides a complete list of its holdings four times in each fiscal year, at the quarter ends. For the second and fourth quarters, the lists appear in the Fund’s semiannual and annual reports to shareholders. For the first and third quarters, the Fund files the lists with the Securities and Exchange Commission (SEC) as an exhibit to its reports on Form N-PORT. The most recent list of portfolio holdings is available at invesco.com/completeqtrholdings. Shareholders can also look up the Fund’s Forms N-PORT on the SEC website at sec.gov.
A description of the policies and procedures that the Fund uses to determine how to vote proxies relating to portfolio securities is available without charge, upon request, from our Client Services department at 800 959 4246 or at invesco.com/proxyguidelines. The information is also available on the SEC website, sec.gov.
Information regarding how the Fund voted proxies related to its portfolio securities during the most recent 12-month period ended June 30 is available at invesco. com/proxysearch. The information is also available on the SEC website, sec.gov.
Invesco Advisers, Inc. is an investment adviser; it provides investment advisory services to individual and institutional clients and does not sell securities. Invesco Distributors, Inc. is the US distributor for Invesco Ltd.’s retail mutual funds, exchange-traded funds and institutional money market funds. Both are wholly owned, indirect subsidiaries of Invesco Ltd.
36 INVESCO OPPENHEIMER V.I. CONSERVATIVE BALANCED FUND
TRUSTEES AND OFFICERS
The address of each trustee and officer is AIM Variable Insurance Funds (Invesco Variable Insurance Funds) (the “Trust”), 11 Greenway Plaza, Suite 1000, Houston, Texas 77046-1173. The trustees serve for the life of the Trust, subject to their earlier death, incapacitation, resignation, retirement or removal as more specifically provided in the Trust’s organizational documents. Each officer serves for a one year term or until their successors are elected and qualified. Column two below includes length of time served with predecessor entities, if any.
| | | | | | | | |
Name, Year of Birth and Position(s) Held with the Trust | | Trustee and/or Officer Since | | Principal Occupation(s) During Past 5 Years | | Number of Funds in Fund Complex Overseen by Trustee | | Other Directorship(s) Held by Trustee During Past 5 Years |
INTERESTED TRUSTEE | | | | | | | | |
| | | | | |
Martin L. Flanagan1 — 1960 Trustee and Vice Chair | | 2007 | | Executive Director, Chief Executive Officer and President, Invesco Ltd. (ultimate parent of Invesco and a global investment management firm); Trustee and Vice Chair, The Invesco Funds; Vice Chair, Investment Company Institute; and Member of Executive Board, SMU Cox School of Business | | 229 | | None |
| | | | | |
| | | | | Formerly: Advisor to the Board, Invesco Advisers, Inc. (formerly known as Invesco Institutional (N.A.), Inc.); Chairman and Chief Executive Officer, Invesco Advisers, Inc. (registered investment adviser); Director, Chairman, Chief Executive Officer and President, Invesco Holding Company (US), Inc. (formerly IVZ Inc.) (holding company), Invesco Group Services, Inc. (service provider) and Invesco North American Holdings, Inc. (holding company); Director, Chief Executive Officer and President, Invesco Holding Company Limited (parent of Invesco and a global investment management firm); Director, Invesco Ltd.; Chairman, Investment Company Institute and President, Co-Chief Executive Officer, Co-President, Chief Operating Officer and Chief Financial Officer, Franklin Resources, Inc. (global investment management organization) | | | | |
| |
| 1 Mr. Flanagan is considered an interested person (within the meaning of Section 2(a)(19) of the 1940 Act) of the Trust because he is an officer of the Adviser to the Trust, and an officer and a director of Invesco Ltd., ultimate parent of the Adviser. |
37 INVESCO OPPENHEIMER V.I. CONSERVATIVE BALANCED FUND
TRUSTEES AND OFFICERSContinued
| | | | | | | | |
Name, Year of Birth and Position(s) Held with the Trust | | Trustee and/or Officer Since | | Principal Occupation(s) During Past 5 Years | | Number of Funds in Fund Complex Overseen by Trustee | | Other Directorship(s) Held by Trustee During Past 5 Years |
| | | | | |
| INDEPENDENT TRUSTEES | | | | | | | | |
Bruce L. Crockett – 1944 Trustee and Chair | | 2003 | | Chairman, Crockett Technologies Associates (technology consulting company) Formerly: Director, Captaris (unified messaging provider); Director, President and Chief Executive Officer, COMSAT Corporation; Chairman, Board of Governors of INTELSAT (international communications company); ACE Limited (insurance company); Independent Directors Council and Investment Company Institute: Member of the Audit Committee, Investment Company Institute; Member of the Executive Committee and Chair of the Governance Committee, Independent Directors Council | | 229 | | Director and Chairman of the Audit Committee, ALPS (Attorneys Liability Protection Society) (insurance company); Director and Member of the Audit Committee and Compensation Committee, Ferroglobe PLC (metallurgical company) |
| | | | | |
David C. Arch – 1945 Trustee | | 2010 | | Chairman of Blistex Inc. (consumer health care products manufacturer); Member, World Presidents’ Organization | | 229 | | Board member of the Illinois Manufacturers’ Association |
| | | | | |
Beth Ann Brown – 1968 Trustee | | 2019 | | Independent Consultant Formerly: Head of Intermediary Distribution, Managing Director, Strategic Relations, Managing Director, Head of National Accounts, Senior Vice President, National Account Manager and Senior Vice President, Key Account Manager, Columbia Management Investment Advisers LLC; Vice President, Key Account Manager, Liberty Funds Distributor, Inc.; and Trustee of certain Oppenheimer Funds | | 229 | | Director, Board of Directors of Caron Engineering Inc.; Advisor, Board of Advisors of Caron Engineering Inc.; President and Director, of Acton Shapleigh Youth Conservation Corps (non-profit); and Vice President and Director of Grahamtastic Connection (non-profit) |
| | | | | |
Jack M. Fields – 1952 Trustee | | 2003 | | Chief Executive Officer, Twenty First Century Group, Inc. (government affairs company); and Chairman, Discovery Learning Alliance (non-profit) Formerly: Owner and Chief Executive Officer, Dos Angeles Ranch L.P. (cattle, hunting, corporate entertainment); Director, Insperity, Inc. (formerly known as Administaff) (human resources provider); Chief Executive Officer, Texana Timber LP (sustainable forestry company); Director of Cross Timbers Quail Research Ranch (non-profit); and member of the U.S. House of Representatives | | 229 | | None |
| | | | | |
Cynthia Hostetler —1962 Trustee | | 2017 | | Non-Executive Director and Trustee of a number of public and private business corporations Formerly: Director, Aberdeen Investment Funds (4 portfolios); Head of Investment Funds and Private Equity, Overseas Private Investment Corporation; President, First Manhattan Bancorporation, Inc.; Attorney, Simpson Thacher & Bartlett LLP | | 229 | | Vulcan Materials Company (construction materials company); Trilinc Global Impact Fund; Genesee & Wyoming, Inc. (railroads); Artio Global Investment LLC (mutual fund complex); Edgen Group, Inc. (specialized energy and infrastructure products distributor); Investment Company Institute (professional organization); Independent Directors Council (professional organization) |
| | | | | |
Eli Jones – 1961 Trustee | | 2016 | | Professor and Dean, Mays Business School - Texas A&M University Formerly: Professor and Dean, Walton College of Business, University of Arkansas and E.J. Ourso College of Business, Louisiana State University; Director, Arvest Bank | | 229 | | Insperity, Inc. (formerly known as Administaff) (human resources provider) |
| | | | | |
Elizabeth Krentzman – 1959 Trustee | | 2019 | | Formerly: Principal and Chief Regulatory Advisor for Asset Management Services and U.S. Mutual Fund Leader of Deloitte & Touche LLP; General Counsel of the Investment Company Institute (trade association); National Director of the Investment Management Regulatory Consulting Practice, Principal, Director and Senior Manager of Deloitte & Touche LLP; Assistant Director of the Division of Investment Management - Office of Disclosure and Investment Adviser Regulation of the U.S. Securities and Exchange Commission and various positions with the Division of Investment Management – Office of Regulatory Policy of the U.S. Securities and Exchange Commission; Associate at Ropes & Gray LLP.; Advisory Board Member of the Securities and Exchange Commission Historical Society; and Trustee of certain Oppenheimer Funds | | 229 | | Trustee of the University of Florida National Board Foundation and Audit Committee Member; Member of the Cartica Funds Board of Directors (private investment funds); Member of the University of Florida Law Center Association, Inc. Board of Trustees and Audit Committee Member |
| | | | | |
Anthony J. LaCava, Jr. – 1956 Trustee | | 2019 | | Formerly: Director and Member of the Audit Committee, Blue Hills Bank (publicly traded financial institution) and Managing Partner, KPMG LLP | | 229* | | Blue Hills Bank; Chairman of Bentley University; Member, Business School Advisory Council; and Nominating Committee, KPMG LLP |
38 INVESCO OPPENHEIMER V.I. CONSERVATIVE BALANCED FUND
| | | | | | | | |
Name, Year of Birth and Position(s) Held with the Trust | | Trustee and/or Officer Since | | Principal Occupation(s) During Past 5 Years | | Number of Funds in Fund Complex Overseen by Trustee | | Other Directorship(s) Held by Trustee During Past 5 Years |
| | | | | |
| INDEPENDENT TRUSTEES (CONTINUED) | | | | | | | | |
| | | | | |
Prema Mathai-Davis – 1950 Trustee | | 2003 | | Retired Co-Owner & Partner of Quantalytics Research, LLC, (a FinTech Investment Research Platform for the Self-Directed Investor) | | 229 | | None |
| | | | | |
Joel W. Motley – 1952 Trustee | | 2019 | | Director of Office of Finance, Federal Home Loan Bank; Member of the Vestry of Trinity Wall Street; Managing Director of Carmona Motley Hoffman, Inc. (privately held financial advisor); Member of the Finance and Budget Committee of the Council on Foreign Relations, Member of the Investment Committee and Board of Human Rights Watch and Member of the Investment Committee and Board of Historic Hudson Valley (non-profit cultural organization). Formerly: Managing Director of Public Capital Advisors, LLC (privately held financial advisor); Managing Director of Carmona Motley Hoffman, Inc. (privately held financial advisor); Trustee of certain Oppenheimer Funds; and Director of Columbia Equity Financial Corp. (privately held financial advisor) | | 229 | | Director of Greenwall Foundation (bioethics research foundation); Member of Board and Investment Committee of The Greenwall Foundation; Director of Southern Africa Legal Services Foundation; Board Member and Investment Committee Member of Pulitzer Center for Crisis Reporting (non-profit journalism) |
| | | | | |
Teresa M. Ressel — 1962 Trustee | | 2017 | | Non-executive director and trustee of a number of public and private business corporations Formerly: Chief Financial Officer, Olayan America, The Olayan Group (international investor/commercial/industrial); Chief Executive Officer, UBS Securities LLC; Group Chief Operating Officer, Americas, UBS AG; Assistant Secretary for Management & Budget and CFO, US Department of the Treasury | | 229 | | Atlantic Power Corporation (power generation company); ON Semiconductor Corp. (semiconductor supplier) |
| | | | | |
Ann Barnett Stern – 1957 Trustee | | 2017 | | President and Chief Executive Officer, Houston Endowment Inc. (private philanthropic institution) Formerly: Executive Vice President and General Counsel, Texas Children’s Hospital; Attorney, Beck, Redden and Secrest, LLP; Business Law Instructor, University of St. Thomas; Attorney, Andrews & Kurth LLP | | 229 | | Federal Reserve Bank of Dallas |
| | | | | |
Robert C. Troccoli – 1949 Trustee | | 2016 | | Retired Formerly: Adjunct Professor, University of Denver – Daniels College of Business, Senior Partner, KPMG LLP | | 229 | | None |
| | | | | |
Daniel S. Vandivort –1954 Trustee | | 2019 | | Treasurer, Chairman of the Audit and Finance Committee, and Trustee, Board of Trustees, Huntington Disease Foundation of America; and President, Flyway Advisory Services LLC (consulting and property management). Formerly: Trustee and Governance Chair, of certain Oppenheimer Funds | | 229 | | Chairman and Lead Independent Director, Chairman of the Audit Committee, and Director, Board of Directors, Value Line Funds |
| | | | | |
James D. Vaughn – 1945 Trustee | | 2019 | | Retired Formerly: Managing Partner, Deloitte & Touche LLP; Trustee and Chairman of the Audit Committee, Schroder Funds; Board Member, Mile High United Way, Boys and Girls Clubs, Boy Scouts, Colorado Business Committee for the Arts, Economic Club of Colorado and Metro Denver Network (economic development corporation); and Trustee of certain Oppenheimer Funds | | 229 | | Board member and Chairman of Audit Committee of AMG National Trust Bank; Trustee and Investment Committee member, University of South Dakota Foundation; Board member, Audit Committee Member and past Board Chair, Junior Achievement (non-profit) |
| | | | | |
Christopher L. Wilson – 1957 Trustee, Vice Chair and Chair Designate | | 2017 | | Retired Formerly: Director, TD Asset Management USA Inc. (mutual fund complex) (22 portfolios); Managing Partner, CT2, LLC (investing and consulting firm); President/ Chief Executive Officer, Columbia Funds, Bank of America Corporation; President/ Chief Executive Officer, CDC IXIS Asset Management Services, Inc.; Principal & Director of Operations, Scudder Funds, Scudder, Stevens & Clark, Inc.; Assistant Vice President, Fidelity Investments | | 229 | | ISO New England, Inc. (non- profit organization managing regional electricity market) |
39 INVESCO OPPENHEIMER V.I. CONSERVATIVE BALANCED FUND
TRUSTEES AND OFFICERSContinued
| | | | | | | | |
Name, Year of Birth and Position(s) Held with the Trust | | Trustee and/or Officer Since | | Principal Occupation(s) During Past 5 Years | | Number of Funds in Fund Complex Overseen by Trustee | | Other Directorship(s) Held by Trustee During Past 5 Years |
OTHER OFFICERS | | | | | | | | |
Sheri Morris — 1964 President, Principal Executive Officer and Treasurer | | 2003 | | Head of Global Fund Services, Invesco Ltd.; President, Principal Executive Officer and Treasurer, The Invesco Funds; Vice President, Invesco Advisers, Inc. (formerly known as Invesco Institutional (N.A.), Inc.) (registered investment adviser); and Vice President, Invesco Exchange-Traded Fund Trust, Invesco Exchange- Traded Fund Trust II, Invesco India Exchange-Traded Fund Trust, Invesco Actively Managed Exchange-Traded Fund Trust, Invesco Actively Managed Exchange- Traded Commodity Fund Trust and Invesco Exchange-Traded Self-Indexed Fund Trust, and Vice President, OppenheimerFunds, Inc. Formerly: Vice President and Principal Financial Officer, The Invesco Funds; Vice President, Invesco AIM Advisers, Inc., Invesco AIM Capital Management, Inc. and Invesco AIM Private Asset Management, Inc.; Assistant Vice President and Assistant Treasurer, The Invesco Funds and Assistant Vice President, Invesco Advisers, Inc., Invesco AIM Capital Management, Inc. and Invesco AIM Private Asset Management, Inc.; and Treasurer, Invesco Exchange-Traded Fund Trust, Invesco Exchange-Traded Fund Trust II, Invesco India Exchange-Traded Fund Trust and Invesco Actively Managed Exchange-Traded Fund Trust | | N/A | | N/A |
| | | | | |
Russell C. Burk — 1958 Senior Vice President and Senior Officer | | 2005 | | Senior Vice President and Senior Officer, The Invesco Funds | | N/A | | N/A |
| | | | | |
Jeffrey H. Kupor – 1968 Senior Vice President, Chief Legal Officer and Secretary | | 2018 | | Head of Legal of the Americas, Invesco Ltd.; Senior Vice President and Secretary, Invesco Advisers, Inc. (formerly known as Invesco Institutional (N.A.), Inc.) (registered investment adviser); Senior Vice President and Secretary, Invesco Distributors, Inc. (formerly known as Invesco AIM Distributors, Inc.); Vice President and Secretary, Invesco Investment Services, Inc. (formerly known as Invesco AIM Investment Services, Inc.) Senior Vice President, Chief Legal Officer and Secretary, The Invesco Funds; Secretary and General Counsel, Invesco Investment Advisers LLC (formerly known as Van Kampen Asset Management); Secretary and General Counsel, Invesco Capital Markets, Inc. (formerly known as Van Kampen Funds Inc.) and Chief Legal Officer, Invesco Exchange-Traded Fund Trust, Invesco Exchange-Traded Fund Trust II, Invesco India Exchange-Traded Fund Trust, Invesco Actively Managed Exchange-Traded Fund Trust, Invesco Actively Managed Exchange-Traded Commodity Fund Trust and Invesco Exchange-Traded Self-Indexed Fund Trust; Secretary, Invesco Indexing LLC; Secretary, W.L. Ross & Co., LLC | | N/A | | N/A |
| | | | | |
| | | | | Formerly: Secretary and Vice President, Jemstep, Inc.; Head of Legal, Worldwide Institutional, Invesco Ltd.; Secretary and General Counsel, INVESCO Private Capital Investments, Inc.; Senior Vice President, Secretary and General Counsel, Invesco Management Group, Inc. (formerly known as Invesco AIM Management Group, Inc.); Assistant Secretary, INVESCO Asset Management (Bermuda) Ltd.; Secretary and General Counsel, Invesco Private Capital, Inc.; Assistant Secretary and General Counsel, INVESCO Realty, Inc.; Secretary and General Counsel, Invesco Senior Secured Management, Inc.; and Secretary, Sovereign G./P. Holdings Inc. | | | | |
| | | | | |
Andrew R. Schlossberg – 1974 Senior Vice President | | 2019 | | Head of the Americas and Senior Managing Director, Invesco Ltd.; Director and Senior Vice President, Invesco Advisers, Inc. (formerly known as Invesco Institutional (N.A.), Inc.) (registered investment adviser); Director and Chairman, Invesco Investment Services, Inc. (formerly known as Invesco AIM Investment Services, Inc.) (registered transfer agent); Senior Vice President, The Invesco Funds; Director, Invesco Investment Advisers LLC (formerly known as Van Kampen Asset Management); Director, President and Chairman, Invesco Insurance Agency, Inc. Formerly: Director, Invesco UK Limited; Director and Chief Executive, Invesco Asset Management Limited and Invesco Fund Managers Limited; Assistant Vice President, The Invesco Funds; Senior Vice President, Invesco Advisers, Inc. (formerly known as Invesco Institutional (N.A.), Inc.) (registered investment adviser); Director and Chief Executive, Invesco Administration Services Limited and Invesco Global Investment Funds Limited; Director, Invesco Distributors, Inc.; Head of EMEA, Invesco Ltd.; President, Invesco Actively Managed Exchange- Traded Commodity Fund Trust, Invesco Actively Managed Exchange-Traded Fund Trust, Invesco Exchange-Traded Fund Trust, Invesco Exchange-Traded Fund Trust II and Invesco India Exchange-Traded Fund Trust; Managing Director and Principal Executive Officer, Invesco Capital Management LLC | | N/A | | N/A |
40 INVESCO OPPENHEIMER V.I. CONSERVATIVE BALANCED FUND
| | | | | | | | |
Name, Year of Birth and Position(s) Held with the Trust | | Trustee and/or
Officer Since | | Principal Occupation(s) During Past 5 Years | | Number of Funds in Fund Complex
Overseen by Trustee | | Other Directorship(s)
Held by Trustee During Past 5
Years |
OTHER OFFICERS (CONTINUED) | | | | | | | | |
John M. Zerr — 1962 Senior Vice President | | 2006 | | Chief Operating Officer of the Americas; Senior Vice President, Invesco Advisers, Inc. (formerly known as Invesco Institutional (N.A.), Inc.) (registered investment adviser); Senior Vice President, Invesco Distributors, Inc. (formerly known as Invesco AIM Distributors, Inc.); Director and Vice President, Invesco Investment Services, Inc. (formerly known as Invesco AIM Investment Services, Inc.) Senior Vice President, The Invesco Funds; Managing Director, Invesco Capital Management LLC; Director, Invesco Investment Advisers LLC (formerly known as Van Kampen Asset Management); Senior Vice President, Invesco Capital Markets, Inc. (formerly known as Van Kampen Funds Inc.); Manager, Invesco Indexing LLC; Manager, Invesco Specialized Products, LLC; Director and Senior Vice President, Invesco Insurance Agency, Inc.; Member, Invesco Canada Funds Advisory Board; Director, President and Chief Executive Officer, Invesco Corporate Class Inc. (corporate mutual fund company); and Director, Chairman, President and Chief Executive Officer, Invesco Canada Ltd. (formerly known as Invesco Trimark Ltd./ Invesco Trimark Ltèe) (registered investment adviser and registered transfer agent) | | N/A | | N/A |
| | | | | |
| | | | | Formerly: Director and Senior Vice President, Invesco Management Group, Inc. (formerly known as Invesco AIM Management Group, Inc.); Secretary and General Counsel, Invesco Management Group, Inc. (formerly known as Invesco AIM Management Group, Inc.); Secretary, Invesco Investment Services, Inc. (formerly known as Invesco AIM Investment Services, Inc.); Chief Legal Officer and Secretary, The Invesco Funds; Secretary and General Counsel, Invesco Investment Advisers LLC (formerly known as Van Kampen Asset Management); Secretary and General Counsel, Invesco Capital Markets, Inc. (formerly known as Van Kampen Funds Inc.); Chief Legal Officer, Invesco Exchange-Traded Fund Trust, Invesco Exchange-Traded Fund Trust II, Invesco India Exchange-Traded Fund Trust, Invesco Actively Managed Exchange-Traded Fund Trust, Invesco Actively Managed Exchange-Traded Commodity Fund Trust and Invesco Exchange-Traded Self-Indexed Fund Trust; Secretary, Invesco Indexing LLC; Director, Secretary, General Counsel and Senior Vice President, Van Kampen Exchange Corp.; Director, Vice President and Secretary, IVZ Distributors, Inc. (formerly known as INVESCO Distributors, Inc.); | | | | |
| | | | | Director and Vice President, INVESCO Funds Group, Inc.; Director and Vice President, Van Kampen Advisors Inc.; Director, Vice President, Secretary and General Counsel, Van Kampen Investor Services Inc.; Director and Secretary, Invesco Distributors, Inc. (formerly known as Invesco AIM Distributors, Inc.); Director, Senior Vice President, General Counsel and Secretary, Invesco AIM Advisers, Inc. and Van Kampen Investments Inc.; Director, Vice President and Secretary, Fund Management Company; Director, Senior Vice President, Secretary, General Counsel and Vice President, Invesco AIM Capital Management, Inc.; Chief Operating Officer and General Counsel, Liberty Ridge Capital, Inc. (an investment adviser) | | | | |
Gregory G. McGreevey - 1962 Senior Vice President | | 2012 | | Senior Managing Director, Invesco Ltd.; Director, Chairman, President, and Chief Executive Officer, Invesco Advisers, Inc. (formerly known as Invesco Institutional (N.A.), Inc.) (registered investment adviser); Director, Invesco Mortgage Capital, Inc. and Invesco Senior Secured Management, Inc.; and Senior Vice President, The Invesco Funds; and President, SNW Asset Management Corporation | | N/A | | N/A |
| | | | | |
| | | | | Formerly: Senior Vice President, Invesco Management Group, Inc. and Invesco Advisers, Inc.; Assistant Vice President, The Invesco Funds | | | | |
Kelli Gallegos – 1970 Vice President, Principal Financial Officer and Assistant Treasurer | | 2008 | | Principal Financial and Accounting Officer – Investments Pool, Invesco Specialized Products, LLC; Vice President, Principal Financial Officer and Assistant Treasurer, The Invesco Funds; Principal Financial and Accounting Officer – Pooled Investments, Invesco Capital Management LLC; Vice President and Treasurer, Invesco Exchange-Traded Fund Trust, Invesco Exchange-Traded Fund Trust II, Invesco India Exchange-Traded Fund Trust, Invesco Actively Managed Exchange- Traded Fund Trust, Invesco Actively Managed Exchange-Traded Commodity Fund Trust and Invesco Exchange-Traded Self-Indexed Fund Trust | | N/A | | N/A |
| | | | | |
| | | | | Formerly: Assistant Treasurer, Invesco Specialized Products, LLC; Assistant Treasurer, Invesco Exchange-Traded Fund Trust, Invesco Exchange-Traded Fund Trust II, Invesco India Exchange-Traded Fund Trust, Invesco Actively Managed Exchange-Traded Fund Trust, Invesco Actively Managed Exchange-Traded Commodity Fund Trust and Invesco Exchange-Traded Self-Indexed Fund Trust; Assistant Treasurer, Invesco Capital Management LLC; Assistant Vice President, The Invesco Funds | | | | |
41 INVESCO OPPENHEIMER V.I. CONSERVATIVE BALANCED FUND
TRUSTEES AND OFFICERSContinued
| | | | | | | | |
Name, Year of Birth and Position(s) Held with the Trust | | Trustee and/or
Officer Since | | Principal Occupation(s) During Past 5 Years | | Number of Funds in Fund Complex
Overseen by Trustee | | Other Directorship(s) Held by Trustee During Past 5
Years |
OTHER OFFICERS (CONTINUED) | | | | | | | | |
Crissie M. Wisdom – 1969 Anti-Money Laundering Compliance Officer | | 2013 | | Anti-Money Laundering Compliance Officer, Invesco Advisers, Inc. (formerly known as Invesco Institutional (N.A.), Inc.) (registered investment adviser), Invesco Capital Markets, Inc. (formerly known as Van Kampen Funds Inc.), Invesco Distributors, Inc., Invesco Investment Services, Inc., The Invesco Funds, and Invesco Exchange-Traded Fund Trust, Invesco Exchange-Traded Fund Trust II, Invesco India Exchange-Traded Fund Trust, Invesco Actively Managed Exchange-Traded Fund Trust, Invesco Actively Managed Exchange-Traded Commodity Fund Trust and Invesco Exchange-Traded Self-Indexed Fund Trust; Anti-Money Laundering Compliance Officer and Bank Secrecy Act Officer, INVESCO National Trust Company and Invesco Trust Company; and Fraud Prevention Manager and Controls and Risk Analysis Manager for Invesco Investment Services, Inc. | | N/A | | N/A |
| | | | | |
| | | | | Formerly: Anti-Money Laundering Compliance Officer, Van Kampen Exchange Corp. and Invesco Management Group, Inc. | | | | |
Robert R. Leveille – 1969 Chief Compliance Officer | | 2016 | | Chief Compliance Officer, Invesco Advisers, Inc. (registered investment adviser); and Chief Compliance Officer, The Invesco Funds | | N/A | | N/A |
| | | | | |
| | | | | Formerly: Chief Compliance Officer, Putnam Investments and the Putnam Funds | | | | |
The Statement of Additional Information of the Trust includes additional information about the Fund’s Trustees and is available upon request, without charge, by calling 1.800.959.4246. Please refer to the Fund’s Statement of Additional Information for information on the Fund’s sub-advisers.
| | | | | | |
| Office of the Fund | | Investment Adviser | | Distributor | | Auditors |
11 Greenway Plaza, Suite 1000 Houston, TX 77046-1173 | | Invesco Advisers, Inc. 1555 Peachtree Street, N.E. Atlanta, GA 30309 | | Invesco Distributors, Inc. 11 Greenway Plaza, Suite 1000 Houston, TX 77046-1173 | | PricewaterhouseCoopers
LLP 1000 Louisiana Street,
Suite 5800 Houston, TX 77002-5021 |
| Counsel to the Fund | | Counsel to the | | Transfer Agent | | Custodian |
Stradley Ronon Stevens & Young, LLP 2005 Market Street, Suite 2600 Philadelphia, PA 19103-7018 | | Independent Trustees Goodwin Procter LLP 901 New York Avenue, N.W. Washington, D.C. 20001 | | Invesco Investment Services, Inc. 11 Greenway Plaza, Suite 1000 Houston, TX 77046-1173 | | JPMorgan Chase Bank
4 Chase Metro Tech
Center Brooklyn, NY 11245 |
42 INVESCO OPPENHEIMER V.I. CONSERVATIVE BALANCED FUND
THIS PAGE INTENTIONALLY LEFT BLANK.

| | | | |

| | Annual Report | | 12/31/2019 |
| | |
| | | | |
| | | | |
| | | | |
| | | | |
| | | | |
| | |
| | Invesco Oppenheimer V.I. Discovery Mid Cap Growth Fund* Beginning on January 1, 2021, as permitted by regulations adopted by the Securities and Exchange Commission, the insurance company that offers your variable annuity or variable life insurance contract may no longer send you paper copies of the Fund’s shareholder reports by mail, unless you specifically request paper copies of the reports from the insurance company or your financial intermediary. Instead of delivering paper copies of the report, the insurance company may choose to make the reports available on a website, and will notify you by mail each time a report is posted and provide you with a website link to access the report. Instructions for requesting paper copies will be provided by your insurance company. If the insurance company offers electronic delivery, you may elect to receive shareholder reports and other communications about the Fund electronically by following the instructions provided by the insurance company or by contacting your financial intermediary. If you already elected to receive shareholder reports electronically, you will not be affected by this change and you need not take any action. You may elect to receive all future reports in paper free of charge from the insurance company. You can inform the insurance company or your financial intermediary that you wish to continue receiving paper copies of your shareholder reports by following the instructions provided by the insurance company or by contacting your financial intermediary. Your election to receive reports in paper will apply to all portfolio companies available under your contract with the insurance company. The Fund provides a complete list of its holdings four times in each fiscal year, at the quarter ends. For the second and fourth quarters, the lists appear in the Fund’s semi annual and annual reports to shareholders. For the first and third quarters, the Fund files the lists with the Securities and Exchange Commission (SEC) as an exhibit to its reports on Form N-PORT. The Fund’s Form N-PORT filings are available on the SEC website, sec.gov. The Fund’s most recent portfolio holdings, as filed on Form N-PORT, have also been made available to insurance companies issuing variable annuity contracts and variable life insurance policies (“variable products”) that invest in the Fund. A description of the policies and procedures that the Fund uses to determine how to vote proxies relating to portfolio securities is available without charge, upon request, from our Client Services department at 800 959 4246 or at invesco.com/proxyguidelines. The information is also available on the SEC website, sec.gov. Information regarding how the Fund voted proxies related to its portfolio securities during the most recent 12-month period ended June 30 is available at invesco.com/proxysearch. The information is also available on the SEC website, sec.gov. Invesco Advisers, Inc. is an investment adviser; it provides investment advisory services to individual and institutional clients and does not sell securities. Invesco Distributors, Inc. is the US distributor for Invesco Ltd.’s retail mutual funds, exchange- traded funds and institutional money market funds. Both are wholly owned, indirect subsidiaries of Invesco Ltd. This report must be accompanied or preceded by a currently effective Fund prospectus and variable product prospectus, which contain more complete information, including sales charges and expenses. Investors should read each carefully before investing. *Prior to the close of business on May 24, 2019, the Fund’s name was Oppenheimer Discovery Mid Cap Growth Fund/VA. See Important Update on the following page for more information. |
Important Update
On October 18, 2018, Massachusetts Mutual Life Insurance Company, an indirect corporate parent of OppenheimerFunds, Inc. and its subsidiaries OFI Global Asset Management, Inc., OFI SteelPath, Inc. and OFI Advisors, LLC, announced that it had entered into an agreement whereby Invesco Ltd., a global investment management company would acquire OppenheimerFunds and its subsidiaries (together, “OppenheimerFunds”). After the close of business on May 24, 2019 Invesco Ltd. completed the acquisition of OppenheimerFunds. This Fund was included in that acquisition and as of that date, became part of the Invesco family of funds. Please visit invesco.com for more information or call Invesco’s Client Services team at 800-959-4246.
PORTFOLIO MANAGERS: Ronald J. Zibelli, Jr., CFA and Justin Livengood, CFA
AVERAGE ANNUAL TOTAL RETURNS FOR THE PERIODS ENDED 12/31/19
| | | | | | | | | | | | | | | | |
| | | Inception
Date | | | 1-Year | | | 5-Year | | | 10-Year | |
| Series I Shares* | | | 8/15/86 | | | | 39.37 | % | | | 12.96 | % | | | 14.78 | % |
| Series II Shares* | | | 10/16/00 | | | | 39.01 | | | | 12.68 | | | | 14.50 | |
| Russell Midcap Growth Index | | | | | | | 35.47 | | | | 11.60 | | | | 14.24 | |
Performance quoted is past performance and cannot guarantee future results; current performance may be lower or higher.Visit invesco.com for the most recent month-end performance. Performance figures reflect reinvested distributions and changes in net asset value (NAV). Investment return and principal value will vary so that you may have a gain or a loss when you sell shares. Fund returns include changes in share price, reinvested distributions. Performance figures given represent the Fund and are not intended to reflect actual variable product values. They do not reflect sales charges, expenses and fees assessed in connection with a variable product. Sales charges, expenses and fees, which are determined by the variable product issuers, will vary and will lower the total return. Returns for periods of less than one year are cumulative and not annualized. As the result of a reorganization after the close of business on May 24, 2019, the Non-Service and Service share classes of the predecessor fund were reorganized into Series I and Series II Shares, respectively, of the Fund. Returns shown for Series I and Series II shares are blended returns of the predecessor fund and the Fund. Share class returns will differ from those of the Oppenheimer predecessor fund because of different expenses. See Fund prospectuses and summary prospectuses for more information on share classes, sales charges and new fee agreements, if any. Fund literature is available at invesco.com.
TOP HOLDINGS AND ALLOCATIONS
TOP TEN COMMON STOCK HOLDINGS
| | | | |
| O’Reilly Automotive, Inc. | | | 2.3 | % |
| KLA Corp. | | | 2.1 | |
| DexCom, Inc. | | | 2.1 | |
| Synopsys, Inc. | | | 2.0 | |
| Lam Research Corp. | | | 1.9 | |
| TransDigm Group, Inc. | | | 1.9 | |
| RingCentral, Inc., Cl. A | | | 1.9 | |
| Pool Corp. | | | 1.9 | |
| CDW Corp. | | | 1.8 | |
| CoStar Group, Inc. | | | 1.8 | |
Holdings and allocations are subject to change and are not buy/sell recommendations. Percentages are as of December 31, 2019, and are based on net assets.
SECTOR ALLOCATION
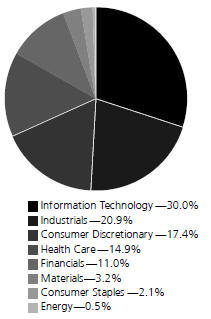
Holdings and allocations are subject to change and are not buy/sell recommendations. Percentages are as of December 31, 2019, and are based on the total market value of common stocks.
For more current Fund holdings, please visit invesco.com.
*Effective after the close of business on May 24, 2019, the Non-Service and Service share classes of the predecessor fund were reorganized into Series I and Series II Shares, respectively, of the Fund. Returns shown for Series I and Series II shares are blended returns of the predecessor fund and the Fund. Share class returns will differ from those of the predecessor fund because of different expenses.
|
| 3 INVESCO OPPENHEIMER V.I. DISCOVERY MID CAP GROWTH FUND |
Fund Performance Discussion
The Fund’s Series I (Non-Service) shares produced a return of 39.37% during the reporting period outperforming the Russell Midcap Growth Index’s (the Index) return of 35.47%. The Fund outperformed the benchmark within Information Technology, Industrials, and Financials sectors due to strong stock selection. This was slightly offset by poor stock selection in the Consumer Staples and Consumer Discretionary sectors.
MARKET OVERVIEW
Markets did surprisingly well considering that the year was plagued with concerns regarding resolution to US-China trade deal, direction of interest rates and monetary policy. In the end investors were rewarded and optimism lifted markets higher.
CONTRIBUTORS TO PERFORMANCE
The top performing stocks for the fund during this reporting period included Ring Central, CoStar, and Total System Services.
Ring Central operates as a provider of software-as-a-service solutions for business communications, offers a multi-year and enterprise-grade communications solution that enables customers and their employees to communicate via voice, text, HD Video and web conferencing. Throughout 2019, RingCentral has consistently reported strong earnings results, raised guidance and announced a transformative deal with Avaya during the latter part of 2019.
CoStar is the leading provider of real estate information services in the United States. The company continues to experience robust organic growth across its segments with margins benefiting from strong operating leverage. We saw this in the second quarter with a 19% rise in share price.
Total System Services provides electronic payment processing services to financial and non-financial institutions, enabling businesses to go paperless. TSS is currently the market leader in both credit issuer processing and merchant processing services. During the second quarter they benefitted from their announcement of a merger with Global Payments and saw a 35% increase in share price.
DETRACTORS TO PERFORMANCE
The stocks that detracted from performance most during this reporting period included Lamb Weston, Service Master, and Lyft.
Lamb Weston produces and supplies frozen potato products, specifically fries, puffs, chips, and prepared potato products. Lamb Weston detracted from portfolio performance as shares fell 21% in the second quarter due to concerns related to a competitor’s announcement of plans to invest in additional potato processing capacity. We have exited this position.
Service Master is a leading provider of essential residential and commercial services, which pre-announced a big third-quarter 2019 miss and cut guidance. The company blamed higher termite damage claims and stepped-up growth investments. Third-quarter revenue was a bit shy and margins fell sharply, which led to a big adjusted EPS miss. We have exited this position.
Lyft is an online ride-sharing service. The share price fell substantially over the second quarter due to fears of competitive pressure. Our position in LYFT was eliminated.
STRATEGY & OUTLOOK
Our long-term investment process remains the same. We seek dynamic companies with above-average and sustainable revenue and earnings growth that we believe are positioned to outperform. This includes leading firms in structurally attractive industries with committed management teams that have proven records of performance.
Looking forward, we expect the US economy to generate about 2.5% growth in 2020. This would be close to the 2.4% for 2019 and would represent the 11th consecutive year of growth. Stable Fed monetary policy and the resolution of uncertainties regarding trade disputes, Brexit, the annual Federal budget and impeachment support the case for sustaining this long expansion. Meanwhile, interest rates and inflation remain low by historical standards and corporate earnings may regain some vigor after a tough stretch in recent quarters. Equity valuations remain high relative to most periods but appear reasonable when placed in context of the favorable macroeconomic environment. Our opportunity set of premier growth companies remains compelling and we believe stock selection can continue to drive our relative performance.
|
| 4 INVESCO OPPENHEIMER V.I. DISCOVERY MID CAP GROWTH FUND |
The views and opinions expressed in management’s discussion of Fund performance are those of Invesco Advisers, Inc. These views and opinions are subject to change at any time based on factors such as market and economic conditions. These views and opinions may not be relied upon as investment advice or recommendations, or as an offer for a particular security. The information is not a complete analysis of every aspect of any market, country, industry, security or the Fund. Statements of fact are from sources considered reliable, but Invesco Advisers, Inc. makes no representation or warranty as to their completeness or accuracy. Although historical performance is no guarantee of future results, these insights may help you understand our investment management philosophy.
Before investing, investors should carefully read the prospectus and/or summary prospectus and carefully consider the investment objectives, risks, charges and expenses. For this and more complete information about the fund(s), investors should ask their advisors for a prospectus/summary prospectus or visit invesco.com/fundprospectus.
Shares of Invesco funds are not deposits or obligations of any bank, are not guaranteed by any bank, are not insured by the FDIC or any other agency, and involve investment risks, including the possible loss of the principal amount invested.
Comparing the Fund’s Performance to the Market.The graphs that follow show the performance of a hypothetical $10,000 investment in each share class of the Fund held until December 31, 2019. Performance is measured over a ten-fiscal-year period for both Classes. Performance information does not reflect charges that apply to separate accounts investing in the Fund. If these charges were taken into account, performance would be lower. The graphs assume that all dividends and capital gains distributions were reinvested in additional shares.
The Fund’s performance is compared to the performance of the Russell Midcap Growth Index. The Russell Midcap Growth Index measures the performance of the mid-cap growth segment of the U.S. equity universe. It includes those Russell Midcap Index companies with higher price-to-book ratios and higher forecasted growth values. The Index is unmanaged and cannot be purchased directly by investors. While index comparisons may be useful to provide a benchmark for the Fund’s performance, it must be noted that the Fund’s investments are not limited to the investments comprising the Index. Index performance includes reinvestment of income, but does not reflect transaction costs, fees, expenses or taxes. Index performance is shown for illustrative purposes only as a benchmark for the Fund’s performance, and does not predict or depict performance of the Fund. The Fund’s performance reflects the effects of the Fund’s business and operating expenses.
|
| 5 INVESCO OPPENHEIMER V.I. DISCOVERY MID CAP GROWTH FUND |
COMPARISON OF CHANGE IN VALUE OF $10,000 HYPOTHETICAL INVESTMENTS IN:
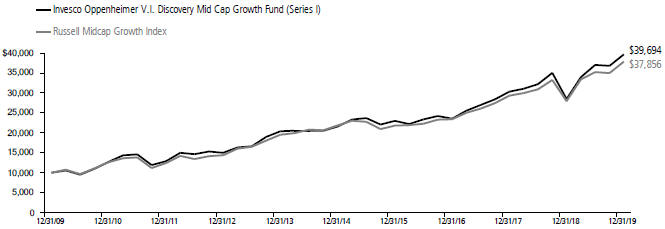
Average Annual Total Returns of Series I Shares of the Fund at 12/31/19
1-Year 39.37% 5-Year 12.96% 10-Year 14.78%
COMPARISON OF CHANGE IN VALUE OF $10,000 HYPOTHETICAL INVESTMENTS IN:

Average Annual Total Returns of Series II Shares of the Fund at 12/31/19
1-Year 39.01% 5-Year 12.68% 10-Year 14.50%
Performance quoted is past performance and cannot guarantee future results; current performance may be lower or higher.Visit invesco.com for the most recent month-end performance. Performance figures reflect reinvested distributions and changes in net asset value (NAV). Investment return and principal value will vary so that you may have a gain or a loss when you sell shares. Fund returns include changes in share price, reinvested distributions. Performance figures given represent the Fund and are not intended to reflect actual variable product values. They do not reflect sales charges, expenses and fees assessed in connection with a variable product. Sales charges, expenses and fees, which are determined by the variable product issuers, will vary and will lower the total return. Returns for periods of less than one year are cumulative and not annualized. As the result of a reorganization after the close of business on May 24, 2019, the Non-Service and Service share classes of the predecessor fund were reorganized into Series I and Series II Shares, respectively, of the Fund. Returns shown for Series I and Series II shares are blended returns of the predecessor fund and the Fund. Share class returns will differ from those of the Oppenheimer predecessor fund because of different expenses. See Fund prospectuses and summary prospectuses for more information on share classes, sales charges and new fee agreements, if any. Fund literature is available at invesco.com.
|
| 6 INVESCO OPPENHEIMER V.I. DISCOVERY MID CAP GROWTH FUND |
Fund Expenses
Fund Expenses.As a shareholder of the Fund, you incur two types of costs: (1) transaction costs and (2) ongoing costs, including management fees; distribution and service fees; and other Fund expenses. These examples are intended to help you understand your ongoing costs (in dollars) of investing in the Fund and to compare these costs with the ongoing costs of investing in other mutual funds.
The examples are based on an investment of $1,000.00 invested at the beginning of the period and held for the entire 6-month period ended December 31, 2019.
Actual Expenses. The first section of the table provides information about actual account values and actual expenses. You may use the information in this section for the class of shares you hold, together with the amount you invested, to estimate the expense that you paid over the period. Simply divide your account value by $1,000.00 (for example, an $8,600.00 account value divided by $1,000.00 = 8.60), then multiply the result by the number in the first section under the heading entitled “Expenses Paid During 6 Months Ended December 31, 2019” to estimate the expenses you paid on your account during this period.
Hypothetical Example for Comparison Purposes.
The second section of the table provides information about hypothetical account values and hypothetical expenses based on the Fund’s actual expense ratio for each class of shares, and an assumed rate of return of 5% per year for each class before expenses, which is not the actual return. The hypothetical account values and expenses may not be used to estimate the actual ending account balance or expenses you paid for the period. You may use this information to compare the ongoing costs of investing in the Fund and other funds. To do so, compare this 5% hypothetical example for the class of shares you hold with the 5% hypothetical examples that appear in the shareholder reports of the other funds.
Please note that the expenses shown in the table are meant to highlight your ongoing costs only and do not reflect any charges associated with the separate accounts that offer this Fund. Therefore, the “hypothetical” lines of the table are useful in comparing ongoing costs only, and will not help you determine the relative total costs of owning different funds. In addition, if these separate account charges were included your costs would have been higher.
| | | | | | | | | | | | | | | | |
Actual | | Beginning
Account
Value
July 1, 2019 | | | Ending Account Value
December 31, 2019 | | | Expenses Paid During 6 Months Ended December 31, 2019 | | | | |
Series I shares | | $ | 1,000.00 | | | $ | 1,071.90 | | | $ | 4.19 | | | | | |
Series II shares | | | 1,000.00 | | | | 1,070.60 | | | | 5.49 | | | | | |
| | | | |
Hypothetical | | | | | | | | | | | | | | | | |
(5% return before expenses) | | | | | | | | | | | | | | | | |
Series I shares | | | 1,000.00 | | | | 1,021.17 | | | | 4.08 | | | | | |
Series II shares | | | 1,000.00 | | | | 1,019.91 | | | | 5.36 | | | | | |
Expenses are equal to the Fund’s annualized expense ratio for that class, multiplied by the average account value over the period, multiplied by 184/365 (to reflect the one-half year period). Those annualized expense ratios, excluding indirect expenses from affiliated funds, based on the 6-month period ended December 31, 2019 are as follows:
| | |
| Class | | Expense Ratios |
| Series I shares | | 0.80% |
| Series II shares | | 1.05 |
The expense ratios reflect voluntary and/or contractual waivers and/or reimbursements of expenses by the Fund’s Manager. Some of these undertakings may be modified or terminated at any time, as indicated in the Fund’s prospectus. The “Financial Highlights” tables in the Fund’s financial statements, included in this report, also show the gross expense ratios, without such waivers or reimbursements and reduction to custodian expenses, if applicable.
|
| 7 INVESCO OPPENHEIMER V.I. DISCOVERY MID CAP GROWTH FUND |
SCHEDULE OF INVESTMENTSDecember 31, 2019
| | | | | | | | |
| | | Shares | | | Value | |
| Common Stocks—99.2% | | | | | | | | |
| Consumer Discretionary—17.2% | |
| Auto Components—0.7% | | | | | | | | |
| Aptiv plc | | | 57,220 | | | $ | 5,434,183 | |
| | | | | | | | | |
| Distributors—1.9% | | | | | | | | |
| Pool Corp. | | | 66,014 | | | | 14,020,053 | |
| | | | | | | | | |
| Diversified Consumer Services—1.2% | | | | | | | | |
| Bright Horizons Family Solutions, Inc.1 | | | 61,405 | | | | 9,228,558 | |
| | | | | | | | | |
| Entertainment—1.1% | | | | | | | | |
| Live Nation Entertainment, Inc.1 | | | 114,188 | | | | 8,161,016 | |
| | | | | | | | | |
| Hotels, Restaurants & Leisure—3.2% | | | | | | | | |
| Chipotle Mexican Grill, Inc., Cl. A1 | | | 13,320 | | | | 11,150,305 | |
| Hilton Worldwide Holdings, Inc. | | | 59,010 | | | | 6,544,799 | |
| Planet Fitness, Inc., Cl. A1 | | | 77,280 | | | | 5,771,271 | |
| | | | | | | 23,466,375 | |
| | | | | | | | | |
| Household Durables—0.5% | | | | | | | | |
| Garmin Ltd. | | | 39,870 | | | | 3,889,717 | |
| | | | | | | | | |
| Interactive Media & Services—1.1% | | | | | | | | |
| IAC/InterActiveCorp1 | | | 33,162 | | | | 8,260,986 | |
| | | | | | | | | |
| Media—1.0% | | | | | | | | |
| Cable One, Inc. | | | 4,920 | | | | 7,323,273 | |
| | | | | | | | | |
| Specialty Retail—4.7% | | | | | | | | |
| Burlington Stores, Inc.1 | | | 26,125 | | | | 5,957,284 | |
| CarMax, Inc.1 | | | 56,243 | | | | 4,930,824 | |
| O’Reilly Automotive, Inc.1 | | | 38,500 | | | | 16,873,010 | |
| Tractor Supply Co. | | | 79,765 | | | | 7,453,241 | |
| | | | | | | 35,214,359 | |
| | | | | | | | | |
| Textiles, Apparel & Luxury Goods—1.8% | | | | | | | | |
| lululemon athletica, Inc.1 | | | 57,503 | | | | 13,321,720 | |
| | | | | | | | | |
| Consumer Staples—2.1% | | | | | | | | |
| Food Products—2.1% | | | | | | | | |
| McCormick & Co., Inc. | | | 56,180 | | | | 9,535,432 | |
| Simply Good Foods Co. (The)1 | | | 87,194 | | | | 2,488,517 | |
| Tyson Foods, Inc., Cl. A | | | 41,109 | | | | 3,742,563 | |
| | | | | | | 15,766,512 | |
| | | | | | | | | |
| Energy—0.5% | | | | | | | | |
| Oil, Gas & Consumable Fuels—0.5% | | | | | | | | |
| Cheniere Energy, Inc.1 | | | 56,530 | | | | 3,452,287 | |
| | | | | | | | | |
| Financials—10.8% | | | | | | | | |
| Capital Markets—5.0% | | | | | | | | |
| KKR & Co., Inc., Cl. A | | | 188,735 | | | | 5,505,400 | |
| LPL Financial Holdings, Inc. | | | 85,319 | | | | 7,870,678 | |
| MarketAxess Holdings, Inc. | | | 17,240 | | | | 6,535,856 | |
| MSCI, Inc., Cl. A | | | 51,601 | | | | 13,322,346 | |
| Tradeweb Markets, Inc., Cl. A | | | 87,813 | | | | 4,070,133 | |
| | | | | | | 37,304,413 | |
| | | | | | | | | |
| Commercial Banks—1.1% | | | | | | | | |
| First Republic Bank | | | 69,797 | | | | 8,197,657 | |
| | | | | | | | | |
| Insurance—1.2% | | | | | | | | |
| Arthur J. Gallagher & Co. | | | 98,000 | | | | 9,332,540 | |
| | | | | | | | | |
| Real Estate Investment Trusts (REITs)—2.4% | | | | | |
| Alexandria Real Estate Equities, Inc. | | | 40,390 | | | | 6,526,216 | |
| Americold Realty Trust | | | 98,221 | | | | 3,443,628 | |
| SBA Communications Corp., Cl. A | | | 31,356 | | | | 7,556,483 | |
| | | | | | | 17,526,327 | |
| | | | | | | | | |
| Real Estate Management & Development—1.1% | | | | | |
| CBRE Group, Inc., Cl. A1 | | | 138,290 | | | | 8,475,794 | |
| | | | | | | | | |
| Health Care—14.8% | | | | | | | | |
| Biotechnology—0.5% | | | | | | | | |
| Seattle Genetics, Inc.1 | | | 32,726 | | | | 3,739,273 | |
| | | | | | | | | |
| Health Care Equipment & Supplies—9.4% | | | | | | | | |
| Cooper Cos., Inc. (The) | | | 12,012 | | | | 3,859,336 | |
| | | | | | | | |
| | | Shares | | | Value | |
| Health Care Equipment & Supplies (Continued) | | | | | |
| DexCom, Inc.1 | | | 70,400 | | | $ | 15,399,296 | |
| Edwards Lifesciences Corp.1 | | | 40,052 | | | | 9,343,731 | |
| IDEXX Laboratories, Inc.1 | | | 28,826 | | | | 7,527,333 | |
| Masimo Corp.1 | | | 50,077 | | | | 7,915,171 | |
| Novocure Ltd.1 | | | 40,663 | | | | 3,426,671 | |
| STERIS plc | | | 54,832 | | | | 8,357,493 | |
| Teleflex, Inc. | | | 18,541 | | | | 6,979,574 | |
| West Pharmaceutical Services, Inc. | | | 49,553 | | | | 7,449,303 | |
| | | | | | | 70,257,908 | |
| | | | | | | | | |
| Health Care Technology—0.8% | | | | | | | | |
| Veeva Systems, Inc., Cl. A1 | | | 39,443 | | | | 5,548,052 | |
| | | | | | | | | |
| Life Sciences Tools & Services—4.1% | | | | | | | | |
| Bio-Rad Laboratories, Inc., Cl. A1 | | | 19,100 | | | | 7,067,573 | |
| Bio-Techne Corp. | | | 27,196 | | | | 5,969,794 | |
| ICON plc1 | | | 49,148 | | | | 8,464,760 | |
| IQVIA Holdings, Inc.1 | | | 59,953 | | | | 9,263,338 | |
| | | | | | | 30,765,465 | |
| | | | | | | | | |
| Industrials—20.8% | | | | | | | | |
| Aerospace & Defense—3.1% | | | | | | | | |
| HEICO Corp. | | | 78,890 | | | | 9,005,293 | |
| TransDigm Group, Inc. | | | 25,310 | | | | 14,173,600 | |
| | | | | | | 23,178,893 | |
| | | | | | | | | |
| Building Products—1.0% | | | | | | | | |
| Masco Corp. | | | 147,120 | | | | 7,060,289 | |
| | | | | | | | | |
| Commercial Services & Supplies—4.8% | | | | | | | | |
| Cintas Corp. | | | 42,850 | | | | 11,530,078 | |
| Clean Harbors, Inc.1 | | | 44,621 | | | | 3,826,251 | |
| Copart, Inc.1 | | | 106,126 | | | | 9,651,098 | |
| Republic Services, Inc., Cl. A | | | 118,640 | | | | 10,633,703 | |
| | | | | | | 35,641,130 | |
| | | | | | | | | |
| Electrical Equipment—1.2% | | | | | | | | |
| AMETEK, Inc. | | | 89,461 | | | | 8,922,840 | |
| | | | | | | | | |
| Industrial Conglomerates—2.8% | | | | | | | | |
| Carlisle Cos., Inc. | | | 45,560 | | | | 7,373,431 | |
| Roper Technologies, Inc. | | | 37,036 | | | | 13,119,262 | |
| | | | | | | 20,492,693 | |
| | | | | | | | | |
| Machinery—1.6% | | | | | | | | |
| IDEX Corp. | | | 49,304 | | | | 8,480,288 | |
| Nordson Corp. | | | 22,647 | | | | 3,687,837 | |
| | | | | | | 12,168,125 | |
| | | | | | | | | |
| Professional Services—4.2% | | | | | | | | |
| CoStar Group, Inc.1 | | | 22,326 | | | | 13,357,646 | |
| IHS Markit Ltd.1 | | | 101,247 | | | | 7,628,962 | |
| TransUnion | | | 124,312 | | | | 10,642,350 | |
| | | | | | | 31,628,958 | |
| | | | | | | | | |
| Road & Rail—2.1% | | | | | | | | |
| Kansas City Southern | | | 56,535 | | | | 8,658,901 | |
| Old Dominion Freight Line, Inc. | | | 36,300 | | | | 6,889,014 | |
| | | | | | | 15,547,915 | |
| | | | | | | | | |
| Information Technology—29.8% | | | | | | | | |
| Communications Equipment—1.2% | | | | | | | | |
| Motorola Solutions, Inc. | | | 58,066 | | | | 9,356,755 | |
| | | | | | | | | |
| Electronic Equipment, Instruments, & Components—3.6% | |
| CDW Corp. | | | 95,793 | | | | 13,683,072 | |
| Keysight Technologies, Inc.1 | | | 126,500 | | | | 12,982,695 | |
| | | | | | | 26,665,767 | |
| | | | | | | | | |
| IT Services—6.2% | | | | | | | | |
| Booz Allen Hamilton Holding Corp., Cl. A | | | 127,040 | | | | 9,036,355 | |
| EPAM Systems, Inc.1 | | | 31,683 | | | | 6,721,865 | |
| Euronet Worldwide, Inc.1 | | | 46,963 | | | | 7,399,490 | |
| Global Payments, Inc. | | | 54,235 | | | | 9,901,142 | |
Twilio, Inc., Cl. A1 | | | 56,910 | | | | 5,593,115 | |
|
| 8 INVESCO OPPENHEIMER V.I. DISCOVERY MID CAP GROWTH FUND |
| | | | | | | | |
| | | Shares | | | Value | |
| IT Services (Continued) | | | | | | | | |
| WEX, Inc.1 | | | 35,192 | | | $ | 7,371,317 | |
| | | | | | | 46,023,284 | |
| | | | | | | | | |
| Semiconductors & Semiconductor Equipment—8.7% | |
| Advanced Micro Devices, Inc.1 | | | 267,115 | | | | 12,249,894 | |
| KLA Corp. | | | 88,144 | | | | 15,704,616 | |
| Lam Research Corp. | | | 49,064 | | | | 14,346,314 | |
| Marvell Technology Group Ltd. | | | 265,067 | | | | 7,040,179 | |
| Monolithic Power Systems, Inc. | | | 54,610 | | | | 9,721,672 | |
| NXP Semiconductors NV | | | 44,645 | | | | 5,681,523 | |
| | | | | | | 64,744,198 | |
| | | | | | | | | |
| Software—10.1% | | | | | | | | |
| ANSYS, Inc.1 | | | 26,880 | | | | 6,919,181 | |
| Aspen Technology, Inc.1 | | | 42,916 | | | | 5,189,832 | |
| Atlassian Corp. plc, Cl. A1 | | | 70,377 | | | | 8,469,168 | |
| Coupa Software, Inc.1 | | | 40,920 | | | | 5,984,550 | |
| Paycom Software, Inc.1 | | | 23,480 | | | | 6,216,565 | |
| RingCentral, Inc., Cl. A1 | | | 84,023 | | | | 14,172,160 | |
| Splunk, Inc.1 | | | 49,954 | | | | 7,481,611 | |
| Synopsys, Inc.1 | | | 106,077 | | | | 14,765,918 | |
| | | | | | | | |
| | | Shares | | | Value | |
| Software (Continued) | | | | | | | | |
| Trade Desk, Inc. (The), Cl. A1 | | | 22,130 | | | $ | 5,748,931 | |
| | | | | | | 74,947,916 | |
| | | | | | | | | |
| Materials—3.2% | | | | | | | | |
| Chemicals—1.0% | | | | | | | | |
| FMC Corp. | | | 45,802 | | | | 4,571,955 | |
| Huntsman Corp. | | | 113,669 | | | | 2,746,243 | |
| | | | | | | 7,318,198 | |
| | | | | | | | | |
| Construction Materials—0.9% | | | | | | | | |
| Martin Marietta Materials, Inc. | | | 25,089 | | | | 7,015,888 | |
| | | | | | | | | |
| Containers & Packaging—1.3% | | | | | | | | |
| Avery Dennison Corp. | | | 29,240 | | | | 3,825,177 | |
| Ball Corp. | | | 87,097 | | | | 5,632,563 | |
| | | | | | | 9,457,740 | |
| Total Common Stocks (Cost $538,930,356) | | | | 738,857,057 | |
| | | | | | | | |
| Investment Company—0.7% | |
Invesco Government & Agency Portfolio, Institutional Class, 1.50%2
(Cost $5,411,943) | | | 5,411,943 | | | | 5,411,943 | |
| Total Investments, at Value (Cost $544,342,299) | | | 99.9 | % | | | 744,269,000 | |
Net Other Assets (Liabilities) | | | 0.1 | | | | 467,413 | |
Net Assets | | | 100.0 | % | | $ | 744,736,413 | |
| | | | | | | | |
Footnotes to Schedule of Investments
1. Non-income producing security.
2. The money market fund and the Fund are affiliated by having the same investment adviser. The rate shown is the 7-day SEC standardized yield as of December 31, 2019.
See accompanying Notes to Financial Statements.
|
| 9 INVESCO OPPENHEIMER V.I. DISCOVERY MID CAP GROWTH FUND |
STATEMENT OF ASSETS AND LIABILITIESDecember 31, 2019
| | | | |
|
| |
| Assets | | | | |
| Investments, at value—see accompanying schedule of investments: | | | | |
| Unaffiliated companies (cost $538,930,356) | | $ | 738,857,057 | |
| Affiliated companies (cost $5,411,943) | | | 5,411,943 | |
| | | | |
| | | 744,269,000 | |
| |
| Cash | | | 96,589 | |
| |
| Receivables and other assets: | | | | |
| Investments sold | | | 2,831,483 | |
| Dividends | | | 1,168,060 | |
| Shares of beneficial interest sold | | | 45,642 | |
| Other | | | 84,150 | |
| | | | |
| Total assets | | | 748,494,924 | |
|
| |
Liabilities | | | | |
| Payables and other liabilities: | | | | |
| Investments purchased | | | 2,301,529 | |
| Shares of beneficial interest redeemed | | | 980,830 | |
| Administration fee | | | 270,119 | |
| Trustees’ compensation | | | 77,573 | |
| Shareholder communications | | | 53,538 | |
| Advisory fee | | | 14,271 | |
| Transfer and shareholder servicing agent fees | | | 12,118 | |
| Distribution and service plan fees | | | 10,769 | |
| Other | | | 37,764 | |
| | | | |
| Total liabilities | | | 3,758,511 | |
|
| |
Net Assets | | $ | 744,736,413 | |
| | | | |
|
| |
| Composition of Net Assets | | | | |
| Shares of beneficial interest | | $ | 480,284,478 | |
| |
| Total distributable earnings | | | 264,451,935 | |
| | | | |
| Net Assets | | $ | 744,736,413 | |
| | | | |
|
| |
| Net Asset Value Per Share | | | | |
| Series I Shares: | | | | |
| Net asset value, redemption price per share and offering price per share (based on net assets of $693,424,333 and 8,272,608 shares of beneficial interest outstanding) | | | $83.82 | |
| |
| Series II Shares: | | | | |
| Net asset value, redemption price per share and offering price per share (based on net assets of $51,312,080 and 660,361 shares of beneficial interest outstanding) | | | $77.70 | |
See accompanying Notes to Financial Statements.
|
| 10 INVESCO OPPENHEIMER V.I. DISCOVERY MID CAP GROWTH FUND |
STATEMENT OF OPERATIONSFor the Year Ended December 31, 2019
| | | | |
|
| |
| Investment Income | | | | |
| Dividends: | | | | |
| Unaffiliated companies (net of foreign withholding taxes of $15,890) | | $ | 5,855,282 | |
| Affiliated companies | | | 237,827 | |
| |
| Interest | | | 131 | |
| | | | |
| Total investment income | | | 6,093,240 | |
|
| |
| Expenses | | | | |
| Advisory fees | | | 5,016,938 | |
| |
| Administration fees | | | 709,390 | |
| |
| Distribution and service plan fees — Series II shares | | | 110,251 | |
| |
| Transfer and shareholder servicing agent fees: | | | | |
| Series I shares | | | 344,405 | |
| Series II shares | | | 21,336 | |
| |
| Shareholder communications: | | | | |
| Series I shares | | | 48,649 | |
| Series II shares | | | 3,213 | |
| |
| Trustees’ compensation | | | 22,633 | |
| |
| Borrowing fees | | | 8,486 | |
| |
| Custodian fees and expenses | | | 4,575 | |
| |
| Other | | | 58,038 | |
| | | | |
| Total expenses | | | 6,347,914 | |
| Less waivers, reimbursement of expenses and offset arrangement(s) | | | (515,643) | |
| | | | |
| Net expenses | | | 5,832,271 | |
|
| |
Net Investment Income | | | 260,969 | |
|
| |
| Realized and Unrealized Gain | | | | |
| Net realized gain on investment transactions in unaffiliated companies (includes net gains (losses) from securities sold to affiliates of $(149,286)) | | | 67,792,034 | |
| |
| Net change in unrealized appreciation/(depreciation) on investment transactions in unaffiliated companies | | | 163,454,901 | |
|
| |
Net Increase in Net Assets Resulting from Operations | | $ | 231,507,904 | |
| | | | |
See accompanying Notes to Financial Statements.
|
| 11 INVESCO OPPENHEIMER V.I. DISCOVERY MID CAP GROWTH FUND |
STATEMENT OF CHANGES IN NET ASSETS
| | | | | | | | |
| | | Year Ended
December 31, 2019 | | | Year Ended
December 31, 2018 | |
|
| |
| Operations | | | | | | | | |
| Net investment income (loss) | | $ | 260,969 | | | $ | (1,784,624) | |
| |
| Net realized gain | | | 67,792,034 | | | | 95,224,298 | |
| |
| Net change in unrealized appreciation/(depreciation) | | | 163,454,901 | | | | (128,898,713) | |
| | | | |
| Net increase (decrease) in net assets resulting from operations | | | 231,507,904 | | | | (35,459,039) | |
|
| |
| Dividends and/or Distributions to Shareholders | | | | | | | | |
| Distributions to shareholders from distributable earnings: | | | | | | | | |
| Series I shares | | | (84,658,513) | | | | (95,656,703) | |
| Series II shares | | | (5,797,957) | | | | (5,963,052) | |
| | | | |
| Total distributions from distributable earnings | | | (90,456,470) | | | | (101,619,755) | |
|
| |
| Beneficial Interest Transactions | | | | | | | | |
| Net increase (decrease) in net assets resulting from beneficial interest transactions: | | | | | | | | |
| Series I shares | | | (25,925,623) | | | | 20,283,999 | |
| Series II shares | | | 8,283,693 | | | | 3,848,119 | |
| | | | |
| Total beneficial interest transactions | | | (17,641,930) | | | | 24,132,118 | |
|
| |
| Net Assets | | | | | | | | |
| Total increase (decrease) | | | 123,409,504 | | | | (112,946,676) | |
| |
| Beginning of period | | | 621,326,909 | | | | 734,273,585 | |
| | | | |
| End of period | | $ | 744,736,413 | | | $ | 621,326,909 | |
| | | | |
See accompanying Notes to Financial Statements.
|
| 12 INVESCO OPPENHEIMER V.I. DISCOVERY MID CAP GROWTH FUND |
FINANCIAL HIGHLIGHTS
| | | | | | | | | | | | | | | | | | | | |
| | | Year Ended | | | Year Ended | | | Year Ended | | | Year Ended | | | Year Ended | |
| | | December 31, | | | December 31, | | | December 31, | | | December 31, | | | December 31, | |
| Series I Shares | | 2019 | | | 2018 | | | 2017 | | | 2016 | | | 2015 | |
| |
| Per Share Operating Data | | | | | | | | | | | | | | | | | | | | |
| Net asset value, beginning of period | | | $68.65 | | | | $84.21 | | | | $72.65 | | | | $76.85 | | | | $78.82 | |
| |
| Income (loss) from investment operations: | | | | | | | | | | | | | | | | | | | | |
| Net investment income (loss)1 | | | 0.042 | | | | (0.19) | | | | (0.10) | | | | 0.03 | | | | (0.19) | |
| Net realized and unrealized gain (loss) | | | 26.04 | | | | (3.07) | | | | 20.08 | | | | 1.69 | | | | 5.67 | |
| | | | |
| Total from investment operations | | | 26.08 | | | | (3.26) | | | | 19.98 | | | | 1.72 | | | | 5.48 | |
| |
| Dividends and/or distributions to shareholders: | | | | | | | | | | | | | | | | | | | | |
| Dividends from net investment income | | | 0.00 | | | | 0.00 | | | | (0.03) | | | | 0.00 | | | | 0.00 | |
| Distributions from net realized gain | | | (10.91) | | | | (12.30) | | | | (8.39) | | | | (5.92) | | | | (7.45) | |
| | | | |
| Total dividends and/or distributions to shareholders | | | (10.91) | | | | (12.30) | | | | (8.42) | | | | (5.92) | | | | (7.45) | |
| |
| Net asset value, end of period | | | $83.82 | | | | $68.65 | | | | $84.21 | | | | $72.65 | | | | $76.85 | |
| | | | |
|
| |
| Total Return, at Net Asset Value3 | | | 39.37% | | | | (6.08)% | | | | 28.79% | | | | 2.34% | | | | 6.61% | |
|
| |
| Ratios/Supplemental Data | | | | | | | | | | | | | | | | | | | | |
| Net assets, end of period (in thousands) | | | $693,424 | | | | $586,273 | | | | $694,675 | | | | $603,708 | | | | $660,450 | |
| |
| Average net assets (in thousands) | | | $671,643 | | | | $690,497 | | | | $661,192 | | | | $621,110 | | | | $695,736 | |
| |
| Ratios to average net assets:4 | | | | | | | | | | | | | | | | | | | | |
| Net investment income (loss) | | | 0.05%2 | | | | (0.23)% | | | | (0.12)% | | | | 0.04% | | | | (0.24)% | |
| Expenses excluding specific expenses listed below | | | 0.87% | | | | 0.86% | | | | 0.84% | | | | 0.84% | | | | 0.83% | |
| Interest and fees from borrowings | | | 0.00%5 | | | | 0.00%5 | | | | 0.00%5 | | | | 0.00%5 | | | | 0.00%5 | |
| | | | |
| Total expenses6 | | | 0.87% | | | | 0.86% | | | | 0.84% | | | | 0.84% | | | | 0.83% | |
| Expenses after payments, waivers and/or reimbursements and reduction to custodian expenses | | | 0.80% | | | | 0.80% | | | | 0.80% | | | | 0.80% | | | | 0.80% | |
| |
| Portfolio turnover rate7 | | | 76% | | | | 104% | | | | 105% | | | | 141% | | | | 81% | |
1. Calculated based on the average shares outstanding during the period.
2. Net investment income per share and the ratio of net investment income to average net assets includes significant dividends received during the year ended December 31, 2019. Net investment income per share and the ratio of net investment income to average net assets excluding the significant dividends are $(0.13) and (0.16)%.
3. Includes adjustments in accordance with accounting principles generally accepted in the United States of America and as such, the net asset value for financial reporting purposes and the returns based upon those net asset values may differ from the net asset value and returns for shareholder transactions. Total returns are not annualized for periods less than one year, if applicable and do not reflect charges assessed in connection with a variable product, which if included would reduce total returns.
4. Annualized for periods less than one full year.
5. Less than 0.005%.
6. Total expenses including indirect expenses from fund fees and expenses were as follows:
| | | | | | | | |
| Year Ended December 31, 2019 | | | 0.87% | | | | | |
| Year Ended December 31, 2018 | | | 0.86% | | | | | |
| Year Ended December 31, 2017 | | | 0.84% | | | | | |
| Year Ended December 31, 2016 | | | 0.84% | | | | | |
| Year Ended December 31, 2015 | | | 0.83% | | | | | |
7. Portfolio turnover is calculated at the fund level and is not annualized for periods less than one year, if applicable.
See accompanying Notes to Financial Statements.
|
| 13 INVESCO OPPENHEIMER V.I. DISCOVERY MID CAP GROWTH FUND |
FINANCIAL HIGHLIGHTSContinued
| | | | | | | | | | | | | | | | | | | | |
| | | Year Ended | | | Year Ended | | | Year Ended | | | Year Ended | | | Year Ended | |
| | | December 31, | | | December 31, | | | December 31, | | | December 31, | | | December 31, | |
| Series II Shares | | 2019 | | | 2018 | | | 2017 | | | 2016 | | | 2015 | |
| |
| Per Share Operating Data | | | | | | | | | | | | | | | | | | | | |
| Net asset value, beginning of period | | | $64.41 | | | | $79.87 | | | | $69.43 | | | | $73.88 | | | | $76.21 | |
| |
| Income (loss) from investment operations: | | | | | | | | | | | | | | | | | | | | |
| Net investment loss1 | | | (0.14)2 | | | | (0.37) | | | | (0.28) | | | | (0.15) | | | | (0.38) | |
| Net realized and unrealized gain (loss) | | | 24.34 | | | | (2.79) | | | | 19.11 | | | | 1.62 | | | | 5.50 | |
| | | | |
| Total from investment operations | | | 24.20 | | | | (3.16) | | | | 18.83 | | | | 1.47 | | | | 5.12 | |
| |
| Dividends and/or distributions to shareholders: | | | | | | | | | | | | | | | | | | | | |
| Dividends from net investment income | | | 0.00 | | | | 0.00 | | | | 0.00 | | | | 0.00 | | | | 0.00 | |
| Distributions from net realized gain | | | (10.91) | | | | (12.30) | | | | (8.39) | | | | (5.92) | | | | (7.45) | |
| | | | |
| Total dividends and/or distributions to shareholders | | | (10.91) | | | | (12.30) | | | | (8.39) | | | | (5.92) | | | | (7.45) | |
| |
| Net asset value, end of period | | | $77.70 | | | | $64.41 | | | | $79.87 | | | | $69.43 | | | | $73.88 | |
| | | | |
|
| |
| Total Return, at Net Asset Value3 | | | 39.01% | | | | (6.31)% | | | | 28.46% | | | | 2.08% | | | | 6.35% | |
|
| |
| Ratios/Supplemental Data | | | | | | | | | | | | | | | | | | | | |
| Net assets, end of period (in thousands) | | | $51,312 | | | | $35,054 | | | | $39,599 | | | | $32,252 | | | | $37,029 | |
| |
| Average net assets (in thousands) | | | $44,138 | | | | $40,815 | | | | $35,753 | | | | $33,797 | | | | $32,812 | |
| |
| Ratios to average net assets:4 | | | | | | | | | | | | | | | | | | | | |
| Net investment loss | | | (0.19)%2 | | | | (0.48)% | | | | (0.37)% | | | | (0.21)% | | | | (0.49)% | |
| Expenses excluding specific expenses listed below | | | 1.12% | | | | 1.11% | | | | 1.09% | | | | 1.09% | | | | 1.08% | |
| Interest and fees from borrowings | | | 0.00%5 | | | | 0.00%5 | | | | 0.00%5 | | | | 0.00%5 | | | | 0.00%5 | |
| | | | |
| Total expenses6 | | | 1.12% | | | | 1.11% | | | | 1.09% | | | | 1.09% | | | | 1.08% | |
| Expenses after payments, waivers and/or reimbursements and reduction to custodian expenses | | | 1.05% | | | | 1.05% | | | | 1.05% | | | | 1.05% | | | | 1.05% | |
| |
| Portfolio turnover rate7 | | | 76% | | | | 104% | | | | 105% | | | | 141% | | | | 81% | |
1. Calculated based on the average shares outstanding during the period.
2. Net investment income per share and the ratio of net investment income to average net assets includes significant dividends received during the year ended December 31, 2019. Net investment income per share and the ratio of net investment income to average net assets excluding the significant dividends are $(0.30) and (0.40)%.
3. Includes adjustments in accordance with accounting principles generally accepted in the United States of America and as such, the net asset value for financial reporting purposes and the returns based upon those net asset values may differ from the net asset value and returns for shareholder transactions. Total returns are not annualized for periods less than one year, if applicable and do not reflect charges assessed in connection with a variable product, which if included would reduce total returns.
4. Annualized for periods less than one full year.
5. Less than 0.005%.
6. Total expenses including indirect expenses from fund fees and expenses were as follows:
| | | | | | | | |
| Year Ended December 31, 2019 | | | 1.12% | | | | | |
| Year Ended December 31, 2018 | | | 1.11% | | | | | |
| Year Ended December 31, 2017 | | | 1.09% | | | | | |
| Year Ended December 31, 2016 | | | 1.09% | | | | | |
| Year Ended December 31, 2015 | | | 1.08% | | | | | |
7. Portfolio turnover is calculated at the fund level and is not annualized for periods less than one year, if applicable.
See accompanying Notes to Financial Statements.
|
| 14 INVESCO OPPENHEIMER V.I. DISCOVERY MID CAP GROWTH FUND |
NOTES TO FINANCIAL STATEMENTSDecember 31, 2019
Note 1 – Significant Accounting Policies
Invesco Oppenheimer V.I. Discovery Mid Cap Growth Fund (the “Fund”) is a series portfolio of AIM Variable Insurance Funds (Invesco Variable Insurance Funds) (the “Trust”). The Trust is a Delaware statutory trust registered under the Investment Company Act of 1940, as amended (the “1940 Act”), as an open-end series management investment company authorized to issue an unlimited number of shares of beneficial interest. Information presented in these financial statements pertains only to the Fund. Matters affecting the Fund or each class will be voted on exclusively by the shareholders of such Fund or each class.
Prior to the close of business on May 24, 2019, the Fund operated as Oppenheimer Discovery Mid Cap Growth Fund/VA (the “Acquired Fund” or “Predecessor Fund”). The Acquired Fund was reorganized after the close of business on May 24, 2019 (the “Reorganization Date”) through the transfer of all of its assets and liabilities to the Fund (the “Reorganization”).
Upon closing of the Reorganization, holders of the Acquired Fund’s Non-Service and Service shares received Series I and Series II shares of the Fund, respectively. Information for the Acquired Fund’s Non-Service and Service shares prior to the Reorganization is included with Series I and Series II, respectively, throughout this report.
The Fund’s investment objective is to seek capital appreciation.
The Fund currently offers two classes of shares, Series I and Series II, both of which are offered to insurance company separate accounts funding variable annuity contracts and variable life insurance policies (“variable products”).
The Fund is an investment company and accordingly follows the investment company accounting and reporting guidance in accordance with Financial Accounting Standards Board Accounting Standards Codification Topic 946, Financial Services – Investment Companies.
The following is a summary of the significant accounting policies followed by the Fund in the preparation of its financial statements.
A. Security Valuations– Securities, including restricted securities, are valued according to the following policy.
A security listed or traded on an exchange (except convertible securities) is valued at its last sales price or official closing price as of the close of the customary trading session on the exchange where the security is principally traded, or lacking any sales or official closing price on a particular day, the security may be valued at the closing bid price on that day. Securities traded in the over-the-counter market are valued based on prices furnished by independent pricing services or market makers. When such securities are valued by an independent pricing service they may be considered fair valued. Futures contracts are valued at the final settlement price set by an exchange on which they are principally traded. Listed options are valued at the mean between the last bid and asked prices from the exchange on which they are principally traded. Options not listed on an exchange are valued by an independent source at the mean between the last bid and asked prices. For purposes of determining net asset value (“NAV”) per share, futures and option contracts generally are valued 15 minutes after the close of the customary trading session of the New York Stock Exchange (“NYSE”).
Investments in open-end and closed-end registered investment companies that do not trade on an exchange are valued at the end-of-day net asset value per share. Investments in open-end and closed-end registered investment companies that trade on an exchange are valued at the last sales price or official closing price as of the close of the customary trading session on the exchange where the security is principally traded.
Debt obligations (including convertible securities) and unlisted equities are fair valued using an evaluated quote provided by an independent pricing service. Evaluated quotes provided by the pricing service may be determined without exclusive reliance on quoted prices, and may reflect appropriate factors such as institution-size trading in similar groups of securities, developments related to specific securities, dividend rate (for unlisted equities), yield (for debt obligations), quality, type of issue, coupon rate (for debt obligations), maturity (for debt obligations), individual trading characteristics and other market data. Pricing services generally value debt obligations assuming orderly transactions of institutional round lot size, but a fund may hold or transact in the same securities in smaller, odd lot sizes. Odd lots often trade at lower prices than institutional round lots. Debt obligations are subject to interest rate and credit risks. In addition, all debt obligations involve some risk of default with respect to interest and/or principal payments.
Foreign securities’ (including foreign exchange contracts) prices are converted into U.S. dollar amounts using the applicable exchange rates as of the close of the NYSE. If market quotations are available and reliable for foreign exchange-traded equity securities, the securities will be valued at the market quotations. Because trading hours for certain foreign securities end before the close of the NYSE, closing market quotations may become unreliable. If between the time trading ends on a particular security and the close of the customary trading session on the NYSE, events occur that the investment adviser determines are significant and make the closing price unreliable, the Fund may fair value the security. If the event is likely to have affected the closing price of the security, the security will be valued at fair value in good faith using procedures approved by the Board of Trustees. Adjustments to closing prices to reflect fair value may also be based on a screening process of an independent pricing service to indicate the degree of certainty, based on historical data, that the closing price in the principal market where a foreign security trades is not the current value as of the close of the NYSE. Foreign securities’ prices meeting the approved degree of certainty that the price is not reflective of current value will be priced at the indication of fair value from the independent pricing service. Multiple factors may be considered by the independent pricing service in determining adjustments to reflect fair value and may include information relating to sector indices, American Depositary Receipts and domestic and foreign index futures. Foreign securities may have additional risks including exchange rate changes, potential for sharply devalued currencies and high inflation, political and economic upheaval, the relative lack of issuer information, relatively low market liquidity and the potential lack of strict financial and accounting controls and standards.
Securities for which market prices are not provided by any of the above methods may be valued based upon quotes furnished by independent sources. The last bid price may be used to value equity securities. The mean between the last bid and asked prices is used to value debt obligations, including corporate loans.
Securities for which market quotations are not readily available or became unreliable are valued at fair value as determined in good faith by or under the supervision of the Trust’s officers following procedures approved by the Board of Trustees. Issuer specific events, market trends, bid/ asked quotes of brokers and information providers and other market data may be reviewed in the course of making a good faith determination of a
|
15 INVESCO OPPENHEIMER V.I. DISCOVERY MID CAP GROWTH FUND |
NOTES TO FINANCIAL STATEMENTSContinued
security’s fair value.
The Fund may invest in securities that are subject to interest rate risk, meaning the risk that the prices will generally fall as interest rates rise and, conversely, the prices will generally rise as interest rates fall. Specific securities differ in their sensitivity to changes in interest rates depending on their individual characteristics. Changes in interest rates may result in increased market volatility, which may affect the value and/or liquidity of certain Fund investments.
Valuations change in response to many factors including the historical and prospective earnings of the issuer, the value of the issuer’s assets, general economic conditions, interest rates, investor perceptions and market liquidity. Because of the inherent uncertainties of valuation, the values reflected in the financial statements may materially differ from the value received upon actual sale of those investments.
| B. | Securities Transactions and Investment Income -Securities transactions are accounted for on a trade date basis. Realized gains or losses on sales are computed on the basis of specific identification of the securities sold. Interest income (net of withholding tax, if any) is recorded on the accrual basis from settlement date. Dividend income (net of withholding tax, if any) is recorded on the ex-dividend date. |
The Fund may periodically participate in litigation related to Fund investments. As such, the Fund may receive proceeds from litigation settlements. Any proceeds received are included in the Statement of Operations as realized gain (loss) for investments no longer held and as unrealized gain (loss) for investments still held.
Brokerage commissions and mark ups are considered transaction costs and are recorded as an increase to the cost basis of securities purchased and/or a reduction of proceeds on a sale of securities. Such transaction costs are included in the determination of net realized and unrealized gain (loss) from investment transactions reported in the Statement of Operations and the Statement of Changes in Net Assets and the net realized and unrealized gains (losses) on securities per share in the Financial Highlights. Transaction costs are included in the calculation of the Fund’s net asset value and, accordingly, they reduce the Fund’s total returns. These transaction costs are not considered operating expenses and are not reflected in net investment income reported in the Statement of Operations and the Statement of Changes in Net Assets, or the net investment income per share and the ratios of expenses and net investment income reported in the Financial Highlights, nor are they limited by any expense limitation arrangements between the Fund and the investment adviser.
The Fund allocates income and realized and unrealized capital gains and losses to a class based on the relative net assets of each class.
The Fund recharacterizes distributions received from REIT investments based on information provided by the REIT into the following categories: ordinary income, long-term and short-term capital gains, and return of capital. If information is not available on a timely basis from the REIT, the recharacterization will be based on available information which may include the previous year’s allocation. If new or additional information becomes available from the REIT at a later date, a recharacterization will be made in the following year. The Fund records as dividend income the amount recharacterized as ordinary income and as realized gain the amount recharacterized as capital gain in the Statement of Operations, and the amount recharacterized as return of capital as a reduction of the cost of the related investment. These recharacterizations are reflected in the accompanying financial statements.
| C. | Country Determination- For the purposes of making investment selection decisions and presentation in the Schedule of Investments, the investment adviser may determine the country in which an issuer is located and/or credit risk exposure based on various factors. These factors include the laws of the country under which the issuer is organized, where the issuer maintains a principal office, the country in which the issuer derives 50% or more of its total revenues and the country that has the primary market for the issuer’s securities, as well as other criteria. Among the other criteria that may be evaluated for making this determination are the country in which the issuer maintains 50% or more of its assets, the type of security, financial guarantees and enhancements, the nature of the collateral and the sponsor organization. |
| D. | Distributions -Dividends and distributions to shareholders, which are determined in accordance with income tax regulations and may differ from accounting principles generally accepted in the United States of America (“GAAP”), are recorded on the ex-dividend date. Income and capital gain distributions, if any, are declared and paid annually to separate accounts of participating insurance companies or at other times as determined necessary by the Adviser. |
| E. | Federal Income Taxes -The Fund intends to comply with the requirements of Subchapter M of the Internal Revenue Code of 1986, as amended (the “Internal Revenue Code”), necessary to qualify as a regulated investment company and to distribute substantially all of the Fund’s taxable earnings to shareholders. As such, the Fund will not be subject to federal income taxes on otherwise taxable income (including net realized capital gain) that is distributed to shareholders. Therefore, no provision for federal income taxes is recorded in the financial statements. |
The Fund recognizes the tax benefits of uncertain tax positions only when the position is more likely than not to be sustained. Management has analyzed the Fund’s uncertain tax positions and concluded that no liability for unrecognized tax benefits should be recorded related to uncertain tax positions. Management is not aware of any tax positions for which it is reasonably possible that the total amounts of unrecognized tax benefits will change materially in the next 12 months.
The Fund files tax returns in the U.S. Federal jurisdiction and certain other jurisdictions. Generally, the Fund is subject to examinations by such taxing authorities for up to three years after the filing of the return for the tax period.
| F. | Expenses -Fees provided for under the Rule 12b-1 plan of a particular class of the Fund are charged to the operations of such class. Transfer agency fees and expenses and other shareholder recordkeeping fees and expenses relating to all other classes are allocated among those classes based on relative net assets. All other expenses are allocated among the classes based on relative net assets. |
| G. | Accounting Estimates -The financial statements are prepared on a basis in conformity with GAAP, which requires management to make estimates and assumptions that affect the reported amounts of assets and liabilities at the date of the financial statements and the reported amounts of revenues and expenses during the reporting period including estimates and assumptions related to taxation. Actual results could differ from those estimates by a significant amount. In addition, the Fund monitors for material events or transactions that may occur or become known after the period-end date and before the date the financial statements are released to print. |
|
16 INVESCO OPPENHEIMER V.I. DISCOVERY MID CAP GROWTH FUND |
| | H. Indemnifications | -Under the Trust’s organizational documents, each Trustee, officer, employee or other agent of the Trust is indemnified against certain liabilities that may arise out of the performance of their duties to the Fund. Additionally, in the normal course of business, the Fund enters into contracts, including the Fund’s servicing agreements, that contain a variety of indemnification clauses. The Fund’s maximum exposure under these arrangements is unknown as this would involve future claims that may be made against the Fund that have not yet occurred. The risk of material loss as a result of such indemnification claims is considered remote. |
Note 2 – Advisory Fees and Other Fees Paid to Affiliates
The Trust has entered into a master investment advisory agreement with Invesco Advisers, Inc. (the “Adviser” or “Invesco”). Under the terms of the investment advisory agreement, the Fund accrues daily and pays monthly an advisory fee to the Adviser based on the annual rate of the Fund’s average daily net assets as follows:
| | | | |
| Fee Schedule* | |
| Up to $200 million | | | 0.75% | |
| Next $200 million | | | 0.72 | |
| Next $200 million | | | 0.69 | |
| Next $200 million | | | 0.66 | |
| Next $700 million | | | 0.60 | |
| Over $1.5 billion | | | 0.58 | |
* The advisory fee paid by the Fund shall be reduced by any amounts paid by the Fund under the administrative services agreement with the Adviser.
For the year ended December 31, 2019, the effective advisory fees incurred by the Fund was 0.70%.
From the beginning of the fiscal period until the date of the Reorganization, the Acquired Fund paid $1,948,311 in advisory fees to OFI Global Asset Management, Inc. based on the annual rates above of the Acquired Fund’s average daily net assets.
Under the terms of a master sub-advisory agreement between the Adviser and each of Invesco Asset Management Deutschland GmbH, Invesco Asset Management Limited, Invesco Asset Management (Japan) Limited, Invesco Hong Kong Limited, Invesco Senior Secured Management, Inc. and Invesco Canada Ltd. and separate sub-advisory agreements with Invesco Capital Management LLC, and Invesco Asset Management (India) Private Limited (collectively, the “Affiliated Sub-Advisers”) the Adviser, not the Fund, will pay 40% of the fees paid to the Adviser to any such Affiliated Sub-Adviser(s) that provide(s) discretionary investment management services to the Fund based on the percentage of assets allocated to such Affiliated Sub-Adviser(s). Invesco has also entered into a Sub-Advisory Agreement with OppenheimerFunds, Inc. to provide discretionary management services to the Funds.
Effective on the Reorganization Date, the Adviser has contractually agreed, through May 31, 2021, to waive advisory fees and/or reimburse expenses of all shares to the extent necessary to limit the total annual fund operating expenses after fee waiver and/or expense reimbursement (excluding certain items discussed below) of Series I and Series II shares to 0.80% and 1.05%, respectively, of the Fund’s average daily net assets (the “expense limits”). In determining the Adviser’s obligation to waive advisory fees and/or reimburse expenses, the following expenses are not taken into account, and could cause total annual fund operating expenses after fee waivers and/or expense reimbursement to exceed the numbers reflected above: (1) interest; (2) taxes; (3) dividend expenses on short sales; (4) extraordinary or non-routine items, including litigation expenses; and (5) expenses that the Fund has incurred but did not actually pay because of an expense offset arrangement. Unless Invesco continues the fee waiver agreement, it will terminate on May 31, 2021. During its term, the fee waiver agreement cannot be terminated or amended to increase the expense limits or reduce the advisory fee waiver without approval of the Board of Trustees.
Further, the Adviser has contractually agreed, through at least June 30, 2021, to waive the advisory fee payable by the Fund in an amount equal to 100% of the net advisory fees the Adviser receives from the affiliated money market funds on investments by the Fund of uninvested cash in such affiliated money market funds.
For the year ended December 31, 2019, the Adviser waived advisory fees of $10,917 and reimbursed Fund expenses of $469,954 and $32,106 for Series I and Series II shares, respectively.
Prior to the Reorganization, OFI Global Asset Management, Inc. had contractually agreed to waive fees and/or reimburse expenses of Non-Service and Service shares to 0.80% and 1.05%, respectively, of the Acquired Fund’s average daily net assets.
The Trust has entered into a master administrative services agreement with Invesco pursuant to which the Fund has agreed to pay Invesco a fee for costs incurred in providing accounting services and fund administrative services to the Fund and to reimburse Invesco for fees paid to insurance companies that have agreed to provide certain administrative services to the Fund. These administrative services provided by the insurance companies may include, among other things: maintenance of master accounts with the Fund; tracking, recording and transmitting net purchase and redemption orders for Fund shares; maintaining and preserving records related to the purchase, redemption and other account activity of variable product owners; distributing copies of Fund documents such as prospectuses, proxy materials and periodic reports, to variable product owners, and responding to inquiries from variable product owners about the Fund. Pursuant to such agreement, for the year ended December 31, 2019, Invesco was paid $61,986 for accounting and fund administrative services and was reimbursed $647,404 for fees paid to insurance companies. Additionally, Invesco has entered into service agreements whereby JPMorgan Chase Bank serves as custodian to the Fund. Prior to the Reorganization, the Acquired Fund paid administrative fees to OFI Global Asset Management, Inc.
The Trust has entered into a transfer agency and service agreement with Invesco Investment Services, Inc. (“IIS”) pursuant to which the Fund has agreed to pay IIS a fee for providing transfer agency and shareholder services to the Fund and reimburse IIS for certain expenses incurred by IIS in the course of providing such services. Prior to the Reorganization, the Acquired Fund paid transfer agent fees to OFI Global Asset Management, Inc. and Shareholder Services, Inc. For the year ended December 31, 2019, expenses incurred under these agreements are shown in the Statement of Operations
|
17 INVESCO OPPENHEIMER V.I. DISCOVERY MID CAP GROWTH FUND |
NOTES TO FINANCIAL STATEMENTSContinued
as Transfer and shareholder servicing agent fees.
The Trust has entered into master distribution agreements with Invesco Distributors, Inc. (“IDI”) to serve as the distributor for the Series II shares of the Fund. The Trust has adopted a plan pursuant to Rule 12b-1 under the 1940 Act with respect to the Fund’s Series II shares (the “Plan”). The Fund, pursuant to the Plan, pays IDI at an annual rate of 0.25% of the average daily net assets of Series II shares. The fees are accrued daily and paid monthly. Of the Plan payments, up to 0.25% of the average daily net assets of the class of shares may be paid to insurance companies who furnish continuing personal shareholder services to customers who purchase and own shares of such class. Any amounts not paid as a service fee under the Plan would constitute an asset-based sales charge. Rules of the Financial Industry Regulatory Authority (“FINRA”) impose a cap on the total sales charges, including asset-based sales charges, that may be paid by any class of shares of the Fund plans. Prior to the Reorganization, the Acquired Fund paid distribution fees to OppenheimerFunds Distributor, Inc. For the year ended December 31, 2019, expenses incurred under the plans are shown in the Statement of Operations as Distribution and service plan fees.
Certain officers and trustees of the Trust are officers and directors of the Adviser, IIS and/or IDI.
Note 3 – Additional Valuation Information
GAAP defines fair value as the price that would be received to sell an asset or paid to transfer a liability in an orderly transaction between market participants at the measurement date, under current market conditions. GAAP establishes a hierarchy that prioritizes the inputs to valuation methods, giving the highest priority to readily available unadjusted quoted prices in an active market for identical assets (Level 1) and the lowest priority to significant unobservable inputs (Level 3), generally when market prices are not readily available or are unreliable. Based on the valuation inputs, the securities or other investments are tiered into one of three levels. Changes in valuation methods may result in transfers in or out of an investment’s assigned level:
Level 1 — Prices are determined using quoted prices in an active market for identical assets.
Level 2 — Prices are determined using other significant observable inputs. Observable inputs are inputs that other market participants may use in pricing a security. These may include quoted prices for similar securities, interest rates, prepayment speeds, credit risk, yield curves, loss severities, default rates, discount rates, volatilities and others.
Level 3 — Prices are determined using significant unobservable inputs. In situations where quoted prices or observable inputs are unavailable (for example, when there is little or no market activity for an investment at the end of the period), unobservable inputs may be used. Unobservable inputs reflect the Fund’s own assumptions about the factors market participants would use in determining fair value of the securities or instruments and would be based on the best available information.
As of December 31, 2019, all of the securities in this Fund were valued based on Level 1 inputs (see the Schedule of Investments for security categories). The level assigned to the securities valuations may not be an indication of the risk or liquidity associated with investing in those securities. Because of the inherent uncertainties of valuation, the values reflected in the financial statements may materially differ from the value received upon actual sale of those investments.
Note 4 - Security Transactions with Affiliated Funds
The Fund is permitted to purchase or sell securities from or to certain other Invesco Funds under specified conditions outlined in procedures adopted by the Board of Trustees of the Trust. The procedures have been designed to ensure that any purchase or sale of securities by the Fund from or to another fund or portfolio that is or could be considered an affiliate by virtue of having a common investment adviser (or affiliated investment advisers), common Trustees and/or common officers complies with Rule 17a-7 of the 1940 Act. Further, as defined under the procedures, each transaction is effected at the current market price. Pursuant to these procedures for the period January 1, 2019 to May 24, 2019, the Predecessor Fund engaged in transactions with affiliates as listed: Securities purchases of $1,560,045 and securities sales of $1,518,654, which resulted in net realized gains (losses) of $(149,286). For the period May 25, 2019 to December 31, 2019, the Fund engaged in transactions with affiliates as listed: Securities purchases of $1,770,648.
Note 5 – Expense Offset Arrangements
The expense offset arrangement is comprised of custodian credits which result from periodic overnight cash balances at the custodian. For the year ended December 31, 2019, the Fund received credits from this arrangement, which resulted in the reduction of the Fund’s total expenses of $2,666.
Note 6 – Trustee and Officer Fees and Benefits
Certain Trustees have executed Deferred Compensation Agreement(s) pursuant to which they have the option to elect to defer receipt of all or a portion of the annual compensation they are entitled to receive from the Fund. For purposes of determining the amount owed to the Trustees under the plan(s), deferred amounts are treated as though equal dollar amounts had been invested in shares of the Fund or in other Invesco and/or Invesco Oppenheimer funds selected by the Trustees. The Fund purchases shares of the funds selected for deferral by the Trustees in amounts equal to his or her deemed investment, resulting in a Fund asset equal to the deferred compensation liability. Such assets are included as a component of “Other” within the asset section of the Statement of Assets and Liabilities. Deferral of Trustees’ fees under the plan(s) will not affect the net assets of the Fund and will not materially affect the Fund’s assets, liabilities or net investment income per share. Amounts will be deferred until distributed in accordance with the
|
18 INVESCO OPPENHEIMER V.I. DISCOVERY MID CAP GROWTH FUND |
Deferred Compensation Agreement(s).
Note 7 – Cash Balances
The Fund is permitted to temporarily carry a negative or overdrawn balance in its account with JPMorgan Chase Bank, the custodian bank. Such balances, if any at period-end, are shown in the Statement of Assets and Liabilities under the payable caption Amount due custodian. To compensate the custodian bank for such overdrafts, the overdrawn Fund may either (1) leave funds as a compensating balance in the account so the custodian bank can be compensated by earning the additional interest; or (2) compensate by paying the custodian bank at a rate agreed upon by the custodian bank and Invesco, not to exceed the contractually agreed upon rate.
Note 8 – Distributions to Shareholders and Tax Components of Net Assets
Tax Character of Distributions to Shareholders Paid During the Fiscal Years Ended December 31, 2019 and 2018:
| | | | | | | | |
| | | 2019 | | | 2018 | |
Ordinary income | | $ | — | | | $ | 23,521,359 | |
Long-term capital gain | | | 90,456,470 | | | | 78,098,396 | |
| | | | |
Total distributions | | $ | 90,456,470 | | | $ | 101,619,755 | |
| | | | |
Tax Components of Net Assets at Period-End:
| | | | |
| | | 2019 | |
Undistributed ordinary income | | $ | 271,534 | |
Undistributed long-term gain | | | 65,337,809 | |
Net unrealized appreciation - investments | | | 198,919,479 | |
Temporary book/tax differences | | | (76,887) | |
Shares of beneficial interest | | | 480,284,478 | |
| | | | |
Total net assets | | $ | 744,736,413 | |
| | | | |
The difference between book-basis and tax-basis unrealized appreciation (depreciation) is due to differences in the timing of recognition of gains and losses on investments for tax and book purposes. The Fund’s net unrealized appreciation (depreciation) difference is attributable primarily to wash sales.
The temporary book/tax differences are a result of timing differences between book and tax recognition of income and/or expenses. The Fund’s temporary book/tax differences are the result of the trustee deferral of compensation and retirement plan benefits.
Capital loss carryforward is calculated and reported as of a specific date. Results of transactions and other activity after that date may affect the amount of capital loss carryforward actually available for the Fund to utilize. Capital losses generated in years beginning after December 22, 2010 can be carried forward for an unlimited period, whereas previous losses expire in eight tax years. Capital losses with an expiration period may not be used to offset capital gains until all net capital losses without an expiration date have been utilized. Capital loss carryforwards with no expiration date will retain their character as either short-term or long-term capital losses instead of as short-term capital losses as under prior law. The ability to utilize capital loss carryforwards in the future may be limited under the Internal Revenue Code and related regulations based on the results of future transactions.
The Fund has no capital loss carryforward as of December 31, 2019.
Note 9 – Investment Transactions
The aggregate amount of investment securities (other than short-term securities, U.S. Treasury obligations and money market funds, if any) purchased and sold by the Fund during the ended December 31, 2019 was $537,987,901 and $614,579,018, respectively. Cost of investments, including any derivatives, on a tax basis includes the adjustments for financial reporting purposes as of the most recently completed federal income tax reporting period-end.
| | | | |
| Unrealized Appreciation (Depreciation) of Investments on a Tax Basis | |
Aggregate unrealized appreciation of investments | | $ | 199,952,678 | |
Aggregate unrealized (depreciation) of investments | | | (1,033,199) | |
| | | | |
Net unrealized appreciation of investments | | $ | 198,919,479 | |
| | | | |
Cost of investments for tax purposes is $545,349,521.
Note 10 – Reclassification of Permanent Differences
Primarily as a result of differing book/tax treatment of post financial statement adjustments, on December 31, 2019, undistributed net realized gain (loss) was decreased by $30,396 and shares of beneficial interest was increased by $30,396. This reclassification had no effect on the net assets of the Fund.
|
19 INVESCO OPPENHEIMER V.I. DISCOVERY MID CAP GROWTH FUND |
NOTES TO FINANCIAL STATEMENTSContinued
Note 11 – Share Information
Transactions in shares of beneficial interest were as follows:
| | | | | | | | | | | | | | | | |
| | | Year Ended December 31, 20191 | | | Year Ended December 31, 2018 | |
| | | | |
| | | Shares | | | Amount | | | Shares | | | Amount |
Series I Shares | | | | | | | | | | | | | | | | |
Sold | | | 189,092 | | | $ | 15,154,696 | | | | 349,932 | | | $ | 26,834,584 | |
Dividends and/or distributions reinvested | | | 1,097,324 | | | | 84,658,513 | | | | 1,182,843 | | | | 95,656,703 | |
Redeemed | | | (1,553,777) | | | | (125,738,832) | | | | (1,242,422 | ) | | | (102,207,288 | ) |
| | | | |
| Net increase (decrease) | | | (267,361) | | | $ | (25,925,623) | | | | 290,353 | | | $ | 20,283,999 | |
| | | | |
| | | | |
| | | | | | | | | | | | | | | | |
Series II Shares | | | | | | | | | | | | | | | | |
Sold | | | 150,758 | | | $ | 11,141,446 | | | | 110,486 | | | $ | 8,346,786 | |
Dividends and/or distributions reinvested | | | 80,955 | | | | 5,797,957 | | | | 78,492 | | | | 5,963,052 | |
Redeemed | | | (115,611) | | | | (8,655,710) | | | | (140,477) | | | | (10,461,719) | |
| | | | |
| Net increase (decrease) | | | 116,102 | | | $ | 8,283,693 | | | | 48,501 | | | $ | 3,848,119 | |
| | | | |
| | | | |
1.There are entities that are record owners of more than 5% of the outstanding shares of the Fund and own 47% of the outstanding shares of the Fund. The Fund and the Fund’s principal underwriter or adviser, are parties to participation agreements with these entities whereby these entities sell units of interest in separate accounts funding variable products that are invested in the Fund. The Fund, Invesco and/or Invesco affiliates may make payments to these entities, which are considered to be related to the Fund, for providing services to the Fund, Invesco and/or Invesco affiliates, including, but not limited to services such as securities brokerage, distribution, third party record keeping and account servicing. The Fund has no knowledge as to whether all or any portion of the shares owned of record by these entities are also owned beneficially.
Note 12 – Borrowings
Joint Credit Facility.A number of mutual funds managed by the Adviser participate in a $1.95 billion revolving credit facility (the “Facility”) intended to provide short-term financing, if necessary, subject to certain restrictions in connection with atypical redemption activity. Expenses and fees related to the Facility are paid by the participating funds and are disclosed separately or as other expenses on the Statement of Operations. The Fund did not utilize the Facility during the reporting period. The Facility terminated May 24, 2019.
Note 13 – Significant Event
The Board of Trustees unanimously approved an Agreement and Plan of Reorganization (the “Agreement”) pursuant to which Invesco Oppenheimer VI Discovery Mid Cap Growth Fund (the “Fund”) would acquire all of the assets and liabilities of Invesco VI Mid Cap Growth Fund (the “Target Fund”) in exchange for shares of the Fund.
The Agreement requires approval of the Target Fund’s shareholders and will be submitted to the shareholders for their consideration at a meeting to be held in or around April 2020. Upon closing of the reorganization, shareholders of the Target Fund will receive a corresponding class of shares of the Fund in exchange for their shares of the Target Fund and the Target Fund will liquidate and cease operations.
|
20 INVESCO OPPENHEIMER V.I. DISCOVERY MID CAP GROWTH FUND |
REPORT OF INDEPENDENT REGISTERED PUBLIC ACCOUNTING FIRM
To the Board of Trustees of AIM Variable Insurance Funds (Invesco Variable Insurance Funds) and Shareholders of Invesco Oppenheimer V.I. Discovery Mid Cap Growth Fund
Opinion on the Financial Statements
We have audited the accompanying statement of assets and liabilities, including the schedule of investments, of Invesco Oppenheimer V.I. Discovery Mid Cap Growth Fund (one of the funds constituting AIM Variable Insurance Funds (Invesco Variable Insurance Funds), referred to hereafter as the “Fund”) as of December 31, 2019, the related statements of operations and of changes in net assets for the year ended December 31, 2019, including the related notes, and the financial highlights for the period ended December 31, 2019 (collectively referred to as the “financial statements”). In our opinion, the financial statements present fairly, in all material respects, the financial position of the Fund as of December 31, 2019, the results of its operations and changes in its net assets for the year ended December 31, 2019 and the financial highlights for the period ended December 31, 2019 in conformity with accounting principles generally accepted in the United States of America.
The financial statements of Invesco Oppenheimer V.I. Discovery Mid Cap Growth Fund (formerly known as Oppenheimer Discovery Mid Cap Growth Fund/VA) as of and for the year ended December 31, 2018 and the financial highlights for each of the periods ended on or prior to December 31, 2018 (not presented herein, other than the statement of changes in net assets and the financial highlights) were audited by other auditors whose report dated February 14, 2019 expressed an unqualified opinion on those financial statements and financial highlights.
Basis for Opinion
These financial statements are the responsibility of the Fund’s management. Our responsibility is to express an opinion on the Fund’s financial statements based on our audit. We are a public accounting firm registered with the Public Company Accounting Oversight Board (United States) (PCAOB) and are required to be independent with respect to the Fund in accordance with the U.S. federal securities laws and the applicable rules and regulations of the Securities and Exchange Commission and the PCAOB.
We conducted our audit of these financial statements in accordance with the standards of the PCAOB. Those standards require that we plan and perform the audit to obtain reasonable assurance about whether the financial statements are free of material misstatement, whether due to error or fraud.
Our audit included performing procedures to assess the risks of material misstatement of the financial statements, whether due to error or fraud, and performing procedures that respond to those risks. Such procedures included examining, on a test basis, evidence regarding the amounts and disclosures in the financial statements. Our audit also included evaluating the accounting principles used and significant estimates made by management, as well as evaluating the overall presentation of the financial statements. Our procedures included confirmation of securities owned as of December 31, 2019 by correspondence with the custodian, transfer agent and brokers; when replies were not received from brokers, we performed other auditing procedures. We believe that our audit provides a reasonable basis for our opinion.
/s/PricewaterhouseCoopers LLP
Houston, Texas
February 18, 2020
We have served as the auditor of one or more of the investment companies in the Invesco group of investment companies since at least 1995. We have not been able to determine the specific year we began serving as auditor.
|
| 21 INVESCO OPPENHEIMER V.I. DISCOVERY MID CAP GROWTH FUND |
TAX INFORMATION
Form 1099-DIV, Form 1042-S and other year–end tax information provide shareholders with actual calendar year amounts that should be included in their tax returns. Shareholders should consult their tax advisers.
The following distribution information is being provided as required by the Internal Revenue Code or to meet a specific state’s requirement. The Fund designates the following amounts or, if subsequently determined to be different, the maximum amount allowable for its fiscal year ended December 31, 2019:
| | | | |
| Federal and State Income Tax | | | |
| |
Long-Term Capital Gain Distributions | | | $90,456,470 | |
|
| 22 INVESCO OPPENHEIMER V.I. DISCOVERY MID CAP GROWTH FUND |
PORTFOLIO PROXY VOTING POLICIES AND GUIDELINES; UPDATES TO SCHEDULE OF INVESTMENTS
Go paperless with eDelivery
Visit invesco.com/edelivery to enjoy the convenience and security of anytime electronic access to your investment documents.
With eDelivery, you can elect to have any or all of the following materials delivered straight to your inbox to download, save and print from your own computer:
| • | | Fund reports and prospectuses |
Invesco mailing information
Send general correspondence to Invesco Investment Services, Inc., P.O. Box 219078, Kansas City, MO 64121-9078.
Important notice regarding delivery of security holder documents
To reduce Fund expenses, only one copy of most shareholder documents may be mailed to shareholders with multiple accounts at the same address (Householding). Mailing of your shareholder documents may be householded indefinitely unless you instruct us otherwise. If you do not want the mailing of these documents to be combined with those for other members of your household, please contact Invesco Investment Services, Inc. at 800 959 4246 or contact your financial institution. We will begin sending you individual copies for each account within 30 days after receiving your request.
Fund holdings and proxy voting information
The Fund provides a complete list of its holdings four times in each fiscal year, at the quarter ends. For the second and fourth quarters, the lists appear in the Fund’s semiannual and annual reports to shareholders. For the first and third quarters, the Fund files the lists with the Securities and Exchange Commission (SEC) as an exhibit to its reports on Form N-PORT. The most recent list of portfolio holdings is available at invesco.com/completeqtrholdings. Shareholders can also look up the Fund’s Forms N-PORT on the SEC website at sec.gov.
A description of the policies and procedures that the Fund uses to determine how to vote proxies relating to portfolio securities is available without charge, upon request, from our Client Services department at 800 959 4246 or at invesco.com/proxyguidelines. The information is also available on the SEC website, sec.gov. Information regarding how the Fund voted proxies related to its portfolio securities during the most recent 12-month period ended June 30 is available at invesco. com/proxysearch. The information is also available on the SEC website, sec.gov.
Invesco Advisers, Inc. is an investment adviser; it provides investment advisory services to individual and institutional clients and does not sell securities. Invesco Distributors, Inc. is the US distributor for Invesco Ltd.’s retail mutual funds, exchange-traded funds and institutional money market funds. Both are wholly owned, indirect subsidiaries of Invesco Ltd.
|
| 23 INVESCO OPPENHEIMER V.I. DISCOVERY MID CAP GROWTH FUND |
TRUSTEES AND OFFICERS
The address of each trustee and officer is AIM Variable Insurance Funds (Invesco Variable Insurance Funds) (the “Trust”), 11 Greenway Plaza, Suite 1000, Houston, Texas 77046-1173. The trustees serve for the life of the Trust, subject to their earlier death, incapacitation, resignation, retirement or removal as more specifically provided in the Trust’s organizational documents. Each officer serves for a one year term or until their successors are elected and qualified. Column two below includes length of time served with predecessor entities, if any.
| | | | | | | | |
| | | | | |
Name, Year of Birth and Position(s) Held with the Trust | | Trustee and/or Officer Since | | Principal Occupation(s) During Past 5 Years | | Number of Funds in Fund Complex
Overseen by Trustee | | Other Directorship(s) Held by Trustee During Past
5 Years |
INTERESTED PERSON | | | | | | | | |
| | | | | |
Martin L. Flanagan 1– 1960 Trustee and Vice Chair | | 2007 | | Executive Director, Chief Executive Officer and President, Invesco Ltd. (ultimate parent of Invesco and a global investment management firm); Trustee and Vice Chair, The Invesco Funds; Vice Chair, Investment Company Institute; and Member of Executive Board, SMU Cox School of Business Formerly: Advisor to the Board, Invesco Advisers, Inc. (formerly known as Invesco Institutional (N.A.), Inc.); Chairman and Chief Executive Officer, Invesco Advisers, Inc. (registered investment adviser); Director, Chairman, Chief Executive Officer and President, Invesco Holding Company (US), Inc. (formerly IVZ Inc.) (holding company), Invesco Group Services, Inc. (service provider) and Invesco North American Holdings, Inc. (holding company); Director, Chief Executive Officer and President, Invesco Holding Company Limited (parent of Invesco and a global investment management firm); Director, Invesco Ltd.; Chairman, Investment Company Institute and President,Co-Chief Executive Officer,Co-President, Chief Operating Officer and Chief Financial Officer, Franklin Resources, Inc. (global investment management organization) | | 229 | | None |
| |
| 1Mr. Flanagan is considered an interested person (within the meaning of Section 2(a)(19) of the 1940 Act) of the Trust because he is an officer of the Adviser to the Trust, and an officer and a director of Invesco Ltd., ultimate parent of the Adviser. |
24 INVESCO OPPENHEIMER V.I. DISCOVERY MID CAP GROWTH FUND
| | | | | | | | |
| | | | | |
Name, Year of Birth and Position(s) Held with the Trust | | Trustee and/or Officer Since | | Principal Occupation(s) During Past 5 Years | | Number of Funds in Fund Complex
Overseen by Trustee | | Other Directorship(s) Held by Trustee During Past
5 Years |
INDEPENDENT TRUSTEES | | | | | | | | |
| | | | | |
Bruce L. Crockett – 1944 Trustee and Chair | | 2003 | | Chairman, Crockett Technologies Associates (technology consulting company) Formerly: Director, Captaris (unified messaging provider); Director, President and Chief Executive Officer, COMSAT Corporation; Chairman, Board of Governors of INTELSAT (international communications company); ACE Limited (insurance company); Independent Directors Council and Investment Company Institute: Member of the Audit Committee, Investment Company Institute; Member of the Executive Committee and Chair of the Governance Committee, Independent Directors Council | | 229 | | Director and Chairman of the Audit Committee, ALPS (Attorneys Liability Protection Society) (insurance company); Director and Member of the Audit Committee and Compensation Committee, Ferroglobe PLC (metallurgical company) |
| | | | | |
David C. Arch – 1945 Trustee | | 2010 | | Chairman of Blistex Inc. (consumer health care products manufacturer); Member, World Presidents’ Organization | | 229 | | Board member of the Illinois Manufacturers’ Association |
| | | | | |
Beth Ann Brown – 1968 Trustee | | 2019 | | Independent Consultant Formerly: Head of Intermediary Distribution, Managing Director, Strategic Relations, Managing Director, Head of National Accounts, Senior Vice President, National Account Manager and Senior Vice President, Key Account Manager, Columbia Management Investment Advisers LLC; Vice President, Key Account Manager, Liberty Funds Distributor, Inc.; and Trustee of certain Oppenheimer Funds | | 229 | | Director, Board of Directors of Caron Engineering Inc.; Advisor, Board of Advisors of Caron Engineering Inc.; President and Director, of Acton Shapleigh Youth Conservation Corps (non-profit); and Vice President and Director of Grahamtastic Connection (non-profit) |
| | | | | |
Jack M. Fields – 1952 Trustee | | 2003 | | Chief Executive Officer, Twenty First Century Group, Inc. (government affairs company); and Chairman, Discovery Learning Alliance(non-profit) Formerly: Owner and Chief Executive Officer, Dos Angeles Ranch L.P. (cattle, hunting, corporate entertainment); Director, Insperity, Inc. (formerly known as Administaff) (human resources provider); Chief Executive Officer, Texana Timber LP (sustainable forestry company); Director of Cross Timbers Quail Research Ranch(non-profit); and member of the U.S. House of Representatives | | 229 | | None |
| | | | | |
Cynthia Hostetler – 1962 Trustee | | 2017 | | Non-Executive Director and Trustee of a number of public and private business corporations Formerly: Director, Aberdeen Investment Funds (4 portfolios); Head of Investment Funds and Private Equity, Overseas Private Investment Corporation; President, First Manhattan Bancorporation, Inc.; Attorney, Simpson Thacher & Bartlett LLP | | 229 | | Vulcan Materials Company (construction materials company); Trilinc Global Impact Fund; Genesee & Wyoming, Inc. (railroads); Artio Global Investment LLC (mutual fund complex); Edgen Group, Inc. (specialized energy and infrastructure products distributor); Investment Company Institute (professional organization); Independent Directors Council (professional organization) |
| | | | | |
Eli Jones – 1961 Trustee | | 2016 | | Professor and Dean, Mays Business School - Texas A&M University Formerly: Professor and Dean, Walton College of Business, University of Arkansas and E.J. Ourso College of Business, Louisiana State University; Director, Arvest Bank | | 229 | | Insperity, Inc. (formerly known as Administaff) (human resources provider) |
| | | | | |
Elizabeth Krentzman – 1959 Trustee | | 2019 | | Formerly: Principal and Chief Regulatory Advisor for Asset Management Services and U.S. Mutual Fund Leader of Deloitte & Touche LLP; General Counsel of the Investment Company Institute (trade association); National Director of the Investment Management Regulatory Consulting Practice, Principal, Director and Senior Manager of Deloitte & Touche LLP; Assistant Director of the Division of Investment Management – Office of Disclosure and Investment Adviser Regulation of the U.S. Securities and Exchange Commission and various positions with the Division of Investment Management – Office of Regulatory Policy of the U.S. Securities and Exchange Commission; Associate at Ropes & Gray LLP.; Advisory Board Member of the Securities and Exchange Commission Historical Society; and Trustee of certain Oppenheimer Funds | | 229 | | Trustee of the University of Florida National Board Foundation and Audit Committee Member; Member of the Cartica Funds Board of Directors (private investment funds); Member of the University of Florida Law Center Association, Inc. Board of Trustees and Audit Committee Member |
| | | | | |
Anthony J. LaCava, Jr. – 1956 Trustee | | 2019 | | Formerly: Director and Member of the Audit Committee, Blue Hills Bank (publicly traded financial institution) and Managing Partner, KPMG LLP | | 229* | | Blue Hills Bank; Chairman of Bentley University; Member, Business School Advisory Council; and Nominating Committee, KPMG LLP |
25 INVESCO OPPENHEIMER V.I. DISCOVERY MID CAP GROWTH FUND
TRUSTEES AND OFFICERS Continued
| | | | | | | | |
| | | | | |
Name, Year of Birth and Position(s) Held with the Trust | | Trustee and/or Officer Since | | Principal Occupation(s) During Past 5 Years | | Number of Funds in Fund Complex
Overseen by Trustee | | Other Directorship(s) Held by Trustee During Past
5 Years |
INDEPENDENT TRUSTEES (CONTINUED) | | | | | | | | |
| | | | | |
Prema Mathai-Davis – 1950 Trustee | | 2003 | | Retired Co-Owner & Partner of Quantalytics Research, LLC, (a FinTech Investment Research Platform for the Self-Directed Investor) | | 229 | | None |
| | | | | |
Joel W. Motley – 1952 Trustee | | 2019 | | Director of Office of Finance, Federal Home Loan Bank; Member of the Vestry of Trinity Wall Street; Managing Director of Carmona Motley Hoffman, Inc. (privately held financial advisor); Member of the Finance and Budget Committee of the Council on Foreign Relations, Member of the Investment Committee and Board of Human Rights Watch and Member of the Investment Committee and Board of Historic Hudson Valley(non-profit cultural organization). Formerly: Managing Director of Public Capital Advisors, LLC (privately held financial advisor); Managing Director of Carmona Motley Hoffman, Inc. (privately held financial advisor); Trustee of certain Oppenheimer Funds; and Director of Columbia Equity Financial Corp. (privately held financial advisor) | | 229 | | Director of Greenwall Foundation (bioethics research foundation); Member of Board and Investment Committee of The Greenwall Foundation; Director of Southern Africa Legal Services Foundation; Board Member and Investment Committee Member of Pulitzer Center for Crisis Reporting(non-profit journalism) |
| | | | | |
Teresa M. Ressel – 1962 Trustee | | 2017 | | Non-executive director and trustee of a number of public and private business corporations Formerly: Chief Financial Officer, Olayan America, The Olayan Group (international investor/commercial/industrial); Chief Executive Officer, UBS Securities LLC; Group Chief Operating Officer, Americas, UBS AG; Assistant Secretary for Management & Budget and CFO, US Department of the Treasury | | 229 | | Atlantic Power Corporation (power generation company); ON Semiconductor Corp. (semiconductor supplier) |
| | | | | |
Ann Barnett Stern – 1957 Trustee | | 2017 | | President and Chief Executive Officer, Houston Endowment Inc. (private philanthropic institution) Formerly: Executive Vice President and General Counsel, Texas Children’s Hospital; Attorney, Beck, Redden and Secrest, LLP; Business Law Instructor, University of St. Thomas; Attorney, Andrews & Kurth LLP | | 229 | | Federal Reserve Bank of Dallas |
| | | | | |
Robert C. Troccoli – 1949 Trustee | | 2016 | | Retired Formerly: Adjunct Professor, University of Denver – Daniels College of Business, Senior Partner, KPMG LLP | | 229 | | None |
| | | | | |
Daniel S. Vandivort – 1954 Trustee | | 2019 | | Treasurer, Chairman of the Audit and Finance Committee, and Trustee, Board of Trustees, Huntington Disease Foundation of America; and President, Flyway Advisory Services LLC (consulting and property management). Formerly: Trustee and Governance Chair, of certain Oppenheimer Funds | | 229 | | Chairman and Lead Independent Director, Chairman of the Audit Committee, and Director, Board of Directors, Value Line Funds |
| | | | | |
James D. Vaughn – 1945 Trustee | | 2019 | | Retired Formerly: Managing Partner, Deloitte & Touche LLP; Trustee and Chairman of the Audit Committee, Schroder Funds; Board Member, Mile High United Way, Boys and Girls Clubs, Boy Scouts, Colorado Business Committee for the Arts, Economic Club of Colorado and Metro Denver Network (economic development corporation); and Trustee of certain Oppenheimer Funds | | 229 | | Board member and Chairman of Audit Committee of AMG National Trust Bank; Trustee and Investment Committee member, University of South Dakota Foundation; Board member, Audit Committee Member and past Board Chair, Junior Achievement(non-profit) |
| | | | | |
Christopher L. Wilson – 1957 Trustee, Vice Chair and Chair Designate | | 2017 | | Retired Formerly: Director, TD Asset Management USA Inc. (mutual fund complex) (22 portfolios); Managing Partner, CT2, LLC (investing and consulting firm); President/Chief Executive Officer, Columbia Funds, Bank of America Corporation; President/Chief Executive Officer, CDC IXIS Asset Management Services, Inc.; Principal & Director of Operations, Scudder Funds, Scudder, Stevens & Clark, Inc.; Assistant Vice President, Fidelity Investments | | 229 | | ISO New England, Inc.(non-profit organization managing regional electricity market) |
26 INVESCO OPPENHEIMER V.I. DISCOVERY MID CAP GROWTH FUND
| | | | | | | | |
| | | | | |
Name, Year of Birth and Position(s) Held with the Trust | | Trustee and/or Officer Since | | Principal Occupation(s) During Past 5 Years | | Number of Funds in Fund Complex
Overseen by Trustee | | Other Directorship(s) Held by Trustee During Past
5 Years |
OTHER OFFICERS | | | | | | | | |
| | | | | |
Sheri Morris – 1964 President, Principal Executive Officer and Treasurer | | 2003 | | Head of Global Fund Services, Invesco Ltd.; President, Principal Executive Officer and Treasurer, The Invesco Funds; Vice President, Invesco Advisers, Inc. (formerly known as Invesco Institutional (N.A.), Inc.) (registered investment adviser); and Vice President, Invesco Exchange-Traded Fund Trust, Invesco Exchange-Traded Fund Trust II, Invesco India Exchange-Traded Fund Trust, Invesco Actively Managed Exchange-Traded Fund Trust, Invesco Actively Managed Exchange-Traded Commodity Fund Trust and Invesco Exchange-Traded Self-Indexed Fund Trust, and Vice President, OppenheimerFunds, Inc. Formerly: Vice President and Principal Financial Officer, The Invesco Funds; Vice President, Invesco AIM Advisers, Inc., Invesco AIM Capital Management, Inc. and Invesco AIM Private Asset Management, Inc.; Assistant Vice President and Assistant Treasurer, The Invesco Funds and Assistant Vice President, Invesco Advisers, Inc., Invesco AIM Capital Management, Inc. and Invesco AIM Private Asset Management, Inc.; and Treasurer, Invesco Exchange-Traded Fund Trust, Invesco Exchange-Traded Fund Trust II, Invesco India Exchange-Traded Fund Trust and Invesco Actively Managed Exchange-Traded Fund Trust | | N/A | | N/A |
| | | | | |
Russell C. Burk – 1958 Senior Vice President and Senior Officer | | 2005 | | Senior Vice President and Senior Officer, The Invesco Funds | | N/A | | N/A |
| | | | | |
Jeffrey H. Kupor – 1968 Senior Vice President, Chief Legal Officer and Secretary | | 2018 | | Head of Legal of the Americas, Invesco Ltd.; Senior Vice President and Secretary, Invesco Advisers, Inc. (formerly known as Invesco Institutional (N.A.), Inc.) (registered investment adviser); Senior Vice President and Secretary, Invesco Distributors, Inc. (formerly known as Invesco AIM Distributors, Inc.); Vice President and Secretary, Invesco Investment Services, Inc. (formerly known as Invesco AIM Investment Services, Inc.) Senior Vice President, Chief Legal Officer and Secretary, The Invesco Funds; Secretary and General Counsel, Invesco Investment Advisers LLC (formerly known as Van Kampen Asset Management); Secretary and General Counsel, Invesco Capital Markets, Inc. (formerly known as Van Kampen Funds Inc.) and Chief Legal Officer, Invesco Exchange-Traded Fund Trust, Invesco Exchange-Traded Fund Trust II, Invesco India Exchange-Traded Fund Trust, Invesco Actively Managed Exchange-Traded Fund Trust, Invesco Actively Managed Exchange-Traded Commodity Fund Trust and Invesco Exchange-Traded Self-Indexed Fund Trust; Secretary, Invesco Indexing LLC; Secretary, W.L. Ross & Co., LLC Formerly: Secretary and Vice President, Jemstep, Inc.; Head of Legal, Worldwide Institutional, Invesco Ltd.; Secretary and General Counsel, INVESCO Private Capital Investments, Inc.; Senior Vice President, Secretary and General Counsel, Invesco Management Group, Inc. (formerly known as Invesco AIM Management Group, Inc.); Assistant Secretary, INVESCO Asset Management (Bermuda) Ltd.; Secretary and General Counsel, Invesco Private Capital, Inc.; Assistant Secretary and General Counsel, INVESCO Realty, Inc.; Secretary and General Counsel, Invesco Senior Secured Management, Inc.; and Secretary, Sovereign G./P. Holdings Inc. | | N/A | | N/A |
| | | | | |
Andrew R. Schlossberg – 1974 Senior Vice President | | 2019 | | Head of the Americas and Senior Managing Director, Invesco Ltd.; Director and Senior Vice President, Invesco Advisers, Inc. (formerly known as Invesco Institutional (N.A.), Inc.) (registered investment adviser); Director and Chairman, Invesco Investment Services, Inc. (formerly known as Invesco AIM Investment Services, Inc.) (registered transfer agent); Senior Vice President, The Invesco Funds; Director, Invesco Investment Advisers LLC (formerly known as Van Kampen Asset Management); Director, President and Chairman, Invesco Insurance Agency, Inc. Formerly: Director, Invesco UK Limited; Director and Chief Executive, Invesco Asset Management Limited and Invesco Fund Managers Limited; Assistant Vice President, The Invesco Funds; Senior Vice President, Invesco Advisers, Inc. (formerly known as Invesco Institutional (N.A.), Inc.) (registered investment adviser); Director and Chief Executive, Invesco Administration Services Limited and Invesco Global Investment Funds Limited; Director, Invesco Distributors, Inc.; Head of EMEA, Invesco Ltd.; President, Invesco Actively Managed Exchange-Traded Commodity Fund Trust, Invesco Actively Managed Exchange-Traded Fund Trust, Invesco Exchange-Traded Fund Trust, Invesco Exchange-Traded Fund Trust II and Invesco India Exchange-Traded Fund Trust; Managing Director and Principal Executive Officer, Invesco Capital Management LLC | | N/A | | N/A |
27 INVESCO OPPENHEIMER V.I. DISCOVERY MID CAP GROWTH FUND
TRUSTEES AND OFFICERS Continued
| | | | | | | | |
| | | | | |
Name, Year of Birth and Position(s) Held with the Trust | | Trustee and/or Officer Since | | Principal Occupation(s) During Past 5 Years | | Number of Funds in Fund Complex
Overseen by Trustee | | Other Directorship(s) Held by Trustee During Past
5 Years |
OTHER OFFICERS (CONTINUED) | | | | | | | | |
| | | | | |
John M. Zerr – 1962 Senior Vice President | | 2006 | | Chief Operating Officer of the Americas; Senior Vice President, Invesco Advisers, Inc. (formerly known as Invesco Institutional (N.A.), Inc.) (registered investment adviser); Senior Vice President, Invesco Distributors, Inc. (formerly known as Invesco AIM Distributors, Inc.); Director and Vice President, Invesco Investment Services, Inc. (formerly known as Invesco AIM Investment Services, Inc.) Senior Vice President, The Invesco Funds; Managing Director, Invesco Capital Management LLC; Director, Invesco Investment Advisers LLC (formerly known as Van Kampen Asset Management); Senior Vice President, Invesco Capital Markets, Inc. (formerly known as Van Kampen Funds Inc.); Manager, Invesco Indexing LLC; Manager, Invesco Specialized Products, LLC; Director and Senior Vice President, Invesco Insurance Agency, Inc.; Member, Invesco Canada Funds Advisory Board; Director, President and Chief Executive Officer, Invesco Corporate Class Inc. (corporate mutual fund company); and Director, Chairman, President and Chief Executive Officer, Invesco Canada Ltd. (formerly known as Invesco Trimark Ltd./Invesco Trimark Ltèe) (registered investment adviser and registered transfer agent) Formerly: Director and Senior Vice President, Invesco Management Group, Inc. (formerly known as Invesco AIM Management Group, Inc.); Secretary and General Counsel, Invesco Management Group, Inc. (formerly known as Invesco AIM Management Group, Inc.); Secretary, Invesco Investment Services, Inc. (formerly known as Invesco AIM Investment Services, Inc.); Chief Legal Officer and Secretary, The Invesco Funds; Secretary and General Counsel, Invesco Investment Advisers LLC (formerly known as Van Kampen Asset Management); Secretary and General Counsel, Invesco Capital Markets, Inc. (formerly known as Van Kampen Funds Inc.); Chief Legal Officer, Invesco Exchange-Traded Fund Trust, Invesco Exchange-Traded Fund Trust II, Invesco India Exchange-Traded Fund Trust, Invesco Actively Managed Exchange-Traded Fund Trust, Invesco Actively Managed Exchange-Traded Commodity Fund Trust and Invesco Exchange-Traded Self-Indexed Fund Trust; Secretary, Invesco Indexing LLC; Director, Secretary, General Counsel and Senior Vice President, Van Kampen Exchange Corp.; Director, Vice President and Secretary, IVZ Distributors, Inc. (formerly known as INVESCO Distributors, Inc.); Director and Vice President, INVESCO Funds Group, Inc.; Director and Vice President, Van Kampen Advisors Inc.; Director, Vice President, Secretary and General Counsel, Van Kampen Investor Services Inc.; Director and Secretary, Invesco Distributors, Inc. (formerly known as Invesco AIM Distributors, Inc.); Director, Senior Vice President, General Counsel and Secretary, Invesco AIM Advisers, Inc. and Van Kampen Investments Inc.; Director, Vice President and Secretary, Fund Management Company; Director, Senior Vice President, Secretary, General Counsel and Vice President, Invesco AIM Capital Management, Inc.; Chief Operating Officer and General Counsel, Liberty Ridge Capital, Inc. (an investment adviser) | | N/A | | N/A |
| | | | | |
Gregory G. McGreevey – 1962 Senior Vice President | | 2012 | | Senior Managing Director, Invesco Ltd.; Director, Chairman, President, and Chief Executive Officer, Invesco Advisers, Inc. (formerly known as Invesco Institutional (N.A.), Inc.) (registered investment adviser); Director, Invesco Mortgage Capital, Inc. and Invesco Senior Secured Management, Inc.; and Senior Vice President, The Invesco Funds; and President, SNW Asset Management Corporation Formerly: Senior Vice President, Invesco Management Group, Inc. and Invesco Advisers, Inc.; Assistant Vice President, The Invesco Funds | | N/A | | N/A |
| | | | | |
Kelli Gallegos – 1970 Vice President, Principal Financial Officer and Assistant Treasurer | | 2008 | | Principal Financial and Accounting Officer – Investments Pool, Invesco Specialized Products, LLC; Vice President, Principal Financial Officer and Assistant Treasurer, The Invesco Funds; Principal Financial and Accounting Officer – Pooled Investments, Invesco Capital Management LLC; Vice President and Treasurer, Invesco Exchange-Traded Fund Trust, Invesco Exchange-Traded Fund Trust II, Invesco India Exchange-Traded Fund Trust, Invesco Actively Managed Exchange-Traded Fund Trust, Invesco Actively Managed Exchange-Traded Commodity Fund Trust and Invesco Exchange-Traded Self-Indexed Fund Trust Formerly: Assistant Treasurer, Invesco Specialized Products, LLC; Assistant Treasurer, Invesco Exchange-Traded Fund Trust, Invesco Exchange-Traded Fund Trust II, Invesco India Exchange-Traded Fund Trust, Invesco Actively Managed Exchange-Traded Fund Trust, Invesco Actively Managed Exchange-Traded Commodity Fund Trust and Invesco Exchange-Traded Self-Indexed Fund Trust; Assistant Treasurer, Invesco Capital Management LLC; Assistant Vice President, The Invesco Funds | | N/A | | N/A |
28 INVESCO OPPENHEIMER V.I. DISCOVERY MID CAP GROWTH FUND
| | | | | | | | |
| | | | | |
Name, Year of Birth and Position(s) Held with the Trust | | Trustee and/or Officer Since | | Principal Occupation(s) During Past 5 Years | | Number of Funds in Fund Complex
Overseen by Trustee | | Other Directorship(s) Held by Trustee During Past
5 Years |
OTHER OFFICERS (CONTINUED) | | | | | | | | |
| | | | | |
Crissie M. Wisdom – 1969 Anti-Money Laundering Compliance Officer | | 2013 | | Anti-Money Laundering Compliance Officer, Invesco Advisers, Inc. (formerly known as Invesco Institutional (N.A.), Inc.) (registered investment adviser), Invesco Capital Markets, Inc. (formerly known as Van Kampen Funds Inc.), Invesco Distributors, Inc., Invesco Investment Services, Inc., The Invesco Funds, and Invesco Exchange-Traded Fund Trust, Invesco Exchange-Traded Fund Trust II, Invesco India Exchange-Traded Fund Trust, Invesco Actively Managed Exchange-Traded Fund Trust, Invesco Actively Managed Exchange-Traded Commodity Fund Trust and Invesco Exchange-Traded Self-Indexed Fund Trust; Anti-Money Laundering Compliance Officer and Bank Secrecy Act Officer, INVESCO National Trust Company and Invesco Trust Company; and Fraud Prevention Manager and Controls and Risk Analysis Manager for Invesco Investment Services, Inc. Formerly: Anti-Money Laundering Compliance Officer, Van Kampen Exchange Corp. and Invesco Management Group, Inc. | | N/A | | N/A |
| | | | | |
Robert R. Leveille – 1969 Chief Compliance Officer | | 2016 | | Chief Compliance Officer, Invesco Advisers, Inc. (registered investment adviser); and Chief Compliance Officer, The Invesco Funds Formerly: Chief Compliance Officer, Putnam Investments and the Putnam Funds | | N/A | | N/A |
The Statement of Additional Information of the Trust includes additional information about the Fund’s Trustees and is available upon request, without charge, by calling 1.800.959.4246. Please refer to the Fund’s Statement of Additional Information for information on the Fund’ssub-advisers.
| | | | | | |
| Office of the Fund | | Investment Adviser | | Distributor | | Auditors |
11 Greenway Plaza, Suite 1000 Houston, TX 77046-1173 | | Invesco Advisers, Inc. 1555 Peachtree Street, N.E. Atlanta, GA 30309 | | Invesco Distributors, Inc. 11 Greenway Plaza, Suite 1000 Houston, TX 77046-1173 | | PricewaterhouseCoopers LLP 1000 Louisiana Street, Suite 5800 Houston, TX 77002-5021 |
| | | |
| Counsel to the Fund | | Counsel to the | | Transfer Agent | | Custodian |
Stradley Ronon Stevens & Young, LLP 2005 Market Street, Suite 2600 Philadelphia, PA 19103-7018 | | Independent Trustees Goodwin Procter LLP 901 New York Avenue, N.W. Washington, D.C. 20001 | | Invesco Investment Services, Inc. 11 Greenway Plaza, Suite 1000 Houston, TX 77046-1173 | | JPMorgan Chase Bank 4 Chase Metro Tech Center Brooklyn, NY 11245 |
29 INVESCO OPPENHEIMER V.I. DISCOVERY MID CAP GROWTH FUND
THIS PAGE INTENTIONALLY LEFT BLANK.
THIS PAGE INTENTIONALLY LEFT BLANK.

| | | | |
 | | Annual report | | 12/31/2019 |
| | |
| | Invesco Oppenheimer V.I. Global Fund* | | |
| | Beginning on January 1, 2021, as permitted by regulations adopted by the Securities and Exchange Commission, the insurance company that offers your variable annuity or variable life insurance contract may no longer send you paper copies of the Fund’s shareholder reports by mail, unless you specifically request paper copies of the reports from the insurance company or your financial intermediary. Instead of delivering paper copies of the report, the insurance company may choose to make the reports available on a website, and will notify you by mail each time a report is posted and provide you with a website link to access the report. Instructions for requesting paper copies will be provided by your insurance company. If the insurance company offers electronic delivery, you may elect to receive shareholder reports and other communications about the Fund electronically by following the instructions provided by the insurance company or by contacting your financial intermediary. If you already elected to receive shareholder reports electronically, you will not be affected by this change and you need not take any action. You may elect to receive all future reports in paper free of charge from the insurance company. You can inform the insurance company or your financial intermediary that you wish to continue receiving paper copies of your shareholder reports by following the instructions provided by the insurance company or by contacting your financial intermediary. Your election to receive reports in paper will apply to all portfolio companies available under your contract with the insurance company. The Fund provides a complete list of its holdings four times in each fiscal year, at the quarter ends. For the second and fourth quarters, the lists appear in the Fund’s semi annual and annual reports to shareholders. For the first and third quarters, the Fund files the lists with the Securities and Exchange Commission (SEC) as an exhibit to its reports on FormN-PORT. The Fund’s FormN-PORT filings are available on the SEC website, sec.gov. The Fund’s most recent portfolio holdings, as filed on FormN-PORT, have also been made available to insurance companies issuing variable annuity contracts and variable life insurance policies (“variable products”) that invest in the Fund. A description of the policies and procedures that the Fund uses to determine how to vote proxies relating to portfolio securities is available without charge, upon request, from our Client Services department at 800 959 4246 or at invesco.com/proxyguidelines. The information is also available on the SEC website, sec.gov. Information regarding how the Fund voted proxies related to its portfolio securities during the most recent12-month period ended June 30 is available at invesco.com/proxysearch. The information is also available on the SEC website, sec.gov. Invesco Advisers, Inc. is an investment adviser; it provides investment advisory services to individual and institutional clients and does not sell securities. Invesco Distributors, Inc. is the US distributor for Invesco Ltd.’s retail mutual funds, exchange- traded funds and institutional money market funds. Both are wholly owned, indirect subsidiaries of Invesco Ltd. This report must be accompanied or preceded by a currently effective Fund prospectus and variable product prospectus, which contain more complete information, including sales charges and expenses. Investors should read each carefully before investing. *Prior to the close of business on May 24, 2019, the Fund’s name was Oppenheimer Global Fund/VA. See Important Update on the following page for more information. |
Important Update
On October 18, 2018, Massachusetts Mutual Life Insurance Company, an indirect corporate parent of OppenheimerFunds, Inc. and its subsidiaries OFI Global Asset Management, Inc., OFI SteelPath, Inc. and OFI Advisors, LLC, announced that it had entered into an agreement whereby Invesco Ltd., a global investment management company would acquire OppenheimerFunds and its subsidiaries (together, “OppenheimerFunds”). After the close of business on May 24, 2019 Invesco Ltd. completed the acquisition of OppenheimerFunds. This Fund was included in that acquisition and as of that date, became part of the Invesco family of funds. Please visit invesco.com for more information or call Invesco’s Client Services team at800-959-4246.
PORTFOLIO MANAGERS: John Delano, CFA
AVERAGE ANNUAL TOTAL RETURNS FOR THE PERIODS ENDED 12/31/19
| | | | | | | | | | | | | | |
| | | Inception Date | | 1-Year | | | 5-Year | | | 10-Year | |
Series I Shares* | | 11/12/90 | | | 31.79 | % | | | 10.22 | % | | | 10.57 | % |
Series II Shares* | | 7/13/00 | | | 31.45 | | | | 9.94 | | | | 10.30 | |
MSCI All Country World Index | | | | | 26.60 | | | | 8.41 | | | | 8.79 | |
Performance quoted is past performance and cannot guarantee future results; current performance may be lower or higher.
Visit invesco.com for the most recentmonth-end performance. Performance figures reflect reinvested distributions and changes in net asset value (NAV). Investment return and principal value will vary so that you may have a gain or a loss when you sell shares. Fund returns include changes in share price, reinvested distributions. Performance figures given represent the Fund and are not intended to reflect actual variable product values. They do not reflect sales charges, expenses and fees assessed in connection with a variable product. Sales charges, expenses and fees, which are determined by the variable product issuers, will vary and will lower the total return. Returns for periods of less than one year are cumulative and not annualized. As the result of a reorganization after the close of business on May 24, 2019, theNon-Service and Service share classes of the predecessor fund were reorganized into Series I and Series II Shares, respectively, of the Fund. Returns shown for Series I and Series II shares are blended returns of the predecessor fund and the Fund. Share class returns will differ from those of the Oppenheimer predecessor fund because of different expenses. See Fund prospectuses and summary prospectuses for more information on share classes, sales charges and new fee agreements, if any. Fund literature is available at invesco.com.
TOP HOLDINGS AND ALLOCATIONS
TOP TEN COMMON STOCK HOLDINGS
| | | | |
Alphabet, Inc., Cl. A | | | 7.4% | |
LVMH Moet Hennessy Louis Vuitton SE | | | 4.3 | |
Airbus SE | | | 4.1 | |
S&P Global, Inc. | | | 3.7 | |
Adobe, Inc. | | | 3.6 | |
Facebook, Inc., Cl. A | | | 3.5 | |
Intuit, Inc. | | | 3.3 | |
SAP SE | | | 2.9 | |
Anthem, Inc. | | | 2.8 | |
Kering SA | | | 2.7 | |
Holdings and allocations are subject to change and are not buy/sell recommendations. Percentages are as of December 31, 2019, and are based on net assets.
REGIONAL ALLOCATION
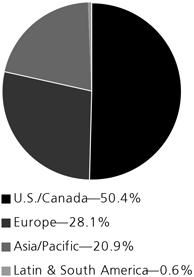
Holdings and allocations are subject to change and are not buy/sell recommendations. Percentages are as of December 31, 2019 and are based on the total market value of investments.
For more current Fund holdings, please visit invesco.com.
*Effective after the close of business on May 24, 2019, theNon-Service and Service share classes of the predecessor fund were reorganized into Series I and Series II Shares, respectively, of the Fund. Returns shown for Series I and Series II shares are blended returns of the predecessor fund and the Fund. Share class returns will differ from those of the predecessor fund because of different expenses.
3 INVESCO OPPENHEIMER V.I. GLOBAL FUND
Fund Performance Discussion
For the twelve months ended December 31, 2019, the Fund’s Series I shares had a return of 31.79%, outperforming its benchmark, the MSCIall-Country World Index (ACWI), which returned 26.60%.
The market resumed a strong upward trajectory in the 4th quarter, after stumbling through much of the third quarter, capping a strong year of returns for equities. However, 2019 was a year of steady, if unspectacular, economic growth, low inflation, and very low interest rates. In fact, for much of the year, interest rates in several of the developed economies hovered near or below zero. Those conditions combined were supportive of equity valuations, countering a more modest economic growth backdrop. For the reporting period all 11 GICs sectors within the ACWI posted strongly positive returns, the lowest being Energy which returned 13.82% for the year.
MARKET OVERVIEW
Trade friction was a constant in the business news of 2019. As we have noted for the last several years, trade wars have no ultimate winners, and it was perhaps no surprise then, that the market began to lift in the latter part of 2019 after it became more clear that the framework for a resolution was emerging. Also, as that trade tension developed, it appears to have led some companies to build extra inventory as a hedge against potential supply chain disruption. That may have, in part, been the cause of some of the industrial production weakness of the last year, and the market downdraft of late 2018 may have been reacting to that with respect to pricing. As is often the case, the market tends to do well when the economy is weak and central banks are easing. We see that as the dominant story of 2019.
FUND REVIEW
The top contributors to performance this period includedLVMH Moet Hennessy Louis Vuitton SE, Airbus SE, andAlphabet Inc.
LVMH Moet Hennessy Louis Vuitton SE (LVMH) had another strong year. Late in the year they announced that they would acquire Tiffany & Co, another of our holdings. The deal is a natural one. LVMH is the leading luxury company in the world, and Tiffany vaults them to the number one position in luxury jewelry. Also, Tiffany has been in turnaround mode the last several years, and the LVMH combination may accelerate that.
Airbus SE is the chief competitor of Boeing in the global market for civil aviation. Boeing has had a year of woe due to the safety concerns regarding its737-Max aircraft. We believe that Airbus is operating well as business and has an enviable safety profile.
Alphabet Inc. has been our largest holding for some time. At present, the company remains a major beneficiary of the growth in digital advertising, at the expense of traditional media, such as radio, linear TV, and print media. We think that this is unlikely to change much. In addition, we see YouTube, Maps, Android, AI and other services as being monetized more deeply in the future. Waymo, the autonomous driving platform is a large option embedded in the business, that we think holds promise.
The top three negative contributors to performance last year wereBaidu Inc., Farfetch Ltd. andBayerische Motoren Werke Akitiengesellschaft.
Baidu Inc. is the leader in Chinese internet search platforms. However, for a variety of reasons Baidu has not achieved the dominance of Google, across much of the rest of the world. In addition, its management has lacked transparency and accountability. Following an inexplicably weak earnings announcement during the year we lost confidence the company could fulfill our expectations, and we eliminated it from the portfolio.
Farfetch Ltd.a United Kingdom based online luxury goods business, was disappointing. It has been challenged by heavy discounting in the brick and mortar retail business. We continue to hold it, with the view that the management team has a good handle on the issue.
Bayerische Motoren Werke Akitiengesellschaft, also known as the German car company BMW, like many other car makers in around the world, has been challenged by weakness in new car demand. We reduced our position in the company during the year, though it remains a minor holding.
POSITIONING AND OUTLOOK
Our thematic, long-term, investment style leads us towards seeking quality businesses with sustainability of both enterprise and advantaged position. We hope to buy these at prices that do not fully reflect their future value, usually because the current understanding of that value by the market seems misestimated to
4 INVESCO OPPENHEIMER V.I. GLOBAL FUND
us for a reason that is temporary. Unpopularity is a price we are willing to incur for a while. Also, it has been our experience that competitively advantaged companies in ascendant industries can create economic value that can go on for decades. This is why we think and behave with a long-term focus.
The views and opinions expressed in management’s discussion of Fund performance are those of Invesco Advisers, Inc. These views and opinions are subject to change at any time based on factors such as market and economic conditions. These views and opinions may not be relied upon as investment advice or recommendations, or as an offer for a particular security. The information is not a complete analysis of every aspect of any market, country, industry, security or the Fund. Statements of fact are from sources considered reliable, but Invesco Advisers, Inc. makes no representation or warranty as to their completeness or accuracy. Although historical performance is no guarantee of future results, these insights may help you understand our investment management philosophy.
Before investing, investors should carefully read the prospectus and/or summary prospectus and carefully consider the investment objectives, risks, charges and expenses. For this and more complete information about the fund(s), investors should ask their advisors for a prospectus/summary prospectus or visit invesco.com/fundprospectus.
Shares of Invesco funds are not deposits or obligations of any bank, are not guaranteed by any bank, are not insured by the FDIC or any other agency, and involve investment risks, including the possible loss of the principal amount invested.
Comparing the Fund’s Performance to the Market.The graphs that follow show the performance of a hypothetical $10,000 investment in each share class of the Fund held until December 31, 2019. Performance is measured over aten-fiscal-year period for both Classes. Performance information does not reflect charges that apply to separate accounts investing in the Fund. If these charges were taken into account, performance would be lower. The graphs assume that all dividends and capital gains distributions were reinvested in additional shares.
The Fund’s performance is compared to the performance of the MSCI All Country World Index. The MSCI All Country World Index is a free float-adjusted market capitalization weighted index that is designed to measure the equity market performance of developed and emerging markets. The Index is unmanaged and cannot be purchased directly by investors. While index comparisons may be useful to provide a benchmark for the Fund’s performance, it must be noted that the Fund’s investments are not limited to the investments comprising the Index. Index performance includes reinvestment of income, but does not reflect transaction costs, fees, expenses or taxes. Index performance is shown for illustrative purposes only as a benchmark for the Fund’s performance, and does not predict or depict performance of the Fund. The Fund’s performance reflects the effects of the Fund’s business and operating expenses.
5 INVESCO OPPENHEIMER V.I. GLOBAL FUND
COMPARISON OF CHANGE IN VALUE OF $10,000 HYPOTHETICAL INVESTMENTS IN:
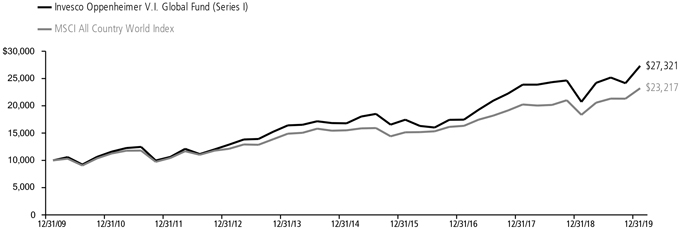
Average Annual Total Returns of Series I Shares of the Fund at 12/31/19
1-Year 31.79% 5-Year 10.22% 10-Year 10.57%
COMPARISON OF CHANGE IN VALUE OF $10,000 HYPOTHETICAL INVESTMENTS IN:
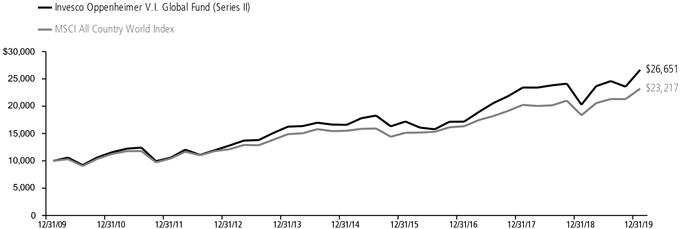
Average Annual Total Returns of Series II Shares of the Fund at 12/31/19
1-Year 31.45% 5-Year 9.94% 10-Year 10.30%
Performance data quoted represents past performance, which does not guarantee future results.The investment return and principal value of an investment in the Fund will fluctuate so that an investor’s shares, when redeemed, may be worth more or less than their original cost. Current performance may be lower or higher than the performance quoted. For performance data current to the most recent month end, call us at 1.800.988.8287. The Fund’s total returns should not be expected to be the same as the returns of other funds, whether or not both funds have the same portfolio managers and/or similar names. The Fund’s total returns include changes in share price and reinvested distributions but do not include the charges associated with the separate account products that offer this Fund. Such performance would have been lower if such charges were taken into account.
6 INVESCO OPPENHEIMER V.I. GLOBAL FUND
Fund Expenses
Fund Expenses.As a shareholder of the Fund, you incur two types of costs: (1) transaction costs and (2) ongoing costs, including management fees; distribution and service fees; and other Fund expenses. These examples are intended to help you understand your ongoing costs (in dollars) of investing in the Fund and to compare these costs with the ongoing costs of investing in other mutual funds.
The examples are based on an investment of $1,000.00 invested at the beginning of the period and held for the entire6-month period ended December 31, 2019.
Actual Expenses. The first section of the table provides information about actual account values and actual expenses. You may use the information in this section for the class of shares you hold, together with the amount you invested, to estimate the expense that you paid over the period. Simply divide your account value by $1,000.00 (for example, an $8,600.00 account value divided by $1,000.00 = 8.60), then multiply the result by the number in the first section under the heading entitled “Expenses Paid During 6 Months Ended December 31, 2019” to estimate the expenses you paid on your account during this period.
Hypothetical Example for Comparison Purposes.
The second section of the table provides information about hypothetical account values and hypothetical expenses based on the Fund’s actual expense ratio for each class of shares, and an assumed rate of return of 5% per year for each class before expenses, which is not the actual return. The hypothetical account values and expenses may not be used to estimate the actual ending account balance or expenses you paid for the period. You may use this information to compare the ongoing costs of investing in the Fund and other funds. To do so, compare this 5% hypothetical example for the class of shares you hold with the 5% hypothetical examples that appear in the shareholder reports of the other funds.
Please note that the expenses shown in the table are meant to highlight your ongoing costs only and do not reflect any charges associated with the separate accounts that offer this Fund. Therefore, the “hypothetical” lines of the table are useful in comparing ongoing costs only, and will not help you determine the relative total costs of owning different funds. In addition, if these separate account charges were included your costs would have been higher.
| | | | | | | | | | | | | | | | |
| Actual | | Beginning
Account
Value
July 1, 2019 | | | Ending
Account
Value
December 31, 2019 | | | Expenses
Paid During
6 Months Ended
December 31, 2019 | | | | |
Series I shares | | $ | 1,000.00 | | | | $ 1,084.90 | | | | $ 4.05 | | | | | |
Series II shares | | | 1,000.00 | | | | 1,083.70 | | | | 5.37 | | | | | |
| | | | |
Hypothetical | | | | | | | | | | | | | | | | |
(5% return before expenses) | | | | | | | | | | | | | | | | |
Series I shares | | | 1,000.00 | | | | 1,021.32 | | | | 3.93 | | | | | |
Series II shares | | | 1,000.00 | | | | 1,020.06 | | | | 5.21 | | | | | |
Expenses are equal to the Fund’s annualized expense ratio for that class, multiplied by the average account value over the period, multiplied by 184/365 (to reflect theone-half year period). Those annualized expense ratios, excluding indirect expenses from affiliated funds, based on the6-month period ended December 31, 2019 are as follows:
| | | | | | | | | | |
| Class | | Expense Ratios | | |
Series I shares | | | | 0.77% | | | | | | |
Series II shares | | | | 1.02 | | | | | | |
The expense ratios reflect voluntary and/or contractual waivers and/or reimbursements of expenses by the Fund’s Manager. Some of these undertakings may be modified or terminated at any time, as indicated in the Fund’s prospectus. The “Financial Highlights” tables in the Fund’s financial statements, included in this report, also show the gross expense ratios, without such waivers or reimbursements and reduction to custodian expenses, if applicable.
7 INVESCO OPPENHEIMER V.I. GLOBAL FUND
SCHEDULE OF INVESTMENTSDecember 31, 2019
| | | | | | |
| | | Shares | | Value | |
Common Stocks—99.1% | | | | | | |
| | | | | | | | |
| Consumer Discretionary—28.2% | |
| Automobiles—0.3% | |
Bayerische Motoren Werke AG | | | 134,591 | | | $ | 8,310,647 | |
|
| Entertainment—4.4% | |
| Capcom Co. Ltd. | | | 644,200 | | | | 17,892,059 | |
| Electronic Arts, Inc.1 | | | 178,023 | | | | 19,139,253 | |
| Nintendo Co. Ltd. | | | 64,700 | | | | 26,115,913 | |
| Walt Disney Co. (The) | | | 326,412 | | | | 47,208,967 | |
| | | | | | | | 110,356,192 | |
|
| Hotels, Restaurants & Leisure—0.4% | |
International Game Technology plc | | | 767,398 | | | | 11,487,948 | |
|
| Interactive Media & Services—10.9% | |
| Alphabet, Inc., Cl. A1 | | | 138,689 | | | | 185,758,659 | |
| Facebook, Inc., Cl. A1 | | | 431,581 | | | | 88,582,000 | |
| | | | | | | | 274,340,659 | |
|
| Internet & Catalog Retail—3.1% | |
| Amazon.com, Inc.1 | | | 12,017 | | | | 22,205,494 | |
| Farfetch Ltd., Cl. A1 | | | 698,120 | | | | 7,225,542 | |
| JD.com, Inc., ADR1 | | | 1,389,453 | | | | 48,950,429 | |
| | | | | | | | 78,381,465 | |
|
| Specialty Retail—1.8% | |
| Industria de Diseno Textil SA | | | 1,252,424 | | | | 44,364,552 | |
|
| Textiles, Apparel & Luxury Goods—7.3% | |
| Brunello Cucinelli SpA | | | 174,343 | | | | 6,175,119 | |
| Kering SA | | | 103,416 | | | | 68,127,507 | |
| LVMH Moet Hennessy Louis Vuitton SE | | | 234,556 | | | | 109,240,022 | |
| | | | | | | | 183,542,648 | |
|
| Consumer Staples—3.1% | |
|
| Household Products—1.5% | |
Colgate-Palmolive Co. | | | 544,473 | | | | 37,481,521 | |
|
| Personal Products—1.6% | |
Unilever plc | | | 704,860 | | | | 40,352,718 | |
|
| Financials—17.0% | |
|
| Capital Markets—5.4% | |
| Credit Suisse Group AG1 | | | 2,321,879 | | | | 31,510,127 | |
| Goldman Sachs Group, Inc. (The) | | | 31,184 | | | | 7,170,137 | |
| S&P Global, Inc. | | | 342,687 | | | | 93,570,685 | |
| UBS Group AG1 | | | 371,232 | | | | 4,685,265 | |
| | | | | | | | 136,936,214 | |
|
| Commercial Banks—5.5% | |
| Citigroup, Inc. | | | 842,487 | | | | 67,306,287 | |
| ICICI Bank Ltd., Sponsored ADR | | | 3,316,634 | | | | 50,048,007 | |
| Societe Generale SA | | | 616,501 | | | | 21,540,989 | |
| | | | | | | | 138,895,283 | |
|
| Insurance—3.5% | |
| Allianz SE | | | 205,389 | | | | 50,363,598 | |
| Prudential plc | | | 1,927,166 | | | | 37,081,443 | |
| | | | | | | | 87,445,041 | |
|
| Real Estate Management & Development—2.6% | |
DLF Ltd. | | | 20,439,758 | | | | 66,159,445 | |
|
| Health Care—13.6% | |
|
| Biotechnology—4.6% | |
| ACADIA Pharmaceuticals, Inc.1 | | | 135,806 | | | | 5,809,781 | |
| Blueprint Medicines Corp.1 | | | 182,373 | | | | 14,609,901 | |
| GlycoMimetics, Inc.1 | | | 565,120 | | | | 2,989,485 | |
| Incyte Corp.1 | | | 210,569 | | | | 18,386,885 | |
| Ionis Pharmaceuticals, Inc.1 | | | 279,721 | | | | 16,897,946 | |
| MacroGenics, Inc.1 | | | 530,500 | | | | 5,771,840 | |
| Sage Therapeutics, Inc.1 | | | 157,123 | | | | 11,342,709 | |
| Sarepta Therapeutics, Inc.1 | | | 118,048 | | | | 15,232,914 | |
| | | | | | | | |
| | | Shares | | | Value | |
Biotechnology (Continued) | | | | | | | | |
| uniQure NV1 | | | 232,700 | | | $ | 16,675,282 | |
| Veracyte, Inc.1 | | | 292,070 | | | | 8,154,594 | |
| | | | | | | | 115,871,337 | |
|
| Health Care Equipment & Supplies—1.1% | |
Zimmer Biomet Holdings, Inc. | | | 192,330 | | | | 28,787,954 | |
|
| Health Care Providers & Services—3.8% | |
| Anthem, Inc. | | | 234,529 | | | | 70,834,794 | |
| Centene Corp.1 | | | 382,486 | | | | 24,046,895 | |
| | | | | | | | 94,881,689 | |
|
| Life Sciences Tools & Services—2.0% | |
| Agilent Technologies, Inc. | | | 418,693 | | | | 35,718,700 | |
| Avantor, Inc.1 | | | 847,098 | | | | 15,374,828 | |
| | | | | | | | 51,093,528 | |
|
| Pharmaceuticals—2.1% | |
| Bayer AG | | | 256,398 | | | | 20,957,970 | |
| Phathom Pharmaceuticals, Inc.1 | | | 248,900 | | | | 7,750,746 | |
| Takeda Pharmaceutical Co. Ltd. | | | 591,294 | | | | 23,425,800 | |
| | | | | | | | 52,134,516 | |
|
| Industrials—13.2% | |
|
| Aerospace & Defense—4.1% | |
Airbus SE | | | 705,629 | | | | 103,528,266 | |
|
| Air Freight & Couriers—1.3% | |
United Parcel Service, Inc., Cl. B | | | 284,856 | | | | 33,345,243 | |
|
| Building Products—1.3% | |
Assa Abloy AB, Cl. B | | | 1,443,599 | | | | 33,733,803 | |
|
| Electrical Equipment—2.3% | |
Nidec Corp. | | | 430,600 | | | | 58,821,735 | |
|
| Industrial Conglomerates—0.3% | |
3M Co. | | | 41,445 | | | | 7,311,727 | |
|
| Machinery—2.6% | |
| Atlas Copco AB, Cl. A | | | 702,160 | | | | 27,989,909 | |
| FANUC Corp. | | | 134,900 | | | | 24,914,437 | |
| Minebea Mitsumi, Inc. | | | 539,800 | | | | 11,139,610 | |
| | | | | | | | 64,043,956 | |
|
| Professional Services—1.3% | |
Equifax, Inc. | | | 236,302 | | | | 33,110,636 | |
|
| Information Technology—24.0% | |
|
| Electronic Equipment, Instruments, & Components—8.0% | |
| Keyence Corp. | | | 147,944 | | | | 52,365,252 | |
| Murata Manufacturing Co. Ltd. | | | 976,500 | | | | 60,372,087 | |
| Omron Corp. | | | 506,600 | | | | 29,512,848 | |
| TDK Corp. | | | 526,900 | | | | 59,220,320 | |
| | | | | | | | 201,470,507 | |
|
| IT Services—3.1% | |
| Fidelity National Information Services, Inc. | | | 105,449 | | | | 14,666,902 | |
| PayPal Holdings, Inc.1 | | | 451,935 | | | | 48,885,809 | |
| StoneCo Ltd., Cl. A1 | | | 365,072 | | | | 14,562,722 | |
| | | | | | | | 78,115,433 | |
|
| Semiconductors & Semiconductor Equipment—2.3% | |
Maxim Integrated Products, Inc. | | | 951,743 | | | | 58,541,712 | |
|
| Software—10.6% | |
| Adobe, Inc.1 | | | 276,384 | | | | 91,154,207 | |
| Intuit, Inc. | | | 312,309 | | | | 81,803,096 | |
| Microsoft Corp. | | | 128,978 | | | | 20,339,831 | |
| SAP SE | | | 542,315 | | | | 73,087,690 | |
| | | | | | | 266,384,824 | |
| Total Common Stocks (Cost $1,095,471,256) | | | | 2,499,231,199 | |
8 INVESCO OPPENHEIMER V.I. GLOBAL FUND
| | | | | | |
| | | Shares | | Value | |
Preferred Stock—0.0% | | | | | | |
Zee Entertainment Enterprises Ltd., 6% Cum.
Non-Cv. (Cost $—) | | 4,053,320 | | $ | 308,919 | |
| | | | | | |
| | | Shares | | Value | |
Investment Company—0.8% | | | | | | |
| Invesco Government & Agency Portfolio, Institutional Class, 1.50%2(Cost $20,491,964) | | 20,491,964 | | $ | 20,491,964 | |
| Total Investments, at Value (Cost $1,115,963,220) | | 99.9% | | | 2,520,032,082 | |
| Net Other Assets (Liabilities) | | 0.1 | | | 1,646,941 | |
Net Assets | | 100.0% | | $ | 2,521,679,023 | |
| | | | | | |
Footnotes to Schedule of Investments
1.Non-income producing security.
2. The money market fund and the Fund are affiliated by having the same investment adviser. The rate shown is the7-day SEC standardized yield as of December 31, 2019.
Distribution of investments representing geographic holdings, as a percentage of total investments at value, is as follows:
| | | | | | |
| Geographic Holdings | | Value | | Percent | |
United States | | $ 1,271,272,050 | | | 50.4 | % |
Japan | | 363,780,062 | | | 14.4 | |
France | | 302,436,784 | | | 12.0 | |
Germany | | 152,719,904 | | | 6.1 | |
India | | 116,516,371 | | | 4.6 | |
United Kingdom | | 84,659,703 | | | 3.4 | |
Sweden | | 61,723,712 | | | 2.5 | |
China | | 48,950,429 | | | 1.9 | |
Spain | | 44,364,552 | | | 1.8 | |
Switzerland | | 36,195,392 | | | 1.4 | |
Netherlands | | 16,675,282 | | | 0.7 | |
Brazil | | 14,562,722 | | | 0.6 | |
Italy | | 6,175,119 | | | 0.2 | |
| | | |
Total | | $ 2,520,032,082 | | | 100.0 | % |
| | | | | | |
Glossary: | | | | | | |
| | | | | | |
Definitions | | | | | | |
ADR American Depositary Receipt | | | | | | |
See accompanying Notes to Financial Statements.
9 INVESCO OPPENHEIMER V.I. GLOBAL FUND
STATEMENT OF ASSETS AND LIABILITIESDecember 31, 2019
| | | | |
| | |
| Assets | | | | |
Investments, at value—see accompanying schedule of investments: | | | | |
Unaffiliated companies (cost $1,095,471,256) | | | $ 2,499,540,118 | |
Affiliated companies (cost $20,491,964) | | | 20,491,964 | |
| | | | |
| | | | 2,520,032,082 | |
| |
Cash | | | 679,168 | |
Receivables and other assets: | | | | |
Dividends | | | 6,309,373 | |
Investments sold | | | 4,209,311 | |
Shares of beneficial interest sold | | | 201,875 | |
Other | | | 191,906 | |
| | | | |
Total assets | | | 2,531,623,715 | |
| | |
| Liabilities | | | | |
Due to custodian-foreign currencies (cost $95) | | | 95 | |
Payables and other liabilities: | | | | |
Shares of beneficial interest redeemed | | | 7,652,342 | |
Administration fees | | | 911,986 | |
Foreign capital gains tax | | | 556,236 | |
Distribution and service plan fees | | | 251,638 | |
Shareholder communications | | | 178,692 | |
Trustees’ compensation | | | 176,422 | |
Advisory fees | | | 43,217 | |
Transfer and shareholder servicing agent fees | | | 33,985 | |
Other | | | 140,079 | |
| | | | |
Total liabilities | | | 9,944,692 | |
| | | | | |
| |
Net Assets | | | $ 2,521,679,023 | |
| | | | |
| | | | |
| | |
| Composition of Net Assets | | | | |
Shares of beneficial interest | | | $ 1,036,867,479 | |
Total distributable earnings | | | 1,484,811,544 | |
| | | | |
Net Assets | | | $ 2,521,679,023 | |
| | | | |
| | | | |
| | |
| Net Asset Value Per Share | | | | |
| |
Series I Shares: | | | | |
| Net asset value, redemption price per share and offering price per share (based on net assets of $1,334,572,515 and 31,366,480 shares of beneficial interest outstanding) | | | $42.55 | |
| |
Series II Shares: | | | | |
| Net asset value, redemption price per share and offering price per share (based on net assets of $1,187,106,508 and 28,299,670 shares of beneficial interest outstanding) | | | $41.95 | |
See accompanying Notes to Financial Statements.
10 INVESCO OPPENHEIMER V.I. GLOBAL FUND
STATEMENT OF OPERATIONSFor the Year Ended December 31, 2019
| | | | |
| | |
| Investment Income | | | | |
| |
Dividends: | | | | |
Unaffiliated companies (net of foreign withholding taxes of $3,122,762) | | $ | 34,648,293 | |
Affiliated companies | | | 625,779 | |
| | | | |
Total investment income | | | 35,274,072 | |
| | | | |
| | |
| Expenses | | | | |
Advisory fees | | | 14,985,357 | |
| |
Administration fees | | | 2,368,569 | |
| |
Distribution and service plan fees — Series II shares | | | 2,775,421 | |
| |
Transfer and shareholder servicing agent fees: | | | | |
Series I shares | | | 651,569 | |
Series II shares | | | 548,877 | |
| |
Shareholder communications: | | | | |
Series I shares | | | 97,709 | |
Series II shares | | | 83,964 | |
| |
Custodian fees and expenses | | | 124,443 | |
| |
Trustees’ compensation | | | 47,444 | |
| |
Borrowing fees | | | 29,367 | |
Other | | | 103,432 | |
| | | | |
Total expenses | | | 21,816,152 | |
Less waivers, reimbursement of expenses and offset arrangement(s) | | | (582,227) | |
| | | | |
Net expenses | | | 21,233,925 | |
| | | | | |
| |
Net Investment Income | | | 14,040,147 | |
| | | | |
| Realized and Unrealized Gain (Loss) | | | | |
Net realized gain (loss) on: | | | | |
Investment transactions in unaffiliated companies | | | 90,242,449 | |
Foreign currency transactions | | | (95,458) | |
| | | | |
Net realized gain | | | 90,146,991 | |
| |
Net change in unrealized appreciation/(depreciation) on: | | | | |
Investment transactions in unaffiliated companies (net of foreign capital gains tax of $496,057) | | | 529,053,128 | |
Translation of assets and liabilities denominated in foreign currencies | | | (9,080) | |
| | | | |
Net change in unrealized appreciation/(depreciation) | | | 529,044,048 | |
| | | | | |
| |
Net Increase in Net Assets Resulting from Operations | | $ | 633,231,186 | |
| | | | |
See accompanying Notes to Financial Statements.
11 INVESCO OPPENHEIMER V.I. GLOBAL FUND
STATEMENT OF CHANGES IN NET ASSETS
| | | | | | | | |
| | | Year Ended
December 31, 2019 | | | Year Ended
December 31, 2018 | |
| Operations | | | | | | | | |
Net investment income | | $ | 14,040,147 | | | | $ 18,245,651 | |
| |
Net realized gain | | | 90,146,991 | | | | 389,171,717 | |
| |
Net change in unrealized appreciation/(depreciation) | | | 529,044,048 | | | | (723,755,997) | |
| | | | |
Net increase (decrease) in net assets resulting from operations | | | 633,231,186 | | | | (316,338,629) | |
|
| |
| Dividends and/or Distributions to Shareholders | | | | | | | | |
Distributions to shareholders from distributable earnings: | | | | | | | | |
Series I shares | | | (194,974,813 | ) | | | (111,686,198) | |
Series II shares | | | (166,963,633 | ) | | | (97,522,940) | |
| | | | |
Total distributions from distributable earnings | | | (361,938,446 | ) | | | (209,209,138) | |
|
| |
| Beneficial Interest Transactions | | | | | | | | |
Net increase (decrease) in net assets resulting from beneficial interest transactions: | | | | | | | | |
Series I shares | | | 21,278,948 | | | | (34,187,598) | |
Series II shares | | | 156,942,783 | | | | (156,723,848) | |
| | | | |
Total beneficial interest transactions | | | 178,221,731 | | | | (190,911,446) | |
|
| |
| Net Assets | | | | | | | | |
Total increase (decrease) | | | 449,514,471 | | | | (716,459,213) | |
| |
Beginning of period | | | 2,072,164,552 | | | | 2,788,623,765 | |
| | | | |
End of period | | $ | 2,521,679,023 | | | | $ 2,072,164,552 | |
| | | | |
See accompanying Notes to Financial Statements.
12 INVESCO OPPENHEIMER V.I. GLOBAL FUND
FINANCIAL HIGHLIGHTS
| | | | | | | | | | | | | | | | | | |
| Series I Shares | | Year Ended
December 31,
2019 | | | Year Ended
December 31,
2018 | | | Year Ended
December 31,
2017 | | | Year Ended
December 31,
2016 | | | Year Ended
December 31,
2015 |
| Per Share Operating Data | | | | | | | | | | | | | | | | | | |
Net asset value, beginning of period | | | $38.00 | | | | $47.42 | | | | $35.02 | | | | $38.00 | | | $39.50 |
|
|
Income (loss) from investment operations: | | | | | | | | | | | | | | | | | | |
Net investment income1 | | | 0.29 | | | | 0.37 | | | | 0.29 | | | | 0.26 | | | 0.372 |
Net realized and unrealized gain (loss) | | | 11.03 | | | | (5.99) | | | | 12.50 | | | | (0.42) | | | 1.382 |
| | | |
Total from investment operations | | | 11.32 | | | | (5.62) | | | | 12.79 | | | | (0.16) | | | 1.75 |
|
|
Dividends and/or distributions to shareholders: | | | | | | | | | | | | | | | | | | |
Dividends from net investment income | | | (0.40) | | | | (0.47) | | | | (0.39) | | | | (0.38) | | | (0.54) |
Distributions from net realized gain | | | (6.37) | | | | (3.33) | | | | 0.00 | | | | (2.44) | | | (2.71) |
| | | |
Total dividends and/or distributions to shareholders | | | (6.77) | | | | (3.80) | | | | (0.39) | | | | (2.82) | | | (3.25) |
|
|
Net asset value, end of period | | | $42.55 | | | | $38.00 | | | | $47.42 | | | | $35.02 | | | $38.00 |
| | | |
|
|
| Total Return, at Net Asset Value3 | | | 31.79% | | | | (13.18)% | | | | 36.66% | | | | 0.08% | | | 3.94% |
|
|
| Ratios/Supplemental Data | | | | | | | | | | | | | | | | | | |
Net assets, end of period (in thousands) | | | $1,334,573 | | | | $1,160,317 | | | | $1,479,034 | | | | $1,245,070 | | | $1,406,001 |
|
|
Average net assets (in thousands) | | | $1,284,201 | | | | $1,401,836 | | | | $1,379,895 | | | | $1,270,049 | | | $1,502,338 |
|
|
Ratios to average net assets:4 | | | | | | | | | | | | | | | | | | |
Net investment income | | | 0.70% | | | | 0.81% | | | | 0.69% | | | | 0.75% | | | 0.92%2 |
Expenses excluding specific expenses listed below | | | 0.80% | | | | 0.78% | | | | 0.76% | | | | 0.77% | | | 0.76% |
Interest and fees from borrowings5 | | | 0.00% | | | | 0.00% | | | | 0.00% | | | | 0.00% | | | 0.00% |
| | | |
Total expenses6 | | | 0.80% | | | | 0.78% | | | | 0.76% | | | | 0.77% | | | 0.76% |
| Expenses after payments, waivers and/or reimbursements and reduction to custodian expenses | | | 0.77% | | | | 0.78%7 | | | | 0.76%7 | | | | 0.77%7 | | | 0.76%7 |
|
|
Portfolio turnover rate8 | | | 23% | | | | 16% | | | | 9% | | | | 14% | | | 14% |
1. Calculated based on the average shares outstanding during the period.
2. Net investment income per share, net realized and unrealized gain (loss) per share and the net investment income ratio include an adjustment for a prior period reclassification for the year ended December 31, 2015.
3. Includes adjustments in accordance with accounting principles generally accepted in the United States of America and as such, the net asset value for financial reporting purposes and the returns based upon those net asset values may differ from the net asset value and returns for shareholder transactions. Total returns are not annualized for periods less than one year, if applicable and do not reflect charges assessed in connection with a variable product, which if included would reduce total returns.
4. Annualized for periods less than one full year.
5. Less than 0.005%.
6. Total expenses including indirect expenses from fund fees and expenses were as follows:
| | | | | | | | |
| | | | | | | |
| | Year Ended December 31, 2019 | | | 0.80% | |
| | Year Ended December 31, 2018 | | | 0.78% | |
| | Year Ended December 31, 2017 | | | 0.76% | |
| | Year Ended December 31, 2016 | | | 0.77% | |
| | Year Ended December 31, 2015 | | | 0.76% | |
7. Waiver was less than 0.005%.
8. Portfolio turnover is calculated at the fund level and is not annualized for periods less than one year, if applicable.
See accompanying Notes to Financial Statements.
13 INVESCO OPPENHEIMER V.I. GLOBAL FUND
FINANCIAL HIGHLIGHTSContinued
| | | | | | | | | | | | | | | | | | |
| Series II Shares | | Year Ended
December 31,
2019 | | | Year Ended
December 31,
2018 | | | Year Ended
December 31,
2017 | | | Year Ended
December 31,
2016 | | | Year Ended
December 31,
2015 |
| Per Share Operating Data | | | | | | | | | | | | | | | | | | |
Net asset value, beginning of period | | | $37.53 | | | | $46.88 | | | | $34.64 | | | | $37.59 | | | $39.10 |
|
|
Income (loss) from investment operations: | | | | | | | | | | | | | | | | | | |
Net investment income1 | | | 0.18 | | | | 0.26 | | | | 0.18 | | | | 0.17 | | | 0.282 |
Net realized and unrealized gain (loss) | | | 10.89 | | | | (5.92) | | | | 12.36 | | | | (0.41) | | | 1.362 |
| | | |
Total from investment operations | | | 11.07 | | | | (5.66) | | | | 12.54 | | | | (0.24) | | | 1.64 |
|
|
Dividends and/or distributions to shareholders: | | | | | | | | | | | | | | | | | | |
Dividends from net investment income | | | (0.28) | | | | (0.36) | | | | (0.30) | | | | (0.27) | | | (0.44) |
Distributions from net realized gain | | | (6.37) | | | | (3.33) | | | | 0.00 | | | | (2.44) | | | (2.71) |
| | | |
Total dividends and/or distributions to shareholders | | | (6.65) | | | | (3.69) | | | | (0.30) | | | | (2.71) | | | (3.15) |
|
|
Net asset value, end of period | | | $41.95 | | | | $37.53 | | | | $46.88 | | | | $34.64 | | | $37.59 |
| | | |
|
|
| Total Return, at Net Asset Value3 | | | 31.45% | | | | (13.39)% | | | | 36.32% | | | | (0.16)% | | | 3.67% |
|
|
| Ratios/Supplemental Data | | | | | | | | | | | | | | | | | | |
Net assets, end of period (in thousands) | | | $1,187,107 | | | | $911,848 | | | | $1,309,590 | | | | $1,065,147 | | | $1,081,711 |
|
|
Average net assets (in thousands) | | | $1,110,567 | | | | $1,215,299 | | | | $1,207,002 | | | | $1,016,772 | | | $1,219,501 |
|
|
Ratios to average net assets:4 | | | | | | | | | | | | | | | | | | |
Net investment income | | | 0.45% | | | | 0.56% | | | | 0.43% | | | | 0.49% | | | 0.70%2 |
Expenses excluding specific expenses listed below | | | 1.04% | | | | 1.03% | | | | 1.01% | | | | 1.02% | | | 1.01% |
Interest and fees from borrowings5 | | | 0.00% | | | | 0.00% | | | | 0.00% | | | | 0.00% | | | 0.00% |
| | | |
Total expenses6 | | | 1.04% | | | | 1.03% | | | | 1.01% | | | | 1.02% | | | 1.01% |
| Expenses after payments, waivers and/or reimbursements and reduction to custodian expenses | | | 1.02% | | | | 1.03%7 | | | | 1.01%7 | | | | 1.02%7 | | | 1.01%7 |
|
|
Portfolio turnover rate8 | | | 23% | | | | 16% | | | | 9% | | | | 14% | | | 14% |
1. Calculated based on the average shares outstanding during the period.
2. Net investment income per share, net realized and unrealized gain (loss) per share and the net investment income ratio include an adjustment for a prior period reclassification for the year ended December 31, 2015.
3. Includes adjustments in accordance with accounting principles generally accepted in the United States of America and as such, the net asset value for financial reporting purposes and the returns based upon those net asset values may differ from the net asset value and returns for shareholder transactions. Total returns are not annualized for periods less than one year, if applicable and do not reflect charges assessed in connection with a variable product, which if included would reduce total returns.
4. Annualized for periods less than one full year.
5. Less than 0.005%.
6. Total expenses including indirect expenses from fund fees and expenses were as follows:
| | | | | | | | |
| | | | | | | |
| | Year Ended December 31, 2019 | | | 1.04% | |
| | Year Ended December 31, 2018 | | | 1.03% | |
| | Year Ended December 31, 2017 | | | 1.01% | |
| | Year Ended December 31, 2016 | | | 1.02% | |
| | Year Ended December 31, 2015 | | | 1.01% | |
7. Waiver was less than 0.005%.
8. Portfolio turnover is calculated at the fund level and is not annualized for periods less than one year, if applicable.
See accompanying Notes to Financial Statements.
14 INVESCO OPPENHEIMER V.I. GLOBAL FUND
NOTES TO FINANCIAL STATEMENTSDecember 31, 2019
Note 1 – Significant Accounting Policies
Invesco Oppenheimer V.I. Global Fund (the “Fund”) is a series portfolio of AIM Variable Insurance Funds (Invesco Variable Insurance Funds) (the “Trust”). The Trust is a Delaware statutory trust registered under the Investment Company Act of 1940, as amended (the “1940 Act”), as anopen-end series management investment company authorized to issue an unlimited number of shares of beneficial interest. Information presented in these financial statements pertains only to the Fund. Matters affecting the Fund or each class will be voted on exclusively by the shareholders of such Fund or each class.
Prior to the close of business on May 24, 2019, the Fund operated as Oppenheimer Global Fund/VA (the “Acquired Fund” or “Predecessor Fund”). The Acquired Fund was reorganized after the close of business on May 24, 2019 (the “Reorganization Date”) through the transfer of all of its assets and liabilities to the Fund (the “Reorganization”).
Upon closing of the Reorganization, holders of the Acquired Fund’sNon-Service and Service shares received Series I and Series II shares of the Fund, respectively. Information for the Acquired Fund’sNon-Service and Service shares prior to the Reorganization is included with Series I and Series II, respectively, throughout this report.
The Fund’s investment objective is to seek capital appreciation.
The Fund currently offers two classes of shares, Series I and Series II, both of which are offered to insurance company separate accounts funding variable annuity contracts and variable life insurance policies (“variable products”).
The Fund is an investment company and accordingly follows the investment company accounting and reporting guidance in accordance with Financial Accounting Standards Board Accounting Standards Codification Topic 946, Financial Services – Investment Companies.
The following is a summary of the significant accounting policies followed by the Fund in the preparation of its financial statements.
| A. | Security Valuations – Securities, including restricted securities, are valued according to the following policy. |
A security listed or traded on an exchange (except convertible securities) is valued at its last sales price or official closing price as of the close of the customary trading session on the exchange where the security is principally traded, or lacking any sales or official closing price on a particular day, the security may be valued at the closing bid price on that day. Securities traded in theover-the-counter market are valued based on prices furnished by independent pricing services or market makers. When such securities are valued by an independent pricing service they may be considered fair valued. Futures contracts are valued at the final settlement price set by an exchange on which they are principally traded. Listed options are valued at the mean between the last bid and asked prices from the exchange on which they are principally traded. Options not listed on an exchange are valued by an independent source at the mean between the last bid and asked prices. For purposes of determining net asset value (“NAV”) per share, futures and option contracts generally are valued 15 minutes after the close of the customary trading session of the New York Stock Exchange (“NYSE”).
Investments inopen-end andclosed-end registered investment companies that do not trade on an exchange are valued at theend-of-day net asset value per share. Investments inopen-end andclosed-end registered investment companies that trade on an exchange are valued at the last sales price or official closing price as of the close of the customary trading session on the exchange where the security is principally traded.
Debt obligations (including convertible securities) and unlisted equities are fair valued using an evaluated quote provided by an independent pricing service. Evaluated quotes provided by the pricing service may be determined without exclusive reliance on quoted prices, and may reflect appropriate factors such asinstitution-size trading in similar groups of securities, developments related to specific securities, dividend rate (for unlisted equities), yield (for debt obligations), quality, type of issue, coupon rate (for debt obligations), maturity (for debt obligations), individual trading characteristics and other market data. Pricing services generally value debt obligations assuming orderly transactions of institutional round lot size, but a fund may hold or transact in the same securities in smaller, odd lot sizes. Odd lots often trade at lower prices than institutional round lots. Debt obligations are subject to interest rate and credit risks. In addition, all debt obligations involve some risk of default with respect to interest and/or principal payments.
Foreign securities’ (including foreign exchange contracts) prices are converted into U.S. dollar amounts using the applicable exchange rates as of the close of the NYSE. If market quotations are available and reliable for foreign exchange-traded equity securities, the securities will be valued at the market quotations. Because trading hours for certain foreign securities end before the close of the NYSE, closing market quotations may become unreliable. If between the time trading ends on a particular security and the close of the customary trading session on the NYSE, events occur that the investment adviser determines are significant and make the closing price unreliable, the Fund may fair value the security. If the event is likely to have affected the closing price of the security, the security will be valued at fair value in good faith using procedures approved by the Board of Trustees. Adjustments to closing prices to reflect fair value may also be based on a screening process of an independent pricing service to indicate the degree of certainty, based on historical data, that the closing price in the principal market where a foreign security trades is not the current value as of the close of the NYSE. Foreign securities’ prices meeting the approved degree of certainty that the price is not reflective of current value will be priced at the indication of fair value from the independent pricing service. Multiple factors may be considered by the independent pricing service in determining adjustments to reflect fair value and may include information relating to sector indices, American Depositary Receipts and domestic and foreign index futures. Foreign securities may have additional risks including exchange rate changes, potential for sharply devalued currencies and high inflation, political and economic upheaval, the relative lack of issuer information, relatively low market liquidity and the potential lack of strict financial and accounting controls and standards.
Securities for which market prices are not provided by any of the above methods may be valued based upon quotes furnished by independent sources. The last bid price may be used to value equity securities. The mean between the last bid and asked prices is used to value debt obligations, including corporate loans.
Securities for which market quotations are not readily available or became unreliable are valued at fair value as determined in good faith by or under the supervision of the Trust’s officers following procedures approved by the Board of Trustees. Issuer specific events, market trends, bid/ asked quotes of brokers and information providers and other market data may be reviewed in the course of making a good faith determination of a
15 INVESCO OPPENHEIMER V.I. GLOBAL FUND
NOTES TO FINANCIAL STATEMENTSContinued
security’s fair value.
The Fund may invest in securities that are subject to interest rate risk, meaning the risk that the prices will generally fall as interest rates rise and, conversely, the prices will generally rise as interest rates fall. Specific securities differ in their sensitivity to changes in interest rates depending on their individual characteristics. Changes in interest rates may result in increased market volatility, which may affect the value and/or liquidity of certain Fund investments.
Valuations change in response to many factors including the historical and prospective earnings of the issuer, the value of the issuer’s assets, general economic conditions, interest rates, investor perceptions and market liquidity. Because of the inherent uncertainties of valuation, the values reflected in the financial statements may materially differ from the value received upon actual sale of those investments.
| B. | Securities Transactions and Investment Income -Securities transactions are accounted for on a trade date basis. Realized gains or losses on sales are computed on the basis of specific identification of the securities sold. Interest income (net of withholding tax, if any) is recorded on the accrual basis from settlement date. Dividend income (net of withholding tax, if any) is recorded on theex-dividend date. |
The Fund may periodically participate in litigation related to Fund investments. As such, the Fund may receive proceeds from litigation settlements. Any proceeds received are included in the Statement of Operations as realized gain (loss) for investments no longer held and as unrealized gain (loss) for investments still held.
Brokerage commissions and mark ups are considered transaction costs and are recorded as an increase to the cost basis of securities purchased and/or a reduction of proceeds on a sale of securities. Such transaction costs are included in the determination of net realized and unrealized gain (loss) from investment transactions reported in the Statement of Operations and the Statement of Changes in Net Assets and the net realized and unrealized gains (losses) on securities per share in the Financial Highlights. Transaction costs are included in the calculation of the Fund’s net asset value and, accordingly, they reduce the Fund’s total returns. These transaction costs are not considered operating expenses and are not reflected in net investment income reported in the Statement of Operations and the Statement of Changes in Net Assets, or the net investment income per share and the ratios of expenses and net investment income reported in the Financial Highlights, nor are they limited by any expense limitation arrangements between the Fund and the investment adviser.
The Fund allocates income and realized and unrealized capital gains and losses to a class based on the relative net assets of each class.
| C. | Country Determination- For the purposes of making investment selection decisions and presentation in the Schedule of Investments, the investment adviser may determine the country in which an issuer is located and/or credit risk exposure based on various factors. These factors include the laws of the country under which the issuer is organized, where the issuer maintains a principal office, the country in which the issuer derives 50% or more of its total revenues and the country that has the primary market for the issuer’s securities, as well as other criteria. Among the other criteria that may be evaluated for making this determination are the country in which the issuer maintains 50% or more of its assets, the type of security, financial guarantees and enhancements, the nature of the collateral and the sponsor organization. |
| D. Distributions | -Dividends and distributions to shareholders, which are determined in accordance with income tax regulations and may differ from accounting principles generally accepted in the United States of America (“GAAP”), are recorded on theex-dividend date. Income and capital gain distributions, if any, are declared and paid annually to separate accounts of participating insurance companies or at other times as determined necessary by the Adviser. |
| E. | Federal Income Taxes -The Fund intends to comply with the requirements of Subchapter M of the Internal Revenue Code of 1986, as amended (the “Internal Revenue Code”), necessary to qualify as a regulated investment company and to distribute substantially all of the Fund’s taxable earnings to shareholders. As such, the Fund will not be subject to federal income taxes on otherwise taxable income (including net realized capital gain) that is distributed to shareholders. Therefore, no provision for federal income taxes is recorded in the financial statements. |
The Fund recognizes the tax benefits of uncertain tax positions only when the position is more likely than not to be sustained. Management has analyzed the Fund’s uncertain tax positions and concluded that no liability for unrecognized tax benefits should be recorded related to uncertain tax positions. Management is not aware of any tax positions for which it is reasonably possible that the total amounts of unrecognized tax benefits will change materially in the next 12 months.
The Fund files tax returns in the U.S. Federal jurisdiction and certain other jurisdictions. Generally, the Fund is subject to examinations by such taxing authorities for up to three years after the filing of the return for the tax period.
| F. | Expenses -Fees provided for under the Rule12b-1 plan of a particular class of the Fund are charged to the operations of such class. Transfer agency fees and expenses and other shareholder recordkeeping fees and expenses attributable to each share class based on relative net assets. Transfer agency fees and expenses and other shareholder recordkeeping fees and expenses relating to all other classes are allocated among those classes based on relative net assets. All other expenses are allocated among the classes based on relative net assets. |
| G. | Accounting Estimates -The financial statements are prepared on a basis in conformity with GAAP, which requires management to make estimates and assumptions that affect the reported amounts of assets and liabilities at the date of the financial statements and the reported amounts of revenues and expenses during the reporting period including estimates and assumptions related to taxation. Actual results could differ from those estimates by a significant amount. In addition, the Fund monitors for material events or transactions that may occur or become known after theperiod-end date and before the date the financial statements are released to print. |
| H. | Indemnifications -Under the Trust’s organizational documents, each Trustee, officer, employee or other agent of the Trust is indemnified against certain liabilities that may arise out of the performance of their duties to the Fund. Additionally, in the normal course of business, the Fund enters into contracts, including the Fund’s servicing agreements, that contain a variety of indemnification clauses. The Fund’s maximum exposure under these arrangements is unknown as this would involve future claims that may be made against the Fund that have not yet occurred. The risk of material loss as a result of such indemnification claims is considered remote. |
| I. | Foreign Currency Translations -Foreign currency is valued at the close of the NYSE based on quotations posted by banks and major currency |
16 INVESCO OPPENHEIMER V.I. GLOBAL FUND
| | dealers. Portfolio securities and other assets and liabilities denominated in foreign currencies are translated into U.S. dollar amounts at the date of valuation. Purchases and sales of portfolio securities (net of foreign taxes withheld on disposition) and income items denominated in foreign currencies are translated into U.S. dollar amounts on the respective dates of such transactions. The Fund does not separately account for the portion of the results of operations resulting from changes in foreign exchange rates on investments and the fluctuations arising from changes in market prices of securities held. The combined results of changes in foreign exchange rates and the fluctuation of market prices on investments (net of estimated foreign tax withholding) are included with the net realized and unrealized gain or loss from investments in the Statement of Operations. Reported net realized foreign currency gains or losses arise from (1) sales of foreign currencies, (2) currency gains or losses realized between the trade and settlement dates on securities transactions, and (3) the difference between the amounts of dividends, interest, and foreign withholding taxes recorded on the Fund’s books and the U.S. dollar equivalent of the amounts actually received or paid. Net unrealized foreign currency gains and losses arise from changes in the fair values of assets and liabilities, other than investments in securities at fiscal period end, resulting from changes in exchange rates. The Fund may invest in foreign securities, which may be subject to foreign taxes on income, gains on investments or currency repatriation, a portion of which may be recoverable. Foreign taxes, if any, are recorded based on the tax regulations and rates that exist in the foreign markets in which the Fund invests and are shown in the Statement of Operations. |
| J. | Forward Foreign Currency Contracts - The Fund may engage in foreign currency transactions either on a spot (i.e. for prompt delivery and settlement) basis, or through forward foreign currency contracts, to manage or minimize currency or exchange rate risk. |
The Fund may also enter into forward foreign currency contracts for the purchase or sale of a security denominated in a foreign currency in order to “lock in” the U.S. dollar price of that security, or the Fund may also enter into forward foreign currency contracts that do not provide for physical settlement of the two currencies, but instead are settled by a single cash payment calculated as the difference between the agreed upon exchange rate and the spot rate at settlement based upon an agreed upon notional amount(non-deliverable forwards). The Fund will set aside liquid assets in an amount equal to the dailymark-to-market obligation for forward foreign currency contracts.
A forward foreign currency contract is an obligation between two parties (“Counterparties”) to purchase or sell a specific currency for an agreed-upon price at a future date. The use of forward foreign currency contracts does not eliminate fluctuations in the price of the underlying securities the Fund owns or intends to acquire but establishes a rate of exchange in advance. Fluctuations in the value of these contracts are measured by the difference in the contract date and reporting date exchange rates and are recorded as unrealized appreciation (depreciation) until the contracts are closed. When the contracts are closed, realized gains (losses) are recorded. Realized and unrealized gains (losses) on the contracts are included in the Statement of Operations. The primary risks associated with forward foreign currency contracts include failure of the Counterparty to meet the terms of the contract and the value of the foreign currency changing unfavorably. These risks may be in excess of the amounts reflected in the Statement of Assets and Liabilities.
Note 2 – Advisory Fees and Other Fees Paid to Affiliates
The Trust has entered into a master investment advisory agreement with Invesco Advisers, Inc. (the “Adviser” or “Invesco”). Under the terms of the investment advisory agreement, the Fund accrues daily and pays monthly an advisory fee to the Adviser based on the annual rate of the Fund’s average daily net assets as follows:
| | | | |
| Fee Schedule* | | |
Up to $200 million | | | 0.75 | % |
Next $200 million | | | 0.72 | |
Next $200 million | | | 0.69 | |
Next $200 million | | | 0.66 | |
Next $4.2 billion | | | 0.60 | |
Over $5 billion | | | 0.58 | |
* The advisory fee paid by the Fund shall be reduced by any amounts paid by the Fund under the administrative service agreement with the advisor.
For the year ended December 31, 2019, the effective advisory fees incurred by the Fund was 0.63%.
From the beginning of the fiscal period until the date of the Reorganization, the Acquired Fund paid $5,929,412 in advisory fees to OFI Global Asset Management, Inc. based on the annual rates above of the Acquired Fund’s average daily net assets.
Under the terms of a mastersub-advisory agreement between the Adviser and each of Invesco Asset Management Deutschland GmbH, Invesco Asset Management Limited, Invesco Asset Management (Japan) Limited, Invesco Hong Kong Limited, Invesco Senior Secured Management, Inc. and Invesco Canada Ltd. and separatesub-advisory agreements with Invesco Capital Management LLC, and Invesco Asset Management (India) Private Limited (collectively, the “AffiliatedSub-Advisers”) the Adviser, not the Fund, will pay 40% of the fees paid to the Adviser to any such AffiliatedSub-Adviser(s) that provide(s) discretionary investment management services to the Fund based on the percentage of assets allocated to such AffiliatedSub-Adviser(s). Invesco has also entered into aSub-Advisory Agreement with OppenheimerFunds, Inc. to provide discretionary management services to the Funds.
Effective on the Reorganization Date, the Adviser has contractually agreed, through May 31, 2021, to waive advisory fees and/or reimburse expenses of all shares to the extent necessary to limit the total annual fund operating expenses after fee waiver and/or expense reimbursement (excluding certain items discussed below) of Series I and Series II shares to 0.77% and 1.02%, respectively, of the Fund’s average daily net assets (the “expense limits”). In determining the Adviser’s obligation to waive advisory fees and/or reimburse expenses, the following expenses are not taken into account, and could cause total annual fund operating expenses after fee waivers and/or expense reimbursement to exceed the numbers reflected above: (1) interest; (2) taxes; (3) dividend expenses on short sales; (4) extraordinary ornon-routine items, including litigation expenses; and (5) expenses that the Fund has incurred but did not actually pay because of an expense offset arrangement. Unless Invesco continues the fee waiver agreement, it will terminate on May
17 INVESCO OPPENHEIMER V.I. GLOBAL FUND
NOTES TO FINANCIAL STATEMENTSContinued
31, 2021. During its term, the fee waiver agreement cannot be terminated or amended to increase the expense limits or reduce the advisory fee waiver without approval of the Board of Trustees.
Further, the Adviser has contractually agreed, through at least June 30, 2021, to waive the advisory fee payable by the Fund in an amount equal to 100% of the net advisory fees the Adviser receives from the affiliated money market funds on investments by the Fund of uninvested cash in such affiliated money market funds.
For the year ended December 31, 2019, the Adviser waived advisory fees of $29,429 and reimbursed Fund expenses of $274,984 and $261,763 for Series I and Series II shares, respectively.
Prior to the Reorganization, the OFI Global Asset Management, Inc. had contractually agreed to waive fees and/or reimburse expenses ofNon-Service and Service shares to 0.77% and 1.02%, respectively, of the Acquired Fund’s average daily net assets.
The Trust has entered into a master administrative services agreement with Invesco pursuant to which the Fund has agreed to pay Invesco a fee for costs incurred in providing accounting services and fund administrative services to the Fund and to reimburse Invesco for fees paid to insurance companies that have agreed to provide certain administrative services to the Fund. These administrative services provided by the insurance companies may include, among other things: maintenance of master accounts with the Fund; tracking, recording and transmitting net purchase and redemption orders for Fund shares; maintaining and preserving records related to the purchase, redemption and other account activity of variable product owners; distributing copies of Fund documents such as prospectuses, proxy materials and periodic reports, to variable product owners, and responding to inquiries from variable product owners about the Fund. Pursuant to such agreement, for the year ended December 31, 2019, Invesco was paid $204,847 for accounting and fund administrative services and was reimbursed $2,163,722 for fees paid to insurance companies. Additionally, Invesco has entered into service agreements whereby JPMorgan Chase Bank serves as custodian to the Fund. Prior to the Reorganization, the Acquired Fund paid administrative fees to OFI Global Asset Management, Inc.
The Trust has entered into a transfer agency and service agreement with Invesco Investment Services, Inc. (“IIS”) pursuant to which the Fund has agreed to pay IIS a fee for providing transfer agency and shareholder services to the Fund and reimburse IIS for certain expenses incurred by IIS in the course of providing such services. Prior to the Reorganization, the Acquired Fund paid transfer agent fees to OFI Global Asset Management, Inc. and Shareholder Services, Inc. For the year ended December 31, 2019, expenses incurred under these agreements are shown in the Statement of Operations as Transfer and shareholder servicing agent fees.
The Trust has entered into master distribution agreements with Invesco Distributors, Inc. (“IDI”) to serve as the distributor for the Series II shares of the Fund. The Trust has adopted a plan pursuant to Rule12b-1 under the 1940 Act with respect to the Fund’s Series II shares (the “Plan”). The Fund, pursuant to the Plan, pays IDI at an annual rate of 0.25% of the average daily net assets of Series II shares. The fees are accrued daily and paid monthly. Of the Plan payments, up to 0.25% of the average daily net assets of the class of shares may be paid to insurance companies who furnish continuing personal shareholder services to customers who purchase and own shares of such class. Any amounts not paid as a service fee under the Plan would constitute an asset-based sales charge. Rules of the Financial Industry Regulatory Authority (“FINRA”) impose a cap on the total sales charges, including asset-based sales charges, that may be paid by any class of shares of the Fund plans. Prior to the Reorganization, the Acquired Fund paid distribution fees to OppenheimerFunds Distributor, Inc. For the year ended December 31, 2019, expenses incurred under the plans are shown in the Statement of Operations as Distribution and service plan fees.
Certain officers and trustees of the Trust are officers and directors of the Adviser, IIS and/or IDI.
Note 3 – Additional Valuation Information
GAAP defines fair value as the price that would be received to sell an asset or paid to transfer a liability in an orderly transaction between market participants at the measurement date, under current market conditions. GAAP establishes a hierarchy that prioritizes the inputs to valuation methods, giving the highest priority to readily available unadjusted quoted prices in an active market for identical assets (Level 1) and the lowest priority to significant unobservable inputs (Level 3), generally when market prices are not readily available or are unreliable. Based on the valuation inputs, the securities or other investments are tiered into one of three levels. Changes in valuation methods may result in transfers in or out of an investment’s assigned level:
Level 1 — Prices are determined using quoted prices in an active market for identical assets.
Level 2 — Prices are determined using other significant observable inputs. Observable inputs are inputs that other market participants may use in pricing a security. These may include quoted prices for similar securities, interest rates, prepayment speeds, credit risk, yield curves, loss severities, default rates, discount rates, volatilities and others.
Level 3 — Prices are determined using significant unobservable inputs. In situations where quoted prices or observable inputs are unavailable (for example, when there is little or no market activity for an investment at the end of the period), unobservable inputs may be used. Unobservable inputs reflect the Fund’s own assumptions about the factors market participants would use in determining fair value of the securities or instruments and would be based on the best available information.
The following is a summary of the tiered valuation input levels, as of December 31, 2019. The level assigned to the securities valuations may not be an indication of the risk or liquidity associated with investing in those securities. Because of the inherent uncertainties of valuation, the values reflected in the financial statements may materially differ from the value received upon actual sale of those investments.
18 INVESCO OPPENHEIMER V.I. GLOBAL FUND
| | | | | | | | | | | | | | |
| | | Level 1—
Unadjusted Quoted Prices | | | Level 2— Other Significant
Observable Inputs | | | Level 3—
Significant
Unobservable
Inputs | | | Value |
Assets Table | | | | | | | | | | | | | | |
Investments, at Value: | | | | | | | | | | | | | | |
| Common Stocks | | | | | | | | | | | | | | |
Consumer Discretionary | | $ | 430,558,292 | | | $ | 280,225,819 | | | $ | — | | | $ 710,784,111 |
Consumer Staples | | | 37,481,521 | | | | 40,352,718 | | | | — | | | 77,834,239 |
Financials | | | 218,095,116 | | | | 211,340,867 | | | | — | | | 429,435,983 |
Health Care | | | 298,385,254 | | | | 44,383,770 | | | | — | | | 342,769,024 |
Industrials | | | 73,767,606 | | | | 260,127,760 | | | | — | | | 333,895,366 |
Information Technology | | | 329,954,279 | | | | 274,558,197 | | | | — | | | 604,512,476 |
Preferred Stock | | | 308,919 | | | | — | | | | — | | | 308,919 |
Investment Company | | | 20,491,964 | | | | — | | | | — | | | 20,491,964 |
| | | |
| Total Assets | | $ | 1,409,042,951 | | | $ | 1,110,989,131 | | | $ | — | | | $ 2,520,032,082 |
| | | |
Note 4 - Security Transactions with Affiliated Funds
The Fund is permitted to purchase or sell securities from or to certain other Invesco Funds under specified conditions outlined in procedures adopted by the Board of Trustees of the Trust. The procedures have been designed to ensure that any purchase or sale of securities by the Fund from or to another fund or portfolio that is or could be considered an affiliate by virtue of having a common investment adviser (or affiliated investment advisers), common Trustees and/or common officers complies with Rule17a-7 of the 1940 Act. Further, as defined under the procedures, each transaction is effected at the current market price. Pursuant to these procedures for the period January 1, 2019 to May 24, 2019,the Predecessor Fund did not engaged in transactions with affiliates. For the period May 25, 2019 to December 31, 2019, the Fund engaged in transactions with affiliates as listed: Securities purchases of $53,061.
Note 5 – Expense Offset Arrangement
The expense offset arrangement is comprised of custodian credits which result from periodic overnight cash balances at the custodian. For the year ended December 31, 2019, the Fund received credits from this arrangement, which resulted in the reduction of the Fund’s total expenses of $16,051.
Note 6 – Trustee and Officer Fees and Benefits
Certain Trustees have executed Deferred Compensation Agreement(s) pursuant to which they have the option to elect to defer receipt of all or a portion of the annual compensation they are entitled to receive from the Fund. For purposes of determining the amount owed to the Trustees under the plan(s), deferred amounts are treated as though equal dollar amounts had been invested in shares of the Fund or in other Invesco and/or Invesco Oppenheimer funds selected by the Trustees. The Fund purchases shares of the funds selected for deferral by the Trustees in amounts equal to his or her deemed investment, resulting in a Fund asset equal to the deferred compensation liability. Such assets are included as a component of “Other” within the asset section of the Statement of Assets and Liabilities. Deferral of Trustees’ fees under the plan(s) will not affect the net assets of the Fund and will not materially affect the Fund’s assets, liabilities or net investment income per share. Amounts will be deferred until distributed in accordance with the Deferred Compensation Agreement(s).
Note 7 – Cash Balances
The Fund is permitted to temporarily carry a negative or overdrawn balance in its account with JPMorgan Chase Bank, the custodian bank. Such balances, if any atperiod-end, are shown in the Statement of Assets and Liabilities under the payable caption Amount due custodian. To compensate the custodian bank for such overdrafts, the overdrawn Fund may either (1) leave funds as a compensating balance in the account so the custodian bank can be compensated by earning the additional interest; or (2) compensate by paying the custodian bank at a rate agreed upon by the custodian bank and Invesco, not to exceed the contractually agreed upon rate.
Note 8 – Distributions to Shareholders and Tax Components of Net Assets
Tax Character of Distributions to Shareholders Paid During the Fiscal Years Ended December 31, 2019 and 2018:
| | | | | | | | |
| | | 2019 | | | 2018 | |
Ordinary income | | $ | 18,844,750 | | | $ | 23,283,339 | |
Long-term capital gain | | | 343,093,696 | | | | 185,925,799 | |
| | | | |
Total distributions | | $ | 361,938,446 | | | $ | 209,209,138 | |
| | | | |
19 INVESCO OPPENHEIMER V.I. GLOBAL FUND
NOTES TO FINANCIAL STATEMENTSContinued
Tax Components of Net Assets atPeriod-End:
| | | | |
| | | 2019 | |
Undistributed ordinary income | | $ | 13,780,667 | |
Undistributed long-term gain | | | 83,318,520 | |
Net unrealized appreciation (depreciation) - investments | | | 1,387,885,573 | |
Temporary book/tax differences | | | (173,216) | |
Shares of beneficial interest | | | 1,036,867,479 | |
| | | | |
Total net assets | | $ | 2,521,679,023 | |
| | | | |
The difference between book-basis andtax-basis unrealized appreciation (depreciation) is due to differences in the timing of recognition of gains and losses on investments for tax and book purposes. The Fund’s net unrealized appreciation (depreciation) difference is attributable primarily to wash sales.
The temporary book/tax differences are a result of timing differences between book and tax recognition of income and/or expenses. The Fund’s temporary book/tax differences are the result of wash sales.
Capital loss carryforward is calculated and reported as of a specific date. Results of transactions and other activity after that date may affect the amount of capital loss carryforward actually available for the Fund to utilize. Capital losses generated in years beginning after December 22, 2010 can be carried forward for an unlimited period, whereas previous losses expire in eight tax years. Capital losses with an expiration period may not be used to offset capital gains until all net capital losses without an expiration date have been utilized. Capital loss carryforwards with no expiration date will retain their character as either short-term or long-term capital losses instead of as short-term capital losses as under prior law. The ability to utilize capital loss carryforwards in the future may be limited under the Internal Revenue Code and related regulations based on the results of future transactions.
The Fund has no capital loss carryforward as of December 31, 2019.
Note 9 – Investment Transactions
The aggregate amount of investment securities (other than short-term securities, U.S. Treasury obligations and money market funds, if any) purchased and sold by the Fund during the year ended December 31, 2019 was $535,524,674 and $674,247,775, respectively. Cost of investments, including any derivatives, on a tax basis includes the adjustments for financial reporting purposes as of the most recently completed federal income tax reportingperiod-end.
| | | | |
| Unrealized Appreciation (Depreciation) of Investments on a Tax Basis | |
Aggregate unrealized appreciation of investments | | $ | 1,434,845,065 | |
Aggregate unrealized (depreciation) of investments | | | (46,959,492) | |
| | | | |
Net unrealized appreciation of investments | | $ | 1,387,885,573 | |
| | | | |
Cost of investments for tax purposes is $1,131,371,388.
Note 10 – Reclassification of Permanent Differences
Primarily as a result of differing book/tax treatment of foreign currency transactions and passive foreign investment companies, on December 31, 2019, undistributed net investment income was increased by $423,388, undistributed net realized gain was decreased by $435,985 and shares of beneficial interest was increased by $12,597. This reclassification had no effect on the net assets of the Fund.
Note 11 – Share Information
Transactions in shares of beneficial interest were as follows:
| | | | | | | | | | | | | | | | |
| | | Year Ended December 31, 20191 | | | Year Ended December 31, 2018 | |
| | | Shares | | | Amount | | | Shares | | | Amount | |
Series I Shares | | | | | | | | | | | | | | | | |
Sold | | | 1,087,675 | | | $ | 44,342,732 | | | | 1,572,044 | | | $ | 70,351,613 | |
Dividends and/or distributions reinvested | | | 5,090,726 | | | | 194,974,813 | | | | 2,449,259 | | | | 111,686,198 | |
Redeemed | | | (5,343,326) | | | | (218,038,597) | | | | (4,681,582) | | | | (216,225,409) | |
| | | | |
Net increase (decrease) | | | 835,075 | | | $ | 21,278,948 | | | | (660,279) | | | $ | (34,187,598) | |
| | | | |
Series II Shares | | | | | | | | | | | | | | | | |
Sold | | | 5,583,631 | | | $ | 232,838,451 | | | | 2,224,972 | | | $ | 100,346,158 | |
Dividends and/or distributions reinvested | | | 4,415,859 | | | | 166,963,633 | | | | 2,162,851 | | | | 97,522,940 | |
Redeemed | | | (5,995,084) | | | | (242,859,301) | | | | (8,029,064) | | | | (354,592,946) | |
| | | | |
Net increase (decrease) | | | 4,004,406 | | | $ | 156,942,783 | | | | (3,641,241) | | | $ | (156,723,848) | |
| | | | |
1. There are entities that are record owners of more than 5% of the outstanding shares of the Fund and own 31% of the outstanding shares of the Fund. The Fund and the Fund’s principal underwriter or adviser, are parties to participation agreements with these entities whereby these entities sell units of interest in separate accounts funding variable products that are invested
20 INVESCO OPPENHEIMER V.I. GLOBAL FUND
in the Fund. The Fund, Invesco and/or Invesco affiliates may make payments to these entities, which are considered to be related to the Fund, for providing services to the Fund, Invesco and/or Invesco affiliates, including, but not limited to services such as securities brokerage, distribution, third party record keeping and account servicing. The Fund has no knowledge as to whether all or any portion of the shares owned of record by these entities are also owned beneficially.
Note 12 – Borrowings
Joint Credit Facility.A number of mutual funds managed by the Adviser participate in a $1.95 billion revolving credit facility (the “Facility”) intended to provide short-term financing, if necessary, subject to certain restrictions in connection with atypical redemption activity. Expenses and fees related to the Facility are paid by the participating funds and are disclosed separately or as other expenses on the Statement of Operations. The Fund did not utilize the Facility during the reporting period. The Facility terminated May 24, 2019.
21 INVESCO OPPENHEIMER V.I. GLOBAL FUND
REPORT OF INDEPENDENT REGISTERED PUBLIC ACCOUNTING FIRM
To the Board of Trustees of AIM Variable Insurance Funds (Invesco Variable Insurance Funds) and Shareholders of Invesco Oppenheimer V.I. Global Fund
Opinion on the Financial Statements
We have audited the accompanying statement of assets and liabilities, including the schedule of investments, of Invesco Oppenheimer V.I. Global Fund (one of the funds constituting AIM Variable Insurance Funds (Invesco Variable Insurance Funds), referred to hereafter as the “Fund”) as of December 31, 2019, the related statements of operations and of changes in net assets for the year ended December 31, 2019, including the related notes, and the financial highlights for the period ended December 31, 2019 (collectively referred to as the “financial statements”). In our opinion, the financial statements present fairly, in all material respects, the financial position of the Fund as of December 31, 2019, the results of its operations and changes in its net assets for the year ended December 31, 2019 and the financial highlights for the period ended December 31, 2019 in conformity with accounting principles generally accepted in the United States of America.
The financial statements of Invesco Oppenheimer V.I. Global Fund (formerly known as Oppenheimer Global Fund/VA) as of and for the year ended December 31, 2018 and the financial highlights for each of the periods ended on or prior to December 31, 2018 (not presented herein, other than the statement of changes in net assets and the financial highlights) were audited by other auditors whose report dated February 14, 2019 expressed an unqualified opinion on those financial statements and financial highlights.
Basis for Opinion
These financial statements are the responsibility of the Fund’s management. Our responsibility is to express an opinion on the Fund’s financial statements based on our audit. We are a public accounting firm registered with the Public Company Accounting Oversight Board (United States) (PCAOB) and are required to be independent with respect to the Fund in accordance with the U.S. federal securities laws and the applicable rules and regulations of the Securities and Exchange Commission and the PCAOB.
We conducted our audit of these financial statements in accordance with the standards of the PCAOB. Those standards require that we plan and perform the audit to obtain reasonable assurance about whether the financial statements are free of material misstatement, whether due to error or fraud.
Our audit included performing procedures to assess the risks of material misstatement of the financial statements, whether due to error or fraud, and performing procedures that respond to those risks. Such procedures included examining, on a test basis, evidence regarding the amounts and disclosures in the financial statements. Our audit also included evaluating the accounting principles used and significant estimates made by management, as well as evaluating the overall presentation of the financial statements. Our procedures included confirmation of securities owned as of December 31, 2019 by correspondence with the custodian and transfer agent. We believe that our audit provides a reasonable basis for our opinion.
/s/PricewaterhouseCoopers LLP
Houston, Texas
February 18, 2020
We have served as the auditor of one or more of the investment companies in the Invesco group of investment companies since at least 1995. We have not been able to determine the specific year we began serving as auditor.
22 INVESCO OPPENHEIMER V.I. GLOBAL FUND
TAX INFORMATION
Form1099-DIV, Form1042-S and other year–end tax information provide shareholders with actual calendar year amounts that should be included in their tax returns. Shareholders should consult their tax advisers.
The following distribution information is being provided as required by the Internal Revenue Code or to meet a specific state’s requirement.
The Fund designates the following amounts or, if subsequently determined to be different, the maximum amount allowable for its fiscal year ended December 31, 2019:
| | | | |
| Federal and State Income Tax | | | |
| |
Long-Term Capital Gain Distributions | | $ | 343,093,696 | |
Corporate Dividends Received Deduction* | | | 61.91 | % |
* The above percentages are based on ordinary income dividends paid to shareholders during the Fund’s fiscal year.
23 INVESCO OPPENHEIMER V.I. GLOBAL FUND
PORTFOLIO PROXY VOTING POLICIES AND GUIDELINES; UPDATES TO SCHEDULE OF INVESTMENTS
Go paperless with eDelivery
Visit invesco.com/edelivery to enjoy the convenience and security of anytime electronic access to your investment documents.
With eDelivery, you can elect to have any or all of the following materials delivered straight to your inbox to download, save and print from your own computer:
• Fund reports and prospectuses
• Quarterly statements
• Daily confirmations
• Tax forms
Invesco mailing information
Send general correspondence to Invesco Investment Services, Inc., P.O. Box 219078, Kansas City, MO 64121-9078.
Important notice regarding delivery of security holder documents
To reduce Fund expenses, only one copy of most shareholder documents may be mailed to shareholders with multiple accounts at the same address (Householding). Mailing of your shareholder documents may be householded indefinitely unless you instruct us otherwise. If you do not want the mailing of these documents to be combined with those for other members of your household, please contact Invesco Investment Services, Inc. at 800 959 4246 or contact your financial institution. We will begin sending you individual copies for each account within 30 days after receiving your request.
Fund holdings and proxy voting information
The Fund provides a complete list of its holdings four times in each fiscal year, at the quarter ends. For the second and fourth quarters, the lists appear in the Fund’s semiannual and annual reports to shareholders. For the first and third quarters, the Fund files the lists with the Securities and Exchange Commission (SEC) as an exhibit to its reports on FormN-PORT. The most recent list of portfolio holdings is available at invesco.com/completeqtrholdings. Shareholders can also look up the Fund’s FormsN-PORT on the SEC website at sec.gov.
A description of the policies and procedures that the Fund uses to determine how to vote proxies relating to portfolio securities is available without charge, upon request, from our Client Services department at 800 959 4246 or at invesco.com/proxyguidelines. The information is also available on the SEC website, sec.gov.
Information regarding how the Fund voted proxies related to its portfolio securities during the most recent12-month period ended June 30 is available at invesco. com/proxysearch. The information is also available on the SEC website, sec.gov.
Invesco Advisers, Inc. is an investment adviser; it provides investment advisory services to individual and institutional clients and does not sell securities. Invesco Distributors, Inc. is the US distributor for Invesco Ltd.’s retail mutual funds, exchange-traded funds and institutional money market funds. Both are wholly owned, indirect subsidiaries of Invesco Ltd.
24 INVESCO OPPENHEIMER V.I. GLOBAL FUND
TRUSTEES AND OFFICERS
The address of each trustee and officer is AIM Variable Insurance Funds (Invesco Variable Insurance Funds) (the “Trust”), 11 Greenway Plaza, Suite 1000, Houston, Texas 77046-1173. The trustees serve for the life of the Trust, subject to their earlier death, incapacitation, resignation, retirement or removal as more specifically provided in the Trust’s organizational documents. Each officer serves for a one year term or until their successors are elected and qualified. Column two below includes length of time served with predecessor entities, if any.
| | | | | | | | |
Name, Year of Birth and Position(s)
Held with the Trust | | Trustee
and/or
Officer Since | | Principal Occupation(s)
During Past 5 Years | | Number of Funds
in Fund Complex
Overseen by Trustee | | Other Directorship(s)
Held by Trustee During Past 5
Years |
| INTERESTED PERSON | | | | | | | | |
Martin L. Flanagan1 — 1960
Trustee and Vice Chair | | 2007 | | Executive Director, Chief Executive Officer and President, Invesco Ltd. (ultimate parent of Invesco and a global investment management firm); Trustee and Vice Chair, The Invesco Funds; Vice Chair, Investment Company Institute; and Member of Executive Board, SMU Cox School of Business Formerly: Advisor to the Board, Invesco Advisers, Inc. (formerly known as Invesco Institutional (N.A.), Inc.); Chairman and Chief Executive Officer, Invesco Advisers, Inc. (registered investment adviser); Director, Chairman, Chief Executive Officer and President, Invesco Holding Company (US), Inc. (formerly IVZ Inc.) (holding company), Invesco Group Services, Inc. (service provider) and Invesco North American Holdings, Inc. (holding company); Director, Chief Executive Officer and President, Invesco Holding Company Limited (parent of Invesco and a global investment management firm); Director, Invesco Ltd.; Chairman, Investment Company Institute and President,Co-Chief Executive Officer,Co-President, Chief Operating Officer and Chief Financial Officer, Franklin Resources, Inc. (global investment management organization) | | 229 | | None |
| 1 Mr. Flanagan is considered an interested person (within the meaning of Section 2(a)(19) of the 1940 Act) of the Trust because he is an officer of the Adviser to the Trust, and an officer and a director of Invesco Ltd., ultimate parent of the Adviser. |
25 INVESCO OPPENHEIMER V.I. GLOBAL FUND
TRUSTEES AND OFFICERS Continued
| | | | | | | | |
Name, Year of Birth and Position(s) Held with
the Trust | | Trustee
and/or
Officer Since | | Principal Occupation(s)
During Past 5 Years | | Number of Funds
in Fund Complex
Overseen by Trustee | | Other Directorship(s)
Held by Trustee During Past 5
Years |
| INDEPENDENT TRUSTEES | | | | | | | | |
Bruce L. Crockett – 1944
Trustee and Chair | | 2003 | | Chairman, Crockett Technologies Associates (technology consulting company) Formerly: Director, Captaris (unified messaging provider); Director, President and Chief Executive Officer, COMSAT Corporation; Chairman, Board of Governors of INTELSAT (international communications company); ACE Limited (insurance company); Independent Directors Council and Investment Company Institute: Member of the Audit Committee, Investment Company Institute; Member of the Executive Committee and Chair of the Governance Committee, Independent Directors Council | | 229 | | Director and Chairman of the Audit Committee, ALPS (Attorneys Liability Protection Society) (insurance company); Director and Member of the Audit Committee and Compensation Committee, Ferroglobe PLC (metallurgical company) |
| | | | | |
David C. Arch – 1945
Trustee | | 2010 | | Chairman of Blistex Inc. (consumer health care products manufacturer); Member, World Presidents’ Organization | | 229 | | Board member of the Illinois Manufacturers’ Association |
| | | | | |
Beth Ann Brown – 1968
Trustee | | 2019 | | Independent Consultant Formerly: Head of Intermediary Distribution, Managing Director, Strategic Relations, Managing Director, Head of National Accounts, Senior Vice President, National Account Manager and Senior Vice President, Key Account Manager, Columbia Management Investment Advisers LLC; Vice President, Key Account Manager, Liberty Funds Distributor, Inc.; and Trustee of certain Oppenheimer Funds | | 229 | | Director, Board of Directors of Caron Engineering Inc.; Advisor, Board of Advisors of Caron Engineering Inc.; President and Director, of Acton Shapleigh Youth Conservation Corps (non -profit); and Vice President and Director of Grahamtastic Connection(non-profit) |
| | | | | |
Jack M. Fields – 1952
Trustee | | 2003 | | Chief Executive Officer, Twenty First Century Group, Inc. (government affairs company); and Chairman, Discovery Learning Alliance(non-profit) Formerly: Owner and Chief Executive Officer, Dos Angeles Ranch L.P. (cattle, hunting, corporate entertainment); Director, Insperity, Inc. (formerly known as Administaff) (human resources provider); Chief Executive Officer, Texana Timber LP (sustainable forestry company); Director of Cross Timbers Quail Research Ranch(non-profit); and member of the U.S. House of Representatives | | 229 | | None |
| | | | | |
Cynthia Hostetler —1962
Trustee | | 2017 | | Non-Executive Director and Trustee of a number of public and private business corporations Formerly: Director, Aberdeen Investment Funds (4 portfolios); Head of Investment Funds and Private Equity, Overseas Private Investment Corporation; President, First Manhattan Bancorporation, Inc.; Attorney, Simpson Thacher & Bartlett LLP | | 229 | | Vulcan Materials Company (construction materials company); Trilinc Global Impact Fund; Genesee & Wyoming, Inc. (railroads); Artio Global Investment LLC (mutual fund complex); Edgen Group, Inc. (specialized energy and infrastructure products distributor); Investment Company Institute (professional organization); Independent Directors Council (professional organization) |
| | | | | |
Eli Jones – 1961
Trustee | | 2016 | | Professor and Dean, Mays Business School - Texas A&M University Formerly: Professor and Dean, Walton College of Business, University of Arkansas and E.J. Ourso College of Business, Louisiana State University; Director, Arvest Bank | | 229 | | Insperity, Inc. (formerly known as Administaff) (human resources provider) |
| | | | | |
Elizabeth Krentzman – 1959
Trustee | | 2019 | | Formerly: Principal and Chief Regulatory Advisor for Asset Management Services and U.S. Mutual Fund Leader of Deloitte & Touche LLP; General Counsel of the Investment Company Institute (trade association); National Director of the Investment Management Regulatory Consulting Practice, Principal, Director and Senior Manager of Deloitte & Touche LLP; Assistant Director of the Division of Investment Management - Office of Disclosure and Investment Adviser Regulation of the U.S. Securities and Exchange Commission and various positions with the Division of Investment Management – Office of Regulatory Policy of the U.S. Securities and Exchange Commission; Associate at Ropes & Gray LLP.; Advisory Board Member of the Securities and Exchange Commission Historical Society; and Trustee of certain Oppenheimer Funds | | 229 | | Trustee of the University of Florida National Board Foundation and Audit Committee Member; Member of the Cartica Funds Board of Directors (private investment funds); Member of the University of Florida Law Center Association, Inc. Board of Trustees and Audit Committee Member |
| | | | | |
Anthony J. LaCava, Jr. – 1956
Trustee | | 2019 | | Formerly: Director and Member of the Audit Committee, Blue Hills Bank (publicly traded financial institution) and Managing Partner, KPMG LLP | | 229* | | Blue Hills Bank; Chairman of Bentley University; Member, Business School Advisory Council; and Nominating Committee, KPMG LLP |
26 INVESCO OPPENHEIMER V.I. GLOBAL FUND
| | | | | | | | |
Name, Year of Birth and Position(s) Held with
the Trust | | Trustee and/or
Officer Since | | Principal Occupation(s) During Past 5 Years | | Number of Funds in Fund Complex
Overseen by Trustee | | Other Directorship(s)
Held by Trustee During Past 5
Years |
INDEPENDENT TRUSTEES (CONTINUED) | | | | | | | | |
| | | | | |
Prema Mathai-Davis – 1950 Trustee | | 2003 | | Retired Co-Owner & Partner of Quantalytics Research, LLC, (a FinTech Investment Research Platform for the Self-Directed Investor) | | 229 | | None |
| | | | | |
Joel W. Motley – 1952 Trustee | | 2019 | | Director of Office of Finance, Federal Home Loan Bank; Member of the Vestry of Trinity Wall Street; Managing Director of Carmona Motley Hoffman, Inc. (privately held financial advisor); Member of the Finance and Budget Committee of the Council on Foreign Relations, Member of the Investment Committee and Board of Human Rights Watch and Member of the Investment Committee and Board of Historic Hudson Valley(non-profit cultural organization). Formerly: Managing Director of Public Capital Advisors, LLC (privately held financial advisor); Managing Director of Carmona Motley Hoffman, Inc. (privately held financial advisor); Trustee of certain Oppenheimer Funds; and Director of Columbia Equity Financial Corp. (privately held financial advisor) | | 229 | | Director of Greenwall Foundation (bioethics research foundation); Member of Board and Investment Committee of The Greenwall Foundation; Director of Southern Africa Legal Services Foundation; Board Member and Investment Committee Member of Pulitzer Center for Crisis Reporting (non- profit journalism) |
| | | | | |
Teresa M. Ressel — 1962 Trustee | | 2017 | | Non-executive director and trustee of a number of public and private business corporations Formerly: Chief Financial Officer, Olayan America, The Olayan Group (international investor/commercial/industrial); Chief Executive Officer, UBS Securities LLC; Group Chief Operating Officer, Americas, UBS AG; Assistant Secretary for Management & Budget and CFO, US Department of the Treasury | | 229 | | Atlantic Power Corporation (power generation company); ON Semiconductor Corp. (semiconductor supplier) |
| | | | | |
Ann Barnett Stern – 1957 Trustee | | 2017 | | President and Chief Executive Officer, Houston Endowment Inc. (private philanthropic institution) Formerly: Executive Vice President and General Counsel, Texas Children’s Hospital; Attorney, Beck, Redden and Secrest, LLP; Business Law Instructor, University of St. Thomas; Attorney, Andrews & Kurth LLP | | 229 | | Federal Reserve Bank of Dallas |
| | | | | |
Robert C. Troccoli – 1949 Trustee | | 2016 | | Retired Formerly: Adjunct Professor, University of Denver – Daniels College of Business, Senior Partner, KPMG LLP | | 229 | | None |
| | | | | |
Daniel S. Vandivort – 1954 Trustee | | 2019 | | Treasurer, Chairman of the Audit and Finance Committee, and Trustee, Board of Trustees, Huntington Disease Foundation of America; and President, Flyway Advisory Services LLC (consulting and property management). Formerly: Trustee and Governance Chair, of certain Oppenheimer Funds | | 229 | | Chairman and Lead Independent Director, Chairman of the Audit Committee, and Director, Board of Directors, Value Line Funds |
| | | | | |
James D. Vaughn – 1945 Trustee | | 2019 | | Retired Formerly: Managing Partner, Deloitte & Touche LLP; Trustee and Chairman of the Audit Committee, Schroder Funds; Board Member, Mile High United Way, Boys and Girls Clubs, Boy Scouts, Colorado Business Committee for the Arts, Economic Club of Colorado and Metro Denver Network (economic development corporation); and Trustee of certain Oppenheimer Funds | | 229 | | Board member and Chairman of Audit Committee of AMG National Trust Bank; Trustee and Investment Committee member, University of South Dakota Foundation; Board member, Audit Committee Member and past Board Chair, Junior Achievement(non-profit) |
| | | | | |
Christopher L. Wilson – 1957 Trustee, Vice Chair and Chair Designate | | 2017 | | Retired Formerly: Director, TD Asset Management USA Inc. (mutual fund complex) (22 portfolios); Managing Partner, CT2, LLC (investing and consulting firm); President/ Chief Executive Officer, Columbia Funds, Bank of America Corporation; President/ Chief Executive Officer, CDC IXIS Asset Management Services, Inc.; Principal & Director of Operations, Scudder Funds, Scudder, Stevens & Clark, Inc.; Assistant Vice President, Fidelity Investments | | 229 | | ISO New England, Inc. (non- profit organization managing regional electricity market) |
27 INVESCO OPPENHEIMER V.I. GLOBAL FUND
TRUSTEES AND OFFICERSContinued
| | | | | | | | |
| | | | | |
Name, Year of Birth and Position(s) Held with
the Trust | | Trustee and/or
Officer Since | | Principal Occupation(s) During Past 5 Years | | Number of Funds
in Fund Complex
Overseen by Trustee | | Other Directorship(s)
Held by Trustee During Past 5
Years |
OTHER OFFICERS | | | | | | | | |
| | | | | |
Sheri Morris — 1964 President, Principal Executive Officer and Treasurer | | 2003 | | Head of Global Fund Services, Invesco Ltd.; President, Principal Executive Officer and Treasurer, The Invesco Funds; Vice President, Invesco Advisers, Inc. (formerly known as Invesco Institutional (N.A.), Inc.) (registered investment adviser); and Vice President, Invesco Exchange-Traded Fund Trust, Invesco Exchange-Traded Fund Trust II, Invesco India Exchange-Traded Fund Trust, Invesco Actively Managed Exchange-Traded Fund Trust, Invesco Actively Managed Exchange-Traded Commodity Fund Trust and Invesco Exchange-Traded Self-Indexed Fund Trust, and Vice President, OppenheimerFunds, Inc. Formerly: Vice President and Principal Financial Officer, The Invesco Funds; Vice President, Invesco AIM Advisers, Inc., Invesco AIM Capital Management, Inc. and Invesco AIM Private Asset Management, Inc.; Assistant Vice President and Assistant Treasurer, The Invesco Funds and Assistant Vice President, Invesco Advisers, Inc., Invesco AIM Capital Management, Inc. and Invesco AIM Private Asset Management, Inc.; and Treasurer, Invesco Exchange-Traded Fund Trust, Invesco Exchange-Traded Fund Trust II, Invesco India Exchange-Traded Fund Trust and Invesco Actively Managed Exchange-Traded Fund Trust | | N/A | | N/A |
| | | | | |
Russell C. Burk — 1958 Senior Vice President and Senior Officer | | 2005 | | Senior Vice President and Senior Officer, The Invesco Funds | | N/A | | N/A |
| | | | | |
Jeffrey H. Kupor – 1968 Senior Vice President, Chief Legal Officer and Secretary | | 2018 | | Head of Legal of the Americas, Invesco Ltd.; Senior Vice President and Secretary, Invesco Advisers, Inc. (formerly known as Invesco Institutional (N.A.), Inc.) (registered investment adviser); Senior Vice President and Secretary, Invesco Distributors, Inc. (formerly known as Invesco AIM Distributors, Inc.); Vice President and Secretary, Invesco Investment Services, Inc. (formerly known as Invesco AIM Investment Services, Inc.) Senior Vice President, Chief Legal Officer and Secretary, The Invesco Funds; Secretary and General Counsel, Invesco Investment Advisers LLC (formerly known as Van Kampen Asset Management); Secretary and General Counsel, Invesco Capital Markets, Inc. (formerly known as Van Kampen Funds Inc.) and Chief Legal Officer, Invesco Exchange-Traded Fund Trust, Invesco Exchange-Traded Fund Trust II, Invesco India Exchange-Traded Fund Trust, Invesco Actively Managed Exchange-Traded Fund Trust, Invesco Actively Managed Exchange-Traded Commodity Fund Trust and Invesco Exchange-Traded Self-Indexed Fund Trust; Secretary, Invesco Indexing LLC; Secretary, W.L. Ross & Co., LLC Formerly: Secretary and Vice President, Jemstep, Inc.; Head of Legal, Worldwide Institutional, Invesco Ltd.; Secretary and General Counsel, INVESCO Private Capital Investments, Inc.; Senior Vice President, Secretary and General Counsel, Invesco Management Group, Inc. (formerly known as Invesco AIM Management Group, Inc.); Assistant Secretary, INVESCO Asset Management (Bermuda) Ltd.; Secretary and General Counsel, Invesco Private Capital, Inc.; Assistant Secretary and General Counsel, INVESCO Realty, Inc.; Secretary and General Counsel, Invesco Senior Secured Management, Inc.; and Secretary, Sovereign G./P. Holdings Inc. | | N/A | | N/A |
| | | | | |
Andrew R. Schlossberg – 1974 Senior Vice President | | 2019 | | Head of the Americas and Senior Managing Director, Invesco Ltd.; Director and Senior Vice President, Invesco Advisers, Inc. (formerly known as Invesco Institutional (N.A.), Inc.) (registered investment adviser); Director and Chairman, Invesco Investment Services, Inc. (formerly known as Invesco AIM Investment Services, Inc.) (registered transfer agent); Senior Vice President, The Invesco Funds; Director, Invesco Investment Advisers LLC (formerly known as Van Kampen Asset Management); Director, President and Chairman, Invesco Insurance Agency, Inc. Formerly: Director, Invesco UK Limited; Director and Chief Executive, Invesco Asset Management Limited and Invesco Fund Managers Limited; Assistant Vice President, The Invesco Funds; Senior Vice President, Invesco Advisers, Inc. (formerly known as Invesco Institutional (N.A.), Inc.) (registered investment adviser); Director and Chief Executive, Invesco Administration Services Limited and Invesco Global Investment Funds Limited; Director, Invesco Distributors, Inc.; Head of EMEA, Invesco Ltd.; President, Invesco Actively Managed Exchange-Traded Commodity Fund Trust, Invesco Actively Managed Exchange-Traded Fund Trust, Invesco Exchange-Traded Fund Trust, Invesco Exchange-Traded Fund Trust II and Invesco India Exchange-Traded Fund Trust; Managing Director and Principal Executive Officer, Invesco Capital Management LLC | | N/A | | N/A |
28 INVESCO OPPENHEIMER V.I. GLOBAL FUND
| | | | | | | | |
| | | | | |
Name, Year of Birth and Position(s) Held with
the Trust | | Trustee and/or
Officer Since | | Principal Occupation(s) During Past 5 Years | | Number of Funds in
Fund Complex
Overseen by Trustee | | Other Directorship(s)
Held by Trustee During Past 5
Years |
OTHER OFFICERS (CONTINUED) | | | | | | | | |
| | | | | |
John M. Zerr — 1962 Senior Vice President | | 2006 | | Chief Operating Officer of the Americas; Senior Vice President, Invesco Advisers, Inc. (formerly known as Invesco Institutional (N.A.), Inc.) (registered investment adviser); Senior Vice President, Invesco Distributors, Inc. (formerly known as Invesco AIM Distributors, Inc.); Director and Vice President, Invesco Investment Services, Inc. (formerly known as Invesco AIM Investment Services, Inc.) Senior Vice President, The Invesco Funds; Managing Director, Invesco Capital Management LLC; Director, Invesco Investment Advisers LLC (formerly known as Van Kampen Asset Management); Senior Vice President, Invesco Capital Markets, Inc. (formerly known as Van Kampen Funds Inc.); Manager, Invesco Indexing LLC; Manager, Invesco Specialized Products, LLC; Director and Senior Vice President, Invesco Insurance Agency, Inc.; Member, Invesco Canada Funds Advisory Board; Director, President and Chief Executive Officer, Invesco Corporate Class Inc. (corporate mutual fund company); and Director, Chairman, President and Chief Executive Officer, Invesco Canada Ltd. (formerly known as Invesco Trimark Ltd./ Invesco Trimark Ltèe) (registered investment adviser and registered transfer agent) Formerly: Director and Senior Vice President, Invesco Management Group, Inc. (formerly known as Invesco AIM Management Group, Inc.); Secretary and General Counsel, Invesco Management Group, Inc. (formerly known as Invesco AIM Management Group, Inc.); Secretary, Invesco Investment Services, Inc. (formerly known as Invesco AIM Investment Services, Inc.); Chief Legal Officer and Secretary, The Invesco Funds; Secretary and General Counsel, Invesco Investment Advisers LLC (formerly known as Van Kampen Asset Management); Secretary and General Counsel, Invesco Capital Markets, Inc. (formerly known as Van Kampen Funds Inc.); Chief Legal Officer, Invesco Exchange-Traded Fund Trust, Invesco Exchange-Traded Fund Trust II, Invesco India Exchange-Traded Fund Trust, Invesco Actively Managed Exchange-Traded Fund Trust, Invesco Actively Managed Exchange-Traded Commodity Fund Trust and Invesco Exchange-Traded Self-Indexed Fund Trust; Secretary, Invesco Indexing LLC; Director, Secretary, General Counsel and Senior Vice President, Van Kampen Exchange Corp.; Director, Vice President and Secretary, IVZ Distributors, Inc. (formerly known as INVESCO Distributors, Inc.); Director and Vice President, INVESCO Funds Group, Inc.; Director and Vice President, Van Kampen Advisors Inc.; Director, Vice President, Secretary and General Counsel, Van Kampen Investor Services Inc.; Director and Secretary, Invesco Distributors, Inc. (formerly known as Invesco AIM Distributors, Inc.); Director, Senior Vice President, General Counsel and Secretary, Invesco AIM Advisers, Inc. and Van Kampen Investments Inc.; Director, Vice President and Secretary, Fund Management Company; Director, Senior Vice President, Secretary, General Counsel and Vice President, Invesco AIM Capital Management, Inc.; Chief Operating Officer and General Counsel, Liberty Ridge Capital, Inc. (an investment adviser) | | N/A | | N/A |
| | | | | |
Gregory G. McGreevey - 1962 Senior Vice President | | 2012 | | Senior Managing Director, Invesco Ltd.; Director, Chairman, President, and Chief Executive Officer, Invesco Advisers, Inc. (formerly known as Invesco Institutional (N.A.), Inc.) (registered investment adviser); Director, Invesco Mortgage Capital, Inc. and Invesco Senior Secured Management, Inc.; and Senior Vice President, The Invesco Funds; and President, SNW Asset Management Corporation Formerly: Senior Vice President, Invesco Management Group, Inc. and Invesco Advisers, Inc.; Assistant Vice President, The Invesco Funds | | N/A | | N/A |
| | | | | |
Kelli Gallegos – 1970 Vice President, Principal Financial Officer and Assistant Treasurer | | 2008 | | Principal Financial and Accounting Officer – Investments Pool, Invesco Specialized Products, LLC; Vice President, Principal Financial Officer and Assistant Treasurer, The Invesco Funds; Principal Financial and Accounting Officer – Pooled Investments, Invesco Capital Management LLC; Vice President and Treasurer, Invesco Exchange-Traded Fund Trust, Invesco Exchange-Traded Fund Trust II, Invesco India Exchange-Traded Fund Trust, Invesco Actively Managed Exchange- Traded Fund Trust, Invesco Actively Managed Exchange-Traded Commodity Fund Trust and Invesco Exchange-Traded Self-Indexed Fund Trust Formerly: Assistant Treasurer, Invesco Specialized Products, LLC; Assistant Treasurer, Invesco Exchange-Traded Fund Trust, Invesco Exchange-Traded Fund Trust II, Invesco India Exchange-Traded Fund Trust, Invesco Actively Managed Exchange-Traded Fund Trust, Invesco Actively Managed Exchange-Traded Commodity Fund Trust and Invesco Exchange-Traded Self-Indexed Fund Trust; Assistant Treasurer, Invesco Capital Management LLC; Assistant Vice President, The Invesco Funds | | N/A | | N/A |
29 INVESCO OPPENHEIMER V.I. GLOBAL FUND
TRUSTEES AND OFFICERSContinued
| | | | | | | | |
| | | | | |
Name, Year of Birth and Position(s) Held with
the Trust | | Trustee and/or
Officer Since | | Principal Occupation(s) During Past 5 Years | | Number of Funds in
Fund Complex
Overseen by Trustee | | Other Directorship(s)
Held by Trustee During Past 5
Years |
OTHER OFFICERS (CONTINUED) | | | | | | | | |
| | | | | |
Crissie M. Wisdom – 1969 Anti-Money Laundering Compliance Officer | | 2013 | | Anti-Money Laundering Compliance Officer, Invesco Advisers, Inc. (formerly known as Invesco Institutional (N.A.), Inc.) (registered investment adviser), Invesco Capital Markets, Inc. (formerly known as Van Kampen Funds Inc.), Invesco Distributors, Inc., Invesco Investment Services, Inc., The Invesco Funds, and Invesco Exchange-Traded Fund Trust, Invesco Exchange-Traded Fund Trust II, Invesco India Exchange-Traded Fund Trust, Invesco Actively Managed Exchange- Traded Fund Trust, Invesco Actively Managed Exchange-Traded Commodity Fund Trust and Invesco Exchange-Traded Self-Indexed Fund Trust; Anti-Money Laundering Compliance Officer and Bank Secrecy Act Officer, INVESCO National Trust Company and Invesco Trust Company; and Fraud Prevention Manager and Controls and Risk Analysis Manager for Invesco Investment Services, Inc. Formerly: Anti-Money Laundering Compliance Officer, Van Kampen Exchange Corp. and Invesco Management Group, Inc. | | N/A | | N/A |
| | | | | |
Robert R. Leveille – 1969 Chief Compliance Officer | | 2016 | | Chief Compliance Officer, Invesco Advisers, Inc. (registered investment adviser); and Chief Compliance Officer, The Invesco Funds Formerly: Chief Compliance Officer, Putnam Investments and the Putnam Funds | | N/A | | N/A |
The Statement of Additional Information of the Trust includes additional information about the Fund’s Trustees and is available upon request, without charge, by calling 1.800.959.4246. Please refer to the Fund’s Statement of Additional Information for information on the Fund’ssub-advisers.
| | | | | | | | |
| Office of the Fund | | Investment Adviser | | Distributor | | Auditors | | |
11 Greenway Plaza,
Suite 1000
Houston, TX 77046-1173 | | Invesco Advisers, Inc.
1555 Peachtree Street, N.E.
Atlanta, GA 30309 | | Invesco Distributors, Inc.
11 Greenway Plaza,
Suite 1000
Houston, TX
77046-1173 | | PricewaterhouseCoopers
LLP
1000 Louisiana Street,
Suite 5800
Houston, TX 77002-5021 | | |
| | | | |
Counsel to the Fund Stradley Ronon Stevens & Young,
LLP
2005 Market Street,
Suite 2600
Philadelphia, PA 19103-7018 | | Counsel to the Independent Trustees Goodwin Procter LLP 901 New York Avenue, N.W.
Washington, D.C. 20001 | | Transfer Agent Invesco Investment Services, Inc. 11 Greenway Plaza, Suite 1000 Houston, TX 77046-1173 | | Custodian JPMorgan Chase Bank 4 Chase Metro Tech Center Brooklyn, NY 11245 | | |
30 INVESCO OPPENHEIMER V.I. GLOBAL FUND
THIS PAGE INTENTIONALLY LEFT BLANK.

| | | | |

| | Annual Report | | 12/31/2019 |
| | | | |
| | | | |
| | | | |
| | | | |
| | | | |
| | | | |
| |
| | Invesco Oppenheimer V.I. Global Strategic Income Fund* Beginning on January 1, 2021, as permitted by regulations adopted by the Securities and Exchange Commission, the insurance company that offers your variable annuity or variable life insurance contract may no longer send you paper copies of the Fund’s shareholder reports by mail, unless you specifically request paper copies of the reports from the insurance company or your financial intermediary. Instead of delivering paper copies of the report, the insurance company may choose to make the reports available on a website, and will notify you by mail each time a report is posted and provide you with a website link to access the report. Instructions for requesting paper copies will be provided by your insurance company. If the insurance company offers electronic delivery, you may elect to receive shareholder reports and other communications about the Fund electronically by following the instructions provided by the insurance company or by contacting your financial intermediary. If you already elected to receive shareholder reports electronically, you will not be affected by this change and you need not take any action. You may elect to receive all future reports in paper free of charge from the insurance company. You can inform the insurance company or your financial intermediary that you wish to continue receiving paper copies of your shareholder reports by following the instructions provided by the insurance company or by contacting your financial intermediary. Your election to receive reports in paper will apply to all portfolio companies available under your contract with the insurance company. The Fund provides a complete list of its holdings four times in each fiscal year, at the quarter ends. For the second and fourth quarters, the lists appear in the Fund’s semi annual and annual reports to shareholders. For the first and third quarters, the Fund files the lists with the Securities and Exchange Commission (SEC) as an exhibit to its reports on Form N-PORT. The Fund’s Form N-PORT filings are available on the SEC website, sec.gov. The Fund’s most recent portfolio holdings, as filed on Form N-PORT, have also been made available to insurance companies issuing variable annuity contracts and variable life insurance policies (“variable products”) that invest in the Fund. A description of the policies and procedures that the Fund uses to determine how to vote proxies relating to portfolio securities is available without charge, upon request, from our Client Services department at 800 959 4246 or at invesco.com/proxyguidelines. The information is also available on the SEC website, sec.gov. Information regarding how the Fund voted proxies related to its portfolio securities during the most recent 12-month period ended June 30 is available at invesco.com/proxysearch. The information is also available on the SEC website, sec.gov. Invesco Advisers, Inc. is an investment adviser; it provides investment advisory services to individual and institutional clients and does not sell securities. Invesco Distributors, Inc. is the US distributor for Invesco Ltd.’s retail mutual funds, exchange- traded funds and institutional money market funds. Both are wholly owned, indirect subsidiaries of Invesco Ltd. This report must be accompanied or preceded by a currently effective Fund prospectus and variable product prospectus, which contain more complete information, including sales charges and expenses. Investors should read each carefully before investing. *Prior to the close of business on May 24, 2019, the Fund’s name was Oppenheimer Global Strategic Income Fund/VA. See Important Update on the following page for more information. |
Important Update
On October 18, 2018, Massachusetts Mutual Life Insurance Company, an indirect corporate parent of OppenheimerFunds, Inc. and its subsidiaries OFI Global Asset Management, Inc., OFI SteelPath, Inc. and OFI Advisors, LLC, announced that it had entered into an agreement whereby Invesco Ltd., a global investment management company would acquire OppenheimerFunds and its subsidiaries (together, “OppenheimerFunds”). After the close of business on May 24, 2019 Invesco Ltd. completed the acquisition of OppenheimerFunds. This Fund was included in that acquisition and as of that date, became part of the Invesco family of funds. Please visit invesco.com for more information or call Invesco’s Client Services team at 800-959-4246.
PORTFOLIO MANAGERS: Hemant Baijal, Chris Kelly, CFA
AVERAGE ANNUAL TOTAL RETURNS FOR THE PERIODS ENDED 12/31/19
| | | | | | | | | | | | | | |
| | | Inception Date | | 1-Year | | | 5-Year | | | 10-Year | |
| Series I Shares* | | 5/3/93 | | | 10.80 | % | | | 3.23 | % | | | 4.71 | % |
| Series II Shares* | | 3/19/01 | | | 10.61 | | | | 3.01 | | | | 4.47 | |
| Bloomberg Barclays U.S. Aggregate Bond Index | | | | | 8.72 | | | | 3.05 | | | | 3.75 | |
Performance quoted is past performance and cannot guarantee future results; current performance may be lower or higher.Visit invesco.com for the most recent month-end performance. Performance figures reflect reinvested distributions and changes in net asset value (NAV). Investment return and principal value will vary so that you may have a gain or a loss when you sell shares. Fund returns include changes in share price, reinvested distributions. Performance figures given represent the Fund and are not intended to reflect actual variable product values. They do not reflect sales charges, expenses and fees assessed in connection with a variable product. Sales charges, expenses and fees, which are determined by the variable product issuers, will vary and will lower the total return. Returns for periods of less than one year are cumulative and not annualized. As the result of a reorganization after the close of business on May 24, 2019, the Non-Service and Service share classes of the predecessor fund were reorganized into Series I and Series II Shares, respectively, of the Fund. Returns shown for Series I and Series II shares are blended returns of the predecessor fund and the Fund. Share class returns will differ from those of the Oppenheimer predecessor fund because of different expenses. See Fund prospectuses and summary prospectuses for more information on share classes, sales charges and new fee agreements, if any. Fund literature is available at invesco.com.
The Fund’s performance is compared to the performance of the Bloomberg Barclays U.S. Aggregate Bond Index, an index of U.S. Government and corporate bonds. The Index is unmanaged and cannot be purchased directly by investors. While index comparisons may be useful to provide a benchmark for the Fund’s performance, it must be noted that the Fund’s investments are not limited to the investments comprising the Index. Index performance includes reinvestment of income, but does not reflect transaction costs, fees, expenses or taxes. Index performance is shown for illustrative purposes only as a benchmark for the Fund’s performance and does not predict or depict performance of the Fund. The Fund’s performance reflects the effects of the Fund’s business and operating expenses.
*Effective after the close of business on May 24, 2019, the Non-Service and Service share classes of the predecessor fund were reorganized into Series I and Series II Shares, respectively, of the Fund. Returns shown for Series I and Series II shares are blended returns of the predecessor fund and the Fund. Share class returns will differ from those of the predecessor fund because of different expenses.
3 INVESCO OPPENHEIMER V.I. GLOBAL STRATEGIC INCOME FUND
TOP HOLDINGS AND ALLOCATIONS
PORTFOLIO ALLOCATION
| | | | |
Non-Convertible Corporate Bonds and Notes | | | 32.5 | % |
Foreign Government Obligations | | | 25.9 | |
Mortgage-Backed Obligations | | | | |
Agency | | | 8.8 | |
CMOs | | | 1.1 | |
Non-Agency | | | 8.4 | |
Investment Companies | | | | |
Carlyle Tactical Private Credit Fund | | | 0.1 | |
Invesco Government & Agency Portfolio, Institutional Class | | | 9.5 | |
Invesco Oppenheimer Limited-Term Bond Fund | | | —* | |
Invesco Oppenheimer Master Event-Linked Bond Fund | | | 2.1 | |
Invesco Oppenheimer Ultra-Short Duration Fund | | | 2.2 | |
Nuveen Floating Rate Income Fund | | | 0.3 | |
Asset-Backed Securities | | | 5.8 | |
Over-the-Counter Options Purchased | | | 1.0 | |
Structured Securities | | | 0.6 | |
| Over-the-Counter Interest Rate Swaptions Purchased | | | 0.6 | |
Short-Term Notes | | | 0.5 | |
Corporate Loans | | | 0.5 | |
Common Stocks | | | 0.1 | |
Rights, Warrants and Certificates | | | —* | |
Preferred Stocks | | | —* | |
Exchange-Traded Options Purchased | | | —* | |
| Over-the-Counter Credit Default Swaptions Purchased | | | —* | |
* Represents a value of less than 0.05%.
Holdings and allocations are subject to change and are not buy/sell recommendations. Percentages are as of December 31, 2019, and are based on total market value of investments.
For more current Fund holdings, please visit invesco.com.
REGIONAL ALLOCATION
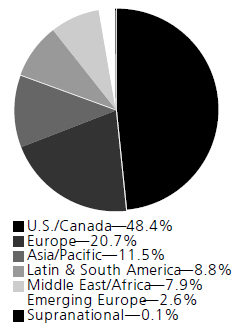
Holdings and allocations are subject to change and are not buy/sell recommendations. Percentages are as of December 31, 2019, and are based on the total market value of investments.
4 INVESCO OPPENHEIMER V.I. GLOBAL STRATEGIC INCOME FUND
Fund Performance Discussion
For the year ended December 31, 2019, Series I shares of Invesco V.I. Global Strategic Income Fund (the Fund) outperformed the Bloomberg Barclays U.S. Aggregate Bond Index (the Index), the Fund’s broad-based securities market/style-specific benchmark. Your Fund’s long-term performance appears later in this report.
MARKET OVERVIEW
2019 was an eventful and volatile year that saw the Federal Reserve cutting interest rates for the first time in more than a decade, and U.S.-China trade relations dominating market sentiment. At the start of the year, rising global growth concerns came to the forefront. In January 2019, we saw the strongest indications yet that the broad economic trends might be evolving. The second quarter started with some hopes for stabilization, with China’s stimulus kicking in and U.S. data recovering from weakness in Q1, but these positive signs proved premature. Due to renewed tensions in the U.S.-China trade dispute and increasing risks regarding global trade, industrial production and global trade weakened noticeably. For most of the world, growth projections were revised down. Trade policy uncertainty was beginning to take its toll on global growth. Besides trade issues and a slowdown in US and Europe, emerging markets also faced a slowing China. As China rebalances away from investment-led growth to consumption-led growth, we do not expect it to provide the same lift to emerging market trade exports going forward as it did in the past.
The third quarter continued to see weaker global growth led primarily by the rest of the world, as economic data in the U.S. surprised to the upside. Global growth outside the U.S. slowed, and policy makers responded by moving towards easier monetary conditions in almost every major global economy. The Federal Reserve delivered the first rate cut of 2019. Most emerging market central banks also continued to reduce rates.
In the fourth quarter, global growth began to stabilize. While an acceleration is yet to show in activity data, forward looking surveys globally are pointing a gradual pick-up in activity. We believe that global growth will remain at around the same levels as 2019, and more likely, slightly higher levels in 2020.
In Asia, the first quarter of 2019 was mired in data weaknesses for Asian emerging markets, despite some stabilization in China. We see this as a manifestation of global trade weakness as global exports and industrial production fell sharply. In addition, Asia felt the headwinds from a slowing technology cycle. In China, front-loading of exports before tariffs took effect and the domestic policy easing were behind the stabilizing growth numbers in the first quarter. Despite fears of downside risks to China’s and Asian emerging markets’ growth in the second half of 2019, Asian economies showed green shoots of recovery towards the end of the year. In the fourth quarter, Purchasing Managers Index turned into expansionary territory, and export growth began to stabilize. The Phase I trade deal between the US and China is expected to be signed mid-January, which helps with investor confidence, as do easier financial conditions on the back of recent monetary easing in the region and a Fed that signaled a pause.
Several countries in the region, such as China, India, Korea and Indonesia have also announced more growth supportive fiscal policies. Nonetheless, continuing structural slowdown in China, and its rebalancing from an investment-led to a consumption-led growth model will not provide the same stimulus to Emerging Markets and commodity prices going forward as in the past. In addition, we do not see a Phase I deal as the end of the geopolitical tensions between China and US. Against this background, we expect a mild and gradual recovery in Asia emerging economies for 2020.
Meanwhile, in Latin America, emerging market economies underperformed growth expectations earlier in the year. The disappointing slowdown broadened from the region’s larger economies to the smaller economies. This trend reversed in the second half of the year as global growth stabilized. In an environment of more supportive global growth, despite a weaker China, we expect emerging markets in Latin America to largely avoid a slowdown in 2020 given the strong rebound in some economies. We see a meaningful recovery in Latin America as the economies in Argentina, Brazil and Mexico recover.
Brazil stands out with strong momentum for a domestic demand-led growth and its structural reform agenda, in an environment of low inflation and low interest rates, while Mexico comes from no growth to show some signs supported by the construction and oil sectors. Argentina should claim the headlines given its debt restructuring process and economic regime change, at the very best showing no contraction this year after 3 declines out of the last 5 years. We do not expect contagion to the region, given the mostly constructive macro background of low inflation and interest rates, moderate fiscal and external balances.
Social unrest across Latin America is being monitored. During the year, it manifested from different reasons in the region, and has been improving. The largest economies of Brazil and Mexico are unlikely to experience it given the high popularity of their presidents, while we expect Chile to bear the largest cost in terms of growth from prolonged uncertainty surrounding its new constitution. In the absence of generalized structural reforms, especially given the politically charged situations in the region, upside to growth or sentiment in developed economies or in China is likely to create more favorable conditions to the region. Central
5 INVESCO OPPENHEIMER V.I. GLOBAL STRATEGIC INCOME FUND
banks for the most part, with Mexico being an exception, have done their part bringing policy rates to accommodative territory and are comfortable with the benign inflation outlook even in the context of weaker exchange rates.
In developed markets, domestically oriented sectors have been resilient despite the weakness in manufacturing. In the U.S., strong labor markets, income growth and high levels of consumer confidence supported consumption. We expect the economy to slow down to its potential rate of just below 2% in the coming year, owing to waning fiscal stimulus that supported the economy over the past two years and an increasingly tight labor market that may slowdown the pace of job and aggregate income growth. A recovery in housing and monetary policy, and consumption growth should support the expansion. In the Eurozone, we expect stabilization in growth, due to receding headwinds from global trade as well as modest fiscal and monetary stimulus.
FUND REVIEW
International fixed income, buoyed by performance in emerging markets, outperformed U.S. fixed income over the reporting period. The Fund’s outperformance relative to the Index this reporting period was largely the result of its allocation to developed markets fixed income and high yield bonds as well as emerging market credit.
The Fund’s credit exposure to Greece and overweight positions in Brazilian and Mexican bonds relative to the Index contributed to positive relative performance during the reporting period. Out of benchmark exposure to Argentinian bonds and the Argentine peso detracted from relative performance as Argentina sold off after an unfavorable market outcome to a primary election.
MARKET OUTLOOK & PORTFOLIO POSITIONING
Looking forward, we see the potential for global growth to improve slightly in 2020, balanced by easing global financial conditions and most importantly in the U.S. With stabilizing growth, the U.S. and global financial conditions will matter more for interest rates while shifting growth dynamics and interest rates would drive currency markets. While we are at the very early stages of considering the use of fiscal policy, there are some signs that policy makers, at very low interest rates, would be willing to use the fiscal policy lever in the future. This too would bring further stability to growth expectations in our view.
With this economic backdrop, in our view the urgency for further rate cuts has diminished, especially given the lags that monetary policy works with. Given that the jury is still out on the US interest rate path, we believe the Fed may cut rates one more time in the first half of 2020, depending on the economic data releases over the next few months. In emerging market countries, there are several central banks with room to cut interest rates. It seems very unlikely that inflation will rise in any major country beyond its base trend. As such, we expect that central banks in India, Indonesia, Mexico and Russia can continue to deliver a few more rate cuts.
From an FX perspective, we continue to believe that the U.S. dollar will continue to slowly decline as the easing financial conditions reduce the cost of being long other developed market currencies such as the Euro and Yen. As financial conditions affect market performance, we expect emerging market currencies will benefit from carry while developed market currencies could benefit from valuations. In this strategy, we are favoring currencies such as the Euro, Brazilian real, Indian rupee, Mexican peso and Russian ruble.
With these valuations, we continue to favor emerging market interest rates over developed market interest rates. Real yields in emerging markets remain close to highs when compared to a combination of developed market yields. We increased portfolio duration opportunistically throughout the quarter as interest rates globally approached more normalized levels.
Given the excellent performance in credit in 2019, we reduced our overall exposure. We also rotated out of financials into structured credit, where we see more value. We will continue to monitor the global financial markets as we seek opportunities to generate income.
The views and opinions expressed in management’s discussion of Fund performance are those of Invesco Advisers, Inc. These views and opinions are subject to change at any time based on factors such as market and economic conditions. These views and opinions may not be relied upon as investment advice or recommendations, or as an offer for a particular security. The information is not a complete analysis of every aspect of any market, country, industry, security or the Fund. Statements of fact are from sources considered reliable, but Invesco Advisers, Inc. makes no representation or warranty as to their completeness or accuracy. Although historical performance is no guarantee of future results, these insights may help you understand our investment management philosophy.
Before investing, investors should carefully read the prospectus and/or summary prospectus and carefully consider the investment objectives, risks, charges and expenses. For this and more complete information about the fund(s), investors should ask their advisors for a prospectus/summary prospectus or visit invesco.com/fundprospectus.
6 INVESCO OPPENHEIMER V.I. GLOBAL STRATEGIC INCOME FUND
Shares of Invesco funds are not deposits or obligations of any bank, are not guaranteed by any bank, are not insured by the FDIC or any other agency, and involve investment risks, including the possible loss of the principal amount invested.
Comparing the Fund’s Performance to the Market.The graphs that follow show the performance of a hypothetical $10,000 investment in each share class of the Fund held until December 31, 2019. Performance is measured over a ten-fiscal-year period for both Classes. Performance information does not reflect charges that apply to separate accounts investing in the Fund. If these charges were taken into account, performance would be lower. The graphs assume that all dividends and capital gains distributions were reinvested in additional shares.
COMPARISON OF CHANGE IN VALUE OF $10,000 HYPOTHETICAL INVESTMENTS IN:
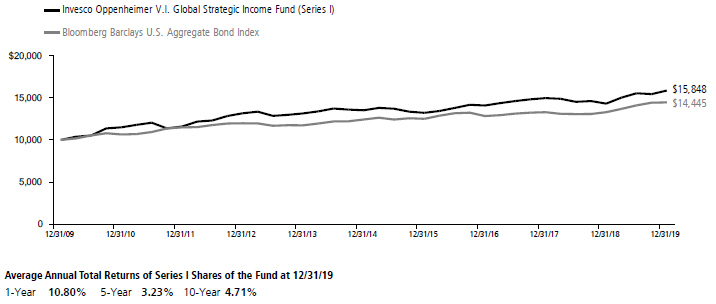
COMPARISON OF CHANGE IN VALUE OF $10,000 HYPOTHETICAL INVESTMENTS IN:
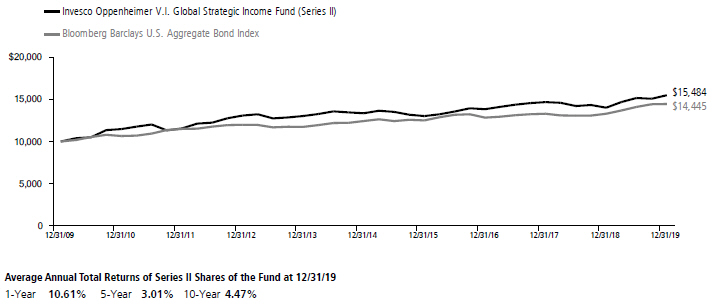
The Fund’s performance is compared to the performance of the Bloomberg Barclays U.S. Aggregate Bond Index, an index of U.S. Government and corporate bonds. The Index is unmanaged and cannot be purchased directly by investors. While index comparisons may be useful to provide a benchmark for the Fund’s performance, it must be noted that the Fund’s investments are not limited to the investments comprising the Index. Index performance includes reinvestment of income, but does not reflect transaction costs, fees, expenses or taxes. Index performance is shown for illustrative purposes only as a benchmark for the Fund’s performance and does not predict or depict performance of the Fund. The Fund’s performance reflects the effects of the Fund’s business and operating expenses.
7 INVESCO OPPENHEIMER V.I. GLOBAL STRATEGIC INCOME FUND
Performance data quoted represents past performance, which does not guarantee future results. The investment return and principal value of an investment in the Fund will fluctuate so that an investor’s shares, when redeemed, may be worth more or less than their original cost. Current performance may be lower or higher than the performance quoted. For performance data current to the most recent month end, call us at 1.800.988.8287. The Fund’s total returns should not be expected to be the same as the returns of other funds, whether or not both funds have the same portfolio managers and/or similar names. The Fund’s total returns include changes in share price and reinvested distributions but do not include the charges associated with the separate account products that offer this Fund. Such performance would have been lower if such charges were taken into account.
8 INVESCO OPPENHEIMER V.I. GLOBAL STRATEGIC INCOME FUND
Fund Expenses
Fund Expenses.As a shareholder of the Fund, you incur two types of costs: (1) transaction costs and (2) ongoing costs, including management fees; distribution and service fees; and other Fund expenses. These examples are intended to help you understand your ongoing costs (in dollars) of investing in the Fund and to compare these costs with the ongoing costs of investing in other mutual funds.
The examples are based on an investment of $1,000.00 invested at the beginning of the period and held for the entire 6-month period ended December 31, 2019.
Actual Expenses. The first section of the table provides information about actual account values and actual expenses. You may use the information in this section for the class of shares you hold, together with the amount you invested, to estimate the expense that you paid over the period. Simply divide your account value by $1,000.00 (for example, an $8,600.00 account value divided by $1,000.00 = 8.60), then multiply the result by the number in the first section under the heading entitled “Expenses Paid During 6 Months Ended December 31, 2019” to estimate the expenses you paid on your account during this period.
Hypothetical Example for Comparison Purposes.
The second section of the table provides information about hypothetical account values and hypothetical expenses based on the Fund’s actual expense ratio for each class of shares, and an assumed rate of return of 5% per year for each class before expenses, which is not the actual return. The hypothetical account values and expenses may not be used to estimate the actual ending account balance or expenses you paid for the period. You may use this information to compare the ongoing costs of investing in the Fund and other funds. To do so, compare this 5% hypothetical example for the class of shares you hold with the 5% hypothetical examples that appear in the shareholder reports of the other funds.
Please note that the expenses shown in the table are meant to highlight your ongoing costs only and do not reflect any charges associated with the separate accounts that offer this Fund. Therefore, the “hypothetical” lines of the table are useful in comparing ongoing costs only, and will not help you determine the relative total costs of owning different funds. In addition, if these separate account charges were included your costs would have been higher.
| | | | | | | | | | | | |
| Actual | | Beginning Account Value July 1, 2019 | | | Ending Account Value December 31, 2019 | | | Expenses Paid During 6 Months Ended December 31, 2019 | |
Series I shares | | $ | 1,000.00 | | | $ | 1,020.50 | | | $ | 3.78 | |
Series II shares | | | 1,000.00 | | | | 1,021.90 | | | | 5.11 | |
| | | |
Hypothetical | | | | | | | | | | | | |
| (5% return before expenses) | | | | | | | | | | | | |
Series I shares | | | 1,000.00 | | | | 1,021.48 | | | | 3.78 | |
Series II shares | | | 1,000.00 | | | | 1,020.16 | | | | 5.10 | |
Expenses are equal to the Fund’s annualized expense ratio for that class, multiplied by the average account value over the period, multiplied by 184/365 (to reflect the one-half year period). Those annualized expense ratios, excluding indirect expenses from affiliated funds, based on the 6-month period ended December 31, 2019 are as follows:
| | | | | | | | |
| Class | | Expense Ratios | |
| Series I shares | | | 0.74 | % | | | | |
| Series II shares | | | 1.00 | | | | | |
The expense ratios reflect voluntary and/or contractual waivers and/or reimbursements of expenses by the Fund’s Manager. Some of these undertakings may be modified or terminated at any time, as indicated in the Fund’s prospectus. The “Financial Highlights” tables in the Fund’s financial statements, included in this report, also show the gross expense ratios, without such waivers or reimbursements and reduction to custodian expenses, if applicable.
9 INVESCO OPPENHEIMER V.I. GLOBAL STRATEGIC INCOME FUND
CONSOLIDATED SCHEDULE OF INVESTMENTSDecember 31, 2019
| | | | | | | | | | |
| | | Principal Amount | | | Value | |
Asset-Backed Securities—6.0% | |
| Alhambra Sme Funding 2019-1, Cl. A, Desginated Activity Company, 2.00%, 11/30/281 | | EUR | | | 5,000,000 | | | $ | 5,567,471 | |
| Alhambra Sme Funding 2019-1, Cl. B, Desginated Activity Company, 2.50%, 11/30/281 | | EUR | | | 625,000 | | | | 689,266 | |
| Alhambra Sme Funding 2019-1, Cl. D, Desginated Activity Company, 8.826%, 11/30/281 | | EUR | | | 150,000 | | | | 168,160 | |
| American Credit Acceptance Receivables Trust: | | | | | |
| Series 2017-4, Cl. C, 2.94%, 1/10/242 | | | | | 236,122 | | | | 236,415 | |
| Series 2017-4, Cl. D, 3.57%, 1/10/242 | | | | | 673,000 | | | | 679,876 | |
| Series 2018-3, Cl. D, 4.14%, 10/15/242 | | | | | 300,000 | | | | 305,844 | |
| Series 2019-2, Cl. D, 3.41%, 6/12/252 | | | | | 1,720,000 | | | | 1,741,764 | |
| Series 2019-3, Cl. C, 2.76%, 9/12/252 | | | | | 1,835,000 | | | | 1,842,003 | |
| AmeriCredit Automobile Receivables Trust: | | | | | |
| Series 2017-2, Cl. D, 3.42%, 4/18/23 | | | | | 830,000 | | | | 844,567 | |
| Series 2017-4, Cl. D, 3.08%, 12/18/23 | | | | | 375,000 | | | | 380,958 | |
| Series 2019-2, Cl. C, 2.74%, 4/18/25 | | | | | 1,185,000 | | | | 1,195,776 | |
| Series 2019-2, Cl. D, 2.99%, 6/18/25 | | | | | 3,290,000 | | | | 3,327,266 | |
| Series 2019-3, Cl. D, 2.58%, 9/18/25 | | | | | 1,550,000 | | | | 1,535,259 | |
| Capital Auto Receivables Asset Trust, Series 2017-1, Cl. D, 3.15%, 2/20/252 | | | | | 110,000 | | | | 111,250 | |
| CarMax Auto Owner Trust: | | | | | |
| Series 2016-1, Cl. D, 3.11%, 8/15/22 | | | | | 465,000 | | | | 465,545 | |
| Series 2017-1, Cl. D, 3.43%, 7/17/23 | | | | | 630,000 | | | | 637,662 | |
| Series 2017-4, Cl. D, 3.30%, 5/15/24 | | | | | 280,000 | | | | 283,608 | |
| Series 2018-1, Cl. D, 3.37%, 7/15/24 | | | | | 195,000 | | | | 198,185 | |
| Series 2019-3, Cl. D, 2.85%, 1/15/26 | | | | | 990,000 | | | | 992,057 | |
| CCG Receivables Trust: | | | | | |
| Series 2017-1, Cl. B, 2.75%, 11/14/232 | | | | | 635,000 | | | | 635,730 | |
| Series 2018-1, Cl. B, 3.09%, 6/16/252 | | | | | 240,000 | | | | 241,864 | |
| Series 2018-1, Cl. C, 3.42%, 6/16/252 | | | | | 70,000 | | | | 70,837 | |
| Series 2019-1, Cl. B, 3.22%, 9/14/262 | | | | | 140,000 | | | | 142,780 | |
| Series 2019-1, Cl. C, 3.57%, 9/14/262 | | | | | 35,000 | | | | 35,727 | |
| CNH Equipment Trust, Series 2017-C, Cl. B, 2.54%, 5/15/25 | | | | | 185,000 | | | | 186,649 | |
| CPS Auto Receivables Trust, Series 2018-A, Cl. B, 2.77%, 4/18/222 | | | | | 249,133 | | | | 249,457 | |
| Credit Acceptance Auto Loan Trust: | | | | | |
| Series 2017-3A, Cl. C, 3.48%, 10/15/262 | | | | | 565,000 | | | | 573,165 | |
| Series 2018-1A, Cl. C, 3.77%, 6/15/272 | | | | | 1,040,000 | | | | 1,060,417 | |
| Series 2019-1A, Cl. B, 3.75%, 4/17/282 | | | | | 85,000 | | | | 87,542 | |
| Series 2019-1A, Cl. C, 3.94%, 6/15/282 | | | | | 515,000 | | | | 532,189 | |
| CWHEQ Revolving Home Equity Loan Trust: | |
| Series 2005-G, Cl. 2A, 1.97% [US0001M+23], 12/15/353 | | | | | 15,510 | | | | 15,309 | |
| Series 2006-H, Cl. 2A1A, 1.89% [US0001M+15], 11/15/363 | | | | | 14,856 | | | | 11,909 | |
| Dell Equipment Finance Trust: | | | | | | | | | | |
| Series 2019-1, Cl. C, 3.14%, 3/22/242 | | | | | 270,000 | | | | 274,014 | |
| Series 2019-2, Cl. D, 2.48%, 4/22/252 | | | | | 1,290,000 | | | | 1,282,466 | |
| Drive Auto Receivables Trust: | | | | | | | | | | |
| Series 2018-3, Cl. D, 4.30%, 9/16/24 | | | | | 175,000 | | | | 179,531 | |
| Series 2019-3, Cl. C, 2.90%, 8/15/25 | | | | | 2,255,000 | | | | 2,279,666 | |
| Series 2019-3, Cl. D, 3.18%, 10/15/26 | | | | | 2,540,000 | | | | 2,577,296 | |
| DT Auto Owner Trust: | | | | | | | | | | |
| Series 2017-1A, Cl. D, 3.55%, 11/15/222 | | | | | 347,414 | | | | 349,340 | |
| Series 2017-1A, Cl. E, 5.79%, 2/15/242 | | | | | 415,000 | | | | 428,097 | |
| Series 2017-2A, Cl. D, 3.89%, 1/15/232 | | | | | 461,783 | | | | 465,061 | |
| Series 2017-4A, Cl. D, 3.47%, 7/17/232 | | | | | 560,000 | | | | 564,019 | |
| Series 2019-2A, Cl. D, 3.48%, 2/18/252 | | | | | 285,000 | | | | 289,067 | |
| Series 2019-3A, Cl. D, 2.96%, 4/15/252 | | | | | 875,000 | | | | 875,745 | |
| Series 2019-4A, Cl. D, 2.85%, 7/15/252 | | | | | 2,050,000 | | | | 2,051,889 | |
| Element Rail Leasing I LLC, Series 2014-1A, Cl. A1, 2.299%, 4/19/442 | | | | | 66,031 | | | | 66,074 | |
| Exeter Automobile Receivables Trust: | | | | | | | | | | |
| Series 2018-1A, Cl. B, 2.75%, 4/15/222 | | | | | 101,115 | | | | 101,155 | |
| | | | | | | | | | |
| | | Principal Amount | | | Value | |
Asset-Backed Securities (Continued) | |
| Exeter Automobile Receivables Trust: (Continued) | |
| Series 2019-1A, Cl. D, 4.13%, 12/16/242 | | $ | | | 2,170,000 | | | $ | 2,240,726 | |
| Series 2019-4A, Cl. D, 2.58%, 9/15/252 | | | | | 2,730,000 | | | | 2,706,465 | |
| GLS Auto Receivables Trust, Series 2018-1A, Cl. A, 2.82%, 7/15/222 | | | | | 278,705 | | | | 279,358 | |
| Madison Park Funding XI Ltd., | | | | | | | | | | |
| Series 2013-11A, Cl. DR, 5.184% [US0003M+325], 7/23/292,3 | | | | | 250,000 | | | | 248,750 | |
| Navistar Financial Dealer Note Master Owner Trust II: | |
| Series 2019-1, Cl. C, 2.742% [US0001M+95], 5/25/242,3 | | | | | 270,000 | | | | 270,599 | |
| Series 2019-1, Cl. D, 3.242% [US0001M+145], 5/25/242,3 | | | | | 255,000 | | | | 255,294 | |
| Prestige Auto Receivables Trust, Series 2019-1A, Cl. C, 2.70%, 10/15/242 | | | | | 1,410,000 | | | | 1,418,410 | |
| Prosil Acquisition SA SER 1 CL A V/R, 1.595%, 10/31/39 | | EUR | | | 2,509,220 | | | | 2,819,754 | |
| Santander Drive Auto Receivables Trust: | |
| Series 2017-1, Cl. E, 5.05%, 7/15/242 | | | | | 1,110,000 | | | | 1,140,497 | |
| Series 2017-2, Cl. D, 3.49%, 7/17/23 | | | | | 190,000 | | | | 192,149 | |
| Series 2017-3, Cl. D, 3.20%, 11/15/23 | | | | | 760,000 | | | | 769,423 | |
| Series 2018-1, Cl. D, 3.32%, 3/15/24 | | | | | 290,000 | | | | 293,090 | |
| Series 2018-2, Cl. D, 3.88%, 2/15/24 | | | | | 145,000 | | | | 148,515 | |
| Series 2019-2, Cl. D, 3.22%, 7/15/25 | | | | | 170,000 | | | | 173,441 | |
| Series 2019-3, Cl. D, 2.68%, 10/15/25 | | | | | 1,910,000 | | | | 1,903,433 | |
| Santander Retail Auto Lease Trust: | | | | | | | | | | |
| Series 2019-A, Cl. C, 3.30%, 5/22/232 | | | | | 2,680,000 | | | | 2,728,143 | |
| Series 2019-B, Cl. C, 2.77%, 8/21/232 | | | | | 1,410,000 | | | | 1,416,682 | |
| Series 2019-C, Cl. C, 2.39%, 11/20/232 | | | | | 2,365,000 | | | | 2,348,580 | |
| SLM Student Loan Trust, Series 2004- 5X, Cl. A6, 0.00% [EUR003M+40], 10/25/392,3 | | EUR | | | 8,452,322 | | | | 9,102,307 | |
| United Auto Credit Securitization Trust, Series 2019-1, Cl. C, 3.16%, 8/12/242 | | | | | 130,000 | | | | 130,998 | |
| Westlake Automobile Receivables Trust, Series 2017-2A, Cl. E, 4.63%, 7/15/242 | | | | | 685,000 | | | | 698,498 | |
| Total Asset-Backed Securities (Cost $67,783,089) | | | | 68,115,039 | |
| | | | | | | | | | |
Mortgage-Backed Obligations—19.0% | |
Agency—9.1% | | | | | | | | | | |
U.S. Agency Securities—9.1% | | | | | | | | | | |
| Federal Home Loan Mortgage Corp. Gold Pool: | | | | | |
| 5.00%, 9/1/33 | | | | | 168,807 | | | | 186,285 | |
| 5.50%, 9/1/39 | | | | | 192,366 | | | | 215,110 | |
| 6.00%, 11/1/21 | | | | | 13,585 | | | | 14,960 | |
| 6.50%, 11/1/22-8/1/32 | | | | | 144,585 | | | | 160,605 | |
| 7.00%, 10/1/31-10/1/37 | | | | | 31,413 | | | | 35,094 | |
| 7.50%, 1/1/32 | | | | | 166,879 | | | | 190,749 | |
| Federal Home Loan Mortgage Corp., Interest-Only Stripped Mtg.-Backed Security: | |
| Series 192,Cl. IO, 99.999%, 2/1/284 | | | | | 3,285 | | | | 490 | |
| Series 205,Cl. IO, 75.286%, 9/1/294 | | | | | 19,932 | | | | 3,766 | |
| Series 243,Cl. 6, 3.501%, 12/15/324 | | | | | 45,716 | | | | 7,708 | |
| Federal Home Loan Mortgage Corp., Multifamily Structured Pass-Through Certificates, Interest-Only Stripped Mtg.- Backed Security, Series K734, Cl. X1, 0.00%, 2/25/264,5 | | | | | 1,679,023 | | | | 57,945 | |
| Federal Home Loan Mortgage Corp., Real Estate Mtg. Investment Conduit Multiclass Pass-Through Certificates: | |
| Series 1360,Cl. PZ, 7.50%, 9/15/22 | | | | | 104,201 | | | | 109,348 | |
| Series 151,Cl. F, 9.00%, 5/15/21 | | | | | 66 | | | | 66 | |
| Series 1674,Cl. Z, 6.75%, 2/15/24 | | | | | 58,252 | | | | 61,748 | |
| Series 1897,Cl. K, 7.00%, 9/15/26 | | | | | 212,011 | | | | 232,475 | |
| Series 2043,Cl. ZP, 6.50%, 4/15/28 | | | | | 106,178 | | | | 118,744 | |
| Series 2106,Cl. FG, 2.19% [US0001M+45], 12/15/283 | | | | | 183,691 | | | | 183,746 | |
| Series 2122,Cl. F, 2.19% [US0001M+45], 2/15/293 | | | | | 5,287 | | | | 5,199 | |
10 INVESCO OPPENHEIMER V.I. GLOBAL STRATEGIC INCOME FUND
| | | | | | | | | | |
| | | Principal Amount | | | Value | |
U.S. Agency Securities (Continued) | | | | | | | | | | |
| Federal Home Loan Mortgage Corp., Real Estate Mtg. Investment Conduit Multiclass Pass-Through Certificates: (Continued) | |
| Series 2148,Cl. ZA, 6.00%, 4/15/29 | | $ | | | 99,208 | | | $ | 109,323 | |
| Series 2195,Cl. LH, 6.50%, 10/15/29 | | | | | 74,242 | | | | 82,731 | |
| Series 2326,Cl. ZP, 6.50%, 6/15/31 | | | | | 9,068 | | | | 10,067 | |
| Series 2344,Cl. FP, 2.69% [US0001M+95], 8/15/313 | | | | | 51,442 | | | | 52,419 | |
| Series 2368,Cl. PR, 6.50%, 10/15/31 | | | | | 37,732 | | | | 42,861 | |
| Series 2412,Cl. GF, 2.69% [US0001M+95], 2/15/323 | | | | | 60,956 | | | | 62,140 | |
| Series 2449,Cl. FL, 2.29% [US0001M+55], 1/15/323 | | | | | 59,107 | | | | 59,337 | |
| Series 2451,Cl. FD, 2.74% [US0001M+100], 3/15/323 | | | | | 27,575 | | | | 28,160 | |
| Series 2461,Cl. PZ, 6.50%, 6/15/32 | | | | | 130,337 | | | | 145,926 | |
| Series 2464,Cl. FI, 2.74% [US0001M+100], 2/15/323 | | | | | 25,219 | | | | 25,749 | |
| Series 2470,Cl. AF, 2.74% [US0001M+100], 3/15/323 | | | | | 47,311 | | | | 48,316 | |
| Series 2470,Cl. LF, 2.74% [US0001M+100], 2/15/323 | | | | | 25,808 | | | | 26,351 | |
| Series 2477,Cl. FZ, 2.29% [US0001M+55], 6/15/313 | | | | | 101,222 | | | | 101,556 | |
| Series 2517,Cl. GF, 2.74% [US0001M+100], 2/15/323 | | | | | 22,439 | | | | 22,910 | |
| Series 2635,Cl. AG, 3.50%, 5/15/32 | | | | | 31,978 | | | | 33,010 | |
| Series 2676,Cl. KY, 5.00%, 9/15/23 | | | | | 234,647 | | | | 243,626 | |
| Series 3025,Cl. SJ, 18.371% [-3.6667 x US0001M+2,475], 8/15/353 | | | | | 63,413 | | | | 87,413 | |
| Series 3857,Cl. GL, 3.00%, 5/15/40 | | | | | 3,587 | | | | 3,642 | |
| Series 3917,Cl. BA, 4.00%, 6/15/38 | | | | | 50,139 | | | | 52,704 | |
| Series 4221,Cl. HJ, 1.50%, 7/15/23 | | | | | 91,802 | | | | 91,197 | |
| Federal Home Loan Mortgage Corp., Real Estate Mtg. Investment Conduit Multiclass Pass-Through Certificates, Interest-Only Stripped Mtg.-Backed Security: | |
| Series 2074,Cl. S, 99.999%, 7/17/284 | | | | | 3,974 | | | | 351 | |
| Series 2079,Cl. S, 99.999%, 7/17/284 | | | | | 7,764 | | | | 833 | |
| Series 2136,Cl. SG, 47.057%, 3/15/294 | | | | | 253,253 | | | | 40,495 | |
| Series 2399,Cl. SG, 99.999%, 12/15/264 | | | | | 133,304 | | | | 17,447 | |
| Series 2437,Cl. SB, 61.288%, 4/15/324 | | | | | 455,311 | | | | 74,864 | |
| Series 2526,Cl. SE, 76.34%, 6/15/294 | | | | | 9,328 | | | | 1,656 | |
| Series 2682,Cl. TQ, 99.999%, 10/15/334 | | | | | 107,374 | | | | 17,813 | |
| Series 2795,Cl. SH, 75.099%, 3/15/244 | | | | | 138,176 | | | | 9,615 | |
| Series 2920,Cl. S, 58.259%, 1/15/354 | | | | | 106,801 | | | | 18,331 | |
| Series 2981,Cl. BS, 99.999%, 5/15/354 | | | | | 215,867 | | | | 38,262 | |
| Series 3397,Cl. GS, 10.265%, 12/15/374 | | | | | 70,759 | | | | 14,554 | |
| Series 3424,Cl. EI, 0.00%, 4/15/384,5 | | | | | 23,205 | | | | 3,468 | |
| Series 3450,Cl. BI, 20.817%, 5/15/384 | | | | | 126,552 | | | | 22,573 | |
| Series 3606,Cl. SN, 19.051%, 12/15/394 | | | | | 35,766 | | | | 5,453 | |
| Federal National Mortgage Assn. Pool: | |
| 5.00%, 3/1/21-7/1/33 | | | | | 187,532 | | | | 206,013 | |
| 5.50%, 4/1/21-5/1/36 | | | | | 100,814 | | | | 112,311 | |
| 6.50%, 12/1/29-1/1/34 | | | | | 301,766 | | | | 335,442 | |
| 7.00%, 1/1/30-4/1/34 | | | | | 389,581 | | | | 444,055 | |
| 7.50%, 2/1/27-3/1/33 | | | | | 530,146 | | | | 611,467 | |
| 8.50%, 7/1/32 | | | | | 392 | | | | 396 | |
| Federal National Mortgage Assn., Interest-Only Stripped Mtg.-Backed Security: | |
| Series 214,Cl. 2, 0.00%, 3/25/234,5 | | | | | 37,720 | | | | 3,296 | |
| Series 221,Cl. 2, 99.999%, 5/25/234 | | | | | 4,364 | | | | 388 | |
| Series 254,Cl. 2, 99.999%, 1/25/244 | | | | | 84,947 | | | | 8,772 | |
| Series 301,Cl. 2, 27.659%, 4/25/294 | | | | | 20,280 | | | | 3,605 | |
| Series 313,Cl. 2, 99.999%, 6/25/314 | | | | | 212,991 | | | | 40,183 | |
| Series 319,Cl. 2, 4.963%, 2/25/324 | | | | | 107,125 | | | | 20,492 | |
| Series 321,Cl. 2, 42.925%, 4/25/324 | | | | | 32,590 | | | | 6,249 | |
| Series 324,Cl. 2, 0.00%, 7/25/324,5 | | | | | 31,121 | | | | 5,836 | |
| Series 328,Cl. 2, 0.00%, 12/25/324,5 | | | | | 61,916 | | | | 12,310 | |
| Series 331,Cl. 5, 2.351%, 2/25/334 | | | | | 120,696 | | | | 24,614 | |
| Series 332,Cl. 2, 0.00%, 3/25/334,5 | | | | | 521,864 | | | | 102,724 | |
| Series 334,Cl. 12, 0.00%, 3/25/334,5 | | | | | 98,003 | | | | 18,933 | |
| | | | | | | | | | |
| | | Principal Amount | | | Value | |
U.S. Agency Securities (Continued) | | | | | | | | | | |
| Federal National Mortgage Assn., Interest-Only Stripped Mtg.-Backed Security: (Continued) | |
| Series 339,Cl. 15, 11.222%, 10/25/334 | | $ | | | 287,208 | | | $ | 57,668 | |
| Series 345,Cl. 9, 0.00%, 1/25/344,5 | | | | | 91,169 | | | | 16,799 | |
| Series 351,Cl. 10, 0.00%, 4/25/344,5 | | | | | 54,097 | | | | 10,257 | |
| Series 351,Cl. 8, 0.00%, 4/25/344,5 | | | | | 98,614 | | | | 18,780 | |
| Series 356,Cl. 10, 0.00%, 6/25/354,5 | | | | | 71,003 | | | | 12,282 | |
| Series 356,Cl. 12, 0.00%, 2/25/354,5 | | | | | 35,171 | | | | 6,577 | |
| Series 362,Cl. 13, 0.00%, 8/25/354,5 | | | | | 45,985 | | | | 9,199 | |
| Federal National Mortgage Assn., Real Estate Mtg. Investment Conduit Multiclass Pass-Through Certificates: | |
| Series 1999-54,Cl. LH, 6.50%, 11/25/29 | | | | | 62,798 | | | | 69,560 | |
| Series 2001-80,Cl. ZB, 6.00%, 1/25/32 | | | | | 53,836 | | | | 59,951 | |
| Series 2002-29,Cl. F, 2.792% [US0001M+100], 4/25/323 | | | | | 27,343 | | | | 27,923 | |
| Series 2002-64,Cl. FJ, 2.792% [US0001M+100], 4/25/323 | | | | | 8,420 | | | | 8,598 | |
| Series 2002-68,Cl. FH, 2.245% [US0001M+50], 10/18/323 | | | | | 18,825 | | | | 18,853 | |
| Series 2002-84,Cl. FB, 2.792% [US0001M+100], 12/25/323 | | | | | 115,060 | | | | 117,515 | |
| Series 2002-90,Cl. FH, 2.292% [US0001M+50], 9/25/323 | | | | | 64,376 | | | | 64,528 | |
| Series 2003-11,Cl. FA, 2.792% [US0001M+100], 9/25/323 | | | | | 115,063 | | | | 117,518 | |
| Series 2003-116,Cl. FA, 2.192% [US0001M+40], 11/25/333 | | | | | 12,103 | | | | 12,084 | |
| Series 2005-109,Cl. AH, 5.50%, 12/25/25 | | | | | 350,011 | | | | 362,428 | |
| Series 2005-71,Cl. DB, 4.50%, 8/25/25 | | | | | 45,943 | | | | 46,957 | |
| Series 2006-11,Cl. PS, 17.996% [-3.6667 x US0001M+2,456.67], 3/25/363 | | | | | 62,569 | | | | 93,141 | |
| Series 2006-46,Cl. SW, 17.629% [-3.6665 x US0001M+2,419.92], 6/25/363 | | | | | 90,932 | | | | 133,144 | |
| Series 2009-113,Cl. DB, 3.00%, 12/25/20 | | | | | 596 | | | | 595 | |
| Series 2009-36,Cl. FA, 2.732% [US0001M+94], 6/25/373 | | | | | 13,668 | | | | 13,905 | |
| Series 2010-43,Cl. KG, 3.00%, 1/25/21 | | | | | 1,295 | | | | 1,296 | |
| Series 2011-122,Cl. EC, 1.50%, 1/25/20 | | | | | 23 | | | | 23 | |
| Series 2011-15,Cl. DA, 4.00%, 3/25/41 | | | | | 35,695 | | | | 37,094 | |
| Series 2011-3,Cl. EL, 3.00%, 5/25/20 | | | | | 125 | | | | 125 | |
| Series 2011-3,Cl. KA, 5.00%, 4/25/40 | | | | | 88,960 | | | | 93,136 | |
| Series 2011-6,Cl. BA, 2.75%, 6/25/20 | | | | | 126 | | | | 126 | |
| Series 2011-82,Cl. AD, 4.00%, 8/25/26 | | | | | 7,865 | | | | 7,897 | |
| Series 2012-20,Cl. FD, 2.192% [US0001M+40], 3/25/423 | | | | | 147,695 | | | | 146,901 | |
| Federal National Mortgage Assn., Real Estate Mtg. Investment Conduit Multiclass Pass- Through Certificates, Interest-Only Stripped Mtg.-Backed Security: | |
| Series 2001-61,Cl. SH, 62.63%, 11/18/314 | | | | | 30,693 | | | | 5,787 | |
| Series 2001-63,Cl. SD, 66.734%, 12/18/314 | | | | | 7,457 | | | | 1,209 | |
| Series 2001-68,Cl. SC, 67.816%, 11/25/314 | | | | | 5,705 | | | | 1,050 | |
| Series 2001-81,Cl. S, 69.467%, 1/25/324 | | | | | 6,327 | | | | 1,117 | |
| Series 2002-28,Cl. SA, 56.182%, 4/25/324 | | | | | 4,955 | | | | 918 | |
| Series 2002-38,Cl. SO, 99.999%, 4/25/324 | | | | | 33,350 | | | | 5,805 | |
| Series 2002-48,Cl. S, 59.236%, 7/25/324 | | | | | 7,061 | | | | 1,377 | |
| Series 2002-52,Cl. SL, 52.438%, 9/25/324 | | | | | 4,979 | | | | 951 | |
| Series 2002-56,Cl. SN, 60.609%, 7/25/324 | | | | | 9,703 | | | | 1,893 | |
| Series 2002-77,Cl. IS, 79.329%, 12/18/324 | | | | | 56,819 | | | | 11,116 | |
11 INVESCO OPPENHEIMER V.I. GLOBAL STRATEGIC INCOME FUND
CONSOLIDATED SCHEDULE OF INVESTMENTSContinued
| | | | | | | | | | |
| | | Principal Amount | | | Value | |
U.S. Agency Securities (Continued) | | | | | | | | | | |
| Federal National Mortgage Assn., Real Estate Mtg. Investment Conduit Multiclass Pass-Through Certificates, Interest-Only Stripped Mtg.-Backed Security: (Continued) | |
| Series 2002-77,Cl. SH, 56.232%, 12/18/324 | | $ | | | 8,951 | | | $ | 1,469 | |
| Series 2002-9,Cl. MS, 52.293%, 3/25/324 | | | | | 8,953 | | | | 1,746 | |
| Series 2003-13,Cl. IO, 61.76%, 3/25/334 | | | | | 99,059 | | | | 21,232 | |
| Series 2003-26,Cl. DI, 61.089%, 4/25/334 | | | | | 72,226 | | | | 17,306 | |
| Series 2003-33,Cl. SP, 45.465%, 5/25/334 | | | | | 53,541 | | | | 11,505 | |
| Series 2003-4,Cl. S, 34.716%, 2/25/334 | | | | | 14,879 | | | | 3,068 | |
| Series 2004-56,Cl. SE, 10.914%, 10/25/334 | | | | | 253,006 | | | | 48,666 | |
| Series 2005-14,Cl. SE, 56.681%, 3/25/354 | | | | | 310,169 | | | | 47,220 | |
| Series 2005-40,Cl. SA, 58.434%, 5/25/354 | | | | | 269,393 | | | | 45,642 | |
| Series 2005-40,Cl. SB, 99.999%, 5/25/354 | | | | | 437,005 | | | | 57,323 | |
| Series 2005-52,Cl. JH, 34.939%, 5/25/354 | | | | | 161,115 | | | | 21,842 | |
| Series 2005-63,Cl. SA, 43.952%, 10/25/314 | | | | | 14,656 | | | | 2,238 | |
| Series 2006-90,Cl. SX, 99.999%, 9/25/364 | | | | | 297,379 | | | | 43,063 | |
| Series 2007-88,Cl. XI, 0.359%, 6/25/374 | | | | | 281,077 | | | | 52,577 | |
| Series 2008-55,Cl. SA, 0.00%, 7/25/384,5 | | | | | 13,780 | | | | 1,910 | |
| Series 2009-8,Cl. BS, 0.00%, 2/25/244,5 | | | | | 483 | | | | 27 | |
| Series 2010-95,Cl. DI, 0.00%, 11/25/204,5 | | | | | 842 | | | | 8 | |
| Series 2011-96,Cl. SA, 10.55%, 10/25/414 | | | | | 122,715 | | | | 20,894 | |
| Series 2012-134,Cl. SA, 0.993%, 12/25/424 | | | | | 419,770 | | | | 78,547 | |
| Series 2012-40,Cl. PI, 24.042%, 4/25/414 | | | | | 639,212 | | | | 67,377 | |
| Federal National Mortgage Assn., Stripped Mtg.-Backed Security, Series 302, Cl. 2, 6.00%, 5/1/29 | | | | | 2 | | | | — | |
| Federal National Mortgage Assn., TBA: | |
| 2.50%, 1/1/346 | | | | | 5,285,000 | | | | 5,330,065 | |
| 3.00%, 1/1/34-1/1/496 | | | | | 33,495,000 | | | | 34,001,259 | |
| 3.50%, 1/1/496 | | | | | 27,235,000 | | | | 28,003,807 | |
| FREMF Mortgage Trust: | | | | | | | | | | |
| Series 2013-K25,Cl. C, 3.619%, 11/25/452,7 | | | | | 135,000 | | | | 137,572 | |
| Series 2013-K26,Cl. C, 3.597%, 12/25/452,7 | | | | | 95,000 | | | | 96,863 | |
| Series 2013-K28,Cl. C, 3.49%, 6/25/462,7 | | | | | 2,330,000 | | | | 2,372,375 | |
| Series 2013-K29,Cl. C, 3.481%, 5/25/462,7 | | | | | 2,300,000 | | | | 2,351,914 | |
| Series 2015-K44,Cl. B, 3.681%, 1/25/482,7 | | | | | 2,310,000 | | | | 2,375,038 | |
| Series 2015-K45,Cl. B, 3.59%, 4/25/482,7 | | | | | 4,646,000 | | | | 4,771,423 | |
| Series 2016-K54,Cl. C, 4.051%, 4/25/482,7 | | | | | 1,810,000 | | | | 1,871,284 | |
| Series 2017-K62,Cl. B, 3.874%, 1/25/502,7 | | | | | 280,000 | | | | 291,040 | |
| Series 2017-K724,Cl. B, 3.485%, 11/25/232,7 | | | | | 1,535,000 | | | | 1,567,417 | |
| Government National Mortgage Assn. I Pool: | |
| 7.00%, 4/15/28-7/15/28 | | | | | 39,787 | | | | 43,564 | |
| 8.00%, 5/15/26 | | | | | 7,051 | | | | 7,070 | |
| Government National Mortgage Assn. II Pool, 4.125% [H15T1Y+150], 11/20/253 | | | | | 1,459 | | | | 1,495 | |
| | | | | | | | | | |
| | | Principal Amount | | | Value | |
U.S. Agency Securities (Continued) | |
| Government National Mortgage Assn. TBA, 3.50%, 1/1/496 | | $ | | | 11,310,000 | | | $ | 11,655,119 | |
| Government National Mortgage Assn., Interest-Only Stripped Mtg.-Backed Security, Series 2011-52, Cl. HS, 20.284%, 4/16/414 | | | | | 269,754 | | | | 42,041 | |
| MASTR Asset Backed Securities Trust, Series 2006-WMC3, Cl. A3, 1.892% [US0001M+10], 8/25/363 | | | | | 821,621 | | | | 382,739 | |
| | | | | | | | | 102,578,105 | |
| | | | | | | | | | | |
CMOs—1.2% | | | | | | | | | | |
Collateralized Mortgage Obligations—1.2% | |
| Bear Stearns ARM Trust, Series 2006-1, Cl. A1, 3.84% [H15T1Y+225], 2/25/363 | | | | | 24,586 | | | | 25,256 | |
| COMM Mortgage Trust, Series 2014-CR20, Cl. ASB, 3.305%, 11/10/47 | | | | | 174,396 | | | | 178,762 | |
| Connecticut Avenue Securities: | |
| Series 2014-C03,Cl. 1M2, 4.792% [US0001M+300], 7/25/243 | | | | | 715,840 | | | | 753,540 | |
| Series 2016-C05,Cl. 2M2, 6.242% [US0001M+445], 1/25/293 | | | | | 1,850,017 | | | | 1,956,051 | |
| Federal Home Loan Mortgage Corp., Multifamily Structured Pass Through Certificates, Interest-Only Stripped Mtg.- Backed Security, Series K735, Cl. X1, 0.00%, 5/25/264,5 | | | | | 3,103,770 | | | | 167,118 | |
| Federal Home Loan Mortgage Corp., Multifamily Structured Pass-Through Certificates, Interest-Only Stripped Mtg.- Backed Security, Series K093, Cl. X1, 0.00%, 5/25/294,5 | | | | | 20,102,252 | | | | 1,517,788 | |
| Federal Home Loan Mortgage Corp., Real Estate Mtg. Investment Conduit Multiclass Pass-Through Certificates, 4.00%, 4/15/40 | | | | | 69,707 | | | | 70,928 | |
| Federal Home Loan Mortgage Corp., Real Estate Mtg. Investment Conduit Multiclass Pass-Through Certificates, Interest-Only Stripped Mtg.-Backed Security: | |
| Series 2922,Cl. SE, 27.229%, 2/15/354 | | | | | 18,062 | | | | 2,834 | |
| Series 2981,Cl. AS, 4.40%, 5/15/354 | | | | | 152,119 | | | | 20,620 | |
| Federal National Mortgage Assn., Real Estate Mtg. Investment Conduit Multiclass Pass-Through Certificates, Interest-Only Stripped Mtg.-Backed Security, Series 2005-12, Cl. SC, 35.965%, 3/25/354 | | | | | 8,139 | | | | 1,261 | |
| FREMF Mortgage Trust: | |
| Series 2013-K27,Cl. C, 3.496%, 1/25/462,7 | | | | | 1,460,000 | | | | 1,496,791 | |
| Series 2016-K723,Cl. C, 3.58%, 11/25/232,7 | | | | | 815,000 | | | | 824,181 | |
| Government National Mortgage Assn., Interest-Only Stripped Mtg.-Backed Security, Series 2007-17, Cl. AI, 47.351%, 4/16/374 | | | | | 165,812 | | | | 29,438 | |
| JP Morgan Chase Commercial Mortgage Securities Trust, Series 2014-C20, Cl. AS, 4.043%, 7/15/47 | | | | | 630,000 | | | | 663,184 | |
| Multifamily Connecticut Avenue Securities Trust, Series 2019-01, Cl. M10, 5.042% [US0001M+325], 10/15/492,3 | | | | | 133,000 | | | | 138,976 | |
| Structured Agency Credit Risk Debt Nts.: | |
| Series 2014-DN1,Cl. M3, 6.292% [US0001M+450], 2/25/243 | | | | | 815,000 | | | | 893,554 | |
| Series 2014-DN2,Cl. M3, 5.392% [US0001M+360], 4/25/243 | | | | | 840,000 | | | | 893,324 | |
| Series 2014-DN3,Cl. M3, 5.792% [US0001M+400], 8/25/243 | | | | | 1,931,085 | | | | 2,059,045 | |
| Series 2014-HQ2,Cl. M3, 5.542% [US0001M+375], 9/25/243 | | | | | 915,000 | | | | 989,166 | |
| Series 2015-HQA2,Cl. M2, 4.592% [US0001M+280], 5/25/283 | | | | | 94,516 | | | | 95,027 | |
12 INVESCO OPPENHEIMER V.I. GLOBAL STRATEGIC INCOME FUND
| | | | | | | | | | |
| | | Principal Amount | | | Value | |
Collateralized Mortgage Obligations (Continued) | |
| WF-RBS Commercial Mortgage Trust, Series 2013-C14, Cl. AS, 3.488%, 6/15/46 | | $ | | | 640,000 | | | $ | 659,161 | |
| | | | | | | | | 13,436,005 | |
| | | | | | | | | | | |
Non-Agency—8.7% | | | | | | | | | | |
| Adjustable-Rate Mortgages—8.7% | | | | | | | | | | |
| Alba plc, Series 2007-1, Cl. F, 4.044% [BP0003M+325], 3/17/392,3 | | | | | 443,948 | | | | 570,918 | |
| Benchmark Mortgage Trust, Interest-Only Commercial Mtg. Pass-Through Certificates, Series 2018-B1, Cl. XA, 10.80%, 1/15/514 | | | | | 5,719,899 | | | | 193,077 | |
| CD Mortgage Trust, Interest-Only Commercial Mtg. Pass-Through Certificates, Series 2017- CD6, Cl. XA, 0.00%, 11/13/504,5 | | | | | 2,285,525 | | | | 119,798 | |
| Chase Mortgage Finance Trust, Series 2005-A2, Cl. 1A3, 4.086%, 1/25/367 | | | | | 9,121 | | | | 9,044 | |
| CHL Mortgage Pass-Through Trust: | |
| Series 2005-17,Cl. 1A8, 5.50%, 9/25/35 | | | | | 363,997 | | | | 364,778 | |
| Series 2005-J4,Cl. A7, 5.50%, 11/25/35 | | | | | 347,690 | | | | 346,569 | |
| Citigroup Commercial Mortgage Trust, Series 2014-GC21, Cl. AAB, 3.477%, 5/10/47 | | | | | 239,391 | | | | 245,839 | |
| Citigroup Commercial Mortgage Trust, Interest-Only Commercial Mtg. Pass-Through Certificates, Series 2017-C4, Cl. XA, 0.00%, 10/12/504,5 | | | | | 6,085,471 | | | | 386,208 | |
| Citigroup Mortgage Loan Trust, Inc.: | | | | | | | | | | |
| Series 2005-2,Cl. 1A3, 4.759%, 5/25/357 | | | | | 404,778 | | | | 413,417 | |
| Series 2006-AR1,Cl. 1A1, 4.97% [H15T1Y+240], 10/25/353 | | | | | 100,857 | | | | 101,041 | |
| Series 2014-8,Cl. 1A2, 2.055% [US0001M+29], 7/20/362,3 | | | | | 3,023,477 | | | | 3,023,307 | |
| COMM Mortgage Trust: | | | | | | | | | | |
| Series 2014-CR21,Cl. AM, 3.987%, 12/10/47 | | | | | 25,000 | | | | 26,554 | |
| Series 2014-LC15,Cl. AM, 4.198%, 4/10/47 | | | | | 455,000 | | | | 483,688 | |
| Series 2014-UBS6,Cl. AM, 4.048%, 12/10/47 | | | | | 1,600,000 | | | | 1,683,427 | |
| COMM Mortgage Trust, Interest-Only Stripped Mtg.-Backed Security, Series 2012-CR5, Cl. XA, 22.774%, 12/10/454 | | | | | 2,473,165 | | | | 95,258 | |
| Connecticut Avenue Securities: | | | | | | | | | | |
| Series 2017-C06,Cl. 1M1, 2.542% [US0001M+75], 2/25/303 | | | | | 22,221 | | | | 22,222 | |
| Series 2017-C07,Cl. 1M2, 4.192% [US0001M+240], 5/25/303 | | | | | 580,000 | | | | 591,278 | |
| Series 2018-C06,Cl. 2M2, 3.892% [US0001M+210], 3/25/313 | | | | | 1,280,000 | | | | 1,288,326 | |
| Connecticut Avenue Securities Trust: | | | | | | | | | | |
| Series 2018-R07,Cl. 1M2, 4.192% [US0001M+240], 4/25/312,3 | | | | | 3,291,140 | | | | 3,332,034 | |
| Series 2019-R02,Cl. 1M2, 4.092% [US0001M+230], 8/25/312,3 | | | | | 1,645,000 | | | | 1,661,627 | |
| Series 2019-R03,Cl. 1M2, 3.942% [US0001M+215], 9/25/312,3 | | | | | 1,525,000 | | | | 1,537,903 | |
| Deutsche Alt-B Securities, Inc. Mortgage Loan Trust, Series 2006-AB2, Cl. A1, 5.178%, 6/25/367 | | | | | 40,136 | | | | 38,975 | |
| Deutsche Mortgage Securities, Inc., Series 2013-RS1, Cl. 1A2, 1.985% [US0001M+22], 7/22/362,3 | | | | | 3,060,694 | | | | 3,032,912 | |
| Eurosail 2006-2bl plc, Series 2006-2X, Cl. E1C, 4.048% [BP0003M+325], 12/15/442,3 | | | | | 1,830,000 | | | | 2,226,031 | |
| Federal Home Loan Mortgage Corp., STACR Trust, Series 2019-HRP1, Cl. M2, 3.192% [US0001M+140], 2/25/492,3 | | | | | 745,000 | | | | 745,698 | |
| Gemgarto 2018-1 plc SER 2018-1 CL E V/R, 3.048%, 9/16/65 | | | | | 2,224,480 | | | | 2,877,762 | |
| | | | | | | | | | |
| | | Principal Amount | | | Value | |
Adjustable-Rate Mortgages (Continued) | |
| GS Mortgage Securities Trust: | | | | | | | | | | |
| Series 2013-GC12,Cl. AAB, 2.678%, 6/10/46 | | $ | | | 63,987 | | | $ | 64,387 | |
| Series 2013-GC16,Cl. AS, 4.649%, 11/10/46 | | | | | 160,000 | | | | 172,275 | |
| Series 2014-GC18,Cl. AAB, 3.648%, 1/10/47 | | | | | 193,888 | | | | 199,039 | |
| GSR Mortgage Loan Trust, Series 2005-AR4, Cl. 6A1, 4.657%, 7/25/357 | | | | | 7,327 | | | | 7,496 | |
| Hawksmoor Mortgage Funding 2019-1 plc SER 2019-1X CL B V/R, 0.00%, [SONIA3M + 175], 5/25/531,2 | | | | | 8,770,000 | | | | 11,708,944 | |
| Hawksmoor Mortgage Funding 2019-1 plc SER 2019-1X CL C V/R, 0.00%, [SONIA3M + 210], 5/25/531,2 | | | | | 4,040,000 | | | | 5,390,519 | |
| HomeBanc Mortgage Trust, Series 2005-3, Cl. A2, 2.102% [US0001M+31], 7/25/353 | | | | | 7,989 | | | | 8,023 | |
| JP Morgan Chase Commercial Mortgage Securities Trust, Series 2013-LC11, Cl. AS, 3.216%, 4/15/46 | | | | | 235,000 | | | | 238,917 | |
| JP Morgan Mortgage Trust, Series 2007-A1, Cl. 5A1, 4.305%, 7/25/357 | | | | | 33,009 | | | | 33,789 | |
| JPMBB Commercial Mortgage Securities Trust: | |
| Series 2014-C24,Cl. B, 4.116%, 11/15/477 | | | | | 680,000 | | | | 706,904 | |
| Series 2014-C25,Cl. AS, 4.065%, 11/15/47 | | | | | 1,720,000 | | | | 1,819,855 | |
| Morgan Stanley Bank of America Merrill Lynch Trust: | |
| Series 2013-C9,Cl. AS, 3.456%, 5/15/46 | | | | | 570,000 | | | | 588,635 | |
| Series 2014-C14,Cl. B, 4.745%, 2/15/477 | | | | | 240,000 | | | | 257,858 | |
| Morgan Stanley Capital I, Inc., Interest-Only Commercial Mtg. Pass-Through Certificates, Series 2017-HR2, Cl. XA, 0.00%, 12/15/504,5 | | | | | 2,006,221 | | | | 103,029 | |
| Paragon Mortgages No 13 plc, Series 13X, Cl. A1, 1.007% [BP0003M+24], 1/15/392,3 | | | | | 10,040,234 | | | | 12,661,114 | |
| RALI Trust, Series 2006-QS13, Cl. 1A8, 6.00%, 9/25/36 | | | | | 10,984 | | | | 9,898 | |
| Residential Asset Securitization Trust, Series 2005-A6CB, Cl. A7, 6.00%, 6/25/35 | | | | | 1,487,684 | | | | 1,403,072 | |
| Stratton Mortgage Funding 2019-1 plc, Series 2019-1, Cl. A, 1.911% [SONIA3M IR+120], 12/10/501,2,3 | | | | | 4,771,944 | | | | 6,340,057 | |
| Structured Agency Credit Risk Debt Nts.: | |
| Series 2016-DNA1,Cl. M2, 4.692% [US0001M+290], 7/25/283 | | | | | 90,484 | | | | 90,872 | |
| Series 2016-DNA2,Cl. M3, 6.442% [US0001M+465], 10/25/283 | | | | | 989,055 | | | | 1,066,029 | |
| Series 2016-DNA3,Cl. M3, 6.792% [US0001M+500], 12/25/283 | | | | | 3,845,000 | | | | 4,195,799 | |
| Series 2016-DNA4,Cl. M3, 5.592% [US0001M+380], 3/25/293 | | | | | 5,570,000 | | | | 5,929,921 | |
| Series 2016-HQA3,Cl. M3, 5.642% [US0001M+385], 3/25/293 | | | | | 3,400,000 | | | | 3,631,215 | |
| Series 2016-HQA4,Cl. M3, 5.692% [US0001M+390], 4/25/293 | | | | | 4,580,000 | | | | 4,893,481 | |
| Series 2017-DNA1,Cl. M2, 5.042% [US0001M+325], 7/25/293 | | | | | 1,980,000 | | | | 2,082,903 | |
| Towd Point Mortgage Funding 2019-Granite4 plc: | |
| 2.545%, 10/20/51 | | | | | 3,700,000 | | | | 4,914,204 | |
| Series 2019-GR4X,Cl. B, 2.195% [BP0003M+140], 10/20/512,3 | | | | | 2,520,000 | | | | 3,343,440 | |
| UBS Commercial Mortgage Trust, Interest-Only Commercial Mtg. Pass-Through Certificates, Series 2017-C5, Cl. XA, 12.545%, 11/15/504 | | | | | 3,784,183 | | | | 215,243 | |
| WaMu Mortgage Pass-Through Certificates Trust: | |
| Series 2003-AR10,Cl. A7, 4.19%, 10/25/337 | | | | | 40,218 | | | | 40,507 | |
13 INVESCO OPPENHEIMER V.I. GLOBAL STRATEGIC INCOME FUND
CONSOLIDATED SCHEDULE OF INVESTMENTSContinued
| | | | | | | | | | |
| | | Principal Amount | | | Value | |
Adjustable-Rate Mortgages (Continued) | |
| WaMu Mortgage Pass-Through Certificates Trust: (Continued) | |
| Series 2005-AR16,Cl. 1A1, 3.748%, 12/25/357 | | $ | | | 6,021 | | | $ | 6,016 | |
| Wells Fargo Commercial Mortgage Trust, Interest-Only Commercial Mtg. Pass-Through Certificates, Series 2017-C42, Cl. XA, 10.48%, 12/15/504 | | | | | 2,785,355 | | | | 164,114 | |
| WF-RBS Commercial Mortgage Trust: | |
| Series 2014-C20,Cl. AS, 4.176%, 5/15/47 | | | | | 490,000 | | | | 519,596 | |
| Series 2014-LC14,Cl. AS, 4.351%, 3/15/477 | | | | | 395,000 | | | | 421,151 | |
| WF-RBS Commercial Mortgage Trust, Interest-Only Commercial Mtg. Pass-Through Certificates, Series 2011-C3, Cl. XA, 0.00%, 3/15/442,4,5 | | | | | 2,880,066 | | | | 37,905 | |
| | | | | | | | | 98,683,898 | |
Total Mortgage-Backed Obligations
(Cost $209,765,839) | | | | | | | | | 214,698,008 | |
| | | | | | | | | | |
Foreign Government Obligations—26.8% | |
Angola—0.3% | | | | | | | | | | |
| Republic of Angola: | | | | | | | | | | |
| 8.00% Sr. Unsec. Nts., 11/26/292 | | | | | 1,100,000 | | | | 1,176,691 | |
| 9.125% Sr. Unsec. Nts., 11/26/492 | | | | | 1,250,000 | | | | 1,340,664 | |
| 9.375% Sr. Unsec. Nts., 5/8/482 | | | | | 915,000 | | | | 1,006,505 | |
| | | | | | | | | 3,523,860 | |
| | | | | | | | | | | |
Argentina—1.2% | | | | | | | | | | |
| Argentine Republic: | | | | | | | | | | |
| 0.000%, 7/29/208 | | ARS | | | 189,100,000 | | | | 2,417,070 | |
| 0.202%, 10/29/208 | | ARS | | | 505,000,000 | | | | 5,752,199 | |
| 5.625% Sr. Unsec. Nts., 1/26/22 | | | | | 1,476,000 | | | | 773,516 | |
| 6.875% Sr. Unsec. Nts., 1/26/27 | | | | | 3,025,000 | | | | 1,518,644 | |
| 7.50% Sr. Unsec. Nts., 4/22/26 | | | | | 5,196,000 | | | | 2,714,098 | |
| 9.80% Unsec. Nts., 5/28/208 | | ARS | | | 56,000,000 | | | | 738,515 | |
| 18.20% Unsec. Nts., 10/3/21 | | ARS | | | 9,285,000 | | | | 59,604 | |
| | | | | | | | | 13,973,646 | |
| | | | | | | | | | | |
Austria—0.3% | | | | | | | | | | |
| Republic of Austria, 1.50% Sr. Unsec. Nts., 11/2/862 | | EUR | | | 2,400,000 | | | | 3,372,401 | |
| | | | | | | | | | | |
Brazil—0.6% | | | | | | | | | | |
| Brazilian Government International Bond, 4.75% Sr. Unsec. Nts., 1/14/50 | | | | | 1,250,000 | | | | 1,245,117 | |
| Federative Republic of Brazil: | | | | | | | | | | |
| 6.00% Nts., 5/15/459 | | BRL | | | 4,000,000 | | | | 4,622,654 | |
| 10.00% Nts., 1/1/29 | | BRL | | | 4,500,000 | | | | 1,352,385 | |
| | | | | | | | | 7,220,156 | |
| | | | | | | | | | | |
Colombia—0.3% | | | | | | | | | | |
| Republic of Colombia, Series B, 10.00% Bonds, 7/24/24 | | COP | | | 10,146,000,000 | | | | 3,661,401 | |
| | | | | | | | | | | |
Cyprus—0.2% | | | | | | | | | | |
| Republic of Cyprus, 2.75% Sr. Unsec. Nts., 5/3/492 | | EUR | | | 1,375,000 | | | | 1,982,444 | |
| | | | | | | | | | | |
Dominican Republic—0.6% | | | | | | | | | | |
| Dominican Republic: | | | | | | | | | | |
| 6.40% Sr. Unsec. Nts., 6/5/492 | | | | | 1,187,000 | | | | 1,305,326 | |
| 6.875% Sr. Unsec. Nts., 1/29/262 | | | | | 2,500,000 | | | | 2,860,269 | |
| 7.50% Sr. Unsec. Nts., 5/6/212 | | | | | 2,400,000 | | | | 2,496,024 | |
| | | | | | | | | 6,661,619 | |
| | | | | | | | | | | |
Ecuador—0.0% | | | | | | | | | | |
| Republic of Ecuador, 8.875% Sr. Unsec. Nts., 10/23/272 | | | | | 285,000 | | | | 262,299 | |
| | | | | | | | | | | |
Egypt—2.1% | | | | | | | | | | |
| Arab Republic of Egypt: | | | | | | | | | | |
| 4.75% Sr. Unsec. Nts., 4/16/262 | | EUR | | | 1,900,000 | | | | 2,248,448 | |
| 5.577% Sr. Unsec. Nts., 2/21/232 | | | | | 3,050,000 | | | | 3,196,708 | |
| | | | | | | | | | |
| | | Principal Amount | | | Value | |
Egypt (Continued) | | | | | | | | | | |
| Arab Republic of Egypt: (Continued) | |
| 6.125% Sr. Unsec. Nts., 1/31/222 | | $ | | | 3,040,000 | | | $ | 3,170,723 | |
| 8.50% Sr. Unsec. Nts., 1/31/472 | | | | | 1,450,000 | | | | 1,614,488 | |
| 8.70% Sr. Unsec. Nts., 3/1/492 | | | | | 1,711,000 | | | | 1,918,647 | |
| 16.00% Unsec. Nts., 12/12/20 | | EGP | | | 29,000,000 | | | | 1,832,032 | |
| 16.00% Bonds, 6/11/22 | | EGP | | | 154,800,000 | | | | 10,030,674 | |
| | | | | | | | | 24,011,720 | |
| | | | | | | | | | | |
El Salvador—0.1% | |
| Republic of El Salvador, 7.125% Sr. Unsec. Nts., 1/20/502 | | | | | 1,365,500 | | | | 1,458,101 | |
| | | | | | | | | | | |
Greece—2.6% | | | | | | | | | | |
| Hellenic Republic: | | | | | | | | | | |
| Bonds, 10/15/427 | | EUR | | | 23,730,000 | | | | 100,190 | |
| 3.875% Sr. Unsec. Nts., 3/12/292 | | EUR | | | 2,400,000 | | | | 3,251,387 | |
| 3.90% Bonds, 1/30/332 | | EUR | | | 9,545,000 | | | | 13,159,236 | |
| 4.00% Bonds, 1/30/372 | | EUR | | | 6,475,000 | | | | 9,109,070 | |
| 4.20% Bonds, 1/30/422 | | EUR | | | 2,205,000 | | | | 3,273,586 | |
| | | | | | | | | 28,893,469 | |
| | | | | | | | | | | |
India—2.1% | | | | | | | | | | |
| Export-Import Bank of India: | | | | | | | | | | |
| 7.35% Sr. Unsec. Nts., 5/18/22 | | INR | | | 70,000,000 | | | | 992,176 | |
| 8.00% Sr. Unsec. Nts., 5/27/21 | | INR | | | 80,000,000 | | | | 1,137,430 | |
| Republic of India: | | | | | | | | | | |
| 7.17% Sr. Unsec. Nts., 1/8/28 | | INR | | | 385,000,000 | | | | 5,505,729 | |
| 7.59% Sr. Unsec. Nts., 1/11/26 | | INR | | | 600,000,000 | | | | 8,756,882 | |
| 7.72% Sr. Unsec. Nts., 5/25/25 | | INR | | | 15,000,000 | | | | 220,172 | |
| 8.20% Sr. Unsec. Nts., 9/24/25 | | INR | | | 215,600,000 | | | | 3,239,984 | |
| 8.24% Sr. Unsec. Nts., 2/15/27 | | INR | | | 215,000,000 | | | | 3,244,060 | |
| | | | | | | | | 23,096,433 | |
| | | | | | | | | | | |
Indonesia—2.4% | | | | | | | | | | |
| Perusahaan Penerbit SBSN Indonesia III: | |
| 4.35% Sr. Unsec. Nts., 9/10/242 | | | | | 525,000 | | | | 567,092 | |
| 4.55% Sr. Unsec. Nts., 3/29/262 | | | | | 790,000 | | | | 865,625 | |
| Republic of Indonesia: | | | | | | | | | | |
| 4.125% Sr. Unsec. Nts., 1/15/252 | | | | | 490,000 | | | | 526,574 | |
| 8.125% Sr. Unsec. Nts., 5/15/24 | | IDR | | | 26,000,000,000 | | | | 1,999,748 | |
| 8.25% Sr. Unsec. Nts., 5/15/29 | | IDR | | | 29,100,000,000 | | | | 2,264,381 | |
| Series FR56, 8.375% Sr. Unsec. Nts., 9/15/26 | | IDR | | | 104,095,000,000 | | | | 8,078,917 | |
| Series FR59, 7.00% Sr. Unsec. Nts., 5/15/27 | | IDR | | | 40,000,000,000 | | | | 2,877,228 | |
| Series FR64, 6.125% Sr. Unsec. Nts., 5/15/28 | | IDR | | | 20,000,000,000 | | | | 1,360,710 | |
| Series FR74, 7.50% Sr. Unsec. Nts., 8/15/32 | | IDR | | | 72,480,000,000 | | | | 5,215,721 | |
| Series FR82, 7.00% Sr. Unsec. Nts., 9/15/30 | | IDR | | | 30,000,000,000 | | | | 2,142,652 | |
| Series FR83, 7.50% Sr. Unsec. Nts., 4/15/40 | | IDR | | | 21,250,000,000 | | | | 1,533,777 | |
| | | | | | | | | 27,432,425 | |
| | | | | | | | | | | |
| Italy—3.1% | | | | | | | | | | |
| Republic of Italy: | | | | | | | | | | |
| 2.70% Sr. Unsec. Nts., 3/1/472 | | EUR | | | 3,300,000 | | | | 3,994,189 | |
| 2.80% Bonds, 3/1/672 | | EUR | | | 13,210,000 | | | | 15,477,220 | |
| 2.95% Bonds, 9/1/382 | | EUR | | | 12,401,000 | | | | 15,772,708 | |
| | | | | | | | | 35,244,117 | |
| | | | | | | | | | | |
Ivory Coast—0.3% | | | | | | | | | | |
| Republic of Cote d’Ivoire: | | | | | | | | | | |
| 5.25% Sr. Unsec. Nts., 3/22/302 | | EUR | | | 2,110,000 | | | | 2,419,384 | |
| 6.875% Sr. Unsec. Nts., 10/17/402 | | EUR | | | 830,000 | | | | 975,062 | |
| | | | | | | | | 3,394,446 | |
| | | | | | | | | | | |
Kenya—0.1% | | | | | | | | | | |
| Republic of Kenya, 6.875% Sr. Unsec. Nts., 6/24/242 | | | | | 1,250,000 | | | | 1,356,138 | |
14 INVESCO OPPENHEIMER V.I. GLOBAL STRATEGIC INCOME FUND
| | | | | | | | | | |
| | | Principal Amount | | | Value | |
Mexico—1.5% | | | | | | | | | | |
| United Mexican States: | | | | | | | | | | |
| Series M, 5.75% Bonds, 3/5/26 | | MXN | | | 24,445,000 | | | $ | 1,226,161 | |
| Series M20, 8.50% Sr. Unsec. Nts., 5/31/29 | | MXN | | | 256,700,000 | | | | 15,121,914 | |
| | | | | | | | | 16,348,075 | |
| | | | | | | | | | | |
New Zealand—0.2% | | | | | | | | | | |
| New Zealand, 1.50% Sr. Unsec. Nts., 5/15/31 | | NZD | | | 3,615,000 | | | | 2,356,467 | |
| | | | | | | | | | | |
Oman—0.4% | | | | | | | | | | |
| Sultanate of Oman: | | | | | | | | | | |
| 3.875% Sr. Unsec. Nts., 3/8/222 | | | | | 2,355,000 | | | | 2,390,824 | |
| 6.75% Sr. Unsec. Nts., 1/17/482 | | | | | 2,000,000 | | | | 2,015,666 | |
| | | | | | | | | 4,406,490 | |
| | | | | | | | | | | |
Panama—0.2% | | | | | | | | | | |
| Republic of Panama, 3.75% Sr. Unsec. Nts., 4/17/262 | | | | | 1,830,000 | | | | 1,930,417 | |
| | | | | | | | | | | |
Paraguay—0.2% | | | | | | | | | | |
| Republic of Paraguay, 4.625% Sr. Unsec. Nts., 1/25/232 | | | | | 2,350,000 | | | | 2,488,450 | |
| | | | | | | | | | | |
Portugal—1.7% | | | | | | | | | | |
| Portuguese Republic, 2.125% Sr. Unsec. Nts., 10/17/282 | | EUR | | | 15,000,000 | | | | 19,374,280 | |
| | | | | | | | | | | |
Russia—1.3% | | | | | | | | | | |
| Russian Federation: | | | | | | | | | | |
| Series 6221, 7.70% Bonds, 3/23/33 | | RUB | | | 400,000,000 | | | | 7,193,958 | |
| Series 6225, 7.25% Bonds, 5/10/34 | | RUB | | | 437,500,000 | | | | 7,602,260 | |
| | | | | | | | | 14,796,218 | |
| | | | | | | | | | | |
Senegal—0.5% | | | | | | | | | | |
| Republic of Senegal: | | | | | | | | | | |
| 6.25% Sr. Unsec. Nts., 7/30/242 | | | | | 1,250,000 | | | | 1,387,296 | |
| 6.75% Sr. Unsec. Nts., 3/13/482 | | | | | 3,890,000 | | | | 3,924,750 | |
| | | | | | | | | 5,312,046 | |
| | | | | | | | | | | |
South Africa—2.3% | | | | | | | | | | |
| Republic of South Africa: | | | | | | | | | | |
| 5.875% Sr. Unsec. Nts., 5/30/22 | | | | | 1,105,000 | | | | 1,184,143 | |
| Series 2030, 8.00% Sr. Unsec. Nts., 1/31/30 | | ZAR | | | 59,100,000 | | | | 3,941,951 | |
| Series 2037, 8.50% Sr. Unsec. Nts., 1/31/37 | | ZAR | | | 57,000,000 | | | | 3,609,607 | |
| Series 2048, 8.75% Sr. Unsec. Nts., 2/28/48 | | ZAR | | | 89,000,000 | | | | 5,612,870 | |
| Series R186, 10.50% Sr. Unsec. Nts., 12/21/26 | | ZAR | | | 133,675,000 | | | | 10,683,913 | |
| Series R214, 6.50% Sr. Unsec. Nts., 2/28/41 | | ZAR | | | 25,000,000 | | | | 1,244,070 | |
| | | | | | | | | 26,276,554 | |
| | | | | | | | | | | |
Sri Lanka—0.7% | | | | | | | | | | |
| Democratic Socialist Republic of Sri Lanka: | |
| 5.875% Sr. Unsec. Nts., 7/25/222 | | | | | 1,350,000 | | | | 1,353,610 | |
| 6.20% Sr. Unsec. Nts., 5/11/272 | | | | | 200,000 | | | | 187,979 | |
| 6.25% Sr. Unsec. Nts., 10/4/202 | | | | | 3,255,000 | | | | 3,307,064 | |
| 6.25% Sr. Unsec. Nts., 7/27/212 | | | | | 1,560,000 | | | | 1,588,080 | |
| 6.35% Sr. Unsec. Nts., 6/28/242 | | | | | 1,210,000 | | | | 1,209,927 | |
| 6.75% Sr. Unsec. Nts., 4/18/282 | | | | | 200,000 | | | | 191,988 | |
| | | | | | | | | 7,838,648 | |
| | | | | | | | | | | |
Supranational—0.1% | | | | | | | | | | |
| European Bank for Reconstruction & Development, 6.85% Sr. Unsec. Nts., 6/21/21 | | IDR | | | 10,600,000,000 | | | | 778,927 | |
| International Finance Corp., 16.721% Sr. Unsec. Nts., 2/15/292,8 | | TRY | | | 3,700,000 | | | | 245,737 | |
| | | | | | | | | 1,024,664 | |
| | | | | | | | | | |
| | | Principal Amount | | | Value | |
Thailand—0.5% | | | | | | | | | | |
| Kingdom of Thailand, 2.125% Sr. Unsec. Nts., 12/17/26 | | THB | | | 165,000,000 | | | $ | 5,790,908 | |
| | | | | | | | | | | |
Turkey—0.6% | | | | | | | | | | |
| Republic of Turkey: | | | | | | | | | | |
| 8.50% Bonds, 9/14/22 | | TRY | | | 15,200,000 | | | | 2,401,748 | |
| 10.70% Bonds, 2/17/21 | | TRY | | | 12,045,000 | | | | 2,021,673 | |
| 12.40% Bonds, 3/8/28 | | TRY | | | 13,500,000 | | | | 2,330,560 | |
| | | | | | | | | 6,753,981 | |
| | | | | | | | | | | |
Ukraine—0.3% | | | | | | | | | | |
| Ukraine, 7.75% Sr. Unsec. Nts., 9/1/262 | | | | | 3,150,000 | | | | 3,451,962 | |
| Total Foreign Government Obligations (Cost $316,073,253) | | | | 303,693,835 | |
| | | | | | | | | | |
Variable Rate Senior Loan Interests—0.6% | |
| Albertson’s LLC, Sr. Sec. Credit Facilities 1st Lien Term Loan, Tranche B7, 4.549% [LIBOR12+275], 11/17/2510,11 | | | | | 65,125 | | | | 65,792 | |
| Altice Financing SA, Sr. Sec. Credit Facilities 1st Lien Term Loan, Tranche B, 4.49% [LIBOR4+275], 7/15/256,10,11 | | | | | 368,750 | | | | 368,658 | |
| American Greetings Corp., Sr. Sec. Credit Facilities 1st Lien Term Loan, Tranche B, 6.299% [LIBOR12+450], 4/6/2410,11 | | | | | 531,966 | | | | 524,486 | |
| Bausch Health Americas, Inc., Sr. Sec. Credit Facilities 1st Lien Term Loan, Tranche B, 2.75% 11/27/256,10,11 | | | | | 496,400 | | | | 499,659 | |
| Caesars Growth Properties Holdings LLC, Sr. Sec. Credit Facilities 1st Lien Term Loan, 4.549% [LIBOR4+275], 12/23/2410,11 | | | | | 726,294 | | | | 728,640 | |
| CenturyLink, Inc., Sr. Sec. Credit Facilities 1st Lien Term Loan, Tranche B, 4.549% [LIBOR4+275], 1/31/256,10,11 | | | | | 515,684 | | | | 518,585 | |
| Charter Communications Operating LLC, Sr. Sec. Credit Facilities 1st Lien Term Loan, Tranche B, 3.55% 4/30/2510,11 | | | | | 511,695 | | | | 515,852 | |
| Claire’s Stores, Inc., Sr. Sec. Credit Facilities Term Loan, 9.188% [LIBOR4+725], 10/12/3810,11,15 | | | | | 37,137 | | | | 66,846 | |
| CSC Holdings LLC, Sr. Sec. Credit Facilities 1st Lien Term Loan, Tranche B5, 4.24% 4/15/2710,11 | | | | | 512,000 | | | | 515,092 | |
| Dun & Bradstreet Corp. (The), Sr. Sec. Credit Facilities 1st Lien Term Loan, Tranche B, 6.792% [LIBOR12+500], 2/6/2610,11 | | | | | 432,000 | | | | 436,320 | |
| iHeartCommunications, Inc., Sr. Sec. Credit Facilities 1st Lien Exit Term Loan, 5.691% [LIBOR12+400], 5/1/2610,11 | | | | | 169,667 | | | | 171,328 | |
| Murray Energy Corp., Sr. Sec. Credit Facilities 1st Lien Term Loan, Tranche B2, 9.354% [LIBOR4+725], 10/17/2210,11,12 | | | | | 540,737 | | | | 118,362 | |
| PetSmart, Inc., Sr. Sec. Credit Facilities 1st Lien Term Loan, Tranche B, 5.74% [LIBOR12+400], 3/11/2210,11 | | | | | 466,126 | | | | 462,071 | |
| Reynolds Group Holdings, Inc., Sr. Sec. Credit Facilities 1st Lien Term Loan, 4.549% [LIBOR12+300], 2/5/236,10,11 | | | | | 510,684 | | | | 512,921 | |
| Scientific Games International, Inc., Sr. Sec. Credit Facilities 1st Lien Term Loan, Tranche B5, 4.549%-4.594% [LIBOR12+275], 8/14/2410,11 | | | | | 704,268 | | | | 707,155 | |
| Windstream Services LLC, Sr. Sec. Credit Facilities Term Loan, Tranche B6, 9.75% [PRIME4+500], 3/29/2110,11,12 | | | | | 169,086 | | | | 162,457 | |
| Total Corporate Loans (Cost $6,658,088) | | | | 6,374,224 | |
15 INVESCO OPPENHEIMER V.I. GLOBAL STRATEGIC INCOME FUND
CONSOLIDATED SCHEDULE OF INVESTMENTSContinued
| | | | | | | | | | |
| | | Principal Amount | | | Value | |
Corporate Bonds and Notes—33.6% | |
Consumer Discretionary—5.9% | |
Auto Components—0.2% | |
| Adient Global Holdings Ltd., 4.875% Sr. Unsec. Nts., 8/15/262 | | $ | | | 295,000 | | | $ | 264,032 | |
| Dana Financing Luxembourg Sarl, 6.50% Sr. Unsec. Nts., 6/1/262 | | | | | 271,000 | | | | 290,417 | |
| Dana, Inc., 5.375% Sr. Unsec. Nts., 11/15/27 | | | | | 220,000 | | | | 227,150 | |
| Panther BF Aggregator 2 LP/Panther Finance Co., Inc.: | | | | | | | | | | |
| 6.25% Sr. Sec. Nts., 5/15/262 | | | | | 138,000 | | | | 148,954 | |
| 8.50% Sr. Unsec. Nts., 5/15/272 | | | | | 278,000 | | | | 295,889 | |
| Tenneco, Inc., 5.375% Sr. Unsec. Nts., 12/15/24 | | | | | 628,000 | | | | 595,291 | |
| | | | | | | | | 1,821,733 | |
| | | | | | | | | | | |
Automobiles—0.6% | | | | | | | | | | |
| Ford Motor Credit Co. LLC: | | | | | | | | | | |
| 4.134% Sr. Unsec. Nts., 8/4/25 | | | | | 2,500,000 | | | | 2,534,624 | |
| 5.584% Sr. Unsec. Nts., 3/18/24 | | | | | 1,135,000 | | | | 1,228,488 | |
| General Motors Financial Co., Inc.: | | | | | | | | | | |
| 4.20% Sr. Unsec. Nts., 11/6/21 | | | | | 1,135,000 | | | | 1,176,844 | |
| 5.10% Sr. Unsec. Nts., 1/17/24 | | | | | 1,135,000 | | | | 1,232,302 | |
| JB Poindexter & Co., Inc., 7.125% Sr. Unsec. Nts., 4/15/262 | | | | | 917,000 | | | | 970,046 | |
| | | | | | | | | 7,142,304 | |
| | | | | | | | | | | |
Distributors—0.1% | | | | | | | | | | |
| Core & Main Holdings LP, 9.375% PIK Rate, 8.625% Cash Rate, 8.625% Sr. Unsec. Nts., 9/15/242,13 | | | | | 1,231,000 | | | | 1,283,828 | |
| | | | | | | | | | | |
Diversified Consumer Services—0.1% | |
| GEMS MENASA Cayman Ltd./GEMS Education Delaware LLC, 7.125% Sr. Sec. Nts., 7/31/262 | | | | | 815,000 | | | | 859,283 | |
| | | | | | | | | | | |
Entertainment—0.3% | | | | | | | | | | |
| AMC Entertainment Holdings, Inc.: | | | | | | | | | | |
| 5.75% Sr. Sub. Nts., 6/15/25 | | | | | 227,000 | | | | 210,448 | |
| 5.875% Sr. Sub. Nts., 11/15/26 | | | | | 690,000 | | | | 623,465 | |
| Netflix, Inc.: | | | | | | | | | | |
| 5.375% Sr. Unsec. Nts., 11/15/292 | | | | | 302,000 | | | | 322,183 | |
| 5.75% Sr. Unsec. Nts., 3/1/24 | | | | | 494,000 | | | | 547,928 | |
| 5.875% Sr. Unsec. Nts., 11/15/28 | | | | | 1,707,000 | | | | 1,895,470 | |
| | | | | | | | | 3,599,494 | |
| | | | | | | | | | | |
Hotels, Restaurants & Leisure—1.8% | |
| 1011778 B.C. ULC/New Red Finance, Inc.: | |
| 4.25% Sr. Sec. Nts., 5/15/242 | | | | | 287,000 | | | | 294,773 | |
| 5.00% Sec. Nts., 10/15/252 | | | | | 855,000 | | | | 884,570 | |
| Aramark Services, Inc.: | | | | | | | | | | |
| 4.75% Sr. Unsec. Nts., 6/1/26 | | | | | 183,000 | | | | 190,745 | |
| 5.00% Sr. Unsec. Nts., 2/1/282 | | | | | 225,000 | | | | 237,510 | |
| Boyd Gaming Corp.: | | | | | | | | | | |
| 6.00% Sr. Unsec. Nts., 8/15/26 | | | | | 570,000 | | | | 613,661 | |
| 6.375% Sr. Unsec. Nts., 4/1/26 | | | | | 94,000 | | | | 101,312 | |
| CEC Entertainment, Inc., 8.00% Sr. Unsec. Nts., 2/15/22 | | | | | 238,000 | | | | 235,099 | |
| Downstream Development Authority of the Quapaw Tribe of Oklahoma, 10.50% Sr. Sec. Nts., 2/15/232 | | | | | 133,000 | | | | 140,038 | |
| International Game Technology plc, 6.25% Sr. Sec. Nts., 2/15/222 | | | | | 2,225,000 | | | | 2,351,336 | |
| KFC Holding Co./Pizza Hut Holdings LLC/ Taco Bell of America LLC: | | | | | | | | | | |
| 4.75% Sr. Unsec. Nts., 6/1/272 | | | | | 144,000 | | | | 151,894 | |
| 5.25% Sr. Unsec. Nts., 6/1/262 | | | | | 350,000 | | | | 370,134 | |
| Marriott Ownership Resorts, Inc., 4.75% Sr. Unsec. Nts., 1/15/282 | | | | | 1,074,000 | | | | 1,102,566 | |
| | | | | | | | | | |
| | | Principal Amount | | | Value | |
Hotels, Restaurants & Leisure (Continued) | | | | | |
| Melco Resorts Finance Ltd.: | | | | | | | | | | |
| 4.875% Sr. Unsec. Nts., 6/6/252 | | $ | | | 3,250,000 | | | $ | 3,344,229 | |
| 5.625% Sr. Unsec. Nts., 7/17/272 | | | | | 290,000 | | | | 302,563 | |
| MGM China Holdings Ltd., 5.375% Sr. Unsec. Nts., 5/15/242 | | | | | 1,505,000 | | | | 1,568,338 | |
| MGM Resorts International: | | | | | | | | | | |
| 4.625% Sr. Unsec. Nts., 9/1/26 | | | | | 449,000 | | | | 476,983 | |
| 5.75% Sr. Unsec. Nts., 6/15/25 | | | | | 186,000 | | | | 208,783 | |
| 6.00% Sr. Unsec. Nts., 3/15/23 | | | | | 1,141,000 | | | | 1,254,626 | |
| Party City Holdings, Inc., 6.625% Sr. Unsec. Nts., 8/1/262 | | | | | 218,000 | | | | 154,196 | |
| Penn National Gaming, Inc., 5.625% Sr. Unsec. Nts., 1/15/272 | | | | | 279,000 | | | | 295,643 | |
| Sazka Group AS, 4.125% Sr. Unsec. Nts., 11/20/242 | | EUR | | | 1,000,000 | | | | 1,179,748 | |
| Scientific Games International, Inc., 7.00% Sr. Unsec. Nts., 5/15/282 | | | | | 280,000 | | | | 300,118 | |
| Wynn Las Vegas LLC/Wynn Las Vegas Capital Corp.: | | | | | | | | | | |
| 5.25% Sr. Unsec. Nts., 5/15/272 | | | | | 322,000 | | | | 342,528 | |
| 5.50% Sr. Unsec. Nts., 3/1/252 | | | | | 467,000 | | | | 501,437 | |
| Wynn Macau Ltd., 4.875% Sr. Unsec. Nts., 10/1/242 | | | | | 3,025,000 | | | | 3,099,370 | |
| Wynn Resorts Finance LLC / Wynn Resorts Capital Corp., 5.125% Sr. Unsec. Nts., 10/1/292 | | | | | 357,000 | | | | 383,998 | |
| | | | | | | | | 20,086,198 | |
| | | | | | | | | | | |
Household Durables—0.7% | | | | | | | | | | |
| Beazer Homes USA, Inc., 6.75% Sr. Unsec. Nts., 3/15/25 | | | | | 526,000 | | | | 553,833 | |
| Eagle Intermediate Global Holding BV/ Ruyi US Finance LLC, 7.50% Sr. Sec. Nts., 5/1/252 | | | | | 285,000 | | | | 228,831 | |
| Lennar Corp.: | | | | | | | | | | |
| 4.50% Sr. Unsec. Nts., 4/30/24 | | | | | 134,000 | | | | 141,817 | |
| 4.75% Sr. Unsec. Nts., 4/1/21 | | | | | 2,250,000 | | | | 2,304,720 | |
| 4.75% Sr. Unsec. Nts., 5/30/25 | | | | | 367,000 | | | | 395,290 | |
| 5.00% Sr. Unsec. Nts., 6/15/27 | | | | | 573,000 | | | | 623,337 | |
| 5.25% Sr. Unsec. Nts., 6/1/26 | | | | | 244,000 | | | | 267,875 | |
| Mattamy Group Corp., 5.25% Sr. Unsec. Nts., 12/15/272 | | | | | 314,000 | | | | 327,345 | |
| Meritage Homes Corp., 5.125% Sr. Unsec. Nts., 6/6/27 | | | | | 508,000 | | | | 542,467 | |
| Spectrum Brands, Inc., 5.00% Sr. Unsec. Nts., 10/1/292 | | | | | 444,000 | | | | 459,694 | |
| Taylor Morrison Communities, Inc., 5.75% Sr. Unsec. Nts., 1/15/282 | | | | | 410,000 | | | | 448,067 | |
| Taylor Morrison Communities, Inc./Taylor Morrison Holdings II, Inc., 5.875% Sr. Unsec. Nts., 4/15/232 | | | | | 1,126,000 | | | | 1,216,547 | |
| William Lyon Homes, Inc., 5.875% Sr. Unsec. Nts., 1/31/25 | | | | | 298,000 | | | | 307,436 | |
| | | | | | | | | 7,817,259 | |
| | | | | | | | | | | |
Leisure Equipment & Products—0.0% | |
| Mattel, Inc., 6.75% Sr. Unsec. Nts., 12/31/252 | | | | | 423,000 | | | | 455,522 | |
| | | | | | | | | | | |
Media—1.4% | | | | | | | | | | |
| Affinion Group, Inc., 14% PIK Rate, 12.5% Cash Rate, 12.50% Sr. Unsec. Nts., 11/10/222,13 | | | | | 1,158,507 | | | | 695,104 | |
| Altice Financing SA, 7.50% Sr. Sec. Nts., 5/15/262 | | | | | 374,000 | | | | 402,742 | |
| AMC Networks, Inc.: | | | | | | | | | | |
| 4.75% Sr. Unsec. Nts., 8/1/25 | | | | | 221,000 | | | | 222,290 | |
| 5.00% Sr. Unsec. Nts., 4/1/24 | | | | | 872,000 | | | | 891,620 | |
| Belo Corp., 7.75% Sr. Unsec. Nts., 6/1/27 | | | | | 311,000 | | | | 360,207 | |
16 INVESCO OPPENHEIMER V.I. GLOBAL STRATEGIC INCOME FUND
| | | | | | | | | | |
| | | | | Principal Amount | | | Value | |
Media (Continued) | |
| Cable Onda SA, 4.50% Sr. Unsec. Nts., 1/30/302 | | | | $ | 235,000 | | | $ | 247,890 | |
| Cablevision Systems Corp., 5.875% Sr. Unsec. Nts., 9/15/22 | | | | | 151,000 | | | | 162,971 | |
| CCO Holdings LLC/CCO Holdings Capital Corp.: | | | | | | | | | | |
| 4.00% Sr. Unsec. Nts., 3/1/232 | | | | | 138,000 | | | | 140,241 | |
| 5.00% Sr. Unsec. Nts., 2/1/282 | | | | | 251,000 | | | | 263,844 | |
| 5.125% Sr. Unsec. Nts., 5/1/232 | | | | | 204,000 | | | | 208,634 | |
| 5.125% Sr. Unsec. Nts., 5/1/272 | | | | | 381,000 | | | | 402,660 | |
| 5.375% Sr. Unsec. Nts., 5/1/252 | | | | | 90,000 | | | | 93,113 | |
| 5.75% Sr. Unsec. Nts., 2/15/262 | | | | | 583,000 | | | | 616,155 | |
| 5.875% Sr. Unsec. Nts., 4/1/242 | | | | | 132,000 | | | | 136,730 | |
| 5.875% Sr. Unsec. Nts., 5/1/272 | | | | | 90,000 | | | | 95,384 | |
| Clear Channel Communications, Inc., 9.00% Sr. Nts., 12/15/2012,14,15 | | | | | 1,455,000 | | | | — | |
| CSC Holdings LLC: | | | | | | | | | | |
| 5.25% Sr. Unsec. Nts., 6/1/24 | | | | | 261,000 | | | | 281,772 | |
| 5.375% Sr. Unsec. Nts., 7/15/232 | | | | | 157,000 | | | | 161,252 | |
| 5.50% Sr. Unsec. Nts., 4/15/272 | | | | | 504,000 | | | | 542,153 | |
| 6.50% Sr. Unsec. Nts., 2/1/292 | | | | | 480,000 | | | | 536,100 | |
| 6.625% Sr. Unsec. Nts., 10/15/252 | | | | | 403,000 | | | | 428,687 | |
| 10.875% Sr. Unsec. Nts., 10/15/252 | | | | | 319,000 | | | | 357,081 | |
| Cumulus Media New Holdings, Inc., 6.75% Sr. Sec. Nts., 7/1/262 | | | | | 455,000 | | | | 488,271 | |
| Diamond Sports Group LLC/Diamond Sports Finance Co.: | | | | | | | | | | |
| 5.375% Sr. Sec. Nts., 8/15/262 | | | | | 1,153,000 | | | | 1,168,480 | |
| 6.625% Sr. Unsec. Nts., 8/15/272 | | | | | 583,000 | | | | 568,046 | |
| DISH DBS Corp., 5.875% Sr. Unsec. Nts., 11/15/24 | | | | | 426,000 | | | | 436,207 | |
| Gray Television, Inc.: | | | | | | | | | | |
| 5.125% Sr. Unsec. Nts., 10/15/242 | | | | | 215,000 | | | | 223,511 | |
| 5.875% Sr. Unsec. Nts., 7/15/262 | | | | | 205,000 | | | | 218,448 | |
| iHeartCommunications, Inc., 8.375% Sr. Unsec. Nts., 5/1/27 | | | | | 493,000 | | | | 545,677 | |
| Lamar Media Corp., 5.75% Sr. Unsec. Nts., 2/1/26 | | | | | 267,000 | | | | 283,487 | |
| Meredith Corp., 6.875% Sr. Unsec. Nts., 2/1/26 | | | | | 578,000 | | | | 602,592 | |
| Sinclair Television Group, Inc., 5.625% Sr. Unsec. Nts., 8/1/242 | | | | | 342,000 | | | | 352,546 | |
| Sirius XM Radio, Inc., 5.50% Sr. Unsec. Nts., 7/1/292 | | | | | 541,000 | | | | 585,952 | |
| TEGNA, Inc., 5.50% Sr. Unsec. Nts., 9/15/242 | | | | | 209,000 | | | | 216,576 | |
| Telenet Finance Luxembourg Notes Sarl, 5.50% Sr. Sec. Nts., 3/1/282 | | | | | 605,000 | | | | 651,283 | |
| Virgin Media Secured Finance plc: | | | | | | | | | | |
| 5.50% Sr. Sec. Nts., 8/15/262 | | | | | 619,000 | | | | 651,388 | |
| 5.50% Sr. Sec. Nts., 5/15/292 | | | | | 130,000 | | | | 137,878 | |
| VTR Finance BV, 6.875% Sr. Sec. Nts., 1/15/242 | | | | | 734,000 | | | | 752,045 | |
| Ziggo BV, 5.50% Sr. Sec. Nts., 1/15/272 | | | | | 424,000 | | | | 451,284 | |
| | | | | | | | | 15,580,301 | |
| | | | | | | | | | | |
Multiline Retail—0.0% | | | | | | | | | | |
| Michaels Stores, Inc., 8.00% Sr. Unsec. Nts., 7/15/272 | | | | | 618,000 | | | | 591,333 | |
| | | | | | | | | | | |
Specialty Retail—0.4% | | | | | | | | | | |
| eG Global Finance plc: | | | | | | | | | | |
| 6.25% Sr. Sec. Nts., 10/30/252 | | EUR | | | 250,000 | | | | 297,341 | |
| 8.50% Sr. Sec. Nts., 10/30/252 | | | | | 296,000 | | | | 314,747 | |
| L Brands, Inc.: | | | | | | | | | | |
| 5.25% Sr. Unsec. Nts., 2/1/28 | | | | | 115,000 | | | | 109,175 | |
| 6.875% Sr. Unsec. Nts., 11/1/35 | | | | | 1,152,000 | | | | 1,033,085 | |
| 7.50% Sr. Unsec. Nts., 6/15/29 | | | | | 491,000 | | | | 506,638 | |
| Lithia Motors, Inc.: | | | | | | | | | | |
| 4.625% Sr. Unsec. Nts., 12/15/272 | | | | | 189,000 | | | | 194,738 | |
| | | | | | | | | | |
| | | | | Principal Amount | | | Value | |
Specialty Retail (Continued) | |
| Lithia Motors, Inc.: (Continued) | | | | | | | | | | |
| 5.25% Sr. Unsec. Nts., 8/1/252 | | | | $ | 680,000 | | | $ | 713,432 | |
| Penske Automotive Group, Inc., 5.50% Sr. Sub. Nts., 5/15/26 | | | | | 762,000 | | | | 799,605 | |
| PetSmart, Inc., 5.875% Sr. Sec. Nts., 6/1/252 | | | | | 251,000 | | | | 256,334 | |
| Suburban Propane Partners LP/Suburban Energy Finance Corp., 5.875% Sr. Unsec. Nts., 3/1/27 | | | | | 366,000 | | | | 381,682 | |
| | | | | | | | | 4,606,777 | |
| | | | | | | | | | | |
Textiles, Apparel & Luxury Goods—0.3% | |
| Hanesbrands, Inc.: | | | | | | | | | | |
| 4.625% Sr. Unsec. Nts., 5/15/242 | | | | | 1,424,000 | | | | 1,504,691 | |
| 4.875% Sr. Unsec. Nts., 5/15/262 | | | | | 835,000 | | | | 885,601 | |
| William Carter Co. (The), 5.625% Sr. Unsec. Nts., 3/15/272 | | | | | 738,000 | | | | 795,064 | |
| | | | | | | | | 3,185,356 | |
| | | | | | | | | | | |
Consumer Staples—0.9% | |
Beverages—0.2% | |
| Coca-Cola Icecek AS, 4.215% Sr. Unsec. Nts., 9/19/242 | | | | | 2,315,000 | | | | 2,359,680 | |
| Simmons Foods, Inc., 5.75% Sec. Nts., 11/1/242 | | | | | 322,000 | | | | 324,281 | |
| | | | | | | | | 2,683,961 | |
| | | | | | | | | | | |
Food & Staples Retailing—0.2% | |
| Albertsons Cos LLC/Safeway, Inc./New Albertsons LP/Albertson’s LLC, 5.875% Sr. Unsec. Nts., 2/15/282 | | | | | 309,000 | | | | 328,884 | |
| Albertsons Cos. LLC/Safeway, Inc./New Albertsons LP/Albertson’s LLC: | | | | | | | | | | |
| 5.75% Sr. Unsec. Nts., 3/15/25 | | | | | 143,000 | | | | 148,422 | |
| 7.50% Sr. Unsec. Nts., 3/15/262 | | | | | 235,000 | | | | 264,228 | |
| Ingles Markets, Inc., 5.75% Sr. Unsec. Nts., 6/15/23 | | | | | 218,000 | | | | 222,630 | |
| Quatrim SASU, 5.875% Sr. Sec. Nts., 1/15/242 | | EUR | | | 100,000 | | | | 118,455 | |
| US Foods, Inc., 5.875% Sr. Unsec. Nts., 6/15/242 | | | | | 600,000 | | | | 619,251 | |
| | | | | | | | | 1,701,870 | |
| | | | | | | | | | | |
Food Products—0.2% | |
| Darling Ingredients, Inc., 5.25% Sr. Unsec. Nts., 4/15/272 | | | | | 119,000 | | | | 126,863 | |
| JBS USA LUX SA/JBS USA Food Co./JBS USA Finance, Inc., 5.50% Sr. Unsec. Nts., 1/15/302 | | | | | 504,000 | | | | 542,279 | |
| Lamb Weston Holdings, Inc., 4.625% Sr. Unsec. Nts., 11/1/242 | | | | | 235,000 | | | | 249,884 | |
| Pilgrim’s Pride Corp.: | | | | | | | | | | |
| 5.75% Sr. Unsec. Nts., 3/15/252 | | | | | 238,000 | | | | 246,500 | |
| 5.875% Sr. Unsec. Nts., 9/30/272 | | | | | 586,000 | | | | 634,696 | |
| Simmons Foods, Inc., 7.75% Sr. Sec. Nts., 1/15/242 | | | | | 114,000 | | | | 123,167 | |
| TreeHouse Foods, Inc., 6.00% Sr. Unsec. Nts., 2/15/242 | | | | | 687,000 | | | | 713,336 | |
| | | | | | | | | 2,636,725 | |
| | | | | | | | | | | |
Household Products—0.3% | |
| Controladora Mabe SA de CV, 5.60% Sr. Unsec. Nts., 10/23/282 | | | | | 2,285,000 | | | | 2,520,007 | |
| Spectrum Brands, Inc., 6.125% Sr. Unsec. Nts., 12/15/24 | | | | | 231,000 | | | | 239,181 | |
| | | | | | | | | 2,759,188 | |
| | | | | | | | | | | |
Personal Products—0.0% | |
| First Quality Finance Co., Inc., 5.00% Sr. Unsec. Nts., 7/1/252 | | | | | 224,000 | | | | 233,707 | |
17 INVESCO OPPENHEIMER V.I. GLOBAL STRATEGIC INCOME FUND
CONSOLIDATED SCHEDULE OF INVESTMENTSContinued
| | | | | | | | | | |
| | | | | Principal Amount | | | Value | |
Energy—4.1% | |
Energy Equipment & Services—0.2% | |
| ADES International Holding plc, 8.625% Sr. Sec. Nts., 4/24/242 | | | | $ | 500,000 | | | $ | 521,250 | |
| Antero Midstream Partners LP/Antero Midstream Finance Corp., 5.75% Sr. Unsec. Nts., 1/15/282 | | | | | 635,000 | | | | 554,053 | |
| Basic Energy Services, Inc., 10.75% Sr. Sec. Nts., 10/15/232 | | | | | 208,000 | | | | 149,760 | |
| Ensign Drilling, Inc., 9.25% Sr. Unsec. Nts., 4/15/242 | | | | | 138,000 | | | | 130,581 | |
| McDermott Technology Americas, Inc./McDermott Technology US, Inc., 10.625% Sr. Unsec. Nts., 5/1/242 | | | | | 1,470,000 | | | | 129,081 | |
| Precision Drilling Corp., 7.125% Sr. Unsec. Nts., 1/15/262 | | | | | 160,000 | | | | 152,456 | |
| | | | | | | | | 1,637,181 | |
| | | | | | | | | | | |
Oil, Gas & Consumable Fuels—3.9% | |
| Antero Resources Corp.: | | | | | | | | | | |
| 5.125% Sr. Unsec. Nts., 12/1/22 | | | | | 97,000 | | | | 86,745 | |
| 5.375% Sr. Unsec. Nts., 11/1/21 | | | | | 235,000 | | | | 224,192 | |
| Ascent Resources Utica Holdings LLC/ ARU Finance Corp., 10.00% Sr. Unsec. Nts., 4/1/222 | | | | | 583,000 | | | | 581,323 | |
| Callon Petroleum Co., 6.375% Sr. Unsec. Nts., 7/1/26 | | | | | 629,000 | | | | 639,978 | |
| Calumet Specialty Products Partners LP/Calumet Finance Corp., 7.625% Sr. Unsec. Nts., 1/15/22 | | | | | 606,000 | | | | 607,704 | |
| Carrizo Oil & Gas, Inc.: | | | | | | | | | | |
| 6.25% Sr. Unsec. Nts., 4/15/23 | | | | | 53,000 | | | | 53,919 | |
| 8.25% Sr. Unsec. Nts., 7/15/25 | | | | | 106,000 | | | | 108,694 | |
| CITGO Petroleum Corp., 6.25% Sr. Sec. Nts., 8/15/222 | | | | | 70,000 | | | | 71,137 | |
| Comstock Resources, Inc., 9.75% Sr. Unsec. Nts., 8/15/26 | | | | | 214,000 | | | | 194,713 | |
| Cosan Ltd., 5.50% Sr. Unsec. Nts., 9/20/292 | | | | | 1,760,000 | | | | 1,836,120 | |
| Crestwood Midstream Partners LP/ Crestwood Midstream Finance Corp.: | | | | | | | | | | |
| 5.625% Sr. Unsec. Nts., 5/1/272 | | | | | 463,000 | | | | 470,535 | |
| 5.75% Sr. Unsec. Nts., 4/1/25 | | | | | 61,000 | | | | 62,524 | |
| 6.25% Sr. Unsec. Nts., 4/1/23 | | | | | 70,000 | | | | 71,546 | |
| DCP Midstream Operating LP: | | | | | | | | | | |
| 4.75% Sr. Unsec. Nts., 9/30/212 | | | | | 235,000 | | | | 241,991 | |
| 5.125% Sr. Unsec. Nts., 5/15/29 | | | | | 662,000 | | | | 688,050 | |
| Energy Transfer Operating LP: | | | | | | | | | | |
| 6.25% [US0003M+402.8] Jr. Sub. Perpetual Bonds3,16 | | | | | 263,000 | | | | 247,620 | |
| 7.50% Sr. Unsec. Nts., 10/15/20 | | | | | 240,000 | | | | 249,451 | |
| EnLink Midstream Partners LP: | | | | | | | | | | |
| 4.40% Sr. Unsec. Nts., 4/1/24 | | | | | 53,000 | | | | 51,547 | |
| 4.85% Sr. Unsec. Nts., 7/15/26 | | | | | 620,000 | | | | 582,690 | |
| 5.60% Sr. Unsec. Nts., 4/1/44 | | | | | 589,000 | | | | 479,113 | |
| Eterna Capital Pte Ltd., 7.5% PIK Rate, 7.50% Sr. Sec. Nts., 12/11/222,13 | | | | | 1,319,387 | | | | 1,039,017 | |
| Eterna Capital Pte Ltd., 8% PIK Rate, 8.00% Sr. Sec. Nts., 12/11/2213 | | | | | 1,594,142 | | | | 917,258 | |
| Genesis Energy LP/Genesis Energy Finance Corp.: | | | | | | | | | | |
| 6.25% Sr. Unsec. Nts., 5/15/26 | | | | | 413,000 | | | | 395,591 | |
| 6.50% Sr. Unsec. Nts., 10/1/25 | | | | | 226,000 | | | | 219,218 | |
| 6.75% Sr. Unsec. Nts., 8/1/22 | | | | | 95,000 | | | | 96,119 | |
| Golden Nugget, Inc., 8.75% Sr. Sub. Nts., 10/1/252 | | | | | 451,000 | | | | 483,411 | |
| Gulfport Energy Corp.: | | | | | | | | | | |
| 6.00% Sr. Unsec. Nts., 10/15/24 | | | | | 347,000 | | | | 247,237 | |
| 6.375% Sr. Unsec. Nts., 5/15/25 | | | | | 118,000 | | | | 75,274 | |
| 6.625% Sr. Unsec. Nts., 5/1/23 | | | | | 735,000 | | | | 621,303 | |
| | | | | | | | | | |
| | | | | Principal Amount | | | Value | |
Oil, Gas & Consumable Fuels (Continued) | |
| Hess Midstream Operations LP, 5.625% Sr. Unsec. Nts., 2/15/262 | | | | $ | 700,000 | | | $ | 730,245 | |
| HighPoint Operating Corp., 8.75% Sr. Unsec. Nts., 6/15/25 | | | | | 81,000 | | | | 74,115 | |
| Hilcorp Energy I LP/Hilcorp Finance Co., 6.25% Sr. Unsec. Nts., 11/1/282 | | | | | 280,000 | | | | 266,797 | |
| Holly Energy Partners LP/Holly Energy Finance Corp., 6.00% Sr. Unsec. Nts., 8/1/242 | | | | | 219,000 | | | | 228,853 | |
| KazTransGas JSC, 4.375% Sr. Unsec. Nts., 9/26/272 | | | | | 1,590,000 | | | | 1,671,055 | |
| Kinder Morgan Energy Partners LP, 3.45% Sr. Unsec. Nts., 2/15/23 | | | | | 1,055,000 | | | | 1,088,210 | |
| Murphy Oil USA, Inc., 5.625% Sr. Unsec. Nts., 5/1/27 | | | | | 577,000 | | | | 620,476 | |
| Murray Energy Corp., 3% PIK Rate, 9% Cash Rate, 12.00% Sec. Nts., 4/15/242,12,13 | | | | | 2,352,945 | | | | 2,965 | |
| NAK Naftogaz Ukraine via Kondor Finance PLC, 7.625% Sr. Unsec. Nts., 11/8/262 | | | | | 600,000 | | | | 614,998 | |
| NGL Energy Partners LP/NGL Energy Finance Corp.: | | | | | | | | | | |
| 6.125% Sr. Unsec. Nts., 3/1/25 | | | | | 369,000 | | | | 348,858 | |
| 7.50% Sr. Unsec. Nts., 11/1/23 | | | | | 124,000 | | | | 124,771 | |
| NuStar Logistics LP: | | | | | | | | | | |
| 4.80% Sr. Unsec. Nts., 9/1/20 | | | | | 235,000 | | | | 238,616 | |
| 6.00% Sr. Unsec. Nts., 6/1/26 | | | | | 818,000 | | | | 866,568 | |
| Oasis Petroleum, Inc., 6.875% Sr. Unsec. Nts., 1/15/23 | | | | | 487,000 | | | | 477,260 | |
| Occidental Petroleum Corp., 2.70% Sr. Unsec. Nts., 8/15/22 | | | | | 900,000 | | | | 909,483 | |
| Oil India International Pte Ltd., 4.00% Sr. Unsec. Nts., 4/21/272 | | | | | 2,119,000 | | | | 2,178,607 | |
| Parkland Fuel Corp., 6.00% Sr. Unsec. Nts., 4/1/262 | | | | | 853,000 | | | | 902,602 | |
| PBF Holding Co. LLC/PBF Finance Corp.: | | | | | | | | | | |
| 7.00% Sr. Unsec. Nts., 11/15/23 | | | | | 137,000 | | | | 142,537 | |
| 7.25% Sr. Unsec. Nts., 6/15/25 | | | | | 167,000 | | | | 178,621 | |
| Pertamina Persero PT, 4.70% Sr. Unsec. Nts., 7/30/492 | | | | | 1,040,000 | | | | 1,111,460 | |
| Petrobras Global Finance BV: | | | | | | | | | | |
| 6.85% Sr. Unsec. Nts., 6/5/15 | | | | | 225,000 | | | | 257,894 | |
| 6.90% Sr. Unsec. Nts., 3/19/49 | | | | | 1,080,000 | | | | 1,268,757 | |
| Petroleos Mexicanos: | | | | | | | | | | |
| 3.75% Sr. Unsec. Nts., 4/16/262 | | EUR | | | 1,400,000 | | | | 1,621,810 | |
| 4.50% Sr. Unsec. Nts., 1/23/26 | | | | | 2,300,000 | | | | 2,296,889 | |
| 5.35% Sr. Unsec. Nts., 2/12/28 | | | | | 1,360,000 | | | | 1,357,073 | |
| 7.69% Sr. Unsec. Nts., 1/23/502 | | | | | 828,000 | | | | 906,474 | |
| Puma International Financing SA: | | | | | | | | | | |
| 5.00% Sr. Unsec. Nts., 1/24/262 | | | | | 825,000 | | | | 776,311 | |
| 5.125% Sr. Unsec. Nts., 10/6/242 | | | | | 750,000 | | | | 733,255 | |
| QEP Resources, Inc.: | | | | | | | | | | |
| 5.625% Sr. Unsec. Nts., 3/1/26 | | | | | 814,000 | | | | 795,909 | |
| 6.875% Sr. Unsec. Nts., 3/1/21 | | | | | 235,000 | | | | 243,906 | |
| Reliance Industries Ltd., 7.00% Unsec. Nts., 8/31/22 | | INR | | | 210,000,000 | | | | 2,980,518 | |
| Southwestern Energy Co.: | | | | | | | | | | |
| 6.20% Sr. Unsec. Nts., 1/23/25 | | | | | 67,000 | | | | 61,619 | |
| 7.50% Sr. Unsec. Nts., 4/1/26 | | | | | 462,000 | | | | 428,517 | |
| Sunoco LP/Sunoco Finance Corp.: | | | | | | | | | | |
| 4.875% Sr. Unsec. Nts., 1/15/23 | | | | | 135,000 | | | | 138,434 | |
| 5.50% Sr. Unsec. Nts., 2/15/26 | | | | | 66,000 | | | | 68,663 | |
| 5.875% Sr. Unsec. Nts., 3/15/28 | | | | | 733,000 | | | | 780,390 | |
| 6.00% Sr. Unsec. Nts., 4/15/27 | | | | | 105,000 | | | | 112,331 | |
| Targa Resources Partners LP/Targa | | | | | | | | | | |
| Resources Partners Finance Corp.: | | | | | | | | | | |
| 5.00% Sr. Unsec. Nts., 1/15/28 | | | | | 371,000 | | | | 379,282 | |
| 5.125% Sr. Unsec. Nts., 2/1/25 | | | | | 589,000 | | | | 612,554 | |
18 INVESCO OPPENHEIMER V.I. GLOBAL STRATEGIC INCOME FUND
| | | | | | | | | | |
| | | | | Principal Amount | | | Value | |
Oil, Gas & Consumable Fuels (Continued) | |
| Targa Resources Partners LP/Targa Resources Partners Finance Corp.: (Continued) | | | | | | | | | | |
| 5.25% Sr. Unsec. Nts., 5/1/23 | | | | $ | 698,000 | | | $ | 706,435 | |
| 5.50% Sr. Unsec. Nts., 3/1/302 | | | | | 113,000 | | | | 116,249 | |
| 5.875% Sr. Unsec. Nts., 4/15/26 | | | | | 1,176,000 | | | | 1,251,704 | |
| 6.50% Sr. Unsec. Nts., 7/15/272 | | | | | 105,000 | | | | 115,169 | |
| Transcanada Trust, 5.875% [US0003M+464] Jr. Sub. Nts., 8/15/763 | | | | | 1,130,000 | | | | 1,217,937 | |
| Whiting Petroleum Corp.: | | | | | | | | | | |
| 5.75% Sr. Unsec. Nts., 3/15/21 | | | | | 97,000 | | | | 91,980 | |
| 6.625% Sr. Unsec. Nts., 1/15/26 | | | | | 831,000 | | | | 568,408 | |
| WPX Energy, Inc., 8.25% Sr. Unsec. Nts., 8/1/23 | | | | | 75,000 | | | | 86,469 | |
| | | | | | | | | 44,396,054 | |
| | | | | | | | | | | |
Financials—10.2% | |
Capital Markets—1.2% | |
| Credit Suisse Group AG, 7.50% [USSW5+459.8] Jr. Sub. Perpetual Bonds2,3,16 | | | | | 3,370,000 | | | | 3,797,394 | |
| Icahn Enterprises LP/Icahn Enterprises Finance Corp., 6.25% Sr. Unsec. Nts., 5/15/26 | | | | | 142,000 | | | | 151,496 | |
| MSCI, Inc., 5.75% Sr. Unsec. Nts., 8/15/252 | | | | | 594,000 | | | | 624,437 | |
| Prime Security Services Borrower LLC/ Prime Finance, Inc., 9.25% Sec. Nts., 5/15/232 | | | | | 632,000 | | | | 663,995 | |
| Standard Life Aberdeen plc, 4.25% Sub. Nts., 6/30/282 | | | | | 1,875,000 | | | | 1,944,114 | |
| UBS Group AG: | | | | | | | | | | |
| 6.875% [USISDA05+549.65] Jr. Sub. Perpetual Bonds2,3,16 | | | | | 3,880,000 | | | | 4,045,870 | |
| 7.00% [USSW5+486.6] Jr. Sub. Perpetual Bonds2,3,16 | | | | | 1,150,000 | | | | 1,318,187 | |
| 7.125% [USSW5+588.3] Jr. Sub. Perpetual Bonds2,3,16 | | | | | 1,214,000 | | | | 1,289,116 | |
| | | | | | | | | 13,834,609 | |
| | | | | | | | | | | |
Commercial Banks—4.6% | |
| Banca Monte dei Paschi di Siena SpA, 5.375% [EUSA5+500.5] Sub. Nts., 1/18/282,3 | | EUR | | | 1,250,000 | | | | 1,108,465 | |
| Banco Bilbao Vizcaya Argentaria SA: | | | | | | | | | | |
| 6.00% [EUSA5+603.9] Jr. Sub. Perpetual Bonds2,3,16 | | EUR | | | 695,000 | | | | 870,630 | |
| 8.875% [EUSA5+917.7] Jr. Sub. Perpetual Bonds2,3,16 | | EUR | | | 1,295,000 | | | | 1,595,429 | |
| Banco BTG Pactual SA (Cayman), 4.50% Sr. Unsec. Nts., 1/10/252 | | | | | 823,000 | | | | 835,345 | |
| Banco Comercial Portugues SA: | | | | | | | | | | |
| 3.871% [EUSA5+423.1] Sub. Nts., 3/27/302,3 | | EUR | | | 600,000 | | | | 682,305 | |
| 4.50% [EUSA5+426.7] Sub. Nts., 12/7/272,3 | | EUR | | | 800,000 | | | | 945,231 | |
| 9.25% [EUSA5+941.4] Jr. Sub. Perpetual Bonds2,3,16 | | EUR | | | 353,000 | | | | 440,527 | |
| Banco do Brasil SA (Cayman), 4.75% Sr. Unsec. Nts., 3/20/242 | | | | | 1,053,000 | | | | 1,107,503 | |
| Banco Santander SA: | | | | | | | | | | |
| 5.25% [EUSA5+499.9] Jr. Sub. Perpetual Bonds2,3,16 | | EUR | | | 600,000 | | | | 718,972 | |
| 6.75% [EUSA5+680.3] Jr. Sub. Perpetual Bonds2,3,16 | | EUR | | | 3,390,000 | | | | 4,201,863 | |
| Banco Votorantim SA, 4.50% Sr. Unsec. Nts., 9/24/242 | | | | | 1,200,000 | | | | 1,236,012 | |
| Bancolombia SA, 4.625% [H15T5Y+294.4] Sub. Nts., 12/18/293 | | | | | 500,000 | | | | 508,125 | |
| | | | | | | | | | |
| | | | | Principal Amount | | | Value | |
Commercial Banks (Continued) | |
| Bank of China Ltd., 5.00% Sub. Nts., 11/13/242 | | | | $ | 1,475,000 | | | $ | 1,612,221 | |
| Bankia SA, 6.375% [EUSA5+622.4] Jr. Sub. Perpetual Bonds2,3,16 | | EUR | | | 600,000 | | | | 731,909 | |
| Bankinter SA, 8.625% [EUSA5+886.7] Jr. Sub. Perpetual Bonds2,3,16 | | EUR | | | 1,145,000 | | | | 1,427,089 | |
| Barclays plc, 7.875% [USSW5+677.2] Jr. Sub. Perpetual Bonds2,3,16 | | | | | 970,000 | | | | 1,047,993 | |
| BNP Paribas SA: | | | | | | | | | | |
| 6.75% [USSW5+491.6] Jr. Sub. Perpetual Bonds2,3,16 | | | | | 2,000,000 | | | | 2,130,790 | |
| 7.625% [USSW5+631.4] Jr. Sub. Perpetual Bonds2,3,16 | | | | | 925,000 | | | | 976,198 | |
| 7.625% [USSW5+631.4] Jr. Sub. Perpetual Bonds2,3,16 | | | | | 2,265,000 | | | | 2,390,368 | |
| CaixaBank SA, 6.75% [EUSA5+649.8] Jr. Sub. Perpetual Bonds2,3,16 | | EUR | | | 1,415,000 | | | | 1,788,582 | |
| CIT Group, Inc.: | | | | | | | | | | |
| 4.125% Sr. Unsec. Nts., 3/9/21 | | | | | 381,000 | | | | 388,879 | |
| 5.00% Sr. Unsec. Nts., 8/15/22 | | | | | 116,000 | | | | 123,249 | |
| 5.25% Sr. Unsec. Nts., 3/7/25 | | | | | 235,000 | | | | 258,990 | |
| Cooperatieve Rabobank UA, 6.625% [EUSA5+669.7] Jr. Sub. Perpetual Bonds2,3,16 | | EUR | | | 2,315,000 | | | | 2,824,599 | |
| Credit Agricole SA: | | | | | | | | | | |
| 6.875% [USSW5+431.9] Jr. Sub. Perpetual Bonds2,3,16 | | | | | 575,000 | | | | 633,630 | |
| 7.875% [USSW5+489.8] Jr. Sub. Perpetual Bonds2,3,16 | | | | | 1,155,000 | | | | 1,319,472 | |
| Credit Suisse AG, 6.50% Sub. Nts., 8/8/232 | | | | | 2,355,000 | | | | 2,631,534 | |
| Danske Bank AS, 6.125% [USSW7+389.6] Jr. Sub. Perpetual Bonds2,3,16 | | | | | 1,125,000 | | | | 1,159,580 | |
| Global Bank Corp., 5.25% | | | | | | | | | | |
| [US0003M+330] Sr. Unsec. Nts., 4/16/292,3 | | | | | 2,100,000 | | | | 2,260,125 | |
| HSBC Holdings plc, 6.00% [EUSA5+533.8] Jr. Sub. Perpetual Bonds2,3,16 | | EUR | | | 955,000 | | | | 1,238,731 | |
| Icahn Enterprises LP/Icahn Enterprises Finance Corp., 6.375% Sr. Unsec. Nts., 12/15/25 | | | | | 186,000 | | | | 195,455 | |
| Lions Gate Capital Holdings LLC, 6.375% Sr. Unsec. Nts., 2/1/242 | | | | | 235,000 | | | | 246,165 | |
| Lloyds Bank plc, 7.50% Sr. Unsec. Nts., 4/2/322,7 | | | | | 2,825,000 | | | | 2,362,097 | |
| Novo Banco SA, 8.50% [EUSA5+823.3] Sub. Nts., 7/6/282,3 | | EUR | | | 755,000 | | | | 898,974 | |
| Skandinaviska Enskilda Banken AB, 5.75% [USSW5+385] Jr. Sub. Perpetual Bonds2,3,16 | | | | | 2,500,000 | | | | 2,523,550 | |
| Societe Generale SA, 7.375% [USSW5+623.8] Jr. Sub. Perpetual Bonds2,3,16 | | | | | 3,745,000 | | | | 3,976,347 | |
| Standard Chartered plc: | | | | | | | | | | |
| 3.516% [H15T5Y+185] Sub. Nts., 2/12/301,2,3 | | | | | 625,000 | | | | 634,163 | |
| 7.75% [USSW5+572.3] Jr. Sub. Perpetual Bonds2,3,16 | | | | | 1,250,000 | | | | 1,383,706 | |
| | | | | | | | | 51,414,803 | |
| | | | | | | | | | | |
Consumer Finance—0.5% | |
| Ally Financial, Inc.: | | | | | | | | | | |
| 5.125% Sr. Unsec. Nts., 9/30/24 | | | | | 825,000 | | | | 911,522 | |
| 5.75% Sub. Nts., 11/20/25 | | | | | 797,000 | | | | 893,636 | |
| 8.00% Sr. Unsec. Nts., 11/1/31 | | | | | 383,000 | | | | 532,351 | |
| Navient Corp.: | | | | | | | | | | |
| 5.875% Sr. Unsec. Nts., 10/25/24 | | | | | 316,000 | | | | 338,907 | |
| 6.125% Sr. Unsec. Nts., 3/25/24 | | | | | 434,000 | | | | 471,971 | |
19 INVESCO OPPENHEIMER V.I. GLOBAL STRATEGIC INCOME FUND
CONSOLIDATED SCHEDULE OF INVESTMENTSContinued
| | | | | | | | | | |
| | | | | Principal Amount | | | Value | |
Consumer Finance (Continued) | |
| Navient Corp.: (Continued) | | | | | | | | | | |
| 6.50% Sr. Unsec. Nts., 6/15/22 | | | | $ | 221,000 | | | $ | 240,061 | |
| 6.625% Sr. Unsec. Nts., 7/26/21 | | | | | 237,000 | | | | 251,161 | |
| 6.75% Sr. Unsec. Nts., 6/25/25 | | | | | 306,000 | | | | 338,589 | |
| 6.75% Sr. Unsec. Nts., 6/15/26 | | | | | 165,000 | | | | 181,657 | |
| Springleaf Finance Corp.: | | | | | | | | | | |
| 6.875% Sr. Unsec. Nts., 3/15/25 | | | | | 653,000 | | | | 744,413 | |
| 7.125% Sr. Unsec. Nts., 3/15/26 | | | | | 817,000 | | | | 946,147 | |
| | | | | | | | | 5,850,415 | |
| | | | | | | | | | | |
Diversified Financial Services—1.0% | |
| Astana Finance JSC, 9.16% Sr. Unsec. Nts., 12/22/2415 | | | | | 315,159 | | | | — | |
| Banco Invex SA/Hipotecaria Credito y Casa SA de CV, 6.45%, 3/13/349,12,15 | | MXN | | | 4,830,531 | | | | — | |
| Docuformas SAPI de CV, 10.25% Sr. Unsec. Nts., 7/24/242 | | | | | 365,000 | | | | 371,086 | |
| Greenko Mauritius Ltd., 6.25% Sr. Unsec. Nts., 2/21/232 | | | | | 1,500,000 | | | | 1,543,943 | |
| Icahn Enterprises LP/Icahn Enterprises Finance Corp., 5.875% Sr. Unsec. Nts., 2/1/22 | | | | | 140,000 | | | | 140,424 | |
| JP Morgan/Hipotecaria su Casita, 6.47%, 8/26/352 | | MXN | | | 5,808,600 | | | | 34,269 | |
| Lions Gate Capital Holdings LLC, 5.875% Sr. Unsec. Nts., 11/1/242 | | | | | 299,000 | | | | 304,357 | |
| Morgan Stanley, Russian Federation Total Return Linked Bonds, Series 007, Cl. VR, 2.66%, 8/22/34 | | RUB | | | 22,725,040 | | | | 61,628 | |
| National Bank for Agriculture & Rural Development, 8.39% Sr. Unsec. Nts., 7/19/21 | | INR | | | 55,000,000 | | | | 786,731 | |
| Power Finance Corp. Ltd.: | | | | | | | | | | |
| 7.27% Sr. Unsec. Nts., 12/22/21 | | INR | | | 140,000,000 | | | | 1,960,235 | |
| 7.42% Sr. Unsec. Nts., 6/26/20 | | INR | | | 43,000,000 | | | | 605,237 | |
| 7.50% Sr. Unsec. Nts., 8/16/21 | | INR | | | 140,000,000 | | | | 1,966,870 | |
| Quicken Loans, Inc.: | | | | | | | | | | |
| 5.25% Sr. Unsec. Nts., 1/15/282 | | | | | 147,000 | | | | 152,486 | |
| 5.75% Sr. Unsec. Nts., 5/1/252 | | | | | 140,000 | | | | 145,017 | |
| Rural Electrification Corp. Ltd., 7.24% Sr. Unsec. Nts., 10/21/21 | | INR | | | 140,000,000 | | | | 1,962,187 | |
| Swiss Insured Brazil Power Finance Sarl, 9.85% Sr. Sec. Nts., 7/16/322 | | BRL | | | 5,250,000 | | | | 1,523,697 | |
| | | | | | | | | 11,558,167 | |
| | | | | | | | | | | |
Insurance—0.8% | |
| AmWINS Group, Inc., 7.75% Sr. Unsec. Nts., 7/1/262 | | | | | 189,000 | | | | 209,408 | |
| ASR Nederland NV, 3.375% [EUSA5+400] Sub. Nts., 5/2/492,3 | | EUR | | | 1,250,000 | | | | 1,560,359 | |
| AXA SA, 3.875% [EUSA11+325] Jr. Sub. Perpetual Bonds2,3,16 | | EUR | | | 810,000 | | | | 1,040,338 | |
| Caisse Nationale de Reassurance Mutuelle Agricole Groupama, 6.375% [EUR003M+577] Jr. Sub. Perpetual Bonds2,3,16 | | EUR | | | 2,000,000 | | | | 2,675,367 | |
| La Mondiale SAM, 5.05% [EUSA5+505] Jr. Sub. Perpetual Bonds2,3,16 | | EUR | | | 825,000 | | | | 1,081,007 | |
| NN Group NV, 4.375% [EUR003M+390] | | | | | | | | | | |
| Jr. Sub. Perpetual Bonds2,3,16 | | EUR | | | 1,160,000 | | | | 1,466,541 | |
| VIVAT NV, 6.25% [USSW5+417.4] Jr. Sub. Perpetual Bonds2,3,16 | | | | | 1,160,000 | | | | 1,178,850 | |
| | | | | | | | | 9,211,870 | |
| | | | | | | | | | | |
Real Estate Investment Trusts (REITs)—0.5% | |
| Equinix, Inc., 5.875% Sr. Unsec. Nts., 1/15/26 | | | | | 781,000 | | | | 830,289 | |
| GLP Capital LP/GLP Financing II, Inc., 5.375% Sr. Unsec. Nts., 11/1/23 | | | | | 563,000 | | | | 613,991 | |
| Iron Mountain US Holdings, Inc., 5.375% Sr. Unsec. Nts., 6/1/262 | | | | | 822,000 | | | | 861,330 | |
| | | | | | | | | | | | | | |
| | | | | | | | Principal Amount | | | Value | |
Real Estate Investment Trusts (REITs) (Continued) | |
| Iron Mountain, Inc.: | | | | | | | | | | | | | | |
| 4.875% Sr. Unsec. Nts., 9/15/272 | | | | | | | | $ | 164,000 | | | $ | 169,711 | |
| 4.875% Sr. Unsec. Nts., 9/15/292 | | | | | | | | | 370,000 | | | | 376,705 | |
| iStar, Inc., 4.75% Sr. Unsec. Nts., 10/1/24 | | | | | | | | | 880,000 | | | | 913,735 | |
| MGM Growth Properties Operating Partnership LP/MGP Finance Co.-Issuer, Inc.: | | | | | | | | | | | | | | |
| 5.625% Sr. Unsec. Nts., 5/1/24 | | | | | | | | | 351,000 | | | | 383,322 | |
| 5.75% Sr. Unsec. Nts., 2/1/272 | | | | | | | | | 105,000 | | | | 117,469 | |
| MPT Operating Partnership LP/MPT Finance Corp.: | | | | | | | | | | | | | | |
| 4.625% Sr. Unsec. Nts., 8/1/29 | | | | | | | | | 962,000 | | | | 992,664 | |
| 5.00% Sr. Unsec. Nts., 10/15/27 | | | | | | | | | 78,000 | | | | 82,877 | |
| 6.375% Sr. Unsec. Nts., 3/1/24 | | | | | | | | | 79,000 | | | | 82,256 | |
| SBA Communications Corp., 4.00% Sr. Unsec. Nts., 10/1/22 | | | | | | | | | 280,000 | | | | 285,948 | |
| | | | | | | | | | | | | 5,710,297 | |
| | | | | | | | | | | | | | | |
Real Estate Management & Development—1.5% | |
| China Aoyuan Group Ltd., 7.50% Sr. Sec. Nts., 5/10/212 | | | | | | | | | 1,001,000 | | | | 1,028,527 | |
| China Resources Land Ltd., 3.75% [H15T5Y+513.9] Jr. Sub. Perpetual Bonds1,2,3,16 | | | | | | | | | 1,250,000 | | | | 1,253,125 | |
| CIFI Holdings Group Co. Ltd.: | | | | | | | | | | | | | | |
| 6.375% Sr. Unsec. Nts., 5/2/202 | | | | | | | | | 1,000,000 | | | | 1,007,306 | |
| 7.625% Sr. Unsec. Nts., 3/2/212 | | | | | | | | | 4,204,000 | | | | 4,342,979 | |
| Country Garden Holdings Co. Ltd., 7.50% Sr. Sec. Nts., 3/9/202 | | | | | | | | | 1,555,000 | | | | 1,565,779 | |
| Logan Property Holdings Co. Ltd., | | | | | | | | | | | | | | |
| 6.875% Sr. Unsec. Nts., 4/24/212 | | | | | | | | | 1,365,000 | | | | 1,404,116 | |
| Times China Holdings Ltd.: | | | | | | | | | | | | | | |
| 6.25% Sr. Sec. Nts., 1/23/202 | | | | | | | | | 490,000 | | | | 489,454 | |
| 7.85% Sr. Sec. Nts., 6/4/212 | | | | | | | | | 5,412,000 | | | | 5,542,844 | |
| | | | | | | | | | | | | 16,634,130 | |
| | | | | | | | | | | | | | | |
Thrifts & Mortgage Finance—0.1% | |
| LIC Housing Finance Ltd., 7.45% Sr. Sec. Nts., 10/17/22 | | INR | | | | | | | 70,000,000 | | | | 981,960 | |
| | | | | | | | | | | | | | | |
Health Care—1.6% | |
Biotechnology—0.4% | |
| AbbVie, Inc., 2.60% Sr. Unsec. Nts., 11/21/242 | | | | | | | | | 5,000,000 | | | | 5,034,272 | |
| | | | | | | | | | | | | | | |
Health Care Equipment & Supplies—0.0% | |
| Teleflex, Inc., 4.875% Sr. Unsec. Nts., 6/1/26 | | | | | | | | | 592,000 | | | | 620,325 | |
| | | | | | | | | | | | | | | |
Health Care Providers & Services—0.9% | |
| Acadia Healthcare Co., Inc.: | | | | | | | | | | | | | | |
| 5.625% Sr. Unsec. Nts., 2/15/23 | | | | | | | | | 84,000 | | | | 85,540 | |
| 6.50% Sr. Unsec. Nts., 3/1/24 | | | | | | | | | 118,000 | | | | 122,621 | |
| Centene Corp.: | | | | | | | | | | | | | | |
| 4.625% Sr. Unsec. Nts., 12/15/292 | | | | | | | | | 157,000 | | | | 165,745 | |
| 4.75% Sr. Unsec. Nts., 5/15/22 | | | | | | | | | 268,000 | | | | 273,837 | |
| 5.375% Sr. Unsec. Nts., 6/1/262 | | | | | | | | | 844,000 | | | | 897,256 | |
| 6.125% Sr. Unsec. Nts., 2/15/24 | | | | | | | | | 234,000 | | | | 243,068 | |
| Hadrian Merger Sub, Inc., 8.50% Sr. Unsec. Nts., 5/1/262 | | | | | | | | | 670,000 | | | | 687,820 | |
| HCA, Inc.: | | | | | | | | | | | | | | |
| 4.125% Sr. Sec. Nts., 6/15/29 | | | | | | | | | 739,000 | | | | 784,569 | |
| 5.375% Sr. Unsec. Nts., 2/1/25 | | | | | | | | | 200,000 | | | | 221,583 | |
| 5.375% Sr. Unsec. Nts., 9/1/26 | | | | | | | | | 985,000 | | | | 1,099,531 | |
| 5.625% Sr. Unsec. Nts., 9/1/28 | | | | | | | | | 246,000 | | | | 280,797 | |
| 5.875% Sr. Unsec. Nts., 2/15/26 | | | | | | | | | 101,000 | | | | 115,037 | |
| 7.50% Sr. Unsec. Nts., 2/15/22 | | | | | | | | | 423,000 | | | | 468,168 | |
| MPH Acquisition Holdings LLC, 7.125% Sr. Unsec. Nts., 6/1/242 | | | | | | | | | 503,000 | | | | 487,905 | |
| Omnicare, Inc., 4.75% Sr. Unsec. Nts., 12/1/22 | | | | | | | | | 1,765,000 | | | | 1,883,896 | |
20 INVESCO OPPENHEIMER V.I. GLOBAL STRATEGIC INCOME FUND
| | | | | | | | | | |
| | | | | Principal Amount | | | Value | |
Health Care Providers & Services (Continued) | |
| Tenet Healthcare Corp.: | | | | | | | | | | |
| 5.125% Sr. Sec. Nts., 11/1/272 | | | | $ | 1,177,000 | | | $ | 1,244,678 | |
| 6.25% Sec. Nts., 2/1/272 | | | | | 258,000 | | | | 277,995 | |
| WellCare Health Plans, Inc., 5.375% Sr. Unsec. Nts., 8/15/262 | | | | | 591,000 | | | | 630,508 | |
| | | | | | | | | 9,970,554 | |
| | | | | | | | | | | |
Life Sciences Tools & Services—0.1% | |
| Charles River Laboratories International, Inc., 4.25% Sr. Unsec. Nts., 5/1/282 | | | | | 815,000 | | | | 831,789 | |
| | | | | | | | | | | |
Pharmaceuticals—0.2% | |
| Bausch Health Americas, Inc., 8.50% Sr. Unsec. Nts., 1/31/272 | | | | | 290,000 | | | | 330,788 | |
| Bausch Health Cos., Inc.: | | | | | | | | | | |
| 5.75% Sr. Sec. Nts., 8/15/272 | | | | | 235,000 | | | | 255,410 | |
| 7.00% Sr. Sec. Nts., 3/15/242 | | | | | 525,000 | | | | 547,095 | |
| HLF Financing Sarl LLC/Herbalife International, Inc., 7.25% Sr. Unsec. Nts., 8/15/262 | | | | | 495,000 | | | | 525,319 | |
| Par Pharmaceutical, Inc., 7.50% Sr. Sec. Nts., 4/1/272 | | | | | 488,000 | | | | 486,792 | |
| | | | | | | | | 2,145,404 | |
| | | | | | | | | | | |
Industrials—2.4% | |
Aerospace & Defense—0.3% | |
| Bombardier, Inc.: | | | | | | | | | | |
| 7.50% Sr. Unsec. Nts., 3/15/252 | | | | | 228,000 | | | | 235,693 | |
| 7.875% Sr. Unsec. Nts., 4/15/272 | | | | | 222,000 | | | | 228,943 | |
| Moog, Inc., 4.25% Sr. Unsec. Nts., 12/15/272 | | | | | 264,000 | | | | 269,306 | |
| TransDigm, Inc.: | | | | | | | | | | |
| 6.25% Sr. Sec. Nts., 3/15/262 | | | | | 235,000 | | | | 254,854 | |
| 6.375% Sr. Sub. Nts., 6/15/26 | | | | | 706,000 | | | | 750,097 | |
| 6.50% Sr. Sub. Nts., 7/15/24 | | | | | 442,000 | | | | 456,778 | |
| Triumph Group, Inc., 7.75% Sr. Unsec. Nts., 8/15/25 | | | | | 586,000 | | | | 612,730 | |
| | | | | | | | | 2,808,401 | |
| | | | | | | | | | | |
Air Freight & Couriers—0.2% | |
| Mexico City Airport Trust, 3.875% Sr. Sec. Nts., 4/30/282 | | | | | 600,000 | | | | 614,464 | |
| Rumo Luxembourg Sarl, 5.875% Sr. Unsec. Nts., 1/18/252 | | | | | 1,225,000 | | | | 1,316,367 | |
| XPO Logistics, Inc.: | | | | | | | | | | |
| 6.125% Sr. Unsec. Nts., 9/1/232 | | | | | 471,000 | | | | 487,195 | |
| 6.75% Sr. Unsec. Nts., 8/15/242 | | | | | 222,000 | | | | 241,633 | |
| | | | | | | | | 2,659,659 | |
| | | | | | | | | | | |
Airlines—0.1% | |
| American Airlines Group, Inc.: | | | | | | | | | | |
| 4.625% Sr. Unsec. Nts., 3/1/202 | | | | | 264,000 | | | | 264,867 | |
| 5.00% Sr. Unsec. Nts., 6/1/222 | | | | | 434,000 | | | | 454,615 | |
| United Continental Holdings, Inc.: | | | | | | | | | | |
| 4.25% Sr. Unsec. Nts., 10/1/22 | | | | | 334,000 | | | | 349,448 | |
| 4.875% Sr. Unsec. Nts., 1/15/25 | | | | | 270,000 | | | | 286,987 | |
| | | | | | | | | 1,355,917 | |
| | | | | | | | | | | |
Building Products—0.2% | |
| Advanced Drainage Systems, Inc., 5.00% Sr. Unsec. Nts., 9/30/272 | | | | | 130,000 | | | | 134,433 | |
| Standard Industries, Inc.: | | | | | | | | | | |
| 5.00% Sr. Unsec. Nts., 2/15/272 | | | | | 172,000 | | | | 179,709 | |
| 5.375% Sr. Unsec. Nts., 11/15/242 | | | | | 348,000 | | | | 358,437 | |
| 6.00% Sr. Unsec. Nts., 10/15/252 | | | | | 799,000 | | | | 841,938 | |
| William Lyon Homes, Inc., 6.00% Sr. Unsec. Nts., 9/1/23 | | | | | 454,000 | | | | 474,618 | |
| | | | | | | | | 1,989,135 | |
| | | | | | | | | | | |
Commercial Services & Supplies—0.4% | |
| ACCO Brands Corp., 5.25% Sr. Unsec. Nts., 12/15/242 | | | | | 438,000 | | | | 457,344 | |
| | | | | | | | | | |
| | | | | Principal Amount | | | Value | |
Commercial Services & Supplies (Continued) | |
| ADT Security Corp. (The), 6.25% Sr. Sec. Nts., 10/15/21 | | | | $ | 658,000 | | | $ | 695,388 | |
| Brink’s Co. (The), 4.625% Sr. Unsec. Nts., 10/15/272 | | | | | 890,000 | | | | 918,767 | |
| GFL Environmental, Inc., 5.125% Sr. Sec. Nts., 12/15/262 | | | | | 113,000 | | | | 119,088 | |
| GW B-CR Security Corp., 9.50% Sr. Unsec. Nts., 11/1/272 | | | | | 231,000 | | | | 247,020 | |
| Intrado Corp., 5.375% Sr. Unsec. Nts., 7/15/222 | | | | | 624,000 | | | | 614,640 | |
| Murphy Oil USA, Inc., 4.75% Sr. Unsec. Nts., 9/15/29 | | | | | 392,000 | | | | 414,705 | |
| Prime Security Services Borrower LLC/ Prime Finance, Inc., 5.75% Sr. Sec. Nts., 4/15/262 | | | | | 437,000 | | | | 475,785 | |
| Resideo Funding, Inc., 6.125% Sr. Unsec. Nts., 11/1/262 | | | | | 225,000 | | | | 227,256 | |
| RR Donnelley & Sons Co., 7.875% Sr. Unsec. Nts., 3/15/21 | | | | | 158,000 | | | | 163,988 | |
| Waste Pro USA, Inc., 5.50% Sr. Unsec. Nts., 2/15/262 | | | | | 433,000 | | | | 452,408 | |
| | | | | | | | | 4,786,389 | |
| | | | | | | | | | | |
Construction & Engineering—0.0% | |
| AECOM, 5.125% Sr. Unsec. Nts., 3/15/27 | | | | | 442,000 | | | | 476,409 | |
| | | | | | | | | | | |
Electrical Equipment—0.1% | |
| EnerSys: | | | | | | | | | | |
| 4.375% Sr. Unsec. Nts., 12/15/272 | | | | | 190,000 | | | | 188,119 | |
| 5.00% Sr. Unsec. Nts., 4/30/232 | | | | | 772,000 | | | | 810,920 | |
| Sensata Technologies BV, 5.625% Sr. Unsec. Nts., 11/1/242 | | | | | 245,000 | | | | 273,277 | |
| | | | | | | | | 1,272,316 | |
| | | | | | | | | | | |
Industrial Conglomerates—0.0% | |
| Icahn Enterprises LP/Icahn Enterprises Finance Corp., 6.75% Sr. Unsec. Nts., 2/1/24 | | | | | 222,000 | | | | 230,972 | |
| | | | | | | | | | | |
Machinery—0.4% | |
| Amsted Industries, Inc., 5.625% Sr. Unsec. Nts., 7/1/272 | | | | | 248,000 | | | | 263,586 | |
| Cleaver-Brooks, Inc., 7.875% Sr. Sec. Nts., 3/1/232 | | | | | 943,000 | | | | 943,391 | |
| Colfax Corp.: | | | | | | | | | | |
| 6.00% Sr. Unsec. Nts., 2/15/242 | | | | | 224,000 | | | | 238,467 | |
| 6.375% Sr. Unsec. Nts., 2/15/262 | | | | | 106,000 | | | | 115,672 | |
| EnPro Industries, Inc., 5.75% Sr. Unsec. Nts., 10/15/26 | | | | | 913,000 | | | | 974,945 | |
| IHS Netherlands Holdco BV, 8.00% Sr. Unsec. Nts., 9/18/272 | | | | | 690,000 | | | | 735,506 | |
| Titan International, Inc., 6.50% Sr. Sec. Nts., 11/30/23 | | | | | 864,000 | | | | 741,239 | |
| | | | | | | | | 4,012,806 | |
| | | | | | | | | | | |
Professional Services—0.1% | |
| ASGN, Inc., 4.625% Sr. Unsec. Nts., 5/15/282 | | | | | 597,000 | | | | 614,749 | |
| | | | | | | | | | | |
Road & Rail—0.2% | |
| Avis Budget Car Rental LLC/Avis Budget Finance, Inc., 5.75% Sr. Unsec. Nts., 7/15/272 | | | | | 514,000 | | | | 535,858 | |
| Fideicomiso PA Pacifico Tres, 8.25% Sr. Sec. Nts., 1/15/352 | | | | | 510,000 | | | | 589,687 | |
| Kenan Advantage Group, Inc. (The), | | | | | | | | | | |
| 7.875% Sr. Unsec. Nts., 7/31/232 | | | | | 654,000 | | | | 641,466 | |
| United Rentals North America, Inc., 5.25% Sr. Unsec. Nts., 1/15/30 | | | | | 504,000 | | | | 543,388 | |
| | | | | | | | | 2,310,399 | |
21 INVESCO OPPENHEIMER V.I. GLOBAL STRATEGIC INCOME FUND
CONSOLIDATED SCHEDULE OF INVESTMENTSContinued
| | | | | | | | | | |
| | | | | Principal Amount | | | Value | |
Trading Companies & Distributors—0.3% | |
| AerCap Global Aviation Trust, 6.50% [US0003M+430] Jr. Sub. Nts., 6/15/452,3 | | | | $ | 483,000 | | | $ | 533,763 | |
| BMC East LLC, 5.50% Sr. Sec. Nts., 10/1/242 | | | | | 603,000 | | | | 628,878 | |
| Herc Holdings, Inc., 5.50% Sr. Unsec. Nts., 7/15/272 | | | | | 423,000 | | | | 446,276 | |
| United Rentals North America, Inc.: | |
| 4.875% Sr. Unsec. Nts., 1/15/28 | | | | | 280,000 | | | | 292,062 | |
| 5.875% Sr. Unsec. Nts., 9/15/26 | | | | | 1,120,000 | | | | 1,204,308 | |
| 6.50% Sr. Unsec. Nts., 12/15/26 | | | | | 471,000 | | | | 518,530 | |
| | | | | | | | | 3,623,817 | |
| | | | | | | | | | | |
Transportation Infrastructure—0.1% | |
| Jasa Marga Persero Tbk PT, 7.50% Sr. Unsec. Nts., 12/11/202 | | | | | IDR 9,160,000,000 | | | | 661,823 | |
| | | | | | | | | | | |
Information Technology—0.6% | |
Communications Equipment—0.0% | |
| Hughes Satellite Systems Corp.: | | | | | | | | | | |
| 5.25% Sr. Sec. Nts., 8/1/26 | | | | | 327,000 | | | | 359,814 | |
| 6.625% Sr. Unsec. Nts., 8/1/26 | | | | | 322,000 | | | | 358,337 | |
| | | | | | | | | 718,151 | |
| | | | | | | | | | | |
Electronic Equipment, Instruments, & Components—0.1% | |
| Itron, Inc., 5.00% Sr. Unsec. Nts., 1/15/262 | | | | | 516,000 | | | | 536,174 | |
| MTS Systems Corp., 5.75% Sr. Unsec. Nts., 8/15/272 | | | | | 471,000 | | | | 493,536 | |
| | | | | | | | | 1,029,710 | |
| | | | | | | | | | | |
IT Services—0.1% | |
| Alliance Data Systems Corp., 4.75% Sr. Unsec. Nts., 12/15/242 | | | | | 435,000 | | | | 435,000 | |
| Harland Clarke Holdings Corp.: | | | | | | | | | | |
| 6.875% Sr. Sec. Nts., 3/1/202 | | | | | 230,000 | | | | 230,086 | |
| 8.375% Sr. Sec. Nts., 8/15/222 | | | | | 160,000 | | | | 130,850 | |
| | | | | | | | | 795,936 | |
| | | | | | | | | | | |
Semiconductors & Semiconductor Equipment—0.1% | |
| Micron Technology, Inc., 4.663% Sr. Unsec. Nts., 2/15/30 | | | | | 681,000 | | | | 750,152 | |
| | | | | | | | | | | |
Software—0.0% | |
| Camelot Finance SA, 4.50% Sr. Sec. Nts., 11/1/262 | | | | | 192,000 | | | | 197,640 | |
| | | | | | | | | | | |
Technology Hardware, Storage & Peripherals—0.3% | |
| Dell International LLC/EMC Corp.: | |
| 4.42% Sr. Sec. Nts., 6/15/212 | | | | | 2,266,000 | | | | 2,332,004 | |
| 7.125% Sr. Unsec. Nts., 6/15/242 | | | | | 616,000 | | | | 650,650 | |
| EMC Corp., 2.65% Sr. Unsec. Nts., 6/1/20 | | | | | 347,000 | | | | 347,496 | |
| Everi Payments, Inc., 7.50% Sr. Unsec. Nts., 12/15/252 | | | | | 339,000 | | | | 364,566 | |
| | | | | | | | | 3,694,716 | |
| | | | | | | | | | | |
Materials—4.6% | |
Chemicals—1.1% | |
| Ashland LLC: | | | | | | | | | | |
| 4.75% Sr. Unsec. Nts., 8/15/22 | | | | | 235,000 | | | | 246,162 | |
| 6.875% Sr. Unsec. Nts., 5/15/43 | | | | | 134,000 | | | | 153,890 | |
| Blue Cube Spinco LLC, 9.75% Sr. Unsec. Nts., 10/15/23 | | | | | 118,000 | | | | 127,182 | |
| Braskem Idesa SAPI, 7.45% Sr. Sec. Nts., 11/15/292 | | | | | 500,000 | | | | 533,630 | |
| Braskem Netherlands Finance BV: | |
| 4.50% Sr. Unsec. Nts., 1/31/302 | | | | | 355,000 | | | | 353,758 | |
| 5.875% Sr. Unsec. Nts., 1/31/502 | | | | | 1,200,000 | | | | 1,193,700 | |
| Celanese US Holdings LLC, 5.875% Sr. Unsec. Nts., 6/15/21 | | | | | 1,019,000 | | | | 1,069,795 | |
| CF Industries, Inc., 3.40% Sr. Sec. Nts., 12/1/212 | | | | | 992,000 | | | | 1,017,498 | |
| | | | | | | | | | |
| | | | | Principal Amount | | | Value | |
Chemicals (Continued) | |
| Chemours Co. (The), 6.625% Sr. Unsec. Nts., 5/15/23 | | | | $ | 192,000 | | | $ | 193,136 | |
| Element Solutions, Inc., 5.875% Sr. Unsec. Nts., 12/1/252 | | | | | 490,000 | | | | 513,883 | |
| ENN Clean Energy International Investment Ltd., 7.50% Sr. Unsec. Nts., 2/27/212 | | | | | 1,250,000 | | | | 1,292,247 | |
| Koppers, Inc., 6.00% Sr. Unsec. Nts., 2/15/252 | | | | | 570,000 | | | | 598,494 | |
| OCP SA, 4.50% Sr. Unsec. Nts., 10/22/252 | | | | | 1,570,000 | | | | 1,683,525 | |
| Olin Corp.: | | | | | | | | | | |
| 5.00% Sr. Unsec. Nts., 2/1/30 | | | | | 117,000 | | | | 118,971 | |
| 5.125% Sr. Unsec. Nts., 9/15/27 | | | | | 110,000 | | | | 114,930 | |
| 5.625% Sr. Unsec. Nts., 8/1/29 | | | | | 943,000 | | | | 997,741 | |
| Starfruit Finco BV/Starfruit US Holdco LLC, 6.50% Sr. Unsec. Nts., 10/1/262 | | EUR | | | 1,455,000 | | | | 1,754,479 | |
| Unigel Luxembourg SA, 8.75% Sr. Unsec. Nts., 10/1/262 | | | | | 780,000 | | | | 796,476 | |
| | | | | | | | | 12,759,497 | |
| | | | | | | | | | | |
Construction Materials—0.2% | |
| Cemex Finance LLC, 6.00% Sr. Sec. Nts., 4/1/242 | | | | | 985,000 | | | | 1,015,043 | |
| Cemex SAB de CV, 5.45% Sr. Sec. Nts., 11/19/292 | | | | | 305,000 | | | | 319,106 | |
| InterCement Financial Operations BV, 5.75% Sr. Unsec. Nts., 7/17/242 | | | | | 650,000 | | | | 539,776 | |
| | | | | | | | | 1,873,925 | |
| | | | | | | | | | | |
Containers & Packaging—0.6% | |
| Ardagh Packaging Finance plc/Ardagh Holdings USA, Inc.: | | | | | | | | | | |
| 4.125% Sr. Sec. Nts., 8/15/262 | | | | | 580,000 | | | | 595,587 | |
| 4.25% Sr. Sec. Nts., 9/15/222 | | | | | 125,000 | | | | 126,824 | |
| 6.00% Sr. Unsec. Nts., 2/15/252 | | | | | 456,000 | | | | 479,370 | |
| Ball Corp., 4.375% Sr. Unsec. Nts., 12/15/20 | | | | | 1,762,000 | | | | 1,802,949 | |
| Berry Global, Inc., 4.875% Sr. Sec. Nts., 7/15/262 | | | | | 427,000 | | | | 451,157 | |
| Cascades, Inc./Cascades USA, Inc., 5.375% Sr. Unsec. Nts., 1/15/282 | | | | | 398,000 | | | | 409,940 | |
| Flex Acquisition Co., Inc.: | | | | | | | | | | |
| 6.875% Sr. Unsec. Nts., 1/15/252 | | | | | 283,000 | | | | 285,827 | |
| 7.875% Sr. Unsec. Nts., 7/15/262 | | | | | 234,000 | | | | 236,298 | |
| Graphic Packaging International LLC: | |
| 4.75% Sr. Unsec. Nts., 4/15/21 | | | | | 1,110,000 | | | | 1,139,582 | |
| 4.875% Sr. Unsec. Nts., 11/15/22 | | | | | 298,000 | | | | 312,993 | |
| OI European Group BV, 4.00% Sr. Unsec. Nts., 3/15/232 | | | | | 442,000 | | | | 446,603 | |
| Owens-Brockway Glass Container, Inc., 5.00% Sr. Unsec. Nts., 1/15/222 | | | | | 225,000 | | | | 233,948 | |
| Reynolds Group Issuer, Inc./Reynolds Group Issuer LLC/Reynolds Group Issuer Luxembourg SA, 5.125% Sr. Sec. Nts., 7/15/232 | | | | | 315,000 | | | | 323,138 | |
| Trivium Packaging Finance BV, 5.50% Sr. Sec. Nts., 8/15/262 | | | | | 145,000 | | | | 153,066 | |
| | | | | | | | | 6,997,282 | |
| | | | | | | | | | | |
Metals & Mining—1.9% | |
| ArcelorMittal SA: | | | | | | | | | | |
| 3.60% Sr. Unsec. Nts., 7/16/24 | | | | | 2,500,000 | | | | 2,566,788 | |
| 6.125% Sr. Unsec. Nts., 6/1/25 | | | | | 1,185,000 | | | | 1,361,183 | |
| Celtic Resources Holdings DAC, 4.125% Sr. Unsec. Nts., 10/9/242 | | | | | 2,325,000 | | | | 2,400,490 | |
| Corp. Nacional del Cobre de Chile, 3.00% Sr. Unsec. Nts., 9/30/292 | | | | | 954,000 | | | | 941,068 | |
| CSN Resources SA, 7.625% Sr. Unsec. Nts., 2/13/232 | | | | | 1,210,000 | | | | 1,292,395 | |
22 INVESCO OPPENHEIMER V.I. GLOBAL STRATEGIC INCOME FUND
| | | | | | | | | | |
| | | | | Principal Amount | | | Value | |
Metals & Mining (Continued) | |
| Evraz plc, 5.375% Sr. Unsec. Nts., 3/20/232 | | | | $ | 2,285,000 | | | $ | 2,458,397 | |
| First Quantum Minerals Ltd.: | | | | | | | | | | |
| 7.00% Sr. Unsec. Nts., 2/15/212 | | | | | 63,000 | | | | 63,276 | |
| 7.25% Sr. Unsec. Nts., 4/1/232 | | | | | 1,324,000 | | | | 1,373,471 | |
| FMG Resources August 2006 Pty Ltd., | |
| 4.75% Sr. Unsec. Nts., 5/15/222 | | | | | 119,000 | | | | 123,079 | |
| Freeport-McMoRan, Inc.: | | | | | | | | | | |
| 3.55% Sr. Unsec. Nts., 3/1/22 | | | | | 147,000 | | | | 149,099 | |
| 4.55% Sr. Unsec. Nts., 11/14/24 | | | | | 99,000 | | | | 104,857 | |
| 5.40% Sr. Unsec. Nts., 11/14/34 | | | | | 2,506,000 | | | | 2,630,855 | |
| 5.45% Sr. Unsec. Nts., 3/15/43 | | | | | 96,000 | | | | 99,610 | |
| Hudbay Minerals, Inc., 7.625% Sr. Unsec. Nts., 1/15/252 | | | | | 535,000 | | | | 565,808 | |
| Industrias Penoles SAB de CV, 5.65% Sr. Unsec. Nts., 9/12/492 | | | | | 755,000 | | | | 807,484 | |
| JSW Steel Ltd., 5.25% Sr. Unsec. Nts., 4/13/222 | | | | | 1,600,000 | | | | 1,636,970 | |
| Metinvest BV, 7.75% Sr. Unsec. Nts., 10/17/292 | | | | | 920,000 | | | | 943,925 | |
| Southern Copper Corp., 7.50% Sr. Unsec. Nts., 7/27/35 | | | | | 480,000 | | | | 662,810 | |
| SunCoke Energy Partners LP/SunCoke Energy Partners Finance Corp., 7.50% Sr. Unsec. Nts., 6/15/252 | | | | | 1,231,000 | | | | 1,186,881 | |
| Taseko Mines Ltd., 8.75% Sr. Sec. Nts., 6/15/222 | | | | | 856,000 | | | | 712,887 | |
| | | | | | | | | 22,081,333 | |
| | | | | | | | | | | |
Paper & Forest Products—0.8% | |
| Boise Cascade Co., 5.625% Sr. Unsec. Nts., 9/1/242 | | | | | 692,000 | | | | 721,697 | |
| Celulosa Arauco y Constitucion SA: | | | | | | | | | | |
| 4.20% Sr. Unsec. Nts., 1/29/302 | | | | | 312,000 | | | | 313,513 | |
| 4.50% Sr. Unsec. Nts., 8/1/24 | | | | | 1,513,000 | | | | 1,589,293 | |
| Louisiana-Pacific Corp., 4.875% Sr. Unsec. Nts., 9/15/24 | | | | | 816,000 | | | | 845,919 | |
| Mercer International, Inc.: | | | | | | | | | | |
| 5.50% Sr. Unsec. Nts., 1/15/26 | | | | | 368,000 | | | | 375,369 | |
| 6.50% Sr. Unsec. Nts., 2/1/24 | | | | | 605,000 | | | | 629,451 | |
| Norbord, Inc., 5.75% Sr. Sec. Nts., 7/15/272 | | | | | 894,000 | | | | 930,071 | |
| Suzano Austria GmbH, 5.00% Sr. Unsec. Nts., 1/15/30 | | | | | 3,050,000 | | | | 3,211,559 | |
| | | | | | | | | 8,616,872 | |
| | | | | | | | | | | |
Telecommunication Services—1.5% | |
Diversified Telecommunication Services—1.3% | |
| Altice France SA: | | | | | | | | | | |
| 7.375% Sr. Sec. Nts., 5/1/262 | | | | | 487,000 | | | | 523,764 | |
| 8.125% Sr. Sec. Nts., 2/1/272 | | | | | 264,000 | | | | 297,818 | |
| Axtel SAB de CV, 6.375% Sr. Unsec. Nts., 11/14/242 | | | | | 1,155,000 | | | | 1,218,057 | |
| CenturyLink, Inc.: | | | | | | | | | | |
| 5.625% Sr. Unsec. Nts., 4/1/25 | | | | | 330,000 | | | | 351,329 | |
| 7.50% Sr. Unsec. Nts., Series Y, 4/1/24 | | | | | 777,000 | | | | 877,688 | |
| Cincinnati Bell, Inc., 8.00% Sr. Unsec. Nts., 10/15/252 | | | | | 445,000 | | | | 472,997 | |
| CommScope, Inc., 6.00% Sr. Sec. Nts., 3/1/262 | | | | | 1,174,000 | | | | 1,251,043 | |
| Frontier Communications Corp.: | | | | | | | | | | |
| 10.50% Sr. Unsec. Nts., 9/15/22 | | | | | 732,000 | | | | 358,908 | |
| 11.00% Sr. Unsec. Nts., 9/15/25 | | | | | 105,000 | | | | 51,187 | |
| GTH Finance BV, 7.25% Sr. Unsec. Nts., 4/26/232 | | | | | 2,250,000 | | | | 2,535,874 | |
| HTA Group Ltd., 9.125% Sr. Unsec. Nts., 3/8/222 | | | | | 1,705,000 | | | | 1,764,970 | |
| Inmarsat Finance plc, 4.875% Sr. Unsec. Nts., 5/15/222 | | | | | 319,000 | | | | 323,586 | |
| | | | | | | | | | |
| | | | | Principal Amount | | | Value | |
Diversified Telecommunication Services (Continued) | |
| Level 3 Financing, Inc.: | | | | | | | | | | |
| 5.25% Sr. Unsec. Nts., 3/15/26 | | | | $ | 971,000 | | | $ | 941,839 | |
| 5.375% Sr. Unsec. Nts., 5/1/25 | | | | | 692,000 | | | | 717,663 | |
| Oi S.A., 10% Cash Rate or 8% Cash Rate and 4% PIK Rate, 10.00% Sr. Unsec. Nts., 7/27/2513 | | | | | 883,000 | | | | 792,859 | |
| Qwest Corp., 6.875% Sr. Unsec. Nts., 9/15/33 | | | | | 287,000 | | | | 288,722 | |
| Telecom Italia Capital SA, 7.20% Sr. Unsec. Nts., 7/18/36 | | | | | 1,039,000 | | | | 1,233,709 | |
| Telecom Italia SpA, 5.303% Sr. Unsec. Nts., 5/30/242 | | | | | 435,000 | | | | 468,708 | |
| Zayo Group LLC/Zayo Capital, Inc., 6.00% Sr. Unsec. Nts., 4/1/23 | | | | | 338,000 | | | | 346,310 | |
| | | | | | | | | 14,817,031 | |
| | | | | | | | | | | |
Wireless Telecommunication Services—0.2% | |
| Intelsat Jackson Holdings SA, 8.50% Sr. Unsec. Nts., 10/15/242 | | | | | 553,000 | | | | 504,842 | |
| T-Mobile USA, Inc.: | | | | | | | | | | |
| 4.00% Sr. Unsec. Nts., 4/15/22 | | | | | 299,000 | | | | 306,847 | |
| 4.75% Sr. Unsec. Nts., 2/1/28 | | | | | 427,000 | | | | 448,205 | |
| 5.125% Sr. Unsec. Nts., 4/15/25 | | | | | 139,000 | | | | 144,137 | |
| 6.00% Sr. Unsec. Nts., 4/15/24 | | | | | 232,000 | | | | 240,118 | |
| | | | | | | | | 1,644,149 | |
| | | | | | | | | | | |
Utilities—1.8% | |
Electric Utilities—0.7% | |
| Adani Transmission Ltd., 4.25% Sr. Sec. Nts., 5/21/362 | | | | | 800,000 | | | | 810,702 | |
| DPL, Inc., 4.35% Sr. Unsec. Nts., 4/15/292 | | | | | 453,000 | | | | 437,038 | |
| Empresa de Transmision Electrica SA, 5.125% Sr. Unsec. Nts., 5/2/492 | | | | | 750,000 | | | | 855,709 | |
| Eskom Holdings SOC Ltd., 6.75% Sr. Unsec. Nts., 8/6/232 | | | | | 1,875,000 | | | | 1,916,962 | |
| Perusahaan Listrik Negara PT, 4.125% Sr. Unsec. Nts., 5/15/272 | | | | | 2,045,000 | | | | 2,160,742 | |
| Terraform Global Operating LLC, 6.125% Sr. Unsec. Nts., 3/1/262 | | | | | 342,000 | | | | 356,654 | |
| TerraForm Power Operating LLC, 5.00% Sr. Unsec. Nts., 1/31/282 | | | | | 43,000 | | | | 45,544 | |
| Vistra Operations Co. LLC: | | | | | | | | | | |
| 5.00% Sr. Unsec. Nts., 7/31/272 | | | | | 491,000 | | | | 513,993 | |
| 5.50% Sr. Unsec. Nts., 9/1/262 | | | | | 131,000 | | | | 139,164 | |
| 5.625% Sr. Unsec. Nts., 2/15/272 | | | | | 224,000 | | | | 236,454 | |
| | | | | | | | | 7,472,962 | |
| | | | | | | | | | | |
Gas Utilities—0.1% | |
| AmeriGas Partners LP/AmeriGas Finance Corp.: | | | | | | | | | | |
| 5.50% Sr. Unsec. Nts., 5/20/25 | | | | | 230,000 | | | | 248,973 | |
| 5.875% Sr. Unsec. Nts., 8/20/26 | | | | | 653,000 | | | | 721,140 | |
| NGL Energy Partners LP/NGL Energy Finance Corp., 7.50% Sr. Unsec. Nts., 4/15/262 | | | | | 147,000 | | | | 142,571 | |
| Superior Plus LP/Superior General Partner, Inc., 7.00% Sr. Unsec. Nts., 7/15/262 | | | | | 493,000 | | | | 530,763 | |
| | | | | | | | | | 1,643,447 | |
Independent Power and Renewable Electricity Producers—1.0% | |
| AES Andres BV/Dominican Power Partners/Empresa Generadora de Electricidad Itabo SA, 7.95% Sr. Unsec. Nts., 5/11/262 | | | | | 490,000 | | | | 521,413 | |
| AES Corp.: | | | | | | | | | | |
| 4.00% Sr. Unsec. Nts., 3/15/21 | | | | | 227,000 | | | | 230,632 | |
| 6.00% Sr. Unsec. Nts., 5/15/26 | | | | | 152,000 | | | | 162,161 | |
| AES Gener SA, 6.35% [H15T5Y+491.7] Jr. Sub. Nts., 10/7/792,3 | | | | | 750,000 | | | | 769,875 | |
23 INVESCO OPPENHEIMER V.I. GLOBAL STRATEGIC INCOME FUND
CONSOLIDATED SCHEDULE OF INVESTMENTSContinued
| | | | | | | | | | |
| | | | | Principal Amount | | | Value | |
| Independent Power and Renewable Electricity Producers (Continued) | |
| Azure Power Energy Ltd., 5.50% Sr. Sec. Nts., 11/3/222 | | | | $ | 1,515,000 | | | $ | 1,548,369 | |
| Azure Power Solar Energy Pvt Ltd., 5.65% Sr. Sec. Nts., 12/24/242 | | | | | 600,000 | | | | 614,358 | |
| Calpine Corp.: | | | | | | | | | | |
| 5.25% Sr. Sec. Nts., 6/1/262 | | | | | 367,000 | | | | 382,991 | |
| 5.75% Sr. Unsec. Nts., 1/15/25 | | | | | 86,000 | | | | 88,472 | |
| Enviva Partners LP/Enviva Partners Finance Corp., 6.50% Sr. Unsec. Nts., 1/15/262 | | | | | 375,000 | | | | 402,424 | |
| Inkia Energy Ltd., 5.875% Sr. Unsec. Nts., 11/9/272 | | | | | 1,865,000 | | | | 1,947,731 | |
| Listrindo Capital BV, 4.95% Sr. Unsec. Nts., 9/14/262 | | | | | 2,285,000 | | | | 2,323,308 | |
| NRG Energy, Inc.: | | | | | | | | | | |
| 5.25% Sr. Unsec. Nts., 6/15/292 | | | | | 826,000 | | | | 894,641 | |
| 6.625% Sr. Unsec. Nts., 1/15/27 | | | | | 816,000 | | | | 886,870 | |
| SMC Global Power Holdings Corp., 5.95% [H15T5Y+679.6] Jr. Sub. Perpetual Bonds1,2,3,16 | | | | | 900,000 | | | | 925,393 | |
| | | | | | | | | 11,698,638 | |
| | | | | | | | | | | |
Multi-Utilities—0.0% | |
| TerraForm Power Operating LLC, 4.25% Sr. Unsec. Nts., 1/31/232 | | | | | 157,000 | | | | 162,018 | |
| Total Corporate Bonds and Notes (Cost $379,824,834) | | | | | | | | | 380,632,920 | |
| | | |
| | | | | Shares | | | | |
Preferred Stock—0.0% | |
| Claire’s Holdings LLC, 0.00%, Series A17(Cost $36,875) | | | | | 71 | | | | 11,360 | |
| | | | | | | | | | |
Common Stocks—0.1% | |
| Claire’s Holdings LLC17 | | | | | 235 | | | | 152,750 | |
| Clear Channel Outdoor Holdings, Inc., Cl. A17 | | | | | 46,536 | | | | 133,093 | |
| Hexion Holdings Corp., Cl. B17 | | | | | 25,804 | | | | 310,938 | |
JSC Astana Finance
(Cost $0, Acquisition Date 6/5/15), GDR2,15,17 | | | | | 446,838 | | | | — | |
| Quicksilver Resources, Inc.15,17 | | | | | 4,151,000 | | | | — | |
| Sabine Oil & Gas Holdings, Inc. | | | | | 837 | | | | 58,800 | |
Total Common Stocks
(Cost $5,329,461) | | | | | | | | | 655,581 | |
| | | | | | | | | | |
| | | | | Units | | | Value | |
Rights, Warrants and Certificates—0.0% | |
| Agro Holdings, Inc. Wts., Exp. 4/10/2415,17 | | | | | 775 | | | $ | — | |
| Sabine Oil Tranche 1 Wts., Strike Price $4.49, | | | | | | | | | | |
| Exp. 8/11/2617 | | | | | 2,612 | | | | 34,165 | |
| Sabine Oil Tranche 2 Wts., Strike Price $2.72, Exp. 8/11/2617 | | | | | 549 | | | | 6,382 | |
| Total Rights, Warrants and Certificates (Cost $351,214) | | | | | | | | | 40,547 | |
| | | |
| | | | | Principal Amount | | | | |
Structured Securities—0.6% | |
| Deutsche Bank AG, Coriolanus Ltd. Sec. Credit Linked Bonds: | | | | | | | | | | |
| 3.003% Sr. Sec. Nts., 4/30/252,8 | | | | | 746,096 | | | | 715,552 | |
| 3.054% Sr. Sec. Nts., 4/30/252,8 | | | | | 950,642 | | | | 911,724 | |
| 3.098% Sr. Sec. Nts., 4/30/252,8 | | | | | 820,727 | | | | 787,128 | |
| 3.131% Sr. Sec. Nts., 4/30/252,8 | | | | | 733,626 | | | | 703,593 | |
| 3.179% Sr. Sec. Nts., 4/30/252,8 | | | | | 913,424 | | | | 876,030 | |
| 3.231% Sr. Sec. Nts., 4/30/252,8 | | | | | 1,042,535 | | | | 999,856 | |
| 3.265% Sr. Sec. Nts., 4/30/252,8 | | | | | 832,863 | | | | 798,768 | |
| 3.346% Sr. Sec. Nts., 4/30/252,8 | | | | | 782,856 | | | | 750,808 | |
Total Structured Securities
(Cost $5,913,362) | | | | | | | | | 6,543,459 | |
Short-Term Notes—0.5% | |
| Arab Republic of Egypt Treasury Bills, 17.01%, 5/5/208 | | | | | EGP 53,600,000 | | | | 3,202,261 | |
| Argentine Republic Treasury Bills, 4.971%, 5/29/208 | | | | | ARS 166,600,000 | | | | 2,340,781 | |
| Total Short-Term Notes (Cost $7,520,694) | | | | 5,543,042 | |
| | | |
| | | | | Shares | | | | |
Investment Companies—14.7% | |
| Carlyle Tactical Private Credit Fund18 | | | | | 71,869 | | | | 664,049 | |
| Invesco Government & Agency Portfolio, Institutional Class, 1.50%19 | | | | | 111,331,442 | | | | 111,331,442 | |
| Invesco Oppenheimer Limited-Term Bond Fund18 | | | | | 2,166 | | | | 9,920 | |
| Invesco Oppenheimer Master Event-Linked Bond Fund18 | | | | | 1,564,541 | | | | 25,095,080 | |
| Invesco Oppenheimer Ultra-Short Duration Fund18 | | | | | 5,234,532 | | | | 26,120,338 | |
| Nuveen Floating Rate Income Fund | | | | | 329,965 | | | | 3,378,842 | |
| Total Investment Companies (Cost $170,845,254) | | | | 166,599,671 | |
| | | | | | | | | | | | | | | | | | | | | | | | | | | | | | | | |
| | | | | | | | | Exercise Price | | | Expiration
Date | | �� | | | | Contracts | | | Notional
Amount (000’s) | | | Value | |
Exchange-Traded Options Purchased—0.0% | |
| S&P 500 Index Put | | | | | | | USD | | | | 2,675.000 | | | | 3/20/20 | | | | USD | | | | 166 | | | | USD 44,405 | | | | 107,900 | |
| S&P 500 Index Put | | | | | | | USD | | | | 2,625.000 | | | | 2/21/20 | | | | USD | | | | 88 | | | | USD 23,100 | | | | 20,240 | |
| S&P 500 Index Put | | | | | | | USD | | | | 2,955.000 | | | | 2/21/20 | | | | USD | | | | 275 | | | | USD 81,263 | | | | 313,500 | |
Total Exchange-Traded Options Purchased
(Cost $3,050,749) | | | | | | | | | | | | | | | | | | | | | | | | 441,640 | |
| | | | | | | | |
| | | Counterparty | | | | | | Exercise Price | | | Expiration
Date | | | | | | Contracts | | | Notional
Amount (000’s) | | | | |
Over-the-Counter Options Purchased—1.0% | |
| BRL Currency Put | | | MSCO | | | | BRL | | | | 4.000 | | | | 5/27/20 | | | | USD | | | | 25,000,000 | | | | USD 25,000 | | | | 520,525 | |
| BRL Currency Put | | | GSCO-OT | | | | BRL | | | | 3.432 | | | | 3/27/20 | | | | USD | | | | 1,460,000 | | | | USD 1,460 | | | | 2,372 | |
| BRL Currency Put | | | GSCO-OT | | | | BRL | | | | 3.430 | | | | 3/30/20 | | | | USD | | | | 1,457,000 | | | | USD 1,457 | | | | 2,619 | |
| BRL Currency Put | | | GSCO-OT | | | | BRL | | | | 3.430 | | | | 3/30/20 | | | | USD | | | | 1,457,000 | | | | USD 1,457 | | | | 2,619 | |
| BRL Currency Put | | | MSCO | | | | BRL | | | | 4.080 | | | | 5/11/20 | | | | USD | | | | 18,750,000 | | | | USD 18,750 | | | | 571,870 | |
| BRL Currency Put | | | JPM | | | | BRL | | | | 3.970 | | | | 1/24/20 | | | | USD | | | | 12,500,000 | | | | USD 12,500 | | | | 64,808 | |
| CAD Currency Call | | | SCB | | | | CAD | | | | 1.338 | | | | 2/5/20 | | | | USD | | | | 25,000,000 | | | | USD 25,000 | | | | 6,122 | |
| CAD Currency Put | | | SCB | | | | CAD | | | | 1.295 | | | | 2/5/20 | | | | USD | | | | 25,000,000 | | | | USD 25,000 | | | | 109,800 | |
| CLP Currency Put | | | JPM | | | | CLP | | | | 699.000 | | | | 1/17/20 | | | | USD | | | | 25,000,000 | | | | USD 25,000 | | | | 436 | |
| CLP Currency Put | | | GSCOI | | | | CLP | | | | 738.000 | | | | 2/5/20 | | | | USD | | | | 25,000,000 | | | | USD 25,000 | | | | 166,431 | |
| EUR Currency Put | | | BOA | | | | USD | | | | 1.094 | | | | 2/17/20 | | | | EUR | | | | 11,250,000 | | | | EUR 11,250 | | | | 6,660 | |
| EUR Currency Call | | | BOA | | | | USD | | | | 1.132 | | | | 2/17/20 | | | | EUR | | | | 11,250,000 | | | | EUR 11,250 | | | | 64,103 | |
| EUR Currency Put | | | BOA | | | | INR | | | | 82.250 | | | | 11/3/20 | | | | EUR | | | | 25,000,000 | | | | EUR 25,000 | | | | 418,536 | |
| EUR Currency Put | | | SCB | | | | IDR | | | | 16,100.000 | | | | 12/17/20 | | | | EUR | | | | 25,000,000 | | | | EUR 25,000 | | | | 566,271 | |
| EUR Currency Put | | | JPM | | | | NOK | | | | 8.900 | | | | 8/26/21 | | | | EUR | | | | 3,750,000 | | | | EUR 3,750 | | | | 574,916 | |
24 INVESCO OPPENHEIMER V.I. GLOBAL STRATEGIC INCOME FUND
| | | | | | | | | | | | | | | | | | | | | | | | | | | | | | | | |
| | | Counterparty | | | | | | Exercise Price | | | Expiration
Date | | | | | | Contracts | | | Notional
Amount
(000’s) | | | Value | |
Over-the-Counter Options Purchased (Continued) | |
| EUR Currency Put | | | MSCO | | | | NOK | | | | 9.757 | | | | 8/20/20 | | | | EUR | | | | 45,000,000 | | | | EUR 45,000 | | | $ | 527,901 | |
| EUR Currency Put | | | BOA | | | | SEK | | | | 9.250 | | | | 4/29/20 | | | | EUR | | | | 2,800,000 | | | | EUR 2,800 | | | | 24 | |
| EUR Currency Put | | | GSCO-OT | | | | INR | | | | 74.875 | | | | 8/5/20 | | | | EUR | | | | 1,500,000 | | | | EUR 1,500 | | | | 201,492 | |
| EUR Currency Put | | | GSCO-OT | | | | NOK | | | | 8.648 | | | | 1/6/21 | | | | EUR | | | | 3,650,000 | | | | EUR 3,650 | | | | 93,829 | |
| EUR Currency Put | | | GSCO-OT | | | | NOK | | | | 8.360 | | | | 1/6/21 | | | | EUR | | | | 3,650,000 | | | | EUR 3,650 | | | | 20,560 | |
| EUR Currency Put | | | GSCOI | | | | RUB | | | | 70.480 | | | | 11/4/20 | | | | EUR | | | | 27,400,000 | | | | EUR 27,400 | | | | 487,537 | |
| IDR Currency Put | | | JPM | | | | IDR | | | | 14,420.000 | | | | 10/26/20 | | | | USD | | | | 12,500,000 | | | | USD 12,500 | | | | 374,116 | |
| IDR Currency Put | | | SCB | | | | IDR | | | | 14,400.000 | | | | 10/22/20 | | | | USD | | | | 25,000,000 | | | | USD 25,000 | | | | 723,784 | |
| IDR Currency Put | | | GSCOI | | | | IDR | | | | 14,435.000 | | | | 10/22/20 | | | | USD | | | | 18,750,000 | | | | USD 18,750 | | | | 572,702 | |
| INR Currency Put | | | JPM | | | | INR | | | | 66.092 | | | | 4/29/20 | | | | USD | | | | 1,500,000 | | | | USD 1,500 | | | | 5,312 | |
| INR Currency Put | | | GSCO-OT | | | | INR | | | | 65.600 | | | | 5/6/20 | | | | USD | | | | 2,280,000 | | | | USD 2,280 | | | | 5,659 | |
| INR Currency Put | | | BOA | | | | INR | | | | 72.500 | | | | 10/27/20 | | | | USD | | | | 25,000,000 | | | | USD 25,000 | | | | 317,935 | |
| MXN Currency Put | | | JPM | | | | MXN | | | | 19.375 | | | | 6/2/20 | | | | USD | | | | 295,550,000 | | | | USD 295,550 | | | | 317,710 | |
| MXN Currency Put | | | CITNA-B | | | | MXN | | | | 19.350 | | | | 6/2/20 | | | | USD | | | | 295,200,000 | | | | USD 295,200 | | | | 306,282 | |
| MXN Currency Put | | | BOA | | | | MXN | | | | 19.135 | | | | 3/12/20 | | | | USD | | | | 25,000,000 | | | | USD 25,000 | | | | 323,486 | |
| PHP Currency Put | | | SCB | | | | PHP | | | | 50.450 | | | | 3/5/20 | | | | USD | | | | 18,750,000 | | | | USD 18,750 | | | | 90,453 | |
| PHP Currency Put | | | GSCO-OT | | | | PHP | | | | 50.200 | | | | 2/4/20 | | | | USD | | | | 6,250,000 | | | | USD 6,250 | | | | 11,871 | |
| PHP Currency Put | | | GSCO-OT | | | | PHP | | | | 50.100 | | | | 2/11/20 | | | | USD | | | | 15,625,000 | | | | USD 15,625 | | | | 28,539 | |
| RUB Currency Put | | | JPM | | | | RUB | | | | 59.000 | | | | 8/5/20 | | | | USD | | | | 1,650,000 | | | | USD 1,650 | | | | 555,897 | |
| RUB Currency Put | | | GSCO-OT | | | | RUB | | | | 57.300 | | | | 3/30/20 | | | | USD | | | | 2,914,000 | | | | USD 2,914 | | | | 85,003 | |
| RUB Currency Put | | | JPM | | | | RUB | | | | 70.000 | | | | 2/25/21 | | | | USD | | | | 1,535,200,000 | | | | USD 1,535,200 | | | | 2,134,465 | |
| RUB Currency Put | | | GSCO-OT | | | | RUB | | | | 58.500 | | | | 8/4/20 | | | | USD | | | | 1,650,000 | | | | USD 1,650 | | | | 445,658 | |
| ZAR Currency Put | | | GSCO-OT | | | | ZAR | | | | 14.500 | | | | 7/23/20 | | | | USD | | | | 229,950,000 | | | | USD 229,950 | | | | 729,059 | |
| Total Over-the-Counter Options Purchased (Cost $14,020,810) | | | | | | | | | | | | | | | | 11,437,362 | |
| | | | | | | | | | | | | | | | | | | | | | | | | | | | | | | | |
| | | Counterparty | | | Buy /Sell
Protection | | | Reference Asset | | | Fixed Rate | | | Expiration Date | | | Notional Amount (000’s) | | | | |
Over-the-Counter Credit Default Swaptions Purchased—0.0% | | | | | | | | | | | | | | | | | | | | | |
Credit Default Swap maturing 12/20/24 Call | | | JPM | | | | Buy | | |
| iTraxx Europe
Crossover Series 32
Version 1 |
| | | 5.000% | | | | 2/19/20 | | | | EUR | | | | 37,500 | | | | 41,340 | |
Credit Default Swap maturing 12/20/24 Call | | | JPM | | | | Buy | | |
| Markit CDX North
America High Yield
Index, Series 31,
Version 1 |
| | | 5.000 | | | | 2/19/20 | | | | USD | | | | 50,000 | | | | 183,406 | |
Credit Default Swap maturing 12/20/24 Call | | | JPM | | | | Buy | | |
| Markit CDX North
America High Yield
Index, Series 31,
Version 1 |
| | | 5.000 | | | | 2/19/20 | | | | USD | | | | 17,000 | | | | 57,248 | |
| Total Over-the-Counter Credit Default Swaptions Purchased (Cost $768,950) | | | | | | | | | | | | | | | | 281,994 | |
| | | | | | | | | | | | | | | | | | | | | | | | | | | | | | | | |
| | | Counterparty | | | Pay / Receive
Floating Rate | | | Floating Rate | | | Fixed Rate | | | Expiration
Date | | | Notional Amount (000’s) | | | | |
Over-the-Counter Interest Rate Swaptions Purchased—0.7% | |
Interest Rate Swap maturing 11/25/21 Put | | | MSCO | | | | Receive | | |
| Six-Month EUR
EURIBOR |
| | | 0.532 | | | | 11/25/21 | | | | EUR | | | | 9,375 | | | | 218,603 | |
Interest Rate Swap maturing 11/27/20 Put | | | JPM | | | | Receive | | |
| Three-Month USD
BBA LIBOR |
| | | 1.700 | | | | 11/27/20 | | | | USD | | | | 63,000 | | | | 2,170,443 | |
Interest Rate Swap maturing 12/2/20 Put | | | GSCOI | | | | Receive | | |
| Three-Month USD
BBA LIBOR |
| | | 2.266 | | | | 12/2/20 | | | | USD | | | | 45,000 | | | | 452,074 | |
Interest Rate Swap maturing 12/3/21 Put | | | MSCO | | | | Receive | | |
| Three-Month USD
BBA LIBOR |
| | | 3.000 | | | | 12/3/21 | | | | USD | | | | 25,000 | | | | 318,195 | |
Interest Rate Swap Maturing 3/29/21 Put | | | JPM | | | | Receive | | |
| Six-Month EUR
EURIBOR |
| | | 1.122 | | | | 3/29/21 | | | | EUR | | | | 146,200 | | | | 67,196 | |
Interest Rate Swap Maturing 3/30/20 Put | | | BOA | | | | Receive | | |
| Three-Month CAD BA
CDOR |
| | | 2.588 | | | | 3/30/20 | | | | CAD | | | | 195,000 | | | | 64,282 | |
Interest Rate Swap Maturing 4/12021 Put | | | JPM | | | | Receive | | |
| Six-Month EUR
EURIBOR |
| | | 0.615 | | | | 4/12/21 | | | | EUR | | | | 146,250 | | | | 13,990 | |
Interest Rate Swap Maturing 4/6/21 Put | | | JPM | | | | Receive | | |
| Six-Month EUR
EURIBOR |
| | | 0.608 | | | | 4/6/21 | | | | EUR | | | | 146,000 | | | | 13,532 | |
| Interest Rate Swap maturing 6/15/20 Put | | | NOM | | | | Receive | | |
| Three-Month USD
BBA LIBOR |
| | | 1.850 | | | | 6/15/20 | | | | USD | | | | 75,000 | | | | 1,391,627 | |
| Interest Rate Swap maturing 8/16/24 Put | | | JPM | | | | Receive | | | | CDX.NA.HY.33 | | | | 2.098 | | | | 8/16/24 | | | | EUR | | | | 30,000 | | | | 637,555 | |
| Interest Rate Swap maturing 8/17/20 Put | | | MSCO | | | | Receive | | |
| Three-Month USD
BBA LIBOR |
| | | 1.695 | | | | 8/17/20 | | | | USD | | | | 52,500 | | | | 1,602,796 | |
Interest Rate Swap maturing 8/26/20 Put | | | MSCO | | | | Receive | | |
| Three-Month USD
BBA LIBOR |
| | | 2.500 | | | | 8/26/20 | | | | USD | | | | 75,000 | | | | 253,989 | |
25 INVESCO OPPENHEIMER V.I. GLOBAL STRATEGIC INCOME FUND
CONSOLIDATED SCHEDULE OF INVESTMENTSContinued
| | | | | | | | | | | | | | | | | | | | | | | | | | | | | | | | |
| | | Counterparty | | | Pay / Receive
Floating Rate | | | Floating Rate | | | Fixed Rate | | | Expiration
Date | | | Notional Amount (000’s) | | | Value | |
Over-the-Counter Interest Rate Swaptions Purchased (Continued) | |
| Interest Rate Swap maturing | | | | | | | | | | | | | | | | | | | | | | | | | | | | | | | | |
| 8/28/20 Put | | | GSCOI | | | | Receive | | | | Three-Month KRW CD | | | | 2.000 | % | | | 8/28/20 | | | | KRW | | | | 36,000,000 | | | $ | 67,472 | |
| Interest Rate Swap maturing | | | | | | | | | | | Three-Month USD | | | | | | | | | | | | | | | | | | | | | |
| 1/9/20 Call | | | GSCOI | | | | Pay | | | | BBA LIBOR | | | | 1.600 | | | | 1/9/20 | | | | USD | | | | 231,600 | | | | 16,594 | |
Total Over-the-Counter Interest Rate Swaptions Purchased (Cost $6,803,510) | | | | | | | | | | | | | | | | 7,288,348 | |
Total Investments, at Value (Cost $1,194,745,982) | | | | | | | | | | | | | | | | 103.6 | % | | | 1,172,357,030 | |
Net Other Assets (Liabilities) | | | | | | | | | | | | | | | | | | | | (3.6 | ) | | | (40,694,443 | ) |
| | | | | | | | | | | | | | | | | | | | | | | | | | | | |
Net Assets | | | | | | | | | | | | | | | | | | | | | | | | | | | 100.0 | % | | $ | 1,131,662,587 | |
| | | | | | | | | | | | | | | | | | | | | | | | | | | | |
| | | | | | | | | | | | | | | | | | | | | | | | | | | | |
Consolidated Footnotes to Schedule of Investments
1. All or a portion of this security is owned by the subsidiary.
2. Security purchased or received in a transaction exempt from registration under the Securities Act of 1933, as amended (the “1933 Act”). The security may be resold pursuant to an exemption from registration under the 1933 Act, typically to qualified institutional buyers. The aggregate value of these securities at December 31, 2019 was $508,785,208, which represented 44.96% of the Fund’s Net Assets.
3. Represents the current interest rate for a variable or increasing rate security, which may be fixed for a predetermined period. The interest rate is, or will be as of an established date, determined as [Referenced Rate + Basis-point spread].
4. Interest-Only Strips represent the right to receive the monthly interest payments on an underlying pool of mortgage loans. These securities typically decline in price as interest rates decline. Most other fixed income securities increase in price when interest rates decline. The principal amount of the underlying pool represents the notional amount on which current interest is calculated. The price of these securities is typically more sensitive to changes in prepayment rates than traditional mortgage-backed securities (for example, GNMA pass-throughs). Interest rates disclosed represent current yields based upon the current cost basis and estimated timing and amount of future cash flows. These securities amount to $4,385,203 or 0.39% of the Fund’s net assets at period end.
5. Interest rate is less than 0.0005%.
6. All or a portion of the security position is when-issued or delayed delivery to be delivered and settled after period end. See Note 1 of the accompanying Consolidated Notes to Financial Statements.
7. This interest rate resets periodically. Interest rate shown reflects the rate in effect at period end. The rate on this variable rate security is not based on a published reference rate and spread but is determined by the issuer or agent based on current market conditions.
8. Zero coupon bond reflects effective yield on the original acquisition date.
9. Denotes an inflation-indexed security: coupon or principal are indexed to a consumer price index.
10. Variable rate senior loan interests often require prepayments from excess cash flow or permit the borrower to repay at its election. The degree to which borrowers repay, whether as a contractual requirement or at their election, cannot be predicted with accuracy. As a result, the actual remaining maturity may be substantially less than the stated maturities shown. However, it is anticipated that the variable rate senior loan interests will have an expected average life of three to five years.
11. Variable rate senior loan interests are, at present, not readily marketable, not registered under the Securities Act of 1933, as amended (the “1933 Act”), and may be subject to contractual and legal restrictions on sale. Variable rate senior loan interests in the Fund’s portfolio generally have variable rates which adjust to a base, such as the London Interbank Offered Rate (“LIBOR”), on set dates, typically every 30 days but not greater than one year; and/or have interest rates that float at a margin above a widely recognized base lending rate such as the Prime Rate of a designated U.S. bank.
12. This security is not accruing income because the issuer has missed an interest payment on it and/or is not anticipated to make future interest and or principal payments. The rate shown is the original contractual interest rate.
13. Interest or dividend is paid-in-kind, when applicable.
14. Security received as the result of issuer reorganization.
15. The value of this security was determined using significant unobservable inputs. See Note 3 of the accompanying Consolidated Notes to Financial Statements.
16. This bond has no contractual maturity date, is not redeemable and contractually pays an indefinite stream of interest.
| 17. | Non-income producing security. |
18. Is or was an affiliate, as defined in the Investment Company Act of 1940, as amended, at or during the reporting period, by virtue of the Fund owning at least 5% of the voting securities of the issuer or as a result of the Fund and the issuer having the same investment adviser. Transactions during the reporting period in which the issuer was an affiliate are as follows:
| | | | | | | | | | | | | | | | |
| | | Shares
December 31, 2018 | | | Gross Additions | | | Gross Reductions | | | Shares
December 31, 2019 | |
Investment Company | | | | | | | | | | | | | | | | |
| Carlyle Tactical Private Credit Fund | | | — | | | | 140,799 | | | | 68,930 | | | | 71,869 | |
| Invesco Oppenheimer Limited-Term Bond Fund | | | 1,654,825 | | | | 122,663 | | | | 1,775,322 | | | | 2,166 | |
| Invesco Oppenheimer Master Event-Linked Bond Fund | | | 1,954,233 | | | | — | | | | 389,692 | | | | 1,564,541 | |
| Invesco Oppenheimer Master Loan Fund | | | 8,607,367 | | | | — | | | | 8,607,367 | | | | — | |
| Invesco Oppenheimer Ultra-Short Duration Fund | | | 10,238,165 | | | | 242,379 | | | | 5,246,012 | | | | 5,234,532 | |
| | | | |
| | | Value | | | Income | | | Realized
Gain (Loss) | | | Change in Unrealized
Gain (Loss) | |
Investment Company | | | | | | | | | | | | | | | | |
| Carlyle Tactical Private Credit Fund | | $ | 664,049 | | | $ | 93,029 | | | $ | (29,640 | ) | | $ | (38,352) | |
| Invesco Oppenheimer Limited-Term Bond Fund | | | 9,920 | | | | 195,233 | | | | 219,616 | | | | (16,503) | |
| Invesco Oppenheimer Master Event-Linked Bond Fund | | | 25,095,080 | | | | 2,175,405 | a,b | | | (1,289,008 | )a | | | 659,058a | |
| Invesco Oppenheimer Master Loan Fund | | | — | | | | 1,789,921 | c,d | | | (6,354,754 | )c | | | 9,620,511c | |
| Invesco Oppenheimer Ultra-Short Duration Fund | | | 26,120,338 | | | | 1,211,754 | | | | (72,901 | ) | | | 102,764 | |
| | | | |
| Total | | $ | 51,889,387 | | | $ | 5,465,342 | | | $ | (7,526,687 | ) | | $ | 10,327,478 | |
| | | | |
a. Represents the amount allocated to the Fund from Invesco Oppenheimer Master Event-Linked Bond Fund.
b. Net of expenses allocated to the Fund from Invesco Oppenheimer Master Event-Linked Bond Fund.
c. Represents the amount allocated to the Fund from Invesco Oppenheimer Master Loan Fund.
d. Net of expenses allocated to the Fund from Invesco Oppenheimer Master Loan Fund.
19. The money market fund and the Fund are affiliated by having the same investment adviser. The rate shown is the 7-day SEC standardized yield as of December 31, 2019.
26 INVESCO OPPENHEIMER V.I. GLOBAL STRATEGIC INCOME FUND
Distribution of investments representing geographic holdings, as a percentage of total investments at value, is as follows:
| | | | | | |
| Geographic Holdings | | Value | | | Percent |
| United States | | $ | 572,530,037 | | | 48.8% |
| United Kingdom | | | 62,769,221 | | | 5.4 |
| India | | | 43,622,053 | | | 3.7 |
| Italy | | | 38,054,999 | | | 3.2 |
| Indonesia | | | 37,882,906 | | | 3.2 |
| Mexico | | | 30,910,945 | | | 2.6 |
| South Africa | | | 28,922,575 | | | 2.5 |
| Greece | | | 28,893,469 | | | 2.5 |
| Egypt | | | 27,213,980 | | | 2.3 |
| Brazil | | | 25,947,185 | | | 2.2 |
| Russia | | | 23,560,676 | | | 2.0 |
| Portugal | | | 22,341,318 | | | 1.9 |
| China | | | 19,767,428 | | | 1.7 |
| France | | | 17,163,555 | | | 1.5 |
| Argentina | | | 16,314,428 | | | 1.4 |
| Ireland | | | 14,703,900 | | | 1.3 |
| Switzerland | | | 13,082,101 | | | 1.1 |
| Spain | | | 11,334,473 | | | 1.0 |
| Netherlands | | | 9,389,177 | | | 0.8 |
| Turkey | | | 9,113,660 | | | 0.8 |
| Canada | | | 8,136,755 | | | 0.7 |
| Luxembourg | | | 8,023,966 | | | 0.7 |
| Sri Lanka | | | 7,838,648 | | | 0.7 |
| Dominican Republic | | | 7,183,032 | | | 0.6 |
| Thailand | | | 5,790,908 | | | 0.5 |
| Senegal | | | 5,312,046 | | | 0.5 |
| Panama | | | 5,294,140 | | | 0.5 |
| Ukraine | | | 5,010,885 | | | 0.4 |
| Colombia | | | 4,759,214 | | | 0.4 |
| Macau | | | 4,667,708 | | | 0.4 |
| Chile | | | 4,532,662 | | | 0.4 |
| Oman | | | 4,406,490 | | | 0.4 |
| Hong Kong | | | 3,646,793 | | | 0.3 |
| Angola | | | 3,523,860 | | | 0.3 |
| Ivory Coast | | | 3,394,446 | | | 0.3 |
| Austria | | | 3,372,401 | | | 0.3 |
| Peru | | | 2,610,541 | | | 0.2 |
| Sweden | | | 2,523,574 | | | 0.2 |
| Paraguay | | | 2,488,450 | | | 0.2 |
| New Zealand | | | 2,356,467 | | | 0.2 |
| Cyprus | | | 1,982,443 | | | 0.2 |
| Mauritius | | | 1,764,970 | | | 0.1 |
| Morocco | | | 1,683,525 | | | 0.1 |
| Kazakhstan | | | 1,671,055 | | | 0.1 |
| Singapore | | | 1,509,566 | | | 0.1 |
| El Salvador | | | 1,458,101 | | | 0.1 |
| Zambia | | | 1,436,747 | | | 0.1 |
| United Arab Emirates | | | 1,380,533 | | | 0.1 |
| Kenya | | | 1,356,138 | | | 0.1 |
| Norway | | | 1,217,207 | | | 0.1 |
| Czech Republic | | | 1,179,748 | | | 0.1 |
| Denmark | | | 1,159,580 | | | 0.1 |
| Philippines | | | 1,056,256 | | | 0.1 |
| Supranational | | | 1,024,664 | | | 0.1 |
| Germany | | | 1,004,820 | | | 0.1 |
| Eurozone | | | 992,216 | | | 0.1 |
| Nigeria | | | 735,506 | | | 0.1 |
| Belgium | | | 651,283 | | | 0.1 |
| Ecuador | | | 262,299 | | | 0.0 |
| Cayman Islands | | | 248,750 | | | 0.0 |
| Australia | | | 123,079 | | | 0.0 |
| South Korea | | | 67,472 | | | 0.0 |
| | | |
| Total | | $ | 1,172,357,030 | | | 100.0% |
| | | |
27 INVESCO OPPENHEIMER V.I. GLOBAL STRATEGIC INCOME FUND
CONSOLIDATED SCHEDULE OF INVESTMENTSContinued
| | | | | | | | | | | | | | | | | | | | | | | | | | | | |
Forward Currency Exchange Contracts as of December 31, 2019 | |
| | | | | | | | | | | | | | | | | | Unrealized | | | Unrealized | |
| Counterparty | | Settlement Month(s) | | | Currency Purchased (000’s) | | | | | | Currency Sold (000’s) | | | Appreciation | | | Depreciation | |
| BAC | | | 05/2020 | | | | CLP | | | | 596,900 | | | | USD | | | | 871 | | | $ | — | | | $ | (76,229 | ) |
| BOA | | | 01/2020 | | | | EUR | | | | 3,730 | | | | USD | | | | 4,117 | | | | 73,759 | | | | — | |
| BOA | | | 01/2020 - 03/2020 | | | | IDR | | | | 194,607,000 | | | | USD | | | | 13,546 | | | | 466,363 | | | | — | |
| BOA | | | 01/2020 | | | | JPY | | | | 285,000 | | | | USD | | | | 2,669 | | | | — | | | | (41,866 | ) |
| BOA | | | 01/2020 | | | | NOK | | | | 38,280 | | | | USD | | | | 4,205 | | | | 155,780 | | | | — | |
| BOA | | | 01/2020 | | | | NZD | | | | 3,900 | | | | USD | | | | 2,472 | | | | 154,254 | | | | — | |
| BOA | | | 03/2020 | | | | RUB | | | | 474,873 | | | | USD | | | | 7,358 | | | | 223,921 | | | | — | |
| BOA | | | 01/2020 | | | | SEK | | | | 168,440 | | | | USD | | | | 17,195 | | | | 811,920 | | | | — | |
| BOA | | | 01/2020 | | | | USD | | | | 29,203 | | | | EUR | | | | 26,475 | | | | — | | | | (543,912 | ) |
| BOA | | | 01/2020 | | | | USD | | | | 15,363 | | | | GBP | | | | 12,355 | | | | — | | | | (1,015,524 | ) |
| BOA | | | 03/2020 | | | | USD | | | | 3 | | | | KRW | | | | 3,360 | | | | — | | | | (47 | ) |
| BOA | | | 03/2020 | | | | USD | | | | 5,375 | | | | MXN | | | | 103,912 | | | | — | | | | (60,456 | ) |
| BOA | | | 01/2020 | | | | USD | | | | 17,576 | | | | SEK | | | | 168,440 | | | | — | | | | (430,910 | ) |
| BOA | | | 03/2020 | | | | USD | | | | 2,256 | | | | TRY | | | | 13,530 | | | | 24,056 | | | | — | |
| BOA | | | 03/2020 | | | | USD | | | | 16,348 | | | | ZAR | | | | 248,000 | | | | — | | | | (1,192,993 | ) |
| BOA | | | 03/2020 | | | | ZAR | | | | 238,000 | | | | USD | | | | 15,975 | | | | 858,837 | | | | — | |
| CITNA-B | | | 02/2020 - 05/2020 | | | | CLP | | | | 4,504,435 | | | | USD | | | | 6,173 | | | | 72,932 | | | | (249,136 | ) |
| CITNA-B | | | 01/2020 | | | | EUR | | | | 2,635 | | | | USD | | | | 2,917 | | | | 43,264 | | | | — | |
| CITNA-B | | | 03/2020 | | | | IDR | | | | 131,902,000 | | | | USD | | | | 9,312 | | | | 164,574 | | | | — | |
| CITNA-B | | | 03/2020 | | | | MXN | | | | 18,698 | | | | USD | | | | 926 | | | | 51,991 | | | | — | |
| CITNA-B | | | 01/2020 | | | | NOK | | | | 182,250 | | | | USD | | | | 19,993 | | | | 768,501 | | | | — | |
| CITNA-B | | | 02/2020 - 03/2020 | | | | USD | | | | 10,012 | | | | CLP | | | | 7,681,312 | | | | — | | | | (210,840 | ) |
| CITNA-B | | | 01/2020 | | | | USD | | | | 96,913 | | | | EUR | | | | 87,495 | | | | — | | | | (1,394,056 | ) |
| CITNA-B | | | 01/2020 | | | | USD | | | | 30,889 | | | | GBP | | | | 24,760 | | | | — | | | | (1,933,661 | ) |
| CITNA-B | | | 03/2020 | | | | USD | | | | 34,476 | | | | IDR | | | | 488,351,000 | | | | — | | | | (609,316 | ) |
| CITNA-B | | | 03/2020 | | | | USD | | | | 18,995 | | | | MXN | | | | 381,563 | | | | — | | | | (960,732 | ) |
| CITNA-B | | | 03/2020 | | | | USD | | | | 15,572 | | | | RUB | | | | 1,001,900 | | | | — | | | | (424,251 | ) |
| GSCO-OT | | | 03/2021 | | | | BRL | | | | 40,000 | | | | USD | | | | 9,643 | | | | 35,115 | | | | — | |
| GSCO-OT | | | 02/2020 | | | | CLP | | | | 2,554,435 | | | | USD | | | | 3,250 | | | | 148,603 | | | | — | |
| GSCO-OT | | | 11/2020 | | | | EUR | | | | 2,700 | | | | RUB | | | | 198,748 | | | | 83,568 | | | | (85,515 | ) |
| GSCO-OT | | | 01/2020 - 01/2021 | | | | EUR | | | | 82,059 | | | | USD | | | | 94,337 | | | | 422,594 | | | | (1,757,158 | ) |
| GSCO-OT | | | 06/2020 | | | | IDR | | | | 37,614,063 | | | | USD | | | | 2,598 | | | | 76,607 | | | | — | |
| GSCO-OT | | | 05/2020 | | | | INR | | | | 1,571,866 | | | | USD | | | | 21,660 | | | | 90,716 | | | | — | |
| GSCO-OT | | | 03/2020 | | | | MXN | | | | 227,288 | | | | USD | | | | 11,875 | | | | 12,204 | | | | — | |
| GSCO-OT | | | 03/2020 | | | | MYR | | | | 760 | | | | USD | | | | 182 | | | | 3,613 | | | | — | |
| GSCO-OT | | | 02/2021 | | | | RUB | | | | 690,200 | | | | USD | | | | 10,140 | | | | 479,684 | | | | — | |
| GSCO-OT | | | 02/2020 - 03/2020 | | | | TRY | | | | 36,400 | | | | USD | | | | 6,112 | | | | — | | | | (90,804 | ) |
| GSCO-OT | | | 03/2020 - 03/2021 | | | | USD | | | | 32,531 | | | | BRL | | | | 133,434 | | | | 35,136 | | | | (319,275 | ) |
| GSCO-OT | | | 05/2020 | | | | USD | | | | 6,547 | | | | CLP | | | | 4,500,000 | | | | 552,801 | | | | — | |
| GSCO-OT | | | 01/2020 - 05/2020 | | | | USD | | | | 10,144 | | | | EUR | | | | 8,844 | | | | 177,976 | | | | (25,258 | ) |
| GSCO-OT | | | 10/2020 | | | | USD | | | | 9,100 | | | | IDR | | | | 133,542,500 | | | | — | | | | (259,906 | ) |
| GSCO-OT | | | 05/2020 - 08/2020 | | | | USD | | | | 36,307 | | | | INR | | | | 2,655,716 | | | | — | | | | (281,965 | ) |
| GSCO-OT | | | 03/2020 | | | | USD | | | | 11,186 | | | | MXN | | | | 218,600 | | | | — | | | | (246,785 | ) |
| GSCO-OT | | | 01/2021 | | | | USD | | | | 28,912 | | | | NOK | | | | 243,000 | | | | 1,237,554 | | | | — | |
| GSCO-OT | | | 01/2020 | | | | USD | | | | 19,557 | | | | NZD | | | | 30,500 | | | | — | | | | (983,392 | ) |
| GSCO-OT | | | 03/2020 | | | | USD | | | | 3,465 | | | | PLN | | | | 13,300 | | | | — | | | | (41,772 | ) |
| GSCO-OT | | | 02/2020 | | | | USD | | | | 3,425 | | | | TRY | | | | 21,200 | | | | 33,703 | | | | (122,819 | ) |
| GSCO-OT | | | 01/2020 - 03/2020 | | | | USD | | | | 22,460 | | | | ZAR | | | | 344,100 | | | | — | | | | (1,927,566 | ) |
| GSCO-OT | | | 01/2020 - 03/2020 | | | | ZAR | | | | 236,700 | | | | USD | | | | 15,399 | | | | 1,396,646 | | | | — | |
| JPM | | | 04/2020 | | | | BRL | | | | 62,647 | | | | USD | | | | 15,354 | | | | 159,031 | | | | — | |
| JPM | | | 03/2020 - 05/2020 | | | | CLP | | | | 6,512,888 | | | | USD | | | | 8,798 | | | | — | | | | (128,442 | ) |
| JPM | | | 03/2020 | | | | COP | | | | 38,203,315 | | | | USD | | | | 11,260 | | | | 319,886 | | | | — | |
| JPM | | | 01/2020 - 08/2021 | | | | EUR | | | | 100,716 | | | | USD | | | | 112,760 | | | | 1,022,152 | | | | — | |
| JPM | | | 01/2020 | | | | GBP | | | | 2,590 | | | | USD | | | | 3,292 | | | | 141,169 | | | | — | |
| JPM | | | 03/2020 - 08/2020 | | | | INR | | | | 1,700,746 | | | | USD | | | | 23,246 | | | | 218,261 | | | | (32,374 | ) |
| JPM | | | 01/2020 | | | | JPY | | | | 388,019 | | | | USD | | | | 3,626 | | | | — | | | | (49,919 | ) |
| JPM | | | 03/2020 | | | | MXN | | | | 220,352 | | | | USD | | | | 11,193 | | | | 331,128 | | | | — | |
| JPM | | | 01/2020 | | | | NOK | | | | 16,000 | | | | USD | | | | 1,752 | | | | 70,451 | | | | — | |
| JPM | | | 01/2020 | | | | NZD | | | | 23,170 | | | | USD | | | | 14,676 | | | | 927,890 | | | | — | |
| JPM | | | 03/2020 | | | | PLN | | | | 370 | | | | USD | | | | 94 | | | | 3,332 | | | | — | |
| JPM | | | 03/2020 | | | | THB | | | | 47,000 | | | | USD | | | | 1,547 | | | | 25,332 | | | | — | |
| JPM | | | 03/2020 | | | | TRY | | | | 57,500 | | | | USD | | | | 9,319 | | | | 165,246 | | | | — | |
| JPM | | | 02/2020 - 03/2020 | | | | USD | | | | 9,650 | | | | CLP | | | | 7,446,990 | | | | — | | | | (260,864 | ) |
| JPM | | | 03/2020 | | | | USD | | | | 5,972 | | | | COP | | | | 20,261,000 | | | | — | | | | (169,650 | ) |
| JPM | | | 01/2020 - 08/2020 | | | | USD | | | | 150,470 | | | | EUR | | | | 135,303 | | | | 141,572 | | | | (1,904,960 | ) |
| JPM | | | 01/2020 | | | | USD | | | | 17,496 | | | | GBP | | | | 14,090 | | | | — | | | | (1,182,252 | ) |
| JPM | | | 03/2020 | | | | USD | | | | 29 | | | | HUF | | | | 8,700 | | | | — | | | | (568 | ) |
28 INVESCO OPPENHEIMER V.I. GLOBAL STRATEGIC INCOME FUND
| | | | | | | | | | | | | | | | | | | | | | | | | | | | |
Forward Currency Exchange Contracts (Continued) | |
| | | | | | | | | | | | | | | | | | Unrealized | | | Unrealized | |
| Counterparty | | Settlement Month(s) | | | Currency Purchased (000’s) | | | | | | Currency Sold (000’s) | | | Appreciation | | | Depreciation | |
| JPM | | | 01/2020 | | | | USD | | | | 6,294 | | | | IDR | | | | 90,000,000 | | | $ | — | | | $ | (203,416 | ) |
| JPM | | | 03/2020 | | | | USD | | | | 35,052 | | | | INR | | | | 2,506,600 | | | | 131,850 | | | | — | |
| JPM | | | 01/2020 | | | | USD | | | | 13,959 | | | | JPY | | | | 1,512,610 | | | | 19,328 | | | | (2,524 | ) |
| JPM | | | 03/2020 | | | | USD | | | | 7,235 | | | | MXN | | | | 141,500 | | | | — | | | | (165,795 | ) |
| JPM | | | 08/2021 | | | | USD | | | | 18,063 | | | | NOK | | | | 162,250 | | | | — | | | | (391,447 | ) |
| JPM | | | 03/2020 | | | | USD | | | | 144 | | | | PEN | | | | 490 | | | | — | | | | (3,627 | ) |
| JPM | | | 03/2020 - 02/2021 | | | | USD | | | | 17,482 | | | | RUB | | | | 1,167,500 | | | | — | | | | (757,484 | ) |
| JPM | | | 01/2020 | | | | USD | | | | 3,794 | | | | SEK | | | | 36,400 | | | | — | | | | (97,736 | ) |
| JPM | | | 03/2020 | | | | USD | | | | 7,234 | | | | THB | | | | 220,700 | | | | — | | | | (146,923 | ) |
| JPM | | | 03/2020 | | | | USD | | | | 16,094 | | | | TRY | | | | 95,740 | | | | 301,975 | | | | — | |
| JPM | | | 03/2020 | | | | USD | | | | 32,176 | | | | ZAR | | | | 494,560 | | | | — | | | | (2,785,441 | ) |
| JPM | | | 03/2020 | | | | ZAR | | | | 338,034 | | | | USD | | | | 22,496 | | | | 1,400,264 | | | | — | |
| MSCO | | | 05/2020 | | | | CLP | | | | 978,100 | | | | USD | | | | 1,423 | | | | — | | | | (120,341 | ) |
| MSCO | | | 03/2020 | | | | USD | | | | 21,125 | | | | CLP | | | | 15,918,029 | | | | 8,148 | | | | (70,461 | ) |
| RBC | | | 01/2020 | | | | EUR | | | | 11,380 | | | | USD | | | | 12,650 | | | | 135,984 | | | | — | |
| RBC | | | 01/2020 | | | | GBP | | | | 2,700 | | | | USD | | | | 3,422 | | | | 156,780 | | | | — | |
| RBC | | | 01/2020 | | | | JPY | | | | 841,000 | | | | USD | | | | 7,916 | | | | — | | | | (164,793 | ) |
| RBC | | | 01/2020 | | | | USD | | | | 46,477 | | | | EUR | | | | 42,020 | | | | — | | | | (735,389 | ) |
| | | | | | | | | | | | | | | | | | | | | | | | |
| Total Unrealized Appreciation and Depreciation | | | | | | | $ | 14,336,451 | | | $ | (24,660,550 | ) |
| | | | | | | | | | | | | | | | | | | | | | | | |
| | | | | | | | | | | | | | | | | | | | | | | | |
| | | | | | | | | | | | | | | | | | | | | | | | | | | | |
Futures Contracts as of December 31, 2019 | |
| Description | | Buy/Sell | | | Expiration Date | | | Number of
Contracts | | | | | | Notional Amount (000’s) | | | Value | | | Unrealized
Appreciation/
(Depreciation) | |
| Canadian Bonds, 10 yr. | | | Sell | | | | 3/20/20 | | | | 355 | | | | CAD | | | | 38,357 | | | $ | 37,584,537 | | | $ | 772,935 | |
| Euro BUXL | | | Sell | | | | 3/06/20 | | | | 49 | | | | EUR | | | | 11,312 | | | | 10,903,619 | | | | 408,041 | |
| Euro-BTP | | | Sell | | | | 3/06/20 | | | | 690 | | | | EUR | | | | 110,594 | | | | 110,260,193 | | | | 333,817 | |
| United States Treasury Long Bonds | | | Sell | | | | 3/20/20 | | | | 152 | | | | USD | | | | 24,209 | | | | 23,697,750 | | | | 511,483 | |
| United States Treasury 10 Year Notes | | | Buy | | | | 3/20/20 | | | | 329 | | | | USD | | | | 42,691 | | | | 42,250,797 | | | | (439,979 | ) |
| United States Treasury 2 Year Notes | | | Sell | | | | 3/31/20 | | | | 345 | | | | USD | | | | 74,358 | | | | 74,347,500 | | | | 10,102 | |
| United States Treasury 5 Year Notes | | | Buy | | | | 3/31/20 | | | | 125 | | | | USD | | | | 14,878 | | | | 14,826,172 | | | | (52,010 | ) |
| United States Ultra Bonds | | | Buy | | | | 3/20/20 | | | | 436 | | | | USD | | | | 81,900 | | | | 79,202,125 | | | | (2,698,165 | ) |
| | | | | | | | | | | | | | | | | | | | | | | | | | | | |
| | | | | | | | | | | | | | | | | | | | | | | | | | $ | (1,153,776 | ) |
| | | | | | | | | | | | | | | | | | | | | | | | | | | | |
| | | | | | | | | | | | | | | | | | | | | | | | | | | | |
| | | | | | | | | | | | | | | | | | | | | | | | | | | | | | | | |
Exchange-Traded Options Written at December 31, 2019 | |
| Description | | | | | Exercise Price | | | Expiration Date | | | | | | Number of
Contracts | | | Notional
Amount
(000’s) | | | Premiums
Received | | | Value | |
| S&P 500 Index Put | | | USD | | | | 2,400.000 | | | | 3/20/20 | | | | USD | | | | 166 | | | | USD 39,840 | | | $ | 681,092 | | | $ | (36,105 | ) |
| S&P 500 Index Put | | | USD | | | | 2,350.000 | | | | 2/21/20 | | | | USD | | | | 88 | | | | USD 20,680 | | | | 208,288 | | | | (6,160 | ) |
| | | | | | | | | | | | | | | | | | | | | | | | | | | | |
| Total Exchange-Traded Options Written | | | | | | | | | | | | | | | | | | | $ | 889,380 | | | $ | (42,265 | ) |
| | | | | | | | | | | | | | | | | | | | | | | | | | | | |
| | | | | | | | | | | | | | | | | | | | | | | | | | | | |
| | | | | | | | | | | | | | | | | | | | | | | | | | | | | | | | |
Over-the-Counter Options Written at December 31, 2019 | |
| Description | | Counterparty | | | | | | Exercise Price | | | Expiration Date | | | Number of
Contracts | | | Notional
Amount
(000’s) | | | Premiums Received | | | Value | |
| BRL Currency Call1 | | | GSCO-OT | | | | BRL | | | | 4.500 | | | | 3/27/20 USD | | | | 1,460,000 | | | | USD 1,460 | | | $ | 254,624 | | | $ | (48,482 | ) |
| BRL Currency Call1 | | | GSCO-OT | | | | BRL | | | | 4.500 | | | | 3/30/20 USD | | | | 1,457,000 | | | | USD 1,457 | | | | 254,684 | | | | (50,476 | ) |
| BRL Currency Call1 | | | GSCO-OT | | | | BRL | | | | 4.500 | | | | 3/30/20 USD | | | | 1,457,000 | | | | USD 1,457 | | | | 254,684 | | | | (50,476 | ) |
| BRL Currency Call | | | JPM | | | | BRL | | | | 4.230 | | | | 1/24/20 USD | | | | 12,500,000 | | | | USD 12,500 | | | | 131,625 | | | | (11,101 | ) |
| BRL Currency Call | | | MSCO | | | | BRL | | | | 4.465 | | | | 5/11/20 USD | | | | 18,750,000 | | | | USD 18,750 | | | | 278,100 | | | | (78,729 | ) |
| BRL Currency Put | | | JPM | | | | BRL | | | | 3.790 | | | | 1/24/20 USD | | | | 12,500,000 | | | | USD 12,500 | | | | 57,875 | | | | (2,512 | ) |
| BRL Currency Put | | | MSCO | | | | BRL | | | | 3.827 | | | | 5/11/20 USD | | | | 18,750,000 | | | | USD 18,750 | | | | 120,937 | | | | (111,047 | ) |
| CLP Currency Call | | | GSCOI | | | | CLP | | | | 778.000 | | | | 2/5/20 USD | | | | 18,750,000 | | | | USD 18,750 | | | | 147,381 | | | | (91,668 | ) |
| CLP Currency Call | | | JPM | | | | CLP | | | | 733.000 | | | | 1/17/20 USD | | | | 25,000,000 | | | | USD 25,000 | | | | 192,500 | | | | (663,399 | ) |
| CLP Currency Put | | | GSCOI | | | | CLP | | | | 712.000 | | | | 2/5/20 USD | | | | 25,000,000 | | | | USD 25,000 | | | | 119,389 | | | | (19,837 | ) |
| COP Currency Call | | | MSCO | | | | COP | | | | 3,580.000 | | | | 2/14/20 USD | | | | 12,500,000 | | | | USD 12,500 | | | | 98,312 | | | | (12,481 | ) |
| COP Currency Put | | | MSCO | | | | COP | | | | 3,295.000 | | | | 2/14/20 USD | | | | 12,500,000 | | | | USD 12,500 | | | | 98,312 | | | | (197,723 | ) |
| EUR Currency Call | | | BOA | | | | RUB | | | | 78.000 | | | | 11/4/20 EUR | | | | 15,100,000 | | | | EUR 15,100 | | | | 517,279 | | | | (294,785 | ) |
| EUR Currency Put | | | BOA | | | | INR | | | | 77.700 | | | | 11/3/20 EUR | | | | 25,000,000 | | | | EUR 25,000 | | | | 160,562 | | | | (89,451 | ) |
| EUR Currency Call | | | BOA | | | | INR | | | | 88.850 | | | | 11/3/20 EUR | | | | 25,000,000 | | | | EUR 25,000 | | | | 356,726 | | | | (304,022 | ) |
| EUR Currency Call | | | BOA | | | | ZAR | | | | 20.000 | | | | 8/5/20 EUR | | | | 1,500,000 | | | | EUR 1,500 | | | | 327,329 | | | | (38,111 | ) |
| EUR Currency Call | | | GSCOI | | | | RUB | | | | 78.000 | | | | 11/4/20 EUR | | | | 27,400,000 | | | | EUR 27,400 | | | | 932,731 | | | | (534,909 | ) |
| EUR Currency Put | | | GSCOI | | | | RUB | | | | 67.750 | | | | 11/4/20 EUR | | | | 41,100,000 | | | | EUR 41,100 | | | | 255,756 | | | | (301,632 | ) |
| EUR Currency Call2 | | | GSCO-OT | | | | NOK | | | | 11.000 | | | | 1/6/21 EUR | | | | 2,925,000 | | | | EUR 2,925 | | | | 586,026 | | | | (329,541 | ) |
| EUR Currency Call | | | GSCO-OT | | | | ZAR | | | | 20.000 | | | | 8/4/20 EUR | | | | 1,500,000 | | | | EUR 1,500 | | | | 235,640 | | | | (37,613 | ) |
| EUR Currency Call | | | GSCO-OT | | | | INR | | | | 90.000 | | | | 8/5/20 EUR | | | | 1,500,000 | | | | EUR 1,500 | | | | 293,187 | | | | (173,491 | ) |
29 INVESCO OPPENHEIMER V.I. GLOBAL STRATEGIC INCOME FUND
CONSOLIDATED SCHEDULE OF INVESTMENTSContinued
| | | | | | | | | | | | | | | | | | | | | | | | | | | | | | | | | | | | |
Over-the-Counter Options Written (Continued) | |
| Description | | Counterparty | | | | | | Exercise Price | | | Expiration Date | | | | | | Number of
Contracts | | | Notional
Amount (000’s) | | | Premiums Received | | | Value | |
| EUR Currency Call | | | JPM | | | | ZAR | | | | 19.050 | | | | 12/8/20 | | | | EUR | | | | 15,100,000 | | | | EUR 15,100 | | | $ | 449,550 | | | $ | (328,495 | ) |
| EUR Currency Call | | | JPM | | | | NOK | | | | 11.000 | | | | 8/26/21 | | | | EUR | | | | 1,875,000 | | | | EUR 1,875 | | | | 558,037 | | | | (373,851 | ) |
| EUR Currency Call | | | MSCO | | | | NOK | | | | 10.758 | | | | 8/20/20 | | | | EUR | | | | 45,000,000 | | | | EUR 45,000 | | | | 532,937 | | | | (179,027 | ) |
| EUR Currency Call | | | MSCO | | | | BRL | | | | 5.250 | | | | 8/24/21 | | | | EUR | | | | 11,300,000 | | | | EUR 11,300 | | | | 635,063 | | | | (421,631 | ) |
| EUR Currency Put | | | SCB | | | | IDR | | | | 15,350.000 | | | | 12/17/20 | | | | EUR | | | | 25,000,000 | | | | EUR 25,000 | | | | 162,562 | | | | (188,046 | ) |
| EUR Currency Call | | | SCB | | | | IDR | | | | 17,600.000 | | | | 12/17/20 | | | | EUR | | | | 25,000,000 | | | | EUR 25,000 | | | | 386,106 | | | | (335,349 | ) |
| IDR Currency Call | | | GSCOI | | | | IDR | | | | 15,640.000 | | | | 10/22/20 | | | | USD | | | | 18,750,000 | | | | USD 18,750 | | | | 241,875 | | | | (96,415 | ) |
| IDR Currency Call | | | JPM | | | | IDR | | | | 15,625.000 | | | | 10/26/20 | | | | USD | | | | 12,500,000 | | | | USD 12,500 | | | | 163,563 | | | | (66,973 | ) |
| IDR Currency Call | | | SCB | | | | IDR | | | | 15,600.000 | | | | 10/22/20 | | | | USD | | | | 25,000,000 | | | | USD 25,000 | | | | 320,525 | | | | (133,280 | ) |
| IDR Currency Put | | | GSCOI | | | | IDR | | | | 13,685.000 | | | | 10/22/20 | | | | USD | | | | 18,750,000 | | | | USD 18,750 | | | | 106,875 | | | | (131,378 | ) |
| IDR Currency Put | | | JPM | | | | IDR | | | | 13,660.000 | | | | 10/26/20 | | | | USD | | | | 12,500,000 | | | | USD 12,500 | | | | 70,750 | | | | (83,863 | ) |
| IDR Currency Put | | | SCB | | | | IDR | | | | 13,700.000 | | | | 10/22/20 | | | | USD | | | | 25,000,000 | | | | USD 25,000 | | | | 148,125 | | | | (181,367 | ) |
| INR Currency Call | | | BOA | | | | INR | | | | 77.550 | | | | 10/27/20 | | | | USD | | | | 25,000,000 | | | | USD 25,000 | | | | 272,750 | | | | (185,311 | ) |
| INR Currency Put | | | BOA | | | | INR | | | | 69.300 | | | | 10/27/20 | | | | USD | | | | 25,000,000 | | | | USD 25,000 | | | | 114,250 | | | | (65,021 | ) |
| MXN Currency Call | | | BOA | | | | MXN | | | | 19.940 | | | | 3/12/20 | | | | USD | | | | 25,000,000 | | | | USD 25,000 | | | | 159,625 | | | | (71,860 | ) |
| MXN Currency Call | | | CITNA-B | | | | MXN | | | | 20.215 | | | | 6/2/20 | | | | USD | | | | 12,500,000 | | | | USD 12,500 | | | | 97,314 | | | | (112,588 | ) |
| MXN Currency Call | | | GSCOI | | | | MXN | | | | 22.036 | | | | 10/30/20 | | | | USD | | | | 25,000,000 | | | | USD 25,000 | | | | 483,225 | | | | (180,846 | ) |
| MXN Currency Call | | | JPM | | | | MXN | | | | 22.170 | | | | 12/3/20 | | | | USD | | | | 12,500,000 | | | | USD 12,500 | | | | 248,750 | | | | (103,758 | ) |
| MXN Currency Call | | | JPM | | | | MXN | | | | 22.250 | | | | 12/3/20 | | | | USD | | | | 12,500,000 | | | | USD 12,500 | | | | 231,475 | | | | (99,731 | ) |
| MXN Currency Call | | | JPM | | | | MXN | | | | 20.480 | | | | 6/2/20 | | | | USD | | | | 12,500,000 | | | | USD 12,500 | | | | 116,712 | | | | (72,016 | ) |
| MXN Currency Call | | | SCB | | | | MXN | | | | 21.590 | | | | 12/15/20 | | | | USD | | | | 18,750,000 | | | | USD 18,750 | | | | 250,781 | | | | (224,365 | ) |
| MXN Currency Put | | | BOA | | | | MXN | | | | 18.578 | | | | 3/12/20 | | | | USD | | | | 25,000,000 | | | | USD 25,000 | | | | 74,375 | | | | (64,481 | ) |
| MXN Currency Put | | | GSCOI | | | | MXN | | | | 18.205 | | | | 10/30/20 | | | | USD | | | | 25,000,000 | | | | USD 25,000 | | | | 195,800 | | | | (112,011 | ) |
| MXN Currency Put | | | JPM | | | | MXN | | | | 18.850 | | | | 6/2/20 | | | | USD | | | | 12,500,000 | | | | USD 12,500 | | | | 100,187 | | | | (105,875 | ) |
| MXN Currency Put | | | JPM | | | | MXN | | | | 18.830 | | | | 12/3/20 | | | | USD | | | | 12,500,000 | | | | USD 12,500 | | | | 176,250 | | | | (138,090 | ) |
| MXN Currency Put | | | JPM | | | | MXN | | | | 18.900 | | | | 12/3/20 | | | | USD | | | | 12,500,000 | | | | USD 12,500 | | | | 173,825 | | | | (150,319 | ) |
| MXN Currency Put | | | SCB | | | | MXN | | | | 18.830 | | | | 12/15/20 | | | | USD | | | | 18,750,000 | | | | USD 18,750 | | | | 250,781 | | | | (212,060 | ) |
| RUB Currency Call | | | JPM | | | | RUB | | | | 60.000 | | | | 2/25/21 | | | | USD | | | | 1,315,900,000 | | | | USD 1,315,900 | | | | 238,946 | | | | (259,930 | ) |
| RUB Currency Put | | | JPM | | | | RUB | | | | 80.000 | | | | 2/25/21 | | | | USD | | | | 1,754,500,000 | | | | USD 1,754,500 | | | | 977,717 | | | | (147,589 | ) |
| TRY Currency Call | | | GSCOI | | | | TRY | | | | 7.000 | | | | 12/9/20 | | | | USD | | | | 9,375,000 | | | | USD 9,375 | | | | 299,016 | | | | (369,390 | ) |
| TRY Currency Call | | | GSCOI | | | | TRY | | | | 7.750 | | | | 10/12/20 | | | | USD | | | | 11,250,000 | | | | USD 11,250 | | | | 413,516 | | | | (180,001 | ) |
| TRY Currency Put | | | GSCOI | | | | TRY | | | | 5.500 | | | | 10/12/20 | | | | USD | | | | 11,250,000 | | | | USD 11,250 | | | | 131,715 | | | | (51,769 | ) |
| TRY Currency Put | | | GSCOI | | | | TRY | | | | 5.750 | | | | 12/9/20 | | | | USD | | | | 9,375,000 | | | | USD 9,375 | | | | 119,644 | | | | (111,513 | ) |
| ZAR Currency Put | | | GSCO-OT | | | | ZAR | | | | 16.000 | | | | 7/23/20 | | | | USD | | | | 338,300,000 | | | | USD 338,300 | | | | 615,579 | | | | (286,256 | ) |
| ZAR Currency Call | | | GSCOI | | | | ZAR | | | | 16.300 | | | | 12/8/20 | | | | USD | | | | 4,800,000 | | | | USD 4,800 | | | | 186,850 | | | | (119,290 | ) |
| ZAR Currency Put | | | GSCOI | | | | ZAR | | | | 14.300 | | | | 12/8/20 | | | | USD | | | | 4,800,000 | | | | USD 4,800 | | | | 114,518 | | | | (206,253 | ) |
| | | | | | | | | | | | | | | | | | | | | | | | | | | | | | | | |
| Total Over-the-Counter Options Written | | | | | | | | | | | | | | | | | | | | | | | | | | | | | | $ | 15,493,228 | | | $ | (9,591,484 | ) |
| | | | | | | | | | | | | | | | | | | | | | | | | | | | | | | | |
| | | | | | | | | | | | | | | | | | | | | | | | | | | | | | | | |
1. Knock-out option is ineligible for exercise if at any time spot rates are greater than or equal to 3.7 BRL per 1 USD
2. Knock-out option is ineligible for exercise if at any time spot rates are greater than or equal to 9.40 NOK per 1 EUR
| | | | | | | | | | | | | | | | | | | | | | | | | | | | | | | | | | | | |
Centrally Cleared Credit Default Swaps at December 31, 2019 | |
| Reference Asset | | | | | Buy/Sell Protection | | | Fixed Rate | | | Maturity Date | | | | | | Notional
Amount
(000’s) | | | Premiums Received/(Paid) | | | Value | | | Unrealized
Appreciation/
(Depreciation) | |
| Brazilian Government International | | | | | | | Sell | | | | 1.000% | | | | 6/20/22 | | | | USD | | | | 2,500 | | | $ | 154,768 | | | $ | 29,638 | | | $ | 184,406 | |
| CDX.EM.31 | | | | | | | Buy | | | | 1.000 | | | | 6/20/24 | | | | USD | | | | 9,850 | | | | (449,268 | ) | | | 257,534 | | | | (191,734 | ) |
| CDX.NA.HY.33 | | | | | | | Buy | | | | 5.000 | | | | 12/20/24 | | | | USD | | | | 46,976 | | | | 3,163,530 | | | | (4,604,961 | ) | | | (1,441,431 | ) |
| Indonesia Government International | | | | | | | Buy | | | | 1.000 | | | | 12/20/24 | | | | USD | | | | 3,000 | | | | 13,940 | | | | (53,858 | ) | | | (39,918 | ) |
| Republic Of South Africa Government | | | | | | | Buy | | | | 1.000 | | | | 12/20/24 | | | | USD | | | | 1,250 | | | | (52,196 | ) | | | 35,822 | | | | (16,374 | ) |
| Turkey Government International Bond | | | | | | | Buy | | | | 1.000 | | | | 12/20/24 | | | | USD | | | | 2,500 | | | | (296,675 | ) | | | 199,915 | | | | (96,760 | ) |
| | | | | | | | | | | | | | | | | | | | | | | | | | | | |
| Total Cleared Credit Default Swaps | | | | | | | | | | | | | | | | | | | | | | | | | | $ | 2,534,099 | | | $ | (4,135,910 | ) | | $ | (1,601,811 | ) |
| | | | | | | | | | | | | | | | | | | | | | | | | | | | |
| | | | | | | | | | | | | | | | | | | | | | | | | | | | |
| | | | | | | | | | | | | | | | | | | | | | | | | | | | | | | | | | | | |
Over-the-Counter Credit Default Swaps at December 31, 2019 | |
| Reference Asset | | Counterparty | | | Buy/Sell Protection | | | Fixed Rate | | | Maturity Date | | | | | | Notional
Amount
(000’s) | | | Premiums Received/(Paid) | | | Value | | | Unrealized
Appreciation/
(Depreciation) | |
| Intesa Sanpaolo S.p.A. | | | JPM | | | | Sell | | | | 5.000 | % | | | 12/20/22 | | | | EUR | | | | 15,000 | | | $ | (2,450,426 | ) | | $ | 2,342,734 | | | $ | (107,692 | ) |
| iTraxx Europe Crossover Series 24 Version 1 | | | JPM | | | | Sell | | | | 5.000 | | | | 12/20/20 | | | | EUR | | | | 2,900 | | | | (272,147 | ) | | | 129,174 | | | | (142,973 | ) |
| Lloyds Banking Group plc | | | JPM | | | | Buy | | | | 1.000 | | | | 6/20/24 | | | | EUR | | | | 750 | | | | (32,906 | ) | | | (6,768 | ) | | | (39,674 | ) |
| Oriental Republic of Uruguay | | | BOA | | | | Sell | | | | 1.000 | | | | 12/20/21 | | | | USD | | | | 2,697 | | | | 48,743 | | | | 20,162 | | | | 68,905 | |
| Royal Bank Of Scotland Group plc | | | JPM | | | | Buy | | | | 1.000 | | | | 6/20/24 | | | | EUR | | | | 750 | | | | (37,778 | ) | | | (1,613 | ) | | | (39,391 | ) |
| | | | | | | | | | | | | | | | | | | | | | | | | | | | |
| Total Over-the-Counter Credit Default Swaps | | | | | | | | | | | | | | | | | | | | | | | | | | $ | (2,744,514 | ) | | $ | 2,483,689 | | | $ | (260,825 | ) |
| | | | | | | | | | | | | | | | | | | | | | | | | | | | |
| | | | | | | | | | | | | | | | | | | | | | | | | | | | |
30 INVESCO OPPENHEIMER V.I. GLOBAL STRATEGIC INCOME FUND
| | | | | | | | | | | | | | | | | | | | | | | | | | | | | | | | | | | | |
Centrally Cleared Interest Rate Swaps at December 31, 2019 | |
| Counterparty | | Pay/Receive Floating Rate | | | Floating Rate | | | Fixed Rate | | | Maturity Date | | | | | | Notional Amount (000’s) | | | Premiums
Received / (Paid) | | | Value | | | Unrealized
Appreciation/
(Depreciation) | |
| BAC | | | Receive | | |
| Six-Month EUR
EURIBOR |
| | | 1.123% | | | | 3/8/28 | | | | EUR | | | | 2,475 | | | $ | — | | | $ | (272,764 | ) | | $ | (272,764 | ) |
| BOA | | | Receive | | | | BBSW6M | | | | 1.655 | | | | 7/16/29 | | | | AUD | | | | 11,675 | | | | — | | | | (134,313 | ) | | | (134,313 | ) |
| CITNA-B | | | Pay | | | | CDOR03 | | | | 1.880 | | | | 10/17/21 | | | | CAD | | | | 168,500 | | | | — | | | | (122,427 | ) | | | (122,427 | ) |
| CITNA-B | | | Pay | | | | COOVIBR | | | | 5.220 | | | | 8/12/29 | | | | COP | | | | 5,950,000 | | | | — | | | | (31,999 | ) | | | (31,999 | ) |
| CITNA-B | | | Pay | | | | CDOR03 | | | | 1.803 | | | | 10/1/21 | | | | CAD | | | | 50,550 | | | | (702 | ) | | | (145,277 | ) | | | (145,979 | ) |
| CITNA-B | | | Receive | | | | CDOR03 | | | | 1.740 | | | | 10/1/29 | | | | CAD | | | | 10,650 | | | | 203 | | | | 311,719 | | | | 311,922 | |
| CITNA-B | | | Pay | | | | COOVIBR | | | | 5.560 | | | | 8/26/26 | | | | COP | | | | 12,803,000 | | | | — | | | | 116,403 | | | | 116,403 | |
| CITNA-B | | | Pay | | | | CDOR03 | | | | 1.848 | | | | 10/11/21 | | | | CAD | | | | 48,000 | | | | — | | | | (46,484 | ) | | | (46,484 | ) |
| CITNA-B | | | Pay | | | | CDOR03 | | | | 1.840 | | | | 10/11/21 | | | | CAD | | | | 65,000 | | | | — | | | | (66,600 | ) | | | (66,600 | ) |
| CITNA-B | | | Pay | | | | COOVIBR | | | | 5.200 | | | | 8/1/29 | | | | COP | | | | 12,445,000 | | | | — | | | | (70,129 | ) | | | (70,129 | ) |
| CITNA-B | | | Pay | | | | CDOR03 | | | | 1.917 | | | | 10/24/29 | | | | CAD | | | | 35,500 | | | | — | | | | (601,384 | ) | | | (601,384 | ) |
| CITNA-B | | | Pay | | | | CDOR03 | | | | 1.953 | | | | 10/25/29 | | | | CAD | | | | 18,125 | | | | — | | | | (261,752 | ) | | | (261,752 | ) |
| CITNA-B | | | Pay | | | | MXN TIIE BANXICO | | | | 6.375 | | | | 11/4/22 | | | | MXN | | | | 420,000 | | | | — | | | | (151,183 | ) | | | (151,183 | ) |
| CITNA-B | | | Receive | | |
| Three-Month USD
BBA LIBOR |
| | | 2.015 | | | | 8/19/50 | | | | USD | | | | 9,750 | | | | — | | | | 172,460 | | | | 172,460 | |
| CITNA-B | | | Pay | | |
| Six-Month HUF
BUBOR |
| | | 2.205 | | | | 3/8/28 | | | | HUF | | | | 825,000 | | | | — | | | | 239,527 | | | | 239,527 | |
| CITNA-B | | | Pay | | | | CDOR03 | | | | 2.035 | | | | 11/7/29 | | | | CAD | | | | 35,250 | | | | — | | | | (276,920 | ) | | | (276,920 | ) |
| CITNA-B | | | Receive | | |
| Three-Month USD
BBA LIBOR |
| | | 1.693 | | | | 1/17/30 | | | | USD | | | | 19,000 | | | | — | | | | 343,601 | | | | 343,601 | |
| DEU | | | Pay | | |
| Three-Month ZAR
JIBAR SAFEX |
| | | 7.675 | | | | 2/21/22 | | | | ZAR | | | | 26,465 | | | | — | | | | 42,425 | | | | 42,425 | |
| DEU | | | Pay | | | | MXN TIIE BANXICO | | | | 7.340 | | | | 7/24/29 | | | | MXN | | | | 39,500 | | | | — | | | | 83,016 | | | | 83,016 | |
| DEU | | | Pay | | | | JIBA3M | | | | 8.420 | | | | 8/29/28 | | | | ZAR | | | | 62,800 | | | | — | | | | 268,718 | | | | 268,718 | |
| DEU | | | Pay | | | | MXN TIIE BANXICO | | | | 8.120 | | | | 5/5/21 | | | | MXN | | | | 493,980 | | | | — | | | | 440,000 | | | | 440,000 | |
| DEU | | | Pay | | | | MXN TIIE BANXICO | | | | 8.525 | | | | 1/15/24 | | | | MXN | | | | 70,450 | | | | — | | | | 262,735 | | | | 262,735 | |
| GSCOI | | | Pay | | | | MXN TIIE BANXICO | | | | 7.845 | | | | 12/7/23 | | | | MXN | | | | 146,300 | | | | — | | | | 346,441 | | | | 346,441 | |
| GSCOI | | | Pay | | | | MXN TIIE BANXICO | | | | 7.200 | | | | 7/27/22 | | | | MXN | | | | 182,500 | | | | — | | | | 133,840 | | | | 133,840 | |
| GSCOI | | | Receive | | | | CPURNSA | | | | 1.883 | | | | 7/19/24 | | | | USD | | | | 49,000 | | | | — | | | | (231,566 | ) | | | (231,566 | ) |
| GSCOI | | | Receive | | |
| Three-Month USD
BBA LIBOR |
| | | 1.666 | | | | 8/7/29 | | | | USD | | | | 1,610 | | | | — | | | | 24,469 | | | | 24,469 | |
| GSCOI | | | Receive | | | | WIBR6M | | | | 2.095 | | | | 5/30/24 | | | | PLN | | | | 14,500 | | | | — | | | | (92,744 | ) | | | (92,744 | ) |
| GSCOI | | | Pay | | | | MXN TIIE BANXICO | | | | 8.620 | | | | 12/26/28 | | | | MXN | | | | 37,300 | | | | — | | | | 254,501 | | | | 254,501 | |
| HSBC | | | Pay | | | | MXN TIIE BANXICO | | | | 7.210 | | | | 7/17/24 | | | | MXN | | | | 135,555 | | | | — | | | | 175,508 | | | | 175,508 | |
| JPM | | | Receive | | | | MXN TIIE BANXICO | | | | 7.070 | | | | 12/12/29 | | | | MXN | | | | 107,250 | | | | — | | | | 530 | | | | 530 | |
| JPM | | | Pay | | | | BZDIOVRA | | | | 6.610 | | | | 1/2/23 | | | | BRL | | | | 358,875 | | | | — | | | | (82,080 | ) | | | (82,080 | ) |
| JPM | | | Pay | | |
| Three-Month ZAR
JIBAR SAFEX |
| | | 7.930 | | | | 11/27/22 | | | | ZAR | | | | 15,000 | | | | — | | | | 36,956 | | | | 36,956 | |
| JPM | | | Pay | | | | CDOR03 | | | | 1.868 | | | | 11/7/21 | | | | CAD | | | | 405,000 | | | | — | | | | (334,464 | ) | | | (334,464 | ) |
| JPM | | | Pay | | | | COOVIBR | | | | 4.890 | | | | 10/17/20 | | | | COP | | | | 46,900,000 | | | | — | | | | 99,005 | | | | 99,005 | |
| JPM | | | Pay | | | | MXN TIIE BANXICO | | | | 6.395 | | | | 10/21/24 | | | | MXN | | | | 275,000 | | | | — | | | | (130,822 | ) | | | (130,822 | ) |
| JPM | | | Pay | | | | MXN TIIE BANXICO | | | | 6.465 | | | | 12/12/24 | | | | MXN | | | | 106,250 | | | | — | | | | (36,967 | ) | | | (36,967 | ) |
| JPM | | | Receive | | | | MXN TIIE BANXICO | | | | 6.975 | | | | 10/22/20 | | | | MXN | | | | 246,875 | | | | — | | | | 15,435 | | | | 15,435 | |
| JPM | | | Pay | | | | BZDI | | | | 2.280 | | | | 1/4/27 | | | | BRL | | | | 46,000 | | | | — | | | | 1,116,115 | | | | 1,116,115 | |
| JPM | | | Pay | | | | MXN TIIE BANXICO | | | | 7.810 | | | | 12/7/23 | | | | MXN | | | | 176,800 | | | | — | | | | 406,932 | | | | 406,932 | |
| JPM | | | Pay | | | | MXN TIIE BANXICO | | | | 6.520 | | | | 9/29/22 | | | | MXN | | | | 108,000 | | | | — | | | | (12,578 | ) | | | (12,578 | ) |
| JPM | | | Pay | | | | MXN TIIE BANXICO | | | | 6.710 | | | | 9/23/21 | | | | MXN | | | | 153,750 | | | | — | | | | (4,564 | ) | | | (4,564 | ) |
| JPM | | | Pay | | | | MXN TIIE BANXICO | | | | 6.910 | | | | 12/16/26 | | | | MXN | | | | 247,125 | | | | — | | | | (31,026 | ) | | | (31,026 | ) |
| JPM | | | Pay | | | | BZDIOVRA | | | | 7.060 | | | | 7/1/22 | | | | BRL | | | | 438,700 | | | | — | | | | 218,289 | | | | 218,289 | |
| JPM | | | Pay | | | | MXN TIIE BANXICO | | | | 6.765 | | | | 10/11/29 | | | | MXN | | | | 32,500 | | | | — | | | | (5,410 | ) | | | (5,410 | ) |
| MSCO | | | Receive | | | | CPURNSA | | | | 1.856 | | | | 7/30/24 | | | | USD | | | | 51,824 | | | | — | | | | (102,668 | ) | | | (102,668 | ) |
| SIB | | | Pay | | | | BZDI | | | | 8.415 | | | | 1/2/25 | | | | BRL | | | | 42,000 | | | | — | | | | 872,823 | | | | 872,823 | |
| SIB | | | Pay | | | | MXN TIIE BANXICO | | | | 7.880 | | | | 6/9/22 | | | | MXN | | | | 167,700 | | | | — | | | | 255,616 | | | | 255,616 | |
| | | | | | | | | | | | | | | | | | | | | | | | | | | | |
| Total Centrally Cleared Interest Rate Swaps | | | | | | | | | | | | | | | | | | | $ | (499 | ) | | $ | 2,990,943 | | | $ | 2,990,444 | |
| | | | | | | | | | | | | | | | | | | | | | | | | | | | |
| | | | | | | | | | | | | | | | | | | | | | | | | | | | |
| | | | | | | | | | | | | | | | | | | | | | | | | | | | | | | | | | | | |
Over-the-Counter Interest Rate Swaps at December 31, 2019 | |
| Counterparty | | Pay/Receive Floating Rate | | | Floating Rate | | | Fixed Rate | | | Maturity Date | | | | | | Notional Amount (000’s) | | | Premiums Received
/ (Paid) | | | Value | | | Unrealized
Appreciation/
(Depreciation) | |
| BOA | | | Pay | | |
| Six-Month INR
FBIL MIBOR OIS
Compound |
| | | 6.330% | | | | 1/31/22 | | | | INR | | | | 210,000 | | | $ | — | | | $ | 72,621 | | | $ | 72,621 | |
| BOA | | | Receive | | |
| Six-Month INR
FBIL MIBOR OIS
Compound |
| | | 5.740 | | | | 5/16/21 | | | | INR | | | | 1,157,000 | | | | — | | | | (115,045 | ) | | | (115,045 | ) |
| BOA | | | Receive | | |
| INR FBIL MIBOR OIS
Compound |
| | | 5.670 | | | | 5/27/21 | | | | INR | | | | 1,180,000 | | | | — | | | | (101,015 | ) | | | (101,015 | ) |
| GSCOI | | | Pay | | | | MOSKP3 | | | | 8.270 | | | | 5/23/24 | | | | RUB | | | | 100,000 | | | | — | | | | 175,462 | | | | 175,462 | |
31 INVESCO OPPENHEIMER V.I. GLOBAL STRATEGIC INCOME FUND
CONSOLIDATED SCHEDULE OF INVESTMENTSContinued
| | | | | | | | | | | | | | | | | | | | | | | | | | | | | | | | | | | | |
Over-the-Counter Interest Rate Swaps (Continued) | |
| Counterparty | | Pay/Receive Floating Rate | | | Floating Rate | | | Fixed Rate | | | Maturity Date | | | | | | Notional Amount (000’s) | | | Premiums Received
/ (Paid) | | | Value | | | Unrealized
Appreciation/
(Depreciation) | |
| GSCOI | | | Pay | | | | MOSKP3 | | | | 8.360% | | | | 6/24/29 | | | | RUB | | | | 130,925 | | | $ | — | | | $ | 289,929 | | | $ | 289,929 | |
| GSCOI | | | Pay | | | | MOSKP3 | | | | 6.580 | | | | 10/25/21 | | | | RUB | | | | 2,170,000 | | | | — | | | | 31,465 | | | | 31,465 | |
| SCB | | | Receive | | |
| Six-Month INR
FBIL MIBOR OIS
Compound |
| | | 6.438 | | | | 1/10/24 | | | | INR | | | | 250,000 | | | | — | | | | (153,239 | ) | | | (153,239 | ) |
| | | | | | | | | | | | | | | | | | | | | | | | | | | | |
| Total Over-the-Counter Interest Rate Swaps | | | | | | | | | | | | | | | | | | | | | | | $ | — | | | $ | 200,178 | | | $ | 200,178 | |
| | | | | | | | | | | | | | | | | | | | | | | | | | | | |
| | | | | | | | | | | | | | | | | | | | | | | | | | | | |
| | | | | | | | | | | | | | | | | | | | | | | | | | | | | | | | | | | | |
Over-the-Counter Credit Default Swaptions Written at December 31, 2019 | |
| Description | | Counterparty | | | Buy/Sell
Protection | | | Reference Asset | | | Fixed Rate | | | Expiration Date | | | | | | Notional
Amount
(000’s) | | | Premiums
Received | | | Value | |
| Credit Default Swap maturing | | | | | | | | | | | | | | | | | | | | | | | | | | | | | | | | | | | | |
| 12/20/24 Put | | | JPM | | | | Sell | | | | CDX.NA.HY.33.V2 | | | | 5.000% | | | | 2/19/20 | | | | USD | | | | 25,000 | | | $ | 88,750 | | | $ | (25,187 | ) |
| Credit Default Swap maturing | | | | | | | | | | | | | | | | | | | | | | | | | | | | | | | | | | | | |
| 12/20/24 Put | | | JPM | | | | Sell | | | | CDX.NA.HY.33.V2 | | | | 5.000 | | | | 1/15/20 | | | | USD | | | | 50,000 | | | | 180,000 | | | | (10,394 | ) |
| Credit Default Swap maturing | | | | | | | | | |
| iTraxx Europe
Crossover Series |
| | | | | | | | | | | | | | | | | | | | | | | | |
| 12/20/24 Call | | | JPM | | | | Sell | | | | 32 Version 1 | | | | 5.000 | | | | 2/19/20 | | | | EUR | | | | 37,500 | | | | 79,034 | | | | (212,187 | ) |
| Credit Default Swap maturing | | | | | | | | | |
| iTraxx Europe
Crossover Series |
| | | | | | | | | | | | | | | | | | | | | | | | |
| 12/20/24 Put | | | JPM | | | | Sell | | | | 32 Version 1 | | | | 5.000 | | | | 2/19/20 | | | | EUR | | | | 56,250 | | | | 81,114 | | | | (26,573 | ) |
| Credit Default Swap maturing | | | | | | | | | | | | | | | | | | | | | | | | | | | | | | | | | | | | |
| 12/20/24 Put | | | JPM | | | | Sell | | | | CDX.NA.HY.33.V1 | | | | 5.000 | | | | 2/19/20 | | | | USD | | | | 50,000 | | | | 280,000 | | | | (98,917 | ) |
| Credit Default Swap maturing | | | | | | | | | | | | | | | | | | | | | | | | | | | | | | | | | | | | |
| 12/20/24 Call | | | JPM | | | | Sell | | | | CDX.NA.HY.33.V1 | | | | 5.000 | | | | 2/19/20 | | | | USD | | | | 50,000 | | | | 105,000 | | | | (305,604 | ) |
| Credit Default Swap maturing | | | | | | | | | | | | | | | | | | | | | | | | | | | | | | | | | | | | |
| 12/20/24 Put | | | JPM | | | | Sell | | | | CDX.NA.HY.33.V2 | | | | 5.000 | | | | 2/19/20 | | | | USD | | | | 17,000 | | | | 33,660 | | | | (21,722 | ) |
| | | | | | | | | | | | | | | | | | | | | | | | | | | | | | | | |
| Total Over-the-Counter Credit Default Swaptions Written | | | | | | | | | | | | | | | | | | | | | | | | | | | $ | 847,558 | | | $ | (700,584 | ) |
| | | | | | | | | | | | | | | | | | | | | | | | | | | | | | | | |
| | | | | | | | | | | | | | | | | | | | | | | | | | | | | | | | |
| | | | | | | | | | | | | | | | | | | | | | | | | | | | | | | | | | | | |
Over-the-Counter Interest Rate Swaptions Written at December 31, 2019 | |
| Description | | Counterparty | | | Pay/Receive
Floating Rate | | | Floating Rate | | | Fixed Rate | | | Expiration
Date | | | | | | Notional Amount
(000’s) | | | Premiums Received | | | Value | |
| | | | | | | | | | | Three-Month | | | | | | | | | | | | | | | | | | | | | | | | | |
| Interest Rate Swap maturing | | | | | | | | | | | USD BBA | | | | | | | | | | | | | | | | | | | | | | | | | |
| 4/24/20 Call | | | BOA | | | | Pay | | | | LIBOR | | | | 1.325% | | | | 4/24/20 | | | | USD | | | | 37,500 | | | $ | 202,575 | | | $ | (55,701 | ) |
| | | | | | | | | | | Three-Month | | | | | | | | | | | | | | | | | | | | | | | | | |
| Interest Rate Swap maturing | | | | | | | | | | | USD BBA | | | | | | | | | | | | | | | | | | | | | | | | | |
| 4/24/20 Put | | | BOA | | | | Receive | | | | LIBOR | | | | 1.725 | | | | 4/24/20 | | | | USD | | | | 37,500 | | | | 202,575 | | | | (254,109 | ) |
| | | | | | | | | |
| Three-
Month RUB |
| | | | | | | | | | | | | | | | | | | | | | | | |
| Interest Rate Swap maturing | | | | | | | | | | | MOSPRIME | | | | | | | | | | | | | | | | | | | | | | | | | |
| 6/15/20 Put | | | GSCOI | | | | Receive | | | | NFEA | | | | 8.080 | | | | 6/15/20 | | | | RUB | | | | 255,500 | | | | 79,463 | | | | (7,640 | ) |
| | | | | | | | | | | Three-Month | | | | | | | | | | | | | | | | | | | | | | | | | |
| Interest Rate Swap maturing | | | | | | | | | | | USD BBA | | | | | | | | | | | | | | | | | | | | | | | | | |
| 1/9/20 Call | | | GSCOI | | | | Pay | | | | LIBOR | | | | 1.600 | | | | 1/9/20 | | | | USD | | | | 100,800 | | | | 539,280 | | | | (20,209 | ) |
| | | | | | | | | | | Three-Month | | | | | | | | | | | | | | | | | | | | | | | | | |
| Interest Rate Swap maturing | | | | | | | | | | | USD BBA | | | | | | | | | | | | | | | | | | | | | | | | | |
| 6/15/20 Put | | | GSCOI | | | | Receive | | | | LIBOR | | | | 1.805 | | | | 6/15/20 | | | | USD | | | | 150,000 | | | | 690,000 | | | | (953,691 | ) |
| | | | | | | | | | | Three-Month | | | | | | | | | | | | | | | | | | | | | | | | | |
| Interest Rate Swap maturing | | | | | | | | | | | USD BBA | | | | | | | | | | | | | | | | | | | | | | | | | |
| 6/15/20 Call | | | GSCOI | | | | Pay | | | | LIBOR | | | | 1.405 | | | | 6/15/20 | | | | USD | | | | 150,000 | | | | 705,000 | | | | (451,997 | ) |
| | | | | | | | | | | Three-Month | | | | | | | | | | | | | | | | | | | | | | | | | |
| Interest Rate Swap maturing | | | | | | | | | | | USD BBA | | | | | | | | | | | | | | | | | | | | | | | | | |
| 3/2/20 Put | | | GSCOI | | | | Receive | | | | LIBOR | | | | 1.986 | | | | 3/2/20 | | | | USD | | | | 45,000 | | | | 191,250 | | | | (279,839 | ) |
| | | | | | | | | | | Three-Month | | | | | | | | | | | | | | | | | | | | | | | | | |
| Interest Rate Swap maturing | | | | | | | | | | | USD BBA | | | | | | | | | | | | | | | | | | | | | | | | | |
| 4/24/20 Call | | | JPM | | | | Pay | | | | LIBOR | | | | 1.340 | | | | 4/24/20 | | | | USD | | | | 150,000 | | | | 840,000 | | | | (236,342 | ) |
| | | | | | | | | | | Three-Month | | | | | | | | | | | | | | | | | | | | | | | | | |
| Interest Rate Swap maturing | | | | | | | | | | | USD BBA | | | | | | | | | | | | | | | | | | | | | | | | | |
| 4/24/20 Put | | | JPM | | | | Receive | | | | LIBOR | | | | 1.661 | | | | 4/24/20 | | | | USD | | | | 112,500 | | | | 279,000 | | | | (237,527 | ) |
| | | | | | | | | | | Three-Month | | | | | | | | | | | | | | | | | | | | | | | | | |
| Interest Rate Swap maturing | | | | | | | | | | | USD BBA | | | | | | | | | | | | | | | | | | | | | | | | | |
| 4/24/20 Put | | | JPM | | | | Receive | | | | LIBOR | | | | 1.740 | | | | 4/24/20 | | | | USD | | | | 150,000 | | | | 765,000 | | | | (960,745 | ) |
| | | | | | | | | | | Three-Month | | | | | | | | | | | | | | | | | | | | | | | | | |
| Interest Rate Swap maturing | | | | | | | | | | | USD BBA | | | | | | | | | | | | | | | | | | | | | | | | | |
| 4/24/20 Call | | | JPM | | | | Pay | | | | LIBOR | | | | 1.361 | | | | 4/24/20 | | | | USD | | | | 112,500 | | | | 277,875 | | | | (71,187 | ) |
| | | | | | | | | | | Three-Month | | | | | | | | | | | | | | | | | | | | | | | | | |
| Interest Rate Swap maturing | | | | | | | | | | | USD BBA | | | | | | | | | | | | | | | | | | | | | | | | | |
| 11/27/20 Put | | | JPM | | | | Receive | | | | LIBOR | | | | 1.618 | | | | 11/27/20 | | | | USD | | | | 300,000 | | | | 1,140,000 | | | | (1,353,288 | ) |
32 INVESCO OPPENHEIMER V.I. GLOBAL STRATEGIC INCOME FUND
| | | | | | | | | | | | | | | | | | | | | | | | | | | | | | | | | | | | |
Over-the-Counter Interest Rate Swaptions Written (Continued) | |
| Description | | Counterparty | | | Pay/Receive
Floating Rate | | | Floating Rate | | | Fixed Rate | | | Expiration
Date | | | | | | Notional Amount
(000’s) | | | Premiums Received | | | Value | |
| | | | | | | | | | | Three-Month | | | | | | | | | | | | | | | | | | | | | | | | | |
| Interest Rate Swap maturing | | | | | | | | | | | USD BBA | | | | | | | | | | | | | | | | | | | | | | | | | |
| 11/27/20 Put | | | JPM | | | | Receive | | | | LIBOR | | | | 2.200% | | | | 11/27/20 | | | | USD | | | | 63,000 | | | $ | 511,800 | | | $ | (740,280 | ) |
| Interest Rate Swap maturing | | | | | | | | | |
| Six-Month
EUR |
| | | | | | | | | | | | | | | | | | | | | | | | |
| 11/25/21 Call | | | MSCO | | | | Pay | | | | EURIBOR | | | | 0.032 | | | | 11/25/21 | | | | EUR | | | | 9,375 | | | | 158,298 | | | | (118,604 | ) |
| | | | | | | | | | | Three-Month | | | | | | | | | | | | | | | | | | | | | | | | | |
| Interest Rate Swap maturing | | | | | | | | | | | USD BBA | | | | | | | | | | | | | | | | | | | | | | | | | |
| 4/24/20 Put | | | MSCO | | | | Receive | | | | LIBOR | | | | 1.800 | | | | 4/24/20 | | | | USD | | | | 75,000 | | | | 75,000 | | | | (68,856 | ) |
| | | | | | | | | | | Three-Month | | | | | | | | | | | | | | | | | | | | | | | | | |
| Interest Rate Swap maturing | | | | | | | | | | | USD BBA | | | | | | | | | | | | | | | | | | | | | | | | | |
| 8/17/20 Put | | | MSCO | | | | Receive | | | | LIBOR | | | | 1.530 | | | | 8/17/20 | | | | USD | | | | 224,000 | | | | 821,936 | | | | (1,055,714 | ) |
| | | | | | | | | | | Three-Month | | | | | | | | | | | | | | | | | | | | | | | | | |
| Interest Rate Swap maturing | | | | | | | | | | | USD BBA | | | | | | | | | | | | | | | | | | | | | | | | | |
| 12/3/21 Call | | | MSCO | | | | Pay | | | | LIBOR | | | | 1.000 | | | | 12/3/21 | | | | USD | | | | 25,000 | | | | 567,500 | | | | (258,154 | ) |
| | | | | | | | | | | Three-Month | | | | | | | | | | | | | | | | | | | | | | | | | |
| Interest Rate Swap maturing | | | | | | | | | | | USD BBA | | | | | | | | | | | | | | | | | | | | | | | | | |
| 4/24/20 Call | | | MSCO | | | | Pay | | | | LIBOR | | | | 1.400 | | | | 4/24/20 | | | | USD | | | | 75,000 | | | | 63,000 | | | | (56,318 | ) |
| | | | | | | | | | | Three-Month | | | | | | | | | | | | | | | | | | | | | | | | | |
| Interest Rate Swap maturing | | | | | | | | | | | USD BBA | | | | | | | | | | | | | | | | | | | | | | | | | |
| 6/15/20 Put | | | NOM | | | | Receive | | | | LIBOR | | | | 2.150 | | | | 6/15/20 | | | | USD | | | | 75,000 | | | | 427,500 | | | | (538,337 | ) |
| | | | | | | | | | | | | | | | | | | | | | | | | | | | | | | | |
| Total Over-the-Counter Interest Rate Swaptions Written | | | | | | | | | | | | | | | | | | | | | | | $ | 8,537,052 | | | $ | (7,718,538 | ) |
| | | | | | | | | | | | | | | | | | | | | | | | | | | | | | | | |
| | | | | | | | | | | | | | | | | | | | | | | | | | | | | | | | |
| | |
| Glossary: | | |
| Counterparty Abbreviations |
| BAC | | Barclays Bank plc |
| BOA | | Bank of America NA |
| CITNA-B | | Citibank NA |
| DEU | | Deutsche Bank AG |
| GSCOI | | Goldman Sachs International |
| GSCO-OT | | Goldman Sachs Bank USA |
| HSBC | | HSBC Bank USA NA |
| JPM | | JPMorgan Chase Bank NA |
| MSCO | | Morgan Stanley Capital Services, Inc. |
| NOM | | Nomura Global Financial Products, Inc. |
| RBC | | RBC Dominion Securities |
| SCB | | Standard Chartered Bank |
| SIB | | Banco Santander SA |
|
| Currency abbreviations indicate amounts reporting in currencies |
| ARS | | Argentine Peso |
| AUD | | Australian Dollar |
| BRL | | Brazilian Real |
| CAD | | Canadian Dollar |
| CLP | | Chilean Peso |
| COP | | Colombian Peso |
| EGP | | Egyptian Pounds |
| EUR | | Euro |
| GBP | | British Pound Sterling |
| HUF | | Hungarian Forint |
| IDR | | Indonesian Rupiah |
| INR | | Indian Rupee |
| JPY | | Japanese Yen |
| KRW | | South Korean Won |
| MXN | | Mexican Nuevo Peso |
| MYR | | Malaysian Ringgit |
| NOK | | Norwegian Krone |
| NZD | | New Zealand Dollar |
| PEN | | Peruvian New Sol |
| PHP | | Philippine Peso |
| PLN | | Polish Zloty |
| RUB | | Russian Ruble |
| SEK | | Swedish Krona |
| THB | | Thailand Baht |
| TRY | | New Turkish Lira |
| ZAR | | South African Rand |
| |
| Definitions | | |
| BA CDOR | | Canada Bankers Acceptances Deposit Offering Rate |
| BANXICO | | Banco de Mexico |
| BBA | | British Bankers’ Association |
33 INVESCO OPPENHEIMER V.I. GLOBAL STRATEGIC INCOME FUND
CONSOLIDATED SCHEDULE OF INVESTMENTSContinued
| | |
| |
| Definitions (Continued) | | |
| BBA LIBOR | | British Bankers’ Association London - Interbank Offered Rate |
| BBSW6M | | ASX Australian Bank Bill Short Term Rate 6 Month Mid |
| BP0003M | | ICE LIBOR GBP 3 Month |
| BTP | | Italian Treasury Bonds |
| BUBOR | | Budapest Interbank Offered Rate |
| BUXL | | German Federal Obligation |
| BZDI | | Brazil Interbank Deposit Rate |
| BZDIOVRA | | Brazil Ceptip DI Interbank Deposit Rate |
| CD | | Certificate of Deposit |
| CDOR | | Canada Bankers Acceptances Rate |
| CDOR03 | | Canada Bankers Acceptance 3 Months |
| CDX.EM.31 | | Markit CDX Emerging Markets Index |
| CDX.NA.HY.33 | | Markit CDX North American High Yield |
| COOVIBR | | Colombia IBR Overnight Nominal interbank Reference Rate |
| CPURNSA | | US CPI Urban Consumer NSA |
| EUR003M | | EURIBOR 3 Month ACT/360 |
| EURIBOR | | Euro Interbank Offered Rate |
| EUSA5 | | EUR Swap Annual 5 Year |
| EUSA11 | | EUR Swap Annual 11 Year |
| FBIL | | Financial Benchmarks India Private Ltd. |
| GDR | | Global Depositary Receipt |
| H15T5Y | | US Treasury Yield Curve Rate T Note Constant Maturity 5 Year |
| H15T1Y | | US Treasury Yield Curve Rate T Note Constant Maturity 1 Year |
| iTraxx Europe Crossover Series 24 Version 1 | | Credit Default Swap Trading Index for a Specific Basket of Securities |
| iTraxx Europe Crossover Series 32 Version 1 | | Credit Default Swap Trading Index for a Specific Basket of Securities |
| JIBA3M | | South Africa Johannesburg Interbank Agreed Rate 3 Month |
| JIBAR SAFEX | | South Africa Johannesburg Interbank Agreed Rate/Futures Exchange |
| KRW CD | | South Korea Three Month Interbank Rate |
| LIBOR | | London Interbank Offered Rate |
| LIBOR4 | | London Interbank Offered Rate-Quarterly |
| LIBOR12 | | London Interbank Offered Rate-Monthly |
| MIBOR | | Mumbai Interbank Offered Rate |
| MOSKP3 | | National Finance Assoc. Moscow Prime Offered 3 Month Rate |
| MOSPRIME NFEA | | National Finance Association Moscow Prime Offered Rate |
| Nts. | | Notes |
| OIS | | Overnight Index Swap |
| PRIME4 | | United States Prime Rate-Quarterly |
| REIT | | Real Estate Investment Trust |
| S&P | | Standard & Poor’s |
| SONIA3M | | Sterling Overnight Index Average |
| Sr. | | Senior |
| TIIE | | Interbank Equilibrium Interest Rate |
| Unsec. | | Unsecured |
| US0001M | | Intercontinental Exchange London Interbank Offered Rate USD 1 Month |
| US0003M | | Intercontinental Exchange London Interbank Offered Rate USD 3 Month |
| USISDA05 | | USD ICE Swap Rate 11:00am NY 5 Year |
| USSW5 | | USD Swap Semi 30/360 5 Year |
| USSW7 | | USD Swap Semi 30/360 7 Year |
| WIBR6M | | GBP Benchmark WIBOR PLN 6 month |
| Wts. | | Warrants |
See accompanying Notes to Consolidated Financial Statements.
34 INVESCO OPPENHEIMER V.I. GLOBAL STRATEGIC INCOME FUND
CONSOLIDATED STATEMENT OF ASSETS AND LIABILITIESDecember 31, 2019
| | | | |
Assets | | | | |
| Investments, at value—see accompanying consolidated schedule of investments: | | | | |
| Unaffiliated companies (cost $1,027,284,916) | | $ | 1,009,136,201 | |
| Affiliated companies (cost $167,461,066) | | | 163,220,829 | |
| | | | 1,172,357,030 | |
| Cash | | | 12,709,347 | |
| Cash—foreign currencies (cost $9,499,351) | | | 9,286,471 | |
| Cash used for collateral on OTC derivatives | | | 8,535,482 | |
| Cash used for collateral on centrally cleared swaps | | | 17,132,489 | |
| Unrealized appreciation on forward currency exchange contracts | | | 14,336,451 | |
| Swaps, at value (net premiums paid $2,673,830) | | | 3,061,547 | |
| Receivables and other assets: | | | | |
| Interest, dividends and principal paydowns | | | 12,247,892 | |
| Shares of beneficial interest sold | | | 6,491,774 | |
| Variation margin receivable – futures contracts | | | 6,469,591 | |
| Investments sold | | | 397,751 | |
| Other | | | 218,092 | |
| Total assets | | | 1,263,243,917 | |
Liabilities | | | | |
| Unrealized depreciation on forward currency exchange contracts | | | 24,660,550 | |
| Options written, at value (premiums received $16,382,608) | | | 9,633,749 | |
| Swaps, at value (premiums paid $70,684) | | | 377,680 | |
| Variation margin payable - centrally cleared swaps | | | 8,059 | |
| Swaptions written, at value (premiums received $9,384,610) | | | 8,419,122 | |
| Payables and other liabilities: | | | | |
| Investments purchased | | | 86,512,801 | |
| Administration fees | | | 448,046 | |
| Shareholder communications | | | 219,094 | |
| Foreign capital gains tax | | | 211,397 | |
| Shares of beneficial interest redeemed | | | 167,551 | |
| Distribution and service plan fees | | | 155,247 | |
| Trustees’ compensation | | | 154,825 | |
| Advisory fees | | | 20,956 | |
| Transfer and shareholder servicing agent fees | | | 16,578 | |
| Other | | | 575,675 | |
| Total liabilities | | | 131,581,330 | |
| Net Assets | | $ | 1,131,662,587 | |
| | | | |
| | | | | |
Composition of Net Assets | | | | |
| Shares of beneficial interest | | $ | 1,258,384,046 | |
| Total accumulated gain (loss) | | | (126,721,459 | ) |
| Net Assets | | $ | 1,131,662,587 | |
| | | | |
| | | | | |
Net Asset Value Per Share | | | | |
| Series I Shares: | | | | |
| Net asset value, redemption price per share and offering price per share (based on net assets of $395,324,060 and 79,502,570 shares of beneficial interest outstanding) | | | $4.97 | |
| Series II Shares: | | | | |
| Net asset value, redemption price per share and offering price per share (based on net assets of $736,338,527 and 143,648,854 shares of beneficial interest outstanding) | | | $5.13 | |
See accompanying Notes to Consolidated Financial Statements.
35 INVESCO OPPENHEIMER V.I. GLOBAL STRATEGIC INCOME FUND
CONSOLIDATED STATEMENT OF OPERATIONSFor the Year Ended December 31, 2019
| | | | |
Investment Income | | | | |
| Interest: | | | | |
| Unaffiliated companies (net of foreign withholding taxes of $933,897) | | $ | 70,859,227 | |
| Affiliated companies | | | 3,906,636 | |
| Dividends: | | | | |
| Unaffiliated companies (net of foreign withholding taxes of $31,849) | | | 319,097 | |
| Affiliated companies | | | 3,968,082 | |
| Total investment income | | | 79,053,042 | |
Expenses | | | | |
| Advisory fees | | | 8,755,844 | |
| Administration fees | | | 1,339,831 | |
| Distribution and service plan fees: | | | | |
| Series II shares | | | 2,540,423 | |
| Transfer and shareholder servicing agent fees: | | | | |
| Series I shares | | | 187,377 | |
| Series II shares | | | 552,393 | |
| Shareholder communications: | | | | |
| Series I shares | | | 76,431 | |
| Series II shares | | | 192,558 | |
| Custodian fees and expenses | | | 251,940 | |
| Trustees’ compensation | | | 46,851 | |
| Borrowing fees | | | 18,328 | |
| Other | | | 228,827 | |
| Total expenses | | | 14,190,803 | |
| Less waivers, reimbursement of expenses and offset arrangement(s) | | | (794,794 | ) |
| Net expenses | | | 13,396,009 | |
Net Investment Income | | | 65,657,033 | |
Realized and Unrealized Gain (Loss) | | | | |
| Net realized gain (loss) on: | | | | |
| Investment transactions in: | | | | |
Unaffiliated companies (net of foreign capital gains tax of $164,111) (includes net gain (loss) from securities sold to affiliates of $(1,058,693)) | | | 5,324,583 | |
Affiliated companies | | | (7,526,687 | ) |
| Option contracts written | | | 21,706,688 | |
| Futures contracts | | | (9,571,924 | ) |
| Foreign currency transactions | | | 979,792 | |
| Forward currency exchange contracts | | | (4,410,872 | ) |
| Swap contracts | | | (1,221,658 | ) |
| Swaption contracts written | | | (9,988,084 | ) |
| Net realized loss | | | (4,708,162 | ) |
| Net change in unrealized appreciation/(depreciation) on: | | | | |
| Investment transactions in: | | | | |
Unaffiliated companies (net of foreign capital gains tax of $211,397) | | | 62,684,989 | |
Affiliated companies | | | 10,327,478 | |
| Translation of assets and liabilities denominated in foreign currencies | | | (96,115 | ) |
| Forward currency exchange contracts | | | (5,224,482 | ) |
| Futures contracts | | | 33,875 | |
| Option contracts written | | | 4,005,204 | |
| Swap contracts | | | (194,218 | ) |
| Swaption contracts written | | | 8,302,645 | |
| Net change in unrealized appreciation/(depreciation) | | | 79,839,376 | |
Net Increase in Net Assets Resulting from Operations | | $ | 140,788,247 | |
| | | | |
| | | | |
See accompanying Notes to Consolidated Financial Statements.
36 INVESCO OPPENHEIMER V.I. GLOBAL STRATEGIC INCOME FUND
CONSOLIDATED STATEMENT OF CHANGES IN NET ASSETS
| | | | | | | | |
| | | Year Ended December 31, 2019 | | | Year Ended December 31, 2018 | |
Operations | | | | | | | | |
| Net investment income | | $ | 65,657,033 | | | $ | 77,241,242 | |
| Net realized loss | | | (4,708,162 | ) | | | (30,542,149 | ) |
| Net change in unrealized appreciation/(depreciation) | | | 79,839,376 | | | | (120,343,292 | ) |
| Net increase (decrease) in net assets resulting from operations | | | 140,788,247 | | | | (73,644,199 | ) |
Dividends and/or Distributions to Shareholders | | | | | | | | |
| Distributions to shareholders from distributable earnings: | | | | | | | | |
| Series I shares | | | (15,389,942 | ) | | | (18,866,160 | ) |
| Series II shares | | | (36,879,378 | ) | | | (54,450,673 | ) |
| Total distributions from distributable earnings | | | (52,269,320 | ) | | | (73,316,833 | ) |
Beneficial Interest Transactions | | | | | | | | |
| Net increase (decrease) in net assets resulting from beneficial interest transactions: | | | | | | | | |
| Series I shares | | | 25,392,026 | | | | (10,549,208 | ) |
| Series II shares | | | (410,787,898 | ) | | | (84,976,296 | ) |
| Total beneficial interest transactions | | | (385,395,872 | ) | | | (95,525,504 | ) |
Net Assets | | | | | | | | |
| Total decrease | | | (296,876,945 | ) | | | (242,486,536 | ) |
| Beginning of period | | | 1,428,539,532 | | | | 1,671,026,068 | |
| End of period | | $ | 1,131,662,587 | | | $ | 1,428,539,532 | |
| | | | | | | | |
See accompanying Notes to Consolidated Financial Statements.
37 INVESCO OPPENHEIMER V.I. GLOBAL STRATEGIC INCOME FUND
CONSOLIDATED FINANCIAL HIGHLIGHTS
| | | | | | | | | | | | | | | | | | | | |
| Series I Shares | | Year Ended December 31, 2019 | | | Year Ended December 31, 2018 | | | Year Ended December 31, 2017 | | | Year Ended December 31, 2016 | | | Year Ended December 31, 2015 | |
Per Share Operating Data | | | | | | | | | | | | | | | | | | | | |
| Net asset value, beginning of period | | | $4.66 | | | | $5.13 | | | | $4.94 | | | | $4.88 | | | | $5.30 | |
| Income (loss) from investment operations: | | | | | | | | | | | | | | | | | | | | |
| Net investment income1 | | | 0.24 | | | | 0.25 | | | | 0.22 | | | | 0.20 | | | | 0.23 | |
| Net realized and unrealized gain (loss) | | | 0.26 | | | | (0.47) | | | | 0.09 | | | | 0.11 | | | | (0.34) | |
| Total from investment operations | | | 0.50 | | | | (0.22) | | | | 0.31 | | | | 0.31 | | | | (0.11) | |
| Dividends and/or distributions to shareholders: | | | | | | | | | | | | | | | | | | | | |
| Dividends from net investment income | | | (0.19) | | | | (0.25) | | | | (0.12) | | | | (0.25) | | | | (0.31) | |
| Net asset value, end of period | | | $4.97 | | | | $4.66 | | | | $5.13 | | | | $4.94 | | | | $4.88 | |
| | | | | | | | | | | | | | | | | | | | |
| | | | | | | | | | | | | | | | | | | | | |
Total Return, at Net Asset Value2 | | | 10.80% | | | | (4.40)% | | | | 6.27% | | | | 6.53% | | | | (2.26)% | |
| | | | | | | | | | | | | | | | | | | | | |
Ratios/Supplemental Data | | | | | | | | | | | | | | | | | | | | |
| Net assets, end of period (in thousands) | | | $395,324 | | | | $346,707 | | | | $393,337 | | | | $401,308 | | | | $429,710 | |
| Average net assets (in thousands) | | | $390,297 | | | | $385,157 | | | | $400,945 | | | | $416,054 | | | | $510,765 | |
| Ratios to average net assets:3 | | | | | | | | | | | | | | | | | | | | |
| Net investment income4 | | | 4.86% | | | | 5.07% | | | | 4.40% | | | | 4.00% | | | | 4.51% | |
| Expenses excluding specific expenses listed below | | | 0.82% | | | | 0.88%5 | | | | 0.82%5 | | | | 0.79%5 | | | | 0.76%5 | |
| Interest and fees from borrowings6 | | | 0.00% | | | | 0.00% | | | | 0.00% | | | | 0.00% | | | | 0.00% | |
| Total expenses7 | | | 0.82% | | | | 0.88%5 | | | | 0.82%5 | | | | 0.79%5 | | | | 0.76%5 | |
| Expenses after payments, waivers and/or reimbursements and reduction to custodian expenses | | | 0.77% | | | | 0.81%5 | | | | 0.76%5 | | | | 0.74%5 | | | | 0.73%5 | |
| Portfolio turnover rate8,9 | | | 134% | | | | 68% | | | | 74% | | | | 80% | | | | 79% | |
1. Calculated based on the average shares outstanding during the period.
2. Includes adjustments in accordance with accounting principles generally accepted in the United States of America and as such, the net asset value for financial reporting purposes and the returns based upon those net asset values may differ from the net asset value and returns for shareholder transactions. Total returns are not annualized for periods less than one year, if applicable and do not reflect charges assessed in connection with a variable product, which if included would reduce total returns.
3. Annualized for periods less than one full year.
4. Includes the Fund’s share of the allocated net investment income from Invesco Oppenheimer Master Event-Linked Bond Fund and Invesco Oppenheimer Master Loan Fund.
5. Includes the Fund’s share of the allocated expenses from Invesco Oppenheimer Master Event-Linked Bond Fund and Invesco Oppenheimer Master Loan Fund.
6. Less than 0.005%.
7. Total expenses including indirect expenses from fund fees and expenses were as follows:
| | | | | | |
| | Year Ended December 31, 2019 | | | 0.86 | % |
| | Year Ended December 31, 2018 | | | 0.90 | % |
| | Year Ended December 31, 2017 | | | 0.83 | % |
| | | Year Ended December 31, 2016 | | | 0.80 | % |
| | Year Ended December 31, 2015 | | | 0.77 | % |
8. The portfolio turnover rate excludes purchase and sale transactions of To Be Announced (TBA) mortgage-related securities as follows:
| | | | | | | | |
| | | Purchase Transactions | | | Sale Transactions | |
| Year Ended December 31, 2019 | | | $2,177,497,748 | | | | $2,279,114,634 | |
| Year Ended December 31, 2018 | | | $2,370,164,194 | | | | $2,399,236,376 | |
| Year Ended December 31, 2017 | | | $2,271,944,419 | | | | $2,153,905,799 | |
| Year Ended December 31, 2016 | | | $1,798,210,272 | | | | $1,766,445,159 | |
| Year Ended December 31, 2015 | | | $1,225,140,927 | | | | $1,266,426,777 | |
9. Portfolio turnover is calculated at the fund level and is not annualized for periods less than one year, if applicable.
See accompanying Notes to Consolidated Financial Statements.
38 INVESCO OPPENHEIMER V.I. GLOBAL STRATEGIC INCOME FUND
| | | | | | | | | | | | | | | | | | | | |
| Series II Shares | | Year Ended
December 31,
2019 | | | Year Ended
December 31,
2018 | | | Year Ended
December 31,
2017 | | | Year Ended
December 31,
2016 | | | Year Ended
December 31,
2015 | |
Per Share Operating Data | | | | | | | | | | | | | | | | | | | | |
| Net asset value, beginning of period | | | $4.80 | | | | $5.27 | | | | $5.07 | | | | $5.00 | | | | $5.42 | |
| Income (loss) from investment operations: | | | | | | | | | | | | | | | | | | | | |
| Net investment income1 | | | 0.23 | | | | 0.24 | | | | 0.22 | | | | 0.19 | | | | 0.23 | |
| Net realized and unrealized gain (loss) | | | 0.27 | | | | (0.48) | | | | 0.08 | | | | 0.12 | | | | (0.35) | |
| Total from investment operations | | | 0.50 | | | | (0.24) | | | | 0.30 | | | | 0.31 | | | | (0.12) | |
| Dividends and/or distributions to shareholders: | | | | | | | | | | | | | | | | | | | | |
| Dividends from net investment income | | | (0.17) | | | | (0.23) | | | | (0.10) | | | | (0.24) | | | | (0.30) | |
| Net asset value, end of period | | | $5.13 | | | | $4.80 | | | | $5.27 | | | | $5.07 | | | | $5.00 | |
| | | | | | | | | | | | | | | | | | | | |
| | | | | | | | | | | | | | | | | | | | | |
Total Return, at Net Asset Value2 | | | 10.61% | | | | (4.54)% | | | | 6.04% | | | | 6.27% | | | | (2.49)% | |
| | | | | | | | | | | | | | | | | | | | | |
Ratios/Supplemental Data | | | | | | | | | | | | | | | | | | | | |
| Net assets, end of period (in thousands) | | | $736,339 | | | | $1,081,833 | | | | $1,277,689 | | | | $1,284,022 | | | | $1,375,143 | |
| Average net assets (in thousands) | | | $1,015,322 | | | | $1,196,988 | | | | $1,295,999 | | | | $1,332,343 | | | | $1,496,350 | |
| Ratios to average net assets:3 | | | | | | | | | | | | | | | | | | | | |
| Net investment income4 | | | 4.60% | | | | 4.82% | | | | 4.15% | | | | 3.75% | | | | 4.26% | |
| Expenses excluding specific expenses listed below | | | 1.08% | | | | 1.13%5 | | | | 1.07%5 | | | | 1.04%5 | | | | 1.01%5 | |
| Interest and fees from borrowings6 | | | 0.00% | | | | 0.00% | | | | 0.00% | | | | 0.00% | | | | 0.00% | |
| Total expenses7 | | | 1.08% | | | | 1.13%5 | | | | 1.07%5 | | | | 1.04%5 | | | | 1.01%5 | |
| Expenses after payments, waivers and/or reimbursements and reduction to custodian expenses | | | 1.02% | | | | 1.06%5 | | | | 1.01%5 | | | | 0.99%5 | | | | 0.98%5 | |
| Portfolio turnover rate8,9 | | | 134% | | | | 68% | | | | 74% | | | | 80% | | | | 79% | |
1. Calculated based on the average shares outstanding during the period.
2. Includes adjustments in accordance with accounting principles generally accepted in the United States of America and as such, the net asset value for financial reporting purposes and the returns based upon those net asset values may differ from the net asset value and returns for shareholder transactions. Total returns are not annualized for periods less than one year, if applicable and do not reflect charges assessed in connection with a variable product, which if included would reduce total returns.
3. Annualized for periods less than one full year.
4. Includes the Fund’s share of the allocated net investment income from Invesco Oppenheimer Master Event-Linked Bond Fund and Invesco Oppenheimer Master Loan Fund.
5. Includes the Fund’s share of the allocated expenses from Invesco Oppenheimer Master Event-Linked Bond Fund and Invesco Oppenheimer Master Loan Fund.
6. Less than 0.005%.
7. Total expenses including indirect expenses from fund fees and expenses were as follows:
| | | | | | |
| | Year Ended December 31, 2019 | | | 1.12 | % |
| | | Year Ended December 31, 2018 | | | 1.15 | % |
| | Year Ended December 31, 2017 | | | 1.08 | % |
| | Year Ended December 31, 2016 | | | 1.05 | % |
| | Year Ended December 31, 2015 | | | 1.02 | % |
8. The portfolio turnover rate excludes purchase and sale transactions of To Be Announced (TBA) mortgage-related securities as follows:
| | | | | | | | |
| | | Purchase Transactions | | | Sale Transactions | |
| Year Ended December 31, 2019 | | | $2,177,497,748 | | | | $2,279,114,634 | |
| Year Ended December 31, 2018 | | | $2,370,164,194 | | | | $2,399,236,376 | |
| Year Ended December 31, 2017 | | | $2,271,944,419 | | | | $2,153,905,799 | |
| Year Ended December 31, 2016 | | | $1,798,210,272 | | | | $1,766,445,159 | |
| Year Ended December 31, 2015 | | | $1,225,140,927 | | | | $1,266,426,777 | |
9. Portfolio turnover is calculated at the fund level and is not annualized for periods less than one year, if applicable.
See accompanying Notes to Consolidated Financial Statements.
39 INVESCO OPPENHEIMER V.I. GLOBAL STRATEGIC INCOME FUND
NOTES TO CONSOLIDATED FINANCIAL STATEMENTSDecember 31, 2019
Note 1 – Significant Accounting Policies
Invesco Oppenheimer V.I. Global Strategic Income Fund (the “Fund”) is a series portfolio of AIM Variable Insurance Funds (Invesco Variable Insurance Funds) (the “Trust”). The Trust is a Delaware statutory trust registered under the Investment Company Act of 1940, as amended (the “1940 Act”), as an open-end series management investment company authorized to issue an unlimited number of shares of beneficial interest. Information presented in these consolidated financial statements pertains only to the Fund. Matters affecting the Fund or each class will be voted on exclusively by the shareholders of such Fund or each class.
Prior to the close of business on May 24, 2019, the Fund operated as Oppenheimer Global Strategic Income Fund/VA (the “Acquired Fund” or “Predecessor Fund”). The Acquired Fund was reorganized after the close of business on May 24, 2019 (the “Reorganization Date”) through the transfer of all of its assets and liabilities to the Fund (the “Reorganization”).
Upon closing of the Reorganization, holders of the Acquired Fund’s Non-Service and Service shares received Series I and Series II shares of the Fund, respectively. Information for the Acquired Fund’s Non-Service and Service shares prior to the Reorganization is included with Series I and Series II, respectively, throughout this report.
The Fund will seek to gain exposure to Regulation S securities primarily through investments in the Invesco Oppenheimer V.I Global Strategic Income Fund (Cayman) Ltd. (the “Subsidiary”), a wholly-owned and controlled subsidiary by the Fund organized under the laws of the Cayman Islands. The Subsidiary was organized by the Fund to invest in Regulation S securities. The Fund may invest up to 25% of its total assets in the Subsidiary.
The Fund’s investment objective is to seek total return.
The Fund currently offers two classes of shares, Series I and Series II, both of which are offered to insurance company separate accounts funding variable annuity contracts and variable life insurance policies (“variable products”).
The Fund is an investment company and accordingly follows the investment company accounting and reporting guidance in accordance with Financial Accounting Standards Board Accounting Standards Codification Topic 946, Financial Services – Investment Companies.
The following is a summary of the significant accounting policies followed by the Fund in the preparation of its consolidated financial statements.
| A. | Security Valuations - Securities, including restricted securities, are valued according to the following policy. |
Debt obligations (including convertible securities) and unlisted equities are fair valued using an evaluated quote provided by an independent pricing service. Evaluated quotes provided by the pricing service may be determined without exclusive reliance on quoted prices, and may reflect appropriate factors such as institution-size trading in similar groups of securities, developments related to specific securities, dividend rate (for unlisted equities), yield (for debt obligations), quality, type of issue, coupon rate (for debt obligations), maturity (for debt obligations), individual trading characteristics and other market data. Pricing services generally value debt obligations assuming orderly transactions of institutional round lot size, but a fund may hold or transact in the same securities in smaller, odd lot sizes. Odd lots often trade at lower prices than institutional round lots. Debt obligations are subject to interest rate and credit risks. In addition, all debt obligations involve some risk of default with respect to interest and/or principal payments.
A security listed or traded on an exchange (except convertible securities) is valued at its last sales price or official closing price as of the close of the customary trading session on the exchange where the security is principally traded, or lacking any sales or official closing price on a particular day, the security may be valued at the closing bid price on that day. Securities traded in the over-the-counter market are valued based on prices furnished by independent pricing services or market makers. When such securities are valued by an independent pricing service they may be considered fair valued. Futures contracts are valued at the final settlement price set by an exchange on which they are principally traded. Listed options are valued at the mean between the last bid and asked prices from the exchange on which they are principally traded. Options not listed on an exchange are valued by an independent source at the mean between the last bid and asked prices. For purposes of determining net asset value (“NAV”) per share, futures and option contracts generally are valued 15 minutes after the close of the customary trading session of the New York Stock Exchange (“NYSE”).
Investments in open-end and closed-end registered investment companies that do not trade on an exchange are valued at the end-of-day net asset value per share. Investments in open-end and closed-end registered investment companies that trade on an exchange are valued at the last sales price or official closing price as of the close of the customary trading session on the exchange where the security is principally traded.
Swap agreements are fair valued using an evaluated quote, if available, provided by an independent pricing service. Evaluated quotes provided by the pricing service are valued based on a model which may include end-of-day net present values, spreads, ratings, industry, company performance and returns of referenced assets. Centrally cleared swap agreements are valued at the daily settlement price determined by the relevant exchange or clearinghouse.
Foreign securities’ (including foreign exchange contracts) prices are converted into U.S. dollar amounts using the applicable exchange rates as of the close of the NYSE. If market quotations are available and reliable for foreign exchange-traded equity securities, the securities will be valued at the market quotations. Because trading hours for certain foreign securities end before the close of the NYSE, closing market quotations may become unreliable. If between the time trading ends on a particular security and the close of the customary trading session on the NYSE, events occur that the investment adviser determines are significant and make the closing price unreliable, the Fund may fair value the security. If the event is likely to have affected the closing price of the security, the security will be valued at fair value in good faith using procedures approved by the Board of Trustees. Adjustments to closing prices to reflect fair value may also be based on a screening process of an independent pricing service to indicate the degree of certainty, based on historical data, that the closing price in the principal market where a foreign security trades is not the current value as of the close of the NYSE. Foreign securities’ prices meeting the approved degree of certainty that the price is not reflective of current value will be priced at the indication of fair value from the independent pricing service. Multiple factors may be considered by the independent pricing service in determining adjustments to reflect fair value and may include information relating to sector indices, American Depositary Receipts and domestic and foreign index futures. Foreign securities may have additional risks including exchange rate changes, potential for sharply devalued currencies and high inflation, political and economic upheaval, the relative lack of issuer information, relatively low market liquidity and the potential lack of strict financial and
40 INVESCO OPPENHEIMER V.I. GLOBAL STRATEGIC INCOME FUND
accounting controls and standards.
Securities for which market prices are not provided by any of the above methods may be valued based upon quotes furnished by independent sources. The last bid price may be used to value equity securities. The mean between the last bid and asked prices is used to value debt obligations, including corporate loans.
Securities for which market quotations are not readily available or became unreliable are valued at fair value as determined in good faith by or under the supervision of the Trust’s officers following procedures approved by the Board of Trustees. Issuer specific events, market trends, bid/ asked quotes of brokers and information providers and other market data may be reviewed in the course of making a good faith determination of a security’s fair value.
The Fund may invest in securities that are subject to interest rate risk, meaning the risk that the prices will generally fall as interest rates rise and, conversely, the prices will generally rise as interest rates fall. Specific securities differ in their sensitivity to changes in interest rates depending on their individual characteristics. Changes in interest rates may result in increased market volatility, which may affect the value and/or liquidity of certain Fund investments.
Valuations change in response to many factors including the historical and prospective earnings of the issuer, the value of the issuer’s assets, general economic conditions, interest rates, investor perceptions and market liquidity. Because of the inherent uncertainties of valuation, the values reflected in the consolidated financial statements may materially differ from the value received upon actual sale of those investments.
| B. | Securities Transactions and Investment Income -Securities transactions are accounted for on a trade date basis. Realized gains or losses on sales are computed on the basis of specific identification of the securities sold. Interest income (net of withholding tax, if any) is recorded on the accrual basis from settlement date. Bond premiums and discounts are amortized and/or accreted over the lives of the respective securities. Pay-in-kind interest income and non-cash dividend income received in the form of securities in-lieu of cash are recorded at the fair value of the securities received. Paydown gains and losses on mortgage and asset-backed securities are recorded as adjustments to interest income. Dividend income (net of withholding tax, if any) is recorded on the ex-dividend date. |
The Fund may periodically participate in litigation related to Fund investments. As such, the Fund may receive proceeds from litigation settlements. Any proceeds received are included in the Consolidated Statement of Operations as realized gain (loss) for investments no longer held and as unrealized gain (loss) for investments still held.
Brokerage commissions and mark ups are considered transaction costs and are recorded as an increase to the cost basis of securities purchased and/or a reduction of proceeds on a sale of securities. Such transaction costs are included in the determination of net realized and unrealized gain (loss) from investment transactions reported in the Consolidated Statement of Operations and the Consolidated Statement of Changes in Net Assets and the net realized and unrealized gains (losses) on securities per share in the Consolidated Financial Highlights. Transaction costs are included in the calculation of the Fund’s net asset value and, accordingly, they reduce the Fund’s total returns. These transaction costs are not considered operating expenses and are not reflected in net investment income reported in the Consolidated Statement of Operations and the Consolidated Statement of Changes in Net Assets, or the net investment income per share and the ratios of expenses and net investment income reported in the Consolidated Financial Highlights, nor are they limited by any expense limitation arrangements between the Fund and the investment adviser.
The Fund allocates income and realized and unrealized capital gains and losses to a class based on the relative net assets of each class.
| C. | Country Determination- For the purposes of making investment selection decisions and presentation in the Consolidated Schedule of Investments, the investment adviser may determine the country in which an issuer is located and/or credit risk exposure based on various factors. These factors include the laws of the country under which the issuer is organized, where the issuer maintains a principal office, the country in which the issuer derives 50% or more of its total revenues and the country that has the primary market for the issuer’s securities, as well as other criteria. Among the other criteria that may be evaluated for making this determination are the country in which the issuer maintains 50% or more of its assets, the type of security, financial guarantees and enhancements, the nature of the collateral and the sponsor organization. |
| D. | Distributions -Dividends and distributions to shareholders, which are determined in accordance with income tax regulations and may differ from accounting principles generally accepted in the United States of America (“GAAP”), are recorded on the ex-dividend date. Income distributions, if any, are declared daily and paid annually to separate accounts of participating insurance companies. Capital gain distributions, if any, are declared and paid annually or at other times as determined necessary by the Adviser. |
| E. | Federal Income Taxes -The Fund intends to comply with the requirements of Subchapter M of the Internal Revenue Code of 1986, as amended (the “Internal Revenue Code”), necessary to qualify as a regulated investment company and to distribute substantially all of the Fund’s taxable earnings to shareholders. As such, the Fund will not be subject to federal income taxes on otherwise taxable income (including net realized capital gain) that is distributed to shareholders. Therefore, no provision for federal income taxes is recorded in the consolidated financial statements. |
The Fund recognizes the tax benefits of uncertain tax positions only when the position is more likely than not to be sustained. Management has analyzed the Fund’s uncertain tax positions and concluded that no liability for unrecognized tax benefits should be recorded related to uncertain tax positions. Management is not aware of any tax positions for which it is reasonably possible that the total amounts of unrecognized tax benefits will change materially in the next 12 months.
The Subsidiary is classified as a controlled foreign corporation under Subchapter N of the Internal Revenue Code. Therefore, the Fund is required to increase its taxable income by its share of the Subsidiary’s income. Net investment losses of the Subsidiary cannot be deducted by the Fund in the current period nor carried forward to offset taxable income in future periods.
The Fund files tax returns in the U.S. Federal jurisdiction and certain other jurisdictions. Generally, the Fund is subject to examinations by such taxing authorities for up to three years after the filing of the return for the tax period.
| F. | Expenses -Fees provided for under the Rule 12b-1 plan of a particular class of the Fund are charged to the operations of such class. Transfer agency fees and expenses and other shareholder recordkeeping fees and expenses relating to all other classes are allocated among those classes based on |
41 INVESCO OPPENHEIMER V.I. GLOBAL STRATEGIC INCOME FUND
NOTES TO CONSOLIDATED FINANCIAL STATEMENTSContinued
| | relative net assets. All other expenses are allocated among the classes based on relative net assets. |
| G. | Accounting Estimates -The consolidated financial statements are prepared on a basis in conformity with GAAP, which requires management to make estimates and assumptions that affect the reported amounts of assets and liabilities at the date of the consolidated financial statements and the reported amounts of revenues and expenses during the reporting period including estimates and assumptions related to taxation. Actual results could differ from those estimates by a significant amount. The accompanying consolidated financial statements reflect the financial position of the Fund and its Subsidiary and the results of operations on a consolidated basis. All inter-company accounts and transactions have been eliminated in consolidation. In addition, the Fund monitors for material events or transactions that may occur or become known after the period-end date and before the date the consolidated financial statements are released to print. |
| H. | Indemnifications -Under the Trust’s organizational documents, each Trustee, officer, employee or other agent of the Trust, and under the Subsidiary’s organizational documents, the directors and officers of the Subsidiary, are indemnified against certain liabilities that may arise out of the performance of their duties to the Fund and/or the Subsidiary, respectively. Additionally, in the normal course of business, the Fund enters into contracts, including the Fund’s servicing agreements, that contain a variety of indemnification clauses. The Fund’s maximum exposure under these arrangements is unknown as this would involve future claims that may be made against the Fund that have not yet occurred. The risk of material loss as a result of such indemnification claims is considered remote. |
| I. | Foreign Currency Translations -Foreign currency is valued at the close of the NYSE based on quotations posted by banks and major currency dealers. Portfolio securities and other assets and liabilities denominated in foreign currencies are translated into U.S. dollar amounts at the date of valuation. Purchases and sales of portfolio securities (net of foreign taxes withheld on disposition) and income items denominated in foreign currencies are translated into U.S. dollar amounts on the respective dates of such transactions. The Fund does not separately account for the portion of the results of operations resulting from changes in foreign exchange rates on investments and the fluctuations arising from changes in market prices of securities held. The combined results of changes in foreign exchange rates and the fluctuation of market prices on investments (net of estimated foreign tax withholding) are included with the net realized and unrealized gain or loss from investments in the Consolidated Statement of Operations. Reported net realized foreign currency gains or losses arise from (1) sales of foreign currencies, (2) currency gains or losses realized between the trade and settlement dates on securities transactions, and (3) the difference between the amounts of dividends, interest, and foreign withholding taxes recorded on the Fund’s books and the U.S. dollar equivalent of the amounts actually received or paid. Net unrealized foreign currency gains and losses arise from changes in the fair values of assets and liabilities, other than investments in securities at fiscal period end, resulting from changes in exchange rates. The Fund may invest in foreign securities, which may be subject to foreign taxes on income, gains on investments or currency repatriation, a portion of which may be recoverable. Foreign taxes, if any, are recorded based on the tax regulations and rates that exist in the foreign markets in which the Fund invests and are shown in the Consolidated Statement of Operations. |
| J. | Forward Foreign Currency Contracts - The Fund may engage in foreign currency transactions either on a spot (i.e. for prompt delivery and settlement) basis, or through forward foreign currency contracts, to manage or minimize currency or exchange rate risk. |
The Fund may also enter into forward foreign currency contracts for the purchase or sale of a security denominated in a foreign currency in order to “lock in” the U.S. dollar price of that security, or the Fund may also enter into forward foreign currency contracts that do not provide for physical settlement of the two currencies, but instead are settled by a single cash payment calculated as the difference between the agreed upon exchange rate and the spot rate at settlement based upon an agreed upon notional amount (non-deliverable forwards). The Fund will set aside liquid assets in an amount equal to the daily mark-to-market obligation for forward foreign currency contracts.
A forward foreign currency contract is an obligation between two parties (“Counterparties”) to purchase or sell a specific currency for an agreed-upon price at a future date. The use of forward foreign currency contracts does not eliminate fluctuations in the price of the underlying securities the Fund owns or intends to acquire but establishes a rate of exchange in advance. Fluctuations in the value of these contracts are measured by the difference in the contract date and reporting date exchange rates and are recorded as unrealized appreciation (depreciation) until the contracts are closed. When the contracts are closed, realized gains (losses) are recorded. Realized and unrealized gains (losses) on the contracts are included in the Consolidated Statement of Operations. The primary risks associated with forward foreign currency contracts include failure of the Counterparty to meet the terms of the contract and the value of the foreign currency changing unfavorably. These risks may be in excess of the amounts reflected in the Consolidated Statement of Assets and Liabilities.
| K. | Treasury Inflation-Protected Securities -The Fund may invest in Treasury Inflation-Protected Securities (“TIPS”). TIPS are fixed income securities whose principal value is periodically adjusted to the rate of inflation. The principal value of TIPS will be adjusted upward or downward, and any increase or decrease in the principal amount of TIPS will be shown as Treasury Inflation-Protected Securities inflation adjustments in the Consolidated Statement of Operations, even though investors do not receive their principal until maturity. |
| L. | Structured Securities -The Fund may invest in structured securities. Structured securities are a type of derivative security whose value is determined by reference to changes in the value of underlying securities, currencies, interest rates, commodities, indices or other financial indicators (“reference instruments”). Most structured securities are fixed-income securities that have maturities of three years or less. Structured securities may be positively or negatively indexed (i.e., their principal value or interest rates may increase or decrease if the underlying reference instrument appreciates) and may have return characteristics similar to direct investments in the underlying reference instrument. |
Structured securities may entail a greater degree of market risk than other types of debt securities because the investor bears the risk of the reference instruments. In addition to the credit risk of structured securities and the normal risks of price changes in response to changes in interest rates, the principal amount of structured notes or indexed securities may decrease as a result of changes in the value of the underlying reference instruments. Changes in the daily value of structured securities are recorded as unrealized gains (losses) in the Consolidated Statement of Operations. When the structured securities mature or are sold, the Fund recognizes a realized gain (loss) on the Consolidated Statement of Operations.”
| M. | Futures Contracts- The Fund may enter into futures contracts to manage exposure to interest rate, equity and market price movements and/or |
42 INVESCO OPPENHEIMER V.I. GLOBAL STRATEGIC INCOME FUND
| | currency risks. A futures contract is an agreement between Counterparties to purchase or sell a specified underlying security, currency or commodity (or delivery of a cash settlement price, in the case of an index future) for a fixed price at a future date. The Fund currently invests only in exchange-traded futures and they are standardized as to maturity date and underlying financial instrument. Initial margin deposits required upon entering into futures contracts are satisfied by the segregation of specific securities or cash as collateral at the futures commission merchant (broker). During the period the futures contracts are open, changes in the value of the contracts are recognized as unrealized gains or losses by recalculating the value of the contracts on a daily basis. Subsequent or variation margin payments are received or made depending upon whether unrealized gains or losses are incurred. These amounts are reflected as receivables or payables on the Consolidated Statement of Assets and Liabilities. When the contracts are closed or expire, the Fund recognizes a realized gain or loss equal to the difference between the proceeds from, or cost of, the closing transaction and the Fund’s basis in the contract. The net realized gain (loss) and the change in unrealized gain (loss) on futures contracts held during the period is included on the Consolidated Statement of Operations. The primary risks associated with futures contracts are market risk and the absence of a liquid secondary market. If the Fund were unable to liquidate a futures contract and/or enter into an offsetting closing transaction, the Fund would continue to be subject to market risk with respect to the value of the contracts and continue to be required to maintain the margin deposits on the futures contracts. Futures contracts have minimal Counterparty risk since the exchange’s clearinghouse, as Counterparty to all exchange-traded futures, guarantees the futures against default. Risks may exceed amounts recognized in the Consolidated Statement of Assets and Liabilities. |
| N. | Swap Agreements - The Fund may enter into various swap transactions, including interest rate, total return, index, currency and credit default swap contracts (“CDS”) for investment purposes or to manage interest rate, currency or credit risk. Such transactions are agreements between Counterparties. A swap agreement may be negotiated bilaterally and traded over-the-counter (“OTC”) between two parties (“uncleared/OTC”) or, in some instances, must be transacted through a future commission merchant (“FCM”) and cleared through a clearinghouse that serves as a central Counterparty (“centrally cleared swap”). These agreements may contain among other conditions, events of default and termination events, and various covenants and representations such as provisions that require the Fund to maintain a pre-determined level of net assets, and/or provide limits regarding the decline of the Fund’s NAV over specific periods of time. If the Fund were to trigger such provisions and have open derivative positions at that time, the Counterparty may be able to terminate such agreement and request immediate payment in an amount equal to the net liability positions, if any. |
Interest rate, total return, index, and currency swap agreements are two-party contracts entered into primarily to exchange the returns (or differentials in rates of returns) earned or realized on particular predetermined investments or instruments. The gross returns to be exchanged or “swapped” between the parties are calculated with respect to a notional amount, i.e., the return on or increase in value of a particular dollar amount invested at a particular interest rate or return of an underlying asset, in a particular foreign currency, or in a “basket” of securities representing a particular index.
In a centrally cleared swap, the Fund’s ultimate Counterparty is a central clearinghouse. The Fund initially will enter into centrally cleared swaps through an executing broker. When a fund enters into a centrally cleared swap, it must deliver to the central Counterparty (via the FCM) an amount referred to as “initial margin.” Initial margin requirements are determined by the central Counterparty, but an FCM may require additional initial margin above the amount required by the central Counterparty. Initial margin deposits required upon entering into centrally cleared swaps are satisfied by cash or securities as collateral at the FCM. Securities deposited as initial margin are designated on the Consolidated Schedule of Investments and cash deposited is recorded on the Consolidated Statement of Assets and Liabilities. During the term of a cleared swap agreement, a “variation margin” amount may be required to be paid by the Fund or may be received by the Fund, based on the daily change in price of the underlying reference instrument subject to the swap agreement and is recorded as a receivable or payable for variation margin in the Consolidated Statement of Assets and Liabilities until the centrally cleared swap is terminated at which time a realized gain or loss is recorded.
A CDS is an agreement between Counterparties to exchange the credit risk of an issuer. A buyer of a CDS is said to buy protection by paying a fixed payment over the life of the agreement and in some situations an upfront payment to the seller of the CDS. If a defined credit event occurs (such as payment default or bankruptcy), the Fund as a protection buyer would cease paying its fixed payment, the Fund would deliver eligible bonds issued by the reference entity to the seller, and the seller would pay the full notional value, or the “par value”, of the referenced obligation to the Fund. A seller of a CDS is said to sell protection and thus would receive a fixed payment over the life of the agreement and an upfront payment, if applicable. If a credit event occurs, the Fund as a protection seller would cease to receive the fixed payment stream, the Fund would pay the buyer “par value” or the full notional value of the referenced obligation, and the Fund would receive the eligible bonds issued by the reference entity. In turn, these bonds may be sold in order to realize a recovery value. Alternatively, the seller of the CDS and its Counterparty may agree to net the notional amount and the market value of the bonds and make a cash payment equal to the difference to the buyer of protection. If no credit event occurs, the Fund receives the fixed payment over the life of the agreement. As the seller, the Fund would effectively add leverage to its portfolio because, in addition to its total net assets, the Fund would be subject to investment exposure on the notional amount of the CDS. In connection with these agreements, cash and securities may be identified as collateral in accordance with the terms of the respective swap agreements to provide assets of value and recourse in the event of default under the swap agreement or bankruptcy/insolvency of a party to the swap agreement. If a Counterparty becomes bankrupt or otherwise fails to perform its obligations due to financial difficulties, the Fund may experience significant delays in obtaining any recovery in a bankruptcy or other reorganization proceeding. The Fund may obtain only limited recovery or may obtain no recovery in such circumstances. The Fund’s maximum risk of loss from Counterparty risk, either as the protection seller or as the protection buyer, is the value of the contract. The risk may be mitigated by having a master netting arrangement between the Fund and the Counterparty and by the designation of collateral by the Counterparty to cover the Fund’s exposure to the Counterparty.
Implied credit spreads represent the current level at which protection could be bought or sold given the terms of the existing CDS contract and serve as an indicator of the current status of the payment/performance risk of the CDS. An implied spread that has widened or increased since entry into the initial contract may indicate a deteriorating credit profile and increased risk of default for the reference entity. A declining or narrowing spread
43 INVESCO OPPENHEIMER V.I. GLOBAL STRATEGIC INCOME FUND
NOTES TO CONSOLIDATED FINANCIAL STATEMENTSContinued
may indicate an improving credit profile or decreased risk of default for the reference entity. Alternatively, credit spreads may increase or decrease reflecting the general tolerance for risk in the credit markets.
An interest rate swap is an agreement between Counterparties pursuant to which the parties exchange a floating rate payment for a fixed rate payment based on a specified notional amount.
Changes in the value of centrally cleared and OTC swap agreements are recognized as unrealized gains (losses) in the Consolidated Statement of Operations by “marking to market” on a daily basis to reflect the value of the swap agreement at the end of each trading day. Payments received or paid at the beginning of the agreement are reflected as such on the Consolidated Statement of Assets and Liabilities and may be referred to as upfront payments. The Fund accrues for the fixed payment stream and amortizes upfront payments, if any, on swap agreements on a daily basis with the net amount, recorded as a component of realized gain (loss) on the Consolidated Statement of Operations. A liquidation payment received or made at the termination of a swap agreement is recorded as realized gain (loss) on the Consolidated Statement of Operations. The Fund segregates cash or liquid securities having a value at least equal to the amount of the potential obligation of a Fund under any swap transaction. Cash held as collateral is recorded as deposits with brokers on the Consolidated Statement of Assets and Liabilities. Entering into these agreements involves, to varying degrees, lack of liquidity and elements of credit, market, and Counterparty risk in excess of amounts recognized on the Consolidated Statement of Assets and Liabilities. Such risks involve the possibility that a swap is difficult to sell or liquidate; the Counterparty does not honor its obligations under the agreement and unfavorable interest rates and market fluctuations. It is possible that developments in the swaps market, including potential government regulation, could adversely affect the Fund’s ability to terminate existing swap agreements or to realize amounts to be received under such agreements. A short position in a security poses more risk than holding the same security long. As there is no limit on how much the price of the security can increase, the Fund’s exposure is unlimited.
Notional amounts of each individual credit default swap agreement outstanding as of December 31, 2019 for which the Fund is the seller of protection are disclosed in the open swap agreements table. These potential amounts would be partially offset by any recovery values of the respective referenced obligations, upfront payments received upon entering into the agreement, or net amounts received from the settlement of buy protection credit default swap agreements entered into by the Fund for the same referenced entity or entities.
| O. | Put Options Purchased and Written - The Fund may purchase and write put options including options on securities indexes, or foreign currency and/or futures contracts. By purchasing a put option, the Fund obtains the right (but not the obligation) to sell the option’s underlying instrument at a fixed strike price. In return for this right, the Fund pays an option premium. The option’s underlying instrument may be a security, securities index, or a futures contract. |
Additionally, the Fund may enter into an option on a swap agreement, also called a “swaption”. A swaption is an option that gives the buyer the right, but not the obligation, to enter into a swap on a future date in exchange for paying a market-based premium. A receiver swaption gives the owner the right to receive the total return of a specified asset, reference rate or index. Swaptions also include options that allow an existing swap to be terminated or extended by one of the Counterparties.
Put options may be used by the Fund to hedge securities it owns by locking in a minimum price at which the Fund can sell. If security prices fall, the put option could be exercised to offset all or a portion of the Fund’s resulting losses. At the same time, because the maximum the Fund has at risk is the cost of the option, purchasing put options does not eliminate the potential for the Fund to profit from an increase in the value of the underlying portfolio securities. The Fund may write put options to earn additional income in the form of option premiums if it expects the price of the underlying instrument to remain stable or rise during the option period so that the option will not be exercised. The risk in this strategy is that the price of the underlying securities may decline by an amount greater than the premium received. Put options written are reported as a liability in the Consolidated Statement of Assets and Liabilities. Realized and unrealized gains and losses on put options purchased and put options written are included in the Consolidated Statement of Operations as Net realized gain (loss) from and Change in net unrealized appreciation (depreciation) of Investment securities and Option contracts written, respectively. A risk in buying an option is that the Fund pays a premium whether or not the option is exercised. In addition, there can be no assurance that a liquid secondary market will exist for any option purchased.
| P. | Call Options Purchased and Written - The Fund may write call options and/or buy call options. A covered call option gives the purchaser of such option the right to buy, and the writer the obligation to sell, the underlying security or foreign currency at the stated exercise price during the option period. An uncovered call option exists without the ownership of the underlying security. Options written by the Fund normally will have expiration dates between three and nine months from the date written. The exercise price of a call option may be below, equal to, or above the current market value of the underlying security at the time the option is written. |
Additionally, the Fund may enter into an option on a swap agreement, also called a “swaption”. A swaption is an option that gives the buyer the right, but not the obligation, to enter into a swap on a future date in exchange for paying a market-based premium. A receiver swaption gives the owner the right to receive the total return of a specified asset, reference rate or index. Swaptions also include options that allow an existing swap to be terminated or extended by one of the Counterparties.
When the Fund writes a covered call option, an amount equal to the premium received by the Fund is recorded as an asset and an equivalent liability in the Consolidated Statement of Assets and Liabilities. The amount of the liability is subsequently “marked-to-market” to reflect the current market value of the option written. If a written covered call option expires on the stipulated expiration date, or if the Fund enters into a closing purchase transaction, the Fund realizes a gain (or a loss if the closing purchase transaction exceeds the premium received when the option was written) without regard to any unrealized gain or loss on the underlying security, and the liability related to such option is extinguished. If a written covered call option is exercised, the Fund realizes a gain or a loss from the sale of the underlying security and the proceeds of the sale are increased by the premium originally received. Realized and unrealized gains and losses on call options written are included in the Consolidated Statement of Operations as Net realized gain (loss) from and Change in net unrealized appreciation (depreciation) of Option contracts written. A risk in writing a covered call option is that the Fund gives up the opportunity for profit if the market price of the security increases and the option is exercised. The risk
44 INVESCO OPPENHEIMER V.I. GLOBAL STRATEGIC INCOME FUND
in writing an uncovered call option is that the Fund may incur significant losses if the value of the written security exceeds the exercise price of the option.
When the Fund buys a call option, an amount equal to the premium paid by the Fund is recorded as an investment on the Consolidated Statement of Assets and Liabilities. The amount of the investment is subsequently “marked-to-market” to reflect the current value of the option purchased. Realized and unrealized gains and losses on call options purchased are included in the Consolidated Statement of Operations as Net realized gain (loss) from and Change in net unrealized appreciation (depreciation) of Investment securities. A risk in buying an option is that the Fund pays a premium whether or not the option is exercised. In addition, there can be no assurance that a liquid secondary market will exist for any option purchased.
| Q. | Securities on a When-Issued or Delayed Delivery Basis -The Fund may purchase securities on a “when-issued” basis, and may purchase or sell securities on a “delayed delivery” basis, with payment and delivery scheduled for a future date. No income accrues to the Fund on the securities in connection with such transactions prior to the date the Fund actually takes delivery of the securities. These transactions are subject to market fluctuations and are subject to the risk that the value at delivery may be more or less than the trade date purchase price. Although the Fund will generally purchase these securities with the intention on acquiring such securities, they may sell such securities prior to the settlement date. |
| R. | Dollar Rolls and Forward Commitment Transactions- The Fund may enter into dollar roll transactions to enhance the Fund’s performance. |
The Fund executes its dollar roll transactions in the to be announced (“TBA”) market whereby the Fund makes a forward commitment to purchase a security and, instead of accepting delivery, the position is offset by the sale of the security with a simultaneous agreement to repurchase at a future date.
The Fund accounts for dollar roll transactions as purchases and sales and realizes gains and losses on these transactions. The Fund will segregate liquid assets in an amount equal to its dollar roll commitments. Dollar roll transactions involve the risk that a Counterparty to the transaction may fail to complete the transaction. If this occurs, the Fund may lose the opportunity to purchase or sell the security at the agreed upon price. Dollar roll transactions also involve the risk that the value of the securities retained by the Fund may decline below the price of the securities that the Fund has sold but is obligated to purchase under the agreement. Dollar roll transactions covered in this manner are not treated as senior securities for purposes of a Fund’s fundamental investment limitation on senior securities and borrowings.
| S. | Other Risks- The Fund may invest in lower-quality debt securities, i.e., “junk bonds”. Investments in lower-rated securities or unrated securities of comparable quality tend to be more sensitive to economic conditions than higher rated securities. Junk bonds involve a greater risk of default by the issuer because such securities are generally unsecured and are often subordinated to other creditors’ claim. The Fund will seek to gain exposure to Regulation S securities primarily through an investment in the Subsidiary. Regulation S securities may be relatively less liquid as a result of legal or contractual restrictions on resale. The Fund is indirectly exposed to the risks associated with the Subsidiary’s investments. |
Investments in obligations issued by agencies and instrumentalities of the U.S. Government may vary in the level of support they receive from the government. The government may choose not to provide financial support to government sponsored agencies or instrumentalities if it is not legally obligated to do so. In this case, if the issuer defaulted, the Fund may not be able to recover its investment in such issuer from the U.S. Government.
The Fund may invest in sovereign debt instruments that are subject to the risk that a governmental entity may delay or refuse, or otherwise be unable, to pay interest or repay principal on its sovereign debt. If a governmental entity defaults, it may ask for more time in which to pay or for further loans. There is no legal process for collecting sovereign debt that a government does not pay nor are there bankruptcy proceedings through which all or part of such sovereign debt may be collected. A restructuring or default of sovereign debt may also cause additional impacts to the financial markets, such as downgrades to credit ratings, a flight to quality debt instruments, disruptions in common trading markets or unions, reduced liquidity, increased volatility, and heightened financial sector, foreign securities and currency risk, among others.
Although the resale, or secondary market for floating rate loans has grown substantially over the past decade, both in overall size and number of market participants, there is no organized exchange or board of trade on which floating rate loans are traded. Instead, the secondary market for floating rate loans is a private, unregulated interdealer or interbank resale market. Such a market may therefore be subject to irregular trading activity, wide bid/ask spreads, and extended trade settlement periods, which may impair the Fund’s ability to sell bank loans within its desired time frame or at an acceptable price and its ability to accurately value existing and prospective investments. Extended trade settlement periods may result in cash not being immediately available to the Fund. As a result, the Fund may have to sell other investments or engage in borrowing transactions to raise cash to meet its obligations. Similar to other asset classes, bank loan funds may be exposed to counterparty credit risk, or the risk than an entity with which the Fund has unsettled or open transactions may fail to or be unable to perform on its commitments. The Fund seeks to manage counterparty credit risk by entering into transactions only with counterparties that it believes have the financial resources to honor their obligations and by monitoring the financial stability of those counterparties.
Active trading of portfolio securities may result in added expenses, a lower return and increased tax liability.
| T. | Leverage Risk- Leverage exists when the Fund can lose more than it originally invests because it purchases or sells an instrument or enters into a transaction without investing an amount equal to the full economic exposure of the instrument or transaction. |
| U. | Collateral- To the extent the Fund has designated or segregated a security as collateral and that security is subsequently sold, it is the Fund’s practice to replace such collateral no later than the next business day. |
Note 2 — Advisory Fees and Other Fees Paid to Affiliates
The Trust has entered into a master investment advisory agreement with Invesco Advisers, Inc. (the “Adviser” or “Invesco”). Under the terms of the investment advisory agreement, the Fund accrues daily and pays monthly an advisory fee to the Adviser based on the annual rate of the Fund’s average daily net assets as follows:
45 INVESCO OPPENHEIMER V.I. GLOBAL STRATEGIC INCOME FUND
NOTES TO CONSOLIDATED FINANCIAL STATEMENTSContinued
| | | | |
| Fee Schedule* | | | |
| Up to $200 million | | | 0.75 | % |
| Next $200 million | | | 0.72 | |
| Next $200 million | | | 0.69 | |
| Next $200 million | | | 0.66 | |
| Next $200 million | | | 0.60 | |
| Next $4 billion | | | 0.50 | |
| Over $5 billion | | | 0.48 | |
* The advisory fee paid by the Fund shall be reduced by any amounts paid by the Fund under the administrative services agreement with the Adviser.
For the year ended December 31, 2019, the effective advisory fees incurred by the Fund was 0.62%.
The Subsidiary has entered into a separate contract with the Adviser whereby the Adviser provides investment advisory and other services to the Subsidiary. In consideration of these services, the Subsidiary pays an advisory fee to the Adviser based on the annual rate of the Subsidiary’s average daily net assets as set forth in the table above.
From the beginning of the fiscal period until the date of the Reorganization, the Acquired Fund paid $3,631,700 in advisory fees to OFI Global Asset Management, Inc. based on the annual rates above of the Acquired Fund’s average daily net assets.
Under the terms of a master sub-advisory agreement between the Adviser and each of Invesco Asset Management Deutschland GmbH, Invesco Asset Management Limited, Invesco Asset Management (Japan) Limited, Invesco Hong Kong Limited, Invesco Senior Secured Management, Inc. and Invesco Canada Ltd. and separate sub-advisory agreements with Invesco Capital Management LLC, and Invesco Asset Management (India) Private Limited (collectively, the “Affiliated Sub-Advisers”) the Adviser, not the Fund, will pay 40% of the fees paid to the Adviser to any such Affiliated Sub-Adviser(s) that provide(s) discretionary investment management services to the Fund based on the percentage of assets allocated to such Affiliated Sub-Adviser(s). Invesco has also entered into a Sub-Advisory Agreement with OppenheimerFunds, Inc. to provide discretionary management services to the Funds.
Effective on the Reorganization Date, the Adviser has contractually agreed, through May 31, 2021, to waive advisory fees and/or reimburse expenses of all shares to the extent necessary to limit the total annual fund operating expenses after fee waiver and/or expense reimbursement (excluding certain items discussed below) of Series I and Series II shares to 0.84% and 1.09%, respectively, of the Fund’s average daily net assets (the “expense limits”). In determining the Adviser’s obligation to waive advisory fees and/or reimburse expenses, the following expenses are not taken into account, and could cause total annual fund operating expenses after fee waivers and/or expense reimbursement to exceed the numbers reflected above: (1) interest; (2) taxes; (3) dividend expenses on short sales; (4) extraordinary or non-routine items, including litigation expenses; and (5) expenses that the Fund has incurred but did not actually pay because of an expense offset arrangement. Unless Invesco continues the fee waiver agreement, it will terminate on May 31, 2021. During its term, the fee waiver agreement cannot be terminated or amended to increase the expense limits or reduce the advisory fee waiver without approval of the Board of Trustees.
Further, the Adviser has contractually agreed, through at least June 30, 2021, to waive the advisory fee payable by the Fund in an amount equal to 100% of the net advisory fees the Adviser receives from the affiliated money market funds on investments by the Fund of uninvested cash in such affiliated money market funds.
For the year ended December 31, 2019, the Adviser waived advisory fees of $503,584 and reimbursed Fund expenses of $63,828 and $138,454 for Series I and Series II shares, respectively.
The Trust has entered into a master administrative services agreement with Invesco pursuant to which the Fund has agreed to pay Invesco a fee for costs incurred in providing accounting services and fund administrative services to the Fund and to reimburse Invesco for fees paid to insurance companies that have agreed to provide certain administrative services to the Fund. These administrative services provided by the insurance companies may include, among other things: maintenance of master accounts with the Fund; tracking, recording and transmitting net purchase and redemption orders for Fund shares; maintaining and preserving records related to the purchase, redemption and other account activity of variable product owners; distributing copies of Fund documents such as prospectuses, proxy materials and periodic reports, to variable product owners, and responding to inquiries from variable product owners about the Fund. Pursuant to such agreement, for the year ended December 31, 2019, Invesco was paid $115,969 for accounting and fund administrative services and was reimbursed $1,223,862 for fees paid to insurance companies. Additionally, Invesco has entered into service agreements whereby JPMorgan Chase Bank serves as custodian to the Fund. Prior to the Reorganization, the Acquired Fund paid administrative fees to OFI Global Asset Management, Inc.
The Trust has entered into a transfer agency and service agreement with Invesco Investment Services, Inc. (“IIS”) pursuant to which the Fund has agreed to pay IIS a fee for providing transfer agency and shareholder services to the Fund and reimburse IIS for certain expenses incurred by IIS in the course of providing such services. Prior to the Reorganization, the Acquired Fund paid transfer agent fees to OFI Global Asset Management, Inc. and Shareholder Services, Inc. For the year ended December 31, 2019, expenses incurred under these agreements are shown in the Consolidated Statement of Operations as Transfer and shareholder servicing agent fees.
The Trust has entered into master distribution agreements with Invesco Distributors, Inc. (“IDI”) to serve as the distributor for the Series II shares of the Fund. The Trust has adopted a plan pursuant to Rule 12b-1 under the 1940 Act with respect to the Fund’s Series II shares (the “Plan”). The Fund, pursuant to the Plan, pays IDI at an annual rate of 0.25% of the average daily net assets of Series II shares. The fees are accrued daily and paid monthly. Of the Plan payments, up to 0.25% of the average daily net assets of the class of shares may be paid to insurance companies who furnish continuing personal shareholder services to customers who purchase and own shares of such class. Any amounts not paid as a service fee under the Plan would constitute an asset-based sales charge. Rules of the Financial Industry Regulatory Authority (“FINRA”) impose a cap on the total sales charges, including asset-based sales charges, that may be paid by any class of shares of the Fund plans. Prior to the Reorganization, the Acquired Fund paid distribution fees to OppenheimerFunds Distributor, Inc. For the year ended December 31, 2019, expenses incurred under the plans are shown in the Consolidated
46 INVESCO OPPENHEIMER V.I. GLOBAL STRATEGIC INCOME FUND
Statement of Operations as Distribution and service plan fees.
Certain officers and trustees of the Trust are officers and directors of the Adviser, IIS and/or IDI.
Note 3 - Additional Valuation Information
GAAP defines fair value as the price that would be received to sell an asset or paid to transfer a liability in an orderly transaction between market participants at the measurement date, under current market conditions. GAAP establishes a hierarchy that prioritizes the inputs to valuation methods, giving the highest priority to readily available unadjusted quoted prices in an active market for identical assets (Level 1) and the lowest priority to significant unobservable inputs (Level 3), generally when market prices are not readily available or are unreliable. Based on the valuation inputs, the securities or other investments are tiered into one of three levels. Changes in valuation methods may result in transfers in or out of an investment’s assigned level:
Level 1 — Prices are determined using quoted prices in an active market for identical assets.
Level 2 — Prices are determined using other significant observable inputs. Observable inputs are inputs that other market participants may use in pricing a security. These may include quoted prices for similar securities, interest rates, prepayment speeds, credit risk, yield curves, loss severities, default rates, discount rates, volatilities and others.
Level 3 — Prices are determined using significant unobservable inputs. In situations where quoted prices or observable inputs are unavailable (for example, when there is little or no market activity for an investment at the end of the period), unobservable inputs may be used. Unobservable inputs reflect the Fund’s own assumptions about the factors market participants would use in determining fair value of the securities or instruments and would be based on the best available information.
The following is a summary of the tiered valuation input levels, as of December 31, 2019. The level assigned to the securities valuations may not be an indication of the risk or liquidity associated with investing in those securities. Because of the inherent uncertainties of valuation, the values reflected in the consolidated financial statements may materially differ from the value received upon actual sale of those investments.
| | | | | | | | | | | | | | | | |
| | | | | | | | | Level 3— | | | | |
| | | Level 1— | | | Level 2— | | | Significant | | | | |
| | | Unadjusted | | | Other Significant | | | Unobservable | | | | |
| | | Quoted Prices | | | Observable Inputs | | | Inputs | | | Value | |
| |
| Assets Table | | | | | | | | | | | | | | | | |
| Investments, at Value: | | | | | | | | | | | | | | | | |
| Asset-Backed Securities | | $ | — | | | $ | 68,115,039 | | | $ | — | | | $ | 68,115,039 | |
| Mortgage-Backed Obligations | | | — | | | | 214,698,008 | | | | — | | | | 214,698,008 | |
| Foreign Government Obligations | | | — | | | | 303,693,835 | | | | — | | | | 303,693,835 | |
| Variable Rate Senior Loan Interests | | | — | | | | 6,307,378 | | | | 66,846 | | | | 6,374,224 | |
| Corporate Bonds and Notes | | | — | | | | 380,632,920 | | | | — | | | | 380,632,920 | |
| Preferred Stock | | | — | | | | 11,360 | | | | — | | | | 11,360 | |
| Common Stocks | | | 502,831 | | | | 152,750 | | | | — | | | | 655,581 | |
| Rights, Warrants and Certificates | | | — | | | | 40,547 | | | | — | | | | 40,547 | |
| Structured Securities | | | — | | | | 6,543,459 | | | | — | | | | 6,543,459 | |
| Short-Term Notes | | | — | | | | 5,543,042 | | | | — | | | | 5,543,042 | |
| Exchange-Traded Options Purchased | | | 441,640 | | | | — | | | | — | | | | 441,640 | |
| Over-the-Counter Options Purchased | | | — | | | | 11,437,362 | | | | — | | | | 11,437,362 | |
| Over-the-Counter Credit Default Swaptions Purchased | | | — | | | | 281,994 | | | | — | | | | 281,994 | |
| Over-the-Counter Interest Rate Swaptions Purchased | | | — | | | | 7,288,348 | | | | — | | | | 7,288,348 | |
| Investment Companies | | | 165,935,622 | | | | 664,049 | | | | — | | | | 166,599,671 | |
| | | | |
| Total Investments, at Value | | | 166,880,093 | | | | 1,005,410,091 | | | | 66,846 | | | | 1,172,357,030 | |
| Other Financial Instruments: | | | | | | | | | | | | | | | | |
| Swaps, at value | | | — | | | | 3,061,547 | | | | — | | | | 3,061,547 | |
| Centrally cleared swaps, at value | | | — | | | | 6,759,973 | | | | — | | | | 6,759,973 | |
| Futures contracts | | | 2,036,378 | | | | — | | | | — | | | | 2,036,378 | |
| Forward currency exchange contracts | | | — | | | | 14,336,451 | | | | — | | | | 14,336,451 | |
| | | | |
| Total Assets | | $ | 168,916,471 | | | $ | 1,029,568,062 | | | $ | 66,846 | | | $ | 1,198,551,379 | |
| | | | |
| | | | |
| Liabilities Table | | | | | | | | | | | | | | | | |
| Other Financial Instruments: | | | | | | | | | | | | | | | | |
| Swaps, at value | | $ | — | | | $ | (377,680 | ) | | $ | — | | | $ | (377,680) | |
| Centrally cleared swaps, at value | | | — | | | | (7,904,940 | ) | | | — | | | | (7,904,940) | |
| Futures contracts | | | (3,190,154 | ) | | | — | | | | — | | | | (3,190,154) | |
| Options written, at value | | | — | | | | (9,633,749 | ) | | | — | | | | (9,633,749) | |
| Forward currency exchange contracts | | | — | | | | (24,660,550 | ) | | | — | | | | (24,660,550) | |
| Swaptions written, at value | | | — | | | | (8,419,122 | ) | | | — | | | | (8,419,122) | |
| | | | |
| Total Liabilities | | $ | (3,190,154 | ) | | $ | (50,996,041 | ) | | $ | — | | | $ | (54,186,195) | |
| | | | |
Forward currency exchange contracts and futures contracts, if any, are reported at their unrealized appreciation/depreciation at measurement date, which represents the change in the contract’s value from trade date. All additional assets and liabilities included in the above table are reported at their market value at measurement date.
47 INVESCO OPPENHEIMER V.I. GLOBAL STRATEGIC INCOME FUND
NOTES TO CONSOLIDATED FINANCIAL STATEMENTSContinued
Note 4 - Security Transactions with Affiliated Funds
The Fund is permitted to purchase or sell securities from or to certain other Invesco Funds under specified conditions outlined in procedures adopted by the Board of Trustees of the Trust. The procedures have been designed to ensure that any purchase or sale of securities by the Fund from or to another fund or portfolio that is or could be considered an affiliate by virtue of having a common investment adviser (or affiliated investment advisers), common Trustees and/or common officers complies with Rule 17a-7 of the 1940 Act. Further, as defined under the procedures, each transaction is effected at the current market price. Pursuant to these procedures for the period January 1, 2019 to May 24, 2019, the Predecessor Fund did not engage in transactions with affiliates. For the period May 25, 2019 to December 31, 2019, the Fund engaged in transactions with affiliates as listed: Securities sales of $2,201,825, which resulted in net realized gains (losses) of $(1,058,693).
Note 5 - Derivative Investments
The Fund may enter into an International Swaps and Derivatives Association Master Agreement (“ISDA Master Agreement”) under which a fund may trade OTC derivatives. An OTC transaction entered into under an ISDA Master Agreement typically involves a collateral posting arrangement, payment netting provisions and close-out netting provisions. These netting provisions allow for reduction of credit risk through netting of contractual obligations. The enforceability of the netting provisions of the ISDA Master Agreement depends on the governing law of the ISDA Master Agreement, among other factors. For financial reporting purposes, the Fund does not offset OTC derivative assets or liabilities that are subject to ISDA Master Agreements in the Consolidated Statement of Assets and Liabilities.
Offsetting Assets and Liabilities
| | | | | | | | | | | | | | | | | | | | |
| The table below reflects the Fund’s exposure to Counterparties subject to either an ISDA Master Agreement or other agreement for OTC derivative asset transactions as of December 31, 2019: | |
| | | | | | Gross Amounts Not Offset in the
Consolidated | | | | |
| | | | | | Statement of Assets & Liabilities | | | | |
| | | Gross Amounts | | | | | | | | | | | | | |
| | | Not Offset in the | | | | | | | | | | | | | |
| | | Consolidated | | | Financial | | | Financial | | | | | | | |
| | | Statement | | | Instruments | | | Instruments | | | | | | | |
| | | of Assets & | | | Available for | | | Collateral | | | Cash Collateral | | | | |
| Counterparty | | Liabilities* | | | Offset | | | Received** | | | Received** | | | Net Amount | |
| Bank of America NA | | $ | 4,056,699 | | | $ | (4,056,699 | ) | | $ | – | | | $ | – | | | $ | – | |
| Citibank NA | | | 1,407,544 | | | | (1,407,544 | ) | | | – | | | | – | | | | – | |
| Goldman Sachs Bank USA | | | 6,415,800 | | | | (6,415,800 | ) | | | – | | | | – | | | | – | |
| Goldman Sachs International | | | 2,259,666 | | | | (2,259,666 | ) | | | – | | | | – | | | | – | |
| JPMorgan Chase Bank NA | | | 15,063,145 | | | | (15,063,145 | ) | | | – | | | | – | | | | – | |
| Morgan Stanley Capital Services, Inc. | | | 4,022,027 | | | | (2,749,086 | ) | | | – | | | | (440,000 | ) | | | 832,941 | |
| Nomura Global Financial Products, Inc. | | | 1,391,627 | | | | (538,337 | ) | | | – | | | | (840,000 | ) | | | 13,290 | |
| RBC Dominion Securities | | | 292,764 | | | | (292,764 | ) | | | – | | | | – | | | | – | |
| Standard Chartered Bank | | | 1,496,430 | | | | (1,427,706 | ) | | | – | | | | – | | | | 68,724 | |
| | | | | | | | | | | | | | | | | | | | |
| | $ | 36,405,702 | | | $ | (34,210,747 | ) | | $ | – | | | $ | (1,280,000 | ) | | $ | 914,955 | |
| | | | | | | | | | | | | | | | | | | | |
|
*OTC derivatives are reported gross on the Consolidated Statement of Assets and Liabilities. Exchange traded options and margin related to centrally cleared swaps and futures, if any, are excluded from these reported amounts. **Reported collateral posted for the benefit of the Fund within this table is limited to the net outstanding amount due from an individual counterparty. The collateral posted for the benefit of the Fund may exceed these amounts. The table below reflects the Fund’s exposure to Counterparties subject to either an ISDA Master Agreement or other agreement for OTC derivative liability transactions as of December 31, 2019: | |
48 INVESCO OPPENHEIMER V.I. GLOBAL STRATEGIC INCOME FUND
| | | | | | | | | | | | | | | | | | | | |
| | | | | | Gross Amounts Not Offset in the Consolidated | | | | |
| | | | | | Statement of Assets & Liabilities | | | | |
| | | Gross Amounts | | | | | | | | | | | | | |
| | | Not Offset in the | | | | | | | | | | | | | |
| | | Consolidated | | | Financial | | | Financial | | | | | | | |
| | | Statement | | | Instruments | | | Instruments | | | | | | | |
| | | of Assets & | | | Available for | | | Collateral | | | Cash Collateral | | | | |
| Counterparty | | Liabilities* | | | Offset | | | Pledged** | | | Pledged** | | | Net Amount | |
| Bank of America NA | | $ | (4,924,620 | ) | | $ | 4,056,699 | | | $ | – | | | $ | 654,000 | | | $ | (213,921 | ) |
| Barclays Bank plc | | | (76,229 | ) | | | – | | | | – | | | | 76,229 | | | | – | |
| Citibank NA | | | (5,894,580 | ) | | | 1,407,544 | | | | – | | | | 3,900,000 | | | | (587,036 | ) |
| Goldman Sachs Bank USA | | | (7,118,550 | ) | | | 6,415,800 | | | | – | | | | 501,482 | | | | (201,268 | ) |
| Goldman Sachs International | | | (4,220,288 | ) | | | 2,259,666 | | | | – | | | | 1,910,000 | | | | (50,622 | ) |
| JPMorgan Chase Bank NA | | | (15,199,258 | ) | | | 15,063,145 | | | | – | | | | 136,113 | | | | – | |
| Morgan Stanley Capital Services, Inc. | | | (2,749,086 | ) | | | 2,749,086 | | | | – | | | | – | | | | – | |
| Nomura Global Financial Products, Inc. | | | (538,337 | ) | | | 538,337 | | | | – | | | | – | | | | – | |
| RBC Dominion Securities | | | (900,182 | ) | | | 292,764 | | | | – | | | | 600,000 | | | | (7,418 | ) |
| Standard Chartered Bank | | | (1,427,706 | ) | | | 1,427,706 | | | | – | | | | – | | | | – | |
| | | | | | | | | | | | | | | | | | | | |
| | $ | (43,048,836 | ) | | $ | 34,210,747 | | | $ | – | | | $ | 7,777,824 | | | $ | (1,060,265 | ) |
| | | | | | | | | | | | | | | | | | | | |
|
*OTC derivatives are reported gross on the Consolidated Statement of Assets and Liabilities. Exchange traded options and margin related to centrally cleared swaps and futures, if any, are excluded from these reported amounts. **Reported collateral pledged within this table is limited to the net outstanding amount due from the Fund. The securities pledged as collateral by the Fund as reported on the Consolidated Schedule of Investments may exceed these amounts. | |
Value of Derivative Instruments at Period-End
The table below reflects the Fund’s exposure to Counterparties subject to either an ISDA Master Agreement or other agreement for OTC derivative liability transactions as of December 31, 2019:
| | | | | | | | | | | | | | | | |
| | | Asset Derivatives | | | | | | Liability Derivatives | |
| Derivatives | | | | | | | | | | | | | |
| Not Accounted | | Consolidated | | | | | | | | Consolidated | | | |
| for as Hedging | | Statement of Assets | | | | | | | | Statement of Assets | | | |
| Instruments | | and Liabilities Location | | Value | | | | | | and Liabilities Location | | Value | |
| Credit contracts | | Swaps, at value | | $ | 2,492,070 | | | | | | | Swaps, at value | | $ | 8,381 | |
| Interest rate contracts | | Swaps, at value | | | 569,477 | | | | | | | Swaps, at value | | | 369,299 | |
| Credit contracts | | Centrally cleared swaps, at value | | | 522,9091 | | | | | | | Centrally cleared swaps, at value | | | 4,658,8191 | |
| Interest rate contracts | | Centrally cleared swaps, at value | | | 6,237,0641 | | | | | | | Centrally cleared swaps, at value | | | 3,246,1211 | |
| Interest rate contracts | | Futures contracts | | | 2,036,3782 | | | | | | | Futures contracts | | | 3,190,1542 | |
| Forward currency exchange contracts | | Unrealized appreciation on forward currency exchange contracts | | | 14,336,451 | | | | | | | Unrealized depreciation on forward currency exchange contracts | | | 24,660,550 | |
| Equity contracts | | | | | | | | | | | | Options written, at value | | | 42,265 | |
| Currency contracts | | | | | | | | | | | | Options written, at value | | | 9,591,484 | |
| Credit contracts | | | | | | | | | | | | Swaptions written, at value | | | 700,584 | |
| Interest rate contracts | | | | | | | | | | | | Swaptions written, at value | | | 7,718,538 | |
| Credit contracts | | Investments, at value | | | 281,9943 | | | | | | | | | | | |
| Equity contracts | | Investments, at value | | | 441,6403 | | | | | | | | | | | |
| Currency contracts | | Investments, at value | | | 11,437,3623 | | | | | | | | | | | |
| Interest rate contracts | | Investments, at value | | | 7,288,3483 | | | | | | | | | | | |
| Total | | | | $ | 45,643,693 | | | | | | | | | $ | 54,186,195 | |
| | | | | | | | | | | | | | | | |
1. The daily variation margin receivable (payable) at period end is recorded in the Consolidated Statement of Assets and Liabilities.
2. Includes only the current day’s variation margin. Prior variation margin movements have been reflected in cash on the Consolidated Statement of Assets and Liabilities upon receipt or payment.
3. Amounts relate to purchased option contracts and purchased swaption contracts, if any.
49 INVESCO OPPENHEIMER V.I. GLOBAL STRATEGIC INCOME FUND
NOTES TO CONSOLIDATED FINANCIAL STATEMENTSContinued
Effect of Derivative Investments for the Year Ended December 31, 2019
The tables below summarize the gains (losses) on derivative investments, detailed by primary risk exposure, recognized in earnings during the period:
| | | | | | | | | | | | | | | | | | | | | | | | | | | | |
| Amount of Realized Gain or (Loss) Recognized on Derivatives | |
Derivatives Not Accounted for as Hedging Instruments | | Investment
transactions
in unaffiliated
companies* | | | Swaption
contracts
written | | | Option
contracts
written | | | Futures
contracts | | | Forward
currency
exchange
contracts | | | Swap contracts | | | Total | |
| Credit contracts | | $ | (1,758,876 | ) | | $ | 3,864,164 | | | $ | — | | | $ | — | | | $ | — | | | $ | 1,641,051 | | | $ | 3,746,339 | |
| Currency contracts | | | (9,571,255 | ) | | | — | | | | 23,108,156 | | | | — | | | | — | | | | — | | | | 13,536,901 | |
| Equity contracts | | | (1,534,384 | ) | | | — | | | | 893,009 | | | | — | | | | — | | | | — | | | | (641,375 | ) |
| Forward currency exchange contracts | | | — | | | | — | | | | — | | | | — | | | | (4,410,872 | ) | | | — | | | | (4,410,872 | ) |
| Interest rate contracts | | | 6,531,818 | | | | (13,852,248 | ) | | | (2,294,477 | ) | | | (9,571,924 | ) | | | — | | | | (2,862,709 | ) | | | (22,049,540 | ) |
| Total | | $ | (6,332,697 | ) | | $ | (9,988,084 | ) | | $ | 21,706,688 | | | $ | (9,571,924 | ) | | $ | (4,410,872 | ) | | $ | (1,221,658 | ) | | $ | (9,818,547 | ) |
| | | | | | | | | | | | | | | | | | | | | | | | | | | | |
|
| Amount of Change in Unrealized Gain or (Loss) Recognized on Derivatives | |
Derivatives Not Accounted for as Hedging Instruments | | Investment
transactions
in unaffiliated
companies* | | | Swaption
contracts
written | | | Option
contracts
written | | | Futures
contracts | | | Forward
currency
exchange
contracts | | | Swap contracts | | | Total | |
| Credit contracts | | $ | (486,956 | ) | | $ | 67,018 | | | $ | — | | | $ | — | | | $ | — | | | $ | (594,737 | ) | | $ | (1,014,675 | ) |
| Currency contracts | | | (596,329 | ) | | | — | | | | 3,158,089 | | | | — | | | | — | | | | — | | | | 2,561,760 | |
| Equity contracts | | | (2,609,109 | ) | | | — | | | | 847,115 | | | | — | | | | — | | | | — | | | | (1,761,994 | ) |
| Forward currency exchange contracts | | | — | | | | — | | | | — | | | | — | | | | (5,224,482 | ) | | | — | | | | (5,224,482 | ) |
| Interest rate contracts | | | (1,224,844 | ) | | | 8,235,627 | | | | — | | | | 33,875 | | | | — | | | | 400,519 | | | | 7,445,177 | |
| Total | | $ | (4,917,238 | ) | | $ | 8,302,645 | | | $ | 4,005,204 | | | $ | 33,875 | | | $ | (5,224,482 | ) | | $ | (194,218 | ) | | $ | 2,005,786 | |
| | | | | | | | | | | | | | | | | | | | | | | | | | | | |
*Includes purchased option contracts and purchased swaption contracts, if any.
The table below summarizes the year ended average notional value of forward foreign currency contracts, futures contracts, swap agreements, currency options purchased, written currency options, purchased swaptions and written swaptions during the period.
| | | | | | | | | | | | | | | | | | | | |
| | | Forward
Foreign
Currency
contracts | | | Futures
contracts | | | Equity Options
purchased* | | | Index Options
purchased* | | | Currency
Options
purchased | |
Average notional
amount | | $ | 1,375,765,528 | | | $ | 308,647,909 | | | $ | 1,307,682,506 | | | $ | 104,000,843 | | | $ | 144,228,760,307 | |
| Average contracts | | | | | | | | | | | 10,000,000 | | | | 22,835 | | | | 144,223,982,414 | |
| | | | | |
| | | Purchased
Fixed Income
Options* | | | Purchased
Option on a
Future* | | | Written Index
Options* | | | Written Currency
Options | | | Written Fixed Income Options* | |
| Average notional amount | | $ | 53,499,237 | | | $ | 62,024,348 | | | $ | 86,422,601 | | | $ | 791,792,938,100 | | | $ | 52,677,150 | |
| Average contracts | | | 47,576,133 | | | | 333 | | | | 22,810 | | | | 791,782,204,332 | | | | 46,785,867 | |
| | | | | |
| | | | | | | | | Purchased
Swaptions | | | Written
Swaptions | | | Swaps | |
| Average notional amount | | | | | | | | | | $ | 1,076,607,920 | | | $ | 1,774,849,692 | | | $ | 1,278,232,904 | |
*Summarizes the eleven month average notional value and average contracts of index options purchased and written index options, the five month average notional value and average contracts of purchased fixed income options and written fixed income options, the four month average notional value and average contracts of purchased options on a future and the three month average notional value and average contracts on purchase equity options.
Note 6 – Expense Offset Arrangement
The expense offset arrangement is comprised of custodian credits which result from periodic overnight cash balances at the custodian. For the year ended December 31, 2019, the Fund received credits from this arrangement, which resulted in the reduction of the Fund’s total expenses of $88,928.
50 INVESCO OPPENHEIMER V.I. GLOBAL STRATEGIC INCOME FUND
Note 7 – Trustee and Officer Fees and Benefits
Certain Trustees have executed Deferred Compensation Agreement(s) pursuant to which they have the option to elect to defer receipt of all or a portion of the annual compensation they are entitled to receive from the Fund. For purposes of determining the amount owed to the Trustees under the plan(s), deferred amounts are treated as though equal dollar amounts had been invested in shares of the Fund or in other Invesco and/or Invesco Oppenheimer funds selected by the Trustees. The Fund purchases shares of the funds selected for deferral by the Trustees in amounts equal to his or her deemed investment, resulting in a Fund asset equal to the deferred compensation liability. Such assets are included as a component of “Other” within the asset section of the Consolidated Statement of Assets and Liabilities. Deferral of Trustees’ fees under the plan(s) will not affect the net assets of the Fund and will not materially affect the Fund’s assets, liabilities or net investment income per share. Amounts will be deferred until distributed in accordance with the Deferred Compensation Agreement(s).
Note 8 – Cash Balances
The Fund is permitted to temporarily carry a negative or overdrawn balance in its account with JPMorgan Chase Bank., the custodian bank. Such balances, if any at period-end, are shown in the Consolidated Statement of Assets and Liabilities under the payable caption Amount due custodian. To compensate the custodian bank for such overdrafts, the overdrawn Fund may either (1) leave funds as a compensating balance in the account so the custodian bank can be compensated by earning the additional interest; or (2) compensate by paying the custodian bank at a rate agreed upon by the custodian bank and Invesco, not to exceed the contractually agreed upon rate.
Note 9 – Distributions to Shareholders and Tax Components of Net Assets
Tax Character of Distributions to Shareholders Paid During the Fiscal Years Ended December 31, 2019 and 2018:
| | | | | | | | |
| | | 2019 | | | 2018 | |
| Ordinary income | | $ | `52,269,320 | | | $ | 73,316,833 | |
| | | | | | | | | | | | |
Tax Components of Net Assets at Period-End: | | | | | | | | | | | | |
| | | | |
| | | 2019 | |
| Undistributed ordinary income | | $ | 56,176,040 | |
| Net unrealized appreciation (depreciation) - investments | | | (14,925,855 | ) |
| Temporary book/tax differences | | | (151,888 | ) |
| Capital loss carryforward | | | (167,819,756 | ) |
| Shares of beneficial interest | | | 1,258,384,046 | |
| | | | |
| Total net assets | | $ | 1,131,662,587 | |
| | | | |
The difference between book-basis and tax-basis unrealized appreciation (depreciation) is due to differences in the timing of recognition of gains and losses on investments for tax and book purposes. The Fund’s net unrealized appreciation (depreciation) difference is attributable primarily to wash sales, straddle losses deferred and derivative investments.
The temporary book/tax differences are a result of timing differences between book and tax recognition of income and/or expenses. The Fund’s temporary book/tax differences are the result of the trustee deferral of compensation and retirement plan benefits.
Capital loss carryforward is calculated and reported as of a specific date. Results of transactions and other activity after that date may affect the amount of capital loss carryforward actually available for the Fund to utilize. Capital losses generated in years beginning after December 22, 2010 can be carried forward for an unlimited period, whereas previous losses expire in eight tax years. Capital losses with an expiration period may not be used to offset capital gains until all net capital losses without an expiration date have been utilized. Capital loss carryforwards with no expiration date will retain their character as either short-term or long-term capital losses instead of as short-term capital losses as under prior law. The ability to utilize capital loss carryforwards in the future may be limited under the Internal Revenue Code and related regulations based on the results of future transactions.
The Fund has a capital loss carryforward as of December 31, 2019, which expires as follows:
| | | | | | | | | | | | |
| Capital Loss Carryforward* | |
| Expiration | | Short-Term | | | Long-Term | | | Total | |
| Not subject to expiration | | $ | 65,305,749 | | | $ | 102,514,007 | | | $ | 167,819,756 | |
* Capital loss carryforward as of the date listed above is reduced for limitations, if any, to the extent required by the Internal Revenue Code and may be further limited depending upon a variety of factors, including the realization of net unrealized gains or losses as of the date of any reorganization.
Note 10 – Investment Transactions
The aggregate amount of investment securities (other than short-term securities, U.S. Treasury obligations and money market funds, if any) purchased and sold by the Fund during the year ended December 31, 2019 was $1,387,970,789 and $1,806,486,578, respectively. During the same period, purchases and sales of U.S. Treasury obligations were $246,700,886 and $263,408,987, respectively. Cost of investments, including any derivatives, on a
51 INVESCO OPPENHEIMER V.I. GLOBAL STRATEGIC INCOME FUND
NOTES TO CONSOLIDATED FINANCIAL STATEMENTSContinued
tax basis includes the adjustments for financial reporting purposes as of the most recently completed federal income tax reporting period-end.
| | | | |
| Unrealized Appreciation (Depreciation) of Investments on a Tax Basis | |
| Aggregate unrealized appreciation of investments | | $ | 73,518,981 | |
| Aggregate unrealized (depreciation) of investments | | | (99,579,958 | ) |
| Net unrealized depreciation of investments | | $ | (26,060,977 | ) |
| | | | |
Cost of investments for tax purposes is $1,060,440,401.
Note 11 – Reclassification of Permanent Differences
Primarily as a result of differing book/tax treatment of master fund transactions, foreign currency transactions and income from swap agreements, on December 31, 2019, undistributed net investment income was decreased by $16,589,121, undistributed net realized loss was increased by $20,905,495 and shares of beneficial interest was decreased by $4,316,374. This reclassification had no effect on the net assets of the Fund.
Note 12 – Share Information
Transactions in shares of beneficial interest were as follows:
| | | | | | | | | | | | | | | | |
| | | Year Ended December 31, 20191 | | | Year Ended December 31, 2018 | |
| | | Shares | | | Amount | | | Shares | | | Amount | |
Series I Shares | | | | | | | | | | | | | | | | |
| Sold | | | 18,615,624 | | | $ | 91,652,597 | | | | 8,490,294 | | | $ | 42,380,338 | |
| Dividends and/or distributions reinvested | | | 3,199,572 | | | | 15,389,942 | | | | 3,988,617 | | | | 18,866,160 | |
| Redeemed | | | (16,669,750 | ) | | | (81,650,513 | ) | | | (14,761,302 | ) | | | (71,795,706 | ) |
| Net increase (decrease) | | | 5,145,446 | | | $ | 25,392,026 | | | | (2,282,391 | ) | | $ | (10,549,208 | ) |
| | | | | | | | | | | | | | | | |
| | | | | | | | | | | | | | | | | |
Series II Shares | | | | | | | | | | | | | | | | |
| Sold | | | 5,575,798 | | | $ | 28,193,986 | | | | 9,208,135 | | | $ | 46,798,575 | |
| Dividends and/or distributions reinvested | | | 7,435,359 | | | | 36,879,378 | | | | 11,180,836 | | | | 54,450,673 | |
| Redeemed | | | (94,815,980 | ) | | | (475,861,262 | ) | | | (37,228,166 | ) | | | (186,225,544 | ) |
| Net increase (decrease) | | | (81,804,823 | ) | | $ | (410,787,898 | ) | | | (16,839,195 | ) | | $ | (84,976,296 | ) |
| | | | | | | | | | | | | | | | |
1. There are entities that are record owners of more than 5% of the outstanding shares of the Fund and in the aggregate own 59% of the outstanding shares of the Fund. IDI has an agreement with these entities to sell Fund shares. The Fund, Invesco and/or Invesco affiliates may make payments to these entities, which are considered to be related to the Fund, for providing services to the Fund, Invesco and/or Invesco affiliates, including but not limited to services such as securities brokerage, distribution, third party record keeping and account servicing. The Fund has no knowledge as to whether all or any portion of the shares owned of record by these entities are also owned beneficially.
Note 13 - Borrowings
Joint Credit Facility.A number of mutual funds managed by the Adviser participate in a $1.95 billion revolving credit facility (the “Facility”) intended to provide short-term financing, if necessary, subject to certain restrictions in connection with atypical redemption activity. Expenses and fees related to the Facility are paid by the participating funds and are disclosed separately or as other expenses on the Consolidated Statement of Operations. The Fund did not utilize the Facility during the reporting period. The Facility terminated May 24, 2019.
52 INVESCO OPPENHEIMER V.I. GLOBAL STRATEGIC INCOME FUND
REPORT OF INDEPENDENT REGISTERED PUBLIC ACCOUNTING FIRM
To the Board of Trustees of AIM Variable Insurance Funds (Invesco Variable Insurance Funds) and Shareholders of Invesco Oppenheimer V.I. Global Strategic Income Fund
Opinion on the Financial Statements
We have audited the accompanying consolidated statement of assets and liabilities, including the consolidated schedule of investments, of Invesco Oppenheimer V.I. Global Strategic Income Fund and its subsidiary (one of the funds constituting AIM Variable Insurance Funds (Invesco Variable Insurance Funds), referred to hereafter as the “Fund”) as of December 31, 2019, the related consolidated statements of operations and of changes in net assets for the year ended December 31, 2019, including the related notes, and the consolidated financial highlights for each of the periods ended December 31, 2019 (collectively referred to as the “consolidated financial statements”). In our opinion, the consolidated financial statements present fairly, in all material respects, the financial position of the Fund as of December 31, 2019, the results of its operations and changes in its net assets for the year ended December 31, 2019 and the financial highlights for each of the periods ended December 31, 2019 in conformity with accounting principles generally accepted in the United States of America.
The consolidated financial statements of Invesco Oppenheimer V.I. Global Strategic Income Fund (formerly known as Oppenheimer Global Strategic Income Fund/VA) as of and for the year ended December 31, 2018 and the consolidated financial highlights for each of the periods ended on or prior to December 31, 2018 (not presented herein, other than the consolidated statement of changes in net assets and the consolidated financial highlights) were audited by other auditors whose report dated February 14, 2019 expressed an unqualified opinion on those consolidated financial statements and consolidated financial highlights.
Basis for Opinion
These consolidated financial statements are the responsibility of the Fund’s management. Our responsibility is to express an opinion on the Fund’s consolidated financial statements based on our audit. We are a public accounting firm registered with the Public Company Accounting Oversight Board (United States) (PCAOB) and are required to be independent with respect to the Fund in accordance with the U.S. federal securities laws and the applicable rules and regulations of the Securities and Exchange Commission and the PCAOB.
We conducted our audit of these consolidated financial statements in accordance with the standards of the PCAOB. Those standards require that we plan and perform the audit to obtain reasonable assurance about whether the consolidated financial statements are free of material misstatement, whether due to error or fraud.
Our audit included performing procedures to assess the risks of material misstatement of the consolidated financial statements, whether due to error or fraud, and performing procedures that respond to those risks. Such procedures included examining, on a test basis, evidence regarding the amounts and disclosures in the consolidated financial statements. Our audit also included evaluating the accounting principles used and significant estimates made by management, as well as evaluating the overall presentation of the consolidated financial statements. Our procedures included confirmation of securities owned as of December 31, 2019 by correspondence with the custodian, transfer agent and brokers; when replies were not received from brokers, we performed other auditing procedures. We believe that our audit provides a reasonable basis for our opinion.
/s/PricewaterhouseCoopers LLP
Houston, Texas
February 18, 2020
We have served as the auditor of one or more of the investment companies in the Invesco group of investment companies since at least 1995. We have not been able to determine the specific year we began serving as auditor.
53 INVESCO OPPENHEIMER V.I. GLOBAL STRATEGIC INCOME FUND
TAX INFORMATION
Form 1099-DIV, Form 1042-S and other year–end tax information provide shareholders with actual calendar year amounts that should be included in their tax returns. Shareholders should consult their tax advisers.
The following distribution information is being provided as required by the Internal Revenue Code or to meet a specific state’s requirement.
The Fund designates the following amounts or, if subsequently determined to be different, the maximum amount allowable for its fiscal year ended December 31, 2019:
| | | | |
| Federal and State Income Tax | | | |
| Corporate Dividends Received Deduction* | | | 3.48 | % |
| U.S. Treasury Obligations* | | | 3.35 | % |
* The above percentages are based on ordinary income dividends paid to shareholders during the Fund’s fiscal year.
54 INVESCO OPPENHEIMER V.I. GLOBAL STRATEGIC INCOME FUND
PORTFOLIO PROXY VOTING POLICIES AND GUIDELINES; UPDATES TO SCHEDULE OF INVESTMENTS
Go paperless with eDelivery
Visit invesco.com/edelivery to enjoy the convenience and security of anytime electronic access to your investment documents.
With eDelivery, you can elect to have any or all of the following materials delivered straight to your inbox to download, save and print from your own computer:
| • | | Fund reports and prospectuses |
Invesco mailing information
Send general correspondence to Invesco Investment Services, Inc., P.O. Box 219078, Kansas City, MO 64121-9078.
Important notice regarding delivery of security holder documents
To reduce Fund expenses, only one copy of most shareholder documents may be mailed to shareholders with multiple accounts at the same address (Householding). Mailing of your shareholder documents may be householded indefinitely unless you instruct us otherwise. If you do not want the mailing of these documents to be combined with those for other members of your household, please contact Invesco Investment Services, Inc. at 800 959 4246 or contact your financial institution. We will begin sending you individual copies for each account within 30 days after receiving your request.
Fund holdings and proxy voting information
The Fund provides a complete list of its holdings four times in each fiscal year, at the quarter ends. For the second and fourth quarters, the lists appear in the Fund’s semiannual and annual reports to shareholders. For the first and third quarters, the Fund files the lists with the Securities and Exchange Commission (SEC) as an exhibit to its reports on Form N-PORT. The most recent list of portfolio holdings is available at invesco.com/completeqtrholdings. Shareholders can also look up the Fund’s Forms N-PORT on the SEC website at sec.gov.
A description of the policies and procedures that the Fund uses to determine how to vote proxies relating to portfolio securities is available without charge, upon request, from our Client Services department at 800 959 4246 or at invesco.com/proxyguidelines. The information is also available on the SEC website, sec.gov.
Information regarding how the Fund voted proxies related to its portfolio securities during the most recent 12-month period ended June 30 is available at invesco. com/proxysearch. The information is also available on the SEC website, sec.gov.
Invesco Advisers, Inc. is an investment adviser; it provides investment advisory services to individual and institutional clients and does not sell securities. Invesco Distributors, Inc. is the US distributor for Invesco Ltd.’s retail mutual funds, exchange-traded funds and institutional money market funds. Both are wholly owned, indirect subsidiaries of Invesco Ltd.
55 INVESCO OPPENHEIMER V.I. GLOBAL STRATEGIC INCOME FUND
TRUSTEES AND OFFICERS
The address of each trustee and officer is AIM Variable Insurance Funds (Invesco Variable Insurance Funds) (the “Trust”), 11 Greenway Plaza, Suite 1000, Houston, Texas 77046-1173. The trustees serve for the life of the Trust, subject to their earlier death, incapacitation, resignation, retirement or removal as more specifically provided in the Trust’s organizational documents. Each officer serves for a one year term or until their successors are elected and qualified. Column two below includes length of time served with predecessor entities, if any.
| | | | | | | | |
| | | | | |
Name, Year of Birth and Position(s) Held with the Trust | | Trustee and/or Officer Since | | Principal Occupation(s) During Past 5 Years | | Number of Funds in Fund Complex
Overseen by Trustee | | Other Directorship(s) Held by Trustee During Past
5 Years |
INTERESTED PERSON | | | | | | | | |
| | | | | |
Martin L. Flanagan 1– 1960 Trustee and Vice Chair | | 2007 | | Executive Director, Chief Executive Officer and President, Invesco Ltd. (ultimate parent of Invesco and a global investment management firm); Trustee and Vice Chair, The Invesco Funds; Vice Chair, Investment Company Institute; and Member of Executive Board, SMU Cox School of Business Formerly: Advisor to the Board, Invesco Advisers, Inc. (formerly known as Invesco Institutional (N.A.), Inc.); Chairman and Chief Executive Officer, Invesco Advisers, Inc. (registered investment adviser); Director, Chairman, Chief Executive Officer and President, Invesco Holding Company (US), Inc. (formerly IVZ Inc.) (holding company), Invesco Group Services, Inc. (service provider) and Invesco North American Holdings, Inc. (holding company); Director, Chief Executive Officer and President, Invesco Holding Company Limited (parent of Invesco and a global investment management firm); Director, Invesco Ltd.; Chairman, Investment Company Institute and President,Co-Chief Executive Officer,Co-President, Chief Operating Officer and Chief Financial Officer, Franklin Resources, Inc. (global investment management organization) | | 229 | | None |
| |
| 1 Mr. Flanagan is considered an interested person (within the meaning of Section 2(a)(19) of the 1940 Act) of the Trust because he is an officer of the Adviser to the Trust, and an officer and a director of Invesco Ltd., ultimate parent of the Adviser. |
56 INVESCO OPPENHEIMER V.I. GLOBAL STRATEGIC INCOME FUND
| | | | | | | | |
| | | | | |
Name, Year of Birth and Position(s) Held with the Trust | | Trustee and/or Officer Since | | Principal Occupation(s) During Past 5 Years | | Number of Funds in Fund Complex
Overseen by Trustee | | Other Directorship(s) Held by Trustee During Past
5 Years |
INDEPENDENT TRUSTEES | | | | | | | | |
| | | | | |
Bruce L. Crockett – 1944 Trustee and Chair | | 2003 | | Chairman, Crockett Technologies Associates (technology consulting company) Formerly: Director, Captaris (unified messaging provider); Director, President and Chief Executive Officer, COMSAT Corporation; Chairman, Board of Governors of INTELSAT (international communications company); ACE Limited (insurance company); Independent Directors Council and Investment Company Institute: Member of the Audit Committee, Investment Company Institute; Member of the Executive Committee and Chair of the Governance Committee, Independent Directors Council | | 229 | | Director and Chairman of the Audit Committee, ALPS (Attorneys Liability Protection Society) (insurance company); Director and Member of the Audit Committee and Compensation Committee, Ferroglobe PLC (metallurgical company) |
| | | | | |
David C. Arch – 1945 Trustee | | 2010 | | Chairman of Blistex Inc. (consumer health care products manufacturer); Member, World Presidents’ Organization | | 229 | | Board member of the Illinois Manufacturers’ Association |
| | | | | |
Beth Ann Brown – 1968 Trustee | | 2019 | | Independent Consultant Formerly: Head of Intermediary Distribution, Managing Director, Strategic Relations, Managing Director, Head of National Accounts, Senior Vice President, National Account Manager and Senior Vice President, Key Account Manager, Columbia Management Investment Advisers LLC; Vice President, Key Account Manager, Liberty Funds Distributor, Inc.; and Trustee of certain Oppenheimer Funds | | 229 | | Director, Board of Directors of Caron Engineering Inc.; Advisor, Board of Advisors of Caron Engineering Inc.; President and Director, of Acton Shapleigh Youth Conservation Corps (non-profit); and Vice President and Director of Grahamtastic Connection (non-profit) |
| | | | | |
Jack M. Fields – 1952 Trustee | | 2003 | | Chief Executive Officer, Twenty First Century Group, Inc. (government affairs company); and Chairman, Discovery Learning Alliance(non-profit) Formerly: Owner and Chief Executive Officer, Dos Angeles Ranch L.P. (cattle, hunting, corporate entertainment); Director, Insperity, Inc. (formerly known as Administaff) (human resources provider); Chief Executive Officer, Texana Timber LP (sustainable forestry company); Director of Cross Timbers Quail Research Ranch(non-profit); and member of the U.S. House of Representatives | | 229 | | None |
| | | | | |
Cynthia Hostetler – 1962 Trustee | | 2017 | | Non-Executive Director and Trustee of a number of public and private business corporations Formerly: Director, Aberdeen Investment Funds (4 portfolios); Head of Investment Funds and Private Equity, Overseas Private Investment Corporation; President, First Manhattan Bancorporation, Inc.; Attorney, Simpson Thacher & Bartlett LLP | | 229 | | Vulcan Materials Company (construction materials company); Trilinc Global Impact Fund; Genesee & Wyoming, Inc. (railroads); Artio Global Investment LLC (mutual fund complex); Edgen Group, Inc. (specialized energy and infrastructure products distributor); Investment Company Institute (professional organization); Independent Directors Council (professional organization) |
| | | | | |
Eli Jones – 1961 Trustee | | 2016 | | Professor and Dean, Mays Business School - Texas A&M University Formerly: Professor and Dean, Walton College of Business, University of Arkansas and E.J. Ourso College of Business, Louisiana State University; Director, Arvest Bank | | 229 | | Insperity, Inc. (formerly known as Administaff) (human resources provider) |
| | | | | |
Elizabeth Krentzman – 1959 Trustee | | 2019 | | Formerly: Principal and Chief Regulatory Advisor for Asset Management Services and U.S. Mutual Fund Leader of Deloitte & Touche LLP; General Counsel of the Investment Company Institute (trade association); National Director of the Investment Management Regulatory Consulting Practice, Principal, Director and Senior Manager of Deloitte & Touche LLP; Assistant Director of the Division of Investment Management – Office of Disclosure and Investment Adviser Regulation of the U.S. Securities and Exchange Commission and various positions with the Division of Investment Management – Office of Regulatory Policy of the U.S. Securities and Exchange Commission; Associate at Ropes & Gray LLP.; Advisory Board Member of the Securities and Exchange Commission Historical Society; and Trustee of certain Oppenheimer Funds | | 229 | | Trustee of the University of Florida National Board Foundation and Audit Committee Member; Member of the Cartica Funds Board of Directors (private investment funds); Member of the University of Florida Law Center Association, Inc. Board of Trustees and Audit Committee Member |
| | | | | |
Anthony J. LaCava, Jr. – 1956 Trustee | | 2019 | | Formerly: Director and Member of the Audit Committee, Blue Hills Bank (publicly traded financial institution) and Managing Partner, KPMG LLP | | 229* | | Blue Hills Bank; Chairman of Bentley University; Member, Business School Advisory Council; and Nominating Committee, KPMG LLP |
57 INVESCO OPPENHEIMER V.I. GLOBAL STRATEGIC INCOME FUND
TRUSTEES AND OFFICERS Continued
| | | | | | | | |
| | | | | |
Name, Year of Birth and Position(s) Held with the Trust | | Trustee and/or Officer Since | | Principal Occupation(s) During Past 5 Years | | Number of Funds in Fund Complex
Overseen by Trustee | | Other Directorship(s) Held by Trustee During Past
5 Years |
INDEPENDENT TRUSTEES (CONTINUED) | | | | | | | | |
| | | | | |
Prema Mathai-Davis – 1950 Trustee | | 2003 | | Retired Co-Owner & Partner of Quantalytics Research, LLC, (a FinTech Investment Research Platform for the Self-Directed Investor) | | 229 | | None |
| | | | | |
Joel W. Motley – 1952 Trustee | | 2019 | | Director of Office of Finance, Federal Home Loan Bank; Member of the Vestry of Trinity Wall Street; Managing Director of Carmona Motley Hoffman, Inc. (privately held financial advisor); Member of the Finance and Budget Committee of the Council on Foreign Relations, Member of the Investment Committee and Board of Human Rights Watch and Member of the Investment Committee and Board of Historic Hudson Valley(non-profit cultural organization). Formerly: Managing Director of Public Capital Advisors, LLC (privately held financial advisor); Managing Director of Carmona Motley Hoffman, Inc. (privately held financial advisor); Trustee of certain Oppenheimer Funds; and Director of Columbia Equity Financial Corp. (privately held financial advisor) | | 229 | | Director of Greenwall Foundation (bioethics research foundation); Member of Board and Investment Committee of The Greenwall Foundation; Director of Southern Africa Legal Services Foundation; Board Member and Investment Committee Member of Pulitzer Center for Crisis Reporting(non-profit journalism) |
| | | | | |
Teresa M. Ressel – 1962 Trustee | | 2017 | | Non-executive director and trustee of a number of public and private business corporations Formerly: Chief Financial Officer, Olayan America, The Olayan Group (international investor/commercial/industrial); Chief Executive Officer, UBS Securities LLC; Group Chief Operating Officer, Americas, UBS AG; Assistant Secretary for Management & Budget and CFO, US Department of the Treasury | | 229 | | Atlantic Power Corporation (power generation company); ON Semiconductor Corp. (semiconductor supplier) |
| | | | | |
Ann Barnett Stern – 1957 Trustee | | 2017 | | President and Chief Executive Officer, Houston Endowment Inc. (private philanthropic institution) Formerly: Executive Vice President and General Counsel, Texas Children’s Hospital; Attorney, Beck, Redden and Secrest, LLP; Business Law Instructor, University of St. Thomas; Attorney, Andrews & Kurth LLP | | 229 | | Federal Reserve Bank of Dallas |
| | | | | |
Robert C. Troccoli – 1949 Trustee | | 2016 | | Retired Formerly: Adjunct Professor, University of Denver – Daniels College of Business, Senior Partner, KPMG LLP | | 229 | | None |
| | | | | |
Daniel S. Vandivort – 1954 Trustee | | 2019 | | Treasurer, Chairman of the Audit and Finance Committee, and Trustee, Board of Trustees, Huntington Disease Foundation of America; and President, Flyway Advisory Services LLC (consulting and property management). Formerly: Trustee and Governance Chair, of certain Oppenheimer Funds | | 229 | | Chairman and Lead Independent Director, Chairman of the Audit Committee, and Director, Board of Directors, Value Line Funds |
| | | | | |
James D. Vaughn – 1945 Trustee | | 2019 | | Retired Formerly: Managing Partner, Deloitte & Touche LLP; Trustee and Chairman of the Audit Committee, Schroder Funds; Board Member, Mile High United Way, Boys and Girls Clubs, Boy Scouts, Colorado Business Committee for the Arts, Economic Club of Colorado and Metro Denver Network (economic development corporation); and Trustee of certain Oppenheimer Funds | | 229 | | Board member and Chairman of Audit Committee of AMG National Trust Bank; Trustee and Investment Committee member, University of South Dakota Foundation; Board member, Audit Committee Member and past Board Chair, Junior Achievement(non-profit) |
| | | | | |
Christopher L. Wilson – 1957 Trustee, Vice Chair and Chair Designate | | 2017 | | Retired Formerly: Director, TD Asset Management USA Inc. (mutual fund complex) (22 portfolios); Managing Partner, CT2, LLC (investing and consulting firm); President/Chief Executive Officer, Columbia Funds, Bank of America Corporation; President/Chief Executive Officer, CDC IXIS Asset Management Services, Inc.; Principal & Director of Operations, Scudder Funds, Scudder, Stevens & Clark, Inc.; Assistant Vice President, Fidelity Investments | | 229 | | ISO New England, Inc.(non-profit organization managing regional electricity market) |
58 INVESCO OPPENHEIMER V.I. GLOBAL STRATEGIC INCOME FUND
| | | | | | | | |
| | | | | |
Name, Year of Birth and Position(s) Held with the Trust | | Trustee and/or Officer Since | | Principal Occupation(s) During Past 5 Years | | Number of Funds in Fund Complex
Overseen by Trustee | | Other Directorship(s) Held by Trustee During Past
5 Years |
OTHER OFFICERS | | | | | | | | |
| | | | | |
Sheri Morris – 1964 President, Principal Executive Officer and Treasurer | | 2003 | | Head of Global Fund Services, Invesco Ltd.; President, Principal Executive Officer and Treasurer, The Invesco Funds; Vice President, Invesco Advisers, Inc. (formerly known as Invesco Institutional (N.A.), Inc.) (registered investment adviser); and Vice President, Invesco Exchange-Traded Fund Trust, Invesco Exchange-Traded Fund Trust II, Invesco India Exchange-Traded Fund Trust, Invesco Actively Managed Exchange-Traded Fund Trust, Invesco Actively Managed Exchange-Traded Commodity Fund Trust and Invesco Exchange-Traded Self-Indexed Fund Trust, and Vice President, OppenheimerFunds, Inc. Formerly: Vice President and Principal Financial Officer, The Invesco Funds; Vice President, Invesco AIM Advisers, Inc., Invesco AIM Capital Management, Inc. and Invesco AIM Private Asset Management, Inc.; Assistant Vice President and Assistant Treasurer, The Invesco Funds and Assistant Vice President, Invesco Advisers, Inc., Invesco AIM Capital Management, Inc. and Invesco AIM Private Asset Management, Inc.; and Treasurer, Invesco Exchange-Traded Fund Trust, Invesco Exchange-Traded Fund Trust II, Invesco India Exchange-Traded Fund Trust and Invesco Actively Managed Exchange-Traded Fund Trust | | N/A | | N/A |
| | | | | |
Russell C. Burk – 1958 Senior Vice President and Senior Officer | | 2005 | | Senior Vice President and Senior Officer, The Invesco Funds | | N/A | | N/A |
| | | | | |
Jeffrey H. Kupor – 1968 Senior Vice President, Chief Legal Officer and Secretary | | 2018 | | Head of Legal of the Americas, Invesco Ltd.; Senior Vice President and Secretary, Invesco Advisers, Inc. (formerly known as Invesco Institutional (N.A.), Inc.) (registered investment adviser); Senior Vice President and Secretary, Invesco Distributors, Inc. (formerly known as Invesco AIM Distributors, Inc.); Vice President and Secretary, Invesco Investment Services, Inc. (formerly known as Invesco AIM Investment Services, Inc.) Senior Vice President, Chief Legal Officer and Secretary, The Invesco Funds; Secretary and General Counsel, Invesco Investment Advisers LLC (formerly known as Van Kampen Asset Management); Secretary and General Counsel, Invesco Capital Markets, Inc. (formerly known as Van Kampen Funds Inc.) and Chief Legal Officer, Invesco Exchange-Traded Fund Trust, Invesco Exchange-Traded Fund Trust II, Invesco India Exchange-Traded Fund Trust, Invesco Actively Managed Exchange-Traded Fund Trust, Invesco Actively Managed Exchange-Traded Commodity Fund Trust and Invesco Exchange-Traded Self-Indexed Fund Trust; Secretary, Invesco Indexing LLC; Secretary, W.L. Ross & Co., LLC Formerly: Secretary and Vice President, Jemstep, Inc.; Head of Legal, Worldwide Institutional, Invesco Ltd.; Secretary and General Counsel, INVESCO Private Capital Investments, Inc.; Senior Vice President, Secretary and General Counsel, Invesco Management Group, Inc. (formerly known as Invesco AIM Management Group, Inc.); Assistant Secretary, INVESCO Asset Management (Bermuda) Ltd.; Secretary and General Counsel, Invesco Private Capital, Inc.; Assistant Secretary and General Counsel, INVESCO Realty, Inc.; Secretary and General Counsel, Invesco Senior Secured Management, Inc.; and Secretary, Sovereign G./P. Holdings Inc. | | N/A | | N/A |
| | | | | |
Andrew R. Schlossberg – 1974 Senior Vice President | | 2019 | | Head of the Americas and Senior Managing Director, Invesco Ltd.; Director and Senior Vice President, Invesco Advisers, Inc. (formerly known as Invesco Institutional (N.A.), Inc.) (registered investment adviser); Director and Chairman, Invesco Investment Services, Inc. (formerly known as Invesco AIM Investment Services, Inc.) (registered transfer agent); Senior Vice President, The Invesco Funds; Director, Invesco Investment Advisers LLC (formerly known as Van Kampen Asset Management); Director, President and Chairman, Invesco Insurance Agency, Inc. Formerly: Director, Invesco UK Limited; Director and Chief Executive, Invesco Asset Management Limited and Invesco Fund Managers Limited; Assistant Vice President, The Invesco Funds; Senior Vice President, Invesco Advisers, Inc. (formerly known as Invesco Institutional (N.A.), Inc.) (registered investment adviser); Director and Chief Executive, Invesco Administration Services Limited and Invesco Global Investment Funds Limited; Director, Invesco Distributors, Inc.; Head of EMEA, Invesco Ltd.; President, Invesco Actively Managed Exchange-Traded Commodity Fund Trust, Invesco Actively Managed Exchange-Traded Fund Trust, Invesco Exchange-Traded Fund Trust, Invesco Exchange-Traded Fund Trust II and Invesco India Exchange-Traded Fund Trust; Managing Director and Principal Executive Officer, Invesco Capital Management LLC | | N/A | | N/A |
59 INVESCO OPPENHEIMER V.I. GLOBAL STRATEGIC INCOME FUND
TRUSTEES AND OFFICERS Continued
| | | | | | | | |
| | | | | |
Name, Year of Birth and Position(s) Held with the Trust | | Trustee and/or Officer Since | | Principal Occupation(s) During Past 5 Years | | Number of Funds in Fund Complex
Overseen by Trustee | | Other Directorship(s) Held by Trustee During Past
5 Years |
OTHER OFFICERS (CONTINUED) | | | | | | | | |
| | | | | |
John M. Zerr – 1962 Senior Vice President | | 2006 | | Chief Operating Officer of the Americas; Senior Vice President, Invesco Advisers, Inc. (formerly known as Invesco Institutional (N.A.), Inc.) (registered investment adviser); Senior Vice President, Invesco Distributors, Inc. (formerly known as Invesco AIM Distributors, Inc.); Director and Vice President, Invesco Investment Services, Inc. (formerly known as Invesco AIM Investment Services, Inc.) Senior Vice President, The Invesco Funds; Managing Director, Invesco Capital Management LLC; Director, Invesco Investment Advisers LLC (formerly known as Van Kampen Asset Management); Senior Vice President, Invesco Capital Markets, Inc. (formerly known as Van Kampen Funds Inc.); Manager, Invesco Indexing LLC; Manager, Invesco Specialized Products, LLC; Director and Senior Vice President, Invesco Insurance Agency, Inc.; Member, Invesco Canada Funds Advisory Board; Director, President and Chief Executive Officer, Invesco Corporate Class Inc. (corporate mutual fund company); and Director, Chairman, President and Chief Executive Officer, Invesco Canada Ltd. (formerly known as Invesco Trimark Ltd./Invesco Trimark Ltèe) (registered investment adviser and registered transfer agent) Formerly: Director and Senior Vice President, Invesco Management Group, Inc. (formerly known as Invesco AIM Management Group, Inc.); Secretary and General Counsel, Invesco Management Group, Inc. (formerly known as Invesco AIM Management Group, Inc.); Secretary, Invesco Investment Services, Inc. (formerly known as Invesco AIM Investment Services, Inc.); Chief Legal Officer and Secretary, The Invesco Funds; Secretary and General Counsel, Invesco Investment Advisers LLC (formerly known as Van Kampen Asset Management); Secretary and General Counsel, Invesco Capital Markets, Inc. (formerly known as Van Kampen Funds Inc.); Chief Legal Officer, Invesco Exchange-Traded Fund Trust, Invesco Exchange-Traded Fund Trust II, Invesco India Exchange-Traded Fund Trust, Invesco Actively Managed Exchange-Traded Fund Trust, Invesco Actively Managed Exchange-Traded Commodity Fund Trust and Invesco Exchange-Traded Self-Indexed Fund Trust; Secretary, Invesco Indexing LLC; Director, Secretary, General Counsel and Senior Vice President, Van Kampen Exchange Corp.; Director, Vice President and Secretary, IVZ Distributors, Inc. (formerly known as INVESCO Distributors, Inc.); Director and Vice President, INVESCO Funds Group, Inc.; Director and Vice President, Van Kampen Advisors Inc.; Director, Vice President, Secretary and General Counsel, Van Kampen Investor Services Inc.; Director and Secretary, Invesco Distributors, Inc. (formerly known as Invesco AIM Distributors, Inc.); Director, Senior Vice President, General Counsel and Secretary, Invesco AIM Advisers, Inc. and Van Kampen Investments Inc.; Director, Vice President and Secretary, Fund Management Company; Director, Senior Vice President, Secretary, General Counsel and Vice President, Invesco AIM Capital Management, Inc.; Chief Operating Officer and General Counsel, Liberty Ridge Capital, Inc. (an investment adviser) | | N/A | | N/A |
| | | | | |
Gregory G. McGreevey – 1962 Senior Vice President | | 2012 | | Senior Managing Director, Invesco Ltd.; Director, Chairman, President, and Chief Executive Officer, Invesco Advisers, Inc. (formerly known as Invesco Institutional (N.A.), Inc.) (registered investment adviser); Director, Invesco Mortgage Capital, Inc. and Invesco Senior Secured Management, Inc.; and Senior Vice President, The Invesco Funds; and President, SNW Asset Management Corporation Formerly: Senior Vice President, Invesco Management Group, Inc. and Invesco Advisers, Inc.; Assistant Vice President, The Invesco Funds | | N/A | | N/A |
| | | | | |
Kelli Gallegos – 1970 Vice President, Principal Financial Officer and Assistant Treasurer | | 2008 | | Principal Financial and Accounting Officer – Investments Pool, Invesco Specialized Products, LLC; Vice President, Principal Financial Officer and Assistant Treasurer, The Invesco Funds; Principal Financial and Accounting Officer – Pooled Investments, Invesco Capital Management LLC; Vice President and Treasurer, Invesco Exchange-Traded Fund Trust, Invesco Exchange-Traded Fund Trust II, Invesco India Exchange-Traded Fund Trust, Invesco Actively Managed Exchange-Traded Fund Trust, Invesco Actively Managed Exchange-Traded Commodity Fund Trust and Invesco Exchange-Traded Self-Indexed Fund Trust Formerly: Assistant Treasurer, Invesco Specialized Products, LLC; Assistant Treasurer, Invesco Exchange-Traded Fund Trust, Invesco Exchange-Traded Fund Trust II, Invesco India Exchange-Traded Fund Trust, Invesco Actively Managed Exchange-Traded Fund Trust, Invesco Actively Managed Exchange-Traded Commodity Fund Trust and Invesco Exchange-Traded Self-Indexed Fund Trust; Assistant Treasurer, Invesco Capital Management LLC; Assistant Vice President, The Invesco Funds | | N/A | | N/A |
60 INVESCO OPPENHEIMER V.I. GLOBAL STRATEGIC INCOME FUND
| | | | | | | | |
| | | | | |
Name, Year of Birth and Position(s) Held with the Trust | | Trustee and/or Officer Since | | Principal Occupation(s) During Past 5 Years | | Number of Funds in Fund Complex
Overseen by Trustee | | Other Directorship(s) Held by Trustee During Past
5 Years |
OTHER OFFICERS (CONTINUED) | | | | | | | | |
| | | | | |
Crissie M. Wisdom – 1969 Anti-Money Laundering Compliance Officer | | 2013 | | Anti-Money Laundering Compliance Officer, Invesco Advisers, Inc. (formerly known as Invesco Institutional (N.A.), Inc.) (registered investment adviser), Invesco Capital Markets, Inc. (formerly known as Van Kampen Funds Inc.), Invesco Distributors, Inc., Invesco Investment Services, Inc., The Invesco Funds, and Invesco Exchange-Traded Fund Trust, Invesco Exchange-Traded Fund Trust II, Invesco India Exchange-Traded Fund Trust, Invesco Actively Managed Exchange-Traded Fund Trust, Invesco Actively Managed Exchange-Traded Commodity Fund Trust and Invesco Exchange-Traded Self-Indexed Fund Trust; Anti-Money Laundering Compliance Officer and Bank Secrecy Act Officer, INVESCO National Trust Company and Invesco Trust Company; and Fraud Prevention Manager and Controls and Risk Analysis Manager for Invesco Investment Services, Inc. Formerly: Anti-Money Laundering Compliance Officer, Van Kampen Exchange Corp. and Invesco Management Group, Inc. | | N/A | | N/A |
| | | | | |
Robert R. Leveille – 1969 Chief Compliance Officer | | 2016 | | Chief Compliance Officer, Invesco Advisers, Inc. (registered investment adviser); and Chief Compliance Officer, The Invesco Funds Formerly: Chief Compliance Officer, Putnam Investments and the Putnam Funds | | N/A | | N/A |
The Statement of Additional Information of the Trust includes additional information about the Fund’s Trustees and is available upon request, without charge, by calling 1.800.959.4246. Please refer to the Fund’s Statement of Additional Information for information on the Fund’ssub-advisers.
| | | | | | |
| Office of the Fund | | Investment Adviser | | Distributor | | Auditors |
11 Greenway Plaza, Suite 1000 Houston, TX 77046-1173 | | Invesco Advisers, Inc. 1555 Peachtree Street, N.E. Atlanta, GA 30309 | | Invesco Distributors, Inc. 11 Greenway Plaza, Suite 1000 Houston, TX 77046-1173 | | PricewaterhouseCoopers LLP 1000 Louisiana Street, Suite 5800 Houston, TX 77002-5021 |
| | | |
| Counsel to the Fund | | Counsel to the | | Transfer Agent | | Custodian |
Stradley Ronon Stevens & Young, LLP 2005 Market Street, Suite 2600 Philadelphia, PA 19103-7018 | | Independent Trustees Goodwin Procter LLP 901 New York Avenue, N.W. Washington, D.C. 20001 | | Invesco Investment Services, Inc. 11 Greenway Plaza, Suite 1000 Houston, TX 77046-1173 | | JPMorgan Chase Bank 4 Chase Metro Tech Center Brooklyn, NY 11245 |
61 INVESCO OPPENHEIMER V.I. GLOBAL STRATEGIC INCOME FUND
THIS PAGE INTENTIONALLY LEFT BLANK.
THIS PAGE INTENTIONALLY LEFT BLANK.

| | | | |

| | Annual Report | | 12/31/2019 |
| | |
| | | | |
| | | | |
| | | | |
| | | | |
| | | | |
| | |
| | Invesco Oppenheimer V.I. Government Money Fund* Beginning on January 1, 2021, as permitted by regulations adopted by the Securities and Exchange Commission, the insurance company that offers your variable annuity or variable life insurance contract may no longer send you paper copies of the Fund’s shareholder reports by mail, unless you specifically request paper copies of the reports from the insurance company or your financial intermediary. Instead of delivering paper copies of the report, the insurance company may choose to make the reports available on a website, and will notify you by mail each time a report is posted and provide you with a website link to access the report. Instructions for requesting paper copies will be provided by your insurance company. If the insurance company offers electronic delivery, you may elect to receive shareholder reports and other communications about the Fund electronically by following the instructions provided by the insurance company or by contacting your financial intermediary. If you already elected to receive shareholder reports electronically, you will not be affected by this change and you need not take any action. You may elect to receive all future reports in paper free of charge from the insurance company. You can inform the insurance company or your financial intermediary that you wish to continue receiving paper copies of your shareholder reports by following the instructions provided by the insurance company or by contacting your financial intermediary. Your election to receive reports in paper will apply to all portfolio companies available under your contract with the insurance company. The Fund provides a complete list of its holdings in various monthly and quarterly regulatory filings. The Fund files a complete schedule of portfolio holdings with the Securities and Exchange Commission (SEC) monthly on FormN-MFP. For the second and fourth quarters, the list also appears in the Fund’s semiannual and annual reports to shareholders. The most recent list of portfolio holdings is available at invesco.com/us. The Fund’s FormN-MFP filings are available on the SEC website, sec.gov. The Fund’s most recent portfolio holdings, as filed on FormN-MFP, have also been made available to insurance companies issuing variable annuity contracts and variable life insurance policies (“variable products”) that invest in the Fund. A description of the policies and procedures that the Fund uses to determine how to vote proxies relating to portfolio securities is available without charge, upon request, from our Client Services department at 800 959 4246 or at invesco.com/proxyguidelines. The information is also available on the SEC website, sec.gov. Information regarding how the Fund voted proxies related to its portfolio securities during the most recent12-month period ended June 30 is available at invesco.com/proxysearch. The information is also available on the SEC website, sec.gov. Invesco Advisers, Inc. is an investment adviser; it provides investment advisory services to individual and institutional clients and does not sell securities. Invesco Distributors, Inc. is the US distributor for Invesco Ltd.’s retail mutual funds, exchange-traded funds and institutional money market funds. Both are wholly owned, indirect subsidiaries of Invesco Ltd. This report must be accompanied or preceded by a currently effective Fund prospectus and variable product prospectus, which contain more complete information, including sales charges and expenses. Investors should read each carefully before investing. *Prior to the close of business on May 24, 2019, the Fund’s name was Oppenheimer Government Money Fund/VA. See Important Update on the following page for more information. |
Important Update
On October 18, 2018, Massachusetts Mutual Life Insurance Company, an indirect corporate parent of OppenheimerFunds, Inc. and its subsidiaries OFI Global Asset Management, Inc., OFI SteelPath, Inc. and OFI Advisors, LLC, announced that it had entered into an agreement whereby Invesco Ltd., a global investment management company would acquire OppenheimerFunds and its subsidiaries (together, “OppenheimerFunds”). After the close of business on May 24, 2019 Invesco Ltd. completed the acquisition of OppenheimerFunds. This Fund was included in that acquisition and as of that date, became part of the Invesco family of funds. Please visit invesco.com for more information or call Invesco’s Client Services team at800-959-4246.
| | | | | | | | | | | | | | | | | | |
Current Yield – Series I* | | | Current Yield – Series II** | |
For the7-Day Period Ended 12/31/19 | | | For the7-Day Period Ended 12/31/19 | |
With Compounding | | | 1.11% | | | | | | | With Compounding | | | 0.82% | | | | | |
Without Compounding | | | 1.11% | | | | | | | Without Compounding | | | 0.82% | | | | | |
For the12-Month Period Ended 12/31/19 | | | | | | | | | | | |
With Compounding | | | 1.69% | | | | | | | | | | | | | | | |
Without Compounding | | | 1.69% | | | | | | | | | | | | | | | |
Performance quoted is past performance and cannot guarantee future results; current performance may be lower or higher. Visit invesco.com for the most recentmonth-end performance. Performance figures reflect reinvested distributions and changes in net asset value (NAV). Investment return and principal value will vary so that you may have a gain or a loss when you sell shares. Fund returns include changes in share price, reinvested distributions. Performance figures given represent the Fund and are not intended to reflect actual variable product values. They do not reflect sales charges, expenses and fees assessed in connection with a variable product. Sales charges, expenses and fees, which are determined by the variable product issuers, will vary and will lower the total return. Returns for periods of less than one year are cumulative and not annualized. As the result of a reorganization after the close of business on May 24, 2019, theNon-Service and Service share classes of the predecessor fund were reorganized into Series I and Series II Shares, respectively, of the Fund. Returns shown for Series I and Series II shares are blended returns of the predecessor fund and the Fund. Share class returns will differ from those of the Oppenheimer predecessor fund because of different expenses. See Fund prospectuses and summary prospectuses for more information on share classes, sales charges and new fee agreements, if any. Fund literature is available at invesco.com.
| | | | |
PORTFOLIO ALLOCATION | | | | |
Repurchase Agreements | | | 47.8 | % |
U.S. Government Obligations | | | 29.4 | |
U.S. Government Agencies | | | 22.8 | |
Holdings and allocations are subject to change and are not buy/sell recommendations. Percentages are as of December 31, 2019, and are based on the total market value of investments.
Before investing, investors should carefully read the prospectus and/or summary prospectus and carefully consider the investment objectives, risks, charges and expenses. For this and more complete information about the fund(s), investors should ask their advisors for a prospectus/summary prospectus or visit invesco.com/fundprospectus.
Shares of Invesco funds are not deposits or obligations of any bank, are not guaranteed by any bank, are not insured by the FDIC or any other agency, and involve investment risks, including the possible loss of the principal amount invested.
*Effective after the close of business on May 24, 2019, theNon-Service share class of the predecessor fund was reorganized into Series I Shares of the Fund. Returns shown for Series I shares are blended returns of the predecessor fund and the Fund. Share class returns will differ from those of the predecessor fund because of different expenses.
**Series II Shares’ performance shown prior to the inception date is that of the predecessor fund’s Service Class shares at net asset value (NAV). Service Class shares’ performance reflects any applicable fee waivers and/or expense reimbursements.
For more current Fund holdings, please visit invesco.com.
|
| 3 INVESCO OPPENHEIMER V.I. GOVERNMENT MONEY FUND |
FUND PERFORMANCE DISCUSSION
Throughout the reporting period, the Fund continued to offer very strong liquidity and a stable $1.00 net asset value (NAV), while providing competitive income. At its December 2019 meeting, the Federal Open Market Committee (FOMC) voted for the Federal Funds Rate to remain in place at a range of 1.50% to 1.75%, ending a trend of rate cuts from the past 3 meetings. The Fund was well positioned ahead of the rate cuts with the employment of a barbell strategy that included extending the weighted average maturity while keeping a substantial position in repo positions due to the inversion of the curve.
MARKET OVERVIEW
The current broader market view is that the FOMC monetary policy directive is on hold for the year 2020, negative net issuance of treasury supply and the continuation by the Fed stabilization of the funding markets by liquidity injections in the form of temporary open market operations and treasury bill purchases. In October 2019, The Federal Reserve (“Fed”) directed the Desk to purchase $60 billion per month in short term treasury bills at least into the second quarter of 2020 to maintain sufficient reserve balances. This has resulted in the flattening of the treasury curve and the stabilization of the repo markets. Repo has been trending toward the lower end of the Federal Funds Rate of 1.50% in part to due to the Fed conducting overnight and term repo operations to keep adequate reserve supply and to lessen the risk of money market pressures on certain funding dates.
FUND REVIEW
The Fund’s weighted average maturity is 15 days with a range of7-25 days. Supply continues to be available, notably in Federal Home Loan Bank paper. We are heavily weighted in government repo and will occasionally ladder in long-dated fixed and floating paper to the portfolio.
STRATEGY & OUTLOOK
Our strategy continues to incorporate selective and incremental investing as we seek to provide shareholders stable and steady value. We intend to remain active in the auction market, with most of that weight going to fixed-rate instruments with durations of six months or less. When pricing allows, we will continue to layer inone- and three-month floating rate securities. We believe the Fund is well-positioned to meet any large outflow while taking advantage of timely market trades.
The views in the Fund Performance Discussion represent the opinions of this Fund’s portfolio managers and are not intended as investment advice or to predict or depict the performance of any investment. These views are as of the close of business on December 31, 2019, and are subject to change based on subsequent developments. The Fund’s portfolio and strategies are subject to change.
You could lose money by investing in the Fund. Although the Fund seeks to preserve the value of your investment at $1.00 per share, it cannot guarantee it will do so. An investment in the Fund is not insured or guaranteed by the Federal Deposit Insurance Corporation or any other government agency. The Fund’s sponsor has no legal obligation to provide financial support to the Fund, and you should not expect that the sponsor will provide financial support to the Fund at any time.
Shares of Invesco funds are not deposits or obligations of any bank, are not guaranteed by any bank, are not insured by the FDIC or any other agency, and involve investment risks, including the possible loss of the principal amount invested.
|
| 4 INVESCO OPPENHEIMER V.I. GOVERNMENT MONEY FUND |
Fund Expenses
Fund Expenses.As a shareholder of the Fund, you incur two types of costs: (1) transaction costs and (2) ongoing costs, including management fees; and other Fund expenses. These examples are intended to help you understand your ongoing costs (in dollars) of investing in the Fund and to compare these costs with the ongoing costs of investing in other mutual funds.
The examples are based on an investment of $1,000.00 invested at the beginning of the period and held for the entire6-month period ended December 31, 2019.
Actual Expenses. The first section of the table provides information about actual account values and actual expenses. You may use the information in this section, together with the amount you invested, to estimate the expense that you paid over the period. Simply divide your account value by $1,000.00 (for example, an $8,600.00 account value divided by $1,000.00 = 8.60), then multiply the result by the number in the first section under the heading entitled “Expenses Paid During 6 Months Ended December 31, 2019” to estimate the expenses you paid on your account during this period.
Hypothetical Example for Comparison Purposes.
The second section of the table provides information about hypothetical account values and hypothetical expenses based on the Fund’s actual expense ratio, and an assumed rate of return of 5% per year before expenses, which is not the actual return. The hypothetical account values and expenses may not be used to estimate the actual ending account balance or expenses you paid for the period. You may use this information to compare the ongoing costs of investing in the Fund and other funds. To do so, compare this 5% hypothetical example with the 5% hypothetical examples that appear in the shareholder reports of the other funds.
Please note that the expenses shown in the table are meant to highlight your ongoing costs only and do not reflect any charges associated with the separate accounts that offer this Fund. Therefore, the “hypothetical” lines of the table are useful in comparing ongoing costs only, and will not help you determine the relative total costs of owning different funds. In addition, if these separate account charges were included your costs would have been higher.
| | | | | | | | | | | | | | | | |
| Actual | | Beginning Account Value July 1, 2019 | | | Ending Account Value December 31, 2019 | | | Expenses Paid During 6 Months Ended December 31, 2019 | | | | |
Series I shares | | $ | 1,000.00 | | | $ | 1,007.30 | | | $ | 2.53 | | �� | | | |
Series II shares | | | 1,000.00 | | | | 1,006.30 | | | | 3.70 | | | | | |
| | | | |
Hypothetical (5% return before expenses) | | | | | | | | | | | | | | | | |
Series I shares | | | 1,000.00 | | | | 1,022.68 | | | | 2.55 | | | | | |
Series II shares | | | 1,000.00 | | | | 1,021.53 | | | | 3.73 | | | | | |
Expenses are equal to the Fund’s annualized expense ratio, multiplied by the average account value over the period, multiplied by 184/365 (to reflect theone-half year period). This annualized expense ratio, excluding indirect expenses from affiliated funds, based on the6-month period ended December 31, 2019 is as follows:
| | | | | |
| Class | | Expense Ratios |
| Series I shares | | | | 0.50% | |
| Series II shares | | | | 0.73 | |
The expense ratio reflects voluntary and/or contractual waivers and/or reimbursements of expenses by the Fund’s Manager. Some of these undertakings may be modified or terminated at any time, as indicated in the Fund’s prospectus. The “Financial Highlights” table in the Fund’s financial statements, included in this report, also shows the gross expense ratio, without such waivers or reimbursements and reduction to custodian expenses, if applicable.
|
| 5 INVESCO OPPENHEIMER V.I. GOVERNMENT MONEY FUND |
SCHEDULE OF INVESTMENTSDecember 31, 2019
| | | | | | | | | | | | | | |
| | | Maturity Date* | | | Final Legal Maturity
Date** | | | Principal
Amount | | | Value |
|
| U.S. Government Agencies—23.1% | | | | | | | | | | | | | | |
|
Federal Home Loan Bank: | | | | | | | | | | | | | | |
1.554%1 | | | 4/1/20 | | | | 4/1/20 | | | $ | 5,500,000 | | | $ 5,478,481 |
1.575% [SOFRRATE+3.5]2 | | | 1/2/20 | | | | 2/21/20 | | | | 2,500,000 | | | 2,500,000 |
1.59% [SOFRRATE+5]2 | | | 1/2/20 | | | | 1/17/20 | | | | 1,000,000 | | | 1,000,000 |
1.606%1 | | | 3/6/20 | | | | 3/6/20 | | | | 1,900,000 | | | 1,894,580 |
1.625% [SOFRRATE+8.5]2 | | | 1/2/20 | | | | 9/10/21 | | | | 25,000,000 | | | 25,000,000 |
1.627%1 | | | 2/21/20 | | | | 2/21/20 | | | | 1,100,000 | | | 1,097,538 |
1.63%1 | | | 2/6/20 | | | | 2/6/20 | | | | 5,000,000 | | | 4,992,100 |
1.637%1 | | | 2/5/20 | | | | 2/5/20 | | | | 2,400,000 | | | 2,396,313 |
1.642%1 | | | 2/7/20 | | | | 2/7/20 | | | | 4,000,000 | | | 3,993,525 |
1.65%[US0001M-6]2 | | | 1/9/20 | | | | 6/9/20 | | | | 3,000,000 | | | 3,000,000 |
1.67%[US0001M-7]2 | | | 1/16/20 | | | | 7/16/20 | | | | 3,000,000 | | | 3,000,000 |
| 1.695%[US0001M-4.5]2 | | | 1/15/20 | | | | 10/15/20 | | | | 5,000,000 | | | 5,000,000 |
|
Federal Home Loan Mortgage Corp., 1.58% [SOFRRATE+4]2 | | | 1/2/20 | | | | 9/10/20 | | | | 26,000,000 | | | 26,000,000 |
| | | | | | | | | | | | | | |
Total U.S. Government Agencies (Cost $85,352,537) | | | | | | | | | | | | | | 85,352,537 |
| | | | |
| | | | | | | | | | | | | | |
|
| U.S. Government Obligations—29.7% | | | | | | | | | | | | | | |
|
United States Treasury Bills: | | | | | | | | | | | | | | |
1.323%1 | | | 1/21/20 | | | | 1/21/20 | | | | 4,000,000 | | | 3,996,645 |
1.362%1 | | | 1/28/20 | | | | 1/28/20 | | | | 40,000,000 | | | 39,953,350 |
1.38%1 | | | 1/14/20 | | | | 1/14/20 | | | | 9,000,000 | | | 8,995,029 |
1.446%1 | | | 2/4/20 | | | | 2/4/20 | | | | 4,000,000 | | | 3,994,258 |
1.462%1 | | | 2/11/20 | | | | 2/11/20 | | | | 10,000,000 | | | 9,982,495 |
1.48%1 | | | 2/18/20 | | | | 2/18/20 | | | | 8,000,000 | | | 7,983,413 |
1.513%1 | | | 3/19/20 | | | | 3/19/20 | | | | 5,000,000 | | | 4,983,317 |
1.532%1 | | | 3/5/20 | | | | 3/5/20 | | | | 3,000,000 | | | 2,991,680 |
1.619%1 | | | 1/23/20 | | | | 1/23/20 | | | | 10,000,000 | | | 9,990,039 |
1.623%1 | | | 4/30/20 | | | | 4/30/20 | | | | 3,000,000 | | | 2,983,900 |
1.811%1 | | | 4/2/20 | | | | 4/2/20 | | | | 10,000,000 | | | 9,954,128 |
|
United States Treasury Floating Rate Note, 1.826% [USBMMY3M+30]2 | | | 1/2/20 | | | | 11/1/21 | | | | 4,000,000 | | | 4,002,869 |
| | | | | | | | | | | | | | |
Total U.S. Government Obligations (Cost $109,811,123) | | | | | | | | | | | | | | 109,811,123 |
| | | | |
| | | | | | | | | | | | | | |
|
| Repurchase Agreements—48.4% | | | | | | | | | | | | | | |
|
| Repurchase Agreements3(Cost $179,000,000) | | | | | | | | | | | 179,000,000 | | | 179,000,000 |
|
| Total Investments, at Value (Cost $374,163,660) | | | | | | | | | | | 101.2% | | | 374,163,660 |
|
Net Other Assets (Liabilities) | | | | | | | | | | | (1.2 | ) | | (4,394,298) |
| | | | | | | | | | | |
Net Assets | | | | | | | | | | | 100.0% | | | $ 369,769,362 |
| | | | | | | | | | | |
Footnotes to Schedule of Investments
Short-term notes and direct bank obligations are generally traded on a discount basis; the interest rate shown is the discount rate received by the Fund at the time of purchase. Other securities normally bear interest at the rates shown.
*.The Maturity Date represents the date used to calculate the Fund’s weighted average maturity as determined under Rule2a-7.
**.If different from the Maturity Date, the Final Legal Maturity Date includes any maturity date extensions which may be affected at the option of the issuer or unconditional payments of principal by the issuer which may be affected at the option of the Fund, and represents the date used to calculate the Fund’s weighted average life as determined under Rule2a-7.
1.Zero coupon bond reflects effective yield on the original acquisition date.
2.Represents the current interest rate for a variable or increasing rate security, which may be fixed for a predetermined period. The interest rate is, or will be as of an established date, determined as [Referenced Rate + Basis-point spread].
3.Repurchase agreements:
| | | | | | | | | | | | | | | | | | | | | | | | | | | | |
| | | | | | | | | | | | | | | | | | | | | | Repurchase | |
| | | | | | | | | | | | | | | | | | | Repurchase | | | Agreement | |
| | | Lending | | | Settlement | | | Maturity | | | Principal | | | | | | | Agreements, | | | Proceeds to be | |
| Counterparty | | Rate | | | Date | | | Date | | | Amount | | | Collateralized By | | | | at Value | | | Receiveda | |
| Credit Agricole Corporate & Investment Bank | | | 1.59% | | | | 12/31/19 | | | | 1/2/20 | | | | $10,000,000 | | | Agreement dated 12/31/2019, maturing value of $10,000,833 (collateralized by a U.S. Treasury obligation valued at $10,200,990; 3.63%; 02/15/2044) | | | | | $10,000,000 | | | | $10,000,833 | |
|
| 6 INVESCO OPPENHEIMER V.I. GOVERNMENT MONEY FUND |
Footnotes to Schedule of Investments (Continued)
| | | | | | | | | | | | | | | | | | | | | | | | | | | | |
| | | | | | | | | | | | | | | | | | | | | | Repurchase | |
| | | | | | | | | | | | | | | | | | | Repurchase | | | Agreement | |
| | | Lending | | | Settlement | | | Maturity | | | Principal | | | | | | | Agreements, | | | Proceeds to be | |
| Counterparty | | Rate | | | Date | | | Date | | | Amount | | | Collateralized By | | | | at Value | | | Receiveda | |
| RBC Dominion Securities Inc. | | | 1.57% | | | | 12/31/19 | | | | 1/2/20 | | | | $65,000,000 | | | Agreement dated 12/31/2019, maturing value of $65,005,669 (collateralized by domestic agency mortgage-backed securities and U.S. Treasury obligations valued at $66,305,850; 1.38% - 4.50%; 05/15/2023 - 01/01/2050) | | | | | $65,000,000 | | | | $65,005,669 | |
| RBC Dominion Securities Inc. | | | 2.00 | | | | 12/27/19 | | | | 1/3/20 | | | | 29,000,000 | | | Term agreement dated 12/27/2019, maturing value of $29,011,278 (collateralized by domestic agency mortgage-backed securities valued at $29,589,861; 2.50% - 4.50%; 12/20/2040 - 01/01/2050) | | | | | 29,000,000 | | | | 29,011,278 | |
| TD Securities (USA) LLC | | | 1.57 | | | | 12/31/19 | | | | 1/2/20 | | | | 75,000,000 | | | Agreement dated 12/31/2019, maturing value of $75,006,542 (collateralized by a domestic agency mortgage-backed security valued at $76,506,673; 2.50%; 01/01/2050) | | | | | 75,000,000 | | | | 75,006,542 | |
| | | | | | | | | | | | | | | | | | | | | | | $179,000,000 | | | | $179,024,322 | |
a.Includes accrued interest.
Glossary:
| | |
| Definitions | | |
| ICE LIBOR | | International Exchange London Interbank Offered Rate |
| SOFRRATE | | United States Secured Overnight Financial Rate |
| US0001M | | ICE LIBOR USD 1 Month |
| USBMMY3M | | U. S. Treasury Bill Rate 3 Month Money Market Yield |
See accompanying Notes to Financial Statements.
|
| 7 INVESCO OPPENHEIMER V.I. GOVERNMENT MONEY FUND |
STATEMENT OF ASSETS AND LIABILITIESDecember 31, 2019
| | | | |
| Assets | | | | |
| Investments, at value—see accompanying schedule of investments: | | | | |
| Unaffiliated companies (cost $195,163,660) | | $ | 195,163,660 | |
| Repurchase agreements (cost $179,000,000) | | | 179,000,000 | |
| | | | 374,163,660 | |
| Cash | | | 1,258,869 | |
| Receivables and other assets: | | | | |
| Interest | | | 93,130 | |
| Shares of beneficial interest sold | | | 26,654 | |
| Other | | | 94,151 | |
| Total assets | | | 375,636,464 | |
| Liabilities | | | | |
| Payables and other liabilities: | | | | |
| Investments purchased | | | 5,478,481 | |
| Shares of beneficial interest redeemed | | | 181,709 | |
| Trustees’ compensation | | | 91,623 | |
| Shareholder communications | | | 46,314 | |
| Administration fees | | | 11,838 | |
| Transfer and shareholder servicing agent fees | | | 6,430 | |
| Advisory fees | | | 4,501 | |
| Dividends | | | 3,482 | |
| Distribution and service plan fees | | | 2 | |
| Other | | | 42,722 | |
| Total liabilities | | | 5,867,102 | |
| Net Assets | | $ | 369,769,362 | |
| | | | |
| | | | | |
| Composition of Net Assets | | | | |
| Shares of beneficial interest | | $ | 369,762,749 | |
| Total distributable earnings | | | 6,613 | |
| Net Assets | | $ | 369,769,362 | |
| | | | |
| | | | | |
| Net Asset Value Per Share | | | | |
| Series I Shares: | | | | |
| Net asset value, redemption price per share and offering price per share (based on net assets of $369,759,362 and 369,723,093 shares of beneficial interest outstanding) | | | $1.00 | |
| Series II Shares: | | | | |
| Net asset value, redemption price per share and offering price per share (based on net assets of $10,000 and 10,000 shares of beneficial interest outstanding) | | | $1.00 | |
See accompanying Notes to Financial Statements.
|
| 8 INVESCO OPPENHEIMER V.I. GOVERNMENT MONEY FUND |
STATEMENT OF OPERATIONSFor the Year EndedDecember 31, 2019
| | | | |
| Investment Income | | | | |
Interest from unaffiliated companies | | $ | 26,685,603 | |
Dividends from affiliated companies | | | 224,841 | |
Total investment income | | | 26,910,444 | |
| Expenses | | | | |
Advisory fees | | | 4,856,081 | |
Administration fees | | | 210,528 | |
Distribution and service plan fees — Series II shares | | | 15 | |
Transfer and shareholder servicing agent fees — Series I shares | | | 868,233 | |
Shareholder communications: | | | | |
Series I shares | | | 62,384 | |
Series II shares | | | 1 | |
Trustees’ compensation | | | 53,870 | |
Custodian fees and expenses | | | 12,883 | |
Other | | | 131,959 | |
Total expenses | | | 6,195,954 | |
Less waivers, reimbursement of expenses and offset arrangement(s) | | | (367,069 | ) |
| Net expenses | | | 5,828,885 | |
| Net Investment Income | | | 21,081,559 | |
| Realized Gain on Investment Transactions in Unaffiliated Companies | | | 10,320 | |
Net Increase in Net Assets Resulting from Operations | | $ | 21,091,879 | |
| | | | |
See accompanying Notes to Financial Statements.
|
| 9 INVESCO OPPENHEIMER V.I. GOVERNMENT MONEY FUND |
STATEMENT OF CHANGES IN NET ASSETS
| | | | | | |
| | | Year Ended December 31, 2019 | | Year Ended December 31, 2018 |
| Operations | | | | | | |
| Net investment income | | $ | 21,081,559 | | | $ 14,653,999 |
| Net realized gain | | | 10,320 | | | 155 |
| Net increase in net assets resulting from operations | | | 21,091,879 | | | 14,654,154 |
| Dividends and/or Distributions to Shareholders | | | | | | |
| Distributions to shareholders from distributable earnings: | | | | | | |
| Series I shares | | | (21,080,865 | ) | | (14,654,285) |
| Series II shares | | | (78 | ) | | — |
| Total distributions from distributable earnings | | | (21,080,943 | ) | | (14,654,285) |
| Beneficial Interest Transactions | | | | | | |
| Net increase (decrease) in net assets resulting from beneficial interest transactions: | | | | | | |
| Series I shares | | | (2,685,977,149 | ) | | 2,630,121,422 |
| Series II shares | | | 10,000 | | | — |
| Total beneficial interest transactions | | | (2,685,967,149 | ) | | 2,630,121,422 |
| Net Assets | | | | | | |
| Total increase (decrease) | | | (2,685,956,213 | ) | | 2,630,121,291 |
| Beginning of period | | | 3,055,725,575 | | | 425,604,284 |
| End of period | | $ | 369,769,362 | | | $ 3,055,725,575 |
| | | |
See accompanying Notes to Financial Statements.
|
| 10 INVESCO OPPENHEIMER V.I. GOVERNMENT MONEY FUND |
FINANCIAL HIGHLIGHTS
| | | | | | | | | | | | | | | | | | | | | | | | | |
| Series I Shares | | Year Ended December 31, 2019 | | Year Ended
December 31,
2018 | | Year Ended
December 31,
2017 | | Year Ended
December 31,
2016 | | Year Ended
December 31,
2015 |
| Per Share Operating Data | | | | | | | | | | | | | | | | | | | | | | | | | |
| Net asset value, beginning of period | | | | $1.00 | | | | | $1.00 | | | | | $1.00 | | | | | $1.00 | | | | | $1.00 | |
| Income (loss) from investment operations: | | | | | | | | | | | | | | | | | | | | | | | | | |
| Net investment income1 | | | | 0.02 | | | | | 0.01 | | | | | 0.002 | | | | | 0.002 | | | | | 0.002 | |
| Net realized and unrealized gain (loss) | | | | 0.002 | | | | | 0.002 | | | | | (0.00)2 | | | | | (0.00)2 | | | | | 0.002 | |
| | | | | | | | | | | | | | | | | | | | | | | | | |
| Total from investment operations | | | | 0.02 | | | | | 0.01 | | | | | 0.002 | | | | | 0.002 | | | | | 0.002 | |
| Dividends and/or distributions to shareholders: | | | | | | | | | | | | | | | | | | | | | | | | | |
| Dividends from net investment income | | | | (0.02) | | | | | (0.01) | | | | | (0.00)2 | | | | | (0.00)2 | | | | | (0.00)2 | |
| Net asset value, end of period | | | | $1.00 | | | | | $1.00 | | | | | $1.00 | | | | | $1.00 | | | | | $1.00 | |
| | | | | | | | | | | | | | | | | | | | | | | | | |
| | | | | | | | | | | | | | | | | | | | | | | | | |
| | | | | | | | | | | | | | | | | | | | | | | | | |
| Total Return, at Net Asset Value3 | | | | 1.71% | | | | | 1.35% | | | | | 0.39% | | | | | 0.01% | | | | | 0.01% | |
| | | | | | | | | | | | | | | | | | | | | | | | | | |
| Ratios/Supplemental Data | | | | | | | | | | | | | | | | | | | | | | | | | |
| Net assets, end of period (in thousands) | | | | $369,759 | | | | | $3,055,726 | | | | | $425,604 | | | | | $541,970 | | | | | $2,648,636 | |
| Average net assets (in thousands) | | | | $1,155,434 | | | | | $952,018 | | | | | $488,532 | | | | | $1,470,447 | | | | | $1,144,581 | |
| Ratios to average net assets:4 | | | | | | | | | | | | | | | | | | | | | | | | | |
| Net investment income | | | | 1.82% | | | | | 1.54% | | | | | 0.39% | | | | | 0.01% | | | | | 0.01% | |
| | | | | | | | | | | | | | | | | | | | | | | | | |
| Total expenses5 | | | | 0.54% | | | | | 0.56% | | | | | 0.59% | | | | | 0.55% | | | | | 0.53% | |
| Expenses after payments, waivers and/or reimbursements and reduction to custodian expenses | | | | 0.50% | | | | | 0.50% | | | | | 0.50% | | | | | 0.35% | | | | | 0.19% | |
1.Calculated based on the average shares outstanding during the period.
2.Less than $0.005 per share
3.Includes adjustments in accordance with accounting principles generally accepted in the United States of America and as such, the net asset value for financial reporting purposes and the returns based upon those net asset values may differ from the net asset value and returns for shareholder transactions. Total returns are not annualized for periods less than one year, if applicable and do not reflect charges assessed in connection with a variable product, which if included would reduce total returns.
4.Annualized for periods less than one full year.
5.Total expenses including indirect expenses from fund fees and expenses were as follows:
| | | | | | | | |
| Year Ended December 31, 2019 | | | 0.54% | | | | | |
| Year Ended December 31, 2018 | | | 0.56% | | | | | |
| Year Ended December 31, 2017 | | | 0.59% | | | | | |
| Year Ended December 31, 2016 | | | 0.55% | | | | | |
| Year Ended December 31, 2015 | | | 0.53% | | | | | |
See accompanying Notes to Financial Statements.
|
| 11 INVESCO OPPENHEIMER V.I. GOVERNMENT MONEY FUND |
FINANCIAL HIGHLIGHTSContinued
| | | | | |
| Series II Shares | | Period Ended December 31, 20191 |
| Per Share Operating Data | | | | | |
| Net asset value, beginning of period | | | | $1.00 | |
| Income (loss) from investment operations: | | | | | |
| Net investment income2 | | | | 0.01 | |
| Net realized and unrealized gain | | | | 0.003 | |
| Total from investment operations | | | | 0.01 | |
| Dividends and/or distributions to shareholders: | | | | | |
| Dividends from net investment income | | | | (0.01) | |
| Net asset value, end of period | | | | $1.00 | |
| | | | | |
| | | | | |
| | | | | | |
| Total Return, at Net Asset Value4 | | | | 0.78% | |
| | | | | | |
| Ratios/Supplemental Data | | | | | |
| Net assets, end of period (in thousands) | | | | $10 | |
| Average net assets (in thousands) | | | | $10 | |
| Ratios to average net assets:5 | | | | | |
| Net investment income | | | | 1.61% | |
| Total expenses6 | | | | 0.72% | |
| Expenses after payments, waivers and/or reimbursements and reduction to custodian expenses | | | | 0.72% | |
1.For the period from May 24, 2019 (commencement of operations) to December 31, 2019.
2.Calculated based on the average shares outstanding during the period.
3.Less than $0.005 per share.
4.Includes adjustments in accordance with accounting principles generally accepted in the United States of America and as such, the net asset value for financial reporting purposes and the returns based upon those net asset values may differ from the net asset value and returns for shareholder transactions. Total returns are not annualized for periods less than one year, if applicable and do not reflect charges assessed in connection with a variable product, which if included would reduce total returns.
5.Annualized for periods less than one full year.
6.Total expenses including indirect expenses from fund fees and expenses were as follows:
| | | | | | | | |
| Period Ended December 31, 2019 | | | 0.72% | | | | | |
See accompanying Notes to Financial Statements.
|
| 12 INVESCO OPPENHEIMER V.I. GOVERNMENT MONEY FUND |
NOTES TO FINANCIAL STATEMENTSDecember 31, 2019
Note 1 – Significant Accounting Policies
Invesco Oppenheimer V.I. Government Money Fund (the “Fund”) is a series portfolio of AIM Variable Insurance Funds (Invesco Variable Insurance Funds) (the “Trust”). The Trust is a Delaware statutory trust registered under the Investment Company Act of 1940, as amended (the “1940 Act”), as anopen-end series management investment company authorized to issue an unlimited number of shares of beneficial interest. Information presented in these financial statements pertains only to the Fund. Matters affecting the Fund or each class will be voted on exclusively by the shareholders of such Fund or each class.
Prior to the close of business on May 24, 2019, the Fund operated as Oppenheimer Government Money/VA Fund (the “Acquired Fund” or “Predecessor Fund”). The Acquired Fund was reorganized after the close of business on May 24, 2019 (the “Reorganization Date”) through the transfer of all of its assets and liabilities to the Fund (the “Reorganization”).
Upon closing of the Reorganization, holders of the Acquired Fund’sNon-Service shares received Series I shares of the Fund. Information for the Acquired Fund’sNon-Service shares prior to the Reorganization is included with Series I throughout this report. Series II shares commenced operations on the Reorganization Date.
The Fund’s investment objective is to seek income consistent with stability of principal.
The Fund currently offers two classes of shares, Series I and Series II, both of which are offered to insurance company separate accounts funding variable annuity contracts and variable life insurance policies (“variable products”).
The Fund is an investment company and accordingly follows the investment company accounting and reporting guidance in accordance with Financial Accounting Standards Board Accounting Standards Codification Topic 946, Financial Services – Investment Companies.
The following is a summary of the significant accounting policies followed by the Fund in the preparation of its financial statements.
A. Security Valuations- The Fund’s securities are recorded on the basis of amortized cost which approximates value as permitted by Rule2a-7 under the 1940 Act. This method values a security at its cost on the date of purchase and, thereafter, assumes a constant amortization to maturity of any premiums or accretion of any discounts.
Because of the inherent uncertainties of valuation, the values reflected in the financial statements may materially differ from the value received upon actual sale of those investments.
The Fund may invest in securities that are subject to interest rate risk, meaning the risk that the prices will generally fall as interest rates rise and, conversely, the prices will generally rise as interest rates fall. Specific securities differ in their sensitivity to changes in interest rates depending on their individual characteristics. Changes in interest rates may result in increased market volatility, which may affect the value and/or liquidity of certain Fund investments.
| B. | Securities Transactions and Investment Income -Securities transactions are accounted for on a trade date basis. Realized gains or losses on sales are computed on the basis of specific identification of the securities sold. Interest income (net of withholding tax, if any) is recorded on the accrual basis from settlement date. Bond premiums and discounts are amortized and/or accreted over the lives of the respective securities. |
The Fund may periodically participate in litigation related to Fund investments. As such, the Fund may receive proceeds from litigation settlements. Any proceeds received are included in the Statement of Operations as realized gain (loss) for investments no longer held and as unrealized gain (loss) for investments still held.
Brokerage commissions and mark ups are considered transaction costs and are recorded as an increase to the cost basis of securities purchased and/or a reduction of proceeds on a sale of securities. Such transaction costs are included in the determination of net realized and unrealized gain (loss) from investment transactions reported in the Statement of Operations and the Statement of Changes in Net Assets and the net realized and unrealized gains (losses) on securities per share in the Financial Highlights. Transaction costs are included in the calculation of the Fund’s net asset value and, accordingly, they reduce the Fund’s total returns. These transaction costs are not considered operating expenses and are not reflected in net investment income reported in the Statement of Operations and the Statement of Changes in Net Assets, or the net investment income per share and the ratios of expenses and net investment income reported in the Financial Highlights, nor are they limited by any expense limitation arrangements between the Fund and the investment adviser.
The Fund allocates income and realized and unrealized capital gains and losses to a class based on the relative net assets of each class.
| C. | Country Determination- For the purposes of making investment selection decisions and presentation in the Schedule of Investments, the investment adviser may determine the country in which an issuer is located and/or credit risk exposure based on various factors. These factors include the laws of the country under which the issuer is organized, where the issuer maintains a principal office, the country in which the issuer derives 50% or more of its total revenues and the country that has the primary market for the issuer’s securities, as well as other criteria. Among the other criteria that may be evaluated for making this determination are the country in which the issuer maintains 50% or more of its assets, the type of security, financial guarantees and enhancements, the nature of the collateral and the sponsor organization. |
| D. | Distributions -Dividends and distributions to shareholders, which are determined in accordance with income tax regulations and may differ from accounting principles generally accepted in the United States of America (“GAAP”), are recorded on theex-dividend date. Income distributions, if any, are declared daily and paid monthly to separate accounts of participating insurance companies. Capital gain distributions, if any, are declared and paid annually or at other times as determined necessary by the Adviser. |
| E. | Federal Income Taxes -The Fund intends to comply with the requirements of Subchapter M of the Internal Revenue Code of 1986, as amended (the “Internal Revenue Code”), necessary to qualify as a regulated investment company and to distribute substantially all of the Fund’s taxable earnings to shareholders. As such, the Fund will not be subject to federal income taxes on otherwise taxable income (including net realized capital gain) that is distributed to shareholders. Therefore, no provision for federal income taxes is recorded in the financial statements. |
The Fund recognizes the tax benefits of uncertain tax positions only when the position is more likely than not to be sustained. Management has
|
| 13 INVESCO OPPENHEIMER V.I. GOVERNMENT MONEY FUND |
NOTES TO FINANCIAL STATEMENTSContinued
analyzed the Fund’s uncertain tax positions and concluded that no liability for unrecognized tax benefits should be recorded related to uncertain tax positions. Management is not aware of any tax positions for which it is reasonably possible that the total amounts of unrecognized tax benefits will change materially in the next 12 months.
The Fund files tax returns in the U.S. Federal jurisdiction and certain other jurisdictions. Generally, the Fund is subject to examinations by such taxing authorities for up to three years after the filing of the return for the tax period.
| F. | Expenses -Fees provided for under the Rule12b-1 plan of a particular class of the Fund and which are directly attributable to that class are charged to the operations of the class. All other expenses are allocated among the classes of the Fund based on relative net assets. |
| G. | Accounting Estimates -The financial statements are prepared on a basis in conformity with GAAP, which requires management to make estimates and assumptions that affect the reported amounts of assets and liabilities at the date of the financial statements and the reported amounts of revenues and expenses during the reporting period including estimates and assumptions related to taxation. Actual results could differ from those estimates by a significant amount. In addition, the Fund monitors for material events or transactions that may occur or become known after theperiod-end date and before the date the financial statements are released to print. |
| H. | Indemnifications -Under the Trust’s organizational documents, each Trustee, officer, employee or other agent of the Trust is indemnified against certain liabilities that may arise out of the performance of their duties to the Fund. Additionally, in the normal course of business, the Fund enters into contracts, including the Fund’s servicing agreements, that contain a variety of indemnification clauses. The Fund’s maximum exposure under these arrangements is unknown as this would involve future claims that may be made against the Fund that have not yet occurred. The risk of material loss as a result of such indemnification claims is considered remote. |
| I. | Repurchase Agreements- In a repurchase transaction, a Fund buys a security and simultaneously sells it back to an approved institution for delivery on an agreed-upon future date. The resale price exceeds the purchase price by an amount that reflects an agreed-upon interest rate effective for the period during which the repurchase agreement is in effect. Approved institutions include U.S. commercial banks, U.S. branches of foreign banks or broker-dealers that have been designated as primary dealers in government securities. They must meet credit requirements set by the investment adviser from time to time. Repurchase agreements must be fully collateralized. However, if the seller fails to pay the repurchase price on the delivery date, a Fund may incur costs in disposing of the collateral and may experience losses if there is any delay in its ability to do so. If the default on the part of the seller is due to its bankruptcy, a Fund’s ability to liquidate the collateral may be delayed or limited. |
The following is a summary by counterparty of the market value of Borrowings and Other Financing Transactions and collateral (received) as of period end:
| | | | | | | | | | | | |
| | | Repurchase Agreement | | | | | | | |
| Counterparty | | Proceeds to be Received 1 | | | Collateral Received1 | | | Net Exposure2 | |
| |
Repurchase Agreements | | | | | | | | | | | | |
Credit Agricole Corporate & Investment Bank | | | $10,000,833 | | | | $(10,200,990) | | | | $(200,157) | |
RBC Dominion Securities Inc. | | | 94,016,947 | | | | (95,895,711) | | | | (1,878,764) | |
TD Securities (USA) LLC | | | 75,006,542 | | | | (76,506,673) | | | | (1,500,131) | |
| | | | | | | | |
| | | $179,024,322 | | | | $(182,603,374) | | | | | |
| | | | | | | | |
1. Includes accrued interest.
2. Net exposure represents the net receivable/payable that would be due from/to the counterparty in the event of default.
| J. | Other Risks -Investments in obligations issued by agencies and instrumentalities of the U.S. Government may vary in the level of support they receive from the government. The government may choose not to provide financial support to government sponsored agencies or instrumentalities if it is not legally obligated to do so. In this case, if the issuer defaulted, the Fund may not be able to recover its investment in such issuer from the U.S. Government. |
Note 2 – Advisory Fees and Other Fees Paid to Affiliates
The Trust has entered into a master investment advisory agreement with Invesco Advisers, Inc. (the “Adviser” or “Invesco”). Under the terms of the investment advisory agreement, the Fund accrues daily and pays monthly an advisory fee to the Adviser based on the annual rate of the Fund’s average daily net assets as follows:
| | | | |
Fee Schedule* | | | | |
| |
Up to $500 million | | | 0.450% | |
Next $500 million | | | 0.425 | |
Next $500 million | | | 0.400 | |
Over $1.5 billion | | | 0.375 | |
*The advisory fee paid by the Fund shall be reduced by any amounts paid by the Fund under the administrative services agreement with the Adviser.
For the yearended December 31, 2019, the effective advisory fees incurred by the Fund was 0.42%.
From the beginning of the fiscal period until the date of the Reorganization, the Acquired Fund paid $2,933,619 in advisory fees to OFI Global Asset Management, Inc. based on the annual rates above of the Acquired Fund’s average daily net assets.
Under the terms of a mastersub-advisory agreement between the Adviser and each of Invesco Asset Management Deutschland GmbH, Invesco Asset Management Limited, Invesco Asset Management (Japan) Limited, Invesco Hong Kong Limited, Invesco Senior Secured Management, Inc. and Invesco Canada Ltd. and separatesub-advisory agreements with Invesco Capital Management LLC, and Invesco Asset Management (India) Private Limited
|
| 14 INVESCO OPPENHEIMER V.I. GOVERNMENT MONEY FUND |
(collectively, the “AffiliatedSub-Advisers”) the Adviser, not the Fund, will pay 40% of the fees paid to the Adviser to any such AffiliatedSub-Adviser(s) that provide(s) discretionary investment management services to the Fund based on the percentage of assets allocated to such AffiliatedSub-Adviser(s). Invesco has also entered into aSub-Advisory Agreement with OppenheimerFunds, Inc. to provide discretionary management services to the Funds.
Effective on the Reorganization Date, the Adviser has contractually agreed, through May 31, 2021, to waive advisory fees and/or reimburse expenses of all shares to the extent necessary to limit the total annual fund operating expenses after fee waiver and/or expense reimbursement (excluding certain items discussed below) ofSeries I and Series II shares to 0.50% and 0.75%, respectively, of the Fund’s average daily net assets (the “expense limits”). In determining the Adviser’s obligation to waive advisory fees and/or reimburse expenses, the following expenses are not taken into account, and could cause total annual fund operating expenses after fee waivers and/or expense reimbursement to exceed the numbers reflected above: (1) interest; (2) taxes; (3) dividend expenses on short sales; (4) extraordinary ornon-routine items, including litigation expenses; and (5) expenses that the Fund has incurred but did not actually pay because of an expense offset arrangement. Unless Invesco continues the fee waiver agreement, it will terminate on May 31, 2021. During its term, the fee waiver agreement cannot be terminated or amended to increase the expense limits or reduce the advisory fee waiver without approval of the Board of Trustees.
Further, the Adviser has contractually agreed, through at least June 30, 2021, to waive the advisory fee payable by the Fund in an amount equal to 100% of the net advisory fees the Adviser receives from the affiliated money market funds on investments by the Fund of uninvested cash in such affiliated money market funds.
For the year ended December 31, 2019, the Adviser waived advisory fees of $9,580 and reimbursed Fund expenses of $354,904 of Series I shares.
Prior to the Reorganization, OFI Global Asset Management, Inc. had contractually agreed to waive fees and/or reimburse expenses ofNon-Service shares to 0.50% of the Acquired Fund’s average daily net assets.
The Trust has entered into a master administrative services agreement with Invesco pursuant to which the Fund has agreed to pay Invesco a fee for costs incurred in providing accounting services and fund administrative services to the Fund and to reimburse Invesco for fees paid to insurance companies that have agreed to provide certain administrative services to the Fund. These administrative services provided by the insurance companies may include, among other things: maintenance of master accounts with the Fund; tracking, recording and transmitting net purchase and redemption orders for Fund shares; maintaining and preserving records related to the purchase, redemption and other account activity of variable product owners; distributing copies of Fund documents such as prospectuses, proxy materials and periodic reports, to variable product owners, and responding to inquiries from variable product owners about the Fund. Pursuant to such agreement, for the year ended December 31, 2019, Invesco was paid $63,107 for accounting and fund administrative services and was reimbursed $147,421 for fees paid to insurance companies. Additionally, Invesco has entered into service agreements whereby JP Morgan Chase Bank serves as custodian to the Fund. Prior to the Reorganization, the Acquired Fund paid administrative fees to OFI Global Asset Management, Inc.
The Trust has entered into a transfer agency and service agreement with Invesco Investment Services, Inc. (“IIS”) pursuant to which the Fund has agreed to pay IIS a fee for providing transfer agency and shareholder services to the Fund and reimburse IIS for certain expenses incurred by IIS in the course of providing such service. Prior to the Reorganization, the Acquired Fund paid transfer agent fees to OFI Global Asset Management, Inc. and Shareholder Services, Inc. For the yearended December 31, 2019, expenses incurred under these agreements are shown in the Statement of Operations as Transfer and shareholder servicing agent fees.
The Trust has entered into master distribution agreements with Invesco Distributors, Inc. (“IDI”) to serve as the distributor for the Series II shares of the Fund. The Trust has adopted a plan pursuant to Rule12b-1 under the 1940 Act with respect to the Fund’s Series II shares (the “Plan”). The Fund, pursuant to the Plan, pays IDI at an annual rate of 0.25% of the average daily net assets of Series II shares. The fees are accrued daily and paid monthly. Of the Plan payments, up to 0.25% of the average daily net assets of the class of shares may be paid to insurance companies who furnish continuing personal shareholder services to customers who purchase and own shares of such class. Any amounts not paid as a service fee under the Plan would constitute an asset-based sales charge. Rules of the Financial Industry Regulatory Authority (“FINRA”) impose a cap on the total sales charges, including asset-based sales charges, that may be paid by any class of shares of the Fund plans. Prior to the Reorganization, the Acquired Fund paid distribution fees to OppenheimerFunds Distributor, Inc. For the yearended December 31, 2019, expenses incurred under the plans are shown in the Statement of Operations as Distribution and service plan fees.
Certain officers and trustees of the Trust are officers and directors of the Adviser, IIS and/or IDI.
Note 3 – Additional Valuation Information
GAAP defines fair value as the price that would be received to sell an asset or paid to transfer a liability in an orderly transaction between market participants at the measurement date, under current market conditions. GAAP establishes a hierarchy that prioritizes the inputs to valuation methods, giving the highest priority to readily available unadjusted quoted prices in an active market for identical assets (Level 1) and the lowest priority to significant unobservable inputs (Level 3), generally when market prices are not readily available or are unreliable. Based on the valuation inputs, the securities or other investments are tiered into one of three levels. Changes in valuation methods may result in transfers in or out of an investment’s assigned level:
Level 1 — Prices are determined using quoted prices in an active market for identical assets.
Level 2 — Prices are determined using other significant observable inputs. Observable inputs are inputs that other market participants may use in pricing a security. These may include quoted prices for similar securities, interest rates, prepayment speeds, credit risk, yield curves, loss severities, default rates, discount rates, volatilities and others.
Level 3 — Prices are determined using significant unobservable inputs. In situations where quoted prices or observable inputs are unavailable (for example, when there is little or no market activity for an investment at the end of the period), unobservable inputs may be used. Unobservable inputs
|
| 15 INVESCO OPPENHEIMER V.I. GOVERNMENT MONEY FUND |
NOTES TO FINANCIAL STATEMENTSContinued
reflect the Fund’s own assumptions about the factors market participants would use in determining fair value of the securities or instruments and would be based on the best available information.
As of December 31, 2019, all of the securities in this Fund were valued based on Level 2 inputs (see the Schedule of Investments for security categories). The level assigned to the securities valuations may not be an indication of the risk or liquidity associated with investing in those securities. Because of the inherent uncertainties of valuation, the values reflected in the financial statements may materially differ from the value received upon actual sale of those investments.
Note 4 – Expense Offset Arrangement
The expense offset arrangement is comprised of custodian credits which result from periodic overnight cash balances at the custodian. For theyearended December 31, 2019, the Fund received credits from this arrangement, which resulted in the reduction of the Fund’s total expenses of $2,585.
Note 5 – Trustee and Officer Fees and Benefits
Certain trustees have executed Deferred Compensation Agreement(s) pursuant to which they have the option to elect to defer receipt of all or a portion of the annual compensation they are entitled to receive from the Fund. For purposes of determining the amount owed to the Trustees under the plan(s), deferred amounts are treated as though equal dollar amounts had been invested in shares of the Fund or in other Invesco and/or Invesco Oppenheimer funds selected by the Trustees. The Fund purchases shares of the funds selected for deferral by the Trustees in amounts equal to his or her deemed investment, resulting in a Fund asset equal to the deferred compensation liability. Such assets are included as a component of “Other” within the asset section of the Statement of Assets and Liabilities. Deferral of Trustees’ fees under the plan(s) will not affect the net assets of the Fund and will not materially affect the Fund’s assets, liabilities or net investment income per share. Amounts will be deferred until distributed in accordance with the Deferred Compensation Agreement(s).
Note 6 – Cash Balances
The Fund is permitted to temporarily carry a negative or overdrawn balance in its account with JPMorgan Chase Bank, the custodian bank. Such balances, if any atperiod-end, are shown in the Statement of Assets and Liabilities under the payable caption Amount due custodian. To compensate the custodian bank for such overdrafts, the overdrawn Fund may either (1) leave funds as a compensating balance in the account so the custodian bank can be compensated by earning the additional interest; or (2) compensate by paying the custodian bank at a rate agreed upon by the custodian bank and Invesco, not to exceed the contractually agreed upon rate.
Note 7 – Distributions to Shareholders and Tax Components of Net Assets
Tax Character of Distributions to Shareholders Paid During the Fiscal Years Ended December 31, 2019 and 2018:
| | | | | | | | |
| | | 2019 | | | 2018 | |
Ordinary income | | $ | 21,080,943 | | | $ | 14,654,285 | |
Tax Components of Net Assets atPeriod-End:
| | | | |
| | | 2019 | |
Undistributed ordinary income | | $ | 95,073 | |
Temporary book/tax differences | | | (88,460) | |
Shares of beneficial interest | | | 369,762,749 | |
| | | | |
Total net assets | | $ | 369,769,362 | |
| | | | |
The temporary book/tax differences are a result of timing differences between book and tax recognition of income and/or expenses. The Fund’s temporary book/tax differences are the result of the trustee deferral of compensation and retirement plan benefits.
Capital loss carryforward is calculated and reported as of a specific date. Results of transactions and other activity after that date may affect the amount of capital loss carryforward actually available for the Fund to utilize. Capital losses generated in years beginning after December 22, 2010 can be carried forward for an unlimited period, whereas previous losses expire in eight tax years. Capital losses with an expiration period may not be used to offset capital gains until all net capital losses without an expiration date have been utilized. Capital loss carryforwards with no expiration date will retain their character as either short-term or long-term capital losses instead of as short-term capital losses as under prior law. The ability to utilize capital loss carryforwards in the future may be limited under the Internal Revenue Code and related regulations based on the results of future transactions.
The Fund has no capital loss carryforward as of December 31, 2019.
Note 8 – Reclassification of Permanent Differences
Primarily as a result of differing book/tax treatment of tax exempt income, on December 31, 2019 undistributed net investment income (loss) was
|
| 16 INVESCO OPPENHEIMER V.I. GOVERNMENT MONEY FUND |
increased by $36,587 and shares of beneficial interest was decreased by $36,587. This reclassification had no effect on the net assets of the Fund.
Note 9 – Share Information
Transactions in shares of beneficial interest were as follows:
| | | | | | | | | | | | | | | | |
| | | Year Ended December 31, 20191 | | | Year Ended December 31, 2018 | |
| | | Shares | | | Amount | | | Shares | | | Amount | |
Series I Shares | | | | | | | | | | | | | | | | |
Sold | | | 2,074,144,735 | | | $ | 2,074,144,735 | | | | 3,403,573,875 | | | $ | 3,403,573,875 | |
Dividends and/or distributions reinvested | | | 23,445,418 | | | | 23,445,418 | | | | 12,421,877 | | | | 12,421,877 | |
Redeemed | | | (4,783,567,302 | ) | | | (4,783,567,302 | ) | | | (785,874,330 | ) | | | (785,874,330 | ) |
Net increase (decrease) | | | (2,685,977,149 | ) | | $ | (2,685,977,149 | ) | | | 2,630,121,422 | | | $ | 2,630,121,422 | |
| | | | | | | | | | | | | | | | |
| | | | | | | | | | | | | | | | |
Series II Shares2 | | | | | | | | | | | | | | | | |
Sold | | | 10,000 | | | $ | 10,000 | | | | — | | | $ | — | |
Dividends and/or distributions reinvested | | | — | | | | — | | | | — | | | | — | |
Redeemed | | | — | | | | — | | | | — | | | | — | |
Net increase | | | 10,000 | | | $ | 10,000 | | | | — | | | $ | — | |
| | | | | | | | | | | | | | | | |
1.There are entities that are record owners of more than 5% of the outstanding shares of the Fund and own 89% of the outstanding shares of the Fund. The Fund and the Fund’s principal underwriter or adviser, are parties to participation agreements with these entities whereby these entities sell units of interest in separate accounts funding variable products that are invested in the Fund. The Fund, Invesco and/or Invesco affiliates may make payments to these entities, which are considered to be related to the Fund, for providing services to the Fund, Invesco and/or Invesco affiliates, including, but not limited to services such as securities brokerage, distribution, third party record keeping and account servicing. The Fund has no knowledge as to whether all or any portion of the shares owned of record by these entities are also owned beneficially.
2.Commencement date after the close of business on May 24, 2019.
|
| 17 INVESCO OPPENHEIMER V.I. GOVERNMENT MONEY FUND |
REPORT OF INDEPENDENT REGISTERED PUBLIC ACCOUNTING FIRM
To the Board of Trustees of AIM Variable Insurance Funds (Invesco Variable Insurance Funds) and Shareholders of Invesco Oppenheimer V.I. Government Money Fund
Opinion on the Financial Statements
We have audited the accompanying statement of assets and liabilities, including the schedule of investments, of Invesco Oppenheimer V.I. Government Money Fund (one of the funds constituting AIM Variable Insurance Funds (Invesco Variable Insurance Funds), referred to hereafter as the “Fund”) as of December 31, 2019, the related statements of operations and of changes in net assets for the year ended December 31, 2019, including the related notes, and the financial highlights for each of the periods ended December 31, 2019 (collectively referred to as the “financial statements”). In our opinion, the financial statements present fairly, in all material respects, the financial position of the Fund as of December 31, 2019, the results of its operations and changes in its net assets for the year ended December 31, 2019 and the financial highlights for each of the periods ended December 31, 2019 in conformity with accounting principles generally accepted in the United States of America.
The financial statements of Invesco Oppenheimer V.I. Government Money Fund (formerly known as Oppenheimer Government Money Fund/VA) as of and for the year ended December 31, 2018 and the financial highlights for each of the periods ended on or prior to December 31, 2018 (not presented herein, other than the statement of changes in net assets and the financial highlights) were audited by other auditors whose report dated February 14, 2019 expressed an unqualified opinion on those financial statements and financial highlights.
Basis for Opinion
These financial statements are the responsibility of the Fund’s management. Our responsibility is to express an opinion on the Fund’s financial statements based on our audit. We are a public accounting firm registered with the Public Company Accounting Oversight Board (United States) (PCAOB) and are required to be independent with respect to the Fund in accordance with the U.S. federal securities laws and the applicable rules and regulations of the Securities and Exchange Commission and the PCAOB.
We conducted our audit of these financial statements in accordance with the standards of the PCAOB. Those standards require that we plan and perform the audit to obtain reasonable assurance about whether the financial statements are free of material misstatement, whether due to error or fraud.
Our audit included performing procedures to assess the risks of material misstatement of the financial statements, whether due to error or fraud, and performing procedures that respond to those risks. Such procedures included examining, on a test basis, evidence regarding the amounts and disclosures in the financial statements. Our audit also included evaluating the accounting principles used and significant estimates made by management, as well as evaluating the overall presentation of the financial statements. Our procedures included confirmation of securities owned as of December 31, 2019 by correspondence with the custodian and brokers; when replies were not received from brokers, we performed other auditing procedures. We believe that our audit provides a reasonable basis for our opinion.
/s/PricewaterhouseCoopers LLP
Houston, Texas
February 18, 2020
We have served as the auditor of one or more of the investment companies in the Invesco group of investment companies since at least 1995. We have not been able to determine the specific year we began serving as auditor.
|
| 18 INVESCO OPPENHEIMER V.I. GOVERNMENT MONEY FUND |
TAX INFORMATION
Form1099-DIV, Form1042-S and other year–end tax information provide shareholders with actual calendar year amounts that should be included in their tax returns. Shareholders should consult their tax advisers.
The following distribution information is being provided as required by the Internal Revenue Code or to meet a specific state’s requirement.
The Fund designates the following amounts or, if subsequently determined to be different, the maximum amount allowable for its fiscal year ended December 31, 2019:
| | | | |
Federal and State Income Tax | | | | |
U.S. Treasury Obligations* | | | 15.41% | |
* The above percentage is based on ordinary income dividends paid to shareholders during the Fund’s fiscal year.
|
| 19 INVESCO OPPENHEIMER V.I. GOVERNMENT MONEY FUND |
PORTFOLIO PROXY VOTING POLICIES AND GUIDELINES; UPDATES TO STATEMENT OF INVESTMENTS
Go paperless with eDelivery
Visit invesco.com/edelivery to enjoy the convenience and security of anytime electronic access to your investment documents.
With eDelivery, you can elect to have any or all of the following materials delivered straight to your inbox to download, save and print from your own computer:
● Fund reports and prospectuses
● Quarterly statements
● Daily confirmations
● Tax forms
Invesco mailing information
Send general correspondence to Invesco Investment Services, Inc., P.O. Box 219078, Kansas City, MO 64121-9078.
Important notice regarding delivery of security holder documents
To reduce Fund expenses, only one copy of most shareholder documents may be mailed to shareholders with multiple accounts at the same address (Householding). Mailing of your shareholder documents may be householded indefinitely unless you instruct us otherwise. If you do not want the mailing of these documents to be combined with those for other members of your household, please contact Invesco Investment Services, Inc. at 800 959 4246 or contact your financial institution. We will begin sending you individual copies for each account within 30 days after receiving your request.
Fund holdings and proxy voting information
The Fund provides a complete list of its holdings four times in each fiscal year, at the quarter ends. For the second and fourth quarters, the lists appear in the Fund’s semiannual and annual reports to shareholders. For the first and third quarters, the Fund files the lists with the Securities and Exchange Commission (SEC) as an exhibit to its reports on FormN-PORT. The most recent list of portfolio holdings is available at invesco.com/completeqtrholdings. Shareholders can also look up the Fund’s FormsN-PORT on the SEC website at sec.gov.
A description of the policies and procedures that the Fund uses to determine how to vote proxies relating to portfolio securities is available without charge, upon request, from our Client Services department at 800 959 4246 or at invesco.com/proxyguidelines. The information is also available on the SEC website, sec.gov.
Information regarding how the Fund voted proxies related to its portfolio securities during the most recent12-month period ended June 30 is available at invesco. com/proxysearch. The information is also available on the SEC website, sec.gov.
Invesco Advisers, Inc. is an investment adviser; it provides investment advisory services to individual and institutional clients and does not sell securities. Invesco Distributors, Inc. is the US distributor for Invesco Ltd.’s retail mutual funds, exchange-traded funds and institutional money market funds. Both are wholly owned, indirect subsidiaries of Invesco Ltd.
|
| 20 INVESCO OPPENHEIMER V.I. GOVERNMENT MONEY FUND |
TRUSTEES AND OFFICERS
The address of each trustee and officer is AIM Variable Insurance Funds (Invesco Variable Insurance Funds) (the “Trust”), 11 Greenway Plaza, Suite 1000, Houston, Texas 77046-1173. The trustees serve for the life of the Trust, subject to their earlier death, incapacitation, resignation, retirement or removal as more specifically provided in the Trust’s organizational documents. Each officer serves for a one year term or until their successors are elected and qualified. Column two below includes length of time served with predecessor entities, if any.
| | | | | | | | |
| | | | | |
Name, Year of Birth and Position(s) Held with the Trust | | Trustee and/or Officer Since | | Principal Occupation(s) During Past 5 Years | | Number of Funds in Fund Complex
Overseen by Trustee | | Other Directorship(s) Held by Trustee During Past
5 Years |
INTERESTED PERSON | | | | | | | | |
| | | | | |
Martin L. Flanagan 1– 1960 Trustee and Vice Chair | | 2007 | | Executive Director, Chief Executive Officer and President, Invesco Ltd. (ultimate parent of Invesco and a global investment management firm); Trustee and Vice Chair, The Invesco Funds; Vice Chair, Investment Company Institute; and Member of Executive Board, SMU Cox School of Business Formerly: Advisor to the Board, Invesco Advisers, Inc. (formerly known as Invesco Institutional (N.A.), Inc.); Chairman and Chief Executive Officer, Invesco Advisers, Inc. (registered investment adviser); Director, Chairman, Chief Executive Officer and President, Invesco Holding Company (US), Inc. (formerly IVZ Inc.) (holding company), Invesco Group Services, Inc. (service provider) and Invesco North American Holdings, Inc. (holding company); Director, Chief Executive Officer and President, Invesco Holding Company Limited (parent of Invesco and a global investment management firm); Director, Invesco Ltd.; Chairman, Investment Company Institute and President,Co-Chief Executive Officer,Co-President, Chief Operating Officer and Chief Financial Officer, Franklin Resources, Inc. (global investment management organization) | | 229 | | None |
| |
| 1Mr. Flanagan is considered an interested person (within the meaning of Section 2(a)(19) of the 1940 Act) of the Trust because he is an officer of the Adviser to the Trust, and an officer and a director of Invesco Ltd., ultimate parent of the Adviser. |
21 INVESCO OPPENHEIMER V.I. GOVERNMENT MONEY FUND
TRUSTEES AND OFFICERS Continued
| | | | | | | | |
| | | | | |
Name, Year of Birth and Position(s) Held with the Trust | | Trustee and/or Officer Since | | Principal Occupation(s) During Past 5 Years | | Number of Funds in Fund Complex
Overseen by Trustee | | Other Directorship(s) Held by Trustee During Past
5 Years |
INDEPENDENT TRUSTEES | | | | | | | | |
| | | | | |
Bruce L. Crockett – 1944 Trustee and Chair | | 2003 | | Chairman, Crockett Technologies Associates (technology consulting company) Formerly: Director, Captaris (unified messaging provider); Director, President and Chief Executive Officer, COMSAT Corporation; Chairman, Board of Governors of INTELSAT (international communications company); ACE Limited (insurance company); Independent Directors Council and Investment Company Institute: Member of the Audit Committee, Investment Company Institute; Member of the Executive Committee and Chair of the Governance Committee, Independent Directors Council | | 229 | | Director and Chairman of the Audit Committee, ALPS (Attorneys Liability Protection Society) (insurance company); Director and Member of the Audit Committee and Compensation Committee, Ferroglobe PLC (metallurgical company) |
| | | | | |
David C. Arch – 1945 Trustee | | 2010 | | Chairman of Blistex Inc. (consumer health care products manufacturer); Member, World Presidents’ Organization | | 229 | | Board member of the Illinois Manufacturers’ Association |
| | | | | |
Beth Ann Brown – 1968 Trustee | | 2019 | | Independent Consultant Formerly: Head of Intermediary Distribution, Managing Director, Strategic Relations, Managing Director, Head of National Accounts, Senior Vice President, National Account Manager and Senior Vice President, Key Account Manager, Columbia Management Investment Advisers LLC; Vice President, Key Account Manager, Liberty Funds Distributor, Inc.; and Trustee of certain Oppenheimer Funds | | 229 | | Director, Board of Directors of Caron Engineering Inc.; Advisor, Board of Advisors of Caron Engineering Inc.; President and Director, of Acton Shapleigh Youth Conservation Corps (non-profit); and Vice President and Director of Grahamtastic Connection (non-profit) |
| | | | | |
Jack M. Fields – 1952 Trustee | | 2003 | | Chief Executive Officer, Twenty First Century Group, Inc. (government affairs company); and Chairman, Discovery Learning Alliance(non-profit) Formerly: Owner and Chief Executive Officer, Dos Angeles Ranch L.P. (cattle, hunting, corporate entertainment); Director, Insperity, Inc. (formerly known as Administaff) (human resources provider); Chief Executive Officer, Texana Timber LP (sustainable forestry company); Director of Cross Timbers Quail Research Ranch(non-profit); and member of the U.S. House of Representatives | | 229 | | None |
| | | | | |
Cynthia Hostetler – 1962 Trustee | | 2017 | | Non-Executive Director and Trustee of a number of public and private business corporations Formerly: Director, Aberdeen Investment Funds (4 portfolios); Head of Investment Funds and Private Equity, Overseas Private Investment Corporation; President, First Manhattan Bancorporation, Inc.; Attorney, Simpson Thacher & Bartlett LLP | | 229 | | Vulcan Materials Company (construction materials company); Trilinc Global Impact Fund; Genesee & Wyoming, Inc. (railroads); Artio Global Investment LLC (mutual fund complex); Edgen Group, Inc. (specialized energy and infrastructure products distributor); Investment Company Institute (professional organization); Independent Directors Council (professional organization) |
| | | | | |
Eli Jones – 1961 Trustee | | 2016 | | Professor and Dean, Mays Business School - Texas A&M University Formerly: Professor and Dean, Walton College of Business, University of Arkansas and E.J. Ourso College of Business, Louisiana State University; Director, Arvest Bank | | 229 | | Insperity, Inc. (formerly known as Administaff) (human resources provider) |
| | | | | |
Elizabeth Krentzman – 1959 Trustee | | 2019 | | Formerly: Principal and Chief Regulatory Advisor for Asset Management Services and U.S. Mutual Fund Leader of Deloitte & Touche LLP; General Counsel of the Investment Company Institute (trade association); National Director of the Investment Management Regulatory Consulting Practice, Principal, Director and Senior Manager of Deloitte & Touche LLP; Assistant Director of the Division of Investment Management – Office of Disclosure and Investment Adviser Regulation of the U.S. Securities and Exchange Commission and various positions with the Division of Investment Management – Office of Regulatory Policy of the U.S. Securities and Exchange Commission; Associate at Ropes & Gray LLP.; Advisory Board Member of the Securities and Exchange Commission Historical Society; and Trustee of certain Oppenheimer Funds | | 229 | | Trustee of the University of Florida National Board Foundation and Audit Committee Member; Member of the Cartica Funds Board of Directors (private investment funds); Member of the University of Florida Law Center Association, Inc. Board of Trustees and Audit Committee Member |
| | | | | |
Anthony J. LaCava, Jr. – 1956 Trustee | | 2019 | | Formerly: Director and Member of the Audit Committee, Blue Hills Bank (publicly traded financial institution) and Managing Partner, KPMG LLP | | 229* | | Blue Hills Bank; Chairman of Bentley University; Member, Business School Advisory Council; and Nominating Committee, KPMG LLP |
22 INVESCO OPPENHEIMER V.I. GOVERNMENT MONEY FUND
| | | | | | | | |
| | | | | |
Name, Year of Birth and Position(s) Held with the Trust | | Trustee and/or Officer Since | | Principal Occupation(s) During Past 5 Years | | Number of Funds in Fund Complex
Overseen by Trustee | | Other Directorship(s) Held by Trustee During Past
5 Years |
INDEPENDENT TRUSTEES (CONTINUED) | | | | | | | | |
| | | | | |
Prema Mathai-Davis – 1950 Trustee | | 2003 | | Retired Co-Owner & Partner of Quantalytics Research, LLC, (a FinTech Investment Research Platform for the Self-Directed Investor) | | 229 | | None |
| | | | | |
Joel W. Motley – 1952 Trustee | | 2019 | | Director of Office of Finance, Federal Home Loan Bank; Member of the Vestry of Trinity Wall Street; Managing Director of Carmona Motley Hoffman, Inc. (privately held financial advisor); Member of the Finance and Budget Committee of the Council on Foreign Relations, Member of the Investment Committee and Board of Human Rights Watch and Member of the Investment Committee and Board of Historic Hudson Valley(non-profit cultural organization). Formerly: Managing Director of Public Capital Advisors, LLC (privately held financial advisor); Managing Director of Carmona Motley Hoffman, Inc. (privately held financial advisor); Trustee of certain Oppenheimer Funds; and Director of Columbia Equity Financial Corp. (privately held financial advisor) | | 229 | | Director of Greenwall Foundation (bioethics research foundation); Member of Board and Investment Committee of The Greenwall Foundation; Director of Southern Africa Legal Services Foundation; Board Member and Investment Committee Member of Pulitzer Center for Crisis Reporting(non-profit journalism) |
| | | | | |
Teresa M. Ressel – 1962 Trustee | | 2017 | | Non-executive director and trustee of a number of public and private business corporations Formerly: Chief Financial Officer, Olayan America, The Olayan Group (international investor/commercial/industrial); Chief Executive Officer, UBS Securities LLC; Group Chief Operating Officer, Americas, UBS AG; Assistant Secretary for Management & Budget and CFO, US Department of the Treasury | | 229 | | Atlantic Power Corporation (power generation company); ON Semiconductor Corp. (semiconductor supplier) |
| | | | | |
Ann Barnett Stern – 1957 Trustee | | 2017 | | President and Chief Executive Officer, Houston Endowment Inc. (private philanthropic institution) Formerly: Executive Vice President and General Counsel, Texas Children’s Hospital; Attorney, Beck, Redden and Secrest, LLP; Business Law Instructor, University of St. Thomas; Attorney, Andrews & Kurth LLP | | 229 | | Federal Reserve Bank of Dallas |
| | | | | |
Robert C. Troccoli – 1949 Trustee | | 2016 | | Retired Formerly: Adjunct Professor, University of Denver – Daniels College of Business, Senior Partner, KPMG LLP | | 229 | | None |
| | | | | |
Daniel S. Vandivort – 1954 Trustee | | 2019 | | Treasurer, Chairman of the Audit and Finance Committee, and Trustee, Board of Trustees, Huntington Disease Foundation of America; and President, Flyway Advisory Services LLC (consulting and property management). Formerly: Trustee and Governance Chair, of certain Oppenheimer Funds | | 229 | | Chairman and Lead Independent Director, Chairman of the Audit Committee, and Director, Board of Directors, Value Line Funds |
| | | | | |
James D. Vaughn – 1945 Trustee | | 2019 | | Retired Formerly: Managing Partner, Deloitte & Touche LLP; Trustee and Chairman of the Audit Committee, Schroder Funds; Board Member, Mile High United Way, Boys and Girls Clubs, Boy Scouts, Colorado Business Committee for the Arts, Economic Club of Colorado and Metro Denver Network (economic development corporation); and Trustee of certain Oppenheimer Funds | | 229 | | Board member and Chairman of Audit Committee of AMG National Trust Bank; Trustee and Investment Committee member, University of South Dakota Foundation; Board member, Audit Committee Member and past Board Chair, Junior Achievement(non-profit) |
| | | | | |
Christopher L. Wilson – 1957 Trustee, Vice Chair and Chair Designate | | 2017 | | Retired Formerly: Director, TD Asset Management USA Inc. (mutual fund complex) (22 portfolios); Managing Partner, CT2, LLC (investing and consulting firm); President/Chief Executive Officer, Columbia Funds, Bank of America Corporation; President/Chief Executive Officer, CDC IXIS Asset Management Services, Inc.; Principal & Director of Operations, Scudder Funds, Scudder, Stevens & Clark, Inc.; Assistant Vice President, Fidelity Investments | | 229 | | ISO New England, Inc.(non-profit organization managing regional electricity market) |
23 INVESCO OPPENHEIMER V.I. GOVERNMENT MONEY FUND
TRUSTEES AND OFFICERS Continued
| | | | | | | | |
| | | | | |
Name, Year of Birth and Position(s) Held with the Trust | | Trustee and/or Officer Since | | Principal Occupation(s) During Past 5 Years | | Number of Funds in Fund Complex
Overseen by Trustee | | Other Directorship(s) Held by Trustee During Past
5 Years |
OTHER OFFICERS | | | | | | | | |
| | | | | |
Sheri Morris – 1964 President, Principal Executive Officer and Treasurer | | 2003 | | Head of Global Fund Services, Invesco Ltd.; President, Principal Executive Officer and Treasurer, The Invesco Funds; Vice President, Invesco Advisers, Inc. (formerly known as Invesco Institutional (N.A.), Inc.) (registered investment adviser); and Vice President, Invesco Exchange-Traded Fund Trust, Invesco Exchange-Traded Fund Trust II, Invesco India Exchange-Traded Fund Trust, Invesco Actively Managed Exchange-Traded Fund Trust, Invesco Actively Managed Exchange-Traded Commodity Fund Trust and Invesco Exchange-Traded Self-Indexed Fund Trust, and Vice President, OppenheimerFunds, Inc. Formerly: Vice President and Principal Financial Officer, The Invesco Funds; Vice President, Invesco AIM Advisers, Inc., Invesco AIM Capital Management, Inc. and Invesco AIM Private Asset Management, Inc.; Assistant Vice President and Assistant Treasurer, The Invesco Funds and Assistant Vice President, Invesco Advisers, Inc., Invesco AIM Capital Management, Inc. and Invesco AIM Private Asset Management, Inc.; and Treasurer, Invesco Exchange-Traded Fund Trust, Invesco Exchange-Traded Fund Trust II, Invesco India Exchange-Traded Fund Trust and Invesco Actively Managed Exchange-Traded Fund Trust | | N/A | | N/A |
| | | | | |
Russell C. Burk – 1958 Senior Vice President and Senior Officer | | 2005 | | Senior Vice President and Senior Officer, The Invesco Funds | | N/A | | N/A |
| | | | | |
Jeffrey H. Kupor – 1968 Senior Vice President, Chief Legal Officer and Secretary | | 2018 | | Head of Legal of the Americas, Invesco Ltd.; Senior Vice President and Secretary, Invesco Advisers, Inc. (formerly known as Invesco Institutional (N.A.), Inc.) (registered investment adviser); Senior Vice President and Secretary, Invesco Distributors, Inc. (formerly known as Invesco AIM Distributors, Inc.); Vice President and Secretary, Invesco Investment Services, Inc. (formerly known as Invesco AIM Investment Services, Inc.) Senior Vice President, Chief Legal Officer and Secretary, The Invesco Funds; Secretary and General Counsel, Invesco Investment Advisers LLC (formerly known as Van Kampen Asset Management); Secretary and General Counsel, Invesco Capital Markets, Inc. (formerly known as Van Kampen Funds Inc.) and Chief Legal Officer, Invesco Exchange-Traded Fund Trust, Invesco Exchange-Traded Fund Trust II, Invesco India Exchange-Traded Fund Trust, Invesco Actively Managed Exchange-Traded Fund Trust, Invesco Actively Managed Exchange-Traded Commodity Fund Trust and Invesco Exchange-Traded Self-Indexed Fund Trust; Secretary, Invesco Indexing LLC; Secretary, W.L. Ross & Co., LLC Formerly: Secretary and Vice President, Jemstep, Inc.; Head of Legal, Worldwide Institutional, Invesco Ltd.; Secretary and General Counsel, INVESCO Private Capital Investments, Inc.; Senior Vice President, Secretary and General Counsel, Invesco Management Group, Inc. (formerly known as Invesco AIM Management Group, Inc.); Assistant Secretary, INVESCO Asset Management (Bermuda) Ltd.; Secretary and General Counsel, Invesco Private Capital, Inc.; Assistant Secretary and General Counsel, INVESCO Realty, Inc.; Secretary and General Counsel, Invesco Senior Secured Management, Inc.; and Secretary, Sovereign G./P. Holdings Inc. | | N/A | | N/A |
| | | | | |
Andrew R. Schlossberg – 1974 Senior Vice President | | 2019 | | Head of the Americas and Senior Managing Director, Invesco Ltd.; Director and Senior Vice President, Invesco Advisers, Inc. (formerly known as Invesco Institutional (N.A.), Inc.) (registered investment adviser); Director and Chairman, Invesco Investment Services, Inc. (formerly known as Invesco AIM Investment Services, Inc.) (registered transfer agent); Senior Vice President, The Invesco Funds; Director, Invesco Investment Advisers LLC (formerly known as Van Kampen Asset Management); Director, President and Chairman, Invesco Insurance Agency, Inc. Formerly: Director, Invesco UK Limited; Director and Chief Executive, Invesco Asset Management Limited and Invesco Fund Managers Limited; Assistant Vice President, The Invesco Funds; Senior Vice President, Invesco Advisers, Inc. (formerly known as Invesco Institutional (N.A.), Inc.) (registered investment adviser); Director and Chief Executive, Invesco Administration Services Limited and Invesco Global Investment Funds Limited; Director, Invesco Distributors, Inc.; Head of EMEA, Invesco Ltd.; President, Invesco Actively Managed Exchange-Traded Commodity Fund Trust, Invesco Actively Managed Exchange-Traded Fund Trust, Invesco Exchange-Traded Fund Trust, Invesco Exchange-Traded Fund Trust II and Invesco India Exchange-Traded Fund Trust; Managing Director and Principal Executive Officer, Invesco Capital Management LLC | | N/A | | N/A |
24 INVESCO OPPENHEIMER V.I. GOVERNMENT MONEY FUND
| | | | | | | | |
| | | | | |
Name, Year of Birth and Position(s) Held with the Trust | | Trustee and/or Officer Since | | Principal Occupation(s) During Past 5 Years | | Number of Funds in Fund Complex
Overseen by Trustee | | Other Directorship(s) Held by Trustee During Past
5 Years |
OTHER OFFICERS (CONTINUED) | | | | | | | | |
| | | | | |
John M. Zerr – 1962 Senior Vice President | | 2006 | | Chief Operating Officer of the Americas; Senior Vice President, Invesco Advisers, Inc. (formerly known as Invesco Institutional (N.A.), Inc.) (registered investment adviser); Senior Vice President, Invesco Distributors, Inc. (formerly known as Invesco AIM Distributors, Inc.); Director and Vice President, Invesco Investment Services, Inc. (formerly known as Invesco AIM Investment Services, Inc.) Senior Vice President, The Invesco Funds; Managing Director, Invesco Capital Management LLC; Director, Invesco Investment Advisers LLC (formerly known as Van Kampen Asset Management); Senior Vice President, Invesco Capital Markets, Inc. (formerly known as Van Kampen Funds Inc.); Manager, Invesco Indexing LLC; Manager, Invesco Specialized Products, LLC; Director and Senior Vice President, Invesco Insurance Agency, Inc.; Member, Invesco Canada Funds Advisory Board; Director, President and Chief Executive Officer, Invesco Corporate Class Inc. (corporate mutual fund company); and Director, Chairman, President and Chief Executive Officer, Invesco Canada Ltd. (formerly known as Invesco Trimark Ltd./Invesco Trimark Ltèe) (registered investment adviser and registered transfer agent) Formerly: Director and Senior Vice President, Invesco Management Group, Inc. (formerly known as Invesco AIM Management Group, Inc.); Secretary and General Counsel, Invesco Management Group, Inc. (formerly known as Invesco AIM Management Group, Inc.); Secretary, Invesco Investment Services, Inc. (formerly known as Invesco AIM Investment Services, Inc.); Chief Legal Officer and Secretary, The Invesco Funds; Secretary and General Counsel, Invesco Investment Advisers LLC (formerly known as Van Kampen Asset Management); Secretary and General Counsel, Invesco Capital Markets, Inc. (formerly known as Van Kampen Funds Inc.); Chief Legal Officer, Invesco Exchange-Traded Fund Trust, Invesco Exchange-Traded Fund Trust II, Invesco India Exchange-Traded Fund Trust, Invesco Actively Managed Exchange-Traded Fund Trust, Invesco Actively Managed Exchange-Traded Commodity Fund Trust and Invesco Exchange-Traded Self-Indexed Fund Trust; Secretary, Invesco Indexing LLC; Director, Secretary, General Counsel and Senior Vice President, Van Kampen Exchange Corp.; Director, Vice President and Secretary, IVZ Distributors, Inc. (formerly known as INVESCO Distributors, Inc.); Director and Vice President, INVESCO Funds Group, Inc.; Director and Vice President, Van Kampen Advisors Inc.; Director, Vice President, Secretary and General Counsel, Van Kampen Investor Services Inc.; Director and Secretary, Invesco Distributors, Inc. (formerly known as Invesco AIM Distributors, Inc.); Director, Senior Vice President, General Counsel and Secretary, Invesco AIM Advisers, Inc. and Van Kampen Investments Inc.; Director, Vice President and Secretary, Fund Management Company; Director, Senior Vice President, Secretary, General Counsel and Vice President, Invesco AIM Capital Management, Inc.; Chief Operating Officer and General Counsel, Liberty Ridge Capital, Inc. (an investment adviser) | | N/A | | N/A |
| | | | | |
Gregory G. McGreevey – 1962 Senior Vice President | | 2012 | | Senior Managing Director, Invesco Ltd.; Director, Chairman, President, and Chief Executive Officer, Invesco Advisers, Inc. (formerly known as Invesco Institutional (N.A.), Inc.) (registered investment adviser); Director, Invesco Mortgage Capital, Inc. and Invesco Senior Secured Management, Inc.; and Senior Vice President, The Invesco Funds; and President, SNW Asset Management Corporation Formerly: Senior Vice President, Invesco Management Group, Inc. and Invesco Advisers, Inc.; Assistant Vice President, The Invesco Funds | | N/A | | N/A |
| | | | | |
Kelli Gallegos – 1970 Vice President, Principal Financial Officer and Assistant Treasurer | | 2008 | | Principal Financial and Accounting Officer – Investments Pool, Invesco Specialized Products, LLC; Vice President, Principal Financial Officer and Assistant Treasurer, The Invesco Funds; Principal Financial and Accounting Officer – Pooled Investments, Invesco Capital Management LLC; Vice President and Treasurer, Invesco Exchange-Traded Fund Trust, Invesco Exchange-Traded Fund Trust II, Invesco India Exchange-Traded Fund Trust, Invesco Actively Managed Exchange-Traded Fund Trust, Invesco Actively Managed Exchange-Traded Commodity Fund Trust and Invesco Exchange-Traded Self-Indexed Fund Trust Formerly: Assistant Treasurer, Invesco Specialized Products, LLC; Assistant Treasurer, Invesco Exchange-Traded Fund Trust, Invesco Exchange-Traded Fund Trust II, Invesco India Exchange-Traded Fund Trust, Invesco Actively Managed Exchange-Traded Fund Trust, Invesco Actively Managed Exchange-Traded Commodity Fund Trust and Invesco Exchange-Traded Self-Indexed Fund Trust; Assistant Treasurer, Invesco Capital Management LLC; Assistant Vice President, The Invesco Funds | | N/A | | N/A |
25 INVESCO OPPENHEIMER V.I. GOVERNMENT MONEY FUND
TRUSTEES AND OFFICERS Continued
| | | | | | | | |
| | | | | |
Name, Year of Birth and Position(s) Held with the Trust | | Trustee and/or Officer Since | | Principal Occupation(s) During Past 5 Years | | Number of Funds in Fund Complex
Overseen by Trustee | | Other Directorship(s) Held by Trustee During Past
5 Years |
OTHER OFFICERS (CONTINUED) | | | | | | | | |
| | | | | |
Crissie M. Wisdom – 1969 Anti-Money Laundering Compliance Officer | | 2013 | | Anti-Money Laundering Compliance Officer, Invesco Advisers, Inc. (formerly known as Invesco Institutional (N.A.), Inc.) (registered investment adviser), Invesco Capital Markets, Inc. (formerly known as Van Kampen Funds Inc.), Invesco Distributors, Inc., Invesco Investment Services, Inc., The Invesco Funds, and Invesco Exchange-Traded Fund Trust, Invesco Exchange-Traded Fund Trust II, Invesco India Exchange-Traded Fund Trust, Invesco Actively Managed Exchange-Traded Fund Trust, Invesco Actively Managed Exchange-Traded Commodity Fund Trust and Invesco Exchange-Traded Self-Indexed Fund Trust; Anti-Money Laundering Compliance Officer and Bank Secrecy Act Officer, INVESCO National Trust Company and Invesco Trust Company; and Fraud Prevention Manager and Controls and Risk Analysis Manager for Invesco Investment Services, Inc. Formerly: Anti-Money Laundering Compliance Officer, Van Kampen Exchange Corp. and Invesco Management Group, Inc. | | N/A | | N/A |
| | | | | |
Robert R. Leveille – 1969 Chief Compliance Officer | | 2016 | | Chief Compliance Officer, Invesco Advisers, Inc. (registered investment adviser); and Chief Compliance Officer, The Invesco Funds Formerly: Chief Compliance Officer, Putnam Investments and the Putnam Funds | | N/A | | N/A |
The Statement of Additional Information of the Trust includes additional information about the Fund’s Trustees and is available upon request, without charge, by calling 1.800.959.4246. Please refer to the Fund’s Statement of Additional Information for information on the Fund’ssub-advisers.
| | | | | | |
| Office of the Fund | | Investment Adviser | | Distributor | | Auditors |
11 Greenway Plaza, Suite 1000 Houston, TX 77046-1173 | | Invesco Advisers, Inc. 1555 Peachtree Street, N.E. Atlanta, GA 30309 | | Invesco Distributors, Inc. 11 Greenway Plaza, Suite 1000 Houston, TX 77046-1173 | | PricewaterhouseCoopers LLP 1000 Louisiana Street, Suite 5800 Houston, TX 77002-5021 |
| | | |
| Counsel to the Fund | | Counsel to the | | Transfer Agent | | Custodian |
Stradley Ronon Stevens & Young, LLP 2005 Market Street, Suite 2600 Philadelphia, PA 19103-7018 | | Independent Trustees Goodwin Procter LLP 901 New York Avenue, N.W. Washington, D.C. 20001 | | Invesco Investment Services, Inc. 11 Greenway Plaza, Suite 1000 Houston, TX 77046-1173 | | JPMorgan Chase Bank 4 Chase Metro Tech Center Brooklyn, NY 11245 |
26 INVESCO OPPENHEIMER V.I. GOVERNMENT MONEY FUND
THIS PAGE INTENTIONALLY LEFT BLANK.

| | | | |

| | Annual Report | | 12/31/2019 |
| | |
| | | | |
| | | | |
| | | | |
| | | | |
| | | | |
| | |
| | Invesco Oppenheimer V.I. International Growth Fund* Beginning on January 1, 2021, as permitted by regulations adopted by the Securities and Exchange Commission, the insurance company that offers your variable annuity or variable life insurance contract may no longer send you paper copies of the Fund’s shareholder reports by mail, unless you specifically request paper copies of the reports from the insurance company or your financial intermediary. Instead of delivering paper copies of the report, the insurance company may choose to make the reports available on a website, and will notify you by mail each time a report is posted and provide you with a website link to access the report. Instructions for requesting paper copies will be provided by your insurance company. If the insurance company offers electronic delivery, you may elect to receive shareholder reports and other communications about the Fund electronically by following the instructions provided by the insurance company or by contacting your financial intermediary. If you already elected to receive shareholder reports electronically, you will not be affected by this change and you need not take any action. You may elect to receive all future reports in paper free of charge from the insurance company. You can inform the insurance company or your financial intermediary that you wish to continue receiving paper copies of your shareholder reports by following the instructions provided by the insurance company or by contacting your financial intermediary. Your election to receive reports in paper will apply to all portfolio companies available under your contract with the insurance company. The Fund provides a complete list of its holdings four times in each fiscal year, at the quarter ends. For the second and fourth quarters, the lists appear in the Fund’s semi annual and annual reports to shareholders. For the first and third quarters, the Fund files the lists with the Securities and Exchange Commission (SEC) as an exhibit to its reports on Form N-PORT. The Fund’s Form N-PORT filings are available on the SEC website, sec.gov. The Fund’s most recent portfolio holdings, as filed on Form N-PORT, have also been made available to insurance companies issuing variable annuity contracts and variable life insurance policies (“variable products”) that invest in the Fund. A description of the policies and procedures that the Fund uses to determine how to vote proxies relating to portfolio securities is available without charge, upon request, from our Client Services department at 800 959 4246 or at invesco.com/proxyguidelines. The information is also available on the SEC website, sec.gov. Information regarding how the Fund voted proxies related to its portfolio securities during the most recent 12-month period ended June 30 is available at invesco.com/proxysearch. The information is also available on the SEC website, sec.gov. Invesco Advisers, Inc. is an investment adviser; it provides investment advisory services to individual and institutional clients and does not sell securities. Invesco Distributors, Inc. is the US distributor for Invesco Ltd.’s retail mutual funds, exchange- traded funds and institutional money market funds. Both are wholly owned, indirect subsidiaries of Invesco Ltd. This report must be accompanied or preceded by a currently effective Fund prospectus and variable product prospectus, which contain more complete information, including sales charges and expenses. Investors should read each carefully before investing. *Prior to the close of business on May 24, 2019, the Fund’s name was Oppenheimer International Growth Fund/VA. See Important Update on the following page for more information. |
Important Update
On October 18, 2018, Massachusetts Mutual Life Insurance Company, an indirect corporate parent of OppenheimerFunds, Inc. and its subsidiaries OFI Global Asset Management, Inc., OFI SteelPath, Inc. and OFI Advisors, LLC, announced that it had entered into an agreement whereby Invesco Ltd., a global investment management company would acquire OppenheimerFunds and its subsidiaries (together, “OppenheimerFunds”). After the close of business on May 24, 2019 Invesco Ltd. completed the acquisition of OppenheimerFunds. This Fund was included in that acquisition and as of that date, became part of the Invesco family of funds. Please visit invesco.com for more information or call Invesco’s Client Services team at 800-959-4246.
PORTFOLIO MANAGERS: George R. Evans, CFA, and Robert B. Dunphy, CFA
AVERAGE ANNUAL TOTAL RETURNS FOR THE PERIODS ENDED 12/31/19
| | | | | | | | | | | | | | | | |
| | | Inception
Date | | | 1-Year | | | 5-Year | | | 10-Year | |
Series I Shares* | | | 5/13/92 | | | | 28.60% | | | | 5.79% | | | | 7.26% | |
Series II Shares* | | | 3/19/01 | | | | 27.95 | | | | 5.48 | | | | 6.98 | |
MSCI AC World ex-U.S. Index | | | | | | | 21.51 | | | | 5.51 | | | | 4.97 | |
Performance quoted is past performance and cannot guarantee future results; current performance may be lower or higher.Visit invesco.com for the most recent month-end performance. Performance figures reflect reinvested distributions and changes in net asset value (NAV).Investment return and principal value will vary so that you may have a gain or a loss when you sell shares. Fund returns include changes in share price, reinvested distributions. Performance figures given represent the Fund and are not intended to reflect actual variable product values. They do not reflect sales charges, expenses and fees assessed in connection with a variable product. Sales charges, expenses and fees, which are determined by the variable product issuers, will vary and will lower the total return. Returns for periods of less than one year are cumulative and not annualized. As the result of a reorganization after the close of business on May 24, 2019, theNon-Service and Service share classes of the predecessor fund were reorganized into Series I and Series II Shares, respectively, of the Fund. Returns shown for Series I and Series II shares are blended returns of the predecessor fund and the Fund. Share class returns will differ from those of the Oppenheimer predecessor fund because of different expenses. See Fund prospectuses and summary prospectuses for more information on share classes, sales charges and new fee agreements, if any. Fund literature is available at invesco.com.
TOP HOLDINGS AND ALLOCATIONS
TOP TEN COMMON STOCK HOLDINGS
| | |
| SAP SE | | 2.9% |
| Hitachi Ltd. | | 2.9 |
| ASML Holding NV | | 2.8 |
| Hermes International | | 2.7 |
| STMicroelectronics NV | | 2.5 |
| Grifols SA | | 2.5 |
| Hoya Corp. | | 2.5 |
| Keyence Corp. | | 2.2 |
| Novo Nordisk AS, Cl. B | | 2.2 |
| Roche Holding AG | | 2.0 |
Holdings and allocations are subject to change and are not buy/sell recommendations. Percentages are as of December 31, 2019, and are based on net assets.
REGIONAL ALLOCATION
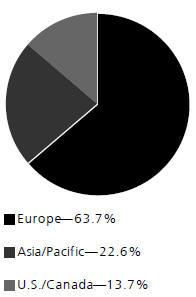
Holdings and allocations are subject to change and are not buy/sell recommendations. Percentages are as of December 31, 2019, and are based on the total market value of investments.
For more current Fund holdings, please visit invesco.com.
*Effective after the close of business on May 24, 2019, the Non-Service and Service share classes of the predecessor fund were reorganized into Series I and Series II Shares, respectively, of the Fund. Returns shown for Series I and Series II shares are blended returns of the predecessor fund and the Fund. Share class returns will differ from those of the predecessor fund because of different expenses.
3 INVESCO OPPENHEIMER V.I. INTERNATIONAL GROWTH FUND
Fund Performance Discussion
For the year ended December 31, 2019, Series I shares of Invesco Oppenheimer V.I. International Growth Fund (the Fund) returned 28.60% (without sales charge) outperforming the MSCI AC World ex-U.S. Index, the Fund’s benchmark, which returned 21.51% during the period.
During this fiscal year, the Fund benefited from the consistency of our philosophy and process, which we have maintained since the portfolio’s inception in 1996. This is particularly gratifying after some of the challenges our portfolio faced in the latter half of 2018. Our semiconductor value chain companies have recovered strongly from the derating they experienced in 2018. The car continues to evolve into a computer on wheels, and our auto component companies have provided us with significant returns since we began investing in them during 2014. However, the fundamentals of the end manufacturers have deteriorated and we reduced our exposure, to positive effect. Our software companies, both those we have owned for ten years and those bought more recently, are benefitting from the “software as a service” business model, and we believe this is likely to continue.
MARKET OVERVIEW
For international equity markets, 2019 was a year of “thirds”. Markets performed very well during the first four months, rebounding sharply from the sell-off in the back half of 2018. For the next four months, markets were range bound until August, when global equities rallied, led by technology. This final “third” of the year was marked by a renewed optimism in the potential for continued growth. This was especially the case in December. National elections in the UK ended three and a half years of uncertainty over whether and when Brexit will happen and the US and China produced a “Phase One” trade agreement. These developments engendered so much positive sentiment that equity markets barely reacted to the subsequent news that the Federal Reserve in the US would not cut rates, and that a US president would be impeached.
TOP INDIVIDUAL CONTRIBUTORS
Top performing stocks for the Portfolio this year included ASML Holding NV, STMicroelectronics NV, and Hitachi, Ltd.
ASML Holding NV, a Dutch company, makes the equipment needed for producing semiconductors. ASML is the only supplier of the extreme ultraviolet lithography equipment that is required to produce the next generation of semiconductor chips. In our opinion, the stock is reacting favorably to a growing appreciation of the company’s growth potential.
ST Microelectronics NV is a global semiconductor chip designer and manufacturer focused on the fast growing automotive, sensor and security segments. The company has consistently displayed admirable margin and capital discipline through various market conditions. It is one of only four companies at the forefront of developing silicon carbide chips, which are necessary in the high temperature and pressure conditions in many of the next generation of chip applications. In our opinion, ST Micro iswell-positioned to benefit from the secular growth trends in its areas of expertise. The shares have recovered strongly from the sell-off experienced last year.
Hitachi Ltd. is a Japanese company that has some industrial component and services businesses that are very interesting to us and other legacy businesses that we think are completely awful. As part of the sea change we are seeing in the behavior of many Japanese company managements, Hitachi is selling its “bad” businesses, restructuring itself into an attractive company.
TOP INDIVIDUAL DETRACTORS
Top detractors from Portfolio performance included Nokia Oyj, Hero Motorcorp Limited and Ubisoft Entertainment SA.
Nokia Oyj, the Finnish telecommunications equipment company, is a familiar name from its days as a dominant player in the handset market. That business is done now with the exception of royalties the company receives from third-party manufacturers. Nokia is now a one-stop shop for both mobile and terrestrial telephony equipment and software. The company has restructured and appears well-poised for the 5G investment cycle. The stock has pulled back on earnings below analyst expectations. We agree with Nokia that lumpy contract and lower margin contracts should be expected at the beginning of 5G deployment, as they have in past new generation telephone rollouts. Our outlook for Nokia remains positive.
Hero Motorcorp Limited is one the two leading motorcycle companies in India, where long term demand is strong. We have benefitted from owning the company for several years. This year, the Regulator in India initiated new emission and safety equipment requirements. In our opinion, it will take Hero some time to pass on the cost of implementing these new standards. We have exited our position.
4 INVESCO OPPENHEIMER V.I. INTERNATIONAL GROWTH FUND
Ubisoft Entertainment SA is a French producer of gaming content that we find very attractive. Gaming continues to grow in popularity. Much of this is driven by the proliferation of devices upon which people can play games. We believe we are still near the beginning of dramatic growth in the amount, variety, content richness, and monetization of gaming people do.
STRATEGY & OUTLOOK
Through the pessimism of the latter half of last year, the early rebound, the volatile range trading, and finally the optimism at the end of this year, our philosophy and our process have remained consistent.
Our software and our semiconductor value chain companies are part of our “Data Deluge” investment theme, a key component of our portfolio since 2010. Some of our holdings within the theme have changed over the years, but the basis of it – that the amount of data created in the world is growing at 30-40% annually and will continue to do for the foreseeable future – remains unchanged. We expect that we will continue to find investment opportunities that are driven by this strong structural growth trend.
Our health care leisure companies are well placed within the rising spending streams from populations that are aging and, in the emerging markets, more affluent. Rising emerging market affluence also drives the growth of our luxury and consumer staples companies.
Since the portfolio’s inception, we have followed the same philosophy and process, and we will continue to do so. We seek to invest in high quality companies that have strong potential to benefit from the deep structural growth forces of Mass Affluence, New Technology, Restructuring and Aging that are always at work in the global economy.
The views and opinions expressed in management’s discussion of Fund performance are those of Invesco Advisers, Inc. These views and opinions are subject to change at any time based on factors such as market and economic conditions. These views and opinions may not be relied upon as investment advice or recommendations, or as an offer for a particular security. The information is not a complete analysis of every aspect of any market, country, industry, security or the Fund. Statements of fact are from sources considered reliable, but Invesco Advisers, Inc. makes no representation or warranty as to their completeness or accuracy. Although historical performance is no guarantee of future results, these insights may help you understand our investment management philosophy.
Before investing, investors should carefully read the prospectus and/or summary prospectus and carefully consider the investment objectives, risks, charges and expenses. For this and more complete information about the fund(s), investors should ask their advisors for a prospectus/summary prospectus or visit invesco.com/fundprospectus.
Shares of Invesco funds are not deposits or obligations of any bank, are not guaranteed by any bank, are not insured by the FDIC or any other agency, and involve investment risks, including the possible loss of the principal amount invested.
Comparing the Fund’s Performance to the Market.The graphs that follow show the performance of a hypothetical $10,000 investment in each share class of the Fund held until December 31, 2019. Performance is measured over aten-fiscal-year period for both Classes. Performance information does not reflect charges that apply to separate accounts investing in the Fund. If these charges were taken into account, performance would be lower. The graphs assume that all dividends and capital gains distributions were reinvested in additional shares.
The Fund’s performance is compared to the performance of the MSCI AC World ex-U.S. Index. The MSCI AC World ex-U.S. Index is designed to measure the equity market performance of developed and emerging markets and excludes the U.S. The Index is unmanaged and cannot be purchased directly by investors. While index comparisons may be useful to provide a benchmark for the Fund’s performance, it must be noted that the Fund’s investments are not limited to the investments comprising the Index. Index performance includes reinvestment of income, but does not reflect transaction costs, fees, expenses or taxes. Index performance is shown for illustrative purposes only as a benchmark for the Fund’s performance, and does not predict or depict performance of the Fund. The Fund’s performance reflects the effects of the Fund’s business and operating expenses.
5 INVESCO OPPENHEIMER V.I. INTERNATIONAL GROWTH FUND
COMPARISON OF CHANGE IN VALUE OF $10,000 HYPOTHETICAL INVESTMENTS IN:
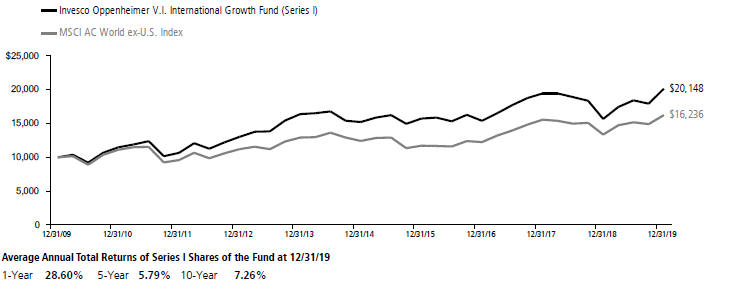
COMPARISON OF CHANGE IN VALUE OF $10,000 HYPOTHETICAL INVESTMENTS IN:
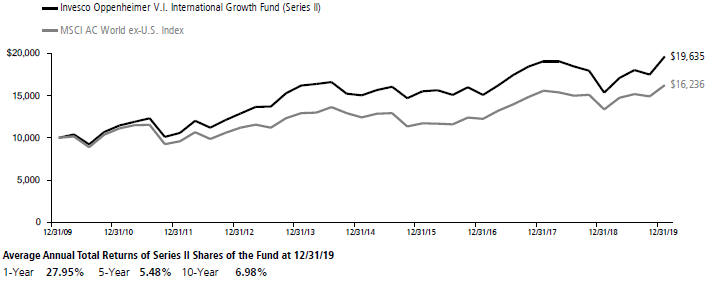
Performance data quoted represents past performance, which does not guarantee future results.The investment return and principal value of an investment in the Fund will fluctuate so that an investor’s shares, when redeemed, may be worth more or less than their original cost. Current performance may be lower or higher than the performance quoted. For performance data current to the most recent month end, call us at 1.800.988.8287. The Fund’s total returns should not be expected to be the same as the returns of other funds, whether or not both funds have the same portfolio managers and/or similar names. The Fund’s total returns include changes in share price and reinvested distributions but do not include the charges associated with the separate account products that offer this Fund. Such performance would have been lower if such charges were taken into account.
6 INVESCO OPPENHEIMER V.I. INTERNATIONAL GROWTH FUND
Fund Expenses
Fund Expenses.As a shareholder of the Fund, you incur two types of costs: (1) transaction costs and (2) ongoing costs, including management fees; distribution and service fees; and other Fund expenses. These examples are intended to help you understand your ongoing costs (in dollars) of investing in the Fund and to compare these costs with the ongoing costs of investing in other mutual funds.
The examples are based on an investment of $1,000.00 invested at the beginning of the period and held for the entire 6-month period ended December 31, 2019.
Actual Expenses. The first section of the table provides information about actual account values and actual expenses. You may use the information in this section for the class of shares you hold, together with the amount you invested, to estimate the expense that you paid over the period. Simply divide your account value by $1,000.00 (for example, an $8,600.00 account value divided by $1,000.00 = 8.60), then multiply the result by the number in the first section under the heading entitled “Expenses Paid During 6 Months Ended December 31, 2019” to estimate the expenses you paid on your account during this period.
Hypothetical Example for Comparison Purposes.
The second section of the table provides information about hypothetical account values and hypothetical expenses based on the Fund’s actual expense ratio for each class of shares, and an assumed rate of return of 5% per year for each class before expenses, which is not the actual return. The hypothetical account values and expenses may not be used to estimate the actual ending account balance or expenses you paid for the period. You may use this information to compare the ongoing costs of investing in the Fund and other funds. To do so, compare this 5% hypothetical example for the class of shares you hold with the 5% hypothetical examples that appear in the shareholder reports of the other funds.
Please note that the expenses shown in the table are meant to highlight your ongoing costs only and do not reflect any charges associated with the separate accounts that offer this Fund. Therefore, the “hypothetical” lines of the table are useful in comparing ongoing costs only, and will not help you determine the relative total costs of owning different funds. In addition, if these separate account charges were included your costs would have been higher.
| | | | | | | | | | | | | | | | |
| Actual | | Beginning Account Value July 1, 2019 | | | Ending Account Value December 31, 2019 | | | Expenses Paid During 6 Months Ended December 31, 2019 | | | | |
| Series I shares | | $ | 1,000.00 | | | $ | 1,093.80 | | | $ | 5.29 | | | | | |
| Series II shares | | | 1,000.00 | | | | 1,089.40 | | | | 6.60 | | | | | |
| | | | |
Hypothetical (5% return before expenses) | | | | | | | | | | | | | | | | |
| Series I shares | | | 1,000.00 | | | | 1,020.16 | | | | 5.10 | | | | | |
| Series II shares | | | 1,000.00 | | | | 1,018.90 | | | | 6.38 | | | | | |
Expenses are equal to the Fund’s annualized expense ratio for that class, multiplied by the average account value over the period, multiplied by 184/365 (to reflect the one-half year period). Those annualized expense ratios, excluding indirect expenses from affiliated funds, based on the 6-month period ended December 31, 2019 are as follows:
| | | | | |
| Class | | Expense Ratios |
| Series I shares | | | | 1.00 | % |
| Series II shares | | | | 1.25 | |
The expense ratios reflect voluntary and/or contractual waivers and/or reimbursements of expenses by the Fund’s Manager. Some of these undertakings may be modified or terminated at any time, as indicated in the Fund’s prospectus. The “Financial Highlights” tables in the Fund’s financial statements, included in this report, also show the gross expense ratios, without such waivers or reimbursements and reduction to custodian expenses, if applicable.
7 INVESCO OPPENHEIMER V.I. INTERNATIONAL GROWTH FUND
SCHEDULE OF INVESTMENTSDecember 31, 2019
| | | | | | | | |
| | | Shares | | | Value | |
| Common Stocks—98.5% | | | | | | | | |
| Consumer Discretionary—15.9% | | | | | |
| Auto Components—1.7% | | | | | | | | |
| Continental AG | | | 13,685 | | | $ | 1,777,113 | |
| Koito Manufacturing Co. Ltd. | | | 81,100 | | | | 3,753,575 | |
| Valeo SA | | | 64,295 | | | | 2,276,513 | |
| | | | | | | 7,807,201 | |
| Entertainment—1.1% | |
| Ubisoft Entertainment SA1 | | | 78,156 | | | | 5,406,571 | |
| Hotels, Restaurants & Leisure—1.1% | |
| Carnival Corp. | | | 43,473 | | | | 2,209,732 | |
| Flutter Entertainment plc | | | 23,062 | | | | 2,821,263 | |
| | | | | | | 5,030,995 | |
| Household Durables—1.6% | |
| SEB SA | | | 10,850 | | | | 1,613,737 | |
| SEB SA, Private Shares1 | | | 850 | | | | 126,422 | |
| SEB SA, Prime1 | | | 39,200 | | | | 5,830,276 | |
| | | | | | | 7,570,435 | |
| Internet & Catalog Retail—1.5% | |
| Alibaba Group Holding Ltd., Sponsored ADR1 | | | 34,498 | | | | 7,317,026 | |
| Multiline Retail—2.0% | |
| Dollarama, Inc. | | | 145,439 | | | | 4,998,608 | |
| Next plc | | | 45,811 | | | | 4,265,488 | |
| | | | | | | 9,264,096 | |
| Specialty Retail—1.5% | |
| Nitori Holdings Co. Ltd. | | | 46,100 | | | | 7,284,354 | |
| Textiles, Apparel & Luxury Goods—5.4% | |
| Cie Financiere Richemont SA | | | 57,458 | | | | 4,510,309 | |
| Hermes International | | | 17,418 | | | | 13,034,650 | |
| LVMH Moet Hennessy Louis Vuitton SE | | | 17,495 | | | | 8,147,965 | |
| | | | | | | 25,692,924 | |
| Consumer Staples—10.4% | |
| Beverages—3.2% | |
| Britvic plc | | | 278,974 | | | | 3,348,095 | |
| Heineken NV | | | 45,503 | | | | 4,853,873 | |
| Pernod Ricard SA | | | 39,466 | | | | 7,064,631 | |
| | | | | | | 15,266,599 | |
| Food & Staples Retailing—2.7% | |
| Alimentation Couche-Tard, Inc., Cl. B | | | 292,485 | | | | 9,282,128 | |
| CP ALL PCL | | | 1,495,400 | | | | 3,596,710 | |
| | | | | | | 12,878,838 | |
| Food Products—3.4% | |
| Barry Callebaut AG | | | 3,579 | | | | 7,912,097 | |
| Saputo, Inc. | | | 139,598 | | | | 4,321,620 | |
| WH Group Ltd. | | | 4,002,500 | | | | 4,147,172 | |
| | | | | | | 16,380,889 | |
| Tobacco—1.1% | |
| Swedish Match AB | | | 98,297 | | | | 5,067,584 | |
| Energy—0.9% | |
| Energy Equipment & Services—0.9% | |
| TechnipFMC plc | | | 201,173 | | | | 4,273,790 | |
| Financials—4.6% | | | | | | | | |
| Commercial Banks—2.0% | |
| ICICI Bank Ltd., Sponsored ADR | | | 620,424 | | | | 9,362,198 | |
| Insurance—2.6% | |
| Legal & General Group plc | | | 1,552,535 | | | | 6,254,806 | |
| Prudential plc | | | 315,162 | | | | 6,064,170 | |
| | | | | | | 12,318,976 | |
| Health Care—18.7% | |
| Biotechnology—5.5% | |
| Ascendis Pharma AS, ADR1 | | | 12,994 | | | | 1,807,725 | |
| CSL Ltd. | | | 49,215 | | | | 9,551,210 | |
| | | | | | | | |
| | | Shares | | | Value | |
| Biotechnology (Continued) | |
| Galapagos NV1 | | | 14,205 | | | $ | 2,956,664 | |
| Grifols SA | | | 335,355 | | | | 11,840,780 | |
| | | | | | | 26,156,379 | |
| Health Care Equipment & Supplies—6.5% | |
| Hoya Corp. | | | 123,393 | | | | 11,781,581 | |
| LivaNova plc1 | | | 35,110 | | | | 2,648,347 | |
| Medtronic plc | | | 43,585 | | | | 4,944,718 | |
| ResMed, Inc. | | | 35,362 | | | | 5,480,049 | |
| Siemens Healthineers AG2 | | | 122,573 | | | | 5,885,850 | |
| | | | | | | 30,740,545 | |
| Health Care Providers & Services—1.2% | |
| Fresenius Medical Care AG & Co. KGaA | | | 77,714 | | | | 5,763,887 | |
| Life Sciences Tools & Services—1.3% | |
| Lonza Group AG1 | | | 17,395 | | | | 6,344,216 | |
| Pharmaceuticals—4.2% | |
| Novo Nordisk AS, Cl. B | | | 177,883 | | | | 10,317,157 | |
| Roche Holding AG | | | 29,588 | | | | 9,594,147 | |
| | | | | | | 19,911,304 | |
| Industrials—18.2% | |
| Aerospace & Defense—1.7% | |
| Airbus SE | | | 53,162 | | | | 7,799,806 | |
| Building Products—0.5% | |
| Daikin Industries Ltd. | | | 17,800 | | | | 2,503,225 | |
| Commercial Services & Supplies—2.3% | |
| Edenred | | | 133,798 | | | | 6,923,373 | |
| Prosegur Cash SA2 | | | 1,481,508 | | | | 2,258,847 | |
| Prosegur Cia de Seguridad SA | | | 466,572 | | | | 1,927,613 | |
| | | | | | | 11,109,833 | |
| Construction & Engineering—0.3% | |
| Boskalis Westminster | | | 53,145 | | | | 1,364,119 | |
| Electrical Equipment—3.7% | |
| Legrand SA | | | 56,438 | | | | 4,604,963 | |
| Melrose Industries plc | | | 2,054,481 | | | | 6,566,870 | |
| Nidec Corp. | | | 46,200 | | | | 6,311,110 | |
| | | | | | | 17,482,943 | |
| Machinery—7.3% | |
| Aalberts NV | | | 130,610 | | | | 5,875,866 | |
| Atlas Copco AB, Cl. A | | | 207,449 | | | | 8,269,452 | |
| Epiroc AB, Cl. A | | | 442,838 | | | | 5,411,962 | |
| Kubota Corp. | | | 138,500 | | | | 2,169,718 | |
| VAT Group AG1,2 | | | 51,287 | | | | 8,676,680 | |
| Weir Group plc (The) | | | 199,262 | | | | 3,987,231 | |
| | | | | | | 34,390,909 | |
| Professional Services—1.1% | |
| Intertek Group plc | | | 69,601 | | | | 5,401,923 | |
| Trading Companies & Distributors—1.3% | |
| Bunzl plc | | | 52,644 | | | | 1,440,367 | |
| Ferguson plc | | | 52,007 | | | | 4,725,179 | |
| | | | | | | 6,165,546 | |
| Information Technology—26.0% | |
| Communications Equipment—0.8% | |
| Nokia OYJ | | | 974,051 | | | | 3,613,579 | |
| Electronic Equipment, Instruments, & Components—5.1% | |
| Hitachi Ltd. | | | 325,200 | | | | 13,698,087 | |
| Keyence Corp. | | | 30,224 | | | | 10,697,881 | |
| | | | | | | 24,395,968 | |
| IT Services—3.9% | |
| Amadeus IT Group SA | | | 71,383 | | | | 5,848,897 | |
| EPAM Systems, Inc.1 | | | 39,553 | | | | 8,391,564 | |
| Worldline SA1,2 | | | 60,741 | | | | 4,310,949 | |
| | | | | | | 18,551,410 | |
8 INVESCO OPPENHEIMER V.I. INTERNATIONAL GROWTH FUND
| | | | | | | | |
| | | Shares | | | Value | |
| Semiconductors & Semiconductor Equipment—8.9% | |
| ASML Holding NV | | | 44,522 | | | $ | 13,259,105 | |
| Infineon Technologies AG | | | 356,739 | | | | 8,180,696 | |
| STMicroelectronics NV | | | 443,185 | | | | 11,961,273 | |
| Taiwan Semiconductor Manufacturing Co. Ltd. | | | 776,000 | | | | 8,593,790 | |
| | | | | | | 41,994,864 | |
| Software—7.3% | |
| Atlassian Corp. plc, Cl. A1 | | | 13,512 | | | | 1,626,034 | |
| Blue Prism Group plc1 | | | 61,141 | | | | 916,184 | |
| Dassault Systemes SE | | | 33,052 | | | | 5,451,774 | |
| SAP SE | | | 101,922 | | | | 13,736,009 | |
| Temenos AG1 | | | 41,191 | | | | 6,512,372 | |
| Xero Ltd.1 | | | 115,350 | | | | 6,494,166 | |
| | | | | | | 34,736,539 | |
| Materials—3.8% | |
| Chemicals—1.7% | |
| Sika AG | | | 42,727 | | | | 8,046,307 | |
| | | | | | | | |
| | | Shares | | | Value | |
| Construction Materials—0.8% | |
| James Hardie Industries plc | | | 189,395 | | | $ | 3,713,149 | |
| Containers & Packaging—1.3% | |
| CCL Industries, Inc., Cl. B | | | 151,259 | | | | 6,443,840 | |
| Total Common Stocks (Cost $269,557,987) | | | | | | | 467,552,767 | |
| Preferred Stock—0.0% | | | | | | | | |
| Zee Entertainment Enterprises Ltd., 6% Cum. Non-Cv. (Cost $—) | | | 599,541 | | | | 45,693 | |
| Investment Company—1.3% | | | | | | | | |
| Invesco Government & Agency Portfolio, Institutional Class, 1.50%3 (Cost $6,357,038) | | | 6,357,038 | | | | 6,357,038 | |
| Total Investments, at Value (Cost $275,915,025) | | | 99.8% | | | | 473,955,498 | |
| Net Other Assets (Liabilities) | | | 0.2 | | | | 741,753 | |
| Net Assets | | | 100.0% | | | $ | 474,697,251 | |
| | | | | | | | |
Footnotes to Schedule of Investments
1. Non-income producing security.
2. Security purchased or received in a transaction exempt from registration under the Securities Act of 1933, as amended (the “1933 Act”). The security may be resold pursuant to an exemption from registration under the 1933 Act, typically to qualified institutional buyers. The aggregate value of these securities at December 31, 2019 was $21,132,326, which represented 4.45% of the Fund’s Net Assets.
3. The money market fund and the Fund are affiliated by having the same investment adviser. The rate shown is the 7-day SEC standardized yield as of December 31, 2019.
| | | | | | | | |
| Distribution of investments representing geographic holdings, as a percentage of total investments at value, is as follows: | | | | | |
| Geographic Holdings | | Value | | | Percent |
| France | | $ | 72,591,630 | | | | 15.3 | % |
| Switzerland | | | 63,557,403 | | | | 13.4 | |
| Japan | | | 58,199,530 | | | | 12.3 | |
| United Kingdom | | | 42,518,922 | | | | 9.0 | |
| United States | | | 40,095,812 | | | | 8.5 | |
| Germany | | | 35,343,554 | | | | 7.4 | |
| Netherlands | | | 25,352,963 | | | | 5.3 | |
| Canada | | | 25,046,195 | | | | 5.3 | |
| Spain | | | 21,876,137 | | | | 4.6 | |
| Sweden | | | 18,748,998 | | | | 3.9 | |
| Denmark | | | 12,124,882 | | | | 2.6 | |
| Australia | | | 9,551,210 | | | | 2.0 | |
| India | | | 9,407,891 | | | | 2.0 | |
| Taiwan | | | 8,593,790 | | | | 1.8 | |
| China | | | 7,317,026 | | | | 1.5 | |
| New Zealand | | | 6,494,166 | | | | 1.4 | |
| Hong Kong | | | 4,147,173 | | | | 0.9 | |
| Finland | | | 3,613,579 | | | | 0.8 | |
| Thailand | | | 3,596,710 | | | | 0.8 | |
| Belgium | | | 2,956,664 | | | | 0.6 | |
| Ireland | | | 2,821,263 | | | | 0.6 | |
| Total | | $ | 473,955,498 | | | | 100.0 | % |
| | | | | | | | |
Glossary:
Definitions
ADR American Depositary Receipt
See accompanying Notes to Financial Statements.
9 INVESCO OPPENHEIMER V.I. INTERNATIONAL GROWTH FUND
STATEMENT OF ASSETS AND LIABILITIESDecember 31, 2019
| | | | |
| Assets | | | | |
| Investments, at value—see accompanying schedule of investments: | | | | |
| Unaffiliated companies (cost $269,557,987) | | $ | 467,598,460 | |
| Affiliated companies (cost $6,357,038) | | | 6,357,038 | |
| | | | |
| | | 473,955,498 | |
| Cash | | | 169,170 | |
| Receivables and other assets: | | | | |
| Dividends | | | 1,986,118 | |
| Shares of beneficial interest sold | | | 275,883 | |
| Investments sold | | | 10,740 | |
| Other | | | 50,487 | |
| | | | |
| Total assets | | | 476,447,896 | |
| Liabilities | | | | |
| Amount due to custodian-foreign (cost $86) | | | 86 | |
| Payables and other liabilities: | | | | |
| Shares of beneficial interest redeemed | | | 1,154,473 | |
| Foreign capital gains tax | | | 212,752 | |
| Administration fees | | | 172,292 | |
| Distribution and service plan fees | | | 52,913 | |
| Trustees’ compensation | | | 44,861 | |
| Shareholder communications | | | 27,649 | |
| Advisory fees | | | 12,272 | |
| Transfer and shareholder servicing agent fees | | | 4,479 | |
| Other | | | 68,868 | |
| | | | |
| Total liabilities | | | 1,750,645 | |
| Net Assets | | $ | 474,697,251 | |
| | | | |
| | | | |
| Composition of Net Assets | | | | |
| Shares of beneficial interest | | $ | 271,602,242 | |
| Total distributable earnings | | | 203,095,009 | |
| | | | |
| Net Assets | | $ | 474,697,251 | |
| | | | |
| | | | |
| Net Asset Value Per Share | | | | |
| |
| Series I Shares: | | | | |
| |
| Net asset value, redemption price per share and offering price per share (based on net assets of $221,944,412 and 90,729,973 shares of beneficial interest outstanding) | | | $2.45 | |
| |
| Series II Shares: | | | | |
| Net asset value, redemption price per share and offering price per share (based on net assets of $252,752,839 and 98,828,783 shares of beneficial interest outstanding) | | | $2.56 | |
See accompanying Notes to Financial Statements.
10 INVESCO OPPENHEIMER V.I. INTERNATIONAL GROWTH FUND
STATEMENT OF OPERATIONSFor the Year Ended December 31, 2019
| | | | |
| Investment Income | | | | |
| Dividends: | | | | |
| Unaffiliated companies (net of foreign withholding taxes of $949,740) | | $ | 8,600,380 | |
| Affiliated companies | | | 315,580 | |
| | | | |
| Total investment income | | | 8,915,960 | |
| Expenses | | | | |
| Advisory fees | | | 4,404,407 | |
| Administration fees | | | 446,199 | |
| Distribution and service plan fees: | | | | |
| Series II shares | | | 571,727 | |
| Transfer and shareholder servicing agent fees: | | | | |
| Series I shares | | | 142,124 | |
| Series II shares | | | 119,042 | |
| Shareholder communications: | | | | |
| Series I shares | | | 12,904 | |
| Series II shares | | | 12,907 | |
| Custodian fees and expenses | | | 45,767 | |
| Trustees’ compensation | | | 19,141 | |
| Borrowing fees | | | 6,284 | |
| Other | | | 53,738 | |
| | | | |
| Total expenses | | | 5,834,240 | |
| Less waivers, reimbursement of expenses and offset arrangement(s) | | | (605,221 | ) |
| | | | |
| Net expenses | | | 5,229,019 | |
| Net Investment Income | | | 3,686,941 | |
| Realized and Unrealized Gain (Loss) | | | | |
| Net realized gain (loss) on: | | | | |
| Investment transactions in unaffiliated companies (net of foreign capital gains tax of $193,635) (includes net gains from securities sold to affiliates of $99,172) | | | 7,433,215 | |
| Foreign currency transactions | | | (33,758 | ) |
| | | | |
| Net realized gain | | | 7,399,457 | |
| Net change in unrealized appreciation/(depreciation) on: | | | | |
| Investment transactions in unaffiliated companies (net of foreign capital gains tax of $(32,030)) | | | 108,121,273 | |
| Translation of assets and liabilities denominated in foreign currencies | | | 3,318 | |
| | | | |
| Net change in unrealized appreciation/(depreciation) | | | 108,124,591 | |
| Net Increase in Net Assets Resulting from Operations | | $ | 119,210,989 | |
| | | | |
See accompanying Notes to Financial Statements.
11 INVESCO OPPENHEIMER V.I. INTERNATIONAL GROWTH FUND
STATEMENT OF CHANGES IN NET ASSETS
| | | | | | | | |
| | | Year Ended
December 31, 2019 | | Year Ended
December 31, 2018 |
| Operations | | | | | | | | |
| Net investment income | | $ | 3,686,941 | | | $ | 4,028,652 | |
| Net realized gain | | | 7,399,457 | | | | 25,026,292 | |
| Net change in unrealized appreciation/(depreciation) | | | 108,124,591 | | | | (139,763,917 | ) |
| | | | |
| Net increase (decrease) in net assets resulting from operations | | | 119,210,989 | | | | (110,708,973 | ) |
| Dividends and/or Distributions to Shareholders | | | | | | | | |
| Distributions to shareholders from distributable earnings: | | | | | | | | |
| Series I shares | | | (13,472,374 | ) | | | (9,134,490 | ) |
| Series II shares | | | (12,709,522 | ) | | | (5,690,284 | ) |
| | | | |
| Total distributions from distributable earnings | | | (26,181,896 | ) | | | (14,824,774 | ) |
| Beneficial Interest Transactions | | | | | | | | |
| Net increase (decrease) in net assets resulting from beneficial interest transactions: | | | | | | | | |
| Series I shares | | | (95,274,031 | ) | | | (20,815,884 | ) |
| Series II shares | | | 10,086,290 | | | | 13,746,754 | |
| | | | |
| Total beneficial interest transactions | | | (85,187,741 | ) | | | (7,069,130 | ) |
| Net Assets | | | | | | | | |
| Total increase (decrease) | | | 7,841,352 | | | | (132,602,877 | ) |
| Beginning of period | | | 466,855,899 | | | | 599,458,776 | |
| | | | |
| End of period | | $ | 474,697,251 | | | $ | 466,855,899 | |
| | | | |
See accompanying Notes to Financial Statements.
12 INVESCO OPPENHEIMER V.I. INTERNATIONAL GROWTH FUND
FINANCIAL HIGHLIGHTS
| | | | | | | | | | | | | | | | | | | | |
| Series I Shares | | Year Ended
December 31,
2019 | | Year Ended
December 31,
2018 | | Year Ended
December 31,
2017 | | Year Ended
December 31,
2016 | | Year Ended
December 31,
2015 |
| Per Share Operating Data | | | | | | | | | | | | | | | | | | | | |
| Net asset value, beginning of period | | | $2.03 | | | | $2.59 | | | | $2.08 | | | | $2.20 | | | | $2.31 | |
| Income (loss) from investment operations: | | | | | | | | | | | | | | | | | | | | |
| Net investment income1 | | | 0.02 | | | | 0.02 | | | | 0.02 | | | | 0.03 | | | | 0.03 | |
| Net realized and unrealized gain (loss) | | | 0.54 | | | | (0.51) | | | | 0.52 | | | | (0.08) | | | | 0.06 | |
| | | | |
| Total from investment operations | | | 0.56 | | | | (0.49) | | | | 0.54 | | | | (0.05) | | | | 0.09 | |
| Dividends and/or distributions to shareholders: | | | | | | | | | | | | | | | | | | | | |
| Dividends from net investment income | | | (0.02) | | | | (0.02) | | | | (0.03) | | | | (0.02) | | | | (0.03) | |
| Distributions from net realized gain | | | (0.12) | | | | (0.05) | | | | 0.00 | | | | (0.05) | | | | (0.17) | |
| | | | |
| Total dividends and/or distributions to shareholders | | | (0.14) | | | | (0.07) | | | | (0.03) | | | | (0.07) | | | | (0.20) | |
| Net asset value, end of period | | | $2.45 | | | | $2.03 | | | | $2.59 | | | | $2.08 | | | | $2.20 | |
| | | | |
| | | | | | | | | | | | | | | | | | | | |
| Total Return, at Net Asset Value2 | | | 28.60% | | | | (19.42)% | | | | 26.29% | | | | (2.12)% | | | | 3.43% | |
| | | | | | | | | | | | | | | | | | | | |
| Ratios/Supplemental Data | | | | | | | | | | | | | | | | | | | | |
| Net assets, end of period (in thousands) | | | $221,944 | | | | $267,220 | | | | $360,417 | | | | $301,559 | | | | $317,547 | |
| Average net assets (in thousands) | | | $236,960 | | | | $325,080 | | | | $339,999 | | | | $305,269 | | | | $343,347 | |
| Ratios to average net assets:3 | | | | | | | | | | | | | | | | | | | | |
| Net investment income | | | 0.91% | | | | 0.83% | | | | 0.87% | | | | 1.24% | | | | 1.08% | |
| Expenses excluding specific expenses listed below | | | 1.13% | | | | 1.10% | | | | 1.08% | | | | 1.09% | | | | 1.08% | |
| Interest and fees from borrowings4 | | | 0.00% | | | | 0.00% | | | | 0.00% | | | | 0.00% | | | | 0.00% | |
| | | | |
| Total expenses5 | | | 1.13% | | | | 1.10% | | | | 1.08% | | | | 1.09% | | | | 1.08% | |
| Expenses after payments, waivers and/or reimbursements and reduction to custodian expenses | | | 1.00% | | | | 1.00% | | | | 1.00% | | | | 1.00% | | | | 1.00% | |
| Portfolio turnover rate6 | | | 51% | | | | 25% | | | | 27% | | | | 15% | | | | 24% | |
1. Calculated based on the average shares outstanding during the period.
2. Includes adjustments in accordance with accounting principles generally accepted in the United States of America and as such, the net asset value for financial reporting purposes and the returns based upon those net asset values may differ from the net asset value and returns for shareholder transactions. Total returns are not annualized for periods less than one year, if applicable and do not reflect charges assessed in connection with a variable product, which if included would reduce total returns.
3. Annualized for periods less than one full year.
4. Less than 0.005%.
5. Total expenses including indirect expenses from fund fees and expenses were as follows:
| | | | | | |
| Year Ended December 31, 2019 | | | 1.13 | % | | |
| Year Ended December 31, 2018 | | | 1.10 | % | | |
| Year Ended December 31, 2017 | | | 1.08 | % | | |
| Year Ended December 31, 2016 | | | 1.09 | % | | |
| Year Ended December 31, 2015 | | | 1.08 | % | | |
6. Portfolio turnover is calculated at the fund level and is not annualized for periods less than one year, if applicable.
See accompanying Notes to Financial Statements.
13 INVESCO OPPENHEIMER V.I. INTERNATIONAL GROWTH FUND
FINANCIAL HIGHLIGHTSContinued
| | | | | | | | | | | | | | | | | | | | |
| Series II Shares | | Year Ended
December 31,
2019 | | Year Ended
December 31,
2018 | | Year Ended
December 31,
2017 | | Year Ended
December 31,
2016 | | Year Ended
December 31,
2015 |
| Per Share Operating Data | | | | | | | | | | | | | | | | | | | | |
| Net asset value, beginning of period | | | $2.12 | | | | $2.70 | | | | $2.16 | | | | $2.29 | | | | $2.40 | |
| Income (loss) from investment operations: | | | | | | | | | | | | | | | | | | | | |
| Net investment income1 | | | 0.02 | | | | 0.01 | | | | 0.01 | | | | 0.02 | | | | 0.02 | |
| Net realized and unrealized gain (loss) | | | 0.56 | | | | (0.52) | | | | 0.56 | | | | (0.08) | | | | 0.06 | |
| | | | |
| Total from investment operations | | | 0.58 | | | | (0.51) | | | | 0.57 | | | | (0.06) | | | | 0.08 | |
| Dividends and/or distributions to shareholders: | | | | | | | | | | | | | | | | | | | | |
| Dividends from net investment income | | | (0.02) | | | | (0.02) | | | | (0.03) | | | | (0.02) | | | | (0.02) | |
| Distributions from net realized gain | | | (0.12) | | | | (0.05) | | | | 0.00 | | | | (0.05) | | | | (0.17) | |
| | | | |
| Total dividends and/or distributions to shareholders | | | (0.14) | | | | (0.07) | | | | (0.03) | | | | (0.07) | | | | (0.19) | |
| Net asset value, end of period | | | $2.56 | | | | $2.12 | | | | $2.70 | | | | $2.16 | | | | $2.29 | |
| | | | |
| | | | | | | | | | | | | | | | | | | | |
| Total Return, at Net Asset Value2 | | | 27.95% | | | | (19.55)% | | | | 26.44% | | | | (2.72)% | | | | 3.11% | |
| | | | | | | | | | | | | | | | | | | | |
| Ratios/Supplemental Data | | | | | | | | | | | | | | | | | | | | |
| Net assets, end of period (in thousands) | | | $252,753 | | | | $199,636 | | | | $239,042 | | | | $175,633 | | | | $169,292 | |
| Average net assets (in thousands) | | | $228,869 | | | | $231,130 | | | | $213,440 | | | | $174,834 | | | | $165,226 | |
| Ratios to average net assets:3 | | | | | | | | | | | | | | | | | | | | |
| Net investment income | | | 0.67% | | | | 0.58% | | | | 0.60% | | | | 0.99% | | | | 0.79% | |
| Expenses excluding specific expenses listed below | | | 1.38% | | | | 1.35% | | | | 1.33% | | | | 1.34% | | | | 1.33% | |
| Interest and fees from borrowings4 | | | 0.00% | | | | 0.00% | | | | 0.00% | | | | 0.00% | | | | 0.00% | |
| | | | |
| Total expenses5 | | | 1.38% | | | | 1.35% | | | | 1.33% | | | | 1.34% | | | | 1.33% | |
| Expenses after payments, waivers and/or reimbursements and reduction to custodian expenses | | | 1.25% | | | | 1.25% | | | | 1.25% | | | | 1.25% | | | | 1.25% | |
| Portfolio turnover rate6 | | | 51% | | | | 25% | | | | 27% | | | | 15% | | | | 24% | |
1. Calculated based on the average shares outstanding during the period.
2. Includes adjustments in accordance with accounting principles generally accepted in the United States of America and as such, the net asset value for financial reporting purposes and the returns based upon those net asset values may differ from the net asset value and returns for shareholder transactions. Total returns are not annualized for periods less than one year, if applicable and do not reflect charges assessed in connection with a variable product, which if included would reduce total returns.
3. Annualized for periods less than one full year.
4. Less than 0.005%.
5. Total expenses including indirect expenses from fund fees and expenses were as follows:
| | | | | | |
| Year Ended December 31, 2019 | | | 1.38 | % | | |
| Year Ended December 31, 2018 | | | 1.35 | % | | |
| Year Ended December 31, 2017 | | | 1.33 | % | | |
| Year Ended December 31, 2016 | | | 1.34 | % | | |
| Year Ended December 31, 2015 | | | 1.33 | % | | |
6. Portfolio turnover is calculated at the fund level and is not annualized for periods less than one year, if applicable.
See accompanying Notes to Financial Statements.
14 INVESCO OPPENHEIMER V.I. INTERNATIONAL GROWTH FUND
NOTES TO FINANCIAL STATEMENTSDecember 31, 2019
Note 1 – Significant Accounting Policies
Invesco Oppenheimer V.I. International Growth Fund (the “Fund”) is a series portfolio of AIM Variable Insurance Funds (Invesco Variable Insurance Funds) (the “Trust”). The Trust is a Delaware statutory trust registered under the Investment Company Act of 1940, as amended (the “1940 Act”), as an open-end series management investment company authorized to issue an unlimited number of shares of beneficial interest. Information presented in these financial statements pertains only to the Fund. Matters affecting the Fund or each class will be voted on exclusively by the shareholders of such Fund or each class.
Prior to the close of business on May 24, 2019, the Fund operated as Oppenheimer International Growth Fund/VA (the “Acquired Fund” or “Predecessor Fund”). The Acquired Fund was reorganized after the close of business on May 24, 2019 (the “Reorganization Date”) through the transfer of all of its assets and liabilities to the Fund (the “Reorganization”).
Upon closing of the Reorganization, holders of the Acquired Fund’s Non-Service and Service shares received Series I and Series II shares of the Fund, respectively. Information for the Acquired Fund’s Non-Service and Service shares prior to the Reorganization is included with Series I and Series II, respectively, throughout this report.
The Fund’s investment objective is to seek capital appreciation.
The Fund currently offers two classes of shares, Series I and Series II, both of which are offered to insurance company separate accounts funding variable annuity contracts and variable life insurance policies (“variable products”).
The Fund is an investment company and accordingly follows the investment company accounting and reporting guidance in accordance with Financial Accounting Standards Board Accounting Standards Codification Topic 946, Financial Services – Investment Companies.
The following is a summary of the significant accounting policies followed by the Fund in the preparation of its financial statements.
| A. | | Security Valuations– Securities, including restricted securities, are valued according to the following policy. |
A security listed or traded on an exchange (except convertible securities) is valued at its last sales price or official closing price as of the close of the customary trading session on the exchange where the security is principally traded, or lacking any sales or official closing price on a particular day, the security may be valued at the closing bid price on that day. Securities traded in the over-the-counter market are valued based on prices furnished by independent pricing services or market makers. When such securities are valued by an independent pricing service they may be considered fair valued. Futures contracts are valued at the final settlement price set by an exchange on which they are principally traded. Listed options are valued at the mean between the last bid and asked prices from the exchange on which they are principally traded. Options not listed on an exchange are valued by an independent source at the mean between the last bid and asked prices. For purposes of determining net asset value (“NAV”) per share, futures and option contracts generally are valued 15 minutes after the close of the customary trading session of the New York Stock Exchange (“NYSE”).
Investments in open-end and closed-end registered investment companies that do not trade on an exchange are valued at the end-of-day net asset value per share. Investments in open-end and closed-end registered investment companies that trade on an exchange are valued at the last sales price or official closing price as of the close of the customary trading session on the exchange where the security is principally traded.
Debt obligations (including convertible securities) and unlisted equities are fair valued using an evaluated quote provided by an independent pricing service. Evaluated quotes provided by the pricing service may be determined without exclusive reliance on quoted prices, and may reflect appropriate factors such as institution-size trading in similar groups of securities, developments related to specific securities, dividend rate (for unlisted equities), yield (for debt obligations), quality, type of issue, coupon rate (for debt obligations), maturity (for debt obligations), individual trading characteristics and other market data. Pricing services generally value debt obligations assuming orderly transactions of institutional round lot size, but a fund may hold or transact in the same securities in smaller, odd lot sizes. Odd lots often trade at lower prices than institutional round lots. Debt obligations are subject to interest rate and credit risks. In addition, all debt obligations involve some risk of default with respect to interest and/or principal payments.
Foreign securities’ (including foreign exchange contracts) prices are converted into U.S. dollar amounts using the applicable exchange rates as of the close of the NYSE. If market quotations are available and reliable for foreign exchange-traded equity securities, the securities will be valued at the market quotations. Because trading hours for certain foreign securities end before the close of the NYSE, closing market quotations may become unreliable. If between the time trading ends on a particular security and the close of the customary trading session on the NYSE, events occur that the investment adviser determines are significant and make the closing price unreliable, the Fund may fair value the security. If the event is likely to have affected the closing price of the security, the security will be valued at fair value in good faith using procedures approved by the Board of Trustees. Adjustments to closing prices to reflect fair value may also be based on a screening process of an independent pricing service to indicate the degree of certainty, based on historical data, that the closing price in the principal market where a foreign security trades is not the current value as of the close of the NYSE. Foreign securities’ prices meeting the approved degree of certainty that the price is not reflective of current value will be priced at the indication of fair value from the independent pricing service. Multiple factors may be considered by the independent pricing service in determining adjustments to reflect fair value and may include information relating to sector indices, American Depositary Receipts and domestic and foreign index futures. Foreign securities may have additional risks including exchange rate changes, potential for sharply devalued currencies and high inflation, political and economic upheaval, the relative lack of issuer information, relatively low market liquidity and the potential lack of strict financial and accounting controls and standards.
Securities for which market prices are not provided by any of the above methods may be valued based upon quotes furnished by independent sources. The last bid price may be used to value equity securities. The mean between the last bid and asked prices is used to value debt obligations, including corporate loans.
Securities for which market quotations are not readily available or became unreliable are valued at fair value as determined in good faith by or under the supervision of the Trust’s officers following procedures approved by the Board of Trustees. Issuer specific events, market trends, bid/ asked quotes of brokers and information providers and other market data may be reviewed in the course of making a good faith determination of a
15 INVESCO OPPENHEIMER V.I. INTERNATIONAL GROWTH FUND
NOTES TO FINANCIAL STATEMENTSContinued
security’s fair value.
The Fund may invest in securities that are subject to interest rate risk, meaning the risk that the prices will generally fall as interest rates rise and, conversely, the prices will generally rise as interest rates fall. Specific securities differ in their sensitivity to changes in interest rates depending on their individual characteristics. Changes in interest rates may result in increased market volatility, which may affect the value and/or liquidity of certain Fund investments.
Valuations change in response to many factors including the historical and prospective earnings of the issuer, the value of the issuer’s assets, general economic conditions, interest rates, investor perceptions and market liquidity. Because of the inherent uncertainties of valuation, the values reflected in the financial statements may materially differ from the value received upon actual sale of those investments.
| B. | | Securities Transactions and Investment Income -Securities transactions are accounted for on a trade date basis. Realized gains or losses on sales are computed on the basis of specific identification of the securities sold. Interest income (net of withholding tax, if any) is recorded on the accrual basis from settlement date. Dividend income (net of withholding tax, if any) is recorded on the ex-dividend date. |
The Fund may periodically participate in litigation related to Fund investments. As such, the Fund may receive proceeds from litigation settlements. Any proceeds received are included in the Statement of Operations as realized gain (loss) for investments no longer held and as unrealized gain (loss) for investments still held.
Brokerage commissions and mark ups are considered transaction costs and are recorded as an increase to the cost basis of securities purchased and/or a reduction of proceeds on a sale of securities. Such transaction costs are included in the determination of net realized and unrealized gain (loss) from investment transactions reported in the Statement of Operations and the Statement of Changes in Net Assets and the net realized and unrealized gains (losses) on securities per share in the Financial Highlights. Transaction costs are included in the calculation of the Fund’s net asset value and, accordingly, they reduce the Fund’s total returns. These transaction costs are not considered operating expenses and are not reflected in net investment income reported in the Statement of Operations and the Statement of Changes in Net Assets, or the net investment income per share and the ratios of expenses and net investment income reported in the Financial Highlights, nor are they limited by any expense limitation arrangements between the Fund and the investment adviser.
The Fund allocates income and realized and unrealized capital gains and losses to a class based on the relative net assets of each class.
| C. | | Country Determination- For the purposes of making investment selection decisions and presentation in the Schedule of Investments, the investment adviser may determine the country in which an issuer is located and/or credit risk exposure based on various factors. These factors include the laws of the country under which the issuer is organized, where the issuer maintains a principal office, the country in which the issuer derives 50% or more of its total revenues and the country that has the primary market for the issuer’s securities, as well as other criteria. Among the other criteria that may be evaluated for making this determination are the country in which the issuer maintains 50% or more of its assets, the type of security, financial guarantees and enhancements, the nature of the collateral and the sponsor organization. |
| D. | | Distributions -Dividends and distributions to shareholders, which are determined in accordance with income tax regulations and may differ from accounting principles generally accepted in the United States of America (“GAAP”), are recorded on the ex-dividend date. Income and capital gain distributions, if any, are declared and paid annually to separate accounts of participating insurance companies or at other times as determined necessary by the Adviser. |
| E. | | Federal Income Taxes -The Fund intends to comply with the requirements of Subchapter M of the Internal Revenue Code of 1986, as amended (the “Internal Revenue Code”), necessary to qualify as a regulated investment company and to distribute substantially all of the Fund’s taxable earnings to shareholders. As such, the Fund will not be subject to federal income taxes on otherwise taxable income (including net realized capital gain) that is distributed to shareholders. Therefore, no provision for federal income taxes is recorded in the financial statements. |
The Fund recognizes the tax benefits of uncertain tax positions only when the position is more likely than not to be sustained. Management has analyzed the Fund’s uncertain tax positions and concluded that no liability for unrecognized tax benefits should be recorded related to uncertain tax positions. Management is not aware of any tax positions for which it is reasonably possible that the total amounts of unrecognized tax benefits will change materially in the next 12 months.
The Fund files tax returns in the U.S. Federal jurisdiction and certain other jurisdictions. Generally, the Fund is subject to examinations by such taxing authorities for up to three years after the filing of the return for the tax period.
| F. | | Expenses -Fees provided for under the Rule 12b-1 plan of a particular class of the Fund are charged to the operations of such class. Transfer agency fees and expenses and other shareholder recordkeeping fees and expenses attributable to each share class based on relative net assets. Transfer agency fees and expenses and other shareholder recordkeeping fees and expenses relating to all other classes are allocated among those classes based on relative net assets. All other expenses are allocated among the classes based on relative net assets. |
| G. | | Accounting Estimates -The financial statements are prepared on a basis in conformity with GAAP, which requires management to make estimates and assumptions that affect the reported amounts of assets and liabilities at the date of the financial statements and the reported amounts of revenues and expenses during the reporting period including estimates and assumptions related to taxation. Actual results could differ from those estimates by a significant amount. In addition, the Fund monitors for material events or transactions that may occur or become known after the period-end date and before the date the financial statements are released to print. |
| H. | | Indemnifications -Under the Trust’s organizational documents, each Trustee, officer, employee or other agent of the Trust is indemnified against certain liabilities that may arise out of the performance of their duties to the Fund. Additionally, in the normal course of business, the Fund enters into contracts, including the Fund’s servicing agreements, that contain a variety of indemnification clauses. The Fund’s maximum exposure under these arrangements is unknown as this would involve future claims that may be made against the Fund that have not yet occurred. The risk of material loss as a result of such indemnification claims is considered remote. |
| I. | | Foreign Currency Translations -Foreign currency is valued at the close of the NYSE based on quotations posted by banks and major currency |
16 INVESCO OPPENHEIMER V.I. INTERNATIONAL GROWTH FUND
| | dealers. Portfolio securities and other assets and liabilities denominated in foreign currencies are translated into U.S. dollar amounts at the date of valuation. Purchases and sales of portfolio securities (net of foreign taxes withheld on disposition) and income items denominated in foreign currencies are translated into U.S. dollar amounts on the respective dates of such transactions. The Fund does not separately account for the portion of the results of operations resulting from changes in foreign exchange rates on investments and the fluctuations arising from changes in market prices of securities held. The combined results of changes in foreign exchange rates and the fluctuation of market prices on investments (net of estimated foreign tax withholding) are included with the net realized and unrealized gain or loss from investments in the Statement of Operations. Reported net realized foreign currency gains or losses arise from (1) sales of foreign currencies, (2) currency gains or losses realized between the trade and settlement dates on securities transactions, and (3) the difference between the amounts of dividends, interest, and foreign withholding taxes recorded on the Fund’s books and the U.S. dollar equivalent of the amounts actually received or paid. Net unrealized foreign currency gains and losses arise from changes in the fair values of assets and liabilities, other than investments in securities at fiscal period end, resulting from changes in exchange rates. The Fund may invest in foreign securities, which may be subject to foreign taxes on income, gains on investments or currency repatriation, a portion of which may be recoverable. Foreign taxes, if any, are recorded based on the tax regulations and rates that exist in the foreign markets in which the Fund invests and are shown in the Statement of Operations. |
| J. | | Forward Foreign Currency Contracts - The Fund may engage in foreign currency transactions either on a spot (i.e. for prompt delivery and settlement) basis, or through forward foreign currency contracts, to manage or minimize currency or exchange rate risk. |
The Fund may also enter into forward foreign currency contracts for the purchase or sale of a security denominated in a foreign currency in order to “lock in” the U.S. dollar price of that security, or the Fund may also enter into forward foreign currency contracts that do not provide for physical settlement of the two currencies, but instead are settled by a single cash payment calculated as the difference between the agreed upon exchange rate and the spot rate at settlement based upon an agreed upon notional amount (non-deliverable forwards). The Fund will set aside liquid assets in an amount equal to the daily mark-to-market obligation for forward foreign currency contracts.
A forward foreign currency contract is an obligation between two parties (“Counterparties”) to purchase or sell a specific currency for an agreed-upon price at a future date. The use of forward foreign currency contracts does not eliminate fluctuations in the price of the underlying securities the Fund owns or intends to acquire but establishes a rate of exchange in advance. Fluctuations in the value of these contracts are measured by the difference in the contract date and reporting date exchange rates and are recorded as unrealized appreciation (depreciation) until the contracts are closed. When the contracts are closed, realized gains (losses) are recorded. Realized and unrealized gains (losses) on the contracts are included in the Statement of Operations. The primary risks associated with forward foreign currency contracts include failure of the Counterparty to meet the terms of the contract and the value of the foreign currency changing unfavorably. These risks may be in excess of the amounts reflected in the Statement of Assets and Liabilities.
Note 2 – Advisory Fees and Other Fees Paid Affiliates
The Trust has entered into a master investment advisory agreement with Invesco Advisers, Inc. (the “Adviser” or “Invesco”). Under the terms of the investment advisory agreement, the Fund accrues daily and pays monthly an advisory fee to the Adviser based on the annual rate of the Fund’s average daily net assets as follows:
| | | | |
| Fee Schedule* | |
| Up to $250 million | | | 1.00 | % |
| Next $250 million | | | 0.90 | |
| Next $500 million | | | 0.85 | |
| Over $1 billion | | | 0.82 | |
* The advisory fee paid by the Fund shall be reduced by any amounts paid by the Fund under the administrative services agreement with the Adviser.
For year ended December 31, 2019, the effective advisory fees incurred by the Fund was 0.95%.
From the beginning of the fiscal period until the date of the Reorganization, the Acquired Fund paid $1,842,903 in advisory fees to OFI Global Asset Management, Inc. based on the annual rates above of the Acquired Fund’s average daily net assets.
Under the terms of a master sub-advisory agreement between the Adviser and each of Invesco Asset Management Deutschland GmbH, Invesco Asset Management Limited, Invesco Asset Management (Japan) Limited, Invesco Hong Kong Limited, Invesco Senior Secured Management, Inc. and Invesco Canada Ltd. and separate sub-advisory agreements with Invesco Capital Management LLC, and Invesco Asset Management (India) Private Limited (collectively, the “Affiliated Sub-Advisers”) the Adviser, not the Fund, will pay 40% of the fees paid to the Adviser to any such Affiliated Sub-Adviser(s) that provide(s) discretionary investment management services to the Fund based on the percentage of assets allocated to such Affiliated Sub-Adviser(s). Invesco has also entered into a Sub-Advisory Agreement with OppenheimerFunds, Inc. to provide discretionary management services to the Funds.
Effective on the Reorganization Date, the Adviser has contractually agreed, through May 31, 2021, to waive advisory fees and/or reimburse expenses of all shares to the extent necessary to limit the total annual fund operating expenses after fee waiver and/or expense reimbursement (excluding certain items discussed below) of Series I and Series II shares to 1.00% and 1.25%, respectively, of the Fund’s average daily net assets (the “expense limits”). In determining the Adviser’s obligation to waive advisory fees and/or reimburse expenses, the following expenses are not taken into account, and could cause total annual fund operating expenses after fee waivers and/or expense reimbursement to exceed the numbers reflected above: (1) interest; (2) taxes; (3) dividend expenses on short sales; (4) extraordinary or non-routine items, including litigation expenses; and (5) expenses that the Fund has incurred but did not actually pay because of an expense offset arrangement. Unless Invesco continues the fee waiver agreement, it will terminate on May 31, 2021. During its term, the fee waiver agreement cannot be terminated or amended to increase the expense limits or reduce the advisory fee waiver without approval of the Board of Trustees.
17 INVESCO OPPENHEIMER V.I. INTERNATIONAL GROWTH FUND
NOTES TO FINANCIAL STATEMENTSContinued
Further, the Adviser has contractually agreed, through at least June 30, 2021, to waive the advisory fee payable by the Fund in an amount equal to 100% of the net advisory fees the Adviser receives from the affiliated money market funds on investments by the Fund of uninvested cash in such affiliated money market funds.
For the year ended December 31, 2019, the Adviser waived advisory fees of $14,545 and reimbursed Fund expenses of $289,293 and $297,584 for Series I and Series II shares, respectively.
Prior to the Reorganization, OFI Global Asset Management, Inc. had contractually agreed to waive fees and/or reimburse expenses of Non-Service and Service shares to 1.00% and 1.25%, respectively, of the Acquired Fund’s average daily net assets.
The Trust has entered into a master administrative services agreement with Invesco pursuant to which the Fund has agreed to pay Invesco a fee for costs incurred in providing accounting services and fund administrative services to the Fund and to reimburse Invesco for fees paid to insurance companies that have agreed to provide certain administrative services to the Fund. These administrative services provided by the insurance companies may include, among other things: maintenance of master accounts with the Fund; tracking, recording and transmitting net purchase and redemption orders for Fund shares; maintaining and preserving records related to the purchase, redemption and other account activity of variable product owners; distributing copies of Fund documents such as prospectuses, proxy materials and periodic reports, to variable product owners, and responding to inquiries from variable product owners about the Fund. Pursuant to such agreement, for the year ended December 31, 2019, Invesco was paid $38,221 for accounting and fund administrative services and was reimbursed $407,978 for fees paid to insurance companies. Additionally, Invesco has entered into service agreements whereby JPMorgan Chase Bank serves as custodian to the Fund. Prior to the Reorganization, the Acquired Fund paid administrative fees to OFI Global Asset Management, Inc.
The Trust has entered into a transfer agency and service agreement with Invesco Investment Services, Inc. (“IIS”) pursuant to which the Fund has agreed to pay IIS a fee for providing transfer agency and shareholder services to the Fund and reimburse IIS for certain expenses incurred by IIS in the course of providing such services. Prior to the Reorganization, the Acquired Fund paid transfer agent fees to OFI Global Asset Management, Inc. and Shareholder Services, Inc. For the year ended December 31, 2019, expenses incurred under these agreements are shown in the Statement of Operations as Transfer and shareholder servicing agent fees.
The Trust has entered into master distribution agreements with Invesco Distributors, Inc. (“IDI”) to serve as the distributor for the Series II shares of the Fund. The Trust has adopted a plan pursuant to Rule 12b-1 under the 1940 Act with respect to the Fund’s Series II shares (the “Plan”). The Fund, pursuant to the Plan, pays IDI at an annual rate of 0.25% of the average daily net assets of Series II shares. The fees are accrued daily and paid monthly. Of the Plan payments, up to 0.25% of the average daily net assets of the class of shares may be paid to insurance companies who furnish continuing personal shareholder services to customers who purchase and own shares of such class. Any amounts not paid as a service fee under the Plan would constitute an asset-based sales charge. Rules of the Financial Industry Regulatory Authority (“FINRA”) impose a cap on the total sales charges, including asset-based sales charges, that may be paid by any class of shares of the Fund plans. Prior to the Reorganization, the Acquired Fund paid distribution fees to OppenheimerFunds Distributor, Inc. For the year ended December 31, 2019, expenses incurred under the plans are shown in the Statement of Operations as Distribution and service plan fees.
Certain officers and trustees of the Trust are officers and directors of the Adviser, IIS and/or IDI.
Note 3 – Additional Valuation Information
GAAP defines fair value as the price that would be received to sell an asset or paid to transfer a liability in an orderly transaction between market participants at the measurement date, under current market conditions. GAAP establishes a hierarchy that prioritizes the inputs to valuation methods, giving the highest priority to readily available unadjusted quoted prices in an active market for identical assets (Level 1) and the lowest priority to significant unobservable inputs (Level 3), generally when market prices are not readily available or are unreliable. Based on the valuation inputs, the securities or other investments are tiered into one of three levels. Changes in valuation methods may result in transfers in or out of an investment’s assigned level:
Level 1 — Prices are determined using quoted prices in an active market for identical assets.
Level 2 — Prices are determined using other significant observable inputs. Observable inputs are inputs that other market participants may use in pricing a security. These may include quoted prices for similar securities, interest rates, prepayment speeds, credit risk, yield curves, loss severities, default rates, discount rates, volatilities and others.
Level 3 — Prices are determined using significant unobservable inputs. In situations where quoted prices or observable inputs are unavailable (for example, when there is little or no market activity for an investment at the end of the period), unobservable inputs may be used. Unobservable inputs reflect the Fund’s own assumptions about the factors market participants would use in determining fair value of the securities or instruments and would be based on the best available information.
The following is a summary of the tiered valuation input levels, as of December 31, 2019. The level assigned to the securities valuations may not be an indication of the risk or liquidity associated with investing in those securities. Because of the inherent uncertainties of valuation, the values reflected in the financial statements may materially differ from the value received upon actual sale of those investments.
18 INVESCO OPPENHEIMER V.I. INTERNATIONAL GROWTH FUND
| | | | | | | | | | | | | | | | |
| | | Level 1— Unadjusted
Quoted Prices | | | Level 2— Other Significant
Observable Inputs | | | Level 3— Significant
Unobservable
Inputs | | | Value | |
| Assets Table | | | | | | | | | | | | | | | | |
| Investments, at Value: | | | | | | | | | | | | | | | | |
| Common Stocks | | | | | | | | | | | | | | | | |
Consumer Discretionary | | $ | 14,525,366 | | | $ | 60,848,236 | | | $ | — | | | $ | 75,373,602 | |
Consumer Staples | | | 13,603,748 | | | | 35,990,162 | | | | — | | | | 49,593,910 | |
Energy | | | — | | | | 4,273,790 | | | | — | | | | 4,273,790 | |
Financials | | | 9,362,198 | | | | 12,318,976 | | | | — | | | | 21,681,174 | |
Health Care | | | 14,880,839 | | | | 74,035,492 | | | | — | | | | 88,916,331 | |
Industrials | | | — | | | | 86,218,304 | | | | — | | | | 86,218,304 | |
Information Technology | | | 10,017,598 | | | | 113,274,762 | | | | — | | | | 123,292,360 | |
Materials | | | 6,443,840 | | | | 11,759,456 | | | | — | | | | 18,203,296 | |
| Preferred Stock | | | 45,693 | | | | — | | | | — | | | | 45,693 | |
| Investment Company | | | 6,357,038 | | | | — | | | | — | | | | 6,357,038 | |
| | | | |
| Total Assets | | $ | 75,236,320 | | | $ | 398,719,178 | | | $ | — | | | $ | 473,955,498 | |
| | | | |
Note 4 - Security Transactions with Affiliated Funds
The Fund is permitted to purchase or sell securities from or to certain other Invesco Funds under specified conditions outlined in procedures adopted by the Board of Trustees of the Trust. The procedures have been designed to ensure that any purchase or sale of securities by the Fund from or to another fund or portfolio that is or could be considered an affiliate by virtue of having a common investment adviser (or affiliated investment advisers), common Trustees and/or common officers complies with Rule 17a-7 of the 1940 Act. Further, as defined under the procedures, each transaction is effected at the current market price. Pursuant to these procedures for the period January 1, 2019 to May 24, 2019, the Predecessor Fund did not engage in transactions with affiliates. For the period May 25, 2019 to December 31, 2019, the Fund engaged in transactions with affiliates as listed: Securities sales of $462,678, which resulted in net realized gains of $99,172.
Note 5 – Expense Offset Arrangement
The expense offset arrangement is comprised of custodian credits which result from periodic overnight cash balances at the custodian. For the year ended December 31, 2019, the Fund received credits from this arrangement, which resulted in the reduction of the Fund’s total expenses of $3,799.
Note 6 – Trustee and Officer Fees and Benefits
Certain Trustees have executed Deferred Compensation Agreement(s) pursuant to which they have the option to elect to defer receipt of all or a portion of the annual compensation they are entitled to receive from the Fund. For purposes of determining the amount owed to the Trustees under the plan(s), deferred amounts are treated as though equal dollar amounts had been invested in shares of the Fund or in other Invesco and/or Invesco Oppenheimer funds selected by the Trustees. The Fund purchases shares of the funds selected for deferral by the Trustees in amounts equal to his or her deemed investment, resulting in a Fund asset equal to the deferred compensation liability. Such assets are included as a component of “Other” within the asset section of the Statement of Assets and Liabilities. Deferral of Trustees’ fees under the plan(s) will not affect the net assets of the Fund and will not materially affect the Fund’s assets, liabilities or net investment income per share. Amounts will be deferred until distributed in accordance with the Deferred Compensation Agreement(s).
Note 7 – Cash Balances
The Fund is permitted to temporarily carry a negative or overdrawn balance in its account with JPMorgan Chase Bank, the custodian bank. Such balances, if any at period-end, are shown in the Statement of Assets and Liabilities under the payable caption Amount due custodian. To compensate the custodian bank for such overdrafts, the overdrawn Fund may either (1) leave funds as a compensating balance in the account so the custodian bank can be compensated by earning the additional interest; or (2) compensate by paying the custodian bank at a rate agreed upon by the custodian bank and Invesco, not to exceed the contractually agreed upon rate.
Note 8 – Distributions to Shareholders and Tax Components of Net Assets
Tax Character of Distributions to Shareholders Paid During the Fiscal Years Ended December 31, 2019 and 2018:
| | | | | | | | |
| | | 2019 | | | 2018 | |
| Ordinary income | | $ | 3,888,153 | | | $ | 4,584,335 | |
| Long-term capital gain | | | 22,293,743 | | | | 10,240,439 | |
| | | | |
| Total distributions | | $ | 26,181,896 | | | $ | 14,824,774 | |
| | | | |
19 INVESCO OPPENHEIMER V.I. INTERNATIONAL GROWTH FUND
NOTES TO FINANCIAL STATEMENTSContinued
Tax Components of Net Assets at Period-End:
| | | | |
| | | 2019 | |
| Undistributed ordinary income | | $ | 3,426,302 | |
| Undistributed long-term gain | | | 5,721,350 | |
| Net unrealized appreciation - investments | | | 193,990,259 | |
| Temporary book/tax differences | | | (42,902) | |
| Shares of beneficial interest | | | 271,602,242 | |
| | | | |
| Total net assets | | $ | 474,697,251 | |
| | | | |
The difference between book-basis and tax-basis unrealized appreciation (depreciation) is due to differences in the timing of recognition of gains and losses on investments for tax and book purposes. The Fund’s net unrealized appreciation (depreciation) difference is attributable primarily to wash sales.
The temporary book/tax differences are a result of timing differences between book and tax recognition of income and/or expenses. The Fund’s temporary book/tax differences are the result of the trustee deferral of compensation and retirement plan benefits.
Capital loss carryforward is calculated and reported as of a specific date. Results of transactions and other activity after that date may affect the amount of capital loss carryforward actually available for the Fund to utilize. Capital losses generated in years beginning after December 22, 2010 can be carried forward for an unlimited period, whereas previous losses expire in eight tax years. Capital losses with an expiration period may not be used to offset capital gains until all net capital losses without an expiration date have been utilized. Capital loss carryforwards with no expiration date will retain their character as either short-term or long-term capital losses instead of as short-term capital losses as under prior law. The ability to utilize capital loss carryforwards in the future may be limited under the Internal Revenue Code and related regulations based on the results of future transactions.
The Fund has no capital loss carryforward as of December 31, 2019.
Note 9 – Investments Transactions
The aggregate amount of investment securities (other than short-term securities, U.S. Treasury obligations and money market funds, if any) purchased and sold by the Fund during the year ended December 31, 2019 was $230,941,190 and $321,641,609, respectively. Cost of investments, including any derivatives, on a tax basis includes the adjustments for financial reporting purposes as of the most recently completed federal income tax reporting period-end.
| | | | |
| Unrealized Appreciation (Depreciation) of Investments on a Tax Basis | |
| Aggregate unrealized appreciation of investments | | $ | 207,090,901 | |
| Aggregate unrealized (depreciation) of investments | | | (12,781,042) | |
| | | | |
| Net unrealized appreciation of investments | | $ | 194,309,859 | |
| | | | |
Cost of investments for tax purposes is $279,411,051.
Note 10 – Reclassification of Permanent Differences
Primarily as a result of differing book/tax treatment of corporate actions, on December 31, 2019, undistributed net investment income (loss) was increased by $1,734,811 and undistributed net realized gain (loss) was decreased by $1,734,811. This reclassification had no effect on the net assets of the Fund.
Note 11- Share Information
Transactions in shares of beneficial interest were as follows:
| | | | | | | | | | | | | | | | |
| | | Year Ended December 31, 20191 | | Year Ended December 31, 2018 |
| | | | |
| | | Shares | | Amount | | Shares | | Amount |
| Series I Shares | | | | | | | | | | | | | | | | |
| Sold | | | 8,881,295 | | | $ | 19,659,846 | | | | 21,532,426 | | | $ | 51,243,851 | |
| Dividends and/or distributions reinvested | | | 6,179,988 | | | | 13,472,374 | | | | 3,639,212 | | | | 9,134,490 | |
| Redeemed | | | (55,770,549 | ) | | | (128,406,251 | ) | | | (32,856,876 | ) | | | (81,194,225 | ) |
| | | | |
| Net increase (decrease) | | | (40,709,266 | ) | | $ | (95,274,031 | ) | | | (7,685,238 | ) | | $ | (20,815,884 | ) |
| | | | |
| | | | | | | | | | | | | | | | | |
| Series II Shares | | | | | | | | | | | | | | | | |
| Sold | | | 13,275,646 | | | $ | 30,754,894 | | | | 19,920,360 | | | $ | 51,115,122 | |
| Dividends and/or distributions reinvested | | | 5,574,352 | | | | 12,709,522 | | | | 2,171,864 | | | | 5,690,284 | |
| Redeemed | | | (14,188,919 | ) | | | (33,378,126 | ) | | | (16,510,354 | ) | | | (43,058,652 | ) |
| | | | |
| Net increase (decrease) | | | 4,661,079 | | | $ | 10,086,290 | | | | 5,581,870 | | | $ | 13,746,754 | |
| | | | |
1. There are entities that are record owners of more than 5% of the outstanding shares of the Fund and own 34% of the outstanding shares of the Fund. The Fund and the Fund’s principal underwriter or adviser, are parties to participation agreements with these entities whereby these entities sell units of interest in separate accounts funding variable products that are invested
20 INVESCO OPPENHEIMER V.I. INTERNATIONAL GROWTH FUND
in the Fund. The Fund, Invesco and/or Invesco affiliates may make payments to these entities, which are considered to be related to the Fund, for providing services to the Fund, Invesco and/or Invesco affiliates, including, but not limited to services such as securities brokerage, distribution, third party record keeping and account servicing. The Fund has no knowledge as to whether all or any portion of the shares owned of record by these entities are also owned beneficially.
Note 12 - Borrowings
Joint Credit Facility.A number of mutual funds managed by the Adviser participate in a $1.95 billion revolving credit facility (the “Facility”) intended to provide short-term financing, if necessary, subject to certain restrictions in connection with atypical redemption activity. Expenses and fees related to the Facility are paid by the participating funds and are disclosed separately or as other expenses on the Statement of Operations. The Fund did not utilize the Facility during the reporting period. The Facility terminated May 24, 2019.
21 INVESCO OPPENHEIMER V.I. INTERNATIONAL GROWTH FUND
REPORT OF INDEPENDENT REGISTERED PUBLIC ACCOUNTING FIRM
To the Board of Trustees of AIM Variable Insurance Funds (Invesco Variable Insurance Funds) and Shareholders of Invesco Oppenheimer V.I. International Growth Fund
Opinion on the Financial Statements
We have audited the accompanying statement of assets and liabilities, including the schedule of investments, of Invesco Oppenheimer V.I. International Growth Fund (one of the funds constituting AIM Variable Insurance Funds (Invesco Variable Insurance Funds), referred to hereafter as the “Fund”) as of December 31, 2019, the related statements of operations and of changes in net assets for the year ended December 31, 2019, including the related notes, and the financial highlights for the period ended December 31, 2019 (collectively referred to as the “financial statements”). In our opinion, the financial statements present fairly, in all material respects, the financial position of the Fund as of December 31, 2019, the results of its operations and changes in its net assets for the year ended December 31, 2019 and the financial highlights for the period ended December 31, 2019 in conformity with accounting principles generally accepted in the United States of America.
The financial statements of Invesco Oppenheimer V.I. International Growth Fund (formerly known as Oppenheimer International Growth Fund/VA) as of and for the year ended December 31, 2018 and the financial highlights for each of the periods ended on or prior to December 31, 2018 (not presented herein, other than the statement of changes in net assets and the financial highlights) were audited by other auditors whose report dated February 14, 2019 expressed an unqualified opinion on those financial statements and financial highlights.
Basis for Opinion
These financial statements are the responsibility of the Fund’s management. Our responsibility is to express an opinion on the Fund’s financial statements based on our audit. We are a public accounting firm registered with the Public Company Accounting Oversight Board (United States) (PCAOB) and are required to be independent with respect to the Fund in accordance with the U.S. federal securities laws and the applicable rules and regulations of the Securities and Exchange Commission and the PCAOB.
We conducted our audit of these financial statements in accordance with the standards of the PCAOB. Those standards require that we plan and perform the audit to obtain reasonable assurance about whether the financial statements are free of material misstatement, whether due to error or fraud.
Our audit included performing procedures to assess the risks of material misstatement of the financial statements, whether due to error or fraud, and performing procedures that respond to those risks. Such procedures included examining, on a test basis, evidence regarding the amounts and disclosures in the financial statements. Our audit also included evaluating the accounting principles used and significant estimates made by management, as well as evaluating the overall presentation of the financial statements. Our procedures included confirmation of securities owned as of December 31, 2019 by correspondence with the custodian and transfer agent. We believe that our audit provides a reasonable basis for our opinion.
/s/PricewaterhouseCoopers LLP
Houston, Texas
February 18, 2020
We have served as the auditor of one or more of the investment companies in the Invesco group of investment companies since at least 1995. We have not been able to determine the specific year we began serving as auditor.
22 INVESCO OPPENHEIMER V.I. INTERNATIONAL GROWTH FUND
TAX INFORMATION
Form 1099-DIV, Form 1042-S and other year–end tax information provide shareholders with actual calendar year amounts that should be included in their tax returns. Shareholders should consult their tax advisers.
The following distribution information is being provided as required by the Internal Revenue Code or to meet a specific state’s requirement.
The Fund designates the following amounts or, if subsequently determined to be different, the maximum amount allowable for its fiscal year ended December 31, 2019:
Federal and State Income Tax
| | | | |
| Long-Term Capital Gain Distributions | | $ | 22,293,743 | |
| Corporate Dividends Received Deduction* | | | 0.01 | % |
* The above percentages are based on ordinary income dividends paid to shareholders during the Fund’s fiscal year.
23 INVESCO OPPENHEIMER V.I. INTERNATIONAL GROWTH FUND
PORTFOLIO PROXY VOTING POLICIES AND GUIDELINES; UPDATES TO SCHEDULE OF INVESTMENTS
Go paperless with eDelivery
Visit invesco.com/edelivery to enjoy the convenience and security of anytime electronic access to your investment documents.
With eDelivery, you can elect to have any or all of the following materials delivered straight to your inbox to download, save and print from your own computer:
| · | | Fund reports and prospectuses |
Invesco mailing information
Send general correspondence to Invesco Investment Services, Inc., P.O. Box 219078, Kansas City, MO 64121-9078.
Important notice regarding delivery of security holder documents
To reduce Fund expenses, only one copy of most shareholder documents may be mailed to shareholders with multiple accounts at the same address (Householding). Mailing of your shareholder documents may be householded indefinitely unless you instruct us otherwise. If you do not want the mailing of these documents to be combined with those for other members of your household, please contact Invesco Investment Services, Inc. at 800 959 4246 or contact your financial institution. We will begin sending you individual copies for each account within 30 days after receiving your request.
Fund holdings and proxy voting information
The Fund provides a complete list of its holdings four times in each fiscal year, at the quarter ends. For the second and fourth quarters, the lists appear in the Fund’s semiannual and annual reports to shareholders. For the first and third quarters, the Fund files the lists with the Securities and Exchange Commission (SEC) as an exhibit to its reports on Form N-PORT. The most recent list of portfolio holdings is available at invesco.com/completeqtrholdings. Shareholders can also look up the Fund’s Forms N-PORT on the SEC website at sec.gov.
A description of the policies and procedures that the Fund uses to determine how to vote proxies relating to portfolio securities is available without charge, upon request, from our Client Services department at 800 959 4246 or at invesco.com/proxyguidelines. The information is also available on the SEC website, sec.gov.
Information regarding how the Fund voted proxies related to its portfolio securities during the most recent 12-month period ended June 30 is available at invesco. com/proxysearch. The information is also available on the SEC website, sec.gov.
Invesco Advisers, Inc. is an investment adviser; it provides investment advisory services to individual and institutional clients and does not sell securities. Invesco Distributors, Inc. is the US distributor for Invesco Ltd.’s retail mutual funds, exchange-traded funds and institutional money market funds. Both are wholly owned, indirect subsidiaries of Invesco Ltd.
24 INVESCO OPPENHEIMER V.I. INTERNATIONAL GROWTH FUND
TRUSTEES AND OFFICERS
The address of each trustee and officer is AIM Variable Insurance Funds (Invesco Variable Insurance Funds) (the “Trust”), 11 Greenway Plaza, Suite 1000, Houston, Texas 77046-1173. The trustees serve for the life of the Trust, subject to their earlier death, incapacitation, resignation, retirement or removal as more specifically provided in the Trust’s organizational documents. Each officer serves for a one year term or until their successors are elected and qualified. Column two below includes length of time served with predecessor entities, if any.
| | | | | | | | |
| | | | | |
Name, Year of Birth and Position(s) Held with the Trust | | Trustee and/or Officer Since | | Principal Occupation(s) During Past 5 Years | | Number of Funds in Fund Complex
Overseen by Trustee | | Other Directorship(s) Held by Trustee During Past
5 Years |
INTERESTED PERSON | | | | | | | | |
| | | | | |
Martin L. Flanagan 1– 1960 Trustee and Vice Chair | | 2007 | | Executive Director, Chief Executive Officer and President, Invesco Ltd. (ultimate parent of Invesco and a global investment management firm); Trustee and Vice Chair, The Invesco Funds; Vice Chair, Investment Company Institute; and Member of Executive Board, SMU Cox School of Business Formerly: Advisor to the Board, Invesco Advisers, Inc. (formerly known as Invesco Institutional (N.A.), Inc.); Chairman and Chief Executive Officer, Invesco Advisers, Inc. (registered investment adviser); Director, Chairman, Chief Executive Officer and President, Invesco Holding Company (US), Inc. (formerly IVZ Inc.) (holding company), Invesco Group Services, Inc. (service provider) and Invesco North American Holdings, Inc. (holding company); Director, Chief Executive Officer and President, Invesco Holding Company Limited (parent of Invesco and a global investment management firm); Director, Invesco Ltd.; Chairman, Investment Company Institute and President,Co-Chief Executive Officer,Co-President, Chief Operating Officer and Chief Financial Officer, Franklin Resources, Inc. (global investment management organization) | | 229 | | None |
| |
| 1 Mr. Flanagan is considered an interested person (within the meaning of Section 2(a)(19) of the 1940 Act) of the Trust because he is an officer of the Adviser to the Trust, and an officer and a director of Invesco Ltd., ultimate parent of the Adviser. |
25 INVESCO OPPENHEIMER V.I. INTERNATIONAL GROWTH FUND
TRUSTEES AND OFFICERS Continued
| | | | | | | | |
| | | | | |
Name, Year of Birth and Position(s) Held with the Trust | | Trustee and/or Officer Since | | Principal Occupation(s) During Past 5 Years | | Number of Funds in Fund Complex
Overseen by Trustee | | Other Directorship(s) Held by Trustee During Past
5 Years |
INDEPENDENT TRUSTEES | | | | | | | | |
| | | | | |
Bruce L. Crockett – 1944 Trustee and Chair | | 2003 | | Chairman, Crockett Technologies Associates (technology consulting company) Formerly: Director, Captaris (unified messaging provider); Director, President and Chief Executive Officer, COMSAT Corporation; Chairman, Board of Governors of INTELSAT (international communications company); ACE Limited (insurance company); Independent Directors Council and Investment Company Institute: Member of the Audit Committee, Investment Company Institute; Member of the Executive Committee and Chair of the Governance Committee, Independent Directors Council | | 229 | | Director and Chairman of the Audit Committee, ALPS (Attorneys Liability Protection Society) (insurance company); Director and Member of the Audit Committee and Compensation Committee, Ferroglobe PLC (metallurgical company) |
| | | | | |
David C. Arch – 1945 Trustee | | 2010 | | Chairman of Blistex Inc. (consumer health care products manufacturer); Member, World Presidents’ Organization | | 229 | | Board member of the Illinois Manufacturers’ Association |
| | | | | |
Beth Ann Brown – 1968 Trustee | | 2019 | | Independent Consultant Formerly: Head of Intermediary Distribution, Managing Director, Strategic Relations, Managing Director, Head of National Accounts, Senior Vice President, National Account Manager and Senior Vice President, Key Account Manager, Columbia Management Investment Advisers LLC; Vice President, Key Account Manager, Liberty Funds Distributor, Inc.; and Trustee of certain Oppenheimer Funds | | 229 | | Director, Board of Directors of Caron Engineering Inc.; Advisor, Board of Advisors of Caron Engineering Inc.; President and Director, of Acton Shapleigh Youth Conservation Corps (non-profit); and Vice President and Director of Grahamtastic Connection (non-profit) |
| | | | | |
Jack M. Fields – 1952 Trustee | | 2003 | | Chief Executive Officer, Twenty First Century Group, Inc. (government affairs company); and Chairman, Discovery Learning Alliance(non-profit) Formerly: Owner and Chief Executive Officer, Dos Angeles Ranch L.P. (cattle, hunting, corporate entertainment); Director, Insperity, Inc. (formerly known as Administaff) (human resources provider); Chief Executive Officer, Texana Timber LP (sustainable forestry company); Director of Cross Timbers Quail Research Ranch(non-profit); and member of the U.S. House of Representatives | | 229 | | None |
| | | | | |
Cynthia Hostetler – 1962 Trustee | | 2017 | | Non-Executive Director and Trustee of a number of public and private business corporations Formerly: Director, Aberdeen Investment Funds (4 portfolios); Head of Investment Funds and Private Equity, Overseas Private Investment Corporation; President, First Manhattan Bancorporation, Inc.; Attorney, Simpson Thacher & Bartlett LLP | | 229 | | Vulcan Materials Company (construction materials company); Trilinc Global Impact Fund; Genesee & Wyoming, Inc. (railroads); Artio Global Investment LLC (mutual fund complex); Edgen Group, Inc. (specialized energy and infrastructure products distributor); Investment Company Institute (professional organization); Independent Directors Council (professional organization) |
| | | | | |
Eli Jones – 1961 Trustee | | 2016 | | Professor and Dean, Mays Business School - Texas A&M University Formerly: Professor and Dean, Walton College of Business, University of Arkansas and E.J. Ourso College of Business, Louisiana State University; Director, Arvest Bank | | 229 | | Insperity, Inc. (formerly known as Administaff) (human resources provider) |
| | | | | |
Elizabeth Krentzman – 1959 Trustee | | 2019 | | Formerly: Principal and Chief Regulatory Advisor for Asset Management Services and U.S. Mutual Fund Leader of Deloitte & Touche LLP; General Counsel of the Investment Company Institute (trade association); National Director of the Investment Management Regulatory Consulting Practice, Principal, Director and Senior Manager of Deloitte & Touche LLP; Assistant Director of the Division of Investment Management – Office of Disclosure and Investment Adviser Regulation of the U.S. Securities and Exchange Commission and various positions with the Division of Investment Management – Office of Regulatory Policy of the U.S. Securities and Exchange Commission; Associate at Ropes & Gray LLP.; Advisory Board Member of the Securities and Exchange Commission Historical Society; and Trustee of certain Oppenheimer Funds | | 229 | | Trustee of the University of Florida National Board Foundation and Audit Committee Member; Member of the Cartica Funds Board of Directors (private investment funds); Member of the University of Florida Law Center Association, Inc. Board of Trustees and Audit Committee Member |
| | | | | |
Anthony J. LaCava, Jr. – 1956 Trustee | | 2019 | | Formerly: Director and Member of the Audit Committee, Blue Hills Bank (publicly traded financial institution) and Managing Partner, KPMG LLP | | 229* | | Blue Hills Bank; Chairman of Bentley University; Member, Business School Advisory Council; and Nominating Committee, KPMG LLP |
26 INVESCO OPPENHEIMER V.I. INTERNATIONAL GROWTH FUND
| | | | | | | | |
| | | | | |
Name, Year of Birth and Position(s) Held with the Trust | | Trustee and/or Officer Since | | Principal Occupation(s) During Past 5 Years | | Number of Funds in Fund Complex
Overseen by Trustee | | Other Directorship(s) Held by Trustee During Past
5 Years |
INDEPENDENT TRUSTEES (CONTINUED) | | | | | | | | |
| | | | | |
Prema Mathai-Davis – 1950 Trustee | | 2003 | | Retired Co-Owner & Partner of Quantalytics Research, LLC, (a FinTech Investment Research Platform for the Self-Directed Investor) | | 229 | | None |
| | | | | |
Joel W. Motley – 1952 Trustee | | 2019 | | Director of Office of Finance, Federal Home Loan Bank; Member of the Vestry of Trinity Wall Street; Managing Director of Carmona Motley Hoffman, Inc. (privately held financial advisor); Member of the Finance and Budget Committee of the Council on Foreign Relations, Member of the Investment Committee and Board of Human Rights Watch and Member of the Investment Committee and Board of Historic Hudson Valley(non-profit cultural organization). Formerly: Managing Director of Public Capital Advisors, LLC (privately held financial advisor); Managing Director of Carmona Motley Hoffman, Inc. (privately held financial advisor); Trustee of certain Oppenheimer Funds; and Director of Columbia Equity Financial Corp. (privately held financial advisor) | | 229 | | Director of Greenwall Foundation (bioethics research foundation); Member of Board and Investment Committee of The Greenwall Foundation; Director of Southern Africa Legal Services Foundation; Board Member and Investment Committee Member of Pulitzer Center for Crisis Reporting(non-profit journalism) |
| | | | | |
Teresa M. Ressel – 1962 Trustee | | 2017 | | Non-executive director and trustee of a number of public and private business corporations Formerly: Chief Financial Officer, Olayan America, The Olayan Group (international investor/commercial/industrial); Chief Executive Officer, UBS Securities LLC; Group Chief Operating Officer, Americas, UBS AG; Assistant Secretary for Management & Budget and CFO, US Department of the Treasury | | 229 | | Atlantic Power Corporation (power generation company); ON Semiconductor Corp. (semiconductor supplier) |
| | | | | |
Ann Barnett Stern – 1957 Trustee | | 2017 | | President and Chief Executive Officer, Houston Endowment Inc. (private philanthropic institution) Formerly: Executive Vice President and General Counsel, Texas Children’s Hospital; Attorney, Beck, Redden and Secrest, LLP; Business Law Instructor, University of St. Thomas; Attorney, Andrews & Kurth LLP | | 229 | | Federal Reserve Bank of Dallas |
| | | | | |
Robert C. Troccoli – 1949 Trustee | | 2016 | | Retired Formerly: Adjunct Professor, University of Denver – Daniels College of Business, Senior Partner, KPMG LLP | | 229 | | None |
| | | | | |
Daniel S. Vandivort – 1954 Trustee | | 2019 | | Treasurer, Chairman of the Audit and Finance Committee, and Trustee, Board of Trustees, Huntington Disease Foundation of America; and President, Flyway Advisory Services LLC (consulting and property management). Formerly: Trustee and Governance Chair, of certain Oppenheimer Funds | | 229 | | Chairman and Lead Independent Director, Chairman of the Audit Committee, and Director, Board of Directors, Value Line Funds |
| | | | | |
James D. Vaughn – 1945 Trustee | | 2019 | | Retired Formerly: Managing Partner, Deloitte & Touche LLP; Trustee and Chairman of the Audit Committee, Schroder Funds; Board Member, Mile High United Way, Boys and Girls Clubs, Boy Scouts, Colorado Business Committee for the Arts, Economic Club of Colorado and Metro Denver Network (economic development corporation); and Trustee of certain Oppenheimer Funds | | 229 | | Board member and Chairman of Audit Committee of AMG National Trust Bank; Trustee and Investment Committee member, University of South Dakota Foundation; Board member, Audit Committee Member and past Board Chair, Junior Achievement(non-profit) |
| | | | | |
Christopher L. Wilson – 1957 Trustee, Vice Chair and Chair Designate | | 2017 | | Retired Formerly: Director, TD Asset Management USA Inc. (mutual fund complex) (22 portfolios); Managing Partner, CT2, LLC (investing and consulting firm); President/Chief Executive Officer, Columbia Funds, Bank of America Corporation; President/Chief Executive Officer, CDC IXIS Asset Management Services, Inc.; Principal & Director of Operations, Scudder Funds, Scudder, Stevens & Clark, Inc.; Assistant Vice President, Fidelity Investments | | 229 | | ISO New England, Inc.(non-profit organization managing regional electricity market) |
27 INVESCO OPPENHEIMER V.I. INTERNATIONAL GROWTH FUND
TRUSTEES AND OFFICERS Continued
| | | | | | | | |
| | | | | |
Name, Year of Birth and Position(s) Held with the Trust | | Trustee and/or Officer Since | | Principal Occupation(s) During Past 5 Years | | Number of Funds in Fund Complex
Overseen by Trustee | | Other Directorship(s) Held by Trustee During Past
5 Years |
OTHER OFFICERS | | | | | | | | |
| | | | | |
Sheri Morris – 1964 President, Principal Executive Officer and Treasurer | | 2003 | | Head of Global Fund Services, Invesco Ltd.; President, Principal Executive Officer and Treasurer, The Invesco Funds; Vice President, Invesco Advisers, Inc. (formerly known as Invesco Institutional (N.A.), Inc.) (registered investment adviser); and Vice President, Invesco Exchange-Traded Fund Trust, InvescoExchange-Traded Fund Trust II, Invesco India Exchange-Traded Fund Trust, Invesco Actively Managed Exchange-Traded Fund Trust, Invesco Actively Managed Exchange-Traded Commodity Fund Trust and Invesco Exchange-Traded Self-Indexed Fund Trust, and Vice President, OppenheimerFunds, Inc. Formerly: Vice President and Principal Financial Officer, The Invesco Funds; Vice President, Invesco AIM Advisers, Inc., Invesco AIM Capital Management, Inc. and Invesco AIM Private Asset Management, Inc.; Assistant Vice President and Assistant Treasurer, The Invesco Funds and Assistant Vice President, Invesco Advisers, Inc., Invesco AIM Capital Management, Inc. and Invesco AIM Private Asset Management, Inc.; and Treasurer, Invesco Exchange-Traded Fund Trust, Invesco Exchange-Traded Fund Trust II, Invesco India Exchange-Traded Fund Trust and Invesco Actively Managed Exchange-Traded Fund Trust | | N/A | | N/A |
| | | | | |
Russell C. Burk – 1958 Senior Vice President and Senior Officer | | 2005 | | Senior Vice President and Senior Officer, The Invesco Funds | | N/A | | N/A |
| | | | | |
Jeffrey H. Kupor – 1968 Senior Vice President, Chief Legal Officer and Secretary | | 2018 | | Head of Legal of the Americas, Invesco Ltd.; Senior Vice President and Secretary, Invesco Advisers, Inc. (formerly known as Invesco Institutional (N.A.), Inc.) (registered investment adviser); Senior Vice President and Secretary, Invesco Distributors, Inc. (formerly known as Invesco AIM Distributors, Inc.); Vice President and Secretary, Invesco Investment Services, Inc. (formerly known as Invesco AIM Investment Services, Inc.) Senior Vice President, Chief Legal Officer and Secretary, The Invesco Funds; Secretary and General Counsel, Invesco Investment Advisers LLC (formerly known as Van Kampen Asset Management); Secretary and General Counsel, Invesco Capital Markets, Inc. (formerly known as Van Kampen Funds Inc.) and Chief Legal Officer, InvescoExchange-Traded Fund Trust, Invesco Exchange-Traded Fund Trust II, Invesco India Exchange-Traded Fund Trust, Invesco Actively ManagedExchange-Traded Fund Trust, Invesco Actively Managed Exchange-Traded Commodity Fund Trust and Invesco Exchange-Traded Self-Indexed Fund Trust; Secretary, Invesco Indexing LLC; Secretary, W.L. Ross & Co., LLC Formerly: Secretary and Vice President, Jemstep, Inc.; Head of Legal, Worldwide Institutional, Invesco Ltd.; Secretary and General Counsel, INVESCO Private Capital Investments, Inc.; Senior Vice President, Secretary and General Counsel, Invesco Management Group, Inc. (formerly known as Invesco AIM Management Group, Inc.); Assistant Secretary, INVESCO Asset Management (Bermuda) Ltd.; Secretary and General Counsel, Invesco Private Capital, Inc.; Assistant Secretary and General Counsel, INVESCO Realty, Inc.; Secretary and General Counsel, Invesco Senior Secured Management, Inc.; and Secretary, Sovereign G./P. Holdings Inc. | | N/A | | N/A |
| | | | | |
Andrew R. Schlossberg – 1974 Senior Vice President | | 2019 | | Head of the Americas and Senior Managing Director, Invesco Ltd.; Director and Senior Vice President, Invesco Advisers, Inc. (formerly known as Invesco Institutional (N.A.), Inc.) (registered investment adviser); Director and Chairman, Invesco Investment Services, Inc. (formerly known as Invesco AIM Investment Services, Inc.) (registered transfer agent); Senior Vice President, The Invesco Funds; Director, Invesco Investment Advisers LLC (formerly known as Van Kampen Asset Management); Director, President and Chairman, Invesco Insurance Agency, Inc. Formerly: Director, Invesco UK Limited; Director and Chief Executive, Invesco Asset Management Limited and Invesco Fund Managers Limited; Assistant Vice President, The Invesco Funds; Senior Vice President, Invesco Advisers, Inc. (formerly known as Invesco Institutional (N.A.), Inc.) (registered investment adviser); Director and Chief Executive, Invesco Administration Services Limited and Invesco Global Investment Funds Limited; Director, Invesco Distributors, Inc.; Head of EMEA, Invesco Ltd.; President, Invesco Actively ManagedExchange-Traded Commodity Fund Trust, Invesco Actively Managed Exchange-Traded Fund Trust, InvescoExchange-Traded Fund Trust, InvescoExchange-Traded Fund Trust II and Invesco India Exchange-Traded Fund Trust; Managing Director and Principal Executive Officer, Invesco Capital Management LLC | | N/A | | N/A |
28 INVESCO OPPENHEIMER V.I. INTERNATIONAL GROWTH FUND
| | | | | | | | |
| | | | | |
Name, Year of Birth and Position(s) Held with the Trust | | Trustee and/or Officer Since | | Principal Occupation(s) During Past 5 Years | | Number of Funds in Fund Complex
Overseen by Trustee | | Other Directorship(s) Held by Trustee During Past
5 Years |
OTHER OFFICERS (CONTINUED) | | | | | | | | |
| | | | | |
John M. Zerr – 1962 Senior Vice President | | 2006 | | Chief Operating Officer of the Americas; Senior Vice President, Invesco Advisers, Inc. (formerly known as Invesco Institutional (N.A.), Inc.) (registered investment adviser); Senior Vice President, Invesco Distributors, Inc. (formerly known as Invesco AIM Distributors, Inc.); Director and Vice President, Invesco Investment Services, Inc. (formerly known as Invesco AIM Investment Services, Inc.) Senior Vice President, The Invesco Funds; Managing Director, Invesco Capital Management LLC; Director, Invesco Investment Advisers LLC (formerly known as Van Kampen Asset Management); Senior Vice President, Invesco Capital Markets, Inc. (formerly known as Van Kampen Funds Inc.); Manager, Invesco Indexing LLC; Manager, Invesco Specialized Products, LLC; Director and Senior Vice President, Invesco Insurance Agency, Inc.; Member, Invesco Canada Funds Advisory Board; Director, President and Chief Executive Officer, Invesco Corporate Class Inc. (corporate mutual fund company); and Director, Chairman, President and Chief Executive Officer, Invesco Canada Ltd. (formerly known as Invesco Trimark Ltd./Invesco Trimark Ltèe) (registered investment adviser and registered transfer agent) Formerly: Director and Senior Vice President, Invesco Management Group, Inc. (formerly known as Invesco AIM Management Group, Inc.); Secretary and General Counsel, Invesco Management Group, Inc. (formerly known as Invesco AIM Management Group, Inc.); Secretary, Invesco Investment Services, Inc. (formerly known as Invesco AIM Investment Services, Inc.); Chief Legal Officer and Secretary, The Invesco Funds; Secretary and General Counsel, Invesco Investment Advisers LLC (formerly known as Van Kampen Asset Management); Secretary and General Counsel, Invesco Capital Markets, Inc. (formerly known as Van Kampen Funds Inc.); Chief Legal Officer, Invesco Exchange-Traded Fund Trust, Invesco Exchange-Traded Fund Trust II, Invesco India Exchange-Traded Fund Trust, Invesco Actively Managed Exchange-Traded Fund Trust, Invesco Actively Managed Exchange-Traded Commodity Fund Trust and Invesco Exchange-Traded Self-Indexed Fund Trust; Secretary, Invesco Indexing LLC; Director, Secretary, General Counsel and Senior Vice President, Van Kampen Exchange Corp.; Director, Vice President and Secretary, IVZ Distributors, Inc. (formerly known as INVESCO Distributors, Inc.); Director and Vice President, INVESCO Funds Group, Inc.; Director and Vice President, Van Kampen Advisors Inc.; Director, Vice President, Secretary and General Counsel, Van Kampen Investor Services Inc.; Director and Secretary, Invesco Distributors, Inc. (formerly known as Invesco AIM Distributors, Inc.); Director, Senior Vice President, General Counsel and Secretary, Invesco AIM Advisers, Inc. and Van Kampen Investments Inc.; Director, Vice President and Secretary, Fund Management Company; Director, Senior Vice President, Secretary, General Counsel and Vice President, Invesco AIM Capital Management, Inc.; Chief Operating Officer and General Counsel, Liberty Ridge Capital, Inc. (an investment adviser) | | N/A | | N/A |
| | | | | |
Gregory G. McGreevey – 1962 Senior Vice President | | 2012 | | Senior Managing Director, Invesco Ltd.; Director, Chairman, President, and Chief Executive Officer, Invesco Advisers, Inc. (formerly known as Invesco Institutional (N.A.), Inc.) (registered investment adviser); Director, Invesco Mortgage Capital, Inc. and Invesco Senior Secured Management, Inc.; and Senior Vice President, The Invesco Funds; and President, SNW Asset Management Corporation Formerly: Senior Vice President, Invesco Management Group, Inc. and Invesco Advisers, Inc.; Assistant Vice President, The Invesco Funds | | N/A | | N/A |
| | | | | |
Kelli Gallegos – 1970 Vice President, Principal Financial Officer and Assistant Treasurer | | 2008 | | Principal Financial and Accounting Officer – Investments Pool, Invesco Specialized Products, LLC; Vice President, Principal Financial Officer and Assistant Treasurer, The Invesco Funds; Principal Financial and Accounting Officer – Pooled Investments, Invesco Capital Management LLC; Vice President and Treasurer, Invesco Exchange-Traded Fund Trust, Invesco Exchange-Traded Fund Trust II, Invesco India Exchange-Traded Fund Trust, Invesco Actively Managed Exchange-Traded Fund Trust, Invesco Actively Managed Exchange-Traded Commodity Fund Trust and Invesco Exchange-Traded Self-Indexed Fund Trust Formerly: Assistant Treasurer, Invesco Specialized Products, LLC; Assistant Treasurer, InvescoExchange-Traded Fund Trust, InvescoExchange-Traded Fund Trust II, Invesco India Exchange-Traded Fund Trust, Invesco Actively Managed Exchange-Traded Fund Trust, Invesco Actively Managed Exchange-Traded Commodity Fund Trust and Invesco Exchange-Traded Self-Indexed Fund Trust; Assistant Treasurer, Invesco Capital Management LLC; Assistant Vice President, The Invesco Funds | | N/A | | N/A |
29 INVESCO OPPENHEIMER V.I. INTERNATIONAL GROWTH FUND
TRUSTEES AND OFFICERS Continued
| | | | | | | | |
| | | | | |
Name, Year of Birth and Position(s) Held with the Trust | | Trustee and/or Officer Since | | Principal Occupation(s) During Past 5 Years | | Number of Funds in Fund Complex
Overseen by Trustee | | Other Directorship(s) Held by Trustee During Past
5 Years |
OTHER OFFICERS (CONTINUED) | | | | | | | | |
| | | | | |
Crissie M. Wisdom – 1969 Anti-Money Laundering Compliance Officer | | 2013 | | Anti-Money Laundering Compliance Officer, Invesco Advisers, Inc. (formerly known as Invesco Institutional (N.A.), Inc.) (registered investment adviser), Invesco Capital Markets, Inc. (formerly known as Van Kampen Funds Inc.), Invesco Distributors, Inc., Invesco Investment Services, Inc., The Invesco Funds, and Invesco Exchange-Traded Fund Trust, Invesco Exchange-Traded Fund Trust II, Invesco India Exchange-Traded Fund Trust, Invesco Actively Managed Exchange-Traded Fund Trust, Invesco Actively Managed Exchange-Traded Commodity Fund Trust and Invesco Exchange-Traded Self-Indexed Fund Trust; Anti-Money Laundering Compliance Officer and Bank Secrecy Act Officer, INVESCO National Trust Company and Invesco Trust Company; and Fraud Prevention Manager and Controls and Risk Analysis Manager for Invesco Investment Services, Inc. Formerly: Anti-Money Laundering Compliance Officer, Van Kampen Exchange Corp. and Invesco Management Group, Inc. | | N/A | | N/A |
| | | | | |
Robert R. Leveille – 1969 Chief Compliance Officer | | 2016 | | Chief Compliance Officer, Invesco Advisers, Inc. (registered investment adviser); and Chief Compliance Officer, The Invesco Funds Formerly: Chief Compliance Officer, Putnam Investments and the Putnam Funds | | N/A | | N/A |
The Statement of Additional Information of the Trust includes additional information about the Fund’s Trustees and is available upon request, without charge, by calling 1.800.959.4246. Please refer to the Fund’s Statement of Additional Information for information on the Fund’ssub-advisers.
| | | | | | |
| Office of the Fund | | Investment Adviser | | Distributor | | Auditors |
11 Greenway Plaza, Suite 1000 Houston, TX 77046-1173 | | Invesco Advisers, Inc. 1555 Peachtree Street, N.E. Atlanta, GA 30309 | | Invesco Distributors, Inc. 11 Greenway Plaza, Suite 1000 Houston, TX 77046-1173 | | PricewaterhouseCoopers LLP 1000 Louisiana Street, Suite 5800 Houston, TX 77002-5021 |
| | | |
| Counsel to the Fund | | Counsel to the | | Transfer Agent | | Custodian |
Stradley Ronon Stevens & Young, LLP 2005 Market Street, Suite 2600 Philadelphia, PA 19103-7018 | | Independent Trustees Goodwin Procter LLP 901 New York Avenue, N.W. Washington, D.C. 20001 | | Invesco Investment Services, Inc. 11 Greenway Plaza, Suite 1000 Houston, TX 77046-1173 | | JPMorgan Chase Bank 4 Chase Metro Tech Center Brooklyn, NY 11245 |
30 INVESCO OPPENHEIMER V.I. INTERNATIONAL GROWTH FUND
THIS PAGE INTENTIONALLY LEFT BLANK.

| | | | |
 | | Annual Report | | 12/31/2019 |
| | |
| | Invesco Oppenheimer |
| | V.I. Main Street Fund®* |
| |
| | Beginning on January 1, 2021, as permitted by regulations adopted by the Securities and Exchange Commission, the insurance company that offers your variable annuity or variable life insurance contract may no longer send you paper copies of the Fund’s shareholder reports by mail, unless you specifically request paper copies of the reports from the insurance company or your financial intermediary. Instead of delivering paper copies of the report, the insurance company may choose to make the reports available on a website, and will notify you by mail each time a report is posted and provide you with a website link to access the report. Instructions for requesting paper copies will be provided by your insurance company. If the insurance company offers electronic delivery, you may elect to receive shareholder reports and other communications about the Fund electronically by following the instructions provided by the insurance company or by contacting your financial intermediary. If you already elected to receive shareholder reports electronically, you will not be affected by this change and you need not take any action. You may elect to receive all future reports in paper free of charge from the insurance company. You can inform the insurance company or your financial intermediary that you wish to continue receiving paper copies of your shareholder reports by following the instructions provided by the insurance company or by contacting your financial intermediary. Your election to receive reports in paper will apply to all portfolio companies available under your contract with the insurance company. |
| |
| | The Fund provides a complete list of its holdings four times in each fiscal year, at the quarter ends. For the second and fourth quarters, the lists appear in the Fund’s semi annual and annual reports to shareholders. For the first and third quarters, the Fund files the lists with the Securities and Exchange Commission (SEC) as an exhibit to its reports on FormN-PORT. The Fund’s FormN-PORT filings are available on the SEC website, sec.gov. The Fund’s most recent portfolio holdings, as filed on FormN-PORT, have also been made available to insurance companies issuing variable annuity contracts and variable life insurance policies (“variable products”) that invest in the Fund. |
| |
| | A description of the policies and procedures that the Fund uses to determine how to vote proxies relating to portfolio securities is available without charge, upon request, from our Client Services department at 800 959 4246 or at invesco.com/proxyguidelines. The information is also available on the SEC website, sec.gov. |
| |
| | Information regarding how the Fund voted proxies related to its portfolio securities during the most recent12-month period ended June 30 is available at invesco.com/proxysearch. The information is also available on the SEC website, sec.gov. |
| |
| | Invesco Advisers, Inc. is an investment adviser; it provides investment advisory services to individual and institutional clients and does not sell securities. Invesco Distributors, Inc. is the US distributor for Invesco Ltd.’s retail mutual funds, exchange- traded funds and institutional money market funds. Both are wholly owned, indirect subsidiaries of Invesco Ltd. |
| |
| | This report must be accompanied or preceded by a currently effective Fund prospectus and variable product prospectus, which contain more complete information, including sales charges and expenses. Investors should read each carefully before investing. |
| |
| | *Prior to the close of business on May 24, 2019, the Fund’s name was Oppenheimer Main Street Fund/VA. See Important Update on the following page for more information. |
Important Update
On October 18, 2018, Massachusetts Mutual Life Insurance Company, an indirect corporate parent of OppenheimerFunds, Inc. and its subsidiaries OFI Global Asset Management, Inc., OFI SteelPath, Inc. and OFI Advisors, LLC, announced that it had entered into an agreement whereby Invesco Ltd., a global investment management company would acquire OppenheimerFunds and its subsidiaries (together, “OppenheimerFunds”). After the close of business on May 24, 2019 Invesco Ltd. completed the acquisition of OppenheimerFunds. This Fund was included in that acquisition and as of that date, became part of the Invesco family of funds. Please visit invesco.com for more information or call Invesco’s Client Services team at800-959-4246.
PORTFOLIO MANAGERS: Manind Govil, CFA, Benjamin Ram and Paul Larson
AVERAGE ANNUAL TOTAL RETURNS FOR THE PERIODS ENDED 12/31/19
| | | | | | | | |
| | | Inception | | | | | | |
| | | Date | | 1-Year | | 5-Year | | 10-Year |
| Series I Shares* | | 7/5/95 | | 32.08% | | 10.41% | | 12.50% |
| Series II Shares* | | 7/13/00 | | 31.74 | | 10.14 | | 12.21 |
| S&P 500 Index | | | | 31.49 | | 11.70 | | 13.56 |
Performance quoted is past performance and cannot guarantee future results; current performance may be lower or higher. Visit invesco.com for the most recentmonth-end performance. Performance figures reflect reinvested distributions and changes in net asset value (NAV). Investment return and principal value will vary so that you may have a gain or a loss when you sell shares. Fund returns include changes in share price, reinvested distributions. Performance figures given represent the Fund and are not intended to reflect actual variable product values. They do not reflect sales charges, expenses and fees assessed in connection with a variable product. Sales charges, expenses and fees, which are determined by the variable product issuers, will vary and will lower the total return. Returns for periods of less than one year are cumulative and not annualized. As the result of a reorganization after the close of business on May 24, 2019, theNon-Service and Service share classes of the predecessor fund were reorganized into Series I and Series II Shares, respectively, of the Fund. Returns shown for Series I and Series II shares are blended returns of the predecessor fund and the Fund. Share class returns will differ from those of the Oppenheimer predecessor fund because of different expenses. See Fund prospectuses and summary prospectuses for more information on share classes, sales charges and new fee agreements, if any. Fund literature is available at invesco.com.
The Fund’s performance is compared to the performance of the S&P 500 Index. The S&P 500 Index is a capitalization-weighted index of 500 stocks intended to be a representative sample of leading companies in leading industries within the U.S. economy. The Index is unmanaged and cannot be purchased directly by investors. While index comparisons may be useful to provide a benchmark for the Fund’s performance, it must be noted that the Fund’s investments are not limited to the investments comprising the Index. Index performance includes reinvestment of income, but does not reflect transaction costs, fees, expenses or taxes. Index performance is shown for illustrative purposes only as a benchmark for the Fund’s performance and does not predict or depict performance of the Fund. The Fund’s performance reflects the effects of the Fund’s business and operating expenses.
TOP HOLDINGS AND ALLOCATIONS
TOP TEN COMMON STOCK HOLDINGS
| | | | |
| Microsoft Corp. | | | 7.9 | % |
| JPMorgan Chase & Co. | | | 5.0 | |
| UnitedHealth Group, Inc. | | | 4.2 | |
| Facebook, Inc., Cl. A | | | 3.8 | |
| Amazon.com, Inc. | | | 3.7 | |
| Procter & Gamble Co. (The) | | | 3.6 | |
| Berkshire Hathaway, Inc., Cl. B | | | 3.4 | |
| Merck & Co., Inc. | | | 3.2 | |
| Lockheed Martin Corp. | | | 3.0 | |
| Prologis, Inc. | | | 2.9 | |
Holdings and allocations are subject to change and are not buy/sell recommendations. Percentages are as of December 31, 2019, and are based on net assets.
SECTOR ALLOCATION
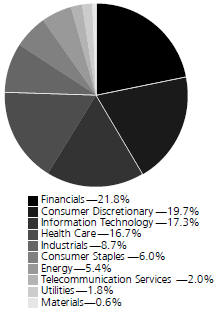
Holdings and allocations are subject to change and are not buy/sell recommendations. Percentages are as of December 31, 2019, and are based on the total market value of common stocks.
For more current Fund holdings, please visit invesco.com.
*Effective after the close of business on May 24, 2019, theNon-Service and Service share classes of the predecessor fund were reorganized into Series I and Series II Shares, respectively, of the Fund. Returns shown for Series I and Series II shares are blended returns of the predecessor fund and the Fund. Share class returns will differ from those of the predecessor fund because of different expenses.
3 INVESCO OPPENHEIMER V.I. MAIN STREET FUND
Fund Performance Discussion
The Fund’s Series I shares returned 32.08% during the reporting period. In comparison, the S&P 500 Index return 31.49% during the same period. The Fund’s outperformance was mainly driven by stock selection within the Industrials, Real Estate, and Health Care sectors. This was partially offset by negative stock selection within the consumer staples, information technology, and utilities sectors.
MARKET OVERVIEW
The S&P 500 Index produced strong returns during the quarter to cap off a gangbuster 2019, as the U.S. economy and corporate earnings remain relatively healthy and interest rates remain low. Gains were broad-based with 10 of 11 sectors producing positive total returns led by the Health Care, Information Technology, and Financials sectors
Fund Review
The top individual contributors to relative performance included Applied Materials, Microsoft, and Prologis.
Applied Materials’, a semiconductor equipment company, shares rose as business activity stabilized and the market is expecting improving orders form logic/ foundry customers.
Prologis, and industrial REIT, benefited from solid demand for its warehouse properties. In addition, Prologis successfully completed two important acquisitions during the year that increased its density and competitive positioning in key U.S. distribution markets. A key demand driver is the growth ofe-commerce, led by Amazon, whose push to ever-faster delivery times is forcing traditional retailers and their suppliers to reconfigure their warehouse “footprints” to be closer to their end customers.
Microsoft has continued to see strength across its business lines and displayed strong execution. This has led to both healthytop-line growth and margin expansion.
The key individual detractors from relative performance during the period included Elanco Animal Health, Kraft Heinz, and NetApp.
Elancosold-off in late August after announcing the acquisition of Bayer’s Animal Health business due to concerns around the size of the deal.
Kraft Heinz shares were sharply lower after announcing that 2019 would be another year of substantial investments which would negatively impact their industry-leading margins. The company also announced a dividend cut tode-lever faster and an $15 billion impairment charge on some of their brands, bringing into question their whole acquisition/cost-cutting driven strategy. We have exited our position.
NetApp shares were under pressure after the company preannounced negatively during the third quarter, blaming sales execution issues in North America and a macroeconomic slowdown. We have exited our position.
STRATEGY & OUTLOOK
In the short-term, we expect the U.S. economy to continue to show economic growth, albeit at slower rates than experienced in 2018 and early 2019, driven by favorable consumer confidence, falling regulatory hurdles, and technological innovation. However, there are several warning signs on the horizon including less synchronized global growth, weakening transport volumes, poor ISM purchasing managers surveys, and a recent flattening/inversion of the yield curve. While a recession later this year would not surprise us, it is not our base case assumption at this time.
We continue to maintain our discipline around valuation and focus on companies with competitive advantages and skilled management teams that areout-executing peers. The evidence of this we look for in our companies include high returns on invested capital, consistently strong pricing power, and/or rising market shares. During times of economic volatility such companies frequently widen their lead over weaker competitors. We seek to invest in companies characterized by these qualities at compelling valuations and believe this disciplined approach is essential to generating superior long-term performance, especially in down markets.
The views and opinions expressed in management’s discussion of Fund performance are those of Invesco Advisers, Inc. These views and opinions are subject to change at any time based on factors such as market and economic conditions. These views and opinions may not be relied upon as investment advice or
4 INVESCO OPPENHEIMER V.I. MAIN STREET FUND
recommendations, or as an offer for a particular security. The information is not a complete analysis of every aspect of any market, country, industry, security or the Fund. Statements of fact are from sources considered reliable, but Invesco Advisers, Inc. makes no representation or warranty as to their completeness or accuracy. Although historical performance is no guarantee of future results, these insights may help you understand our investment management philosophy.
Before investing, investors should carefully read the prospectus and/or summary prospectus and carefully consider the investment objectives, risks, charges and expenses. For this and more complete information about the fund(s), investors should ask their advisors for a prospectus/summary prospectus or visit invesco.com/fundprospectus.
Shares of Invesco funds are not deposits or obligations of any bank, are not guaranteed by any bank, are not insured by the FDIC or any other agency, and involve investment risks, including the possible loss of the principal amount invested.
Comparing the Fund’s Performance to the Market.The graphs that follow show the performance of a hypothetical $10,000 investment in each share class of the Fund held until December 31, 2019. Performance is measured over aten-fiscal-year period for both Classes. Performance information does not reflect charges that apply to separate accounts investing in the Fund. If these charges were taken into account, performance would be lower. The graphs assume that all dividends and capital gains distributions were reinvested in additional shares.
The Fund’s performance is compared to the performance of the S&P 500 Index. The S&P 500 Index is a capitalization-weighted index of 500 stocks intended to be a representative sample of leading companies in leading industries within the U.S. economy. The Index isunmanaged and cannot be purchased directly by investors. While index comparisons may be useful to provide a benchmark for the Fund’s performance, it must be noted that the Fund’s investments are not limited to the investments comprising the Index. Index performance includes reinvestment of income, but does not reflect transaction costs, fees, expenses or taxes. Index performance is shown for illustrative purposes only as a benchmark for the Fund’s performance, and does not predict or depict performance of the Fund. The Fund’s performance reflects the effects of the Fund’s business and operating expenses.
5 INVESCO OPPENHEIMER V.I. MAIN STREET FUND
COMPARISON OF CHANGE IN VALUE OF $10,000 HYPOTHETICAL INVESTMENTS IN:
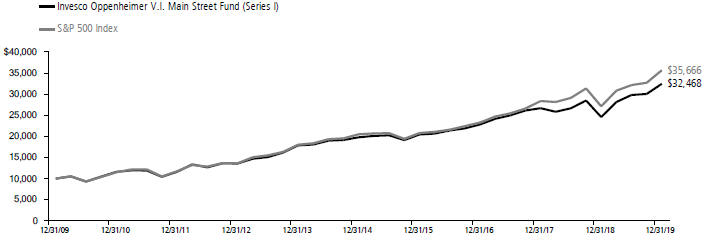
Average Annual Total Returns of Series I Shares of the Fund at 12/31/19
1-Year 32.08% 5-Year 10.41% 10-Year 12.50%
COMPARISON OF CHANGE IN VALUE OF $10,000 HYPOTHETICAL INVESTMENTS IN:
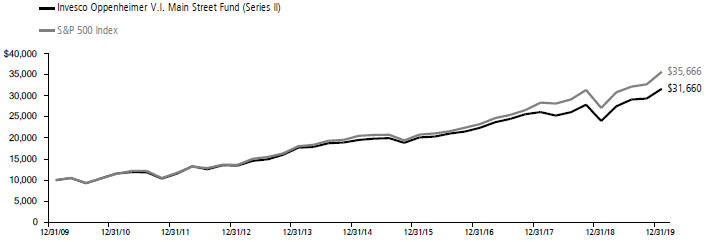
Average Annual Total Returns of Series II Shares of the Fund at 12/31/19
1-Year 31.74% 5-Year 10.14% 10-Year 12.21%
Performance data quoted represents past performance, which does not guarantee future results. The investment return and principal value of an investment in the Fund will fluctuate so that an investor’s shares, when redeemed, may be worth more or less than their original cost. Current performance may be lower or higher than the performance quoted. For performance data current to the most recent month end, call us at 1.800.988.8287. The Fund’s total returns should not be expected to be the same as the returns of other funds, whether or not both funds have the same portfolio managers and/or similar names. The Fund’s total returns include changes in share price and reinvested distributions but do not include the charges associated with the separate account products that offer this Fund. Such performance would have been lower if such charges were taken into account.
6 INVESCO OPPENHEIMER V.I. MAIN STREET FUND
Fund Expenses
Fund Expenses.As a shareholder of the Fund, you incur two types of costs: (1) transaction costs and (2) ongoing costs, including management fees; distribution and service fees; and other Fund expenses. These examples are intended to help you understand your ongoing costs (in dollars) of investing in the Fund and to compare these costs with the ongoing costs of investing in other mutual funds.
The examples are based on an investment of $1,000.00 invested at the beginning of the period and held for the entire6-month period ended December 31, 2019.
Actual Expenses. The first section of the table provides information about actual account values and actual expenses. You may use the information in this section for the class of shares you hold, together with the amount you invested, to estimate the expense that you paid over the period. Simply divide your account value by $1,000.00 (for example, an $8,600.00 account value divided by $1,000.00 = 8.60), then multiply the result by the number in the first section under the heading entitled “Expenses Paid During 6 Months Ended December 31, 2019” to estimate the expenses you paid on your account during this period.
Hypothetical Example for Comparison Purposes.
The second section of the table provides information about hypothetical account values and hypothetical expenses based on the Fund’s actual expense ratio for each class of shares, and an assumed rate of return of 5% per year for each class before expenses, which is not the actual return. The hypothetical account values and expenses may not be used to estimate the actual ending account balance or expenses you paid for the period. You may use this information to compare the ongoing costs of investing in the Fund and other funds. To do so, compare this 5% hypothetical example for the class of shares you hold with the 5% hypothetical examples that appear in the shareholder reports of the other funds.
Please note that the expenses shown in the table are meant to highlight your ongoing costs only and do not reflect any charges associated with the separate accounts that offer this Fund. Therefore, the “hypothetical” lines of the table are useful in comparing ongoing costs only, and will not help you determine the relative total costs of owning different funds. In addition, if these separate account charges were included your costs would have been higher.
| | | | | | | | | | | | |
| Actual | | Beginning Account Value July 1, 2019 | | | Ending Account Value December 31, 2019 | | | Expenses Paid During 6 Months Ended December 31, 2019 | |
| Series I shares | | $ | 1,000.00 | | | $ | 1,089.20 | | | $ | 4.22 | |
| Series II shares | | | 1,000.00 | | | | 1,087.60 | | | | 5.54 | |
| | | |
| Hypothetical | | | | | | | | | | | | |
| (5% return before expenses) | | | | | | | | | | | | |
| Series I shares | | | 1,000.00 | | | | 1,021.17 | | | | 4.08 | |
| Series II shares | | | 1,000.00 | | | | 1,019.91 | | | | 5.36 | |
Expenses are equal to the Fund’s annualized expense ratio for that class, multiplied by the average account value over the period, multiplied by 184/365 (to reflect theone-half year period). Those annualized expense ratios, excluding indirect expenses from affiliated funds, based on the6-month period ended December 31, 2019 are as follows:
| | | | |
| Class | | Expense Ratios | |
| Series I shares | | | 0.80% | |
| Series II shares | | | 1.05 | |
The expense ratios reflect voluntary and/or contractual waivers and/or reimbursements of expenses by the Fund’s Manager. Some of these undertakings may be modified or terminated at any time, as indicated in the Fund’s prospectus. The “Financial Highlights” tables in the Fund’s financial statements, included in this report, also show the gross expense ratios, without such waivers or reimbursements and reduction to custodian expenses, if applicable.
7 INVESCO OPPENHEIMER V.I. MAIN STREET FUND
SCHEDULE OF INVESTMENTSDecember 31, 2019
| | | | | | | | |
| | | Shares | | | Value | |
| Common Stocks—98.7% | | | | | | | | |
| Consumer Discretionary—19.5% | |
| Automobiles—0.6% | | | | | | | | |
| General Motors Co. | | | 224,050 | | | $ | 8,200,230 | |
| Hotels, Restaurants & Leisure—0.9% | |
| Starbucks Corp. | | | 132,969 | | | | 11,690,634 | |
| Household Durables—0.8% | | | | | | | | |
| DR Horton, Inc. | | | 201,705 | | | | 10,639,939 | |
| Interactive Media & Services—5.9% | |
| Alphabet, Inc., Cl. A1 | | | 19,931 | | | | 26,695,382 | |
| Facebook, Inc., Cl. A1 | | | 242,230 | | | | 49,717,708 | |
| | | | | | | 76,413,090 | |
| Internet & Catalog Retail—6.0% | |
| Amazon.com, Inc.1 | | | 25,837 | | | | 47,742,642 | |
| Booking Holdings, Inc.1 | | | 14,550 | | | | 29,881,772 | |
| | | | | | | 77,624,414 | |
| Specialty Retail—5.3% | |
| Best Buy Co., Inc. | | | 205,035 | | | | 18,002,073 | |
| Home Depot, Inc. (The) | | | 122,172 | | | | 26,679,921 | |
| O’Reilly Automotive, Inc.1 | | | 24,546 | | | | 10,757,530 | |
| Ulta Beauty, Inc.1 | | | 53,328 | | | | 13,499,450 | |
| | | | | | | 68,938,974 | |
| Consumer Staples—5.9% | |
| Beverages—1.7% | | | | | | | | |
| Anheuser-Busch InBev SA | | | 131,153 | | | | 10,754,744 | |
| Constellation Brands, Inc., Cl. A | | | 61,290 | | | | 11,629,777 | |
| | | | | | | 22,384,521 | |
| Household Products—4.2% | | | | | | | | |
| Church & Dwight Co., Inc. | | | 114,244 | | | | 8,035,923 | |
| Procter & Gamble Co. (The) | | | 377,260 | | | | 47,119,774 | |
| | | | | | | 55,155,697 | |
| Energy—5.3% | | | | | | | | |
| Energy Equipment & Services—1.3% | |
| Schlumberger Ltd. | | | 417,077 | | | | 16,766,496 | |
| Oil, Gas & Consumable Fuels—4.0% | | | | | | | | |
| Magellan Midstream Partners LP | | | 294,045 | | | | 18,486,609 | |
| Suncor Energy, Inc. | | | 1,037,050 | | | | 34,015,240 | |
| | | | | | | 52,501,849 | |
| | | | | | | | | |
| Financials—21.5% | | | | | | | | |
| Capital Markets—3.3% | | | | | | | | |
| Intercontinental Exchange, Inc. | | | 180,466 | | | | 16,702,128 | |
| S&P Global, Inc. | | | 85,963 | | | | 23,472,197 | |
| Tradeweb Markets, Inc., Cl. A | | | 55,473 | | | | 2,571,174 | |
| | | | | | | 42,745,499 | |
| | | | | | | | | |
| Commercial Banks—6.3% | | | | | | | | |
| Danske Bank AS | | | 556,931 | | | | 9,006,912 | |
| JPMorgan Chase & Co. | | | 469,013 | | | | 65,380,412 | |
| SVB Financial Group1 | | | 29,091 | | | | 7,303,005 | |
| | | | | | | 81,690,329 | |
| | | | | | | | | |
| Consumer Finance—2.7% | | | | | | | | |
| Capital One Financial Corp. | | | 347,183 | | | | 35,728,603 | |
| | | | | | | | | |
| Diversified Financial Services—5.3% | |
| AXA Equitable Holdings, Inc. | | | 1,007,005 | | | | 24,953,584 | |
| Berkshire Hathaway, Inc., Cl. B1 | | | 193,290 | | | | 43,780,185 | |
| | | | | | | 68,733,769 | |
| | | | | | | | | |
| Insurance—1.0% | | | | | | | | |
| Fidelity National Financial, Inc. | | | 138,757 | | | | 6,292,630 | |
| Progressive Corp. (The) | | | 93,138 | | | | 6,742,260 | |
| | | | | | | 13,034,890 | |
| | | | | | | | | |
| Real Estate Investment Trusts (REITs)—2.9% | |
| Prologis, Inc. | | | 425,563 | | | | 37,934,686 | |
| | | | | | | | |
| | | Shares | | | Value | |
| Health Care—16.5% | | | | | | | | |
| Biotechnology—0.8% | | | | | | | | |
| Gilead Sciences, Inc. | | | 149,810 | | | $ | 9,734,654 | |
| | | | | | | | | |
| Health Care Equipment & Supplies—2.8% | |
| Boston Scientific Corp.1 | | | 167,164 | | | | 7,559,156 | |
| Zimmer Biomet Holdings, Inc. | | | 195,481 | | | | 29,259,596 | |
| | | | | | | 36,818,752 | |
| | | | | | | | | |
| Health Care Providers & Services—4.6% | | | | | | | | |
| Laboratory Corp. of America Holdings1 | | | 33,530 | | | | 5,672,270 | |
| UnitedHealth Group, Inc. | | | 184,740 | | | | 54,309,865 | |
| | | | | | | 59,982,135 | |
| | | | | | | | | |
| Life Sciences Tools & Services—1.7% | | | | | | | | |
| Thermo Fisher Scientific, Inc. | | | 66,490 | | | | 21,600,606 | |
| | | | | | | | | |
| Pharmaceuticals—6.6% | | | | | | | | |
| AstraZeneca plc, Sponsored ADR | | | 450,730 | | | | 22,473,398 | |
| Elanco Animal Health, Inc.1 | | | 735,560 | | | | 21,662,242 | |
| Merck & Co., Inc. | | | 463,261 | | | | 42,133,588 | |
| | | | | | | 86,269,228 | |
| | | | | | | | | |
| Industrials—8.6% | | | | | | | | |
| Aerospace & Defense—3.0% | | | | | | | | |
| Lockheed Martin Corp. | | | 101,320 | | | | 39,451,982 | |
| | | | | | | | | |
| Air Freight & Couriers—0.3% | | | | | | | | |
| CH Robinson Worldwide, Inc. | | | 48,769 | | | | 3,813,736 | |
| | | | | | | | | |
| Commercial Services & Supplies—0.7% | | | | | | | | |
| Republic Services, Inc., Cl. A | | | 108,486 | | | | 9,723,600 | |
| | | | | | | | | |
| Industrial Conglomerates—1.8% | | | | | | | | |
| Honeywell International, Inc. | | | 133,516 | | | | 23,632,332 | |
| | | | | | | | | |
| Machinery—0.2% | | | | | | | | |
| Stanley Black & Decker, Inc. | | | 12,667 | | | | 2,099,429 | |
| | | | | | | | | |
| Road & Rail—1.5% | | | | | | | | |
| Union Pacific Corp. | | | 104,507 | | | | 18,893,820 | |
| | | | | | | | | |
| Trading Companies & Distributors—1.1% | | | | | | | | |
| Fastenal Co. | | | 381,969 | | | | 14,113,754 | |
| | | | | | | | | |
| Information Technology—17.1% | | | | | | | | |
| Communications Equipment—2.2% | | | | | | | | |
| Motorola Solutions, Inc. | | | 174,904 | | | | 28,184,030 | |
| | | | | | | | | |
| IT Services—2.3% | | | | | | | | |
| Amdocs Ltd. | | | 181,716 | | | | 13,118,078 | |
| Mastercard, Inc., Cl. A | | | 55,120 | | | | 16,458,281 | |
| | | | | | | 29,576,359 | |
| | | | | | | | | |
| Semiconductors & Semiconductor Equipment—4.7% | |
| Applied Materials, Inc. | | | 455,896 | | | | 27,827,892 | |
| QUALCOMM, Inc. | | | 271,560 | | | | 23,959,739 | |
| Texas Instruments, Inc. | | | 71,080 | | | | 9,118,853 | |
| | | | | | | 60,906,484 | |
| | | | | | | | | |
| Software—7.9% | | | | | | | | |
| Microsoft Corp. | | | 657,393 | | | | 103,670,876 | |
| | | | | | | | | |
| Materials—0.6% | | | | | | | | |
| Chemicals—0.6% | | | | | | | | |
| Ecolab, Inc. | | | 37,760 | | | | 7,287,302 | |
| | | | | | | | | |
| Telecommunication Services—2.0% | | | | | | | | |
| Diversified Telecommunication Services—2.0% | |
| Verizon Communications, Inc. | | | 428,195 | | | | 26,291,173 | |
| | | | | | | | | |
| Utilities—1.7% | | | | | | | | |
| Electric Utilities—1.2% | | | | | | | | |
| Duke Energy Corp. | | | 173,904 | | | | 15,861,784 | |
| | | | | | | | | |
| Gas Utilities—0.5% | | | | | | | | |
| UGI Corp. | | | 153,107 | | | | 6,914,312 | |
| Total Common Stocks (Cost $961,727,558) | | | | 1,285,009,968 | |
8 INVESCO OPPENHEIMER V.I. MAIN STREET FUND
| | | | | | | | |
| | | Shares | | | Value | |
| Investment Company—1.1% | | | | | | | | |
Invesco Government & Agency Portfolio, Institutional Class, 1.50%2
(Cost $14,860,862) | | | 14,860,862 | | | $ | 14,860,862 | |
Total Investments, at Value
(Cost $976,588,420) | | | 99.8% | | | | 1,299,870,830 | |
| Net Other Assets (Liabilities) | | | 0.2 | | | | 2,412,420 | |
| Net Assets | | | 100.0% | | | $ | 1,302,283,250 | |
| | | | | | | | |
Footnotes to Schedule of Investments
1.Non-income producing security.
2. The money market fund and the Fund are affiliated by having the same investment adviser. The rate shown is the7-day SEC standardized yield as of December 31, 2019.
| | |
| Glossary: | | |
| Definitions | | |
| ADR | | American Depositary Receipt |
See accompanying Notes to Financial Statements.
9 INVESCO OPPENHEIMER V.I. MAIN STREET FUND
STATEMENT OF ASSETS AND LIABILITIESDecember 31, 2019
| | | | |
| Assets | | | | |
| Investments, at value—see accompanying schedule of investments: | | | | |
| Unaffiliated companies (cost $961,727,558) | | $ | 1,285,009,968 | |
| Affiliated companies (cost $14,860,862) | | | 14,860,862 | |
| | | | |
| | | 1,299,870,830 | |
| Cash | | | 28,649 | |
| Cash—foreign currencies (cost $649) | | | 658 | |
| Receivables and other assets: | | | | |
| Investments sold | | | 10,466,797 | |
| Dividends | | | 997,041 | |
| Shares of beneficial interest sold | | | 180,807 | |
| Other | | | 162,623 | |
| | | | |
| Total assets | | | 1,311,707,405 | |
| Liabilities | | | | |
| Payables and other liabilities: | | | | |
| Investments purchased | | | 7,881,304 | |
| Shares of beneficial interest redeemed | | | 591,433 | |
| Administration fees | | | 447,209 | |
| Trustees’ compensation | | | 155,414 | |
| Distribution and service plan fees | | | 153,990 | |
| Shareholder communications | | | 109,407 | |
| Advisory fees | | | 23,215 | |
| Transfer and shareholder servicing agent fees | | | 20,676 | |
| Other | | | 41,507 | |
| | | | |
| Total liabilities | | | 9,424,155 | |
| Net Assets | | $ | 1,302,283,250 | |
| | | | |
| | | | |
| Composition of Net Assets | | | | |
| Shares of beneficial interest | | $ | 872,244,157 | |
| Total distributable earnings | | | 430,039,093 | |
| | | | |
| Net Assets | | $ | 1,302,283,250 | |
| | | | |
| | | | |
| Net Asset Value Per Share | | | | |
| |
| Series I Shares: | | | | |
| |
| Net asset value, redemption price per share and offering price per share (based on net assets of $570,820,662 and 19,389,120 shares of beneficial interest outstanding) | | | $29.44 | |
| |
| Series II Shares: | | | | |
| Net asset value, redemption price per share and offering price per share (based on net assets of $731,462,588 and 25,178,072 shares of beneficial interest outstanding) | | | $29.05 | |
See accompanying Notes to Financial Statements.
10 INVESCO OPPENHEIMER V.I. MAIN STREET FUND
STATEMENT OF OPERATIONSFor the Year Ended December 31, 2019
| | | | |
| Investment Income | | | | |
| Dividends: | | | | |
| Unaffiliated companies (net of foreign withholding taxes of $204,661) | | $ | 23,574,006 | |
| Affiliated companies | | | 448,162 | |
| | | | |
| Total investment income | | | 24,022,168 | |
| Expenses | | | | |
| Advisory fees | | | 8,224,842 | |
| Administration fees | | | 1,175,066 | |
| Distribution and service plan fees: | | | | |
| Series II shares | | | 1,779,228 | |
| Transfer and shareholder servicing agent fees: | | | | |
| Series I shares | | | 275,587 | |
| Series II shares | | | 362,137 | |
| Shareholder communications: | | | | |
| Series I shares | | | 47,003 | |
| Series II shares | | | 60,884 | |
| Trustees’ compensation | | | 31,398 | |
| Borrowing fees | | | 15,002 | |
| Custodian fees and expenses | | | 8,413 | |
| Other | | | 83,038 | |
| | | | |
| Total expenses | | | 12,062,598 | |
| Less waivers, reimbursement of expenses and offset arrangement(s) | | | (239,242 | ) |
| | | | |
| Net expenses | | | 11,823,356 | |
| Net Investment Income | | | 12,198,812 | |
| Realized and Unrealized Gain (Loss) | | | | |
| Net realized gain (loss) on: | | | | |
| Investment transactions in unaffiliated companies (includes net gains from securities sold to affiliates of $2,084,230) | | | 98,455,955 | |
| Foreign currency transactions | | | (12,638 | ) |
| | | | |
| Net realized gain | | | 98,443,317 | |
| Net change in unrealized appreciation/(depreciation) on: | | | | |
| Investment transactions in unaffiliated companies | | | 230,851,553 | |
| Translation of assets and liabilities denominated in foreign currencies | | | 6,535 | |
| | | | |
| Net change in unrealized appreciation/(depreciation) | | | 230,858,088 | |
| Net Increase in Net Assets Resulting from Operations | | $ | 341,500,217 | |
| | | | |
See accompanying Notes to Financial Statements.
11 INVESCO OPPENHEIMER V.I. MAIN STREET FUND
STATEMENT OF CHANGES IN NET ASSETS
| | | | | | | | |
| | | Year Ended
December 31, 2019 | | Year Ended
December 31, 2018 |
| Operations | | | | | | | | |
| Net investment income | | $ | 12,198,812 | | | $ | 11,343,487 | |
| Net realized gain | | | 98,443,317 | | | | 222,465,657 | |
| Net change in unrealized appreciation/(depreciation) | | | 230,858,088 | | | | (328,736,245 | ) |
| | | | |
| Net increase (decrease) in net assets resulting from operations | | | 341,500,217 | | | | (94,927,101 | ) |
| Dividends and/or Distributions to Shareholders | | | | | | | | |
| Distributions to shareholders from distributable earnings: | | | | | | | | |
| Series I shares | | | (93,497,935 | ) | | | (53,341,045 | ) |
| Series II shares | | | (121,555,544 | ) | | | (71,631,264 | ) |
| | | | |
| Total distributions from distributable earnings | | | (215,053,479 | ) | | | (124,972,309 | ) |
| Beneficial Interest Transactions | | | | | | | | |
| Net increase in net assets resulting from beneficial interest transactions: | | | | | | | | |
| Series I shares | | | 30,061,913 | | | | 17,298,831 | |
| Series II shares | | | 29,147,063 | | | | (27,705,526 | ) |
| | | | |
| Total beneficial interest transactions | | | 59,208,976 | | | | (10,406,695 | ) |
| Net Assets | | | | | | | | |
| Total increase (decrease) | | | 185,655,714 | | | | (230,306,105 | ) |
| Beginning of period | | | 1,116,627,536 | | | | 1,346,933,641 | |
| | | | |
| End of period | | $ | 1,302,283,250 | | | $ | 1,116,627,536 | |
| | | | |
See accompanying Notes to Financial Statements.
12 INVESCO OPPENHEIMER V.I. MAIN STREET FUND
FINANCIAL HIGHLIGHTS
| | | | | | | | | | | | | | | | | | | | |
| Series I Shares | | Year Ended
December 31,
2019 | | Year Ended
December 31,
2018 | | Year Ended
December 31,
2017 | | Year Ended
December 31,
2016 | | Year Ended
December 31,
2015 |
| Per Share Operating Data | | | | | | | | | | | | | | | | | | | | |
| Net asset value, beginning of period | | | $26.82 | | | | $32.25 | | | | $28.41 | | | | $29.24 | | | | $33.61 | |
| Income (loss) from investment operations: | | | | | | | | | | | | | | | | | | | | |
| Net investment income1 | | | 0.32 | | | | 0.32 | | | | 0.34 | | | | 0.33 | | | | 0.33 | |
| Net realized and unrealized gain (loss) | | | 7.73 | | | | (2.55) | | | | 4.41 | | | | 2.76 | | | | 0.80 | |
| | | | |
| Total from investment operations | | | 8.05 | | | | (2.23) | | | | 4.75 | | | | 3.09 | | | | 1.13 | |
| Dividends and/or distributions to shareholders: | | | | | | | | | | | | | | | | | | | | |
| Dividends from net investment income | | | (0.34) | | | | (0.38) | | | | (0.39) | | | | (0.34) | | | | (0.32) | |
| Distributions from net realized gain | | | (5.09) | | | | (2.82) | | | | (0.52) | | | | (3.58) | | | | (5.18) | |
| | | | |
| Total dividends and/or distributions to shareholders | | | (5.43) | | | | (3.20) | | | | (0.91) | | | | (3.92) | | | | (5.50) | |
| Net asset value, end of period | | | $29.44 | | | | $26.82 | | | | $32.25 | | | | $28.41 | | | | $29.24 | |
| | | | |
| | | | | | | | | | | | | | | | | | | | |
| Total Return, at Net Asset Value2 | | | 32.03% | | | | (7.89)% | | | | 16.91% | | | | 11.62% | | | | 3.33% | |
| | | | | | | | | | | | | | | | | | | | |
| Ratios/Supplemental Data | | | | | | | | | | | | | | | | | | | | |
| Net assets, end of period (in thousands) | | | $570,821 | | | | $485,230 | | | | $561,555 | | | | $485,196 | | | | $518,456 | |
| Average net assets (in thousands) | | | $546,812 | | | | $543,152 | | | | $535,770 | | | | $502,522 | | | | $541,020 | |
| Ratios to average net assets:3 | | | | | | | | | | | | | | | | | | | | |
| Net investment income | | | 1.11% | | | | 1.03% | | | | 1.12% | | | | 1.16% | | | | 1.05% | |
| Expenses excluding specific expenses listed below | | | 0.82% | | | | 0.80% | | | | 0.78% | | | | 0.79% | | | | 0.78% | |
| Interest and fees from borrowings4 | | | 0.00% | | | | 0.00% | | | | 0.00% | | | | 0.00% | | | | 0.00% | |
| | | | |
| Total expenses5 | | | 0.82% | | | | 0.80% | | | | 0.78% | | | | 0.79% | | | | 0.78% | |
| Expenses after payments, waivers and/or reimbursements and reduction to custodian expenses | | | 0.80% | | | | 0.80%6 | | | | 0.78%6 | | | | 0.79%6 | | | | 0.78%6 | |
| Portfolio turnover rate7 | | | 43% | | | | 65% | | | | 35% | | | | 33% | | | | 44% | |
1. Calculated based on the average shares outstanding during the period.
2. Includes adjustments in accordance with accounting principles generally accepted in the United States of America and as such, the net asset value for financial reporting purposes and the returns based upon those net asset values may differ from the net asset value and returns for shareholder transactions. Total returns are not annualized for periods less than one year, if applicable and do not reflect charges assessed in connection with a variable product, which if included would reduce total returns.
3. Annualized for periods less than one full year.
4. Less than 0.005%.
5. Total expenses including indirect expenses from fund fees and expenses were as follows:
| | | | | | |
| Year Ended December 31, 2019 | | | 0.82 | % | | |
| Year Ended December 31, 2018 | | | 0.80 | % | | |
| Year Ended December 31, 2017 | | | 0.78 | % | | |
| Year Ended December 31, 2016 | | | 0.79 | % | | |
| Year Ended December 31, 2015 | | | 0.78 | % | | |
6. Waiver was less than 0.005%.
7. Portfolio turnover is calculated at the fund level and is not annualized for periods less than one year, if applicable.
See accompanying Notes to Financial Statements.
13 INVESCO OPPENHEIMER V.I. MAIN STREET FUND
FINANCIAL HIGHLIGHTSContinued
| | | | | | | | | | | | | | | | | | | | |
| Series II Shares | | Year Ended
December 31,
2019 | | Year Ended
December 31,
2018 | | Year Ended
December 31,
2017 | | Year Ended
December 31,
2016 | | Year Ended
December 31,
2015 |
| Per Share Operating Data | | | | | | | | | | | | | | | | | | | | |
| Net asset value, beginning of period | | | $26.51 | | | | $31.91 | | | | $28.12 | | | | $28.98 | | | | $33.33 | |
| Income (loss) from investment operations: | | | | | | | | | | | | | | | | | | | | |
| Net investment income1 | | | 0.25 | | | | 0.24 | | | | 0.26 | | | | 0.26 | | | | 0.25 | |
| Net realized and unrealized gain (loss) | | | 7.64 | | | | (2.53) | | | | 4.37 | | | | 2.72 | | | | 0.80 | |
| | | | |
| Total from investment operations | | | 7.89 | | | | (2.29) | | | | 4.63 | | | | 2.98 | | | | 1.05 | |
| Dividends and/or distributions to shareholders: | | | | | | | | | | | | | | | | | | | | |
| Dividends from net investment income | | | (0.26) | | | | (0.29) | | | | (0.32) | | | | (0.26) | | | | (0.22) | |
| Distributions from net realized gain | | | (5.09) | | | | (2.82) | | | | (0.52) | | | | (3.58) | | | | (5.18) | |
| | | | |
| Total dividends and/or distributions to shareholders | | | (5.35) | | | | (3.11) | | | | (0.84) | | | | (3.84) | | | | (5.40) | |
| Net asset value, end of period | | | $29.05 | | | | $26.51 | | | | $31.91 | | | | $28.12 | | | | $28.98 | |
| | | | |
| | | | | | | | | | | | | | | | | | | | |
| Total Return, at Net Asset Value2 | | | 31.74% | | | | (8.10)% | | | | 16.63% | | | | 11.30% | | | | 3.11% | |
| | | | | | | | | | | | | | | | | | | | |
| Ratios/Supplemental Data | | | | | | | | | | | | | | | | | | | | |
| Net assets, end of period (in thousands) | | | $731,463 | | | | $631,398 | | | | $785,379 | | | | $772,594 | | | | $715,328 | |
| Average net assets (in thousands) | | | $711,914 | | | | $740,691 | | | | $788,342 | | | | $725,836 | | | | $757,218 | |
| Ratios to average net assets:3 | | | | | | | | | | | | | | | | | | | | |
| Net investment income | | | 0.86% | | | | 0.78% | | | | 0.87% | | | | 0.94% | | | | 0.80% | |
| Expenses excluding specific expenses listed below | | | 1.07% | | | | 1.05% | | | | 1.03% | | | | 1.04% | | | | 1.03% | |
| Interest and fees from borrowings4 | | | 0.00% | | | | 0.00% | | | | 0.00% | | | | 0.00% | | | | 0.00% | |
| | | | |
| Total expenses5 | | | 1.07% | | | | 1.05% | | | | 1.03% | | | | 1.04% | | | | 1.03% | |
| Expenses after payments, waivers and/or reimbursements and reduction to custodian expenses | | | 1.05% | | | | 1.05%6 | | | | 1.03%6 | | | | 1.04%6 | | | | 1.03%6 | |
| Portfolio turnover rate7 | | | 43% | | | | 65% | | | | 35% | | | | 33% | | | | 44% | |
1. Calculated based on the average shares outstanding during the period.
2. Includes adjustments in accordance with accounting principles generally accepted in the United States of America and as such, the net asset value for financial reporting purposes and the returns based upon those net asset values may differ from the net asset value and returns for shareholder transactions. Total returns are not annualized for periods less than one year, if applicable and do not reflect charges assessed in connection with a variable product, which if included would reduce total returns.
3. Annualized for periods less than one full year.
4. Less than 0.005%.
5. Total expenses including indirect expenses from fund fees and expenses were as follows:
| | | | | | |
| Year Ended December 31, 2019 | | | 1.07 | % | | |
| Year Ended December 31, 2018 | | | 1.05 | % | | |
| Year Ended December 31, 2017 | | | 1.03 | % | | |
| Year Ended December 31, 2016 | | | 1.04 | % | | |
| Year Ended December 31, 2015 | | | 1.03 | % | | |
6. Waiver was less than 0.005%.
7. Portfolio turnover is calculated at the fund level and is not annualized for periods less than one year, if applicable.
See accompanying Notes to Financial Statements.
14 INVESCO OPPENHEIMER V.I. MAIN STREET FUND
NOTES TO FINANCIAL STATEMENTSDecember 31, 2019
Note 1 – Significant Accounting Policies
Invesco Oppenheimer V.I. Main Street Fund (the “Fund”) is a series portfolio of AIM Variable Insurance Funds (Invesco Variable Insurance Funds) (the “Trust”). The Trust is a Delaware statutory trust registered under the Investment Company Act of 1940, as amended (the “1940 Act”), as anopen-end series management investment company authorized to issue an unlimited number of shares of beneficial interest. Information presented in these financial statements pertains only to the Fund. Matters affecting the Fund or each class will be voted on exclusively by the shareholders of such Fund or each class.
Prior to the close of business on May 24, 2019, the Fund operated as Oppenheimer Main Street Fund/VA (the “Acquired Fund” or “Predecessor Fund”). The Acquired Fund was reorganized after the close of business on May 24, 2019 (the “Reorganization Date”) through the transfer of all of its assets and liabilities to the Fund (the “Reorganization”).
Upon closing of the Reorganization, holders of the Acquired Fund’sNon-Service and Service shares received Series I and Series II shares of the Fund, respectively. Information for the Acquired Fund’sNon-Service and Service shares prior to the Reorganization is included with Series I and Series II, respectively, throughout this report.
The Fund’s investment objective is to seek capital appreciation.
The Fund currently offers two classes of shares, Series I and Series II, both of which are offered to insurance company separate accounts funding variable annuity contracts and variable life insurance policies (“variable products”).
The Fund is an investment company and accordingly follows the investment company accounting and reporting guidance in accordance with Financial
Accounting Standards Board Accounting Standards Codification Topic 946, Financial Services – Investment Companies. The following is a summary of the significant accounting policies followed by the Fund in the preparation of its financial statements.
| A. | | Security Valuations– Securities, including restricted securities, are valued according to the following policy. |
A security listed or traded on an exchange (except convertible securities) is valued at its last sales price or official closing price as of the close of the customary trading session on the exchange where the security is principally traded, or lacking any sales or official closing price on a particular day, the security may be valued at the closing bid price on that day. Securities traded in theover-the-counter market are valued based on prices furnished by independent pricing services or market makers. When such securities are valued by an independent pricing service they may be considered fair valued. Futures contracts are valued at the final settlement price set by an exchange on which they are principally traded. Listed options are valued at the mean between the last bid and asked prices from the exchange on which they are principally traded. Options not listed on an exchange are valued by an independent source at the mean between the last bid and asked prices. For purposes of determining net asset value (“NAV”) per share, futures and option contracts generally are valued 15 minutes after the close of the customary trading session of the New York Stock Exchange (“NYSE”).
Investments inopen-end andclosed-end registered investment companies that do not trade on an exchange are valued at theend-of-day net asset value per share. Investments inopen-end andclosed-end registered investment companies that trade on an exchange are valued at the last sales price or official closing price as of the close of the customary trading session on the exchange where the security is principally traded.
Debt obligations (including convertible securities) and unlisted equities are fair valued using an evaluated quote provided by an independent pricing service. Evaluated quotes provided by the pricing service may be determined without exclusive reliance on quoted prices, and may reflect appropriate factors such asinstitution-size trading in similar groups of securities, developments related to specific securities, dividend rate (for unlisted equities), yield (for debt obligations), quality, type of issue, coupon rate (for debt obligations), maturity (for debt obligations), individual trading characteristics and other market data. Pricing services generally value debt obligations assuming orderly transactions of institutional round lot size, but a fund may hold or transact in the same securities in smaller, odd lot sizes. Odd lots often trade at lower prices than institutional round lots. Debt obligations are subject to interest rate and credit risks. In addition, all debt obligations involve some risk of default with respect to interest and/or principal payments.
Foreign securities’ (including foreign exchange contracts) prices are converted into U.S. dollar amounts using the applicable exchange rates as of the close of the NYSE. If market quotations are available and reliable for foreign exchange-traded equity securities, the securities will be valued at the market quotations. Because trading hours for certain foreign securities end before the close of the NYSE, closing market quotations may become unreliable. If between the time trading ends on a particular security and the close of the customary trading session on the NYSE, events occur that the investment adviser determines are significant and make the closing price unreliable, the Fund may fair value the security. If the event is likely to have affected the closing price of the security, the security will be valued at fair value in good faith using procedures approved by the Board of Trustees. Adjustments to closing prices to reflect fair value may also be based on a screening process of an independent pricing service to indicate the degree of certainty, based on historical data, that the closing price in the principal market where a foreign security trades is not the current value as of the close of the NYSE. Foreign securities’ prices meeting the approved degree of certainty that the price is not reflective of current value will be priced at the indication of fair value from the independent pricing service. Multiple factors may be considered by the independent pricing service in determining adjustments to reflect fair value and may include information relating to sector indices, American Depositary Receipts and domestic and foreign index futures. Foreign securities may have additional risks including exchange rate changes, potential for sharply devalued currencies and high inflation, political and economic upheaval, the relative lack of issuer information, relatively low market liquidity and the potential lack of strict financial and accounting controls and standards.
Securities for which market prices are not provided by any of the above methods may be valued based upon quotes furnished by independent sources. The last bid price may be used to value equity securities. The mean between the last bid and asked prices is used to value debt obligations, including corporate loans.
Securities for which market quotations are not readily available or became unreliable are valued at fair value as determined in good faith by or under the supervision of the Trust’s officers following procedures approved by the Board of Trustees. Issuer specific events, market trends, bid/ asked quotes of brokers and information providers and other market data may be reviewed in the course of making a good faith determination of a
15 INVESCO OPPENHEIMER V.I. MAIN STREET FUND
NOTES TO FINANCIAL STATEMENTSContinued
security’s fair value.
The Fund may invest in securities that are subject to interest rate risk, meaning the risk that the prices will generally fall as interest rates rise and, conversely, the prices will generally rise as interest rates fall. Specific securities differ in their sensitivity to changes in interest rates depending on their individual characteristics. Changes in interest rates may result in increased market volatility, which may affect the value and/or liquidity of certain Fund investments.
Valuations change in response to many factors including the historical and prospective earnings of the issuer, the value of the issuer’s assets, general economic conditions, interest rates, investor perceptions and market liquidity. Because of the inherent uncertainties of valuation, the values reflected in the financial statements may materially differ from the value received upon actual sale of those investments.
| B. | | Securities Transactions and Investment Income -Securities transactions are accounted for on a trade date basis. Realized gains or losses on sales are computed on the basis of specific identification of the securities sold. Interest income (net of withholding tax, if any) is recorded on the accrual basis from settlement date. Dividend income (net of withholding tax, if any) is recorded on theex-dividend date. |
The Fund may periodically participate in litigation related to Fund investments. As such, the Fund may receive proceeds from litigation settlements. Any proceeds received are included in the Statement of Operations as realized gain (loss) for investments no longer held and as unrealized gain (loss) for investments still held.
Brokerage commissions and mark ups are considered transaction costs and are recorded as an increase to the cost basis of securities purchased and/or a reduction of proceeds on a sale of securities. Such transaction costs are included in the determination of net realized and unrealized gain (loss) from investment transactions reported in the Statement of Operations and the Statement of Changes in Net Assets and the net realized and unrealized gains (losses) on securities per share in the Financial Highlights. Transaction costs are included in the calculation of the Fund’s net asset value and, accordingly, they reduce the Fund’s total returns. These transaction costs are not considered operating expenses and are not reflected in net investment income reported in the Statement of Operations and the Statement of Changes in Net Assets, or the net investment income per share and the ratios of expenses and net investment income reported in the Financial Highlights, nor are they limited by any expense limitation arrangements between the Fund and the investment adviser.
The Fund allocates income and realized and unrealized capital gains and losses to a class based on the relative net assets of each class.
| C. | | Country Determination- For the purposes of making investment selection decisions and presentation in the Schedule of Investments, the investment adviser may determine the country in which an issuer is located and/or credit risk exposure based on various factors. These factors include the laws of the country under which the issuer is organized, where the issuer maintains a principal office, the country in which the issuer derives 50% or more of its total revenues and the country that has the primary market for the issuer’s securities, as well as other criteria. Among the other criteria that may be evaluated for making this determination are the country in which the issuer maintains 50% or more of its assets, the type of security, financial guarantees and enhancements, the nature of the collateral and the sponsor organization. |
| D. | | Distributions -Dividends and distributions to shareholders, which are determined in accordance with income tax regulations and may differ from accounting principles generally accepted in the United States of America (“GAAP”), are recorded on theex-dividend date. Income and capital gain distributions, if any, are declared and paid annually to separate accounts of participating insurance companies or at other times as determined necessary by the Adviser. |
| E. | | Master Limited Partnerships - The Fund invests in Master Limited Partnerships (“MLPs”). MLPs are publicly traded partnerships and limited liability companies taxed as partnerships under the Internal Revenue Code of 1986, as amended (the “Internal Revenue Code”). The Fund invests in MLPs engaged in, among other things, the transportation, storage, processing, refining, marketing, exploration, production and mining of minerals and natural resources. The Fund is a partner in each MLP; accordingly, the Fund is required to take into account the Fund’s allocable share of income, gains, losses, deductions, expenses, and tax credits recognized by each MLP. |
MLP’s may be less liquid and subject to more abrupt or erratic price movements than conventional publicly traded securities.
| F. | | Return of Capital -Distributions received from the Fund’s investments in MLPs generally are comprised of income and return of capital. The Fund records investment income and return of capital based on estimates made at the time such distributions are received. The return of capital portion of the distribution is a reduction to investment income that results in an equivalent reduction in the cost basis of the associated investments and increases net realized gains (losses) and change in unrealized appreciation (depreciation). Such estimates are based on historical information available from each MLP and other industry sources. These estimates will subsequently be revised and may materially differ primarily based on information received from the MLPs after their tax reporting periods are concluded. |
| G. | | Federal Income Taxes -The Fund intends to comply with the requirements of Subchapter M of the Internal Revenue Code of 1986, as amended (the “Internal Revenue Code”), necessary to qualify as a regulated investment company and to distribute substantially all of the Fund’s taxable earnings to shareholders. As such, the Fund will not be subject to federal income taxes on otherwise taxable income (including net realized capital gain) that is distributed to shareholders. Therefore, no provision for federal income taxes is recorded in the financial statements. |
The Fund recognizes the tax benefits of uncertain tax positions only when the position is more likely than not to be sustained. Management has analyzed the Fund’s uncertain tax positions and concluded that no liability for unrecognized tax benefits should be recorded related to uncertain tax positions. Management is not aware of any tax positions for which it is reasonably possible that the total amounts of unrecognized tax benefits will change materially in the next 12 months.
The Fund files tax returns in the U.S. Federal jurisdiction and certain other jurisdictions. Generally, the Fund is subject to examinations by such taxing authorities for up to three years after the filing of the return for the tax period.
| H. | | Expenses -Fees provided for under the Rule12b-1 plan of a particular class of the Fund are charged to the operations of such class. Transfer agency fees and expenses and other shareholder recordkeeping fees and expenses relating to all other classes are allocated among those classes based on relative net assets. All other expenses are allocated among the classes based on relative net assets. |
16 INVESCO OPPENHEIMER V.I. MAIN STREET FUND
| I. | | Accounting Estimates -The financial statements are prepared on a basis in conformity with GAAP, which requires management to make estimates and assumptions that affect the reported amounts of assets and liabilities at the date of the financial statements and the reported amounts of revenues and expenses during the reporting period including estimates and assumptions related to taxation. Actual results could differ from those estimates by a significant amount. In addition, the Fund monitors for material events or transactions that may occur or become known after theperiod-end date and before the date the financial statements are released to print. |
| J. | | Indemnifications -Under the Trust’s organizational documents, each Trustee, officer, employee or other agent of the Trust is indemnified against certain liabilities that may arise out of the performance of their duties to the Fund. Additionally, in the normal course of business, the Fund enters into contracts, including the Fund’s servicing agreements, that contain a variety of indemnification clauses. The Fund’s maximum exposure under these arrangements is unknown as this would involve future claims that may be made against the Fund that have not yet occurred. The risk of material loss as a result of such indemnification claims is considered remote. |
| K. | | Foreign Currency Translations -Foreign currency is valued at the close of the NYSE based on quotations posted by banks and major currency dealers. Portfolio securities and other assets and liabilities denominated in foreign currencies are translated into U.S. dollar amounts at the date of valuation. Purchases and sales of portfolio securities (net of foreign taxes withheld on disposition) and income items denominated in foreign currencies are translated into U.S. dollar amounts on the respective dates of such transactions. The Fund does not separately account for the portion of the results of operations resulting from changes in foreign exchange rates on investments and the fluctuations arising from changes in market prices of securities held. The combined results of changes in foreign exchange rates and the fluctuation of market prices on investments (net of estimated foreign tax withholding) are included with the net realized and unrealized gain or loss from investments in the Statement of Operations. Reported net realized foreign currency gains or losses arise from (1) sales of foreign currencies, (2) currency gains or losses realized between the trade and settlement dates on securities transactions, and (3) the difference between the amounts of dividends, interest, and foreign withholding taxes recorded on the Fund’s books and the U.S. dollar equivalent of the amounts actually received or paid. Net unrealized foreign currency gains and losses arise from changes in the fair values of assets and liabilities, other than investments in securities at fiscal period end, resulting from changes in exchange rates. The Fund may invest in foreign securities, which may be subject to foreign taxes on income, gains on investments or currency repatriation, a portion of which may be recoverable. Foreign taxes, if any, are recorded based on the tax regulations and rates that exist in the foreign markets in which the Fund invests and are shown in the Statement of Operations. |
Note 2 – Advisory Fees and Other Fees Paid to Affiliates
The Trust has entered into a master investment advisory agreement with Invesco Advisers, Inc. (the “Adviser” or “Invesco”). Under the terms of the investment advisory agreement, the Fund accrues daily and pays monthly an advisory fee to the Adviser based on the annual rate of the Fund’s average daily net assets as follows:
| | | | |
| Fee Schedule* | |
| Up to $200 million | | | 0.75 | % |
| Next $200 million | | | 0.72 | |
| Next $200 million | | | 0.69 | |
| Next $200 million | | | 0.66 | |
| Next $200 million | | | 0.60 | |
| Next $4 billion | | | 0.58 | |
| Over $5 billion | | | 0.56 | |
* The advisory fee paid by the Fund shall be reduced by any amounts paid by the Fund under the administrative services agreement with the Adviser.
For theyearended December 31, 2019, the effective advisory fees incurred by the Fund was 0.65%.
From the beginning of the fiscal period until the date of the Reorganization, the Acquired Fund paid $3,249,790in advisory fees to OFI Global Asset Management, Inc. based on the annual rates above of the Acquired Fund’s average daily net assets.
Under the terms of a mastersub-advisory agreement between the Adviser and each of Invesco Asset Management Deutschland GmbH, Invesco Asset Management Limited, Invesco Asset Management (Japan) Limited, Invesco Hong Kong Limited, Invesco Senior Secured Management, Inc. and Invesco Canada Ltd. and separatesub-advisory agreements with Invesco Capital Management LLC, and Invesco Asset Management (India) Private Limited (collectively, the “AffiliatedSub-Advisers”) the Adviser, not the Fund, will pay 40% of the fees paid to the Adviser to any such AffiliatedSub-Adviser(s) that provide(s) discretionary investment management services to the Fund based on the percentage of assets allocated to such AffiliatedSub-Adviser(s). Invesco has also entered into aSub-Advisory Agreement with OppenheimerFunds, Inc. to provide discretionary management services to the Funds.
Effective on the Reorganization Date, the Adviser has contractually agreed, through May 31, 2021, to waive advisory fees and/or reimburse expenses of all shares to the extent necessary to limit the total annual fund operating expenses after fee waiver and/or expense reimbursement (excluding certain items discussed below) ofSeries I and Series II shares to 0.80% and 1.05%, respectively, of the Fund’s average daily net assets (the “expense limits”). In determining the Adviser’s obligation to waive advisory fees and/or reimburse expenses, the following expenses are not taken into account, and could cause total annual fund operating expenses after fee waivers and/or expense reimbursement to exceed the numbers reflected above: (1) interest; (2) taxes; (3) dividend expenses on short sales; (4) extraordinary ornon-routine items, including litigation expenses; and (5) expenses that the Fund has incurred but did not actually pay because of an expense offset arrangement. Unless Invesco continues the fee waiver agreement, it will terminate on May 31, 2021. During its term, the fee waiver agreement cannot be terminated or amended to increase the expense limits or reduce the advisory fee waiver without approval of the Board of Trustees.
Further, the Adviser has contractually agreed, through at least June 30, 2021, to waive the advisory fee payable by the Fund in an amount equal
17 INVESCO OPPENHEIMER V.I. MAIN STREET FUND
NOTES TO FINANCIAL STATEMENTSContinued
to 100% of the net advisory fees the Adviser receives from the affiliated money market funds on investments by the Fund of uninvested cash in such affiliated money market funds.
For the year ended December 31, 2019, the Adviser waived advisory fees of $20,507 and reimbursed Fund expenses of $87,745 and $126,110 for Series I and Series II shares, respectively.
The Trust has entered into a master administrative services agreement with Invesco pursuant to which the Fund has agreed to pay Invesco a fee for costs incurred in providing accounting services and fund administrative services to the Fund and to reimburse Invesco for fees paid to insurance companies that have agreed to provide certain administrative services to the Fund. These administrative services provided by the insurance companies may include, among other things: maintenance of master accounts with the Fund; tracking, recording and transmitting net purchase and redemption orders for Fund shares; maintaining and preserving records related to the purchase, redemption and other account activity of variable product owners; distributing copies of Fund documents such as prospectuses, proxy materials and periodic reports, to variable product owners, and responding to inquiries from variable product owners about the Fund. Pursuant to such agreement, for the year ended December 31, 2019, Invesco was paid $107,793 for accounting and fund administrative services and was reimbursed $1,067,273 for fees paid to insurance companies. Additionally, Invesco has entered into service agreements whereby JP Morgan Chase Bank serves as custodian to the Fund. Prior to the Reorganization, the Acquired Fund paid administrative fees to OFI Global Asset Management, Inc.
The Trust has entered into a transfer agency and service agreement with Invesco Investment Services, Inc. (“IIS”) pursuant to which the Fund has agreed to pay IIS a fee for providing transfer agency and shareholder services to the Fund and reimburse IIS for certain expenses incurred by IIS in the course of providing such services. Prior to the Reorganization, the Acquired Fund paid transfer agent fees to OFI Global Asset Management, Inc. and Shareholder Services, Inc. For the yearended December 31, 2019, expenses incurred under these agreements are shown in the Statement of Operations as Transfer and shareholder servicing agent fees.
The Trust has entered into master distribution agreements with Invesco Distributors, Inc. (“IDI”) to serve as the distributor for the Series II shares of the Fund. The Trust has adopted a plan pursuant to Rule12b-1 under the 1940 Act with respect to the Fund’s Series II shares (the “Plan”). The Fund, pursuant to the Plan, pays IDI at an annual rate of 0.25% of the average daily net assets of Series II shares. The fees are accrued daily and paid monthly. Of the Plan payments, up to 0.25% of the average daily net assets of the class of shares may be paid to insurance companies who furnish continuing personal shareholder services to customers who purchase and own shares of such class. Any amounts not paid as a service fee under the Plan would constitute an asset-based sales charge. Rules of the Financial Industry Regulatory Authority (“FINRA”) impose a cap on the total sales charges, including asset-based sales charges, that may be paid by any class of shares of the Fund plans. Prior to the Reorganization, the Acquired Fund paid distribution fees to OppenheimerFunds Distributor, Inc. For the yearended December 31, 2019, expenses incurred under the plans are shown in the Statement of Operations as Distribution and service plan fees.
Certain officers and trustees of the Trust are officers and directors of the Adviser, IIS and/or IDI.
Note 3 – Additional Valuation Information
GAAP defines fair value as the price that would be received to sell an asset or paid to transfer a liability in an orderly transaction between market participants at the measurement date, under current market conditions. GAAP establishes a hierarchy that prioritizes the inputs to valuation methods, giving the highest priority to readily available unadjusted quoted prices in an active market for identical assets (Level 1) and the lowest priority to significant unobservable inputs (Level 3), generally when market prices are not readily available or are unreliable. Based on the valuation inputs, the securities or other investments are tiered into one of three levels. Changes in valuation methods may result in transfers in or out of an investment’s assigned level:
Level 1 — Prices are determined using quoted prices in an active market for identical assets.
Level 2 — Prices are determined using other significant observable inputs. Observable inputs are inputs that other market participants may use in pricing a security. These may include quoted prices for similar securities, interest rates, prepayment speeds, credit risk, yield curves, loss severities, default rates, discount rates, volatilities and others.
Level 3 — Prices are determined using significant unobservable inputs. In situations where quoted prices or observable inputs are unavailable (for example, when there is little or no market activity for an investment at the end of the period), unobservable inputs may be used. Unobservable inputs reflect the Fund’s own assumptions about the factors market participants would use in determining fair value of the securities or instruments and would be based on the best available information.
The following is a summary of the tiered valuation input levels, as of December 31, 2019. The level assigned to the securities valuations may not be an indication of the risk or liquidity associated with investing in those securities. Because of the inherent uncertainties of valuation, the values reflected in the financial statements may materially differ from the value received upon actual sale of those investments.
| | | | | | | | | | | | | | | | |
| | | Level 1— Unadjusted Quoted Prices | | Level 2— Other Significant
Observable Inputs | | Level 3— Significant
Unobservable
Inputs | | Value |
| Assets Table | | | | | | | | | | | | | | | | |
| Investments, at Value: | | | | | | | | | | | | | | | | |
| Common Stocks | | | | | | | | | | | | | | | | |
Consumer Discretionary | | $ | 253,507,281 | | | $ | — | | | $ | — | | | $ | 253,507,281 | |
Consumer Staples | | | 66,785,474 | | | | 10,754,744 | | | | — | | | | 77,540,218 | |
18 INVESCO OPPENHEIMER V.I. MAIN STREET FUND
| | | | | | | | | | | | | | | | |
| | | Level 1— Unadjusted Quoted Prices | | Level 2— Other Significant
Observable Inputs | | Level 3— Significant
Unobservable
Inputs | | Value |
| Common Stocks (Continued) | | | | | | | | | | | | | | | | |
Energy | | $ | 69,268,345 | | | $ | — | | | $ | — | | | $ | 69,268,345 | |
Financials | | | 270,860,864 | | | | 9,006,912 | | | | — | | | | 279,867,776 | |
Health Care | | | 214,405,375 | | | | — | | | | — | | | | 214,405,375 | |
Industrials | | | 111,728,653 | | | | — | | | | — | | | | 111,728,653 | |
Information Technology | | | 222,337,749 | | | | — | | | | — | | | | 222,337,749 | |
Materials | | | 7,287,302 | | | | — | | | | — | | | | 7,287,302 | |
Telecommunication Services | | | 26,291,173 | | | | — | | | | — | | | | 26,291,173 | |
Utilities | | | 22,776,096 | | | | — | | | | — | | | | 22,776,096 | |
| Investment Company | | | 14,860,862 | | | | — | | | | — | | | | 14,860,862 | |
| | | | |
| Total Assets | | $ | 1,280,109,174 | | | $ | 19,761,656 | | | $ | — | | | $ | 1,299,870,830 | |
| | | | |
Note 4 – Security Transactions with Affiliated Funds
The Fund is permitted to purchase or sell securities from or to certain other Invesco Funds under specified conditions outlined in procedures adopted by the Board of Trustees of the Trust. The procedures have been designed to ensure that any purchase or sale of securities by the Fund from or to another fund or portfolio that is or could be considered an affiliate by virtue of having a common investment adviser (or affiliated investment advisers), common Trustees and/or common officers complies with Rule17a-7 of the 1940 Act. Further, as defined under the procedures, each transaction is effected at the current market price. Pursuant to these procedures for the period January 1, 2019 to May 24, 2019,the Predecessor Fund engaged in transactions with affiliates as listed: Securities sales of $4,383,960, which resulted in net realized gainsof $221,208. For the period May 25, 2019 to December 31, 2019, the Fund engaged in transactions with affiliates as listed: Securities purchased of $4,918,922 and securities sales of $12,411,089, which resulted in net realized gains of $1,863,022.
Note 5 – Expense Offset Arrangement
The expense offset arrangement is comprised of custodian credits which result from periodic overnight cash balances at the custodian. For theyearended December 31, 2019, the Fund received credits from this arrangement, which resulted in the reduction of the Fund’s total expenses of $4,880.
Note 6 – Trustee and Officer Fees and Benefits
Certain Trustees have executed Deferred Compensation Agreement(s) pursuant to which they have the option to elect to defer receipt of all or a portion of the annual compensation they are entitled to receive from the Fund. For purposes of determining the amount owed to the Trustees under the plan(s), deferred amounts are treated as though equal dollar amounts had been invested in shares of the Fund or in other Invesco and/or Invesco Oppenheimer funds selected by the Trustees. The Fund purchases shares of the funds selected for deferral by the Trustees in amounts equal to his or her deemed investment, resulting in a Fund asset equal to the deferred compensation liability. Such assets are included as a component of “Other” within the asset section of the Statement of Assets and Liabilities. Deferral of Trustees’ fees under the plan(s) will not affect the net assets of the Fund and will not materially affect the Fund’s assets, liabilities or net investment income per share. Amounts will be deferred until distributed in accordance with the Deferred Compensation Agreement(s).
Note 7 – Cash Balances
The Fund is permitted to temporarily carry a negative or overdrawn balance in its account with JPMorgan Chase Bank, the custodian bank. Such balances, if any atperiod-end, are shown in the Statement of Assets and Liabilities under the payable caption Amount due custodian. To compensate the custodian bank for such overdrafts, the overdrawn Fund may either (1) leave funds as a compensating balance in the account so the custodian bank can be compensated by earning the additional interest; or (2) compensate by paying the custodian bank at a rate agreed upon by the custodian bank and Invesco, not to exceed the contractually agreed upon rate.
Note 8 – Distributions to Shareholders and Tax Components of Net Assets
Tax Character of Distributions to Shareholders Paid During the Fiscal Years Ended December 31, 2019 and 2018:
| | | | | | | | |
| | | 2019 | | | 2018 | |
| Ordinary income | | $ | 15,468,146 | | | $ | 27,663,938 | |
| Long-term capital gain | | | 199,585,333 | | | | 97,308,371 | |
| | | | |
| Total distributions | | $ | 215,053,479 | | | $ | 124,972,309 | |
| | | | |
19 INVESCO OPPENHEIMER V.I. MAIN STREET FUND
NOTES TO FINANCIAL STATEMENTSContinued
Tax Components of Net Assets atPeriod-End:
| | | | |
| | | 2019 | |
| Undistributed ordinary income | | $ | 19,327,783 | |
| Undistributed long-term gain | | | 92,530,791 | |
| Net unrealized appreciation - investments | | | 318,333,446 | |
| Temporary book/tax differences | | | (152,927) | |
| Shares of beneficial interest | | | 872,244,157 | |
| | | | |
| Total net assets | | $ | 1,302,283,250 | |
| | | | |
The difference between book-basis andtax-basis unrealized appreciation (depreciation) is due to differences in the timing of recognition of gains and losses on investments for tax and book purposes. The Fund’s net unrealized appreciation (depreciation) difference is attributable primarily to wash sales and partnership transactions.
The temporary book/tax differences are a result of timing differences between book and tax recognition of income and/or expenses. The Fund’s temporary book/tax differences are the result of the trustee deferral of compensation and retirement plan benefits.
Capital loss carryforward is calculated and reported as of a specific date. Results of transactions and other activity after that date may affect the amount of capital loss carryforward actually available for the Fund to utilize. Capital losses generated in years beginning after December 22, 2010 can be carried forward for an unlimited period, whereas previous losses expire in eight tax years. Capital losses with an expiration period may not be used to offset capital gains until all net capital losses without an expiration date have been utilized. Capital loss carryforwards with no expiration date will retain their character as either short-term or long-term capital losses instead of as short-term capital losses as under prior law. The ability to utilize capital loss carryforwards in the future may be limited under the Internal Revenue Code and related regulations based on the results of future transactions.
The Fund has no capital loss carryforward as of December 31, 2019.
Note 9 – Investments Transactions
The aggregate amount of investment securities (other than short-term securities, U.S. Treasury obligations and money market funds, if any) purchased and sold by the Fund during theyearended December 31, 2019 was $535,246,314 and $678,399,374, respectively. Cost of investments, including any derivatives, on a tax basis includes the adjustments for financial reporting purposes as of the most recently completed federal income tax reportingperiod-end.
| | | | |
| Unrealized Appreciation (Depreciation) of Investments on a Tax Basis | |
| Aggregate unrealized appreciation of investments | | $ | 324,771,375 | |
| Aggregate unrealized (depreciation) of investments | | | (6,437,929) | |
| | | | |
| Net unrealized appreciation of investments | | $ | 318,333,446 | |
| | | | |
Cost of investments for tax purposes is$981,538,258.
Note 10 – Reclassification of Permanent Differences
Primarily as a result of differing book/tax treatment of partnership transactions, on December 31, 2019, undistributed net investment income was decreased by $2,653,476, undistributed net realized gain was increased by $2,653,327 and shares of beneficial interest was increased by $149. This reclassification had no effect on the net assets of the Fund.
Note 11 – Share Information
Transactions in shares of beneficial interest were as follows:
| | | | | | | | | | | | | | | | |
| | | Year Ended December 31, 20191 | | Year Ended December 31, 2018 |
| | | | |
| | | Shares | | Amount | | Shares | | Amount |
| Series I Shares | | | | | | | | | | | | | | | | |
| Sold | | | 673,942 | | | $ | 19,609,116 | | | | 1,272,402 | | | $ | 37,785,582 | |
| Dividends and/or distributions reinvested | | | 3,495,250 | | | | 93,497,935 | | | | 1,802,062 | | | | 53,341,045 | |
| Redeemed | | | (2,875,474 | ) | | | (83,045,138 | ) | | | (2,391,616 | ) | | | (73,827,796 | ) |
| | | | |
| Net increase (decrease) | | | 1,293,718 | | | $ | 30,061,913 | | | | 682,848 | | | $ | 17,298,831 | |
| | | | |
| | | | | | | | | | | | | | | | | |
| Series II Shares | | | | | | | | | | | | | | | | |
| Sold | | | 1,630,045 | | | $ | 46,915,384 | | | | 2,634,038 | | | $ | 78,888,308 | |
| Dividends and/or distributions reinvested | | | 4,599,150 | | | | 121,555,544 | | | | 2,444,753 | | | | 71,631,264 | |
| Redeemed | | | (4,866,048 | ) | | | (139,323,865 | ) | | | (5,873,057 | ) | | | (178,225,098 | ) |
| | | | |
| Net increase (decrease) | | | 1,363,147 | | | $ | 29,147,063 | | | | (794,266 | ) | | $ | (27,705,526 | ) |
| | | | |
20 INVESCO OPPENHEIMER V.I. MAIN STREET FUND
1.There are entities that are record owners of more than 5% of the outstanding shares of the Fund and own 50% of the outstanding shares of the Fund. The Fund and the Fund’s principal underwriter or adviser, are parties to participation agreements with these entities whereby these entities sell units of interest in separate accounts funding variable products that are invested in the Fund. The Fund, Invesco and/or Invesco affiliates may make payments to these entities, which are considered to be related to the Fund, for providing services to the Fund, Invesco and/or Invesco affiliates, including, but not limited to services such as securities brokerage, distribution, third party record keeping and account servicing. The Fund has no knowledge as to whether all or any portion of the shares owned of record by these entities are also owned beneficially.
Note 12 – Borrowings
Joint Credit Facility.A number of mutual funds managed by the Adviser participate in a $1.95 billion revolving credit facility (the “Facility”) intended to provide short-term financing, if necessary, subject to certain restrictions in connection with atypical redemption activity. Expenses and fees related to the Facility are paid by the participating funds and are disclosed separately or as other expenses on the Statement of Operations. The Fund did not utilize the Facility during the reporting period. The Facility terminated May 24, 2019.
21 INVESCO OPPENHEIMER V.I. MAIN STREET FUND
REPORT OF INDEPENDENT REGISTERED PUBLIC ACCOUNTING FIRM
To the Board of Trustees of AIM Variable Insurance Funds (Invesco Variable Insurance Funds) and Shareholders of Invesco Oppenheimer V.I. Main Street Fund®
Opinion on the Financial Statements
We have audited the accompanying statement of assets and liabilities, including the schedule of investments, of Invesco Oppenheimer V.I. Main Street Fund® (one of the funds constituting AIM Variable Insurance Funds (Invesco Variable Insurance Funds), referred to hereafter as the “Fund”) as of December 31, 2019, the related statements of operations and of changes in net assets for the year ended December 31, 2019, including the related notes, and the financial highlights for the period ended December 31, 2019 (collectively referred to as the “financial statements”). In our opinion, the financial statements present fairly, in all material respects, the financial position of the Fund as of December 31, 2019, the results of its operations and changes in its net assets for the year ended December 31, 2019 and the financial highlights for the period ended December 31, 2019 in conformity with accounting principles generally accepted in the United States of America.
The financial statements of Invesco Oppenheimer V.I. Main Street Fund® (formerly known as Oppenheimer Main Street Fund/VA) as of and for the year ended December 31, 2018 and the financial highlights for each of the periods ended on or prior to December 31, 2018 (not presented herein, other than the statement of changes in net assets and the financial highlights) were audited by other auditors whose report dated February 14, 2019 expressed an unqualified opinion on those financial statements and financial highlights.
Basis for Opinion
These financial statements are the responsibility of the Fund’s management. Our responsibility is to express an opinion on the Fund’s financial statements based on our audit. We are a public accounting firm registered with the Public Company Accounting Oversight Board (United States) (PCAOB) and are required to be independent with respect to the Fund in accordance with the U.S. federal securities laws and the applicable rules and regulations of the Securities and Exchange Commission and the PCAOB.
We conducted our audit of these financial statements in accordance with the standards of the PCAOB. Those standards require that we plan and perform the audit to obtain reasonable assurance about whether the financial statements are free of material misstatement, whether due to error or fraud.
Our audit included performing procedures to assess the risks of material misstatement of the financial statements, whether due to error or fraud, and performing procedures that respond to those risks. Such procedures included examining, on a test basis, evidence regarding the amounts and disclosures in the financial statements. Our audit also included evaluating the accounting principles used and significant estimates made by management, as well as evaluating the overall presentation of the financial statements. Our procedures included confirmation of securities owned as of December 31, 2019 by correspondence with the custodian, transfer agent and brokers; when replies were not received from brokers, we performed other auditing procedures. We believe that our audit provides a reasonable basis for our opinion.
/s/PricewaterhouseCoopers LLP
Houston, Texas
February 18, 2020
We have served as the auditor of one or more of the investment companies in the Invesco group of investment companies since at least 1995. We have not been able to determine the specific year we began serving as auditor.
22 INVESCO OPPENHEIMER V.I. MAIN STREET FUND
TAX INFORMATION
Form1099-DIV, Form1042-S and other year–end tax information provide shareholders with actual calendar year amounts that should be included in their tax returns. Shareholders should consult their tax advisers.
The following distribution information is being provided as required by the Internal Revenue Code or to meet a specific state’s requirement.
The Fund designates the following amounts or, if subsequently determined to be different, the maximum amount allowable for its fiscal year ended December 31, 2019:
Federal and State Income Tax
| | | | |
| Long-Term Capital Gain Distributions | | $ | 199,585,333 | |
| Corporate Dividends Received Deduction* | | | 99.97 | % |
* The above percentages are based on ordinary income dividends paid to shareholders during the Fund’s fiscal year.
23 INVESCO OPPENHEIMER V.I. MAIN STREET FUND
PORTFOLIO PROXY VOTING POLICIES AND GUIDELINES; UPDATES TO SCHEDULE OF INVESTMENTS
Go paperless with eDelivery
Visit invesco.com/edelivery to enjoy the convenience and security of anytime electronic access to your investment documents.
With eDelivery, you can elect to have any or all of the following materials delivered straight to your inbox to download, save and print from your own computer:
| · | | Fund reports and prospectuses |
Invesco mailing information
Send general correspondence to Invesco Investment Services, Inc., P.O. Box 219078, Kansas City, MO 64121-9078.
Important notice regarding delivery of security holder documents
To reduce Fund expenses, only one copy of most shareholder documents may be mailed to shareholders with multiple accounts at the same address (Householding). Mailing of your shareholder documents may be householded indefinitely unless you instruct us otherwise. If you do not want the mailing of these documents to be combined with those for other members of your household, please contact Invesco Investment Services, Inc. at 800 959 4246 or contact your financial institution. We will begin sending you individual copies for each account within 30 days after receiving your request.
Fund holdings and proxy voting information
The Fund provides a complete list of its holdings four times in each fiscal year, at the quarter ends. For the second and fourth quarters, the lists appear in the Fund’s semiannual and annual reports to shareholders. For the first and third quarters, the Fund files the lists with the Securities and Exchange Commission (SEC) as an exhibit to its reports on FormN-PORT. The most recent list of portfolio holdings is available at invesco.com/completeqtrholdings. Shareholders can also look up the Fund’s FormsN-PORT on the SEC website at sec.gov.
A description of the policies and procedures that the Fund uses to determine how to vote proxies relating to portfolio securities is available without charge, upon request, from our Client Services department at 800 959 4246 or at invesco.com/proxyguidelines. The information is also available on the SEC website, sec.gov.
Information regarding how the Fund voted proxies related to its portfolio securities during the most recent12-month period ended June 30 is available at invesco. com/proxysearch. The information is also available on the SEC website, sec.gov.
Invesco Advisers, Inc. is an investment adviser; it provides investment advisory services to individual and institutional clients and does not sell securities. Invesco Distributors, Inc. is the US distributor for Invesco Ltd.’s retail mutual funds, exchange-traded funds and institutional money market funds. Both are wholly owned, indirect subsidiaries of Invesco Ltd.
24 INVESCO OPPENHEIMER V.I. MAIN STREET FUND
TRUSTEES AND OFFICERS
The address of each trustee and officer is AIM Variable Insurance Funds (Invesco Variable Insurance Funds) (the “Trust”), 11 Greenway Plaza, Suite 1000, Houston, Texas 77046-1173. The trustees serve for the life of the Trust, subject to their earlier death, incapacitation, resignation, retirement or removal as more specifically provided in the Trust’s organizational documents. Each officer serves for a one year term or until their successors are elected and qualified. Column two below includes length of time served with predecessor entities, if any.
| | | | | | | | |
Name, Year of Birth and Position(s) Held with
the Trust | | Trustee and/or Officer Since | | Principal Occupation(s) During Past 5 Years | | Number of Funds in Fund Complex
Overseen by Trustee | | Other Directorship(s) Held by Trustee During Past 5 Years |
| INTERESTED PERSON | | | | | | | | |
Martin L. Flanagan1— 1960 Trustee and Vice Chair | | 2007 | | Executive Director, Chief Executive Officer and President, Invesco Ltd. (ultimate parent of Invesco and a global investment management firm); Trustee and Vice Chair, The Invesco Funds; Vice Chair, Investment Company Institute; and Member of Executive Board, SMU Cox School of Business Formerly: Advisor to the Board, Invesco Advisers, Inc. (formerly known as Invesco Institutional (N.A.), Inc.); Chairman and Chief Executive Officer, Invesco Advisers, Inc. (registered investment adviser); Director, Chairman, Chief Executive Officer and President, Invesco Holding Company (US), Inc. (formerly IVZ Inc.) (holding company), Invesco Group Services, Inc. (service provider) and Invesco North American Holdings, Inc. (holding company); Director, Chief Executive Officer and President, Invesco Holding Company Limited (parent of Invesco and a global investment management firm); Director, Invesco Ltd.; Chairman, Investment Company Institute and President,Co-Chief Executive Officer,Co-President, Chief Operating Officer and Chief Financial Officer, Franklin Resources, Inc. (global investment management organization) | | 229 | | None |
| 1Mr. Flanagan is considered an interested person (within the meaning of Section 2(a)(19) of the 1940 Act) of the Trust because he is an officer of the Adviser to the Trust, and an officer and a director of Invesco Ltd., ultimate parent of the Adviser. |
25 INVESCO OPPENHEIMER V.I. MAIN STREET FUND
TRUSTEES AND OFFICERS Continued
| | | | | | | | |
Name, Year of Birth and Position(s) Held with
the Trust | | Trustee and/or Officer Since | | Principal Occupation(s) During Past 5 Years | | Number of Funds in Fund Complex
Overseen by Trustee | | Other Directorship(s) Held by Trustee During Past 5 Years |
| INDEPENDENT TRUSTEES | | | | | | | | |
Bruce L. Crockett – 1944 Trustee and Chair | | 2003 | | Chairman, Crockett Technologies Associates (technology consulting company) Formerly: Director, Captaris (unified messaging provider); Director, President and Chief Executive Officer, COMSAT Corporation; Chairman, Board of Governors of INTELSAT (international communications company); ACE Limited (insurance company); Independent Directors Council and Investment Company Institute: Member of the Audit Committee, Investment Company Institute; Member of the Executive Committee and Chair of the Governance Committee, Independent Directors Council | | 229 | | Director and Chairman of the Audit Committee, ALPS (Attorneys Liability Protection Society) (insurance company); Director and Member of the Audit Committee and Compensation Committee, Ferroglobe PLC (metallurgical company) |
David C. Arch – 1945 Trustee | | 2010 | | Chairman of Blistex Inc. (consumer health care products manufacturer); Member, World Presidents’ Organization | | 229 | | Board member of the Illinois Manufacturers’ Association |
Beth Ann Brown – 1968 Trustee | | 2019 | | Independent Consultant Formerly: Head of Intermediary Distribution, Managing Director, Strategic Relations, Managing Director, Head of National Accounts, Senior Vice President, National Account Manager and Senior Vice President, Key Account Manager, Columbia Management Investment Advisers LLC; Vice President, Key Account Manager, Liberty Funds Distributor, Inc.; and Trustee of certain Oppenheimer Funds | | 229 | | Director, Board of Directors of Caron Engineering Inc.; Advisor, Board of Advisors of Caron Engineering Inc.; President and Director, of Acton Shapleigh Youth Conservation Corps (non - profit); and Vice President and Director of Grahamtastic Connection (non-profit) |
Jack M. Fields – 1952 Trustee | | 2003 | | Chief Executive Officer, Twenty First Century Group, Inc. (government affairs company); and Chairman, Discovery Learning Alliance(non-profit) Formerly: Owner and Chief Executive Officer, Dos Angeles Ranch L.P. (cattle, hunting, corporate entertainment); Director, Insperity, Inc. (formerly known as Administaff) (human resources provider); Chief Executive Officer, Texana Timber LP (sustainable forestry company); Director of Cross Timbers Quail Research Ranch(non-profit); and member of the U.S. House of Representatives | | 229 | | None |
Cynthia Hostetler — 1962 Trustee | | 2017 | | Non-Executive Director and Trustee of a number of public and private business corporations Formerly: Director, Aberdeen Investment Funds (4 portfolios); Head of Investment Funds and Private Equity, Overseas Private Investment Corporation; President, First Manhattan Bancorporation, Inc.; Attorney, Simpson Thacher & Bartlett LLP | | 229 | | Vulcan Materials Company (construction materials company); Trilinc Global Impact Fund; Genesee & Wyoming, Inc. (railroads); Artio Global Investment LLC (mutual fund complex); Edgen Group, Inc. (specialized energy and infrastructure products distributor); Investment Company Institute (professional organization); Independent Directors Council (professional organization) |
Eli Jones – 1961 Trustee | | 2016 | | Professor and Dean, Mays Business School - Texas A&M University Formerly: Professor and Dean, Walton College of Business, University of Arkansas and E.J. Ourso College of Business, Louisiana State University; Director, Arvest Bank | | 229 | | Insperity, Inc. (formerly known as Administaff) (human resources provider) |
Elizabeth Krentzman – 1959 Trustee | | 2019 | | Formerly: Principal and Chief Regulatory Advisor for Asset Management Services and U.S. Mutual Fund Leader of Deloitte & Touche LLP; General Counsel of the Investment Company Institute (trade association); National Director of the Investment Management Regulatory Consulting Practice, Principal, Director and Senior Manager of Deloitte & Touche LLP; Assistant Director of the Division of Investment Management - Office of Disclosure and Investment Adviser Regulation of the U.S. Securities and Exchange Commission and various positions with the Division of Investment Management – Office of Regulatory Policy of the U.S. Securities and Exchange Commission; Associate at Ropes & Gray LLP.; Advisory Board Member of the Securities and Exchange Commission Historical Society; and Trustee of certain Oppenheimer Funds | | 229 | | Trustee of the University of Florida National Board Foundation and Audit Committee Member; Member of the Cartica Funds Board of Directors (private investment funds); Member of the University of Florida Law Center Association, Inc. Board of Trustees and Audit Committee Member |
Anthony J. LaCava, Jr. – 1956 Trustee | | 2019 | | Formerly: Director and Member of the Audit Committee, Blue Hills Bank (publicly traded financial institution) and Managing Partner, KPMG LLP | | 229* | | Blue Hills Bank; Chairman of Bentley University; Member, Business School Advisory Council; and Nominating Committee, KPMG LLP |
26 INVESCO OPPENHEIMER V.I. MAIN STREET FUND
| | | | | | | | |
Name, Year of Birth and Position(s) Held with the Trust | | Trustee and/or Officer Since | | Principal Occupation(s) During Past 5 Years | | Number of Funds in Fund Complex
Overseen by Trustee | | Other Directorship(s) Held by Trustee During Past 5 Years |
| INDEPENDENT TRUSTEES (CONTINUED) | | | | | | | | |
Prema Mathai-Davis – 1950 Trustee | | 2003 | | Retired Co-Owner & Partner of Quantalytics Research, LLC, (a FinTech Investment Research Platform for the Self-Directed Investor) | | 229 | | None |
Joel W. Motley – 1952 Trustee | | 2019 | | Director of Office of Finance, Federal Home Loan Bank; Member of the Vestry of Trinity Wall Street; Managing Director of Carmona Motley Hoffman, Inc. (privately held financial advisor); Member of the Finance and Budget Committee of the Council on Foreign Relations, Member of the Investment Committee and Board of Human Rights Watch and Member of the Investment Committee and Board of Historic Hudson Valley(non-profit cultural organization). Formerly: Managing Director of Public Capital Advisors, LLC (privately held financial advisor); Managing Director of Carmona Motley Hoffman, Inc. (privately held financial advisor); Trustee of certain Oppenheimer Funds; and Director of Columbia Equity Financial Corp. (privately held financial advisor) | | 229 | | Director of Greenwall Foundation (bioethics research foundation); Member of Board and Investment Committee of The Greenwall Foundation; Director of Southern Africa Legal Services Foundation; Board Member and Investment Committee Member of Pulitzer Center for Crisis Reporting(non-profit journalism) |
Teresa M. Ressel — 1962 Trustee | | 2017 | | Non-executive director and trustee of a number of public and private business corporations Formerly: Chief Financial Officer, Olayan America, The Olayan Group (international investor/commercial/industrial); Chief Executive Officer, UBS Securities LLC; Group Chief Operating Officer, Americas, UBS AG; Assistant Secretary for Management & Budget and CFO, US Department of the Treasury | | 229 | | Atlantic Power Corporation (power generation company); ON Semiconductor Corp. (semiconductor supplier) |
Ann Barnett Stern – 1957 Trustee | | 2017 | | President and Chief Executive Officer, Houston Endowment Inc. (private philanthropic institution) Formerly: Executive Vice President and General Counsel, Texas Children’s Hospital; Attorney, Beck, Redden and Secrest, LLP; Business Law Instructor, University of St. Thomas; Attorney, Andrews & Kurth LLP | | 229 | | Federal Reserve Bank of Dallas |
Robert C. Troccoli – 1949 Trustee | | 2016 | | Retired Formerly: Adjunct Professor, University of Denver – Daniels College of Business, Senior Partner, KPMG LLP | | 229 | | None |
Daniel S. Vandivort – 1954 Trustee | | 2019 | | Treasurer, Chairman of the Audit and Finance Committee, and Trustee, Board of Trustees, Huntington Disease Foundation of America; and President, Flyway Advisory Services LLC (consulting and property management). Formerly: Trustee and Governance Chair, of certain Oppenheimer Funds | | 229 | | Chairman and Lead Independent Director, Chairman of the Audit Committee, and Director, Board of Directors, Value Line Funds |
James D. Vaughn – 1945 Trustee | | 2019 | | Retired Formerly: Managing Partner, Deloitte & Touche LLP; Trustee and Chairman of the Audit Committee, Schroder Funds; Board Member, Mile High United Way, Boys and Girls Clubs, Boy Scouts, Colorado Business Committee for the Arts, Economic Club of Colorado and Metro Denver Network (economic development corporation); and Trustee of certain Oppenheimer Funds | | 229 | | Board member and Chairman of Audit Committee of AMG National Trust Bank; Trustee and Investment Committee member, University of South Dakota Foundation; Board member, Audit Committee Member and past Board Chair, Junior Achievement(non-profit) |
Christopher L. Wilson – 1957 Trustee, Vice Chair and Chair Designate | | 2017 | | Retired Formerly: Director, TD Asset Management USA Inc. (mutual fund complex) (22 portfolios); Managing Partner, CT2, LLC (investing and consulting firm); President/Chief Executive Officer, Columbia Funds, Bank of America Corporation; President/Chief Executive Officer, CDC IXIS Asset Management Services, Inc.; Principal & Director of Operations, Scudder Funds, Scudder, Stevens & Clark, Inc.; Assistant Vice President, Fidelity Investments | | 229 | | ISO New England, Inc.(non-profit organization managing regional electricity market) |
27 INVESCO OPPENHEIMER V.I. MAIN STREET FUND
TRUSTEES AND OFFICERS Continued
| | | | | | | | |
Name, Year of Birth and Position(s) Held with
the Trust | | Trustee and/or Officer Since | | Principal Occupation(s) During Past 5 Years | | Number of Funds in Fund Complex
Overseen by Trustee | | Other Directorship(s) Held by Trustee During Past 5 Years |
| OTHER OFFICERS | | | | | | | | |
Sheri Morris — 1964 President, Principal Executive Officer and Treasurer | | 2003 | | Head of Global Fund Services, Invesco Ltd.; President, Principal Executive Officer and Treasurer, The Invesco Funds; Vice President, Invesco Advisers, Inc. (formerly known as Invesco Institutional (N.A.), Inc.) (registered investment adviser); and Vice President, Invesco Exchange-Traded Fund Trust, Invesco Exchange-Traded Fund Trust II, Invesco India Exchange-Traded Fund Trust, Invesco Actively Managed Exchange-Traded Fund Trust, Invesco Actively Managed Exchange-Traded Commodity Fund Trust and Invesco Exchange-Traded Self-Indexed Fund Trust, and Vice President, OppenheimerFunds, Inc. Formerly: Vice President and Principal Financial Officer, The Invesco Funds; Vice President, Invesco AIM Advisers, Inc., Invesco AIM Capital Management, Inc. and Invesco AIM Private Asset Management, Inc.; Assistant Vice President and Assistant Treasurer, The Invesco Funds and Assistant Vice President, Invesco Advisers, Inc., Invesco AIM Capital Management, Inc. and Invesco AIM Private Asset Management, Inc.; and Treasurer, Invesco Exchange-Traded Fund Trust, Invesco Exchange-Traded Fund Trust II, Invesco India Exchange-Traded Fund Trust and Invesco Actively Managed Exchange-Traded Fund Trust | | N/A | | N/A |
Russell C. Burk — 1958 Senior Vice President and Senior Officer | | 2005 | | Senior Vice President and Senior Officer, The Invesco Funds | | N/A | | N/A |
Jeffrey H. Kupor – 1968 Senior Vice President, Chief Legal Officer and Secretary | | 2018 | | Head of Legal of the Americas, Invesco Ltd.; Senior Vice President and Secretary, Invesco Advisers, Inc. (formerly known as Invesco Institutional (N.A.), Inc.) (registered investment adviser); Senior Vice President and Secretary, Invesco Distributors, Inc. (formerly known as Invesco AIM Distributors, Inc.); Vice President and Secretary, Invesco Investment Services, Inc. (formerly known as Invesco AIM Investment Services, Inc.) Senior Vice President, Chief Legal Officer and Secretary, The Invesco Funds; Secretary and General Counsel, Invesco Investment Advisers LLC (formerly known as Van Kampen Asset Management); Secretary and General Counsel, Invesco Capital Markets, Inc. (formerly known as Van Kampen Funds Inc.) and Chief Legal Officer, Invesco Exchange-Traded Fund Trust, Invesco Exchange-Traded Fund Trust II, Invesco India Exchange-Traded Fund Trust, Invesco Actively Managed Exchange-Traded Fund Trust, Invesco Actively Managed Exchange-Traded Commodity Fund Trust and Invesco Exchange-Traded Self-Indexed Fund Trust; Secretary, Invesco Indexing LLC; Secretary, W.L. Ross & Co., LLC Formerly: Secretary and Vice President, Jemstep, Inc.; Head of Legal, Worldwide Institutional, Invesco Ltd.; Secretary and General Counsel, INVESCO Private Capital Investments, Inc.; Senior Vice President, Secretary and General Counsel, Invesco Management Group, Inc. (formerly known as Invesco AIM Management Group, Inc.); Assistant Secretary, INVESCO Asset Management (Bermuda) Ltd.; Secretary and General Counsel, Invesco Private Capital, Inc.; Assistant Secretary and General Counsel, INVESCO Realty, Inc.; Secretary and General Counsel, Invesco Senior Secured Management, Inc.; and Secretary, Sovereign G./P. Holdings Inc. | | N/A | | N/A |
Andrew R. Schlossberg – 1974 Senior Vice President | | 2019 | | Head of the Americas and Senior Managing Director, Invesco Ltd.; Director and Senior Vice President, Invesco Advisers, Inc. (formerly known as Invesco Institutional (N.A.), Inc.) (registered investment adviser); Director and Chairman, Invesco Investment Services, Inc. (formerly known as Invesco AIM Investment Services, Inc.) (registered transfer agent); Senior Vice President, The Invesco Funds; Director, Invesco Investment Advisers LLC (formerly known as Van Kampen Asset Management); Director, President and Chairman, Invesco Insurance Agency, Inc. Formerly: Director, Invesco UK Limited; Director and Chief Executive, Invesco Asset Management Limited and Invesco Fund Managers Limited; Assistant Vice President, The Invesco Funds; Senior Vice President, Invesco Advisers, Inc. (formerly known as Invesco Institutional (N.A.), Inc.) (registered investment adviser); Director and Chief Executive, Invesco Administration Services Limited and Invesco Global Investment Funds Limited; Director, Invesco Distributors, Inc.; Head of EMEA, Invesco Ltd.; President, Invesco Actively Managed Exchange-Traded Commodity Fund Trust, Invesco Actively Managed Exchange-Traded Fund Trust, Invesco Exchange-Traded Fund Trust, Invesco Exchange-Traded Fund Trust II and Invesco India Exchange-Traded Fund Trust; Managing Director and Principal Executive Officer, Invesco Capital Management LLC | | N/A | | N/A |
28 INVESCO OPPENHEIMER V.I. MAIN STREET FUND
| | | | | | | | |
Name, Year of Birth and Position(s) Held with
the Trust | | Trustee and/or Officer Since | | Principal Occupation(s) During Past 5 Years | | Number of Funds in Fund Complex
Overseen by Trustee | | Other Directorship(s) Held by Trustee During Past 5 Years |
| OTHER OFFICERS (CONTINUED) | | | | | | | | |
John M. Zerr — 1962 Senior Vice President | | 2006 | | Chief Operating Officer of the Americas; Senior Vice President, Invesco Advisers, Inc. (formerly known as Invesco Institutional (N.A.), Inc.) (registered investment adviser); Senior Vice President, Invesco Distributors, Inc. (formerly known as Invesco AIM Distributors, Inc.); Director and Vice President, Invesco Investment Services, Inc. (formerly known as Invesco AIM Investment Services, Inc.) Senior Vice President, The Invesco Funds; Managing Director, Invesco Capital Management LLC; Director, Invesco Investment Advisers LLC (formerly known as Van Kampen Asset Management); Senior Vice President, Invesco Capital Markets, Inc. (formerly known as Van Kampen Funds Inc.); Manager, Invesco Indexing LLC; Manager, Invesco Specialized Products, LLC; Director and Senior Vice President, Invesco Insurance Agency, Inc.; Member, Invesco Canada Funds Advisory Board; Director, President and Chief Executive Officer, Invesco Corporate Class Inc. (corporate mutual fund company); and Director, Chairman, President and Chief Executive Officer, Invesco Canada Ltd. (formerly known as Invesco Trimark Ltd./Invesco Trimark Ltèe) (registered investment adviser and registered transfer agent) Formerly: Director and Senior Vice President, Invesco Management Group, Inc. (formerly known as Invesco AIM Management Group, Inc.); Secretary and General Counsel, Invesco Management Group, Inc. (formerly known as Invesco AIM Management Group, Inc.); Secretary, Invesco Investment Services, Inc. (formerly known as Invesco AIM Investment Services, Inc.); Chief Legal Officer and Secretary, The Invesco Funds; Secretary and General Counsel, Invesco Investment Advisers LLC (formerly known as Van Kampen Asset Management); Secretary and General Counsel, Invesco Capital Markets, Inc. (formerly known as Van Kampen Funds Inc.); Chief Legal Officer, Invesco Exchange-Traded Fund Trust, Invesco Exchange-Traded Fund Trust II, Invesco India Exchange-Traded Fund Trust, Invesco Actively Managed Exchange-Traded Fund Trust, Invesco Actively Managed Exchange-Traded Commodity Fund Trust and Invesco Exchange-Traded Self-Indexed Fund Trust; Secretary, Invesco Indexing LLC; Director, Secretary, General Counsel and Senior Vice President, Van Kampen Exchange Corp.; Director, Vice President and Secretary, IVZ Distributors, Inc. (formerly known as INVESCO Distributors, Inc.); Director and Vice President, INVESCO Funds Group, Inc.; Director and Vice President, Van Kampen Advisors Inc.; Director, Vice President, Secretary and General Counsel, Van Kampen Investor Services Inc.;Director and Secretary, Invesco Distributors, Inc. (formerly known as Invesco AIM Distributors, Inc.); Director, Senior Vice President, General Counsel and Secretary, Invesco AIM Advisers, Inc. and Van Kampen Investments Inc.; Director, Vice President and Secretary, Fund Management Company; Director, Senior Vice President, Secretary, General Counsel and Vice President, Invesco AIM Capital Management, Inc.; Chief Operating Officer and General Counsel, Liberty Ridge Capital, Inc. (an investment adviser) | | N/A | | N/A |
Gregory G. McGreevey - 1962 Senior Vice President | | 2012 | | Senior Managing Director, Invesco Ltd.; Director, Chairman, President, and Chief Executive Officer, Invesco Advisers, Inc. (formerly known as Invesco Institutional (N.A.), Inc.) (registered investment adviser); Director, Invesco Mortgage Capital, Inc. and Invesco Senior Secured Management, Inc.; and Senior Vice President, The Invesco Funds; and President, SNW Asset Management Corporation Formerly: Senior Vice President, Invesco Management Group, Inc. and Invesco Advisers, Inc.; Assistant Vice President, The Invesco Funds | | N/A | | N/A |
Kelli Gallegos – 1970 Vice President, Principal Financial Officer and Assistant Treasurer | | 2008 | | Principal Financial and Accounting Officer – Investments Pool, Invesco Specialized Products, LLC; Vice President, Principal Financial Officer and Assistant Treasurer, The Invesco Funds; Principal Financial and Accounting Officer – Pooled Investments, Invesco Capital Management LLC; Vice President and Treasurer, Invesco Exchange-Traded Fund Trust, Invesco Exchange-Traded Fund Trust II, Invesco India Exchange-Traded Fund Trust, Invesco Actively Managed Exchange-Traded Fund Trust, Invesco Actively Managed Exchange-Traded Commodity Fund Trust and Invesco Exchange-Traded Self-Indexed Fund Trust Formerly: Assistant Treasurer, Invesco Specialized Products, LLC; Assistant Treasurer, Invesco Exchange-Traded Fund Trust, Invesco Exchange-Traded Fund Trust II, Invesco India Exchange-Traded Fund Trust, Invesco Actively Managed Exchange-Traded Fund Trust, Invesco Actively Managed Exchange-Traded Commodity Fund Trust and Invesco Exchange-Traded Self-Indexed Fund Trust; Assistant Treasurer, Invesco Capital Management LLC; Assistant Vice President, The Invesco Funds | | N/A | | N/A |
29 INVESCO OPPENHEIMER V.I. MAIN STREET FUND
TRUSTEES AND OFFICERS Continued
| | | | | | | | |
Name, Year of Birth and Position(s) Held with
the Trust | | Trustee and/or Officer Since | | Principal Occupation(s) During Past 5 Years | | Number of Funds in Fund Complex
Overseen by Trustee | | Other Directorship(s) Held by Trustee During Past 5 Years |
| OTHER OFFICERS (CONTINUED) | | | | | | | | |
Crissie M. Wisdom – 1969 Anti-Money Laundering Compliance Officer | | 2013 | | Anti-Money Laundering Compliance Officer, Invesco Advisers, Inc. (formerly known as Invesco Institutional (N.A.), Inc.) (registered investment adviser), Invesco Capital Markets, Inc. (formerly known as Van Kampen Funds Inc.), Invesco Distributors, Inc., Invesco Investment Services, Inc., The Invesco Funds, and Invesco Exchange-Traded Fund Trust, Invesco Exchange-Traded Fund Trust II, Invesco India Exchange-Traded Fund Trust, Invesco Actively Managed Exchange-Traded Fund Trust, Invesco Actively Managed Exchange-Traded Commodity Fund Trust and Invesco Exchange-Traded Self-Indexed Fund Trust; Anti-Money Laundering Compliance Officer and Bank Secrecy Act Officer, INVESCO National Trust Company and Invesco Trust Company; and Fraud Prevention Manager and Controls and Risk Analysis Manager for Invesco Investment Services, Inc. Formerly: Anti-Money Laundering Compliance Officer, Van Kampen Exchange Corp. and Invesco Management Group, Inc. | | N/A | | N/A |
Robert R. Leveille – 1969 Chief Compliance Officer | | 2016 | | Chief Compliance Officer, Invesco Advisers, Inc. (registered investment adviser); and Chief Compliance Officer, The Invesco Funds Formerly: Chief Compliance Officer, Putnam Investments and the Putnam Funds | | N/A | | N/A |
The Statement of Additional Information of the Trust includes additional information about the Fund’s Trustees and is available upon request, without charge, by calling 1.800.959.4246. Please refer to the Fund’s Statement of Additional Information for information on the Fund’ssub-advisers.
| | | | | | |
| Office of the Fund | | Investment Adviser | | Distributor | | Auditors |
11 Greenway Plaza, Suite 1000 Houston, TX 77046-1173 | | Invesco Advisers, Inc. 1555 Peachtree Street, N.E. Atlanta, GA 30309 | | Invesco Distributors, Inc. 11 Greenway Plaza, Suite 1000 Houston, TX 77046-1173 | | PricewaterhouseCoopers LLP 1000 Louisiana Street, Suite 5800 Houston, TX 77002-5021 |
|
|
| | | |
| Counsel to the Fund | | Counsel to the Independent Trustees | | Transfer Agent | | Custodian |
Stradley Ronon Stevens & Young, LLP 2005 Market Street, Suite 2600 Philadelphia, PA 19103-7018 | | Goodwin Procter LLP 901 New York Avenue, N.W. Washington, D.C. 20001 | | Invesco Investment Services, Inc. 11 Greenway Plaza, Suite 1000 Houston, TX 77046-1173 | | JPMorgan Chase Bank 4 Chase Metro Tech Center Brooklyn, NY 11245 |
|
|
30 INVESCO OPPENHEIMER V.I. MAIN STREET FUND
THIS PAGE INTENTIONALLY LEFT BLANK.

| | | | |

| | Annual Report | | 12/31/2019 |
| | |
| | | | |
| | | | |
| | | | |
| | | | |
| | | | |
| | |
| | Invesco Oppenheimer V.I. Main Street Small Cap Fund®* Beginning on January 1, 2021, as permitted by regulations adopted by the Securities and Exchange Commission, the insurance company that offers your variable annuity or variable life insurance contract may no longer send you paper copies of the Fund’s shareholder reports by mail, unless you specifically request paper copies of the reports from the insurance company or your financial intermediary. Instead of delivering paper copies of the report, the insurance company may choose to make the reports available on a website, and will notify you by mail each time a report is posted and provide you with a website link to access the report. Instructions for requesting paper copies will be provided by your insurance company. If the insurance company offers electronic delivery, you may elect to receive shareholder reports and other communications about the Fund electronically by following the instructions provided by the insurance company or by contacting your financial intermediary. If you already elected to receive shareholder reports electronically, you will not be affected by this change and you need not take any action. You may elect to receive all future reports in paper free of charge from the insurance company. You can inform the insurance company or your financial intermediary that you wish to continue receiving paper copies of your shareholder reports by following the instructions provided by the insurance company or by contacting your financial intermediary. Your election to receive reports in paper will apply to all portfolio companies available under your contract with the insurance company. The Fund provides a complete list of its holdings four times in each fiscal year, at the quarter ends. For the second and fourth quarters, the lists appear in the Fund’s semi annual and annual reports to shareholders. For the first and third quarters, the Fund files the lists with the Securities and Exchange Commission (SEC) as an exhibit to its reports on
FormN-PORT. The Fund’s FormN-PORT filings are available on the SEC website, sec.gov. The Fund’s most recent portfolio holdings, as filed on FormN-PORT, have also been made available to insurance companies issuing variable annuity contracts and variable life insurance policies (“variable products”) that invest in the Fund. A description of the policies and procedures that the Fund uses to determine how to vote proxies relating to portfolio securities is available without charge, upon request, from our Client Services department at 800 959 4246 or at invesco.com/proxyguidelines. The information is also available on the SEC website, sec.gov. Information regarding how the Fund voted proxies related to its portfolio securities during the most recent12-month period ended June 30 is available at invesco.com/proxysearch. The information is also available on the SEC website, sec.gov. Invesco Advisers, Inc. is an investment adviser; it provides investment advisory services to individual and institutional clients and does not sell securities. Invesco Distributors, Inc. is the US distributor for Invesco Ltd.’s retail mutual funds, exchange-traded funds and institutional money market funds. Both are wholly owned, indirect subsidiaries of Invesco Ltd. This report must be accompanied or preceded by a currently effective Fund prospectus and variable product prospectus, which contain more complete information, including sales charges and expenses. Investors should read each carefully before investing. *Prior to the close of business on May 24, 2019, the Fund’s name was Oppenheimer Main Street Small Cap Fund/VA. See Important Update on the following page for more information. |
Important Update
On October 18, 2018, Massachusetts Mutual Life Insurance Company, an indirect corporate parent of OppenheimerFunds, Inc. and its subsidiaries OFI Global Asset Management, Inc., OFI SteelPath, Inc. and OFI Advisors, LLC, announced that it had entered into an agreement whereby Invesco Ltd., a global investment management company would acquire OppenheimerFunds and its subsidiaries (together, “OppenheimerFunds”). After the close of business on May 24, 2019 Invesco Ltd. completed the acquisition of OppenheimerFunds. This Fund was included in that acquisition and as of that date, became part of the Invesco family of funds. Please visit invesco.com for more information or call Invesco’s Client Services team at800-959-4246.
PORTFOLIO MANAGERS: Matthew P. Ziehl, CFA, Raymond Anello, CFA, Raman Vardharaj, CFA, Joy Budzinski, Kristin Ketner, Magnus Krantz and Adam Weiner.
AVERAGE ANNUAL TOTAL RETURNS FOR THE PERIODS ENDED 12/31/19
| | | | | | | | | | | | | | |
| | | Inception
Date | | 1-Year | | | 5-Year | | | 10-Year | |
Series I Shares* | | 5/1/98 | | | 26.47% | | | | 7.54% | | | | 12.45% | |
Series II Shares* | | 7/16/01 | | | 26.13 | | | | 7.27 | | | | 12.17 | |
Russell 2000 Index | | | | | 25.52 | | | | 8.23 | | | | 11.83 | |
Performance quoted is past performance and cannot guarantee future results; current performance may be lower or higher.Visit invesco.com for the most recentmonth-end performance. Performance figures reflect reinvested distributions and changes in net asset value (NAV). Investment return and principal value will vary so that you may have a gain or a loss when you sell shares. Fund returns include changes in share price, reinvested distributions. Performance figures given represent the Fund and are not intended to reflect actual variable product values. They do not reflect sales charges, expenses and fees assessed in connection with a variable product. Sales charges, expenses and fees, which are determined by the variable product issuers, will vary and will lower the total return. Returns for periods of less than one year are cumulative and not annualized. As the result of a reorganization after the close of business on May 24, 2019, theNon-Service and Service share classes of the predecessor fund were reorganized into Series I and Series II Shares, respectively, of the Fund. Returns shown for Series I and Series II shares are blended returns of the predecessor fund and the Fund. Share class returns will differ from those of the Oppenheimer predecessor fund because of different expenses. See Fund prospectuses and summary prospectuses for more information on share classes, sales charges and new fee agreements, if any. Fund literature is available at invesco.com.
TOP HOLDINGS AND ALLOCATIONS
TOP TEN COMMON STOCK HOLDINGS
| | |
| Zynga, Inc., Cl. A | | 2.3% |
| ASGN, Inc. | | 2.3 |
| MKS Instruments, Inc. | | 2.2 |
| CACI International, Inc., Cl. A | | 2.1 |
| Korn Ferry | | 2.1 |
| WSFS Financial Corp. | | 2.0 |
| j2 Global, Inc. | | 2.0 |
| Matador Resources Co. | | 2.0 |
| Four Corners Property Trust, Inc. | | 1.8 |
| Avista Corp. | | 1.7 |
Holdings and allocations are subject to change and are not buy/sell recommendations. Percentages are as of December 31, 2019, and are based on net assets.
SECTOR ALLOCATION
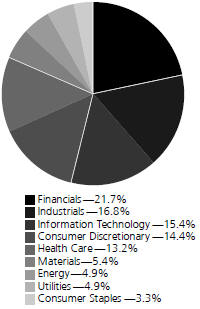
Holdings and allocations are subject to change and are not buy/sell recommendations. Percentages are as of December 31, 2019, and are based on the total market value of common stocks.
For more current Fund holdings, please visit invesco.com.
*Effective after the close of business on May 24, 2019, theNon-Service and Service share classes of the predecessor fund were reorganized into Series I and Series II Shares, respectively, of the Fund. Returns shown for Series I and Series II shares are blended returns of the predecessor fund and the Fund. Share class returns will differ from those of the predecessor fund because of different expenses.
3 INVESCO OPPENHEIMER V.I. MAIN STREET SMALL CAP FUND
Fund Performance Discussion
The Fund’s Series I shares returned 26.47% during the reporting period. In comparison, the Russell 2000 Index returned 25.52% during the same period. The Fund’s outperformance was mainly driven by stock selection within the information technology, industrials, and communication services sectors. This was partially offset by negative stock selection within the consumer discretionary, health care, and consumer staples sectors.
MARKET OVERVIEW
The U.S. economy experienced slowing growth over the course of 2019, notably in the industrial economy where some manufacturing indicators dipped into negative territory as the impact of trade wars and tariffs weighed on export demand. Nevertheless, overall employment and consumption remained solid. U.S. stocks were range-bound until late in the year, before driving higher to new record levels in the fourth calendar quarter. A reversal of Federal Reserve policy from tightening to easing drove lower interest rates during the spring and summer months, which along with overall economic resiliency gave comfort to equity investors despite ongoing political turmoil at home and abroad.
Within the Russell 2000 Index, 10 of 11 sectors posted positive returns. Energy was the only sector with a negative result. Eights sectors produced >20% returns with information technology leading the way.
FUND REVIEW
The key individual contributors to relative returns included Generac, CACI International, and MKS Instruments.
Generator manufacturer Generac outperformed as investors grew increasingly optimistic on the company’s future growth prospects in California as PG&E’s new rolling blackout policies have created robust interest for Generac’s home standby generators. We agree directionally with this assessment but believe this growth will take several years to gain traction as Generac must expand its retailer and installer network in California, which will take some time. Therefore, we took advantage of strength in the shares to reduce our position in order to manage risk.
Defense technology services provider CACI showed improving organic growth against a backdrop of a strengthening defense spending outlook. A strong awards pace and expanding backlog sets CACI up well for 2020 revenue growth and margin expansion. In addition, the recently-acquired LGS Innovations and Mastodon Design organizations appear to be integrating well and delivering results ahead of expectations.
MKS Instruments provides tools for measuring and control of gases used in semiconductor manufacturing, as well as adjacent products such as flat panel displays. The industry is seeing bottoming in demand as Foundry/Logic customers, including TSM, Intel and Samsung, ramp up their capital spending plans. The Memory market remains soft but stabilizing commodity prices suggest that it’s only a matter of time before memory customers resume capital spending to boost supply growth. Given strong secular end demand drivers, we believe that the market is discounting improved performance well before the fundamentals are reflected in current numbers.
The key individual detractors to relative returns included Houghton Mifflin Harcourt, Nu Skin Enterprises, and Spirit Airlines.
Houghton Mifflin underperformed after one of its larger markets (Florida) pushed back the implementation of a key text book scheduled for introduction in 2019.
Nu Skin’s sales in China (30% of sales) slowed down materially in 2019. Chinese regulators imposed marketing constraints on all multi-level marketing companies in response to a consumer’s death due to improper treatment of an illness resulting from the improper marketing of product efficacy by one multi-level, unaffiliated marketing company. Given the lack of visibility into the easing of such regulatory constraints we exited the position as of the end of the year.
Spirit Airlines faced several headwinds during the year including a spike in costs driven by poor execution from stretching the network too thin, runway construction at its main hub in Fort Lauderdale, and hurricane Dorian.
STRATEGY & OUTLOOK
In the short-term, we expect the U.S. economy to continue to show economic growth, albeit at slower rates than experienced in 2018 and early 2019, driven by favorable consumer confidence, falling regulatory hurdles, and technological innovation. However, there are several warning signs on the horizon including less synchronized global growth, weakening transport volumes, poor ISM purchasing managers surveys, and a recent flattening/inversion of the yield curve. While a recession later this year would not surprise us, it is not our base case assumption at this time.
4 INVESCO OPPENHEIMER V.I. MAIN STREET SMALL CAP FUND
We continue to maintain our discipline around valuation and focus on companies with competitive advantages and skilled management teams that areout-executing peers. The evidence of this we look for in our companies include high returns on invested capital, consistently strong pricing power, and/or rising market shares. During times of economic volatility such companies frequently widen their lead over weaker competitors. We seek to invest in companies characterized by these qualities at compelling valuations and believe this disciplined approach is essential to generating superior long-term performance, especially in down markets.
The views and opinions expressed in management’s discussion of Fund performance are those of Invesco Advisers, Inc. These views and opinions are subject to change at any time based on factors such as market and economic conditions. These views and opinions may not be relied upon as investment advice or recommendations, or as an offer for a particular security. The information is not a complete analysis of every aspect of any market, country, industry, security or the Fund. Statements of fact are from sources considered reliable, but Invesco Advisers, Inc. makes no representation or warranty as to their completeness or accuracy. Although historical performance is no guarantee of future results, these insights may help you understand our investment management philosophy.
Before investing, investors should carefully read the prospectus and/or summary prospectus and carefully consider the investment objectives, risks, charges and expenses. For this and more complete information about the fund(s), investors should ask their advisors for a prospectus/summary prospectus or visit invesco.com/fundprospectus.
Shares of Invesco funds are not deposits or obligations of any bank, are not guaranteed by any bank, are not insured by the FDIC or any other agency, and involve investment risks, including the possible loss of the principal amount invested.
Comparing the Fund’s Performance to the Market.The graphs that follow show the performance of a hypothetical $10,000 investment in each share class of the Fund held until December 31, 2019. Performance is measured over aten-fiscal-year period for both Classes. Performance information does not reflect charges that apply to separate accounts investing in the Fund. If these charges were taken into account, performance would be lower. The graphs assume that all dividends and capital gains distributions were reinvested in additional shares.
The Fund’s performance is compared to the performance of the Russell 2000 Index, which measures the performance of thesmall-cap segment of the U.S. equity universe. The Russell 2000 Index is a subset of the Russell 3000 Index representing approximately 10% of the total market capitalization of that index. It includes approximately 2000 of the smallest securities based on a combination of their market cap and current index membership. The Index is unmanaged and cannot be purchased directly by investors. While index comparisons may be useful to provide a benchmark for the Fund’s performance, it must be noted that the Fund’s investments are not limited to the investments comprising theIndex. Index performance includes reinvestment of income, but does not reflect transaction costs, fees, expenses or taxes. Index performance is shown for illustrative purposes only as a benchmark for the Fund’s performance, and does not predict or depict performance of the Fund. The Fund’s performance reflects the effects of the Fund’s business and operating expenses.
5 INVESCO OPPENHEIMER V.I. MAIN STREET SMALL CAP FUND
COMPARISON OF CHANGE IN VALUE OF $10,000 HYPOTHETICAL INVESTMENTS IN:
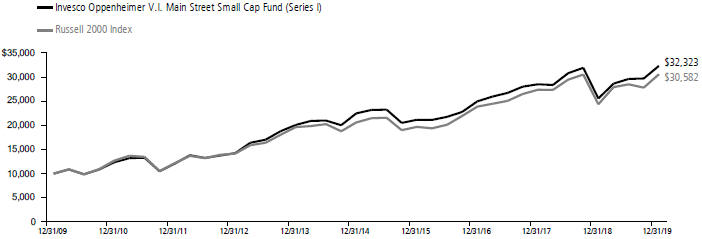
Average Annual Total Returns of Series I Shares of the Fund at 12/31/19
1-Year 26.47% 5-Year 7.54% 10-Year 12.45%
COMPARISON OF CHANGE IN VALUE OF $10,000 HYPOTHETICAL INVESTMENTS IN:
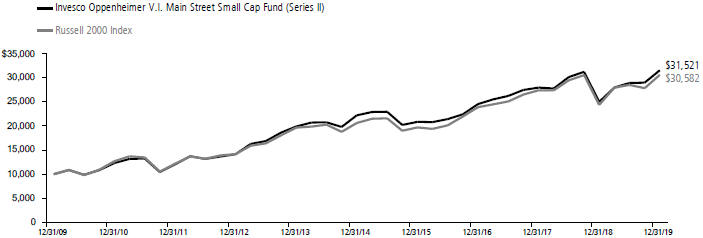
Average Annual Total Returns of Series II Shares of the Fund at 12/31/19
1-Year 26.13% 5-Year 7.27% 10-Year 12.17%
Performance quoted is past performance and cannot guarantee future results; current performance may be lower or higher.Visit invesco.com for the most recentmonth-end performance. Performance figures reflect reinvested distributions and changes in net asset value (NAV). Investment return and principal value will vary so that you may have a gain or a loss when you sell shares. Fund returns include changes in share price, reinvested distributions. Performance figures given represent the Fund and are not intended to reflect actual variable product values. They do not reflect sales charges, expenses and fees assessed in connection with a variable product. Sales charges, expenses and fees, which are determined by the variable product issuers, will vary and will lower the total return. Returns for periods of less than one year are cumulative and not annualized. As the result of a reorganization after the close of business on May 24, 2019, theNon-Service and Service share classes of the predecessor fund were reorganized into Series I and Series II Shares, respectively, of the Fund. Returns shown for Series I and Series II shares are blended returns of the predecessor fund and the Fund. Share class returns will differ from those of the Oppenheimer predecessor fund because of different expenses. See Fund prospectuses and summary prospectuses for more information on share classes, sales charges and new fee agreements, if any. Fund literature is available at invesco.com.
6 INVESCO OPPENHEIMER V.I. MAIN STREET SMALL CAP FUND
Fund Expenses
Fund Expenses.As a shareholder of the Fund, you incur two types of costs: (1) transaction costs and (2) ongoing costs, including management fees; distribution and service fees; and other Fund expenses. These examples are intended to help you understand your ongoing costs (in dollars) of investing in the Fund and to compare these costs with the ongoing costs of investing in other mutual funds.
The examples are based on an investment of $1,000.00 invested at the beginning of the period and held for the entire6-month period ended December 31, 2019.
Actual Expenses. The first section of the table provides information about actual account values and actual expenses. You may use the information in this section for the class of shares you hold, together with the amount you invested, to estimate the expense that you paid over the period. Simply divide your account value by $1,000.00 (for example, an $8,600.00 account value divided by $1,000.00 = 8.60), then multiply the result by the number in the first section under the heading entitled “Expenses Paid During 6 Months Ended December 31, 2019” to estimate the expenses you paid on your account during this period.
Hypothetical Example for Comparison Purposes.
The second section of the table provides information about hypothetical account values and hypothetical expenses based on the Fund’s actual expense ratio for each class of shares, and an assumed rate of return of 5% per year for each class before expenses, which is not the actual return. The hypothetical account values and expenses may not be used to estimate the actual ending account balance or expenses you paid for the period. You may use this information to compare the ongoing costs of investing in the Fund and other funds. To do so, compare this 5% hypothetical example for the class of shares you hold with the 5% hypothetical examples that appear in the shareholder reports of the other funds.
Please note that the expenses shown in the table are meant to highlight your ongoing costs only and do not reflect any charges associated with the separate accounts that offer this Fund. Therefore, the “hypothetical” lines of the table are useful in comparing ongoing costs only, and will not help you determine the relative total costs of owning different funds. In addition, if these separate account charges were included your costs would have been higher.
| | | | | | | | | | | | | | | | |
| Actual | | Beginning Account Value July 1, 2019 | | | Ending Account Value December 31, 2019 | | | Expenses Paid During 6 Months Ended December 31, 2019 | | | | |
| Series I shares | | $ | 1,000.00 | | | $ | 1,091.70 | | | $ | 4.23 | | | | | |
| Series II shares | | | 1,000.00 | | | | 1,090.50 | | | | 5.55 | | | | | |
| | | | |
Hypothetical (5% return before expenses) | | | | | | | | | | | | | | | | |
| Series I shares | | | 1,000.00 | | | | 1,021.17 | | | | 4.08 | | | | | |
| Series II shares | | | 1,000.00 | | | | 1,019.91 | | | | 5.36 | | | | | |
Expenses are equal to the Fund’s annualized expense ratio for that class, multiplied by the average account value over the period, multiplied by 184/365 (to reflect theone-half year period). Those annualized expense ratios, excluding indirect expenses from affiliated funds, based on the6-month period ended December 31, 2019 are as follows:
| | | | | |
| Class | | Expense Ratios |
| Series I shares | | | | 0.80 | % |
| Series II shares | | | | 1.05 | |
The expense ratios reflect voluntary and/or contractual waivers and/or reimbursements of expenses by the Fund’s Manager. Some of these undertakings may be modified or terminated at any time, as indicated in the Fund’s prospectus. The “Financial Highlights” tables in the Fund’s financial statements, included in this report, also show the gross expense ratios, without such waivers or reimbursements and reduction to custodian expenses, if applicable.
7 INVESCO OPPENHEIMER V.I. MAIN STREET SMALL CAP FUND
SCHEDULE OF INVESTMENTSDecember 31, 2019
| | | | | | | | |
| | | Shares | | | Value | |
| Common Stocks—99.8% | |
| Consumer Discretionary—14.4% | |
| Auto Components—2.7% | |
| Dorman Products, Inc.1 | | | 102,368 | | | $ | 7,751,305 | |
| Visteon Corp.1 | | | 132,159 | | | | 11,443,648 | |
| | | | 19,194,953 | |
| Diversified Consumer Services—0.9% | |
| Houghton Mifflin Harcourt Co.1 | | | 1,055,534 | | | | 6,597,087 | |
| Entertainment—2.3% | |
| Zynga, Inc., Cl. A1 | | | 2,672,230 | | | | 16,354,048 | |
| Hotels, Restaurants & Leisure—4.4% | |
| Cedar Fair LP | | | 64,684 | | | | 3,586,081 | |
| Jack in the Box, Inc. | | | 111,761 | | | | 8,720,711 | |
| Texas Roadhouse, Inc., Cl. A | | | 187,890 | | | | 10,581,965 | |
| Wendy’s Co. (The) | | | 393,460 | | | | 8,738,746 | |
| | | | 31,627,503 | |
| Household Durables—0.9% | |
| TopBuild Corp.1 | | | 61,443 | | | | 6,333,544 | |
| Internet & Catalog Retail—0.5% | |
| Etsy, Inc.1 | | | 80,962 | | | | 3,586,617 | |
| Specialty Retail—2.7% | |
| AutoNation, Inc.1 | | | 169,930 | | | | 8,263,696 | |
| Monro, Inc. | | | 143,405 | | | | 11,214,271 | |
| | | | 19,477,967 | |
| Consumer Staples—3.3% | |
| Food & Staples Retailing—1.2% | |
| BJ’s Wholesale Club Holdings, Inc.1 | | | 392,625 | | | | 8,928,292 | |
| Household Products—1.3% | |
| Energizer Holdings, Inc. | | | 191,198 | | | | 9,601,964 | |
| Personal Products—0.8% | |
| BellRing Brands, Inc., Cl. A1 | | | 259,047 | | | | 5,515,111 | |
| Energy—4.9% | |
| Oil, Gas & Consumable Fuels—4.9% | |
| Matador Resources Co.1 | | | 777,065 | | | | 13,963,858 | |
| Noble Midstream Partners LP | | | 323,299 | | | | 8,586,821 | |
| Range Resources Corp. | | | 446,153 | | | | 2,163,842 | |
| Renewable Energy Group, Inc.1 | | | 379,783 | | | | 10,235,152 | |
| | | | 34,949,673 | |
| Financials—21.7% | |
| Capital Markets—2.9% | |
| Federated Investors, Inc., Cl. B | | | 166,381 | | | | 5,422,357 | |
| Focus Financial Partners, Inc., Cl. A1 | | | 161,684 | | | | 4,764,827 | |
| Stifel Financial Corp. | | | 177,349 | | | | 10,756,217 | |
| | | | 20,943,401 | |
| Commercial Banks—7.7% | |
| Bank of NT Butterfield & Son Ltd. (The) | | | 241,307 | | | | 8,933,185 | |
| BankUnited, Inc. | | | 104,267 | | | | 3,812,001 | |
| Berkshire Hills Bancorp, Inc. | | | 183,300 | | | | 6,026,904 | |
| Cathay General Bancorp | | | 150,851 | | | | 5,739,881 | |
| CrossFirst Bankshares, Inc.1 | | | 188,586 | | | | 2,719,410 | |
| Heritage Financial Corp. | | | 217,073 | | | | 6,143,166 | |
| IBERIABANK Corp. | | | 120,948 | | | | 9,050,539 | |
| Pacific Premier Bancorp, Inc. | | | 161,758 | | | | 5,274,120 | |
| Sterling Bancorp | | | 341,169 | | | | 7,191,842 | |
| | | | 54,891,048 | |
| Insurance—1.4% | |
| ProAssurance Corp. | | | 184,998 | | | | 6,685,828 | |
| ProSight Global, Inc.1 | | | 204,792 | | | | 3,303,295 | |
| | | | 9,989,123 | |
| Real Estate Investment Trusts (REITs)—6.8% | |
| Brandywine Realty Trust | | | 635,789 | | | | 10,013,677 | |
| DiamondRock Hospitality Co. | | | 1,002,698 | | | | 11,109,894 | |
| EPR Properties | | | 90,832 | | | | 6,416,372 | |
| | | | | | | | |
| | | Shares | | | Value | |
| Real Estate Investment Trusts (REITs) (Continued) | |
| Four Corners Property Trust, Inc. | | | 461,328 | | | $ | 13,004,836 | |
| National Storage Affiliates Trust | | | 239,942 | | | | 8,066,850 | |
| | | | 48,611,629 | |
| Thrifts & Mortgage Finance—2.9% | |
| OceanFirst Financial Corp. | | | 259,792 | | | | 6,635,088 | |
| WSFS Financial Corp. | | | 327,306 | | | | 14,398,191 | |
| | | | 21,033,279 | |
| Health Care—13.2% | |
| Biotechnology—1.9% | |
| Emergent BioSolutions, Inc.1 | | | 132,857 | | | | 7,167,635 | |
| G1 Therapeutics, Inc.1 | | | 77,828 | | | | 2,056,994 | |
| uniQure NV1 | | | 60,505 | | | | 4,335,788 | |
| | | | 13,560,417 | |
| Health Care Equipment & Supplies—3.3% | |
| AtriCure, Inc.1 | | | 135,391 | | | | 4,401,561 | |
| CryoPort, Inc.1 | | | 165,887 | | | | 2,730,500 | |
| Quidel Corp.1 | | | 107,983 | | | | 8,101,965 | |
| Tandem Diabetes Care, Inc.1 | | | 139,758 | | | | 8,330,974 | |
| | | | 23,565,000 | |
| Health Care Providers & Services—2.5% | |
| Addus HomeCare Corp.1 | | | 84,007 | | | | 8,167,161 | |
| LHC Group, Inc.1 | | | 71,052 | | | | 9,788,123 | |
| | | | 17,955,284 | |
| Health Care Technology—2.5% | |
| Inspire Medical Systems, Inc.1 | | | 118,282 | | | | 8,777,707 | |
| Teladoc Health, Inc.1 | | | 104,858 | | | | 8,778,712 | |
| | | | 17,556,419 | |
| Life Sciences Tools & Services—1.7% | |
| Adaptive Biotechnologies Corp.1 | | | 49,268 | | | | 1,474,099 | |
| Repligen Corp.1 | | | 112,302 | | | | 10,387,935 | |
| | | | 11,862,034 | |
| Pharmaceuticals—1.3% | |
| Axsome Therapeutics, Inc.1 | | | 30,554 | | | | 3,158,061 | |
| Intersect ENT, Inc.1 | | | 159,990 | | | | 3,983,751 | |
| TherapeuticsMD, Inc.1 | | | 776,800 | | | | 1,879,856 | |
| | | | 9,021,668 | |
| Industrials—16.7% | |
| Airlines—0.9% | |
| Spirit Airlines, Inc.1 | | | 169,454 | | | | 6,830,691 | |
| Building Products—1.2% | |
| Masonite International Corp.1 | | | 119,749 | | | | 8,647,075 | |
| Commercial Services & Supplies—1.5% | |
| ACCO Brands Corp. | | | 1,132,778 | | | | 10,602,802 | |
| Construction & Engineering—0.5% | |
| Comfort Systems USA, Inc. | | | 65,411 | | | | 3,260,738 | |
| Electrical Equipment—3.2% | |
| Atkore International Group, Inc.1 | | | 188,815 | | | | 7,639,455 | |
| EnerSys | | | 41,221 | | | | 3,084,567 | |
| Generac Holdings, Inc.1 | | | 121,895 | | | | 12,261,418 | |
| | | | 22,985,440 | |
| Machinery—5.0% | |
| Chart Industries, Inc.1 | | | 58,785 | | | | 3,967,400 | |
| EnPro Industries, Inc. | | | 95,736 | | | | 6,402,824 | |
| Evoqua Water Technologies Corp.1 | | | 296,273 | | | | 5,614,373 | |
| Greenbrier Cos., Inc. (The) | | | 118,754 | | | | 3,851,192 | |
| Navistar International Corp.1 | | | 158,855 | | | | 4,597,264 | |
| Rexnord Corp.1 | | | 348,068 | | | | 11,353,978 | |
| | | | 35,787,031 | |
| Professional Services—4.4% | |
| ASGN, Inc.1 | | | 229,975 | | | | 16,321,326 | |
| Korn Ferry | | | 350,203 | | | | 14,848,607 | |
| | | | 31,169,933 | |
8 INVESCO OPPENHEIMER V.I. MAIN STREET SMALL CAP FUND
| | | | | | | | |
| | | Shares | | | Value | |
| Information Technology—15.4% | |
| IT Services—4.7% | |
| CACI International, Inc., Cl. A1 | | | 60,123 | | | $ | 15,030,149 | |
| KBR, Inc. | | | 360,774 | | | | 11,003,607 | |
| Perspecta, Inc. | | | 291,945 | | | | 7,719,026 | |
| | | | 33,752,782 | |
| Semiconductors & Semiconductor Equipment—5.0% | |
| Brooks Automation, Inc. | | | 241,294 | | | | 10,124,696 | |
| MKS Instruments, Inc. | | | 140,750 | | | | 15,483,908 | |
| Semtech Corp.1 | | | 187,581 | | | | 9,923,035 | |
| | | | 35,531,639 | |
| Software—5.7% | |
| Bottomline Technologies DE, Inc.1 | | | 168,491 | | | | 9,031,118 | |
| Envestnet, Inc.1 | | | 61,345 | | | | 4,271,452 | |
| j2 Global, Inc. | | | 151,443 | | | | 14,191,724 | |
| Paylocity Holding Corp.1 | | | 44,044 | | | | 5,321,396 | |
| Q2 Holdings, Inc.1 | | | 95,964 | | | | 7,780,761 | |
| | | | 40,596,451 | |
| Materials—5.3% | |
| Construction Materials—1.5% | |
| Summit Materials, Inc., Cl. A1 | | | 463,796 | | | | 11,084,724 | |
| | | | | | | | |
| | | Shares | | | Value | |
| Metals & Mining—3.8% | |
| Allegheny Technologies, Inc.1 | | | 248,080 | | | $ | 5,125,333 | |
| Compass Minerals International, Inc. | | | 126,326 | | | | 7,700,833 | |
| Kaiser Aluminum Corp. | | | 108,855 | | | | 12,070,931 | |
| Mayville Engineering Co., Inc.1 | | | 215,463 | | | | 2,021,043 | |
| | | | 26,918,140 | |
| Utilities—4.9% | |
| Gas Utilities—3.2% | |
| South Jersey Industries, Inc. | | | 352,731 | | | | 11,633,068 | |
| Suburban Propane Partners LP | | | 526,115 | | | | 11,495,613 | |
| | | | 23,128,681 | |
| Multi-Utilities—1.7% | |
| Avista Corp. | | | 255,206 | | | | 12,272,857 | |
| Total Common Stocks (Cost $561,572,593) | | | | | | | 713,725,045 | |
| Investment Company—0.3% | | | | | | | | |
Invesco Government & Agency Portfolio, Institutional Class, 1.50%2
(Cost $1,914,336) | | | 1,914,336 | | | | 1,914,336 | |
Total Investments, at Value
(Cost $563,486,929) | | | 100.1% | | | | 715,639,381 | |
| Net Other Assets (Liabilities) | | | (0.1) | | | | (616,945 | ) |
| Net Assets | | | 100.0% | | | $ | 715,022,436 | |
| | | | | | | | |
Footnotes to Schedule of Investments
1.Non-income producing security.
2. The money market fund and the Fund are affiliated by having the same investment adviser. The rate shown is the7-day SEC standardized yield as of December 31, 2019.
See accompanying Notes to Financial Statements.
9 INVESCO OPPENHEIMER V.I. MAIN STREET SMALL CAP FUND
STATEMENT OF ASSETS AND LIABILITIESDecember 31, 2019
| | | | |
| Assets | | | | |
| Investments, at value—see accompanying schedule of investments: | | | | |
| Unaffiliated companies (cost $561,572,593) | | $ | 713,725,045 | |
| Affiliated companies (cost $1,914,336) | | | 1,914,336 | |
| | | | |
| | | 715,639,381 | |
| Cash | | | 621,907 | |
| Receivables and other assets: | | | | |
| Dividends | | | 355,982 | |
| Shares of beneficial interest sold | | | 92,851 | |
| Other | | | 90,459 | |
| | | | |
| Total assets | | | 716,800,580 | |
| Liabilities | | | | |
| Payables and other liabilities: | | | | |
| Investments purchased | | | 709,375 | |
| Shares of beneficial interest redeemed | | | 366,434 | |
| Administration fee | | | 282,692 | |
| Shareholder communications | | | 141,900 | |
| Distribution and service plan fees | | | 127,349 | |
| Trustees’ compensation | | | 83,512 | |
| Advisory fee | | | 13,755 | |
| Transfer and shareholder servicing agent fees | | | 12,244 | |
| Other | | | 40,883 | |
| | | | |
| Total liabilities | | | 1,778,144 | |
| Net Assets | | $ | 715,022,436 | |
| | | | |
| | | | |
| Composition of Net Assets | | | | |
| Shares of beneficial interest | | $ | 556,112,137 | |
| Total distributable earnings | | | 158,910,299 | |
| | | | |
| Net Assets | | $ | 715,022,436 | |
| | | | |
| | | | |
| Net Asset Value Per Share | | | | |
| |
| Series I Shares: | | | | |
| Net asset value, redemption price per share and offering price per share (based on net assets of $109,695,280 and 4,703,587 shares of beneficial interest outstanding) | | | $23.32 | |
| |
| Series II Shares: | | | | |
| Net asset value, redemption price per share and offering price per share (based on net assets of $605,327,156 and 26,439,702 shares of beneficial interest outstanding) | | | $22.89 | |
See accompanying Notes to Financial Statements.
10 INVESCO OPPENHEIMER V.I. MAIN STREET SMALL CAP FUND
STATEMENT OF OPERATIONSFor the Year Ended December 31, 2019
| | | | |
| Investment Income | | | | |
| Dividends: | | | | |
| Unaffiliated companies | | $ | 11,264,066 | |
| Affiliated companies | | | 290,096 | |
| Interest | | | 34 | |
| | | | |
| Total investment income | | | 11,554,196 | |
| Expenses | | | | |
| Advisory fees | | | 6,104,920 | |
| Administration fees | | | 838,910 | |
| Distribution and service plan fees: | | | | |
| Series II shares | | | 1,932,910 | |
| Transfer and shareholder servicing agent fees: | | | | |
| Series I shares | | | 69,832 | |
| Series II shares | | | 425,028 | |
| Shareholder communications: | | | | |
| Series I shares | | | 19,882 | |
| Series II shares | | | 130,089 | |
| Trustees’ compensation | | | 27,169 | |
| Borrowing fees | | | 11,947 | |
| Custodian fees and expenses | | | 4,471 | |
| Other | | | 65,792 | |
| | | | |
| Total expenses | | | 9,630,950 | |
| Less waivers, reimbursement of expenses and offset arrangement(s) | | | (572,497 | ) |
| | | | |
| Net expenses | | | 9,058,453 | |
| Net Investment Income | | | 2,495,743 | |
| Realized and Unrealized Gain | | | | |
| Net realized gain on investment transactions in unaffiliated companies | | | 69,732,405 | |
| Net change in unrealized appreciation/(depreciation) on investment transactions in unaffiliated companies | | | 122,277,503 | |
| Net Increase in Net Assets Resulting from Operations | | $ | 194,505,651 | |
| | | | |
See accompanying Notes to Financial Statements.
11 INVESCO OPPENHEIMER V.I. MAIN STREET SMALL CAP FUND
STATEMENT OF CHANGES IN NET ASSETS
| | | | | | | | |
| | | Year Ended
December 31, 2019 | | Year Ended
December 31, 2018 |
| Operations | | | | | | | | |
| Net investment income | | $ | 2,495,743 | | | $ | 713,422 | |
| Net realized gain | | | 69,732,405 | | | | 96,680,460 | |
| Net change in unrealized appreciation/(depreciation) | | | 122,277,503 | | | | (191,923,313 | ) |
| | | | |
| Net increase (decrease) in net assets resulting from operations | | | 194,505,651 | | | | (94,529,431 | ) |
| Dividends and/or Distributions to Shareholders | | | | | | | | |
| Distributions to shareholders from distributable earnings: | | | | | | | | |
| Series I shares | | | (10,160,591 | ) | | | (19,059,602 | ) |
| Series II shares | | | (77,152,079 | ) | | | (117,234,118 | ) |
| | | | |
| Total distributions from distributable earnings | | | (87,312,670 | ) | | | (136,293,720 | ) |
| Beneficial Interest Transactions | | | | | | | | |
| Net increase (decrease) in net assets resulting from beneficial interest transactions: | | | | | | | | |
| Series I shares | | | (31,945,204 | ) | | | 4,916,454 | |
| Series II shares | | | (220,156,704 | ) | | | (2,571,998 | ) |
| | | | |
| Total beneficial interest transactions | | | (252,101,908 | ) | | | 2,344,456 | |
| Net Assets | | | | | | | | |
| Total decrease | | | (144,908,927 | ) | | | (228,478,695 | ) |
| Beginning of period | | | 859,931,363 | | | | 1,088,410,058 | |
| | | | |
| End of period | | $ | 715,022,436 | | | $ | 859,931,363 | |
| | | | |
See accompanying Notes to Financial Statements.
12 INVESCO OPPENHEIMER V.I. MAIN STREET SMALL CAP FUND
FINANCIAL HIGHLIGHTS
| | | | | | | | | | | | | | | | | | | | |
| Series I Shares | | Year Ended
December 31,
2019 | | Year Ended
December 31,
2018 | | Year Ended
December 31,
2017 | | Year Ended
December 31,
2016 | | Year Ended
December 31,
2015 |
| Per Share Operating Data | | | | | | | | | | | | | | | | | | | | |
| Net asset value, beginning of period | | | $20.36 | | | | $25.79 | | | | $24.08 | | | | $21.32 | | | | $26.56 | |
| Income (loss) from investment operations: | | | | | | | | | | | | | | | | | | | | |
| Net investment income1 | | | 0.11 | | | | 0.07 | | | | 0.07 | | | | 0.16 | | | | 0.12 | |
| Net realized and unrealized gain (loss) | | | 5.06 | | | | (2.07) | | | | 3.22 | | | | 3.55 | | | | (1.28) | |
| | | | |
| Total from investment operations | | | 5.17 | | | | (2.00) | | | | 3.29 | | | | 3.71 | | | | (1.16) | |
| Dividends and/or distributions to shareholders: | | | | | | | | | | | | | | | | | | | | |
| Dividends from net investment income | | | (0.05) | | | | (0.08) | | | | (0.22) | | | | (0.11) | | | | (0.23) | |
| Distributions from net realized gain | | | (2.16) | | | | (3.35) | | | | (1.36) | | | | (0.84) | | | | (3.85) | |
| | | | |
| Total dividends and/or distributions to shareholders | | | (2.21) | | | | (3.43) | | | | (1.58) | | | | (0.95) | | | | (4.08) | |
| Net asset value, end of period | | | $23.32 | | | | $20.36 | | | | $25.79 | | | | $24.08 | | | | $21.32 | |
| | | | |
| | | | | | | | | | | | | | | | | | | | |
| Total Return, at Net Asset Value2 | | | 26.47% | | | | (10.32)% | | | | 14.15% | | | | 18.05% | | | | (5.90)% | |
| | | | | | | | | | | | | | | | | | | | |
| Ratios/Supplemental Data | | | | | | | | | | | | | | | | | | | | |
| Net assets, end of period (in thousands) | | | $109,695 | | | | $123,962 | | | | $152,617 | | | | $145,428 | | | | $129,104 | |
| Average net assets (in thousands) | | | $118,599 | | | | $150,279 | | | | $150,376 | | | | $130,889 | | | | $134,932 | |
| Ratios to average net assets:3 | | | | | | | | | | | | | | | | | | | | |
| Net investment income | | | 0.49% | | | | 0.28% | | | | 0.28% | | | | 0.74% | | | | 0.49% | |
| Expenses excluding specific expenses listed below | | | 0.86% | | | | 0.83% | | | | 0.80% | | | | 0.81% | | | | 0.80% | |
| Interest and fees from borrowings4 | | | 0.00% | | | | 0.00% | | | | 0.00% | | | | 0.00% | | | | 0.00% | |
| | | | |
| Total expenses5 | | | 0.86% | | | | 0.83% | | | | 0.80% | | | | 0.81% | | | | 0.80% | |
| Expenses after payments, waivers and/or reimbursements and reduction to custodian expenses | | | 0.80% | | | | 0.80% | | | | 0.80%6 | | | | 0.80% | | | | 0.80%6 | |
| Portfolio turnover rate7 | | | 36% | | | | 45% | | | | 42% | | | | 65% | | | | 43% | |
1. Calculated based on the average shares outstanding during the period.
2. Includes adjustments in accordance with accounting principles generally accepted in the United States of America and as such, the net asset value for financial reporting purposes and the returns based upon those net asset values may differ from the net asset value and returns for shareholder transactions. Total returns are not annualized for periods less than one year, if applicable and do not reflect charges assessed in connection with a variable product, which if included would reduce total returns.
3. Annualized for periods less than one full year.
4. Less than 0.005%.
5. Total expenses including indirect expenses from fund fees and expenses were as follows:
| | | | | | |
| Year Ended December 31, 2019 | | | 0.86 | % | | |
| Year Ended December 31, 2018 | | | 0.83 | % | | |
| Year Ended December 31, 2017 | | | 0.80 | % | | |
| Year Ended December 31, 2016 | | | 0.81 | % | | |
| Year Ended December 31, 2015 | | | 0.80 | % | | |
6. Waiver was less than 0.005%.
7. Portfolio turnover is calculated at the fund level and is not annualized for periods less than one year, if applicable.
See accompanying Notes to Financial Statements.
13 INVESCO OPPENHEIMER V.I. MAIN STREET SMALL CAP FUND
FINANCIAL HIGHLIGHTSContinued
| | | | | | | | | | | | | | | | | | | | |
| Series II Shares | | Year Ended
December 31,
2019 | | Year Ended
December 31,
2018 | | Year Ended
December 31,
2017 | | Year Ended
December 31,
2016 | | Year Ended
December 31,
2015 |
| Per Share Operating Data | | | | | | | | | | | | | | | | | | | | |
| Net asset value, beginning of period | | | $20.03 | | | | $25.42 | | | | $23.75 | | | | $21.05 | | | | $26.26 | |
| Income (loss) from investment operations: | | | | | | | | | | | | | | | | | | | | |
| Net investment income1 | | | 0.05 | | | | 0.01 | | | | 0.01 | | | | 0.10 | | | | 0.06 | |
| Net realized and unrealized gain (loss) | | | 4.97 | | | | (2.03) | | | | 3.18 | | | | 3.49 | | | | (1.25) | |
| | | | |
| Total from investment operations | | | 5.02 | | | | (2.02) | | | | 3.19 | | | | 3.59 | | | | (1.19) | |
| Dividends and/or distributions to shareholders: | | | | | | | | | | | | | | | | | | | | |
| Dividends from net investment income | | | 0.00 | | | | (0.02) | | | | (0.16) | | | | (0.05) | | | | (0.17) | |
| Distributions from net realized gain | | | (2.16) | | | | (3.35) | | | | (1.36) | | | | (0.84) | | | | (3.85) | |
| | | | |
| Total dividends and/or distributions to shareholders | | | (2.16) | | | | (3.37) | | | | (1.52) | | | | (0.89) | | | | (4.02) | |
| Net asset value, end of period | | | $22.89 | | | | $20.03 | | | | $25.42 | | | | $23.75 | | | | $21.05 | |
| | | | |
| | | | | | | | | | | | | | | | | | | | |
| Total Return, at Net Asset Value2 | | | 26.13% | | | | (10.54)% | | | | 13.91% | | | | 17.67% | | | | (6.09)% | |
| | | | | | | | | | | | | | | | | | | | |
| Ratios/Supplemental Data | | | | | | | | | | | | | | | | | | | | |
| Net assets, end of period (in thousands) | | | $605,327 | | | | $735,969 | | | | $935,793 | | | | $922,037 | | | | $856,719 | |
| Average net assets (in thousands) | | | $772,788 | | | | $911,784 | | | | $919,475 | | | | $850,883 | | | | $927,514 | |
| Ratios to average net assets:3 | | | | | | | | | | | | | | | | | | | | |
| Net investment income | | | 0.25% | | | | 0.03% | | | | 0.03% | | | | 0.49% | | | | 0.24% | |
| Expenses excluding specific expenses listed below | | | 1.11% | | | | 1.08% | | | | 1.05% | | | | 1.06% | | | | 1.05% | |
| Interest and fees from borrowings4 | | | 0.00% | | | | 0.00% | | | | 0.00% | | | | 0.00% | | | | 0.00% | |
| | | | |
| Total expenses5 | | | 1.11% | | | | 1.08% | | | | 1.05% | | | | 1.06% | | | | 1.05% | |
| Expenses after payments, waivers and/or reimbursements and reduction to custodian expenses | | | 1.05% | | | | 1.05% | | | | 1.05%6 | | | | 1.05% | | | | 1.05%6 | |
| Portfolio turnover rate7 | | | 36% | | | | 45% | | | | 42% | | | | 65% | | | | 43% | |
1. Calculated based on the average shares outstanding during the period.
2. Includes adjustments in accordance with accounting principles generally accepted in the United States of America and as such, the net asset value for financial reporting purposes and the returns based upon those net asset values may differ from the net asset value and returns for shareholder transactions. Total returns are not annualized for periods less than one year, if applicable and do not reflect charges assessed in connection with a variable product, which if included would reduce total returns.
3. Annualized for periods less than one full year.
4. Less than 0.005%.
5. Total expenses including indirect expenses from fund fees and expenses were as follows:
| | | | | | |
| Year Ended December 31, 2019 | | | 1.11 | % | | |
| Year Ended December 31, 2018 | | | 1.08 | % | | |
| Year Ended December 31, 2017 | | | 1.05 | % | | |
| Year Ended December 31, 2016 | | | 1.06 | % | | |
| Year Ended December 31, 2015 | | | 1.05 | % | | |
6. Waiver was less than 0.005%.
7. Portfolio turnover is calculated at the fund level and is not annualized for periods less than one year, if applicable.
See accompanying Notes to Financial Statements.
14 INVESCO OPPENHEIMER V.I. MAIN STREET SMALL CAP FUND
NOTES TO FINANCIAL STATEMENTSDecember 31, 2019
Note 1 – Significant Accounting Policies
Invesco Oppenheimer V.I. Main Street Small Cap Fund (the “Fund”) is a series portfolio of AIM Variable Insurance Funds (Invesco Variable Insurance Funds) (the “Trust”). The Trust is a Delaware statutory trust registered under the Investment Company Act of 1940, as amended (the “1940 Act”), as anopen-end series management investment company authorized to issue an unlimited number of shares of beneficial interest. Information presented in these financial statements pertains only to the Fund. Matters affecting the Fund or each class will be voted on exclusively by the shareholders of such Fund or each class.
Prior to the close of business on May 24, 2019, the Fund operated as Oppenheimer Main Street Small Cap Fund/VA (the “Acquired Fund” or “Predecessor Fund”). The Acquired Fund was reorganized after the close of business on May 24, 2019 (the “Reorganization Date”) through the transfer of all of its assets and liabilities to the Fund (the “Reorganization”).
Upon closing of the Reorganization, holders of the Acquired Fund’sNon-Service and Service shares received Series I and Series II shares of the Fund, respectively. Information for the Acquired Fund’sNon-Service and Service shares prior to the Reorganization is included with Series I and Series II, respectively, throughout this report.
The Fund’s investment objective is to seek capital appreciation.
The Fund currently offers two classes of shares, Series I and Series II, both of which are offered to insurance company separate accounts funding variable annuity contracts and variable life insurance policies (“variable products”).
The Fund is an investment company and accordingly follows the investment company accounting and reporting guidance in accordance with Financial Accounting Standards Board Accounting Standards Codification Topic 946, Financial Services – Investment Companies.
The following is a summary of the significant accounting policies followed by the Fund in the preparation of its financial statements.
| A. | | Security Valuations– Securities, including restricted securities, are valued according to the following policy. |
A security listed or traded on an exchange (except convertible securities) is valued at its last sales price or official closing price as of the close of the customary trading session on the exchange where the security is principally traded, or lacking any sales or official closing price on a particular day, the security may be valued at the closing bid price on that day. Securities traded in theover-the-counter market are valued based on prices furnished by independent pricing services or market makers. When such securities are valued by an independent pricing service they may be considered fair valued. Futures contracts are valued at the final settlement price set by an exchange on which they are principally traded. Listed options are valued at the mean between the last bid and asked prices from the exchange on which they are principally traded. Options not listed on an exchange are valued by an independent source at the mean between the last bid and asked prices. For purposes of determining net asset value (“NAV”) per share, futures and option contracts generally are valued 15 minutes after the close of the customary trading session of the New York Stock Exchange (“NYSE”).
Investments inopen-end andclosed-end registered investment companies that do not trade on an exchange are valued at theend-of-day net asset value per share. Investments inopen-end andclosed-end registered investment companies that trade on an exchange are valued at the last sales price or official closing price as of the close of the customary trading session on the exchange where the security is principally traded.
Debt obligations (including convertible securities) and unlisted equities are fair valued using an evaluated quote provided by an independent pricing service. Evaluated quotes provided by the pricing service may be determined without exclusive reliance on quoted prices, and may reflect appropriate factors such asinstitution-size trading in similar groups of securities, developments related to specific securities, dividend rate (for unlisted equities), yield (for debt obligations), quality, type of issue, coupon rate (for debt obligations), maturity (for debt obligations), individual trading characteristics and other market data. Pricing services generally value debt obligations assuming orderly transactions of institutional round lot size, but a fund may hold or transact in the same securities in smaller, odd lot sizes. Odd lots often trade at lower prices than institutional round lots. Debt obligations are subject to interest rate and credit risks. In addition, all debt obligations involve some risk of default with respect to interest and/or principal payments.
Foreign securities’ (including foreign exchange contracts) prices are converted into U.S. dollar amounts using the applicable exchange rates as of the close of the NYSE. If market quotations are available and reliable for foreign exchange-traded equity securities, the securities will be valued at the market quotations. Because trading hours for certain foreign securities end before the close of the NYSE, closing market quotations may become unreliable. If between the time trading ends on a particular security and the close of the customary trading session on the NYSE, events occur that the investment adviser determines are significant and make the closing price unreliable, the Fund may fair value the security. If the event is likely to have affected the closing price of the security, the security will be valued at fair value in good faith using procedures approved by the Board of Trustees. Adjustments to closing prices to reflect fair value may also be based on a screening process of an independent pricing service to indicate the degree of certainty, based on historical data, that the closing price in the principal market where a foreign security trades is not the current value as of the close of the NYSE. Foreign securities’ prices meeting the approved degree of certainty that the price is not reflective of current value will be priced at the indication of fair value from the independent pricing service. Multiple factors may be considered by the independent pricing service in determining adjustments to reflect fair value and may include information relating to sector indices, American Depositary Receipts and domestic and foreign index futures. Foreign securities may have additional risks including exchange rate changes, potential for sharply devalued currencies and high inflation, political and economic upheaval, the relative lack of issuer information, relatively low market liquidity and the potential lack of strict financial and accounting controls and standards.
Securities for which market prices are not provided by any of the above methods may be valued based upon quotes furnished by independent sources. The last bid price may be used to value equity securities. The mean between the last bid and asked prices is used to value debt obligations, including corporate loans.
Securities for which market quotations are not readily available or became unreliable are valued at fair value as determined in good faith by or under the supervision of the Trust’s officers following procedures approved by the Board of Trustees. Issuer specific events, market trends, bid/ asked quotes of brokers and information providers and other market data may be reviewed in the course of making a good faith determination of a
15 INVESCO OPPENHEIMER V.I. MAIN STREET SMALL CAP FUND
NOTES TO FINANCIAL STATEMENTSContinued
security’s fair value.
The Fund may invest in securities that are subject to interest rate risk, meaning the risk that the prices will generally fall as interest rates rise and, conversely, the prices will generally rise as interest rates fall. Specific securities differ in their sensitivity to changes in interest rates depending on their individual characteristics. Changes in interest rates may result in increased market volatility, which may affect the value and/or liquidity of certain Fund investments.
Valuations change in response to many factors including the historical and prospective earnings of the issuer, the value of the issuer’s assets, general economic conditions, interest rates, investor perceptions and market liquidity. Because of the inherent uncertainties of valuation, the values reflected in the financial statements may materially differ from the value received upon actual sale of those investments.
| B. | | Securities Transactions and Investment Income -Securities transactions are accounted for on a trade date basis. Realized gains or losses on sales are computed on the basis of specific identification of the securities sold. Interest income (net of withholding tax, if any) is recorded on the accrual basis from settlement date. Dividend income (net of withholding tax, if any) is recorded on theex-dividend date. |
The Fund may periodically participate in litigation related to Fund investments. As such, the Fund may receive proceeds from litigation settlements. Any proceeds received are included in the Statement of Operations as realized gain (loss) for investments no longer held and as unrealized gain (loss) for investments still held.
Brokerage commissions and mark ups are considered transaction costs and are recorded as an increase to the cost basis of securities purchased and/or a reduction of proceeds on a sale of securities. Such transaction costs are included in the determination of net realized and unrealized gain (loss) from investment transactions reported in the Statement of Operations and the Statement of Changes in Net Assets and the net realized and unrealized gains (losses) on securities per share in the Financial Highlights. Transaction costs are included in the calculation of the Fund’s net asset value and, accordingly, they reduce the Fund’s total returns. These transaction costs are not considered operating expenses and are not reflected in net investment income reported in the Statement of Operations and the Statement of Changes in Net Assets, or the net investment income per share and the ratios of expenses and net investment income reported in the Financial Highlights, nor are they limited by any expense limitation arrangements between the Fund and the investment adviser.
The Fund allocates income and realized and unrealized capital gains and losses to a class based on the relative net assets of each class.
The Fund recharacterizes distributions received from REIT investments based on information provided by the REIT into the following categories: ordinary income, long-term and short-term capital gains, and return of capital. If information is not available on a timely basis from the REIT, the recharacterization will be based on available information which may include the previous year’s allocation. If new or additional information becomes available from the REIT at a later date, a recharacterization will be made in the following year. The Fund records as dividend income the amount recharacterized as ordinary income and as realized gain the amount recharacterized as capital gain in the Statement of Operations, and the amount recharacterized as return of capital as a reduction of the cost of the related investment. These recharacterizations are reflected in the accompanying financial statements.
| C. | | Country Determination- For the purposes of making investment selection decisions and presentation in the Schedule of Investments, the investment adviser may determine the country in which an issuer is located and/or credit risk exposure based on various factors. These factors include the laws of the country under which the issuer is organized, where the issuer maintains a principal office, the country in which the issuer derives 50% or more of its total revenues and the country that has the primary market for the issuer’s securities, as well as other criteria. Among the other criteria that may be evaluated for making this determination are the country in which the issuer maintains 50% or more of its assets, the type of security, financial guarantees and enhancements, the nature of the collateral and the sponsor organization. |
| D. | | Distributions -Dividends and distributions to shareholders, which are determined in accordance with income tax regulations and may differ from accounting principles generally accepted in the United States of America (“GAAP”), are recorded on theex-dividend date. Income and capital gain distributions, if any, are declared and paid annually to separate accounts of participating insurance companies or at other times as determined necessary by the Adviser. |
| E. | | Federal Income Taxes -The Fund intends to comply with the requirements of Subchapter M of the Internal Revenue Code of 1986, as amended (the “Internal Revenue Code”), necessary to qualify as a regulated investment company and to distribute substantially all of the Fund’s taxable earnings to shareholders. As such, the Fund will not be subject to federal income taxes on otherwise taxable income (including net realized capital gain) that is distributed to shareholders. Therefore, no provision for federal income taxes is recorded in the financial statements. |
The Fund recognizes the tax benefits of uncertain tax positions only when the position is more likely than not to be sustained. Management has analyzed the Fund’s uncertain tax positions and concluded that no liability for unrecognized tax benefits should be recorded related to uncertain tax positions. Management is not aware of any tax positions for which it is reasonably possible that the total amounts of unrecognized tax benefits will change materially in the next 12 months.
The Fund files tax returns in the U.S. Federal jurisdiction and certain other jurisdictions. Generally, the Fund is subject to examinations by such taxing authorities for up to three years after the filing of the return for the tax period.
| F. | | Expenses -Fees provided for under the Rule12b-1 plan of a particular class of the Fund are charged to the operations of such class. Transfer agency fees and expenses and other shareholder recordkeeping fees and expenses attributable to each share class based on relative net assets. Transfer agency fees and expenses and other shareholder recordkeeping fees and expenses relating to all other classes are allocated among those classes based on relative net assets. All other expenses are allocated among the classes based on relative net assets. |
| G. | | Accounting Estimates -The financial statements are prepared on a basis in conformity with GAAP, which requires management to make estimates and assumptions that affect the reported amounts of assets and liabilities at the date of the financial statements and the reported amounts of revenues and expenses during the reporting period including estimates and assumptions related to taxation. Actual results could differ from those estimates by a significant amount. In addition, the Fund monitors for material events or transactions that may occur or become known after the |
16 INVESCO OPPENHEIMER V.I. MAIN STREET SMALL CAP FUND
| | period-end date and before the date the financial statements are released to print. |
| H. | | Indemnifications -Under the Trust’s organizational documents, each Trustee, officer, employee or other agent of the Trust is indemnified against certain liabilities that may arise out of the performance of their duties to the Fund. Additionally, in the normal course of business, the Fund enters into contracts, including the Fund’s servicing agreements, that contain a variety of indemnification clauses. The Fund’s maximum exposure under these arrangements is unknown as this would involve future claims that may be made against the Fund that have not yet occurred. The risk of material loss as a result of such indemnification claims is considered remote. |
| I. | | Master Limited Partnerships - The Fund invests in Master Limited Partnerships (“MLPs”). MLPs are publicly traded partnerships and limited liability companies taxed as partnerships under the Internal Revenue Code of 1986, as amended (the “Internal Revenue Code”). The Fund invests in MLPs engaged in, among other things, the transportation, storage, processing, refining, marketing, exploration, production and mining of minerals and natural resources. The Fund is a partner in each MLP; accordingly, the Fund is required to take into account the Fund’s allocable share of income, gains, losses, deductions, expenses, and tax credits recognized by each MLP. |
MLP’s may be less liquid and subject to more abrupt or erratic price movements than conventional publicly traded securities.
| J. | | Return of Capital -Distributions received from the Fund’s investments in MLPs generally are comprised of income and return of capital. The Fund records investment income and return of capital based on estimates made at the time such distributions are received. The return of capital portion of the distribution is a reduction to investment income that results in an equivalent reduction in the cost basis of the associated investments and increases net realized gains (losses) and change in unrealized appreciation (depreciation). Such estimates are based on historical information available from each MLP and other industry sources. These estimates will subsequently be revised and may materially differ primarily based on information received from the MLPs after their tax reporting periods are concluded. |
Note 2 – Advisory Fees and Other Fees Paid to Affiliates
The Trust has entered into a master investment advisory agreement with Invesco Advisers, Inc. (the “Adviser” or “Invesco”). Under the terms of the investment advisory agreement, the Fund accrues daily and pays monthly an advisory fee to the Adviser based on the annual rate of the Fund’s average daily net assets as follows:
| | | | |
| Fee Schedule* | |
| Up to $200 million | | | 0.75 | % |
| Next $200 million | | | 0.72 | |
| Next $200 million | | | 0.69 | |
| Next $200 million | | | 0.66 | |
| Next $200 million | | | 0.60 | |
| Next $4 billion | | | 0.58 | |
| Over $5 billion | | | 0.56 | |
* The advisory fee paid by the Fund shall be reduced by any amounts paid by the Fund under the administrative services agreement with the Adviser.
For the year ended December 31, 2019, the effective advisory fees incurred by the Fund was 0.68%.
From the beginning of the fiscal period until the date of the Reorganization, the Acquired Fund paid $2,608,376 in advisory fees to OFI Global Asset Management, Inc. based on the annual rates above of the Acquired Fund’s average daily net assets.
Under the terms of a mastersub-advisory agreement between the Adviser and each of Invesco Asset Management Deutschland GmbH, Invesco Asset Management Limited, Invesco Asset Management (Japan) Limited, Invesco Hong Kong Limited, Invesco Senior Secured Management, Inc. and Invesco Canada Ltd. and separatesub-advisory agreements with Invesco Capital Management LLC, and Invesco Asset Management (India) Private Limited (collectively, the “AffiliatedSub-Advisers”) the Adviser, not the Fund, will pay 40% of the fees paid to the Adviser to any such AffiliatedSub-Adviser(s) that provide(s) discretionary investment management services to the Fund based on the percentage of assets allocated to such AffiliatedSub-Adviser(s). Invesco has also entered into aSub-Advisory Agreement with OppenheimerFunds, Inc. to provide discretionary management services to the Funds.
Effective on the Reorganization Date, the Adviser has contractually agreed, through May 31, 2021, to waive advisory fees and/or reimburse expenses of all shares to the extent necessary to limit the total annual fund operating expenses after fee waiver and/or expense reimbursement (excluding certain items discussed below) of Series I and Series II shares to 0.80% and 1.05%, respectively, of the Fund’s average daily net assets (the “expense limits”). In determining the Adviser’s obligation to waive advisory fees and/or reimburse expenses, the following expenses are not taken into account, and could cause total annual fund operating expenses after fee waivers and/or expense reimbursement to exceed the numbers reflected above: (1) interest; (2) taxes; (3) dividend expenses on short sales; (4) extraordinary ornon-routine items, including litigation expenses; and (5) expenses that the Fund has incurred but did not actually pay because of an expense offset arrangement. Unless Invesco continues the fee waiver agreement, it will terminate on May 31, 2021. During its term, the fee waiver agreement cannot be terminated or amended to increase the expense limits or reduce the advisory fee waiver without approval of the Board of Trustees.
Further, the Adviser has contractually agreed, through at least June 30, 2021, to waive the advisory fee payable by the Fund in an amount equal to 100% of the net advisory fees the Adviser receives from the affiliated money market funds on investments by the Fund of uninvested cash in such affiliated money market funds.
For the year ended December 31, 2019, the Adviser waived advisory fees of $12,559 and reimbursed Fund expenses of $69,898 and $486,974 for Series I and Series II shares, respectively.
Prior to the Reorganization, the OFI Global Asset Management, Inc. had contractually agreed to waive fees and/or reimburse expenses ofNon-Service and Service shares to 0.80% and 1.05%, respectively, of the Acquired Fund’s average daily net assets.
17 INVESCO OPPENHEIMER V.I. MAIN STREET SMALL CAP FUND
NOTES TO FINANCIAL STATEMENTSContinued
The Trust has entered into a master administrative services agreement with Invesco pursuant to which the Fund has agreed to pay Invesco a fee for costs incurred in providing accounting services and fund administrative services to the Fund and to reimburse Invesco for fees paid to insurance companies that have agreed to provide certain administrative services to the Fund. These administrative services provided by the insurance companies may include, among other things: maintenance of master accounts with the Fund; tracking, recording and transmitting net purchase and redemption orders for Fund shares; maintaining and preserving records related to the purchase, redemption and other account activity of variable product owners; distributing copies of Fund documents such as prospectuses, proxy materials and periodic reports, to variable product owners, and responding to inquiries from variable product owners about the Fund. Pursuant to such agreement, for the year ended December 31, 2019, Invesco was paid $71,567 for accounting and fund administrative services and was reimbursed $767,343 for fees paid to insurance companies. Additionally, Invesco has entered into service agreements whereby JP Morgan Chase Bank serves as custodian to the Fund. Prior to the Reorganization, the Acquired Fund paid administrative fees to OFI Global Asset Management, Inc.
The Trust has entered into a transfer agency and service agreement with Invesco Investment Services, Inc. (“IIS”) pursuant to which the Fund has agreed to pay IIS a fee for providing transfer agency and shareholder services to the Fund and reimburse IIS for certain expenses incurred by IIS in the course of providing such services. Prior to the Reorganization, the Acquired Fund paid transfer agent fees to OFI Global Asset Management, Inc. and Shareholder Services, Inc. For the yearended December 31, 2019, expenses incurred under these agreements are shown in the Statement of Operations as Transfer and shareholder servicing agent fees.
The Trust has entered into master distribution agreements with Invesco Distributors, Inc. (“IDI”) to serve as the distributor for the Series II shares of the Fund. The Trust has adopted a plan pursuant to Rule12b-1 under the 1940 Act with respect to the Fund’s Series II shares (the “Plan”). The Fund, pursuant to the Plan, pays IDI at an annual rate of 0.25% of the average daily net assets of Series II shares. The fees are accrued daily and paid monthly. Of the Plan payments, up to 0.25% of the average daily net assets of the class of shares may be paid to insurance companies who furnish continuing personal shareholder services to customers who purchase and own shares of such class. Any amounts not paid as a service fee under the Plan would constitute an asset-based sales charge. Rules of the Financial Industry Regulatory Authority (“FINRA”) impose a cap on the total sales charges, including asset-based sales charges, that may be paid by any class of shares of the Fund plans. Prior to the Reorganization, the Acquired Fund paid distribution fees to OppenheimerFunds Distributor, Inc. For the year ended December 31, 2019, expenses incurred under the plans are shown in the Statement of Operations as Distribution and service plan fees.
Certain officers and trustees of the Trust are officers and directors of the Adviser, IIS and/or IDI.
Note 3 – Additional Valuation Information
GAAP defines fair value as the price that would be received to sell an asset or paid to transfer a liability in an orderly transaction between market participants at the measurement date, under current market conditions. GAAP establishes a hierarchy that prioritizes the inputs to valuation methods, giving the highest priority to readily available unadjusted quoted prices in an active market for identical assets (Level 1) and the lowest priority to significant unobservable inputs (Level 3), generally when market prices are not readily available or are unreliable. Based on the valuation inputs, the securities or other investments are tiered into one of three levels. Changes in valuation methods may result in transfers in or out of an investment’s assigned level:
Level 1 — Prices are determined using quoted prices in an active market for identical assets.
Level 2 — Prices are determined using other significant observable inputs. Observable inputs are inputs that other market participants may use in pricing a security. These may include quoted prices for similar securities, interest rates, prepayment speeds, credit risk, yield curves, loss severities, default rates, discount rates, volatilities and others.
Level 3 — Prices are determined using significant unobservable inputs. In situations where quoted prices or observable inputs are unavailable (for example, when there is little or no market activity for an investment at the end of the period), unobservable inputs may be used. Unobservable inputs reflect the Fund’s own assumptions about the factors market participants would use in determining fair value of the securities or instruments and would be based on the best available information.
As of December 31, 2019, all of the securities in this Fund were valued based on Level 1 inputs (see the Schedule of Investments for security categories). The level assigned to the securities valuations may not be an indication of the risk or liquidity associated with investing in those securities. Because of the inherent uncertainties of valuation, the values reflected in the financial statements may materially differ from the value received upon actual sale of those investments.
Note 4 – Security Transactions with Affiliated Funds
The Fund is permitted to purchase or sell securities from or to certain other Invesco Funds under specified conditions outlined in procedures adopted by the Board of Trustees of the Trust. The procedures have been designed to ensure that any purchase or sale of securities by the Fund from or to another fund or portfolio that is or could be considered an affiliate by virtue of having a common investment adviser (or affiliated investment advisers), common Trustees and/or common officers complies with Rule17a-7 of the 1940 Act. Further, as defined under the procedures, each transaction is effected at the current market price. Pursuant to these procedures for the period January 1, 2019 to May 24, 2019, the Predecessor Fund engaged in transactions with affiliates as listed: Securities purchases of $126,589 which resulted in no net realized gains (losses). For the period May 25, 2019 to December 31, 2019, the Fund did not engage in transactions with affiliates.
18 INVESCO OPPENHEIMER V.I. MAIN STREET SMALL CAP FUND
Note 5 – Expense Offset Arrangement
The expense offset arrangement is comprised of custodian credits which result from periodic overnight cash balances at the custodian. For the year ended December 31, 2019, the Fund received credits from this arrangement, which resulted in the reduction of the Fund’s total expenses of $3,066.
Note 6 – Trustee and Officer Fees and Benefits
Certain Trustees have executed Deferred Compensation Agreement(s) pursuant to which they have the option to elect to defer receipt of all or a portion of the annual compensation they are entitled to receive from the Fund. For purposes of determining the amount owed to the Trustees under the plan(s), deferred amounts are treated as though equal dollar amounts had been invested in shares of the Fund or in other Invesco and/or Invesco Oppenheimer funds selected by the Trustees. The Fund purchases shares of the funds selected for deferral by the Trustees in amounts equal to his or her deemed investment, resulting in a Fund asset equal to the deferred compensation liability. Such assets are included as a component of “Other” within the asset section of the Statement of Assets and Liabilities. Deferral of Trustees’ fees under the plan(s) will not affect the net assets of the Fund and will not materially affect the Fund’s assets, liabilities or net investment income per share. Amounts will be deferred until distributed in accordance with the Deferred Compensation Agreement(s).
Note 7 – Cash Balance
The Fund is permitted to temporarily carry a negative or overdrawn balance in its account with JPMorgan Chase Bank, the custodian bank. Such balances, if any atperiod-end, are shown in the Statement of Assets and Liabilities under the payable caption Amount due custodian. To compensate the custodian bank for such overdrafts, the overdrawn Fund may either (1) leave funds as a compensating balance in the account so the custodian bank can be compensated by earning the additional interest; or (2) compensate by paying the custodian bank at a rate agreed upon by the custodian bank and Invesco, not to exceed the contractually agreed upon rate.
Note 8 – Distributions to Shareholders and Tax Components of Net Assets
Tax Character of Distributions to Shareholders Paid During the Fiscal Years Ended December 31, 2019 and 2018:
| | | | | | | | |
| | | 2019 | | | 2018 | |
| Ordinary income | | $ | 7,555,176 | | | $ | 29,120,771 | |
| Long-term capital gain | | | 79,757,494 | | | | 107,172,949 | |
| | | | |
| Total distributions | | $ | 87,312,670 | | | $ | 136,293,720 | |
| | | | |
Tax Components of Net Assets atPeriod-End:
| | | | |
| | | 2019 | |
| Undistributed ordinary income | | $ | 4,655,621 | |
| Undistributed long-term gain | | | 8,881,408 | |
| Net unrealized appreciation - investments | | | 145,454,154 | |
| Temporary book/tax differences | | | (80,884) | |
| Shares of beneficial interest | | | 556,112,137 | |
| | | | |
| Total net assets | | $ | 715,022,436 | |
| | | | |
The difference between book-basis andtax-basis unrealized appreciation (depreciation) is due to differences in the timing of recognition of gains and losses on investments for tax and book purposes. The Fund’s net unrealized appreciation (depreciation) difference is attributable primarily to wash sales, partnerships and master limited partnerships.
The temporary book/tax differences are a result of timing differences between book and tax recognition of income and/or expenses. The Fund’s temporary book/tax differences are the result of the trustee deferral of compensation and retirement plan benefits.
Capital loss carryforward is calculated and reported as of a specific date. Results of transactions and other activity after that date may affect the amount of capital loss carryforward actually available for the Fund to utilize. Capital losses generated in years beginning after December 22, 2010 can be carried forward for an unlimited period, whereas previous losses expire in eight tax years. Capital losses with an expiration period may not be used to offset capital gains until all net capital losses without an expiration date have been utilized. Capital loss carryforwards with no expiration date will retain their character as either short-term or long-term capital losses instead of as short-term capital losses as under prior law. The ability to utilize capital loss carryforwards in the future may be limited under the Internal Revenue Code and related regulations based on the results of future transactions.
The Fund does not have a capital loss carryforward as of December 31, 2019.
Note 9 – Investment Transactions
The aggregate amount of investment securities (other than short-term securities, U.S. Treasury obligations and money market funds, if any) purchased
19 INVESCO OPPENHEIMER V.I. MAIN STREET SMALL CAP FUND
NOTES TO FINANCIAL STATEMENTSContinued
and sold by the Fund during theyearended December 31, 2019 was $317,004,115 and $402,932,862, respectively. Cost of investments, including any derivatives, on a tax basis includes the adjustments for financial reporting purposes as of the most recently completed federal income tax reportingperiod-end.
| | | | |
| Unrealized Appreciation (Depreciation) of Investments on a Tax Basis | |
| Aggregate unrealized appreciation of investments | | $ | 181,182,420 | |
| Aggregate unrealized (depreciation) of investments | | | (35,728,266) | |
| | | | |
| Net unrealized appreciation of investments | | $ | 145,454,154 | |
| | | | |
Cost of investments for tax purposes is$570,185,227.
Note 10 – Reclassification of Permanent Differences
Primarily as a result of differing book/tax treatment of redemptionsin-kind, on December 31, 2019, undistributed net investment incomewas decreased by $3,932,644,undistributed net realized gain was decreased by $59,600,099,and shares of beneficial interest was increased by $63,532,743. This reclassification had no effect on the net assets of the Fund.
Note 11 – Share Information
Transactions in shares of beneficial interest were as follows:
| | | | | | | | | | | | | | | | |
| | | Year Ended December 31, 20191 | | Year Ended December 31, 2018 |
| | | | |
| | | Shares | | Amount | | Shares | | Amount |
| Series I Shares | | | | | | | | | | | | | | | | |
| Sold | | | 483,827 | | | $ | 10,802,190 | | | | 877,784 | | | $ | 21,586,667 | |
| Dividends and/or distributions reinvested | | | 480,179 | | | | 10,160,591 | | | | 754,537 | | | | 19,059,602 | |
| Redeemed | | | (2,347,530 | ) | | | (52,907,985 | ) | | | (1,462,725 | ) | | | (35,729,815 | ) |
| | | | |
| Net increase (decrease) | | | (1,383,524 | ) | | $ | (31,945,204 | ) | | | 169,596 | | | $ | 4,916,454 | |
| | | | |
| | | | | | | | | | | | | | | | | |
| Series II Shares | | | | | | | | | | | | | | | | |
| Sold | | | 2,432,799 | | | $ | 52,170,452 | | | | 2,340,038 | | | $ | 56,752,666 | |
| Dividends and/or distributions reinvested | | | 3,709,234 | | | | 77,152,079 | | | | 4,711,982 | | | | 117,234,118 | |
| Redeemed2 | | | (16,441,278 | ) | | | (349,479,235 | ) | | | (7,125,127 | ) | | | (176,558,782 | ) |
| | | | |
| Net increase (decrease) | | | (10,299,245 | ) | | $ | (220,156,704 | ) | | | (73,107 | ) | | $ | (2,571,998 | ) |
| | | | |
1.There are entities that are record owners of more than 5% of the outstanding shares of the Fund and own 58% of the outstanding shares of the Fund. The Fund and the Fund’s principal underwriter or adviser, are parties to participation agreements with these entities whereby these entities sell units of interest in separate accounts funding variable products that are invested in the Fund. The Fund, Invesco and/or Invesco affiliates may make payments to these entities, which are considered to be related to the Fund, for providing services to the Fund, Invesco and/or Invesco affiliates, including, but not limited to services such as securities brokerage, distribution, third party record keeping and account servicing. The Fund has no knowledge as to whether all or any portion of the shares owned of record by these entities are also owned beneficially.
2.On October 18, 2019, a total of 11,222,355 Series II shares of the Fund valued at $235,669,465 were redeemed by a significant shareholder and settled through aredemption-in-kind transaction, of which $1,490,346 consisted of cash, which resulted in a realized gain (loss) of $62,922,388 to the Fund for book purposes. From a federal income tax perspective, the realized gains (losses) are not recognized.
Note 12 – Borrowings
Joint Credit Facility.A number of mutual funds managed by the Adviser participate in a $1.95 billion revolving credit facility (the “Facility”) intended to provide short-term financing, if necessary, subject to certain restrictions in connection with atypical redemption activity. Expenses and fees related to the Facility are paid by the participating funds and are disclosed separately or as other expenses on the Statement of Operations. The Fund did not utilize the Facility during the reporting period. The Facility terminated May 24, 2019.
20 INVESCO OPPENHEIMER V.I. MAIN STREET SMALL CAP FUND
REPORT OF INDEPENDENT REGISTERED PUBLIC ACCOUNTING FIRM
To the Board of Trustees of AIM Variable Insurance Funds (Invesco Variable Insurance Funds) and Shareholders of Invesco Oppenheimer V.I. Main Street Small Cap Fund®
Opinion on the Financial Statements
We have audited the accompanying statement of assets and liabilities, including the schedule of investments, of Invesco Oppenheimer V.I. Main Street Small Cap Fund® (one of the funds constituting AIM Variable Insurance Funds (Invesco Variable Insurance Funds), referred to hereafter as the “Fund”) as of December 31, 2019, the related statements of operations and of changes in net assets for the year ended December 31, 2019, including the related notes, and the financial highlights for the period ended December 31, 2019 (collectively referred to as the “financial statements”). In our opinion, the financial statements present fairly, in all material respects, the financial position of the Fund as of December 31, 2019, the results of its operations and changes in its net assets for the year ended December 31, 2019 and the financial highlights for the period ended December 31, 2019 in conformity with accounting principles generally accepted in the United States of America.
The financial statements of Invesco Oppenheimer V.I. Main Street Small Cap Fund® (formerly known as Oppenheimer Main Street Small Cap Fund/ VA) as of and for the year ended December 31, 2018 and the financial highlights for each of the periods ended on or prior to December 31, 2018 (not presented herein, other than the statement of changes in net assets and the financial highlights) were audited by other auditors whose report dated February 14, 2019 expressed an unqualified opinion on those financial statements and financial highlights.
Basis for Opinion
These financial statements are the responsibility of the Fund’s management. Our responsibility is to express an opinion on the Fund’s financial statements based on our audit. We are a public accounting firm registered with the Public Company Accounting Oversight Board (United States) (PCAOB) and are required to be independent with respect to the Fund in accordance with the U.S. federal securities laws and the applicable rules and regulations of the Securities and Exchange Commission and the PCAOB.
We conducted our audit of these financial statements in accordance with the standards of the PCAOB. Those standards require that we plan and perform the audit to obtain reasonable assurance about whether the financial statements are free of material misstatement, whether due to error or fraud.
Our audit included performing procedures to assess the risks of material misstatement of the financial statements, whether due to error or fraud, and performing procedures that respond to those risks. Such procedures included examining, on a test basis, evidence regarding the amounts and disclosures in the financial statements. Our audit also included evaluating the accounting principles used and significant estimates made by management, as well as evaluating the overall presentation of the financial statements. Our procedures included confirmation of securities owned as of December 31, 2019 by correspondence with the custodian, transfer agent and brokers; when replies were not received from brokers, we performed other auditing procedures. We believe that our audit provides a reasonable basis for our opinion.
/s/PricewaterhouseCoopers LLP
Houston, Texas
February 18, 2020
We have served as the auditor of one or more of the investment companies in the Invesco group of investment companies since at least 1995. We have not been able to determine the specific year we began serving as auditor.
21 INVESCO OPPENHEIMER V.I. MAIN STREET SMALL CAP FUND
TAX INFORMATION
Form1099-DIV, Form1042-S and other year–end tax information provide shareholders with actual calendar year amounts that should be included in their tax returns. Shareholders should consult their tax advisers.
The following distribution information is being provided as required by the Internal Revenue Code or to meet a specific state’s requirement.
The Fund designates the following amounts or, if subsequently determined to be different, the maximum amount allowable for its fiscal year ended December 31, 2019:
Federal and State Income Tax
| | | | |
| Long-Term Capital Gain Distributions | | $ | 79,757,494 | |
| Corporate Dividends Received Deduction* | | | 86.18 | % |
* The above percentage is based on ordinary income dividends paid to shareholders during the Fund’s fiscal year.
22 INVESCO OPPENHEIMER V.I. MAIN STREET SMALL CAP FUND
PORTFOLIO PROXY VOTING POLICIES AND GUIDELINES; UPDATES TO SCHEDULE OF INVESTMENTS
Go paperless with eDelivery
Visit invesco.com/edelivery to enjoy the convenience and security of anytime electronic access to your investment documents.
With eDelivery, you can elect to have any or all of the following materials delivered straight to your inbox to download, save and print from your own computer:
| · | | Fund reports and prospectuses |
Invesco mailing information
Send general correspondence to Invesco Investment Services, Inc., P.O. Box 219078, Kansas City, MO 64121-9078.
Important notice regarding delivery of security holder documents
To reduce Fund expenses, only one copy of most shareholder documents may be mailed to shareholders with multiple accounts at the same address (Householding). Mailing of your shareholder documents may be householded indefinitely unless you instruct us otherwise. If you do not want the mailing of these documents to be combined with those for other members of your household, please contact Invesco Investment Services, Inc. at 800 959 4246 or contact your financial institution. We will begin sending you individual copies for each account within 30 days after receiving your request.
Fund holdings and proxy voting information
The Fund provides a complete list of its holdings four times in each fiscal year, at the quarter ends. For the second and fourth quarters, the lists appear in the Fund’s semiannual and annual reports to shareholders. For the first and third quarters, the Fund files the lists with the Securities and Exchange Commission (SEC) as an exhibit to its reports on FormN-PORT. The most recent list of portfolio holdings is available at invesco.com/completeqtrholdings. Shareholders can also look up the Fund’s FormsN-PORT on the SEC website at sec.gov.
A description of the policies and procedures that the Fund uses to determine how to vote proxies relating to portfolio securities is available without charge, upon request, from our Client Services department at 800 959 4246 or at invesco.com/proxyguidelines. The information is also available on the SEC website, sec.gov.
Information regarding how the Fund voted proxies related to its portfolio securities during the most recent12-month period ended June 30 is available at invesco. com/proxysearch. The information is also available on the SEC website, sec.gov.
Invesco Advisers, Inc. is an investment adviser; it provides investment advisory services to individual and institutional clients and does not sell securities. Invesco Distributors, Inc. is the US distributor for Invesco Ltd.’s retail mutual funds, exchange-traded funds and institutional money market funds. Both are wholly owned, indirect subsidiaries of Invesco Ltd.
23 INVESCO OPPENHEIMER V.I. MAIN STREET SMALL CAP FUND
TRUSTEES AND OFFICERS
The address of each trustee and officer is AIM Variable Insurance Funds (Invesco Variable Insurance Funds) (the “Trust”), 11 Greenway Plaza, Suite 1000, Houston, Texas 77046-1173. The trustees serve for the life of the Trust, subject to their earlier death, incapacitation, resignation, retirement or removal as more specifically provided in the Trust’s organizational documents. Each officer serves for a one year term or until their successors are elected and qualified. Column two below includes length of time served with predecessor entities, if any.
| | | | | | | | |
| | | | | |
Name, Year of Birth and Position(s) Held with the Trust | | Trustee and/or Officer Since | | Principal Occupation(s) During Past 5 Years | | Number of Funds in Fund Complex
Overseen by Trustee | | Other Directorship(s) Held by Trustee During Past
5 Years |
INTERESTED PERSON | | | | | | | | |
| | | | | |
Martin L. Flanagan 1– 1960 Trustee and Vice Chair | | 2007 | | Executive Director, Chief Executive Officer and President, Invesco Ltd. (ultimate parent of Invesco and a global investment management firm); Trustee and Vice Chair, The Invesco Funds; Vice Chair, Investment Company Institute; and Member of Executive Board, SMU Cox School of Business Formerly: Advisor to the Board, Invesco Advisers, Inc. (formerly known as Invesco Institutional (N.A.), Inc.); Chairman and Chief Executive Officer, Invesco Advisers, Inc. (registered investment adviser); Director, Chairman, Chief Executive Officer and President, Invesco Holding Company (US), Inc. (formerly IVZ Inc.) (holding company), Invesco Group Services, Inc. (service provider) and Invesco North American Holdings, Inc. (holding company); Director, Chief Executive Officer and President, Invesco Holding Company Limited (parent of Invesco and a global investment management firm); Director, Invesco Ltd.; Chairman, Investment Company Institute and President,Co-Chief Executive Officer,Co-President, Chief Operating Officer and Chief Financial Officer, Franklin Resources, Inc. (global investment management organization) | | 229 | | None |
| |
| 1 Mr. Flanagan is considered an interested person (within the meaning of Section 2(a)(19) of the 1940 Act) of the Trust because he is an officer of the Adviser to the Trust, and an officer and a director of Invesco Ltd., ultimate parent of the Adviser. |
24 INVESCO OPPENHEIMER V.I. MAIN STREET SMALL CAP FUND
| | | | | | | | |
| | | | | |
Name, Year of Birth and Position(s) Held with the Trust | | Trustee and/or Officer Since | | Principal Occupation(s) During Past 5 Years | | Number of Funds in Fund Complex
Overseen by Trustee | | Other Directorship(s) Held by Trustee During Past
5 Years |
INDEPENDENT TRUSTEES | | | | | | | | |
| | | | | |
Bruce L. Crockett – 1944 Trustee and Chair | | 2003 | | Chairman, Crockett Technologies Associates (technology consulting company) Formerly: Director, Captaris (unified messaging provider); Director, President and Chief Executive Officer, COMSAT Corporation; Chairman, Board of Governors of INTELSAT (international communications company); ACE Limited (insurance company); Independent Directors Council and Investment Company Institute: Member of the Audit Committee, Investment Company Institute; Member of the Executive Committee and Chair of the Governance Committee, Independent Directors Council | | 229 | | Director and Chairman of the Audit Committee, ALPS (Attorneys Liability Protection Society) (insurance company); Director and Member of the Audit Committee and Compensation Committee, Ferroglobe PLC (metallurgical company) |
| | | | | |
David C. Arch – 1945 Trustee | | 2010 | | Chairman of Blistex Inc. (consumer health care products manufacturer); Member, World Presidents’ Organization | | 229 | | Board member of the Illinois Manufacturers’ Association |
| | | | | |
Beth Ann Brown – 1968 Trustee | | 2019 | | Independent Consultant Formerly: Head of Intermediary Distribution, Managing Director, Strategic Relations, Managing Director, Head of National Accounts, Senior Vice President, National Account Manager and Senior Vice President, Key Account Manager, Columbia Management Investment Advisers LLC; Vice President, Key Account Manager, Liberty Funds Distributor, Inc.; and Trustee of certain Oppenheimer Funds | | 229 | | Director, Board of Directors of Caron Engineering Inc.; Advisor, Board of Advisors of Caron Engineering Inc.; President and Director, of Acton Shapleigh Youth Conservation Corps (non-profit); and Vice President and Director of Grahamtastic Connection (non-profit) |
| | | | | |
Jack M. Fields – 1952 Trustee | | 2003 | | Chief Executive Officer, Twenty First Century Group, Inc. (government affairs company); and Chairman, Discovery Learning Alliance(non-profit) Formerly: Owner and Chief Executive Officer, Dos Angeles Ranch L.P. (cattle, hunting, corporate entertainment); Director, Insperity, Inc. (formerly known as Administaff) (human resources provider); Chief Executive Officer, Texana Timber LP (sustainable forestry company); Director of Cross Timbers Quail Research Ranch(non-profit); and member of the U.S. House of Representatives | | 229 | | None |
| | | | | |
Cynthia Hostetler – 1962 Trustee | | 2017 | | Non-Executive Director and Trustee of a number of public and private business corporations Formerly: Director, Aberdeen Investment Funds (4 portfolios); Head of Investment Funds and Private Equity, Overseas Private Investment Corporation; President, First Manhattan Bancorporation, Inc.; Attorney, Simpson Thacher & Bartlett LLP | | 229 | | Vulcan Materials Company (construction materials company); Trilinc Global Impact Fund; Genesee & Wyoming, Inc. (railroads); Artio Global Investment LLC (mutual fund complex); Edgen Group, Inc. (specialized energy and infrastructure products distributor); Investment Company Institute (professional organization); Independent Directors Council (professional organization) |
| | | | | |
Eli Jones – 1961 Trustee | | 2016 | | Professor and Dean, Mays Business School - Texas A&M University Formerly: Professor and Dean, Walton College of Business, University of Arkansas and E.J. Ourso College of Business, Louisiana State University; Director, Arvest Bank | | 229 | | Insperity, Inc. (formerly known as Administaff) (human resources provider) |
| | | | | |
Elizabeth Krentzman – 1959 Trustee | | 2019 | | Formerly: Principal and Chief Regulatory Advisor for Asset Management Services and U.S. Mutual Fund Leader of Deloitte & Touche LLP; General Counsel of the Investment Company Institute (trade association); National Director of the Investment Management Regulatory Consulting Practice, Principal, Director and Senior Manager of Deloitte & Touche LLP; Assistant Director of the Division of Investment Management – Office of Disclosure and Investment Adviser Regulation of the U.S. Securities and Exchange Commission and various positions with the Division of Investment Management – Office of Regulatory Policy of the U.S. Securities and Exchange Commission; Associate at Ropes & Gray LLP.; Advisory Board Member of the Securities and Exchange Commission Historical Society; and Trustee of certain Oppenheimer Funds | | 229 | | Trustee of the University of Florida National Board Foundation and Audit Committee Member; Member of the Cartica Funds Board of Directors (private investment funds); Member of the University of Florida Law Center Association, Inc. Board of Trustees and Audit Committee Member |
| | | | | |
Anthony J. LaCava, Jr. – 1956 Trustee | | 2019 | | Formerly: Director and Member of the Audit Committee, Blue Hills Bank (publicly traded financial institution) and Managing Partner, KPMG LLP | | 229* | | Blue Hills Bank; Chairman of Bentley University; Member, Business School Advisory Council; and Nominating Committee, KPMG LLP |
25 INVESCO OPPENHEIMER V.I. MAIN STREET SMALL CAP FUND
TRUSTEES AND OFFICERS Continued
| | | | | | | | |
| | | | | |
Name, Year of Birth and Position(s) Held with the Trust | | Trustee and/or Officer Since | | Principal Occupation(s) During Past 5 Years | | Number of Funds in Fund Complex
Overseen by Trustee | | Other Directorship(s) Held by Trustee During Past
5 Years |
INDEPENDENT TRUSTEES (CONTINUED) | | | | | | | | |
| | | | | |
Prema Mathai-Davis – 1950 Trustee | | 2003 | | Retired Co-Owner & Partner of Quantalytics Research, LLC, (a FinTech Investment Research Platform for the Self-Directed Investor) | | 229 | | None |
| | | | | |
Joel W. Motley – 1952 Trustee | | 2019 | | Director of Office of Finance, Federal Home Loan Bank; Member of the Vestry of Trinity Wall Street; Managing Director of Carmona Motley Hoffman, Inc. (privately held financial advisor); Member of the Finance and Budget Committee of the Council on Foreign Relations, Member of the Investment Committee and Board of Human Rights Watch and Member of the Investment Committee and Board of Historic Hudson Valley(non-profit cultural organization). Formerly: Managing Director of Public Capital Advisors, LLC (privately held financial advisor); Managing Director of Carmona Motley Hoffman, Inc. (privately held financial advisor); Trustee of certain Oppenheimer Funds; and Director of Columbia Equity Financial Corp. (privately held financial advisor) | | 229 | | Director of Greenwall Foundation (bioethics research foundation); Member of Board and Investment Committee of The Greenwall Foundation; Director of Southern Africa Legal Services Foundation; Board Member and Investment Committee Member of Pulitzer Center for Crisis Reporting(non-profit journalism) |
| | | | | |
Teresa M. Ressel – 1962 Trustee | | 2017 | | Non-executive director and trustee of a number of public and private business corporations Formerly: Chief Financial Officer, Olayan America, The Olayan Group (international investor/commercial/industrial); Chief Executive Officer, UBS Securities LLC; Group Chief Operating Officer, Americas, UBS AG; Assistant Secretary for Management & Budget and CFO, US Department of the Treasury | | 229 | | Atlantic Power Corporation (power generation company); ON Semiconductor Corp. (semiconductor supplier) |
| | | | | |
Ann Barnett Stern – 1957 Trustee | | 2017 | | President and Chief Executive Officer, Houston Endowment Inc. (private philanthropic institution) Formerly: Executive Vice President and General Counsel, Texas Children’s Hospital; Attorney, Beck, Redden and Secrest, LLP; Business Law Instructor, University of St. Thomas; Attorney, Andrews & Kurth LLP | | 229 | | Federal Reserve Bank of Dallas |
| | | | | |
Robert C. Troccoli – 1949 Trustee | | 2016 | | Retired Formerly: Adjunct Professor, University of Denver – Daniels College of Business, Senior Partner, KPMG LLP | | 229 | | None |
| | | | | |
Daniel S. Vandivort – 1954 Trustee | | 2019 | | Treasurer, Chairman of the Audit and Finance Committee, and Trustee, Board of Trustees, Huntington Disease Foundation of America; and President, Flyway Advisory Services LLC (consulting and property management). Formerly: Trustee and Governance Chair, of certain Oppenheimer Funds | | 229 | | Chairman and Lead Independent Director, Chairman of the Audit Committee, and Director, Board of Directors, Value Line Funds |
| | | | | |
James D. Vaughn – 1945 Trustee | | 2019 | | Retired Formerly: Managing Partner, Deloitte & Touche LLP; Trustee and Chairman of the Audit Committee, Schroder Funds; Board Member, Mile High United Way, Boys and Girls Clubs, Boy Scouts, Colorado Business Committee for the Arts, Economic Club of Colorado and Metro Denver Network (economic development corporation); and Trustee of certain Oppenheimer Funds | | 229 | | Board member and Chairman of Audit Committee of AMG National Trust Bank; Trustee and Investment Committee member, University of South Dakota Foundation; Board member, Audit Committee Member and past Board Chair, Junior Achievement(non-profit) |
| | | | | |
Christopher L. Wilson – 1957 Trustee, Vice Chair and Chair Designate | | 2017 | | Retired Formerly: Director, TD Asset Management USA Inc. (mutual fund complex) (22 portfolios); Managing Partner, CT2, LLC (investing and consulting firm); President/Chief Executive Officer, Columbia Funds, Bank of America Corporation; President/Chief Executive Officer, CDC IXIS Asset Management Services, Inc.; Principal & Director of Operations, Scudder Funds, Scudder, Stevens & Clark, Inc.; Assistant Vice President, Fidelity Investments | | 229 | | ISO New England, Inc.(non-profit organization managing regional electricity market) |
26 INVESCO OPPENHEIMER V.I. MAIN STREET SMALL CAP FUND
| | | | | | | | |
| | | | | |
Name, Year of Birth and Position(s) Held with the Trust | | Trustee and/or Officer Since | | Principal Occupation(s) During Past 5 Years | | Number of Funds in Fund Complex
Overseen by Trustee | | Other Directorship(s) Held by Trustee During Past
5 Years |
OTHER OFFICERS | | | | | | | | |
| | | | | |
Sheri Morris – 1964 President, Principal Executive Officer and Treasurer | | 2003 | | Head of Global Fund Services, Invesco Ltd.; President, Principal Executive Officer and Treasurer, The Invesco Funds; Vice President, Invesco Advisers, Inc. (formerly known as Invesco Institutional (N.A.), Inc.) (registered investment adviser); and Vice President, Invesco Exchange-Traded Fund Trust, Invesco Exchange-Traded Fund Trust II, Invesco India Exchange-Traded Fund Trust, Invesco Actively Managed Exchange-Traded Fund Trust, Invesco Actively Managed Exchange-Traded Commodity Fund Trust and Invesco Exchange-Traded Self-Indexed Fund Trust, and Vice President, OppenheimerFunds, Inc. Formerly: Vice President and Principal Financial Officer, The Invesco Funds; Vice President, Invesco AIM Advisers, Inc., Invesco AIM Capital Management, Inc. and Invesco AIM Private Asset Management, Inc.; Assistant Vice President and Assistant Treasurer, The Invesco Funds and Assistant Vice President, Invesco Advisers, Inc., Invesco AIM Capital Management, Inc. and Invesco AIM Private Asset Management, Inc.; and Treasurer, Invesco Exchange-Traded Fund Trust, Invesco Exchange-Traded Fund Trust II, Invesco India Exchange-Traded Fund Trust and Invesco Actively Managed Exchange-Traded Fund Trust | | N/A | | N/A |
| | | | | |
Russell C. Burk – 1958 Senior Vice President and Senior Officer | | 2005 | | Senior Vice President and Senior Officer, The Invesco Funds | | N/A | | N/A |
| | | | | |
Jeffrey H. Kupor – 1968 Senior Vice President, Chief Legal Officer and Secretary | | 2018 | | Head of Legal of the Americas, Invesco Ltd.; Senior Vice President and Secretary, Invesco Advisers, Inc. (formerly known as Invesco Institutional (N.A.), Inc.) (registered investment adviser); Senior Vice President and Secretary, Invesco Distributors, Inc. (formerly known as Invesco AIM Distributors, Inc.); Vice President and Secretary, Invesco Investment Services, Inc. (formerly known as Invesco AIM Investment Services, Inc.) Senior Vice President, Chief Legal Officer and Secretary, The Invesco Funds; Secretary and General Counsel, Invesco Investment Advisers LLC (formerly known as Van Kampen Asset Management); Secretary and General Counsel, Invesco Capital Markets, Inc. (formerly known as Van Kampen Funds Inc.) and Chief Legal Officer, Invesco Exchange-Traded Fund Trust, Invesco Exchange-Traded Fund Trust II, Invesco India Exchange-Traded Fund Trust, Invesco Actively Managed Exchange-Traded Fund Trust, Invesco Actively Managed Exchange-Traded Commodity Fund Trust and Invesco Exchange-Traded Self-Indexed Fund Trust; Secretary, Invesco Indexing LLC; Secretary, W.L. Ross & Co., LLC Formerly: Secretary and Vice President, Jemstep, Inc.; Head of Legal, Worldwide Institutional, Invesco Ltd.; Secretary and General Counsel, INVESCO Private Capital Investments, Inc.; Senior Vice President, Secretary and General Counsel, Invesco Management Group, Inc. (formerly known as Invesco AIM Management Group, Inc.); Assistant Secretary, INVESCO Asset Management (Bermuda) Ltd.; Secretary and General Counsel, Invesco Private Capital, Inc.; Assistant Secretary and General Counsel, INVESCO Realty, Inc.; Secretary and General Counsel, Invesco Senior Secured Management, Inc.; and Secretary, Sovereign G./P. Holdings Inc. | | N/A | | N/A |
| | | | | |
Andrew R. Schlossberg – 1974 Senior Vice President | | 2019 | | Head of the Americas and Senior Managing Director, Invesco Ltd.; Director and Senior Vice President, Invesco Advisers, Inc. (formerly known as Invesco Institutional (N.A.), Inc.) (registered investment adviser); Director and Chairman, Invesco Investment Services, Inc. (formerly known as Invesco AIM Investment Services, Inc.) (registered transfer agent); Senior Vice President, The Invesco Funds; Director, Invesco Investment Advisers LLC (formerly known as Van Kampen Asset Management); Director, President and Chairman, Invesco Insurance Agency, Inc. Formerly: Director, Invesco UK Limited; Director and Chief Executive, Invesco Asset Management Limited and Invesco Fund Managers Limited; Assistant Vice President, The Invesco Funds; Senior Vice President, Invesco Advisers, Inc. (formerly known as Invesco Institutional (N.A.), Inc.) (registered investment adviser); Director and Chief Executive, Invesco Administration Services Limited and Invesco Global Investment Funds Limited; Director, Invesco Distributors, Inc.; Head of EMEA, Invesco Ltd.; President, Invesco Actively Managed Exchange-Traded Commodity Fund Trust, Invesco Actively Managed Exchange-Traded Fund Trust, Invesco Exchange-Traded Fund Trust, Invesco Exchange-Traded Fund Trust II and Invesco India Exchange-Traded Fund Trust; Managing Director and Principal Executive Officer, Invesco Capital Management LLC | | N/A | | N/A |
27 INVESCO OPPENHEIMER V.I. MAIN STREET SMALL CAP FUND
TRUSTEES AND OFFICERS Continued
| | | | | | | | |
| | | | | |
Name, Year of Birth and Position(s) Held with the Trust | | Trustee and/or Officer Since | | Principal Occupation(s) During Past 5 Years | | Number of Funds in Fund Complex
Overseen by Trustee | | Other Directorship(s) Held by Trustee During Past
5 Years |
OTHER OFFICERS (CONTINUED) | | | | | | | | |
| | | | | |
John M. Zerr – 1962 Senior Vice President | | 2006 | | Chief Operating Officer of the Americas; Senior Vice President, Invesco Advisers, Inc. (formerly known as Invesco Institutional (N.A.), Inc.) (registered investment adviser); Senior Vice President, Invesco Distributors, Inc. (formerly known as Invesco AIM Distributors, Inc.); Director and Vice President, Invesco Investment Services, Inc. (formerly known as Invesco AIM Investment Services, Inc.) Senior Vice President, The Invesco Funds; Managing Director, Invesco Capital Management LLC; Director, Invesco Investment Advisers LLC (formerly known as Van Kampen Asset Management); Senior Vice President, Invesco Capital Markets, Inc. (formerly known as Van Kampen Funds Inc.); Manager, Invesco Indexing LLC; Manager, Invesco Specialized Products, LLC; Director and Senior Vice President, Invesco Insurance Agency, Inc.; Member, Invesco Canada Funds Advisory Board; Director, President and Chief Executive Officer, Invesco Corporate Class Inc. (corporate mutual fund company); and Director, Chairman, President and Chief Executive Officer, Invesco Canada Ltd. (formerly known as Invesco Trimark Ltd./Invesco Trimark Ltèe) (registered investment adviser and registered transfer agent) Formerly: Director and Senior Vice President, Invesco Management Group, Inc. (formerly known as Invesco AIM Management Group, Inc.); Secretary and General Counsel, Invesco Management Group, Inc. (formerly known as Invesco AIM Management Group, Inc.); Secretary, Invesco Investment Services, Inc. (formerly known as Invesco AIM Investment Services, Inc.); Chief Legal Officer and Secretary, The Invesco Funds; Secretary and General Counsel, Invesco Investment Advisers LLC (formerly known as Van Kampen Asset Management); Secretary and General Counsel, Invesco Capital Markets, Inc. (formerly known as Van Kampen Funds Inc.); Chief Legal Officer, Invesco Exchange-Traded Fund Trust, Invesco Exchange-Traded Fund Trust II, Invesco India Exchange-Traded Fund Trust, Invesco Actively Managed Exchange-Traded Fund Trust, Invesco Actively Managed Exchange-Traded Commodity Fund Trust and Invesco Exchange-Traded Self-Indexed Fund Trust; Secretary, Invesco Indexing LLC; Director, Secretary, General Counsel and Senior Vice President, Van Kampen Exchange Corp.; Director, Vice President and Secretary, IVZ Distributors, Inc. (formerly known as INVESCO Distributors, Inc.); Director and Vice President, INVESCO Funds Group, Inc.; Director and Vice President, Van Kampen Advisors Inc.; Director, Vice President, Secretary and General Counsel, Van Kampen Investor Services Inc.; Director and Secretary, Invesco Distributors, Inc. (formerly known as Invesco AIM Distributors, Inc.); Director, Senior Vice President, General Counsel and Secretary, Invesco AIM Advisers, Inc. and Van Kampen Investments Inc.; Director, Vice President and Secretary, Fund Management Company; Director, Senior Vice President, Secretary, General Counsel and Vice President, Invesco AIM Capital Management, Inc.; Chief Operating Officer and General Counsel, Liberty Ridge Capital, Inc. (an investment adviser) | | N/A | | N/A |
| | | | | |
Gregory G. McGreevey – 1962 Senior Vice President | | 2012 | | Senior Managing Director, Invesco Ltd.; Director, Chairman, President, and Chief Executive Officer, Invesco Advisers, Inc. (formerly known as Invesco Institutional (N.A.), Inc.) (registered investment adviser); Director, Invesco Mortgage Capital, Inc. and Invesco Senior Secured Management, Inc.; and Senior Vice President, The Invesco Funds; and President, SNW Asset Management Corporation Formerly: Senior Vice President, Invesco Management Group, Inc. and Invesco Advisers, Inc.; Assistant Vice President, The Invesco Funds | | N/A | | N/A |
| | | | | |
Kelli Gallegos – 1970 Vice President, Principal Financial Officer and Assistant Treasurer | | 2008 | | Principal Financial and Accounting Officer – Investments Pool, Invesco Specialized Products, LLC; Vice President, Principal Financial Officer and Assistant Treasurer, The Invesco Funds; Principal Financial and Accounting Officer – Pooled Investments, Invesco Capital Management LLC; Vice President and Treasurer, Invesco Exchange-Traded Fund Trust, Invesco Exchange-Traded Fund Trust II, Invesco India Exchange-Traded Fund Trust, Invesco Actively Managed Exchange-Traded Fund Trust, Invesco Actively Managed Exchange-Traded Commodity Fund Trust and Invesco Exchange-Traded Self-Indexed Fund Trust Formerly: Assistant Treasurer, Invesco Specialized Products, LLC; Assistant Treasurer, Invesco Exchange-Traded Fund Trust, Invesco Exchange-Traded Fund Trust II, Invesco India Exchange-Traded Fund Trust, Invesco Actively Managed Exchange-Traded Fund Trust, Invesco Actively Managed Exchange-Traded Commodity Fund Trust and Invesco Exchange-Traded Self-Indexed Fund Trust; Assistant Treasurer, Invesco Capital Management LLC; Assistant Vice President, The Invesco Funds | | N/A | | N/A |
28 INVESCO OPPENHEIMER V.I. MAIN STREET SMALL CAP FUND
| | | | | | | | |
| | | | | |
Name, Year of Birth and Position(s) Held with the Trust | | Trustee and/or Officer Since | | Principal Occupation(s) During Past 5 Years | | Number of Funds in Fund Complex
Overseen by Trustee | | Other Directorship(s) Held by Trustee During Past
5 Years |
OTHER OFFICERS (CONTINUED) | | | | | | | | |
| | | | | |
Crissie M. Wisdom – 1969 Anti-Money Laundering Compliance Officer | | 2013 | | Anti-Money Laundering Compliance Officer, Invesco Advisers, Inc. (formerly known as Invesco Institutional (N.A.), Inc.) (registered investment adviser), Invesco Capital Markets, Inc. (formerly known as Van Kampen Funds Inc.), Invesco Distributors, Inc., Invesco Investment Services, Inc., The Invesco Funds, and Invesco Exchange-Traded Fund Trust, Invesco Exchange-Traded Fund Trust II, Invesco India Exchange-Traded Fund Trust, Invesco Actively Managed Exchange-Traded Fund Trust, Invesco Actively Managed Exchange-Traded Commodity Fund Trust and Invesco Exchange-Traded Self-Indexed Fund Trust; Anti-Money Laundering Compliance Officer and Bank Secrecy Act Officer, INVESCO National Trust Company and Invesco Trust Company; and Fraud Prevention Manager and Controls and Risk Analysis Manager for Invesco Investment Services, Inc. Formerly: Anti-Money Laundering Compliance Officer, Van Kampen Exchange Corp. and Invesco Management Group, Inc. | | N/A | | N/A |
| | | | | |
Robert R. Leveille – 1969 Chief Compliance Officer | | 2016 | | Chief Compliance Officer, Invesco Advisers, Inc. (registered investment adviser); and Chief Compliance Officer, The Invesco Funds Formerly: Chief Compliance Officer, Putnam Investments and the Putnam Funds | | N/A | | N/A |
The Statement of Additional Information of the Trust includes additional information about the Fund’s Trustees and is available upon request, without charge, by calling 1.800.959.4246. Please refer to the Fund’s Statement of Additional Information for information on the Fund’ssub-advisers.
| | | | | | |
| Office of the Fund | | Investment Adviser | | Distributor | | Auditors |
11 Greenway Plaza, Suite 1000 Houston, TX 77046-1173 | | Invesco Advisers, Inc. 1555 Peachtree Street, N.E. Atlanta, GA 30309 | | Invesco Distributors, Inc. 11 Greenway Plaza, Suite 1000 Houston, TX 77046-1173 | | PricewaterhouseCoopers LLP 1000 Louisiana Street, Suite 5800 Houston, TX 77002-5021 |
| | | |
| Counsel to the Fund | | Counsel to the | | Transfer Agent | | Custodian |
Stradley Ronon Stevens & Young, LLP 2005 Market Street, Suite 2600 Philadelphia, PA 19103-7018 | | Independent Trustees Goodwin Procter LLP 901 New York Avenue, N.W. Washington, D.C. 20001 | | Invesco Investment Services, Inc. 11 Greenway Plaza, Suite 1000 Houston, TX 77046-1173 | | JPMorgan Chase Bank 4 Chase Metro Tech Center Brooklyn, NY 11245 |
29 INVESCO OPPENHEIMER V.I. MAIN STREET SMALL CAP FUND
THIS PAGE INTENTIONALLY LEFT BLANK.
THIS PAGE INTENTIONALLY LEFT BLANK.

| | | | |
 | | Annual Report | | 12/31/2019 |
| | |
| | | | |
| | | | |
| | | | |
| | | | |
| | | | |
| | |
| | Invesco Oppenheimer V.I. Total Return Bond Fund* Beginning on January 1, 2021, as permitted by regulations adopted by the Securities and Exchange Commission, the insurance company that offers your variable annuity or variable life insurance contract may no longer send you paper copies of the Fund’s shareholder reports by mail, unless you specifically request paper copies of the reports from the insurance company or your financial intermediary. Instead of delivering paper copies of the report, the insurance company may choose to make the reports available on a website, and will notify you by mail each time a report is posted and provide you with a website link to access the report. Instructions for requesting paper copies will be provided by your insurance company. If the insurance company offers electronic delivery, you may elect to receive shareholder reports and other communications about the Fund electronically by following the instructions provided by the insurance company or by contacting your financial intermediary. If you already elected to receive shareholder reports electronically, you will not be affected by this change and you need not take any action. You may elect to receive all future reports in paper free of charge from the insurance company. You can inform the insurance company or your financial intermediary that you wish to continue receiving paper copies of your shareholder reports by following the instructions provided by the insurance company or by contacting your financial intermediary. Your election to receive reports in paper will apply to all portfolio companies available under your contract with the insurance company. The Fund provides a complete list of its holdings four times in each fiscal year, at the quarter ends. For the second and fourth quarters, the lists appear in the Fund’s semi annual and annual reports to shareholders. For the first and third quarters, the Fund files the lists with the Securities and Exchange Commission (SEC) as an exhibit to its reports on Form N-PORT. The Fund’s Form N-PORT filings are available on the SEC website, sec.gov. The Fund’s most recent portfolio holdings, as filed on Form N-PORT, have also been made available to insurance companies issuing variable annuity contracts and variable life insurance policies (“variable products”) that invest in the Fund. A description of the policies and procedures that the Fund uses to determine how to vote proxies relating to portfolio securities is available without charge, upon request, from our Client Services department at 800 959 4246 or at invesco.com/proxyguidelines. The information is also available on the SEC website, sec.gov. Information regarding how the Fund voted proxies related to its portfolio securities during the most recent 12-month period ended June 30 is available at invesco.com/proxysearch. The information is also available on the SEC website, sec.gov. Invesco Advisers, Inc. is an investment adviser; it provides investment advisory services to individual and institutional clients and does not sell securities. Invesco Distributors, Inc. is the US distributor for Invesco Ltd.’s retail mutual funds, exchange-traded funds and institutional money market funds. Both are wholly owned, indirect subsidiaries of Invesco Ltd. This report must be accompanied or preceded by a currently effective Fund prospectus and variable product prospectus, which contain more complete information, including sales charges and expenses. Investors should read each carefully before investing. *Prior to the close of business on May 24, 2019, the Fund’s name was Oppenheimer Total Return Bond Fund/VA. See Important Update on the following page for more information. |
Important Update
On October 18, 2018, Massachusetts Mutual Life Insurance Company, an indirect corporate parent of OppenheimerFunds, Inc. and its subsidiaries OFI Global Asset Management, Inc., OFI SteelPath, Inc. and OFI Advisors, LLC, announced that it had entered into an agreement whereby Invesco Ltd., a global investment management company would acquire OppenheimerFunds and its subsidiaries (together, “OppenheimerFunds”). After the close of business on May 24, 2019 Invesco Ltd. completed the acquisition of OppenheimerFunds. This Fund was included in that acquisition and as of that date, became part of the Invesco family of funds. Please visit invesco.com for more information or call Invesco’s Client Services team at 800-959-4246.
PORTFOLIO MANAGERS: Matthew Brill, Michael Hyman and Todd Schomberg1
AVERAGE ANNUAL TOTAL RETURNS FOR THE PERIODS ENDED 12/31/19
| | | | | | | | | | | | | | | | |
| | | Inception
Date | | | 1-Year | | | 5-Year | | | 10-Year | |
| | | | |
Series I Shares2 | | | 4/3/85 | | | | 9.53% | | | | 3.40% | | | | 5.36% | |
| | | | |
Series II Shares2 | | | 5/1/02 | | | | 9.25 | | | | 3.15 | | | | 5.11 | |
| | | | |
Bloomberg Barclays Credit Index | | | | | | | 13.80 | | | | 4.39 | | | | 5.32 | |
| | | | |
Bloomberg Barclays U.S. Aggregate Bond Index | | | | | | | 8.72 | | | | 3.05 | | | | 3.75 | |
| | | | |
FTSE Broad Investment Grade Bond Index | | | | | | | 8.86 | | | | 3.08 | | | | 3.73 | |
Performance quoted is past performance and cannot guarantee future results; current performance may be lower or higher.Visit invesco.com for the most recent month-end performance. Performance figures reflect reinvested distributions and changes in net asset value (NAV). Investment return and principal value will vary so that you may have a gain or a loss when you sell shares. Fund returns include changes in share price, reinvested distributions. Performance figures given represent the Fund and are not intended to reflect actual variable product values. They do not reflect sales charges, expenses and fees assessed in connection with a variable product. Sales charges, expenses and fees, which are determined by the variable product issuers, will vary and will lower the total return. Returns for periods of less than one year are cumulative and not annualized. As the result of a reorganization after the close of business on May 24, 2019, the Non-Service and Service share classes of the predecessor fund were reorganized into Series I and Series II Shares, respectively, of the Fund. Returns shown for Series I and Series II shares are blended returns of the predecessor fund and the Fund. Share class returns will differ from those of the Oppenheimer predecessor fund because of different expenses. See Fund prospectuses and summary prospectuses for more information on share classes, sales charges and new fee agreements, if any. Fund literature is available at invesco.com.
TOP HOLDINGS AND ALLOCATIONS
PORTFOLIO ALLOCATION
| | | | |
| Non-Convertible Corporate Bonds and Notes | | | 40.4% | |
| Mortgage-Backed Obligations | | | | |
Agency | | | 17.3 | |
CMOs | | | 2.7 | |
Non-Agency | | | 6.8 | |
| Investment Company | | | | |
Invesco Government & Agency Portfolio, Institutional | | | | |
Class | | | 15.5 | |
| Asset-Backed Securities | | | 13.9 | |
| U.S. Government Obligations | | | 3.4 | |
Holdings and allocations are subject to change and are not buy/sell recommendations. Percentages are as of December 31, 2019 and are based on the total market value of investments.
CORPORATE BONDS & NOTES - TOP TEN INDUSTRIES
| | |
| Commercial Banks | | 7.9% |
| Oil, Gas & Consumable Fuels | | 4.2 |
| Food Products | | 2.2 |
| Automobiles | | 2.1 |
| Real Estate Investment Trusts (REITs) | | 2.0 |
| Capital Markets | | 2.0 |
| Insurance | | 1.6 |
| Media | | 1.5 |
| Electric Utilities | | 1.4 |
| Pharmaceuticals | | 1.3 |
Holdings and allocations are subject to change and are not buy/sell recommendations. Percentages are as of December 31, 2019, and are based on net assets.
For more current Fund holdings, please visit invesco.com.
1. Matthew Brill, Michael Hyman, and Todd Schomberg were named Portfolio Managers of the Fund effective January 14, 2020.
2. Effective after the close of business on May 24, 2019, the Non-Service and Service share classes of the predecessor fund were reorganized into Series I and Series II Shares, respectively, of the Fund. Returns shown for Series I and Series II shares are blended returns of the predecessor fund and the Fund. Share class returns will differ from those of the predecessor fund because of different expenses.
3 INVESCO OPPENHEIMER V.I. TOTAL RETURN BOND FUND
Fund Performance Discussion
MARKET OVERVIEW
Calendar year 2019 proved to be an increasingly volatile time for the US bond market. US Bond returns posted strong results for the year, as rates fell amid a decelerating global economy and persistent trade disputes between the US and China. Global risks remained a headwind to growth throughout most of the year. However, during the final months of 2019, rates increased amid diminishing risks of imminent rate cuts by the US Federal Reserve (the Fed), which were previously priced in. The global economy appeared to be stabilizing as trade disputes between the US and China, Brexit uncertainties and Chinese data all seemed less threatening to valuations. Credit investors were generally rewarded over the year, despite heightened volatility and escalating recession fears. US-based yield strategies remained competitive from a global perspective as negative yields increased across regions.
During the year, the Fed cut interest rates three times: in July, September and October 2019. However, at its December meeting, the Fed gave the clear indication that the target rate would likely remain at its current level through 2020 as factors that had driven risk aversion over the year had shown signs of improving.
US rate movements were a primary driver of valuations for the year. The two-year US Treasury yield declined from 2.48% to 1.58%, the 10-year US Treasury yield decreased from 2.69% to 1.92%, and the 30-year US Treasury yield decreased from 3.02% to 2.39%. The yield curve, as measured by the yield differential of the two-year US Treasury yield versus the 30-year US Treasury yield, steepened notably from 54 bps to 81 bps.
Corporate credit spreads were also a significant contributor to returns as spreads tightened about 0.60% during the year as solid corporate fundamentals and demand for high quality assets were robust in 2019. Corporate balance sheets remain relatively healthy as debt service levels remain strong and select BBB-rated companies look to further deleverage their balance sheets from recent acquisitions.
The US investment grade bond market, as represented by the Bloomberg Barclays U.S. Aggregate Bond Index, returned 8.72% for the year. This was largely attributed to the decline in Treasury yields and the tightening of credit spreads. In particular, the credit sector returned 13.80%, with long-dated corporate bonds and those rated BBB performing the best. US Treasuries also registered a solid year with a 6.86% return.
FUND REVIEW
Against this backdrop, the Fund’s Series I shares returned 9.53% during the reporting period. In comparison, the Bloomberg Barclays US Aggregate Bond Index returned 8.72%. During this period, credit outperformed as the Bloomberg Barclays US Credit Index returned 13.80%.
In a period where credit outperformed US Treasuries, the Fund’s overweight position to credit and underweight to US Treasuries were the top contributors to return, leading the Fund to outperform the Bloomberg Barclays US Aggregate Bond Index. Additionally, the Fund had a small off-benchmark allocation to high yield which was beneficial, while an overweight to ABS and an underweight to agency MBS were both detractors.
STRATEGY & OUTLOOK
We expect 2020 to be a year of growth stabilization, with annual growth returning to around 1.8%, near our estimate of US potential growth. A US-China “Phase 1” deal would likely further improve growth prospects, even in manufacturing. Consumption looks relativity solid and interest rate-sensitive areas of the economy, such as housing, have improved.
We expect inflation to look much like it has in the post-crisis period at around 2.2%-2.5% per year. We separate prices into core sticky and flexible prices. The latter have been most affected by tariffs, but their impact should wane by the end of 2020. The Fed has been clear that the current rate of the Personal Consumption Expenditures (PCE) inflation (1.6%-1.8%) is fine and should not lead to rate cuts or hikes.
We believe the US Federal Reserve (Fed) is done cutting interest rates for the next six months. It has communicated that it is relatively comfortable with the current pace of economic growth and sees limited inflation pressures. For the Fed to cut further, growth must slow significantly. On the other hand, the Fed is unlikely to raise rates in the near future as it has committed to not raising rates unless there is a substantial increase in inflation.
We expect the 10-year Treasury to rise toward a fair value of around 2.35% over the next year. It could breach fair value if the Fed begins to hike rates, inflation accelerates or supply-demand technicals deteriorate.
4 INVESCO OPPENHEIMER V.I. TOTAL RETURN BOND FUND
We anticipate US corporate credit fundamentals to improve across most sectors in 2020. Although 2019 operating results were pressured by the first-half 2019 government shutdown, extended trade policy uncertainty and a stronger US dollar, earnings growth is still positive. Operating margins remain around historical highs, which supports improved free cash flow metrics. In addition, we are seeing pressure from shareholders to decrease leverage through management incentives.
US housing data have strengthened in recent months with improving affordability driven by low mortgage rates and a strong labor market. The rate of home price appreciation has accelerated after stabilizing near the long-term average. In the primary market, elevated securitization activity has weighed modestly on credit spreads but this has created value, in our view, relative to comparable fixed income credit sectors.
2020 faces many global uncertainties including a U.S. election, Brexit, unrest in Hong Kong and continuing trade tensions. However, the backdrop provided by global central bank easing more than offsets these concerns in our view helping to provide a foundation for potentially better growth, but also a strong tailwind to the fixed income market.
The views and opinions expressed in management’s discussion of Fund performance are those of Invesco Advisers, Inc. These views and opinions are subject to change at any time based on factors such as market and economic conditions. These views and opinions may not be relied upon as investment advice or recommendations, or as an offer for a particular security. The information is not a complete analysis of every aspect of any market, country, industry, security or the Fund. Statements of fact are from sources considered reliable, but Invesco Advisers, Inc. makes no representation or warranty as to their completeness or accuracy. Although historical performance is no guarantee of future results, these insights may help you understand our investment management philosophy.
Before investing, investors should carefully read the prospectus and/or summary prospectus and carefully consider the investment objectives, risks, charges and expenses. For this and more complete information about the fund(s), investors should ask their advisors for a prospectus/summary prospectus or visit invesco.com/fundprospectus.
Shares of Invesco funds are not deposits or obligations of any bank, are not guaranteed by any bank, are not insured by the FDIC or any other agency, and involve investment risks, including the possible loss of the principal amount invested.
Comparing the Fund’s Performance to the Market.The graphs that follow show the performance of a hypothetical $10,000 investment in each share class of the Fund held until December 31, 2019. Performance is measured over a ten-fiscal-year period for both Classes. Performance information does not reflect charges that apply to separate accounts investing in the Fund. If these charges were taken into account, performance would be lower. The graphs assume that all dividends and capital gains distributions were reinvested in additional shares.
The Fund’s performance is compared to the performance of the Bloomberg Barclays Credit Index, an index of non-convertible U.S. investment grade corporate bonds; the Bloomberg Barclays U.S. Aggregate Bond Index, an index of U.S. corporate and government bonds and the FTSE Broad Investment-Grade Bond Index, an index of institutionally traded U.S. Treasury Bonds, government-sponsored bonds, mortgage-backed securities and corporate securities. The indices are unmanaged and cannot be purchased directly by investors. While index comparisons may be useful to provide a benchmark for the Fund’s performance, it must be noted that the Fund’s investments are not limited to the investments comprising the indices. Index performance includes reinvestment of income, but does not reflect transaction costs, fees, expenses or taxes. Index performance is shown for illustrative purposes only as a benchmark for the Fund’s performance, and does not predict or depict performance of the Fund. The Fund’s performance reflects the effects of the Fund’s business and operating expenses.
5 INVESCO OPPENHEIMER V.I. TOTAL RETURN BOND FUND
COMPARISON OF CHANGE IN VALUE OF $10,000 HYPOTHETICAL INVESTMENTS IN:
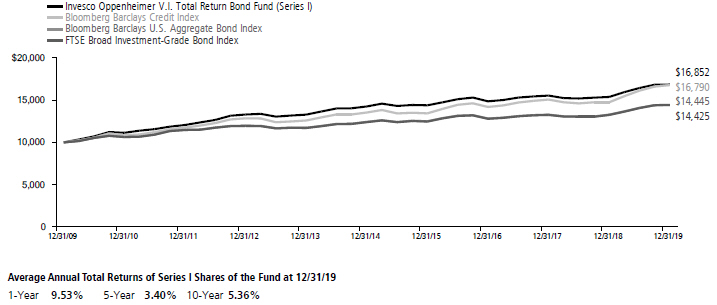
COMPARISON OF CHANGE IN VALUE OF $10,000 HYPOTHETICAL INVESTMENTS IN:
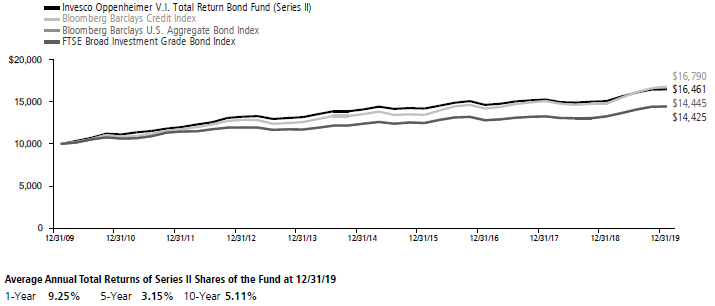
Performance quoted is past performance and cannot guarantee future results; current performance may be lower or higher.Visit invesco.com for the most recent month-end performance. Performance figures reflect reinvested distributions and changes in net asset value (NAV). Investment return and principal value will vary so that you may have a gain or a loss when you sell shares. Fund returns include changes in share price, reinvested distributions. Performance figures given represent the Fund and are not intended to reflect actual variable product values. They do not reflect sales charges, expenses and fees assessed in connection with a variable product. Sales charges, expenses and fees, which are determined by the variable product issuers, will vary and will lower the total return. Returns for periods of less than one year are cumulative and not annualized. As the result of a reorganization after the close of business on May 24, 2019, the Non-Service and Service share classes of the predecessor fund were reorganized into Series I and Series II Shares, respectively, of the Fund. Returns shown for Series I and Series II shares are blended returns of the predecessor fund and the Fund. Share class returns will differ from those of the Oppenheimer predecessor fund because of different expenses. See Fund prospectuses and summary prospectuses for more information on share classes, sales charges and new fee agreements, if any. Fund literature is available at invesco.com
6 INVESCO OPPENHEIMER V.I. TOTAL RETURN BOND FUND
Fund Expenses
Fund Expenses.As a shareholder of the Fund, you incur two types of costs: (1) transaction costs and (2) ongoing costs, including management fees; distribution and service fees; and other Fund expenses. These examples are intended to help you understand your ongoing costs (in dollars) of investing in the Fund and to compare these costs with the ongoing costs of investing in other mutual funds.
The examples are based on an investment of $1,000.00 invested at the beginning of the period and held for the entire 6-month period ended December 31, 2019.
Actual Expenses. The first section of the table provides information about actual account values and actual expenses. You may use the information in this section for the class of shares you hold, together with the amount you invested, to estimate the expense that you paid over the period. Simply divide your account value by $1,000.00 (for example, an $8,600.00 account value divided by $1,000.00 = 8.60), then multiply the result by the number in the first section under the heading entitled “Expenses Paid During 6 Months Ended December 31, 2019” to estimate the expenses you paid on your account during this period.
Hypothetical Example for Comparison Purposes.
The second section of the table provides information about hypothetical account values and hypothetical expenses based on the Fund’s actual expense ratio for each class of shares, and an assumed rate of return of 5% per year for each class before expenses, which is not the actual return. The hypothetical account values and expenses may not be used to estimate the actual ending account balance or expenses you paid for the period. You may use this information to compare the ongoing costs of investing in the Fund and other funds. To do so, compare this 5% hypothetical example for the class of shares you hold with the 5% hypothetical examples that appear in the shareholder reports of the other funds.
Please note that the expenses shown in the table are meant to highlight your ongoing costs only and do not reflect any charges associated with the separate accounts that offer this Fund. Therefore, the “hypothetical” lines of the table are useful in comparing ongoing costs only, and will not help you determine the relative total costs of owning different funds. In addition, if these separate account charges were included your costs would have been higher.
| | | | | | | | | | | | | | | | |
| Actual | | Beginning Account Value July 1, 2019 | | | Ending Account Value
December 31, 2019 | | | Expenses
Paid During
6 Months Ended
December 31, 2019 | | | | |
| Series I shares | | $ | 1,000.00 | | | $ | 1,024.50 | | | $ | 3.83 | | | | | |
| Series II shares | | | 1,000.00 | | | | 1,023.60 | | | | 5.11 | | | | | |
| | | | |
Hypothetical (5% return before expenses) | | | | | | | | | | | | | | | | |
| Series I shares | | | 1,000.00 | | | | 1,021.42 | | | | 3.83 | | | | | |
| Series II shares | | | 1,000.00 | | | | 1,020.16 | | | | 5.10 | | | | | |
Expenses are equal to the Fund’s annualized expense ratio for that class, multiplied by the average account value over the period, multiplied by 184/365 (to reflect the one-half year period). Those annualized expense ratios, excluding indirect expenses from affiliated funds, based on the 6-month period ended December 31, 2019 are as follows:
| | | | |
| Class | | Expense Ratios | |
| Series I shares | | | 0.75% | |
| Series II shares | | | 1.00 | |
The expense ratios reflect voluntary and/or contractual waivers and/or reimbursements of expenses by the Fund’s Manager. Some of these undertakings may be modified or terminated at any time, as indicated in the Fund’s prospectus. The “Financial Highlights” tables in the Fund’s financial statements, included in this report, also show the gross expense ratios, without such waivers or reimbursements and reduction to custodian expenses, if applicable.
7 INVESCO OPPENHEIMER V.I. TOTAL RETURN BOND FUND
SCHEDULE OF INVESTMENTSDecember 31, 2019
| | | | | | | | |
| | | Principal Amount | | | Value | |
| Asset-Backed Securities—16.0% | | | | | | | | |
| Auto Loans/Leases—11.6% | | | | | |
| American Credit Acceptance Receivables Trust: | |
| Series 2017-4, Cl. C, 2.94%, 1/10/241 | | $ | 84,726 | | | $ | 84,831 | |
| Series 2017-4, Cl. D, 3.57%, 1/10/241 | | | 227,000 | | | | 229,319 | |
| Series 2018-2, Cl. C, 3.70%, 7/10/241 | | | 255,000 | | | | 256,550 | |
| Series 2018-3, Cl. B, 3.49%, 6/13/221 | | | 61,208 | | | | 61,314 | |
| Series 2018-3, Cl. D, 4.14%, 10/15/241 | | | 25,000 | | | | 25,487 | |
| Series 2018-4, Cl. C, 3.97%, 1/13/251 | | | 180,000 | | | | 182,372 | |
| Series 2019-2, Cl. D, 3.41%, 6/12/251 | | | 145,000 | | | | 146,835 | |
| Series 2019-3, Cl. C, 2.76%, 9/12/251 | | | 160,000 | | | | 160,611 | |
| AmeriCredit Automobile Receivables Trust: | |
| Series 2017-2, Cl. D, 3.42%, 4/18/23 | | | 300,000 | | | | 305,265 | |
| Series 2017-4, Cl. D, 3.08%, 12/18/23 | | | 190,000 | | | | 193,019 | |
| Series 2018-3, Cl. C, 3.74%, 10/18/24 | | | 260,000 | | | | 270,030 | |
| Series 2019-2, Cl. C, 2.74%, 4/18/25 | | | 100,000 | | | | 100,909 | |
| Series 2019-2, Cl. D, 2.99%, 6/18/25 | | | 280,000 | | | | 283,172 | |
| Series 2019-3, Cl. D, 2.58%, 9/18/25 | | | 135,000 | | | | 133,716 | |
| Capital Auto Receivables Asset Trust: | | | | | | | | |
| Series 2017-1, Cl. D, 3.15%, 2/20/251 | | | 40,000 | | | | 40,454 | |
| Series 2018-2, Cl. B, 3.48%, 10/20/231 | | | 120,000 | | | | 121,393 | |
| Series 2018-2, Cl. C, 3.69%, 12/20/231 | | | 115,000 | | | | 116,688 | |
| CarMax Auto Owner Trust: | | | | | | | | |
| Series 2016-1, Cl. D, 3.11%, 8/15/22 | | | 185,000 | | | | 185,217 | |
| Series 2017-1, Cl. D, 3.43%, 7/17/23 | | | 230,000 | | | | 232,797 | |
| Series 2017-4, Cl. D, 3.30%, 5/15/24 | | | 100,000 | | | | 101,288 | |
| Series 2018-4, Cl. C, 3.85%, 7/15/24 | | | 85,000 | | | | 88,307 | |
| Series 2019-3, Cl. D, 2.85%, 1/15/26 | | | 80,000 | | | | 80,166 | |
| CPS Auto Receivables Trust: | | | | | | | | |
| Series 2018-A, Cl. B, 2.77%, 4/18/221 | | | 84,167 | | | | 84,276 | |
| Series 2018-B, Cl. B, 3.23%, 7/15/221 | | | 150,000 | | | | 150,471 | |
| Credit Acceptance Auto Loan Trust: | | | | | | | | |
| Series 2017-3A, Cl. C, 3.48%, 10/15/261 | | | 205,000 | | | | 207,963 | |
| Series 2018-1A, Cl. B, 3.60%, 4/15/271 | | | 165,000 | | | | 167,805 | |
| Series 2018-1A, Cl. C, 3.77%, 6/15/271 | | | 250,000 | | | | 254,908 | |
| Series 2018-2A, Cl. C, 4.16%, 9/15/271 | | | 150,000 | | | | 155,033 | |
| Series 2018-3A, Cl. C, 4.04%, 12/15/271 | | | 210,000 | | | | 216,276 | |
| Series 2019-1A, Cl. B, 3.75%, 4/17/281 | | | 100,000 | | | | 102,990 | |
| Series 2019-1A, Cl. C, 3.94%, 6/15/281 | | | 190,000 | | | | 196,342 | |
| Drive Auto Receivables Trust: | | | | | | | | |
| Series 2016-CA, Cl. D, 4.18%, 3/15/241 | | | 151,503 | | | | 153,351 | |
| Series 2017-1, Cl. D, 3.84%, 3/15/23 | | | 360,000 | | | | 363,675 | |
| Series 2018-1, Cl. D, 3.81%, 5/15/24 | | | 180,000 | | | | 182,998 | |
| Series 2018-2, Cl. D, 4.14%, 8/15/24 | | | 215,000 | | | | 219,387 | |
| Series 2018-3, Cl. D, 4.30%, 9/16/24 | | | 200,000 | | | | 205,178 | |
| Series 2018-5, Cl. C, 3.99%, 1/15/25 | | | 210,000 | | | | 214,012 | |
| Series 2019-1, Cl. C, 3.78%, 4/15/25 | | | 345,000 | | | | 351,013 | |
| Series 2019-3, Cl. D, 3.18%, 10/15/26 | | | 215,000 | | | | 218,157 | |
| Series 2019-4, Cl. D, 2.70%, 2/16/27 | | | 80,000 | | | | 79,454 | |
| DT Auto Owner Trust: | | | | | | | | |
| Series 2016-4A, Cl. E, 6.49%, 9/15/231 | | | 120,000 | | | | 123,094 | |
| Series 2017-1A, Cl. D, 3.55%, 11/15/221 | | | 98,697 | | | | 99,244 | |
| Series 2017-2A, Cl. D, 3.89%, 1/15/231 | | | 163,257 | | | | 164,415 | |
| Series 2017-3A, Cl. D, 3.58%, 5/15/231 | | | 70,000 | | | | 70,503 | |
| Series 2017-3A, Cl. E, 5.60%, 8/15/241 | | | 195,000 | | | | 201,978 | |
| Series 2017-4A, Cl. D, 3.47%, 7/17/231 | | | 190,000 | | | | 191,364 | |
| Series 2017-4A, Cl. E, 5.15%, 11/15/241 | | | 215,000 | | | | 221,576 | |
| Series 2018-3A, Cl. B, 3.56%, 9/15/221 | | | 250,000 | | | | 252,224 | |
| Series 2018-3A, Cl. C, 3.79%, 7/15/241 | | | 100,000 | | | | 101,620 | |
| Series 2019-2A, Cl. D, 3.48%, 2/18/251 | | | 125,000 | | | | 126,783 | |
| Series 2019-3A, Cl. D, 2.96%, 4/15/251 | | | 75,000 | | | | 75,064 | |
| Series 2019-4A, Cl. D, 2.85%, 7/15/251 | | | 225,000 | | | | 225,207 | |
| Exeter Automobile Receivables Trust: | | | | | | | | |
| Series 2018-1A, Cl. B, 2.75%, 4/15/221 | | | 34,953 | | | | 34,967 | |
| Series 2018-4A, Cl. B, 3.64%, 11/15/221 | | | 210,000 | | | | 211,032 | |
| Series 2019-1A, Cl. D, 4.13%, 12/16/241 | | | 260,000 | | | | 268,474 | |
| Series 2019-2A, Cl. C, 3.30%, 3/15/241 | | | 317,000 | | | | 321,745 | |
| Series 2019-4A, Cl. D, 2.58%, 9/15/251 | | | 240,000 | | | | 237,931 | |
| | | | | | | | |
| | | Principal Amount | | | Value | |
| Auto Loans/Leases (Continued) | | | | | |
| Flagship Credit Auto Trust, Series 2016-1, Cl. C, 6.22%, 6/15/221 | | $ | 345,000 | | | $ | 354,008 | |
GLS Auto Receivables Trust, Series
2018-1A, Cl. A, 2.82%, 7/15/221 | | | 98,222 | | | | 98,452 | |
| GM Financial Automobile Leasing Trust: | |
| Series 2017-3, Cl. C, 2.73%, 9/20/21 | | | 120,000 | | | | 120,131 | |
| Series 2018-2, Cl. C, 3.50%, 4/20/22 | | | 135,000 | | | | 136,316 | |
| Prestige Auto Receivables Trust, Series 2019-1A, Cl. C, 2.70%, 10/15/241 | | | 115,000 | | | | 115,686 | |
| Santander Drive Auto Receivables Trust: | |
| Series 2017-1, Cl. E, 5.05%, 7/15/241 | | | 355,000 | | | | 364,753 | |
| Series 2017-2, Cl. D, 3.49%, 7/17/23 | | | 70,000 | | | | 70,792 | |
| Series 2017-3, Cl. D, 3.20%, 11/15/23 | | | 280,000 | | | | 283,472 | |
| Series 2018-1, Cl. D, 3.32%, 3/15/24 | | | 100,000 | | | | 101,066 | |
| Series 2018-2, Cl. D, 3.88%, 2/15/24 | | | 165,000 | | | | 169,000 | |
| Series 2018-5, Cl. C, 3.81%, 12/16/24 | | | 215,000 | | | | 218,244 | |
| Series 2019-2, Cl. D, 3.22%, 7/15/25 | | | 195,000 | | | | 198,947 | |
| Series 2019-3, Cl. D, 2.68%, 10/15/25 | | | 165,000 | | | | 164,433 | |
| Santander Retail Auto Lease Trust: | |
| Series 2019-A, Cl. C, 3.30%, 5/22/231 | | | 315,000 | | | | 320,659 | |
| Series 2019-B, Cl. C, 2.77%, 8/21/231 | | | 115,000 | | | | 115,545 | |
| Series 2019-C, Cl. C, 2.39%, 11/20/231 | | | 210,000 | | | | 208,542 | |
| United Auto Credit Securitization Trust, Series 2019-1, Cl. C, 3.16%, 8/12/241 | | | 150,000 | | | | 151,152 | |
| Westlake Automobile Receivables Trust: | |
| Series 2017-2A, Cl. E, 4.63%, 7/15/241 | | | 305,000 | | | | 311,010 | |
| Series 2018-1A, Cl. D, 3.41%, 5/15/231 | | | 160,000 | | | | 161,834 | |
| Series 2018-3A, Cl. B, 3.32%, 10/16/231 | | | 245,000 | | | | 246,931 | |
| Series 2019-3A, Cl. C, 2.49%, 10/15/241 | | | 260,000 | | | | 260,156 | |
| | | | | | | 14,021,379 | |
| Credit Cards—1.5% | |
| World Financial Network Credit Card Master Trust: | |
| Series 2018-A, Cl. A, 3.07%, 12/16/24 | | | 495,000 | | | | 500,572 | |
| Series 2018-B, Cl. A, 3.46%, 7/15/25 | | | 230,000 | | | | 235,286 | |
| Series 2018-C, Cl. A, 3.55%, 8/15/25 | | | 470,000 | | | | 481,789 | |
| Series 2019-A, Cl. A, 3.14%, 12/15/25 | | | 75,000 | | | | 76,681 | |
| Series 2019-B, Cl. A, 2.49%, 4/15/26 | | | 270,000 | | | | 272,314 | |
| Series 2019-C, Cl. A, 2.21%, 7/15/26 | | | 235,000 | | | | 235,380 | |
| | | | | | | 1,802,022 | |
| Home Equity Loans—0.1% | |
| Ameriquest Mortgage Securities, Inc. Asset- Backed Pass-Through Certificates, Series 2005-R5, Cl. M2, 2.482% [US0001M+69], 7/25/352 | | | 5,555 | | | | 5,571 | |
| CNH Equipment Trust, Series 2017-C, Cl. B, 2.54%, 5/15/25 | | | 65,000 | | | | 65,579 | |
| | | | | | | 71,150 | |
| Leases—1.3% | |
| CCG Receivables Trust: | | | | | | | | |
| Series 2017-1, Cl. B, 2.75%, 11/14/231 | | | 230,000 | | | | 230,265 | |
| Series 2018-1, Cl. B, 3.09%, 6/16/251 | | | 85,000 | | | | 85,660 | |
| Series 2018-1, Cl. C, 3.42%, 6/16/251 | | | 20,000 | | | | 20,239 | |
| Series 2018-2, Cl. C, 3.87%, 12/15/251 | | | 60,000 | | | | 61,589 | |
| Series 2019-1, Cl. B, 3.22%, 9/14/261 | | | 170,000 | | | | 173,376 | |
| Series 2019-1, Cl. C, 3.57%, 9/14/261 | | | 40,000 | | | | 40,831 | |
| Series 2019-2, Cl. B, 2.55%, 3/15/271 | | | 105,000 | | | | 104,935 | |
| Series 2019-2, Cl. C, 2.89%, 3/15/271 | | | 100,000 | | | | 99,884 | |
| CNH Equipment Trust, Series 2019-A, Cl. A4, 3.22%, 1/15/26 | | | 125,000 | | | | 129,434 | |
| Dell Equipment Finance Trust: | | | | | | | | |
| Series 2017-2, Cl. B, 2.47%, 10/24/221 | | | 70,000 | | | | 70,097 | |
| Series 2018-1, Cl. B, 3.34%, 6/22/231 | | | 80,000 | | | | 81,024 | |
| Series 2019-1, Cl. C, 3.14%, 3/22/241 | | | 325,000 | | | | 329,831 | |
| Series 2019-2, Cl. D, 2.48%, 4/22/251 | | | 115,000 | | | | 114,328 | |
| Element Rail Leasing I LLC, Series 2014-1A, Cl. A1, 2.299%, 4/19/441 | | | 72,395 | | | | 72,443 | |
| | | | | | | 1,613,936 | |
8 INVESCO OPPENHEIMER V.I. TOTAL RETURN BOND FUND
| | | | | | | | |
| | | Principal Amount | | | Value | |
| Loans—1.5% | | | | | | | | |
| Ford Credit Floorplan Master Owner Trust A, Series 2019-3, Cl. A2, 2.34% [US0001M+60], 9/15/242 | | $ | 560,000 | | | $ | 562,476 | |
| GMF Floorplan Owner Revolving Trust: | |
| Series 2018-3, Cl. B, 3.49%, 9/15/221 | | | 240,000 | | | | 242,019 | |
| Series 2018-3, Cl. C, 3.68%, 9/15/221 | | | 200,000 | | | | 201,826 | |
| Series 2018-4, Cl. B, 3.68%, 9/15/231 | | | 200,000 | | | | 204,561 | |
| Series 2018-4, Cl. C, 3.88%, 9/15/231 | | | 250,000 | | | | 255,959 | |
| Navistar Financial Dealer Note Master Owner Trust II: | |
| Series 2018-1, Cl. A, 2.422% [US0001M+63], 9/25/231,2 | | | 110,000 | | | | 110,200 | |
| Series 2018-1, Cl. B, 2.592% [US0001M+80], 9/25/231,2 | | | 125,000 | | | | 125,151 | |
| Series 2019-1, Cl. C, 2.742% [US0001M+95], 5/25/241,2 | | | 25,000 | | | | 25,056 | |
| Series 2019-1, Cl. D, 3.242% [US0001M+145], 5/25/241,2 | | | 25,000 | | | | 25,029 | |
| | | | 1,752,277 | |
Total Asset-Backed Securities (Cost $19,020,175) | | | | 19,260,764 | |
| Mortgage-Backed Obligations—30.9% | |
| Agency—19.9% | |
| U.S. Agency Securities—19.9% | |
| Federal Home Loan Mortgage Corp. Gold Pool: | |
| 5.00%, 12/1/34 | | | 2,843 | | | | 3,105 | |
| 5.50%, 9/1/39 | | | 176,719 | | | | 197,613 | |
| 6.00%, 10/1/22-10/1/29 | | | 186,890 | | | | 207,640 | |
| 6.50%, 7/1/28-4/1/34 | | | 73,147 | | | | 81,311 | |
| 7.00%, 10/1/31-10/1/37 | | | 67,415 | | | | 74,786 | |
| 9.00%, 8/1/22-5/1/25 | | | 2,561 | | | | 2,762 | |
| Federal Home Loan Mortgage Corp. Non Gold Pool, 10.50%, 10/1/20 | | | 44 | | | | 45 | |
| Federal Home Loan Mortgage Corp., Interest-Only Stripped Mtg.-Backed Security: | |
| Series 205, Cl. IO, 93.91%, 9/1/293 | | | 3,226 | | | | 609 | |
| Series 206, Cl. IO, 7.104%, 12/15/293 | | | 58,659 | | | | 11,891 | |
| Series 243, Cl. 6, 2.633%, 12/15/323 | | | 37,649 | | | | 6,348 | |
| Series 304, Cl. C31, 7.932%, 12/15/273 | | | 116,497 | | | | 7,736 | |
| Series 304, Cl. C45, 7.889%, 12/15/273 | | | 94,736 | | | | 6,297 | |
| Series 304, Cl. C47, 5.711%, 12/15/273 | | | 55,171 | | | | 3,732 | |
| Federal Home Loan Mortgage Corp., Mtg.- Linked Amortizing Global Debt Securities, Series 2012-1, Cl. A10, 2.06%, 1/15/22 | | | 187,144 | | | | 187,842 | |
| Federal Home Loan Mortgage Corp., Multifamily Structured Pass-Through Certificates, Interest-Only Stripped Mtg.-Backed Security: | |
| Series K734, Cl. X1, 0.00%, 2/25/263,4 | | | 2,048,808 | | | | 70,706 | |
| Series KC02, Cl. X1, 0.00%, 3/25/243,4 | | | 4,565,100 | | | | 69,020 | |
| Federal Home Loan Mortgage Corp., Principal- Only Stripped Mtg.-Backed Security, Series 176, Cl. PO, 4.108%, 6/1/265 | | | 15,988 | | | | 15,011 | |
| Federal Home Loan Mortgage Corp., Real Estate Mtg. Investment Conduit Multiclass Pass-Through Certificates: | |
| Series 151, Cl. F, 9.00%, 5/15/21 | | | 44 | | | | 44 | |
| Series 1674, Cl. Z, 6.75%, 2/15/24 | | | 4,315 | | | | 4,574 | |
| Series 2034, Cl. Z, 6.50%, 2/15/28 | | | 900 | | | | 991 | |
| Series 2042, Cl. N, 6.50%, 3/15/28 | | | 1,965 | | | | 2,148 | |
| Series 2043, Cl. ZP, 6.50%, 4/15/28 | | | 119,450 | | | | 133,587 | |
| Series 2046, Cl. G, 6.50%, 4/15/28 | | | 3,893 | | | | 4,354 | |
| Series 2053, Cl. Z, 6.50%, 4/15/28 | | | 1,035 | | | | 1,161 | |
| Series 2066, Cl. Z, 6.50%, 6/15/28 | | | 127,494 | | | | 140,903 | |
| Series 2195, Cl. LH, 6.50%, 10/15/29 | | | 92,864 | | | | 103,483 | |
| Series 2220, Cl. PD, 8.00%, 3/15/30 | | | 741 | | | | 868 | |
| Series 2326, Cl. ZP, 6.50%, 6/15/31 | | | 23,577 | | | | 26,174 | |
| Series 2461, Cl. PZ, 6.50%, 6/15/32 | | | 108,202 | | | | 121,144 | |
| Series 2470, Cl. LF, 2.74% [US0001M+100], 2/15/322 | | | 912 | | | | 931 | |
| Series 2635, Cl. AG, 3.50%, 5/15/32 | | | 16,521 | | | | 17,054 | |
| Series 3025, Cl. SJ, 18.371% [-3.6667 x US0001M+2,475], 8/15/352 | | | 9,487 | | | | 13,077 | |
| | | | | | | | |
| | | Principal Amount | | | Value | |
| U.S. Agency Securities (Continued) | |
| Federal Home Loan Mortgage Corp., Real Estate Mtg. Investment Conduit Multiclass Pass-Through Certificates: (Continued) | |
| Series 3030, Cl. FL, 2.14% [US0001M+40], 9/15/352 | | $ | 1,454 | | | $ | 1,451 | |
| Series 3645, Cl. EH, 3.00%, 12/15/20 | | | 1,008 | | | | 1,007 | |
| Series 3822, Cl. JA, 5.00%, 6/15/40 | | | 734 | | | | 739 | |
| Series 3857, Cl. GL, 3.00%, 5/15/40 | | | 2,391 | | | | 2,428 | |
| Series 4221, Cl. HJ, 1.50%, 7/15/23 | | | 35,563 | | | | 35,328 | |
| Federal Home Loan Mortgage Corp., Real Estate Mtg. Investment Conduit Multiclass Pass-Through Certificates, Interest-Only Stripped Mtg.-Backed Security: | |
| Series 2074, Cl. S, 99.999%, 7/17/283 | | | 518 | | | | 46 | |
| Series 2079, Cl. S, 99.999%, 7/17/283 | | | 1,033 | | | | 111 | |
| Series 2130, Cl. SC, 99.999%, 3/15/293 | | | 40,294 | | | | 6,187 | |
| Series 2526, Cl. SE, 95.87%, 6/15/293 | | | 1,518 | | | | 270 | |
| Series 2796, Cl. SD, 99.999%, 7/15/263 | | | 76,351 | | | | 9,519 | |
| Series 2920, Cl. S, 44.163%, 1/15/353 | | | 327,721 | | | | 56,248 | |
| Series 3004, Cl. SB, 0.00%, 7/15/353,4 | | | 13,970 | | | | 1,656 | |
| Series 3397, Cl. GS, 9.211%, 12/15/373 | | | 7,611 | | | | 1,566 | |
| Series 3424, Cl. EI, 0.00%, 4/15/383,4 | | | 5,994 | | | | 896 | |
| Series 3450, Cl. BI, 19.417%, 5/15/383 | | | 212,702 | | | | 37,939 | |
| Series 3606, Cl. SN, 18.519%, 12/15/393 | | | 52,496 | | | | 8,003 | |
| Series 4057, Cl. QI, 4.398%, 6/15/273 | | | 339,597 | | | | 22,080 | |
| Series 4146, Cl. AI, 8.002%, 12/15/273 | | | 146,798 | | | | 9,645 | |
| Series 4205, Cl. AI, 7.26%, 5/15/283 | | | 90,757 | | | | 5,334 | |
| Series 4316, Cl. JS, 0.00%, 1/15/443,4 | | | 155,221 | | | | 20,761 | |
| Series 4818, Cl. BI, 0.00%, 3/15/453,4 | | | 153,338 | | | | 16,684 | |
| Federal National Mortgage Assn. Pool: | |
| 5.00%, 3/1/21-7/1/22 | | | 520 | | | | 537 | |
| 5.50%, 2/1/35-5/1/36 | | | 81,671 | | | | 91,941 | |
| 6.50%, 1/1/34 | | | 4,881 | | | | 5,431 | |
| 7.00%, 1/1/30-12/1/32 | | | 10,955 | | | | 12,582 | |
| 7.50%, 1/1/33 | | | 2,387 | | | | 2,776 | |
| 8.50%, 7/1/32 | | | 2,677 | | | | 2,704 | |
| Federal National Mortgage Assn., Interest-Only Stripped Mtg.-Backed Security: | |
| Series 221, Cl. 2, 99.999%, 5/25/233 | | | 728 | | | | 65 | |
| Series 222, Cl. 2, 99.999%, 6/25/233 | | | 80,282 | | | | 7,174 | |
| Series 252, Cl. 2, 0.00%, 11/25/233,4 | | | 71,439 | | | | 6,731 | |
| Series 294, Cl. 2, 99.999%, 2/25/283 | | | 14,226 | | | | 2,328 | |
| Series 301, Cl. 2, 30.504%, 4/25/293 | | | 1,107 | | | | 197 | |
| Series 303, Cl. IO, 73.905%, 11/25/293 | | | 24,642 | | | | 5,167 | |
| Series 320, Cl. 2, 86.056%, 4/25/323 | | | 106,719 | | | | 23,357 | |
| Series 321, Cl. 2, 39.826%, 4/25/323 | | | 267,894 | | | | 51,365 | |
| Series 324, Cl. 2, 22.722%, 7/25/323 | | | 2,549 | | | | 478 | |
| Series 331, Cl. 5, 0.00%, 2/25/333,4 | | | 3,690 | | | | 752 | |
| Series 331, Cl. 9, 20.411%, 2/25/333 | | | 83,882 | | | | 16,333 | |
| Series 334, Cl. 12, 0.00%, 3/25/333,4 | | | 6,101 | | | | 1,179 | |
| Series 334, Cl. 17, 61.126%, 2/25/333 | | | 54,369 | | | | 10,753 | |
| Series 339, Cl. 12, 0.00%, 6/25/333,4 | | | 82,543 | | | | 16,603 | |
| Series 339, Cl. 7, 0.00%, 11/25/333,4 | | | 179,833 | | | | 35,785 | |
| Series 343, Cl. 13, 0.00%, 9/25/333,4 | | | 92,385 | | | | 17,922 | |
| Series 343, Cl. 18, 0.00%, 5/25/343,4 | | | 21,970 | | | | 4,044 | |
| Series 345, Cl. 9, 0.00%, 1/25/343,4 | | | 65,116 | | | | 11,998 | |
| Series 351, Cl. 10, 0.00%, 4/25/343,4 | | | 27,554 | | | | 5,224 | |
| Series 351, Cl. 8, 0.00%, 4/25/343,4 | | | 48,393 | | | | 9,216 | |
| Series 356, Cl. 10, 0.00%, 6/25/353,4 | | | 34,716 | | | | 6,005 | |
| Series 356, Cl. 12, 0.00%, 2/25/353,4 | | | 17,157 | | | | 3,208 | |
| Series 362, Cl. 13, 0.00%, 8/25/353,4 | | | 66,534 | | | | 13,310 | |
| Series 364, Cl. 15, 0.00%, 9/25/353,4 | | | 3,578 | | | | 631 | |
| Series 364, Cl. 16, 0.00%, 9/25/353,4 | | | 73,774 | | | | 13,952 | |
| Series 365, Cl. 16, 0.00%, 3/25/363,4 | | | 90,289 | | | | 20,147 | |
| Federal National Mortgage Assn., Real Estate Mtg. Investment Conduit Multiclass Pass-Through Certificates: | |
| Series 1993-87, Cl. Z, 6.50%, 6/25/23 | | | 56,151 | | | | 59,319 | |
| Series 1998-58, Cl. PC, 6.50%, 10/25/28 | | | 67,653 | | | | 74,959 | |
| Series 1998-61, Cl. PL, 6.00%, 11/25/28 | | | 32,396 | | | | 35,836 | |
| Series 1999-54, Cl. LH, 6.50%, 11/25/29 | | | 52,154 | | | | 57,770 | |
| Series 2001-51, Cl. OD, 6.50%, 10/25/31 | | | 2,868 | | | | 3,047 | |
9 INVESCO OPPENHEIMER V.I. TOTAL RETURN BOND FUND
SCHEDULE OF INVESTMENTSContinued
| | | | | | | | |
| | | Principal Amount | | | Value | |
| U.S. Agency Securities (Continued) | | | | | |
| Federal National Mortgage Assn., Real Estate Mtg. Investment Conduit Multiclass Pass-Through Certificates: (Continued) | |
| Series 2005-73, Cl. DF, 2.042% [US0001M+25], 8/25/352 | | $ | 1,439 | | | $ | 1,432 | |
| Series 2006-11, Cl. PS, 17.996% [-3.6667 x US0001M+2,456.67], 3/25/362 | | | 54,014 | | | | 80,405 | |
| Series 2006-46, Cl. SW, 17.629% [-3.6665 x US0001M+2,419.92], 6/25/362 | | | 34,495 | | | | 50,509 | |
| Series 2006-50, Cl. KS, 17.629% [-3.6667 x US0001M+2,420], 6/25/362 | | | 41,576 | | | | 60,109 | |
| Series 2009-113, Cl. DB, 3.00%, 12/25/20 | | | 398 | | | | 398 | |
| Series 2009-36, Cl. FA, 2.732% [US0001M+94], 6/25/372 | | | 19,998 | | | | 20,345 | |
| Series 2010-43, Cl. KG, 3.00%, 1/25/21 | | | 496 | | | | 496 | |
| Series 2011-3, Cl. EL, 3.00%, 5/25/20 | | | 83 | | | | 83 | |
| Series 2011-82, Cl. AD, 4.00%, 8/25/26 | | | 2,932 | | | | 2,944 | |
| Federal National Mortgage Assn., Real Estate Mtg. Investment Conduit Multiclass Pass-Through Certificates, Interest-Only Stripped Mtg.-Backed Security: | |
| Series 2001-61, Cl. SH, 43.515%, 11/18/313 | | | 3,341 | | | | 630 | |
| Series 2001-63, Cl. SD, 61.987%, 12/18/313 | | | 1,038 | | | | 168 | |
| Series 2001-65, Cl. S, 60.043%, 11/25/313 | | | 83,819 | | | | 14,293 | |
| Series 2001-68, Cl. SC, 75.588%, 11/25/313 | | | 796 | | | | 147 | |
| Series 2001-81, Cl. S, 56.776%, 1/25/323 | | | 23,257 | | | | 4,105 | |
| Series 2002-28, Cl. SA, 64.01%, 4/25/323 | | | 780 | | | | 144 | |
| Series 2002-38, Cl. SO, 99.999%, 4/25/323 | | | 2,369 | | | | 412 | |
| Series 2002-39, Cl. SD, 92.123%, 3/18/323 | | | 1,567 | | | | 324 | |
| Series 2002-47, Cl. NS, 64.261%, 4/25/323 | | | 77,616 | | | | 14,829 | |
| Series 2002-48, Cl. S, 63.259%, 7/25/323 | | | 1,169 | | | | 228 | |
| Series 2002-51, Cl. S, 62.448%, 8/25/323 | | | 71,251 | | | | 13,621 | |
| Series 2002-52, Cl. SL, 63.005%, 9/25/323 | | | 806 | | | | 154 | |
| Series 2002-53, Cl. SK, 99.999%, 4/25/323 | | | 5,458 | | | | 1,159 | |
| Series 2002-56, Cl. SN, 58.878%, 7/25/323 | | | 1,594 | | | | 311 | |
| Series 2002-60, Cl. SM, 36.296%, 8/25/323 | | | 10,233 | | | | 1,619 | |
| Series 2002-7, Cl. SK, 45.544%, 1/25/323 | | | 4,845 | | | | 823 | |
| Series 2002-77, Cl. BS, 41.599%, 12/18/323 | | | 6,960 | | | | 1,377 | |
| Series 2002-77, Cl. IS, 84.295%, 12/18/323 | | | 4,036 | | | | 790 | |
| Series 2002-77, Cl. SH, 47.91%, 12/18/323 | | | 31,172 | | | | 5,114 | |
| Series 2002-84, Cl. SA, 46.929%, 12/25/323 | | | 77,177 | | | | 13,632 | |
| Series 2002-9, Cl. MS, 55.964%, 3/25/323 | | | 1,274 | | | | 248 | |
| Series 2002-90, Cl. SN, 36.424%, 8/25/323 | | | 5,264 | | | | 888 | |
| Series 2002-90, Cl. SY, 41.868%, 9/25/323 | | | 3,863 | | | | 643 | |
| Series 2003-26, Cl. DI, 84.741%, 4/25/333 | | | 3,561 | | | | 853 | |
| Series 2003-33, Cl. SP, 45.317%, 5/25/333 | | | 82,162 | | | | 17,656 | |
| Series 2003-4, Cl. S, 40.389%, 2/25/333 | | | 49,781 | | | | 10,266 | |
| | | | | | | | |
| | | Principal Amount | | | Value | |
| U.S. Agency Securities (Continued) | | | | | |
| Federal National Mortgage Assn., Real Estate Mtg. Investment Conduit Multiclass Pass-Through Certificates, Interest-Only Stripped Mtg.-Backed Security: (Continued) | |
| Series 2004-54, Cl. DS, 99.999%, 11/25/303 | | $ | 67,066 | | | $ | 10,570 | |
| Series 2005-14, Cl. SE, 49.33%, 3/25/353 | | | 57,300 | | | | 8,723 | |
| Series 2005-40, Cl. SA, 99.999%, 5/25/353 | | | 165,407 | | | | 28,024 | |
| Series 2005-40, Cl. SB, 78.015%, 5/25/353 | | | 7,649 | | | | 1,003 | |
| Series 2005-52, Cl. JH, 37.992%, 5/25/353 | | | 43,352 | | | | 5,877 | |
| Series 2005-93, Cl. SI, 11.13%, 10/25/353 | | | 124,540 | | | | 21,428 | |
| Series 2008-55, Cl. SA, 0.00%, 7/25/383,4 | | | 4,506 | | | | 625 | |
| Series 2009-8, Cl. BS, 99.999%, 2/25/243 | | | 488 | | | | 28 | |
| Series 2011-96, Cl. SA, 10.959%, 10/25/413 | | | 41,757 | | | | 7,110 | |
| Series 2012-121, Cl. IB, 6.594%, 11/25/273 | | | 143,837 | | | | 9,183 | |
| Series 2012-134, Cl. SA, 1.25%, 12/25/423 | | | 117,094 | | | | 21,911 | |
| Series 2012-40, Cl. PI, 25.855%, 4/25/413 | | | 79,902 | | | | 8,422 | |
| Series 2015-57, Cl. LI, 5.94%, 8/25/353 | | | 368,346 | | | | 47,886 | |
| Series 2016-45, Cl. MI, 7.899%, 7/25/463 | | | 105,091 | | | | 19,692 | |
| Series 2017-60, Cl. LI, 0.00%, 8/25/473,4 | | | 189,294 | | | | 19,024 | |
| Series 2017-66, Cl. AS, 0.00%, 9/25/473,4 | | | 867,511 | | | | 135,350 | |
| Series 2018-16, Cl. NI, 0.841%, 12/25/443 | | | 77,993 | | | | 7,986 | |
| Series 2018-69, Cl. CI, 0.00%, 10/25/463,4 | | | 112,377 | | | | 4,811 | |
| Federal National Mortgage Assn., Real Estate Mtg. Investment Conduit Multiclass Pass-Through Certificates, Principal-Only Stripped Mtg.-Backed Security, Series 1993-184, Cl. M, 5.195%, 9/25/235 | | | 26,335 | | | | 25,277 | |
| Federal National Mortgage Assn., TBA: | | | | | |
| 2.50%, 1/1/346 | | | 1,465,000 | | | | 1,477,492 | |
| 3.00%, 1/1/34-1/1/496 | | | 8,145,000 | | | | 8,269,807 | |
| 3.50%, 1/1/496 | | | 5,435,000 | | | | 5,588,423 | |
| FREMF Mortgage Trust: | | | | | | | | |
| Series 2013-K25, Cl. C, 3.619%, 11/25/451,7 | | | 90,000 | | | | 91,715 | |
| Series 2013-K26, Cl. C, 3.597%, 12/25/451,7 | | | 60,000 | | | | 61,177 | |
| Series 2013-K28, Cl. C, 3.49%, 6/25/461,7 | | | 285,000 | | | | 290,183 | |
| Series 2013-K713, Cl. C, 3.169%, 4/25/461,7 | | | 245,000 | | | | 245,000 | |
| Series 2014-K715, Cl. C, 4.117%, 2/25/461,7 | | | 190,000 | | | | 192,947 | |
| Government National Mortgage Assn. I Pool: | | | | | |
| 7.00%, 12/15/23-3/15/26 | | | 2,456 | | | | 2,559 | |
| Government National Mortgage Assn. TBA, 3.50%, 1/1/496 | | | 4,265,000 | | | | 4,395,144 | |
| Government National Mortgage Assn., Interest-Only Stripped Mtg.-Backed Security: | |
| Series 2002-15, Cl. SM, 99.999%, 2/16/323 | | | 92,210 | | | | 223 | |
| Series 2011-52, Cl. HS, 23.081%, 4/16/413 | | | 296,366 | | | | 46,188 | |
| Series 2017-136, Cl. LI, 4.251%, 9/16/473 | | | 281,569 | | | | 46,268 | |
| Series 2017-149, Cl. GS, 2.127%, 10/16/473 | | | 328,273 | | | | 48,000 | |
10 INVESCO OPPENHEIMER V.I. TOTAL RETURN BOND FUND
| | | | | | | | |
| | | Principal Amount | | | Value | |
| U.S. Agency Securities (Continued) | | | | | |
| MASTR Asset Backed Securities Trust, Series 2006-WMC3, Cl. A3, 1.892% [US0001M+10], 8/25/362 | | $ | 43,903 | | | $ | 20,452 | |
| Structured Agency Credit Risk Debt Nts., Series 2018-HQA1, Cl. M2, 4.092% [US0001M+230], 9/25/302 | | | 110,000 | | | | 111,338 | |
| | | | | | | 23,976,672 | |
| CMOs—3.1% | | | | | |
| Collateralized Mortgage Obligations—3.1% | | | | | |
| BANK, Interest-Only Stripped Mtg.-Backed Security, Series 2019-BN16, Cl. XA, 10.958%, 2/15/523 | | | 1,578,039 | | | | 110,426 | |
| Bear Stearns ARM Trust, Series 2006-1, Cl. A1, 3.84% [H15T1Y+225], 2/25/362 | | | 78,802 | | | | 80,948 | |
| COMM Mortgage Trust, Series 2014-CR20, Cl. ASB, 3.305%, 11/10/47 | | | 62,976 | | | | 64,553 | |
| Connecticut Avenue Securities: | | | | | |
| Series 2014-C01, Cl. M2, 6.192% [US0001M+440], 1/25/242 | | | 266,115 | | | | 289,404 | |
| Series 2014-C02, Cl. 1M2, 4.392% [US0001M+260], 5/25/242 | | | 156,458 | | | | 163,041 | |
| Series 2014-C03, Cl. 1M2, 4.792% [US0001M+300], 7/25/242 | | | 253,763 | | | | 267,128 | |
| Series 2014-C04, Cl. 2M2, 6.792% [US0001M+500], 11/25/242 | | | 254,455 | | | | 275,130 | |
| Series 2016-C03, Cl. 1M1, 3.792% [US0001M+200], 10/25/282 | | | 8,079 | | | | 8,090 | |
| Series 2016-C06, Cl. 1M2, 6.042% [US0001M+425], 4/25/292 | | | 280,000 | | | | 300,998 | |
| Federal Home Loan Mortgage Corp., Multifamily Structured Pass Through Certificates, Interest-Only StrippedMtg.-Backed Security, Series K735, Cl. X1, 0.00%, 5/25/263,4 | | | 2,159,145 | | | | 116,256 | |
| Federal Home Loan Mortgage Corp., Multifamily Structured Pass-Through Certificates, Interest-Only StrippedMtg.-Backed Security, Series K093, Cl. X1, 0.00%, 5/25/293,4 | | | 1,693,505 | | | | 127,865 | |
| Federal Home Loan Mortgage Corp., Real Estate Mtg. Investment Conduit Multiclass Pass-Through Certificates: | |
| Series 3010, Cl. WB, 4.50%, 7/15/20 | | | 206 | | | | 206 | |
| Series 3848, Cl. WL, 4.00%, 4/15/40 | | | 9,489 | | | | 9,655 | |
| Federal Home Loan Mortgage Corp., Real Estate Mtg. Investment Conduit Multiclass Pass-Through Certificates, Interest-Only Stripped Mtg.-Backed Security: | |
| Series 2922, Cl. SE, 27.454%, 2/15/353 | | | 38,993 | | | | 6,118 | |
| Series 2981, Cl. AS, 3.848%, 5/15/353 | | | 45,797 | | | | 6,208 | |
| Federal National Mortgage Assn., Real Estate Mtg. Investment Conduit Multiclass Pass-Through Certificates: | |
| Series 2001-74, Cl. QE, 6.00%, 12/25/31 | | | 78,630 | | | | 87,933 | |
| Series 2003-28, Cl. KG, 5.50%, 4/25/23 | | | 154,762 | | | | 161,058 | |
| Series 2014-20, Cl. HL, 1.50%, 1/25/40 | | | 153,476 | | | | 152,375 | |
| Federal National Mortgage Assn., Real Estate Mtg. Investment Conduit Multiclass Pass-Through Certificates, Interest-Only Stripped Mtg.-Backed Security: | |
| Series 2002-52, Cl. SD, 99.999%, 9/25/323 | | | 110,256 | | | | 21,386 | |
| Series 2005-12, Cl. SC, 39.578%, 3/25/353 | | | 17,568 | | | | 2,721 | |
| FREMF Mortgage Trust: | | | | | | | | |
| Series 2010-K6, Cl. B, 5.397%, 12/25/461,7 | | | 55,000 | | | | 54,912 | |
| Series 2013-K27, Cl. C, 3.496%, 1/25/461,7 | | | 95,000 | | | | 97,394 | |
| Government National Mortgage Assn., Interest-Only Stripped Mtg.-Backed Security, Series 2007-17, Cl. AI, 59.244%, 4/16/373 | | | 46,473 | | | | 8,251 | |
| JP Morgan Chase Commercial Mortgage Securities Trust: | |
| Series 2013-C10, Cl. AS, 3.372%, 12/15/47 | | | 315,000 | | | | 322,963 | |
| | | | | | | | |
| | | Principal Amount | | | Value | |
| Collateralized Mortgage Obligations (Continued) | | | | | |
| JP Morgan Chase Commercial Mortgage Securities Trust: (Continued) | |
| Series 2014-C20, Cl. AS, 4.043%, 7/15/47 | | $ | 220,000 | | | $ | 231,588 | |
| RBSSP Resecuritization Trust, Series 2010-1, Cl. 2A1, 4.269%, 7/26/451,7 | | | 4,426 | | | | 4,523 | |
| Structured Agency Credit Risk Debt Nts.: | | | | | |
| Series 2014-DN1, Cl. M2, 3.992% [US0001M+220], 2/25/242 | | | 22,164 | | | | 22,410 | |
| Series 2014-DN3, Cl. M3, 5.792% [US0001M+400], 8/25/242 | | | 162,276 | | | | 173,029 | |
| Series 2014-HQ2, Cl. M3, 5.542% [US0001M+375], 9/25/242 | | | 335,000 | | | | 362,154 | |
| Series 2015-HQA2, Cl. M2, 4.592% [US0001M+280], 5/25/282 | | | 14,965 | | | | 15,046 | |
| WF-RBS Commercial Mortgage Trust, Series 2013-C14, Cl. AS, 3.488%, 6/15/46 | | | 150,000 | | | | 154,491 | |
| | | | | | | 3,698,260 | |
| Non-Agency—7.9% | | | | | |
| Adjustable-Rate Mortgages—7.9% | | | | | |
| Banc of America Funding Trust: | | | | | |
| Series 2007-1, Cl. 1A3, 6.00%, 1/25/37 | | | 65,031 | | | | 63,743 | |
| Series 2007-C, Cl. 1A4, 4.366%, 5/20/367 | | | 22,686 | | | | 22,725 | |
| Banc of America Mortgage Trust, Series 2007-1, Cl. 1A24, 6.00%, 3/25/37 | | | 44,279 | | | | 43,807 | |
| Bear Stearns ARM Trust, Series 2005-9, Cl. A1, 4.27% [H15T1Y+230], 10/25/352 | | | 64,207 | | | | 66,113 | |
| Benchmark Mortgage Trust, Interest-Only Commercial Mtg. Pass-Through Certificates, Series 2018-B1, Cl. XA, 10.80%, 1/15/513 | | | 1,779,016 | | | | 60,051 | |
| Capital Lease Funding Securitization LP, Interest-Only Commercial Mtg. Pass-Through Certificates, Series 1997-CTL1, Cl. IO, 0.00%, 6/22/241,3,4 | | | 108,644 | | | | 1,632 | |
| CD Mortgage Trust, Interest-Only Commercial Mtg. Pass-Through Certificates, Series 2017- CD6, Cl. XA, 0.00%, 11/13/503,4 | | | 740,589 | | | | 38,819 | |
| Chase Home Lending Mortgage Trust, Series 2019-ATR1, Cl. A15, 4.00%, 4/25/491,7 | | | 61,617 | | | | 63,127 | |
| Chase Mortgage Finance Trust, Series2005-A2, Cl. 1A3, 4.086%, 1/25/367 | | | 65,782 | | | | 65,227 | |
| CHL Mortgage Pass-Through Trust: | | | | | | | | |
| Series 2005-17, Cl. 1A8, 5.50%, 9/25/35 | | | 7,786 | | | | 7,803 | |
| Series 2005-26, Cl. 1A8, 5.50%, 11/25/35 | | | 55,382 | | | | 51,332 | |
| Series 2005-J4, Cl. A7, 5.50%, 11/25/35 | | | 6,591 | | | | 6,570 | |
| Citigroup Commercial Mortgage Trust, Series 2014-GC21, Cl. AAB, 3.477%, 5/10/47 | | | 84,230 | | | | 86,499 | |
| Citigroup Commercial Mortgage Trust, Interest-Only Commercial Mtg. Pass-Through Certificates: | |
| Series 2013-GC17, Cl. XA, 0.00%, 11/10/463,4 | | | 387,139 | | | | 13,236 | |
| Series 2017-C4, Cl. XA, 0.00%, 10/12/503,4 | | | 2,053,168 | | | | 130,302 | |
| Citigroup Mortgage Loan Trust, Inc., Series 2006-AR1, Cl. 1A1, 4.97% [H15T1Y+240], 10/25/352 | | | 186,828 | | | | 187,169 | |
| COMM Mortgage Trust: | | | | | |
| Series 2013-CR6, Cl. AM, 3.147%, 3/10/461 | | | 245,000 | | | | 249,432 | |
| Series 2014-CR21, Cl. AM, 3.987%, 12/10/47 | | | 715,000 | | | | 759,456 | |
| Series 2014-LC15, Cl. AM, 4.198%, 4/10/47 | | | 170,000 | | | | 180,719 | |
| Series 2014-UBS6, Cl. AM, 4.048%, 12/10/47 | | | 475,000 | | | | 499,767 | |
| COMM Mortgage Trust, Interest-Only Stripped Mtg.-Backed Security, Series 2012-CR5, Cl. XA, 23.776%, 12/10/453 | | | 1,961,952 | | | | 75,568 | |
11 INVESCO OPPENHEIMER V.I. TOTAL RETURN BOND FUND
SCHEDULE OF INVESTMENTSContinued
| | | | | | | | |
| | | Principal Amount | | | Value | |
| Adjustable-Rate Mortgages (Continued) | |
| Connecticut Avenue Securities: | | | | | |
| Series 2014-C03, Cl. 2M2, 4.692% [US0001M+290], 7/25/242 | | $ | 44,493 | | | $ | 46,402 | |
| Series 2016-C01, Cl. 1M2, 8.542% [US0001M+675], 8/25/282 | | | 145,071 | | | | 161,573 | |
| Series 2016-C02, Cl. 1M2, 7.792% [US0001M+600], 9/25/282 | | | 257,501 | | | | 283,579 | |
| Series 2017-C01, Cl. 1M2, 5.342% [US0001M+355], 7/25/292 | | | 185,000 | | | | 195,937 | |
| Series 2017-C03, Cl. 1M1, 2.742% [US0001M+95], 10/25/292 | | | 203,607 | | | | 203,941 | |
| Series 2018-C01, Cl. 1M1, 2.392% [US0001M+60], 7/25/302 | | | 270,869 | | | | 270,857 | |
| Series 2018-C03, Cl. 1M1, 2.472% [US0001M+68], 10/25/302 | | | 122,560 | | | | 122,611 | |
| Series 2018-C05, Cl. 1M1, 2.512% [US0001M+72], 1/25/312 | | | 45,032 | | | | 45,050 | |
| Series 2018-C06, Cl. 2M1, 2.342% [US0001M+55], 3/25/312 | | | 10,259 | | | | 10,258 | |
| Connecticut Avenue Securities Trust, Series 2019-R02, Cl. 1M1, 2.642% [US0001M+85], 8/25/311,2 | | | 20,390 | | | | 20,392 | |
| CSMC Mortgage-Backed Trust, Series 2006-6, Cl. 1A4, 6.00%, 7/25/36 | | | 124,769 | | | | 102,675 | |
| Federal Home Loan Mortgage Corp., Multifamily Structured Pass-Through Certificates, Interest-Only StrippedMtg.-Backed Security, Series KC03, Cl. X1, 0.00%, 11/25/243,4 | | | 2,754,968 | | | | 61,047 | |
| Federal Home Loan Mortgage Corp., STACR Trust: | |
| Series 2018-HQA2, Cl. M1, 2.542% [US0001M+75], 10/25/481,2 | | | 247,023 | | | | 247,097 | |
| Series 2019-HRP1, Cl. M2, 3.192% [US0001M+140], 2/25/491,2 | | | 60,000 | | | | 60,056 | |
| First Horizon Alternative Mortgage Securities Trust, Series 2005-FA8, Cl. 1A6, 2.442% [US0001M+65], 11/25/352 | | | 99,750 | | | | 64,152 | |
| GS Mortgage Securities Trust: | | | | | |
| Series 2012-GC6, Cl. A3, 3.482%, 1/10/45 | | | 59,774 | | | | 60,850 | |
| Series 2013-GC12, Cl. AAB, 2.678%, 6/10/46 | | | 23,574 | | | | 23,722 | |
| Series 2013-GC16, Cl. AS, 4.649%, 11/10/46 | | | 45,000 | | | | 48,452 | |
| Series 2014-GC18, Cl. AAB, 3.648%, 1/10/47 | | | 70,130 | | | | 71,993 | |
| GSR Mortgage Loan Trust, Series 2005-AR4, Cl. 6A1, 4.657%, 7/25/357 | | | 34,912 | | | | 35,715 | |
| HomeBanc Mortgage Trust, Series 2005-3, Cl. A2, 2.102% [US0001M+31], 7/25/352 | | | 11,583 | | | | 11,634 | |
| JP Morgan Chase Commercial Mortgage Securities Trust: | |
| Series 2013-C16, Cl. AS, 4.517%, 12/15/46 | | | 300,000 | | | | 321,763 | |
| Series 2013-LC11, Cl. AS, 3.216%, 4/15/46 | | | 40,000 | | | | 40,667 | |
| Series 2016-JP3, Cl. A2, 2.435%, 8/15/49 | | | 147,066 | | | | 147,059 | |
| JP Morgan Mortgage Trust: | | | | | | | | |
| Series 2007-A1, Cl. 5A1, 4.305%, 7/25/357 | | | 40,498 | | | | 41,455 | |
| Series 2018-8, Cl. A17, 4.00%, 1/25/491,7 | | | 50,000 | | | | 50,872 | |
| JPMBB Commercial Mortgage Securities Trust: | | | | | |
| Series 2014-C24, Cl. B, 4.116%, 11/15/477 | | | 245,000 | | | | 254,693 | |
| Series 2014-C25, Cl. AS, 4.065%, 11/15/47 | | | 200,000 | | | | 211,611 | |
| | | | | | | | |
| | | Principal Amount | | | Value | |
| Adjustable-Rate Mortgages (Continued) | |
| JPMBB Commercial Mortgage Securities Trust., Interest-Only StrippedMtg.-Backed Security, Series 2015-C27, Cl. XA, 16.833%, 2/15/483 | | $ | 2,260,027 | | | $ | 108,211 | |
| LB Commercial Conduit Mortgage Trust, Interest-Only Stripped Mtg.-Backed Security, Series 1998-C1, Cl. IO, 0.00%, 2/18/303,4 | | | 54,486 | | | | 1 | |
| Lehman Structured Securities Corp., Series 2002-GE1, Cl. A, 0.00%, 7/26/241,7 | | | 21,313 | | | | 13,331 | |
| Morgan Stanley Bank of America Merrill Lynch Trust: | | | | | |
| Series 2013-C9, Cl. AS, 3.456%, 5/15/46 | | | 225,000 | | | | 232,356 | |
| Series 2014-C19, Cl. AS, 3.832%, 12/15/47 | | | 595,000 | | | | 626,885 | |
| Morgan Stanley Capital I Trust, Series 2011-C2, Cl. A4, 4.661%, 6/15/441 | | | 75,000 | | | | 76,682 | |
| Morgan Stanley Capital I, Inc., Interest-Only Commercial Mtg. Pass-Through Certificates, Series 2017-HR2, Cl. XA, 0.00%, 12/15/503,4 | | | 678,648 | | | | 34,852 | |
| Morgan Stanley Re-Remic Trust, Series 2012-R3, Cl. 1B, 3.271%, 11/26/361,7 | | | 391,058 | | | | 377,561 | |
| RALI Trust: | | | | | | | | |
| Series 2006-QS13, Cl. 1A8, 6.00%, 9/25/36 | | | 549 | | | | 495 | |
| Series 2007-QS6, Cl. A28, 5.75%, 4/25/37 | | | 6,594 | | | | 6,178 | |
| STACR Trust: | | | | | | | | |
| Series 2018-DNA2, Cl. M1, 2.592% [US0001M+80], 12/25/301,2 | | | 211,600 | | | | 211,782 | |
| Series 2018-DNA3, Cl. M1, 2.542% [US0001M+75], 9/25/481,2 | | | 37,829 | | | | 37,854 | |
| Series 2018-HRP2, Cl. M2, 3.042% [US0001M+125], 2/25/471,2 | | | 215,000 | | | | 215,412 | |
| Structured Agency Credit Risk Debt Nts.: | |
| Series 2016-DNA1, Cl. M2, 4.692% [US0001M+290], 7/25/282 | | | 49,152 | | | | 49,363 | |
| Series 2016-DNA2, Cl. M3, 6.442% [US0001M+465], 10/25/282 | | | 233,268 | | | | 251,422 | |
| Series 2016-DNA4, Cl. M2, 3.092% [US0001M+130], 3/25/292 | | | 117,496 | | | | 117,757 | |
| Series 2017-HQA1, Cl. M1, 2.992% [US0001M+120], 8/25/292 | | | 94,843 | | | | 94,919 | |
| Series 2018-DNA1, Cl. M1, 2.242% [US0001M+45], 7/25/302 | | | 166,426 | | | | 166,304 | |
| UBS Commercial Mortgage Trust, Interest-Only Commercial Mtg. Pass-Through Certificates, Series 2017-C5, Cl. XA, 12.545%, 11/15/503 | | | 1,241,685 | | | | 70,627 | |
| WaMu Mortgage Pass-Through Certificates Trust: | |
| Series 2003-AR10, Cl. A7, 4.19%, 10/25/337 | | | 48,866 | | | | 49,218 | |
| Series 2005-AR14, Cl. 1A4, 3.844%, 12/25/357 | | | 98,002 | | | | 98,130 | |
| Series 2005-AR16, Cl. 1A1, 3.748%, 12/25/357 | | | 46,384 | | | | 46,345 | |
| Wells Fargo Commercial Mortgage Trust, Series 2015-NXS1, Cl. ASB, 2.934%, 5/15/48 | | | 305,000 | | | | 309,865 | |
| Wells Fargo Commercial Mortgage Trust, Interest-Only Commercial Mtg. Pass-Through Certificates, Series 2017-C42, Cl. XA, 10.48%, 12/15/503 | | | 892,107 | | | | 52,563 | |
| Wells Fargo Mortgage Backed Securities Trust, Series 2019-1, Cl. A7, 4.00%, 11/25/481,7 | | | 68,032 | | | | 68,110 | |
| WF-RBS Commercial Mortgage Trust: | | | | | |
| Series 2014-C20, Cl. AS, 4.176%, 5/15/47 | | | 130,000 | | | | 137,852 | |
| Series 2014-LC14, Cl. AS, 4.351%, 3/15/477 | | | 145,000 | | | | 154,600 | |
| | | | | | | 9,497,885 | |
| Total Mortgage-Backed Obligations (Cost $38,325,638) | | | | 37,172,817 | |
12 INVESCO OPPENHEIMER V.I. TOTAL RETURN BOND FUND
| | | | | | | | |
| | | Principal Amount | | | Value | |
| U.S. Government Obligations—3.8% | |
| United States Treasury Bond, 2.25%, 8/15/49 | | $ | 575,600 | | | $ | 557,893 | |
| United States Treasury Nts.: | | | | | |
| 1.625%, 12/31/21-12/15/22 | | | 1,145,000 | | | | 1,145,682 | |
| 1.75%, 12/31/24-11/15/29 | | | 2,962,000 | | | | 2,951,461 | |
Total U.S. Government Obligations (Cost $4,656,731) | | | | 4,655,036 | |
| Corporate Bonds and Notes—46.5% | |
| Consumer Discretionary—5.7% | |
| Automobiles—2.1% | |
| Daimler Finance North America LLC, 2.55% Sr. Unsec. Nts., 8/15/221 | | | 319,000 | | | | 321,356 | |
| Ford Motor Credit Co. LLC, 5.584% Sr. Unsec. Nts., 3/18/24 | | | 200,000 | | | | 216,474 | |
| General Motors Co., 6.25% Sr. Unsec. Nts., 10/2/43 | | | 78,000 | | | | 87,553 | |
| General Motors Financial Co., Inc.: | | | | | |
| 4.15% Sr. Unsec. Nts., 6/19/23 | | | 310,000 | | | | 326,205 | |
| 4.20% Sr. Unsec. Nts., 11/6/21 | | | 250,000 | | | | 259,217 | |
| Harley-Davidson Financial Services, Inc., 2.55% Sr. Unsec. Nts., 6/9/221 | | | 318,000 | | | | 319,184 | |
| Hyundai Capital America, 4.125% Sr. Unsec. Nts., 6/8/231 | | | 315,000 | | | | 329,070 | |
| Nissan Motor Acceptance Corp., 3.65% Sr. Unsec. Nts., 9/21/211 | | | 310,000 | | | | 316,457 | |
| Volkswagen Group of America Finance LLC, 4.00% Sr. Unsec. Nts., 11/12/211 | | | 298,000 | | | | 308,223 | |
| | | | | | | 2,483,739 | |
| Hotels, Restaurants & Leisure—0.3% | |
| Las Vegas Sands Corp., 3.50% Sr. Unsec. Nts., 8/18/26 | | | 247,000 | | | | 254,206 | |
| McDonald’s Corp., 3.625% Sr. Unsec. Nts., 9/1/49 | | | 74,000 | | | | 75,358 | |
| | | | | | | 329,564 | |
| Household Durables—0.8% | |
| DR Horton, Inc., 4.75% Sr. Unsec. Nts., 2/15/23 | | | 290,000 | | | | 309,439 | |
| Lennar Corp., 4.75% Sr. Unsec. Nts., 5/30/25 | | | 314,000 | | | | 338,205 | |
| Toll Brothers Finance Corp.: | | | | | |
| 4.375% Sr. Unsec. Nts., 4/15/23 | | | 257,000 | | | | 269,957 | |
| 4.875% Sr. Unsec. Nts., 3/15/27 | | | 75,000 | | | | 81,213 | |
| | | | | | | 998,814 | |
| Internet & Catalog Retail—0.4% | |
QVC, Inc., 4.45% Sr. Sec. Nts., 2/15/25 | | | 520,000 | | | | 537,931 | |
| Media—1.5% | |
| Charter Communications Operating LLC/Charter Communications Operating Capital, 5.125% Sr. Sec. Nts., 7/1/49 | | | 87,000 | | | | 94,564 | |
| Comcast Corp.: | | | | | | | | |
| 2.65% Sr. Unsec. Nts., 2/1/30 | | | 90,000 | | | | 90,364 | |
| 4.00% Sr. Unsec. Nts., 3/1/48 | | | 105,000 | | | | 116,576 | |
| Discovery Communications LLC, 4.125% Sr. Unsec. Nts., 5/15/29 | | | 191,000 | | | | 206,333 | |
| Interpublic Group of Cos., Inc. (The): | | | | | |
| 3.75% Sr. Unsec. Nts., 10/1/21 | | | 251,000 | | | | 257,987 | |
| 4.20% Sr. Unsec. Nts., 4/15/24 | | | 311,000 | | | | 334,794 | |
| Time Warner Cable LLC, 4.50% Sr. Sec. Nts., 9/15/42 | | | 106,000 | | | | 108,322 | |
| ViacomCBS, Inc.: | | | | | | | | |
| 4.20% Sr. Unsec. Nts., 6/1/29 | | | 160,000 | | | | 174,666 | |
| 4.375% Sr. Unsec. Nts., 3/15/43 | | | 100,000 | | | | 105,983 | |
| WPP Finance 2010, 3.75% Sr. Unsec. Nts., 9/19/24 | | | 321,000 | | | | 338,669 | |
| | | | | | | 1,828,258 | |
| | | | | | | | |
| | | Principal Amount | | | Value | |
| Specialty Retail—0.3% | |
Ross Stores, Inc., 3.375% Sr. Unsec. Nts., 9/15/24 | | $ | 324,000 | | | $ | 338,313 | |
| Textiles, Apparel & Luxury Goods—0.3% | |
Hanesbrands, Inc., 4.875% Sr. Unsec. Nts., 5/15/261 | | | 316,000 | | | | 335,150 | |
| Consumer Staples—4.5% | |
| Beverages—0.9% | |
| Anheuser-Busch InBev Worldwide, Inc., 8.20% Sr. Unsec. Nts., 1/15/39 | | | 186,000 | | | | 292,658 | |
| Bacardi Ltd., 4.70% Sr. Unsec. Nts., 5/15/281 | | | 163,000 | | | | 177,613 | |
| Keurig Dr Pepper, Inc., 4.057% Sr. Unsec. Nts., 5/25/23 | | | 304,000 | | | | 320,612 | |
| Pernod Ricard SA, 4.25% Sr. Unsec. Nts., 7/15/221 | | | 307,000 | | | | 323,006 | |
| | | | | | | 1,113,889 | |
| Food & Staples Retailing—0.3% | |
| Kroger Co. (The), 4.45% Sr. Unsec. Nts., 2/1/47 | | | 89,000 | | | | 94,568 | |
| Walgreen Co., 3.10% Sr. Unsec. Nts., 9/15/22 | | | 303,000 | | | | 309,191 | |
| | | | | | | 403,759 | |
| Food Products—2.2% | |
| Bunge Ltd. Finance Corp.: | | | | | | | | |
| 3.25% Sr. Unsec. Nts., 8/15/26 | | | 216,000 | | | | 216,006 | |
| 3.50% Sr. Unsec. Nts., 11/24/20 | | | 313,000 | | | | 316,954 | |
| Conagra Brands, Inc.: | | | | | | | | |
| 3.80% Sr. Unsec. Nts., 10/22/21 | | | 240,000 | | | | 247,665 | |
| 4.60% Sr. Unsec. Nts., 11/1/25 | | | 302,000 | | | | 333,551 | |
| Lamb Weston Holdings, Inc., 4.875% Sr. Unsec. Nts., 11/1/261 | | | 308,000 | | | | 327,050 | |
| Mondelez International Holdings Netherlands BV, 2.00% Sr. Unsec. Nts., 10/28/211 | | | 319,000 | | | | 319,030 | |
| Smithfield Foods, Inc.: | | | | | | | | |
| 3.35% Sr. Unsec. Nts., 2/1/221 | | | 174,000 | | | | 174,530 | |
| 5.20% Sr. Unsec. Nts., 4/1/291 | | | 255,000 | | | | 282,663 | |
| Tyson Foods, Inc.: | | | | | | | | |
| 3.90% Sr. Unsec. Nts., 9/28/23 | | | 255,000 | | | | 270,486 | |
| 5.10% Sr. Unsec. Nts., 9/28/48 | | | 89,000 | | | | 111,894 | |
| | | | | | | 2,599,829 | |
| Tobacco—1.1% | |
| Altria Group, Inc., 3.49% Sr. Unsec. Nts., 2/14/22 | | | 209,000 | | | | 215,055 | |
| BAT Capital Corp., 3.557% Sr. Unsec. Nts., 8/15/27 | | | 169,000 | | | | 172,496 | |
| BAT International Finance plc, 3.25% Sr. Unsec. Nts., 6/7/221 | | | 314,000 | | | | 320,915 | |
| Imperial Brands Finance plc, 3.75% Sr. Unsec. Nts., 7/21/221 | | | 308,000 | | | | 317,078 | |
| Imperial Tobacco Finance plc, 2.95% Sr. Unsec. Nts., 7/21/201 | | | 233,000 | | | | 233,679 | |
| | | | | | | 1,259,223 | |
| Energy—4.4% | |
| Energy Equipment & Services—0.2% | |
Schlumberger Holdings Corp., 4.00% Sr. Unsec. Nts., 12/21/251 | | | 184,000 | | | | 198,113 | |
| Oil, Gas & Consumable Fuels—4.2% | |
| Apache Corp., 4.375% Sr. Unsec. Nts., 10/15/28 | | | 237,000 | | | | 247,633 | |
| Boardwalk Pipelines LP, 4.95% Sr. Unsec. Nts., 12/15/24 | | | 156,000 | | | | 168,801 | |
| Cenovus Energy, Inc., 4.25% Sr. Unsec. Nts., 4/15/27 | | | 187,000 | | | | 198,068 | |
| Cimarex Energy Co., 4.375% Sr. Unsec. Nts., 3/15/29 | | | 160,000 | | | | 169,348 | |
13 INVESCO OPPENHEIMER V.I. TOTAL RETURN BOND FUND
SCHEDULE OF INVESTMENTSContinued
| | | | | | | | |
| | | Principal Amount | | | Value | |
| Oil, Gas & Consumable Fuels (Continued) | |
| Continental Resources, Inc., 4.375% Sr. Unsec. Nts., 1/15/28 | | $ | 174,000 | | | $ | 185,116 | |
| Devon Energy Corp., 4.75% Sr. Unsec. Nts., 5/15/42 | | | 64,000 | | | | 71,321 | |
| Energy Transfer Operating LP: | | | | | | | | |
| 4.25% Sr. Unsec. Nts., 3/15/23 | | | 245,000 | | | | 255,936 | |
| 5.30% Sr. Unsec. Nts., 4/15/47 | | | 94,000 | | | | 100,241 | |
| Enterprise Products Operating LLC, 4.20% Sr. Unsec. Nts., 1/31/50 | | | 116,000 | | | | 124,620 | |
| EQT Corp.: | | | | | | | | |
| 2.50% Sr. Unsec. Nts., 10/1/20 | | | 150,000 | | | | 149,985 | |
| 3.00% Sr. Unsec. Nts., 10/1/22 | | | 177,000 | | | | 173,922 | |
| Kinder Morgan Energy Partners LP, 5.80% Sr. Unsec. Nts., 3/1/21 | | | 124,000 | | | | 129,092 | |
| Kinder Morgan, Inc., 5.20% Sr. Unsec. Nts., 3/1/48 | | | 132,000 | | | | 153,063 | |
| Marathon Petroleum Corp., 4.50% Sr. Unsec. Nts., 4/1/48 | | | 69,000 | | | | 73,317 | |
| MPLX LP: | | | | | | | | |
| 2.985% [US0003M+110] Sr. Unsec. Nts., 9/9/222 | | | 149,000 | | | | 149,611 | |
| 4.25% Sr. Unsec. Nts., 12/1/271 | | | 195,000 | | | | 205,414 | |
| Newfield Exploration Co., 5.625% Sr. Unsec. Nts., 7/1/24 | | | 283,000 | | | | 311,161 | |
| Occidental Petroleum Corp.: | | | | | | | | |
| 2.90% Sr. Unsec. Nts., 8/15/24 | | | 344,000 | | | | 349,683 | |
| 3.50% Sr. Unsec. Nts., 8/15/29 | | | 157,000 | | | | 160,177 | |
| 4.50% Sr. Unsec. Nts., 7/15/44 | | | 64,000 | | | | 64,559 | |
| ONEOK, Inc., 4.35% Sr. Unsec. Nts., 3/15/29 | | | 161,000 | | | | 174,304 | |
| Plains All American Pipeline LP/PAA Finance Corp., 3.55% Sr. Unsec. Nts., 12/15/29 | | | 154,000 | | | | 151,890 | |
| Rockies Express Pipeline LLC, 4.95% Sr. Unsec. Nts., 7/15/291 | | | 164,000 | | | | 163,487 | |
| Sabine Pass Liquefaction LLC: | | | | | |
| 4.20% Sr. Sec. Nts., 3/15/28 | | | 166,000 | | | | 175,901 | |
| 5.75% Sr. Sec. Nts., 5/15/24 | | | 280,000 | | | | 312,329 | |
| Sunoco Logistics Partners Operations LP, 4.00% Sr. Unsec. Nts., 10/1/27 | | | 194,000 | | | | 200,650 | |
| Valero Energy Corp., 4.00% Sr. Unsec. Nts., 4/1/29 | | | 153,000 | | | | 165,110 | |
| Williams Cos., Inc. (The), 3.70% Sr. Unsec. Nts., 1/15/23 | | | 318,000 | | | | 329,373 | |
| | | | | | | 5,114,112 | |
| Financials—15.4% | |
| Capital Markets—2.0% | |
| Apollo Management Holdings LP, 4.95% [H15T5Y+326.6] Sub. Nts., 1/14/501,2 | | | 235,000 | | | | 238,180 | |
| Brookfield Asset Management, Inc., 4.00% Sr. Unsec. Nts., 1/15/25 | | | 252,000 | | | | 270,998 | |
| Carlyle Finance Subsidiary LLC, 3.50% Sr. Unsec. Nts., 9/19/291 | | | 159,000 | | | | 158,574 | |
| Credit Suisse Group Funding Guernsey Ltd., 4.55% Sr. Unsec. Nts., 4/17/26 | | | 147,000 | | | | 163,165 | |
| Goldman Sachs Group, Inc. (The): | |
| 3.50% Sr. Unsec. Nts., 11/16/26 | | | 172,000 | | | | 180,906 | |
| 3.75% Sr. Unsec. Nts., 2/25/26 | | | 170,000 | | | | 179,911 | |
| Morgan Stanley: | | | | | | | | |
| 4.431% [US0003M+162.8] Sr. Unsec. Nts., 1/23/302 | | | 238,000 | | | | 269,037 | |
| 5.00% Sub. Nts., 11/24/25 | | | 264,000 | | | | 297,350 | |
| Northern Trust Corp., 3.375% [US0003M+113.1] Sub. Nts., 5/8/322 | | | 119,000 | | | | 122,249 | |
| Raymond James Financial, Inc., 3.625% Sr. Unsec. Nts., 9/15/26 | | | 157,000 | | | | 165,925 | |
| UBS Group AG: | | | | | | | | |
| 4.125% Sr. Unsec. Nts., 4/15/261 | | | 153,000 | | | | 166,367 | |
| | | | | | | | |
| | | Principal Amount | | | Value | |
| Capital Markets (Continued) | |
| UBS Group AG: (Continued) 4.253% Sr. Unsec. Nts., 3/23/281 | | $ | 135,000 | | | $ | 147,583 | |
| | | | | | | 2,360,245 | |
| Commercial Banks—7.9% | |
| Bank of America Corp.: | | | | | | | | |
| 3.824% [US0003M+157.5] Sr. Unsec. Nts., 1/20/282 | | | 185,000 | | | | 199,113 | |
| 4.271% [US0003M+131] Sr. Unsec. Nts., 7/23/292 | | | 253,000 | | | | 281,064 | |
| 7.75% Sub. Nts., 5/14/38 | | | 232,000 | | | | 365,392 | |
| Bank of Ireland Group plc, 4.50% Sr. Unsec. Nts., 11/25/231 | | | 250,000 | | | | 267,499 | |
| Bank of Montreal, Series E, 3.30% Sr. Unsec. Nts., 2/5/24 | | | 247,000 | | | | 257,426 | |
| BBVA USA, 2.50% Sr. Unsec. Nts., 8/27/24 | | | 255,000 | | | | 252,881 | |
| BNP Paribas SA, 4.375% [USSW5+148.3] Sub. Nts., 3/1/331,2 | | | 176,000 | | | | 190,065 | |
| Citigroup, Inc.: | | | | | | | | |
| 4.075% [US0003M+119.2] Sr. Unsec. Nts., 4/23/292 | | | 256,000 | | | | 280,501 | |
| 5.00% [SOFRRATE+381.3] Jr. Sub. Perpetual Bonds2,8 | | | 249,000 | | | | 260,983 | |
| Citizens Bank NA (Providence RI), 2.65% Sr. Unsec. Nts., 5/26/22 | | | 65,000 | | | | 65,800 | |
| Credit Agricole SA, 4.375% Sub. Nts., 3/17/251 | | | 310,000 | | | | 333,328 | |
| Credit Suisse AG (New York), 3.625% Sr. Unsec. Nts., 9/9/24 | | | 189,000 | | | | 201,019 | |
| Danske Bank AS, 3.244% [US0003M+159.1] Sr. Unsec. Nts., 12/20/251,2 | | | 200,000 | | | | 202,366 | |
| Discover Bank, 4.65% Sr. Unsec. Nts., 9/13/28 | | | 116,000 | | | | 130,707 | |
| Fifth Third Bank (Cincinnati OH), 3.85% Sub. Nts., 3/15/26 | | | 168,000 | | | | 178,946 | |
| HSBC Holdings plc: | | | | | | | | |
| 3.95% [US0003M+98.72] Sr. Unsec. Nts., 5/18/242 | | | 103,000 | | | | 108,359 | |
| 4.041% [US0003M+154.6] Sr. Unsec. Nts., 3/13/282 | | | 125,000 | | | | 133,697 | |
| 4.583% [US0003M+153.46] Sr. Unsec. Nts., 6/19/292 | | | 171,000 | | | | 191,120 | |
| Huntington Bancshares, Inc., 4.00% Sr. Unsec. Nts., 5/15/25 | | | 317,000 | | | | 342,483 | |
| JPMorgan Chase & Co.: | | | | | | | | |
| 3.54% [US0003M+138] Sr. Unsec. Nts., 5/1/282 | | | 259,000 | | | | 275,087 | |
| 3.782% [US0003M+133.7] Sr. Unsec. Nts., 2/1/282 | | | 337,000 | | | | 363,281 | |
| 3.797% [US0003M+89] Sr. Unsec. Nts., 7/23/242 | | | 315,000 | | | | 332,003 | |
| KeyCorp, 4.15% Sr. Unsec. Nts., 10/29/25 | | | 101,000 | | | | 110,683 | |
| Lloyds Bank plc, 2.25% Sr. Unsec. Nts., 8/14/22 | | | 256,000 | | | | 257,235 | |
| Lloyds Banking Group plc, 6.657% [US0003M+127] Jr. Sub. Perpetual Bonds1,2,8 | | | 304,000 | | | | 361,870 | |
| Mitsubishi UFJ Financial Group, Inc., 3.741% Sr. Unsec. Nts., 3/7/29 | | | 196,000 | | | | 211,409 | |
| National Australia Bank Ltd., 3.933% [H15T5Y+188] Sub. Nts., 8/2/341,2 | | | 153,000 | | | | 158,991 | |
| Nordea Bank Abp, 4.625% [USSW5+169] Sub. Nts., 9/13/331,2 | | | 112,000 | | | | 122,138 | |
| PNC Financial Services Group, Inc. (The), 3.15% Sr. Unsec. Nts., 5/19/27 | | | 235,000 | | | | 246,422 | |
| Royal Bank of Canada, 3.70% Sr. Unsec. Nts., 10/5/23 | | | 272,000 | | | | 287,528 | |
14 INVESCO OPPENHEIMER V.I. TOTAL RETURN BOND FUND
| | | | | | | | |
| | | Principal Amount | | | Value | |
| Commercial Banks (Continued) | |
| Santander Holdings USA, Inc., 3.50% Sr. Unsec. Nts., 6/7/24 | | $ | 256,000 | | | $ | 263,332 | |
| Societe Generale SA, 3.875% Sr. Unsec. Nts., 3/28/241 | | | 248,000 | | | | 260,787 | |
| Standard Chartered plc, 2.744% [US0003M+120] Sr. Unsec. Nts., 9/10/221,2 | | | 250,000 | | | | 251,747 | |
| Synovus Financial Corp., 3.125% Sr. Unsec. Nts., 11/1/22 | | | 180,000 | | | | 182,264 | |
| Truist Bank: | | | | | | | | |
| 2.636% [H15T5Y+115] Sub. Nts., 9/17/292 | | | 390,000 | | | | 389,846 | |
| 3.30% Sub. Nts., 5/15/26 | | | 112,000 | | | | 116,657 | |
| 4.05% Sr. Unsec. Nts., 11/3/25 | | | 135,000 | | | | 148,268 | |
| US Bancorp, 3.10% Sub. Nts., 4/27/26 | | | 204,000 | | | | 212,326 | |
| Wells Fargo & Co.: 3.584% [US0003M+131] Sr. Unsec. Nts., 5/22/282 | | | 257,000 | | | | 273,129 | |
| 4.75% Sub. Nts., 12/7/46 | | | 160,000 | | | | 191,847 | |
| Zions Bancorp NA, 3.25% Sub. Nts., 10/29/29 | | | 250,000 | | | | 245,446 | |
| | | | | | | 9,505,045 | |
| Consumer Finance—0.9% | |
| American Express Co.: | | | | | | | | |
| 3.125% Sr. Unsec. Nts., 5/20/26 | | | 190,000 | | | | 197,566 | |
| 4.90% [US0003M+328.5] Jr. Sub. Perpetual Bonds2,8 | | | 246,000 | | | | 247,296 | |
| Capital One Financial Corp.: | | | | | |
| 3.75% Sr. Unsec. Nts., 3/9/27 | | | 103,000 | | | | 109,841 | |
| 3.80% Sr. Unsec. Nts., 1/31/28 | | | 91,000 | | | | 97,812 | |
| Discover Financial Services, 3.75% Sr. Unsec. Nts., 3/4/25 | | | 112,000 | | | | 118,569 | |
| Synchrony Financial, 4.25% Sr. Unsec. Nts., 8/15/24 | | | 252,000 | | | | 268,910 | |
| | | | | | | 1,039,994 | |
| Diversified Financial Services—0.9% | |
| AerCap Ireland Capital DAC/AerCap Global Aviation Trust, 3.50% Sr. Unsec. Nts., 5/26/22 | | | 295,000 | | | | 303,222 | |
| AXA Equitable Holdings, Inc., 4.35% Sr. Unsec. Nts., 4/20/28 | | | 165,000 | | | | 179,127 | |
| Blackstone Holdings Finance Co. LLC, 3.15% Sr. Unsec. Nts., 10/2/271 | | | 121,000 | | | | 124,333 | |
| BPCE SA, 4.50% Sub. Nts., 3/15/251 | | | 185,000 | | | | 199,355 | |
| EDP Finance BV, 3.625% Sr. Unsec. Nts., 7/15/241 | | | 219,000 | | | | 228,000 | |
| | | | | | | 1,034,037 | |
| Insurance—1.6% | |
| Athene Global Funding, 2.95% Sec. Nts., 11/12/261 | | | 440,000 | | | | 439,407 | |
| Brighthouse Financial, Inc., 3.70% Sr. Unsec. Nts., 6/22/27 | | | 67,000 | | | | 66,827 | |
| CNA Financial Corp., 3.45% Sr. Unsec. Nts., 8/15/27 | | | 239,000 | | | | 249,002 | |
| Lincoln National Corp., 3.80% Sr. Unsec. Nts., 3/1/28 | | | 193,000 | | | | 205,662 | |
| Manulife Financial Corp., 4.061% [USISDA05+164.7] Sub. Nts., 2/24/322 | | | 193,000 | | | | 200,239 | |
| Marsh & McLennan Cos., Inc., 4.35% Sr. Unsec. Nts., 1/30/47 | | | 106,000 | | | | 121,922 | |
| Principal Financial Group, Inc., 3.70% Sr. Unsec. Nts., 5/15/29 | | | 190,000 | | | | 207,093 | |
| Prudential Financial, Inc.: | | | | | | | | |
| 3.70% Sr. Unsec. Nts., 3/13/51 | | | 149,000 | | | | 156,743 | |
| 5.20% [US0003M+304] Jr. Sub. Nts., 3/15/442 | | | 243,000 | | | | 259,580 | |
| | | | | | | | |
| | | Principal Amount | | | Value | |
| Insurance (Continued) | |
| Willis North America, Inc., 3.875% Sr. Unsec. Nts., 9/15/49 | | $ | 74,000 | | | $ | 73,909 | |
| | | | | | | 1,980,384 | |
| Real Estate Investment Trusts (REITs)—2.0% | |
| American Tower Corp.: | | | | | | | | |
| 3.00% Sr. Unsec. Nts., 6/15/23 | | | 262,000 | | | | 268,322 | |
| 4.00% Sr. Unsec. Nts., 6/1/25 | | | 168,000 | | | | 179,867 | |
| Brixmor Operating Partnership LP, 4.125% Sr. Unsec. Nts., 5/15/29 | | | 162,000 | | | | 173,959 | |
| Crown Castle International Corp., 3.65% Sr. Unsec. Nts., 9/1/27 | | | 170,000 | | | | 179,853 | |
| Equinix, Inc., 3.20% Sr. Unsec. Nts., 11/18/29 | | | 155,000 | | | | 155,863 | |
| Essex Portfolio LP, 3.00% Sr. Unsec. Nts., 1/15/30 | | | 148,000 | | | | 149,754 | |
| Healthcare Trust of America Holdings LP, 3.50% Sr. Unsec. Nts., 8/1/26 | | | 219,000 | | | | 228,561 | |
| Healthpeak Properties, Inc., 3.00% Sr. Unsec. Nts., 1/15/30 | | | 297,000 | | | | 298,102 | |
| Host Hotels & Resorts LP, 3.375% Sr. Unsec. Nts., 12/15/29 | | | 49,000 | | | | 49,497 | |
| Kite Realty Group LP, 4.00% Sr. Unsec. Nts., 10/1/26 | | | 215,000 | | | | 214,881 | |
| Regency Centers LP, 2.95% Sr. Unsec. Nts., 9/15/29 | | | 226,000 | | | | 225,818 | |
| Spirit Realty LP, 3.20% Sr. Unsec. Nts., 1/15/27 | | | 209,000 | | | | 209,296 | |
| Welltower, Inc., 2.70% Sr. Unsec. Nts., 2/15/27 | | | 140,000 | | | | 140,567 | |
| | | | | | | 2,474,340 | |
| Thrifts & Mortgage Finance—0.1% | |
Nationwide Building Society, 3.96% [US0003M+185.5] Sr. Unsec. Nts., 7/18/301,2 | | | 150,000 | | | | 161,116 | |
| Health Care—3.8% | |
| Biotechnology—0.9% | |
| AbbVie, Inc.: | | | | | | | | |
| 2.95% Sr. Unsec. Nts., 11/21/261 | | | 113,000 | | | | 114,864 | |
| 3.20% Sr. Unsec. Nts., 11/21/291 | | | 381,000 | | | | 387,833 | |
| 4.05% Sr. Unsec. Nts., 11/21/391 | | | 128,000 | | | | 135,731 | |
| 4.875% Sr. Unsec. Nts., 11/14/48 | | | 131,000 | | | | 150,256 | |
| Amgen, Inc., 4.563% Sr. Unsec. Nts., 6/15/48 | | | 89,000 | | | | 103,332 | |
| Gilead Sciences, Inc., 4.75% Sr. Unsec. Nts., 3/1/46 | | | 133,000 | | | | 159,711 | |
| | | | | | | 1,051,727 | |
| Health Care Equipment & Supplies—0.4% | |
| Becton Dickinson & Co., 3.70% Sr. Unsec. Nts., 6/6/27 | | | 165,000 | | | | 175,795 | |
| Hologic, Inc., 4.375% Sr. Unsec. Nts., 10/15/251 | | | 318,000 | | | | 328,998 | |
| | | | | | | 504,793 | |
| Health Care Providers & Services—0.9% | |
| Anthem, Inc., 3.125% Sr. Unsec. Nts., 5/15/22 | | | 315,000 | | | | 322,874 | |
| Cigna Corp., 4.125% Sr. Unsec. Nts., 11/15/25 | | | 246,000 | | | | 267,027 | |
| CVS Health Corp., 5.05% Sr. Unsec. Nts., 3/25/48 | | | 201,000 | | | | 237,856 | |
| Fresenius Medical Care US Finance II, Inc., 5.875% Sr. Unsec. Nts., 1/31/221 | | | 295,000 | | | | 315,648 | |
| | | | | | | 1,143,405 | |
| Life Sciences Tools & Services—0.3% | |
| IQVIA, Inc., 5.00% Sr. Unsec. Nts., 10/15/261 | | | 312,000 | | | | 329,884 | |
15 INVESCO OPPENHEIMER V.I. TOTAL RETURN BOND FUND
SCHEDULE OF INVESTMENTSContinued
| | | | | | | | |
| | | Principal Amount | | | Value | |
| Pharmaceuticals—1.3% | |
| Allergan Funding SCS, 3.85% Sr. Unsec. Nts., 6/15/24 | | $ | 302,000 | | | $ | 317,167 | |
| Bayer US Finance II LLC, 3.875% Sr. Unsec. Nts., 12/15/231 | | | 313,000 | | | | 328,537 | |
| Bristol-Myers Squibb Co., 3.40% Sr. Unsec. Nts., 7/26/291 | | | 225,000 | | | | 240,648 | |
| Elanco Animal Health, Inc., 4.90% Sr. Unsec. Nts., 8/28/28 | | | 137,000 | | | | 149,021 | |
| Mylan, Inc., 3.125% Sr. Unsec. Nts., 1/15/231 | | | 309,000 | | | | 313,574 | |
| Takeda Pharmaceutical Co. Ltd., 5.00% Sr. Unsec. Nts., 11/26/28 | | | 159,000 | | | | 185,152 | |
| | | | | | | 1,534,099 | |
| Industrials—3.8% | |
| Aerospace & Defense—0.8% | |
| BAE Systems Holdings, Inc., 3.85% Sr. Unsec. Nts., 12/15/251 | | | 246,000 | | | | 261,051 | |
| L3Harris Technologies, Inc., 3.85% Sr. Unsec. Nts., 6/15/231 | | | 317,000 | | | | 333,961 | |
| Northrop Grumman Corp., 4.75% Sr. Unsec. Nts., 6/1/43 | | | 175,000 | | | | 211,291 | |
| United Technologies Corp., 3.95% Sr. Unsec. Nts., 8/16/25 | | | 193,000 | | | | 210,526 | |
| | | | | | | 1,016,829 | |
| Air Freight & Couriers—0.1% | |
Penske Truck Leasing Co. LP/PTL Finance Corp., 3.65% Sr. Unsec. Nts., 7/29/211 | | | 110,000 | | | | 112,540 | |
| Airlines—0.5% | |
| Delta Air Lines, Inc., 2.90% Sr. Unsec. Nts., 10/28/24 | | | 410,000 | | | | 411,031 | |
| United Airlines 2019-2 Class AA Pass Through Trust, 2.70%, 5/1/32 | | | 149,000 | | | | 149,748 | |
| | | | | | | 560,779 | |
| Building Products—0.4% | |
| Fortune Brands Home & Security, Inc.: | |
| 3.25% Sr. Unsec. Nts., 9/15/29 | | | 154,000 | | | | 155,848 | |
| 4.00% Sr. Unsec. Nts., 9/21/23 | | | 297,000 | | | | 313,837 | |
| | | | | | | 469,685 | |
| Commercial Services & Supplies—0.3% | |
Experian Finance plc, 2.75% Sr. Unsec. Nts., 3/8/301 | | | 329,000 | | | | 324,059 | |
| Industrial Conglomerates—0.4% | |
| GE Capital International Funding Co. Unlimited Co., 3.373% Sr. Unsec. Nts., 11/15/25 | | | 163,000 | | | | 169,792 | |
| General Electric Co., 2.70% Sr. Unsec. Nts., 10/9/22 | | | 320,000 | | | | 324,359 | |
| | | | | | | 494,151 | |
| Machinery—0.3% | |
| Ingersoll-Rand Luxembourg Finance SA, 3.80% Sr. Unsec. Nts., 3/21/29 | | | 152,000 | | | | 163,157 | |
| nVent Finance Sarl, 4.55% Sr. Unsec. Nts., 4/15/28 | | | 162,000 | | | | 168,107 | |
| | | | | | | 331,264 | |
| Professional Services—0.2% | |
IHS Markit Ltd., 4.125% Sr. Unsec. Nts., 8/1/23 | | | 198,000 | | | | 210,636 | |
| Road & Rail—0.5% | |
| Penske Truck Leasing Co. LP/PTL Finance Corp., 3.40% Sr. Unsec. Nts., 11/15/261 | | | 276,000 | | | | 281,731 | |
| Ryder System, Inc., 2.50% Sr. Unsec. Nts., 9/1/24 | | | 310,000 | | | | 311,520 | |
| | | | | | | 593,251 | |
| | | | | | | | |
| | | Principal Amount | | | Value | |
| Trading Companies & Distributors—0.3% | |
| Air Lease Corp.: | | | | | | | | |
| 3.25% Sr. Unsec. Nts., 3/1/25 | | $ | 99,000 | | | $ | 101,905 | |
| 3.625% Sr. Unsec. Nts., 4/1/27 | | | 106,000 | | | | 109,907 | |
| GATX Corp., 3.50% Sr. Unsec. Nts., 3/15/28 | | | 201,000 | | | | 207,138 | |
| | | | | | | 418,950 | |
| Information Technology—3.6% | |
| Communications Equipment—0.5% | |
| British Telecommunications plc, 4.50% Sr. Unsec. Nts., 12/4/23 | | | 201,000 | | | | 216,359 | |
| Deutsche Telekom International Finance BV, 4.375% Sr. Unsec. Nts., 6/21/281 | | | 149,000 | | | | 166,327 | |
| Motorola Solutions, Inc., 4.60% Sr. Unsec. Nts., 2/23/28 | �� | | 241,000 | | | | 261,371 | |
| | | | | | | 644,057 | |
| Electronic Equipment, Instruments, & Components—0.8% | |
| Arrow Electronics, Inc., 3.875% Sr. Unsec. Nts., 1/12/28 | | | 232,000 | | | | 237,647 | |
| Corning, Inc., 5.45% Sr. Unsec. Nts., 11/15/79 | | | 85,000 | | | | 93,237 | |
| FLIR Systems, Inc., 3.125% Sr. Unsec. Nts., 6/15/21 | | | 308,000 | | | | 310,507 | |
| Tech Data Corp., 4.95% Sr. Unsec. Nts., 2/15/27 | | | 264,000 | | | | 272,602 | |
| | | | | | | 913,993 | |
| IT Services—0.9% | |
| DXC Technology Co., 4.75% Sr. Unsec. Nts., 4/15/27 | | | 241,000 | | | | 259,502 | |
| Fidelity National Information Services, Inc., 4.25% Sr. Unsec. Nts., 5/15/28 | | | 162,000 | | | | 181,361 | |
| Fiserv, Inc., 3.50% Sr. Unsec. Nts., 7/1/29 | | | 229,000 | | | | 240,834 | |
| Global Payments, Inc., 3.20% Sr. Unsec. Nts., 8/15/29 | | | 153,000 | | | | 156,358 | |
| VeriSign, Inc.: | | | | | | | | |
| 4.75% Sr. Unsec. Nts., 7/15/27 | | | 190,000 | | | | 200,802 | |
| 5.25% Sr. Unsec. Nts., 4/1/25 | | | 99,000 | | | | 109,335 | |
| | | | | | | 1,148,192 | |
| Semiconductors & Semiconductor Equipment—0.7% | |
| Microchip Technology, Inc., 3.922% Sr. Sec. Nts., 6/1/21 | | | 316,000 | | | | 323,205 | |
| NXP BV/NXP Funding LLC, 4.125% Sr. Unsec. Nts., 6/1/211 | | | 292,000 | | | | 299,420 | |
| NXP BV/NXP Funding LLC/NXP USA, Inc., 3.875% Sr. Unsec. Nts., 6/18/261 | | | 203,000 | | | | 215,407 | |
| | | | | | | 838,032 | |
| Software—0.2% | |
| Autodesk, Inc., 4.375% Sr. Unsec. Nts., 6/15/25 | | | 98,000 | | | | 107,010 | |
| VMware, Inc., 3.90% Sr. Unsec. Nts., 8/21/27 | | | 161,000 | | | | 168,487 | |
| | | | | | | 275,497 | |
| Technology Hardware, Storage & Peripherals—0.5% | |
| Apple, Inc., 4.375% Sr. Unsec. Nts., 5/13/45 | | | 188,000 | | | | 227,493 | |
| Dell International LLC/EMC Corp., 5.30% Sr. Sec. Nts., 10/1/291 | | | 317,000 | | | | 357,261 | |
| | | | | | | 584,754 | |
| Materials—1.9% | |
| Chemicals—0.7% | |
| Dow Chemical Co. (The), 3.625% Sr. Unsec. Nts., 5/15/26 | | | 207,000 | | | | 217,788 | |
| Eastman Chemical Co., 3.50% Sr. Unsec. Nts., 12/1/21 | | | 126,000 | | | | 129,246 | |
| Nutrien Ltd.: | | | | | | | | |
| 4.875% Sr. Unsec. Nts., 3/30/20 | | | 41,000 | | | | 41,271 | |
16 INVESCO OPPENHEIMER V.I. TOTAL RETURN BOND FUND
| | | | | | | | |
| | | Principal Amount | | | Value | |
| Chemicals (Continued) | |
Nutrien Ltd.: (Continued)
5.00% Sr. Unsec. Nts., 4/1/49 | | $ | 84,000 | | | $ | 100,030 | |
| RPM International, Inc., 3.45% Sr. Unsec. Nts., 11/15/22 | | | 335,000 | | | | 343,498 | |
| | | | | | | 831,833 | |
| Construction Materials—0.2% | |
Martin Marietta Materials, Inc., 3.50% Sr. Unsec. Nts., 12/15/27 | | | 161,000 | | | | 167,120 | |
| Containers & Packaging—0.7% | |
| International Paper Co., 4.35% Sr. Unsec. Nts., 8/15/48 | | | 83,000 | | | | 88,252 | |
| Packaging Corp. of America, 3.65% Sr. Unsec. Nts., 9/15/24 | | | 273,000 | | | | 286,956 | |
| Silgan Holdings, Inc., 4.75% Sr. Unsec. Nts., 3/15/25 | | | 270,000 | | | | 276,862 | |
| WRKCo, Inc., 3.90% Sr. Unsec. Nts., 6/1/28 | | | 191,000 | | | | 202,748 | |
| | | | | | | 854,818 | |
| Metals & Mining—0.3% | |
| Anglo American Capital plc, 3.625% Sr. Unsec. Nts., 9/11/241 | | | 83,000 | | | | 86,087 | |
| ArcelorMittal SA, 4.25% Sr. Unsec. Nts., 7/16/29 | | | 159,000 | | | | 166,216 | |
| Newmont Goldcorp Corp., 2.80% Sr. Unsec. Nts., 10/1/29 | | | 154,000 | | | | 152,670 | |
| | | | | | | 404,973 | |
| Telecommunication Services—1.2% | |
| Diversified Telecommunication Services—0.7% | |
| AT&T, Inc.: | | | | | | | | |
| 4.30% Sr. Unsec. Nts., 2/15/30 | | | 238,000 | | | | 264,636 | |
| 4.35% Sr. Unsec. Nts., 6/15/45 | | | 126,000 | | | | 135,866 | |
| 4.50% Sr. Unsec. Nts., 3/9/48 | | | 135,000 | | | | 149,188 | |
| Telefonica Emisiones SA, 4.103% Sr. Unsec. Nts., 3/8/27 | | | 90,000 | | | | 97,401 | |
| Verizon Communications, Inc., 4.522% Sr. Unsec. Nts., 9/15/48 | | | 184,000 | | | | 220,418 | |
| | | | | | | 867,509 | |
| Wireless Telecommunication Services—0.5% | |
| T-Mobile USA, Inc., 6.50% Sr. Unsec. Nts., 1/15/26 | | | 284,000 | | | | 305,033 | |
| Vodafone Group plc, 3.75% Sr. Unsec. Nts., 1/16/24 | | | 313,000 | | | | 331,040 | |
| | | | | | | 636,073 | |
| | | | | | | | |
| | | Principal Amount | | | Value | |
| Utilities—2.2% | |
| Electric Utilities—1.4% | |
| AEP Texas, Inc., 3.95% Sr. Unsec. Nts., 6/1/281 | | $ | 162,000 | | | $ | 176,088 | |
| Berkshire Hathaway Energy Co., 3.80% Sr. Unsec. Nts., 7/15/48 | | | 75,000 | | | | 80,584 | |
| Duke Energy Corp., 3.75% Sr. Unsec. Nts., 9/1/46 | | | 65,000 | | | | 67,140 | |
| Emera US Finance LP, 2.70% Sr. Unsec. Nts., 6/15/21 | | | 168,000 | | | | 169,561 | |
| Enel Finance International NV, 2.875% Sr. Unsec. Nts., 5/25/221 | | | 309,000 | | | | 312,947 | |
| Exelon Corp., 4.45% Sr. Unsec. Nts., 4/15/46 | | | 89,000 | | | | 99,913 | |
| FirstEnergy Corp., 3.90% Sr. Unsec. Nts., 7/15/27 | | | 175,000 | | | | 187,135 | |
| Fortis, Inc., 3.055% Sr. Unsec. Nts., 10/4/26 | | | 126,000 | | | | 128,667 | |
| Mid-Atlantic Interstate Transmission LLC, 4.10% Sr. Unsec. Nts., 5/15/281 | | | 162,000 | | | | 177,228 | |
| PPL WEM Ltd./Western Power Distribution Ltd., 5.375% Sr. Unsec. Nts., 5/1/211 | | | 308,000 | | | | 317,087 | |
| | | | | | | 1,716,350 | |
| Independent Power and Renewable Electricity Producers—0.1% | |
NRG Energy, Inc., 4.45% Sr. Sec. Nts., 6/15/291 | | | 158,000 | | | | 165,548 | |
| Multi-Utilities—0.7% | |
| Ameren Corp., 2.50% Sr. Unsec. Nts., 9/15/24 | | | 209,000 | | | | 210,855 | |
| CenterPoint Energy, Inc., 4.25% Sr. Unsec. Nts., 11/1/28 | | | 147,000 | | | | 159,554 | |
| Dominion Energy, Inc., 2.715% Jr. Sub. Nts., 8/15/217 | | | 203,000 | | | | 204,571 | |
| PSEG Power LLC, 3.00% Sr. Unsec. Nts., 6/15/21 | | | 16,000 | | | | 16,183 | |
| Sempra Energy, 3.40% Sr. Unsec. Nts., 2/1/28 | | | 173,000 | | | | 179,281 | |
| | | | | | | 770,444 | |
| Total Corporate Bonds and Notes (Cost $53,119,956) | | | | 56,011,100 | |
| | |
| | | Shares | | | | |
| Investment Company—17.9% | | | | | |
| Invesco Liquid Assets Portfolio, Institutional Class, 1.71%9(Cost $21,545,511) | | | 21,539,049 | | | | 21,539,049 | |
| Total Investments, at Value (Cost $136,668,011) | | | 115.1% | | | | 138,638,766 | |
| Net Other Assets (Liabilities) | | | (15.1) | | | | (18,240,035 | ) |
| Net Assets | | | 100.0% | | | $ | 120,398,731 | |
| | | | | | | | |
Footnotes to Schedule of Investments
1. Security purchased or received in a transaction exempt from registration under the Securities Act of 1933, as amended (the “1933 Act”). The security may be resold pursuant to an exemption from registration under the 1933 Act, typically to qualified institutional buyers. The aggregate value of these securities at December 31, 2019 was $29,222,895, which represented 24.27% of the Fund’s Net Assets.
2. Represents the current interest rate for a variable or increasing rate security, which may be fixed for a predetermined period. The interest rate is, or will be as of an established date, determined as [Referenced Rate + Basis-point spread].
3. Interest-Only Strips represent the right to receive the monthly interest payments on an underlying pool of mortgage loans. These securities typically decline in price as interest rates decline. Most other fixed income securities increase in price when interest rates decline. The principal amount of the underlying pool represents the notional amount on which current interest is calculated. The price of these securities is typically more sensitive to changes in prepayment rates than traditional mortgage-backed securities (for example, GNMA pass-throughs). Interest rates disclosed represent current yields based upon the current cost basis and estimated timing and amount of future cash flows. These securities amount to $2,306,114 or 1.92% of the Fund’s net assets at period end.
4. Interest rate is less than 0.0005%.
5. Principal-Only Strips represent the right to receive the monthly principal payments on an underlying pool of mortgage loans. The value of these securities generally increases as interest rates decline and prepayment rates rise. The price of these securities is typically more volatile than that of coupon-bearing bonds of the same maturity. Interest rates disclosed represent current yields based upon the current cost basis and estimated timing of future cash flows. These securities amount to $40,288 or 0.03% of the Fund’s net assets at period end.
6. All or a portion of the security position is when-issued or delayed delivery to be delivered and settled after period end. See Note 1 of the accompanying Notes.
7. This interest rate resets periodically. Interest rate shown reflects the rate in effect at period end. The rate on this variable rate security is not based on a published reference rate and spread but is determined by the issuer or agent based on current market conditions.
8. This bond has no contractual maturity date, is not redeemable and contractually pays an indefinite stream of interest.
9. The money market fund and the Fund are affiliated by having the same investment adviser. The rate shown is the 7-day SEC standardized yield as of December 31, 2019.
17 INVESCO OPPENHEIMER V.I. TOTAL RETURN BOND FUND
SCHEDULE OF INVESTMENTSContinued
| | | | | | | | | | | | | | | | | | | | | | | | | | | | |
| Futures Contracts as of December 31, 2019 | | | | | | | | | | | | | | | | | | | | | | | | | | | | |
| Description | | Buy/Sell | | | Expiration Date | | | Number of
Contracts | | | | | | Notional
Amount (000’s) | | | Value | | | Unrealized
Appreciation/
(Depreciation) | |
| United States Treasury Long Bonds | | | Buy | | | | 3/20/20 | | | | 16 | | | | USD | | | | 2,550 | | | $ | 2,494,500 | | | $ | (55,035 | ) |
| United States Treasury Nts., 10 yr. | | | Buy | | | | 3/20/20 | | | | 2 | | | | USD | | | | 259 | | | | 256,844 | | | | (2,317 | ) |
| United States Treasury Nts., 2 yr. | | | Buy | | | | 3/31/20 | | | | 13 | | | | USD | | | | 2,804 | | | | 2,801,500 | | | | (2,633 | ) |
| United States Treasury Nts., 5 yr. | | | Sell | | | | 3/31/20 | | | | 57 | | | | USD | | | | 6,785 | | | | 6,760,735 | | | | 24,377 | |
| United States Ultra Bonds | | | Buy | | | | 3/20/20 | | | | 64 | | | | USD | | | | 12,009 | | | | 11,626,000 | | | | (382,642 | ) |
| | | | | | | | | | | | | | | | | | | | | | | | | | $ | (418,250 | ) |
| | | | | | | | | | | | | | | | | | | | | | | | | | | | |
| | |
| Definitions | | |
| H15T5Y | | US Treasury Yield Curve Rate T Note Constant Maturity 5 Year |
| H15T1Y | | US Treasury Yield Curve Rate T Note Constant Maturity 1 Year |
| ICE LIBOR | | Intercontinental Exchange London Interbank Offered Rate |
| SOFRRATE | | United States Secured Overnight Financing Rate |
| US0001M | | ICE LIBOR USD 1 Month |
| US0003M | | ICE LIBOR USD 3 Month |
| USISDA05 | | USD ICE Swap Rate 11:00am NY 5 Year |
| USSW5 | | USD Swap Semi 30/360 5 Year |
See accompanying Notes to Financial Statements.
18 INVESCO OPPENHEIMER V.I. TOTAL RETURN BOND FUND
STATEMENT OF ASSETS AND LIABILITIESDecember 31, 2019
| | | | |
| Assets | | | | |
| Investments, at value—see accompanying schedule of investments: | | | | |
| Unaffiliated companies (cost $115,122,500) | | $ | 117,099,717 | |
| Affiliated companies (cost $21,545,511) | | | 21,539,049 | |
| | | | |
| | | 138,638,766 | |
| Cash | | | 713,933 | |
| Receivables and other assets: | | | | |
| Interest, dividends and principal paydowns | | | 685,919 | |
| Variation margin receivable – futures contracts | | | 291,776 | |
| Shares of beneficial interest sold | | | 44,879 | |
| Other | | | 50,556 | |
| | | | |
| Total assets | | | 140,425,829 | |
| Liabilities | | | | |
| Payables and other liabilities: | | | | |
| Investments purchased | | | 19,739,755 | |
| Shares of beneficial interest redeemed | | | 49,216 | |
| Trustees’ compensation | | | 47,685 | |
| Administration fee | | | 46,373 | |
| Shareholder communications | | | 37,953 | |
| Distribution and service plan fees | | | 10,018 | |
| Transfer and shareholder servicing agent fees | | | 2,490 | |
| Advisory fee | | | 1,950 | |
| Other | | | 91,658 | |
| | | | |
| Total liabilities | | | 20,027,098 | |
| Net Assets | | $ | 120,398,731 | |
| | | | |
| | | | |
| Composition of Net Assets | | | | |
| Shares of beneficial interest | | $ | 117,906,505 | |
| Total distributable earnings | | | 2,492,226 | |
| | | | |
| Net Assets | | $ | 120,398,731 | |
| | | | |
| | | | |
| Net Asset Value Per Share | | | | |
| Series I Shares: | | | | |
| Net asset value, redemption price per share and offering price per share (based on net assets of $73,159,597 and 9,227,786 shares of beneficial interest outstanding) | | | $7.93 | |
| Series II Shares: | | | | |
| Net asset value, redemption price per share and offering price per share (based on net assets of $47,239,134 and 6,043,668 shares of beneficial interest outstanding) | | | $7.82 | |
See accompanying Notes to Financial Statements.
19 INVESCO OPPENHEIMER V.I. TOTAL RETURN BOND FUND
STATEMENT OF OPERATIONSFor the Year Ended December 31, 2019
| | | | |
| Investment Income | | | | |
| Interest — unaffiliated companies | | $ | 4,379,747 | |
| Dividends — affiliated companies | | | 307,298 | |
| | | | |
| Total investment income | | | 4,687,045 | |
| Expenses | | | | |
| Advisory fees | | | 741,328 | |
| Administration fees | | | 123,874 | |
| Distribution and service plan fees: | | | | |
| Series II shares | | | 128,032 | |
| Transfer and shareholder servicing agent fees: | | | | |
| Series I shares | | | 42,840 | |
| Series II shares | | | 29,460 | |
| Shareholder communications: | | | | |
| Series I shares | | | 26,947 | |
| Series II shares | | | 18,451 | |
| Legal, auditing and other professional fees | | | 56,694 | |
| Custodian fees and expenses | | | 53,768 | |
| Trustees’ compensation | | | 14,478 | |
| Borrowing fees | | | 1,537 | |
| Other | | | 8,625 | |
| | | | |
| Total expenses | | | 1,246,034 | |
| Less waivers, reimbursement of expenses and offset arrangement(s) | | | (185,194 | ) |
| | | | |
| Net expenses | | | 1,060,840 | |
| Net Investment Income | | | 3,626,205 | |
| Realized and Unrealized Gain (Loss) | | | | |
| Net realized gain (loss) on: | | | | |
| Investment transactions in: | | | | |
Unaffiliated companies (includes net losses from securities sold to affiliates of $4,165) | | | 2,295,365 | |
Affiliated companies | | | 81 | |
| Futures contracts | | | 2,286,681 | |
| Swap contracts | | | (494,599 | ) |
| | | | |
| Net realized gain | | | 4,087,528 | |
| Net change in unrealized appreciation/(depreciation) on: | | | | |
| Investment transactions in: | | | | |
Unaffiliated companies | | | 4,363,868 | |
Affiliated companies | | | (6,462 | ) |
| Futures contracts | | | (825,098 | ) |
| | | | |
| Net change in unrealized appreciation/(depreciation) | | | 3,532,308 | |
| Net Increase in Net Assets Resulting from Operations | | $ | 11,246,041 | |
| | | | |
See accompanying Notes to Financial Statements.
20 INVESCO OPPENHEIMER V.I. TOTAL RETURN BOND FUND
STATEMENT OF CHANGES IN NET ASSETS
| | | | | | | | |
| | | Year Ended December 31, 2019 | | Year Ended December 31, 2018 |
| Operations | | | | | | | | |
| Net investment income | | $ | 3,626,205 | | | $ | 4,078,170 | |
| Net realized gain (loss) | | | 4,087,528 | | | | (2,608,541 | ) |
| Net change in unrealized appreciation/(depreciation) | | | 3,532,308 | | | | (3,029,473 | ) |
| | | | |
| Net increase (decrease) in net assets resulting from operations | | | 11,246,041 | | | | (1,559,844 | ) |
| Dividends and/or Distributions to Shareholders | | | | | | | | |
| Distributions to shareholders from distributable earnings: | | | | | | | | |
| Series I shares | | | (2,462,939 | ) | | | (2,617,442 | ) |
| Series II shares | | | (1,702,386 | ) | | | (1,481,742 | ) |
| | | | |
| Total distributions from distributable earnings | | | (4,165,325 | ) | | | (4,099,184 | ) |
| Beneficial Interest Transactions | | | | | | | | |
| Net increase (decrease) in net assets resulting from beneficial interest transactions: | | | | | | | | |
| Series I shares | | | (6,004,640 | ) | | | (3,043,103 | ) |
| Series II shares | | | (1,997,752 | ) | | | (2,488,899 | ) |
| | | | |
| Total beneficial interest transactions | | | (8,002,392 | ) | | | (5,532,002 | ) |
| Net Assets | | | | | | | | |
| Total decrease | | | (921,676 | ) | | | (11,191,030 | ) |
| Beginning of period | | | 121,320,407 | | | | 132,511,437 | |
| | | | |
| End of period | | $ | 120,398,731 | | | $ | 121,320,407 | |
| | | | |
See accompanying Notes to Financial Statements.
21 INVESCO OPPENHEIMER V.I. TOTAL RETURN BOND FUND
FINANCIAL HIGHLIGHTS
| | | | | | | | | | | | | | | | | | | | |
| Series I Shares | | Year Ended
December 31,
2019 | | | Year Ended
December 31,
2018 | | | Year Ended
December 31,
2017 | | | Year Ended
December 31,
2016 | | | Year Ended
December 31,
2015 | |
| Per Share Operating Data | | | | | | | | | | | | | | | | | | | | |
| Net asset value, beginning of period | | | $7.49 | | | | $7.83 | | | | $7.67 | | | | $7.71 | | | | $7.96 | |
| Income (loss) from investment operations: | | | | | | | | | | | | | | | | | | | | |
| Net investment income1 | | | 0.23 | | | | 0.25 | | | | 0.19 | | | | 0.23 | | | | 0.27 | |
| Net realized and unrealized gain (loss) | | | 0.48 | | | | (0.33) | | | | 0.16 | | | | 0.02 | | | | (0.19) | |
| | | | |
| Total from investment operations | | | 0.71 | | | | (0.08) | | | | 0.35 | | | | 0.25 | | | | 0.08 | |
| Dividends and/or distributions to shareholders: | | | | | | | | | | | | | | | | | | | | |
| Dividends from net investment income | | | (0.27) | | | | (0.26) | | | | (0.19) | | | | (0.29) | | | | (0.33) | |
| Net asset value, end of period | | | $7.93 | | | | $7.49 | | | | $7.83 | | | | $7.67 | | | | $7.71 | |
| | | | |
| | | | | | | | | | | | | | | | | | | | |
| Total Return, at Net Asset Value2 | | | 9.53% | | | | (1.02)% | | | | 4.59% | | | | 3.27% | | | | 0.96% | |
| | | | | | | | | | | | | | | | | | | | |
| Ratios/Supplemental Data | | | | | | | | | | | | | | | | | | | | |
| Net assets, end of period (in thousands) | | | $73,160 | | | | $74,929 | | | | $81,481 | | | | $83,405 | | | | $85,160 | |
| Average net assets (in thousands) | | | $74,141 | | | | $77,723 | | | | $83,239 | | | | $87,039 | | | | $89,919 | |
| Ratios to average net assets:3 | | | | | | | | | | | | | | | | | | | | |
| Net investment income | | | 2.99% | | | | 3.35% | | | | 2.38% | | | | 2.96% | | | | 3.46% | |
| Expenses excluding specific expenses listed below | | | 0.89% | | | | 0.87% | | | | 0.85% | | | | 0.84% | | | | 0.82% | |
| Interest and fees from borrowings4 | | | 0.00% | | | | 0.00% | | | | 0.00% | | | | 0.00% | | | | 0.00% | |
| | | | |
| Total expenses5 | | | 0.89% | | | | 0.87% | | | | 0.85% | | | | 0.84% | | | | 0.82% | |
| Expenses after payments, waivers and/or reimbursements and reduction to custodian expenses | | | 0.75% | | | | 0.75% | | | | 0.75% | | | | 0.75% | | | | 0.75% | |
| Portfolio turnover rate6,7 | | | 93% | | | | 64% | | | | 86% | | | | 79% | | | | 73% | |
1. Calculated based on the average shares outstanding during the period.
2. Includes adjustments in accordance with accounting principles generally accepted in the United States of America and as such, the net asset value for financial reporting purposes and the returns based upon those net asset values may differ from the net asset value and returns for shareholder transactions. Total returns are not annualized for periods less than one year, if applicable and do not reflect charges assessed in connection with a variable product, which if included would reduce total returns.
3. Annualized for periods less than one full year.
4. Less than 0.005%.
5. Total expenses including indirect expenses from fund fees and expenses were as follows:
| | | | | | |
| Year Ended December 31, 2019 | | | 0.90 | % | | |
| Year Ended December 31, 2018 | | | 0.87 | % | | |
| Year Ended December 31, 2017 | | | 0.85 | % | | |
| Year Ended December 31, 2016 | | | 0.85 | % | | |
| Year Ended December 31, 2015 | | | 0.83 | % | | |
6. The portfolio turnover rate excludes purchase and sale transactions of To Be Announced (TBA) mortgage-related securities as follows:
| | | | | | | | |
| | | Purchase Transactions | | | Sale Transactions | |
| Year Ended December 31, 2019 | | | $488,722,598 | | | | $507,909,671 | |
| Year Ended December 31, 2018 | | | $641,318,699 | | | | $653,537,737 | |
| Year Ended December 31, 2017 | | | $679,964,368 | | | | $662,714,451 | |
| Year Ended December 31, 2016 | | | $672,031,328 | | | | $673,808,454 | |
| Year Ended December 31, 2015 | | | $697,962,198 | | | | $709,720,690 | |
7. Portfolio turnover is calculated at the fund level and is not annualized for periods less than one year, if applicable.
See accompanying Notes to Financial Statements.
22 INVESCO OPPENHEIMER V.I. TOTAL RETURN BOND FUND
| | | | | | | | | | | | | | | | | | | | |
| Series II Shares | | Year Ended
December 31,
2019 | | | Year Ended
December 31,
2018 | | | Year Ended
December 31,
2017 | | | Year Ended
December 31,
2016 | | | Year Ended
December 31,
2015 | |
| Per Share Operating Data | | | | | | | | | | | | | | | | | | | | |
| Net asset value, beginning of period | | | $7.39 | | | | $7.73 | | | | $7.57 | | | | $7.61 | | | | $7.86 | |
| Income (loss) from investment operations: | | | | | | | | | | | | | | | | | | | | |
| Net investment income1 | | | 0.21 | | | | 0.23 | | | | 0.16 | | | | 0.21 | | | | 0.25 | |
| Net realized and unrealized gain (loss) | | | 0.47 | | | | (0.33) | | | | 0.17 | | | | 0.02 | | | | (0.19) | |
| | | | |
| Total from investment operations | | | 0.68 | | | | (0.10) | | | | 0.33 | | | | 0.23 | | | | 0.06 | |
| Dividends and/or distributions to shareholders: | | | | | | | | | | | | | | | | | | | | |
| Dividends from net investment income | | | (0.25) | | | | (0.24) | | | | (0.17) | | | | (0.27) | | | | (0.31) | |
| Net asset value, end of period | | | $7.82 | | | | $7.39 | | | | $7.73 | | | | $7.57 | | | | $7.61 | |
| | | | |
| | | | | | | | | | | | | | | | | | | | |
| Total Return, at Net Asset Value2 | | | 9.25% | | | | (1.31)% | | | | 4.38% | | | | 3.05% | | | | 0.70% | |
| | | | | | | | | | | | | | | | | | | | |
| Ratios/Supplemental Data | | | | | | | | | | | | | | | | | | | | |
| Net assets, end of period (in thousands) | | | $47,239 | | | | $46,391 | | | | $51,030 | | | | $53,350 | | | | $52,519 | |
| Average net assets (in thousands) | | | $51,196 | | | | $47,731 | | | | $52,525 | | | | $52,738 | | | | $54,016 | |
| Ratios to average net assets:3 | | | | | | | | | | | | | | | | | | | | |
| Net investment income | | | 2.75% | | | | 3.10% | | | | 2.13% | | | | 2.70% | | | | 3.21% | |
| Expenses excluding specific expenses listed below | | | 1.14% | | | | 1.12% | | | | 1.10% | | | | 1.09% | | | | 1.07% | |
| Interest and fees from borrowings4 | | | 0.00% | | | | 0.00% | | | | 0.00% | | | | 0.00% | | | | 0.00% | |
| | | | |
| Total expenses5 | | | 1.14% | | | | 1.12% | | | | 1.10% | | | | 1.09% | | | | 1.07% | |
| Expenses after payments, waivers and/or reimbursements and reduction to custodian expenses | | | 1.00% | | | | 1.00% | | | | 1.00% | | | | 1.00% | | | | 1.00% | |
| Portfolio turnover rate6,7 | | | 93% | | | | 64% | | | | 86% | | | | 79% | | | | 73% | |
1. Calculated based on the average shares outstanding during the period.
2. Includes adjustments in accordance with accounting principles generally accepted in the United States of America and as such, the net asset value for financial reporting purposes and the returns based upon those net asset values may differ from the net asset value and returns for shareholder transactions. Total returns are not annualized for periods less than one year, if applicable and do not reflect charges assessed in connection with a variable product, which if included would reduce total returns.
3. Annualized for periods less than one full year.
4. Less than 0.005%.
5. Total expenses including indirect expenses from fund fees and expenses were as follows:
| | | | | | |
| Year Ended December 31, 2019 | | | 1.15 | % | | |
| Year Ended December 31, 2018 | | | 1.12 | % | | |
| Year Ended December 31, 2017 | | | 1.10 | % | | |
| Year Ended December 31, 2016 | | | 1.10 | % | | |
| Year Ended December 31, 2015 | | | 1.08 | % | | |
6. The portfolio turnover rate excludes purchase and sale transactions of To Be Announced (TBA) mortgage-related securities as follows:
| | | | | | | | |
| | | Purchase Transactions | | | Sale Transactions | |
| Year Ended December 31, 2019 | | | $488,722,598 | | | | $507,909,671 | |
| Year Ended December 31, 2018 | | | $641,318,699 | | | | $653,537,737 | |
| Year Ended December 31, 2017 | | | $679,964,368 | | | | $662,714,451 | |
| Year Ended December 31, 2016 | | | $672,031,328 | | | | $673,808,454 | |
| Year Ended December 31, 2015 | | | $697,962,198 | | | | $709,720,690 | |
7. Portfolio turnover is calculated at the fund level and is not annualized for periods less than one year, if applicable.
See accompanying Notes to Financial Statements.
23 INVESCO OPPENHEIMER V.I. TOTAL RETURN BOND FUND
NOTES TO FINANCIAL STATEMENTSDecember 31, 2019
Note 1 - Significant Accounting Policies
Invesco Oppenheimer V.I. Total Return Bond Fund (the “Fund”) is a series portfolio of AIM Variable Insurance Funds (Invesco Variable Insurance Funds) (the “Trust”). The Trust is a Delaware statutory trust registered under the Investment Company Act of 1940, as amended (the “1940 Act”), as an open-end series management investment company authorized to issue an unlimited number of shares of beneficial interest. Information presented in these financial statements pertains only to the Fund. Matters affecting the Fund or each class will be voted on exclusively by the shareholders of such Fund or each class.
Prior to the close of business on May 24, 2019, the Fund operated as Invesco Oppenheimer Total Return Bond Fund/VA (the “Acquired Fund” or “Predecessor Fund”). The Acquired Fund was reorganized after the close of business on May 24, 2019 (the “Reorganization Date”) through the transfer of all of its assets and liabilities to the Fund (the “Reorganization”).
Upon closing of the Reorganization, holders of the Acquired Fund’s Non-Service and Service shares received Series I and Series II shares of the Fund, respectively. Information for the Acquired Fund’s Non-Service and Service shares prior to the Reorganization is included with Series I and Series II, respectively, throughout this report.
The Fund’s investment objective is to seek total return.
The Fund currently offers two classes of shares, Series I and Series II, both of which are offered to insurance company separate accounts funding variable annuity contracts and variable life insurance policies (“variable products”).
The Fund is an investment company and accordingly follows the investment company accounting and reporting guidance in accordance with Financial Accounting Standards Board Accounting Standards Codification Topic 946, Financial Services – Investment Companies.
The following is a summary of the significant accounting policies followed by the Fund in the preparation of its financial statements.
A. Security Valuations - Securities, including restricted securities, are valued according to the following policy.
Debt obligations (including convertible securities) and unlisted equities are fair valued using an evaluated quote provided by an independent pricing service. Evaluated quotes provided by the pricing service may be determined without exclusive reliance on quoted prices, and may reflect appropriate factors such as institution-size trading in similar groups of securities, developments related to specific securities, dividend rate (for unlisted equities), yield (for debt obligations), quality, type of issue, coupon rate (for debt obligations), maturity (for debt obligations), individual trading characteristics and other market data. Pricing services generally value debt obligations assuming orderly transactions of institutional round lot size, but a fund may hold or transact in the same securities in smaller, odd lot sizes. Odd lots often trade at lower prices than institutional round lots. Debt obligations are subject to interest rate and credit risks. In addition, all debt obligations involve some risk of default with respect to interest and/or principal payments.
A security listed or traded on an exchange (except convertible securities) is valued at its last sales price or official closing price as of the close of the customary trading session on the exchange where the security is principally traded, or lacking any sales or official closing price on a particular day, the security may be valued at the closing bid price on that day. Securities traded in the over-the-counter market are valued based on prices furnished by independent pricing services or market makers. When such securities are valued by an independent pricing service they may be considered fair valued. Futures contracts are valued at the final settlement price set by an exchange on which they are principally traded. Listed options are valued at the mean between the last bid and asked prices from the exchange on which they are principally traded. Options not listed on an exchange are valued by an independent source at the mean between the last bid and asked prices. For purposes of determining net asset value (“NAV”) per share, futures and option contracts generally are valued 15 minutes after the close of the customary trading session of the New York Stock Exchange (“NYSE”).
Investments in open-end and closed-end registered investment companies that do not trade on an exchange are valued at the end-of-day net asset value per share. Investments in open-end and closed-end registered investment companies that trade on an exchange are valued at the last sales price or official closing price as of the close of the customary trading session on the exchange where the security is principally traded.
Swap agreements are fair valued using an evaluated quote, if available, provided by an independent pricing service. Evaluated quotes provided by the pricing service are valued based on a model which may include end-of-day net present values, spreads, ratings, industry, company performance and returns of referenced assets. Centrally cleared swap agreements are valued at the daily settlement price determined by the relevant exchange or clearinghouse.
Foreign securities’ (including foreign exchange contracts) prices are converted into U.S. dollar amounts using the applicable exchange rates as of the close of the NYSE. If market quotations are available and reliable for foreign exchange-traded equity securities, the securities will be valued at the market quotations. Because trading hours for certain foreign securities end before the close of the NYSE, closing market quotations may become unreliable. If between the time trading ends on a particular security and the close of the customary trading session on the NYSE, events occur that the investment adviser determines are significant and make the closing price unreliable, the Fund may fair value the security. If the event is likely to have affected the closing price of the security, the security will be valued at fair value in good faith using procedures approved by the Board of Trustees. Adjustments to closing prices to reflect fair value may also be based on a screening process of an independent pricing service to indicate the degree of certainty, based on historical data, that the closing price in the principal market where a foreign security trades is not the current value as of the close of the NYSE. Foreign securities’ prices meeting the approved degree of certainty that the price is not reflective of current value will be priced at the indication of fair value from the independent pricing service. Multiple factors may be considered by the independent pricing service in determining adjustments to reflect fair value and may include information relating to sector indices, American Depositary Receipts and domestic and foreign index futures. Foreign securities may have additional risks including exchange rate changes, potential for sharply devalued currencies and high inflation, political and economic upheaval, the relative lack of issuer information, relatively low market liquidity and the potential lack of strict financial and accounting controls and standards.
Securities for which market prices are not provided by any of the above methods may be valued based upon quotes furnished by independent sources. The last bid price may be used to value equity securities. The mean between the last bid and asked prices is used to value debt obligations,
24 INVESCO OPPENHEIMER V.I. TOTAL RETURN BOND FUND
including corporate loans.
Securities for which market quotations are not readily available or became unreliable are valued at fair value as determined in good faith by or under the supervision of the Trust’s officers following procedures approved by the Board of Trustees. Issuer specific events, market trends, bid/ asked quotes of brokers and information providers and other market data may be reviewed in the course of making a good faith determination of a security’s fair value.
The Fund may invest in securities that are subject to interest rate risk, meaning the risk that the prices will generally fall as interest rates rise and, conversely, the prices will generally rise as interest rates fall. Specific securities differ in their sensitivity to changes in interest rates depending on their individual characteristics. Changes in interest rates may result in increased market volatility, which may affect the value and/or liquidity of certain Fund investments.
Valuations change in response to many factors including the historical and prospective earnings of the issuer, the value of the issuer’s assets, general economic conditions, interest rates, investor perceptions and market liquidity. Because of the inherent uncertainties of valuation, the values reflected in the financial statements may materially differ from the value received upon actual sale of those investments.
| B. | | Securities Transactions and Investment Income -Securities transactions are accounted for on a trade date basis. Realized gains or losses on sales are computed on the basis of specific identification of the securities sold. Interest income (net of withholding tax, if any) is recorded on the accrual basis from settlement date. Bond premiums and discounts are amortized and/or accreted over the lives of the respective securities. Pay-in-kind interest income and non-cash dividend income received in the form of securities in-lieu of cash are recorded at the fair value of the securities received. Paydown gains and losses on mortgage and asset-backed securities are recorded as adjustments to interest income. Dividend income (net of withholding tax, if any) is recorded on the ex-dividend date. |
The Fund may periodically participate in litigation related to Fund investments. As such, the Fund may receive proceeds from litigation settlements. Any proceeds received are included in the Statement of Operations as realized gain (loss) for investments no longer held and as unrealized gain (loss) for investments still held.
Brokerage commissions and mark ups are considered transaction costs and are recorded as an increase to the cost basis of securities purchased and/or a reduction of proceeds on a sale of securities. Such transaction costs are included in the determination of net realized and unrealized gain (loss) from investment transactions reported in the Statement of Operations and the Statement of Changes in Net Assets and the net realized and unrealized gains (losses) on securities per share in the Financial Highlights. Transaction costs are included in the calculation of the Fund’s net asset value and, accordingly, they reduce the Fund’s total returns. These transaction costs are not considered operating expenses and are not reflected in net investment income reported in the Statement of Operations and the Statement of Changes in Net Assets, or the net investment income per share and the ratios of expenses and net investment income reported in the Financial Highlights, nor are they limited by any expense limitation arrangements between the Fund and the investment adviser.
The Fund allocates income and realized and unrealized capital gains and losses to a class based on the relative net assets of each class.
| C. | | Country Determination- For the purposes of making investment selection decisions and presentation in the Schedule of Investments, the investment adviser may determine the country in which an issuer is located and/or credit risk exposure based on various factors. These factors include the laws of the country under which the issuer is organized, where the issuer maintains a principal office, the country in which the issuer derives 50% or more of its total revenues and the country that has the primary market for the issuer’s securities, as well as other criteria. Among the other criteria that may be evaluated for making this determination are the country in which the issuer maintains 50% or more of its assets, the type of security, financial guarantees and enhancements, the nature of the collateral and the sponsor organization. |
| D. | | Distributions -Dividends and distributions to shareholders, which are determined in accordance with income tax regulations and may differ from accounting principles generally accepted in the United States of America (“GAAP”), are recorded on the ex-dividend date. Income distributions, if any, are declared and paid annually to separate accounts of participating insurance companies. Capital gain distributions, if any, are declared and paid annually or at other times as determined necessary by the Adviser. |
| E. | | Federal Income Taxes -The Fund intends to comply with the requirements of Subchapter M of the Internal Revenue Code of 1986, as amended (the “Internal Revenue Code”), necessary to qualify as a regulated investment company and to distribute substantially all of the Fund’s taxable earnings to shareholders. As such, the Fund will not be subject to federal income taxes on otherwise taxable income (including net realized capital gain) that is distributed to shareholders. Therefore, no provision for federal income taxes is recorded in the financial statements. |
The Fund recognizes the tax benefits of uncertain tax positions only when the position is more likely than not to be sustained. Management has analyzed the Fund’s uncertain tax positions and concluded that no liability for unrecognized tax benefits should be recorded related to uncertain tax positions. Management is not aware of any tax positions for which it is reasonably possible that the total amounts of unrecognized tax benefits will change materially in the next 12 months.
The Fund files tax returns in the U.S. Federal jurisdiction and certain other jurisdictions. Generally, the Fund is subject to examinations by such taxing authorities for up to three years after the filing of the return for the tax period.
| F. | | Expenses -Fees provided for under the Rule 12b-1 plan of a particular class of the Fund are charged to the operations of such class. Transfer agency fees and expenses and other shareholder recordkeeping fees and expenses relating to all other classes are allocated among those classes based on relative net assets. All other expenses are allocated among the classes based on relative net assets. |
| G. | | Accounting Estimates -The financial statements are prepared on a basis in conformity with GAAP, which requires management to make estimates and assumptions that affect the reported amounts of assets and liabilities at the date of the financial statements and the reported amounts of revenues and expenses during the reporting period including estimates and assumptions related to taxation. Actual results could differ from those estimates by a significant amount. In addition, the Fund monitors for material events or transactions that may occur or become known after the period-end date and before the date the financial statements are released to print. |
25 INVESCO OPPENHEIMER V.I. TOTAL RETURN BOND FUND
NOTES TO FINANCIAL STATEMENTSContinued
| H. | | Indemnifications -Under the Trust’s organizational documents, each Trustee, officer, employee or other agent of the Trust is indemnified against certain liabilities that may arise out of the performance of their duties to the Fund. Additionally, in the normal course of business, the Fund enters into contracts, including the Fund’s servicing agreements, that contain a variety of indemnification clauses. The Fund’s maximum exposure under these arrangements is unknown as this would involve future claims that may be made against the Fund that have not yet occurred. The risk of material loss as a result of such indemnification claims is considered remote. |
| I. | | Futures Contracts -The Fund may enter into futures contracts to manage exposure to interest rate, equity and market price movements and/or currency risks. A futures contract is an agreement between Counterparties to purchase or sell a specified underlying security, currency or commodity (or delivery of a cash settlement price, in the case of an index future) for a fixed price at a future date. The Fund currently invests only in exchange-traded futures and they are standardized as to maturity date and underlying financial instrument. Initial margin deposits required upon entering into futures contracts are satisfied by the segregation of specific securities or cash as collateral at the futures commission merchant (broker). During the period the futures contracts are open, changes in the value of the contracts are recognized as unrealized gains or losses by recalculating the value of the contracts on a daily basis. Subsequent or variation margin payments are received or made depending upon whether unrealized gains or losses are incurred. These amounts are reflected as receivables or payables on the Statement of Assets and Liabilities. When the contracts are closed or expire, the Fund recognizes a realized gain or loss equal to the difference between the proceeds from, or cost of, the closing transaction and the Fund’s basis in the contract. The net realized gain (loss) and the change in unrealized gain (loss) on futures contracts held during the period is included on the Statement of Operations. The primary risks associated with futures contracts are market risk and the absence of a liquid secondary market. If the Fund were unable to liquidate a futures contract and/or enter into an offsetting closing transaction, the Fund would continue to be subject to market risk with respect to the value of the contracts and continue to be required to maintain the margin deposits on the futures contracts. Futures contracts have minimal Counterparty risk since the exchange’s clearinghouse, as Counterparty to all exchange-traded futures, guarantees the futures against default. Risks may exceed amounts recognized in the Statement of Assets and Liabilities. |
| J. | | Swap Agreements - The Fund may enter into various swap transactions, including interest rate, total return, index, currency and credit default swap contracts (“CDS”) for investment purposes or to manage interest rate, currency or credit risk. Such transactions are agreements between Counterparties. A swap agreement may be negotiated bilaterally and traded over-the-counter (“OTC”) between two parties (“uncleared/OTC”) or, in some instances, must be transacted through a future commission merchant (“FCM”) and cleared through a clearinghouse that serves as a central Counterparty (“centrally cleared swap”). These agreements may contain among other conditions, events of default and termination events, and various covenants and representations such as provisions that require the Fund to maintain a pre-determined level of net assets, and/or provide limits regarding the decline of the Fund’s NAV over specific periods of time. If the Fund were to trigger such provisions and have open derivative positions at that time, the Counterparty may be able to terminate such agreement and request immediate payment in an amount equal to the net liability positions, if any. |
Interest rate, total return, index, and currency swap agreements are two-party contracts entered into primarily to exchange the returns (or differentials in rates of returns) earned or realized on particular predetermined investments or instruments. The gross returns to be exchanged or “swapped” between the parties are calculated with respect to a notional amount, i.e., the return on or increase in value of a particular dollar amount invested at a particular interest rate or return of an underlying asset, in a particular foreign currency, or in a “basket” of securities representing a particular index.
In a centrally cleared swap, the Fund’s ultimate Counterparty is a central clearinghouse. The Fund initially will enter into centrally cleared swaps through an executing broker. When a fund enters into a centrally cleared swap, it must deliver to the central Counterparty (via the FCM) an amount referred to as “initial margin.” Initial margin requirements are determined by the central Counterparty, but an FCM may require additional initial margin above the amount required by the central Counterparty. Initial margin deposits required upon entering into centrally cleared swaps are satisfied by cash or securities as collateral at the FCM. Securities deposited as initial margin are designated on the Schedule of Investments and cash deposited is recorded on the Statement of Assets and Liabilities. During the term of a cleared swap agreement, a “variation margin” amount may be required to be paid by the Fund or may be received by the Fund, based on the daily change in price of the underlying reference instrument subject to the swap agreement and is recorded as a receivable or payable for variation margin in the Statement of Assets and Liabilities until the centrally cleared swap is terminated at which time a realized gain or loss is recorded.
A CDS is an agreement between Counterparties to exchange the credit risk of an issuer. A buyer of a CDS is said to buy protection by paying a fixed payment over the life of the agreement and in some situations an upfront payment to the seller of the CDS. If a defined credit event occurs (such as payment default or bankruptcy), the Fund as a protection buyer would cease paying its fixed payment, the Fund would deliver eligible bonds issued by the reference entity to the seller, and the seller would pay the full notional value, or the “par value”, of the referenced obligation to the Fund. A seller of a CDS is said to sell protection and thus would receive a fixed payment over the life of the agreement and an upfront payment, if applicable. If a credit event occurs, the Fund as a protection seller would cease to receive the fixed payment stream, the Fund would pay the buyer “par value” or the full notional value of the referenced obligation, and the Fund would receive the eligible bonds issued by the reference entity. In turn, these bonds may be sold in order to realize a recovery value. Alternatively, the seller of the CDS and its Counterparty may agree to net the notional amount and the market value of the bonds and make a cash payment equal to the difference to the buyer of protection. If no credit event occurs, the Fund receives the fixed payment over the life of the agreement. As the seller, the Fund would effectively add leverage to its portfolio because, in addition to its total net assets, the Fund would be subject to investment exposure on the notional amount of the CDS. In connection with these agreements, cash and securities may be identified as collateral in accordance with the terms of the respective swap agreements to provide assets of value and recourse in the event of default under the swap agreement or bankruptcy/insolvency of a party to the swap agreement. If a Counterparty becomes bankrupt or otherwise fails to perform its obligations due to financial difficulties, the Fund may experience significant delays in obtaining any recovery in a bankruptcy or other reorganization proceeding. The Fund may obtain only limited recovery or may obtain no recovery in such circumstances. The Fund’s
26 INVESCO OPPENHEIMER V.I. TOTAL RETURN BOND FUND
maximum risk of loss from Counterparty risk, either as the protection seller or as the protection buyer, is the value of the contract. The risk may be mitigated by having a master netting arrangement between the Fund and the Counterparty and by the designation of collateral by the Counterparty to cover the Fund’s exposure to the Counterparty.
Implied credit spreads represent the current level at which protection could be bought or sold given the terms of the existing CDS contract and serve as an indicator of the current status of the payment/performance risk of the CDS. An implied spread that has widened or increased since entry into the initial contract may indicate a deteriorating credit profile and increased risk of default for the reference entity. A declining or narrowing spread may indicate an improving credit profile or decreased risk of default for the reference entity. Alternatively, credit spreads may increase or decrease reflecting the general tolerance for risk in the credit markets.
An interest rate swap is an agreement between Counterparties pursuant to which the parties exchange a floating rate payment for a fixed rate payment based on a specified notional amount.
Changes in the value of centrally cleared and OTC swap agreements are recognized as unrealized gains (losses) in the Statement of Operations by “marking to market” on a daily basis to reflect the value of the swap agreement at the end of each trading day. Payments received or paid at the beginning of the agreement are reflected as such on the Statement of Assets and Liabilities and may be referred to as upfront payments. The Fund accrues for the fixed payment stream and amortizes upfront payments, if any, on swap agreements on a daily basis with the net amount, recorded as a component of realized gain (loss) on the Statement of Operations. A liquidation payment received or made at the termination of a swap agreement is recorded as realized gain (loss) on the Statement of Operations. The Fund segregates cash or liquid securities having a value at least equal to the amount of the potential obligation of a Fund under any swap transaction. Cash held as collateral is recorded as deposits with brokers on the Statement of Assets and Liabilities. Entering into these agreements involves, to varying degrees, lack of liquidity and elements of credit, market, and Counterparty risk in excess of amounts recognized on the Statement of Assets and Liabilities. Such risks involve the possibility that a swap is difficult to sell or liquidate; the Counterparty does not honor its obligations under the agreement and unfavorable interest rates and market fluctuations. It is possible that developments in the swaps market, including potential government regulation, could adversely affect the Fund’s ability to terminate existing swap agreements or to realize amounts to be received under such agreements. A short position in a security poses more risk than holding the same security long. As there is no limit on how much the price of the security can increase, the Fund’s exposure is unlimited.
| K. | | Securities on a When-Issued or Delayed Delivery Basis -The Fund may purchase securities on a “when-issued” basis, and may purchase or sell securities on a “delayed delivery” basis, with payment and delivery scheduled for a future date. No income accrues to the Fund on the securities in connection with such transactions prior to the date the Fund actually takes delivery of the securities. These transactions are subject to market fluctuations and are subject to the risk that the value at delivery may be more or less than the trade date purchase price. Although the Fund will generally purchase these securities with the intention on acquiring such securities, they may sell such securities prior to the settlement date. |
| L. | | Dollar Rolls and Forward Commitment Transactions- The Fund may enter into dollar roll transactions to enhance the Fund’s performance. The Fund executes its dollar roll transactions in the to be announced (“TBA”) market whereby the Fund makes a forward commitment to purchase a security and, instead of accepting delivery, the position is offset by the sale of the security with a simultaneous agreement to repurchase at a future date. |
The Fund accounts for dollar roll transactions as purchases and sales and realizes gains and losses on these transactions. The Fund will segregate liquid assets in an amount equal to its dollar roll commitments. Dollar roll transactions involve the risk that a Counterparty to the transaction may fail to complete the transaction. If this occurs, the Fund may lose the opportunity to purchase or sell the security at the agreed upon price. Dollar roll transactions also involve the risk that the value of the securities retained by the Fund may decline below the price of the securities that the Fund has sold but is obligated to purchase under the agreement. Dollar roll transactions covered in this manner are not treated as senior securities for purposes of a Fund’s fundamental investment limitation on senior securities and borrowings.
| M. | | Leverage Risk- Leverage exists when the Fund can lose more than it originally invests because it purchases or sells an instrument or enters into a transaction without investing an amount equal to the full economic exposure of the instrument or transaction. |
| N. | | Collateral- To the extent the Fund has designated or segregated a security as collateral and that security is subsequently sold, it is the Fund’s practice to replace such collateral no later than the next business day. |
Note 2 - Advisory Fees and Other Fees Paid to Affiliates
The Trust has entered into a master investment advisory agreement with Invesco Advisers, Inc. (the “Adviser” or “Invesco”). Under the terms of the investment advisory agreement, the Fund accrues daily and pays monthly an advisory fee to the Adviser based on the annual rate of the Fund’s average daily net assets as follows:
| | | | |
| Fee Schedule* | |
| Up to $1 billion | | | 0.60 | % |
| Over $1 billion | | | 0.50 | |
* The advisory fee paid by the Fund shall be reduced by any amounts paid by the Fund under the administrative services agreement with the Adviser.
For the year ended December 31, 2019, the effective advisory fees incurred by the Fund was 0.59%.
From the beginning of the fiscal period until the date of the Reorganization, the Acquired Fund paid $295,210 in advisory fees to OFI Global Asset Management, Inc. based on the annual rates above of the Acquired Fund’s average daily net assets.
Under the terms of a master sub-advisory agreement between the Adviser and each of Invesco Asset Management Deutschland GmbH, Invesco Asset Management Limited, Invesco Asset Management (Japan) Limited, Invesco Hong Kong Limited, Invesco Senior Secured Management, Inc. and Invesco
27 INVESCO OPPENHEIMER V.I. TOTAL RETURN BOND FUND
NOTES TO FINANCIAL STATEMENTSContinued
Canada Ltd. and separate sub-advisory agreements with Invesco Capital Management LLC, and Invesco Asset Management (India) Private Limited (collectively, the “Affiliated Sub-Advisers”) the Adviser, not the Fund, will pay 40% of the fees paid to the Adviser to any such Affiliated Sub-Adviser(s) that provide(s) discretionary investment management services to the Fund based on the percentage of assets allocated to such Affiliated Sub-Adviser(s). Invesco has also entered into a Sub-Advisory Agreement with OppenheimerFunds, Inc. to provide discretionary management services to the Funds.
Effective on the Reorganization Date, the Adviser has contractually agreed, through May 31, 2021, to waive advisory fees and/or reimburse expenses of all shares to the extent necessary to limit the total annual fund operating expenses after fee waiver and/or expense reimbursement (excluding certain items discussed below) of Series I and Series II shares to 0.75% and 1.00%, respectively, of the Fund’s average daily net assets (the “expense limits”). In determining the Adviser’s obligation to waive advisory fees and/or reimburse expenses, the following expenses are not taken into account, and could cause total annual fund operating expenses after fee waivers and/or expense reimbursement to exceed the numbers reflected above: (1) interest; (2) taxes; (3) dividend expenses on short sales; (4) extraordinary or non-routine items, including litigation expenses; and (5) expenses that the Fund has incurred but did not actually pay because of an expense offset arrangement. Unless Invesco continues the fee waiver agreement, it will terminate on May 31, 2021. During its term, the fee waiver agreement cannot be terminated or amended to increase the expense limits or reduce the advisory fee waiver without approval of the Board of Trustees.
Further, the Adviser has contractually agreed, through at least June 30, 2021, to waive the advisory fee payable by the Fund in an amount equal to 100% of the net advisory fees the Adviser receives from the affiliated money market funds on investments by the Fund of uninvested cash in such affiliated money market funds.
For the year ended December 31, 2019, the Adviser waived advisory fees of $9,434 and reimbursed Fund expenses of $103,366 and $71,786 for Series I and Series II shares, respectively.
Prior to the Reorganization, OFI Global Asset Management, Inc. had contractually agreed to waive fees and/or reimburse expenses of Non-Service and Service shares to 0.75% and 1.00%, respectively, of the Acquired Fund’s average daily net assets.
The Trust has entered into a master administrative services agreement with Invesco pursuant to which the Fund has agreed to pay Invesco a fee for costs incurred in providing accounting services and fund administrative services to the Fund and to reimburse Invesco for fees paid to insurance companies that have agreed to provide certain administrative services to the Fund. These administrative services provided by the insurance companies may include, among other things: maintenance of master accounts with the Fund; tracking, recording and transmitting net purchase and redemption orders for Fund shares; maintaining and preserving records related to the purchase, redemption and other account activity of variable product owners; distributing copies of Fund documents such as prospectuses, proxy materials and periodic reports, to variable product owners, and responding to inquiries from variable product owners about the Fund. Pursuant to such agreement, for the year ended December 31, 2019, Invesco was paid $10,679 for accounting and fund administrative services and was reimbursed $113,195 for fees paid to insurance companies. Additionally, Invesco has entered into service agreements whereby JP Morgan Chase Bank serves as custodian to the Fund. Prior to the Reorganization, the Acquired Fund paid administrative fees to OFI Global Asset Management, Inc.
The Trust has entered into a transfer agency and service agreement with Invesco Investment Services, Inc. (“IIS”) pursuant to which the Fund has agreed to pay IIS a fee for providing transfer agency and shareholder services to the Fund and reimburse IIS for certain expenses incurred by IIS in the course of providing such services. Prior to the Reorganization, the Acquired Fund paid transfer agent fees to OFI Global Asset Management, Inc. and Shareholder Services, Inc. For the year ended December 31, 2019, expenses incurred under these agreements are shown in the Statement of Operations as Transfer and shareholder servicing agent fees.
The Trust has entered into master distribution agreements with Invesco Distributors, Inc. (“IDI”) to serve as the distributor for the Series II shares of the Fund. The Trust has adopted a plan pursuant to Rule 12b-1 under the 1940 Act with respect to the Fund’s Series II shares (the “Plan”). The Fund, pursuant to the Plan, pays IDI at an annual rate of 0.25% of the average daily net assets of Series II shares. The fees are accrued daily and paid monthly. Of the Plan payments, up to 0.25% of the average daily net assets of the class of shares may be paid to insurance companies who furnish continuing personal shareholder services to customers who purchase and own shares of such class. Any amounts not paid as a service fee under the Plan would constitute an asset-based sales charge. Rules of the Financial Industry Regulatory Authority (“FINRA”) impose a cap on the total sales charges, including asset-based sales charges, that may be paid by any class of shares of the Fund plans. Prior to the Reorganization, the Acquired Fund paid distribution fees to OppenheimerFunds Distributor, Inc. For the year ended December 31, 2019, expenses incurred under the plans are shown in the Statement of Operations as Distribution and service plan fees.
Certain officers and trustees of the Trust are officers and directors of the Adviser, IIS and/or IDI.
Note 3 - Additional Valuation Information
GAAP defines fair value as the price that would be received to sell an asset or paid to transfer a liability in an orderly transaction between market participants at the measurement date, under current market conditions. GAAP establishes a hierarchy that prioritizes the inputs to valuation methods, giving the highest priority to readily available unadjusted quoted prices in an active market for identical assets (Level 1) and the lowest priority to significant unobservable inputs (Level 3), generally when market prices are not readily available or are unreliable. Based on the valuation inputs, the securities or other investments are tiered into one of three levels. Changes in valuation methods may result in transfers in or out of an investment’s assigned level:
Level 1 — Prices are determined using quoted prices in an active market for identical assets.
Level 2 — Prices are determined using other significant observable inputs. Observable inputs are inputs that other market participants may use in pricing a security. These may include quoted prices for similar securities, interest rates, prepayment speeds, credit risk, yield curves, loss severities, default rates, discount rates, volatilities and others.
28 INVESCO OPPENHEIMER V.I. TOTAL RETURN BOND FUND
Level 3 — Prices are determined using significant unobservable inputs. In situations where quoted prices or observable inputs are unavailable (for example, when there is little or no market activity for an investment at the end of the period), unobservable inputs may be used. Unobservable inputs reflect the Fund’s own assumptions about the factors market participants would use in determining fair value of the securities or instruments and would be based on the best available information.
The following is a summary of the tiered valuation input levels, as of December 31, 2019. The level assigned to the securities valuations may not be an indication of the risk or liquidity associated with investing in those securities. Because of the inherent uncertainties of valuation, the values reflected in the financial statements may materially differ from the value received upon actual sale of those investments.
| | | | | | | | | | | | | | | | |
| | | Level 1— Unadjusted Quoted Prices | | Level 2— Other Significant
Observable Inputs | | | Level 3— Significant
Unobservable
Inputs | | | Value | |
| Assets Table | | | | | | | | | | | | | | | | |
| Investments, at Value: | | | | | | | | | | | | | | | | |
| Asset-Backed Securities | | $ | — | | | $ | 19,260,764 | | | $ | — | | | $ | 19,260,764 | |
| Mortgage-Backed Obligations | | | — | | | | 37,172,817 | | | | — | | | | 37,172,817 | |
| U.S. Government Obligations | | | — | | | | 4,655,036 | | | | — | | | | 4,655,036 | |
| Corporate Bonds and Notes | | | — | | | | 56,011,100 | | | | — | | | | 56,011,100 | |
| Investment Company | | | 21,539,049 | | | | — | | | | — | | | | 21,539,049 | |
| | | | |
| Total Investments, at Value | | | 21,539,049 | | | | 117,099,717 | | | | — | | | | 138,638,766 | |
| Other Financial Instruments: | | | | | | | | | | | | | | | | |
| Futures contracts | | | 24,377 | | | | — | | | | — | | | | 24,377 | |
| | | | |
| Total Assets | | $ | 21,563,426 | | | $ | 117,099,717 | | | $ | — | | | $ | 138,663,143 | |
| | | | |
| Other Financial Instruments: | | | | | | | | | | | | | | | | |
| Futures contracts | | $ | (442,627 | ) | | $ | — | | | $ | — | | | $ | (442,627 | ) |
| | | | |
| Total Liabilities | | $ | (442,627 | ) | | $ | — | | | $ | — | | | $ | (442,627 | ) |
| | | | |
Forward currency exchange contracts and futures contracts, if any, are reported at their unrealized appreciation/depreciation at measurement date, which represents the change in the contract’s value from trade date. All additional assets and liabilities included in the above table are reported at their market value at measurement date.
Note 4 - Security Transactions with Affiliated Funds
The Fund is permitted to purchase or sell securities from or to certain other Invesco Funds under specified conditions outlined in procedures adopted by the Board of Trustees of the Trust. The procedures have been designed to ensure that any purchase or sale of securities by the Fund from or to another fund or portfolio that is or could be considered an affiliate by virtue of having a common investment adviser (or affiliated investment advisers), common Trustees and/or common officers complies with Rule 17a-7 of the 1940 Act. Further, as defined under the procedures, each transaction is effected at the current market price. Pursuant to these procedures for the period January 1, 2019 to May 24, 2019, the Predecessor Fund engaged in transactions with affiliates as listed: Securities purchases of $239,711 and securities sales of $119,907, which resulted in net realized losses of $(4,165). For the period May 25, 2019 to December 31, 2019, the Fund did not engage in transactions with affiliates.
Note 5 - Derivative Investments
The Fund may enter into an International Swaps and Derivatives Association Master Agreement (“ISDA Master Agreement”) under which a fund may trade OTC derivatives. An OTC transaction entered into under an ISDA Master Agreement typically involves a collateral posting arrangement, payment netting provisions and close-out netting provisions. These netting provisions allow for reduction of credit risk through netting of contractual obligations. The enforceability of the netting provisions of the ISDA Master Agreement depends on the governing law of the ISDA Master Agreement, among other factors. For financial reporting purposes, the Fund does not offset OTC derivative assets or liabilities that are subject to ISDA Master Agreements in the Statement of Assets and Liabilities.
Value of Derivative Instruments at Period-End
The table below reflects the Fund’s exposure to Counterparties subject to either an ISDA Master Agreement or other agreement for OTC derivative liability transactions as of December 31, 2019:
| | | | | | | | | | | | | | |
| | | Asset Derivatives | | | Liability Derivatives | |
Derivatives Not Accounted for as Hedging Instruments | | Statement of Assets and Liabilities Location | | Value | | | Statement of Assets and Liabilities Location | | | Value | |
| Interest rate contracts Variation margin receivable | | $ | 24,3771 | | | | Variation margin payable | | | $ | 442,6271 | |
| | | | | | | | | | | | |
| Total | | $ | 24,377 | | | | | | | $ | 442,627 | |
| | | | | | | | | | | | |
1.Includes only the current day’s variation margin. Prior variation margin movements have been reflected in cash on the Statement of Assets and Liabilities upon receipt or payment.
29 INVESCO OPPENHEIMER V.I. TOTAL RETURN BOND FUND
NOTES TO FINANCIAL STATEMENTSContinued
Effect of Derivative Investments for the Year Ended December 31, 2019
The tables below summarizes the gains (losses) on derivative investments, detailed by primary risk exposure, recognized in earnings during the period:
| | | | | | | | | | | | |
| Amount of Realized Gain or (Loss) Recognized on Derivatives | |
Derivatives Not Accounted for as Hedging Instruments | | Futures contracts | | | Swap contracts | | | Total | |
| Credit contracts | | $ | — | | | $ | (494,599 | ) | | $ | (494,599) | |
| Interest rate contracts | | | 2,286,681 | | | | — | | | | 2,286,681 | |
| | | | |
| Total | | $ | 2,286,681 | | | $ | (494,599 | ) | | $ | 1,792,082 | |
| | | | |
| | |
| Amount of Change in Unrealized Gain or (Loss) Recognized on Derivatives |
Derivatives Not Accounted for as Hedging Instruments | | Futures contracts |
| Interest rate contracts | | $ (825,098) |
The table below summarizes the year ended average notional value of futures contracts and swap agreements during the period.
| | | | | | | | |
| | | Futures
contracts | | | Total return
swap contracts | |
Average notional amount | | $ | 28,176,081 | | | $ | 5,188,809 | |
Note 6 - Expense Offset Arrangement
The expense offset arrangement is comprised of custodian credits which result from periodic overnight cash balances at the custodian. For the year ended December 31, 2019, the Fund received credits from this arrangement, which resulted in the reduction of the Fund’s total expenses of $608.
Note 7 - Trustee and Officer Fees and Benefits
Certain Trustees have executed Deferred Compensation Agreement(s) pursuant to which they have the option to elect to defer receipt of all or a portion of the annual compensation they are entitled to receive from the Fund. For purposes of determining the amount owed to the Trustees under the plan(s), deferred amounts are treated as though equal dollar amounts had been invested in shares of the Fund or in other Invesco and/or Invesco Oppenheimer funds selected by the Trustees. The Fund purchases shares of the funds selected for deferral by the Trustees in amounts equal to his or her deemed investment, resulting in a Fund asset equal to the deferred compensation liability. Such assets are included as a component of “Other” within the asset section of the Statement of Assets and Liabilities. Deferral of Trustees’ fees under the plan(s) will not affect the net assets of the Fund and will not materially affect the Fund’s assets, liabilities or net investment income per share. Amounts will be deferred until distributed in accordance with the Deferred Compensation Agreement(s).
Note 8 - Cash Balances
The Fund is permitted to temporarily carry a negative or overdrawn balance in its account with JPMorgan Chase Bank, the custodian bank. Such balances, if any at period-end, are shown in the Statement of Assets and Liabilities under the payable caption Amount due custodian. To compensate the custodian bank for such overdrafts, the overdrawn Fund may either (1) leave funds as a compensating balance in the account so the custodian bank can be compensated by earning the additional interest; or (2) compensate by paying the custodian bank at a rate agreed upon by the custodian bank and Invesco, not to exceed the contractually agreed upon rate.
Note 9 - Distributions to Shareholders and Tax Components of Net Assets
Tax Character of Distributions to Shareholders Paid During the Fiscal Years Ended December 31, 2019 and 2018:
| | | | | | | | |
| | | 2019 | | | 2018 | |
| Ordinary income | | $ | 4,165,325 | | | $ | 4,099,184 | |
30 INVESCO OPPENHEIMER V.I. TOTAL RETURN BOND FUND
Tax Components of Net Assets at Period-End:
| | | | |
| | | 2019 | |
| Undistributed ordinary income | | $ | 3,718,739 | |
| Net unrealized appreciation - investments | | | 1,970,348 | |
| Temporary book/tax differences | | | (46,077) | |
| Capital loss carryforward | | | (3,150,785) | |
| Shares of beneficial interest | | | 117,906,506 | |
| | | | |
| Total net assets | | $ | 120,398,731 | |
| | | | |
The difference between book-basis and tax-basis unrealized appreciation (depreciation) is due to differences in the timing of recognition of gains and losses on investments for tax and book purposes. The Fund’s net unrealized appreciation (depreciation) difference is attributable primarily to futures contracts.
The temporary book/tax differences are a result of timing differences between book and tax recognition of income and/or expenses. The Fund’s temporary book/tax differences are the result of the trustee deferral of compensation and retirement plan benefits.
Capital loss carryforward is calculated and reported as of a specific date. Results of transactions and other activity after that date may affect the amount of capital loss carryforward actually available for the Fund to utilize. Capital losses generated in years beginning after December 22, 2010 can be carried forward for an unlimited period, whereas previous losses expire in eight tax years. Capital losses with an expiration period may not be used to offset capital gains until all net capital losses without an expiration date have been utilized. Capital loss carryforwards with no expiration date will retain their character as either short-term or long-term capital losses instead of as short-term capital losses as under prior law. The ability to utilize capital loss carryforwards in the future may be limited under the Internal Revenue Code and related regulations based on the results of future transactions.
The Fund has a capital loss carryforward as of December 31, 2019, which expires as follows:
| | | | | | | | | | | | |
| Capital Loss Carryforward* | |
| Expiration | | Short-Term | | | Long-Term | | | Total | |
| Not subject to expiration | | $ | 1,188,047 | | | $ | 1,962,738 | | | $ | 3,150,785 | |
* Capital loss carryforward as of the date listed above is reduced for limitations, if any, to the extent required by the Internal Revenue Code and may be further limited depending upon a variety of factors, including the realization of net unrealized gains or losses as of the date of any reorganization.
Note 10 - Investment Transactions
The aggregate amount of investment securities (other than short-term securities, U.S. Treasury obligations and money market funds, if any) purchased and sold by the Fund during the year ended December 31, 2019 was $73,312,372 and $94,310,930, respectively. During the same period, purchases and sales of U.S. Treasury obligations were $18,979,783 and $14,627,134, respectively. Cost of investments, including any derivatives, on a tax basis includes the adjustments for financial reporting purposes as of the most recently completed federal income tax reporting period-end.
| | | | |
| Unrealized Appreciation (Depreciation) of Investments on a Tax Basis | |
| Aggregate unrealized appreciation of investments | | $ | 4,413,565 | |
| Aggregate unrealized (depreciation) of investments | | | (2,443,217) | |
| | | | |
| Net unrealized appreciation of investments | | $ | 1,970,348 | |
| | | | |
Cost of investments for tax purposes is $147,086,527.
Note 11 - Reclassification of Permanent Differences
Primarily as a result of differing book/tax treatment of paydowns and income from swap agreements, on December 31, 2019, undistributed net investment income was increased by $128,389 and undistributed net realized gain (loss) was decreased by $128,389. This reclassification had no effect on the net assets of the Fund.
Note 12 - Share Information
Transactions in shares of beneficial interest were as follows:
| | | | | | | | | | | | | | | | |
| | | Year Ended December 31, 20191 | | Year Ended December 31, 2018 |
| | | | |
| | | Shares | | Amount | | Shares | | Amount |
| Series I Shares | | | | | | | | | | | | | | | | |
| Sold | | | 778,748 | | | $ | 6,072,746 | | | | 1,820,955 | | | $ | 14,050,401 | |
| Dividends and/or distributions reinvested | | | 320,278 | | | | 2,462,939 | | | | 353,708 | | | | 2,617,442 | |
| Redeemed | | | (1,874,852 | ) | | | (14,540,325 | ) | | | (2,572,646 | ) | | | (19,710,946 | ) |
| | | | |
| Net increase (decrease) | | | (775,826 | ) | | $ | (6,004,640 | ) | | | (397,983 | ) | | $ | (3,043,103 | ) |
| | | | |
| | | | | | | | | | | | | | | | | |
31 INVESCO OPPENHEIMER V.I. TOTAL RETURN BOND FUND
NOTES TO FINANCIAL STATEMENTSContinued
| | | | | | | | | | | | | | | | |
| | | Year Ended December 31, 20191 | | Year Ended December 31, 2018 |
| | | | |
| | | Shares | | Amount | | Shares | | Amount |
| Series II Shares | | | | | | | | | | | | | | | | |
| Sold | | | 2,278,654 | | | $ | 17,388,336 | | | | 1,451,512 | | | $ | 10,711,237 | |
| Dividends and/or distributions reinvested | | | 224,293 | | | | 1,702,386 | | | | 202,701 | | | | 1,481,742 | |
| Redeemed | | | (2,738,590 | ) | | | (21,088,474 | ) | | | (1,978,329 | ) | | | (14,681,878 | ) |
| | | | |
| Net increase (decrease) | | | (235,643 | ) | | $ | (1,997,752 | ) | | | (324,116 | ) | | $ | (2,488,899 | ) |
| | | | |
1. There are entities that are record owners of more than 5% of the outstanding shares of the Fund and own 52% of the outstanding shares of the Fund. The Fund and the Fund’s principal underwriter or adviser, are parties to participation agreements with these entities whereby these entities sell units of interest in separate accounts funding variable products that are invested in the Fund. The Fund, Invesco and/or Invesco affiliates may make payments to these entities, which are considered to be related to the Fund, for providing services to the Fund, Invesco and/or Invesco affiliates, including, but not limited to services such as securities brokerage, distribution, third party record keeping and account servicing. The Fund has no knowledge as to whether all or any portion of the shares owned of record by these entities are also owned beneficially.
Note 13 - Borrowings
Joint Credit Facility.A number of mutual funds managed by the Adviser participate in a $1.95 billion revolving credit facility (the “Facility”) intended to provide short-term financing, if necessary, subject to certain restrictions in connection with atypical redemption activity. Expenses and fees related to the Facility are paid by the participating funds and are disclosed separately or as other expenses on the Statement of Operations. The Fund did not utilize the Facility during the reporting period. The Facility terminated May 24, 2019.
32 INVESCO OPPENHEIMER V.I. TOTAL RETURN BOND FUND
REPORT OF INDEPENDENT REGISTERED PUBLIC ACCOUNTING FIRM
To the Board of Trustees of AIM Variable Insurance Funds (Invesco Variable Insurance Funds) and Shareholders of Invesco Oppenheimer V.I. Total Return Bond Fund
Opinion on the Financial Statements
We have audited the accompanying statement of assets and liabilities, including the schedule of investments, of Invesco Oppenheimer V.I. Total Return Bond Fund (one of the funds constituting AIM Variable Insurance Funds (Invesco Variable Insurance Funds), referred to hereafter as the “Fund”) as of December 31, 2019, the related statements of operations and of changes in net assets for the year ended December 31, 2019, including the related notes, and the financial highlights for the period ended December 31, 2019 (collectively referred to as the “financial statements”). In our opinion, the financial statements present fairly, in all material respects, the financial position of the Fund as of December 31, 2019, the results of its operations and changes in its net assets for the year ended December 31, 2019 and the financial highlights for the period ended December 31, 2019 in conformity with accounting principles generally accepted in the United States of America.
The financial statements of Invesco Oppenheimer V.I. Total Return Bond Fund (formerly known as Oppenheimer Total Return Bond Fund/VA) as of and for the year ended December 31, 2018 and the financial highlights for each of the periods ended on or prior to December 31, 2018 (not presented herein, other than the statement of changes in net assets and the financial highlights) were audited by other auditors whose report dated February 14, 2019 expressed an unqualified opinion on those financial statements and financial highlights.
Basis for Opinion
These financial statements are the responsibility of the Fund’s management. Our responsibility is to express an opinion on the Fund’s financial statements based on our audit. We are a public accounting firm registered with the Public Company Accounting Oversight Board (United States) (PCAOB) and are required to be independent with respect to the Fund in accordance with the U.S. federal securities laws and the applicable rules and regulations of the Securities and Exchange Commission and the PCAOB.
We conducted our audit of these financial statements in accordance with the standards of the PCAOB. Those standards require that we plan and perform the audit to obtain reasonable assurance about whether the financial statements are free of material misstatement, whether due to error or fraud.
Our audit included performing procedures to assess the risks of material misstatement of the financial statements, whether due to error or fraud, and performing procedures that respond to those risks. Such procedures included examining, on a test basis, evidence regarding the amounts and disclosures in the financial statements. Our audit also included evaluating the accounting principles used and significant estimates made by management, as well as evaluating the overall presentation of the financial statements. Our procedures included confirmation of securities owned as of December 31, 2019 by correspondence with the custodian, transfer agent and brokers; when replies were not received from brokers, we performed other auditing procedures. We believe that our audit provides a reasonable basis for our opinion.
/s/PricewaterhouseCoopers LLP
Houston, Texas
February 18, 2020
We have served as the auditor of one or more of the investment companies in the Invesco group of investment companies since at least 1995. We have not been able to determine the specific year we began serving as auditor.
33 INVESCO OPPENHEIMER V.I. TOTAL RETURN BOND FUND
TAX INFORMATION
Form 1099-DIV, Form 1042-S and other year–end tax information provide shareholders with actual calendar year amounts that should be included in their tax returns. Shareholders should consult their tax advisers.
The following distribution information is being provided as required by the Internal Revenue Code or to meet a specific state’s requirement.
The Fund designates the following amounts or, if subsequently determined to be different, the maximum amount allowable for its fiscal year ended December 31, 2019:
Federal and State Income Tax
| | | | |
| Corporate Dividends Received Deduction* | | | 0.01 | % |
| U.S. Treasury Obligations* | | | 0.43 | % |
* The above percentages are based on ordinary income dividends paid to shareholders during the Fund’s fiscal year.
34 INVESCO OPPENHEIMER V.I. TOTAL RETURN BOND FUND
PORTFOLIO PROXY VOTING POLICIES AND GUIDELINES; UPDATES TO SCHEDULE OF INVESTMENTS
Go paperless with eDelivery
Visit invesco.com/edelivery to enjoy the convenience and security of anytime electronic access to your investment documents.
With eDelivery, you can elect to have any or all of the following materials delivered straight to your inbox to download, save and print from your own computer:
· Fund reports and prospectuses
· Quarterly statements
· Daily confirmations
· Tax forms
Invesco mailing information
Send general correspondence to Invesco Investment Services, Inc., P.O. Box 219078, Kansas City, MO 64121-9078.
Important notice regarding delivery of security holder documents
To reduce Fund expenses, only one copy of most shareholder documents may be mailed to shareholders with multiple accounts at the same address (Householding). Mailing of your shareholder documents may be householded indefinitely unless you instruct us otherwise. If you do not want the mailing of these documents to be combined with those for other members of your household, please contact Invesco Investment Services, Inc. at 800 959 4246 or contact your financial institution. We will begin sending you individual copies for each account within 30 days after receiving your request.
Fund holdings and proxy voting information
The Fund provides a complete list of its holdings four times in each fiscal year, at the quarter ends. For the second and fourth quarters, the lists appear in the Fund’s semiannual and annual reports to shareholders. For the first and third quarters, the Fund files the lists with the Securities and Exchange Commission (SEC) as an exhibit to its reports on Form N-PORT. The most recent list of portfolio holdings is available at invesco.com/completeqtrholdings. Shareholders can also look up the Fund’s Forms N-PORT on the SEC website at sec.gov.
A description of the policies and procedures that the Fund uses to determine how to vote proxies relating to portfolio securities is available without charge, upon request, from our Client Services department at 800 959 4246 or at invesco.com/proxyguidelines. The information is also available on the SEC website, sec.gov.
Information regarding how the Fund voted proxies related to its portfolio securities during the most recent 12-month period ended June 30 is available at invesco. com/proxysearch. The information is also available on the SEC website, sec.gov.
Invesco Advisers, Inc. is an investment adviser; it provides investment advisory services to individual and institutional clients and does not sell securities. Invesco Distributors, Inc. is the US distributor for Invesco Ltd.’s retail mutual funds, exchange-traded funds and institutional money market funds. Both are wholly owned, indirect subsidiaries of Invesco Ltd.
35 INVESCO OPPENHEIMER V.I. TOTAL RETURN BOND FUND
TRUSTEES AND OFFICERS
The address of each trustee and officer is AIM Variable Insurance Funds (Invesco Variable Insurance Funds) (the “Trust”), 11 Greenway Plaza, Suite 1000, Houston, Texas 77046-1173. The trustees serve for the life of the Trust, subject to their earlier death, incapacitation, resignation, retirement or removal as more specifically provided in the Trust’s organizational documents. Each officer serves for a one year term or until their successors are elected and qualified. Column two below includes length of time served with predecessor entities, if any.
| | | | | | | | |
| | | | | |
Name, Year of Birth and Position(s)�� Held with the Trust | | Trustee and/or Officer Since | | Principal Occupation(s) During Past 5 Years | | Number of Funds in Fund Complex
Overseen by Trustee | | Other Directorship(s) Held by Trustee During Past
5 Years |
INTERESTED PERSON | | | | | | | | |
| | | | | |
Martin L. Flanagan 1– 1960 Trustee and Vice Chair | | 2007 | | Executive Director, Chief Executive Officer and President, Invesco Ltd. (ultimate parent of Invesco and a global investment management firm); Trustee and Vice Chair, The Invesco Funds; Vice Chair, Investment Company Institute; and Member of Executive Board, SMU Cox School of Business Formerly: Advisor to the Board, Invesco Advisers, Inc. (formerly known as Invesco Institutional (N.A.), Inc.); Chairman and Chief Executive Officer, Invesco Advisers, Inc. (registered investment adviser); Director, Chairman, Chief Executive Officer and President, Invesco Holding Company (US), Inc. (formerly IVZ Inc.) (holding company), Invesco Group Services, Inc. (service provider) and Invesco North American Holdings, Inc. (holding company); Director, Chief Executive Officer and President, Invesco Holding Company Limited (parent of Invesco and a global investment management firm); Director, Invesco Ltd.; Chairman, Investment Company Institute and President,Co-Chief Executive Officer,Co-President, Chief Operating Officer and Chief Financial Officer, Franklin Resources, Inc. (global investment management organization) | | 229 | | None |
| |
1 Mr. Flanagan is considered an interested person (within the meaning of Section 2(a)(19) of the 1940 Act) of the Trust because he is an officer of the Adviser to the Trust, and an officer and a director of Invesco Ltd., ultimate parent of the Adviser. |
36 INVESCO OPPENHEIMER V.I. TOTAL RETURN BOND FUND
| | | | | | | | |
| | | | | |
Name, Year of Birth and Position(s) Held with the Trust | | Trustee and/or Officer Since | | Principal Occupation(s) During Past 5 Years | | Number of Funds in Fund Complex
Overseen by Trustee | | Other Directorship(s) Held by Trustee During Past
5 Years |
INDEPENDENT TRUSTEES | | | | | | | | |
| | | | | |
Bruce L. Crockett – 1944 Trustee and Chair | | 2003 | | Chairman, Crockett Technologies Associates (technology consulting company) Formerly: Director, Captaris (unified messaging provider); Director, President and Chief Executive Officer, COMSAT Corporation; Chairman, Board of Governors of INTELSAT (international communications company); ACE Limited (insurance company); Independent Directors Council and Investment Company Institute: Member of the Audit Committee, Investment Company Institute; Member of the Executive Committee and Chair of the Governance Committee, Independent Directors Council | | 229 | | Director and Chairman of the Audit Committee, ALPS (Attorneys Liability Protection Society) (insurance company); Director and Member of the Audit Committee and Compensation Committee, Ferroglobe PLC (metallurgical company) |
| | | | | |
David C. Arch – 1945 Trustee | | 2010 | | Chairman of Blistex Inc. (consumer health care products manufacturer); Member, World Presidents’ Organization | | 229 | | Board member of the Illinois Manufacturers’ Association |
| | | | | |
Beth Ann Brown – 1968 Trustee | | 2019 | | Independent Consultant Formerly: Head of Intermediary Distribution, Managing Director, Strategic Relations, Managing Director, Head of National Accounts, Senior Vice President, National Account Manager and Senior Vice President, Key Account Manager, Columbia Management Investment Advisers LLC; Vice President, Key Account Manager, Liberty Funds Distributor, Inc.; and Trustee of certain Oppenheimer Funds | | 229 | | Director, Board of Directors of Caron Engineering Inc.; Advisor, Board of Advisors of Caron Engineering Inc.; President and Director, of Acton Shapleigh Youth Conservation Corps (non-profit); and Vice President and Director of Grahamtastic Connection (non-profit) |
| | | | | |
Jack M. Fields – 1952 Trustee | | 2003 | | Chief Executive Officer, Twenty First Century Group, Inc. (government affairs company); and Chairman, Discovery Learning Alliance(non-profit) Formerly: Owner and Chief Executive Officer, Dos Angeles Ranch L.P. (cattle, hunting, corporate entertainment); Director, Insperity, Inc. (formerly known as Administaff) (human resources provider); Chief Executive Officer, Texana Timber LP (sustainable forestry company); Director of Cross Timbers Quail Research Ranch(non-profit); and member of the U.S. House of Representatives | | 229 | | None |
| | | | | |
Cynthia Hostetler – 1962 Trustee | | 2017 | | Non-Executive Director and Trustee of a number of public and private business corporations Formerly: Director, Aberdeen Investment Funds (4 portfolios); Head of Investment Funds and Private Equity, Overseas Private Investment Corporation; President, First Manhattan Bancorporation, Inc.; Attorney, Simpson Thacher & Bartlett LLP | | 229 | | Vulcan Materials Company (construction materials company); Trilinc Global Impact Fund; Genesee & Wyoming, Inc. (railroads); Artio Global Investment LLC (mutual fund complex); Edgen Group, Inc. (specialized energy and infrastructure products distributor); Investment Company Institute (professional organization); Independent Directors Council (professional organization) |
| | | | | |
Eli Jones – 1961 Trustee | | 2016 | | Professor and Dean, Mays Business School - Texas A&M University Formerly: Professor and Dean, Walton College of Business, University of Arkansas and E.J. Ourso College of Business, Louisiana State University; Director, Arvest Bank | | 229 | | Insperity, Inc. (formerly known as Administaff) (human resources provider) |
| | | | | |
Elizabeth Krentzman – 1959 Trustee | | 2019 | | Formerly: Principal and Chief Regulatory Advisor for Asset Management Services and U.S. Mutual Fund Leader of Deloitte & Touche LLP; General Counsel of the Investment Company Institute (trade association); National Director of the Investment Management Regulatory Consulting Practice, Principal, Director and Senior Manager of Deloitte & Touche LLP; Assistant Director of the Division of Investment Management – Office of Disclosure and Investment Adviser Regulation of the U.S. Securities and Exchange Commission and various positions with the Division of Investment Management – Office of Regulatory Policy of the U.S. Securities and Exchange Commission; Associate at Ropes & Gray LLP.; Advisory Board Member of the Securities and Exchange Commission Historical Society; and Trustee of certain Oppenheimer Funds | | 229 | | Trustee of the University of Florida National Board Foundation and Audit Committee Member; Member of the Cartica Funds Board of Directors (private investment funds); Member of the University of Florida Law Center Association, Inc. Board of Trustees and Audit Committee Member |
| | | | | |
Anthony J. LaCava, Jr. – 1956 Trustee | | 2019 | | Formerly: Director and Member of the Audit Committee, Blue Hills Bank (publicly traded financial institution) and Managing Partner, KPMG LLP | | 229* | | Blue Hills Bank; Chairman of Bentley University; Member, Business School Advisory Council; and Nominating Committee, KPMG LLP |
37 INVESCO OPPENHEIMER V.I. TOTAL RETURN BOND FUND
TRUSTEES AND OFFICERSContinued
| | | | | | | | |
| | | | | |
Name, Year of Birth and Position(s) Held with the Trust | | Trustee and/or Officer Since | | Principal Occupation(s) During Past 5 Years | | Number of Funds in Fund Complex
Overseen by Trustee | | Other Directorship(s) Held by Trustee During Past
5 Years |
INDEPENDENT TRUSTEES (CONTINUED) | | | | | | | | |
| | | | | |
Prema Mathai-Davis – 1950 Trustee | | 2003 | | Retired Co-Owner & Partner of Quantalytics Research, LLC, (a FinTech Investment Research Platform for the Self-Directed Investor) | | 229 | | None |
| | | | | |
Joel W. Motley – 1952 Trustee | | 2019 | | Director of Office of Finance, Federal Home Loan Bank; Member of the Vestry of Trinity Wall Street; Managing Director of Carmona Motley Hoffman, Inc. (privately held financial advisor); Member of the Finance and Budget Committee of the Council on Foreign Relations, Member of the Investment Committee and Board of Human Rights Watch and Member of the Investment Committee and Board of Historic Hudson Valley(non-profit cultural organization). Formerly: Managing Director of Public Capital Advisors, LLC (privately held financial advisor); Managing Director of Carmona Motley Hoffman, Inc. (privately held financial advisor); Trustee of certain Oppenheimer Funds; and Director of Columbia Equity Financial Corp. (privately held financial advisor) | | 229 | | Director of Greenwall Foundation (bioethics research foundation); Member of Board and Investment Committee of The Greenwall Foundation; Director of Southern Africa Legal Services Foundation; Board Member and Investment Committee Member of Pulitzer Center for Crisis Reporting(non-profit journalism) |
| | | | | |
Teresa M. Ressel – 1962 Trustee | | 2017 | | Non-executive director and trustee of a number of public and private business corporations Formerly: Chief Financial Officer, Olayan America, The Olayan Group (international investor/commercial/industrial); Chief Executive Officer, UBS Securities LLC; Group Chief Operating Officer, Americas, UBS AG; Assistant Secretary for Management & Budget and CFO, US Department of the Treasury | | 229 | | Atlantic Power Corporation (power generation company); ON Semiconductor Corp. (semiconductor supplier) |
| | | | | |
Ann Barnett Stern – 1957 Trustee | | 2017 | | President and Chief Executive Officer, Houston Endowment Inc. (private philanthropic institution) Formerly: Executive Vice President and General Counsel, Texas Children’s Hospital; Attorney, Beck, Redden and Secrest, LLP; Business Law Instructor, University of St. Thomas; Attorney, Andrews & Kurth LLP | | 229 | | Federal Reserve Bank of Dallas |
| | | | | |
Robert C. Troccoli – 1949 Trustee | | 2016 | | Retired Formerly: Adjunct Professor, University of Denver – Daniels College of Business, Senior Partner, KPMG LLP | | 229 | | None |
| | | | | |
Daniel S. Vandivort – 1954 Trustee | | 2019 | | Treasurer, Chairman of the Audit and Finance Committee, and Trustee, Board of Trustees, Huntington Disease Foundation of America; and President, Flyway Advisory Services LLC (consulting and property management). Formerly: Trustee and Governance Chair, of certain Oppenheimer Funds | | 229 | | Chairman and Lead Independent Director, Chairman of the Audit Committee, and Director, Board of Directors, Value Line Funds |
| | | | | |
James D. Vaughn – 1945 Trustee | | 2019 | | Retired Formerly: Managing Partner, Deloitte & Touche LLP; Trustee and Chairman of the Audit Committee, Schroder Funds; Board Member, Mile High United Way, Boys and Girls Clubs, Boy Scouts, Colorado Business Committee for the Arts, Economic Club of Colorado and Metro Denver Network (economic development corporation); and Trustee of certain Oppenheimer Funds | | 229 | | Board member and Chairman of Audit Committee of AMG National Trust Bank; Trustee and Investment Committee member, University of South Dakota Foundation; Board member, Audit Committee Member and past Board Chair, Junior Achievement(non-profit) |
| | | | | |
Christopher L. Wilson – 1957 Trustee, Vice Chair and Chair Designate | | 2017 | | Retired Formerly: Director, TD Asset Management USA Inc. (mutual fund complex) (22 portfolios); Managing Partner, CT2, LLC (investing and consulting firm); President/Chief Executive Officer, Columbia Funds, Bank of America Corporation; President/Chief Executive Officer, CDC IXIS Asset Management Services, Inc.; Principal & Director of Operations, Scudder Funds, Scudder, Stevens & Clark, Inc.; Assistant Vice President, Fidelity Investments | | 229 | | ISO New England, Inc.(non-profit organization managing regional electricity market) |
38 INVESCO OPPENHEIMER V.I. TOTAL RETURN BOND FUND
| | | | | | | | |
| | | | | |
Name, Year of Birth and Position(s) Held with the Trust | | Trustee and/or Officer Since | | Principal Occupation(s) During Past 5 Years | | Number of Funds in Fund Complex
Overseen by Trustee | | Other Directorship(s) Held by Trustee During Past
5 Years |
OTHER OFFICERS | | | | | | | | |
| | | | | |
Sheri Morris – 1964 President, Principal Executive Officer and Treasurer | | 2003 | | Head of Global Fund Services, Invesco Ltd.; President, Principal Executive Officer and Treasurer, The Invesco Funds; Vice President, Invesco Advisers, Inc. (formerly known as Invesco Institutional (N.A.), Inc.) (registered investment adviser); and Vice President, Invesco Exchange-Traded Fund Trust, InvescoExchange-Traded Fund Trust II, Invesco India Exchange-Traded Fund Trust, Invesco Actively Managed Exchange-Traded Fund Trust, Invesco Actively Managed Exchange-Traded Commodity Fund Trust and Invesco Exchange-Traded Self-Indexed Fund Trust, and Vice President, OppenheimerFunds, Inc. Formerly: Vice President and Principal Financial Officer, The Invesco Funds; Vice President, Invesco AIM Advisers, Inc., Invesco AIM Capital Management, Inc. and Invesco AIM Private Asset Management, Inc.; Assistant Vice President and Assistant Treasurer, The Invesco Funds and Assistant Vice President, Invesco Advisers, Inc., Invesco AIM Capital Management, Inc. and Invesco AIM Private Asset Management, Inc.; and Treasurer, Invesco Exchange-Traded Fund Trust, Invesco Exchange-Traded Fund Trust II, Invesco India Exchange-Traded Fund Trust and Invesco Actively Managed Exchange-Traded Fund Trust | | N/A | | N/A |
| | | | | |
Russell C. Burk – 1958 Senior Vice President and Senior Officer | | 2005 | | Senior Vice President and Senior Officer, The Invesco Funds | | N/A | | N/A |
| | | | | |
Jeffrey H. Kupor – 1968 Senior Vice President, Chief Legal Officer and Secretary | | 2018 | | Head of Legal of the Americas, Invesco Ltd.; Senior Vice President and Secretary, Invesco Advisers, Inc. (formerly known as Invesco Institutional (N.A.), Inc.) (registered investment adviser); Senior Vice President and Secretary, Invesco Distributors, Inc. (formerly known as Invesco AIM Distributors, Inc.); Vice President and Secretary, Invesco Investment Services, Inc. (formerly known as Invesco AIM Investment Services, Inc.) Senior Vice President, Chief Legal Officer and Secretary, The Invesco Funds; Secretary and General Counsel, Invesco Investment Advisers LLC (formerly known as Van Kampen Asset Management); Secretary and General Counsel, Invesco Capital Markets, Inc. (formerly known as Van Kampen Funds Inc.) and Chief Legal Officer, InvescoExchange-Traded Fund Trust, Invesco Exchange-Traded Fund Trust II, Invesco India Exchange-Traded Fund Trust, Invesco Actively ManagedExchange-Traded Fund Trust, Invesco Actively Managed Exchange-Traded Commodity Fund Trust and Invesco Exchange-Traded Self-Indexed Fund Trust; Secretary, Invesco Indexing LLC; Secretary, W.L. Ross & Co., LLC Formerly: Secretary and Vice President, Jemstep, Inc.; Head of Legal, Worldwide Institutional, Invesco Ltd.; Secretary and General Counsel, INVESCO Private Capital Investments, Inc.; Senior Vice President, Secretary and General Counsel, Invesco Management Group, Inc. (formerly known as Invesco AIM Management Group, Inc.); Assistant Secretary, INVESCO Asset Management (Bermuda) Ltd.; Secretary and General Counsel, Invesco Private Capital, Inc.; Assistant Secretary and General Counsel, INVESCO Realty, Inc.; Secretary and General Counsel, Invesco Senior Secured Management, Inc.; and Secretary, Sovereign G./P. Holdings Inc. | | N/A | | N/A |
| | | | | |
Andrew R. Schlossberg – 1974 Senior Vice President | | 2019 | | Head of the Americas and Senior Managing Director, Invesco Ltd.; Director and Senior Vice President, Invesco Advisers, Inc. (formerly known as Invesco Institutional (N.A.), Inc.) (registered investment adviser); Director and Chairman, Invesco Investment Services, Inc. (formerly known as Invesco AIM Investment Services, Inc.) (registered transfer agent); Senior Vice President, The Invesco Funds; Director, Invesco Investment Advisers LLC (formerly known as Van Kampen Asset Management); Director, President and Chairman, Invesco Insurance Agency, Inc. Formerly: Director, Invesco UK Limited; Director and Chief Executive, Invesco Asset Management Limited and Invesco Fund Managers Limited; Assistant Vice President, The Invesco Funds; Senior Vice President, Invesco Advisers, Inc. (formerly known as Invesco Institutional (N.A.), Inc.) (registered investment adviser); Director and Chief Executive, Invesco Administration Services Limited and Invesco Global Investment Funds Limited; Director, Invesco Distributors, Inc.; Head of EMEA, Invesco Ltd.; President, Invesco Actively ManagedExchange-Traded Commodity Fund Trust, Invesco Actively Managed Exchange-Traded Fund Trust, InvescoExchange-Traded Fund Trust, InvescoExchange-Traded Fund Trust II and Invesco India Exchange-Traded Fund Trust; Managing Director and Principal Executive Officer, Invesco Capital Management LLC | | N/A | | N/A |
39 INVESCO OPPENHEIMER V.I. TOTAL RETURN BOND FUND
TRUSTEES AND OFFICERSContinued
| | | | | | | | |
| | | | | |
Name, Year of Birth and Position(s) Held with the Trust | | Trustee and/or Officer Since | | Principal Occupation(s) During Past 5 Years | | Number of Funds in Fund Complex
Overseen by Trustee | | Other Directorship(s) Held by Trustee During Past
5 Years |
OTHER OFFICERS (CONTINUED) | | | | | | | | |
| | | | | |
John M. Zerr – 1962 Senior Vice President | | 2006 | | Chief Operating Officer of the Americas; Senior Vice President, Invesco Advisers, Inc. (formerly known as Invesco Institutional (N.A.), Inc.) (registered investment adviser); Senior Vice President, Invesco Distributors, Inc. (formerly known as Invesco AIM Distributors, Inc.); Director and Vice President, Invesco Investment Services, Inc. (formerly known as Invesco AIM Investment Services, Inc.) Senior Vice President, The Invesco Funds; Managing Director, Invesco Capital Management LLC; Director, Invesco Investment Advisers LLC (formerly known as Van Kampen Asset Management); Senior Vice President, Invesco Capital Markets, Inc. (formerly known as Van Kampen Funds Inc.); Manager, Invesco Indexing LLC; Manager, Invesco Specialized Products, LLC; Director and Senior Vice President, Invesco Insurance Agency, Inc.; Member, Invesco Canada Funds Advisory Board; Director, President and Chief Executive Officer, Invesco Corporate Class Inc. (corporate mutual fund company); and Director, Chairman, President and Chief Executive Officer, Invesco Canada Ltd. (formerly known as Invesco Trimark Ltd./Invesco Trimark Ltèe) (registered investment adviser and registered transfer agent) Formerly: Director and Senior Vice President, Invesco Management Group, Inc. (formerly known as Invesco AIM Management Group, Inc.); Secretary and General Counsel, Invesco Management Group, Inc. (formerly known as Invesco AIM Management Group, Inc.); Secretary, Invesco Investment Services, Inc. (formerly known as Invesco AIM Investment Services, Inc.); Chief Legal Officer and Secretary, The Invesco Funds; Secretary and General Counsel, Invesco Investment Advisers LLC (formerly known as Van Kampen Asset Management); Secretary and General Counsel, Invesco Capital Markets, Inc. (formerly known as Van Kampen Funds Inc.); Chief Legal Officer, Invesco Exchange-Traded Fund Trust, Invesco Exchange-Traded Fund Trust II, Invesco India Exchange-Traded Fund Trust, Invesco Actively Managed Exchange-Traded Fund Trust, Invesco Actively Managed Exchange-Traded Commodity Fund Trust and Invesco Exchange-Traded Self-Indexed Fund Trust; Secretary, Invesco Indexing LLC; Director, Secretary, General Counsel and Senior Vice President, Van Kampen Exchange Corp.; Director, Vice President and Secretary, IVZ Distributors, Inc. (formerly known as INVESCO Distributors, Inc.); Director and Vice President, INVESCO Funds Group, Inc.; Director and Vice President, Van Kampen Advisors Inc.; Director, Vice President, Secretary and General Counsel, Van Kampen Investor Services Inc.; Director and Secretary, Invesco Distributors, Inc. (formerly known as Invesco AIM Distributors, Inc.); Director, Senior Vice President, General Counsel and Secretary, Invesco AIM Advisers, Inc. and Van Kampen Investments Inc.; Director, Vice President and Secretary, Fund Management Company; Director, Senior Vice President, Secretary, General Counsel and Vice President, Invesco AIM Capital Management, Inc.; Chief Operating Officer and General Counsel, Liberty Ridge Capital, Inc. (an investment adviser) | | N/A | | N/A |
| | | | | |
Gregory G. McGreevey – 1962 Senior Vice President | | 2012 | | Senior Managing Director, Invesco Ltd.; Director, Chairman, President, and Chief Executive Officer, Invesco Advisers, Inc. (formerly known as Invesco Institutional (N.A.), Inc.) (registered investment adviser); Director, Invesco Mortgage Capital, Inc. and Invesco Senior Secured Management, Inc.; and Senior Vice President, The Invesco Funds; and President, SNW Asset Management Corporation Formerly: Senior Vice President, Invesco Management Group, Inc. and Invesco Advisers, Inc.; Assistant Vice President, The Invesco Funds | | N/A | | N/A |
| | | | | |
Kelli Gallegos – 1970 Vice President, Principal Financial Officer and Assistant Treasurer | | 2008 | | Principal Financial and Accounting Officer – Investments Pool, Invesco Specialized Products, LLC; Vice President, Principal Financial Officer and Assistant Treasurer, The Invesco Funds; Principal Financial and Accounting Officer – Pooled Investments, Invesco Capital Management LLC; Vice President and Treasurer, Invesco Exchange-Traded Fund Trust, Invesco Exchange-Traded Fund Trust II, Invesco India Exchange-Traded Fund Trust, Invesco Actively Managed Exchange-Traded Fund Trust, Invesco Actively Managed Exchange-Traded Commodity Fund Trust and Invesco Exchange-Traded Self-Indexed Fund Trust Formerly: Assistant Treasurer, Invesco Specialized Products, LLC; Assistant Treasurer, InvescoExchange-Traded Fund Trust, InvescoExchange-Traded Fund Trust II, Invesco India Exchange-Traded Fund Trust, Invesco Actively Managed Exchange-Traded Fund Trust, Invesco Actively Managed Exchange-Traded Commodity Fund Trust and Invesco Exchange-Traded Self-Indexed Fund Trust; Assistant Treasurer, Invesco Capital Management LLC; Assistant Vice President, The Invesco Funds | | N/A | | N/A |
40 INVESCO OPPENHEIMER V.I. TOTAL RETURN BOND FUND
| | | | | | | | |
| | | | | |
Name, Year of Birth and Position(s) Held with the Trust | | Trustee and/or Officer Since | | Principal Occupation(s) During Past 5 Years | | Number of Funds in Fund Complex
Overseen by Trustee | | Other Directorship(s) Held by Trustee During Past
5 Years |
OTHER OFFICERS (CONTINUED) | | | | | | | | |
| | | | | |
Crissie M. Wisdom – 1969 Anti-Money Laundering Compliance Officer | | 2013 | | Anti-Money Laundering Compliance Officer, Invesco Advisers, Inc. (formerly known as Invesco Institutional (N.A.), Inc.) (registered investment adviser), Invesco Capital Markets, Inc. (formerly known as Van Kampen Funds Inc.), Invesco Distributors, Inc., Invesco Investment Services, Inc., The Invesco Funds, and Invesco Exchange-Traded Fund Trust, Invesco Exchange-Traded Fund Trust II, Invesco India Exchange-Traded Fund Trust, Invesco Actively Managed Exchange-Traded Fund Trust, Invesco Actively Managed Exchange-Traded Commodity Fund Trust and Invesco Exchange-Traded Self-Indexed Fund Trust; Anti-Money Laundering Compliance Officer and Bank Secrecy Act Officer, INVESCO National Trust Company and Invesco Trust Company; and Fraud Prevention Manager and Controls and Risk Analysis Manager for Invesco Investment Services, Inc. Formerly: Anti-Money Laundering Compliance Officer, Van Kampen Exchange Corp. and Invesco Management Group, Inc. | | N/A | | N/A |
| | | | | |
Robert R. Leveille – 1969 Chief Compliance Officer | | 2016 | | Chief Compliance Officer, Invesco Advisers, Inc. (registered investment adviser); and Chief Compliance Officer, The Invesco Funds Formerly: Chief Compliance Officer, Putnam Investments and the Putnam Funds | | N/A | | N/A |
The Statement of Additional Information of the Trust includes additional information about the Fund’s Trustees and is available upon request, without charge, by calling 1.800.959.4246. Please refer to the Fund’s Statement of Additional Information for information on the Fund’ssub-advisers.
| | | | | | |
| Office of the Fund | | Investment Adviser | | Distributor | | Auditors |
11 Greenway Plaza, Suite 1000 Houston, TX 77046-1173 | | Invesco Advisers, Inc. 1555 Peachtree Street, N.E. Atlanta, GA 30309 | | Invesco Distributors, Inc. 11 Greenway Plaza, Suite 1000 Houston, TX 77046-1173 | | PricewaterhouseCoopers LLP 1000 Louisiana Street, Suite 5800 Houston, TX 77002-5021 |
| | | |
| Counsel to the Fund | | Counsel to the | | Transfer Agent | | Custodian |
Stradley Ronon Stevens & Young, LLP 2005 Market Street, Suite 2600 Philadelphia, PA 19103-7018 | | Independent Trustees Goodwin Procter LLP 901 New York Avenue, N.W. Washington, D.C. 20001 | | Invesco Investment Services, Inc. 11 Greenway Plaza, Suite 1000 Houston, TX 77046-1173 | | JPMorgan Chase Bank 4 Chase Metro Tech Center Brooklyn, NY 11245 |
41 INVESCO OPPENHEIMER V.I. TOTAL RETURN BOND FUND
THIS PAGE INTENTIONALLY LEFT BLANK.
THIS PAGE INTENTIONALLY LEFT BLANK.

There were no amendments to the Code of Ethics (the “Code”) that applies to the Registrant’s Principal Executive Officer (“PEO”) and Principal Financial Officer (“PFO”) during the period covered by the report. The Registrant did not grant any waivers, including implicit waivers, from any provisions of the Code to the PEO or PFO during the period covered by this report.
| ITEM 3. | AUDIT COMMITTEE FINANCIAL EXPERT. |
The Board of Trustees has determined that the Registrant has at least one audit committee financial expert serving on its Audit Committee. The Audit Committee financial experts are David C. Arch, Bruce L. Crockett, Cynthia Hostetler, Elizabeth Krentzman, Anthony J. LaCava, Jr., Teresa M. Ressel, Jr. Robert C. Troccoli and James Vaughn. David C. Arch, Bruce L. Crockett, Cynthia Hostetler, Elizabeth Krentzman, Anthony J. LaCava, Jr., Teresa M. Ressel, Jr. Robert C. Troccoli and James Vaughn are “independent” within the meaning of that term as used in FormN-CSR.
| ITEM 4. | PRINCIPAL ACCOUNTANT FEES AND SERVICES. |
During the reporting period, PricewaterhouseCoopers LLC (“PwC”) advised the Audit Committee of the following matters for consideration under the SEC’s auditor independence rules. PwC advised the Audit Committee that a PwC Director, a PwC Manager and a PwC Senior Associate each held financial interests in investment companies within the Invesco Fund Complex that were inconsistent with the requirements of Rule2-01(c)(1) of RegulationS-X. PwC noted, among other things, that during the time of its audit, the engagement team was not aware of the investments, (or with respect to the PwC Senior Associate was not aware until after the investments were confirmed as SEC exceptions), the individuals were not in the chain of command of the audit or the audit partners of Invesco or the affiliate of the Registrant, the services each individual provided were not relied upon by the audit engagement team with respect to the audit of the Registrant or its affiliates (or with respect to the PwC Senior Associate, the services were performed by an individual who did not have decision-making responsibility for matters that materially affected the audit and were reviewed by team members at least two levels higher than the PwC Senior Associate), and the investments were not material to the net worth of each individual or their respective immediate family members which PwC considered in reaching its conclusion. PwC advised the Audit Committee that it believes its objectivity and impartiality had not been adversely affected by these matters as they related to the audit of the Registrant.
On May 24, 2019, certain investment advisor subsidiaries of Invesco Ltd. assumed management responsibility from Oppenheimer Funds, Inc. (“OFI”) for 83open-end mutual funds and 20 exchange-traded funds (collectively, the “Oppenheimer Funds”). Assumption of management responsibility for the Oppenheimer Funds was accomplished through the reorganization of each Oppenheimer Fund into a new Invesco shell fund (collectively, the “New Invesco Funds”) that did not havepre-existing assets (together, the “Reorganizations”). The Reorganizations were part of the acquisition by Invesco Ltd. (together with its subsidiaries, “Invesco”) of the asset management business of OFI (including the Oppenheimer Funds) from Massachusetts Mutual Life Insurance Company (“MassMutual”), which was also consummated on May 24, 2019 (the “Acquisition”). Subsequent to the Acquisition, MassMutual became a significant shareholder of Invesco, and the Invesco Ltd. board of directors expanded by one director with the addition of a director selected by MassMutual.
Prior to the consummation of the Acquisition and the Reorganizations on May 24, 2019, PwC completed an independence assessment to evaluate the services and relationships with OFI and its affiliates, which became affiliates of Invesco upon the closing of the Acquisition. The assessment identified the following relationship and services that are inconsistent with the auditor independence rules under Rule2-01 of RegulationS-X (“Rule2-01”) if provided to an affiliate of an audit client. A retired PwC partner who receives a benefit from PwC that is not fully funded, served as a member of Audit Committee of the Boards of Trustees of certain Oppenheimer Funds prior to the Acquisition (the“Pre-Reorganization Relationship”).
Additionally, PwC provided certainnon-audit services including, expert legal services to one Oppenheimer Fund, custody of client assets in connection with payroll services, anon-audit service performed pursuant to a success-based fee,non-audit services in which PwC acted as an advocate on behalf of a MassMutual foreign affiliate and certain employee activities undertaken in connection with the provision ofnon-audit services for MassMutual and certain MassMutual foreign affiliates (collectively, the“Pre-Reorganization Services”).
PwC and the Audit Committees of the New Invesco Funds each considered the impact that thePre-Reorganization Relationship and Services have on PwC’s independence with respect to the New Invesco Funds. On the basis of the nature of the relationship and services performed, and in particular the mitigating factors described below, PwC concluded that a reasonable investor, possessing knowledge of all the relevant facts and circumstances regarding thePre-Reorganization Relationship and Services, would conclude that thePre-Reorganization Relationship and Services do not impair PwC’s ability to exhibit the requisite objectivity and impartiality to report on the financial statements of the New Invesco Funds for the years ending May 31, 2019 – April 30, 2020 (“PwC’s Conclusion”).
The Audit Committees of the Boards of Trustees of the New Invesco Funds, based upon PwC’s Conclusion and the concurrence of Invesco, considered the relevant facts and circumstances including the mitigating factors described below and, after careful consideration, concluded that PwC is capable of exercising objective and impartial judgment in connection with its audits of the financial statements of the New Invesco Funds that the respective Boards of Trustees oversee.
Mitigating factors that PwC and the Audit Committees considered in reaching their respective conclusions included, among others, the following factors:
| | • | | none of thePre-Reorganization Relationship or Services created a mutuality of interest between PwC and the New Invesco Funds; |
| | • | | PwC will not act in a management or employee capacity for the New Invesco Funds or their affiliates during any portion of PwC’s professional engagement period; |
| | • | | other than the expert legal services,Pre-Reorganization Services that have been provided to OFI, MassMutual and their affiliates do not have any impact on the financial statements of the New Invesco Funds; |
| | • | | as it relates to the expert legal services, while the service provided by PwC related to litigation involving one Oppenheimer Fund, the impact of the litigation on the Oppenheimer Fund’s financial statements was based upon OFI’s decision, and OFI management represented that the PwC service was not considered a significant component of its decision; |
| | • | | while certain employees of OFI who were involved in the financial reporting process of the Oppenheimer Funds will be employed by Invesco subsequent to the Reorganizations, existing officers of other Invesco Funds will serve as Principal Executive Officer and Principal Financial Officer or equivalent roles for the New Invesco Funds, and are ultimately responsible for the accuracy of all financial statement assertions for the entirety of the financial reporting periods for the New Invesco Funds; |
| | • | | thePre-Reorganization Services giving rise to the lack of independence were provided to, or entered into with, OFI, MassMutual and their affiliates at a time when PwC had no independence restriction with respect to these entities; |
| | • | | with the exception of the expert legal service provided to one Oppenheimer Fund, none of thePre-Reorganization Services affected the operations or financial reporting of the New Invesco Funds; |
| | • | | thePre-Reorganization Services provided by PwC to OFI, MassMutual and their affiliates were performed by persons who were not, and will not be, part of the audit engagement team for the New Invesco Funds; and |
| | • | | the fees associated with thePre-Reorganization Services were not material to MassMutual, Invesco or PwC. |
(a) to (d)
Fees Billed by PwC Related to the Registrant
PwC billed the Registrant aggregate fees for services rendered to the Registrant for the last two fiscal years as shown in the following table. The Audit Committee pre-approved all audit and non-audit services provided to the Registrant.
| | | | | | | | |
| | | Fees Billed for Services
Rendered to the Registrant
for fiscal year end 2019 | | | Fees Billed for Services
Rendered to the Registrant for
fiscal year end 2018 | |
Audit Fees | | $ | 977,878 | | | $ | 719,500 | |
Audit-Related Fees | | $ | 0 | | | $ | 0 | |
Tax Fees(1) | | $ | 576,844 | | | $ | 155,473 | |
All Other Fees | | $ | 0 | | | $ | 0 | |
| | | | | | | | |
Total Fees | | $ | 1,554,721 | | | $ | 874,973 | |
| (1) | Tax Fees for the fiscal year end December 31, 2019 includes fees billed for preparation of U.S. Tax Returns and Taxable Income calculations, including excise tax andyear-to-date estimates for variousbook-to-tax differences. Tax Fees for fiscal year end December 31, 2018 includes fees billed for reviewing tax returns and/or services related to tax compliance. |
Fees Billed by PwC Related to Invesco and Invesco Affiliates
PwC billed Invesco Advisers, Inc. (“Invesco”), the Registrant’s adviser, and any entity controlling, controlled by or under common control with Invesco that provides ongoing services to the Registrant (“Invesco Affiliates”) aggregate fees forpre-approvednon-audit services rendered to Invesco and Invesco Affiliates for the last two fiscal years as shown in the following table. The Audit Committee pre-approved all non-audit services provided to Invesco and Invesco Affiliates that were required to be pre-approved.
| | | | | | | | |
| | | Fees Billed for Non-Audit Services
Rendered to Invesco and Invesco
Affiliates for fiscal year end 2019
That Were Required
to bePre-Approved
by the Registrant’s
Audit Committee | | | Fees Billed forNon-Audit Services
Rendered to Invesco and Invesco
Affiliates for fiscal year end 2018 That
Were Required
to bePre-Approved
by the Registrant’s
Audit Committee | |
Audit-Related Fees(1) | | $ | 690,000 | | | $ | 690,000 | |
Tax Fees | | $ | 0 | | | $ | 0 | |
All Other Fees | | $ | 0 | | | $ | 0 | |
| | | | | | | | |
Total Fees | | $ | 690,000 | | | $ | 690,000 | |
| (1) | Audit-Related Fees for the fiscal years ended 2019 and 2018 include fees billed related to reviewing controls at a service organization. |
(e)(1)
PRE-APPROVAL OF AUDIT ANDNON-AUDIT SERVICES
POLICIES AND PROCEDURES
As adopted by the Audit Committees
of the Invesco Funds (the “Funds”)
Last Amended March 29, 2017
| | I. | Statement of Principles |
The Audit Committees (the “Audit Committee”) of the Boards of Trustees of the Funds (the “Board”) have adopted these policies and procedures (the “Procedures”) with respect to thepre-approval of audit andnon-audit services to be provided by the Funds’ independent auditor (the “Auditor”) to the Funds, and to the Funds’ investment adviser(s) and any entity controlling, controlled by, or under common control with the investment adviser(s) that provides ongoing services to the Funds (collectively, “Service Affiliates”).
Under Section 202 of the Sarbanes-Oxley Act of 2002, all audit andnon-audit services provided to the Funds by the Auditor must be preapproved by the Audit Committee. Rule2-01 of RegulationS-X requires that the Audit Committee alsopre-approve a Service Affiliate’s engagement of the Auditor fornon-audit services if the engagement relates directly to the operations and financial reporting of the Funds (a “Service Affiliate’s Covered Engagement”).
These Procedures set forth the procedures and the conditions pursuant to which the Audit Committee maypre-approve audit andnon-audit services for the Funds and a Service Affiliate’s Covered Engagement pursuant to rules and regulations of the Securities and Exchange Commission (“SEC”) and other organizations and regulatory bodies applicable to the Funds (“Applicable Rules”).1 They address both generalpre-approvals without consideration of specificcase-by-case services (“general pre-approvals”) and pre-approvals on acase-by-case basis (“specific pre-approvals”). Any services requiringpre-approval that are not within the scope of generalpre-approvals hereunder are subject to specificpre-approval. These Procedures also address the delegation by the Audit Committee ofpre-approval authority to the Audit Committee Chair or Vice Chair.
| | II. | Pre-Approval of Fund Audit Services |
The annual Fund audit services engagement, including terms and fees, is subject to specificpre-approval by the Audit Committee. Audit services include the annual financial statement audit and other procedures required to be performed by an independent auditor to be able to form an opinion on the Funds’ financial statements. The Audit Committee will receive, review and consider sufficient information concerning a proposed Fund audit engagement to make a reasonable evaluation of the Auditor’s qualifications and independence. The Audit Committee will oversee the Fund audit services engagement as necessary, including approving any changes in terms, audit scope, conditions and fees.
In addition to approving the Fund audit services engagement at least annually and specifically approving any changes, the Audit Committee may generally or specificallypre-approve
| 1 | Applicable Rules include, for example, New York Stock Exchange (“NYSE”) rules applicable toclosed-end funds managed by Invesco and listed on NYSE. |
engagements for other audit services, which are those services that only an independent auditor reasonably can provide. Other audit services may include services associated with SEC registration statements, periodic reports and other documents filed with the SEC.
| | III. | General and SpecificPre-Approval ofNon-Audit Fund Services |
The Audit Committee will consider, at least annually, the list of GeneralPre-ApprovedNon-Audit Services which list may be terminated or modified at any time by the Audit Committee. To inform the Audit Committee’s review and approval of GeneralPre-ApprovedNon-Audit Services, the Funds’ Treasurer (or his or her designee) and Auditor shall provide such information regarding independence or other matters as the Audit Committee may request.
Any services or fee ranges that are not within the scope of GeneralPre-ApprovedNon-Audit Services have not received generalpre-approval and require specificpre-approval. Each request for specificpre-approval by the Audit Committee for services to be provided by the Auditor to the Funds must be submitted to the Audit Committee by the Funds’ Treasurer (or his or her designee)and must include detailed information about the services to be provided, the fees or fee ranges to be charged, and other relevant information sufficient to allow the Audit Committee to consider whether topre-approve such engagement, including evaluating whether the provision of such services will impair the independence of the Auditor and is otherwise consistent with Applicable Rules.
| | IV. | Non-Audit Service Types |
The Audit Committee may provide either general or specificpre-approval of audit-related, tax or other services, each as described in more detail below.
“Audit-related services” are assurance and related services that are reasonably related to the performance of the audit or review of the Fund’s financial statements or that are traditionally performed by an independent auditor. Audit-related services include, among others, accounting consultations related to accounting, financial reporting or disclosure matters not classified as “Audit services”; assistance with understanding and implementing new accounting and financial reporting guidance from rulemaking authorities; services related to mergers, acquisitions or dispositions; compliance with ratings agency requirements and interfund lending activities; and assistance with internal control reporting requirements.
“Tax services” include, but are not limited to, the review and signing of the Funds’ federal tax returns, the review of required distributions by the Funds and consultations regarding tax matters such as the tax treatment of new investments or the impact of new regulations. The Audit Committee will not approve proposed services of the Auditor which the Audit Committee believes are to be provided in connection with a service or transaction initially recommended by the Auditor, the sole business purpose of which may be tax avoidance and the tax treatment of which may not be supported in the Internal Revenue Code and related regulations. The Audit Committee will consult with the Funds’ Treasurer (or his or her designee) and may consult with outside counsel or advisers as necessary to ensure the consistency of tax services rendered by the Auditor with the foregoing policy. The Auditor shall not represent any Fund or any Service Affiliate before a tax court, district court or federal court of claims.
Each request to provide tax services under either the general or specificpre-approval of the Audit Committee will include a description from the Auditor in writing of (i) the scope of the service,
the fee structure for the engagement, and any side letter or other amendment to the engagement letter, or any other agreement (whether oral, written, or otherwise) between the Auditor and the Funds, relating to the service; and (ii) any compensation arrangement or other agreement, such as a referral agreement, a referral fee orfee-sharing arrangement, between the Auditor (or an affiliate of the Auditor) and any person (other than the Funds or Service Affiliates receiving the services) with respect to the promoting, marketing, or recommending of a transaction covered by the service. The Auditor will also discuss with the Audit Committee the potential effects of the services on the independence of the Auditor, and document the substance of its discussion with the Audit Committee.
The Audit Committee maypre-approve other non-audit services so long as the Audit Committee believes that the service will not impair the independence of the Auditor.Appendix I includes a list of services that the Auditor is prohibited from performing by the SEC rules.Appendix I also includes a list of services that would impair the Auditor’s independence unless the Audit Committee reasonably concludes that the results of the services will not be subject to audit procedures during an audit of the Funds’ financial statements.
| | V. | Pre-Approval of Service Affiliate’s Covered Engagements |
Rule2-01 of RegulationS-X requires that the Audit Committeepre-approve a Service Affiliate’s engagement of the Auditor fornon-audit services if the engagement relates directly to the operations and financial reporting of the Funds, defined above as a “Service Affiliate’s Covered Engagement”.
The Audit Committee may provide either general or specificpre-approval of any Service Affiliate’s Covered Engagement, including for audit-related, tax or other services, as described above, if the Audit Committee believes that the provision of the services to a Service Affiliate will not impair the independence of the Auditor with respect to the Funds. Any Service Affiliate’s Covered Engagements that are not within the scope of GeneralPre-ApprovedNon-Audit Services have not received generalpre-approval and require specificpre-approval.
Each request for specificpre-approval by the Audit Committee of a Service Affiliate’s Covered Engagement must be submitted to the Audit Committee by the Funds’ Treasurer (or his or her designee)and must include detailed information about the services to be provided, the fees or fee ranges to be charged, a description of the current status of thepre-approval process involving other audit committees in the Invesco investment company complex (as defined in Rule2-201 of RegulationS-X) with respect to the proposed engagement, and other relevant information sufficient to allow the Audit Committee to consider whether the provision of such services will impair the independence of the Auditor from the Funds. Additionally, the Funds’ Treasurer (or his or her designee) and the Auditor will provide the Audit Committee with a statement that the proposed engagement requirespre-approval by the Audit Committee, the proposed engagement, in their view, will not impair the independence of the Auditor and is consistent with Applicable Rules, and the description of the proposed engagement provided to the Audit Committee is consistent with that presented to or approved by the Invesco audit committee.
Information about all Service Affiliate engagements of the Auditor fornon-audit services, whether or not subject topre-approval by the Audit Committee, shall be provided to the Audit Committee
at least quarterly, to allow the Audit Committee to consider whether the provision of such services is compatible with maintaining the Auditor’s independence from the Funds. The Funds’ Treasurer and Auditor shall provide the Audit Committee with sufficiently detailed information about the scope of services provided and the fees for such services, to ensure that the Audit Committee can adequately consider whether the provision of such services is compatible with maintaining the Auditor’s independence from the Funds.
| | VI. | Pre-Approved Fee Levels or Established Amounts |
Pre-approved fee levels or ranges for audit andnon-audit services to be provided by the Auditor to the Funds, and for a Service Affiliate’s Covered Engagement, under generalpre-approval or specificpre-approval will be set periodically by the Audit Committee. Any proposed fees exceeding 110% of the maximumpre-approved fee levels or ranges for such services or engagements will be promptly presented to the Audit Committee and will require specificpre-approval by the Audit Committee before payment of any additional fees is made.
The Audit Committee hereby delegates, subject to the dollar limitations set forth below, specific authority to its Chair, or in his or her absence, Vice Chair, topre-approve audit andnon-audit services proposed to be provided by the Auditor to the Funds and/or a Service Affiliate’s Covered Engagement, between Audit Committee meetings. Such delegation does not preclude the Chair or Vice Chair from declining, on a case by case basis, to exercise his or her delegated authority and instead convening the Audit Committee to consider andpre-approve any proposed services or engagements.
Notwithstanding the foregoing, the Audit Committee mustpre-approve: (a) anynon-audit services to be provided to the Funds for which the fees are estimated to exceed $500,000; (b) any Service Affiliate’s Covered Engagement for which the fees are estimated to exceed $500,000; or (c) any cost increase to any previously approved service or engagement that exceeds the greater of $250,000 or 50% of the previously approved fees up to a maximum increase of $500,000.
| | VIII. | Compliance with Procedures |
Notwithstanding anything herein to the contrary, failure topre-approve any services or engagements that are not required to bepre-approved pursuant to the de minimis exception provided for in Rule2-01(c)(7)(i)(C) of RegulationS-X shall not constitute a violation of these Procedures. The Audit Committee has designated the Funds’ Treasurer to ensure services and engagements arepre-approved in compliance with these Procedures. The Funds’ Treasurer will immediately report to the Chair of the Audit Committee, or the Vice Chair in his or her absence, any breach of these Procedures that comes to the attention of the Funds’ Treasurer or any services or engagements that are not required to bepre-approved pursuant to the de minimis exception provided for in Rule2-01(c)(7)(i)(C) of RegulationS-X.
On at least an annual basis, the Auditor will provide the Audit Committee with a summary of allnon-audit services provided to any entity in the investment company complex (as defined in section2-01(f)(14) of RegulationS-X, including the Funds and Service Affiliates) that were notpre-approved, including the nature of services provided and the associated fees.
| | IX. | Amendments to Procedures |
All material amendments to these Procedures must be approved in advance by the Audit Committee.Non-material amendments to these Procedures may be made by the Legal and Compliance Departments and will be reported to the Audit Committee at the next regularly scheduled meeting of the Audit Committee.
Appendix I
Non-Audit Services That May Impair the Auditor’s Independence
The Auditor is not independent if, at any point during the audit and professional engagement, the Auditor provides the followingnon-audit services:
| | • | | Broker-dealer, investment adviser, or investment banking services ; |
| | • | | Expert services unrelated to the audit; |
| | • | | Any service or product provided for a contingent fee or a commission; |
| | • | | Services related to marketing, planning, or opining in favor of the tax treatment of confidential transactions or aggressive tax position transactions, a significant purpose of which is tax avoidance; |
| | • | | Tax services for persons in financial reporting oversight roles at the Fund; and |
| | • | | Any other service that the Public Company Oversight Board determines by regulation is impermissible. |
An Auditor is not independent if, at any point during the audit and professional engagement, the Auditor provides the followingnon-audit services unless it is reasonable to conclude that the results of the services will not be subject to audit procedures during an audit of the Funds’ financial statements:
| | • | | Bookkeeping or other services related to the accounting records or financial statements of the audit client; |
| | • | | Financial information systems design and implementation; |
| | • | | Appraisal or valuation services, fairness opinions, orcontribution-in-kind reports; |
| | • | | Actuarial services; and |
| | • | | Internal audit outsourcing services. |
(e)(2) There were no amounts that werepre-approved by the Audit Committee pursuant to the de minimus exception under Rule2-01 of RegulationS-X.
(f) Not applicable.
(g) In addition to the amounts shown in the tables above, PwC billed Invesco and Invesco Affiliates aggregate fees of $4,779,000 for the fiscal year ended December 31, 2019 and $4,240,000 for the fiscal year ended December 31, 2018 for non-audit services not required to be pre-approved by the Registrant’s Audit Committee. In total, PwC billed the Registrant, Invesco and Invesco Affiliates aggregate non-audit fees of $5,355,844 for the fiscal year ended December 31, 2019 and $4,395,473 for the fiscal year ended December 31, 2018.
PwC provided audit services to the Investment Company complex of approximately $34 million.
(h) The Audit Committee also has considered whether the provision ofnon-audit services that were rendered to Invesco and Invesco Affiliates that were not required to bepre-approved pursuant to SEC regulations, if any, is compatible with maintaining PwC’s independence.
| ITEM 5. | AUDIT COMMITTEE OF LISTED REGISTRANTS. |
Not applicable
| ITEM 6. | SCHEDULE OF INVESTMENTS. |
Investments in securities of unaffiliated issuers is included as part of the reports to stockholders filed under Item 1 of this Form.
| ITEM 7. | DISCLOSURE OF PROXY VOTING POLICIES AND PROCEDURES FORCLOSED-END MANAGEMENT INVESTMENT COMPANIES. |
Not applicable.
| ITEM 8. | PORTFOLIO MANAGERS OFCLOSED-END MANAGEMENT COMPANIES. |
Not applicable.
| ITEM 9. | PURCHASES OF EQUITY SECURITIES BYCLOSED-END MANAGEMENT INVESTMENT COMPANY AND AFFILIATED PURCHASERS. |
Not applicable.
| ITEM 10. | SUBMISSION OF MATTERS TO A VOTE OF SECURITY HOLDERS. |
None
| ITEM 11. | CONTROLS AND PROCEDURES. |
| | (a) | As of February 12, 2020, an evaluation was performed under the supervision and with the participation of the officers of the Registrant, including the Principal Executive Officer (“PEO”) and Principal Financial Officer (“PFO”), to assess the effectiveness of the Registrant’s disclosure controls and procedures, as that term is defined in Rule30a-3(c) under the Investment Company Act of 1940 (“Act”), as amended. Based on that evaluation, the Registrant’s officers, including the PEO and PFO, concluded that, as of February 12, 2020, the Registrant’s disclosure controls and procedures were reasonably designed so as to ensure: (1) that information required to be disclosed by the Registrant on FormN-CSR is recorded, processed, summarized and reported within the time periods specified by the rules and forms of the Securities and Exchange Commission; and (2) that material information relating to the Registrant is made known to the PEO and PFO as appropriate to allow timely decisions regarding required disclosure. |
| | (b) | There have been no changes in the Registrant’s internal control over financial reporting (as defined in Rule30a-3(d) under the Act) that occurred during the period covered by this report that have materially affected, or are reasonably likely to materially affect, the Registrant’s internal control over financial reporting. |
| ITEM 12. | DISCLOSURE OF SECURITIES LENDING ACTIVITIES FORCLOSED-END MANAGEMENT INVESTMENT COMPANIES. |
Not applicable
| | |
| 13(a) (1) | | Code of Ethics. |
| |
| 13(a) (2) | | Certifications of principal executive officer and principal financial officer as required by Rule30a-2(a) under the Investment Company Act of 1940. |
| |
| 13(a) (3) | | Not applicable. |
| |
| 13(a) (4) | | Not applicable. |
| |
| 13(b) | | Certifications of principal executive officer and principal financial officer as required by Rule30a-2(b) under the Investment Company Act of 1940. |
SIGNATURES
Pursuant to the requirements of the Securities Exchange Act of 1934 and the Investment Company Act of 1940, the Registrant has duly caused this report to be signed on its behalf by the undersigned, thereunto duly authorized.
Registrant: AIM Variable Insurance Funds (Invesco Variable Insurance Funds)
| | |
| By: | | /s/ Sheri Morris |
| | Sheri Morris |
| | Principal Executive Officer |
| |
| Date: | | February 27, 2020 |
Pursuant to the requirements of the Securities and Exchange Act of 1934 and the Investment Company Act of 1940, this report has been signed below by the following persons on behalf of the Registrant and in the capacities and on the dates indicated.
| | |
| By: | | /s/ Sheri Morris |
| | Sheri Morris |
| | Principal Executive Officer |
| |
| Date: | | February 27, 2020 |
| | |
| By: | | /s/ Kelli Gallegos |
| | Kelli Gallegos |
| | Principal Financial Officer |
| |
| Date: | | February 27, 2020 |