UNITED STATES
SECURITIES AND EXCHANGE COMMISSION
Washington, D.C. 20549
FORM N-CSR
CERTIFIED SHAREHOLDER REPORT OF REGISTERED
MANAGEMENT INVESTMENT COMPANIES
Investment Company Act file number 811-07454
Pacific Capital Funds
(Exact name of registrant as specified in charter)
3435 Stelzer Rd
Columbus, OH 43219
(Address of principal executive offices) (Zip code)
Citi Fund Services
3435 Stelzer Road
Columbus, OH 43219
(Name and address of agent for service)
Registrant’s telephone number, including area code: 614-470-8000
Date of fiscal year end:
7/31
Date of reporting period:
7/31/09
Item 1. Reports to Stockholders.
Table of Contents
Letter to Shareholders
Page 1
Fund Performance Review
Page 3
Statements of Assets and Liabilities
Page 29
Statements of Operations
Page 32
Statements of Changes in Net Assets
Page 35
Schedules of Portfolio Investments
Page 43
Notes to Financial Statements
Page 75
Financial Highlights
Page 89
Report of Independent Registered Public Accounting Firm
Page 101
Additional Tax Information
Page 102
Trustees and Officers
Page 104
Additional Information
Page 107

Dear Shareholders:
Thank you for investing with Pacific Capital Funds. We value the trust you place in us, and we seek to provide world-class investment management to help you meet your financial goals.
Pacific Capital Funds draw upon the investment expertise of the Asset Management Group of Bank of Hawaii (AMG), which has approximately $3.5 billion in mutual fund assets under management. AMG has partnered with a select list of sub-advisors to provide Pacific Capital Funds’ shareholders with greater investment opportunities, broader diversification and access to an elite group of institutional money managers:
| | • | | Chicago Equity Partners, LLC, which specializes in domestic equity markets, serves as Sub-Adviser to the Pacific Capital Mid-Cap Fund, Pacific Capital Growth Stock Fund, Pacific Capital Growth and Income Fund and Pacific Capital Value Fund. |
| | • | | First State Investments International, Limited, a specialist in single-country, regional and sector-specific investments, serves as Sub-Adviser to the Pacific Capital New Asia Growth Fund. |
| | • | | Hansberger Global Investors, Inc., a specialist in international equity investments, serves as Sub-Adviser to the Pacific Capital International Stock Fund. |
| | • | | Nicholas-Applegate Capital Management, which specializes in global, international and domestic equity and special strategy management acts as one of three Sub-Advisers to the Pacific Capital Small Cap Fund, managing the U.S. systematic small cap core portion of the portfolio. |
| | • | | Wellington Management Company, LLP, one of the largest independent investment management firms in the world with more than $550 billion in assets, also serves as a Sub-Adviser to the Pacific Capital Small Cap Fund, managing the small cap growth portion of the portfolio. |
| | • | | Mellon Capital Management Corporation, with more than $200 billion in assets, manages the small cap value portion of the portfolio as the third Sub-Adviser for the Pacific Capital Small Cap Fund. |
Annual Review
The 12-month period between August 2008 and July 2009 coincided with one of the most difficult economic and market environments in U.S. history. A recession that began in December 2007 deepened, exacerbated by a widening credit crisis and accelerated by the failure of several large financial institutions. Spending by consumers and corporations fell, resulting in economic contraction and rising unemployment. The declining economic environment and the prospect of further failures in the financial markets caused investors to shun securities they perceived to be risky, and instead to seek safety in bonds backed by the U.S. government.
The federal government attempted to repair the damaged financial system through several measures, including a dramatic lowering of the Federal Reserve’s target short-term interest rate, the federal funds rate, from 2% to a range between 0% and 0.25%. In addition, a government stimulus package enacted in February aimed to pump money into the economy through a mixture of tax credits and new spending on infrastructure, health care and other items. Government intervention also helped prop up mortgage lenders such as Fannie Mae and Freddie Mac, as well as damaged financial firms such as insurance company AIG.
Meanwhile, investors spooked by companies’ shaky balance sheets and difficult outlooks avoided corporate securities, including stocks and corporate bonds. The financial crisis even affected the normally stable money markets, forcing one prominent money market fund to “break the buck”—that is, to guarantee investors less than one dollar per fund share. That uncertainty in the markets led investors to retreat to Treasury securities, which offered the safety of backing by the U.S. government. The rapid influx of investment money into Treasury securities pushed down the bonds’ yields, to the extent that at one point three-month Treasury bills briefly offered negative yields.
The efforts by the federal government to resuscitate the financial system appeared to take hold in the early part of 2009. The credit markets began to thaw, opening up much-needed funding for corporations and consumers. Gross domestic product1 fell precipitously in the fourth quarter of 2008 and the first quarter of 2009, but declined only modestly in the second quarter. Investors, gaining confidence that the worst of the economic and financial downturn had passed, moved beyond the shelter of U.S. government bonds and back into higher-risk areas of the market, including equities and high-yield and corporate bonds.
The financial markets continued to improve as the period wore on. The housing market appeared to stabilize, while investors’ fear of credit risk dissipated. By the end of the 12-month period, corporate earnings were exceeding expectations and investors continued to seek higher-risk securities that offered greater return potential.
Investors return to equities
Stocks across all sectors and investment styles fell sharply early in the period. But investors re-entered the equity market in the early part of 2009, sparking a significant rally that has continued through the end of the period. During the 12-month period, the S&P 5002 fell -19.96%, while small-cap stocks as measured by the Russell 20002 fell - -20.72%. The MSCI EAFE Index2 of foreign stocks in 21 developed countries lost -22.60%.
| 1 | The Gross Domestic Product (“GDP”) is the measure of the market value of the goods and services produced by labor and property in the United States |
| 2 | The Russell 2000® Index measures the performance of the small-cap segment of the U.S. equity universe. The Russell 2000® Index is a subset of the Russell 3000® Index representing approximately 10% of the total market capitalization of that index. It includes approximately 2000 of the smallest securities based on a combination of their market cap and current index membership. The Standard & Poor’s 500 Index (“S&P 500”) is an index of 500 selected common stocks, most of which are listed on the New York Stock Exchange, and is considered a measure of the U.S. stock market as a whole. The MSCI EAFE Index (Europe, Australasia, Far East) is a free float-adjusted market capitalization index that is designed to measure the equity market performance of developed markets, excluding the US & Canada. As of June 2007 the MSCI EAFE Index consisted of the following 21 developed market country indices: Australia, Austria, Belgium, Denmark, Finland, France, Germany, Greece, Hong Kong, Ireland, Italy, Japan, the Netherlands, New Zealand, Norway, Portugal, Singapore, Spain, Sweden, Switzerland, and the United Kingdom. Investors cannot invest directly in an index. |
| | Past performance does not guarantee future results. The performance data quoted represents past performance and current returns may be lower or higher. The investment return and principal value will fluctuate so that an investor’s shares, when redeemed may be worth more or less than the original cost. To obtain performance information current to the most recent month end, please call 1-800-258-9232, or visit the Funds’ website at pacificcapitalfunds.com. |
1

The credit crisis and recession led to the collapse or sale of Wall Street firms such as Lehman Brothers and Merrill Lynch, while the balance sheets of many companies suffered tremendously. Defensive stocks, such as shares of consumer staples firms, held up best early in the period. Economically cyclical sectors such as consumer discretionary, energy, materials, industrials and information technology suffered during the first months of this fiscal year, but gained back some of those losses later in the period.
Mid-cap stocks led both small- and large-cap stocks in 2009, though large-cap stocks were the top performers for the 12-month period as equity investors earlier in the period sought shares of large and relatively stable firms with strong balance sheets. Small-cap stocks posted significant early losses due in part to their reliance on the credit markets, which were virtually frozen in late 2008. Small caps surged during the market’s rebound, however.
Outside of the U.S., emerging markets performed very poorly early in the period. However, emerging markets—particularly the BRIC countries of Brazil, Russia, India and China—rebounded earlier than domestic equities and rallied strongly through the end of the period. These countries experienced relatively strong economic growth during a period where much of the developed world’s economies were shrinking.
Bond investors seek higher yields
Treasury bonds led the fixed-income markets in 2008. Investors abandoned those securities that carried even a hint of risk in favor of the safety and liquidity of Treasuries. As a result, corporate, agency, mortgage-backed and municipal bonds all underperformed Treasuries early in the period.
Spreads between yields on Treasuries and other types of fixed-income securities widened to historic levels during 2008. Investors in 2009 sought yield by moving out of Treasuries and into other sectors of the fixed-income markets.
Lower-quality bonds significantly underperformed Treasuries early in the period, but then posted very strong gains. High-yield bonds and municipal bonds were the strongest performers during the last seven months of the period, and ended the fiscal year with positive performance for the 12-month period as a whole. Corporate bonds also rallied after a slow start to post positive returns for the period.
Our perspective
We are cautiously optimistic about the current economic environment. We believe we will continue to see better corporate earnings, and expect investors to be more willing to take on investment risk. We believe those factors may potentially drive better performance in both the equity and fixed-income markets.
We would like to take this opportunity to remind investors of the importance of appropriate diversification among asset classes. The markets’ turbulence during the past twelve months underscores the danger of holding all of a portfolio in one type of investment. Proper diversification, based on your particular financial goals and your time frame for reaching them, can help you achieve long-term objectives despite difficult market environments.
Thank you for your confidence in the Pacific Capital Funds. If you have any questions or would like a Fund prospectus, we encourage you to contact your registered investment professional, call Pacific Capital Funds at (800) 258-9232 or visit our website at www.pacificcapitalfunds.com.
Sincerely,

Tobias M. Martyn
Senior Executive Vice President & Chief Investment Officer
Asset Management Group of Bank of Hawaii
The foregoing information and opinions and following management discussions and analysis are for general information only. The Asset Management Group of Bank of Hawaii does not guarantee the accuracy or completeness, nor assume liability for any loss, which may result from the reliance by any person upon any such information or opinions. Such information and opinions are subject to change without notice, are for general information only and are not intended as an offer or solicitation with respect to the purchase or sale of any security or offering of individual or personalized investment advice.
| | Past performance does not guarantee future results. The performance data quoted represents past performance and current returns may be lower or higher. The investment return and principal value will fluctuate so that an investor’s shares, when redeemed may be worth more or less than the original cost. To obtain performance information current to the most recent month end, please call 1-800-258-9232, or visit the Funds’ website at pacificcapitalfunds.com. |
| * | For additional information regarding Fund performance, please refer to the Funds’ commentary section. |
NOTICE ABOUT DUPLICATE MAILINGS
In order to reduce expenses incurred in connection with the mailing of prospectuses, prospectus supplements, semi-annual reports and annual reports to multiple shareholders at the same address, Pacific Capital Funds may in the future deliver one copy of a prospectus, prospectus supplement, semi-annual report or annual report to a single investor sharing a street address or post office box with other investors, provided that all such investors have the same last name or are believed to be members of the same family. This process, called “householding,” will continue indefinitely unless you instruct us otherwise. If you share an address with another investor and wish to receive your own prospectus, prospectus supplements, semi-annual reports and annual reports, please call the Trust toll-free at 1-800-258-9232.
2

Investment Style
Regional, multi-cap, growth
Investment Objective
Long-term capital appreciation by investing in a broadly diversified portfolio of companies located in Asia’s developing regions, excluding Japan. Investments are not limited to any particular size or sector.
Investment Considerations
An investment in this Fund entails the special risks of international investing, including currency exchange fluctuation, government regulations, and the potential for political and economic instability. The Fund’s share price is expected to be more volatile than that of a U.S.-only fund. Equity securities (stocks) are more volatile and carry more risk than other forms of investments, such as investments in high-grade fixed income securities. The net asset value per share of this Fund will fluctuate as the value of the securities in the portfolio changes.
Investment Process
| | • | | Follow active bottom-up investment approach |
| | • | | Invest for absolute versus relative return |
| | • | | Look outside benchmark representation for fresh opportunities |
| | • | | Identify sensibly priced, high-quality companies that exhibit long-term growth potential |
Investment Management
Advised by Asset Management Group of Bank of Hawaii
Sub-Advised by First State Investments International Limited (since June 29, 2006)
| | • | | First State Investments is part of Colonial First State Global Asset Management (CFS GAM), the consolidated asset management business of the Commonwealth Bank of Australia (CBA) |
| | • | | CFS GAM’S combined investment businesses manage approximately US$111.7 billion globally |
| | • | | CFS GAM has offices in London, Edinburgh, Sydney, Hong Kong, Singapore and Jakarta |
| | • | | Specialist in single country, regional, global and sector specific investments |
How did the Fund perform compared to its benchmark?
For the 12-month period ended July 31, 2009, the Fund returned -6.91% (Class A Shares without sales charge), underforming its benchmark, the MSCI AC Far East Free Index1 (excluding Japan), which returned -6.49%.
What were the major factors in the market that influenced the Fund’s performance?
The MSCI Far East ex-Japan Index outperformed global indices for the year ended July 31, 2009. The MSCI World Index declined 21.07% and the MSCI Emerging Markets Index fell by 16.57% in U.S. dollar terms.
Asian markets were weak during the second half of 2008 and at the start of 2009 due to continuing concerns about the impact of the credit crunch, with some falling to valuation levels not seen since the 1970s. However, markets saw a recovery from March 2009 as credit conditions improved and risk appetite returned.
At the sector level, Information Technology, Utilities, Consumer Discretionary, and Financials outperformed. Information Technology benefitted as investors expected an improved outlook for demand. The Energy and Materials sectors underperformed as the price of oil and gold declined from the record highs seen in the previous period.
What helped the Fund’s performance?
Positions in the Financial sector outperformed as companies rebounded from oversold levels as credit conditions eased, in particular Kasikornbank (Thailand), Oversea-Chinese Banking Corp (Singapore), Hang Lung Group and Swire Pacific (Hong Kong).†
Information Technology stocks Infosys Technologies (India), Taiwan Semiconductor and Samsung Electronics (South Korea) all contributed positively as investors were attracted by low valuations and expectations of a demand recovery.†
What hurt the Fund’s performance?
On the negative side, several positions in Malaysia lagged. Tenaga Nasional (Utilities) underperformed on concerns that the government was not serious about state reform, Genting (Consumer Discretionary) lagged due to concerns about its corporate governance and IOI Corp (Consumer Staples) underperformed as the price of palm oil declined during the period.†
Performance was also hurt by Keppel Corp (Singapore), which declined with the oil price and Chunghwa Telecom (Taiwan), which underperformed as markets recovered due to its defensive nature.†
What major changes have occurred in the portfolio during the period covered by this report?
Over the year, we added to our positions in the Consumer Staples sector purchasing Chinese stocks Hengan International, which offers visible long-term growth and Tingyi, a dominant producer of noodles and beverages that is increasing market share.†
In the Information Technology sector, we bought AU Optronics (Taiwan) and Lenovo Group (China) as they were trading at compelling valuations. We also purchased Telekomunikasi (Indonesia: Telecom Services) for its defensive earnings stream and good cash flow.†
We sold Hong Kong Financial stocks Wing Hang Bank on valuation concerns and Kerry Properties on the deteriorating outlook for the Hong Kong property market. E.Sun Financial Holdings (Taiwan) was sold on concerns about management strategy.†
Past performance does not guarantee future results.
| 1 | The Morgan Stanley Capital International (MSCI) All Country (AC) Far East Free Index (excluding Japan) is a free float-adjusted market capitalization index that is designed to measure equity market performance in the Far East, excluding Japan. Investors cannot invest directly in an index. |
| † | The composition of the Fund’s portfolio is subject to change. |
3

In the Industrials sector, we sold Keppel Corp (Singapore) which rebounded sharply with the oil price as well as benefitting from increased optimism towards the Singapore property sector and China Merchants Holdings on worries about a further slowdown in Chinese exports. We sold Consumer Discretionary stocks Li & Fung (Hong Kong), following a period of strong performance, and Genting (Malaysia) on worries about corporate governance.†
What is your outlook for the Fund?
We continue to retain a very conservative stance seeing little upside at current valuations.
Markets are discounting a rapid return to the favourable conditions of strong global economic growth that was prevalent before the recent financial crisis.
However, they are not discounting the possibility of inflation returning because of ‘quantitative easing’.
We believe the extent and pace of the rebound since March has been astonishing and a further correction over the coming months seems likely.
Past performance does not guarantee future results.
| † | The composition of the Fund’s portfolio is subject to change. |
4
Country Weightings as of July 31, 2009 (as a percentage of total investments)
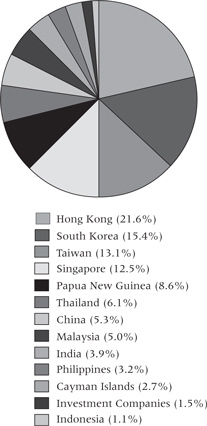
The composition of the Fund’s portfolio is subject to change.
Growth of a $10,000 Investment
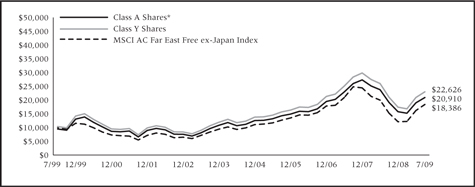
The hypothetical $10,000 investment graph above represents a comparison of the performance of the indicated share class versus a similar investment in the Fund’s benchmark.
Average Annual Total Returns as of July 31, 2009
| | | | | | | | | | | | |
| | | 1 Year | | | 3 Year | | | 5 Year | | | 10 Year | |
Class A Shares* | | -11.78 | % | | 6.83 | % | | 13.90 | % | | 7.66 | % |
Class B Shares** | | -10.27 | % | | 7.34 | % | | 14.12 | % | | 7.65 | % |
Class C Shares** | | -8.30 | % | | 7.93 | % | | 14.25 | % | | 7.49 | % |
Class Y Shares | | -6.74 | % | | 8.99 | % | | 15.39 | % | | 8.51 | % |
MSCI AC Far East Free Index (excluding Japan) | | -6.49 | % | | 8.17 | % | | 15.19 | % | | 6.28 | % |
| | | | |
Expense Ratios | | Class A | | | Class B | | | Class C | | | Class Y | |
Gross | | 1.74 | % | | 2.34 | % | | 2.34 | % | | 1.34 | % |
With Contractual Waivers | | 1.59 | % | | 2.34 | % | | 2.34 | % | | 1.34 | % |
Past performance does not guarantee future results. The performance data quoted represents past performance and current returns may be lower or higher. The investment return and principal value will fluctuate so that an investor’s shares, when redeemed, may be worth more or less than the original cost. To obtain performance information current to the most recent month end, please call 1-800-258-9232 or visit the Funds’ website at pacificcapitalfunds.com.
The above expense ratios are from the Funds’ prospectus dated November 28, 2008. Additional information pertaining to the Funds’ expense ratios for the year ended July 31, 2009 can be found in the financial highlights.
| * | Reflects 5.25% maximum front-end sales charge. |
| ** | Reflects maximum contingent deferred sales charge (CDSC) of up to 5.00% for the Class B Shares and a maximum CDSC of 1.00% for the Class C Shares (applicable only to redemptions within one year of purchase). |
The hypothetical $10,000 graph and above performance table do not reflect the deduction of taxes that a shareholder would pay on Fund distributions or redemption of Fund shares. Total returns reflect the waiver of various operational fees. Had these waivers not been in effect, performance quoted would have been lower.
The Class C Shares of the Fund commenced operations on April 30, 2004. Performance information for Class C Shares prior to April 30, 2004 is based on the performance of Class B Shares.
The performance of the Pacific Capital New Asia Growth Fund is measured against the MSCI AC Far East Free ex Japan Index, a free float-adjusted market capitalization index that is designed to measure equity market performance in the Far East, excluding Japan. The index is unmanaged and does not reflect the deduction of fees associated with a mutual fund, such as investment management and fund accounting fees. The Fund’s performance reflects the deduction of fees for these services. Investors cannot invest directly in an index.
Effective May 1, 2009, the offering of the Class C Shares was suspended, and will remain in effect until further notice.
The Pacific Capital Funds are distributed by Foreside Distribution Services, L.P. The Asset Management Group of Bank of Hawaii is investment adviser to the Fund and receives a fee for its services. First State Investments International Limited is sub-adviser to the Fund and is paid a fee for its services.
5

Investment Style
International, multi-cap, blend
Investment Objective
Long-term capital appreciation by investing in a broadly diversified portfolio of companies domiciled outside the United States. Investments are not limited to any particular type or size of company or to any region of the world, including emerging markets countries.
Investment Considerations
An investment in this Fund entails the special risks of international investing, including currency exchange fluctuation, government regulations, and the potential for political and economic instability. The Fund’s share price is expected to be more volatile than that of a U.S.-only fund. Equity securities (stocks) are more volatile and carry more risk than other forms of investments, such as investments in high-grade fixed income securities. The net asset value per share of this Fund will fluctuate as the value of the securities in the portfolio changes.
Investment Process
| | • | | Style neutral growth and value discipline |
| | • | | Disciplined bottom-up stock selection |
Investment Management
Advised by Asset Management Group of Bank of Hawaii
Sub-Advised by Hansberger Global Investors, Inc. (since June 1, 2004)
| | • | | Headquartered in Ft. Lauderdale, Florida, with satellite offices in Hong Kong, Moscow, Toronto and Mumbai |
| | • | | 23 investment professionals, 18 nationalities |
| | • | | $6.6 billion in assets under advisement, includes $0.8 billion in Advised Managed Accounts of other firms based on HGI models |
| | • | | HGI is an affiliated investment manager of Natixis Asset Management Group (Natixis). Natixis has an ownership position of 86%. HGI management and employees own the remaining 14%. |
How did the Fund perform compared to its benchmark?
For the 12-month period ended July 31, 2009, the Fund underperformed its benchmark, the MSCI ACWI ex US Index1. The Fund (Class A shares without sales charge) returned -22.32%, while the MSCI ACWI ex US Index returned -20.90%.
What were the major factors in the market that influenced the Fund’s performance?
Japanese stocks held within the portfolio performed worse than the MSCI Japan Index falling -23.9% compared to -16.9%. Orix Corporation (down -70.1%) and Nintendo (down -42.6%) were the major detractors to performance. Pacific ex Japan holdings also underperformed the MSCI Pacific ex Japan Index falling -25.9% compared to -14.5%. Australia’s Woodside Petroleum (down -40.0%) and Hong Kong’s Foxconn International (down -63.8%) were the main detractors in the year. Emerging Markets stocks held by the Fund performed better than the MSCI EM Index, falling -12.5% compared to -16.6%. Chinese companies Agile Property Holdings (up 63.2%) and Tencent Holdings (up 281.5%) were the main contributors to outperformance.†
Currency: Holding a different basket of currencies than the MSCI ACWI ex U.S. had a positive net effect on the relative return.†
What major changes have occurred in the portfolio during the period covered by this report?
Change in absolute weights: On an absolute basis, the largest changes in the regional weights were a -2.8% decrease to Europe and a 1.9% increase to Emerging Markets.†
From a sector perspective, the Fund’s largest absolute weighting changes were a 2.4% increase to Consumer Discretionary, a 1.8% increase to Financials, and a -1.0% decrease to Information Technology. †
Change in benchmark-relative weights: Relative to the benchmark, the Funds North American (Canada) weight increased by 0.9% and its Japan weight decreased by -0.8%.†
From a sector perspective the largest changes were a 1.5% increase to Financials, a 1.1% increase to Industrials, and a -1.2% decrease to Consumer Discretionary.†
What is your outlook for the Fund?
While the pace of economic growth has slowed dramatically, the long-term outlook for many economies—especially the Emerging Markets—is still very much alive. Maintaining a well-diversified portfolio of international companies should prove beneficial as investors return to equities and risk aversion subsides. Many of the names that will recover first are the liquid, large-cap companies that we hold in the portfolio.†
Past performance does not guarantee future results.
| 1 | The Morgan Stanley Capital International (MSCI) All Country World (ACWI) ex US Index is a free float-adjusted market capitalization index that is designed to measure equity market performance in the global developed and emerging markets outside the U.S. Investors cannot invest directly in an index. |
| † | The composition of the Fund’s portfolio is subject to change. |
6

Country Weightings as of July 31, 2009 (as a percentage of total investments)

The composition of the Fund’s portfolio is subject to change.
Growth of a $10,000 Investment
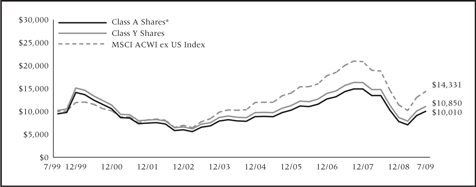
The hypothetical $10,000 investment graph above represents a comparison of the performance of the indicated share class versus a similar investment in the Fund’s benchmark.
Average Annual Total Returns as of July 31, 2009
| | | | | | | | | | | | |
| | | 1 Year | | | 3 Year | | | 5 Year | | | 10 Year | |
Class A Shares* | | -26.37 | % | | -5.34 | % | | 4.57 | % | | 0.01 | % |
Class B Shares** | | -25.09 | % | | -4.99 | % | | 4.78 | % | | -0.01 | % |
Class C Shares** | | -23.48 | % | | -4.39 | % | | 4.89 | % | | -0.17 | % |
Class Y Shares | | -22.21 | % | | -3.44 | % | | 5.95 | % | | 0.82 | % |
MSCI ACWI ex US Index | | -20.90 | % | | -2.68 | % | | 7.57 | % | | 3.66 | % |
| | | | |
Expense Ratios | | Class A | | | Class B | | | Class C | | | Class Y | |
Gross | | 1.60 | % | | 2.20 | % | | 2.20 | % | | 1.20 | % |
With Contractual Waivers | | 1.45 | % | | 2.20 | % | | 2.20 | % | | 1.20 | % |
Past performance does not guarantee future results. The performance data quoted represents past performance and current returns may be lower or higher. The investment return and principal value will fluctuate so that an investor’s shares, when redeemed, may be worth more or less than the original cost. To obtain performance information current to the most recent month end, please call 1-800-258-9232 or visit the Funds’ website at pacificcapitalfunds.com.
The above expense ratios are from the Funds’ prospectus dated November 28, 2008. Additional information pertaining to the Funds’ expense ratios for the year ended July 31, 2009 can be found in the financial highlights.
| * | Reflects 5.25% maximum front-end sales charge. |
| ** | Reflects maximum contingent deferred sales charge (CDSC) of up to 5.00% for the Class B Shares and a maximum CDSC of 1.00% for the Class C Shares (applicable only to redemptions within one year of purchase). |
The above hypothetical $10,000 graph and performance table do not reflect the deduction of taxes that a shareholder would pay on Fund distributions or redemption of Fund shares. Total returns reflect the waiver of various operational fees. Had these waivers not been in effect, performance quoted would have been lower.
The Class C Shares of the Fund commenced operations on April 30, 2004. Performance information for Class C Shares prior to April 30, 2004 is based on the performance of Class B Shares.
The performance of the Pacific Capital International Stock Fund is measured against the MSCI ACWI ex US Index, which is unmanaged and designed to measure equity market performance in the global developed and emerging markets outside the U.S. The index does not reflect the deduction of fees associated with a mutual fund, such as investment management and fund accounting fees. The Fund’s performance reflects the deduction of fees for these services. Investors cannot invest directly in an index.
Effective May 1, 2009, the offering of the Class C Shares was suspended, and will remain in effect until further notice.
The Pacific Capital Funds are distributed by Foreside Distribution Services, L.P. The Asset Management Group of Bank of Hawaii is investment adviser to the Fund and receives a fee for its services. Hansberger Global Investors, Inc. is sub-adviser to the Fund and is paid a fee for its services.
7

Investment Style
Domestic, small-cap, blend
Investment Objective
Long-term capital appreciation by investing in a diversified portfolio of small-capitalization companies.
Investment Considerations
Small-capitalization stocks typically carry additional risk, since smaller companies generally have a higher risk of failure and experience a greater degree of volatility than larger companies. Equity securities (stocks) are more volatile and carry more risk than other forms of investments, such as investments in high-grade fixed income securities. The net asset value per share of this Fund will fluctuate as the value of the securities in the portfolio changes.
Investment Process
Nicholas-Applegate Capital Management
| | • | | Systematic small cap strategy: Emphasizes a quantitative stock-selection approach to identify companies with sustainable growth characteristics and timely market recognition |
Wellington Management Company, LLP
| | • | | Small cap growth intersection strategy: Combines fundamental research with quantitative valuation techniques in a disciplined framework to assess investment attractiveness |
Mellon Capital Management Corporation
| | • | | Small cap value strategy: Utilizes a disciplined process that combines computer modeling techniques, fundamental analysis, and risk management to select undervalued stocks for the Fund |
How did the Fund perform compared to its benchmark?
For the 12-month period ended July 31, 2009, the Fund returned -26.16% (Class A Shares without sales charge), underperforming the Fund’s benchmark, the Russell 2000® Index1, which returned -20.72%.
What were the major factors in the market that influenced the Fund’s performance?
During the fiscal year, large caps (represented by the S&P 5002 ) returned -19.96%, outperforming small caps (represented by the Russell 2000®) which returned -20.72%. Within the small cap universe, growth and value stocks experienced equal declines (the Russell 2000® Value3 returned -20.67% while the Russell 2000® Growth4 returned -20.86%). Within the Russell 2000® Growth Index, the Consumer Staples and Information Technology sectors were the strongest performers, while Energy, Industrials, and Telecommunication Services suffered the largest declines.
After registering its sixth straight quarterly decline in the first quarter of 2009, the broad U.S. equity market (as measured by the S&P 500) rose sharply during the second quarter, recouping losses from earlier in the year to finish slightly ahead at the end of June. Investors shook off fears created by the volatility in the markets earlier in the period and interpreted a slowdown in the pace of economic decline as a sign that a bottoming process for the global economy had begun, reacting positively to the responsiveness of many companies in trimming cost structures and realigning operations to meet a softer demand outlook. Many larger banks, brokerage firms, and real estate companies successfully launched capital raises, shoring up balance sheets and in turn, investor confidence.
Stock selection was the primary driver of performance during the year. Selection within Information Technology, Telecommunication Services, and Financials contributed most to performance, and more than offset weaker selection in Energy and Materials. The top relative contributors to Fund performance were CV Therapeutics (Health Care), Atlantic Tele-Network (Telecommunication Services), and WMS Industries (Consumer Discretionary), while top relative detractors included Human Genome Science (Health Care), and Energy holdings Complete Production and ATP Oil & Gas.†
What major changes have occurred in the portfolio during the period covered by the report?
Since June 2006, the Fund employed a “multi-manager” approach whereby portions of the Fund’s assets were allocated among three different investment sub-advisers: small cap value strategy managed by Mellon Capital Management (“MCM”), systematic small cap core strategy managed by Nicholas-Applegate Capital Management (“NACM”), and small cap growth strategy managed by Wellington Management Company (“WMC”). Each sub-adviser utilizes distinct investment styles intended to complement one another, applying its own methodology for selecting investments.
Past performance does not guarantee future results.
| 1 | The Russell 2000® Index measures the performance of the small-cap segment of the U.S. equity universe. The Russell 2000® Index is a subset of the Russell 3000® Index representing approximately 10% of the total market capitalization of that index. It includes approximately 2000 of the smallest securities based on a combination of their market cap and current index membership. Investors cannot invest directly in an index. |
| 2 | The Standard & Poor’s 500 Index (“S&P 500”) is an index of 500 selected common stocks, most of which are listed on the New York Stock Exchange, and is considered a measure of the U.S. stock market as a whole. Investors cannot invest directly in an index. |
| 3 | The Russell 2000® Value Index measures the performance of small-cap value segment of the U.S. equity universe. It includes those Russell 2000® companies with lower price-to-book ratios and lower forecasted growth values. Investors cannot invest directly in an index. |
| 4 | The Russell 2000® Growth Index measures the performance of the small-cap growth segment of the U.S. equity universe. It includes those Russell 2000® companies with higher price-to-value ratios and higher forecasted growth values. |
| † | The composition of the Fund’s portfolio is subject to change. |
8

Investment Management
Advised by Asset Management Group of Bank of Hawaii
Sub-Advised by Nicholas-Applegate Capital Management (since January 31, 2001)
| | • | | Founded in 1984, Nicholas-Applegate is a diversified global investment firm with more than twenty years of experience delivering value to clients |
| | • | | Nicholas-Applegate offers a broad array of investment solutions built on a consistent investment philosophy |
| | • | | Traditional Global, U.S. and non-U.S. |
| | • | | $8.7 billion in assets under management |
Sub-Advised by Wellington Management Company, LLP (since June 14, 2006)
| | • | | Tracing its roots to 1928, Wellington Management is one of the largest independent investment management firms in the world |
| | • | | Serves as investment manager for clients in over 40 countries |
| | • | | $448.0 billion in assets under management |
Sub-Advised by Mellon Capital Management (since January 1, 2008)
| | • | | Founded in 1983, Mellon Capital is headquartered in San Francisco with offices in Pittsburgh, Philadelphia, Boston and Jersey City |
| | • | | Specializes in domestic and global asset allocation strategies, active and passive equity and fixed income strategies, alternative investments, currency strategies, and overlay strategies |
| | • | | Over $153.0 billion in assets under management (including $9.7 billion in overlay assets) |
MCM—Small Cap Value
There have been no major changes in this portion of the portfolio during the period. The portfolio remains diversified across many industry groups. Given the continued volatility in the financial markets, a strategy emphasizing strong fundamentals and sector diversification has served clients well over the long run.†
NACM—Systematic Small Cap
All buys and sells in this portion of the portfolio are driven by NACM’s quantitative stock selection model based on each position’s relative attractiveness and contribution to risk in relation to existing portfolio holdings. During the period, there were minor changes in sector weights in this sleeve of the portfolio relative to the benchmark driven by stock selection model. Sector weightings in Consumer Discretion and Information Technology were increased, while the weightings in Energy, Financials and Health Care were reduced.†
WMC—Small Cap Growth Intersection
Changes in this portion of the portfolio are driven by bottom-up fundamental and quantitative research rather than sector-level, top-down views. During the 12-month period, the largest new purchases in this portion of the portfolio included Manpower, an employment services company, and Arbitron, a leading provider of media audience rating services for the radio industry. Our largest eliminations included U.S.-based pharmaceutical company CV Therapeutics, and medical and surgical supply distributor Owens & Minor.†
What is your outlook for the Fund?
We believe it is increasingly clear that the U.S. is in a deep recession, notwithstanding the second quarter’s stock market rally. Unemployment is rising sharply, the housing slowdown continues, and the consumer is contracting. The government is reshaping the financial playing field through actions ranging from stimulus packages to massive loans to impaired private sector companies, all taken with an eye towards thawing frozen credit markets and expanding purchasing power. We believe these moves could help mitigate some of the negative economic pressures, and while the outlook remains uncertain, markets have begun to anticipate a recovery.
We will continue to employ a combination of fundamental and quantitative research rather than sector-level top-down views to identify the most attractive stocks, while maintaining appropriate risk controls relative to the benchmark. Over the long-run, security selection should drive the Fund’s results as the portfolio will be close to neutral relative to the benchmark on most metrics.†
| † | The composition of the Fund’s portfolio is subject to change. |
9
Sector Weightings as of July 31, 2009 (as a percentage of total investments)
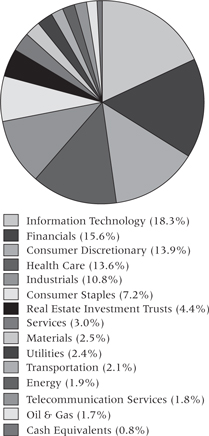
The composition of the Fund’s portfolio is subject to change.
Growth of a $10,000 Investment
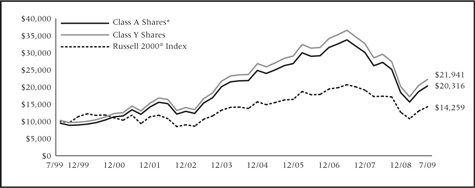
The hypothetical $10,000 investment graph above represents a comparison of the performance of the indicated share class versus a similar investment in the Fund’s benchmark.
Average Annual Total Returns as of July 31, 2009
| | | | | | | | | | | | |
| | | 1 Year | | | 3 Year | | | 5 Year | | | 10 Year | |
Class A Shares* | | -30.05 | % | | -11.77 | % | | -1.60 | % | | 7.35 | % |
Class B Shares** | | -28.98 | % | | -11.23 | % | | -1.20 | % | | 7.27 | % |
Class C Shares** | | -27.50 | % | | -10.87 | % | | -1.29 | % | | 7.10 | % |
Class Y Shares | | -25.99 | % | | -9.95 | % | | -0.28 | % | | 8.17 | % |
Russell 2000® Index | | -20.72 | % | | -6.05 | % | | 1.52 | % | | 3.61 | % |
| | | | |
Expense Ratios | | Class A | | | Class B | | | Class C | | | Class Y | |
Gross | | 1.88 | % | | 2.48 | % | | 2.48 | % | | 1.48 | % |
With Contractual Waivers | | 1.73 | % | | 2.48 | % | | 2.48 | % | | 1.48 | % |
Past performance does not guarantee future results. The performance data quoted represents past performance and current returns may be lower or higher. The investment return and principal value will fluctuate so that an investor’s shares, when redeemed, may be worth more or less than the original cost. To obtain performance information current to the most recent month end, please call 1-800-258-9232 or visit the Funds’ website at pacificcapitalfunds.com.
The above expense ratios are from the Funds’ prospectus dated November 28, 2008. Additional information pertaining to the Funds’ expense ratios for the year ended July 31, 2009 can be found in the financial highlights.
| * | Reflects 5.25% maximum front-end sales charge. |
| ** | Reflects maximum contingent deferred sales charge (CDSC) of up to 5.00% for the Class B Shares and a maximum CDSC of 1.00% for the Class C Shares (applicable only to redemptions within one year of purchase). |
The above hypothetical $10,000 graph and performance table do not reflect the deduction of taxes that a shareholder would pay on Fund distributions or redemption of Fund shares. Total returns reflect the waiver of various operational fees. Had these waivers not been in effect, performance quoted would have been lower.
The Class C Shares of the Fund commenced operations on April 30, 2004. Performance information for Class C Shares prior to April 30, 2004 is based on the performance of Class B Shares.
The performance of the Pacific Capital Small Cap Fund is measured against the Russell 2000® Index, which measures the performance of the small-cap segment of the U.S. equity universe. The Russell 2000® Index is a subset of the Russell 3000® Index representing approximately 10% of the total market capitalization of that index. It includes approximately 2,000 of the smallest securities based on a combination of their market cap and current index membership. The index is unmanaged and does not reflect the deduction of fees associated with a mutual fund, such as investment management and fund accounting fees. The Fund’s performance reflects the deduction of fees for these services. Investors cannot invest directly in an index.
Effective May 1, 2009, the offering of the Class C Shares was suspended, and will remain in effect until further notice.
The Pacific Capital Funds are distributed by Foreside Distribution Services, L.P. The Asset Management Group of Bank of Hawaii is investment adviser to the Fund and receives a fee for its services. Nicholas-Applegate Capital Management, Wellington Management Company, LLP and Mellon Capital Management Corporation are each sub-advisers for a portion of the Fund’s assets and are paid a fee for their services.
10

Investment Style
Domestic, mid-cap, blend
Investment Objective
Long-term capital appreciation by investing in a diversified portfolio of mid-capitalization companies the sub-adviser believes are reasonably priced, fundamentally strong and exhibit better growth expectations relative to peers.
Investment Considerations
Mid-capitalization stocks typically carry additional risk, since smaller companies generally have a higher risk of failure and a greater degree of volatility than larger companies. Equity securities (stocks) are more volatile and carry more risk than other forms of investments, such as investments in high-grade fixed income securities. The net asset value per share of this Fund will fluctuate as the value of the securities in the portfolio changes.
Investment Process
| | • | | Quantitative research analysis with fundamental research overlay |
| | • | | Quantitative analysts use proprietary screen to evaluate expectations, valuation and quality of 3,000 stocks |
| | • | | Fundamental analysts identify factors not included in the screen to determine most attractive stocks |
| | • | | Portfolio construction emphasizes stock selection and seeks to neutralize risk elements that are not consistently rewarded |
Investment Management
Advised by Asset Management Group of Bank of Hawaii
Sub-Advised by Chicago Equity Partners, LLC (CEP) (since October 10, 2006)
| | • | | Founded in 1989, CEP specializes in core domestic equity and fixed income markets |
| | • | | CEP investment management team averages 21 years experience |
| | • | | $6.6 billion in assets under management |
How did the Fund perform compared to its benchmark?
For the 12-month period ended July 31, 2009, the Fund underperformed its benchmark, the S&P MidCap 400 Index1. The Fund produced a total return of -25.62% (Class A Shares without sales charge), compared to the S&P MidCap 400 Index, which returned -20.25% for the same period.
What were the major factors in the market that influenced the Fund’s performance?
After declining significantly in 2008 and early 2009, several economic metrics began to stabilize or improve slightly during the second quarter. Although the global economy remained mired in recession, the fear of imminent economic collapse appeared to be lessening substantially. According to the National Bureau of Economic Research, the current recession is the longest since the Great Depression. On a more uplifting note, GDP2 estimates are now positive for the fourth quarter of 2009, after growth plunged 6.3% and 5.7% in the fourth quarter 2008 and first quarter 2009, respectively. Nevertheless, questions remain as to whether the stimulus-driven improvement can become self-sustaining.
The equity market rally that began in March has been led by low-quality, low-priced stocks. As a result, our model was inverted in the second quarter, with the lowest-ranked stocks outperforming and the highest-ranked stocks underperforming. Of the four factor groups, only the Value group performed well. We increased our exposure to the value factor group, which provided a benefit. These changes allowed the portfolio to participate in the recent market rally even though our model was not providing the full potential.†
Over the last twelve months, the Fund underperformed the benchmark. Over the long term, our proprietary quantitative model shows strong discrimination between the lowest- and highest-rated stocks. The stocks in the highest deciles have an “intersection” of the following qualities:
| | • | | They are trading at a reasonable price versus peer companies; |
| | • | | They are growing at a faster rate; |
| | • | | They have strong balance sheets and have a higher quality aspect to them; and |
| | • | | They are responsible with their capital. |
An intersection of these factor groups was heavily punished over the last twelve months. Stocks that had a combination of lower valuations, sustainable earnings growth and higher-quality financials underperformed in this market environment. The Fund holds a majority of its weight in these types of stocks; these stocks generally underperformed their peers during this time. However, we have begun to see performance in this product rebound, as the Fund has outperformed during the first quarter of 2009.†
Overall, our philosophy will not change based on short-term trends or conditions in the market. Our goal is to add value through security selection, while attempting to neutralize other risk factors, such as market timing and sector rotation, for which there is not adequate compensation by the market. We will continue to use our disciplined approach to provide added value at controlled levels of risk.†
What major changes have occurred in the portfolio during the period covered by the report?
Other than typical re-balancing, no major changes occurred during the period. We are maintaining our disciplined process that has delivered competitive returns.†
What is your outlook for the Fund?
We believe that as investors gain confidence the economy should avoid a depression, the smallest, hardest-hit, most vulnerable stocks have bounced back most so far in this stage. As we move forward, and the economy begins to recover, which most economists predict GDP will grow in the third quarter, we believe there will be a premium on investing in really well-run companies with strong balance sheets and favorable growth prospects. We believe the portfolio is positioned to continue to do well as our strongest performance tends to follow periods of underperformance.†
Past performance does not guarantee future results.
| 1 | The S&P MidCap 400 Index is a market capitalization-weighted index of 400 medium capitalization stocks. Investors cannot invest directly in an index. |
| 2 | The Gross Domestic Product (“GDP”) is the measure of the market value of the goods and services produced by labor and property in the United States. |
| † | The composition of the Fund’s portfolio is subject to change. |
11

Sector Weightings as of July 31, 2009 (as a percentage of total investments)
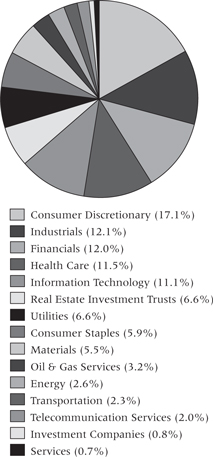
The composition of the Fund’s portfolio is subject to change.
Growth of a $10,000 Investment
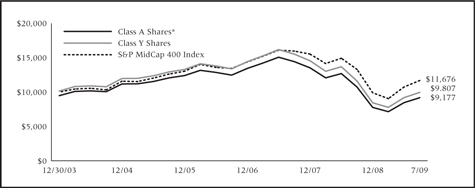
The hypothetical $10,000 investment graph above represents a comparison of the performance of the indicated share class versus a similar investment in the Fund’s benchmark.
Average Annual Total Returns as of July 31, 2009
| | | | | | | | | | | | |
| | | 1 Year | | | 3 Year | | | 5 Year | | | Since Inception
(12/30/03) | |
Class A Shares* | | -29.54 | % | | -11.05 | % | | -2.38 | % | | -1.52 | % |
Class C Shares** | | -27.00 | % | | -10.14 | % | | -2.06 | % | | -1.27 | % |
Class Y Shares | | -25.51 | % | | -9.23 | % | | -1.11 | % | | -0.35 | % |
S&P MidCap 400 Index | | -20.25 | % | | -4.00 | % | | 3.04 | % | | 2.93 | % |
| | | | |
Expense Ratios | | | | | Class A | | | Class C | | | Class Y | |
Gross | | | | | 1.55 | % | | 2.15 | % | | 1.15 | % |
With Contractual Waivers | | | | | 1.40 | % | | 2.15 | % | | 1.15 | % |
Past performance does not guarantee future results. The performance data quoted represents past performance and current returns may be lower or higher. The investment return and principal value will fluctuate so that an investor’s shares, when redeemed, may be worth more or less than the original cost. To obtain performance information current to the most recent month end, please call 1-800-258-9232 or visit the Funds’ website at pacificcapitalfunds.com.
The above expense ratios are from the Funds’ prospectus dated November 28, 2008. Additional information pertaining to the Funds’ expense ratios for the year ended July 31, 2009 can be found in the financial highlights.
| * | Reflects 5.25% maximum front-end sales charge. |
| ** | Reflects maximum contingent deferred sales charge (CDSC) of up to 1.00% (applicable only to redemptions within one year of purchase). |
The above hypothetical $10,000 graph and performance table do not reflect the deduction of taxes that a shareholder would pay on Fund distributions or redemption of Fund shares. Total returns reflect the waiver of various operational fees. Had these waivers not been in effect, performance quoted would have been lower.
The Pacific Capital Mid-Cap Fund’s inception date was December 30, 2003. The Class C Shares were not in existence prior to April 30, 2004. Performance information for the Class C Shares prior to April 30, 2004 is based on the performance of Class A Shares, which does not reflect the higher 12b-1 fees charged to Class C Shares. Had the higher 12b-1 fees been reflected, total return figures may have been adversely affected.
The performance of the Pacific Capital Mid-Cap Fund is measured against the S&P MidCap 400 Index, a market capitalization-weighted index of 400 medium capitalization stocks. The index is unmanaged and does not reflect the deduction of fees associated with a mutual fund, such as investment management and fund accounting fees. The Fund’s performance reflects the deduction of fees for these services. Investors cannot invest directly in an index.
Effective May 1, 2009, the offering of the Class C Shares was suspended, and will remain in effect until further notice.
The Pacific Capital Funds are distributed by Foreside Distribution Services, L.P. The Asset Management Group of Bank of Hawaii is investment adviser to the Fund and receives a fee for its services. Chicago Equity Partners, LLC, is sub-adviser to the Fund and is paid a fee for its services.
12

Investment Style
Domestic, large-cap, growth
Investment Objective
Long-term capital appreciation and dividend income by investing in a diversified portfolio of large-capitalization companies whose earnings are expected to grow faster than the average of other companies in their industries.
Investment Considerations
Equity securities (stocks) are more volatile and carry more risk than other forms of investments, such as investments in high-grade fixed income securities. The net asset value per share of this Fund will fluctuate as the value of the securities in the portfolio changes.
Investment Process
| | • | | Utilizes a dynamic multi-factor quantitative stock model to evaluate the expected returns of a large universe of stocks |
| | • | | Fundamental analysts identify factors not included in the stock model to choose the best risk-adjusted stocks within their sector |
| | • | | Follows a disciplined portfolio construction process that seeks to neutralize risk elements that are not consistently rewarded |
Investment Management
Advised by Asset Management Group of Bank of Hawaii
Sub-Advised by Chicago Equity Partners, LLC (CEP) (since June 29, 2007)
| | • | | Founded in 1989, CEP specializes in core domestic equity and fixed income markets |
| | • | | CEP investment management team averages 21 years experience |
| | • | | $6.6 billion in assets under management |
How did the Fund perform compared to its benchmark?
For the 12-month period ended July 31, 2009, the Fund produced a -18.22% total return (Class A Shares without sales charge), underperforming its benchmark, the S&P 500/Citigroup Growth Index1, which returned -16.44%.
What were the major factors in the market that influenced the Fund’s performance?
After declining significantly in 2008 and early 2009, several economic metrics began to stabilize or improve slightly during the second quarter. Although the global economy remained mired in recession, the fear of imminent economic collapse appeared to be lessening substantially. According to the National Bureau of Economic Research, the current recession is the longest since the Great Depression. On a more uplifting note, GDP2 estimates are now positive for the fourth quarter of 2009, after growth plunged 6.3% and 5.7% in the fourth quarter 2008 and first quarter 2009, respectively. Nevertheless, questions remain as to whether the stimulus-driven improvement can become self-sustaining.
The equity market rally that began in March has been led by low-quality, low-priced stocks. As a result, our model was inverted in the second quarter, with the lowest-ranked stocks outperforming and the highest-ranked stocks underperforming. Of the four factor groups, only the Value group performed well. We increased our exposure to the value factor group, which provided a benefit. These changes allowed the portfolio to participate in the recent market rally, although we still underperformed.†
Over the last twelve months, the Fund underperformed the benchmark. Over the long term, our proprietary quantitative model shows strong discrimination between the lowest- and highest-rated stocks. The stocks in the highest deciles have an “intersection” of the following qualities:
| | • | | They are trading at a reasonable price versus peer companies; |
| | • | | They are growing at a faster rate; |
| | • | | They have strong balance sheets and have a higher quality aspect to them; and |
| | • | | They are responsible with their capital. |
An intersection of these factor groups was heavily punished over the last twelve months. Stocks that had a combination of lower valuations, sustainable earnings growth and higher-quality financials underperformed in this market environment. The Fund holds a majority of its weight in these types of stocks; these stocks generally underperformed their peers during this time.†
Overall, our philosophy will not change based on short-term trends or conditions in the market. Our goal is to add value through security selection, while attempting to neutralize other risk factors, such as market timing and sector rotation, for which there is not adequate compensation by the market. We will continue to use our disciplined approach to provide added value at controlled levels of risk.†
What major changes have occurred in the portfolio during the period covered by the report?
Other than typical re-balancing, no major changes occurred during the period. We are maintaining our disciplined process that has historically helped the Fund to deliver competitive returns.†
What is your outlook for the Fund?
We believe as investors gain confidence the economy should avoid a depression, the smallest, hardest-hit, most vulnerable stocks have bounced back most so far in this stage. As we move forward, and the economy does begin to recover, which most economists predict GDP will grow in the third quarter, we believe there will be a premium on investing in really well-run companies with strong balance sheets and favorable growth prospects. We believe the portfolio is positioned to do well as our strongest performance tends to follow periods of underperformance.†
Past performance does not guarantee future results.
| 1 | The S&P 500/Citigroup Growth Index measures the performance of all stocks in the S&P 500 Index (the 500 largest U.S. companies based on total market capitalization) that are classified as growth stocks. Investors cannot invest directly in an index. |
| 2 | The Gross Domestic Product (“GDP”) is the measure of the market value of the goods and services produced by labor and property in the United States. |
| † | The composition of the Fund’s portfolio is subject to change. |
13

Sector Weightings as of July 31, 2009 (as a percentage of total investments)
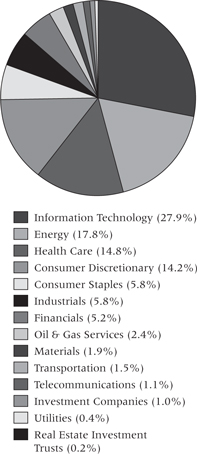
The composition of the Fund’s portfolio is subject to change.
Growth of a $10,000 Investment
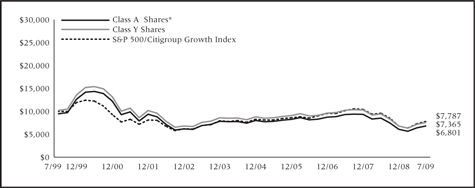
The hypothetical $10,000 investment graph above represents a comparison of the performance of the indicated share class versus a similar investment in the Fund’s benchmarks.
Average Annual Total Returns as of July 31, 2009
| | | | | | | | | | | | |
| | | 1 Year | | | 3 Year | | | 5 Year | | | 10 Year | |
Class A Shares* | | -22.53 | % | | -6.57 | % | | -2.71 | % | | -3.78 | % |
Class B Shares** | | -22.13 | % | | -6.54 | % | | -2.60 | % | | -3.82 | % |
Class C Shares** | | -19.59 | % | | -5.59 | % | | -2.37 | % | | -3.96 | % |
Class Y Shares | | -18.03 | % | | -4.62 | % | | -1.43 | % | | -3.01 | % |
S&P 500/Citigroup Growth Index | | -16.44 | % | | -3.03 | % | | 0.42 | % | | -2.47 | % |
| | | | |
Expense Ratios | | Class A | | | Class B | | | Class C | | | Class Y | |
Gross | | 1.51 | % | | 2.11 | % | | 2.11 | % | | 1.11 | % |
With Contractual Waivers | | 1.36 | % | | 2.11 | % | | 2.11 | % | | 1.11 | % |
Past performance does not guarantee future results. The performance data quoted represents past performance and current returns may be lower or higher. The investment return and principal value will fluctuate so that an investor’s shares, when redeemed, may be worth more or less than the original cost. To obtain performance information current to the most recent month end, please call 1-800-258-9232 or visit the Funds’ website at pacificcapitalfunds.com.
The above expense ratios are from the Funds’ prospectus dated November 28, 2008 and excludes the impact of underlying fund fees and expenses. Additional information pertaining to the Funds’ expense ratios for the year ended July 31, 2009 can be found in the financial highlights.
| * | Reflects 5.25% maximum front-end sales charge. |
| ** | Reflects maximum contingent deferred sales charge (CDSC) of up to 5.00% for the Class B Shares and a maximum CDSC of 1.00% for the Class C Shares (applicable only to redemptions within one year of purchase). |
The above hypothetical $10,000 graph and performance table do not reflect the deduction of taxes that a shareholder would pay on Fund distributions or redemption of Fund shares. Total returns reflect the waiver of various operational fees. Had these waivers not been in effect, performance quoted would have been lower.
The Class C Shares of the Fund commenced operations on April 30, 2004. Performance information for Class C Shares prior to April 30, 2004 is based on the performance of Class B Shares.
The performance of the Pacific Capital Growth Stock Fund is measured against the S&P 500/Citigroup Growth Index, which measures the performance of all stocks in the S&P 500 Index (the 500 largest U.S. companies based on total market capitalization) that are classified as growth stocks. The index is unmanaged and does not reflect the deduction of fees associated with a mutual fund, such as investment management and fund accounting fees. The Fund’s performance reflects the deduction of fees for these services. Investors cannot invest directly in an index.
Effective May 1, 2009, the offering of the Class C Shares was suspended, and will remain in effect until further notice.
The Pacific Capital Funds are distributed by Foreside Distribution Services, L.P. The Asset Management Group of Bank of Hawaii is investment adviser to the Fund and receives a fee for its services. Chicago Equity Partners, LLC, is sub-adviser to the Fund and is paid a fee for its services.
14

Investment Style
Domestic, large-cap, blend
Investment Objective
Long-term capital appreciation and current income by investing in a diversified portfolio of large-capitalization dividend-paying companies (currently greater than $1 billion) whose earnings are expected to grow at above-average rates in relation to other companies in their industries.
Investment Considerations
Equity securities (stocks) are more volatile and carry more risk than other forms of investments, such as investments in high-grade fixed income securities. The net asset value per share of this Fund will fluctuate as the value of the securities in the portfolio changes.
Investment Process
| | • | | Utilizes a dynamic multi-factor quantitative stock model to evaluate the expected returns of a large universe of stocks |
| | • | | Fundamental analysts identify factors not included in the stock model to choose the best risk-adjusted stocks within their sector |
| | • | | Follows a disciplined portfolio construction process that seeks to neutralize risk elements that are not consistently rewarded |
Investment Management
Advised by Asset Management Group of Bank of Hawaii
Sub-Advised by Chicago Equity Partners, LLC (CEP) (since June 29, 2007)
| | • | | Founded in 1989, CEP specializes in core domestic equity and fixed income markets |
| | • | | CEP investment management team averages 21 years experience |
| | • | | $6.6 billion in assets under management |
How did the Fund perform compared to its benchmark?
For the 12-month period ended July 31, 2009, the Fund returned -22.98% (Class A Shares without sales charge), underperforming its benchmark, the S&P 500 Index1, which returned -19.96%.
What were the major factors in the market that influenced the Fund’s performance?
After declining significantly in 2008 and early 2009, several economic metrics began to stabilize or improve slightly during the second quarter. Although the global economy remained mired in recession, the fear of imminent economic collapse appeared to be lessening substantially. According to the National Bureau of Economic Research, the current recession is the longest since the Great Depression. On a more uplifting note, GDP2 estimates are now positive for the fourth quarter of 2009, after growth plunged 6.3% and 5.7% in the fourth quarter 2008 and first quarter 2009, respectively. Nevertheless, questions remain as to whether the stimulus-driven improvement can become self-sustaining.
The equity market rally that began in March has been led by low-quality, low-priced stocks. As a result, our model was inverted in the second quarter, with the lowest-ranked stocks outperforming and the highest-ranked stocks underperforming. Of the four factor groups, only the Value group performed well. We increased our exposure to the value factor group, which provided a benefit. These changes allowed the portfolio to participate in the recent market rally, although we still underperformed.†
Over the last twelve months, the Fund underperformed the benchmark. Over the long term, our proprietary quantitative model shows strong discrimination between the lowest- and highest-rated stocks. The stocks in the highest deciles have an “intersection” of the following qualities:
| | • | | They are trading at a reasonable price versus peer companies; |
| | • | | They are growing at a faster rate; |
| | • | | They have strong balance sheets and have a higher quality aspect to them; and |
| | • | | They are responsible with their capital. |
An intersection of these factor groups was heavily punished over the last twelve months. Stocks that had a combination of lower valuations, sustainable earnings growth and higher quality financials underperformed in this market environment. The Fund holds a majority of its weight in these types of stocks; these stocks generally underperformed their peers during this time.†
Overall, our philosophy will not change based on short-term trends or conditions in the market. Our goal is to add value through security selection, while attempting to neutralize other risk factors, such as market timing and sector rotation, for which there is not adequate compensation by the market. We will continue to use our disciplined approach to provide added value at controlled levels of risk.†
What major changes have occurred in the portfolio during the period covered by the report?
Other than typical re-balancing, no major changes occurred during the period. We are maintaining our disciplined process that has historically helped the Fund to deliver competitive returns.†
What is your outlook for the Fund?
We believe as investors gain confidence the economy should avoid a depression, the smallest, hardest-hit, most vulnerable stocks have bounced back most so far in this stage. As we move forward, and the economy does begin to recover, which most economists predict GDP will grow in the third quarter, we believe there will be a premium on investing in really well-run companies with strong balance sheets and favorable growth prospects. We believe the portfolio is positioned to do well as our strongest performance tends to follow periods of underperformance.†
Past performance does not guarantee future results.
| 1 | The Standard & Poor’s 500 Index (“S&P 500”) is an index of 500 selected common stocks, most of which are listed on the New York Stock Exchange, and is considered a measure of the U.S. stock market as a whole. Investors cannot invest directly in an index. |
| 2 | The Gross Domestic Product (“GDP”) is the measure of the market value of the goods and services produced by labor and property in the United States. |
| † | The composition of the Fund’s portfolio is subject to change. |
15

Sector Weightings as of July 31, 2009 (as a percentage of total investments)
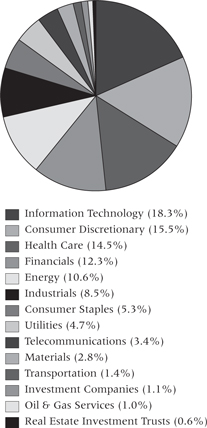
The composition of the Fund’s portfolio is subject to change.
Growth of a $10,000 Investment
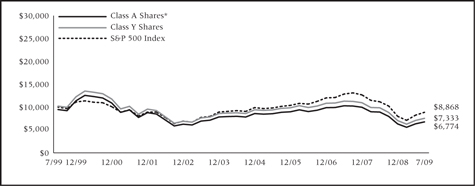
The hypothetical $10,000 investment graph above represents a comparison of the performance of the indicated share class versus a similar investment in the Fund’s benchmark.
Average Annual Total Returns as of July 31, 2009
| | | | | | | | | | | | |
| | | 1 Year | | | 3 Year | | | 5 Year | | | 10 Year | |
Class A Shares* | | -27.03 | % | | -10.47 | % | | -3.75 | % | | -3.82 | % |
Class B Shares** | | -26.57 | % | | -10.39 | % | | -3.62 | % | | -3.88 | % |
Class C Shares** | | -24.33 | % | | -9.55 | % | | -3.44 | % | | -4.02 | % |
Class Y Shares | | -22.77 | % | | -8.62 | % | | -2.45 | % | | -3.06 | % |
S&P 500 Index | | -19.96 | % | | -6.16 | % | | -0.14 | % | | -1.19 | % |
| | | | |
Expense Ratios | | Class A | | | Class B | | | Class C | | | Class Y | |
Gross | | 1.50 | % | | 2.10 | % | | 2.10 | % | | 1.10 | % |
With Contractual Waivers | | 1.35 | % | | 2.10 | % | | 2.10 | % | | 1.10 | % |
Past performance does not guarantee future results. The performance data quoted represents past performance and current returns may be lower or higher. The investment return and principal value will fluctuate so that an investor’s shares, when redeemed, may be worth more or less than the original cost. To obtain performance information current to the most recent month end, please call 1-800-258-9232 or visit the Funds’ website at pacificcapitalfunds.com.
The above expense ratios are from the Funds’ prospectus dated November 28, 2008 and excludes the impact of underlying fund fees and expenses. Additional information pertaining to the Funds’ expense ratios for the year ended July 31, 2009 can be found in the financial highlights.
| * | Reflects 5.25% maximum front-end sales charge. |
| ** | Reflects maximum contingent deferred sales charge (CDSC) of up to 5.00% for the Class B Shares and a maximum CDSC of 1.00% for the Class C Shares (applicable only to redemptions within one year of purchase). |
The above hypothetical $10,000 graph and performance table do not reflect the deduction of taxes that a shareholder would pay on Fund distributions or redemption of Fund shares. Total returns reflect the waiver of various operational fees. Had these waivers not been in effect, performance quoted would have been lower.
The Class C Shares of the Fund commenced operations on April 30, 2004. Performance information for Class C Shares prior to April 30, 2004 is based on the performance of Class B Shares.
The performance of the Pacific Capital Growth and Income Fund is measured against the S&P 500 Index, which measures the performance of 500 selected common stocks, most of which are listed on the New York Stock Exchange, and is considered a measure of the U.S. stock market as a whole. The index is unmanaged and does not reflect the deduction of fees associated with a mutual fund, such as investment management and fund accounting fees. The Fund’s performance reflects the deduction of fees for these services. Investors cannot invest directly in an index.
Effective May 1, 2009, the offering of the Class C Shares was suspended, and will remain in effect until further notice.
The Pacific Capital Funds are distributed by Foreside Distribution Services, L.P. The Asset Management Group of Bank of Hawaii is investment adviser to the Fund and receives a fee for its services. Chicago Equity Partners, LLC, is sub-adviser to the Fund and is paid a fee for its services.
16

Investment Style
Domestic, large-cap, value
Investment Objective
Long-term capital appreciation and current income by investing in a diversified portfolio of large-capitalization companies (currently greater than $1 billion) whose stock prices, the Fund’s sub-adviser believes are undervalued.
Investment Considerations
Value-based investments are subject to the risk that the broad market may not recognize their intrinsic value. Equity securities (stocks) are more volatile and carry more risk than other forms of investments, such as investments in high-grade fixed income securities. The net asset value per share of this Fund will fluctuate as the value of the securities in the portfolio changes.
Investment Process
| | • | | Utilizes a dynamic multi-factor quantitative stock model to evaluate the expected returns of a large universe of stocks |
| | • | | Fundamental analysts identify factors not included in the stock model to choose the best risk-adjusted stocks within their sector |
| | • | | Follows a disciplined portfolio construction process that seeks to neutralize risk elements that are not consistently rewarded |
Investment Management
Advised by Asset Management Group of Bank of Hawaii
Sub-Advised by Chicago Equity Partners, LLC (CEP) (since June 29, 2007)
| | • | | Founded in 1989, CEP specializes in core domestic equity and fixed income markets |
| | • | | CEP investment management team averages 21 years experience |
| | • | | $6.6 billion in assets under management |
How did the Fund perform compared to its benchmark?
For the 12-month period ended July 31, 2009, the Fund returned -21.08% (Class A Shares without sales charge), outperforming its benchmark, the Russell 1000® Value Index1, which returned -22.94%.
What were the major factors in the market that influenced the Fund’s performance?
After declining significantly in 2008 and early 2009, several economic metrics began to stabilize or improve slightly during the second quarter. Although the global economy remained mired in recession, the fear of imminent economic collapse appeared to be lessening substantially. According to the National Bureau of Economic Research, the current recession is the longest since the Great Depression. On a more uplifting note, GDP2 estimates are now positive for the fourth quarter of 2009, after growth plunged 6.3% and 5.7% in the fourth quarter 2008 and first quarter 2009, respectively. Nevertheless, questions remain as to whether the stimulus-driven improvement can become self-sustaining.
The national unemployment rate (9.5%) and the average unemployment duration (14.9 weeks) recently hit multi-year highs and are likely to continue rising. With industrial production falling, the business economy remains weak, but there are signs of life in new orders. Additionally, the Index of Leading Economic Indicators, an amalgamation of 10 individual financial and economic variables, and the broader Chicago Federal Reserve National Activity Index3 recently posted modest improvements. Housing prices continue to fall, albeit at a slower pace. Valuations, down 18.7% on a year-over-year basis through May, stood at late-2002 levels, according to the S&P/Case-Schiller Home Price Index4. Although home inventories remained high, housing starts jumped 17% on a year-over-year basis through May.
The equity market rally that began in March has been led by low-quality, low-priced stocks. As a result, our model was inverted in the second quarter, with the lowest-ranked stocks outperforming and the highest-ranked stocks underperforming. Of the four factor groups, only the Value group performed well. We increased our exposure to the value factor group, which provided a benefit. These changes allowed the portfolio to participate in the recent market rally even though our model was not providing the full potential. Overall, our philosophy will not change based on short-term trends or conditions in the market. Our goal is to add value through security selection, while attempting to neutralize other risk factors, such as market timing and sector rotation, for which there is not adequate compensation by the market. We will continue to use our disciplined approach to provide added value at controlled levels of risk.†
What major changes have occurred in the portfolio during the period covered by the report?
Other than typical re-balancing, no major changes occurred during the period. We are maintaining our disciplined process that has historically helped the Fund to deliver competitive returns.†
What is your outlook for the Fund?
We believe as investors gain confidence the economy should avoid a depression, the smallest, hardest-hit, most vulnerable stocks have bounced back most so far in this stage. As we move forward, and the economy does begin to recover, which most economists predict GDP will grow in the third quarter, we believe there will be a premium on investing in really well-run companies with strong balance sheets and favorable growth prospects. We believe the portfolio is positioned to continue do well in this market environment.†
Past performance does not guarantee future results.
| 1 | The Russell 1000® Value Index measures the performance of the large-cap value segment of the U.S. equity universe. It includes those Russell 1000® companies with lower price-to-book ratios and lower expected growth values. Investors cannot invest directly in an index. |
| 2 | The Gross Domestic Product (“GDP”) is the measure of the market value of the goods and services produced by labor and property in the United States. |
| 3 | The Chicago Federal Reserve National Activity Index is a monthly index designed to guage overall economic activity and inflationary pressure. |
| 4 | The S&P/Case-Shiller Home Price Index measures the residential housing market, tracking changes in the value of the residential real estate market in 20 metropolitan regions across the United States. |
| † | The composition of the Fund’s portfolio is subject to change. |
17

Sector Weightings as of July 31, 2009 (as a percentage of total investments)
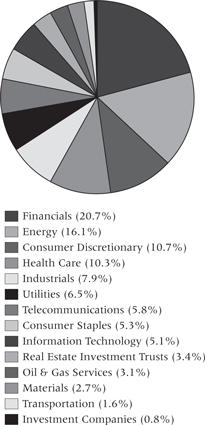
The composition of the Fund’s portfolio is subject to change.
Growth of a $10,000 Investment
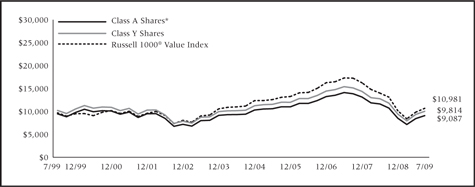
The hypothetical $10,000 investment graph above represents a comparison of the performance of the indicated share class versus a similar investment in the Fund’s benchmark.
Average Annual Total Returns as of July 31, 2009
| | | | | | | | | | | | |
| | | 1 Year | | | 3 Year | | | 5 Year | | | 10 Year | |
Class A Shares* | | -25.21 | % | | -10.36 | % | | -1.31 | % | | -0.95 | % |
Class B Shares** | | -24.87 | % | | -10.10 | % | | -1.13 | % | | -1.02 | % |
Class C Shares** | | -22.56 | % | | -9.46 | % | | -1.01 | % | | -1.17 | % |
Class Y Shares | | -20.97 | % | | -8.55 | % | | -0.02 | % | | -0.19 | % |
Russell 1000® Value Index | | -22.94 | % | | -9.47 | % | | -0.29 | % | | 0.94 | % |
| | | | |
Expense Ratios | | Class A | | | Class B | | | Class C | | | Class Y | |
Gross | | 1.48 | % | | 2.08 | % | | 2.08 | % | | 1.08 | % |
With Contractual Waivers | | 1.33 | % | | 2.08 | % | | 2.08 | % | | 1.08 | % |
Past performance does not guarantee future results. The performance data quoted represents past performance and current returns may be lower or higher. The investment return and principal value will fluctuate so that an investor’s shares, when redeemed, may be worth more or less than the original cost. To obtain performance information current to the most recent month end, please call 1-800-258-9232 or visit the Funds’ website at pacificcapitalfunds.com.
The above expense ratios are from the Funds’ prospectus dated November 28, 2008 and excludes the impact of underlying fund fees and expenses. Additional information pertaining to the Funds’ expense ratios for the year ended July 31, 2009 can be found in the financial highlights.
| * | Reflects 5.25% maximum front-end sales charge. |
| ** | Reflects maximum contingent deferred sales charge (CDSC) of up to 5.00% for the Class B Shares and a maximum CDSC of 1.00% for the Class C Shares (applicable only to redemptions within one year of purchase). |
The above hypothetical $10,000 graph and performance table do not reflect the deduction of taxes that a shareholder would pay on Fund distributions or redemption of Fund shares. Total returns reflect the waiver of various operational fees. Had these waivers not been in effect, performance quoted would have been lower.
The Class C Shares of the Fund commenced operations on April 30, 2004. Performance information for Class C Shares prior to April 30, 2004 is based on the performance of Class B Shares.
The performance of the Pacific Capital Value Fund is measured against the Russell 1000® Value Index, which measures the performance of the large-cap value segment of the U.S. equity universe. It includes those Russell 1000® companies with lower price-to-book ratios and lower expected growth values. The index is unmanaged and does not reflect the deduction of fees associated with a mutual fund, such as investment management and fund accounting fees. The Fund’s performance reflects the deduction of fees for these services. Investors cannot invest directly in an index.
Effective May 1, 2009, the offering of the Class C Shares was suspended, and will remain in effect until further notice.
The Pacific Capital Funds are distributed by Foreside Distribution Services, L.P. The Asset Management Group of Bank of Hawaii is investment adviser to the Fund and receives a fee for its services. Chicago Equity Partners, LLC, is sub-adviser to the Fund and is paid a fee for its services.
18

Investment Style
High-quality, intermediate-term, taxable
Investment Objective
High current income by investing at least 80% of its net assets in fixed income securities issued or guaranteed by the U.S. Government, its agencies and instrumentalities and in investment-grade corporate debt securities.
Investment Considerations
Bonds offer a relatively stable level of income, although bond prices will fluctuate, providing the potential for principal gain or loss. Generally, bond prices fall when interest rates rise, and vice versa. Intermediate-term, higher-quality bonds generally offer less risk than longer-term bonds and a lower rate of return.
The values of any of the Fund’s investments may also decline in response to events affecting the issuer or its credit rating.
Investment Process
| | • | | Top-down macroeconomic analysis of interest rate trends |
| | • | | Bottom-up credit research to identify high quality bonds |
Investment Management
Advised by Asset Management Group of Bank of Hawaii (AMG)
| | • | | AMG manages $3.5 billion in mutual fund assets. In addition, certain AMG personnel also manage approximately $1.14 billion in assets on behalf of Bank of Hawaii clients. |
How did the Fund perform compared to its benchmark?
For the 12-month period ended July 31, 2009, the Fund returned 6.93% (Class A Shares without sales charge), underperforming its benchmark, the Merrill Lynch Domestic Master Index1, which returned 8.02%.
What were the major factors in the market that influenced the Fund’s performance?
The Fund was overweight corporate bonds and agency mortgage-backed securities, and both these sectors have performed very well recently, which benefited the Fund. On the other hand, during the massive credit rally that occurred this year, lower quality corporate bonds outperformed higher quality corporate bonds, which caused the Fund to lag the benchmark as the Fund’s corporate holdings are of mostly higher credit quality.†
What major changes have occurred in the portfolio during the period covered by the report?
Near the end of last year, we added to our corporate bonds positions at historically cheap levels, and also implemented an overweight to agency mortgage-backed securities.†
What is your outlook for the Fund?
We believe with inflation under control, the Federal Reserve will be on hold for the remainder of the year, and interest rates are likely to remain range bound and relatively low in the near future. We believe in such an environment, the income and yield components of the Fund could be important sources of return.†
Past performance does not guarantee future results.
| 1 | The Merrill Lynch Domestic Master Index is a broad-based index that measures the total rate of return performance of the U.S. investment-grade bond market. Investors cannot invest directly in an index. |
| † | The composition of the Fund’s portfolio is subject to change. |
19

Portfolio Composition as of July 31, 2009 (as a percentage of total investments)
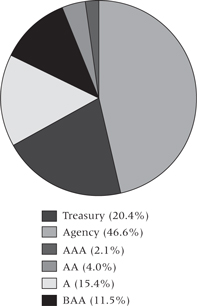
The composition of the Fund’s portfolio is subject to change.
Growth of a $10,000 Investment
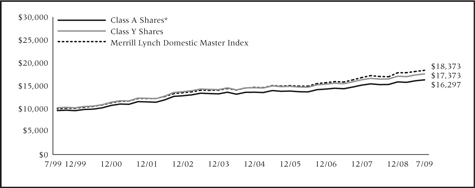
The hypothetical $10,000 investment graph above represents a comparison of the performance of the indicated share class versus a similar investment in the Fund’s benchmark.
Average Annual Total Returns as of July 31, 2009
| | | | | | | | | | | | |
| | | 1 Year | | | 3 Year | | | 5 Year | | | 10 Year | |
Class A Shares* | | 2.61 | % | | 4.20 | % | | 3.30 | % | | 5.01 | % |
Class B Shares** | | 2.14 | % | | 3.90 | % | | 3.18 | % | | 4.81 | % |
Class C Shares** | | 5.24 | % | | 4.85 | % | | 3.40 | % | | 4.66 | % |
Class Y Shares | | 7.15 | % | | 5.85 | % | | 4.36 | % | | 5.68 | % |
Merrill Lynch Domestic Master Index | | 8.02 | % | | 6.71 | % | | 5.28 | % | | 6.27 | % |
| | | | |
Expense Ratios | | Class A | | | Class B | | | Class C | | | Class Y | |
Gross | | 1.24 | % | | 1.84 | % | | 1.84 | % | | 0.84 | % |
With Contractual Waivers | | 1.09 | % | | 1.84 | % | | 1.84 | % | | 0.84 | % |
Past performance does not guarantee future results. The performance data quoted represents past performance and current returns may be lower or higher. The investment return and principal value will fluctuate so that an investor’s shares, when redeemed, may be worth more or less than the original cost. To obtain performance information current to the most recent month end, please call 1-800-258-9232 or visit the Funds’ website at pacificcapitalfunds.com.
The above expense ratios are from the Funds’ prospectus dated November 28, 2008. Additional information pertaining to the Funds’ expense ratios for the year ended July 31, 2009 can be found in the financial highlights.
| * | Reflects 4.00% maximum front-end sales charge. |
| ** | Reflects maximum contingent deferred sales charge (CDSC) of up to 5.00% for the Class B Shares and a maximum CDSC of 1.00% for the Class C Shares (applicable only to redemptions within one year of purchase). |
The above hypothetical $10,000 graph and performance table do not reflect the deduction of taxes that a shareholder would pay on Fund distributions or redemption of Fund shares. Total returns reflect the waiver of various operational fees. Had these waivers not been in effect, performance quoted would have been lower.
The Class C Shares of the Fund commenced operations on April 30, 2004. Performance information for Class C Shares prior to April 30, 2004 is based on the performance of Class B Shares.
The performance of the Pacific Capital High Grade Core Fixed Income Fund is measured against the Merrill Lynch Domestic Master Index, a broad-based index that measures the total rate of return performance of the U.S. investment-grade bond market. The index is unmanaged and does not reflect the deduction of fees associated with a mutual fund, such as investment management and fund accounting fees. The Fund’s performance reflects the deduction of fees for these services. Investors cannot invest directly in an index.
Effective May 1, 2009, the offering of the Class C Shares was suspended, and will remain in effect until further notice.
The Pacific Capital Funds are distributed by Foreside Distribution Services, L.P. The Asset Management Group of Bank of Hawaii is investment adviser to the Fund and receives a fee for its services.
20

Investment Style
High-quality, intermediate-term, tax-exempt
Investment Objective
High level of current income that is exempt from federal and Hawaii income tax by investing at least 80% of its net assets in investment grade municipal obligations. The Fund normally invests 50%–75% of its assets in Hawaii municipal obligations—debt securities issued by or on behalf of the State of Hawaii and its political subdivisions, agencies and instrumentalities that pay interest which is exempt from Hawaii income tax as well as federal income tax.
Investment Considerations
Income received from the Fund may be subject to certain state and local taxes and, depending on one’s tax status, to the federal alternative minimum tax. Bonds offer a relatively stable level of income, although bond prices will fluctuate, providing the potential for principal gain or loss. Generally, bond prices and values fall when interest rates rise, and vice versa. The longer the average maturity of the Fund’s portfolio, the greater the fluctuation in value. Since the Fund invests significantly in securities of issuers in Hawaii, it will also be affected by a variety of Hawaii’s economic and political factors.
The values of any of the Fund’s investments may also decline in response to events.
Investment Process
| | • | | Top-down macroeconomic analysis of interest rate trends |
| | • | | Bottom-up credit research to identify high quality bonds |
Investment Management
Advised by Asset Management Group of Bank of Hawaii (AMG)
| | • | | AMG manages $3.5 billion in mutual fund assets. In addition, certain AMG personnel also manage approximately $1.14 billion in assets on behalf of Bank of Hawaii clients. |
How did the Fund perform compared to its benchmark?
For the 12-month period ended July 31, 2009, the Fund gained 4.50% (Class A Shares without sales charge), underperforming its benchmark, the Barclays Capital Municipal Hawaii Bond Index1, which returned 7.18%.
What were the major factors in the market that influenced the Fund’s performance?
Like the rest of the financial markets, it also a very volatile year for the municipal market. The two-year yields started the fiscal year on July 31, 2008 at 2.31% and ended the year at 0.77%. The 30-year yields were relatively unchanged year-over-year from 4.80% to 4.84%. However, throughout the course of the year, the 30-year municipal yield was up to 5.89% on October 21, 2008 at the height of the financial crisis for the municipal market. This was at a time of large liquidations of municipal bonds into the secondary market from hedge funds, insurance companies and large mutual funds.
For the one-year period, the Fund had a strong return without expenses of 5.54% but trailed the benchmark which returned 7.18%. This was primarily due to two factors: the Fund held slightly lower credit quality bonds than the benchmark during this volatile period and flight to quality. Also, as the market rebounded strongly in 2009, we lowered the duration on the Fund to be more defensive, although the market continued to favor a longer duration positioning.†
For the Fund’s Class A Shares, the one-year percentile ranking was 66 amongst the Lipper Other States Intermediate Municipal Debt Funds category2 (78 out of 118 Funds) as of July 31, 2009.†
What major changes have occurred in the portfolio during the period covered by the report?
Following the strong rally starting the year we repositioned the portfolio towards a more defensive structure by selling some lower quality securities and shortening the duration.†
What is your outlook for the Fund?
Despite recent market improvements, there is still uncertainty about the growth prospects for the economy. The various government efforts to stabilize the markets seem to have achieved some success, but the budgetary strains most municipalities face will have longer term impacts. We will remain relatively cautious until we see more confirmation of sustainable economic improvement.
Past performance does not guarantee future results.
| 1 | The Barclays Capital Municipal Hawaii Bond Index (formerly the Lehman Brothers Municipal Hawaii Bond Index) is a rules-based, market-value weighted index engineered for the long-term tax-exempt Hawaii bond market. The index has four main sectors: general obligation bonds, revenue bonds, insured bonds and prerefunded bonds. Investors cannot invest directly in an index. |
| 2 | For the one-year period ended July 31, 2009, the Pacific Capital Tax-Free Securities Fund (Class A Shares) ranked 78 out of 118 funds within the Lipper Other States Intermediate Muni Debt Funds category. For the five- and 10-year periods ended July 31, 2009, the Fund ranked 67 out of 110 and 34 out of 80, respectively. The Lipper ranking is based on total return and does not reflect a sales charge. |
| † | The composition of the Fund’s portfolio is subject to change. |
21

Credit Quality as of July 31, 2009 (as a percentage of total investments)
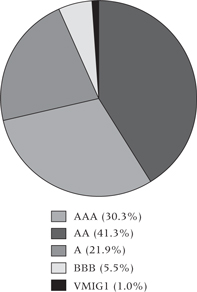
The composition of the Fund’s portfolio is subject to change.
Growth of a $10,000 Investment
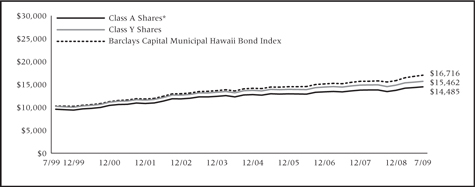
The hypothetical $10,000 investment graph above represents a comparison of the performance of the indicated share class versus a similar investment in the Fund’s benchmark. The graph does not reflect the deduction of taxes that a shareholder would pay on Fund distributions or redemption of Fund shares.
Average Annual Total Returns as of July 31, 2009
| | | | | | | | | | | | |
| | | 1 Year | | | 3 Year | | | 5 Year | | | 10 Year | |
Class A Shares* | | 0.35 | % | | 2.22 | % | | 2.26 | % | | 3.77 | % |
Class B Shares** | | -0.27 | % | | 1.90 | % | | 2.16 | % | | 3.58 | % |
Class C Shares** | | 2.81 | % | | 2.90 | % | | 2.37 | % | | 3.45 | % |
Class Y Shares | | 4.75 | % | | 3.86 | % | | 3.34 | % | | 4.45 | % |
Barclays Capital Municipal Hawaii Bond Index | | 7.18 | % | | 5.13 | % | | 4.46 | % | | 5.27 | % |
| | | | |
Expense Ratios | | Class A | | | Class B | | | Class C | | | Class Y | |
Gross | | 1.25 | % | | 1.85 | % | | 1.85 | % | | 0.85 | % |
With Contractual Waivers | | 1.10 | % | | 1.85 | % | | 1.85 | % | | 0.85 | % |
Past performance does not guarantee future results. The performance data quoted represents past performance and current returns may be lower or higher. The investment return and principal value will fluctuate so that an investor’s shares, when redeemed, may be worth more or less than the original cost. To obtain performance information current to the most recent month end, please call 1-800-258-9232 or visit the Funds’ website at pacificcapitalfunds.com.
The above expense ratios are from the Funds’ prospectus dated November 28, 2008. Additional information pertaining to the Funds’ expense ratios for the year ended July 31, 2009 can be found in the financial highlights.
| * | Reflects 4.00% maximum front-end sales charge. |
| ** | Reflects maximum contingent deferred sales charge (CDSC) of up to 5.00% for the Class B Shares and a maximum CDSC of 1.00% for the Class C Shares (applicable only to redemptions within one year of purchase). |
The above hypothetical $10,000 graph and performance table do not reflect the deduction of taxes that a shareholder would pay on Fund distributions or redemption of Fund shares. Total returns reflect the waiver of various operational fees. Had these waivers not been in effect, performance quoted would have been lower.
The Class C Shares of the Fund commenced operations on April 30, 2004. Performance information for Class C Shares prior to April 30, 2004 is based on the performance of Class B Shares.
The performance of the Pacific Capital Tax-Free Securities Fund is measured against the Barclays Capital Municipal Hawaii Bond Index, a rules-based, market-value weighted index engineered for the long-term tax-exempt Hawaii bond market. The index has four main sectors: general obligation bonds, revenue bonds, insured bonds and prerefunded bonds. The index is unmanaged and does not reflect the deduction of fees associated with a mutual fund, such as investment management and fund accounting fees. The Fund’s performance reflects the deduction of fees for these services. Investors cannot invest directly in an index.
Effective May 1, 2009, the offering of the Class C Shares was suspended, and will remain in effect until further notice.
The Pacific Capital Funds are distributed by Foreside Distribution Services, L.P. The Asset Management Group of Bank of Hawaii is investment adviser to the Fund and receives a fee for its services.
22

Investment Style
High-quality, short-intermediate-term, taxable
Investment Objective
High current income consistent with prudent capital risk by investing at least 80% of its net assets in fixed income securities issued or guaranteed by the U.S. Government, its agencies and instrumentalities and in investment-grade corporate debt securities. Under normal market and interest rate conditions, the Fund’s duration will be between two and five years.
Investment Considerations
Bonds offer a relatively stable level of income, although bond prices will fluctuate with interest rate changes, providing the potential for principal gain or loss. Generally, bond prices and values fall when interest rates rise, and vice versa. Intermediate-term, higher-quality bonds generally offer less risk than longer-term bonds and a lower rate of return. Government and agency guarantees apply only to the underlying securities and not to the Fund.
The values of any of the Fund’s investments may also decline in response to events affecting the issuer or its credit rating.
Investment Process
| | • | | Top-down macroeconomic analysis of interest rate trends |
| | • | | Bottom-up credit research to identify high quality bonds |
Investment Management
Advised by Asset Management Group of Bank of Hawaii (AMG)
| | • | | AMG manages $3.5 billion in mutual fund assets. In addition, certain AMG personnel also manage approximately $1.14 billion in assets on behalf of Bank of Hawaii clients. |
How did the Fund perform compared to its benchmark?
For the 12-month period ended July 31, 2009, the Fund gained 7.30% (Class A Shares without sales charge), and outperformed its benchmark, the Merrill Lynch Domestic Master 1–5-Year Index1, which returned 6.37%.
What were the major factors in the market that influenced the Fund’s performance?
The sustained flight to quality rally for Treasury notes in 2008 is subsiding for the year-to-date of 2009. Investor confidence has returned for both corporate and agency debt. Federal support to maintain appropriate capital levels while the Government-Sponsored Enterprises, such as Fannie Mae and Freddie Mac, restructure their business models appears solid and as a result their debt performed well versus Treasury securities. Corporate debt found even more enthusiastic sponsorship in the market as bonds won versus stocks from an assets allocation perspective and additionally the historical wide new issue spread premiums drew many investors off of the sidelines into the market.†
What major changes have occurred in the portfolio during the period covered by the report?
We will attempt to maintain a neutral duration target versus the benchmark and continue to work on neutralizing our yield curve exposures, in addition to our total portfolio duration, as markets remain volatile.†
What is your outlook for the Fund?
We believe that the fed funds rate may remain at 0.00–0.25% and that the question of further easing is effectively off the table. In fact, fed funds futures are currently pricing the first full 1/4 of 1% or 25 basis point (0.25%) rate hike for April 2010. We believe that until the backslide in GDP2 and employment is reversed the Treasury, Federal Reserve and Congress will continue with various attempts at stimulating economic activity through numerous measures such as the now infamous “cash for clunkers”. The 2008 Emergency Economic Stabilization Act that created the Troubled Asset Relief Program3 (“TARP”) appears to be working as intended. We believe ongoing stabilization in the credit markets in spite a challenging operating environment may continue to benefit the portfolio particularly with regard to its high quality corporate positions.†
Past performance does not guarantee future results.
| 1 | Merrill Lynch Domestic Master 1–5-Year Index is a broad-based measure of the total rate of return performance of the short-term U.S. investment-grade bond market. Investors cannot invest directly in an index. |
| 2 | The Gross Domestic Product (“GDP”) is the measure of the market value of the goods and services produced by labor and property in the United States. |
| 3 | The Troubled Asset Relief Program (“TARP”) is a program of the United States government to purchase assets and equity from financial institutions to strengthen its financial sector. It is the largest component of the government’s measures in 2008 to address the subprime mortgage crisis. |
| † | The composition of the Fund’s portfolio is subject to change. |
23

Portfolio Composition as of July 31, 2009 (as a percentage of total investments)
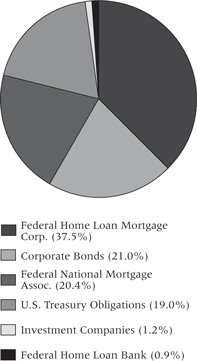
The composition of the Fund’s portfolio is subject to change.
Growth of a $10,000 Investment
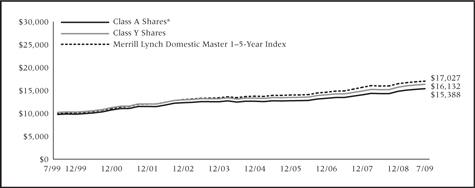
The hypothetical $10,000 investment graph above represents a comparison of the performance of the indicated share class versus a similar investment in the Fund’s benchmark.
Average Annual Total Returns as of July 31, 2009
| | | | | | | | | | | | |
| | | 1 Year | | | 3 Year | | | 5 Year | | | 10 Year | |
Class A Shares* | | 4.92 | % | | 5.10 | % | | 3.74 | % | | 4.40 | % |
Class C Shares** | | 5.51 | % | | 5.12 | % | | 3.42 | % | | 4.23 | % |
Class Y Shares | | 7.55 | % | | 6.16 | % | | 4.47 | % | | 4.90 | % |
Merrill Lynch Domestic Master 1–5-Year Index | | 6.37 | % | | 6.16 | % | | 4.74 | % | | 5.47 | % |
| | | | |
Expense Ratios | | | | | Class A | | | Class C | | | Class Y | |
Gross | | | | | 1.23 | % | | 1.83 | % | | 0.83 | % |
With Contractual Waivers | | | | | 1.08 | % | | 1.83 | % | | 0.83 | % |
Past performance does not guarantee future results. The performance data quoted represents past performance and current returns may be lower or higher. The investment return and principal value will fluctuate so that an investor’s shares, when redeemed, may be worth more or less than the original cost. To obtain performance information current to the most recent month end, please call 1-800-258-9232 or visit the Funds’ website at pacificcapitalfunds.com.
The above expense ratios are from the Funds’ prospectus dated November 28, 2008. Additional information pertaining to the Funds’ expense ratios for the year ended July 31, 2009 can be found in the financial highlights.
| * | Reflects 2.25% maximum front-end sales charge. |
| ** | Reflects maximum contingent deferred sales charge (CDSC) of up to 1.00% (applicable only to redemptions within one year of purchase). |
The above hypothetical $10,000 graph and performance table do not reflect the deduction of taxes that a shareholder would pay on Fund distributions or redemption of Fund shares. Total returns reflect the waiver of various operational fees. Had these waivers not been in effect, performance quoted would have been lower.
The Class C Shares of the Fund commenced operations on April 30, 2004. Performance information for Class C Shares prior to April 30, 2004 is based on the performance of Class A Shares, which does not reflect the higher 12b-1 fees charged to Class C Shares. Had the higher 12b-1 fees been reflected, total return figures may have been adversely affected.
The performance of the Pacific Capital High Grade Short Intermediate Fixed Income Fund is measured against the Merrill Lynch Domestic Master 1–5-Year Index, a broad-based index that measures the total rate of return performance of the short-term U.S. investment-grade bond market. The index is unmanaged and does not reflect the deduction of fees associated with a mutual fund, such as investment management and fund accounting fees. The Fund’s performance reflects the deduction of fees for these services. Investors cannot invest directly in an index.
Effective May 1, 2009, the offering of the Class C Shares was suspended, and will remain in effect until further notice.
The Pacific Capital Funds are distributed by Foreside Distribution Services, L.P. The Asset Management Group of Bank of Hawaii is investment adviser to the Fund and receives a fee for its services.
24

Investment Style
High-quality, short-intermediate-term, tax-exempt
Investment Objective
High current income that is exempt from federal and Hawaii income tax by investing at least 80% of its net assets in investment grade municipal obligations. The Fund normally invests 50%–75% of its assets in Hawaii municipal obligations—debt securities issued by or on behalf of the State of Hawaii and its political subdivisions, agencies and instrumentalities that pay interest which is exempt from Hawaii income tax as well as federal income tax. Seeks to provide greater price stability than a long-term bond fund.
Investment Considerations
Income received from the Fund may be subject to certain state and local taxes and, depending on one’s tax status, to the federal alternative minimum tax. Bonds offer a relatively stable level of income, although bond prices will fluctuate, providing the potential for principal gain or loss. Generally, bond prices and values fall when interest rates rise, and vice versa. Intermediate-term, higher-quality bonds generally offer less risk than longer-term bonds and a lower rate of return. Since the Fund invests significantly in securities of issuers in Hawaii, it will also be affected by a variety of Hawaii’s economic and political factors.
The values of any of the Fund’s investments may also decline in response to events affecting the issuer or its credit rating.
Investment Process
| | • | | Top-down macroeconomic analysis of interest rate trends |
| | • | | Bottom-up credit research to identify high quality bonds |
Investment Management
Advised by Asset Management Group of Bank of Hawaii (AMG)
| | • | | AMG manages $3.5 billion in mutual fund assets. In addition, certain AMG personnel also manage approximately $1.14 billion in assets on behalf of Bank of Hawaii clients. |
How did the Fund perform compared to its benchmark?
For the 12-month period ended July 31, 2009, the Fund gained 3.56% (Class A Shares without sales charge), underperforming its benchmark, the Barclays Capital Municipal Hawaii 3-Year Bond Index1, which returned 7.12%.
What were the major factors in the market that influenced the Fund’s performance?
Like the rest of the financial markets, it also a very volatile year for the municipal market. The two-year yields started the fiscal year on July 31, 2008 at 2.31% and ended the year at 0.77%. The 30-year yields were relatively unchanged year-over-year from 4.80% to 4.84%. However, throughout the course of the year, the 30-year municipal yield was up to 5.89% on October 21, 2008 at the height of the financial crisis for the municipal market. This was at a time of large liquidations of municipal bonds into the secondary market from hedge funds, insurance companies and large mutual funds.
For the one-year period, the Fund had a strong return without expenses of 4.65% but trailed the benchmark which returned 7.12%. This was primarily due to two factors: the Fund held slightly lower credit quality bonds than the benchmark during this volatile period and flight to quality. Also, as the market rebounded strongly in 2009, we lowered the duration on the Fund to be more defensive, although the market continued to favor a longer duration positioning.†
The Fund’s Class A Shares was in line with the median peer group rankings for the one-year period with a 50th percentile in the Lipper Other States Intermediate Municipal Debt category2 (6 out of 11 Funds) as of July 31, 2009.†
What major changes have occurred in the portfolio during the period covered by the report?
Following the strong rally starting the year, we repositioned the portfolio towards a more defensive structure by selling some lower quality securities and shortening the duration.†
What is your outlook for the Fund?
Despite recent market improvements, there is still uncertainty about the growth prospects for the economy. The various government efforts to stabilize the markets seem to have achieved some success, but the budgetary strains most municipalities face will have longer term impacts. We will remain relatively cautious until we see more confirmation of sustainable economic improvement.
Past performance does not guarantee future results.
| 1 | The Barclays Capital Municipal Hawaii 3-Year Bond Index (formerly the Lehman Brothers Capital Municipal Hawaii 3-Year Bond Index) is the 2–4 year component of the Barclays Capital Hawaii Municipal Bond Index. The index is a rules-based, market-value-weighted index engineered for the Hawaii tax-exempt bond market. The index has four main sectors: general obligation bonds, revenue bonds, insured bonds and prerefunded bonds. Investors cannot invest directly in an index. |
| 2 | For the one-year period ended July 31, 2009, the Pacific Capital Tax-Free Short Intermediate Securities Fund (Class A Shares) ranked 6 out of 11 funds within the Lipper Other States Short Intermediate Muni Debt Funds category. For the five- and 10-year periods ended July 31, 2009, the Fund ranked 7 out of 10 and 6 out of 9, respectively. The Lipper ranking is based on total return and does not reflect a sales charge. |
| † | The composition of the Fund’s portfolio is subject to change. |
25

Credit Quality as of July 31, 2009 (as a percentage of total investments)
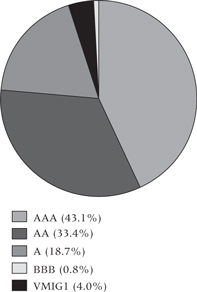
The composition of the Fund’s portfolio is subject to change.
Growth of a $10,000 Investment
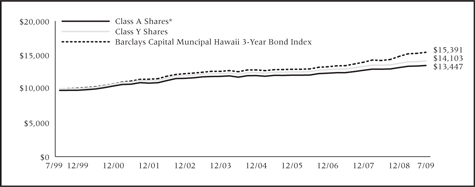
The hypothetical $10,000 investment graph above represents a comparison of the performance of the indicated share class versus a similar investment in the Fund’s benchmark.
Average Annual Total Returns as of July 31, 2009
| | | | | | | | | | | | |
| | | 1 Year | | | 3 Year | | | 5 Year | | | 10 Year | |
Class A Shares* | | 1.27 | % | | 2.79 | % | | 2.19 | % | | 3.01 | % |
Class C Shares** | | 1.80 | % | | 2.77 | % | | 1.88 | % | | 2.84 | % |
Class Y Shares | | 3.80 | % | | 3.81 | % | | 2.90 | % | | 3.50 | % |
Barclays Capital Municipal Hawaii 3-Year Bond Index | | 7.12 | % | | 5.75 | % | | 4.06 | % | | 4.41 | % |
| | | | |
Expense Ratios | | | | | Class A | | | Class C | | | Class Y | |
Gross | | | | | 1.27 | % | | 1.87 | % | | 0.87 | % |
With Contractual Waivers | | | | | 1.12 | % | | 1.87 | % | | 0.87 | % |
Past performance does not guarantee future results. The performance data quoted represents past performance and current returns may be lower or higher. The investment return and principal value will fluctuate so that an investor’s shares, when redeemed, may be worth more or less than the original cost. To obtain performance information current to the most recent month end, please call 1-800-258-9232 or visit the Funds’ website at pacificcapitalfunds.com.
The above expense ratios are from the Funds’ prospectus dated November 28, 2008. Additional information pertaining to the Funds’ expense ratios for the year ended July 31, 2009 can be found in the financial highlights.
| * | Reflects 2.25% maximum front-end sales charge. |
| ** | Reflects maximum contingent deferred sales charge (CDSC) of up to 1.00% (applicable only to redemptions within one year of purchase). |
The above hypothetical $10,000 graph and performance table do not reflect the deduction of taxes that a shareholder would pay on Fund distributions or redemption of Fund shares. Total returns reflect the waiver of various operational fees. Had these waivers not been in effect, performance quoted would have been lower.
The Class C Shares of the Fund commenced operations on April 30, 2004. Performance information for Class C Shares prior to April 30, 2004 is based on the performance of Class A Shares, which does not reflect the higher 12b-1 fees charged to Class C Shares. Had the higher 12b-1 fees been reflected, total return figures may have been adversely affected.
The performance of the Pacific Capital Tax-Free Short Intermediate Securities Fund is measured against the Barclays Capital Municipal Hawaii 3–Year Bond Index, which is the 2-4 year component of the Barclays Capital Hawaii Municipal Bond Index and is a rules-based, market-value-weighted index engineered for the Hawaii tax-exempt bond market. The index has four main sectors: general obligation bonds, revenue bonds, insured bonds, and prerefunded bonds. The index is unmanaged and does not reflect the deduction of fees associated with a mutual fund, such as investment management and fund accounting fees. The Fund’s performance reflects the deduction of fees for these services. Investors cannot invest directly in an index.
Effective May 1, 2009, the offering of the Class C Shares was suspended, and will remain in effect until further notice.
The Pacific Capital Funds are distributed by Foreside Distribution Services, L.P. The Asset Management Group of Bank of Hawaii is investment adviser to the Fund and receives a fee for its services.
26

Investment Style
High-quality, short-term, taxable
Investment Objective
High current income consistent with capital preservation by investing 100% in short-term debt securities issued or guaranteed by the U.S. Government and its agencies. Under normal market and interest rate conditions, the Fund’s target duration is not expected to exceed 2.5 years.
Investment Considerations
Bonds offer a relatively stable level of income, although bond prices will fluctuate with interest rate changes, providing the potential for principal gain or loss. Generally, bond prices fall when interest rates rise, and vice versa. Intermediate-term, higher-quality bonds generally offer less risk than longer-term bonds and a lower rate of return. Government and agency guarantees apply only to the underlying securities and not to the Fund.
The values of any of the Fund’s investments may also decline in response to events affecting the issuer or its credit rating.
Investment Process
| | • | | Top-down macroeconomic analysis of interest rate trends |
| | • | | Bottom-up credit research to identify high quality bonds |
Investment Management
Advised by Asset Management Group of Bank of Hawaii (AMG)
| | • | | AMG manages $3.5 billion in mutual fund assets. In addition, certain AMG personnel also manage approximately $1.14 billion in assets on behalf of Bank of Hawaii clients. |
How did the Fund perform compared to its benchmark?
For the 12-month period ended July 31, 2009, the Fund gained 3.24% (Class A Shares without sales charge), underperforming its benchmark, the Merrill Lynch 1–3-Year U.S. Treasury Index1, which returned 4.11%.
What were the major factors in the market that influenced the Fund’s performance?
The sustained flight to quality rally for Treasury notes in 2008 is subsiding for the year-to-date of 2009. Investor confidence has returned for both corporate and agency debt. Federal support to maintain appropriate capital levels while the Government-Sponsored Enterprises, such as Fannie Mae and Freddie Mac, restructure their business models appears solid and as a result their debt performed well versus Treasury securities. In spite of decent performance from GSE debt the Fund’s shorter than index duration allocation restrained performance, however, considering the low absolute level of rates and the potential for an increase in Government spending and the Treasury’s debt load to potentially drive up interest rates, we view the Fund’s positioning as justifiable and prudent.
What major changes have occurred in the portfolio during the period covered by the report?
The Fund is maintaining a shorter than benchmark duration position versus the 1–3-year Treasury index. The Fund’s Treasury/Agency weighting is approximately 50/50, we believe that the spreads on Agency debt could allow the Fund to uphold its competitive performance while moderating its Agency credit exposure versus heavier weightings of GSE debentures in prior years.†
What is your outlook for the Fund?
We believe that the fed funds rate may remain at 0.00-0.25% and that the question of further easing is effectively off the table. In fact, fed funds futures are currently pricing the first full 1/ 4 of 1% or 25 basis point (0.25%) rate hike for April 2010. We believe that until the backslide in GDP2 and employment is reversed the Treasury, Federal Reserve and Congress will continue with various attempts at stimulating economic activity through numerous measures such as the now infamous “cash for clunkers.” The 2008 Emergency Economic Stabilization Act that created the Troubled Asset Relief Program3 (“TARP”) appears to be working as intended. We believe ongoing stabilization in the credit markets in spite of a challenging operating environment for mortgage finance GSEs may continue to benefit the portfolio versus the vulnerable low yields on Treasury Securities.†
Past performance does not guarantee future results.
| 1 | The Merrill Lynch 1–3-Year Treasury Index is comprised of United States Treasury issues with maturities from one- to three-years. Investors cannot invest directly in an index. |
| 2 | The Gross Domestic Product (“GDP”) is the measure of the market value of the goods and services produced by labor and property in the United States. |
| 3 | The Troubled Asset Relief Program (“TARP”) is a program of the United States government to purchase assets and equity from financial institutions to strengthen its financial sector. It is the largest component of the government’s measures in 2008 to address the subprime mortgage crisis. |
| † | The composition of the Fund’s portfolio is subject to change. |
27

Portfolio Composition as of July 31, 2009 (as a percentage of total investments)
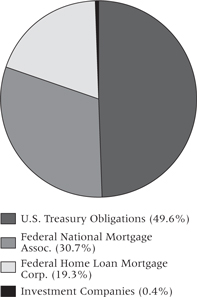
The composition of the Fund’s portfolio is subject to change.
Growth of a $10,000 Investment
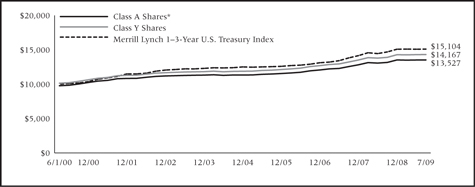
The hypothetical $10,000 investment graph above represents a comparison of the performance of the indicated share class versus a similar investment in the Fund’s benchmark.
Average Annual Total Returns as of July 31, 2009
| | | | | | | | | | | | |
| | | 1 Year | | | 3 Year | | | 5 Year | | | Since Inception
(6/1/00) | |
Class A Shares* | | 0.88 | % | | 3.85 | % | | 3.20 | % | | 3.35 | % |
Class B Shares** | | -1.48 | % | | 2.94 | % | | 2.72 | % | | 2.94 | % |
Class C Shares** | | 1.58 | % | | 3.89 | % | | 2.91 | % | | 2.86 | % |
Class Y Shares | | 3.50 | % | | 4.94 | % | | 3.92 | % | | 3.87 | % |
Merrill Lynch 1–3-Year U.S. Treasury Index | | 4.11 | % | | 5.37 | % | | 4.03 | % | | 4.60 | % |
| | | | |
Expense Ratios | | Class A | | | Class B | | | Class C | | | Class Y | |
Gross | | 1.09 | % | | 1.69 | % | | 1.69 | % | | 0.69 | % |
With Contractual Waivers | | 0.94 | % | | 1.69 | % | | 1.69 | % | | 0.69 | % |
Past performance does not guarantee future results. The performance data quoted represents past performance and current returns may be lower or higher. The investment return and principal value will fluctuate so that an investor’s shares, when redeemed, may be worth more or less than the original cost. To obtain performance information current to the most recent month end, please call 1-800-258-9232 or visit the Funds’ website at pacificcapitalfunds.com.
The above expense ratios are from the Funds’ prospectus dated November 28, 2008. Additional information pertaining to the Funds’ expense ratios for the year ended July 31, 2009 can be found in the financial highlights.
| * | Reflects 2.25% maximum front-end sales charge. |
| ** | Reflects maximum contingent deferred sales charge (CDSC) of up to 5.00% for the Class B Shares and a maximum CDSC of 1.00% for the Class C Shares (applicable only to redemptions within one year of purchase). |
The above growth of $10,000 graph and performance table do not reflect the deduction of taxes that a shareholder would pay on Fund distributions or redemption of Fund shares. Total returns reflect the waiver of various operational fees. Had these waivers not been in effect, performance quoted would have been lower.
The Pacific Capital U.S. Government Short Fixed Income Fund’s inception date was June 1, 2000. The Class A and Class B Shares were not in existence prior to August 1, 2000, and the Class C Shares prior to April 30, 2004. Performance information for Class C Shares prior to April 30, 2004 is based on the performance of Class B Shares. Performance for any period prior to August 1, 2000 is based on the performance of Class Y Shares, which does not reflect the higher 12b-1 fees charged to the Class A, Class B and Class C Shares. Had the higher 12b-1 fees been reflected, total return figures may have been adversely affected.
The performance of the Pacific Capital U.S. Government Short Fixed Income Fund is measured against the Merrill Lynch 1–3-Year U.S. Treasury Index, which is comprised of U.S. Treasury issues with maturities from one- to three-years. The index is unmanaged and does not reflect the deduction of fees associated with a mutual fund, such as investment management and fund accounting fees. The Fund’s performance reflects the deduction of fees for these services. Investors cannot invest directly in an index.
Effective May 1, 2009, the offering of the Class C Shares was suspended, and will remain in effect until further notice.
The Pacific Capital Funds are distributed by Foreside Distribution Services, L.P. The Asset Management Group of Bank of Hawaii is investment adviser to the Fund and receives a fee for its services.
28
PACIFIC CAPITAL FUNDS
Statements of Assets and Liabilities
July 31, 2009
| | | | | | | | | | | | | | | | |
| | | New Asia
Growth
Fund | | | International
Stock
Fund | | | Small Cap
Fund | | | Mid-Cap
Fund | |
| Assets: | | | | | | | | | | | | | | | | |
Investments, at cost | | $ | 75,195,577 | | | $ | 85,045,331 | | | $ | 131,649,036 | | | $ | 30,722,742 | |
| | | | | | | | | | | | | | | | |
Investments, at value | | $ | 79,869,662 | | | $ | 80,294,909 | | | $ | 133,357,621 | | | $ | 32,224,016 | |
Cash | | | — | | | | — | | | | 610 | | | | — | |
Foreign currency, at value (cost $2,127,628, $46,836, $- and $-, respectively) | | | 2,105,644 | | | | 47,137 | | | | — | | | | — | |
Unrealized appreciation on forward foreign currency exchange contracts | | | — | | | | 3 | | | | — | | | | — | |
Income receivable | | | 173,615 | | | | 143,775 | | | | 89,802 | | | | 27,013 | |
Receivable for capital shares issued | | | 43,778 | | | | 2,844 | | | | 157,590 | | | | 36 | |
Receivable for investments sold | | | — | | | | 445,058 | | | | 151,836 | | | | — | |
Reclaims receivable | | | — | | | | 366,824 | | | | — | | | | — | |
Prepaid expenses and other assets | | | 3,192 | | | | 15,818 | | | | 31,317 | | | | 2,613 | |
| | | | | | | | | | | | | | | | |
Total Assets | | | 82,195,891 | | | | 81,316,368 | | | | 133,788,776 | | | | 32,253,678 | |
| | | | | | | | | | | | | | | | |
| Liabilities: | | | | | | | | | | | | | | | | |
Cash overdraft | | | — | | | | 130,194 | | | | — | | | | — | |
Payable for capital shares redeemed | | | 133,340 | | | | 191,247 | | | | 272,653 | | | | 83,101 | |
Payable for investments purchased | | | 373,415 | | | | 103,538 | | | | 15,050 | | | | — | |
Unrealized depreciation on forward foreign currency exchange contracts | | | — | | | | 1,836 | | | | — | | | | — | |
Accrued expenses and other payables: | | | | | | | | | | | | | | | | |
Investment advisory fees | | | 25,555 | | | | 22,576 | | | | 39,681 | | | | 9,023 | |
Sub-investment advisory fees | | | 31,943 | | | | 38,308 | | | | 69,151 | | | | 5,156 | |
Administration and sub-administration fees | | | 5,750 | | | | 5,805 | | | | 9,795 | | | | 2,320 | |
Compliance service fees | | | 489 | | | | 837 | | | | 1,883 | | | | 337 | |
Distribution fees | | | 1,061 | | | | 459 | | | | 17,940 | | | | 228 | |
Other fees | | | 42,481 | | | | 64,467 | | | | 97,203 | | | | 19,736 | |
| | | | | | | | | | | | | | | | |
Total Liabilities | | | 614,034 | | | | 559,267 | | | | 523,356 | | | | 119,901 | |
| | | | | | | | | | | | | | | | |
| Net Assets: | | | | | | | | | | | | | | | | |
Capital (no par value) | | | 85,381,280 | | | | 131,960,255 | | | | 290,947,392 | | | | 54,258,628 | |
Undistributed (distributions in excess of) net investment income | | | (163,007 | ) | | | (244,504 | ) | | | — | | | | 11,731 | |
Accumulated net realized losses from investments | | | (8,289,569 | ) | | | (46,234,434 | ) | | | (159,390,557 | ) | | | (23,637,856 | ) |
Net unrealized appreciation (depreciation) on investments | | | 4,653,153 | | | | (4,724,216 | ) | | | 1,708,585 | | | | 1,501,274 | |
| | | | | | | | | | | | | | | | |
Net Assets | | $ | 81,581,857 | | | $ | 80,757,101 | | | $ | 133,265,420 | | | $ | 32,133,777 | |
| | | | | | | | | | | | | | | | |
Net Assets | | | | | | | | | | | | | | | | |
Class A | | $ | 3,793,547 | | | $ | 1,248,355 | | | $ | 55,686,612 | | | $ | 502,988 | |
Class B | | | 46,206 | | | | 49,258 | | | | 655,600 | | | | — | |
Class C | | | 385,809 | | | | 195,960 | | | | 7,389,163 | | | | 143,534 | |
Class Y | | | 77,356,295 | | | | 79,263,528 | | | | 69,534,045 | | | | 31,487,255 | |
| | | | | | | | | | | | | | | | |
Total | | $ | 81,581,857 | | | $ | 80,757,101 | | | $ | 133,265,420 | | | $ | 32,133,777 | |
| | | | | | | | | | | | | | | | |
Outstanding units of beneficial interest (shares) | | | | | | | | | | | | | | | | |
Class A | | | 314,610 | | | | 192,646 | | | | 5,621,898 | | | | 72,713 | |
Class B | | | 4,181 | | | | 8,267 | | | | 72,759 | | | | — | |
Class C | | | 35,065 | | | | 32,972 | | | | 827,980 | | | | 21,408 | |
Class Y | | | 6,251,746 | | | | 11,875,921 | | | | 6,839,585 | | | | 4,541,012 | |
| | | | | | | | | | | | | | | | |
Total | | | 6,605,602 | | | | 12,109,806 | | | | 13,362,222 | | | | 4,635,133 | |
| | | | | | | | | | | | | | | | |
Net Asset Value | | | | | | | | | | | | | | | | |
Class A—redemption price per share | | $ | 12.06 | | | $ | 6.48 | | | $ | 9.91 | | | $ | 6.92 | |
| | | | | | | | | | | | | | | | |
Class A—maximum sales charge | | | 5.25 | % | | | 5.25 | % | | | 5.25 | % | | | 5.25 | % |
| | | | | | | | | | | | | | | | |
Class A—Maximum offering price per share
(100%/(100%-maximum sales charge) of net asset value adjusted to the nearest cent) | | $ | 12.73 | | | $ | 6.84 | | | $ | 10.46 | | | $ | 7.30 | |
| | | | | | | | | | | | | | | | |
Class B—offering price per share* | | $ | 11.05 | | | $ | 5.96 | | | $ | 9.01 | | | | — | |
| | | | | | | | | | | | | | | | |
Class C—offering price per share* | | $ | 11.00 | | | $ | 5.94 | | | $ | 8.92 | | | $ | 6.70 | |
| | | | | | | | | | | | | | | | |
Class Y—offering and redemption price per share | | $ | 12.37 | | | $ | 6.67 | | | $ | 10.17 | | | $ | 6.93 | |
| | | | | | | | | | | | | | | | |
| * | Redemption price per share varies based on length of time shares are held. |
See notes to financial statements.
29
PACIFIC CAPITAL FUNDS
Statements of Assets and Liabilities, continued
July 31, 2009
| | | | | | | | | | | | | | | | |
| | | Growth
Stock
Fund | | | Growth and
Income
Fund | | | Value
Fund | | | High Grade
Core Fixed
Income
Fund | |
| Assets: | | | | | | | | | | | | | | | | |
Investments, at cost | | $ | 77,543,781 | | | $ | 74,413,616 | | | $ | 68,473,665 | | | $ | 197,251,299 | |
| | | | | | | | | | | | | | | | |
Investments, at value | | $ | 76,041,736 | | | $ | 69,432,155 | | | $ | 64,265,881 | | | $ | 201,233,995 | |
Income receivable | | | 40,671 | | | | 71,177 | | | | 100,132 | | | | 1,894,291 | |
Receivable for capital shares issued | | | 3,776 | | | | 400 | | | | 547 | | | | — | |
Receivable for investments sold | | | — | | | | — | | | | — | | | | 1,463,041 | |
Prepaid expenses and other assets | | | 10,796 | | | | 11,155 | | | | 4,937 | | | | 14,867 | |
| | | | | | | | | | | | | | | | |
Total Assets | | | 76,096,979 | | | | 69,514,887 | | | | 64,371,497 | | | | 204,606,194 | |
| | | | | | | | | | | | | | | | |
| Liabilities: | | | | | | | | | | | | | | | | |
Distributions payable | | | — | | | | — | | | | — | | | | 65,100 | |
Payable for capital shares redeemed | | | 335,311 | | | | 193,818 | | | | 197,092 | | | | 676,682 | |
Payable for investments purchased | | | — | | | | — | | | | — | | | | 1,104,004 | |
Accrued expenses and other payables: | | | | | | | | | | | | | | | | |
Investment advisory fees | | | 21,747 | | | | 19,791 | | | | 18,086 | | | | 77,936 | |
Sub-investment advisory fees | | | 15,533 | | | | 14,136 | | | | 12,918 | | | | — | |
Administration and sub-administration fees | | | 5,592 | | | | 5,089 | | | | 4,651 | | | | 15,587 | |
Compliance service fees | | | 865 | | | | 774 | | | | 726 | | | | 2,469 | |
Distribution fees | | | 2,292 | | | | 1,495 | | | | 1,057 | | | | 1,576 | |
Other fees | | | 35,796 | | | | 31,061 | | | | 27,422 | | | | 57,594 | |
| | | | | | | | | | | | | | | | |
Total Liabilities | | | 417,136 | | | | 266,164 | | | | 261,952 | | | | 2,000,948 | |
| | | | | | | | | | | | | | | | |
| Net Assets: | | | | | | | | | | | | | | | | |
Capital (no par value) | | | 187,949,372 | | | | 113,101,605 | | | | 107,253,475 | | | | 199,069,554 | |
Undistributed (distributions in excess of) net investment income | | | — | | | | 27,870 | | | | 27,494 | | | | (41,189 | ) |
Accumulated net realized losses from investments | | | (110,767,484 | ) | | | (38,899,291 | ) | | | (38,963,640 | ) | | | (405,815 | ) |
Net unrealized appreciation (depreciation) on investments | | | (1,502,045 | ) | | | (4,981,461 | ) | | | (4,207,784 | ) | | | 3,982,696 | |
| | | | | | | | | | | | | | | | |
Net Assets | | $ | 75,679,843 | | | $ | 69,248,723 | | | $ | 64,109,545 | | | $ | 202,605,246 | |
| | | | | | | | | | | | | | | | |
Net Assets | | | | | | | | | | | | | | | | |
Class A | | $ | 7,329,060 | | | $ | 4,597,369 | | | $ | 2,149,564 | | | $ | 3,355,846 | |
Class B | | | 480,710 | | | | 235,761 | | | | 248,664 | | | | 519,129 | |
Class C | | | 438,880 | | | | 394,016 | | | | 467,752 | | | | 462,306 | |
Class Y | | | 67,431,193 | | | | 64,021,577 | | | | 61,243,565 | | | | 198,267,965 | |
| | | | | | | | | | | | | | | | |
Total | | $ | 75,679,843 | | | $ | 69,248,723 | | | $ | 64,109,545 | | | $ | 202,605,246 | |
| | | | | | | | | | | | | | | | |
Outstanding units of beneficial interest (shares) | | | | | | | | | | | | | | | | |
Class A | | | 1,023,848 | | | | 494,572 | | | | 374,630 | | | | 305,365 | |
Class B | | | 73,257 | | | | 27,178 | | | | 44,390 | | | | 47,345 | |
Class C | | | 66,896 | | | | 45,548 | | | | 83,221 | | | | 42,152 | |
Class Y | | | 9,110,787 | | | | 6,828,059 | | | | 10,642,316 | | | | 17,935,786 | |
| | | | | | | | | | | | | | | | |
Total | | | 10,274,788 | | | | 7,395,357 | | | | 11,144,557 | | | | 18,330,648 | |
| | | | | | | | | | | | | | | | |
Net Asset Value | | | | | | | | | | | | | | | | |
Class A—redemption price per share | | $ | 7.16 | | | $ | 9.30 | | | $ | 5.74 | | | $ | 10.99 | |
| | | | | | | | | | | | | | | | |
Class A—maximum sales charge | | | 5.25 | % | | | 5.25 | % | | | 5.25 | % | | | 4.00 | % |
| | | | | | | | | | | | | | | | |
Class A—maximum offering price per share
(100%/(100%-maximum sales charge) of net asset value adjusted to the nearest cent) | | $ | 7.56 | | | $ | 9.82 | | | $ | 6.06 | | | $ | 11.45 | |
| | | | | | | | | | | | | | | | |
Class B—offering price per share* | | $ | 6.56 | | | $ | 8.67 | | | $ | 5.60 | | | $ | 10.96 | |
| | | | | | | | | | | | | | | | |
Class C—offering price per share* | | $ | 6.56 | | | $ | 8.65 | | | $ | 5.62 | | | $ | 10.97 | |
| | | | | | | | | | | | | | | | |
Class Y—offering and redemption price per share | | $ | 7.40 | | | $ | 9.38 | | | $ | 5.75 | | | $ | 11.05 | |
| | | | | | | | | | | | | | | | |
| * | Redemption price per share varies based on length of time shares are held. |
See notes to financial statements.
30
PACIFIC CAPITAL FUNDS
Statements of Assets and Liabilities, continued
July 31, 2009
| | | | | | | | | | | | | | | | |
| | | Tax-Free
Securities
Fund | | | High Grade Short
Intermediate
Fixed Income
Fund | | | Tax-Free Short
Intermediate
Securities
Fund | | | U.S. Government
Short Fixed
Income
Fund | |
| Assets: | | | | | | | | | | | | | | | | |
Investments, at cost | | $ | 226,076,722 | | | $ | 56,104,473 | | | $ | 61,457,361 | | | $ | 69,150,904 | |
| | | | | | | | | | | | | | | | |
Investments, at value | | $ | 236,226,554 | | | $ | 57,752,278 | | | $ | 62,844,055 | | | $ | 69,651,081 | |
Income receivable | | | 2,194,982 | | | | 417,005 | | | | 477,968 | | | | 585,172 | |
Receivable for capital shares issued | | | 1,371,540 | | | | 16,720 | | | | 825,181 | | | | 5,753 | |
Receivable for investments sold | | | — | | | | 29,670 | | | | — | | | | — | |
Prepaid expenses and other assets | | | 14,524 | | | | 4,034 | | | | 3,350 | | | | 4,895 | |
| | | | | | | | | | | | | | | | |
Total Assets | | | 239,807,600 | | | | 58,219,707 | | | | 64,150,554 | | | | 70,246,901 | |
| | | | | | | | | | | | | | | | |
| Liabilities: | | | | | | | | | | | | | | | | |
Distributions payable | | | 74,197 | | | | 18,643 | | | | 21,303 | | | | 6,699 | |
Payable for capital shares redeemed | | | 21,726 | | | | 192,867 | | | | — | | | | 312,142 | |
Payable for investments purchased | | | — | | | | — | | | | 1,123,970 | | | | — | |
Accrued expenses and other payables: | | | | | | | | | | | | | | | | |
Investment advisory fees | | | 90,436 | | | | 6,694 | | | | 20,965 | | | | 8,010 | |
Administration and sub-administration fees | | | 18,087 | | | | 4,420 | | | | 4,717 | | | | 5,440 | |
Compliance service fees | | | 2,853 | | | | 689 | | | | 734 | | | | 831 | |
Distribution fees | | | 1,508 | | | | 646 | | | | 396 | | | | 1,425 | |
Other fees | | | 68,181 | | | | 23,995 | | | | 24,584 | | | | 26,849 | |
| | | | | | | | | | | | | | | | |
Total Liabilities | | | 276,988 | | | | 247,954 | | | | 1,196,669 | | | | 361,396 | |
| | | | | | | | | | | | | | | | |
| Net Assets: | | | | | | | | | | | | | | | | |
Capital (no par value) | | | 231,472,578 | | | | 57,371,195 | | | | 62,425,698 | | | | 69,960,812 | |
Undistributed (distributions in excess of) net investment income | | | 29,108 | | | | (18,643 | ) | | | (21,303 | ) | | | — | |
Accumulated net realized losses from investments | | | (2,120,906 | ) | | | (1,028,604 | ) | | | (837,204 | ) | | | (575,484 | ) |
Net unrealized appreciation (depreciation) on investments | | | 10,149,832 | | | | 1,647,805 | | | | 1,386,694 | | | | 500,177 | |
| | | | | | | | | | | | | | | | |
Net Assets | | $ | 239,530,612 | | | $ | 57,971,753 | | | $ | 62,953,885 | | | $ | 69,885,505 | |
| | | | | | | | | | | | | | | | |
Net Assets | | | | | | | | | | | | | | | | |
Class A | | $ | 5,904,273 | | | $ | 1,215,917 | | | $ | 1,829,395 | | | $ | 1,706,881 | |
Class B | | | 266,855 | | | | — | | | | — | | | | 213,628 | |
Class C | | | 11,334 | | | | 439,344 | | | | 10,999 | | | | 1,008,613 | |
Class Y | | | 233,348,150 | | | | 56,316,492 | | | | 61,113,491 | | | | 66,956,383 | |
| | | | | | | | | | | | | | | | |
Total | | $ | 239,530,612 | | | $ | 57,971,753 | | | $ | 62,953,885 | | | $ | 69,885,505 | |
| | | | | | | | | | | | | | | | |
Outstanding units of beneficial interest (shares) | | | | | | | | | | | | | | | | |
Class A | | | 594,398 | | | | 121,473 | | | | 178,325 | | | | 164,074 | |
Class B | | | 26,861 | | | | — | | | | — | | | | 20,540 | |
Class C | | | 1,139 | | | | 43,932 | | | | 1,072 | | | | 96,924 | |
Class Y | | | 23,395,727 | | | | 5,616,106 | | | | 5,924,222 | | | | 6,430,130 | |
| | | | | | | | | | | | | | | | |
Total | | | 24,018,125 | | | | 5,781,511 | | | | 6,103,619 | | | | 6,711,668 | |
| | | | | | | | | | | | | | | | |
Net Asset Value | | | | | | | | | | | | | | | | |
Class A—redemption price per share | | $ | 9.93 | | | $ | 10.01 | | | $ | 10.26 | | | $ | 10.40 | |
| | | | | | | | | | | | | | | | |
Class A—maximum sales charge | | | 4.00 | % | | | 2.25 | % | | | 2.25 | % | | | 2.25 | % |
| | | | | | | | | | | | | | | | |
Class A—maximum offering price per share
(100%/(100%-maximum sales charge) of net asset value adjusted to the nearest cent) | | $ | 10.34 | | | $ | 10.24 | | | $ | 10.50 | | | $ | 10.64 | |
| | | | | | | | | | | | | | | | |
Class B—offering price per share* | | $ | 9.93 | | | | — | | | | — | | | $ | 10.40 | |
| | | | | | | | | | | | | | | | |
Class C—offering price per share* | | $ | 9.95 | | | $ | 10.00 | | | $ | 10.26 | | | $ | 10.41 | |
| | | | | | | | | | | | | | | | |
Class Y—offering and redemption price per share | | $ | 9.97 | | | $ | 10.03 | | | $ | 10.32 | | | $ | 10.41 | |
| | | | | | | | | | | | | | | | |
| * | Redemption price per share varies based on length of time shares are held. |
See notes to financial statements.
31
PACIFIC CAPITAL FUNDS
Statements of Operations
Year Ended July 31, 2009
| | | | | | | | | | | | | | | | |
| | | New Asia
Growth
Fund | | | International
Stock
Fund | | | Small Cap
Fund | | | Mid-Cap
Fund | |
| Investment Income: | | | | | | | | | | | | | | | | |
Dividend income | | $ | 1,836,749 | | | $ | 2,504,017 | | | $ | 2,413,127 | | | $ | 688,713 | |
Interest income | | | 6 | | | | 8,282 | | | | — | | | | — | |
Foreign tax withholding | | | (160,660 | ) | | | (199,574 | ) | | | (1,048 | ) | | | — | |
| | | | | | | | | | | | | | | | |
Total Investment Income | | | 1,676,095 | | | | 2,312,725 | | | | 2,412,079 | | | | 688,713 | |
| | | | | | | | | | | | | | | | |
| Expenses: | | | | | | | | | | | | | | | | |
Investment advisory fees | | | 237,725 | | | | 407,023 | | | | 868,197 | | | | 213,993 | |
Sub-investment advisory fees | | | 297,155 | | | | 495,838 | | | | 1,210,688 | | | | 71,331 | |
Administration and sub-administration fees | | | 53,488 | | | | 81,405 | | | | 170,091 | | | | 32,099 | |
Distribution fees—Class A | | | 11,940 | | | | 4,018 | | | | 283,595 | | | | 1,530 | �� |
Distribution fees—Class B | | | 692 | | | | 641 | | | | 8,352 | | | | — | |
Distribution fees—Class C | | | 3,919 | | | | 2,748 | | | | 96,928 | | | | 2,137 | |
Accounting fees | | | 60,452 | | | | 96,475 | | | | 151,505 | | | | 31,064 | |
Compliance service fees | | | 7,375 | | | | 11,900 | | | | 24,565 | | | | 4,530 | |
Custodian fees | | | 112,076 | | | | 236,913 | | | | 86,981 | | | | 35,819 | |
Transfer agent fees | | | 63,385 | | | | 59,296 | | | | 291,734 | | | | 52,553 | |
Trustee fees | | | 9,800 | | | | 17,081 | | | | 33,574 | | | | 6,218 | |
Other fees | | | 66,924 | | | | 87,904 | | | | 344,894 | | | | 34,089 | |
| | | | | | | | | | | | | | | | |
Total expenses before reductions | | | 924,931 | | | | 1,501,242 | | | | 3,571,104 | | | | 485,363 | |
Less expenses waived/reimbursed by the Adviser | | | (45 | ) | | | (90,452 | ) | | | (260,173 | ) | | | (89,176 | ) |
Less expenses waived by the Distributor—Class A | | | (4,478 | ) | | | (1,507 | ) | | | (106,348 | ) | | | (574 | ) |
Less expenses waived by the Distributor—Class B | | | — | | | | — | | | | (6,261 | ) | | | — | |
| | | | | | | | | | | | | | | | |
Net Expenses | | | 920,408 | | | | 1,409,283 | | | | 3,198,322 | | | | 395,613 | |
| | | | | | | | | | | | | | | | |
Net Investment Income (Loss) | | | 755,687 | | | | 903,442 | | | | (786,243 | ) | | | 293,100 | |
| | | | | | | | | | | | | | | | |
| Realized/Unrealized Gains (Losses) from Investments, Futures and Foreign Currency Transactions: | | | | | | | | | | | | | | | | |
Net realized losses from investments and foreign currency transactions | | | (8,539,204 | ) | | | (45,609,416 | ) | | | (100,758,044 | ) | | | (18,971,714 | ) |
Net realized losses from futures transactions | | | — | | | | — | | | | (283,712 | ) | | | — | |
Change in unrealized appreciation/depreciation on investments and foreign currency transactions | | | (4,365,208 | ) | | | (5,784,197 | ) | | | 9,452,952 | | | | 3,275,652 | |
| | | | | | | | | | | | | | | | |
Net realized/unrealized losses from investments, futures and foreign currency transactions | | | (12,904,412 | ) | | | (51,393,613 | ) | | | (91,588,804 | ) | | | (15,696,062 | ) |
| | | | | | | | | | | | | | | | |
Change in net assets resulting from operations | | $ | (12,148,725 | ) | | $ | (50,490,171 | ) | | $ | (92,375,047 | ) | | $ | (15,402,962 | ) |
| | | | | | | | | | | | | | | | |
See notes to financial statements.
32
PACIFIC CAPITAL FUNDS
Statements of Operations, continued
Year Ended July 31, 2009
| | | | | | | | | | | | | | | | |
| | | Growth
Stock
Fund | | | Growth and
Income
Fund | | | Value
Fund | | | High Grade Core
Fixed Income
Fund | |
| Investment Income: | | | | | | | | | | | | | | | | |
Dividend income | | $ | 1,616,502 | | | $ | 1,989,204 | | | $ | 2,315,095 | | | $ | 22,545 | |
Interest income | | | — | | | | — | | | | — | | | | 11,951,876 | |
| | | | | | | | | | | | | | | | |
Total Investment Income | | | 1,616,502 | | | | 1,989,204 | | | | 2,315,095 | | | | 11,974,421 | |
| | | | | | | | | | | | | | | | |
| Expenses: | | | | | | | | | | | | | | | | |
Investment advisory fees | | | 488,190 | | | | 434,589 | | | | 404,484 | | | | 1,413,407 | |
Sub-investment advisory fees | | | 221,904 | | | | 197,540 | | | | 183,856 | | | | — | |
Administration and sub-administration fees | | | 79,886 | | | | 71,115 | | | | 66,189 | | | | 212,013 | |
Distribution fees—Class A | | | 25,366 | | | | 16,065 | | | | 6,525 | | | | 12,073 | |
Distribution fees—Class B | | | 10,229 | | | | 5,101 | | | | 3,154 | | | | 7,082 | |
Distribution fees—Class C | | | 8,246 | | | | 8,019 | | | | 8,361 | | | | 7,254 | |
Accounting fees | | | 65,417 | | | | 57,501 | | | | 54,907 | | | | 180,821 | |
Compliance service fees | | | 11,179 | | | | 9,969 | | | | 9,313 | | | | 29,160 | |
Custodian fees | | | 26,261 | | | | 24,534 | | | | 24,357 | | | | 25,370 | |
Transfer agent fees | | | 94,017 | | | | 74,968 | | | | 57,914 | | | | 63,578 | |
Trustee fees | | | 15,258 | | | | 13,616 | | | | 12,677 | | | | 38,235 | |
Other fees | | | 117,878 | | | | 90,092 | | | | 61,717 | | | | 172,480 | |
| | | | | | | | | | | | | | | | |
Total expenses before reductions | | | 1,163,831 | | | | 1,003,109 | | | | 893,454 | | | | 2,161,473 | |
Less expenses waived/reimbursed by the Adviser | | | (177,556 | ) | | | (158,034 | ) | | | (147,090 | ) | | | (353,358 | ) |
Less expenses waived by the Distributor—Class A | | | (9,512 | ) | | | (6,024 | ) | | | (2,447 | ) | | | (4,527 | ) |
| | | | | | | | | | | | | | | | |
Net Expenses | | | 976,763 | | | | 839,051 | | | | 743,917 | | | | 1,803,588 | |
| | | | | | | | | | | | | | | | |
Net Investment Income | | | 639,739 | | | | 1,150,153 | | | | 1,571,178 | | | | 10,170,833 | |
| | | | | | | | | | | | | | | | |
| Realized/Unrealized Gains (Losses) from Investments: | | | | | | | | | | | | | | | | |
Net realized gains (losses) from investments | | | (30,155,245 | ) | | | (29,435,660 | ) | | | (33,417,085 | ) | | | 789,365 | |
Change in unrealized appreciation/depreciation on investments | | | 2,921,766 | | | | 552,595 | | | | 7,835,932 | | | | 4,772,498 | |
| | | | | | | | | | | | | | | | |
Net realized/unrealized gains (losses) from investments | | | (27,233,479 | ) | | | (28,883,065 | ) | | | (25,581,153 | ) | | | 5,561,863 | |
| | | | | | | | | | | | | | | | |
Change in net assets resulting from operations | | $ | (26,593,740 | ) | | $ | (27,732,912 | ) | | $ | (24,009,975 | ) | | $ | 15,732,696 | |
| | | | | | | | | | | | | | | | |
See notes to financial statements.
33
PACIFIC CAPITAL FUNDS
Statements of Operations, continued
Year Ended July 31, 2009
| | | | | | | | | | | | | | | | |
| | | Tax-Free
Securities
Fund | | | High Grade Short
Intermediate
Fixed Income
Fund | | | Tax-Free Short
Intermediate
Securities
Fund | | | U.S. Government
Short Fixed
Income
Fund | |
| Investment Income: | | | | | | | | | | | | | | | | |
Dividend income | | $ | 16,567 | | | $ | 4,047 | | | $ | 18,436 | | | $ | 2,735 | |
Interest income | | | 12,011,465 | | | | 2,682,486 | | | | 1,751,841 | | | | 1,819,892 | |
| | | | | | | | | | | | | | | | |
Total Investment Income | | | 12,028,032 | | | | 2,686,533 | | | | 1,770,277 | | | | 1,822,627 | |
| | | | | | | | | | | | | | | | |
| Expenses: | | | | | | | | | | | | | | | | |
Investment advisory fees | | | 1,451,672 | | | | 302,282 | | | | 268,854 | | | | 287,615 | |
Administration and sub-administration fees | | | 217,752 | | | | 54,411 | | | | 48,394 | | | | 64,714 | |
Distribution fees—Class A | | | 20,693 | | | | 4,159 | | | | 5,884 | | | | 8,947 | |
Distribution fees—Class B | | | 5,572 | | | | — | | | | — | | | | 3,676 | |
Distribution fees—Class C | | | 111 | | | | 4,581 | | | | 108 | | | | 10,135 | |
Accounting fees | | | 182,276 | | | | 51,625 | | | | 44,703 | | | | 52,843 | |
Compliance service fees | | | 29,792 | | | | 7,430 | | | | 6,598 | | | | 8,880 | |
Custodian fees | | | 55,960 | | | | 16,984 | | | | 18,931 | | | | 16,427 | |
Transfer agent fees | | | 55,856 | | | | 52,144 | | | | 51,159 | | | | 53,915 | |
Trustee fees | | | 38,489 | | | | 9,555 | | | | 8,196 | | | | 11,302 | |
Other fees | | | 172,180 | | | | 51,712 | | | | 45,585 | | | | 63,934 | |
| | | | | | | | | | | | | | | | |
Total expenses before reductions | | | 2,230,353 | | | | 554,883 | | | | 498,412 | | | | 582,388 | |
Less expenses waived/reimbursed by the Adviser | | | (362,931 | ) | | | (231,607 | ) | | | (53,775 | ) | | | (252,024 | ) |
Less expenses waived by the Distributor—Class A | | | (7,760 | ) | | | (1,560 | ) | | | (2,207 | ) | | | (3,355 | ) |
| | | | | | | | | | | | | | | | |
Net Expenses | | | 1,859,662 | | | | 321,716 | | | | 442,430 | | | | 327,009 | |
| | | | | | | | | | | | | | | | |
Net Investment Income | | | 10,168,370 | | | | 2,364,817 | | | | 1,327,847 | | | | 1,495,618 | |
| | | | | | | | | | | | | | | | |
| Realized/Unrealized Gains (Losses) from Investments: | | | | | | | | | | | | | | | | |
Net realized gains (losses) from investments | | | (2,120,906 | ) | | | 663,174 | | | | (82,600 | ) | | | 1,572,643 | |
Change in unrealized appreciation/depreciation on investments | | | 2,752,064 | | | | 1,374,033 | | | | 708,487 | | | | (584,570 | ) |
| | | | | | | | | | | | | | | | |
Net realized/unrealized gains from investments | | | 631,158 | | | | 2,037,207 | | | | 625,887 | | | | 988,073 | |
| | | | | | | | | | | | | | | | |
Change in net assets resulting from operations | | $ | 10,799,528 | | | $ | 4,402,024 | | | $ | 1,953,734 | | | $ | 2,483,691 | |
| | | | | | | | | | | | | | | | |
See notes to financial statements.
34
PACIFIC CAPITAL FUNDS
Statements of Changes in Net Assets
| | | | | | | | | | | | | | | | | | | | | | | | |
| | | New Asia Growth Fund | | | International Stock Fund | | | Small Cap Fund | |
| | | Year Ended
July 31,
2009 | | | Year Ended
July 31,
2008 | | | Year Ended
July 31,
2009 | | | Year Ended
July 31,
2008 | | | Year Ended
July 31,
2009 | | | Year Ended
July 31,
2008 | |
| From Investment Activities: | | | | | | | | | | | | | | | | | | | | | | | | |
| Operations: | | | | | | | | | | | | | | | | | | | | | | | | |
Net investment income (loss) | | $ | 755,687 | | | $ | 1,448,040 | | | $ | 903,442 | | | $ | 3,212,257 | | | $ | (786,243 | ) | | $ | (2,529,157 | ) |
Net realized gains (losses) from investments and foreign currency transactions | | | (8,539,204 | ) | | | 21,491,476 | | | | (45,609,416 | ) | | | 22,613,383 | | | | (100,758,044 | ) | | | (54,823,424 | ) |
Net realized losses from futures transactions | | | — | | | | — | | | | — | | | | — | | | | (283,712 | ) | | | (116,732 | ) |
Change in unrealized appreciation/depreciation on investments and foreign currency transactions | | | (4,365,208 | ) | | | (27,565,224 | ) | | | (5,784,197 | ) | | | (44,515,682 | ) | | | 9,452,952 | | | | 2,123,071 | |
| | | | | | | | | | | | | | | | | | | | | | | | |
Change in net assets resulting from operations | | | (12,148,725 | ) | | | (4,625,708 | ) | | | (50,490,171 | ) | | | (18,690,042 | ) | | | (92,375,047 | ) | | | (55,346,242 | ) |
| | | | | | | | | | | | | | | | | | | | | | | | |
| Distributions to Class A Shareholders: | | | | | | | | | | | | | | | | | | | | | | | | |
From net investment income | | | (28,520 | ) | | | (49,236 | ) | | | (3,375 | ) | | | (17,830 | ) | | | — | | | | — | |
From net realized gains | | | (664,868 | ) | | | (554,220 | ) | | | (228,207 | ) | | | (126,628 | ) | | | (287,280 | ) | | | (32,778,648 | ) |
From return of capital | | | — | | | | — | | | | (2,147 | ) | | | — | | | | — | | | | — | |
| Distributions to Class B Shareholders: | | | | | | | | | | | | | | | | | | | | | | | | |
From net investment income | | | (568 | ) | | | (1,960 | ) | | | — | | | | (875 | ) | | | — | | | | — | |
From net realized gains | | | (19,278 | ) | | | (101,202 | ) | | | (17,199 | ) | | | (36,630 | ) | | | (3,806 | ) | | | (369,645 | ) |
From return of capital | | | — | | | | — | | | | (63 | ) | | | — | | | | — | | | | — | |
| Distributions to Class C Shareholders: | | | | | | | | | | | | | | | | | | | | | | | | |
From net investment income | | | (2,751 | ) | | | (4,998 | ) | | | — | | | | (2,605 | ) | | | — | | | | — | |
From net realized gains | | | (90,936 | ) | | | (115,822 | ) | | | (67,080 | ) | | | (42,315 | ) | | | (43,196 | ) | | | (4,182,152 | ) |
From return of capital | | | — | | | | — | | | | (299 | ) | | | — | | | | — | | | | ��� | |
| Distributions to Class Y Shareholders: | | | | | | | | | | | | | | | | | | | | | | | | |
From net investment income | | | (582,674 | ) | | | (1,349,279 | ) | | | (437,376 | ) | | | (2,692,270 | ) | | | — | | | | — | |
From net realized gains | | | (10,997,817 | ) | | | (18,299,741 | ) | | | (20,315,206 | ) | | | (15,706,421 | ) | | | (466,969 | ) | | | (36,706,704 | ) |
From return of capital | | | — | | | | — | | | | (178,285 | ) | | | — | | | | — | | | | — | |
| | | | | | | | | | | | | | | | | | | | | | | | |
Change in net assets from shareholder distributions | | | (12,387,412 | ) | | | (20,476,458 | ) | | | (21,249,237 | ) | | | (18,625,574 | ) | | | (801,251 | ) | | | (74,037,149 | ) |
| | | | | | | | | | | | | | | | | | | | | | | | |
| Capital Transactions: | | | | | | | | | | | | | | | | | | | | | | | | |
Change in net assets from capital share transactions | | | 7,298,484 | | | | 6,063,374 | | | | (32,451,516 | ) | | | (26,284,769 | ) | | | (86,346,767 | ) | | | (94,276,129 | ) |
| | | | | | | | | | | | | | | | | | | | | | | | |
Change in net assets | | | (17,237,653 | ) | | | (19,038,792 | ) | | | (104,190,924 | ) | | | (63,600,385 | ) | | | (179,523,065 | ) | | | (223,659,520 | ) |
| | | | | | | | | | | | | | | | | | | | | | | | |
| Net Assets: | | | | | | | | | | | | | | | | | | | | | | | | |
Beginning of year | | | 98,819,510 | | | | 117,858,302 | | | | 184,948,025 | | | | 248,548,410 | | | | 312,788,485 | | | | 536,448,005 | |
| | | | | | | | | | | | | | | | | | | | | | | | |
End of year | | $ | 81,581,857 | | | $ | 98,819,510 | | | $ | 80,757,101 | | | $ | 184,948,025 | | | $ | 133,265,420 | | | $ | 312,788,485 | |
| | | | | | | | | | | | | | | | | | | | | | | | |
Undistributed (distributions in excess of) net investment income | | $ | (163,007 | ) | | $ | (19,628 | ) | | $ | (244,504 | ) | | $ | (243,491 | ) | | $ | — | | | $ | — | |
| | | | | | | | | | | | | | | | | | | | | | | | |
See notes to financial statements.
35
PACIFIC CAPITAL FUNDS
Statements of Changes in Net Assets, continued
| | | | | | | | | | | | | | | | | | | | | | | | |
| | | New Asia Growth Fund | | | International Stock Fund | | | Small Cap Fund | |
| | | Year Ended
July 31,
2009 | | | Year Ended
July 31,
2008 | | | Year Ended
July 31,
2009 | | | Year Ended
July 31,
2008 | | | Year Ended
July 31,
2009 | | | Year Ended
July 31,
2008 | |
| Capital Transactions: | | | | | | | | | | | | | | | | | | | | | | | | |
| Class A: | | | | | | | | | | | | | | | | | | | | | | | | |
Proceeds from shares issued | | $ | 1,290,731 | | | $ | 3,638,780 | | | $ | 321,788 | | | $ | 1,711,745 | | | $ | 19,252,930 | | | $ | 54,485,249 | |
Dividends reinvested | | | 609,441 | | | | 491,158 | | | | 187,513 | | | | 121,615 | | | | 265,528 | | | | 29,790,004 | |
Cost of shares redeemed | | | (1,790,719 | ) | | | (1,346,583 | ) | | | (321,376 | ) | | | (1,024,267 | ) | | | (50,459,393 | ) | | | (134,813,450 | ) |
| | | | | | | | | | | | | | | | | | | | | | | | |
Change in net assets from Class A | | $ | 109,453 | | | $ | 2,783,355 | | | $ | 187,925 | | | $ | 809,093 | | | $ | (30,940,935 | ) | | $ | (50,538,197 | ) |
| | | | | | | | | | | | | | | | | | | | | | | | |
| Class B: | | | | | | | | | | | | | | | | | | | | | | | | |
Proceeds from shares issued | | $ | 14 | | | $ | 29,107 | | | $ | — | | | $ | 7,195 | | | $ | 1,813 | | | $ | — | |
Dividends reinvested | | | 11,571 | | | | 70,940 | | | | 14,365 | | | | 34,059 | | | | 3,557 | | | | 352,112 | |
Cost of shares redeemed | | | (56,026 | ) | | | (553,207 | ) | | | (71,619 | ) | | | (487,378 | ) | | | (417,697 | ) | | | (749,008 | ) |
| | | | | | | | | | | | | | | | | | | | | | | | |
Change in net assets from Class B | | $ | (44,441 | ) | | $ | (453,160 | ) | | $ | (57,254 | ) | | $ | (446,124 | ) | | $ | (412,327 | ) | | $ | (396,896 | ) |
| | | | | | | | | | | | | | | | | | | | | | | | |
| Class C: | | | | | | | | | | | | | | | | | | | | | | | | |
Proceeds from shares issued | | $ | 78,255 | | | $ | 294,199 | | | $ | 84,209 | | | $ | 118,886 | | | $ | 719,942 | | | $ | 5,709,916 | |
Dividends reinvested | | | 93,687 | | | | 115,782 | | | | 67,380 | | | | 44,920 | | | | 39,260 | | | | 3,660,806 | |
Cost of shares redeemed | | | (274,045 | ) | | | (162,325 | ) | | | (225,783 | ) | | | (219,349 | ) | | | (5,326,435 | ) | | | (9,110,895 | ) |
| | | | | | | | | | | | | | | | | | | | | | | | |
Change in net assets from Class C | | $ | (102,103 | ) | | $ | 247,656 | | | $ | (74,194 | ) | | $ | (55,543 | ) | | $ | (4,567,233 | ) | | $ | 259,827 | |
| | | | | | | | | | | | | | | | | | | | | | | | |
| Class Y: | | | | | | | | | | | | | | | | | | | | | | | | |
Proceeds from shares issued | | $ | 25,514,120 | | | $ | 15,043,651 | | | $ | 6,172,005 | | | $ | 32,508,758 | | | $ | 29,812,102 | | | $ | 40,232,542 | |
Dividends reinvested | | | 11,132,848 | | | | 16,269,905 | | | | 20,310,900 | | | | 12,911,597 | | | | 439,981 | | | | 31,750,368 | |
Cost of shares redeemed | | | (29,311,393 | ) | | | (27,828,033 | ) | | | (58,990,898 | ) | | | (72,012,550 | ) | | | (80,678,355 | ) | | | (115,583,773 | ) |
| | | | | | | | | | | | | | | | | | | | | | | | |
Change in net assets from Class Y | | $ | 7,335,575 | | | $ | 3,485,523 | | | $ | (32,507,993 | ) | | $ | (26,592,195 | ) | | $ | (50,426,272 | ) | | $ | (43,600,863 | ) |
| | | | | | | | | | | | | | | | | | | | | | | | |
Change in net assets from capital transactions | | $ | 7,298,484 | | | $ | 6,063,374 | | | $ | (32,451,516 | ) | | $ | (26,284,769 | ) | | $ | (86,346,767 | ) | | $ | (94,276,129 | ) |
| | | | | | | | | | | | | | | | | | | | | | | | |
| Share Transactions: | | | | | | | | | | | | | | | | | | | | | | | | |
| Class A: | | | | | | | | | | | | | | | | | | | | | | | | |
Issued | | | 124,683 | | | | 180,451 | | | | 56,582 | | | | 126,598 | | | | 2,142,099 | | | | 3,543,506 | |
Reinvested | | | 69,895 | | | | 23,416 | | | | 38,425 | | | | 9,282 | | | | 31,423 | | | | 2,006,061 | |
Redeemed | | | (163,774 | ) | | | (65,431 | ) | | | (45,752 | ) | | | (82,437 | ) | | | (5,490,925 | ) | | | (9,127,829 | ) |
| | | | | | | | | | | | | | | | | | | | | | | | |
Net change in Class A | | | 30,804 | | | | 138,436 | | | | 49,255 | | | | 53,443 | | | | (3,317,403 | ) | | | (3,578,262 | ) |
| | | | | | | | | | | | | | | | | | | | | | | | |
| Class B: | | | | | | | | | | | | | | | | | | | | | | | | |
Issued | | | — | | | | 1,241 | | | | — | | | | 561 | | | | 265 | | | | — | |
Reinvested | | | 1,445 | | | | 3,558 | | | | 3,207 | | | | 2,729 | | | | 463 | | | | 26,005 | |
Redeemed | | | (5,579 | ) | | | (28,823 | ) | | | (9,973 | ) | | | (40,391 | ) | | | (48,713 | ) | | | (52,967 | ) |
| | | | | | | | | | | | | | | | | | | | | | | | |
Net change in Class B | | | (4,134 | ) | | | (24,024 | ) | | | (6,766 | ) | | | (37,101 | ) | | | (47,985 | ) | | | (26,962 | ) |
| | | | | | | | | | | | | | | | | | | | | | | | |
| Class C: | | | | | | | | | | | | | | | | | | | | | | | | |
Issued | | | 8,071 | | | | 14,913 | | | | 16,249 | | | | 9,721 | | | | 82,057 | | | | 390,136 | |
Reinvested | | | 11,746 | | | | 5,843 | | | | 15,074 | | | | 3,620 | | | | 5,132 | | | | 270,170 | |
Redeemed | | | (24,616 | ) | | | (8,536 | ) | | | (40,040 | ) | | | (18,360 | ) | | | (653,137 | ) | | | (682,682 | ) |
| | | | | | | | | | | | | | | | | | | | | | | | |
Net change in Class C | | | (4,799 | ) | | | 12,220 | | | | (8,717 | ) | | | (5,019 | ) | | | (565,948 | ) | | | (22,376 | ) |
| | | | | | | | | | | | | | | | | | | | | | | | |
| Class Y: | | | | | | | | | | | | | | | | | | | | | | | | |
Issued | | | 2,332,512 | | | | 692,522 | | | | 956,987 | | | | 2,448,112 | | | | 3,125,164 | | | | 2,639,823 | |
Reinvested | | | 1,250,908 | | | | 757,898 | | | | 4,050,763 | | | | 957,057 | | | | 50,806 | | | | 2,091,592 | |
Redeemed | | | (2,529,919 | ) | | | (1,316,500 | ) | | | (8,733,942 | ) | | | (5,586,734 | ) | | | (8,927,671 | ) | | | (7,230,631 | ) |
| | | | | | | | | | | | | | | | | | | | | | | | |
Net change in Class Y | | | 1,053,501 | | | | 133,920 | | | | (3,726,192 | ) | | | (2,181,565 | ) | | | (5,751,701 | ) | | | (2,499,216 | ) |
| | | | | | | | | | | | | | | | | | | | | | | | |
Change in shares | | | 1,075,372 | | | | 260,552 | | | | (3,692,420 | ) | | | (2,170,242 | ) | | | (9,683,037 | ) | | | (6,126,816 | ) |
| | | | | | | | | | | | | | | | | | | | | | | | |
See notes to financial statements.
36
PACIFIC CAPITAL FUNDS
Statements of Changes in Net Assets, continued
| | | | | | | | | | | | | | | | | | | | | | | | |
| | | Mid-Cap Fund | | | Growth Stock Fund | | | Growth and Income Fund | |
| | | Year Ended
July 31,
2009 | | | Year Ended
July 31,
2008 | | | Year Ended
July 31,
2009 | | | Year Ended
July 31,
2008 | | | Year Ended
July 31,
2009 | | | Year Ended
July 31,
2008 | |
| From Investment Activities: | | | | | | | | | | | | | | | | | | | | | | | | |
| Operations: | | | | | | | | | | | | | | | | | | | | | | | | |
Net investment income | | $ | 293,100 | | | $ | 297,752 | | | $ | 639,739 | | | $ | 811,698 | | | $ | 1,150,153 | | | $ | 1,405,809 | |
Net realized losses from investments | | | (18,971,714 | ) | | | (4,586,678 | ) | | | (30,155,245 | ) | | | (3,434,390 | ) | | | (29,435,660 | ) | | | (9,290,726 | ) |
Change in unrealized appreciation/depreciation on investments | | | 3,275,652 | | | | (5,400,714 | ) | | | 2,921,766 | | | | (7,391,794 | ) | | | 552,595 | | | | (6,754,078 | ) |
| | | | | | | | | | | | | | | | | | | | | | | | |
Change in net assets resulting from operations | | | (15,402,962 | ) | | | (9,689,640 | ) | | | (26,593,740 | ) | | | (10,014,486 | ) | | | (27,732,912 | ) | | | (14,638,995 | ) |
| | | | | | | | | | | | | | | | | | | | | | | | |
| Distributions to Class A Shareholders: | | | | | | | | | | | | | | | | | | | | | | | | |
From net investment income | | | (1,980 | ) | | | (1,731 | ) | | | (38,087 | ) | | | (29,746 | ) | | | (52,988 | ) | | | (43,313 | ) |
From net realized gains | | | — | | | | (70,748 | ) | | | — | | | | — | | | | — | | | | (307,734 | ) |
| Distributions to Class B Shareholders: | | | | | | | | | | | | | | | | | | | | | | | | |
From net investment income | | | — | | | | — | | | | (1,440 | ) | | | (5,399 | ) | | | (2,958 | ) | | | (2,163 | ) |
From net realized gains | | | — | | | | — | | | | — | | | | — | | | | — | | | | (138,122 | ) |
| Distributions to Class C Shareholders: | | | | | | | | | | | | | | | | | | | | | | | | |
From net investment income | | | (457 | ) | | | — | | | | (1,358 | ) | | | (2,039 | ) | | | (5,514 | ) | | | (1,755 | ) |
From net realized gains | | | — | | | | (49,554 | ) | | | — | | | | — | | | | — | | | | (102,454 | ) |
| Distributions to Class Y Shareholders: | | | | | | | | | | | | | | | | | | | | | | | | |
From net investment income | | | (278,932 | ) | | | (344,034 | ) | | | (605,741 | ) | | | (798,007 | ) | | | (1,106,658 | ) | | | (1,312,747 | ) |
From net realized gains | | | — | | | | (7,523,615 | ) | | | — | | | | — | | | | — | | | | (7,376,837 | ) |
| | | | | | | | | | | | | | | | | | | | | | | | |
Change in net assets from shareholder distributions | | | (281,369 | ) | | | (7,989,682 | ) | | | (646,626 | ) | | | (835,191 | ) | | | (1,168,118 | ) | | | (9,285,125 | ) |
| | | | | | | | | | | | | | | | | | | | | | | | |
| Capital Transactions: | | | | | | | | | | | | | | | | | | | | | | | | |
Change in net assets from capital share transactions | | | (8,146,322 | ) | | | 2,047,497 | | | | (25,386,751 | ) | | | (30,189,419 | ) | | | (18,192,720 | ) | | | (14,794,129 | ) |
| | | | | | | | | | | | | | | | | | | | | | | | |
Change in net assets | | | (23,830,653 | ) | | | (15,631,825 | ) | | | (52,627,117 | ) | | | (41,039,096 | ) | | | (47,093,750 | ) | | | (38,718,249 | ) |
| | | | | | | | | | | | | | | | | | | | | | | | |
| Net Assets: | | | | | | | | | | | | | | | | | | | | | | | | |
Beginning of year | | | 55,964,430 | | | | 71,596,255 | | | | 128,306,960 | | | | 169,346,056 | | | | 116,342,473 | | | | 155,060,722 | |
| | | | | | | | | | | | | | | | | | | | | | | | |
End of year | | $ | 32,133,777 | | | $ | 55,964,430 | | | $ | 75,679,843 | | | $ | 128,306,960 | | | $ | 69,248,723 | | | $ | 116,342,473 | |
| | | | | | | | | | | | | | | | | | | | | | | | |
Undistributed net investment income | | $ | 11,731 | | | $ | — | | | $ | — | | | $ | — | | | $ | 27,870 | | | $ | 45,835 | |
| | | | | | | | | | | | | | | | | | | | | | | | |
See notes to financial statements.
37
PACIFIC CAPITAL FUNDS
Statements of Changes in Net Assets, continued
| | | | | | | | | | | | | | | | | | | | | | | | |
| | | Mid-Cap Fund | | | Growth Stock Fund | | | Growth and Income Fund | |
| | | Year Ended
July 31,
2009 | | | Year Ended
July 31,
2008 | | | Year Ended
July 31,
2009 | | | Year Ended
July 31,
2008 | | | Year Ended
July 31,
2009 | | | Year Ended
July 31,
2008 | |
| Capital Transactions: | | | | | | | | | | | | | | | | | | | | | | | | |
| Class A: | | | | | | | | | | | | | | | | | | | | | | | | |
Proceeds from shares issued | | $ | 135,126 | | | $ | 75,916 | | | $ | 1,757,752 | | | $ | 2,694,225 | | | $ | 1,026,862 | | | $ | 1,509,204 | |
Dividends reinvested | | | 1,612 | | | | 59,165 | | | | 35,400 | | | | 27,639 | | | | 50,364 | | | | 337,535 | |
Cost of shares redeemed | | | (58,487 | ) | | | (115,068 | ) | | | (943,910 | ) | | | (2,202,836 | ) | | | (642,490 | ) | | | (1,492,254 | ) |
| | | | | | | | | | | | | | | | | | | | | | | | |
Change in net assets from Class A | | $ | 78,251 | | | $ | 20,013 | | | $ | 849,242 | | | $ | 519,028 | | | $ | 434,736 | | | $ | 354,485 | |
| | | | | | | | | | | | | | | | | | | | | | | | |
| Class B: | | | | | | | | | | | | | | | | | | | | | | | | |
Proceeds from shares issued | | | | | | | | | | $ | — | | | $ | 14,185 | | | $ | 20 | | | $ | 71,441 | |
Dividends reinvested | | | | | | | | | | | 1,289 | | | | 5,034 | | | | 2,662 | | | | 131,214 | |
Cost of shares redeemed | | | | | | | | | | | (1,275,009 | ) | | | (3,445,106 | ) | | | (593,386 | ) | | | (1,887,739 | ) |
| | | | | | | | | | | | | | | | | | | | | | | | |
Change in net assets from Class B | | | | | | | | | | $ | (1,273,720 | ) | | $ | (3,425,887 | ) | | $ | (590,704 | ) | | $ | (1,685,084 | ) |
| | | | | | | | | | | | | | | | | | | | | | | | |
| Class C: | | | | | | | | | | | | | | | | | | | | | | | | |
Proceeds from shares issued | | $ | 54,956 | | | $ | 128,344 | | | $ | 149,355 | | | $ | 236,790 | | | $ | 160,132 | | | $ | 294,079 | |
Dividends reinvested | | | 457 | | | | 49,083 | | | | 1,358 | | | | 2,039 | | | | 5,514 | | | | 104,209 | |
Cost of shares redeemed | | | (196,664 | ) | | | (162,507 | ) | | | (736,147 | ) | | | (682,628 | ) | | | (767,117 | ) | | | (537,375 | ) |
| | | | | | | | | | | | | | | | | | | | | | | | |
Change in net assets from Class C | | $ | (141,251 | ) | | $ | 14,920 | | | $ | (585,434 | ) | | $ | (443,799 | ) | | $ | (601,471 | ) | | $ | (139,087 | ) |
| | | | | | | | | | | | | | | | | | | | | | | | |
| Class Y: | | | | | | | | | | | | | | | | | | | | | | | | |
Proceeds from shares issued | | $ | 6,151,753 | | | $ | 11,415,749 | | | $ | 11,826,933 | | | $ | 11,899,047 | | | $ | 12,082,284 | | | $ | 13,351,033 | |
Dividends reinvested | | | 64,693 | | | | 6,269,439 | | | | 218,670 | | | | 190,834 | | | | 359,710 | | | | 5,354,562 | |
Cost of shares redeemed | | | (14,299,768 | ) | | | (15,672,624 | ) | | | (36,422,442 | ) | | | (38,928,642 | ) | | | (29,877,275 | ) | | | (32,030,038 | ) |
| | | | | | | | | | | | | | | | | | | | | | | | |
Change in net assets from Class Y | | $ | (8,083,322 | ) | | $ | 2,012,564 | | | $ | (24,376,839 | ) | | $ | (26,838,761 | ) | | $ | (17,435,281 | ) | | $ | (13,324,443 | ) |
| | | | | | | | | | | | | | | | | | | | | | | | |
Change in net assets from capital transactions | | $ | (8,146,322 | ) | | $ | 2,047,497 | | | $ | (25,386,751 | ) | | $ | (30,189,419 | ) | | $ | (18,192,720 | ) | | $ | (14,794,129 | ) |
| | | | | | | | | | | | | | | | | | | | | | | | |
| Share Transactions: | | | | | | | | | | | | | | | | | | | | | | | | |
| Class A: | | | | | | | | | | | | | | | | | | | | | | | | |
Issued | | | 22,391 | | | | 7,213 | | | | 264,975 | | | | 290,428 | | | | 117,913 | | | | 112,475 | |
Reinvested | | | 279 | | | | 5,722 | | | | 5,482 | | | | 3,007 | | | | 5,828 | | | | 24,202 | |
Redeemed | | | (8,651 | ) | | | (11,159 | ) | | | (140,217 | ) | | | (235,103 | ) | | | (70,451 | ) | | | (108,455 | ) |
| | | | | | | | | | | | | | | | | | | | | | | | |
Change in Class A | | | 14,019 | | | | 1,776 | | | | 130,240 | | | | 58,332 | | | | 53,290 | | | | 28,222 | |
| | | | | | | | | | | | | | | | | | | | | | | | |
| Class B: | | | | | | | | | | | | | | | | | | | | | | | | |
Issued | | | | | | | | | | | — | | | | 1,648 | | | | 2 | | | | 5,253 | |
Reinvested | | | | | | | | | | | 226 | | | | 609 | | | | 334 | | | | 10,024 | |
Redeemed | | | | | | | | | | | (205,979 | ) | | | (399,454 | ) | | | (70,735 | ) | | | (147,616 | ) |
| | | | | | | | | | | | | | | | | | | | | | | | |
Change in Class B | | | | | | | | | | | (205,753 | ) | | | (397,197 | ) | | | (70,399 | ) | | | (132,339 | ) |
| | | | | | | | | | | | | | | | | | | | | | | | |
| Class C: | | | | | | | | | | | | | | | | | | | | | | | | |
Issued | | | 9,297 | | | | 12,717 | | | | 24,616 | | | | 27,220 | | | | 19,330 | | | | 23,176 | |
Reinvested | | | 83 | | | | 4,864 | | | | 238 | | | | 247 | | | | 698 | | | | 7,968 | |
Redeemed | | | (29,420 | ) | | | (16,513 | ) | | | (117,501 | ) | | | (78,233 | ) | | | (91,610 | ) | | | (44,024 | ) |
| | | | | | | | | | | | | | | | | | | | | | | | |
Change in Class C | | | (20,040 | ) | | | 1,068 | | | | (92,647 | ) | | | (50,766 | ) | | | (71,582 | ) | | | (12,880 | ) |
| | | | | | | | | | | | | | | | | | | | | | | | |
| Class Y: | | | | | | | | | | | | | | | | | | | | | | | | |
Issued | | | 1,051,847 | | | | 1,013,542 | | | | 1,702,366 | | | | 1,229,182 | | | | 1,390,452 | | | | 961,111 | |
Reinvested | | | 11,072 | | | | 604,906 | | | | 32,759 | | | | 20,245 | | | | 41,281 | | | | 380,211 | |
Redeemed | | | (2,387,083 | ) | | | (1,527,979 | ) | | | (5,472,691 | ) | | | (4,011,283 | ) | | | (3,394,502 | ) | | | (2,357,842 | ) |
| | | | | | | | | | | | | | | | | | | | | | | | |
Change in Class Y | | | (1,324,164 | ) | | | 90,469 | | | | (3,737,566 | ) | | | (2,761,856 | ) | | | (1,962,769 | ) | | | (1,016,520 | ) |
| | | | | | | | | | | | | | | | | | | | | | | | |
Change in shares | | | (1,330,185 | ) | | | 93,313 | | | | (3,905,726 | ) | | | (3,151,487 | ) | | | (2,051,460 | ) | | | (1,133,517 | ) |
| | | | | | | | | | | | | | | | | | | | | | | | |
See notes to financial statements.
38
PACIFIC CAPITAL FUNDS
Statements of Changes in Net Assets, continued
| | | | | | | | | | | | | | | | | | | | | | | | |
| | | Value Fund | | | High Grade Core Fixed
Income Fund | | | Tax-Free Securities Fund | |
| | | Year Ended
July 31,
2009 | | | Year Ended
July 31,
2008 | | | Year Ended
July 31,
2009 | | | Year Ended
July 31,
2008 | | | Year Ended
July 31,
2009 | | | Year Ended
July 31,
2008 | |
| From Investment Activities: | | | | | | | | | | | | | | | | | | | | | |
| Operations: | | | | | | | | | | | | | | | | | | | | | | | | |
Net investment income | | $ | 1,571,178 | | | $ | 2,045,348 | | | $ | 10,170,833 | | | $ | 13,839,082 | | | $ | 10,168,370 | | | $ | 12,082,995 | |
Net realized gains (losses) from investments | | | (33,417,085 | ) | | | (5,434,126 | ) | | | 789,365 | | | | 2,618,457 | | | | (2,120,906 | ) | | | 341,698 | |
Change in unrealized appreciation/depreciation on investments | | | 7,835,932 | | | | (15,681,950 | ) | | | 4,772,498 | | | | (377,812 | ) | | | 2,752,064 | | | | (3,883,418 | ) |
| | | | | | | | | | | | | | | | | | | | | | | | |
Change in net assets resulting from operations | | | (24,009,975 | ) | | | (19,070,728 | ) | | | 15,732,696 | | | | 16,079,727 | | | | 10,799,528 | | | | 8,541,275 | |
| | | | | | | | | | | | | | | | | | | | | | | | |
| Distributions to Class A Shareholders: | | | | | | | | | | | | | | | | | | | | | | | | |
From net investment income | | | (32,053 | ) | | | (32,755 | ) | | | (122,040 | ) | | | (139,029 | ) | | | (204,462 | ) | | | (220,589 | ) |
From net realized gains | | | — | | | | (429,326 | ) | | | — | | | | — | | | | (6,985 | ) | | | (5,521 | ) |
| Distributions to Class B Shareholders: | | | | | | | | | | | | | | | | | | | | | | | | |
From net investment income | | | (3,773 | ) | | | (4,487 | ) | | | (23,521 | ) | | | (44,972 | ) | | | (18,145 | ) | | | (28,928 | ) |
From net realized gains | | | — | | | | (155,040 | ) | | | — | | | | — | | | | (956 | ) | | | (850 | ) |
| Distributions to Class C Shareholders: | | | | | | | | | | | | | | | | | | | | | | | | |
From net investment income | | | (9,484 | ) | | | (10,382 | ) | | | (23,972 | ) | | | (34,469 | ) | | | (349 | ) | | | (367 | ) |
From net realized gains | | | — | | | | (309,838 | ) | | | — | | | | — | | | | (16 | ) | | | (11 | ) |
| Distributions to Class Y Shareholders: | | | | | | | | | | | | | | | | | | | | | | | | |
From net investment income | | | (1,497,601 | ) | | | (2,049,266 | ) | | | (9,873,931 | ) | | | (13,416,292 | ) | | | (9,916,410 | ) | | | (11,833,111 | ) |
From net realized gains | | | — | | | | (23,050,183 | ) | | | — | | | | — | | | | (333,728 | ) | | | (274,361 | ) |
| | | | | | | | | | | | | | | | | | | | | | | | |
Change in net assets from shareholder distributions | | | (1,542,911 | ) | | | (26,041,277 | ) | | | (10,043,464 | ) | | | (13,634,762 | ) | | | (10,481,051 | ) | | | (12,363,738 | ) |
| | | | | | | | | | | | | | | | | | | | | | | | |
| Capital Transactions: | | | | | | | | | | | | | | | | | | | | | | | | |
Change in net assets from capital share transactions | | | (18,779,184 | ) | | | 3,852,288 | | | | (86,898,398 | ) | | | (32,459,786 | ) | | | (20,846,984 | ) | | | (25,415,866 | ) |
| | | | | | | | | | | | | | | | | | | | | | | | |
Change in net assets | | | (44,332,070 | ) | | | (41,259,717 | ) | | | (81,209,166 | ) | | | (30,014,821 | ) | | | (20,528,507 | ) | | | (29,238,329 | ) |
| | | | | | | | | | | | | | | | | | | | | | | | |
| Net Assets: | | | | | | | | | | | | | | | | | | | | | | | | |
Beginning of year | | | 108,441,615 | | | | 149,701,332 | | | | 283,814,412 | | | | 313,829,233 | | | | 260,059,119 | | | | 289,297,448 | |
| | | | | | | | | | | | | | | | | | | | | | | | |
End of year | | $ | 64,109,545 | | | $ | 108,441,615 | | | $ | 202,605,246 | | | $ | 283,814,412 | | | $ | 239,530,612 | | | $ | 260,059,119 | |
| | | | | | | | | | | | | | | | | | | | | | | | |
Undistributed (distributions in excess of) net investment income | | $ | 27,494 | | | $ | 1 | | | $ | (41,189 | ) | | $ | (41,189 | ) | | $ | 29,108 | | | $ | 91 | |
| | | | | | | | | | | | | | | | | | | | | | | | |
See notes to financial statements.
39
PACIFIC CAPITAL FUNDS
Statements of Changes in Net Assets, continued
| | | | | | | | | | | | | | | | | | | | | | | | |
| | | Value Fund | | | High Grade Core Fixed
Income Fund | | | Tax-Free Securities Fund | |
| | | Year Ended
July 31,
2009 | | | Year Ended
July 31,
2008 | | | Year Ended
July 31,
2009 | | | Year Ended
July 31,
2008 | | | Year Ended
July 31,
2009 | | | Year Ended
July 31,
2008 | |
| Capital Transactions: | | | | | | | | | | | | | | | | | | | | | | | | |
| Class A: | | | | | | | | | | | | | | | | | | | | | | | | |
Proceeds from shares issued | | $ | 659,700 | | | $ | 456,292 | | | $ | 1,236,816 | | | $ | 826,735 | | | $ | 1,053,806 | | | $ | 498,673 | |
Dividends reinvested | | | 25,493 | | | | 338,110 | | | | 95,436 | | | | 105,649 | | | | 124,460 | | | | 127,806 | |
Cost of shares redeemed | | | (260,416 | ) | | | (796,094 | ) | | | (1,313,720 | ) | | | (808,729 | ) | | | (424,436 | ) | | | (927,100 | ) |
| | | | | | | | | | | | | | | | | | | | | | | | |
Change in net assets from Class A | | $ | 424,777 | | | $ | (1,692 | ) | | $ | 18,532 | | | $ | 123,655 | | | $ | 753,830 | | | $ | (300,621 | ) |
| | | | | | | | | | | | | | | | | | | | | | | | |
| Class B: | | | | | | | | | | | | | | | | | | | | | | | | |
Proceeds from shares issued | | $ | 3,388 | | | $ | — | | | $ | 1,891 | | | $ | 3,943 | | | $ | — | | | $ | — | |
Dividends reinvested | | | 3,248 | | | | 146,800 | | | | 18,203 | | | | 35,224 | | | | 11,903 | | | | 18,618 | |
Cost of shares redeemed | | | (160,731 | ) | | | (445,215 | ) | | | (395,513 | ) | | | (813,173 | ) | | | (471,835 | ) | | | (380,239 | ) |
| | | | | | | | | | | | | | | | | | | | | | | | |
Change in net assets from Class B | | $ | (154,095 | ) | | $ | (298,415 | ) | | $ | (375,419 | ) | | $ | (774,006 | ) | | $ | (459,932 | ) | | $ | (361,621 | ) |
| | | | | | | | | | | | | | | | | | | | | | | | |
| Class C: | | | | | | | | | | | | | | | | | | | | | | | | |
Proceeds from shares issued | | $ | 176,322 | | | $ | 380,806 | | | $ | 127,115 | | | $ | 213,276 | | | $ | (31 | ) | | $ | — | |
Dividends reinvested | | | 9,483 | | | | 320,220 | | | | 23,758 | | | | 34,016 | | | | 365 | | | | 376 | |
Cost of shares redeemed | | | (723,636 | ) | | | (628,394 | ) | | | (565,165 | ) | | | (358,844 | ) | | | — | | | | — | |
| | | | | | | | | | | | | | | | | | | | | | | | |
Change in net assets from Class C | | $ | (537,831 | ) | | $ | 72,632 | | | $ | (414,292 | ) | | $ | (111,552 | ) | | $ | 334 | | | $ | 376 | |
| | | | | | | | | | | | | | | | | | | | | | | | |
| Class Y: | | | | | | | | | | | | | | | | | | | | | | | | |
Proceeds from shares issued | | $ | 9,229,528 | | | $ | 19,168,810 | | | $ | 25,304,699 | | | $ | 28,701,064 | | | $ | 44,671,807 | | | $ | 36,520,216 | |
Dividends reinvested | | | 422,435 | | | | 16,321,574 | | | | 2,231,165 | | | | 2,884,573 | | | | 365,071 | | | | 855,113 | |
Cost of shares redeemed | | | (28,163,998 | ) | | | (31,410,621 | ) | | | (113,663,083 | ) | | | (63,283,520 | ) | | | (66,178,094 | ) | | | (62,129,329 | ) |
| | | | | | | | | | | | | | | | | | | | | | | | |
Change in net assets from Class Y | | $ | (18,512,035 | ) | | $ | 4,079,763 | | | $ | (86,127,219 | ) | | $ | (31,697,883 | ) | | $ | (21,141,216 | ) | | $ | (24,754,000 | ) |
| | | | | | | | | | | | | | | | | | | | | | | | |
Change in net assets from capital transactions | | $ | (18,779,184 | ) | | $ | 3,852,288 | | | $ | (86,898,398 | ) | | $ | (32,459,786 | ) | | $ | (20,846,984 | ) | | $ | (25,415,866 | ) |
| | | | | | | | | | | | | | | | | | | | | | | | |
| Share Transactions: | | | | | | | | | | | | | | | | | | | | | | | | |
| Class A: | | | | | | | | | | | | | | | | | | | | | | | | |
Issued | | | 128,185 | | | | 54,574 | | | | 114,300 | | | | 76,384 | | | | 106,580 | | | | 49,591 | |
Reinvested | | | 4,806 | | | | 39,581 | | | | 8,875 | | | | 9,754 | | | | 12,751 | | | | 12,772 | |
Redeemed | | | (48,687 | ) | | | (84,535 | ) | | | (122,509 | ) | | | (74,762 | ) | | | (43,536 | ) | | | (92,290 | ) |
| | | | | | | | | | | | | | | | | | | | | | | | |
Change in Class A | | | 84,304 | | | | 9,620 | | | | 666 | | | | 11,376 | | | | 75,795 | | | | (29,927 | ) |
| | | | | | | | | | | | | | | | | | | | | | | | |
| Class B: | | | | | | | | | | | | | | | | | | | | | | | | |
Issued | | | 683 | | | | — | | | | 172 | | | | 365 | | | | — | | | | — | |
Reinvested | | | 632 | | | | 17,576 | | | | 1,700 | | | | 3,259 | | | | 1,223 | | | | 1,860 | |
Redeemed | | | (29,719 | ) | | | (51,354 | ) | | | (37,043 | ) | | | (75,287 | ) | | | (48,137 | ) | | | (37,848 | ) |
| | | | | | | | | | | | | | | | | | | | | | | | |
Change in Class B | | | (28,404 | ) | | | (33,778 | ) | | | (35,171 | ) | | | (71,663 | ) | | | (46,914 | ) | | | (35,988 | ) |
| | | | | | | | | | | | | | | | | | | | | | | | |
| Class C: | | | | | | | | | | | | | | | | | | | | | | | | |
Issued | | | 33,963 | | | | 45,653 | | | | 11,868 | | | | 19,541 | | | | — | | | | — | |
Reinvested | | | 1,859 | | | | 38,260 | | | | 2,218 | | | | 3,147 | | | | 37 | | | | 38 | |
Redeemed | | | (134,274 | ) | | | (78,808 | ) | | | (52,483 | ) | | | (33,070 | ) | | | — | | | | — | |
| | | | | | | | | | | | | | | | | | | | | | | | |
Change in Class C | | | (98,452 | ) | | | 5,105 | | | | (38,397 | ) | | | (10,382 | ) | | | 37 | | | | 38 | |
| | | | | | | | | | | | | | | | | | | | | | | | |
| Class Y: | | | | | | | | | | | | | | | | | | | | | | | | |
Issued | | | 1,790,583 | | | | 2,135,840 | | | | 2,343,136 | | | | 2,630,979 | | | | 4,541,880 | | | | 3,634,039 | |
Reinvested | | | 79,510 | | | | 1,906,746 | | | | 206,647 | | | | 265,539 | | | | 39,020 | | | | 85,379 | |
Redeemed | | | (5,248,484 | ) | | | (3,621,798 | ) | | | (10,525,633 | ) | | | (5,823,053 | ) | | | (6,747,130 | ) | | | (6,169,494 | ) |
| | | | | | | | | | | | | | | | | | | | | | | | |
Change in Class Y | | | (3,378,391 | ) | | | 420,788 | | | | (7,975,850 | ) | | | (2,926,535 | ) | | | (2,166,230 | ) | | | (2,450,076 | ) |
| | | | | | | | | | | | | | | | | | | | | | | | |
Change in shares | | | (3,420,943 | ) | | | 401,735 | | | | (8,048,752 | ) | | | (2,997,204 | ) | | | (2,137,312 | ) | | | (2,515,953 | ) |
| | | | | | | | | | | | | | | | | | | | | | | | |
See notes to financial statements.
40
PACIFIC CAPITAL FUNDS
Statements of Changes in Net Assets, continued
| | | | | | | | | | | | | | | | | | | | | | | | |
| | | High Grade
Short Intermediate
Fixed Income Fund | | | Tax-Free
Short Intermediate
Securities Fund | | | U.S. Government
Short Fixed
Income Fund | |
| | | Year Ended
July 31,
2009 | | | Year Ended
July 31,
2008 | | | Year Ended
July 31,
2009 | | | Year Ended
July 31,
2008 | | | Year Ended
July 31,
2009 | | | Year Ended
July 31,
2008 | |
| From Investment Activities: | | | | | | | | | | | | | | | | | | | | | | | | |
| Operations: | | | | | | | | | | | | | | | | | | | | | | | | |
Net investment income | | $ | 2,364,817 | | | $ | 2,812,625 | | | $ | 1,327,847 | | | $ | 1,600,839 | | | $ | 1,495,618 | | | $ | 3,393,550 | |
Net realized gains (losses) from investments | | | 663,174 | | | | 667,701 | | | | (82,600 | ) | | | 8,348 | | | | 1,572,643 | | | | 717,346 | |
Change in unrealized appreciation/depreciation on investments | | | 1,374,033 | | | | 441,526 | | | | 708,487 | | | | 625,732 | | | | (584,570 | ) | | | 1,004,440 | |
| | | | | | | | | | | | | | | | | | | | | | | | |
Change in net assets resulting from operations | | | 4,402,024 | | | | 3,921,852 | | | | 1,953,734 | | | | 2,234,919 | | | | 2,483,691 | | | | 5,115,336 | |
| | | | | | | | | | | | | | | | | | | | | | | | |
| Distributions to Class A Shareholders: | | | | | | | | | | | | | | | | | | | | | | | | |
From net investment income | | | (39,661 | ) | | | (40,697 | ) | | | (33,725 | ) | | | (63,059 | ) | | | (46,855 | ) | | | (94,683 | ) |
| Distributions to Class B Shareholders: | | | | | | | | | | | | | | | | | | | | | | | | |
From net investment income | | | — | | | | — | | | | — | | | | — | | | | (4,778 | ) | | | (18,221 | ) |
| Distributions to Class C Shareholders: | | | | | | | | | | | | | | | | | | | | | | | | |
From net investment income | | | (13,966 | ) | | | (16,899 | ) | | | (171 | ) | | | (243 | ) | | | (10,828 | ) | | | (31,569 | ) |
| Distributions to Class Y Shareholders: | | | | | | | | | | | | | | | | | | | | | | | | |
From net investment income | | | (2,388,712 | ) | | | (2,752,365 | ) | | | (1,317,060 | ) | | | (1,537,537 | ) | | | (1,433,157 | ) | | | (3,249,077 | ) |
| | | | | | | | | | | | | | | | | | | | | | | | |
Change in net assets from shareholder distributions | | | (2,442,339 | ) | | | (2,809,961 | ) | | | (1,350,956 | ) | | | (1,600,839 | ) | | | (1,495,618 | ) | | | (3,393,550 | ) |
| | | | | | | | | | | | | | | | | | | | | | | | |
| Capital Transactions: | | | | | | | | | | | | | | | | | | | | | | | | |
Change in net assets from capital share transactions | | | (7,682,970 | ) | | | (1,719,939 | ) | | | 12,832,358 | | | | (4,135,556 | ) | | | (6,432,935 | ) | | | (16,415,431 | ) |
| | | | | | | | | | | | | | | | | | | | | | | | |
Change in net assets | | | (5,723,285 | ) | | | (608,048 | ) | | | 13,435,136 | | | | (3,501,476 | ) | | | (5,444,862 | ) | | | (14,693,645 | ) |
| | | | | | | | | | | | | | | | | | | | | | | | |
| Net Assets: | | | | | | | | | | | | | | | | | | | | | | | | |
Beginning of year | | | 63,695,038 | | | | 64,303,086 | | | | 49,518,749 | | | | 53,020,225 | | | | 75,330,367 | | | | 90,024,012 | |
| | | | | | | | | | | | | | | | | | | | | | | | |
End of year | | $ | 57,971,753 | | | $ | 63,695,038 | | | $ | 62,953,885 | | | $ | 49,518,749 | | | $ | 69,885,505 | | | $ | 75,330,367 | |
| | | | | | | | | | | | | | | | | | | | | | | | |
Undistributed (distributions in excess of) net investment income | | $ | (18,643 | ) | | $ | (7,382 | ) | | $ | (21,303 | ) | | $ | 762 | | | $ | — | | | $ | — | |
| | | | | | | | | | | | | | | | | | | | | | | | |
See notes to financial statements.
41
PACIFIC CAPITAL FUNDS
Statements of Changes in Net Assets, continued
| | | | | | | | | | | | | | | | | | | | | | | | |
| | | High Grade
Short Intermediate
Fixed Income Fund | | | Tax-Free
Short Intermediate
Securities Fund | | | U.S. Government
Short Fixed
Income Fund | |
| | | Year Ended
July 31,
2009 | | | Year Ended
July 31,
2008 | | | Year Ended
July 31,
2009 | | | Year Ended
July 31,
2008 | | | Year Ended
July 31,
2009 | | | Year Ended
July 31,
2008 | |
| Capital Transactions: | | | | | | | | | | | | | | | | | | | | | | | | |
| Class A: | | | | | | | | | | | | | | | | | | | | | | | | |
Proceeds from shares issued | | $ | 273,421 | | | $ | 96,490 | | | $ | 605,312 | | | $ | 19,987 | | | $ | 790,373 | | | $ | 858,808 | |
Dividends reinvested | | | 35,826 | | | | 36,453 | | | | 27,245 | | | | 51,745 | | | | 34,944 | | | | 54,613 | |
Cost of shares redeemed | | | (148,855 | ) | | | (109,635 | ) | | | (777,631 | ) | | | (317,241 | ) | | | (1,938,921 | ) | | | (451,758 | ) |
| | | | | | | | | | | | | | | | | | | | | | | | |
Change in net assets from Class A | | $ | 160,392 | | | $ | 23,308 | | | $ | (145,074 | ) | | $ | (245,509 | ) | | $ | (1,113,604 | ) | | $ | 461,663 | |
| | | | | | | | | | | | | | | | | | | | | | | | |
| Class B: | | | | | | | | | | | | | | | | | | | | | | | | |
Proceeds from shares issued | | | | | | | | | | | | | | | | | | $ | 17,338 | | | $ | 45,565 | |
Dividends reinvested | | | | | | | | | | | | | | | | | | | 4,461 | | | | 16,895 | |
Cost of shares redeemed | | | | | | | | | | | | | | | | | | | (268,025 | ) | | | (446,815 | ) |
| | | | | | | | | | | | | | | | | | | | | | | | |
Change in net assets from Class B | | | | | | | | | | | | | | | | | | $ | (246,226 | ) | | $ | (384,355 | ) |
| | | | | | | | | | | | | | | | | | | | | | | | |
| Class C: | | | | | | | | | | | | | | | | | | | | | | | | |
Proceeds from shares issued | | $ | 204,463 | | | $ | 86,028 | | | $ | — | | | $ | — | | | $ | 517,208 | | | $ | 225,776 | |
Dividends reinvested | | | 13,815 | | | | 16,723 | | | | 172 | | | | 241 | | | | 10,652 | | | | 31,069 | |
Cost of shares redeemed | | | (257,142 | ) | | | (158,013 | ) | | | — | | | | — | | | | (461,712 | ) | | | (466,888 | ) |
| | | | | | | | | | | | | | | | | | | | | | | | |
Change in net assets from Class C | | $ | (38,864 | ) | | $ | (55,262 | ) | | $ | 172 | | | $ | 241 | | | $ | 66,148 | | | $ | (210,043 | ) |
| | | | | | | | | | | | | | | | | | | | | | | | |
| Class Y: | | | | | | | | | | | | | | | | | | | | | | | | |
Proceeds from shares issued | | $ | 15,734,795 | | | $ | 18,166,175 | | | $ | 27,121,911 | | | $ | 10,990,527 | | | $ | 13,934,900 | | | $ | 23,194,578 | |
Dividends reinvested | | | 580,677 | | | | 544,487 | | | | 3,964 | | | | 78,588 | | | | 495,372 | | | | 1,347,356 | |
Cost of shares redeemed | | | (24,119,970 | ) | | | (20,398,647 | ) | | | (14,148,615 | ) | | | (14,959,403 | ) | | | (19,569,525 | ) | | | (40,824,630 | ) |
| | | | | | | | | | | | | | | | | | | | | | | | |
Change in net assets from Class Y | | $ | (7,804,498 | ) | | $ | (1,687,985 | ) | | $ | 12,977,260 | | | $ | (3,890,288 | ) | | $ | (5,139,253 | ) | | $ | (16,282,696 | ) |
| | | | | | | | | | | | | | | | | | | | | | | | |
Change in net assets from capital transactions | | $ | (7,682,970 | ) | | $ | (1,719,939 | ) | | $ | 12,832,358 | | | $ | (4,135,556 | ) | | $ | (6,432,935 | ) | | $ | (16,415,431 | ) |
| | | | | | | | | | | | | | | | | | | | | | | | |
| Share Transactions: | | | | | | | | | | | | | | | | | | | | | | | | |
| Class A: | | | | | | | | | | | | | | | | | | | | | | | | |
Issued | | | 27,534 | | | | 9,913 | | | | 59,232 | | | | 1,966 | | | | 76,556 | | | | 83,669 | |
Reinvested | | | 3,644 | | | | 3,755 | | | | 2,678 | | | | 5,114 | | | | 3,374 | | | | 5,330 | |
Redeemed | | | (15,195 | ) | | | (11,302 | ) | | | (76,400 | ) | | | (31,280 | ) | | | (186,066 | ) | | | (43,927 | ) |
| | | | | | | | | | | | | | | | | | | | | | | | |
Change in Class A | | | 15,983 | | | | 2,366 | | | | (14,490 | ) | | | (24,200 | ) | | | (106,136 | ) | | | 45,072 | |
| | | | | | | | | | | | | | | | | | | | | | | | |
| Class B: | | | | | | | | | | | | | | | | | | | | | | | | |
Issued | | | | | | | | | | | | | | | | | | | 1,676 | | | | 4,490 | |
Reinvested | | | | | | | | | | | | | | | | | | | 431 | | | | 1,651 | |
Redeemed | | | | | | | | | | | | | | | | | | | (25,816 | ) | | | (43,853 | ) |
| | | | | | | | | | | | | | | | | | | | | | | | |
Change in Class B | | | | | | | | | | | | | | | | | | | (23,709 | ) | | | (37,712 | ) |
| | | | | | | | | | | | | | | | | | | | | | | | |
| Class C: | | | | | | | | | | | | | | | | | | | | | | | | |
Issued | | | 20,729 | | | | 8,842 | | | | — | | | | — | | | | 49,905 | | | | 22,011 | |
Reinvested | | | 1,406 | | | | 1,724 | | | | 17 | | | | 24 | | | | 1,030 | | | | 3,034 | |
Redeemed | | | (26,043 | ) | | | (16,269 | ) | | | — | | | | — | | | | (44,441 | ) | | | (45,562 | ) |
| | | | | | | | | | | | | | | | | | | | | | | | |
Change in Class C | | | (3,908 | ) | | | (5,703 | ) | | | 17 | | | | 24 | | | | 6,494 | | | | (20,517 | ) |
| | | | | | | | | | | | | | | | | | | | | | | | |
| Class Y: | | | | | | | | | | | | | | | | | | | | | | | | |
Issued | | | 1,596,815 | | | | 1,874,839 | | | | 2,644,094 | | | | 1,081,831 | | | | 1,340,777 | | | | 2,254,832 | |
Reinvested | | | 59,036 | | | | 56,045 | | | | 388 | | | | 7,712 | | | | 47,792 | | | | 131,548 | |
Redeemed | | | (2,446,981 | ) | | | (2,092,111 | ) | | | (1,382,504 | ) | | | (1,472,590 | ) | | | (1,888,122 | ) | | | (3,979,619 | ) |
| | | | | | | | | | | | | | | | | | | | | | | | |
Change in Class Y | | | (791,130 | ) | | | (161,227 | ) | | | 1,261,978 | | | | (383,047 | ) | | | (499,553 | ) | | | (1,593,239 | ) |
| | | | | | | | | | | | | | | | | | | | | | | | |
Change in shares | | | (779,055 | ) | | | (164,564 | ) | | | 1,247,505 | | | | (407,223 | ) | | | (622,904 | ) | | | (1,606,396 | ) |
| | | | | | | | | | | | | | | | | | | | | | | | |
See notes to financial statements.
42
PACIFIC CAPITAL FUNDS
New Asia Growth Fund
Schedule of Portfolio Investments
July 31, 2009
| | | | |
| Shares | | Security
Description | | Value ($) |
| Common Stocks (96.4%) | | |
| Cayman Islands (2.6%) | | |
Consumer Discretionary (1.6%) | | |
| 220,000 | | Hengan International Group Co. Ltd. | | 1,280,291 |
| | | | |
Consumer Staples (1.0%) | | |
| 450,000 | | Tingyi (Cayman Islands) Holding Corp. | | 833,828 |
| | | | |
| | | | 2,114,119 |
| | | | |
| China (5.2%) | | |
Consumer Discretionary (2.5%) | | |
| 813,000 | | China Resources Enterprise Ltd. | | 2,033,077 |
| | | | |
Energy (1.2%) | | |
| 902,000 | | China Oilfield Services Ltd., Class H | | 983,496 |
| | | | |
Telecommunications (1.5%) | | |
| 2,278,000 | | China Telecom Corp. Ltd., Class H | | 1,187,530 |
| | | | |
| | | | 4,204,103 |
| | | | |
| Hong Kong (21.2%) | | |
Consumer Discretionary (5.8%) | | |
| 274,000 | | Cheung Kong Holdings Ltd. | | 3,539,111 |
| 165,700 | | Esprit Holdings Ltd. | | 1,197,347 |
| | | | |
| | | | 4,736,458 |
| | | | |
Energy (1.0%) | | |
| 631,500 | | CNOOC Ltd. | | 849,084 |
| | | | |
Financials (2.8%) | | |
| 443,000 | | Hang Lung Group Ltd. | | 2,295,085 |
| | | | |
Industrials (5.1%) | | |
| 372,000 | | Swire Pacific Ltd., Class A | | 4,178,508 |
| | | | |
Information Technology (0.2%) | | |
| 262,000 | | Lenovo Group Ltd. | | 124,411 |
| | | | |
Utilities (6.3%) | | |
| 207,000 | | CLP Holdings Ltd. | | 1,407,636 |
| 1,650,680 | | Hong Kong & China Gas Co. Ltd. | | 3,693,359 |
| | | | |
| | | | 5,100,995 |
| | | | |
| | | | 17,284,541 |
| | | | |
| India (3.8%) | | |
Information Technology (3.8%) | | |
| 71,100 | | Infosys Technologies Ltd., ADR | | 3,059,433 |
| | | | |
| Indonesia (1.1%) | | |
Telecommunications (1.1%) | | |
| 1,038,000 | | PT Telekomunikasi Indonesia | | 936,502 |
| | | | |
| Malaysia (4.9%) | | |
Financials (1.1%) | | |
| 286,500 | | Bumiputra-Commerce Holdings Berhad | | 879,034 |
| | | | |
Industrials (3.8%) | | |
| 2,269,050 | | IOI Corp. Berhad | | 3,158,621 |
| | | | |
| | | | 4,037,655 |
| | | | |
| Papua New Guinea (8.4%) | | |
Metals and Mining (8.4%) | | |
| 2,968,898 | | Lihir Gold Ltd. (a) | | 6,875,954 |
| | | | |
| | | | |
| Shares | | Security
Description | | Value ($) |
| Common Stocks, continued | | |
| Philippines (3.1%) | | |
Financials (1.6%) | | |
| 203,488 | | Ayala Corp. | | 1,269,948 |
| | | | |
Telecommunications (1.5%) | | |
| 13,590 | | Philippine Long Distance Telephone Co. | | 719,504 |
| 10,100 | | Philippine Long Distance Telephone Co., ADR | | 531,967 |
| | | | |
| | | | 1,251,471 |
| | | | |
| | | | 2,521,419 |
| | | | |
| Singapore (12.2%) | | |
Consumer Staples (1.5%) | | |
| 423,000 | | Fraser & Neave Ltd. | | 1,220,079 |
| | | | |
Financials (5.5%) | | |
| 72,000 | | Great Eastern Holdings Ltd. | | 709,591 |
| 701,471 | | Oversea-Chinese Banking Corp. Ltd. | | 3,812,555 |
| | | | |
| | | | 4,522,146 |
| | | | |
Telecommunications (5.2%) | | |
| 1,207,000 | | Singapore Telecommunications Ltd. | | 2,936,127 |
| 828,290 | | Starhub Ltd. | | 1,289,526 |
| | | | |
| | | | 4,225,653 |
| | | | |
| | | | 9,967,878 |
| | | | |
| South Korea (15.1%) | | |
Consumer Discretionary (5.2%) | | |
| 21,720 | | LG Corp. | | 1,170,994 |
| 7,044 | | Shinsegae Co. Ltd. | | 3,046,147 |
| | | | |
| | | | 4,217,141 |
| | | | |
Financials (2.5%) | | |
| 12,134 | | Samsung Fire & Marine Insurance Co. Ltd. | | 2,035,674 |
| | | | |
Information Technology (6.0%) | | |
| 16,428 | | S1 Corp. | | 747,883 |
| 7,003 | | Samsung Electronics Co. Ltd. | | 4,129,141 |
| | | | |
| | | | 4,877,024 |
| | | | |
Pharmaceuticals (1.4%) | | |
| 7,485 | | Yuhan Corp. | | 1,188,676 |
| | | | |
| | | | 12,318,515 |
| | | | |
| Taiwan (12.8%) | | |
Consumer Staples (2.7%) | | |
| 429,000 | | President Chain Store Corp. | | 1,122,269 |
| 1,067,394 | | Uni-President Enterprises Corp. | | 1,108,140 |
| | | | |
| | | | 2,230,409 |
| | | | |
Industrials (0.7%) | | |
| 489,000 | | AU Optronics Corp. | | 542,704 |
| | | | |
Information Technology (7.0%) | | |
| 579,473 | | Delta Electronics, Inc. | | 1,501,775 |
| 423,645 | | Powertech Technology, Inc. | | 1,136,678 |
| 1,685,496 | | Taiwan Semiconductor Manufacturing Co. Ltd. | | 3,026,882 |
| | | | |
| | | | 5,665,335 |
| | | | |
See notes to financial statements.
43
PACIFIC CAPITAL FUNDS
New Asia Growth Fund
Schedule of Portfolio Investments, continued
July 31, 2009
| | | | |
| Shares | | Security
Description | | Value ($) |
| Common Stocks, continued | | |
| Taiwan, continued | | |
Telecommunications (2.4%) | | |
| 978,599 | | Chunghwa Telecom Co. Ltd. | | 1,963,285 |
| | | | |
| | | | 10,401,733 |
| | | | |
| Thailand (6.0%) | | |
Energy (2.3%) | | |
| 268,800 | | PTT Public Co. Ltd. | | 1,896,296 |
| | | | |
Financials (2.7%) | | |
| 940,900 | | Kasikornbank Public Co. Ltd. | | 2,212,581 |
| | | | |
Telecommunications (1.0%) | | |
| 309,600 | | Advanced Info Service Public Co. Ltd. | | 825,873 |
| | | | |
| | | | 4,934,750 |
| | | | |
Total Common Stocks (Cost $73,982,517) | | 78,656,602 |
| | | | |
| | | | |
| Shares | | Security
Description | | Value ($) |
| Investment Companies (1.5%) | | |
| 1,213,060 | | Victory Federal Money Market Fund, Investor Shares, 0.01% (b) | | 1,213,060 |
| | | | |
Total Investment Companies (Cost $1,213,060) | | 1,213,060 |
| | | | |
Total Investments (Cost $75,195,577)—97.9% | | 79,869,662 |
Other assets in excess of liabilities—2.1% | | 1,712,195 |
| | | | |
Net Assets—100.0% | | 81,581,857 |
| | | | |
| (a) | Non-income producing security. |
| (b) | Rate periodically changes. Rate disclosed is the daily yield on July 31, 2009. |
ADR—American Depositary Receipt
See notes to financial statements.
44
PACIFIC CAPITAL FUNDS
International Stock Fund
Schedule of Portfolio Investments
July 31, 2009
| | | | |
| Shares | | Security
Description | | Value ($) |
| Common Stocks (99.3%) | | |
| Australia (3.5%) | | |
Financials (1.1%) | | |
| 12,404 | | Commonwealth Bank of Australia | | 443,878 |
| 25,879 | | Westpac Banking Corp. | | 469,315 |
| | | | |
| | | | 913,193 |
| | | | |
Health Care (0.7%) | | |
| 23,006 | | CSL Ltd. | | 587,639 |
| | | | |
Materials (1.7%) | | |
| 19,078 | | BHP Billiton Ltd. | | 603,749 |
| 14,132 | | Rio Tinto Ltd. | | 713,672 |
| | | | |
| | | | 1,317,421 |
| | | | |
| | | | 2,818,253 |
| | | | |
| Belgium (0.7%) | | |
Consumer Staples (0.7%) | | |
| 14,514 | | Anheuser-Busch Inbev NV | | 577,387 |
| | | | |
| Brazil (4.2%) | | |
Energy (1.4%) | | |
| 15,696 | | Petroleo Brasileiro SA, ADR | | 647,303 |
| 13,701 | | Petroleo Brasileiro SA, ADR, Preferred Shares | | 461,724 |
| | | | |
| | | | 1,109,027 |
| | | | |
Financials (0.7%) | | |
| 31,940 | | Itau Unibanco Banco Multiplo SA, ADR | | 571,406 |
| | | | |
Materials (1.5%) | | |
| 34,905 | | Vale SA, ADR, Special Preferred | | 600,366 |
| 33,589 | | Vale SA, Special ADR | | 662,711 |
| | | | |
| | | | 1,263,077 |
| | | | |
Utilities (0.6%) | | |
| 32,232 | | Companhia Energetica de Minas Gerais SA, ADR | | 460,273 |
| | | | |
| | | | 3,403,783 |
| | | | |
| Canada (5.6%) | | |
Consumer Staples (0.6%) | | |
| 12,274 | | Shoppers Drug Mart Corp. | | 512,955 |
| | | | |
Energy (2.1%) | | |
| 36,568 | | Cameco Corp. | | 1,011,105 |
| 21,416 | | Suncor Energy, Inc. | | 695,592 |
| | | | |
| | | | 1,706,697 |
| | | | |
Financials (2.4%) | | |
| 13,518 | | Bank of Nova Scotia | | 576,366 |
| 12,107 | | IGM Financial, Inc. | | 505,751 |
| 33,950 | | Manulife Financial Corp. | | 825,325 |
| | | | |
| | | | 1,907,442 |
| | | | |
Telecommunications (0.5%) | | |
| 14,295 | | Rogers Communications, Inc. | | 397,260 |
| | | | |
| | | | 4,524,354 |
| | | | |
| China (9.8%) | | |
Consumer Discretionary (0.7%) | | |
| 1,134,000 | | Denway Motors Ltd. | | 563,357 |
| | | | |
| | | | |
| Shares | | Security
Description | | Value ($) |
| Common Stocks, continued | | |
| China, continued | | |
Energy (1.4%) | | |
| 156,500 | | China Shenhua Energy Co. Ltd. | | 639,142 |
| 396,000 | | PetroChina Co. Ltd., Class H | | 470,614 |
| | | | |
| | | | 1,109,756 |
| | | | |
Financials (4.0%) | | |
| 468,000 | | Agile Property Holdings Ltd. | | 661,860 |
| 732,000 | | China Construction Bank Corp., Class H | | 590,338 |
| 211,950 | | China Merchants Bank Co. Ltd. | | 498,300 |
| 1,356,000 | | Industrial and Commercial Bank of China Ltd., Class H | | 976,345 |
| 57,500 | | Ping An Insurance Co. of China Ltd. (Group) | | 510,465 |
| | | | |
| | | | 3,237,308 |
| | | | |
Industrials (2.4%) | | |
| 859,000 | | China Communications Construction Co. Ltd., Class H | | 1,115,066 |
| 175,200 | | Weichai Power Co. Ltd. | | 800,289 |
| | | | |
| | | | 1,915,355 |
| | | | |
Information Technology (0.9%) | | |
| 54,800 | | Tencent Holdings Ltd. | | 739,642 |
| | | | |
Telecommunications (0.4%) | | |
| 35,000 | | China Mobile Ltd. | | 367,622 |
| | | | |
| | | | 7,933,040 |
| | | | |
| Denmark (2.0%) | | |
Health Care (1.0%) | | |
| 14,011 | | Novo Nordisk A/S, Class B | | 824,760 |
| | | | |
Industrials (1.0%) | | |
| 11,374 | | Vestas Wind Systems A/S (a) | | 801,262 |
| | | | |
| | | | 1,626,022 |
| | | | |
| France (10.4%) | | |
Consumer Discretionary (0.6%) | | |
| 4,148 | | PPR | | 462,203 |
| | | | |
Consumer Staples (1.9%) | | |
| 8,465 | | Carrefour SA | | 397,308 |
| 21,654 | | Groupe DANONE (b) | | 1,161,683 |
| | | | |
| | | | 1,558,991 |
| | | | |
Energy (1.5%) | | |
| 21,316 | | Total SA, ADR | | 1,186,235 |
| | | | |
Financials (3.2%) | | |
| 29,296 | | AXA | | 619,144 |
| 34,588 | | AXA, ADR | | 731,190 |
| 17,287 | | BNP Paribas SA | | 1,260,108 |
| | | | |
| | | | 2,610,442 |
| | | | |
Materials (0.8%) | | |
| 16,789 | | ArcelorMittal | | 604,128 |
| | | | |
Telecommunications (1.2%) | | |
| 11,718 | | France Telecom SA | | 292,403 |
| 6,331 | | Iliad SA | | 675,766 |
| | | | |
| | | | 968,169 |
| | | | |
See notes to financial statements.
45
PACIFIC CAPITAL FUNDS
International Stock Fund
Schedule of Portfolio Investments, continued
July 31, 2009
| | | | |
| Shares | | Security
Description | | Value ($) |
| Common Stocks, continued | | |
| France, continued | | |
Utilities (1.2%) | | |
| 12,912 | | Electricite de France | | 639,886 |
| 8,934 | | GDF SUEZ | | 341,275 |
| | | | |
| | | | 981,161 |
| | | | |
| | | | 8,371,329 |
| | | | |
| Germany (6.0%) | | |
Consumer Discretionary (1.1%) | | |
| 20,519 | | Adidas | | 866,423 |
| | | | |
Consumer Staples (0.5%) | | |
| 10,587 | | Henkel AG & Co. KGaA | | 389,256 |
| | | | |
Financials (0.7%) | | |
| 7,099 | | Deutsche Boerse AG | | 561,984 |
| | | | |
Health Care (0.8%) | | |
| 6,696 | | Bayer AG | | 409,942 |
| 2,545 | | Merck KGaA | | 236,362 |
| | | | |
| | | | 646,304 |
| | | | |
Industrials (0.6%) | | |
| 6,246 | | Siemens AG | | 497,928 |
| | | | |
Information Technology (1.6%) | | |
| 28,116 | | SAP AG, ADR | | 1,328,481 |
| | | | |
Materials (0.7%) | | |
| 4,036 | | Wacker Chemie AG | | 533,754 |
| | | | |
| | | | 4,824,130 |
| | | | |
| Hong Kong (2.5%) | | |
Consumer Discretionary (1.6%) | | |
| 91,200 | | Esprit Holdings Ltd. | | 659,011 |
| 208,000 | | Li & Fung Ltd. | | 613,280 |
| | | | |
| | | | 1,272,291 |
| | | | |
Financials (0.5%) | | |
| 116,000 | | Hang Lung Properties Ltd. | | 425,095 |
| | | | |
Industrials (0.4%) | | |
| 620,000 | | China State Construction International Holdings Ltd. | | 325,608 |
| | | | |
| | | | 2,022,994 |
| | | | |
| India (2.5%) | | |
Financials (1.0%) | | |
| 7,939 | | HDFC Bank Ltd., ADR | | 776,196 |
| | | | |
Information Technology (1.5%) | | |
| 28,915 | | Infosys Technologies Ltd., ADR | | 1,244,213 |
| | | | |
| | | | 2,020,409 |
| | | | |
| Israel (0.6%) | | |
Health Care (0.6%) | | |
| 8,767 | | Teva Pharmaceutical Industries Ltd., ADR | | 467,632 |
| | | | |
| Italy (1.8%) | | |
Energy (1.8%) | | |
| 29,221 | | ENI SpA | | 680,023 |
| 28,262 | | Saipem SpA | | 765,242 |
| | | | |
| | | | 1,445,265 |
| | | | |
| | | | |
| Shares | | Security
Description | | Value ($) |
| Common Stocks, continued | | |
| Japan (12.7%) | | |
Consumer Discretionary (2.6%) | | |
| 624 | | Jupiter Telecommunications Co. Ltd. | | 524,342 |
| 23,500 | | Toyota Motor Corp. | | 991,069 |
| 9,110 | | Yamada Denki Co. Ltd. | | 570,037 |
| | | | |
| | | | 2,085,448 |
| | | | |
Consumer Staples (0.4%) | | |
| 14,200 | | Seven & I Holdings Co. Ltd. | | 333,199 |
| | | | |
Financials (2.7%) | | |
| 73,000 | | Bank of Yokohama Ltd. (The) | | 395,825 |
| 58,700 | | Mitsubishi UFJ Financial Group, Inc. | | 351,170 |
| 45,700 | | Nomura Holdings, Inc. | | 400,436 |
| 154 | | Sony Financial Holdings, Inc. | | 474,810 |
| 107,000 | | Sumitomo Trust & Banking Co. Ltd. (The) | | 585,837 |
| | | | |
| | | | 2,208,078 |
| | | | |
Health Care (1.4%) | | |
| 34,000 | | Shionogi & Co. Ltd. | | 704,006 |
| 8,900 | | Terumo Corp. | | 452,479 |
| | | | |
| | | | 1,156,485 |
| | | | |
Industrials (2.4%) | | |
| 7,100 | | FANUC Ltd. | | 583,099 |
| 24,000 | | NGK Insulators Ltd. | | 544,129 |
| 36,300 | | Sumitomo Corp. | | 359,509 |
| 26,000 | | THK Co. Ltd. | | 427,058 |
| | | | |
| | | | 1,913,795 |
| | | | |
Information Technology (1.2%) | | |
| 10,750 | | Canon, Inc. | | 401,094 |
| 2,100 | | Nintendo Co. Ltd. | | 568,005 |
| | | | |
| | | | 969,099 |
| | | | |
Materials (1.2%) | | |
| 17,900 | | Shin-Etsu Chemical Co. Ltd. | | 964,909 |
| | | | |
Telecommunications (0.5%) | | |
| 71 | | KDDI Corp. | | 376,725 |
| | | | |
Utilities (0.3%) | | |
| 83,000 | | OSAKA Gas Co. Ltd. | | 276,345 |
| | | | |
| | | | 10,284,083 |
| | | | |
| Luxembourg (1.1%) | | |
Telecommunications (1.1%) | | |
| 11,922 | | Millicom International Cellular SA (a) | | 884,016 |
| | | | |
| Mexico (1.4%) | | |
Consumer Staples (0.6%) | | |
| 13,892 | | Wal-Mart de Mexico SA de CV, ADR | | 470,939 |
| | | | |
Telecommunications (0.8%) | | |
| 14,673 | | America Movil SAB de CV, Series L | | 631,086 |
| | | | |
| | | | 1,102,025 |
| | | | |
| Norway (1.8%) | | |
Energy (0.5%) | | |
| 35,451 | | Subsea 7, Inc. (a) | | 410,937 |
| | | | |
See notes to financial statements.
46
PACIFIC CAPITAL FUNDS
International Stock Fund
Schedule of Portfolio Investments, continued
July 31, 2009
| | | | |
| Shares | | Security
Description | | Value ($) |
| Common Stocks, continued | | |
| Norway, continued | | |
Industrials (1.3%) | | |
| 127,028 | | Renewable Energy Corp. AS (a)(b) | | 1,009,084 |
| | | | |
| | | | 1,420,021 |
| | | | |
| Russia (2.2%) | | |
Energy (1.6%) | | |
| 8,524 | | LUKOIL, ADR | | 430,803 |
| 43,176 | | OAO Gazprom, ADR | | 895,902 |
| | | | |
| | | | 1,326,705 |
| | | | |
Materials (0.6%) | | |
| 46,250 | | JSC MMC Norilsk Nickel, ADR (a) | | 463,887 |
| | | | |
| | | | 1,790,592 |
| | | | |
| Singapore (0.7%) | | |
Financials (0.7%) | | |
| 56,000 | | DBS Group Holdings Ltd. | | 540,228 |
| | | | |
| South Africa (0.6%) | | |
Telecommunications (0.6%) | | |
| 28,648 | | MTN Group Ltd. | | 473,154 |
| | | | |
| South Korea (2.3%) | | |
Financials (0.6%) | | |
| 11,870 | | KB Financial Group, Inc. (a) | | 513,313 |
| | | | |
Information Technology (1.7%) | | |
| 2,345 | | Samsung Electronics Co. Ltd. | | 1,382,670 |
| | | | |
| | | | 1,895,983 |
| | | | |
| Spain (3.4%) | | |
Consumer Discretionary (0.5%) | | |
| 7,150 | | Industria de Diseno Textil SA | | 384,548 |
| | | | |
Financials (1.4%) | | |
| 82,126 | | Banco Santander Central Hispano SA | | 1,189,095 |
| | | | |
Industrials (0.7%) | | |
| 26,268 | | Gamesa Corporacion Technologica SA | | 568,252 |
| | | | |
Telecommunications (0.8%) | | |
| 26,141 | | Telefonica SA | | 650,256 |
| | | | |
| | | | 2,792,151 |
| | | | |
| Switzerland (8.3%) | | |
Consumer Staples (1.6%) | | |
| 31,236 | | Nestle SA | | 1,286,051 |
| | | | |
Financials (1.6%) | | |
| 26,416 | | Credit Suisse Group | | 1,248,837 |
| | | | |
Health Care (2.8%) | | |
| 2,808 | | Lonza Group AG, Registered Shares | | 278,381 |
| 18,104 | | Novartis AG | | 829,442 |
| 7,485 | | Roche Holding AG, Genusschien | | 1,180,699 |
| | | | |
| | | | 2,288,522 |
| | | | |
Industrials (1.3%) | | |
| 57,696 | | ABB Ltd. | | 1,054,321 |
| | | | |
Information Technology (0.6%) | | |
| 28,757 | | Logitech International SA, Registered Shares (a) | | 481,392 |
| | | | |
| | | | |
| Shares | | Security
Description | | Value ($) |
| Common Stocks, continued | | |
| Switzerland, continued | | |
Materials (0.4%) | | |
| 1,471 | | Syngenta AG | | 339,589 |
| | | | |
| | | | 6,698,712 |
| | | | |
| Taiwan (0.7%) | | |
Information Technology (0.7%) | | |
| 321,554 | | Taiwan Semiconductor Manufacturing Co. Ltd. | | 577,459 |
| | | | |
| United Kingdom (14.5%) | | |
Consumer Discretionary (0.6%) | | |
| 57,677 | | British Sky Broadcasting Group PLC | | 525,974 |
| | | | |
Consumer Staples (1.2%) | | |
| 161,427 | | Tesco PLC | | 990,838 |
| | | | |
Energy (0.7%) | | |
| 32,026 | | BG Group PLC | | 534,364 |
| | | | |
Financials (5.8%) | | |
| 125,255 | | Barclays PLC | | 632,415 |
| 53,775 | | HSBC Holdings PLC | | 534,988 |
| 129,740 | | ICAP PLC | | 983,782 |
| 140,445 | | Man Group PLC | | 649,177 |
| 88,662 | | Prudential Corp. PLC | | 663,784 |
| 50,718 | | Standard Chartered PLC | | 1,203,719 |
| | | | |
| | | | 4,667,865 |
| | | | |
Health Care (1.0%) | | |
| 101,288 | | Smith & Nephew PLC | | 804,410 |
| | | | |
Information Technology (1.8%) | | |
| 268,642 | | ARM Holdings PLC | | 566,467 |
| 43,741 | | Autonomy Corp. PLC (a) | | 858,411 |
| | | | |
| | | | 1,424,878 |
| | | | |
Materials (2.8%) | | |
| 35,584 | | BHP Billiton Ltd. PLC | | 928,929 |
| 33,830 | | Eurasian Natural Resources Corp. | | 487,903 |
| 28,055 | | Vedanta Resources PLC | | 826,567 |
| | | | |
| | | | 2,243,399 |
| | | | |
Telecommunications (0.6%) | | |
| 24,157 | | Vodafone Group PLC, ADR | | 497,151 |
| | | | |
| | | | 11,688,879 |
| | | | |
Total Common Stocks (Cost $84,946,833) | | 80,181,901 |
| | | | |
| Exchange Traded Funds (0.1%) | | |
| United States (0.1%) | | |
| 1,531 | | iShares MSCI EAFE Index Fund | | 77,178 |
| 667 | | iShares MSCI Emerging Markets Index Fund | | 23,825 |
| | | | |
Total Exchange Traded Funds (Cost $98,498) | | 101,003 |
| | | | |
| Rights (0.0%) | | |
| South Korea (0.0%) | | |
| 930 | | KB Financial Group, Inc. | | 12,005 |
| | | | |
Total Rights (Cost $—) | | 12,005 |
| | | | |
Total Investments (Cost $85,045,331)—99.4% | | 80,294,909 |
Other assets in excess of liabilities—0.6% | | 462,192 |
| | | | |
Net Assets—100.0% | | 80,757,101 |
| | | | |
See notes to financial statements.
47
PACIFIC CAPITAL FUNDS
International Stock Fund
Schedule of Portfolio Investments, continued
July 31, 2009
| (a) | Non-income producing security. |
| (b) | All or a portion of this security is exempt from registration under Rule 144A or Section 4(2) of the Securities Act of 1933 and has been deemed liquid based on procedures approved by the Board. The security may be resold in transactions exempt from registration, normally to qualified institutional buyers. As of July 31, 2009, these securities represent 0.5% of net assets. |
ADR—American Depositary Receipt
PLC—Public Liability Co.
At July 31, 2009 the Fund’s forward foreign exchange contracts were as follows:
| | | | | | | | | | | | | | |
Currency | | Delivery Date | | Contract Amount
In Local Currency | | | Contract Value
in USD ($) | | | Value ($) | | | Unrealized
Appreciation/
Depreciation ($) | |
Short: | | | | | | | | | | | | | | |
Euro | | 8/3/09 | | (65,817 | ) | | (92,223 | ) | | (93,796 | ) | | (1,573 | ) |
| | 8/4/09 | | (15,014 | ) | | (21,133 | ) | | (21,396 | ) | | (263 | ) |
| | | | | | | | | | | | | | |
Total Short Contracts | | | (113,356 | ) | | (115,192 | ) | | (1,836 | ) |
| | | | | | | | | | | | | | |
Long: | | | | | | | | | | | | | | |
Hong Kong Dollar | | 8/3/09 | | 388,480 | | | 50,126 | | | 50,129 | | | 3 | |
| | | | | | | | | | | | | | |
Total Long Contracts | | | 50,126 | | | 50,129 | | | 3 | |
| | | | | | | | | | | | | | |
See notes to financial statements.
48
PACIFIC CAPITAL FUNDS
Small Cap Fund
Schedule of Portfolio Investments
July 31, 2009
| | | | |
| Shares | | Security
Description | | Value ($) |
| Common Stocks (99.3%) | | |
Consumer Discretionary (13.9%) | | |
| 14,750 | | AAON, Inc. | | 289,248 |
| 4,600 | | Aaron’s, Inc. | | 126,362 |
| 3,800 | | Abercrombie & Fitch Co., Class A | | 108,642 |
| 8,300 | | Aeropostale, Inc. (a) | | 302,120 |
| 16,800 | | AgFeed Industries, Inc. (a) | | 102,312 |
| 27,500 | | Amerigon, Inc. (a) | | 231,275 |
| 13,693 | | Apogee Enterprises, Inc. | | 199,644 |
| 13,700 | | Bally Technologies, Inc. (a) | | 496,077 |
| 24,086 | | Bare Escentuals, Inc. (a) | | 213,402 |
| 11,000 | | Barnes & Noble, Inc. | | 253,330 |
| 9,000 | | Big Lots, Inc. (a) | | 207,360 |
| 1,900 | | Bio-Rad Laboratories, Inc., Class A (a) | | 147,136 |
| 5,726 | | Blyth, Inc. | | 242,954 |
| 34,200 | | Cabela’s, Inc. (a) | | 554,382 |
| 14,300 | | Carter’s, Inc. (a) | | 405,262 |
| 22,176 | | Cato Corp. (The) | | 441,081 |
| 6,772 | | CEC Entertainment, Inc. (a) | | 197,539 |
| 23,550 | | Central Garden & Pet Co. (a) | | 288,723 |
| 3,657 | | Choice Hotels International, Inc. | | 101,847 |
| 3,200 | | Consolidated Graphics, Inc. (a) | | 58,560 |
| 35,200 | | Cooper Tire & Rubber Co. | | 519,552 |
| 11,650 | | Cracker Barrel Old Country Store, Inc. | | 336,219 |
| 4,300 | | Deckers Outdoor Corp. (a) | | 290,723 |
| 17,700 | | Dollar Thrifty Automotive Group, Inc. (a) | | 292,935 |
| 6,400 | | Dress Barn, Inc. (The) (a) | | 99,776 |
| 23,600 | | DSW, Inc. (a) | | 318,364 |
| 12,200 | | Fresh Del Monte Produce, Inc. (a) | | 261,202 |
| 9,300 | | Fuel Systems Solutions, Inc. (a) | | 233,244 |
| 6,400 | | Fuqi International, Inc. (a) | | 154,944 |
| 25,888 | | Genesco, Inc. (a) | | 562,287 |
| 16,772 | | Gymboree Corp. (The) (a) | | 667,190 |
| 8,300 | | Helen of Troy Ltd. (a) | | 180,525 |
| 4,100 | | Herman Miller, Inc. | | 68,101 |
| 51,450 | | Hot Topic, Inc. (a) | | 397,709 |
| 14,600 | | Iconix Brand Group, Inc. (a) | | 255,792 |
| 14,400 | | Isle of Capri Casinos, Inc. (a) | | 171,216 |
| 5,827 | | ITT Educational Services, Inc. (a) | | 567,258 |
| 3,999 | | JAKKS Pacific, Inc. (a) | | 46,108 |
| 3,200 | | Jo-Ann Stores, Inc. (a) | | 74,560 |
| 16,500 | | Jos. A. Bank Clothiers, Inc. (a) | | 603,735 |
| 24,900 | | Kirkland’s, Inc. (a) | | 343,869 |
| 6,800 | | Lithia Motors, Inc., Class A | | 81,532 |
| 5,000 | | Maidenform Brands, Inc. (a) | | 69,150 |
| 8,460 | | Manpower, Inc. | | 405,657 |
| 11,000 | | Marvel Entertainment, Inc. (a) | | 435,160 |
| 4,600 | | Michael Baker Corp. (a) | | 196,190 |
| 6,600 | | Papa John’s International, Inc. (a) | | 167,706 |
| 9,760 | | Polaris Industries, Inc. | | 369,611 |
| 6,600 | | Pre-Paid Legal Services, Inc. | | 321,882 |
| 18,300 | | Prestige Brands Holdings, Inc. (a) | | 119,499 |
| 7,800 | | RadioShack Corp. | | 120,978 |
| 6,700 | | Red Robin Gourmet Burgers, Inc. (a) | | 125,424 |
| 31,117 | | Rent-A-Center, Inc. (a) | | 645,989 |
| 10,800 | | School Specialty, Inc. (a) | | 241,596 |
| | | | |
| Shares | | Security
Description | | Value ($) |
| Common Stocks, continued | | |
Consumer Discretionary, continued | | |
| 38,800 | | Spartan Motors, Inc. | | 271,600 |
| 6,000 | | Spartech Corp. | | 75,000 |
| 15,300 | | Steak n Shake Co. (The) (a) | | 156,366 |
| 4,293 | | Steven Madden Ltd. (a) | | 137,634 |
| 20,100 | | TeleTech Holdings, Inc. (a) | | 336,072 |
| 35,600 | | Temple-Inland, Inc. | | 557,496 |
| 35,350 | | Tempur-Pedic International, Inc. | | 524,241 |
| 34,250 | | True Religion Apparel, Inc. (a) | | 765,830 |
| 4,900 | | Warnaco Group, Inc. (The) (a) | | 178,017 |
| 14,100 | | WMS Industries, Inc. (a) | | 509,856 |
| 6,000 | | Wonder Auto Technology, Inc. (a) | | 67,380 |
| 13,900 | | World Wrestling Entertainment, Inc., Class A | | 182,507 |
| | | | |
| | | | 18,474,938 |
| | | | |
Consumer Staples (7.2%) | | |
| 25,300 | | 99 Cents Only Stores (a) | | 370,645 |
| 24,500 | | American Italian Pasta Co., Class A (a) | | 770,770 |
| 13,595 | | Andersons, Inc. (The) | | 438,031 |
| 9,700 | | BJ’s Wholesale Club, Inc. (a) | | 323,495 |
| 34,750 | | Brightpoint, Inc. (a) | | 206,415 |
| 31,650 | | Buckle, Inc. (The) | | 979,251 |
| 19,521 | | Chiquita Brands International, Inc. (a) | | 239,132 |
| 10,100 | | Citi Trends, Inc. (a) | | 294,920 |
| 8,000 | | Collective Brands, Inc. (a) | | 127,360 |
| 32,998 | | Comfort Systems USA, Inc. | | 388,716 |
| 47,400 | | Darling International, Inc. (a) | | 334,644 |
| 97,050 | | Del Monte Foods Co. | | 937,503 |
| 17,100 | | Diamond Foods, Inc. | | 482,220 |
| 4,600 | | DineEquity, Inc. | | 113,666 |
| 35,900 | | Jones Apparel Group, Inc. | | 493,984 |
| 1,700 | | Lancaster Colony Corp. | | 77,418 |
| 37,300 | | Liz Claiborne, Inc. | | 117,868 |
| 74,486 | | Nu Skin Enterprises, Inc., Class A | | 1,341,493 |
| 22,100 | | P.H. Glatfelter Co. | | 228,735 |
| 3,100 | | Pantry, Inc. (a) | | 54,405 |
| 6,600 | | PriceSmart, Inc. | | 107,646 |
| 3,750 | | Spartan Stores, Inc. | | 48,338 |
| 17,028 | | Timberland Co. (The), Class A (a) | | 232,262 |
| 13,700 | | Tupperware Brands Corp. | | 466,759 |
| 17,350 | | Volcom, Inc. (a) | | 210,456 |
| 70,178 | | Wet Seal, Inc. (The), Class A (a) | | 231,587 |
| | | | |
| | | | 9,617,719 |
| | | | |
Energy (1.9%) | | |
| 3,300 | | CH Energy Group, Inc. | | 163,317 |
| 13,700 | | GT Solar International, Inc. (a) | | 84,940 |
| 17,347 | | Headwaters, Inc. (a) | | 53,255 |
| 11,852 | | Holly Corp. | | 252,092 |
| 1,000 | | Lufkin Industries, Inc. | | 45,400 |
| 68,850 | | Rosetta Resources, Inc. (a) | | 713,974 |
| 4,136 | | Southwest Gas Corp. | | 100,174 |
| 4,918 | | St. Mary Land & Exploration Co. | | 117,393 |
| 38,300 | | Stone Energy Corp. (a) | | 415,938 |
| 19,421 | | Swift Energy Co. (a) | | 382,594 |
| 23,454 | | Union Drilling, Inc. (a) | | 167,696 |
| | | | |
| | | | 2,496,773 |
| | | | |
See notes to financial statements.
49
PACIFIC CAPITAL FUNDS
Small Cap Fund
Schedule of Portfolio Investments, continued
July 31, 2009
| | | | |
| Shares | | Security
Description | | Value ($) |
| Common Stocks, continued | | |
Financials (15.6%) | | |
| 9,562 | | Allied World Assurance Co. Holdings Ltd. | | 415,565 |
| 25,447 | | American Equity Investment Life Holding Co. | | 184,236 |
| 10,033 | | American Physicians Capital, Inc. | | 446,368 |
| 41,297 | | Amerisafe, Inc. (a) | | 686,769 |
| 19,072 | | AmTrust Financial Services, Inc. | | 233,060 |
| 8,700 | | Aspen Insurance Holdings Ltd. | | 216,369 |
| 43,300 | | Assured Guaranty Ltd. | | 604,901 |
| 1,400 | | BancFirst Corp. | | 50,162 |
| 6,800 | | Bank of the Ozarks, Inc. | | 171,904 |
| 17,350 | | Cash America International, Inc. | | 463,765 |
| 22,933 | | Community Bank System, Inc. | | 415,775 |
| 4,100 | | Community Trust Bancorp, Inc. | | 111,315 |
| 12,000 | | Crawford & Co., Class B (a) | | 58,200 |
| 55,281 | | CVB Financial Corp. | | 416,819 |
| 10,600 | | Danvers Bancorp, Inc. | | 133,030 |
| 24,800 | | Delphi Financial Group, Inc. | | 590,984 |
| 53,629 | | Deluxe Corp. | | 839,294 |
| 36,960 | | Dime Community Bancshares | | 444,998 |
| 3,050 | | Employers Holdings, Inc. | | 42,456 |
| 10,300 | | Evercore Partners, Inc., Class A | | 202,601 |
| 57,629 | | EZCORP, Inc., Class A (a) | | 729,007 |
| 42,000 | | F.N.B. Corp. | | 325,920 |
| 6,800 | | Fifth Street Finance Corp. | | 70,380 |
| 22,150 | | First BanCorp. | | 68,665 |
| 17,500 | | First Cash Financial Services, Inc. (a) | | 329,000 |
| 27,152 | | First Commonwealth Financial Corp. | | 181,104 |
| 5,950 | | First Financial Bankshares, Inc. | | 313,386 |
| 40,400 | | First Midwest Bancorp, Inc. | | 337,744 |
| 15,603 | | First Niagara Financial Group, Inc. | | 205,179 |
| 28,177 | | FirstMerit Corp. | | 526,346 |
| 15,600 | | Flushing Financial Corp. | | 165,516 |
| 4,283 | | FPIC Insurance Group, Inc. (a) | | 147,121 |
| 26,800 | | GFI Group, Inc. | | 172,860 |
| 6,791 | | Glacier Bancorp, Inc. | | 105,736 |
| 3,133 | | Greenhill & Co., Inc. | | 235,978 |
| 7,179 | | Hancock Holding Co. | | 289,960 |
| 7,500 | | Hercules Technology Growth Capital, Inc. | | 73,425 |
| 9,200 | | Horace Mann Educators Corp. | | 104,420 |
| 4,100 | | Infinity Property & Casualty Corp. | | 170,314 |
| 7,500 | | International Bancshares Corp. | | 98,850 |
| 13,000 | | Investment Technology Group, Inc. (a) | | 290,550 |
| 40,268 | | Knight Capital Group, Inc. (a) | | 747,777 |
| 7,100 | | Life Partners Holdings, Inc. | | 153,218 |
| 7,400 | | Meadowbrook Insurance Group, Inc. | | 58,534 |
| 10,100 | | MF Global Ltd. (a) | | 64,438 |
| 35,700 | | National Financial Partners Corp. | | 267,750 |
| 14,091 | | National Penn Bancshares, Inc. | | 70,173 |
| 6,850 | | Nelnet, Inc., Class A (a) | | 97,887 |
| 14,360 | | Ocwen Financial Corp. (a) | | 204,630 |
| 28,883 | | Old National Bancorp | | 326,378 |
| 39,700 | | optionsXpress Holdings, Inc. | | 717,379 |
| 6,800 | | Oriental Financial Group, Inc. | | 95,948 |
| 8,595 | | Penson Worldwide, Inc. (a) | | 100,304 |
| | | | |
| Shares | | Security
Description | | Value ($) |
| Common Stocks, continued | | |
Financials, continued | | |
| 16,250 | | PHH Corp. (a) | | 297,863 |
| 4,250 | | Piper Jaffray Cos. (a) | | 194,905 |
| 20,160 | | Platinum Underwriters Holdings Ltd. | | 680,400 |
| 2,507 | | ProAssurance Corp. (a) | | 127,305 |
| 7,800 | | Prosperity Bancshares, Inc. | | 261,378 |
| 21,500 | | Protective Life Corp. | | 321,425 |
| 12,500 | | Republic Bancorp, Inc., Class A | | 301,375 |
| 14,864 | | S&T Bancorp, Inc. | | 203,785 |
| 8,367 | | Safety Insurance Group, Inc. | | 269,919 |
| 13,300 | | SeaBright Insurance Holdings, Inc. (a) | | 129,276 |
| 17,778 | | Selective Insurance Group, Inc. | | 265,603 |
| 3,980 | | Signature Bank (a) | | 117,330 |
| 11,000 | | StanCorp Financial Group, Inc. | | 378,620 |
| 9,743 | | Sterling Bancorp | | 78,626 |
| 16,133 | | Susquehanna Bancshares, Inc. | | 84,860 |
| 9,053 | | SVB Financial Group (a) | | 319,118 |
| 24,929 | | SWS Group, Inc. | | 343,023 |
| 8,300 | | Tower Group, Inc. | | 207,251 |
| 4,450 | | TriCo Bancshares | | 74,004 |
| 11,005 | | UMB Financial Corp. | | 459,129 |
| 7,750 | | Validus Holdings Ltd. | | 175,925 |
| 9,800 | | Washington Federal, Inc. | | 136,514 |
| 11,032 | | Western Alliance Bancorp (a) | | 76,452 |
| 27,500 | | Wilshire Bancorp, Inc. | | 202,400 |
| 22,922 | | World Acceptance Corp. (a) | | 543,710 |
| | | | |
| | | | 20,824,644 |
| | | | |
Health Care (13.6%) | | |
| 8,200 | | Albany Molecular Research, Inc. (a) | | 78,146 |
| 45,700 | | Alkermes, Inc. (a) | | 471,624 |
| 2,100 | | Amedisys, Inc. (a) | | 93,891 |
| 20,900 | | American Medical Systems Holdings, Inc. (a) | | 319,561 |
| 30,419 | | American Oriental Bioengineering, Inc. (a) | | 184,948 |
| 8,914 | | Amerigroup Corp. (a) | | 219,998 |
| 18,300 | | AMN Healthcare Services, Inc. (a) | | 133,224 |
| 42,300 | | AngioDynamics, Inc. (a) | | 527,904 |
| 38,915 | | Arena Pharmaceuticals, Inc. (a) | | 198,467 |
| 36,300 | | ArQule, Inc. (a) | | 222,156 |
| 3,900 | | Beckman Coulter, Inc. | | 245,661 |
| 14,500 | | Bruker Corp. (a) | | 145,870 |
| 38,843 | | Celera Corp. (a) | | 233,058 |
| 16,981 | | Centene Corp. (a) | | 327,903 |
| 23,900 | | Cepheid (a) | | 252,623 |
| 4,600 | | Community Health Systems, Inc. (a) | | 130,272 |
| 16,700 | | CorVel Corp. (a) | | 407,814 |
| 17,450 | | Cross Country Healthcare, Inc. (a) | | 145,708 |
| 73,400 | | Cubist Pharmaceuticals, Inc. (a) | | 1,458,458 |
| 16,000 | | Cyberonics, Inc. (a) | | 265,760 |
| 10,400 | | Cypress Bioscience, Inc. (a) | | 91,936 |
| 51,630 | | Cytokinetics, Inc. (a) | | 152,825 |
| 4,600 | | Gentiva Health Services, Inc. (a) | | 97,888 |
| 8,600 | | Hanger Orthopedic Group, Inc. (a) | | 117,992 |
| 13,600 | | HealthSouth Corp. (a) | | 195,840 |
| 73,788 | | Healthspring, Inc. (a) | | 931,942 |
| 12,800 | | Herbalife Ltd. | | 440,448 |
See notes to financial statements.
50
PACIFIC CAPITAL FUNDS
Small Cap Fund
Schedule of Portfolio Investments, continued
July 31, 2009
| | | | |
| Shares | | Security
Description | | Value ($) |
| Common Stocks, continued | | |
Health Care, continued | | |
| 15,238 | | Invacare Corp. | | 310,855 |
| 29,400 | | Kendle International, Inc. (a) | | 343,392 |
| 16,600 | | LHC Group, Inc. (a) | | 487,210 |
| 11,506 | | LifePoint Hospitals, Inc. (a) | | 318,256 |
| 7,100 | | Martek Biosciences Corp. | | 165,146 |
| 13,900 | | Masimo Corp. (a) | | 339,855 |
| 9,293 | | MedCath Corp. (a) | | 112,074 |
| 35,900 | | Medicines Co. (The) (a) | | 291,149 |
| 8,300 | | Merit Medical Systems, Inc. (a) | | 151,807 |
| 13,450 | | Molina Healthcare, Inc. (a) | | 303,297 |
| 10,100 | | Myriad Genetics, Inc. (a) | | 276,942 |
| 2,475 | | Myriad Pharmaceuticals, Inc. (a) | | 12,053 |
| 13,600 | | Onyx Pharmaceuticals, Inc. (a) | | 488,512 |
| 36,755 | | Orasure Technologies, Inc. (a) | | 104,384 |
| 13,800 | | Orthofix International N.V. (a) | | 384,468 |
| 9,600 | | OSI Pharmaceuticals, Inc. (a) | | 324,384 |
| 29,200 | | PDL BioPharma, Inc. | | 240,316 |
| 2,373 | | Perrigo Co. | | 64,403 |
| 14,600 | | Pharmasset, Inc. (a) | | 224,694 |
| 10,100 | | PharMerica Corp. (a) | | 211,696 |
| 18,200 | | Questcor Pharmaceuticals, Inc. (a) | | 106,652 |
| 28,462 | | Regeneron Pharmaceuticals, Inc. (a) | | 610,225 |
| 4,200 | | RehabCare Group, Inc. (a) | | 101,052 |
| 24,789 | | Rigel Pharmaceuticals, Inc. (a) | | 206,492 |
| 60,500 | | Salix Pharmaceuticals Ltd. (a) | | 736,890 |
| 34,600 | | Seattle Genetics, Inc. (a) | | 416,930 |
| 19,500 | | Sepracor, Inc. (a) | | 338,325 |
| 63,606 | | Symmetry Medical, Inc. (a) | | 544,467 |
| 6,500 | | Triple-S Management Corp., Class B (a) | | 111,085 |
| 9,056 | | U.S. Physical Therapy, Inc. (a) | | 148,066 |
| 20,500 | | Valeant Pharmaceuticals International (a) | | 528,900 |
| 15,685 | | ViroPharma, Inc. (a) | | 115,598 |
| 6,800 | | Volcano Corp. (a) | | 103,292 |
| 6,600 | | Watson Pharmaceuticals, Inc. (a) | | 229,218 |
| 10,586 | | XenoPort, Inc. (a) | | 215,002 |
| 17,300 | | Zoll Medical Corp. (a) | | 318,839 |
| | | | |
| | | | 18,077,843 |
| | | | |
Industrials (10.8%) | | |
| 5,401 | | A.O. Smith Corp. | | 210,855 |
| 13,155 | | Acuity Brands, Inc. | | 388,204 |
| 3,100 | | Agco Corp. (a) | | 97,526 |
| 6,300 | | Ameron International Corp. | | 469,476 |
| 4,631 | | AZZ, Inc. (a) | | 179,451 |
| 7,200 | | Brink’s Co. (The) | | 195,480 |
| 29,318 | | Ceradyne, Inc. (a) | | 529,190 |
| 39,650 | | Chart Industries, Inc. (a) | | 763,659 |
| 12,748 | | Checkpoint Systems, Inc. (a) | | 220,923 |
| 41,717 | | Complete Production Services, Inc. (a) | | 344,582 |
| 8,466 | | Ducommun, Inc. | | 146,293 |
| 26,700 | | Dycom Industries, Inc. (a) | | 339,891 |
| 6,400 | | DynCorp International, Inc., Class A (a) | | 129,984 |
| 49,878 | | EMCOR Group, Inc. (a) | | 1,203,057 |
| | | | |
| Shares | | Security
Description | | Value ($) |
| Common Stocks, continued | | |
Industrials, continued | | |
| 15,302 | | Encore Wire Corp. | | 331,900 |
| 3,600 | | EnerSys (a) | | 71,244 |
| 14,600 | | EnPro Industries, Inc. (a) | | 260,172 |
| 12,800 | | Esterline Technologies Corp. (a) | | 363,904 |
| 57,900 | | GrafTech International Ltd. (a) | | 794,967 |
| 6,324 | | Granite Construction, Inc. | | 214,257 |
| 5,700 | | Harbin Electric, Inc. (a) | | 90,174 |
| 11,310 | | HEICO Corp. | | 417,678 |
| 18,263 | | Hub Group, Inc. (a) | | 392,472 |
| 10,209 | | Koppers Holdings, Inc. | | 284,933 |
| 6,772 | | Layne Christensen Co. (a) | | 160,700 |
| 3,200 | | Lindsay Corp. | | 113,504 |
| 8,700 | | Molex, Inc. | | 154,512 |
| 9,000 | | Moog, Inc., Class A (a) | | 242,640 |
| 11,453 | | Mueller Industries, Inc. | | 272,123 |
| 19,471 | | Olin Corp. | | 268,505 |
| 42,300 | | ON Semiconductor Corp. (a) | | 308,790 |
| 7,600 | | Polypore International, Inc. (a) | | 93,860 |
| 11,000 | | Powell Industries, Inc. (a) | | 392,150 |
| 10,700 | | Resources Connection, Inc. (a) | | 161,570 |
| 18,290 | | Robbins & Myers, Inc. | | 382,810 |
| 7,421 | | Rock-Tenn Co. | | 333,648 |
| 7,750 | | Schnitzer Steel Industries, Inc. | | 416,718 |
| 36,900 | | Smith & Wesson Holding Corp. (a) | | 223,614 |
| 9,340 | | Teledyne Technologies, Inc. (a) | | 305,698 |
| 9,900 | | Thomas & Betts Corp. (a) | | 263,736 |
| 2,950 | | Toro Co. (The) | | 102,247 |
| 11,800 | | TransDigm Group, Inc. (a) | | 451,822 |
| 4,600 | | Triumph Group, Inc. | | 183,724 |
| 4,150 | | Tutor Perini Corp. (a) | | 76,568 |
| 13,800 | | Ultralife Corp. (a) | | 88,596 |
| 5,676 | | Varian Semiconductor Equipment Associates, Inc. (a) | | 181,859 |
| 8,000 | | Varian, Inc. (a) | | 406,080 |
| 15,700 | | Woodward Governor Co. | | 308,348 |
| | | | |
| | | | 14,334,094 |
| | | | |
Information Technology (18.4%) | | |
| 6,200 | | Acxiom Corp. | | 59,830 |
| 13,147 | | American Reprographics Co. (a) | | 113,722 |
| 15,700 | | ANADIGICS, Inc. (a) | | 64,998 |
| 58,700 | | Arris Group, Inc. (a) | | 714,966 |
| 63,100 | | Art Technology Group, Inc. (a) | | 239,149 |
| 32,400 | | Aruba Networks, Inc. (a) | | 287,712 |
| 20,400 | | AsiaInfo Holdings, Inc. (a) | | 393,108 |
| 13,400 | | Atheros Communications, Inc. (a) | | 335,000 |
| 47,376 | | Avocent Corp. (a) | | 734,802 |
| 45,862 | | Benchmark Electronics, Inc. (a) | | 724,620 |
| 9,500 | | Black Box Corp. | | 260,965 |
| 2,100 | | CACI International, Inc., Class A (a) | | 97,020 |
| 27,800 | | Cirrus Logic, Inc. (a) | | 149,564 |
| 18,400 | | CommVault Systems, Inc. (a) | | 320,344 |
| 33,600 | | Compuware Corp. (a) | | 246,288 |
| 27,197 | | CSG Systems International, Inc. (a) | | 453,646 |
| 28,100 | | Cypress Semiconductor Corp. (a) | | 298,422 |
| 24,300 | | EarthLink, Inc. (a) | | 205,335 |
| 14,600 | | Eclipsys Corp. (a) | | 265,720 |
See notes to financial statements.
51
PACIFIC CAPITAL FUNDS
Small Cap Fund
Schedule of Portfolio Investments, continued
July 31, 2009
| | | | |
| Shares | | Security
Description | | Value ($) |
| Common Stocks, continued | | |
Information Technology, continued | | |
| 8,040 | | Harmonic, Inc. (a) | | 55,717 |
| 22,600 | | i2 Technologies, Inc. (a) | | 304,196 |
| 35,400 | | Informatica Corp. (a) | | 651,006 |
| 19,750 | | InfoSpace, Inc. (a) | | 144,570 |
| 21,369 | | J2 Global Communications, Inc. (a) | | 512,642 |
| 12,803 | | JDA Software Group, Inc. (a) | | 263,870 |
| 19,969 | | Methode Electronics, Inc. | | 151,365 |
| 6,434 | | MicroStrategy, Inc., Class A (a) | | 392,796 |
| 20,000 | | Multi-Fineline Electronix, Inc. (a) | | 455,800 |
| 7,069 | | Net 1 UEPS Technologies, Inc. (a) | | 119,183 |
| 42,000 | | NetScout Systems, Inc. (a) | | 417,900 |
| 43,500 | | Novatel Wireless, Inc. (a) | | 412,380 |
| 14,000 | | Oplink Communications, Inc. (a) | | 178,080 |
| 8,553 | | OSI Systems, Inc. (a) | | 169,435 |
| 14,100 | | Overstock.com, Inc. (a) | | 185,697 |
| 11,300 | | Palm, Inc. (a) | | 177,749 |
| 31,200 | | Parametric Technology Corp. (a) | | 402,792 |
| 15,288 | | Perot Systems Corp., Class A (a) | | 244,302 |
| 16,000 | | Photronics, Inc. (a) | | 81,760 |
| 19,521 | | Plantronics, Inc. | | 462,062 |
| 10,218 | | Plexus Corp. (a) | | 262,500 |
| 36,600 | | PMC-Sierra, Inc. (a) | | 334,890 |
| 13,200 | | Polycom, Inc. (a) | | 313,500 |
| 61,071 | | QLogic Corp. (a) | | 796,977 |
| 15,100 | | Red Hat, Inc. (a) | | 344,733 |
| 96,500 | | RF Micro Devices, Inc. (a) | | 501,800 |
| 7,700 | | RightNow Technologies, Inc. (a) | | 92,708 |
| 26,100 | | Riverbed Technology, Inc. (a) | | 522,261 |
| 65,400 | | Sapient Corp. (a) | | 436,872 |
| 15,338 | | Sigma Designs, Inc. (a) | | 248,015 |
| 59,443 | | Skyworks Solutions, Inc. (a) | | 718,071 |
| 4,876 | | Sohu.com, Inc. (a) | | 298,265 |
| 13,800 | | Solera Holdings, Inc. (a) | | 371,634 |
| 13,998 | | Sonicwall, Inc. (a) | | 106,245 |
| 3,600 | | SRA International, Inc., Class A (a) | | 70,920 |
| 23,600 | | Starent Networks Corp. (a) | | 565,928 |
| 19,700 | | Sykes Enterprises, Inc. (a) | | 392,030 |
| 14,500 | | Synaptics, Inc. (a) | | 347,565 |
| 2,500 | | Syntel, Inc. | | 98,950 |
| 20,000 | | TeleCommunication Systems, Inc. (a) | | 165,600 |
| 7,500 | | Tessera Technologies, Inc. (a) | | 210,675 |
| 184,129 | | TIBCO Software, Inc. (a) | | 1,607,446 |
| 20,400 | | TiVo, Inc. (a) | | 209,100 |
| 47,700 | | TriQuint Semiconductor, Inc. (a) | | 342,486 |
| 10,700 | | Ultratech, Inc. (a) | | 127,437 |
| 95,618 | | United Online, Inc. | | 877,773 |
| 28,200 | | Volterra Semiconductor Corp. (a) | | 467,838 |
| 45,900 | | Wright Express Corp. (a) | | 1,298,052 |
| 54,786 | | Zoran Corp. (a) | | 631,135 |
| | | | |
| | | | 24,509,919 |
| | | | |
Materials (2.5%) | | |
| 26,003 | | A. Schulman, Inc. | | 554,124 |
| 5,183 | | Belden, Inc. | | 90,910 |
| 4,500 | | Calgon Carbon Corp. (a) | | 57,015 |
| 14,200 | | Cliffs Natural Resources, Inc. | | 388,938 |
| 14,626 | | Columbus McKinnon Corp. (a) | | 211,638 |
| | | | |
| Shares | | Security
Description | | Value ($) |
| Common Stocks, continued | | |
Materials, continued | | |
| 8,200 | | CVR Energy, Inc. (a) | | 70,028 |
| 7,500 | | Dawson Geophysical Co. (a) | | 228,075 |
| 7,800 | | Dynamic Materials Corp. | | 127,686 |
| 11,453 | | Gibraltar Industries, Inc. | | 88,990 |
| 3,791 | | Greif, Inc., Class A | | 194,592 |
| 7,050 | | Haynes International, Inc. (a) | | 162,362 |
| 13,600 | | Horsehead Holding Corp. (a) | | 145,384 |
| 22,800 | | Innophos Holdings, Inc. | | 428,184 |
| 2,550 | | NewMarket Corp. | | 192,907 |
| 21,000 | | Omnova Solutions, Inc. (a) | | 117,810 |
| 4,100 | | Royal Gold, Inc. | | 168,428 |
| 9,100 | | RTI International Metals, Inc. (a) | | 161,616 |
| | | | |
| | | | 3,388,687 |
| | | | |
Oil & Gas (1.7%) | | |
| 15,700 | | Arena Resources, Inc. (a) | | 512,291 |
| 60,750 | | ATP Oil & Gas Corp. (a) | | 470,812 |
| 31,100 | | Cal Dive International, Inc. (a) | | 277,723 |
| 8,400 | | Delek US Holdings, Inc. | | 71,568 |
| 90,300 | | McMoRan Exploration Co. (a) | | 574,308 |
| 59,300 | | VAALCO Energy, Inc. | | 262,699 |
| 12,500 | | Western Refining, Inc. (a) | | 81,375 |
| | | | |
| | | | 2,250,776 |
| | | | |
Real Estate Investment Trusts (4.4%) | | |
| 4,600 | | Acadia Realty Trust | | 63,020 |
| 18,000 | | American Capital Agency Corp. | | 410,040 |
| 25,000 | | Anworth Mortgage Asset Corp. | | 188,500 |
| 19,471 | | BioMed Realty Trust, Inc. | | 227,421 |
| 11,650 | | CBL & Associates Properties, Inc. | | 69,201 |
| 31,372 | | Cedar Shopping Centers, Inc. | | 166,585 |
| 27,450 | | Colonial Properties Trust | | 219,051 |
| 9,750 | | Corporate Office Property Trust | | 330,622 |
| 4,750 | | Douglas Emmett, Inc. | | 48,260 |
| 7,189 | | Entertainment Properties Trust | | 196,332 |
| 4,250 | | Equity Lifestyle Properties, Inc. | | 177,098 |
| 26,750 | | First Potomac Realty Trust | | 250,648 |
| 3,300 | | Highwoods Properties, Inc. | | 84,513 |
| 30,400 | | Hospitality Properties Trust | | 480,016 |
| 33,400 | | LaSalle Hotel Properties | | 497,994 |
| 20,741 | | Lexington Realty Trust | | 88,771 |
| 43,800 | | Medical Properties Trust, Inc. | | 306,600 |
| 17,700 | | MFA Financial, Inc. | | 130,980 |
| 22,459 | | National Retail Properties, Inc. | | 442,667 |
| 19,919 | | Omega Healthcare Investors, Inc. | | 332,846 |
| 3,317 | | Realty Income Corp. | | 78,215 |
| 20,300 | | Redwood Trust, Inc. | | 329,875 |
| 4,250 | | Saul Centers, Inc. | | 143,948 |
| 28,459 | | Senior Housing Properties Trust | | 531,045 |
| 7,400 | | Urstadt Biddle Properties, Inc., Class A | | 113,886 |
| | | | |
| | | | 5,908,134 |
| | | | |
Services (3.0%) | | |
| 29,700 | | Arbitron, Inc. | | 483,516 |
| 12,312 | | ATC Technology Corp. (a) | | 257,567 |
| 3,900 | | Cornell Companies, Inc. (a) | | 66,807 |
| 32,747 | | Heartland Payment Systems, Inc. | | 349,083 |
See notes to financial statements.
52
PACIFIC CAPITAL FUNDS
Small Cap Fund
Schedule of Portfolio Investments, continued
July 31, 2009
| | | | |
| Shares | | Security
Description | | Value ($) |
| Common Stocks, continued | | |
Services, continued | | |
| 14,100 | | Houston Wire & Cable Co. | | 151,575 |
| 10,100 | | MercadoLibre, Inc. (a) | | 291,082 |
| 6,200 | | Navigant Consulting, Inc. (a) | | 73,780 |
| 28,700 | | NutriSystem, Inc. | | 408,401 |
| 33,200 | | Team, Inc. (a) | | 483,392 |
| 12,200 | | TNS, Inc. (a) | | 279,746 |
| 2,700 | | VistaPrint Ltd. (a) | | 111,375 |
| 16,122 | | Watson Wyatt Worldwide, Inc. | | 601,996 |
| 9,400 | | World Fuel Services Corp. | | 412,284 |
| | | | |
| | | | 3,970,604 |
| | | | |
Telecommunications (1.8%) | | |
| 7,400 | | Applied Signal Technology, Inc. | | 185,000 |
| 9,264 | | Atlantic Tele-Network, Inc. | | 388,440 |
| 70,116 | | Cincinnati Bell, Inc. (a) | | 219,463 |
| 3,200 | | EchoStar Corp., Class A (a) | | 47,168 |
| 51,300 | | Haris Stratex Networks, Inc., Class A (a) | | 356,022 |
| 8,800 | | InterDigital, Inc. (a) | | 260,568 |
| 6,059 | | NTELOS Holdings Corp. | | 93,854 |
| 22,000 | | Premiere Global Services, Inc. (a) | | 210,980 |
| 22,700 | | Syniverse Holdings, Inc. (a) | | 397,931 |
| 14,050 | | USA Mobility, Inc. | | 189,675 |
| | | | |
| | | | 2,349,101 |
| | | | |
Transportation (2.1%) | | |
| 6,400 | | Allegiant Travel Co. (a) | | 277,184 |
| 6,000 | | American Commercial Lines, Inc. (a) | | 93,720 |
| 14,100 | | American Railcar Industries, Inc. | | 116,889 |
| 86,741 | | Force Protection, Inc. (a) | | 448,451 |
| 47,600 | | Hawaiian Holdings, Inc. (a) | | 304,164 |
| 2,500 | | Hornbeck Offshore Services, Inc. (a) | | 54,450 |
| 6,400 | | Knight Transportation, Inc. | | 116,096 |
| | | | | |
| Shares | | Security
Description | | Value ($) | |
| Common Stocks, continued | | | |
Transportation, continued | | | |
| 9,400 | | Marten Transport Ltd. (a) | | 165,816 | |
| 6,100 | | Old Dominion Freight Line, Inc. (a) | | 217,343 | |
| 33,100 | | Republic Airways Holdings, Inc. (a) | | 169,472 | |
| 7,500 | | Saia, Inc. (a) | | 135,450 | |
| 49,200 | | TBS International Ltd. (a) | | 397,044 | |
| 19,429 | | Werner Enterprises, Inc. | | 350,888 | |
| | | | | |
| | | | 2,846,967 | |
| | | | | |
Utilities (2.4%) | | | |
| 14,853 | | Avista Corp. | | 275,077 | |
| 2,500 | | Black Hills Corp. | | 65,025 | |
| 5,700 | | Central Vermont Public Service Corp. | | 105,108 | |
| 7,679 | | El Paso Electric Co. (a) | | 116,030 | |
| 8,067 | | Laclede Group, Inc. (The) | | 270,809 | |
| 9,096 | | New Jersey Resources Corp. | | 351,106 | |
| 13,440 | | Nicor, Inc. | | 489,754 | |
| 3,821 | | Northwest Natural Gas Co. | | 170,569 | |
| 19,900 | | Portland General Electric Co. | | 378,697 | |
| 16,100 | | UniSource Energy Corp. | | 444,360 | |
| 17,767 | | WGL Holdings, Inc. | | 588,443 | |
| | | | | |
| | | | 3,254,978 | |
| | | | | |
Total Common Stocks (Cost $130,596,592) | | 132,305,177 | |
| | | | | |
| Cash Equivalents (0.8%) | | | |
| 1,052,444 | | Bank of New York Cash Reserve Fund, 0.05% (b) | | 1,052,444 | |
| | | | | |
Total Cash Equivalents (Cost $1,052,444) | | 1,052,444 | |
| | | | | |
Total Investments (Cost $131,649,036)—100.1% | | 133,357,621 | |
Liabilities in excess of other assets—(0.1)% | | (92,201 | ) |
| | | | | |
Net Assets—100.0% | | 133,265,420 | |
| | | | | |
| (a) | Non-income producing security. |
| (b) | Rate periodically changes. Rate disclosed is the daily yield on July 31, 2009. |
See notes to financial statements.
53
PACIFIC CAPITAL FUNDS
Mid-Cap Fund
Schedule of Portfolio Investments
July 31, 2009
| | | | |
| Shares | | Security
Description | | Value ($) |
| Common Stocks (99.5%) | | |
Consumer Discretionary (17.4%) | | |
| 2,300 | | Advance Auto Parts, Inc. | | 106,329 |
| 3,100 | | AECOM Technology Corp. (a) | | 100,440 |
| 4,550 | | Aeropostale, Inc. (a) | | 165,620 |
| 6,200 | | AutoNation, Inc. (a) | | 128,216 |
| 2,400 | | Big Lots, Inc. (a) | | 55,296 |
| 1,575 | | Blyth, Inc. | | 66,827 |
| 5,700 | | Bob Evans Farms, Inc. | | 165,414 |
| 7,400 | | BorgWarner, Inc. | | 245,606 |
| 5,500 | | Brinker International, Inc. | | 91,520 |
| 2,500 | | Career Education Corp. (a) | | 57,300 |
| 6,600 | | CarMax, Inc. (a) | | 106,458 |
| 1,900 | | Casey’s General Stores, Inc. | | 52,117 |
| 4,900 | | Chico’s FAS, Inc. (a) | | 56,203 |
| 6,100 | | Corinthian Colleges, Inc. (a) | | 94,184 |
| 2,400 | | DeVry, Inc. | | 119,376 |
| 5,700 | | Dollar Tree, Inc. (a) | | 262,884 |
| 800 | | FTI Consulting, Inc. (a) | | 43,544 |
| 3,000 | | Guess?, Inc. | | 87,210 |
| 4,900 | | Harte-Hanks, Inc. | | 53,018 |
| 5,500 | | Hewitt Associates, Inc., Class A (a) | | 164,615 |
| 1,400 | | Hubbell, Inc., Class B | | 52,248 |
| 1,100 | | ITT Educational Services, Inc. (a) | | 107,085 |
| 9,600 | | Leggett & Platt, Inc. | | 166,560 |
| 6,300 | | M.D.C. Holdings, Inc. | | 222,012 |
| 2,100 | | Manpower, Inc. | | 100,695 |
| 4,600 | | Marvel Entertainment, Inc. (a) | | 181,976 |
| 6,000 | | MeadWestvaco Corp. | | 116,940 |
| 3,700 | | Netflix, Inc. (a) | | 162,578 |
| 290 | | NVR, Inc. (a) | | 174,334 |
| 1,300 | | Priceline.com, Inc. (a) | | 168,506 |
| 8,400 | | R.R. Donnelley & Sons Co. | | 116,760 |
| 2,300 | | Rent-A-Center, Inc. (a) | | 47,748 |
| 6,100 | | Rollins, Inc. | | 111,813 |
| 10,300 | | Ross Stores, Inc. | | 454,127 |
| 1,900 | | Scotts Miracle-Gro Co. (The) | | 74,195 |
| 1,500 | | Silgan Holdings, Inc. | | 75,390 |
| 750 | | Strayer Education, Inc. | | 159,285 |
| 11,800 | | Tech Data Corp. (a) | | 412,174 |
| 5,500 | | Temple-Inland, Inc. | | 86,130 |
| 5,300 | | Warnaco Group, Inc. (The) (a) | | 192,549 |
| 1,900 | | Whirlpool Corp. | | 108,471 |
| 5,900 | | Wyndham Worldwide Corp. | | 82,305 |
| | | | |
| | 5,596,058 |
| | | | |
Consumer Staples (5.9%) | | |
| 7,400 | | BJ’s Wholesale Club, Inc. (a) | | 246,790 |
| 8,400 | | Cheesecake Factory, Inc. (The) (a) | | 162,708 |
| 1,300 | | Chipotle Mexican Grill, Inc., Class A (a) | | 121,979 |
| 2,300 | | Dean Foods Co. (a) | | 48,737 |
| 12,100 | | Foot Locker, Inc. | | 134,068 |
| 3,100 | | Hansen Natural Corp. (a) | | 96,131 |
| 4,600 | | Hormel Foods Corp. | | 165,186 |
| 7,400 | | Lancaster Colony Corp. | | 336,996 |
| 1,500 | | Panera Bread Co., Class A (a) | | 82,440 |
| 2,100 | | PepsiAmericas, Inc. | | 56,238 |
| 1,700 | | Ralcorp Holdings, Inc. (a) | | 107,967 |
| | | | |
| Shares | | Security
Description | | Value ($) |
| Common Stocks, continued | | |
Consumer Staples, continued | | |
| 4,200 | | Smithfield Foods, Inc. (a) | | 56,910 |
| 7,800 | | Timberland Co. (The), Class A (a) | | 106,392 |
| 3,700 | | Tupperware Brands Corp. | | 126,059 |
| 2,400 | | Urban Outfitters, Inc. (a) | | 57,696 |
| | | | |
| | 1,906,297 |
| | | | |
Energy (2.6%) | | |
| 5,700 | | Atmos Energy Corp. | | 154,812 |
| 5,700 | | Cimarex Energy Co. | | 203,946 |
| 2,700 | | ENSCO International, Inc. | | 102,303 |
| 4,400 | | Mariner Energy, Inc. (a) | | 52,756 |
| 1,600 | | Sunoco, Inc. | | 39,504 |
| 3,300 | | Tesoro Corp. | | 43,197 |
| 5,000 | | Tidewater, Inc. | | 225,000 |
| | | | |
| | 821,518 |
| | | | |
Financials (12.0%) | | |
| 3,100 | | Alliance Data Systems Corp. (a) | | 158,100 |
| 6,600 | | American Financial Group, Inc. | | 160,974 |
| 7,200 | | AmeriCredit Corp. (a) | | 112,968 |
| 10,200 | | Apollo Investment Corp. | | 72,624 |
| 2,200 | | Arch Capital Group Ltd. (a) | | 136,818 |
| 5,100 | | Aspen Insurance Holdings Ltd. | | 126,837 |
| 11,200 | | Associated Banc-Corp. | | 121,408 |
| 1,100 | | BOK Financial Corp. | | 46,079 |
| 6,800 | | Broadridge Financial Solutions, Inc. | | 117,436 |
| 1,100 | | Capitol Federal Financial | | 40,513 |
| 1,900 | | Cullen/Frost Bankers, Inc. | | 91,257 |
| 3,500 | | Eaton Vance Corp. | | 100,170 |
| 6,100 | | Fidelity National Financial, Inc., Class A | | 87,535 |
| 8,800 | | First American Corp. | | 260,040 |
| 2,300 | | Global Payments, Inc. | | 97,290 |
| 16,900 | | Jefferies Group, Inc. (a) | | 386,334 |
| 3,900 | | Lender Processing Services, Inc. | | 133,302 |
| 800 | | Odyssey Re Holdings Corp. | | 36,960 |
| 10,300 | | Old Republic International Corp. | | 106,502 |
| 5,100 | | Platinum Underwriters Holdings Ltd. | | 172,125 |
| 7,100 | | Protective Life Corp. | | 106,145 |
| 5,700 | | Raymond James Financial, Inc. | | 116,964 |
| 3,500 | | Reinsurance Group of America, Inc. | | 145,250 |
| 13,400 | | Trustmark Corp. | | 266,660 |
| 1,300 | | UMB Financial Corp. | | 54,236 |
| 20,700 | | Unitrin, Inc. | | 273,033 |
| 3,700 | | Westamerica Bancorp | | 193,362 |
| 4,500 | | Wilmington Trust Corp. | | 51,705 |
| 4,800 | | XL Capital Ltd., Class A | | 67,584 |
| | | | |
| | 3,840,211 |
| | | | |
Health Care (11.5%) | | |
| 8,400 | | Affymetrix, Inc. (a) | | 74,256 |
| 1,500 | | Amerigroup Corp. (a) | | 37,020 |
| 800 | | Beckman Coulter, Inc. | | 50,392 |
| 600 | | Cerner Corp. (a) | | 39,048 |
| 7,600 | | Charles River Laboratories International, Inc. (a) | | 251,332 |
| 3,500 | | Endo Pharmaceuticals Holdings, Inc. (a) | | 73,535 |
See notes to financial statements.
54
PACIFIC CAPITAL FUNDS
Mid-Cap Fund
Schedule of Portfolio Investments, continued
July 31, 2009
| | | | |
| Shares | | Security
Description | | Value ($) |
| Common Stocks, continued | | |
Health Care, continued | | |
| 3,900 | | Gen-Probe, Inc. (a) | | 144,768 |
| 22,700 | | Health Management Associates, Inc., Class A (a) | | 136,881 |
| 21,700 | | Health Net, Inc. (a) | | 293,601 |
| 4,200 | | Henry Schein, Inc. (a) | | 215,796 |
| 1,900 | | Herbalife Ltd. | | 65,379 |
| 11,400 | | Hill-Rom Holdings, Inc. | | 195,396 |
| 10,100 | | Kindred Healthcard, Inc. (a) | | 141,804 |
| 3,113 | | Life Technologies Corp. (a) | | 141,735 |
| 4,200 | | Magellan Health Services, Inc. (a) | | 135,912 |
| 2,900 | | Masimo Corp. (a) | | 70,905 |
| 1,600 | | Myriad Genetics, Inc. (a) | | 43,872 |
| 400 | | Myriad Pharmaceuticals, Inc. (a) | | 1,948 |
| 2,700 | | Omnicare, Inc. | | 64,449 |
| 5,900 | | Owens & Minor, Inc. | | 261,370 |
| 6,000 | | PDL BioPharma, Inc. | | 49,380 |
| 2,700 | | PerkinElmer, Inc. | | 47,601 |
| 2,300 | | Pharmaceutical Product Development, Inc. | | 47,771 |
| 2,400 | | ResMed, Inc. (a) | | 98,400 |
| 3,200 | | Sepracor, Inc. (a) | | 55,520 |
| 10,800 | | STERIS Corp. | | 303,264 |
| 2,000 | | Techne Corp. | | 127,640 |
| 900 | | Universal Health Services, Inc. | | 50,049 |
| 9,000 | | Valeant Pharmaceuticals International (a) | | 232,200 |
| 2,000 | | Vertex Pharmaceuticals, Inc. (a) | | 72,020 |
| 4,000 | | Watson Pharmaceuticals, Inc. (a) | | 138,920 |
| 1,700 | | WellCare Health Plans, Inc. (a) | | 37,842 |
| | | | |
| | | | 3,700,006 |
| | | | |
Industrials (12.1%) | | |
| 3,700 | | Agco Corp. (a) | | 116,402 |
| 1,500 | | Alliant Techsystems, Inc. (a) | | 118,080 |
| 1,800 | | Arrow Electronics, Inc. (a) | | 46,386 |
| 1,700 | | Bemis Co., Inc. | | 44,744 |
| 5,000 | | Brink’s Co. (The) | | 135,750 |
| 3,700 | | Bucyrus International, Inc. | | 109,076 |
| 1,500 | | Clean Harbors, Inc. (a) | | 78,255 |
| 5,500 | | Crane Co. | | 116,710 |
| 5,300 | | Donaldson Co., Inc. | | 201,453 |
| 11,900 | | Dycom Industries, Inc. (a) | | 151,487 |
| 3,200 | | EMCOR Group, Inc. (a) | | 77,184 |
| 3,000 | | Flowserve Corp. | | 242,310 |
| 1,600 | | Granite Construction, Inc. | | 54,208 |
| 4,500 | | Harsco Corp. | | 123,795 |
| 7,000 | | Joy Global, Inc. | | 260,260 |
| 8,100 | | KBR, Inc. | | 171,639 |
| 11,300 | | Lennar Corp., Class A | | 133,792 |
| 3,300 | | Lincoln Electric Holdings, Inc. | | 139,854 |
| 4,400 | | MSC Industrial Direct Co., Inc., Class A | | 172,656 |
| 6,100 | | Nordson Corp. | | 273,890 |
| 3,200 | | Oil States International, Inc. (a) | | 86,784 |
| 5,100 | | Oshkosh Corp. | | 139,995 |
| 3,100 | | Pentair, Inc. | | 84,692 |
| 3,500 | | Shaw Group, Inc. (The) (a) | | 103,040 |
| | | | |
| Shares | | Security
Description | | Value ($) |
| Common Stocks, continued | | |
Industrials, continued | | |
| 1,100 | | SPX Corp. | | 58,102 |
| 1,200 | | Toro Co. (The) | | 41,592 |
| 1,800 | | URS Corp. (a) | | 91,080 |
| 4,400 | | Valspar Corp. (The) | | 111,408 |
| 1,700 | | Varian, Inc. (a) | | 86,292 |
| 6,000 | | Woodward Governor Co. | | 117,840 |
| 16,200 | | Worthington Industries, Inc. | | 214,164 |
| | | | |
| | | | 3,902,920 |
| | | | |
Information Technology (11.1%) | | |
| 43,200 | | 3com Corp. (a) | | 162,864 |
| 8,800 | | Acxiom Corp. | | 84,920 |
| 13,200 | | Amkor Technology, Inc. (a) | | 82,632 |
| 19,700 | | Atmel Corp. (a) | | 82,149 |
| 2,700 | | Avnet, Inc. (a) | | 65,880 |
| 11,100 | | Cadence Design Systems, Inc. (a) | | 65,490 |
| 9,500 | | Convergys Corp. (a) | | 101,745 |
| 600 | | Dun & Bradstreet Corp. (The) | | 43,194 |
| 1,700 | | F5 Networks, Inc. (a) | | 63,104 |
| 2,400 | | FactSet Research Systems, Inc. | | 136,080 |
| 14,900 | | Fairchild Semiconductor International, Inc. (a) | | 131,567 |
| 4,200 | | Gartner, Inc. (a) | | 71,820 |
| 23,200 | | Ingram Micro, Inc. (a) | | 390,224 |
| 9,200 | | Intersil Corp., Class A | | 132,204 |
| 3,500 | | Metavante Technologies, Inc. (a) | | 107,800 |
| 6,600 | | NCR Corp. (a) | | 85,404 |
| 2,700 | | NeuStar, Inc., Class A (a) | | 61,236 |
| 36,100 | | Novell, Inc. (a) | | 165,338 |
| 6,300 | | Novellus Systems, Inc. (a) | | 123,291 |
| 2,700 | | Plantronics, Inc. | | 63,909 |
| 2,600 | | Red Hat, Inc. (a) | | 59,358 |
| 15,300 | | RF Micro Devices, Inc. (a) | | 79,560 |
| 5,500 | | Rovi Corp. (a) | | 143,880 |
| 10,900 | | SAIC, Inc. (a) | | 197,181 |
| 2,400 | | Silicon Laboratories, Inc. (a) | | 102,792 |
| 8,200 | | Sybase, Inc. (a) | | 293,560 |
| 5,700 | | Synopsys, Inc. (a) | | 113,886 |
| 8,100 | | Vishay Intertechnology, Inc. (a) | | 57,591 |
| 10,300 | | Western Digital Corp. (a) | | 311,575 |
| | | | |
| | | | 3,580,234 |
| | | | |
Materials (5.5%) | | |
| 1,100 | | Alpha Natural Resources, Inc. (a) | | 36,641 |
| 8,300 | | Ashland, Inc. | | 275,062 |
| 2,000 | | Carpenter Technology Corp. | | 37,380 |
| 1,300 | | CF Industries Holdings, Inc. | | 102,622 |
| 2,800 | | Cliffs Natural Resources, Inc. | | 76,692 |
| 4,600 | | Commercial Metals Co. | | 76,084 |
| 1,700 | | Compass Minerals International, Inc. | | 90,423 |
| 5,100 | | Cytec Industries, Inc. | | 128,010 |
| 1,300 | | Eastman Chemical Co. | | 64,558 |
| 19,600 | | Federal Signal Corp. | | 173,656 |
| 900 | | FMC Corp. | | 43,776 |
| 14,100 | | Louisiana-Pacific Corp. (a) | | 59,502 |
| 3,100 | | Lubrizol Corp. (The) | | 179,583 |
| 2,200 | | Minerals Technologies, Inc. | | 95,634 |
See notes to financial statements.
55
PACIFIC CAPITAL FUNDS
Mid-Cap Fund
Schedule of Portfolio Investments, continued
July 31, 2009
| | | | |
| Shares | | Security
Description | | Value ($) |
| Common Stocks, continued | | |
Materials, continued | | |
| 4,400 | | Terra Industries, Inc. | | 128,304 |
| 7,400 | | Westlake Chemical Corp. | | 184,926 |
| | | | |
| | | | 1,752,853 |
| | | | |
Oil & Gas (3.2%) | | |
| 2,700 | | Bill Barrett Corp. (a) | | 85,293 |
| 2,100 | | Exterran Holdings, Inc. (a) | | 36,519 |
| 3,100 | | FMC Technologies, Inc. (a) | | 134,850 |
| 12,000 | | Frontier Oil Corp. | | 166,800 |
| 1,200 | | Helmerich & Payne, Inc. | | 41,232 |
| 6,500 | | Newfield Exploration Co. (a) | | 255,645 |
| 800 | | Oceaneering International, Inc. (a) | | 40,736 |
| 3,000 | | Plains Exploration & Production Co. (a) | | 85,950 |
| 8,000 | | Rowan Cos., Inc. | | 170,640 |
| | | | |
| | | | 1,017,665 |
| | | | |
Real Estate Investment Trusts (6.6%) | | |
| 12,100 | | Annaly Capital Management, Inc. | | 203,885 |
| 2,000 | | BRE Properties, Inc. | | 47,460 |
| 1,700 | | Digital Realty Trust, Inc. | | 68,935 |
| 2,800 | | Entertainment Properties Trust | | 76,468 |
| 9,500 | | Equity One, Inc. | | 142,975 |
| 2,600 | | Federal Realty Investment Trust | | 148,330 |
| 12,300 | | First Industrial Realty Trust, Inc. | | 52,152 |
| 16,200 | | Hospitality Properties Trust | | 255,798 |
| 38,600 | | HRPT Properties Trust | | 186,052 |
| 2,900 | | Liberty Property Trust | | 80,533 |
| 2,464 | | Macerich Co. (The) | | 48,467 |
| 6,800 | | Nationwide Health Properties, Inc. | | 197,336 |
| 5,400 | | Omega Healthcare Investors, Inc. | | 90,234 |
| 8,400 | | Potlatch Corp. | | 248,388 |
| 1,600 | | Rayonier, Inc. | | 62,384 |
| 3,400 | | Realty Income Corp. | | 80,172 |
| 5,100 | | SL Green Realty Corp. | | 131,478 |
| 1 | | Walter Investment Management Corp. (a) | | 13 |
| | | | |
| | | | 2,121,060 |
| | | | |
Services (0.7%) | | |
| 2,200 | | Brink’s Home Security Holdings, Inc. (a) | | 65,604 |
| 12,600 | | ValueClick, Inc. (a) | | 144,900 |
| | | | |
| | | | 210,504 |
| | | | |
| | | | | |
| Shares | | Security
Description | | Value ($) | |
| Common Stocks, continued | | | |
Telecommunications (2.0%) | | | |
| 14,100 | | ADC Telecommunications, Inc. (a) | | 102,648 | |
| 4,400 | | CenturyTel, Inc. | | 138,116 | |
| 1,900 | | CommScope, Inc. (a) | | 48,640 | |
| 2,500 | | InterDigital, Inc. (a) | | 74,025 | |
| 7,200 | | NII Holdings, Inc. (a) | | 165,744 | |
| 20,400 | | Tellabs, Inc. (a) | | 118,320 | |
| | | | | |
| | | | 647,493 | |
| | | | | |
Transportation (2.3%) | | | |
| 6,000 | | AirTran Holdings, Inc. (a) | | 43,440 | |
| 4,200 | | Alaska Air Group, Inc. (a) | | 96,852 | |
| 3,900 | | J.B. Hunt Transport Services, Inc. | | 109,005 | |
| 3,500 | | Knight Transportation, Inc. | | 63,490 | |
| 3,700 | | Overseas Shipholding Group, Inc. | | 127,095 | |
| 1,100 | | SEACOR Holdings, Inc. (a) | | 87,428 | |
| 12,500 | | Werner Enterprises, Inc. | | 225,750 | |
| | | | | |
| | | | 753,060 | |
| | | | | |
Utilities (6.6%) | | | |
| 5,000 | | CMS Energy Corp. | | 64,700 | |
| 18,000 | | Hawaiian Electric Industries, Inc. | | 321,660 | |
| 3,700 | | IDACORP, Inc. | | 102,564 | |
| 9,100 | | Mirant Corp. (a) | | 164,346 | |
| 11,200 | | NiSource, Inc. | | 144,256 | |
| 4,800 | | NSTAR | | 154,080 | |
| 2,000 | | OGE Energy Corp. | | 60,200 | |
| 1,800 | | Pinnacle West Capital Corp. | | 57,528 | |
| 24,200 | | PNM Resources, Inc. | | 295,240 | |
| 18,400 | | UGI Corp. | | 486,496 | |
| 10,800 | | Vectren Corp. | | 265,248 | |
| | | | | |
| | | | 2,116,318 | |
| | | | | |
Total Common Stocks (Cost $30,464,923) | | 31,966,197 | |
| | | | | |
| Investment Companies (0.8%) | | | |
| 257,819 | | Victory Federal Money Market Fund, Investor Shares, 0.01% (b) | | 257,819 | |
| | | | | |
Total Investment Companies (Cost $257,819) | | 257,819 | |
| | | | | |
Total Investments (Cost $30,722,742)—100.3% | | 32,224,016 | |
Liabilities in excess of other assets—(0.3)% | | (90,239 | ) |
| | | | | |
Net Assets—100.0% | | 32,133,777 | |
| | | | | |
| (a) | Non-income producing security. |
| (b) | Rate periodically changes. Rate disclosed is the daily yield on July 31, 2009. |
See notes to financial statements.
56
PACIFIC CAPITAL FUNDS
Growth Stock Fund
Schedule of Portfolio Investments
July 31, 2009
| | | | |
| Shares | | Security
Description | | Value ($) |
| Common Stocks (99.5%) | | |
Consumer Discretionary (14.3%) | | |
| 11,300 | | Apollo Group, Inc., Class A (a) | | 780,152 |
| 17,400 | | AutoNation, Inc. (a) | | 359,832 |
| 2,800 | | AutoZone, Inc. (a) | | 429,996 |
| 11,800 | | Avon Products, Inc. | | 382,084 |
| 4,500 | | Big Lots, Inc. (a) | | 103,680 |
| 8,000 | | Brown-Forman Corp. | | 351,600 |
| 2,200 | | Bunge Ltd. | | 153,934 |
| 23,240 | | Colgate-Palmolive Co. | | 1,683,506 |
| 26,200 | | Comcast Corp., Class A | | 389,332 |
| 10,900 | | CVS Corp. | | 364,932 |
| 6,700 | | Ecolab, Inc. | | 278,117 |
| 34,500 | | Interpublic Group of Cos., Inc. (The) (a) | | 179,745 |
| 7,100 | | Leggett & Platt, Inc. | | 123,185 |
| 29,800 | | Macy’s, Inc. | | 414,518 |
| 15,390 | | McDonald’s Corp. | | 847,373 |
| 5,300 | | McGraw-Hill Cos., Inc. (The) | | 166,155 |
| 3,470 | | NIKE, Inc., Class B | | 196,541 |
| 2,800 | | Polo Ralph Lauren Corp. | | 176,540 |
| 7,900 | | Sears Holding Corp. (a) | | 524,086 |
| 3,700 | | Sherwin-Williams Co. (The) | | 213,675 |
| 21,510 | | TJX Cos., Inc. (The) | | 779,307 |
| 4,100 | | Viacom, Inc., Class B (a) | | 94,956 |
| 27,900 | | Wal-Mart Stores, Inc. | | 1,391,652 |
| 4,100 | | Whirlpool Corp. | | 234,069 |
| 15,300 | | Wyndham Worldwide Corp. | | 213,435 |
| | | | |
| | | | 10,832,402 |
| | | | |
Consumer Staples (5.8%) | | |
| 5,500 | | Archer-Daniels-Midland Co. | | 165,660 |
| 8,400 | | Campbell Soup Co. | | 260,652 |
| 44,200 | | Coca-Cola Enterprises, Inc. | | 830,518 |
| 4,200 | | Dr Pepper Snapple Group, Inc. (a) | | 103,362 |
| 2,100 | | Hershey Co. (The) | | 83,895 |
| 10,070 | | Kroger Co. (The) | | 215,296 |
| 7,400 | | Molson Coors Brewing Co., Class B | | 334,554 |
| 15,504 | | PepsiCo, Inc. | | 879,852 |
| 15,445 | | Procter & Gamble Co. (The) | | 857,352 |
| 27,300 | | Sysco Corp. | | 648,648 |
| | | | |
| | | | 4,379,789 |
| | | | |
Energy (17.9%) | | |
| 15,300 | | Chesapeake Energy Corp. | | 328,032 |
| 47,560 | | Chevron Corp. | | 3,303,993 |
| 5,800 | | CONSOL Energy, Inc. | | 206,074 |
| 6,390 | | Devon Energy Corp. | | 371,195 |
| 23,500 | | ENSCO International, Inc. | | 890,415 |
| 93,040 | | Exxon Mobil Corp. | | 6,549,086 |
| 11,100 | | Murphy Oil Corp. | | 646,020 |
| 16,700 | | Southwestern Energy Co. (a) | | 691,881 |
| 5,600 | | Sunoco, Inc. | | 138,264 |
| 6,800 | | Tesoro Corp. | | 89,012 |
| 18,270 | | Valero Energy Corp. | | 328,860 |
| | | | |
| | | | 13,542,832 |
| | | | |
Financials (5.3%) | | |
| 10,200 | | Aflac, Inc. | | 386,172 |
| 2,600 | | American Express Co. | | 73,658 |
| | | | |
| Shares | | Security
Description | | Value ($) |
| Common Stocks, continued | | |
Financials, continued | | |
| 14,800 | | Bank of America Corp. | | 218,892 |
| 17,900 | | Charles Schwab Corp. (The) | | 319,873 |
| 27,400 | | Citigroup, Inc. | | 86,858 |
| 1,150 | | CME Group, Inc. | | 320,655 |
| 8,090 | | Goldman Sachs Group, Inc. (The) | | 1,321,097 |
| 23,600 | | Invesco Ltd. | | 466,100 |
| 3,700 | | Loews Corp. | | 111,074 |
| 2,280 | | MasterCard, Inc., Class A | | 442,388 |
| 4,500 | | NYSE Euronext, Inc. | | 121,275 |
| 9,100 | | Western Union Co. | | 159,068 |
| | | | |
| | | | 4,027,110 |
| | | | |
Health Care (14.9%) | | |
| 11,700 | | Abbott Laboratories | | 526,383 |
| 14,340 | | AmerisourceBergen Corp. | | 282,785 |
| 32,540 | | Amgen, Inc. (a) | | 2,027,567 |
| 10,900 | | C. R. Bard, Inc. | | 801,913 |
| 6,500 | | Coventry Health Care, Inc. (a) | | 149,500 |
| 13,900 | | Express Scripts, Inc. (a) | | 973,556 |
| 10,700 | | Forest Laboratories, Inc. (a) | | 276,381 |
| 16,200 | | Gilead Sciences, Inc. (a) | | 792,666 |
| 21,300 | | Humana, Inc. (a) | | 699,705 |
| 61,360 | | Johnson & Johnson | | 3,736,211 |
| 6,200 | | UnitedHealth Group, Inc. | | 173,972 |
| 10,400 | | UnumProvident Corp. | | 195,208 |
| 9,600 | | Varian Medical Systems, Inc. (a) | | 338,592 |
| 6,700 | | Wyeth | | 311,885 |
| | | | |
| | | | 11,286,324 |
| | | | |
Industrials (5.8%) | | |
| 15,000 | | Cooper Industries Ltd., Class A | | 494,250 |
| 7,400 | | Dover Corp. | | 251,674 |
| 18,100 | | Emerson Electric Co. | | 658,478 |
| 6,900 | | Fluor Corp. | | 364,320 |
| 19,000 | | General Dynamics Corp. | | 1,052,410 |
| 7,690 | | Honeywell International, Inc. | | 266,843 |
| 6,750 | | Lockheed Martin Corp. | | 504,630 |
| 8,600 | | Raytheon Co. | | 403,770 |
| 4,100 | | W.W. Grainger, Inc. | | 368,631 |
| | | | |
| | | | 4,365,006 |
| | | | |
Information Technology (28.0%) | | |
| 4,370 | | Accenture Ltd., Class A | | 153,256 |
| 11,600 | | Adobe Systems, Inc. (a) | | 376,072 |
| 13,200 | | Altera Corp. | | 246,708 |
| 17,500 | | Amazon.com, Inc. (a) | | 1,500,800 |
| 17,860 | | Apple Computer, Inc. (a) | | 2,918,145 |
| 5,600 | | Automatic Data Processing, Inc. | | 208,600 |
| 8,400 | | Avnet, Inc. (a) | | 204,960 |
| 23,500 | | BMC Software, Inc. (a) | | 799,705 |
| 10,000 | | Broadcom Corp., Class A (a) | | 282,300 |
| 25,300 | | CA, Inc. | | 534,842 |
| 128,190 | | Cisco Systems, Inc. (a) | | 2,821,462 |
| 13,100 | | Computer Sciences Corp. (a) | | 631,027 |
| 60,400 | | Dell, Inc. (a) | | 808,152 |
| 2,010 | | Google, Inc., Class A (a) | | 890,531 |
| 10,450 | | Hewlett-Packard Co. | | 452,485 |
See notes to financial statements.
57
PACIFIC CAPITAL FUNDS
Growth Stock Fund
Schedule of Portfolio Investments, continued
July 31, 2009
| | | | |
| Shares | | Security
Description | | Value ($) |
| Common Stocks, continued | | |
Information Technology, continued | | |
| 18,580 | | International Business Machines Corp. | | 2,191,139 |
| 10,200 | | Lexmark International, Inc., Class A (a) | | 147,696 |
| 21,800 | | Marvell Technology Group Ltd. (a) | | 290,812 |
| 4,600 | | McAfee, Inc. (a) | | 205,068 |
| 111,930 | | Microsoft Corp. | | 2,632,594 |
| 69,300 | | Novell, Inc. (a) | | 317,394 |
| 26,100 | | Novellus Systems, Inc. (a) | | 510,777 |
| 17,800 | | QUALCOMM, Inc. | | 822,538 |
| 6,600 | | SanDisk Corp. (a) | | 117,612 |
| 106,130 | | Seagate Technology (a) | | 0 |
| 29,200 | | Symantec Corp. (a) | | 435,956 |
| 28,700 | | Texas Instruments, Inc. | | 690,235 |
| | | | |
| | | | 21,190,866 |
| | | | |
Materials (1.9%) | | |
| 5,200 | | CF Industries Holdings, Inc. | | 410,488 |
| 4,600 | | Freeport-McMoRan Copper & Gold, Inc. Class B | | 277,380 |
| 2,600 | | Sigma-Aldrich Corp. | | 131,950 |
| 53,900 | | Titanium Metals Corp. | | 451,143 |
| 3,700 | | Waters Corp. (a) | | 185,925 |
| | | | |
| | | | 1,456,886 |
| | | | |
Oil & Gas (2.4%) | | |
| 6,700 | | Apache Corp. | | 562,465 |
| 4,100 | | Cameron International Corp. (a) | | 128,043 |
| 33,600 | | Nabors Industries Ltd. (a) | | 571,872 |
| 5,200 | | Noble Corp. | | 176,072 |
| 17,300 | | Rowan Cos., Inc. | | 369,009 |
| | | | |
| | | | 1,807,461 |
| | | | |
Real Estate Investment Trusts (0.2%) | | |
| 7,700 | | Annaly Capital Management, Inc. | | 129,745 |
| | | | |
| | | | | |
| Shares | | Security
Description | | Value ($) | |
| Common Stocks, continued | | | |
Telecommunications (1.1%) | | | |
| 7,900 | | DIRECTV Group, Inc. (The) (a) | | 204,610 | |
| 7,600 | | Harris Corp. | | 237,956 | |
| 48,600 | | Sprint Nextel Corp. (a) | | 194,400 | |
| 38,400 | | Tellabs, Inc. (a) | | 222,720 | |
| | | | | |
| | | | 859,686 | |
| | | | | |
Transportation (1.5%) | | | |
| 8,900 | | C.H. Robinson Worldwide, Inc. | | 485,317 | |
| 23,700 | | Delta Air Lines, Inc. (a) | | 164,241 | |
| 14,400 | | Expeditors International of Washington, Inc. | | 488,592 | |
| | | | | |
| | | | 1,138,150 | |
| | | | | |
Utilities (0.4%) | | | |
| 19,700 | | CMS Energy Corp. | | 254,918 | |
| | | | | |
Total Common Stocks (Cost $76,773,220) | | 75,271,175 | |
| | | | | |
| Investment Companies (1.0%) | | | |
| 770,561 | | Victory Federal Money Market Fund, Investor Shares, 0.01% (b) | | 770,561 | |
| | | | | |
Total Investment Companies (Cost $770,561) | | 770,561 | |
| | | | | |
Total Investments (Cost $77,543,781)—100.5% | | 76,041,736 | |
Liabilities in excess of other assets—(0.5)% | | (361,893 | ) |
| | | | | |
Net Assets—100.0% | | 75,679,843 | |
| | | | | |
| (a) | Non-income producing security. |
| (b) | Rate periodically changes. Rate disclosed is the daily yield on July 31, 2009. |
See notes to financial statements.
58
PACIFIC CAPITAL FUNDS
Growth and Income Fund
Schedule of Portfolio Investments
July 31, 2009
| | | | |
| Shares | | Security
Description | | Value ($) |
| Common Stocks (99.2%) | | |
Consumer Discretionary (15.5%) | | |
| 6,600 | | Apollo Group, Inc., Class A (a) | | 455,664 |
| 10,500 | | Bunge Ltd. | | 734,685 |
| 25,460 | | Colgate-Palmolive Co. | | 1,844,323 |
| 51,400 | | Comcast Corp., Class A | | 763,804 |
| 11,100 | | Family Dollar Stores, Inc. | | 348,762 |
| 24,200 | | Leggett & Platt, Inc. | | 419,870 |
| 66,400 | | Macy’s, Inc. | | 923,624 |
| 15,785 | | McDonald’s Corp. | | 869,122 |
| 40,500 | | Newell Rubbermaid, Inc. | | 521,235 |
| 19,760 | | Omnicom Group, Inc. | | 671,840 |
| 16,920 | | Philip Morris International, Inc. | | 788,472 |
| 9,700 | | Sealed Air Corp. | | 178,383 |
| 5,000 | | Sears Holding Corp. (a) | | 331,700 |
| 12,800 | | Time Warner, Inc. | | 341,248 |
| 31,500 | | Wal-Mart Stores, Inc. | | 1,571,220 |
| | | | |
| | | | 10,763,952 |
| | | | |
Consumer Staples (5.4%) | | |
| 12,000 | | Archer-Daniels-Midland Co. | | 361,440 |
| 39,200 | | Coca-Cola Enterprises, Inc. | | 736,568 |
| 18,000 | | ConAgra Foods, Inc. | | 353,340 |
| 32,150 | | Kroger Co. (The) | | 687,367 |
| 8,600 | | Lorillard, Inc. | | 633,992 |
| 16,595 | | PepsiCo, Inc. | | 941,766 |
| | | | |
| | | | 3,714,473 |
| | | | |
Energy (10.6%) | | |
| 38,120 | | ConocoPhillips | | 1,666,225 |
| 14,230 | | Devon Energy Corp. | | 826,621 |
| 18,080 | | ENSCO International, Inc. | | 685,051 |
| 50,040 | | Exxon Mobil Corp. | | 3,522,316 |
| 37,010 | | Valero Energy Corp. | | 666,180 |
| | | | |
| | | | 7,366,393 |
| | | | |
Financials (12.3%) | | |
| 27,710 | | Allstate Corp. (The) | | 745,676 |
| 55,600 | | Bank of America Corp. | | 822,324 |
| 8,840 | | Goldman Sachs Group, Inc. (The) | | 1,443,572 |
| 45,775 | | JPMorgan Chase & Co. | | 1,769,204 |
| 33,700 | | Morgan Stanley | | 960,450 |
| 4,400 | | Northern Trust Corp. | | 263,164 |
| 17,160 | | Travelers Cos., Inc. (The) | | 739,081 |
| 29,500 | | U.S. Bancorp | | 602,095 |
| 48,900 | | Wells Fargo & Co. | | 1,196,094 |
| | | | |
| | | | 8,541,660 |
| | | | |
Health Care (14.5%) | | |
| 33,900 | | AmerisourceBergen Corp. | | 668,508 |
| 9,500 | | Amgen, Inc. (a) | | 591,945 |
| 11,010 | | Baxter International, Inc. | | 620,634 |
| 5,200 | | C. R. Bard, Inc. | | 382,564 |
| 43,100 | | Coventry Health Care, Inc. (a) | | 991,300 |
| 25,600 | | Eli Lilly & Co. | | 893,184 |
| 10,900 | | Express Scripts, Inc. (a) | | 763,436 |
| 11,400 | | Gilead Sciences, Inc. (a) | | 557,802 |
| 41,226 | | Johnson & Johnson | | 2,510,251 |
| 12,100 | | McKesson Corp. | | 618,915 |
| | | | |
| Shares | | Security
Description | | Value ($) |
| Common Stocks, continued | | |
Health Care, continued | | |
| 41,938 | | Pfizer, Inc. | | 668,072 |
| 11,100 | | Schering-Plough Corp. | | 294,261 |
| 10,900 | | Wyeth | | 507,395 |
| | | | |
| | | | 10,068,267 |
| | | | |
Industrials (8.5%) | | |
| 14,200 | | Agco Corp. (a) | | 446,732 |
| 13,600 | | Dover Corp. | | 462,536 |
| 13,850 | | Emerson Electric Co. | | 503,863 |
| 9,800 | | Fluor Corp. | | 517,440 |
| 120,700 | | General Electric Co. | | 1,617,380 |
| 19,400 | | Johnson Controls, Inc. | | 502,072 |
| 11,460 | | Lockheed Martin Corp. | | 856,749 |
| 13,160 | | Northrop Grumman Corp. | | 586,673 |
| 3,990 | | W.W. Grainger, Inc. | | 358,741 |
| | | | |
| | | | 5,852,186 |
| | | | |
Information Technology (18.5%) | | |
| 25,200 | | Accenture Ltd., Class A | | 883,764 |
| 7,900 | | Amazon.com, Inc. (a) | | 677,504 |
| 19,000 | | Analog Devices, Inc. | | 520,030 |
| 7,630 | | Apple Computer, Inc. (a) | | 1,246,665 |
| 9,400 | | Automatic Data Processing, Inc. | | 350,150 |
| 13,150 | | Avnet, Inc. (a) | | 320,860 |
| 14,600 | | BMC Software, Inc. (a) | | 496,838 |
| 47,200 | | Cisco Systems, Inc. (a) | | 1,038,872 |
| 39,420 | | Hewlett-Packard Co. | | 1,706,886 |
| 26,500 | | Intel Corp. | | 510,125 |
| 11,800 | | International Business Machines Corp. | | 1,391,574 |
| 66,300 | | Marvell Technology Group Ltd. (a) | | 884,442 |
| 46,990 | | Microsoft Corp. | | 1,105,205 |
| 24,600 | | Novellus Systems, Inc. (a) | | 481,422 |
| 10,400 | | QUALCOMM, Inc. | | 480,584 |
| 48,400 | | Symantec Corp. (a) | | 722,612 |
| | | | |
| | | | 12,817,533 |
| | | | |
Materials (2.8%) | | |
| 19,400 | | Dow Chemical Co. (The) | | 410,698 |
| 14,300 | | FMC Corp. | | 695,552 |
| 5,900 | | Mosaic Co. (The) | | 307,685 |
| 12,700 | | Newmont Mining Corp. | | 525,145 |
| | | | |
| | | | 1,939,080 |
| | | | |
Oil & Gas (1.0%) | | |
| 20,400 | | Noble Corp. | | 690,744 |
| | | | |
Real Estate Investment Trusts (0.6%) | | |
| 16,800 | | HCP, Inc. | | 432,768 |
| | | | |
Telecommunications (3.4%) | | |
| 37,446 | | AT&T, Inc. | | 982,209 |
| 15,300 | | CenturyTel, Inc. | | 480,267 |
| 109,200 | | Sprint Nextel Corp. (a) | | 436,800 |
| 75,400 | | Tellabs, Inc. (a) | | 437,320 |
| | | | |
| | | | 2,336,596 |
| | | | |
See notes to financial statements.
59
PACIFIC CAPITAL FUNDS
Growth and Income Fund
Schedule of Portfolio Investments, continued
July 31, 2009
| | | | |
| Shares | | Security
Description | | Value ($) |
| Common Stocks, continued | | |
Transportation (1.4%) | | |
| 12,200 | | Expeditors International of Washington, Inc. | | 413,946 |
| 12,200 | | Norfolk Southern Corp. | | 527,650 |
| | | | |
| | | | 941,596 |
| | | | |
Utilities (4.7%) | | |
| 30,600 | | Dominion Resources, Inc. | | 1,034,280 |
| 13,900 | | Nicor, Inc. | | 506,516 |
| 33,700 | | Southern Co. | | 1,058,180 |
| 47,600 | | TECO Energy, Inc. | | 642,124 |
| | | | |
| | | | 3,241,100 |
| | | | |
Total Common Stocks (Cost $73,687,809) | | 68,706,348 |
| | | | |
| | | | | |
| Shares | | Security
Description | | Value ($) | |
| Investment Companies (1.1%) | | | |
| 721,988 | | Victory Federal Money Market Fund, Investor Shares, 0.01% (b) | | 721,988 | |
| 3,819 | | Victory Institutional Money Market Fund, Investor Shares, 0.42% (b) | | 3,819 | |
| | | | | |
Total Investment Companies (Cost $725,807) | | 725,807 | |
| | | | | |
Total Investments (Cost $74,413,616)—100.3% | | 69,432,155 | |
Liabilities in excess of other assets—(0.3)% | | (183,432 | ) |
| | | | | |
Net Assets—100.0% | | 69,248,723 | |
| | | | | |
| (a) | Non-income producing security. |
| (b) | Rate periodically changes. Rate disclosed is the daily yield on July 31, 2009. |
See notes to financial statements.
60
PACIFIC CAPITAL FUNDS
Value Fund
Schedule of Portfolio Investments
July 31, 2009
| | | | |
| Shares | | Security
Description | | Value ($) |
| Common Stocks (99.4%) | | |
Consumer Discretionary (10.8%) | | |
| 6,700 | | AutoNation, Inc. (a) | | 138,556 |
| 500 | | AutoZone, Inc. (a) | | 76,785 |
| 16,500 | | Avon Products, Inc. | | 534,270 |
| 5,200 | | Brinker International, Inc. | | 86,528 |
| 5,700 | | Bunge Ltd. | | 398,829 |
| 45,700 | | Comcast Corp., Class A | | 679,102 |
| 25,700 | | D.R. Horton, Inc. | | 297,863 |
| 22,500 | | DISH Network Corp., Class A (a) | | 381,375 |
| 3,800 | | Ecolab, Inc. | | 157,738 |
| 4,000 | | Family Dollar Stores, Inc. | | 125,680 |
| 3,800 | | Fortune Brands, Inc. | | 150,366 |
| 4,300 | | Hasbro, Inc. | | 113,950 |
| 9,000 | | Home Depot, Inc. (The) | | 233,460 |
| 65,500 | | Interpublic Group of Cos., Inc. (The) (a) | | 341,255 |
| 7,000 | | J.C. Penney Co., Inc. | | 211,050 |
| 14,600 | | Leggett & Platt, Inc. | | 253,310 |
| 23,300 | | Macy’s, Inc. | | 324,103 |
| 5,600 | | McGraw-Hill Cos., Inc. (The) | | 175,560 |
| 12,500 | | MeadWestvaco Corp. | | 243,625 |
| 31,400 | | News Corp., Class A | | 324,362 |
| 11,600 | | Temple-Inland, Inc. | | 181,656 |
| 3,491 | | Time Warner Cable, Inc. (a) | | 115,412 |
| 17,100 | | Time Warner, Inc. | | 455,886 |
| 3,800 | | Wal-Mart Stores, Inc. | | 189,544 |
| 12,840 | | Walt Disney Co. (The) | | 322,541 |
| 1,500 | | Whirlpool Corp. | | 85,635 |
| 24,700 | | Wyndham Worldwide Corp. | | 344,565 |
| | | | |
| | | | 6,943,006 |
| | | | |
Consumer Staples (5.3%) | | |
| 19,500 | | Archer-Daniels-Midland Co. | | 587,340 |
| 7,200 | | BJ’s Wholesale Club, Inc. (a) | | 240,120 |
| 35,100 | | Coca-Cola Enterprises, Inc. | | 659,529 |
| 23,000 | | ConAgra Foods, Inc. | | 451,490 |
| 6,800 | | Constellation Brands, Inc., Class A (a) | | 92,888 |
| 4,400 | | Crown Holdings, Inc. (a) | | 110,440 |
| 3,200 | | Genuine Parts Co. | | 113,344 |
| 16,970 | | Kroger Co. (The) | | 362,819 |
| 1,800 | | Lorillard, Inc. | | 132,696 |
| 2,200 | | Molson Coors Brewing Co., Class B | | 99,462 |
| 5,200 | | Reynolds American, Inc. | | 226,252 |
| 13,800 | | Sysco Corp. | | 327,888 |
| | | | |
| | | | 3,404,268 |
| | | | |
Energy (16.1%) | | |
| 4,890 | | Atmos Energy Corp. | | 132,813 |
| 10,700 | | Chesapeake Energy Corp. | | 229,408 |
| 38,590 | | Chevron Corp. | | 2,680,847 |
| 22,100 | | ConocoPhillips | | 965,991 |
| 37,650 | | Duke Energy Corp. | | 582,822 |
| 52,408 | | Exxon Mobil Corp. | | 3,688,999 |
| 5,400 | | Foundation Coal Holdings, Inc. | | 194,022 |
| 8,300 | | Murphy Oil Corp. | | 483,060 |
| 11,700 | | Southwestern Energy Co. (a) | | 484,731 |
| 10,200 | | Tesoro Corp. | | 133,518 |
| 4,400 | | Tidewater, Inc. | | 198,000 |
| 31,460 | | Valero Energy Corp. | | 566,280 |
| | | | |
| | | | 10,340,491 |
| | | | |
| | | | |
| Shares | | Security
Description | | Value ($) |
| Common Stocks, continued | | |
Financials (20.7%) | | |
| 2,500 | | Aflac, Inc. | | 94,650 |
| 5,420 | | Allstate Corp. (The) | | 145,852 |
| 97,047 | | Bank of America Corp. | | 1,435,325 |
| 6,500 | | Bank of New York Mellon Corp. | | 177,710 |
| 14,100 | | BB&T Corp. | | 322,608 |
| 1,980 | | BlackRock, Inc. | | 377,269 |
| 1,900 | | Capitol Federal Financial | | 69,977 |
| 2,270 | | Chubb Corp. (The) | | 104,829 |
| 15,600 | | CIGNA Corp. | | 443,040 |
| 24,760 | | Citigroup, Inc. | | 78,489 |
| 9,300 | | Discover Financial Services | | 110,484 |
| 21,200 | | Fifth Third Bancorp | | 201,400 |
| 8,100 | | First American Corp. | | 239,355 |
| 2,700 | | Franklin Resources, Inc. | | 239,436 |
| 6,540 | | Goldman Sachs Group, Inc. (The) | | 1,067,982 |
| 7,300 | | Invesco Ltd. | | 144,175 |
| 7,800 | | Jefferies Group, Inc. (a) | | 178,308 |
| 63,599 | | JPMorgan Chase & Co. | | 2,458,101 |
| 950 | | MasterCard, Inc., Class A | | 184,329 |
| 4,100 | | Morgan Stanley | | 116,850 |
| 3,400 | | Northern Trust Corp. | | 203,354 |
| 2,400 | | PartnerRe Ltd. | | 164,616 |
| 1,600 | | PNC Financial Services Group, Inc. | | 58,656 |
| 14,900 | | Protective Life Corp. | | 222,755 |
| 13,800 | | Prudential Financial, Inc. | | 610,926 |
| 11,900 | | Raymond James Financial, Inc. | | 244,188 |
| 3,900 | | Reinsurance Group of America, Inc. | | 161,850 |
| 400 | | RenaissanceRe Holdings Ltd. | | 20,100 |
| 6,300 | | State Street Corp. | | 316,890 |
| 18,600 | | Travelers Cos., Inc. (The) | | 801,102 |
| 24,600 | | U.S. Bancorp | | 502,086 |
| 11,700 | | Unitrin, Inc. | | 154,323 |
| 66,300 | | Wells Fargo & Co. | | 1,621,698 |
| | | | |
| | | | 13,272,713 |
| | | | |
Health Care (10.4%) | | |
| 4,300 | | Abbott Laboratories | | 193,457 |
| 34,560 | | AmerisourceBergen Corp. | | 681,523 |
| 4,000 | | Amgen, Inc. (a) | | 249,240 |
| 10,800 | | Covidien PLC | | 408,348 |
| 5,600 | | Eli Lilly & Co. | | 195,384 |
| 4,300 | | Forest Laboratories, Inc. (a) | | 111,069 |
| 11,900 | | Health Net, Inc. (a) | | 161,007 |
| 4,300 | | Herbalife Ltd. | | 147,963 |
| 7,300 | | Hill-Rom Holdings, Inc. | | 125,122 |
| 2,600 | | Humana, Inc. (a) | | 85,410 |
| 6,900 | | Johnson & Johnson | | 420,141 |
| 17,900 | | Lincoln National Corp. | | 379,301 |
| 6,200 | | McKesson Corp. | | 317,130 |
| 120,050 | | Pfizer, Inc. | | 1,912,397 |
| 7,900 | | UnumProvident Corp. | | 148,283 |
| 5,200 | | WellPoint, Inc. (a) | | 273,728 |
| 18,300 | | Wyeth | | 851,865 |
| | | | |
| | | | 6,661,368 |
| | | | |
Industrials (7.9%) | | |
| 10,300 | | Cooper Industries Ltd., Class A | | 339,385 |
| 4,500 | | Crane Co. | | 95,490 |
See notes to financial statements.
61
PACIFIC CAPITAL FUNDS
Value Fund
Schedule of Portfolio Investments, continued
July 31, 2009
| | | | |
| Shares | | Security
Description | | Value ($) |
| Common Stocks, continued | | |
Industrials, continued | | |
| 1,600 | | Flowserve Corp. | | 129,232 |
| 8,820 | | Fluor Corp. | | 465,696 |
| 3,200 | | General Dynamics Corp. | | 177,248 |
| 137,660 | | General Electric Co. | | 1,844,644 |
| 40,100 | | Global Industries Ltd. (a) | | 273,883 |
| 8,000 | | Illinois Tool Works, Inc. | | 324,400 |
| 7,900 | | Johnson Controls, Inc. | | 204,452 |
| 2,500 | | Joy Global, Inc. | | 92,950 |
| 20,300 | | Raytheon Co. | | 953,085 |
| 1,700 | | W.W. Grainger, Inc. | | 152,847 |
| | | | |
| | | | 5,053,312 |
| | | | |
Information Technology (5.1%) | | |
| 4,000 | | Automatic Data Processing, Inc. | | 149,000 |
| 10,800 | | Brocade Communications Systems, Inc. (a) | | 84,888 |
| 4,800 | | Cisco Systems, Inc. (a) | | 105,648 |
| 4,800 | | Computer Sciences Corp. (a) | | 231,216 |
| 9,200 | | Hewlett-Packard Co. | | 398,360 |
| 32,500 | | Ingram Micro, Inc. (a) | | 546,650 |
| 800 | | International Business Machines Corp. | | 94,344 |
| 6,800 | | Lexmark International, Inc., Class A (a) | | 98,464 |
| 19,300 | | Marvell Technology Group Ltd. (a) | | 257,462 |
| 23,200 | | NCR Corp. (a) | | 300,208 |
| 4,400 | | NeuStar, Inc., Class A (a) | | 99,792 |
| 5,500 | | Novellus Systems, Inc. (a) | | 107,635 |
| 14,500 | | SAIC, Inc. (a) | | 262,305 |
| 14,000 | | Symantec Corp. (a) | | 209,020 |
| 12,900 | | Texas Instruments, Inc. | | 310,245 |
| | | | |
| | | | 3,255,237 |
| | | | |
Materials (2.7%) | | |
| 21,400 | | AK Steel Holding Corp. | | 420,938 |
| 10,000 | | Ashland, Inc. | | 331,400 |
| 5,400 | | Dow Chemical Co. (The) | | 114,318 |
| 7,500 | | FMC Corp. | | 364,800 |
| 4,200 | | Freeport-McMoRan Copper & Gold, Inc. Class B | | 253,260 |
| 2,000 | | Lubrizol Corp. (The) | | 115,860 |
| 2,500 | | Sigma-Aldrich Corp. | | 126,875 |
| | | | |
| | | | 1,727,451 |
| | | | |
Oil & Gas (3.1%) | | |
| 10,200 | | Apache Corp. | | 856,290 |
| 3,400 | | Cameron International Corp. (a) | | 106,182 |
| 2,900 | | Noble Corp. | | 98,194 |
| 9,900 | | Plains Exploration & Production Co. (a) | | 283,635 |
| 29,700 | | Rowan Cos., Inc. | | 633,501 |
| | | | |
| | | | 1,977,802 |
| | | | |
| | | | | |
| Shares | | Security
Description | | Value ($) | |
| Common Stocks, continued | | | |
Real Estate Investment Trusts (3.4%) | | | |
| 24,600 | | Annaly Capital Management, Inc. | | 414,510 | |
| 30,600 | | Brandywine Realty Trust | | 250,308 | |
| 7,650 | | Hospitality Properties Trust | | 120,793 | |
| 43,840 | | HRPT Properties Trust | | 211,309 | |
| 29,500 | | SL Green Realty Corp. | | 760,510 | |
| 17,000 | | Taubman Centers, Inc. | | 452,370 | |
| | | | | |
| | | | 2,209,800 | |
| | | | | |
Telecommunications (5.8%) | | | |
| 20,000 | | ADC Telecommunications, Inc. (a) | | 145,600 | |
| 51,311 | | AT&T, Inc. | | 1,345,888 | |
| 2,660 | | CenturyTel, Inc. | | 83,497 | |
| 95,700 | | Sprint Nextel Corp. (a) | | 382,800 | |
| 33,820 | | Verizon Communications, Inc. | | 1,084,607 | |
| 75,500 | | Windstream Corp. | | 662,135 | |
| | | | | |
| | | | 3,704,527 | |
| | | | | |
Transportation (1.6%) | | | |
| 16,700 | | CSX Corp. | | 670,004 | |
| 4,900 | | Expeditors International of Washington, Inc. | | 166,257 | |
| 2,900 | | Overseas Shipholding Group, Inc. | | 99,615 | |
| 1,100 | | SEACOR Holdings, Inc. (a) | | 87,428 | |
| | | | | |
| | | | 1,023,304 | |
| | | | | |
Utilities (6.5%) | | | |
| 13,200 | | Alliant Energy Corp. | | 345,312 | |
| 5,400 | | American Water Works Co., Inc. | | 106,434 | |
| 22,800 | | CMS Energy Corp. | | 295,032 | |
| 8,600 | | Dominion Resources, Inc. | | 290,680 | |
| 12,990 | | Edison International | | 419,837 | |
| 3,200 | | FirstEnergy Corp. | | 131,840 | |
| 2,600 | | FPL Group, Inc. | | 147,342 | |
| 7,900 | | Hawaiian Electric Industries, Inc. | | 141,173 | |
| 12,100 | | Mirant Corp. (a) | | 218,526 | |
| 16,800 | | NSTAR | | 539,280 | |
| 4,900 | | PG&E Corp. | | 197,813 | |
| 3,900 | | Pinnacle West Capital Corp. | | 124,644 | |
| 15,100 | | Southern Co. | | 474,140 | |
| 28,100 | | UGI Corp. | | 742,964 | |
| | | | | |
| | | | 4,175,017 | |
| | | | | |
Total Common Stocks (Cost $67,956,080) | | 63,748,296 | |
| | | | | |
| Investment Companies (0.8%) | | | |
| 517,585 | | Victory Federal Money Market Fund, Investor Shares, 0.01% (b) | | 517,585 | |
| | | | | |
Total Investment Companies (Cost $517,585) | | 517,585 | |
| | | | | |
Total Investments (Cost $68,473,665)—100.2% | | 64,265,881 | |
Liabilities in excess of other assets—(0.2)% | | (156,336 | ) |
| | | | | |
Net Assets—100.0% | | 64,109,545 | |
| | | | | |
| (a) | Non-income producing security. |
| (b) | Rate periodically changes. Rate disclosed is the daily yield on July 31, 2009. |
PLC—Public Liability Co.
See notes to financial statements.
62
PACIFIC CAPITAL FUNDS
High Grade Core Fixed Income Fund
Schedule of Portfolio Investments
July 31, 2009
| | | | |
Principal
Amount ($) | | Security
Description | | Value ($) |
| Corporate Bonds (33.1%) | | |
Consumer Discretionary (2.5%) | | |
| 2,990,000 | | Comcast Corp., 5.85%, 11/15/15 | | 3,245,137 |
| 1,802,000 | | Harvard President & Fellows of Harvard, 6.30%, 10/1/37,
Callable 4/1/16 @ 100 | | 1,802,995 |
| | | | |
| | | | 5,048,132 |
| | | | |
Energy (4.2%) | | |
| 1,800,000 | | Apache Finance Canada,
7.75%, 12/15/29 | | 2,262,586 |
| 2,125,000 | | Duke Capital LLC, 8.00%, 10/1/19 | | 2,364,813 |
| 1,750,000 | | Kinder Morgan Energy Partners LP, 7.13%, 3/15/12 | | 1,895,444 |
| 2,000,000 | | Smith International, Inc.,
6.00%, 6/15/16 | | 1,965,722 |
| | | | |
| | | | 8,488,565 |
| | | | |
Financials (12.3%) | | |
Banking (2.0%) | | |
| 184,073 | | Fifth Third Bancorp, Series BKNT, 2.87%, 8/10/09 | | 183,649 |
| 900,000 | | International Bank for Reconstruction & Development, 2.10%, 6/15/12,
Callable 6/15/10 @ 100 | | 899,745 |
| 675,000 | | Regions Bank, 3.25%, 12/9/11 (a) | | 701,049 |
| 665,000 | | US Bank NA, 6.30%, 2/4/14 | | 726,497 |
| 1,480,000 | | Wells Fargo & Co.,
5.63%, 12/11/17 | | 1,504,694 |
| | | | |
| | | | 4,015,634 |
| | | | |
Financial Services (10.3%) | | |
| 925,000 | | Bear Stearns Cos., LLC (The), 6.40%, 10/2/17 | | 990,658 |
| 125,000 | | BP Capital Markets PLC,
5.25%, 11/7/13 | | 137,095 |
| 1,225,000 | | Charles Schwab Corp., Series A, 6.38%, 9/1/17, MTN | | 1,326,448 |
| 1,100,000 | | Citigroup Funding, Inc.,
2.25%, 12/10/12 (a) | | 1,104,004 |
| 1,050,000 | | General Electric Capital Corp., 5.72%, 8/22/11,
Callable 1/22/10 @ 100, MTN | | 1,069,057 |
| 1,075,000 | | General Electric Capital Corp.,
Series G, 3.00%, 12/9/11 (a) | | 1,109,067 |
| 650,000 | | HSBC Finance Corp.,
6.75%, 5/15/11 | | 675,713 |
| 1,000,000 | | HSBC Finance Corp.,
6.38%, 10/15/11 | | 1,026,959 |
| 1,000,000 | | International Lease Finance Corp., Series P, 0.91% (b), 1/15/10, MTN | | 954,856 |
| 3,450,000 | | International Lease Finance Corp., 0.86% (b), 7/13/12 | | 2,401,062 |
| 3,700,000 | | Merrill Lynch & Co., Series C, 0.87% (b), 6/5/12, MTN | | 3,361,927 |
| 1,250,000 | | Morgan Stanley, 7.30%, 5/13/19 | | 1,410,585 |
| | | | |
Principal
Amount ($) | | Security
Description | | Value ($) |
| Corporate Bonds, continued | | |
Financial Services, continued | | |
| 1,400,000 | | National Rural Utilities Cooperative Finance Corp., 10.38%, 11/1/18 | | 1,814,701 |
| 3,025,000 | | PartnerRe Finance A LLC,
6.88%, 6/1/18 | | 2,852,856 |
| 571,051 | | Toyota Motor Credit Corp.,
2.75%, 8/6/09, MTN | | 571,214 |
| | | | |
| | | | 20,806,202 |
| | | | |
| | | | 24,821,836 |
| | | | |
Industrials (2.7%) | | |
| 2,950,000 | | Dominion Resources, Inc.,
5.25%, 8/1/33 | | 3,091,187 |
| 2,300,000 | | General Electric Co.,
5.00%, 2/1/13 | | 2,420,614 |
| | | | |
| | | | 5,511,801 |
| | | | |
Information Technology (0.4%) | | |
| 800,000 | | Pitney Bowes, Inc., 5.25%, 1/15/37, MTN | | 812,283 |
| | | | |
Supranational Agency (0.5%) | | |
| 1,000,000 | | European Investment Bank,
2.38%, 3/14/14 | | 974,367 |
| | | | |
Technology (1.1%) | | |
| 1,140,000 | | Science Applications International Corp., 7.13%, 7/1/32 | | 1,101,482 |
| 1,485,000 | | Science Applications International Corp., 5.50%, 7/1/33 | | 1,209,970 |
| | | | |
| | | | 2,311,452 |
| | | | |
Telecommunications (4.6%) | | |
| 1,325,000 | | AT&T, Inc., 4.13%, 9/15/09 | | 1,329,198 |
| 2,075,000 | | GTE Southwest, Inc., First Mortgage Bond, 8.50%, 11/15/31 | | 2,360,922 |
| 1,550,000 | | Harris Corp., 5.00%, 10/1/15 | | 1,522,379 |
| 2,000,000 | | Harris Corp., 5.95%, 12/1/17 | | 2,096,678 |
| 2,000,000 | | Verizon Wireless Capital,
3.75%, 5/20/11 (c) | | 2,061,110 |
| | | | |
| | | | 9,370,287 |
| | | | |
Transportation (2.9%) | | |
| 736,334 | | Burlington Northern & Santa Fe Railway Co. (The),
5.14%, 1/15/21 | | 731,724 |
| 3,881,374 | | FedEx Corp., Pass Thru Certificates, 7.50%, 1/15/18 | | 4,172,477 |
| 1,000,000 | | GATX Corp., 8.75%, 5/15/14 | | 1,057,617 |
| | | | |
| | | | 5,961,818 |
| | | | |
Utilities (1.9%) | | |
| 1,295,000 | | Alabama Power Co., Series 1, 5.65%, 3/15/35, Callable 3/15/15 @ 100 | | 1,287,453 |
| 1,300,000 | | Georgia Power Co., Series Q, 4.90%, 9/15/13 | | 1,377,564 |
See notes to financial statements.
63
PACIFIC CAPITAL FUNDS
High Grade Core Fixed Income Fund
Schedule of Portfolio Investments, continued
July 31, 2009
| | | | |
Principal
Amount ($) | | Security
Description | | Value ($) |
| Corporate Bonds, continued | | |
Utilities, continued | | |
| 1,007,000 | | PacifiCorp, 5.45%, 9/15/13 | | 1,082,182 |
| | | | |
| | | | 3,747,199 |
| | | | |
Total Corporate Bonds (Cost $66,642,201) | | 67,047,740 |
| | | | |
| Municipal Bonds (0.7%) | | |
Hawaii (0.7%) | | |
| 1,410,000 | | Hawaii State GO, Series DM,
3.68%, 5/1/10 | | 1,431,432 |
| | | | |
Total Municipal Bonds (Cost $1,410,000) | | 1,431,432 |
| | | | |
| U.S. Government Agency Mortgage-Backed Obligations (39.0%) | | |
Federal Home Loan Mortgage Corp. (12.7%) | | |
| 1,822,677 | | 5.50%, 4/1/21 | | 1,913,750 |
| 1,862,516 | | 4.50%, 8/1/33 | | 1,881,461 |
| 2,129,719 | | 5.00%, 5/1/34 | | 2,188,554 |
| 3,658,737 | | 5.50%, 3/1/35 | | 3,802,855 |
| 1,303,030 | | 6.00%, 4/1/36 | | 1,368,201 |
| 4,729,136 | | 5.85% (b), 12/1/36 | | 4,991,444 |
| 4,268,488 | | 6.00%, 12/1/36 | | 4,481,977 |
| 2,778,173 | | 5.50%, 1/1/37 | | 2,875,885 |
| 2,117,231 | | 6.50%, 5/1/37 | | 2,261,284 |
| | | | |
| | | | 25,765,411 |
| | | | |
Federal National Mortgage Assoc. (25.4%) | | |
| 1,232,612 | | 4.50%, 6/1/14 | | 1,274,711 |
| 2,303,477 | | 4.50%, 3/1/19 | | 2,395,878 |
| 3,415,965 | | 5.00%, 9/1/33 | | 3,510,335 |
| 680,635 | | 4.50%, 10/1/33 | | 688,697 |
| 2,227,805 | | 5.00%, 1/1/34 | | 2,289,351 |
| 610,785 | | 5.00%, 3/1/34 | | 627,658 |
| 2,568,584 | | 5.08% (b), 9/1/34 | | 2,676,083 |
| 2,054,483 | | 5.14% (b), 10/1/34 | | 2,153,447 |
| 5,246,702 | | 5.50%, 2/1/35 | | 5,458,289 |
| 1,905,080 | | 6.00%, 4/1/35 | | 2,009,888 |
| 8,188,000 | | 5.50%, 7/25/35 | | 8,583,919 |
| 1,118,338 | | 5.00%, 8/1/35 | | 1,148,010 |
| 3,207,001 | | 5.50%, 10/1/35 | | 3,334,327 |
| 1,993,448 | | 6.00%, 12/1/35 | | 2,098,134 |
| 1,447,920 | | 6.00%, 10/1/36 | | 1,521,696 |
| 2,532,643 | | 5.50%, 12/1/36 | | 2,622,524 |
| 5,156,258 | | 5.57% (b), 1/1/37 | | 5,422,005 |
| 3,506,944 | | 6.50%, 4/1/38 | | 3,755,803 |
| | | | |
| | | | 51,570,755 |
| | | | |
Government National Mortgage Assoc. (0.9%) | | |
| 1,726,856 | | 5.50%, 11/15/35 | | 1,803,111 |
| | | | |
Total U.S. Government Agency Mortgage- Backed Obligations (Cost $74,551,710) | | 79,139,277 |
| | | | |
| U.S. Government Agencies (6.0%) | | |
Federal Home Loan Mortgage Corp. (2.3%) | | |
| 2,975,000 | | 2.45%, 6/29/12,
Callable 6/29/12 @ 100 | | 2,995,840 |
| 1,200,000 | | 2.50%, 4/8/13,
Callable 4/8/11 @ 100 | | 1,199,222 |
| | | | |
Shares or
Principal
Amount ($) | | Security
Description | | Value ($) |
| U.S. Government Agencies, continued | | |
Federal Home Loan Mortgage Corp., continued | | |
| 350,000 | | 5.40%, 3/17/21,
Callable 3/17/16 @ 100 | | 376,258 |
| | | | |
| | | | 4,571,320 |
| | | | |
Federal National Mortgage Assoc. (2.7%) | | |
| 500,000 | | 1.38%, 10/7/11,
Callable 4/7/10 @ 100 | | 501,353 |
| 1,000,000 | | 2.50%, 2/17/12,
Callable 2/17/10 @ 100 | | 1,003,125 |
| 900,000 | | 2.88%, 12/11/13 | | 916,620 |
| 2,000,000 | | 4.00%, 4/22/19,
Callable 4/22/10 @ 100 | | 1,982,296 |
| 925,000 | | 5.50%, 6/25/24,
Callable 9/25/09 @ 100 | | 907,736 |
| 180,000 | | 5.50%, 5/10/27,
Callable 5/10/17 @ 100 | | 181,458 |
| | | | |
| | | | 5,492,588 |
| | | | |
Small Business Administration Corp. (0.1%) | | |
| 285,325 | | 6.34%, 8/1/11 | | 298,782 |
| | | | |
Tennessee Valley Authority (0.5%) | | |
| 880,000 | | 5.50%, 7/18/17 | | 968,765 |
| | | | |
U.S. Department of Housing & Urban Development (0.4%) | | |
| 770,000 | | 3.44%, 8/1/11 | | 803,641 |
| | | | |
Total U.S. Government Agencies
(Cost $12,064,919) | | 12,135,096 |
| | | | |
| U.S. Treasury Obligations (20.2%) | | |
U.S. Treasury Bonds (7.2%) | | |
| 2,850,000 | | 7.88%, 2/15/21 | | 3,880,455 |
| 2,090,000 | | 5.25%, 11/15/28 | | 2,349,946 |
| 8,125,000 | | 4.50%, 2/15/36 | | 8,376,371 |
| | | | |
| | | | 14,606,772 |
| | | | |
U.S. Treasury Notes (13.0%) | | |
| 4,200,000 | | 4.75%, 3/31/11 | | 4,464,961 |
| 4,162,000 | | 1.13%, 6/30/11 | | 4,166,882 |
| 1,890,000 | | 1.50%, 7/15/12 | | 1,885,281 |
| 2,516,000 | | 4.63%, 7/31/12 | | 2,740,671 |
| 7,675,000 | | 4.25%, 8/15/15 | | 8,253,626 |
| 3,000,000 | | 4.63%, 11/15/16 | | 3,284,532 |
| 1,500,000 | | 3.13%, 5/15/19 | | 1,454,059 |
| | | | |
| | | | 26,250,012 |
| | | | |
Total U.S. Treasury Obligations
(Cost $41,958,803) | | 40,856,784 |
| | | | |
| Investment Companies (0.3%) | | |
| 623,666 | | Victory Federal Money Market Fund, Investor Shares, 0.01% (d) | | 623,666 |
| | | | |
Total Investment Companies (Cost $623,666) | | 623,666 |
| | | | |
Total Investments (Cost $197,251,299)—99.3% | | 201,233,995 |
Other assets in excess of liabilities—0.7% | | 1,371,251 |
| | | | |
Net Assets—100.0% | | 202,605,246 |
| | | | |
See notes to financial statements.
64
PACIFIC CAPITAL FUNDS
High Grade Core Fixed Income Fund
Schedule of Portfolio Investments, continued
July 31, 2009
| (a) | Security issued under terms of the Temporary Liquidity Guarantee Program and is guaranteed by the Federal Deposit Insurance Corporation. |
| (b) | Rate periodically changes. Rate disclosed is the rate in effect on July 31, 2009. |
| (c) | All or a portion of this security is exempt from registration under Rule 144A or Section 4(2) of the Securities Act of 1933 and has been deemed liquid based on procedures approved by the Board. The security may be resold in transactions exempt from registration, normally to qualified institutional buyers. As of July 31, 2009, these securities represent 1.0% of net assets. |
| (d) | Rate periodically changes. Rate disclosed is the daily yield on July 31, 2009. |
GO—General Obligation
LLC—Limited Liability Co.
LP—Limited Partnership
MTN—Medium Term Note
PLC—Public Liability Co.
See notes to financial statements.
65
PACIFIC CAPITAL FUNDS
Tax-Free Securities Fund
Schedule of Portfolio Investments
July 31, 2009
| | | | |
Principal
Amount ($) | | Security
Description | | Value ($) |
| Municipal Bonds (94.3%) | | |
Arizona (3.1%) | | |
| 7,255,000 | | Phoenix Civic Improvement Corp., Civic Plaza, Convertible CAB, 0.00% (a), 7/1/31, 5.50% effective 7/1/13, FGIC | | 5,781,582 |
| 1,605,000 | | Scottsdale GO, 5.38%, 7/1/16, Callable 7/1/11 @ 101 | | 1,725,600 |
| | | | |
| | | | 7,507,182 |
| | | | |
California (0.8%) | | |
| 5,000,000 | | Norwalk-La Mirada California Unified School District GO, CAB, Series B, 5.21% (b), 8/1/27, FSA-CR | | 1,864,350 |
| | | | |
Florida (2.7%) | | |
| 2,000,000 | | Miami-Dade County Expressway Authority Toll System Revenue, 6.00%, 7/1/20, Prerefunded 7/1/10 @ 101, FGIC | | 2,118,400 |
| 3,725,000 | | Orlando Utilities Community Water & Electric Revenue, Series D, 6.75%, 10/1/17, ETM | | 4,479,387 |
| | | | |
| | | | 6,597,787 |
| | | | |
Georgia (4.1%) | | |
| 1,865,000 | | Metropolitan Atlanta Rapid Transportation Authority Sales Tax Revenue, Series P, 6.25%, 7/1/11, AMBAC | | 1,977,441 |
| 390,000 | | Municipal Electric Authority Power Revenue, Series W, 6.60%, 1/1/18, ETM, MBIA | | 501,314 |
| 6,385,000 | | Municipal Electric Authority Power Revenue, Series W, 6.60%, 1/1/18, Unrefunded Portion, MBIA | | 7,251,444 |
| | | | |
| | | | 9,730,199 |
| | | | |
Hawaii (60.3%) | | |
| 3,000,000 | | Hawaii Airport System Revenue, AMT, 5.63%, 7/1/18, Callable 7/1/11 @ 100, FGIC | | 3,007,590 |
| 9,735,000 | | Hawaii Airport System Revenue, Second Series, AMT, 6.90%, 7/1/12, ETM, MBIA | | 10,323,383 |
| 605,000 | | Hawaii County GO, Series A, 5.60%, 5/1/13, FGIC | | 686,578 |
| 1,655,000 | | Hawaii County GO, Series A, 5.25%, 7/15/17 | | 1,869,008 |
| 1,655,000 | | Hawaii County GO, Series A, 6.00%, 7/15/26,
Callable 7/15/18 @100 | | 1,837,381 |
| 3,000,000 | | Hawaii Department of Budget & Finance, Special Purpose Revenue, Hawaiian Electric Co., 5.70%, 7/1/20, Callable
7/1/10 @ 101, AMBAC | | 2,947,320 |
| | | | |
Principal
Amount ($) | | Security
Description | | Value ($) |
| Municipal Bonds, continued | | |
Hawaii, continued | | |
| 3,000,000 | | Hawaii Department of Budget & Finance, Special Purpose Revenue, Hawaiian Electric Co., Series A, AMT, 4.95%, 4/1/12, MBIA | | 3,095,400 |
| 2,000,000 | | Hawaii Department of Budget & Finance, Special Purpose Revenue, Hawaiian Electric Co., Series A, 5.50%, 12/1/14, Callable 12/1/09 @ 101, AMBAC | | 2,041,820 |
| 5,200,000 | | Hawaii Department of Budget & Finance, Special Purpose Revenue, Hawaiian Electric Co., Series A, 5.65%, 10/1/27, Callable 10/1/12 @ 101, MBIA | | 4,842,292 |
| 2,500,000 | | Hawaii State Department of Budget & Finance, Special Purpose Revenue, Series B,
0.42% (a), 7/1/29, Bank of America N.A. | | 2,500,000 |
| 510,000 | | Hawaii State Department of Hawaiian Home Lands Revenue, 4.00%, 4/1/10 | | 516,666 |
| 500,000 | | Hawaii State Department of Hawaiian Home Lands Revenue, 4.50%, 4/1/13 | | 526,300 |
| 500,000 | | Hawaii State Department of Hawaiian Home Lands Revenue, 5.00%, 4/1/16 | | 527,740 |
| 775,000 | | Hawaii State Department of Hawaiian Home Lands Revenue, 5.00%, 4/1/18 | | 800,800 |
| 2,000,000 | | Hawaii State GO, Series BZ, 6.00%, 10/1/12, FGIC | | 2,293,680 |
| 1,350,000 | | Hawaii State GO, Series CH, 4.75%, 11/1/11, MBIA | | 1,461,794 |
| 1,335,000 | | Hawaii State GO, Series CH, 4.75%, 11/1/13, MBIA | | 1,508,991 |
| 5,000,000 | | Hawaii State GO, Series CM, 6.50%, 12/1/13, FGIC | | 6,021,400 |
| 500,000 | | Hawaii State GO, Series CY, 5.75%, 2/1/15, FSA | | 590,450 |
| 1,000,000 | | Hawaii State GO, Series DD, 5.00%, 5/1/17,
Callable 5/1/14 @ 100, MBIA | | 1,096,490 |
| 2,680,000 | | Hawaii State GO, Series DD, 5.00%, 5/1/18, Prerefunded 5/1/14 @ 100, MBIA | | 3,071,762 |
| 1,560,000 | | Hawaii State GO, Series DD, 5.00%, 5/1/18,
Callable 5/1/14 @ 100, MBIA | | 1,691,056 |
| 4,000,000 | | Hawaii State GO, Series DK, 5.00%, 5/1/17 | | 4,593,320 |
| 3,000,000 | | Hawaii State GO, Series DQ, 5.00%, 6/1/23,
Callable 6/1/19 @ 100 | | 3,279,780 |
See notes to financial statements.
66
PACIFIC CAPITAL FUNDS
Tax-Free Securities Fund
Schedule of Portfolio Investments, continued
July 31, 2009
| | | | |
Principal
Amount ($) | | Security
Description | | Value ($) |
| Municipal Bonds, continued | | |
Hawaii, continued | | |
| 1,105,000 | | Hawaii State Harbor System Revenue, Series A, AMT, 5.25%, 7/1/16, FSA | | 1,176,604 |
| 1,500,000 | | Hawaii State Harbor System Revenue, Series B, AMT, 5.50%, 7/1/19, Callable
7/1/12 @ 100, AMBAC | | 1,573,680 |
| 2,530,000 | | Hawaii State Highway Revenue, 5.38%, 7/1/18, Prerefunded 7/1/10 @ 100, FSA | | 2,642,712 |
| 2,000,000 | | Hawaii State Housing Finance & Development Corp., Single Family Mortgage Purchase Revenue, Series A, AMT, 5.40%, 7/1/29, Callable
7/1/10 @ 101.50, FNMA | | 2,002,620 |
| 2,970,000 | | Honolulu City & County Board of Water Supply System Revenue, Series A, 4.75%, 7/1/18, Callable 7/1/14 @ 100, FGIC | | 3,135,934 |
| 2,315,000 | | Honolulu City & County Board of Water Supply System Revenue, Series A, 4.75%, 7/1/31, Callable 7/1/16 @ 100, MBIA | | 2,274,673 |
| 2,320,000 | | Honolulu City & County GO, 6.00%, 12/1/11, ETM, FGIC | | 2,600,418 |
| 2,125,000 | | Honolulu City & County GO, Series A, 6.00%, 1/1/11, ETM, FGIC | | 2,284,099 |
| 875,000 | | Honolulu City & County GO, Series A, 6.00%, 1/1/11, FGIC | | 937,816 |
| 4,820,000 | | Honolulu City & County GO, Series A, 5.75%, 4/1/11, ETM, FGIC | | 5,224,928 |
| 1,865,000 | | Honolulu City & County GO, Series A, 5.75%, 4/1/12, FGIC | | 2,087,662 |
| 850,000 | | Honolulu City & County GO, Series A, 5.75%, 4/1/13, ETM, FGIC | | 984,266 |
| 3,345,000 | | Honolulu City & County GO, Series A, 5.75%, 4/1/13, FGIC | | 3,847,486 |
| 3,500,000 | | Honolulu City & County GO, Series A, 5.38%, 9/1/18, Prerefunded 9/1/11 @ 100, FSA | | 3,829,175 |
| 6,250,000 | | Honolulu City & County GO, Series A, 5.00%, 7/1/19, Callable 7/1/15 @ 100, MBIA | | 6,787,750 |
| 640,000 | | Honolulu City & County GO, Series B, 5.25%, 10/1/12, FGIC | | 719,168 |
| 5,000,000 | | Honolulu City & County GO, Series D, 5.00%, 7/1/20, Callable 7/1/15 @ 100, MBIA | | 5,380,300 |
| 2,000,000 | | Honolulu City & County Waste Water System Revenue, Junior Series, 5.00%, 7/1/23, Callable 8/31/09 @ 101, FGIC | | 2,011,340 |
| | | | |
Principal
Amount ($) | | Security
Description | | Value ($) |
| Municipal Bonds, continued | | |
Hawaii, continued | | |
| 5,000,000 | | Honolulu Hawaii City & County GO, Series A, 5.00%, 4/1/18 | | 5,675,550 |
| 6,680,000 | | Honolulu Hawaii City & County GO, Series A, 5.00%, 7/1/21, Callable 7/1/17 @ 100, FSA | | 7,279,864 |
| 5,000,000 | | Honolulu Hawaii City & County GO, Series A, 5.00%, 7/1/26, Callable 7/1/15 @ 100, MBIA | | 5,188,550 |
| 3,150,000 | | Honolulu Hawaii City & County GO, Series A, 5.00%, 7/1/27, Callable 7/1/15 @ 100, MBIA | | 3,252,186 |
| 2,315,000 | | Honolulu Hawaii City & County GO, Series A, 5.00%, 7/1/29, Callable 7/1/17 @ 100, FSA | | 2,371,069 |
| 4,115,000 | | Honolulu Hawaii City & County GO, Series F, 5.00%, 7/1/22, Callable 7/1/15 @ 100, FGIC | | 4,369,389 |
| 1,340,000 | | Kauai County GO, Series C, 5.90%, 8/1/09, AMBAC | | 1,340,150 |
| 1,000,000 | | University of Hawaii System Revenue, Series A, 5.50%, 7/15/16, Prerefunded 7/15/12 @ 100, FGIC | | 1,131,490 |
| 1,205,000 | | University of Hawaii System Revenue, Series A, 5.50%, 7/15/22, Prerefunded 7/15/12 @ 100, FGIC | | 1,363,445 |
| 1,000,000 | | University of Hawaii System Revenue, Series A, 5.50%, 7/15/29, Prerefunded 7/15/12 @ 100, FGIC | | 1,131,490 |
| 750,000 | | University of Hawaii System Revenue, Series A, 5.13%, 7/15/32, Prerefunded 7/15/12 @ 100, FGIC | | 840,473 |
| | | | |
| | | | 144,575,288 |
| | | | |
Illinois (4.2%) | | |
| 2,000,000 | | Chicago Midway Airport Revenue, Series C, 5.50%, 1/1/15, MBIA | | 2,143,460 |
| 4,665,000 | | Illinois Municipal Electric Agency Power Supply Revenue, Series C, 5.25%, 2/1/21, FGIC | | 4,980,494 |
| 5,505,000 | | Kane & De Kalb Counties Illinois Community Unit School District GO, 4.89% (b), 2/1/23, FGIC | | 2,899,428 |
| | | | |
| | | | 10,023,382 |
| | | | |
Indiana (0.5%) | | |
| 1,000,000 | | Tri-Creek High School Building Corp. Revenue, 5.00%, 7/15/15, Prerefunded 7/15/13 @ 100, FSA | | 1,141,390 |
| | | | |
See notes to financial statements.
67
PACIFIC CAPITAL FUNDS
Tax-Free Securities Fund
Schedule of Portfolio Investments, continued
July 31, 2009
| | | | |
Principal
Amount ($) | | Security
Description | | Value ($) |
| Municipal Bonds, continued | | |
Kentucky (0.6%) | | |
| 1,250,000 | | Kentucky State Property & Buildings Commission Revenue, Second Series, AMT, 5.50%, 11/1/16, Callable
11/1/12 @ 100, FSA | | 1,348,913 |
| | | | |
Massachusetts (0.4%) | | |
| 1,000,000 | | Massachusetts State GO, Series C, 5.75%, 10/1/20, Prerefunded 10/1/10 @ 100 | | 1,056,930 |
| | | | |
Michigan (2.3%) | | |
| 3,000,000 | | Michigan Municipal Building Authority Revenue, Clean Water Revolving Fund, 5.50%, 10/1/21, Prerefunded 10/1/10 @ 101 | | 3,202,800 |
| 2,245,000 | | Michigan State Strategic Fund Ltd. Obligation Revenue, 6.95%, 5/1/11, FGIC | | 2,330,085 |
| | | | |
| | | | 5,532,885 |
| | | | |
Missouri (0.9%) | | |
| 2,000,000 | | University of Missouri Revenue, Series B, 5.38%, 11/1/16, Callable 11/1/11 @ 100 | | 2,130,220 |
| | | | |
Ohio (0.9%) | | |
| 795,000 | | Hamilton County Sales Tax Revenue, Series B, 5.25%, 12/1/18, Prerefunded
12/1/10 @ 100 | | 844,258 |
| 205,000 | | Hamilton County Sales Tax Revenue, Series B, 5.25%, 12/1/18, Callable
12/1/10 @ 100, AMBAC | | 211,142 |
| 1,000,000 | | Ohio State Building Authority, Adult Correction Facility Revenue, Series A, 5.50%, 10/1/14, Callable
10/1/11 @ 100, FSA | | 1,080,290 |
| | | | |
| | | | 2,135,690 |
| | | | |
Pennsylvania (3.1%) | | |
| 6,000,000 | | East Stroudsburg Area School District GO, Series A, 7.75%, 9/1/27, Callable
9/1/17 @ 100, FGIC | | 7,357,560 |
| | | | |
Texas (5.3%) | | |
| 2,395,000 | | Barbers Hill Independent School District GO, 5.00%, 2/15/24, Callable 2/15/15 @ 100, PSF-GTD | | 2,532,162 |
| | | | |
Shares or
Principal
Amount ($) | | Security
Description | | Value ($) |
| Municipal Bonds, continued | | |
Texas, continued | | |
| 2,630,000 | | Galveston County GO, CAB, Series RD, 5.96% (b), 2/1/24, FGIC | | 1,315,316 |
| 2,345,000 | | Grapevine GO, Series A, 5.00%, 8/15/24, Callable 2/15/15 @ 100, MBIA | | 2,424,964 |
| 2,000,000 | | Houston Independent School District GO, Series A, 5.00%, 2/15/24, Callable
2/15/15 @ 100 | | 2,114,540 |
| 1,365,000 | | New Braunfels GO, 5.00%, 10/1/16, Callable
10/1/14 @ 100, AMBAC | | 1,505,431 |
| 10,000,000 | | North Texas Tollway Authority Revenue, CAB, Series D, 5.37% (b), 1/1/30, Insured by Assured Guaranty Ltd. | | 2,888,100 |
| | | | |
| | | | 12,780,513 |
| | | | |
Washington (5.1%) | | |
| 3,475,000 | | Douglas County School District No. 206 Eastmont GO, 5.00%, 12/1/17, Prerefunded 6/1/11 @ 100, FGIC | | 3,749,004 |
| 3,000,000 | | King County Washington School District No. 403 Renton GO, 5.00%, 12/1/24, Callable
12/1/16 @ 100, FGIC, School Board Guarantee | | 3,228,060 |
| 2,000,000 | | Port Seattle Washington Revenue, 5.00%, 2/1/25, Callable
2/1/16 @ 100, XLCA | | 2,084,280 |
| 325,000 | | Snohomish County Washington GO, 5.25%, 12/1/12, Prerefunded 12/1/11 @ 100, NATL-RE | | 358,683 |
| 2,555,000 | | Snohomish County Washington GO, 5.25%, 12/1/12, Callable 12/1/11 @ 100, NATL-RE | | 2,794,327 |
| | | | |
| | | | 12,214,354 |
| | | | |
Total Municipal Bonds (Cost $215,846,811) | | 225,996,643 |
| | | | |
| Investment Companies (4.3%) | | |
| 10,229,911 | | Dreyfus Tax Exempt Cash Management Fund, Institutional Shares, 0.25% (c) | | 10,229,911 |
| | | | |
Total Investment Companies (Cost $10,229,911) | | 10,229,911 |
| | | | |
Total Investments (Cost $226,076,722)—98.6% | | 236,226,554 |
Other assets in excess of liabilities—1.4% | | 3,304,058 |
| | | | |
Net Assets—100.0% | | 239,530,612 |
| | | | |
| (a) | Rate periodically changes. Rate disclosed is the rate in effect on July 31, 2009. |
| (b) | Rate disclosed represents the effective yield at purchase. |
| (c) | Rate periodically changes. Rate disclosed is the daily yield on July 31, 2009. |
See notes to financial statements.
68
PACIFIC CAPITAL FUNDS
Tax-Free Securities Fund
Schedule of Portfolio Investments, continued
July 31, 2009
AMBAC—Insured by American Municipal Bond Assurance Corp.
AMT—Subject to alternative minimum tax
CAB—Capital Appreciation Bond
ETM—Escrowed to Maturity
FGIC—Insured by Financial Guaranty Insurance Co.
FNMA—Insured by Federal National Mortgage Association
FSA—Insured by Federal Security Assurance
FSA-CR—Insured by Federal Security Assurance Custodial Receipts
GO—General Obligation
MBIA—Insured by Municipal Bond Insurance Association
NATL-RE—Insured by National Reinsurance Corp.
PSF-GTD—Insured by Public School Funding Guarantee
XLCA—Insured by XL Capital Assurance
See notes to financial statements.
69
PACIFIC CAPITAL FUNDS
High Grade Short Intermediate Fixed Income Fund
Schedule of Portfolio Investments
July 31, 2009
| | | | |
Principal
Amount ($) | | Security
Description | | Value ($) |
| Corporate Bonds (20.9%) |
Consumer Discretionary (3.4%) |
| 125,000 | | Avon Products, Inc., 5.63%, 3/1/14 | | 133,488 |
| 250,000 | | Comcast Corp., 5.45%, 11/15/10 | | 260,386 |
| 1,000,000 | | Daimler Chrysler NA Holding Corp., 5.88%, 3/15/11 | | 1,031,530 |
| 71,000 | | Newell Rubbermaid, Inc., 4.00%, 5/1/10 | | 71,323 |
| 150,000 | | Wal-Mart Stores, Inc., 4.25%, 4/15/13 | | 156,841 |
| 300,000 | | Walgreen Co., 4.88%, 8/1/13 | | 318,850 |
| | | | |
| | | | 1,972,418 |
| | | | |
Consumer Staples (2.5%) |
| 100,000 | | Coca-Cola Co. (The), 3.63%, 3/15/14 | | 103,171 |
| 100,000 | | Coca-Cola Enterprises, Inc., 3.75%, 3/1/12 | | 104,023 |
| 45,000 | | Diageo Capital PLC, 5.20%, 1/30/13 | | 47,707 |
| 150,000 | | General Mills, Inc., 5.25%, 8/15/13 | | 162,625 |
| 175,000 | | Kellogg Co., 4.25%, 3/6/13 | | 182,323 |
| 225,000 | | Kroger Co., 5.50%, 2/1/13 | | 236,524 |
| 165,000 | | Kroger Co., 5.00%, 4/15/13 | | 171,290 |
| 250,000 | | PepsiCo, Inc., 5.15%, 5/15/12 | | 271,139 |
| 160,000 | | Sysco Corp., 4.20%, 2/12/13 | | 163,125 |
| | | | |
| | | | 1,441,927 |
| | | | |
Energy (0.5%) |
| 150,000 | | Chevron Corp., 3.95%, 3/3/14 | | 156,474 |
| 100,000 | | ConocoPhillips, 4.75%, 2/1/14 | | 106,498 |
| | | | |
| | | | 262,972 |
| | | | |
Financials (7.2%) |
| 325,000 | | American General Finance, Series J, 5.63%, 8/17/11, MTN | | 222,846 |
| 100,000 | | Bank of America Corp., Series L, 7.38%, 5/15/14 | | 109,041 |
| 50,000 | | Bank of New York Mellon, 4.30%, 5/15/14 | | 51,899 |
| 100,000 | | BP Capital Markets PLC, 3.63%, 5/8/14 | | 102,572 |
| 300,000 | | Caterpillar Financial Services Corp., 4.25%, 2/8/13, MTN | | 303,470 |
| 500,000 | | Citigroup, Inc., 5.50%, 4/11/13 | | 494,528 |
| 300,000 | | Citigroup, Inc., 6.50%, 8/19/13 | | 305,966 |
| 1,000,000 | | Countrywide Financial Corp., 4.50%, 6/15/10 | | 1,008,729 |
| 525,000 | | General Electric Capital Corp., 5.72%, 8/22/11, Callable 1/22/10 @ 100, MTN | | 534,529 |
| 90,000 | | General Electric Capital Corp., Series A, 5.25%, 10/19/12, MTN | | 94,044 |
| 45,000 | | Goldman Sachs Group, Inc., 5.45%, 11/1/12 | | 48,148 |
| 50,000 | | John Deere Capital Corp., 5.25%, 10/1/12, MTN | | 53,502 |
| | | | |
Principal
Amount ($) | | Security
Description | | Value ($) |
| Corporate Bonds, continued |
Financials, continued |
| 100,000 | | JPMorgan Chase & Co., 4.65%, 6/1/14 | | 104,274 |
| 500,000 | | Morgan Stanley, 5.63%, 1/9/12 | | 520,858 |
| 100,000 | | Morgan Stanley, 6.00%, 5/13/14 | | 106,845 |
| 100,000 | | U.S. Bancorp, 4.20%, 5/15/14 | | 102,254 |
| | | | |
| | | | 4,163,505 |
| | | | |
Health Care (0.4%) |
| 200,000 | | Johnson & Johnson, 5.15%, 8/15/12 | | 219,982 |
| | | | |
Industrials (1.5%) |
| 75,000 | | Boeing Co. (The), 5.00%, 3/15/14 | | 80,460 |
| 180,000 | | Boeing Co. (The), 3.50%, 2/15/15 | | 180,053 |
| 125,000 | | ConocoPhillips Canada, 5.30%, 4/15/12 | | 133,586 |
| 160,000 | | Dominion Resource, Inc., 4.75%, 12/15/10 | | 164,883 |
| 100,000 | | Honeywell International, Inc., 3.88%, 2/15/14 | | 102,887 |
| 95,000 | | Paccar, Inc., 6.38%, 2/15/12 | | 102,605 |
| 100,000 | | Snap-on, Inc., 5.85%, 3/1/14 | | 107,722 |
| | | | |
| | | | 872,196 |
| | | | |
Information Technology (0.9%) |
| 55,000 | | Dell, Inc., 5.63%, 4/15/14 | | 59,434 |
| 325,000 | | Hewlett-Packard Co., 4.50%, 3/1/13 | | 344,667 |
| 100,000 | | Oracle Corp., 3.75%, 7/8/14 | | 103,246 |
| | | | |
| | | | 507,347 |
| | | | |
Pharmaceuticals (0.5%) |
| 100,000 | | Eli Lilly & Co., 3.55%, 3/6/12 | | 103,907 |
| 200,000 | | Pfizer, Inc., 4.45%, 3/15/12 | | 211,870 |
| | | | |
| | | | 315,777 |
| | | | |
Real Estate Investment Trust (1.7%) |
| 1,000,000 | | Simon Property Group LP, 4.88%, 3/18/10 | | 1,008,618 |
| | | | |
Telecommunications (0.7%) |
| 200,000 | | AT&T, Inc., 4.85%, 2/15/14 | | 213,076 |
| 215,000 | | Verizon Communications, Inc., 4.35%, 2/15/13 | | 223,301 |
| | | | |
| | | | 436,377 |
| | | | |
Transportation (0.7%) |
| 325,000 | | United Parcel Service, Inc., 4.50%, 1/15/13 | | 341,186 |
| 75,000 | | United Parcel Service, Inc., 3.88%, 4/1/14 | | 77,879 |
| | | | |
| | | | 419,065 |
| | | | |
Utilities (0.9%) |
| 500,000 | | Exelon Generation Co., LLC, 6.95%, 6/15/11 | | 534,958 |
| | | | |
Total Corporate Bonds (Cost $11,822,064) | | 12,155,142 |
| | | | |
See notes to financial statements.
70
PACIFIC CAPITAL FUNDS
High Grade Short Intermediate Fixed Income Fund
Schedule of Portfolio Investments, continued
July 31, 2009
| | | | |
Principal
Amount ($) | | Security
Description | | Value ($) |
| U.S. Government Agency Mortgage-Backed Obligations (53.8%) |
Federal Home Loan Mortgage Corp. (34.9%) |
| 430,586 | | 5.00%, 1/1/19 | | 452,501 |
| 858,746 | | 4.50%, 4/1/19 | | 895,877 |
| 750,747 | | 4.50%, 12/1/19 | | 780,862 |
| 648,665 | | 6.00%, 6/1/21 | | 688,273 |
| 1,018,359 | | 5.14% (a), 11/1/35 | | 1,067,908 |
| 1,031,643 | | 6.50%, 9/1/36 | | 1,102,054 |
| 4,321,762 | | 5.50%, 11/1/36 | | 4,483,893 |
| 6,232,356 | | 5.00%, 12/1/36 | | 6,387,003 |
| 2,458,516 | | 6.50%, 8/1/38 | | 2,625,790 |
| 1,690,176 | | 6.00%, 9/1/38 | | 1,773,295 |
| | | | |
| | | | 20,257,456 |
| | | | |
Federal National Mortgage Assoc. (18.9%) |
| 441,744 | | 5.00%, 5/1/19 | | 463,951 |
| 5,863,936 | | 5.50%, 2/1/36 | | 6,087,587 |
| 1,071,965 | | 6.50%, 6/1/36 | | 1,148,597 |
| 3,063,888 | | 5.48% (a), 4/1/37 | | 3,219,597 |
| | | | |
| | | | 10,919,732 |
| | | | |
Total U.S. Government Agency Mortgage-Backed Obligations (Cost $30,167,671) | | 31,177,188 |
| | | | |
| U.S. Government Agencies (4.8%) |
Federal Home Loan Bank (1.0%) |
| 550,000 | | 4.75%, 3/5/12 | | 593,981 |
| | | | |
Federal Home Loan Mortgage Corp. (2.4%) |
| 300,000 | | 3.50%, 5/29/13 | | 313,413 |
| 1,000,000 | | 3.75%, 6/28/13 | | 1,054,165 |
| | | | |
| | | | 1,367,578 |
| | | | |
Federal National Mortgage Assoc. (1.4%) |
| 750,000 | | 4.38%, 9/15/12 | | 804,229 |
| | | | |
Total U.S. Government Agencies (Cost $2,697,389) | | 2,765,788 |
| | | | |
| | | | |
Shares or
Principal
Amount ($) | | Security
Description | | Value ($) |
| U.S. Treasury Obligations (18.9%) |
U.S. Treasury Notes (18.9%) |
| 50,000 | | 2.13%, 4/30/10 | | 50,670 |
| 45,000 | | 3.88%, 5/15/10 | | 46,223 |
| 50,000 | | 3.63%, 6/15/10 | | 51,397 |
| 1,400,000 | | 1.13%, 12/15/11 | | 1,394,095 |
| 1,175,000 | | 1.13%, 1/15/12 | | 1,168,667 |
| 1,475,000 | | 4.63%, 2/29/12 | | 1,596,227 |
| 400,000 | | 2.50%, 3/31/13 | | 408,125 |
| 3,700,000 | | 3.38%, 6/30/13 | | 3,884,711 |
| 800,000 | | 4.25%, 8/15/13 | | 866,501 |
| 1,000,000 | | 2.25%, 5/31/14 | | 989,293 |
| 465,000 | | 4.13%, 5/15/15 | | 497,405 |
| | | | |
| | | | 10,953,314 |
| | | | |
Total U.S. Treasury Obligations (Cost $10,716,503) | | 10,953,314 |
| | | | |
| Investment Companies (1.2%) |
| 129,702 | | Dreyfus Cash Management, Institutional Shares, 0.33% (b) | | 129,702 |
| 571,144 | | Victory Federal Money Market Fund, Investor Shares, 0.01% (b) | | 571,144 |
| | | | |
Total Investment Companies (Cost $700,846) | | 700,846 |
| | | | |
Total Investments (Cost $56,104,473)—99.6% | | 57,752,278 |
Other assets in excess of liabilities—0.4% | | 219,475 |
| | | | |
Net Assets—100.0% | | 57,971,753 |
| | | | |
| (a) | Rate periodically changes. Rate disclosed is the rate in effect on July 31, 2009. |
| (b) | Rate periodically changes. Rate disclosed is the daily yield on July 31, 2009. |
LLC—Limited Liability Co.
LP—Limited Partnership
MTN—Medium Term Note
PLC—Public Liability Co.
See notes to financial statements.
71
PACIFIC CAPITAL FUNDS
Tax-Free Short Intermediate Securities Fund
Schedule of Portfolio Investments
July 31, 2009
| | | | |
Principal
Amount ($) | | Security
Description | | Value ($) |
| Municipal Bonds (80.5%) | | |
Arizona (0.7%) | | |
| 500,000 | | Vistancia Community Facilities District GO, 4.00%, 7/15/13 | | 474,225 |
| | | | |
Colorado (2.5%) | | |
| 525,000 | | Arapahoe County Colorado School District No. 5 Cherry Creek GO, 3.00%, 12/15/09 | | 529,725 |
| 1,000,000 | | Pueblo West Metropolitan District Water & Waste Water Revenue, 5.25%, 12/15/25, Prerefunded 12/15/10 @ 100, NATL-RE | | 1,063,780 |
| | | | |
| | | | 1,593,505 |
| | | | |
Florida (1.3%) | | |
| 755,000 | | Highlands County Florida Health Facilities Authority Revenue, Series G, 5.00%, 11/15/11, Unrefunded Portion | | 787,125 |
| 25,000 | | Highlands County Florida Health Facilities Authority Revenue, Series G, 5.00%, 11/15/11, ETM | | 27,252 |
| | | | |
| | | | 814,377 |
| | | | |
Georgia (2.6%) | | |
| 500,000 | | Georgia State GO, Series C, 5.50%, 7/1/12 | | 565,040 |
| 1,000,000 | | Metropolitan Atlanta Rapid Transit Authority Georgia Sales Tax Revenue, Series A, 5.00%, 7/1/12, AMBAC | | 1,103,340 |
| | | | |
| | | | 1,668,380 |
| | | | |
Guam (2.5%) | | |
| 1,350,000 | | Guam Economic Development Authority, Capital Appreciation, CAB, Series B, 5.40%, 5/15/15 | | 1,579,945 |
| | | | |
Hawaii (48.8%) | | |
| 450,000 | | Hawaii Airport System Revenue, Second Series, AMT, 6.90%, 7/1/12, ETM, MBIA | | 477,198 |
| 1,000,000 | | Hawaii County GO, Series A, 4.00%, 7/15/10 | | 1,030,810 |
| 1,580,000 | | Hawaii County GO, Series A, 5.00%, 7/15/10, AMBAC | | 1,640,467 |
| 660,000 | | Hawaii State Airports System Revenue, Second Series, AMT, 6.90%, 7/1/12, ETM | | 699,890 |
| 2,500,000 | | Hawaii State Department of Budget & Finance, Special Purpose Revenue, Series B, 0.42% (a), 7/1/29, Bank of America N.A. | | 2,500,000 |
| 1,630,000 | | Hawaii State GO, Series CM, 6.00%, 12/1/11, FGIC | | 1,820,188 |
| 1,000,000 | | Hawaii State GO, Series CU, 5.75%, 10/1/10, MBIA | | 1,059,930 |
| 1,550,000 | | Hawaii State GO, Series CV, 5.50%, 8/1/10, FGIC | | 1,627,299 |
| | | | |
Principal
Amount ($) | | Security
Description | | Value ($) |
| Municipal Bonds, continued | | |
Hawaii, continued | | |
| 1,500,000 | | Hawaii State GO, Series CX, 5.50%, 2/1/15, Prerefunded 2/1/12 @ 100, FSA | | 1,671,015 |
| 1,500,000 | | Hawaii State GO, Series CY, 5.75%, 2/1/13, FSA | | 1,721,415 |
| 1,000,000 | | Hawaii State GO, Series CZ, 5.25%, 7/1/12, FSA | | 1,119,870 |
| 1,000,000 | | Hawaii State GO, Series CZ, 5.25%, 7/1/15, Prerefunded 7/1/12 @ 100, FSA | | 1,123,970 |
| 1,000,000 | | Hawaii State GO, Series DG, 5.00%, 7/1/13, AMBAC | | 1,131,460 |
| 1,000,000 | | Hawaii State GO, Series DQ, 4.00%, 6/1/13 | | 1,092,120 |
| 1,000,000 | | Hawaii State GO, Series DR, 4.00%, 6/1/14 | | 1,090,520 |
| 830,000 | | Hawaii State Harbor System Revenue, Series A, AMT, 4.50%, 7/1/10, FSA | | 853,140 |
| 400,000 | | Hawaii State Highway Revenue, 5.25%, 7/1/12, Prerefunded 7/1/11 @100, FSA | | 435,268 |
| 1,055,000 | | Hawaii State Housing & Community Development Revenue, Series A, 3.70%, 7/1/13, FSA | | 1,067,808 |
| 800,000 | | Honolulu City & County GO, Series B, 5.25%, 10/1/12, ETM | | 904,272 |
| 1,000,000 | | Honolulu City & County GO, Series B, 5.50%, 7/1/13, FSA | | 1,149,530 |
| 1,000,000 | | Honolulu City & County Waste Water System Revenue, 5.25%, 7/1/15, Callable 8/31/09 @ 101, FGIC | | 1,011,490 |
| 2,000,000 | | Honolulu City & County Waste Water System Revenue, 5.25%, 7/1/18, Callable 8/31/09 @ 101, FGIC | | 2,022,300 |
| 2,000,000 | | State of Hawaii GO, Series DG, 5.00%, 7/1/12, AMBAC | | 2,222,420 |
| 1,090,000 | | University of Hawaii System Revenue, Series A, 5.50%, 7/15/16, Prerefunded 7/15/12 @ 100, FGIC | | 1,233,324 |
| | | | |
| | | | 30,705,704 |
| | | | |
Illinois (2.5%) | | |
| 500,000 | | Chicago Illinois Midway Airport Revenue, Series B, 5.00%, 1/1/12, AMBAC | | 519,135 |
| 1,000,000 | | Illinois State GO, 5.25%, 8/1/10, MBIA | | 1,039,290 |
| | | | |
| | | | 1,558,425 |
| | | | |
Kansas (0.7%) | | |
| 450,000 | | Wyandotte County Kansas City Unified Government Utility System Revenue, 5.13%, 9/1/13, Callable 9/8/09 @ 101, MBIA | | 453,398 |
| | | | |
See notes to financial statements.
72
PACIFIC CAPITAL FUNDS
Tax-Free Short Intermediate Securities Fund
Schedule of Portfolio Investments, continued
July 31, 2009
| | | | |
Principal
Amount ($) | | Security
Description | | Value ($) |
| Municipal Bonds, continued | | |
Michigan (1.2%) | | |
| 750,000 | | Michigan State Hospital Finance Authority Revenue, 5.50%, 11/1/12 | | 778,493 |
| | | | |
Minnesota (2.6%) | | |
| 1,500,000 | | Minnesota State GO, 5.00%, 8/1/16, Callable 8/1/12 @ 100 | | 1,622,655 |
| | | | |
New York (3.4%) | | |
| 1,000,000 | | New York State Thruway Authority Revenue, Highway & Bridge Trust Fund, Series B, 5.25%, 4/1/12, AMBAC | | 1,100,270 |
| 1,000,000 | | New York, New York GO, Series C, 4.25%, 1/1/12 | | 1,059,360 |
| | | | |
| | | | 2,159,630 |
| | | | |
Oklahoma (2.1%) | | |
| 1,345,000 | | Tulsa Oklahoma Industrial Authority Educational Facilities Revenue, Series B, 5.00%, 12/1/14, Callable 12/1/09 @ 100 | | 1,353,769 |
| | | | |
Pennsylvania (1.8%) | | |
| 1,030,000 | | Philadelphia Water & Waste Water Revenue, Series B, 5.50%, 11/1/11, FGIC | | 1,112,761 |
| | | | |
Puerto Rico (3.2%) | | |
| 1,200,000 | | Puerto Rico Commonwealth Aqueduct & Sewer Authority Revenue, 6.25%, 7/1/13, MBIA | | 1,424,964 |
| 500,000 | | Puerto Rico Commonwealth Highway & Transportation Authority Revenue, Series D, 5.75%, 7/1/41, Prerefunded 7/1/12 @ 100 | | 560,795 |
| | | | |
| | | | 1,985,759 |
| | | | |
| | | | |
Shares or
Principal
Amount ($) | | Security
Description | | Value ($) |
| Municipal Bonds, continued | | |
Tennessee (2.9%) | | |
| 480,000 | | Sullivan County Tennessee Health Educational & Housing Facilities Board Revenue, Wellmont Health Systems Project, 6.25%, 9/1/32, Prerefunded 9/1/12 @ 101 | | 554,203 |
| 1,135,000 | | Wilson County Tennessee GO, 5.00%, 4/1/12, MBIA | | 1,248,943 |
| | | | |
| | | | 1,803,146 |
| | | | |
Washington (1.7%) | | |
| 1,000,000 | | Washington State Health Care Facilities Authority Revenue, Providence Health System, Series A, 5.63%, 10/1/14, Callable 10/1/11 @ 100, MBIA | | 1,048,580 |
| | | | |
Total Municipal Bonds (Cost $49,326,058) | | 50,712,752 |
| | | | |
| Investment Companies (19.3%) | | |
| 12,131,303 | | Dreyfus Tax Exempt Cash Management Fund, Institutional Shares, 0.25% (b) | | 12,131,303 |
| | | | |
Total Investment Companies (Cost $12,131,303) | | 12,131,303 |
| | | | |
Total Investments (Cost $61,457,361)—99.8% | | 62,844,055 |
Other assets in excess of liabilities—0.2% | | 109,830 |
| | | | |
Net Assets—100.0% | | 62,953,885 |
| | | | |
| (a) | Rate periodically changes. Rate disclosed is the rate in effect on July 31, 2009. |
| (b) | Rate periodically changes. Rate disclosed is the daily yield on July 31, 2009. |
AMBAC—Insured by American Municipal Bond Assurance Corp.
AMT—Subject to alternative minimum tax
CAB—Capital Appreciation Bond
ETM—Escrowed to Maturity
FGIC—Insured by Financial Guaranty Insurance Co.
FSA—Insured by Federal Security Assurance
GO—General Obligation
MBIA—Insured by Municipal Bond Insurance Association
NATL-RE—Insured by National Reinsurance Corp.
See notes to financial statements.
73
PACIFIC CAPITAL FUNDS
U.S. Government Short Fixed Income Fund
Schedule of Portfolio Investments
July 31, 2009
| | | | |
Principal
Amount ($) | | Security
Description | | Value ($) |
| U.S. Government Agencies (49.8%) |
Federal Home Loan Mortgage Corp. (19.2%) | | |
| 4,400,000 | | 5.13%, 4/18/11 | | 4,699,130 |
| 1,050,000 | | 2.38%, 2/24/12, Callable 2/24/10 @ 100 | | 1,056,725 |
| 7,000,000 | | 5.13%, 7/15/12 | | 7,669,403 |
| | | | |
| | | | 13,425,258 |
| | | | |
Federal National Mortgage Assoc. (30.6%) | | |
| 800,000 | | 0.40% (a), 2/1/10 | | 798,888 |
| 1,690,000 | | 4.30%, 2/17/10 | | 1,722,059 |
| 1,000,000 | | 4.40%, 3/8/10 | | 1,022,286 |
| 8,000,000 | | 4.13%, 5/15/10 | | 8,225,528 |
| 2,800,000 | | 5.00%, 10/15/11 | | 3,027,231 |
| 50,000 | | 2.00%, 1/27/12, Callable 7/27/10 @ 100 | | 50,201 |
| 6,000,000 | | 4.75%, 11/19/12 | | 6,531,828 |
| | | | |
| | | | 21,378,021 |
| | | | |
Total U.S. Government Agencies
(Cost $34,663,094) | | 34,803,279 |
| | | | |
| U.S. Treasury Obligations (49.5%) |
U.S. Treasury Bills (4.1%) (a) |
| 355,000 | | 0.23%, 8/6/09 | | 354,992 |
| 325,000 | | 0.33%, 8/20/09 | | 324,977 |
| 325,000 | | 0.40%, 9/10/09 | | 324,955 |
| 900,000 | | 0.47%, 10/22/09 | | 899,666 |
| 300,000 | | 0.55%, 11/19/09 | | 299,834 |
| 620,000 | | 0.28%, 2/11/10 | | 619,107 |
| | | | |
| | | | 2,823,531 |
| | | | |
| | | | |
Shares or
Principal
Amount ($) | |
Security
Description | | Value ($) |
| U.S. Treasury Obligations (continued) |
U.S. Treasury Notes (45.4%) |
| 3,800,000 | | 4.88%, 8/15/09 | | 3,807,446 |
| 1,300,000 | | 3.13%, 11/30/09 | | 1,312,442 |
| 2,800,000 | | 2.00%, 2/28/10 | | 2,827,672 |
| 3,800,000 | | 2.13%, 4/30/10 | | 3,850,916 |
| 1,500,000 | | 2.63%, 5/31/10 | | 1,527,540 |
| 200,000 | | 4.13%, 8/15/10 | | 207,477 |
| 4,865,000 | | 2.38%, 8/31/10 | | 4,962,110 |
| 2,850,000 | | 2.00%, 9/30/10 | | 2,897,427 |
| 2,800,000 | | 4.88%, 7/31/11 | | 3,007,376 |
| 2,675,000 | | 4.63%, 8/31/11 | | 2,864,759 |
| 1,500,000 | | 1.75%, 11/15/11 | | 1,516,295 |
| 345,000 | | 1.13%, 12/15/11 | | 343,545 |
| 2,675,000 | | 1.13%, 1/15/12 | | 2,660,582 |
| | | | |
| | | | 31,785,587 |
| | | | |
Total U.S. Treasury Obligations
(Cost $34,249,126) | | 34,609,118 |
| | | | |
| Investment Companies (0.4%) |
| 238,684 | | Cavanal Hill U.S. Treasury Fund, Administrative Class, 0.01% (b) | | 238,684 |
| | | | |
Total Investment Companies (Cost $238,684) | | 238,684 |
| | | | |
Total Investments (Cost $69,150,904)—99.7% | | 69,651,081 |
Other assets in excess of liabilities—0.3% | | 234,424 |
| | | | |
Net Assets—100.0% | | 69,885,505 |
| | | | |
| (a) | Rate disclosed represents the effective yield at purchase. |
| (b) | Rate periodically changes. Rate disclosed is the daily yield on July 31, 2009. |
See notes to financial statements.
74
PACIFIC CAPITAL FUNDS
Notes to Financial Statements
July 31, 2009
Pacific Capital Funds (the “Trust”) was organized on October 30, 1992 and is registered under the Investment Company Act of 1940, as amended (the “1940 Act”), as an open-end management investment company established as a Massachusetts business trust. The Trust currently consists of the following investment portfolios (collectively, the “Funds” and individually, a “Fund”): New Asia Growth Fund, International Stock Fund, Small Cap Fund, Mid-Cap Fund, Growth Stock Fund, Growth and Income Fund, Value Fund, High Grade Core Fixed Income Fund, Tax-Free Securities Fund, High Grade Short Intermediate Fixed Income Fund, Tax-Free Short Intermediate Securities Fund and U.S. Government Short Fixed Income Fund. The Trust is authorized to issue an unlimited number of shares without par value in four classes of shares: Class A, Class B, Class C and Class Y. The sale of Class B Shares has been suspended since June 1, 2003 (except for reinvestment of dividends and exchanges of Class B Shares between Funds) and the offering of Class C Shares was suspended on May 1, 2009 (except for reinvestment of dividends and exchanges of Class C Shares between Funds).
The assets of each Fund are segregated and a shareholder’s interest is limited to the Fund in which shares are held. Each class of shares has identical rights and privileges except with respect to the fees paid under distribution (12b-1) plans, voting rights on matters affecting a single class of shares, sales charges and exchange privileges. The Class A Shares of the New Asia Growth Fund, International Stock Fund, Small Cap Fund, Mid-Cap Fund, Growth Stock Fund, Growth and Income Fund and Value Fund have a maximum sales charge on purchases of 5.25% of the purchase price; the Class A Shares of the High Grade Core Fixed Income Fund and Tax-Free Securities Fund have a maximum sales charge on purchases of 4.00% of the purchase price; and the Class A Shares of the High Grade Short Intermediate Fixed Income Fund, Tax-Free Short Intermediate Securities Fund and U.S. Government Short Fixed Income Fund have a maximum sales charge on purchases of 2.25% of the purchase price. The Class B Shares have a contingent deferred sales charge (“CDSC”) of 5.00% as a percentage of original purchase price or sale price (whichever is less) if redeemed before the sixth anniversary of purchase, declining from 5.00% within the first year to 0% after the sixth year. The Class C Shares have a CDSC of 1.00% as a percentage of the original purchase price or sales price (whichever is less) if redeemed within twelve months of purchase.
Under the Trust’s organizational documents, its officers and trustees are indemnified against certain liabilities arising out of the performance of their duties to the Trust. In addition, in the normal course of business, the Trust may enter into contracts with its vendors and others that provide for general indemnifications. The Trust’s maximum exposure under these arrangements is unknown as this would involve future claims that may be made against the Trust.
| 2. | | Significant Accounting Policies |
The following is a summary of significant accounting policies followed by the Trust in the preparation of its financial statements. The policies are in conformity with United States generally accepted accounting principles (“GAAP”). The preparation of financial statements requires management to make estimates and assumptions that affect the reported amounts of assets and liabilities, the disclosure of contingent assets and liabilities at the date of the financial statements and the reported amounts of income and expenses for the period. Actual results could differ from those estimates.
Securities Valuation:
Investments in securities, the principal market for which is a securities exchange or an over-the-counter market, are valued at their latest available sale price (except for those securities that are traded on NASDAQ, which are valued at the NASDAQ official closing price) or in the absence of such a price, by reference to the latest available mean of the bid and asked quotations in the principal market in which such securities are normally traded. Investments in securities in which the principal market is not an exchange or an over-the-counter market are valued using an independent pricing service approved by the Board of Trustees (the “Board”). Such prices reflect fair values, which may be established through the use of electronic and matrix techniques. Short-term obligations that mature in 60 days or less and are of sufficient credit quality, are valued at amortized cost or original cost plus interest, which approximates fair value. Investments in
75
PACIFIC CAPITAL FUNDS
Notes to Financial Statements, continued
July 31, 2009
open-end investment companies are valued at their respective net asset value as reported by such companies. The differences between cost and fair value of investments are reflected as either unrealized appreciation or depreciation.
In cases where market prices for portfolio securities are not readily available, a Pricing Committee established and appointed by the Trust’s Board determines in good faith, subject to Trust procedures, the fair value of such portfolio securities. In addition, if events materially affecting the value of foreign securities occur between the time when the exchange on which they are traded closes and the time when the Fund’s net asset value is calculated, such securities may be valued at fair value in accordance with procedures adopted by the Board. In the event of an increase or decrease in the value of a designated benchmark index greater than predetermined levels, the New Asia Growth Fund and International Stock Fund may use a systematic valuation model provided by an independent third party to fair value their international equity securities.
The Funds comply with Statement of Financial Accounting Standards (“SFAS”) No. 157, “Fair Value Measurements.” This standard established a single authoritative definition of fair value, sets out a framework for measuring fair value, and requires additional disclosures about fair value measurements. One key component of the implementation of SFAS 157 included the development of a three-tier fair value hierarchy. The basis of the tiers is dependant upon the various “inputs” used to determine the value of the Funds’ investments. These inputs are summarized in the three broad levels listed below:
| | • | | Level 1—quoted prices in active markets for identical assets. |
| | • | | Level 2—other significant observable inputs (including quoted prices for similar securities, interest rates, prepayment speeds, credit risk, etc.). |
| | • | | Level 3—significant unobservable inputs (including the Fund’s own assumptions in determining the fair value of investments). |
The inputs or methodology used for valuing securities are not necessarily an indication of the risk associated with investing in those securities.
The following is a summary of the inputs used to value the Funds’ investments as of July 31, 2009, while the breakdown, by category, of common stocks is disclosed on each Fund’s Schedule of Portfolio Investments:
| | | | | | | | | | | | | | | | | | | | |
| | | LEVEL 1—Quoted Prices | | | LEVEL 2—Other
Significant Observable
Inputs | | Total | |
Fund Name | | Investments
in Securities | | Other
Financial
Investments* | | | Investments
in Securities | | Other
Financial
Investments* | | Investments
in Securities | | Other
Financial
Investments* | |
New Asia Growth Fund | | | | | | | | | | | | | | | | | |
Common Stocks | | $ | 78,656,602 | | $ | — | | | $ | — | | $ | — | | $ | 78,656,602 | | $ | — | |
Investment Companies | | | 1,213,060 | | | — | | | | — | | | — | | | 1,213,060 | | | — | |
| | | | | | | | | | | | | | | | | | | | |
Total | | | 79,869,662 | | | — | | | | — | | | — | | | 79,869,662 | | | — | |
International Stock Fund | | | | | | | | | | | | | | | | | |
Common Stocks | | | 80,181,901 | | | — | | | | — | | | — | | | 80,181,901 | | | — | |
Exchange Traded Funds | | | 101,003 | | | — | | | | — | | | — | | | 101,003 | | | — | |
Rights | | | — | | | — | | | | 12,005 | | | — | | | 12,005 | | | — | |
Forward Foreign Exchange Contracts | | | — | | | (1,833 | ) | | | — | | | — | | | — | | | (1,833 | ) |
| | | | | | | | | | | | | | | | | | | | |
Total | | | 80,282,904 | | | (1,833 | ) | | | 12,005 | | | — | | | 80,294,909 | | | (1,833 | ) |
Small Cap Fund | | | | | | | | | | | | | | | | | |
Common Stocks | | | 132,305,177 | | | — | | | | — | | | — | | | 132,305,177 | | | — | |
Cash Equivalents | | | — | | | — | | | | 1,052,444 | | | — | | | 1,052,444 | | | — | |
| | | | | | | | | | | | | | | | | | | | |
Total | | | 132,305,177 | | | — | | | | 1,052,444 | | | — | | | 133,357,621 | | | — | |
Mid-Cap Fund | | | | | | | | | | | | | | | | | |
Common Stocks | | | 31,966,197 | | | — | | | | — | | | — | | | 31,966,197 | | | — | |
Investment Companies | | | 257,819 | | | — | | | | — | | | — | | | 257,819 | | | — | |
| | | | | | | | | | | | | | | | | | | | |
Total | | | 32,224,016 | | | — | | | | — | | | — | | | 32,224,016 | | | — | |
76
PACIFIC CAPITAL FUNDS
Notes to Financial Statements, continued
July 31, 2009
| | | | | | | | | | | | | | | | | | |
| | | LEVEL 1—Quoted Prices | | LEVEL 2—Other Significant
Observable Inputs | | Total |
Fund Name | | Investments
in Securities | | Other
Financial
Investments* | | Investments
in Securities | | Other
Financial
Investments* | | Investments
in Securities | | Other
Financial
Investments* |
Growth Stock Fund | | | | | | | | | | | | | | | |
Common Stocks | | $ | 75,271,175 | | $ | — | | $ | — | | $ | — | | $ | 75,271,175 | | $ | — |
Investment Companies | | | 770,561 | | | — | | | — | | | — | | | 770,561 | | | — |
| | | | | | | | | | | | | | | | | | |
Total | | | 76,041,736 | | | — | | | — | | | — | | | 76,041,736 | | | — |
Growth and Income Fund | | | | | | | | | | | | | | | |
Common Stocks | | | 68,706,348 | | | — | | | — | | | — | | | 68,706,348 | | | — |
Investment Companies | | | 725,807 | | | — | | | — | | | — | | | 725,807 | | | — |
| | | | | | | | | | | | | | | | | | |
Total | | | 69,432,155 | | | — | | | — | | | — | | | 69,432,155 | | | — |
Value Fund | | | | | | | | | | | | | | | |
Common Stocks | | | 63,748,296 | | | — | | | — | | | — | | | 63,748,296 | | | — |
Investment Companies | | | 517,585 | | | — | | | — | | | — | | | 517,585 | | | — |
| | | | | | | | | | | | | | | | | | |
Total | | | 64,265,881 | | | — | | | — | | | — | | | 64,265,881 | | | — |
High Grade Core Fixed Income Fund | | | | | | | | | | | | | | | | | | |
Corporate Bonds | | | — | | | — | | | 67,047,740 | | | — | | | 67,047,740 | | | — |
U.S. Government Agency Mortgage-Backed Obligations | | | — | | | — | | | 79,139,277 | | | — | | | 79,139,277 | | | — |
U.S. Treasury Obligations | | | — | | | — | | | 40,856,784 | | | — | | | 40,856,784 | | | — |
U.S. Government Agencies | | | — | | | — | | | 12,135,096 | | | — | | | 12,135,096 | | | — |
Municipal Bonds | | | — | | | — | | | 1,431,432 | | | — | | | 1,431,432 | | | — |
Investment Companies | | | 623,666 | | | — | | | — | | | — | | | 623,666 | | | — |
| | | | | | | | | | | | | | | | | | |
Total | | | 623,666 | | | — | | | 200,610,329 | | | — | | | 201,233,995 | | | — |
Tax-Free Securities Fund | | | | | | | | | | | | | | | |
Municipal Bonds | | | — | | | — | | | 225,996,643 | | | — | | | 225,996,643 | | | — |
Investment Companies | | | 10,229,911 | | | — | | | — | | | — | | | 10,229,911 | | | — |
| | | | | | | | | | | | | | | | | | |
Total | | | 10,229,911 | | | — | | | 225,996,643 | | | — | | | 236,226,554 | | | — |
High Grade Short Intermediate Fixed Income Fund | | | | | | | | | | | | | | | | | | |
Corporate Bonds | | | — | | | — | | | 12,155,142 | | | — | | | 12,155,142 | | | — |
U.S. Government Agency Mortgage-Backed Obligations | | | — | | | — | | | 31,177,188 | | | — | | | 31,177,188 | | | — |
U.S. Treasury Obligations | | | — | | | — | | | 10,953,314 | | | — | | | 10,953,314 | | | — |
U.S. Government Agencies | | | — | | | — | | | 2,765,788 | | | — | | | 2,765,788 | | | — |
Investment Companies | | | 700,846 | | | — | | | — | | | — | | | 700,846 | | | — |
| | | | | | | | | | | | | | | | | | |
Total | | | 700,846 | | | — | | | 57,051,432 | | | — | | | 57,752,278 | | | — |
Tax-Free Short Intermediate Securities Fund | | | | | | | | | | | | | | | | | | |
Municipal Bonds | | | — | | | — | | | 50,712,752 | | | — | | | 50,712,752 | | | — |
Investment Companies | | | 12,131,303 | | | — | | | — | | | — | | | 12,131,303 | | | — |
| | | | | | | | | | | | | | | | | | |
Total | | | 12,131,303 | | | — | | | 50,712,752 | | | — | | | 62,844,055 | | | — |
U.S. Government Short Fixed Income Fund | | | | | | | | | | | | | | | | | | |
U.S. Treasury Obligations | | | — | | | — | | | 34,609,118 | | | — | | | 34,609,118 | | | — |
U.S. Government Agencies | | | — | | | — | | | 34,803,279 | | | — | | | 34,803,279 | | | — |
Investment Companies | | | 238,684 | | | — | | | — | | | — | | | 238,684 | | | — |
| | | | | | | | | | | | | | | | | | |
Total | | | 238,684 | | | — | | | 69,412,397 | | | — | | | 69,651,081 | | | — |
| * | Other financial investments are derivative instruments not reflected in the Schedule of Portfolio Investments, such as futures or forward foreign currency contracts, which are valued at the unrealized appreciation/(depreciation) on the investment. |
77
PACIFIC CAPITAL FUNDS
Notes to Financial Statements, continued
July 31, 2009
Derivative Instruments:
Certain of the Funds may be subject to equity price risk and forward foreign currency exchange risk in the normal course of pursuing investment objectives. Certain of the Funds may invest in various financial instruments including positions in futures and forward currency contracts to gain exposure to or hedge against changes in the value of equities or foreign currencies.
All open derivative positions at period end are reflected for each Fund in the tables below, and the volume of these open positions relative to each Fund’s net assets is generally representative of the volume of open positions throughout the reporting period. The following is a description of the derivative instruments utilized by the Funds, including the primary underlying risk exposure related to each instrument type.
Foreign Currency Transactions:
The accounting records of the Trust are maintained in U.S. dollars. Investment securities and other assets and liabilities of a Fund denominated in a foreign currency are translated into U.S. dollars at current exchange rates. Purchases and sales of securities, income receipts and expense payments are translated into U.S. dollars at the exchange rates on the dates of the transactions.
The Funds do not isolate the portion of operations resulting from changes in foreign exchange rates on investments from fluctuations arising from changes in market prices of securities held. Such changes are included with the net realized and unrealized gain or loss from investments and foreign currency transactions.
Reported net realized foreign currency exchange gains or losses arise from sales and maturities of portfolio securities, sales of foreign currencies, currency exchange fluctuations between the trade and settlement dates of securities transactions, and the differences between the amounts of assets and liabilities recorded and the U.S. dollar equivalents of the amounts actually received or paid. Net unrealized foreign currency appreciation or depreciation arises from changes in the values of assets and liabilities, including investments in securities, resulting from changes in currency exchange rates.
Foreign Currency Contracts:
The New Asia Growth Fund, International Stock Fund and Small Cap Fund may enter into foreign currency exchange contracts to convert U.S. dollars to and from various foreign currencies. A foreign currency exchange contract is an obligation by a Fund to purchase or sell a specific foreign currency at a future date at a price (in U.S. dollars) set at the time of the contract. The Funds do not engage in “cross-currency” foreign exchange contracts (i.e., contracts to purchase or sell one foreign currency in exchange for another foreign currency). The Funds’ foreign currency contracts might be considered spot contracts (typically a contract of one week or less) or forward contracts (typically a contract term over one week). A spot contract is entered into for purposes of hedging against foreign currency fluctuations relating to a specific portfolio transaction, such as the delay between a security transaction trade date and settlement date. Forward contracts are entered into for purposes of hedging portfolio holdings or concentrations of such holdings. The New Asia Growth Fund, International Stock Fund and Small Cap Fund enter into foreign currency exchange contracts solely for spot or forward hedging purposes, and not for speculative purposes (i.e., the Funds do not enter into such contracts solely for the purpose of earning foreign currency gains). Each foreign currency exchange contract is adjusted daily by the prevailing spot or forward rate of the underlying currency, and any appreciation or depreciation is recorded for financial statement purposes as unrealized until the contract settlement date, at which time the Fund records realized gains or losses equal to the difference between the value of the contract at the time it was opened and the value at the time it was closed. A Fund could be exposed to risk if a counterparty is unable to meet the terms of a forward foreign exchange currency contract or if the value of the foreign currency changes unfavorably. In addition, the use of forward currency contracts does not eliminate fluctuations in the underlying prices of the securities.
78
PACIFIC CAPITAL FUNDS
Notes to Financial Statements, continued
July 31, 2009
Futures Contracts:
Each of the Funds (other than the U.S. Government Short Fixed Income Fund) may enter into contracts for the future delivery of specific securities, classes of securities, and financial indices; may purchase or sell exchange-listed or OTC options on any such futures contracts; and may engage in related closing transactions. A financial futures contract is an agreement to purchase or sell an agreed amount of securities or currency at a set price for delivery in the future. A futures contract on a securities index is an agreement obligating either party to pay, and entitling the other party to receive, while the contract is outstanding, cash payments based on the level of a specified securities index. The acquisition of put and call options on futures contracts will, respectively, give the Fund the right (but not the obligation), for a specified price, to sell or to purchase the underlying futures contract, upon exercise of the option, at any time during the option period.
The Small Cap Fund has entered into futures contracts for hedging purposes, such as to protect against anticipated declines in the fair value of its portfolio securities or to manage exposure to changing interest rates. The Fund receives from or pays to the broker, on a daily basis, an amount of cash equal to the daily fluctuation in value of the contract. Such receipts or payments are known as “variation margin,” and are recorded by the Fund as unrealized gains or losses. When a futures contract closes, the Fund records a realized gain or loss equal to the difference between the value of the contract at the time it was opened and the value at the time it was closed.
Effective February 1, 2009, the Funds adopted Financial Accounting Standards Board (“FASB”) SFAS No. 161 “Disclosures about Derivative Instruments and Hedging Activities” (“SFAS 161”) which is effective for fiscal years and interim periods beginning after November 15, 2008. SFAS 161 requires enhanced disclosures about the Funds’ derivative and hedging activities, including how such activities are accounted for and their effect on the Funds’ financial position, performance and cash flows.
Fair Value of Derivative Instruments as of July 31, 2009:
| | | | | | | | | | |
| | | Asset Derivatives | | Liability Derivatives |
Primary Risk Exposure | | Fund | | Statements of Assets
and Liabilities
Location | | Fair Value ($) | | Statements of Assets
and Liabilities
Location | | Fair Value ($) |
Forward Foreign Exchange Contracts | | International Stock Fund | | Unrealized appreciation on forward foreign currency exchange contracts | | 3 | | Unrealized depreciation on forward foreign currency exchange contracts | | 1,836 |
The effect of Derivative Instruments on the Statements of Operations for the period February 1, 2009 through July 31, 2009:
| | | | | | | | |
Primary Risk Exposure | | Fund | | Location of Gain (Loss) on
Derivatives Recognized in
Income | | Realized Gain (Loss) on
Derivatives Recognized
in Income ($) | | Change in Unrealized
Appreciation/Depreciation
on Derivatives Recognized
in Income ($) |
Forward Foreign Exchange Contracts | | International Stock Fund | | Net realized losses from investments and foreign currency transactions/change in unrealized appreciation/depreciation on investments and foreign currency transactions | | (79,130) | | (1,833) |
79
PACIFIC CAPITAL FUNDS
Notes to Financial Statements, continued
July 31, 2009
| | | | | | | | |
Primary Risk Exposure | | Fund | | Location of Gain (Loss) on
Derivatives Recognized in
Income | | Realized Gain (Loss) on
Derivatives Recognized
in Income ($) | | Change in Unrealized
Appreciation/Depreciation
on Derivatives Recognized
in Income ($) |
Equity Contracts | | Small Cap Fund | | Net realized losses from futures transactions/change in unrealized appreciation/ depreciation on investments and foreign currency transactions | | 12,822 | | — |
In September 2008, FASB issued Staff Position No. FAS 133-1 and FIN 45-4, “Disclosure and Credit Derivatives and Certain Guarantees: An Amendment of FASB Statement No. 133 and FASB Interpretation No. 45; and Clarification of the Effective Date of FASB Statement No. 161 (“FAS 133-1 and FIN 45-4”). FAS 133-1 and FIN 45-4 are effective for fiscal years and interim periods ending after November 15, 2008. FAS 133-1 and FIN 45-4 required enhanced disclosures by sellers of credit derivatives and certain guarantees, including the nature of these derivatives, approximate terms, reasons for entering into these instruments, and status of payment/performance risk. The Funds were not impacted by the adoption of these standards.
Restricted Securities:
A restricted security is a security which has been purchased through a private offering and cannot be resold to the general public without prior registration under the Securities Act of 1933, as amended (the “1933 Act”), or pursuant to the resale limitations provided by Rule 144A under the 1933 Act or an exemption from the registration requirements of the 1933 Act. Whether a restricted security is illiquid is determined pursuant to guidelines established by the Board. Not all restricted securities are considered illiquid. At July 31, 2009, the following Funds held liquid restricted securities as detailed below:
| | | | | | | | |
Issue Description | | Acquisition
Date | | Shares or
Principal
Amount ($) | | Cost ($) | | Value ($) |
International Stock Fund | | | | | | | | |
Groupe DANONE | | 6/15/09 | | 2,804 | | 95,652 | | 150,428 |
Renewable Energy Corp. AS | | * | | 36,513 | | 163,637 | | 290,052 |
High Grade Core Fixed Income Fund | | | | | | | | |
Verizon Wireless Capital, 3.75%, 5/20/11 | | 5/19/09 | | 2,000,000 | | 1,998,400 | | 2,061,110 |
| | * | Purchased on 5/7/09 and 7/14/09. |
Security Transactions and Related Income:
During the period, security transactions are accounted for no later than one business day following the trade date. For financial reporting purposes, however, security transactions are accounted for on the trade date if the trade was on the last business day of the reporting period. Interest income is recognized on the accrual basis and includes, where applicable, the pro rata amortization of premium or accretion of discount. Dividend income is recorded on the ex-dividend date or as soon as information is readily available for foreign securities. Gains or losses realized from sales of securities are determined by comparing the identified cost of the security lot sold with the net sales proceeds.
Allocations:
Expenses that are directly related to a specific Fund are charged to that Fund. Class specific expenses, such as distribution fees, if any, are borne by that class. Other operating expenses of the Trust are pro-rated to the Funds on the basis of relative net assets or another appropriate basis.
80
PACIFIC CAPITAL FUNDS
Notes to Financial Statements, continued
July 31, 2009
Income, expenses (other than expenses attributable to a specific share class) and realized/unrealized gains or losses on investments are allocated to each class of shares based on its relative net assets or another appropriate basis.
Distributions to Shareholders:
Dividends from net investment income are declared daily and paid monthly for the High Grade Core Fixed Income Fund, Tax-Free Securities Fund, High Grade Short Intermediate Fixed Income Fund, Tax-Free Short Intermediate Securities Fund and U.S. Government Short Fixed Income Fund. Dividends from net investment income are declared and paid quarterly for the New Asia Growth Fund, International Stock Fund, Small Cap Fund, Mid-Cap Fund, Growth Stock Fund, Growth and Income Fund and Value Fund. Distributable net realized capital gains, if any, are declared and distributed at least annually for all the Funds.
Redemption Fees:
The New Asia Growth Fund and International Stock Fund may impose a redemption fee of 2.00% on redemptions and exchanges of Fund shares within 30 days from the date the Fund shares were acquired. Prior to October 16, 2007, the fee could be assessed on redemptions and exchanges of Fund shares within 90 days from the date the Fund shares were acquired. For financial statement purposes, these amounts are included in the Statements of Changes in Net Assets in “Proceeds from Shares Issued”. Redemption fees collected for the Funds for the years ended July 31, 2009 and July 31, 2008 were as follows:
| | | | |
| | | Year Ended
7/31/09 ($) | | Year Ended
7/31/08 ($) |
New Asia Growth Fund | | 469 | | 1,105 |
International Stock Fund | | 1,001 | | 2,369 |
Subsequent Events:
The Funds have evaluated subsequent events through September 25, 2009, which is the date these financial statements were issued and there are no subsequent events to report.
| 3. | | Purchases and Sales of Securities |
Purchases and sales of securities (excluding securities maturing less than one year from acquisition) for the year ended July 31, 2009 were as follows:
| | | | |
| | | Purchases ($) | | Sales ($) |
New Asia Growth Fund | | 29,068,199 | | 34,948,331 |
International Stock Fund | | 47,929,977 | | 101,563,916 |
Small Cap Fund | | 228,518,956 | | 313,400,639 |
Mid-Cap Fund | | 43,557,748 | | 51,012,631 |
Growth Stock Fund | | 76,937,935 | | 100,220,547 |
Growth and Income Fund | | 63,061,507 | | 79,316,221 |
Value Fund | | 71,755,903 | | 89,819,092 |
High Grade Core Fixed Income Fund | | 106,184,644 | | 189,309,744 |
Tax-Free Securities Fund | | 56,535,188 | | 94,525,611 |
High Grade Short Intermediate Fixed Income Fund | | 58,942,520 | | 66,570,107 |
Tax-Free Short Intermediate Securities Fund | | 20,658,459 | | 20,051,000 |
U.S. Government Short Fixed Income Fund | | 50,446,777 | | 46,264,285 |
81
PACIFIC CAPITAL FUNDS
Notes to Financial Statements, continued
July 31, 2009
Purchases and sales of long-term U.S. Government securities for the year ended July 31, 2009 were as follows:
| | | | |
| | | Purchases ($) | | Sales ($) |
High Grade Core Fixed Income Fund | | 64,433,543 | | 119,827,159 |
High Grade Short Intermediate Fixed Income Fund | | 55,609,593 | | 62,205,956 |
U.S. Government Short Fixed Income Fund | | 50,446,777 | | 46,264,285 |
| 4. | | Transactions with Affiliates |
Investment advisory services are provided to the Trust by the Asset Management Group of Bank of Hawaii (the “Adviser”). Under terms of an advisory agreement, each Fund is charged an annual fee which is computed daily and paid monthly based upon average daily net assets. The Adviser may voluntarily waive a portion of its fees. Voluntary waivers may be terminated at any time and are not subject to recoupment by the Adviser. Fee rates for the year ended July 31, 2009 were as follows:
| | | | | |
| | | Maximum Annual
Advisory Fee (%) | | Net Annual
Fees Paid After
Voluntary
Waivers (%) | |
New Asia Growth Fund | | 0.40 | | 0.40 | |
International Stock Fund | | 0.45 | | 0.35 | |
Small Cap Fund | | 0.46 | | 0.36 | 1 |
Mid-Cap Fund | | 0.60 | | 0.35 | |
Growth Stock Fund | | 0.55 | | 0.35 | |
Growth and Income Fund | | 0.55 | | 0.35 | |
Value Fund | | 0.55 | | 0.35 | |
High Grade Core Fixed Income Fund | | 0.60 | | 0.45 | |
Tax-Free Securities Fund | | 0.60 | | 0.45 | |
High Grade Short Intermediate Fixed Income Fund | | 0.50 | | 0.12 | |
Tax-Free Short Intermediate Securities Fund | | 0.50 | | 0.40 | |
U.S. Government Short Fixed Income Fund | | 0.40 | | 0.05 | |
| | 1 | The Adviser has voluntarily agreed to waive a portion of its fees for the Small Cap Fund so that the total combined advisory and sub-advisory fees will not exceed 1.00%. |
The following Funds have entered into Sub-Advisory contracts as listed below. Under the terms of each Sub-Advisory agreement, the Funds are charged the following annual fees in addition to the Advisory Fees by the Sub-Adviser based upon average daily net assets managed by the Sub-Adviser which are computed daily and paid quarterly:
| | | | |
| | | Sub-Adviser | | Annual Fees Paid |
New Asia Growth Fund | | First State Investments International Limited | | 0.50% |
| | |
International Stock Fund | | Hansberger Global Investors, Inc. | | 0.60% of the first $75 million; 0.35% in excess of $75 million |
| | |
Small Cap Fund | | Mellon Capital Management Corp. | | 0.55% of the first $100 million; 0.50% on assets between $100 million and $200 million; 0.45% on assets in excess of $200 million 1 |
| | Nicholas-Applegate Capital Management | | 0.70% 2 |
| | |
| | Wellington Management Company, LLP | | 0.70% of the first $150 million; 0.65% on assets in excess of $150 million 3 |
82
PACIFIC CAPITAL FUNDS
Notes to Financial Statements, continued
July 31, 2009
| | | | |
| | | Sub-Adviser | | Annual Fees Paid |
| | |
Mid-Cap Fund | | Chicago Equity Partners, LLC | | 0.20% |
| | |
Growth Stock Fund | | Chicago Equity Partners, LLC | | 0.25% |
| | |
Growth and Income Fund | | Chicago Equity Partners, LLC | | 0.25% |
| | |
Value Fund | | Chicago Equity Partners, LLC | | 0.25% |
| | 1 | On assets managed by Mellon Capital Management Corp. using a “small cap value” strategy |
| | 2 | On assets managed by Nicholas-Applegate Capital Management using a “systematic small cap” strategy. |
| | 3 | On assets managed by Wellington Management Company, LLP using a “small cap growth” strategy. |
Bank of Hawaii (the “Administrator”) acts as Administrator of the Trust and receives fees from the Trust at the annual rate of 0.04% of the average daily net assets of the Trust for this service.
Citi Fund Services Ohio, Inc. (“Citi”) serves the Trust as Sub-Administrator pursuant to an agreement among the Trust, the Administrator and Citi. Citi receives fees from the Trust at the annual rate of 0.05% of the average daily net assets of the Trust, subject to reduction if certain standards are not met, and $10,000 annually for providing additional regulatory services, plus out-of-pocket expenses.
In addition, Citi provides an employee to serve as Chief Compliance Officer for the Trust and performs certain related services. Citi receives a fee for this service and reimbursement for certain related out-of-pocket expenses.
Citi also serves the Trust as Fund Accountant and Transfer Agent. Under the terms of the fund accounting and transfer agency agreements, Citi is entitled to receive fees, subject to reduction if certain standards are not met, and reimbursement for certain out-of-pocket expenses.
Foreside Distribution Services, L.P. (the “Distributor”) serves the Trust as principal underwriter and distributor. The Trust has adopted for the Class A, Class B and Class C Shares of each of the Funds the Class A Distribution Plan, Class B Distribution Plan and Class C Distribution Plan (the “Plans”) pursuant to Rule 12b-1 under the 1940 Act. Under the Plans, each Fund pays the Distributor a fee which will not exceed on an annual basis, 0.40%, 1.00% and 1.00%, respectively, of the average daily net assets attributable to the Class A, Class B and Class C Shares of each Fund. The Distributor is contractually limiting the 12b-1 fee for Class A Shares to 0.25% through November 30, 2009. These fees are for payments the Distributor makes to banks, other institutions and broker dealers, including certain affiliates of the Administrator and for expenses the Distributor and any of its affiliates or subsidiaries incur for providing distribution or shareholder service assistance. The following table shows amounts received by the Distributor on commissions from sales and the amounts paid to affiliated broker dealers of the Funds during the year ended July 31, 2009:
| | | | |
| | | Received ($) | | Paid to
Affiliates ($) |
Class A | | 40,645 | | 294 |
Class C | | 17,131 | | 1,417 |
Mellon Capital Management Corp., a sub-adviser of the Small Cap Fund, is an affiliate of The Bank of New York Mellon who serves as custodian of the Funds. Fees for custody services are reflected as Custodian fees on the Statements of Operations.
Certain Officers and Trustees of the Trust are affiliated with the Administrator, the Adviser or Citi. Such Officers and Trustees receive no compensation from the Funds for serving in their respective roles. Each of the five Independent Trustees receives a fee for his services plus the reimbursement of certain expenses incurred.
83
PACIFIC CAPITAL FUNDS
Notes to Financial Statements, continued
July 31, 2009
The Adviser has entered into a reimbursement agreement with the Funds in which it agrees to reimburse the Funds for certain fees charged by various intermediaries. The intermediaries, such as broker-dealers, banks, retirement plan administrators or other institutions, make the shares of one or more Funds available to their customers in accordance with relevant Intermediary Agreements and provide certain recordkeeping, processing and/or administrative services. This agreement can be terminated by the Adviser with 60 days’ written notice. The reimbursements made by the Adviser may not be recouped in future periods.
The New Asia Growth Fund and International Stock Fund invest in securities of foreign issuers in various countries. Investing on an international basis involves certain risks not involved in domestic investments, including fluctuations in foreign exchange rates, future adverse political and economic developments and the possible imposition of exchange controls or other foreign governmental laws or restrictions. In addition, with respect to certain foreign countries, there is the possibility of expropriation of assets, confiscatory taxation, political or social instability, and/or diplomatic developments which could affect investments in those countries. Moreover, individual foreign economies may differ favorably or unfavorably from the U.S. economy in such respects as growth of gross national product, rates of inflation, capital reinvestment, resources, self-sufficiency and balance of payments position. Certain foreign investments may also be subject to foreign withholding taxes.
The New Asia Growth Fund’s concentration of investments in securities of issuers located in the Far East Asia region may subject the Fund to the effects of economic and government policies within that region.
The Tax-Free Securities Fund’s and Tax-Free Short Intermediate Securities Fund’s concentration of investments in securities of issuers located in Hawaii may subject each of these Funds to the effects of economic developments and government policies within Hawaii.
Each Fund may be subject to the risks described above and other risks. Additional information about the Funds, their investment strategies and related risks is available in the Trust’s Statement of Additional Information.
| 6. | | Federal Income Tax Information |
It is the policy of each Fund to continue to qualify as a regulated investment company by complying with the provisions available to certain investment companies as defined in applicable sections of the Internal Revenue Code, and to make distributions from net investment income and from net realized gains sufficient to relieve it from all, or substantially all, federal income taxes. Withholding taxes on foreign dividends have been paid or provided for in accordance with each applicable country’s tax rules and rates.
The amounts of dividends from net investment income and amounts of distributions from net realized gains are determined in accordance with federal income tax regulations, which may differ from GAAP. These “book/tax” differences are either considered temporary or permanent in nature. To the extent these differences are permanent in nature (e.g., paydown reclasses and foreign currency transactions), such amounts are reclassified within the composition of net assets based on their federal tax-basis treatment; temporary differences do not require reclassification.
The Funds comply with FASB Interpretation No. 48, Accounting for Uncertainty in Income Taxes (“FIN 48”). FIN 48 provides guidance for how uncertain tax positions should be recognized, measured, presented and disclosed in the financial statements. FIN 48 requires the affirmative evaluation of tax positions taken or expected to be taken in the course of preparing each Fund’s tax return to determine whether it is more-likely-than-not (i.e., greater than 50-percent) that each tax position will be sustained upon examination by a taxing authority based on the technical merits of the position. A tax position that meets the more-than-likely-than-not recognition threshold is measured to determine the amount of benefit to recognize in
84
PACIFIC CAPITAL FUNDS
Notes to Financial Statements, continued
July 31, 2009
the financial statements. Differences between tax positions taken in a tax return and amounts recognized in the financial statements will generally result in an increase in a liability for taxes payable (or a reduction of a tax refund receivable), including the recognition of any related interest and penalties as an operating expense. Compliance with FIN 48 includes a review of tax positions taken in tax years that remain subject to examination by all major tax jurisdictions, including federal tax and the state of Hawaii (e.g., the last four tax year ends and the interim tax period since then). Management believes that there is no tax liability resulting from unrecognized tax benefits related to certain tax positions taken.
The tax character of distributions paid during the year ended July 31, 2009 were as follows (amounts in thousands):
| | | | | | | | | | | | |
| | | Distributions Paid From | | | | | | | | |
| | | Net
Investment
Income ($) | | Net
Long-Term
Capital Gains ($) | | Total
Taxable
Distributions ($) | | Return of
Capital ($) | | Tax
Exempt
Distributions ($) | | Total
Distributions
Paid ($)* |
New Asia Growth Fund | | 2,263 | | 10,124 | | 12,387 | | — | | — | | 12,387 |
International Stock Fund | | 1,057 | | 20,011 | | 21,068 | | 181 | | — | | 21,249 |
Small Cap Fund | | — | | 801 | | 801 | | — | | — | | 801 |
Mid-Cap Fund | | 281 | | — | | 281 | | — | | — | | 281 |
Growth Stock Fund | | 640 | | — | | 640 | | 7 | | — | | 647 |
Growth and Income Fund | | 1,168 | | — | | 1,168 | | — | | — | | 1,168 |
Value Fund | | 1,543 | | — | | 1,543 | | — | | — | | 1,543 |
High Grade Core Fixed Income Fund | | 10,079 | | — | | 10,079 | | — | | — | | 10,079 |
Tax-Free Securities Fund | | 355 | | 342 | | 697 | | — | | 9,800 | | 10,497 |
High Grade Short Intermediate Fixed Income Fund | | 2,443 | | — | | 2,443 | | — | | — | | 2,443 |
Tax-Free Short Intermediate Securities Fund | | 4 | | — | | 4 | | — | | 1,339 | | 1,343 |
U.S. Government Short Fixed Income Fund | | 1,509 | | — | | 1,509 | | — | | — | | 1,509 |
| | * | Total Distributions Paid differ from the Statements of Changes in Net Assets because, for tax purposes, dividends are recognized when actually paid. |
The tax character of distributions paid during the year ended July 31, 2008 were as follows (amounts in thousands):
| | | | | | | | | | | | |
| | | Distributions Paid From | | | | | | | | |
| | | Net
Investment
Income ($) | | Net
Long-Term
Capital Gains ($) | | Total
Taxable
Distributions ($) | | Return of
Capital ($) | | Tax
Exempt
Distributions ($) | | Total
Distributions
Paid ($)* |
New Asia Growth Fund | | 5,594 | | 14,882 | | 20,476 | | — | | — | | 20,476 |
International Stock Fund | | 2,714 | | 15,912 | | 18,626 | | — | | — | | 18,626 |
Small Cap Fund | | 33,243 | | 40,794 | | 74,037 | | — | | — | | 74,037 |
Mid-Cap Fund | | 2,130 | | 5,804 | | 7,934 | | 56 | | — | | 7,990 |
Growth Stock Fund | | 828 | | — | | 828 | | 7 | | — | | 835 |
Growth and Income Fund | | 1,360 | | 7,925 | | 9,285 | | — | | — | | 9,285 |
Value Fund | | 18,946 | | 7,044 | | 25,990 | | 51 | | — | | 26,041 |
High Grade Core Fixed Income Fund | | 13,576 | | — | | 13,576 | | — | | — | | 13,576 |
Tax-Free Securities Fund | | 576 | | 189 | | 765 | | — | | 11,544 | | 12,309 |
High Grade Short Intermediate Fixed Income Fund | | 2,799 | | — | | 2,799 | | — | | — | | 2,799 |
Tax-Free Short Intermediate Securities Fund | | 21 | | — | | 21 | | — | | 1,571 | | 1,592 |
U.S. Government Short Fixed Income Fund | | 3,385 | | — | | 3,385 | | — | | — | | 3,385 |
| | * | Total Distributions Paid differ from the Statements of Changes in Net Assets because, for tax purposes, dividends are recognized when actually paid. |
85
PACIFIC CAPITAL FUNDS
Notes to Financial Statements, continued
July 31, 2009
As of July 31, 2009, the components of accumulated earnings/(deficit) on a tax basis were as follows (amounts in thousands):
| | | | | | | | | | | | | | | | | | |
| | | Undistributed | | Accumulated
Earnings ($) | | Distributions
Payable ($) | | | Accumulated
Capital &
Other Losses ($) | | | Unrealized
Appreciation/
(Depreciation) ($)** | | | Total
Accumulated
Earnings/
(Deficit) ($) | |
| | | Ordinary
Income ($) | | Long-Term
Capital Gain ($) | | | | | |
New Asia Growth Fund | | 34 | | — | | 34 | | — | | | (8,118 | ) | | 4,285 | | | (3,799 | ) |
International Stock Fund | | — | | — | | — | | — | | | (41,458 | ) | | (9,745 | ) | | (51,203 | ) |
Small Cap Fund | | — | | — | | — | | — | | | (152,517 | ) | | (5,165 | ) | | (157,682 | ) |
Mid-Cap Fund | | 12 | | — | | 12 | | — | | | (22,914 | ) | | 778 | | | (22,124 | ) |
Growth Stock Fund | | — | | — | | — | | — | | | (109,413 | ) | | (2,857 | ) | | (112,270 | ) |
Growth and Income Fund | | 28 | | — | | 28 | | — | | | (37,584 | ) | | (6,296 | ) | | (43,852 | ) |
Value Fund | | 28 | | — | | 28 | | — | | | (36,126 | ) | | (7,046 | ) | | (43,144 | ) |
High Grade Core Fixed Income Fund | | 24 | | — | | 24 | | (65 | ) | | (406 | ) | | 3,983 | | | 3,536 | |
High Grade Short Intermediate Fixed Income Fund | | — | | — | | — | | (18 | ) | | (1,029 | ) | | 1,648 | | | 601 | |
U.S. Government Short Fixed Income Fund | | 7 | | — | | 7 | | (7 | ) | | (575 | ) | | 500 | | | (75 | ) |
| | ** | The differences between book-basis and tax-basis unrealized appreciation/depreciation is attributable primarily to: tax deferral of losses on wash sales and return of capital adjustments. |
| | | | | | | | | | | | | | | | | | |
| | | Undistributed | | Accumulated
Earnings ($) | | Distributions
Payable ($) | | | Accumulated
Capital &
Other Losses ($) | | | Unrealized
Appreciation/
(Depreciation) ($) | | Total
Accumulated
Earnings/
(Deficit) ($) |
| | | Tax-Exempt
Income ($) | | Ordinary
Income ($) | | Long-Term
Capital Gain ($) | | | | | |
Tax-Free Securities Fund | | 103 | | — | | — | | 103 | | (74 | ) | | (2,121 | ) | | 10,150 | | 8,058 |
Tax-Free Short Intermediate Securities Fund | | — | | — | | — | | — | | (22 | ) | | (837 | ) | | 1,387 | | 528 |
As of the latest tax year end of July 31, 2009, the following Funds had net capital loss carryforwards to offset future net capital gains, if any, to the extent provided by Treasury regulations. To the extent that these carryforwards are used to offset future capital gains, it is probable that the gains that are offset will not be distributed to shareholders.
86
PACIFIC CAPITAL FUNDS
Notes to Financial Statements, continued
July 31, 2009
| | | | | | | | | | | | |
| | | Expires |
| | | 2011 ($) | | 2013 ($) | | 2014 ($) | | 2015 ($) | | 2016 ($) | | 2017 ($) |
New Asia Growth Fund | | — | | — | | — | | — | | — | | 529,155 |
International Stock Fund | | — | | — | | — | | — | | — | | 10,389,320 |
Small Cap Fund | | — | | — | | — | | — | | — | | 69,091,777 |
Mid-Cap Fund | | — | | — | | — | | — | | 739,471 | | 5,185,507 |
Growth Stock Fund | | 76,835,141 | | — | | — | | — | | 3,055,247 | | 4,585,249 |
Growth and Income Fund | | — | | — | | — | | — | | 5,239,853 | | 7,224,116 |
Value Fund | | — | | — | | — | | — | | 4,646,679 | | 5,557,468 |
High Grade Core Fixed Income Fund | | — | | — | | — | | 48,099 | | — | | — |
Tax-Free Securities Fund | | | | — | | — | | — | | — | | 625,102 |
High Grade Short Intermediate Fixed Income Fund | | — | | — | | — | | 1,028,605 | | — | | — |
Tax-Free Short Intermediate Securities Fund | | — | | 14,258 | | 18,908 | | 657,223 | | 49,093 | | 15,122 |
U.S. Government Short Fixed Income Fund | | — | | — | | — | | 575,484 | | — | | — |
During the year ended July 31, 2009, the High Grade Core Fixed Income Fund, High Grade Short Intermediate Fixed Income Fund and U.S. Government Short Fixed Income Fund utilized $1,274, $599 and $1,573 in capital loss carryforwards (amounts in thousands), respectively.
Under current tax law, capital and foreign currency losses realized after October 31 may be deferred and treated as occurring on the first day of the following fiscal year. For the year ended July 31, 2009, the Funds deferred to August 1, 2009 post-October capital losses and post-October currency losses of:
| | | | |
| | | Post-October
Capital Losses ($) | | Post-October
Foreign Currency
Losses ($) |
New Asia Growth Fund | | 7,391,968 | | 197,341 |
International Stock Fund | | 30,822,495 | | 246,340 |
Small Cap Fund | | 83,424,934 | | — |
Mid-Cap Fund | | 16,989,249 | | — |
Growth Stock Fund | | 24,936,896 | | — |
Growth and Income Fund | | 25,120,438 | | — |
Value Fund | | 25,921,710 | | — |
High Grade Core Fixed Income Fund | | 357,716 | | — |
Tax-Free Securities Fund | | 1,495,804 | | — |
Tax-Free Short Intermediate Securities Fund | | 82,600 | | — |
The cost for federal income tax purposes, gross unrealized appreciation, gross unrealized depreciation and net unrealized appreciation/depreciation as of July 31, 2009 is as follows:
| | | | | | | | | | |
Fund | | Tax Cost of
Securities ($) | | Unrealized
Appreciation ($) | | Unrealized
Depreciation ($) | | | Net Unrealized
Appreciation/
(Depreciation) ($) | |
New Asia Growth Fund | | 75,564,023 | | 8,430,128 | | (4,124,489 | ) | | 4,305,639 | |
International Stock Fund | | 90,067,950 | | 6,585,608 | | (16,358,649 | ) | | (9,773,041 | ) |
Small Cap Fund | | 138,522,879 | | 17,190,650 | | (22,355,908 | ) | | (5,165,258 | ) |
Mid-Cap Fund | | 31,446,372 | | 4,393,025 | | (3,615,381 | ) | | 777,644 | |
Growth Stock Fund | | 78,898,733 | | 5,023,343 | | (7,880,340 | ) | | (2,856,997 | ) |
Growth and Income Fund | | 75,728,500 | | 3,818,915 | | (10,115,260 | ) | | (6,296,345 | ) |
Value Fund | | 71,311,448 | | 5,120,875 | | (12,166,442 | ) | | (7,045,567 | ) |
High Grade Core Fixed Income Fund | | 197,251,299 | | 8,816,280 | | (4,833,584 | ) | | 3,982,696 | |
Tax-Free Securities Fund | | 226,076,722 | | 11,945,437 | | (1,795,605 | ) | | 10,149,832 | |
High Grade Short Intermediate Fixed Income Fund | | 56,104,473 | | 1,756,135 | | (108,330 | ) | | 1,647,805 | |
Tax-Free Short Intermediate Securities Fund | | 61,457,361 | | 1,420,840 | | (34,146 | ) | | 1,386,694 | |
U.S. Government Short Fixed Income Fund | | 69,150,904 | | 521,516 | | (21,339 | ) | | 500,177 | |
87
PACIFIC CAPITAL FUNDS
Notes to Financial Statements, continued
July 31, 2009
| 7. | | Legal and Regulatory Matters |
Citi Fund Services, Inc., certain affiliates of which provide various services to the Trust as described in footnote 4, has reached a settlement with the SEC regarding the SEC’s investigation related to its past payment of certain marketing and other expenses with respect to certain of its mutual fund clients. Fund management has not determined the degree, if any, to which the Funds are affected by the settlement. A proposed plan of distribution (“Fair Fund Plan”) was posted by the SEC for public review and comment on May 29, 2009. Further information, including the methodology of the Fair Fund Plan, is available on the SEC website at www.sec.gov/litigation/admin/2009/34-60011-pdp.pdf. Based on management’s review and consideration of the matter to date, management does not believe the Funds’ financial statements would be adversely impacted as a result of this investigation.
88
PACIFIC CAPITAL FUNDS
New Asia Growth Fund
Financial Highlights
(Selected data for a share of capital stock outstanding throughout the periods indicated)
| | | | | | | | | | | | | | | | | | | | | | | | | | | | | | | | | | | | | | | | | | | | | | | | |
| | | | | Investment Activities | | | Distributions | | | | | | | | Ratios/Supplemental Data | |
| | | Net Asset
Value,
Beginning
of Period | | Net
Investment
Income
(Loss) | | | Net Realized
and Unrealized
Gains (Losses)
on Investments | | | Total from
Investment
Activities | | | Dividends
from Net
Investment
Income | | | Distributions
from Net
Realized
Gains | | | Total
Dividends
and
Distributions | | | Net Asset
Value,
End of
Period | | Total
Return (a) | | | Net Assets,
End of
Period (000’s) | | Ratio of
Expenses
to Average
Net Assets | | | Ratio of Net
Investment
Income
(Loss) to
Average
Net Assets | | | Ratio of
Expenses
to Average
Net Assets (b) | | | Portfolio
Turnover (c) | |
CLASS A | | | | | | | | | | | | | | | | | | | | | | | | | | | | | | | | | | | | | | | | | | | | | | | | |
Year Ended July 31, 2009 | | $ | 17.57 | | $ | 0.13 | | | $ | (2.56 | ) | | $ | (2.43 | ) | | $ | (0.12 | ) | | $ | (2.96 | ) | | $ | (3.08 | ) | | $ | 12.06 | | (6.91 | %) | | $ | 3,794 | | 1.78 | % | | 1.06 | % | | 1.93 | % | | 47.98 | % |
Year Ended July 31, 2008 | | | 22.06 | | | 0.20 | | | | (0.76 | ) | | | (0.56 | ) | | | (0.23 | ) | | | (3.70 | ) | | | (3.93 | ) | | | 17.57 | | (5.38 | ) | | | 4,986 | | 1.59 | | | 1.04 | | | 1.74 | | | 45.92 | |
Year Ended July 31, 2007 | | | 16.84 | | | 0.22 | | | | 7.05 | | | | 7.27 | | | | (0.22 | ) | | | (1.83 | ) | | | (2.05 | ) | | | 22.06 | | 46.07 | | | | 3,207 | | 1.62 | | | 1.14 | | | 1.77 | | | 37.50 | |
Year Ended July 31, 2006 | | | 15.52 | | | 0.10 | | | | 2.12 | | | | 2.22 | | | | (0.10 | ) | | | (0.80 | ) | | | (0.90 | ) | | | 16.84 | | 15.00 | | | | 2,157 | | 1.76 | | | 0.64 | | | 2.08 | | | 44.10 | |
Year Ended July 31, 2005 | | | 11.46 | | | 0.11 | (d) | | | 4.07 | (d) | | | 4.18 | | | | (0.12 | ) | | | — | | | | (0.12 | ) | | | 15.52 | | 36.68 | | | | 1,770 | | 1.96 | | | 0.84 | | | 2.48 | | | 44.06 | |
CLASS B | | | | | | | | | | | | | | | | | | | | | | | | | | | | | | | | | | | | | | | | | | | | | | | | |
Year Ended July 31, 2009 | | $ | 16.54 | | $ | 0.03 | (d) | | $ | (2.48 | )(d) | | $ | (2.45 | ) | | $ | (0.08 | ) | | $ | (2.96 | ) | | $ | (3.04 | ) | | $ | 11.05 | | (7.60 | %) | | $ | 46 | | 2.53 | % | | 0.25 | % | | 2.53 | % | | 47.98 | % |
Year Ended July 31, 2008 | | | 20.99 | | | 0.01 | (d) | | | (0.66 | )(d) | | | (0.65 | ) | | | (0.10 | ) | | | (3.70 | ) | | | (3.80 | ) | | | 16.54 | | (6.13 | ) | | | 137 | | 2.34 | | | 0.04 | | | 2.34 | | | 45.92 | |
Year Ended July 31, 2007 | | | 16.13 | | | 0.06 | | | | 6.73 | | | | 6.79 | | | | (0.10 | ) | | | (1.83 | ) | | | (1.93 | ) | | | 20.99 | | 44.97 | | | | 679 | | 2.37 | | | 0.35 | | | 2.37 | | | 37.50 | |
Year Ended July 31, 2006 | | | 14.97 | | | — | | | | 2.01 | | | | 2.01 | | | | (0.05 | ) | | | (0.80 | ) | | | (0.85 | ) | | | 16.13 | | 14.05 | | | | 639 | | 2.51 | | | (0.04 | ) | | 2.57 | | | 44.10 | |
Year Ended July 31, 2005 | | | 11.09 | | | 0.01 | (d) | | | 3.93 | (d) | | | 3.94 | | | | (0.06 | ) | | | — | | | | (0.06 | ) | | | 14.97 | | 35.66 | | | | 446 | | 2.71 | | | 0.09 | | | 2.73 | | | 44.06 | |
CLASS C | | | | | | | | | | | | | | | | | | | | | | | | | | | | | | | | | | | | | | | | | | | | | | | | |
Year Ended July 31, 2009 | | $ | 16.48 | | $ | 0.03 | | | $ | (2.47 | ) | | $ | (2.44 | ) | | $ | (0.08 | ) | | $ | (2.96 | ) | | $ | (3.04 | ) | | $ | 11.00 | | (7.63 | %) | | $ | 386 | | 2.53 | % | | 0.28 | % | | 2.53 | % | | 47.98 | % |
Year Ended July 31, 2008 | | | 20.97 | | | 0.05 | | | | (0.70 | ) | | | (0.65 | ) | | | (0.14 | ) | | | (3.70 | ) | | | (3.84 | ) | | | 16.48 | | (6.09 | ) | | | 657 | | 2.34 | | | 0.26 | | | 2.34 | | | 45.92 | |
Year Ended July 31, 2007 | | | 16.12 | | | 0.07 | | | | 6.72 | | | | 6.79 | | | | (0.11 | ) | | | (1.83 | ) | | | (1.94 | ) | | | 20.97 | | 44.96 | | | | 580 | | 2.37 | | | 0.37 | | | 2.37 | | | 37.50 | |
Year Ended July 31, 2006 | | | 14.96 | | | (0.01 | ) | | | 2.02 | | | | 2.01 | | | | (0.05 | ) | | | (0.80 | ) | | | (0.85 | ) | | | 16.12 | | 14.08 | | | | 413 | | 2.51 | | | (0.10 | ) | | 2.57 | | | 44.10 | |
Year Ended July 31, 2005 | | | 11.09 | | | 0.04 | (d) | | | 3.91 | (d) | | | 3.95 | | | | (0.08 | ) | | | — | | | | (0.08 | ) | | | 14.96 | | 35.73 | | | | 272 | | 2.70 | | | 0.27 | | | 2.74 | | | 44.06 | |
CLASS Y | | | | | | | | | | | | | | | | | | | | | | | | | | | | | | | | | | | | | | | | | | | | | | | | |
Year Ended July 31, 2009 | | $ | 17.90 | | $ | 0.15 | | | $ | (2.59 | ) | | $ | (2.44 | ) | | $ | (0.13 | ) | | $ | (2.96 | ) | | $ | (3.09 | ) | | $ | 12.37 | | (6.74 | %) | | $ | 77,356 | | 1.53 | % | | 1.29 | % | | 1.53 | % | | 47.98 | % |
Year Ended July 31, 2008 | | | 22.39 | | | 0.27 | | | | (0.80 | ) | | | (0.53 | ) | | | (0.26 | ) | | | (3.70 | ) | | | (3.96 | ) | | | 17.90 | | (5.14 | ) | | | 93,039 | | 1.34 | | | 1.21 | | | 1.34 | | | 45.92 | |
Year Ended July 31, 2007 | | | 17.07 | | | 0.26 | | | | 7.15 | | | | 7.41 | | | | (0.26 | ) | | | (1.83 | ) | | | (2.09 | ) | | | 22.39 | | 46.36 | | | | 113,393 | | 1.37 | | | 1.38 | | | 1.37 | | | 37.50 | |
Year Ended July 31, 2006 | | | 15.72 | | | 0.14 | | | | 2.15 | | | | 2.29 | | | | (0.14 | ) | | | (0.80 | ) | | | (0.94 | ) | | | 17.07 | | 15.26 | | | | 85,836 | | 1.51 | | | 0.98 | | | 1.57 | | | 44.10 | |
Year Ended July 31, 2005 | | | 11.60 | | | 0.15 | (d) | | | 4.13 | (d) | | | 4.28 | | | | (0.16 | ) | | | — | | | | (0.16 | ) | | | 15.72 | | 37.07 | | | | 44,092 | | 1.71 | | | 1.13 | | | 1.73 | | | 44.06 | |
| (a) | Excludes sales charge and/or redemption fees, if applicable. |
| (b) | During the period certain fees were reduced. If such fee reductions had not occurred the ratios would have been as indicated. |
| (c) | Portfolio turnover is calculated on the basis of the Fund as a whole without distinguishing between the classes of shares issued. |
| (d) | Amounts calculated using the daily average shares method. |
See notes to financial statements.
89
PACIFIC CAPITAL FUNDS
International Stock Fund
Financial Highlights
(Selected data for a share of capital stock outstanding throughout the periods indicated)
| | | | | | | | | | | | | | | | | | | | | | | | | | | | | | | | | | | | | | | | | | | | | | | | | | | | |
| | | | | Investment Activities | | | Distributions | | | | | | | | Ratios/Supplemental Data | |
| | | Net Asset
Value,
Beginning
of Period | | Net
Investment
Income (Loss) | | | Net Realized
and Unrealized
Gains (Losses)
on Investments | | | Total from
Investment
Activities | | | Dividends
from Net
Investment
Income | | | Distributions
from Net
Realized
Gains | | | Distributions
from Return
of Capital | | | Total
Dividends
and
Distributions | | | Net Asset
Value,
End of
Period | | Total
Return (a) | | | Net Assets,
End of
Period (000’s) | | Ratio of
Expenses
to Average
Net Assets | | | Ratio of Net
Investment
Income
(Loss) to
Average
Net Assets | | | Ratio of
Expenses
to Average
Net Assets (b) | | | Portfolio
Turnover (c) | |
CLASS A | | | | | | | | | | | | | | | | | | | | | | | | | | | | | | | | | | | | | | | | | | | | | | | | | | | | |
Year Ended July 31, 2009 | | $ | 11.46 | | $ | 0.06 | | | $ | (3.23 | ) | | $ | (3.17 | ) | | $ | (0.02 | ) | | $ | (1.78 | ) | | $ | (0.01 | ) | | $ | (1.81 | ) | | $ | 6.48 | | (22.32 | %) | | $ | 1,248 | | 1.83 | % | | 0.88 | % | | 2.08 | % | | 50.99 | % |
Year Ended July 31, 2008 | | | 13.57 | | | 0.12 | | | | (1.23 | ) | | | (1.11 | ) | | | (0.12 | ) | | | (0.88 | ) | | | — | | | | (1.00 | ) | | | 11.46 | | (9.03 | ) | | | 1,644 | | 1.35 | | | 1.10 | | | 1.60 | | | 52.32 | |
Year Ended July 31, 2007 | | | 10.81 | | | 0.11 | | | | 2.77 | | | | 2.88 | | | | (0.12 | ) | | | — | | | | — | | | | (0.12 | ) | | | 13.57 | | 26.68 | | | | 1,221 | | 1.35 | | | 0.86 | | | 1.60 | | | 47.50 | |
Year Ended July 31, 2006 | | | 8.95 | | | 0.07 | | | | 1.87 | | | | 1.94 | | | | (0.08 | ) | | | — | | | | — | | | | (0.08 | ) | | | 10.81 | | 21.65 | | | | 999 | | 1.48 | | | 0.68 | | | 1.90 | | | 46.18 | |
Year Ended July 31, 2005 | | | 7.41 | | | 0.05 | (d) | | | 1.52 | (d) | | | 1.57 | | | | (0.03 | ) | | | — | | | | — | | | | (0.03 | ) | | | 8.95 | | 21.17 | | | | 949 | | 1.73 | | | 0.60 | | | 2.35 | | | 37.98 | |
CLASS B | | | | | | | | | | | | | | | | | | | | | | | | | | | | | | | | | | | | | | | | | | | | | | | | | | | | |
Year Ended July 31, 2009 | | $ | 10.81 | | $ | (0.02 | ) | | $ | (3.05 | ) | | $ | (3.07 | ) | | $ | — | | | $ | (1.78 | ) | | $ | — | (e) | | $ | (1.78 | ) | | $ | 5.96 | | (22.88 | %) | | $ | 49 | | 2.56 | % | | 0.00 | % | | 2.66 | % | | 50.99 | % |
Year Ended July 31, 2008 | | | 12.87 | | | 0.01 | (d) | | | (1.15 | )(d) | | | (1.14 | ) | | | (0.04 | ) | | | (0.88 | ) | | | — | | | | (0.92 | ) | | | 10.81 | | (9.76 | ) | | | 163 | | 2.10 | | | 0.09 | | | 2.20 | | | 52.32 | |
Year Ended July 31, 2007 | | | 10.27 | | | (0.01 | ) | | | 2.65 | | | | 2.64 | | | | (0.04 | ) | | | — | | | | — | | | | (0.04 | ) | | | 12.87 | | 25.72 | | | | 671 | | 2.10 | | | 0.03 | | | 2.20 | | | 47.50 | |
Year Ended July 31, 2006 | | | 8.54 | | | (0.01 | ) | | | 1.77 | | | | 1.76 | | | | (0.03 | ) | | | — | | | | — | | | | (0.03 | ) | | | 10.27 | | 20.63 | | | | 673 | | 2.23 | | | (0.06 | ) | | 2.39 | | | 46.18 | |
Year Ended July 31, 2005 | | | 7.10 | | | (0.01 | )(d) | | | 1.46 | (d) | | | 1.45 | | | | (0.01 | ) | | | — | | | | — | | | | (0.01 | ) | | | 8.54 | | 20.43 | | | | 649 | | 2.48 | | | (0.16 | ) | | 2.60 | | | 37.98 | |
CLASS C | | | | | | | | | | | | | | | | | | | | | | | | | | | | | | | | | | | | | | | | | | | | | | | | | | | | |
Year Ended July 31, 2009 | | $ | 10.79 | | $ | 0.01 | | | $ | (3.07 | ) | | $ | (3.06 | ) | | $ | — | | | $ | (1.78 | ) | | $ | (0.01 | ) | | $ | (1.79 | ) | | $ | 5.94 | | (22.93 | %) | | $ | 196 | | 2.59 | % | | 0.14 | % | | 2.69 | | | 50.99 | % |
Year Ended July 31, 2008 | | | 12.85 | | | 0.04 | | | | (1.16 | ) | | | (1.12 | ) | | | (0.06 | ) | | | (0.88 | ) | | | — | | | | (0.94 | ) | | | 10.79 | | (9.66 | ) | | | 450 | | 2.10 | | | 0.31 | | | 2.20 | | | 52.32 | |
Year Ended July 31, 2007 | | | 10.27 | | | — | | | | 2.62 | | | | 2.62 | | | | (0.04 | ) | | | — | | | | — | | | | (0.04 | ) | | | 12.85 | | 25.53 | | | | 600 | | 2.10 | | | 0.06 | | | 2.20 | | | 47.50 | |
Year Ended July 31, 2006 | | | 8.53 | | | (0.01 | ) | | | 1.78 | | | | 1.77 | | | | (0.03 | ) | | | — | | | | — | | | | (0.03 | ) | | | 10.27 | | 20.78 | | | | 601 | | 2.23 | | | (0.04 | ) | | 2.39 | | | 46.18 | |
Year Ended July 31, 2005 | | | 7.10 | | | 0.05 | (d) | | | 1.39 | (d) | | | 1.44 | | | | (0.01 | ) | | | — | | | | — | | | | (0.01 | ) | | | 8.53 | | 20.30 | | | | 494 | | 2.42 | | | 0.57 | | | 2.55 | | | 37.98 | |
CLASS Y | | | | | | | | | | | | | | | | | | | | | | | | | | | | | | | | | | | | | | | | | | | | | | | | | | | | |
Year Ended July 31, 2009 | | $ | 11.71 | | $ | 0.07 | | | $ | (3.28 | ) | | $ | (3.21 | ) | | $ | (0.04 | ) | | $ | (1.78 | ) | | $ | (0.01 | ) | | $ | (1.83 | ) | | $ | 6.67 | | (22.21 | %) | | $ | 79,264 | | 1.55 | % | | 1.01 | % | | 1.65% | | | 50.99 | % |
Year Ended July 31, 2008 | | | 13.84 | | | 0.18 | | | | (1.28 | ) | | | (1.10 | ) | | | (0.15 | ) | | | (0.88 | ) | | | — | | | | (1.03 | ) | | | 11.71 | | (8.80 | ) | | | 182,692 | | 1.10 | | | 1.32 | | | 1.20 | | | 52.32 | |
Year Ended July 31, 2007 | | | 11.03 | | | 0.13 | | | | 2.83 | | | | 2.96 | | | | (0.15 | ) | | | — | | | | — | | | | (0.15 | ) | | | 13.84 | | 26.90 | | | | 246,057 | | 1.10 | | | 1.07 | | | 1.20 | | | 47.50 | |
Year Ended July 31, 2006 | | | 9.13 | | | 0.09 | | | | 1.91 | | | | 2.00 | | | | (0.10 | ) | | | — | | | | — | | | | (0.10 | ) | | | 11.03 | | 21.90 | | | | 209,795 | | 1.23 | | | 1.15 | | | 1.39 | | | 46.18 | |
Year Ended July 31, 2005 | | | 7.55 | | | 0.08 | (d) | | | 1.55 | (d) | | | 1.63 | | | | (0.05 | ) | | | — | | | | — | | | | (0.05 | ) | | | 9.13 | | 21.61 | | | | 93,049 | | 1.47 | | | 0.97 | | | 1.59 | | | 37.98 | |
| (a) | Excludes sales charge and/or redemption fees, if applicable. |
| (b) | During the period certain fees were reduced. If such fee reductions had not occurred the ratios would have been as indicated. |
| (c) | Portfolio turnover is calculated on the basis of the Fund as a whole without distinguishing between the classes of shares issued. |
| (d) | Amounts calculated using the daily average shares method. |
| (e) | Less than $0.005 per share. |
See notes to financial statements.
90
PACIFIC CAPITAL FUNDS
Small Cap Fund
Financial Highlights
(Selected data for a share of capital stock outstanding throughout the periods indicated)
| | | | | | | | | | | | | | | | | | | | | | | | | | | | | | | | | | | | | | | | | | | | | | | |
| | | | | Investment Activities | | | Distributions | | | | | | | | Ratios/Supplemental Data | |
| | | Net Asset
Value,
Beginning
of Period | | Net
Investment
Income
(Loss) | | | Net Realized
and Unrealized
Gains (Losses)
on Investments | | | Total from
Investment
Activities | | | Dividends
from Net
Investment
Income | | Distributions
from Net
Realized
Gains | | | Total
Dividends
and
Distributions | | | Net Asset
Value,
End of
Period | | Total
Return (a) | | | Net Assets,
End of
Period (000’s) | | Ratio of
Expenses
to Average
Net Assets | | | Ratio of Net
Investment
Income
(Loss) to
Average
Net Assets | | | Ratio of
Expenses
to Average
Net Assets (b) | | | Portfolio
Turnover (c) | |
CLASS A | | | | | | | | | | | | | | | | | | | | | | | | | | | | | | | | | | | | | | | | | | | | | | | |
Year Ended July 31, 2009 | | $ | 13.48 | | $ | (0.06 | ) | | $ | (3.47 | ) | | $ | (3.53 | ) | | $ | — | | $ | (0.04 | ) | | $ | (0.04 | ) | | $ | 9.91 | | (26.16 | %) | | $ | 55,687 | | 1.79 | % | | (0.52 | %) | | 2.08 | % | | 118.96 | % |
Year Ended July 31, 2008 | | | 18.29 | | | (0.13 | ) | | | (1.77 | ) | | | (1.90 | ) | | | — | | | (2.91 | ) | | | (2.91 | ) | | | 13.48 | | (11.86 | ) | | | 120,495 | | 1.63 | | | (0.68 | ) | | 1.88 | | | 130.78 | |
Year Ended July 31, 2007 | | | 17.67 | | | (0.06 | )(d) | | | 2.09 | (d) | | | 2.03 | | | | — | | | (1.41 | ) | | | (1.41 | ) | | | 18.29 | | 11.39 | | | | 228,985 | | 1.57 | | | (0.31 | ) | | 1.82 | | | 164.61 | |
Year Ended July 31, 2006 | | | 18.10 | | | (0.07 | )(d) | | | 0.93 | (d) | | | 0.86 | | | | — | | | (1.29 | ) | | | (1.29 | ) | | | 17.67 | | 4.97 | | | | 215,270 | | 1.62 | | | (0.40 | ) | | 2.02 | | | 110.61 | |
Year Ended July 31, 2005 | | | 16.52 | | | (0.08 | )(d) | | | 4.39 | (d) | | | 4.31 | | | | — | | | (2.73 | ) | | | (2.73 | ) | | | 18.10 | | 27.98 | | | | 103,700 | | 1.63 | | | (0.49 | ) | | 2.26 | | | 67.75 | |
CLASS B | | | | | | | | | | | | | | | | | | | | | | | | | | | | | | | | | | | | | | | | | | | | | | | |
Year Ended July 31, 2009 | | $ | 12.27 | | $ | (0.02 | ) | | $ | (3.20 | ) | | $ | (3.22 | ) | | $ | — | | $ | (0.04 | ) | | $ | (0.04 | ) | | $ | 9.01 | | (26.03 | %) | | $ | 656 | | 1.79 | % | | (0.15 | %) | | 2.68 | % | | 118.96 | % |
Year Ended July 31, 2008 | | | 16.99 | | | (0.19 | ) | | | (1.62 | ) | | | (1.81 | ) | | | — | | | (2.91 | ) | | | (2.91 | ) | | | 12.27 | | (12.48 | ) | | | 1,481 | | 2.18 | | | (1.22 | ) | | 2.48 | | | 130.78 | |
Year Ended July 31, 2007 | | | 16.62 | | | (0.19 | )(d) | | | 1.97 | (d) | | | 1.78 | | | | — | | | (1.41 | ) | | | (1.41 | ) | | | 16.99 | | 10.57 | | | | 2,510 | | 2.32 | | | (1.06 | ) | | 2.42 | | | 164.61 | |
Year Ended July 31, 2006 | | | 17.22 | | | (0.19 | )(d) | | | 0.88 | (d) | | | 0.69 | | | | — | | | (1.29 | ) | | | (1.29 | ) | | | 16.62 | | 4.14 | | | | 3,093 | | 2.37 | | | (1.11 | ) | | 2.53 | | | 110.61 | |
Year Ended July 31, 2005 | | | 15.94 | | | (0.21 | ) | | | 4.22 | | | | 4.01 | | | | — | | | (2.73 | ) | | | (2.73 | ) | | | 17.22 | | 27.09 | | | | 3,555 | | 2.35 | | | (1.29 | ) | | 2.46 | | | 67.75 | |
CLASS C | | | | | | | | | | | | | | | | | | | | | | | | | | | | | | | | | | | | | | | | | | | | | | | |
Year Ended July 31, 2009 | | $ | 12.24 | | $ | (0.15 | ) | | $ | (3.13 | ) | | $ | (3.28 | ) | | $ | — | | $ | (0.04 | ) | | $ | (0.04 | ) | | $ | 8.92 | | (26.77 | %) | | $ | 7,389 | | 2.54 | % | | (1.27 | %) | | 2.68 | % | | 118.96 | % |
Year Ended July 31, 2008 | | | 17.00 | | | (0.22 | ) | | | (1.63 | ) | | | (1.85 | ) | | | — | | | (2.91 | ) | | | (2.91 | ) | | | 12.24 | | (12.54 | ) | | | 17,067 | | 2.38 | | | (1.47 | ) | | 2.48 | | | 130.78 | |
Year Ended July 31, 2007 | | | 16.63 | | | (0.19 | )(d) | | | 1.97 | (d) | | | 1.78 | | | | — | | | (1.41 | ) | | | (1.41 | ) | | | 17.00 | | 10.56 | | | | 24,083 | | 2.32 | | | (1.05 | ) | | 2.42 | | | 164.61 | |
Year Ended July 31, 2006 | | | 17.23 | | | (0.20 | )(d) | | | 0.89 | (d) | | | 0.69 | | | | — | | | (1.29 | ) | | | (1.29 | ) | | | 16.63 | | 4.19 | | | | 14,908 | | 2.37 | | | (1.15 | ) | | 2.53 | | | 110.61 | |
Year Ended July 31, 2005 | | | 15.95 | | | (0.21 | )(d) | | | 4.22 | (d) | | | 4.01 | | | | — | | | (2.73 | ) | | | (2.73 | ) | | | 17.23 | | 27.00 | | | | 5,832 | | 2.40 | | | (1.33 | ) | | 2.54 | | | 67.75 | |
CLASS Y | | | | | | | | | | | | | | | | | | | | | | | | | | | | | | | | | | | | | | | | | | | | | | | |
Year Ended July 31, 2009 | | $ | 13.80 | | $ | (0.04 | ) | | $ | (3.55 | ) | | $ | (3.59 | ) | | $ | — | | $ | (0.04 | ) | | $ | (0.04 | ) | | $ | 10.17 | | (25.99 | %) | | $ | 69,534 | | 1.54 | % | | (0.28 | %) | | 1.68 | % | | 118.96 | % |
Year Ended July 31, 2008 | | | 18.61 | | | (0.08 | ) | | | (1.82 | ) | | | (1.90 | ) | | | — | | | (2.91 | ) | | | (2.91 | ) | | | 13.80 | | (11.64 | ) | | | 173,745 | | 1.38 | | | (0.45 | ) | | 1.48 | | | 130.78 | |
Year Ended July 31, 2007 | | | 17.92 | | | (0.01 | )(d) | | | 2.11 | (d) | | | 2.10 | | | | — | | | (1.41 | ) | | | (1.41 | ) | | | 18.61 | | 11.64 | | | | 280,870 | | 1.32 | | | (0.04 | ) | | 1.42 | | | 164.61 | |
Year Ended July 31, 2006 | | | 18.29 | | | (0.03 | )(d) | | | 0.95 | (d) | | | 0.92 | | | | — | | | (1.29 | ) | | | (1.29 | ) | | | 17.92 | | 5.26 | | | | 197,701 | | 1.37 | | | (0.14 | ) | | 1.53 | | | 110.61 | |
Year Ended July 31, 2005 | | | 16.63 | | | (0.05 | ) | | | 4.44 | | | | 4.39 | | | | — | | | (2.73 | ) | | | (2.73 | ) | | | 18.29 | | 28.30 | | | | 125,299 | | 1.35 | | | (0.29 | ) | | 1.46 | | | 67.75 | |
| (a) | Excludes sales charge and/or redemption fees, if applicable. |
| (b) | During the period certain fees were reduced. If such fee reductions had not occurred the ratios would have been as indicated. |
| (c) | Portfolio turnover is calculated on the basis of the Fund as a whole without distinguishing between the classes of shares issued. |
| (d) | Amounts calculated using the daily average shares method. |
See notes to financial statements.
91
PACIFIC CAPITAL FUNDS
Mid-Cap Fund
Financial Highlights
(Selected data for a share of capital stock outstanding throughout the periods indicated)
| | | | | | | | | | | | | | | | | | | | | | | | | | | | | | | | | | | | | | | | | | | | | | | | |
| | | | | Investment Activities | | | Distributions | | | | | | | | Ratios/Supplemental Data | |
| | | Net Asset
Value,
Beginning
of Period | | Net
Investment
Income
(Loss) | | | Net Realized
and Unrealized
Gains (Losses)
on Investments | | | Total from
Investment
Activities | | | Dividends
from Net
Investment
Income | | | Distributions
from Net
Realized
Gains | | | Total
Dividends
and
Distributions | | | Net Asset
Value,
End of
Period | | Total
Return (a) | | | Net Assets,
End of
Period (000’s) | | Ratio of
Expenses
to Average
Net Assets | | | Ratio of Net
Investment
Income
(Loss) to
Average
Net Assets | | | Ratio of
Expenses
to Average
Net Assets (b) | | | Portfolio
Turnover (c) | |
CLASS A | | | | | | | | | | | | | | | | | | | | | | | | | | | | | | | | | | | | | | | | | | | | | | | | |
Year Ended July 31, 2009 | | $ | 9.36 | | $ | 0.03 | | | $ | (2.44 | ) | | $ | (2.41 | ) | | $ | (0.03 | ) | | $ | — | | | $ | (0.03 | ) | | $ | 6.92 | | (25.62 | %) | | $ | 503 | | 1.35 | % | | 0.54 | % | | 1.75 | % | | 120.38 | % |
Year Ended July 31, 2008 | | | 12.17 | | | 0.02 | | | | (1.56 | ) | | | (1.54 | ) | | | (0.03 | ) | | | (1.24 | ) | | | (1.27 | ) | | | 9.36 | | (13.60 | ) | | | 549 | | 1.15 | | | 0.21 | | | 1.55 | | | 130.00 | |
Year Ended July 31, 2007 | | | 12.21 | | | 0.05 | | | | 1.76 | | | | 1.81 | | | | (0.05 | ) | | | (1.80 | ) | | | (1.85 | ) | | | 12.17 | | 15.63 | | | | 693 | | 1.07 | | | 0.44 | | | 1.60 | | | 117.44 | |
Year Ended July 31, 2006 | | | 12.75 | | | 0.01 | | | | 0.22 | | | | 0.23 | | | | (0.02 | ) | | | (0.75 | ) | | | (0.77 | ) | | | 12.21 | | 1.78 | | | | 886 | | 1.05 | | | 0.10 | | | 1.69 | | | 101.34 | |
Year Ended July 31, 2005 | | | 10.33 | | | 0.03 | | | | 2.42 | | | | 2.45 | | | | (0.03 | ) | | | — | | | | (0.03 | ) | | | 12.75 | | 23.69 | | | | 760 | | 1.05 | | | 0.25 | | | 1.95 | | | 97.23 | |
CLASS C | | | | | | | | | | | | | | | | | | | | | | | | | | | | | | | | | | | | | | | | | | | | | | | | |
Year Ended July 31, 2009 | | $ | 9.11 | | $ | (0.03 | ) | | $ | (2.37 | ) | | $ | (2.40 | ) | | $ | (0.01 | ) | | $ | — | | | $ | (0.01 | ) | | $ | 6.70 | | (26.27 | %) | | $ | 144 | | 2.10 | % | | (0.21 | %) | | 2.35 | % | | 120.38 | % |
Year Ended July 31, 2008 | | | 11.93 | | | (0.06 | ) | | | (1.52 | ) | | | (1.58 | ) | | | — | | | | (1.24 | ) | | | (1.24 | ) | | | 9.11 | | (14.22 | ) | | | 378 | | 1.90 | | | (0.54 | ) | | 2.15 | | | 130.00 | |
Year Ended July 31, 2007 | | | 12.07 | | | (0.05 | ) | | | 1.74 | | | | 1.69 | | | | (0.03 | ) | | | (1.80 | ) | | | (1.83 | ) | | | 11.93 | | 14.73 | | | | 482 | | 1.82 | | | (0.29 | ) | | 2.20 | | | 117.44 | |
Year Ended July 31, 2006 | | | 12.68 | | | (0.08 | ) | | | 0.22 | | | | 0.14 | | | | — | | | | (0.75 | ) | | | (0.75 | ) | | | 12.07 | | 1.07 | | | | 547 | | 1.80 | | | (0.64 | ) | | 2.18 | | | 101.34 | |
Year Ended July 31, 2005 | | | 10.32 | | | (0.03 | ) | | | 2.39 | | | | 2.36 | | | | — | | | | — | | | | — | | | | 12.68 | | 22.87 | | | | 509 | | 1.80 | | | (0.50 | ) | | 2.21 | | | 97.23 | |
CLASS Y | | | | | | | | | | | | | | | | | | | | | | | | | | | | | | | | | | | | | | | | | | | | | | | | |
Year Ended July 31, 2009 | | $ | 9.38 | | $ | 0.05 | | | $ | (2.45 | ) | | $ | (2.40 | ) | | $ | (0.05 | ) | | $ | — | | | $ | (0.05 | ) | | $ | 6.93 | | (25.51 | %) | | $ | 31,487 | | 1.10 | % | | 0.83 | % | | 1.35 | % | | 120.38 | % |
Year Ended July 31, 2008 | | | 12.19 | | | 0.05 | | | | (1.56 | ) | | | (1.51 | ) | | | (0.06 | ) | | | (1.24 | ) | | | (1.30 | ) | | | 9.38 | | (13.36 | ) | | | 55,037 | | 0.90 | | | 0.46 | | | 1.15 | | | 130.00 | |
Year Ended July 31, 2007 | | | 12.23 | | | 0.08 | | | | 1.76 | | | | 1.84 | | | | (0.08 | ) | | | (1.80 | ) | | | (1.88 | ) | | | 12.19 | | 15.87 | | | | 70,422 | | 0.82 | | | 0.65 | | | 1.20 | | | 117.44 | |
Year Ended July 31, 2006 | | | 12.76 | | | 0.04 | | | | 0.22 | | | | 0.26 | | | | (0.04 | ) | | | (0.75 | ) | | | (0.79 | ) | | | 12.23 | | 2.06 | | | | 73,195 | | 0.80 | | | 0.35 | | | 1.18 | | | 101.34 | |
Year Ended July 31, 2005 | | | 10.34 | | | 0.05 | | | | 2.42 | | | | 2.47 | | | | (0.05 | ) | | | — | | | | (0.05 | ) | | | 12.76 | | 23.92 | | | | 83,141 | | 0.80 | | | 0.47 | | | 1.19 | | | 97.23 | |
| (a) | Excludes sales charge and/or redemption fees, if applicable. |
| (b) | During the period certain fees were reduced. If such fee reductions had not occurred the ratios would have been as indicated. |
| (c) | Portfolio turnover is calculated on the basis of the Fund as a whole without distinguishing between the classes of shares issued. |
See notes to financial statements.
92
PACIFIC CAPITAL FUNDS
Growth Stock Fund
Financial Highlights
(Selected data for a share of capital stock outstanding throughout the periods indicated)
| | | | | | | | | | | | | | | | | | | | | | | | | | | | | | | | | | | | | | | | | | | | | | | |
| | | | | Investment Activities | | | Distributions | | | | | | | | Ratios/Supplemental Data | |
| | | Net Asset
Value,
Beginning
of Period | | Net
Investment
Income
(Loss) | | | Net Realized
and Unrealized
Gains (Losses)
on Investments | | | Total from
Investment
Activities | | | Dividends
from Net
Investment
Income | | | Distributions
from Net
Realized
Gains | | Total
Dividends
and
Distributions | | | Net Asset
Value,
End of
Period | | Total
Return (a) | | | Net Assets,
End of
Period (000’s) | | Ratio of
Expenses
to Average
Net Assets | | | Ratio of Net
Investment
Income
(Loss) to
Average
Net Assets | | | Ratio of
Expenses
to Average
Net Assets (b) | | | Portfolio
Turnover (c) | |
CLASS A | | | | | | | | | | | | | | | | | | | | | | | | | | | | | | | | | | | | | | | | | | | | | | | |
Year Ended July 31, 2009 | | $ | 8.81 | | $ | 0.03 | | | $ | (1.64 | ) | | $ | (1.61 | ) | | $ | (0.04 | ) | | $ | — | | $ | (0.04 | ) | | $ | 7.16 | | (18.22 | %) | | $ | 7,329 | | 1.31 | % | | 0.47 | % | | 1.66 | % | | 86.70 | % |
Year Ended July 31, 2008 | | | 9.53 | | | 0.03 | | | | (0.71 | ) | | | (0.68 | ) | | | (0.04 | ) | | | — | | | (0.04 | ) | | | 8.81 | | (7.20 | ) | | | 7,868 | | 1.16 | | | 0.30 | | | 1.51 | | | 77.71 | |
Year Ended July 31, 2007 | | | 8.40 | | | (0.01 | ) | | | 1.14 | | | | 1.13 | | | | — | (d) | | | — | | | — | (d) | | | 9.53 | | 13.49 | | | | 7,957 | | 1.34 | | | (0.03 | ) | | 1.51 | | | 192.57 | |
Year Ended July 31, 2006 | | | 8.67 | | | (0.02 | )(e) | | | (0.25 | )(e) | | | (0.27 | ) | | | — | | | | — | | | — | | | | 8.40 | | (3.11 | ) | | | 7,979 | | 1.39 | | | (0.28 | ) | | 1.73 | | | 191.06 | |
Year Ended July 31, 2005 | | | 7.87 | | | — | | | | 0.81 | | | | 0.81 | | | | (0.01 | ) | | | — | | | (0.01 | ) | | | 8.67 | | 10.29 | | | | 9,997 | | 1.40 | | | (0.06 | ) | | 1.91 | | | 174.37 | (f) |
CLASS B | | | | | | | | | | | | | | | | | | | | | | | | | | | | | | | | | | | | | | | | | | | | | | | |
Year Ended July 31, 2009 | | $ | 8.10 | | $ | (0.03 | ) | | $ | (1.50 | ) | | $ | (1.53 | ) | | $ | (0.01 | ) | | $ | — | | $ | (0.01 | ) | | $ | 6.56 | | (18.89 | %) | | $ | 481 | | 2.06 | % | | (0.17 | %) | | 2.26 | % | | 86.70 | % |
Year Ended July 31, 2008 | | | 8.81 | | | (0.07 | ) | | | (0.63 | ) | | | (0.70 | ) | | | (0.01 | ) | | | — | | | (0.01 | ) | | | 8.10 | | (7.94 | ) | | | 2,259 | | 1.91 | | | (0.38 | ) | | 2.11 | | | 77.71 | |
Year Ended July 31, 2007 | | | 7.82 | | | (0.09 | ) | | | 1.08 | | | | 0.99 | | | | — | (d) | | | — | | | — | (d) | | | 8.81 | | 12.69 | | | | 5,956 | | 2.09 | | | (0.78 | ) | | 2.11 | | | 192.57 | |
Year Ended July 31, 2006 | | | 8.14 | | | (0.08 | )(e) | | | (0.24 | )(e) | | | (0.32 | ) | | | — | | | | — | | | — | | | | 7.82 | | (3.93 | ) | | | 8,898 | | 2.14 | | | (1.03 | ) | | 2.20 | | | 191.06 | |
Year Ended July 31, 2005 | | | 7.43 | | | (0.07 | ) | | | 0.78 | | | | 0.71 | | | | — | | | | — | | | — | | | | 8.14 | | 9.56 | | | | 12,127 | | 2.15 | | | (0.82 | ) | | 2.16 | | | 174.37 | (f) |
CLASS C | | | | | | | | | | | | | | | | | | | | | | | | | | | | | | | | | | | | | | | | | | | | | | | |
Year Ended July 31, 2009 | | $ | 8.09 | | $ | (0.04 | ) | | $ | (1.48 | ) | | $ | (1.52 | ) | | $ | (0.01 | ) | | $ | — | | $ | (0.01 | ) | | $ | 6.56 | | (18.77 | %) | | $ | 439 | | 2.06 | % | | (0.22 | %) | | 2.26 | % | | 86.70 | % |
Year Ended July 31, 2008 | | | 8.80 | | | (0.05 | ) | | | (0.65 | ) | | | (0.70 | ) | | | (0.01 | ) | | | — | | | (0.01 | ) | | | 8.09 | | (7.95 | ) | | | 1,291 | | 1.91 | | | (0.42 | ) | | 2.11 | | | 77.71 | |
Year Ended July 31, 2007 | | | 7.82 | | | (0.08 | ) | | | 1.06 | | | | 0.98 | | | | — | (d) | | | — | | | — | (d) | | | 8.80 | | 12.55 | | | | 1,851 | | 2.09 | | | (0.78 | ) | | 2.11 | | | 192.57 | |
Year Ended July 31, 2006 | | | 8.13 | | | (0.08 | )(e) | | | (0.23 | )(e) | | | (0.31 | ) | | | — | | | | — | | | — | | | | 7.82 | | (3.81 | ) | | | 1,926 | | 2.14 | | | (1.03 | ) | | 2.20 | | | 191.06 | |
Year Ended July 31, 2005 | | | 7.43 | | | (0.05 | ) | | | 0.76 | | | | 0.71 | | | | (0.01 | ) | | | — | | | (0.01 | ) | | | 8.13 | | 9.59 | | | | 1,987 | | 2.15 | | | (1.15 | ) | | 2.18 | | | 174.37 | (f) |
CLASS Y | | | | | | | | | | | | | | | | | | | | | | | | | | | | | | | | | | | | | | | | | | | | | | | |
Year Ended July 31, 2009 | | $ | 9.10 | | $ | 0.05 | | | $ | (1.70 | ) | | $ | (1.65 | ) | | $ | (0.05 | ) | | $ | — | | $ | (0.05 | ) | | $ | 7.40 | | (18.03 | %) | | $ | 67,431 | | 1.06 | % | | 0.76 | % | | 1.26 | % | | 86.70 | % |
Year Ended July 31, 2008 | | | 9.84 | | | 0.06 | | | | (0.74 | ) | | | (0.68 | ) | | | (0.06 | ) | | | — | | | (0.06 | ) | | | 9.10 | | (6.98 | ) | | | 116,888 | | 0.91 | | | 0.57 | | | 1.11 | | | 77.71 | |
Year Ended July 31, 2007 | | | 8.66 | | | 0.02 | | | | 1.17 | | | | 1.19 | | | | (0.01 | ) | | | — | | | (0.01 | ) | | | 9.84 | | 13.78 | | | | 153,583 | | 1.09 | | | 0.22 | | | 1.11 | | | 192.57 | |
Year Ended July 31, 2006 | | | 8.92 | | | — | (e) | | | (0.26 | )(e) | | | (0.26 | ) | | | — | | | | — | | | — | | | | 8.66 | | (2.91 | ) | | | 144,801 | | 1.14 | | | (0.03 | ) | | 1.20 | | | 191.06 | |
Year Ended July 31, 2005 | | | 8.09 | | | 0.02 | | | | 0.83 | | | | 0.85 | | | | (0.02 | ) | | | — | | | (0.02 | ) | | | 8.92 | | 10.50 | | | | 218,750 | | 1.15 | | | 0.19 | | | 1.16 | | | 174.37 | (f) |
| (a) | Excludes sales charge and/or redemption fees, if applicable. |
| (b) | During the period certain fees were reduced. If such fee reductions had not occurred the ratios would have been as indicated. |
| (c) | Portfolio turnover is calculated on the basis of the Fund as a whole without distinguishing between the classes of shares issued. |
| (d) | Less than $0.005 per share. |
| (e) | Amounts calculated using the daily average shares method. |
| (f) | The portfolio turnover rate increased significantly during the period. This increase was attributable to changes in equity management staff, cashflows into and out of the Fund, as well as tactical portfolio adjustments made in response to conditions in the energy and raw materials markets. The basic characteristics of the Fund in terms of market capitalization, style, and diversification have not changed. |
See notes to financial statements.
93
PACIFIC CAPITAL FUNDS
Growth and Income Fund
Financial Highlights
(Selected data for a share of capital stock outstanding throughout the periods indicated)
| | | | | | | | | | | | | | | | | | | | | | | | | | | | | | | | | | | | | | | | | | | | | | | | |
| | | | | Investment Activities | | | Distributions | | | | | | | | Ratios/Supplemental Data | |
| | | Net Asset
Value,
Beginning
of Period | | Net
Investment
Income
(Loss) | | | Net Realized
and Unrealized
Gains (Losses)
on Investments | | | Total from
Investment
Activities | | | Dividends
from Net
Investment
Income | | | Distributions
from Net
Realized
Gains | | | Total
Dividends
and
Distributions | | | Net Asset
Value,
End of
Period | | Total
Return (a) | | | Net Assets,
End of
Period (000’s) | | Ratio of
Expenses
to Average
Net Assets | | | Ratio of Net
Investment
Income
(Loss) to
Average
Net Assets | | | Ratio of
Expenses
to Average
Net Assets (b) | | | Portfolio
Turnover (c) | |
CLASS A | | | | | | | | | | | | | | | | | | | | | | | | | | | | | | | | | | | | | | | | | | | | | | | | |
Year Ended July 31, 2009 | | $ | 12.24 | | $ | 0.11 | | | $ | (2.93 | ) | | $ | (2.82 | ) | | $ | (0.12 | ) | | $ | — | | | $ | (0.12 | ) | | $ | 9.30 | | (22.98 | %) | | $ | 4,597 | | 1.28 | % | | 1.20 | % | | 1.63 | % | | 79.57 | % |
Year Ended July 31, 2008 | | | 14.58 | | | 0.10 | | | | (1.55 | ) | | | (1.45 | ) | | | (0.10 | ) | | | (0.79 | ) | | | (0.89 | ) | | | 12.24 | | (10.65 | ) | | | 5,401 | | 1.15 | | | 0.77 | | | 1.50 | | | 60.54 | |
Year Ended July 31, 2007 | | | 13.32 | | | 0.07 | | | | 1.27 | | | | 1.34 | | | | (0.08 | ) | | | — | | | | (0.08 | ) | | | 14.58 | | 10.06 | | | | 6,022 | | 1.31 | | | 0.51 | | | 1.48 | | | 170.64 | |
Year Ended July 31, 2006 | | | 13.32 | | | 0.04 | | | | — | | | | 0.04 | | | | (0.04 | ) | | | — | | | | (0.04 | ) | | | 13.32 | | 0.28 | | | | 5,519 | | 1.38 | | | 0.29 | | | 1.71 | | | 170.39 | |
Year Ended July 31, 2005 | | | 11.65 | | | 0.06 | | | | 1.67 | | | | 1.73 | | | | (0.06 | ) | | | — | | | | (0.06 | ) | | | 13.32 | | 14.83 | | | | 5,554 | | 1.42 | | | 0.42 | | | 1.94 | | | 181.04 | (d) |
CLASS B | | | | | | | | | | | | | | | | | | | | | | | | | | | | | | | | | | | | | | | | | | | | | | | | |
Year Ended July 31, 2009 | | $ | 11.41 | | $ | 0.06 | | | $ | (2.75 | ) | | $ | (2.69 | ) | | $ | (0.05 | ) | | $ | — | | | $ | (0.05 | ) | | $ | 8.67 | | (23.53 | %) | | $ | 236 | | 2.03 | % | | 0.54 | % | | 2.23 | % | | 79.57 | % |
Year Ended July 31, 2008 | | | 13.66 | | | 0.01 | | | | (1.46 | ) | | | (1.45 | ) | | | (0.01 | ) | | | (0.79 | ) | | | (0.80 | ) | | | 11.41 | | (11.37 | ) | | | 1,114 | | 1.90 | | | 0.08 | | | 2.10 | | | 60.54 | |
Year Ended July 31, 2007 | | | 12.51 | | | (0.04 | ) | | | 1.20 | | | | 1.16 | | | | (0.01 | ) | | | — | | | | (0.01 | ) | | | 13.66 | | 9.24 | | | | 3,141 | | 2.06 | | | (0.20 | ) | | 2.08 | | | 170.64 | |
Year Ended July 31, 2006 | | | 12.57 | | | (0.07 | ) | | | 0.01 | | | | (0.06 | ) | | | — | | | | — | | | | — | | | | 12.51 | | (0.48 | ) | | | 5,330 | | 2.13 | | | (0.44 | ) | | 2.19 | | | 170.39 | |
Year Ended July 31, 2005 | | | 11.06 | | | (0.04 | ) | | | 1.58 | | | | 1.54 | | | | (0.03 | ) | | | — | | | | (0.03 | ) | | | 12.57 | | 13.93 | | | | 7,193 | | 2.17 | | | (0.33 | ) | | 2.19 | | | 181.04 | (d) |
CLASS C | | | | | | | | | | | | | | | | | | | | | | | | | | | | | | | | | | | | | | | | | | | | | | | | |
Year Ended July 31, 2009 | | $ | 11.40 | | $ | 0.04 | | | $ | (2.73 | ) | | $ | (2.69 | ) | | $ | (0.06 | ) | | $ | — | | | $ | (0.06 | ) | | $ | 8.65 | | (23.57 | %) | | $ | 394 | | 2.03 | % | | 0.50 | % | | 2.23 | % | | 79.57 | % |
Year Ended July 31, 2008 | | | 13.65 | | | — | (e) | | | (1.45 | ) | | | (1.45 | ) | | | (0.01 | ) | | | (0.79 | ) | | | (0.80 | ) | | | 11.40 | | (11.38 | ) | | | 1,336 | | 1.90 | | | 0.03 | | | 2.10 | | | 60.54 | |
Year Ended July 31, 2007 | | | 12.50 | | | (0.03 | ) | | | 1.19 | | | | 1.16 | | | | (0.01 | ) | | | — | | | | (0.01 | ) | | | 13.65 | | 9.25 | | | | 1,774 | | 2.06 | | | (0.23 | ) | | 2.08 | | | 170.64 | |
Year Ended July 31, 2006 | | | 12.56 | | | (0.06 | ) | | | — | | | | (0.06 | ) | | | — | | | | — | | | | — | | | | 12.50 | | (0.48 | ) | | | 1,913 | | 2.13 | | | (0.45 | ) | | 2.19 | | | 170.39 | |
Year Ended July 31, 2005 | | | 11.06 | | | (0.02 | ) | | | 1.57 | | | | 1.55 | | | | (0.05 | ) | | | — | | | | (0.05 | ) | | | 12.56 | | 14.00 | | | | 1,911 | | 2.17 | | | (0.74 | ) | | 2.20 | | | 181.04 | (d) |
CLASS Y | | | | | | | | | | | | | | | | | | | | | | | | | | | | | | | | | | | | | | | | | | | | | | | | |
Year Ended July 31, 2009 | | $ | 12.34 | | $ | 0.14 | | | $ | (2.96 | ) | | $ | (2.82 | ) | | $ | (0.14 | ) | | $ | — | | | $ | (0.14 | ) | | $ | 9.38 | | (22.77 | %) | | $ | 64,022 | | 1.03 | % | | 1.49 | % | | 1.23 | % | | 79.57 | % |
Year Ended July 31, 2008 | | | 14.70 | | | 0.15 | | | | (1.58 | ) | | | (1.43 | ) | | | (0.14 | ) | | | (0.79 | ) | | | (0.93 | ) | | | 12.34 | | (10.48 | ) | | | 108,492 | | 0.90 | | | 1.03 | | | 1.10 | | | 60.54 | |
Year Ended July 31, 2007 | | | 13.42 | | | 0.12 | | | | 1.28 | | | | 1.40 | | | | (0.12 | ) | | | — | | | | (0.12 | ) | | | 14.70 | | 10.39 | | | | 144,123 | | 1.06 | | | 0.77 | | | 1.08 | | | 170.64 | |
Year Ended July 31, 2006 | | | 13.42 | | | 0.07 | | | | — | | | | 0.07 | | | | (0.07 | ) | | | — | | | | (0.07 | ) | | | 13.42 | | 0.52 | | | | 152,521 | | 1.13 | | | 0.54 | | | 1.19 | | | 170.39 | |
Year Ended July 31, 2005 | | | 11.73 | | | 0.09 | | | | 1.68 | | | | 1.77 | | | | (0.08 | ) | | | — | | | | (0.08 | ) | | | 13.42 | | 15.12 | | | | 136,311 | | 1.17 | | | 0.67 | | | 1.19 | | | 181.04 | (d) |
| (a) | Excludes sales charge and/or redemption fees, if applicable. |
| (b) | During the period certain fees were reduced. If such fee reductions had not occurred the ratios would have been as indicated. |
| (c) | Portfolio turnover is calculated on the basis of the Fund as a whole without distinguishing between the classes of shares issued. |
| (d) | The portfolio turnover rate increased significantly during the period. This increase was attributable to changes in equity management staff, cashflows into and out of the Fund, as well as tactical portfolio adjustments made in response to conditions in the energy and raw materials markets. The basic characteristics of the Fund in terms of market capitalization, style, and diversification have not changed. |
| (e) | Less than $0.005 per share. |
See notes to financial statements.
94
PACIFIC CAPITAL FUNDS
Value Fund
Financial Highlights
(Selected data for a share of capital stock outstanding throughout the periods indicated)
| | | | | | | | | | | | | | | | | | | | | | | | | | | | | | | | | | | | | | | | | | | | | | | |
| | | | | Investment Activities | | | Distributions | | | | | | | | Ratios/Supplemental Data | |
| | | Net Asset
Value,
Beginning
of Period | | Net
Investment
Income | | Net Realized
and Unrealized
Gains (Losses)
on Investments | | | Total from
Investment
Activities | | | Dividends
from Net
Investment
Income | | | Distributions
from Net
Realized
Gains | | | Total
Dividends
and
Distributions | | | Net Asset
Value,
End of
Period | | Total
Return (a) | | | Net Assets,
End of
Period (000’s) | | Ratio of
Expenses
to Average
Net Assets | | | Ratio of Net
Investment
Income
(Loss) to
Average
Net Assets | | | Ratio of
Expenses
to Average
Net Assets (b) | | | Portfolio
Turnover (c) | |
CLASS A | | | | | | | | | | | | | | | | | | | | | | | | | | | | | | | | | | | | | | | | | | | | | | | |
Year Ended July 31, 2009 | | $ | 7.43 | | $ | 0.11 | | $ | (1.69 | ) | | $ | (1.58 | ) | | $ | (0.11 | ) | | $ | — | | | $ | (0.11 | ) | | $ | 5.74 | | (21.08 | %) | | $ | 2,150 | | 1.24 | % | | 1.85 | % | | 1.59 | % | | 96.77 | % |
Year Ended July 31, 2008 | | | 10.55 | | | 0.12 | | | (1.37 | ) | | | (1.25 | ) | | | (0.12 | ) | | | (1.75 | ) | | | (1.87 | ) | | | 7.43 | | (14.09 | ) | | | 2,157 | | 1.13 | | | 1.28 | | | 1.48 | | | 92.94 | |
Year Ended July 31, 2007 | | | 10.69 | | | 0.12 | | | 1.15 | | | | 1.27 | | | | (0.12 | ) | | | (1.29 | ) | | | (1.41 | ) | | | 10.55 | | 12.10 | | | | 2,962 | | 1.28 | | | 1.05 | | | 1.45 | | | 183.84 | |
Year Ended July 31, 2006 | | | 9.87 | | | 0.09 | | | 0.83 | | | | 0.92 | | | | (0.10 | ) | | | — | | | | (0.10 | ) | | | 10.69 | | 9.39 | | | | 2,991 | | 1.34 | | | 0.91 | | | 1.67 | | | 141.07 | |
Year Ended July 31, 2005 | | | 8.37 | | | 0.08 | | | 1.50 | | | | 1.58 | | | | (0.08 | ) | | | — | | | | (0.08 | ) | | | 9.87 | | 18.75 | | | | 2,910 | | 1.36 | | | 0.78 | | | 1.87 | | | 129.24 | (d) |
CLASS B | | | | | | | | | | | | | | | | | | | | | | | | | | | | | | | | | | | | | | | | | | | | | | | |
Year Ended July 31, 2009 | | $ | 7.25 | | $ | 0.06 | | $ | (1.65 | ) | | $ | (1.59 | ) | | $ | (0.06 | ) | | $ | — | | | $ | (0.06 | ) | | $ | 5.60 | | (21.78 | %) | | $ | 249 | | 1.99 | % | | 1.20 | % | | 2.19 | % | | 96.77 | % |
Year Ended July 31, 2008 | | | 10.34 | | | 0.05 | | | (1.34 | ) | | | (1.29 | ) | | | (0.05 | ) | | | (1.75 | ) | | | (1.80 | ) | | | 7.25 | | (14.66 | ) | | | 528 | | 1.88 | | | 0.57 | | | 2.08 | | | 92.94 | |
Year Ended July 31, 2007 | | | 10.51 | | | 0.03 | | | 1.13 | | | | 1.16 | | | | (0.04 | ) | | | (1.29 | ) | | | (1.33 | ) | | | 10.34 | | 11.24 | | | | 1,102 | | 2.03 | | | 0.33 | | | 2.05 | | | 183.84 | |
Year Ended July 31, 2006 | | | 9.70 | | | 0.02 | | | 0.81 | | | | 0.83 | | | | (0.02 | ) | | | — | | | | (0.02 | ) | | | 10.51 | | 8.57 | | | | 1,433 | | 2.09 | | | 0.17 | | | 2.15 | | | 141.07 | |
Year Ended July 31, 2005 | | | 8.25 | | | — | | | 1.48 | | | | 1.48 | | | | (0.03 | ) | | | — | | | | (0.03 | ) | | | 9.70 | | 18.00 | | | | 1,460 | | 2.11 | | | 0.04 | | | 2.12 | | | 129.24 | (d) |
CLASS C | | | | | | | | | | | | | | | | | | | | | | | | | | | | | | | | | | | | | | | | | | | | | | | |
Year Ended July 31, 2009 | | $ | 7.27 | | $ | 0.06 | | $ | (1.65 | ) | | $ | (1.59 | ) | | $ | (0.06 | ) | | $ | — | | | $ | (0.06 | ) | | $ | 5.62 | | (21.79 | %) | | $ | 468 | | 1.99 | % | | 1.17 | % | | 2.19 | % | | 96.77 | % |
Year Ended July 31, 2008 | | | 10.37 | | | 0.05 | | | (1.34 | ) | | | (1.29 | ) | | | (0.06 | ) | | | (1.75 | ) | | | (1.81 | ) | | | 7.27 | | (14.69 | ) | | | 1,321 | | 1.88 | | | 0.55 | | | 2.08 | | | 92.94 | |
Year Ended July 31, 2007 | | | 10.54 | | | 0.03 | | | 1.13 | | | | 1.16 | | | | (0.04 | ) | | | (1.29 | ) | | | (1.33 | ) | | | 10.37 | | 11.21 | | | | 1,831 | | 2.03 | | | 0.31 | | | 2.05 | | | 183.84 | |
Year Ended July 31, 2006 | | | 9.74 | | | 0.02 | | | 0.81 | | | | 0.83 | | | | (0.03 | ) | | | — | | | | (0.03 | ) | | | 10.54 | | 8.57 | | | | 2,082 | | 2.09 | | | 0.16 | | | 2.15 | | | 141.07 | |
Year Ended July 31, 2005 | | | 8.25 | | | — | | | 1.50 | | | | 1.50 | | | | (0.01 | ) | | | — | | | | (0.01 | ) | | | 9.74 | | 18.00 | | | | 1,833 | | 2.11 | | | (0.19 | ) | | 2.14 | | | 129.24 | (d) |
CLASS Y | | | | | | | | | | | | | | | | | | | | | | | | | | | | | | | | | | | | | | | | | | | | | | | |
Year Ended July 31, 2009 | | $ | 7.45 | | $ | 0.12 | | $ | (1.70 | ) | | $ | (1.58 | ) | | $ | (0.12 | ) | | $ | — | | | $ | (0.12 | ) | | $ | 5.75 | | (20.97 | %) | | $ | 61,244 | | 0.99 | % | | 2.16 | % | | 1.19 | % | | 96.77 | % |
Year Ended July 31, 2008 | | | 10.57 | | | 0.15 | | | (1.37 | ) | | | (1.22 | ) | | | (0.15 | ) | | | (1.75 | ) | | | (1.90 | ) | | | 7.45 | | (13.83 | ) | | | 104,435 | | 0.88 | | | 1.54 | | | 1.08 | | | 92.94 | |
Year Ended July 31, 2007 | | | 10.71 | | | 0.14 | | | 1.15 | | | | 1.29 | | | | (0.14 | ) | | | (1.29 | ) | | | (1.43 | ) | | | 10.57 | | 12.33 | | | | 143,807 | | 1.03 | | | 1.30 | | | 1.05 | | | 183.84 | |
Year Ended July 31, 2006 | | | 9.89 | | | 0.13 | | | 0.82 | | | | 0.95 | | | | (0.13 | ) | | | — | | | | (0.13 | ) | | | 10.71 | | 9.64 | | | | 145,676 | | 1.09 | | | 1.18 | | | 1.15 | | | 141.07 | |
Year Ended July 31, 2005 | | | 8.39 | | | 0.10 | | | 1.50 | | | | 1.60 | | | | (0.10 | ) | | | — | | | | (0.10 | ) | | | 9.89 | | 19.12 | | | | 182,279 | | 1.11 | | | 1.05 | | | 1.12 | | | 129.24 | (d) |
| (a) | Excludes sales charge and/or redemption fees, if applicable. |
| (b) | During the period certain fees were reduced. If such fee reductions had not occurred the ratios would have been as indicated. |
| (c) | Portfolio turnover is calculated on the basis of the Fund as a whole without distinguishing between the classes of shares issued. |
| (d) | The portfolio turnover rate increased significantly during the period. This increase was attributable to changes in equity management staff, cashflows into and out of the Fund, as well as tactical portfolio adjustments made in response to conditions in the energy and raw materials markets. The basic characteristics of the Fund in terms of market capitalization, style, and diversification have not changed. |
See notes to financial statements.
95
PACIFIC CAPITAL FUNDS
High Grade Core Fixed Income Fund
Financial Highlights
(Selected data for a share of capital stock outstanding throughout the periods indicated)
| | | | | | | | | | | | | | | | | | | | | | | | | | | | | | | | | | | | | | | | | | | | | | | | |
| | | | | Investment Activities | | | Distributions | | | | | | | | Ratios/Supplemental Data | |
| | | Net Asset
Value,
Beginning
of Period | | Net
Investment
Income | | | Net Realized
and Unrealized
Gains (Losses)
on Investments | | | Total from
Investment
Activities | | | Dividends
from Net
Investment
Income | | | Distributions
from Net
Realized
Gains | | | Total
Dividends
and
Distributions | | | Net Asset
Value,
End of
Period | | Total
Return (a) | | | Net Assets,
End of
Period (000’s) | | Ratio of
Expenses
to Average
Net Assets | | | Ratio of Net
Investment
Income
to Average
Net Assets | | | Ratio of
Expenses
to Average
Net Assets (b) | | | Portfolio
Turnover (c) | |
CLASS A | | | | | | | | | | | | | | | | | | | | | | | | | | | | | | | | | | | | | | | | | | | | | | | | |
Year Ended July 31, 2009 | | $ | 10.70 | | $ | 0.44 | (d) | | $ | 0.28 | (d) | | $ | 0.72 | | | $ | (0.43 | ) | | $ | — | | | $ | (0.43 | ) | | $ | 10.99 | | 6.93 | % | | $ | 3,356 | | 1.01 | % | | 4.10 | % | | 1.31 | % | | 46.98 | % |
Year Ended July 31, 2008 | | | 10.62 | | | 0.48 | | | | 0.07 | | | | 0.55 | | | | (0.47 | ) | | | — | | | | (0.47 | ) | | | 10.70 | | 5.21 | | | | 3,259 | | 0.94 | | | 4.42 | | | 1.24 | | | 65.72 | |
Year Ended July 31, 2007 | | | 10.61 | | | 0.50 | | | | — | | | | 0.50 | | | | (0.49 | ) | | | — | | | | (0.49 | ) | | | 10.62 | | 4.75 | | | | 3,115 | | 0.93 | | | 4.67 | | | 1.23 | | | 66.38 | |
Year Ended July 31, 2006 | | | 11.02 | | | 0.44 | | | | (0.41 | ) | | | 0.03 | | | | (0.44 | ) | | | — | (e) | | | (0.44 | ) | | | 10.61 | | 0.29 | | | | 3,689 | | 0.96 | | | 4.06 | | | 1.45 | | | 85.53 | |
Year Ended July 31, 2005 | | | 11.05 | | | 0.40 | | | | — | | | | 0.40 | | | | (0.40 | ) | | | (0.03 | ) | | | (0.43 | ) | | | 11.02 | | 3.67 | | | | 4,577 | | 1.00 | | | 3.58 | | | 1.67 | | | 27.95 | |
CLASS B | | | | | | | | | | | | | | | | | | | | | | | | | | | | | | | | | | | | | | | | | | | | | | | | |
Year Ended July 31, 2009 | | $ | 10.67 | | $ | 0.36 | | | $ | 0.28 | | | $ | 0.64 | | | $ | (0.35 | ) | | $ | — | | | $ | (0.35 | ) | | $ | 10.96 | | 6.14 | % | | $ | 519 | | 1.76 | % | | 3.38 | % | | 1.91 | % | | 46.98 | % |
Year Ended July 31, 2008 | | | 10.60 | | | 0.40 | | | | 0.06 | | | | 0.46 | | | | (0.39 | ) | | | — | | | | (0.39 | ) | | | 10.67 | | 4.34 | | | | 881 | | 1.69 | | | 3.70 | | | 1.84 | | | 65.72 | |
Year Ended July 31, 2007 | | | 10.59 | | | 0.42 | | | | — | | | | 0.42 | | | | (0.41 | ) | | | — | | | | (0.41 | ) | | | 10.60 | | 3.98 | | | | 1,634 | | 1.68 | | | 3.91 | | | 1.83 | | | 66.38 | |
Year Ended July 31, 2006 | | | 11.00 | | | 0.36 | | | | (0.41 | ) | | | (0.05 | ) | | | (0.36 | ) | | | — | (e) | | | (0.36 | ) | | | 10.59 | | (0.45 | ) | | | 2,944 | | 1.71 | | | 3.32 | | | 1.92 | | | 85.53 | |
Year Ended July 31, 2005 | | | 11.03 | | | 0.32 | | | | — | | | | 0.32 | | | | (0.32 | ) | | | (0.03 | ) | | | (0.35 | ) | | | 11.00 | | 2.90 | | | | 4,019 | | 1.75 | | | 2.83 | | | 1.92 | | | 27.95 | |
CLASS C | | | | | | | | | | | | | | | | | | | | | | | | | | | | | | | | | | | | | | | | | | | | | | | | |
Year Ended July 31, 2009 | | $ | 10.67 | | $ | 0.36 | | | $ | 0.29 | | | $ | 0.65 | | | $ | (0.35 | ) | | $ | — | | | $ | (0.35 | ) | | $ | 10.97 | | 6.24 | % | | $ | 462 | | 1.76 | % | | 3.36 | % | | 1.91 | % | | 46.98 | % |
Year Ended July 31, 2008 | | | 10.60 | | | 0.40 | | | | 0.06 | | | | 0.46 | | | | (0.39 | ) | | | — | | | | (0.39 | ) | | | 10.67 | | 4.34 | | | | 860 | | 1.69 | | | 3.67 | | | 1.84 | | | 65.72 | |
Year Ended July 31, 2007 | | | 10.59 | | | 0.42 | | | | — | | | | 0.42 | | | | (0.41 | ) | | | — | | | | (0.41 | ) | | | 10.60 | | 3.98 | | | | 964 | | 1.68 | | | 3.90 | | | 1.83 | | | 66.38 | |
Year Ended July 31, 2006 | | | 11.00 | | | 0.36 | | | | (0.41 | ) | | | (0.05 | ) | | | (0.36 | ) | | | — | (e) | | | (0.36 | ) | | | 10.59 | | (0.45 | ) | | | 1,322 | | 1.71 | | | 3.34 | | | 1.92 | | | 85.53 | |
Year Ended July 31, 2005 | | | 11.02 | | | 0.32 | | | | 0.01 | | | | 0.33 | | | | (0.32 | ) | | | (0.03 | ) | | | (0.35 | ) | | | 11.00 | | 3.00 | | | | 1,188 | | 1.75 | | | 2.90 | | | 1.93 | | | 27.95 | |
CLASS Y | | | | | | | | | | | | | | | | | | | | | | | | | | | | | | | | | | | | | | | | | | | | | | | | |
Year Ended July 31, 2009 | | $ | 10.76 | | $ | 0.47 | (d) | | $ | 0.28 | (d) | | $ | 0.75 | | | $ | (0.46 | ) | | $ | — | | | $ | (0.46 | ) | | $ | 11.05 | | 7.15 | % | | $ | 198,268 | | 0.76 | % | | 4.32 | % | | 0.91 | % | | 46.98 | % |
Year Ended July 31, 2008 | | | 10.68 | | | 0.51 | | | | 0.07 | | | | 0.58 | | | | (0.50 | ) | | | — | | | | (0.50 | ) | | | 10.76 | | 5.44 | | | | 278,815 | | 0.69 | | | 4.64 | | | 0.84 | | | 65.72 | |
Year Ended July 31, 2007 | | | 10.67 | | | 0.53 | | | | — | | | | 0.53 | | | | (0.52 | ) | | | — | | | | (0.52 | ) | | | 10.68 | | 4.98 | | | | 308,116 | | 0.68 | | | 4.88 | | | 0.83 | | | 66.38 | |
Year Ended July 31, 2006 | | | 11.09 | | | 0.47 | | | | (0.42 | ) | | | 0.05 | | | | (0.47 | ) | | | — | (e) | | | (0.47 | ) | | | 10.67 | | 0.45 | | | | 287,360 | | 0.71 | | | 4.30 | | | 0.92 | | | 85.53 | |
Year Ended July 31, 2005 | | | 11.12 | | | 0.43 | | | | — | | | | 0.43 | | | | (0.43 | ) | | | (0.03 | ) | | | (0.46 | ) | | | 11.09 | | 3.90 | | | | 294,240 | | 0.74 | | | 3.81 | | | 0.91 | | | 27.95 | |
| (a) | Excludes sales charge and/or redemption fees, if applicable. |
| (b) | During the period certain fees were reduced. If such fee reductions had not occurred the ratios would have been as indicated. |
| (c) | Portfolio turnover is calculated on the basis of the Fund as a whole without distinguishing between the classes of shares issued. |
| (d) | Amounts calculated using the daily average shares method. |
| (e) | Less than $0.005 per share. |
See notes to financial statements.
96
PACIFIC CAPITAL FUNDS
Tax-Free Securities Fund
Financial Highlights
(Selected data for a share of capital stock outstanding throughout the periods indicated)
| | | | | | | | | | | | | | | | | | | | | | | | | | | | | | | | | | | | | | | | | | | | | | |
| | | | | Investment Activities | | Distributions | | | | | | | | Ratios/Supplemental Data | |
| | | Net Asset
Value,
Beginning
of Period | | Net
Investment
Income | | Net Realized
and Unrealized
Gains (Losses)
on Investments | | | Total from
Investment
Activities | | Dividends
from Net
Investment
Income | | | Distributions
from Net
Realized
Gains | | | Total
Dividends
and
Distributions | | | Net Asset
Value,
End of
Period | | Total
Return (a) | | | Net Assets,
End of
Period (000’s) | | Ratio of
Expenses
to Average
Net Assets | | | Ratio of Net
Investment
Income
to Average
Net Assets | | | Ratio of
Expenses
to Average
Net Assets (b) | | | Portfolio
Turnover (c) | |
CLASS A | | | | | | | | | | | | | | | | | | | | | | | | | | | | | | | | | | | | | | | | | | | | | | |
Year Ended July 31, 2009 | | $ | 9.90 | | $ | 0.39 | | $ | 0.04 | | | $ | 0.43 | | $ | (0.39 | ) | | $ | (0.01 | ) | | $ | (0.40 | ) | | $ | 9.93 | | 4.50 | % | | $ | 5,904 | | 1.01 | % | | 3.96 | % | | 1.31 | % | | 23.69 | % |
Year Ended July 31, 2008 | | | 10.05 | | | 0.41 | | | (0.14 | ) | | | 0.27 | | | (0.41 | ) | | | (0.01 | ) | | | (0.42 | ) | | | 9.90 | | 2.77 | | | | 5,136 | | 0.95 | | | 4.14 | | | 1.25 | | | 30.61 | |
Year Ended July 31, 2007 | | | 10.11 | | | 0.41 | | | (0.05 | ) | | | 0.36 | | | (0.41 | ) | | | (0.01 | ) | | | (0.42 | ) | | | 10.05 | | 3.57 | | | | 5,513 | | 0.93 | | | 4.02 | | | 1.23 | | | 19.29 | |
Year Ended July 31, 2006 | | | 10.52 | | | 0.40 | | | (0.28 | ) | | | 0.12 | | | (0.40 | ) | | | (0.13 | ) | | | (0.53 | ) | | | 10.11 | | 1.19 | | | | 6,209 | | 0.98 | | | 3.87 | | | 1.48 | | | 59.63 | (d) |
Year Ended July 31, 2005 | | | 10.72 | | | 0.41 | | | (0.04 | ) | | | 0.37 | | | (0.41 | ) | | | (0.16 | ) | | | (0.57 | ) | | | 10.52 | | 3.49 | | | | 8,973 | | 1.00 | | | 3.83 | | | 1.67 | | | 8.65 | |
CLASS B | | | | | | | | | | | | | | | | | | | | | | | | | | | | | | | | | | | | | | | | | | | | | | |
Year Ended July 31, 2009 | | $ | 9.90 | | $ | 0.31 | | $ | 0.04 | | | $ | 0.35 | | $ | (0.31 | ) | | $ | (0.01 | ) | | $ | (0.32 | ) | | $ | 9.93 | | 3.73 | % | | $ | 267 | | 1.76 | % | | 3.27 | % | | 1.91 | % | | 23.69 | % |
Year Ended July 31, 2008 | | | 10.05 | | | 0.34 | | | (0.14 | ) | | | 0.20 | | | (0.34 | ) | | | (0.01 | ) | | | (0.35 | ) | | | 9.90 | | 2.00 | | | | 731 | | 1.70 | | | 3.39 | | | 1.85 | | | 30.61 | |
Year Ended July 31, 2007 | | | 10.11 | | | 0.33 | | | (0.05 | ) | | | 0.28 | | | (0.33 | ) | | | (0.01 | ) | | | (0.34 | ) | | | 10.05 | | 2.80 | | | | 1,103 | | 1.68 | | | 3.24 | | | 1.83 | | | 19.29 | |
Year Ended July 31, 2006 | | | 10.52 | | | 0.32 | | | (0.28 | ) | | | 0.04 | | | (0.32 | ) | | | (0.13 | ) | | | (0.45 | ) | | | 10.11 | | 0.44 | | | | 2,375 | | 1.73 | | | 3.11 | | | 1.94 | | | 59.63 | (d) |
Year Ended July 31, 2005 | | | 10.72 | | | 0.33 | | | (0.04 | ) | | | 0.29 | | | (0.33 | ) | | | (0.16 | ) | | | (0.49 | ) | | | 10.52 | | 2.71 | | | | 3,344 | | 1.75 | | | 3.08 | | | 1.92 | | | 8.65 | |
CLASS C | | | | | | | | | | | | | | | | | | | | | | | | | | | | | | | | | | | | | | | | | | | | | | |
Year Ended July 31, 2009 | | $ | 9.91 | | $ | 0.31 | | $ | 0.05 | | | $ | 0.36 | | $ | (0.31 | ) | | $ | (0.01 | ) | | $ | (0.32 | ) | | $ | 9.95 | | 3.81 | % | | $ | 11 | | 1.76 | % | | 3.17 | % | | 1.91 | % | | 23.69 | % |
Year Ended July 31, 2008 | | | 10.05 | | | 0.34 | | | (0.13 | ) | | | 0.21 | | | (0.34 | ) | | | (0.01 | ) | | | (0.35 | ) | | | 9.91 | | 2.10 | | | | 11 | | 1.70 | | | 3.38 | | | 1.85 | | | 30.61 | |
Year Ended July 31, 2007 | | | 10.11 | | | 0.33 | | | (0.05 | ) | | | 0.28 | | | (0.33 | ) | | | (0.01 | ) | | | (0.34 | ) | | | 10.05 | | 2.79 | | | | 11 | | 1.68 | | | 3.27 | | | 1.83 | | | 19.29 | |
Year Ended July 31, 2006 | | | 10.53 | | | 0.32 | | | (0.29 | ) | | | 0.03 | | | (0.32 | ) | | | (0.13 | ) | | | (0.45 | ) | | | 10.11 | | 0.35 | | | | 10 | | 1.73 | | | 3.11 | | | 1.94 | | | 59.63 | (d) |
Year Ended July 31, 2005 | | | 10.72 | | | 0.33 | | | (0.03 | ) | | | 0.30 | | | (0.33 | ) | | | (0.16 | ) | | | (0.49 | ) | | | 10.53 | | 2.83 | | | | 10 | | 1.74 | | | 3.09 | | | 1.90 | | | 8.65 | |
CLASS Y | | | | | | | | | | | | | | | | | | | | | | | | | | | | | | | | | | | | | | | | | | | | | | |
Year Ended July 31, 2009 | | $ | 9.94 | | $ | 0.41 | | $ | 0.04 | | | $ | 0.45 | | $ | (0.41 | ) | | $ | (0.01 | ) | | $ | (0.42 | ) | | $ | 9.97 | | 4.75 | % | | $ | 233,348 | | 0.76 | % | | 4.21 | % | | 0.91 | % | | 23.69 | % |
Year Ended July 31, 2008 | | | 10.09 | | | 0.44 | | | (0.14 | ) | | | 0.30 | | | (0.44 | ) | | | (0.01 | ) | | | (0.45 | ) | | | 9.94 | | 3.02 | | | | 254,182 | | 0.70 | | | 4.36 | | | 0.85 | | | 30.61 | |
Year Ended July 31, 2007 | | | 10.15 | | | 0.43 | | | (0.05 | ) | | | 0.38 | | | (0.43 | ) | | | (0.01 | ) | | | (0.44 | ) | | | 10.09 | | 3.81 | | | | 282,671 | | 0.68 | | | 4.25 | | | 0.83 | | | 19.29 | |
Year Ended July 31, 2006 | | | 10.57 | | | 0.42 | | | (0.29 | ) | | | 0.13 | | | (0.42 | ) | | | (0.13 | ) | | | (0.55 | ) | | | 10.15 | | 1.34 | | | | 287,126 | | 0.73 | | | 4.09 | | | 0.94 | | | 59.63 | (d) |
Year Ended July 31, 2005 | | | 10.76 | | | 0.44 | | | (0.03 | ) | | | 0.41 | | | (0.44 | ) | | | (0.16 | ) | | | (0.60 | ) | | | 10.57 | | 3.83 | | | | 315,854 | | 0.75 | | | 4.06 | | | 0.92 | | | 8.65 | |
| (a) | Excludes sales charge and/or redemption fees, if applicable. |
| (b) | During the period certain fees were reduced. If such fee reductions had not occurred the ratios would have been as indicated. |
| (c) | Portfolio turnover is calculated on the basis of the Fund as a whole without distinguishing between the classes of shares issued. |
| (d) | The portfolio turnover rate increased significantly during the period. This increase was primarily attributable to cash flows into and out of the Fund, as well as tactical portfolio adjustments made in response to rising short and intermediate interest rates. The basic characteristics of the Fund in terms of market capitalization, style, and diversification have not changed. |
See notes to financial statements.
97
PACIFIC CAPITAL FUNDS
High Grade Short Intermediate Fixed Income Fund
Financial Highlights
(Selected data for a share of capital stock outstanding throughout the periods indicated)
| | | | | | | | | | | | | | | | | | | | | | | | | | | | | | | | | | | | | | | | | | | | | | |
| | | | | Investment Activities | | Distributions | | | | | | | | Ratios/Supplemental Data | |
| | | Net Asset
Value,
Beginning
of Period | | Net
Investment
Income | | Net Realized
and Unrealized
Gains (Losses)
on Investments | | | Total from
Investment
Activities | | Dividends
from Net
Investment
Income | | | Distributions
from Net
Realized
Gains | | | Total
Dividends
and
Distributions | | | Net Asset
Value,
End of
Period | | Total
Return (a) | | | Net Assets,
End of
Period (000’s) | | Ratio of
Expenses
to Average
Net Assets | | | Ratio of Net
Investment
Income
to Average
Net Assets | | | Ratio of
Expenses
to Average
Net Assets (b) | | | Portfolio
Turnover (c) | |
CLASS A | | | | | | | | | | | | | | | | | | | | | | | | | | | | | | | | | | | | | | | | | | | | | | |
Year Ended July 31, 2009 | | $ | 9.69 | | $ | 0.36 | | $ | 0.33 | | | $ | 0.69 | | $ | (0.37 | ) | | $ | — | | | $ | (0.37 | ) | | $ | 10.01 | | 7.30 | % | | $ | 1,216 | | 0.77 | % | | 3.67 | % | | 1.30 | % | | 100.24 | % |
Year Ended July 31, 2008 | | | 9.54 | | | 0.40 | | | 0.15 | | | | 0.55 | | | (0.40 | ) | | | — | | | | (0.40 | ) | | | 9.69 | | 5.83 | | | | 1,022 | | 0.77 | | | 4.12 | | | 1.23 | | | 143.94 | |
Year Ended July 31, 2007 | | | 9.53 | | | 0.42 | | | 0.01 | | | | 0.43 | | | (0.42 | ) | | | — | | | | (0.42 | ) | | | 9.54 | | 4.61 | | | | 984 | | 0.77 | | | 4.43 | | | 1.22 | | | 88.15 | |
Year Ended July 31, 2006 | | | 9.66 | | | 0.34 | | | (0.13 | ) | | | 0.21 | | | (0.34 | ) | | | — | | | | (0.34 | ) | | | 9.53 | | 2.21 | | | | 1,261 | | 0.78 | | | 3.49 | | | 1.43 | | | 74.37 | |
Year Ended July 31, 2005 | | | 9.80 | | | 0.26 | | | (0.14 | ) | | | 0.12 | | | (0.26 | ) | | | — | (d) | | | (0.26 | ) | | | 9.66 | | 1.27 | | | | 1,781 | | 0.80 | | | 2.69 | | | 1.59 | | | 35.32 | |
CLASS C | | | | | | | | | | | | | | | | | | | | | | | | | | | | | | | | | | | | | | | | | | | | | | |
Year Ended July 31, 2009 | | $ | 9.68 | | $ | 0.28 | | $ | 0.34 | | | $ | 0.62 | | $ | (0.30 | ) | | $ | — | | | $ | (0.30 | ) | | $ | 10.00 | | 6.51 | % | | $ | 439 | | 1.52 | % | | 2.91 | % | | 1.90 | % | | 100.24 | % |
Year Ended July 31, 2008 | | | 9.54 | | | 0.33 | | | 0.14 | | | | 0.47 | | | (0.33 | ) | | | — | | | | (0.33 | ) | | | 9.68 | | 4.93 | | | | 463 | | 1.52 | | | 3.38 | | | 1.83 | | | 143.94 | |
Year Ended July 31, 2007 | | | 9.52 | | | 0.35 | | | 0.02 | | | | 0.37 | | | (0.35 | ) | | | — | | | | (0.35 | ) | | | 9.54 | | 3.94 | | | | 511 | | 1.52 | | | 3.67 | | | 1.82 | | | 88.15 | |
Year Ended July 31, 2006 | | | 9.65 | | | 0.27 | | | (0.13 | ) | | | 0.14 | | | (0.27 | ) | | | — | | | | (0.27 | ) | | | 9.52 | | 1.45 | | | | 675 | | 1.53 | | | 2.80 | | | 1.89 | | | 74.37 | |
Year Ended July 31, 2005 | | | 9.80 | | | 0.19 | | | (0.15 | ) | | | 0.04 | | | (0.19 | ) | | | — | (d) | | | (0.19 | ) | | | 9.65 | | 0.40 | | | | 631 | | 1.55 | | | 1.99 | | | 1.84 | | | 35.32 | |
CLASS Y | | | | | | | | | | | | | | | | | | | | | | | | | | | | | | | | | | | | | | | | | | | | | | |
Year Ended July 31, 2009 | | $ | 9.71 | | $ | 0.39 | | $ | 0.33 | | | $ | 0.72 | | $ | (0.40 | ) | | $ | — | | | $ | (0.40 | ) | | $ | 10.03 | | 7.55 | % | | $ | 56,316 | | 0.52 | % | | 3.92 | % | | 0.90 | % | | 100.24 | % |
Year Ended July 31, 2008 | | | 9.56 | | | 0.42 | | | 0.15 | | | | 0.57 | | | (0.42 | ) | | | — | | | | (0.42 | ) | | | 9.71 | | 6.08 | | | | 62,209 | | 0.52 | | | 4.37 | | | 0.83 | | | 143.94 | |
Year Ended July 31, 2007 | | | 9.55 | | | 0.45 | | | 0.01 | | | | 0.46 | | | (0.45 | ) | | | — | | | | (0.45 | ) | | | 9.56 | | 4.86 | | | | 62,808 | | 0.52 | | | 4.68 | | | 0.82 | | | 88.15 | |
Year Ended July 31, 2006 | | | 9.68 | | | 0.36 | | | (0.13 | ) | | | 0.23 | | | (0.36 | ) | | | — | | | | (0.36 | ) | | | 9.55 | | 2.46 | | | | 60,257 | | 0.53 | | | 3.74 | | | 0.89 | | | 74.37 | |
Year Ended July 31, 2005 | | | 9.82 | | | 0.29 | | | (0.14 | ) | | | 0.15 | | | (0.29 | ) | | | — | (d) | | | (0.29 | ) | | | 9.68 | | 1.52 | | | | 85,991 | | 0.55 | | | 2.93 | | | 0.84 | | | 35.32 | |
| (a) | Excludes sales charge and/or redemption fees, if applicable. |
| (b) | During the period certain fees were reduced. If such fee reductions had not occurred the ratios would have been as indicated. |
| (c) | Portfolio turnover is calculated on the basis of the Fund as a whole without distinguishing between the classes of shares issued. |
| (d) | Less than $0.005 per share. |
See notes to financial statements.
98
PACIFIC CAPITAL FUNDS
Tax-Free Short Intermediate Securities Fund
Financial Highlights
(Selected data for a share of capital stock outstanding throughout the periods indicated)
| | | | | | | | | | | | | | | | | | | | | | | | | | | | | | | | | | | | | | | | | | | | | |
| | | | | Investment Activities | | Distributions | | | | | | | | Ratios/Supplemental Data | |
| | | Net Asset
Value,
Beginning
of Period | | Net
Investment
Income | | Net Realized
and Unrealized
Gains (Losses)
on Investments | | | Total from
Investment
Activities | | Dividends
from Net
Investment
Income | | | Distributions
from Net
Realized
Gains | | Total
Dividends
and
Distributions | | | Net Asset
Value,
End of
Period | | Total
Return (a) | | | Net Assets,
End of
Period (000’s) | | Ratio of
Expenses
to Average
Net Assets | | | Ratio of Net
Investment
Income
to Average
Net Assets | | | Ratio of
Expenses
to Average
Net Assets (b) | | | Portfolio
Turnover (c) | |
CLASS A | | | | | | | | | | | | | | | | | | | | | | | | | | | | | | | | | | | | | | | | | | | | | |
Year Ended July 31, 2009 | | $ | 10.14 | | $ | 0.24 | | $ | 0.12 | | | $ | 0.36 | | $ | (0.24 | ) | | $ | — | | $ | (0.24 | ) | | $ | 10.26 | | 3.56 | % | | $ | 1,829 | | 1.07 | % | | 2.24 | % | | 1.32 | % | | 40.33 | % |
Year Ended July 31, 2008 | | | 10.02 | | | 0.31 | | | 0.12 | | | | 0.43 | | | (0.31 | ) | | | — | | | (0.31 | ) | | | 10.14 | | 4.31 | | | | 1,956 | | 1.02 | | | 3.04 | | | 1.27 | | | 39.29 | |
Year Ended July 31, 2007 | | | 10.05 | | | 0.31 | | | (0.03 | ) | | | 0.28 | | | (0.31 | ) | | | — | | | (0.31 | ) | | | 10.02 | | 2.84 | | | | 2,175 | | 0.99 | | | 3.10 | | | 1.23 | | | 68.09 | |
Year Ended July 31, 2006 | | | 10.21 | | | 0.28 | | | (0.16 | ) | | | 0.12 | | | (0.28 | ) | | | — | | | (0.28 | ) | | | 10.05 | | 1.22 | | | | 2,792 | | 1.00 | | | 2.78 | | | 1.44 | | | 112.73 | (d) |
Year Ended July 31, 2005 | | | 10.30 | | | 0.23 | | | (0.09 | ) | | | 0.14 | | | (0.23 | ) | | | — | | | (0.23 | ) | | | 10.21 | | 1.40 | | | | 3,784 | | 1.00 | | | 2.26 | | | 1.62 | | | 28.31 | |
CLASS C | | | | | | | | | | | | | | | | | | | | | | | | | | | | | | | | | | | | | | | | | | | | | |
Year Ended July 31, 2009 | | $ | 10.14 | | $ | 0.16 | | $ | 0.12 | | | $ | 0.28 | | $ | (0.16 | ) | | $ | — | | $ | (0.16 | ) | | $ | 10.26 | | 2.80 | % | | $ | 11 | | 1.82 | % | | 1.54 | % | | 1.92 | % | | 40.33 | % |
Year Ended July 31, 2008 | | | 10.02 | | | 0.23 | | | 0.12 | | | | 0.35 | | | (0.23 | ) | | | — | | | (0.23 | ) | | | 10.14 | | 3.55 | | | | 11 | | 1.77 | | | 2.30 | | | 1.87 | | | 39.29 | |
Year Ended July 31, 2007 | | | 10.06 | | | 0.24 | | | (0.04 | ) | | | 0.20 | | | (0.24 | ) | | | — | | | (0.24 | ) | | | 10.02 | | 1.97 | | | | 10 | | 1.74 | | | 2.35 | | | 1.83 | | | 68.09 | |
Year Ended July 31, 2006 | | | 10.21 | | | 0.20 | | | (0.15 | ) | | | 0.05 | | | (0.20 | ) | | | — | | | (0.20 | ) | | | 10.06 | | 0.55 | | | | 10 | | 1.75 | | | 2.03 | | | 1.91 | | | 112.73 | (d) |
Year Ended July 31, 2005 | | | 10.31 | | | 0.16 | | | (0.10 | ) | | | 0.06 | | | (0.16 | ) | | | — | | | (0.16 | ) | | | 10.21 | | 0.54 | | | | 10 | | 1.75 | | | 1.52 | | | 1.87 | | | 28.31 | |
CLASS Y | | | | | | | | | | | | | | | | | | | | | | | | | | | | | | | | | | | | | | | | | | | | | |
Year Ended July 31, 2009 | | $ | 10.20 | | $ | 0.26 | | $ | 0.12 | | | $ | 0.38 | | $ | (0.26 | ) | | $ | — | | $ | (0.26 | ) | | $ | 10.32 | | 3.80 | % | | $ | 61,113 | | 0.81 | % | | 2.47 | % | | 0.91 | % | | 40.33 | % |
Year Ended July 31, 2008 | | | 10.08 | | | 0.33 | | | 0.12 | | | | 0.45 | | | (0.33 | ) | | | — | | | (0.33 | ) | | | 10.20 | | 4.55 | | | | 47,552 | | 0.77 | | | 3.27 | | | 0.87 | | | 39.29 | |
Year Ended July 31, 2007 | | | 10.11 | | | 0.34 | | | (0.03 | ) | | | 0.31 | | | (0.34 | ) | | | — | | | (0.34 | ) | | | 10.08 | | 3.08 | | | | 50,835 | | 0.74 | | | 3.33 | | | 0.83 | | | 68.09 | |
Year Ended July 31, 2006 | | | 10.27 | | | 0.31 | | | (0.16 | ) | | | 0.15 | | | (0.31 | ) | | | — | | | (0.31 | ) | | | 10.11 | | 1.47 | | | | 62,816 | | 0.75 | | | 3.03 | | | 0.91 | | | 112.73 | (d) |
Year Ended July 31, 2005 | | | 10.36 | | | 0.26 | | | (0.09 | ) | | | 0.17 | | | (0.26 | ) | | | — | | | (0.26 | ) | | | 10.27 | | 1.65 | | | | 65,070 | | 0.74 | | | 2.51 | | | 0.86 | | | 28.31 | |
| (a) | Excludes sales charge and/or redemption fees, if applicable. |
| (b) | During the period certain fees were reduced. If such fee reductions had not occurred the ratios would have been as indicated. |
| (c) | Portfolio turnover is calculated on the basis of the Fund as a whole without distinguishing between the classes of shares issued. |
| (d) | The portfolio turnover rate increased significantly during the period. This increase was primarily attributable to tactical portfolio adjustments made in response to rising short and intermediate interest rates and Hawaii municipal bond availability. The basic characteristics of the Fund in terms of style and diversification have not changed. |
See notes to financial statements.
99
PACIFIC CAPITAL FUNDS
U.S. Government Short Fixed Income Fund
Financial Highlights
(Selected data for a share of capital stock outstanding throughout the periods indicated)
| | | | | | | | | | | | | | | | | | | | | | | | | | | | | | | | | | | | | | | | | | | | | |
| | | | | Investment Activities | | Distributions | | | | | | | | Ratios/Supplemental Data | |
| | | Net Asset
Value,
Beginning
of Period | | Net
Investment
Income | | Net Realized
and Unrealized
Gains (Losses)
on Investments | | | Total from
Investment
Activities | | Dividends
from Net
Investment
Income | | | Distributions
from Net
Realized
Gains | | Total
Dividends
and
Distributions | | | Net Asset
Value,
End of
Period | | Total
Return (a) | | | Net Assets,
End of
Period (000’s) | | Ratio of
Expenses
to Average
Net Assets | | | Ratio of Net
Investment
Income
to Average
Net Assets | | | Ratio of
Expenses
to Average
Net Assets (b) | | | Portfolio
Turnover (c) | |
CLASS A | | | | | | | | | | | | | | | | | | | | | | | | | | | | | | | | | | | | | | | | | | | | | |
Year Ended July 31, 2009 | | $ | 10.26 | | $ | 0.19 | | $ | 0.14 | | | $ | 0.33 | | $ | (0.19 | ) | | $ | — | | $ | (0.19 | ) | | $ | 10.40 | | 3.24 | % | | $ | 1,707 | | 0.68 | % | | 2.09 | % | | 1.18 | % | | 77.12 | % |
Year Ended July 31, 2008 | | | 10.06 | | | 0.39 | | | 0.20 | | | | 0.59 | | | (0.39 | ) | | | — | | | (0.39 | ) | | | 10.26 | | 5.89 | | | | 2,773 | | 0.65 | | | 3.75 | | | 1.09 | | | 62.20 | |
Year Ended July 31, 2007 | | | 10.04 | | | 0.45 | | | 0.02 | | | | 0.47 | | | (0.45 | ) | | | — | | | (0.45 | ) | | | 10.06 | | 4.80 | | | | 2,265 | | 0.64 | | | 4.50 | | | 1.07 | | | 81.16 | |
Year Ended July 31, 2006 | | | 10.04 | | | 0.32 | | | — | | | | 0.32 | | | (0.32 | ) | | | — | | | (0.32 | ) | | | 10.04 | | 3.27 | | | | 2,355 | | 0.63 | | | 3.03 | | | 1.36 | | | 88.38 | |
Year Ended July 31, 2005 | | | 10.10 | | | 0.18 | | | (0.06 | ) | | | 0.12 | | | (0.18 | ) | | | — | | | (0.18 | ) | | | 10.04 | | 1.19 | | | | 6,552 | | 0.62 | | | 1.76 | | | 1.47 | | | 64.16 | |
CLASS B | | | | | | | | | | | | | | | | | | | | | | | | | | | | | | | | | | | | | | | | | | | | | |
Year Ended July 31, 2009 | | $ | 10.26 | | $ | 0.11 | | $ | 0.15 | | | $ | 0.26 | | $ | (0.12 | ) | | $ | — | | $ | (0.12 | ) | | $ | 10.40 | | 2.52 | % | | $ | 214 | | 1.43 | % | | 1.25 | % | | 1.78 | % | | 77.12 | % |
Year Ended July 31, 2008 | | | 10.06 | | | 0.31 | | | 0.20 | | | | 0.51 | | | (0.31 | ) | | | — | | | (0.31 | ) | | | 10.26 | | 5.11 | | | | 454 | | 1.40 | | | 3.08 | | | 1.69 | | | 62.20 | |
Year Ended July 31, 2007 | | | 10.04 | | | 0.38 | | | 0.02 | | | | 0.40 | | | (0.38 | ) | | | — | | | (0.38 | ) | | | 10.06 | | 4.02 | | | | 825 | | 1.39 | | | 3.75 | | | 1.67 | | | 81.16 | |
Year Ended July 31, 2006 | | | 10.04 | | | 0.25 | | | — | | | | 0.25 | | | (0.25 | ) | | | — | | | (0.25 | ) | | | 10.04 | | 2.50 | | | | 1,238 | | 1.38 | | | 2.44 | | | 1.77 | | | 88.38 | |
Year Ended July 31, 2005 | | | 10.10 | | | 0.10 | | | (0.06 | ) | | | 0.04 | | | (0.10 | ) | | | — | | | (0.10 | ) | | | 10.04 | | 0.43 | | | | 1,609 | | 1.37 | | | 1.01 | | | 1.72 | | | 64.16 | |
CLASS C | | | | | | | | | | | | | | | | | | | | | | | | | | | | | | | | | | | | | | | | | | | | | |
Year Ended July 31, 2009 | | $ | 10.26 | | $ | 0.11 | | $ | 0.15 | | | $ | 0.26 | | $ | (0.11 | ) | | $ | — | | $ | (0.11 | ) | | $ | 10.41 | | 2.58 | % | | $ | 1,009 | | 1.43 | % | | 1.07 | % | | 1.78 | % | | 77.12 | % |
Year Ended July 31, 2008 | | | 10.06 | | | 0.31 | | | 0.20 | | | | 0.51 | | | (0.31 | ) | | | — | | | (0.31 | ) | | | 10.26 | | 5.11 | | | | 928 | | 1.40 | | | 3.04 | | | 1.69 | | | 62.20 | |
Year Ended July 31, 2007 | | | 10.04 | | | 0.38 | | | 0.02 | | | | 0.40 | | | (0.38 | ) | | | — | | | (0.38 | ) | | | 10.06 | | 4.02 | | | | 1,116 | | 1.39 | | | 3.75 | | | 1.67 | | | 81.16 | |
Year Ended July 31, 2006 | | | 10.04 | | | 0.25 | | | — | | | | 0.25 | | | (0.25 | ) | | | — | | | (0.25 | ) | | | 10.04 | | 2.50 | | | | 1,514 | | 1.38 | | | 2.45 | | | 1.77 | | | 88.38 | |
Year Ended July 31, 2005 | | | 10.10 | | | 0.10 | | | (0.06 | ) | | | 0.04 | | | (0.10 | ) | | | — | | | (0.10 | ) | | | 10.04 | | 0.43 | | | | 1,834 | | 1.37 | | | 1.20 | | | 1.72 | | | 64.16 | |
CLASS Y | | | | | | | | | | | | | | | | | | | | | | | | | | | | | | | | | | | | | | | | | | | | | |
Year Ended July 31, 2009 | | $ | 10.27 | | $ | 0.22 | | $ | 0.14 | | | $ | 0.36 | | $ | (0.22 | ) | | $ | — | | $ | (0.22 | ) | | $ | 10.41 | | 3.50 | % | | $ | 66,956 | | 0.43 | % | | 2.10 | % | | 0.78 | % | | 77.12 | % |
Year Ended July 31, 2008 | | | 10.07 | | | 0.41 | | | 0.20 | | | | 0.61 | | | (0.41 | ) | | | — | | | (0.41 | ) | | | 10.27 | | 6.15 | | | | 71,175 | | 0.40 | | | 4.03 | | | 0.69 | | | 62.20 | |
Year Ended July 31, 2007 | | | 10.04 | | | 0.48 | | | 0.03 | | | | 0.51 | | | (0.48 | ) | | | — | | | (0.48 | ) | | | 10.07 | | 5.17 | | | | 85,818 | | 0.39 | | | 4.74 | | | 0.67 | | | 81.16 | |
Year Ended July 31, 2006 | | | 10.05 | | | 0.35 | | | (0.01 | ) | | | 0.34 | | | (0.35 | ) | | | — | | | (0.35 | ) | | | 10.04 | | 3.42 | | | | 96,102 | | 0.38 | | | 3.43 | | | 0.77 | | | 88.38 | |
Year Ended July 31, 2005 | | | 10.11 | | | 0.20 | | | (0.06 | ) | | | 0.14 | | | (0.20 | ) | | | — | | | (0.20 | ) | | | 10.05 | | 1.44 | | | | 125,349 | | 0.37 | | | 1.98 | | | 0.71 | | | 64.16 | |
| (a) | Excludes sales charge and/or redemption fees, if applicable. |
| (b) | During the period certain fees were reduced. If such fee reductions had not occurred the ratios would have been as indicated. |
| (c) | Portfolio turnover is calculated on the basis of the Fund as a whole without distinguishing between the classes of shares issued. |
See notes to financial statements.
100
PACIFIC CAPITAL FUNDS
Report of Independent Registered Public Accounting Firm
To the Shareholders and Board of Trustees of
Pacific Capital Funds:
We have audited the accompanying statements of assets and liabilities of Pacific Capital Funds—New Asia Growth Fund, International Stock Fund, Small Cap Fund, Mid-Cap Fund, Growth Stock Fund, Growth and Income Fund, Value Fund, High Grade Core Fixed Income Fund, Tax-Free Securities Fund, High Grade Short Intermediate Fixed Income Fund, Tax-Free Short Intermediate Securities Fund and U.S. Government Short Fixed Income Fund (the Funds), including the schedules of portfolio investments, as of July 31, 2009, and the related statements of operations for the year then ended, the statements of changes in net assets for each year in the two-year period then ended, and the financial highlights for each year in the five-year period then ended. These financial statements and financial highlights are the responsibility of the Funds’ management. Our responsibility is to express an opinion on these financial statements and financial highlights based on our audits.
We conducted our audits in accordance with the standards of the Public Company Accounting Oversight Board (United States). Those standards require that we plan and perform the audit to obtain reasonable assurance about whether the financial statements and financial highlights are free of material misstatement. An audit includes examining, on a test basis, evidence supporting the amounts and disclosures in the financial statements. Our procedures included confirmation of securities owned as of July 31, 2009, by correspondence with custodians and brokers, or by other appropriate auditing procedures where replies from brokers were not received. An audit also includes assessing the accounting principles used and significant estimates made by management, as well as evaluating the overall financial statement presentation. We believe that our audits provide a reasonable basis for our opinion.
In our opinion, the financial statements and financial highlights referred to above present fairly, in all material respects, the financial position of the Funds as of July 31, 2009, the results of their operations for the year then ended, the changes in their net assets for each year in the two-year period then ended, and the financial highlights for each of the years in the five-year period then ended, in conformity with U.S. generally accepted accounting principles.
KPMG LLP
Columbus, Ohio
September 25, 2009
101
PACIFIC CAPITAL FUNDS
Additional Tax Information
July 31, 2009
(Unaudited)
For the year ended July 31, 2009, certain Funds designate the maximum amount allowable, but no less than the following percentages of the ordinary income dividends paid during the year as qualified dividend income in accordance with Section 854 of the Internal Revenue Code:
| | |
| | | Qualified Dividend
Income (%) |
New Asia Growth Fund | | 26.25 |
International Stock Fund | | 100.00 |
Mid-Cap Fund | | 100.00 |
Growth Stock Fund | | 100.00 |
Growth and Income Fund | | 100.00 |
Value Fund | | 100.00 |
For the year ended July 31, 2009, certain Funds designate the maximum amount allowable but no less than the following percentages of their ordinary income dividends paid during the year as eligible for the corporate dividends received deduction in accordance with Section 854 of the Internal Revenue Code:
| | |
| | | Dividend Received
Deduction (%) |
New Asia Growth Fund | | 1.22 |
Mid-Cap Fund | | 100.00 |
Growth Stock Fund | | 100.00 |
Growth and Income Fund | | 100.00 |
Value Fund | | 100.00 |
For the year ended July 31, 2009, certain Funds have made an election to pass-through the maximum amount of the portion of their ordinary dividends paid derived from foreign source income as well as any foreign taxes paid by such Funds in accordance with Section 853 of the Internal Revenue Code to their shareholders or the following amounts per share of ordinary dividends:
| | | | |
| | | Foreign Source
Income ($) | | Foreign Tax
Expense ($) |
New Asia Growth Fund | | 0.25 | | 0.02 |
International Stock Fund | | 0.19 | | 0.02 |
For the year ended July 31, 2009, certain Funds designate the maximum amount allowable but not less than the following amounts as exempt-interest dividends:
| | |
| | | Amount ($) |
Tax-Free Securities Fund | | 9,800,538 |
Tax-Free Short Intermediate Securities Fund | | 1,339,890 |
For the year ended July 31, 2009, certain Funds designate the maximum amount allowable but not less than the following amounts as a capital gain dividend in accordance with Section 852(b)(3)(C) of the Internal Revenue Code:
| | |
| | | Amount ($) |
New Asia Growth Fund | | 10,124,494 |
International Stock Fund | | 20,011,569 |
Small Cap Fund | | 801,268 |
Tax-Free Securities Fund | | 341,698 |
102
PACIFIC CAPITAL FUNDS
Additional Tax Information, continued
July 31, 2009
(Unaudited)
For the year ended July 31, 2009, certain Funds designate the maximum amount allowable but not less than the following amounts as a short-term capital gain dividend in accordance with Section 871(k)(2) and 881(e) of the Internal Revenue Code:
| | |
| | | Amount ($) |
New Asia Growth Fund | | 1,648,409 |
International Stock Fund | | 616,131 |
For the year ended July 31, 2009, certain Funds designate the maximum amount allowable but not less than the following amounts as interest-related dividends in accordance with Section 871(k)(1) and 881(e) of the Internal Revenue Code:
| | |
| | | Amount ($) |
High Grade Core Fixed Income Fund | | 10,151,683 |
Tax-Free Securities Fund | | 10,154,364 |
High Grade Short Intermediate Fixed Income Fund | | 2,361,255 |
Tax-Free Short Intermediate Securities Fund | | 1,314,019 |
U.S. Government Short Fixed Income Fund | | 1,493,374 |
103
PACIFIC CAPITAL FUNDS
Trustees and Officers
July 31, 2009
(Unaudited)
Interested Trustees. The table below sets forth certain information about each of the Trustees of the Trust who is an “interested person” of the Trust as defined by the Investment Company Act of 1940, as amended (the “1940 Act”).
| | | | | | | | | | |
Name, Address and Age | | Position(s)
Held with
Trust | | Term of
Office;
Term
Served in
Office | | Principal Occupation(s) During Past 5 Years | | Number of
Portfolios
in Fund
Complex
Overseen | | Other Directorships
Held by Trustee |
Peter S. Ho* 130 Merchant Street, 22nd Floor Honolulu, Hawaii 96813 Age: 43 | | Trustee | | Indefinite; Since 5/04 | | President, Bank of Hawaii (04/08-Present), Vice Chairman and Chief Banking Officer—Retail Banking (since 2007), Commercial Banking (Since 2006) and Investment Services Group (since 2004); Executive Vice President, Bank of Hawaii—Commercial Group (2003-2004). | | 12 | | Member of the Board of: Rehabilitation Hospital Foundation, Hawaii Chapter of the American Red Cross, Special Olympics of Hawaii, Oceanic Institute, Hawaii Pacific University, Hanahau’oli School, Frederic Duclos Barstow Foundation, Historic Hawaii Foundation, Teach for America-Hawaii, GIFT Foundation, McInerny Foundation, Strong Foundation, Hawaii Community Foundation, East West Center and University of Hawaii Ahahui Koa Anuenue. |
| * | Mr. Ho is an “interested person” of the Trust, as identified by the 1940 Act, because of his employment with the Bank of Hawaii. |
Independent Trustees. The table below sets forth certain information about the Trustees of the Trust who are not “interested persons” of the Trust as defined in the 1940 Act.
| | | | | | | | | | |
Name, Address and Age | | Position(s)
Held with
Trust | | Term of
Office;
Term
Served in
Office | | Principal Occupation(s) During Past 5 Years | | Number of
Portfolios
in Fund
Complex
Overseen | | Other Directorships
Held by Trustee |
Stanley W. Hong 4976 Poola Street Honolulu, Hawaii 96821 Age: 72 | | Trustee | | Indefinite; Since 10/92 | | Chairman of the Board of Trustees, The King William Charles Lunalilo Trust Estate (since 2001); President of Waste Management of Hawaii, Inc. (2001-2005); Corporate Vice President of Waste Management (Houston) (2001-2006). | | 12 | | Trustee of Cash Assets Trust and Hawaiian Tax-Free Trust (registered investment companies) (since 1992); Member of the Board of: First Insurance Co. of Hawaii, Ltd., Lanihau Properties, LLC and Heald Education, LLC; Member of the Board of the following non-profit organizations: Chaminade University of Honolulu, Nature Conservancy of Hawaii, St. Louis School, Blue Planet Foundation, Child and Family Service and East West Center Foundation. |
| | | | | |
Richard L. Humphreys 970 N Kalaheo Avenue, Suite C110 Kailua, Hawaii 96734 Age: 65 | | Trustee | | Indefinite; Since 3/05 | | President of Hawaii Receivables Management LLC (since 2001); President of Lynk Payment Systems Hawaii LLC (since 2002). | | 12 | | Member of the Board of: The Castle Group, Inc. and other charitable and civic organizations. |
104
PACIFIC CAPITAL FUNDS
Trustees and Officers, continued
July 31, 2009
(Unaudited)
| | | | | | | | | | |
Name, Address and Age | | Position(s)
Held with
Trust | | Term of
Office;
Term
Served in
Office | | Principal Occupation(s) During Past 5 Years | | Number of
Portfolios
in Fund
Complex
Overseen | | Other Directorships
Held by Trustee |
Russell K. Okata 1015 Wilder
Avenue, #203 Honolulu, Hawaii 96822 Age: 65 | | Trustee and (Since 3/05) Chairman | | Indefinite; Since 10/92 | | Retired. Formerly Executive Director, Hawaii Government Employees Association AFSCME Local 152, AFL-CIO (1981-2007); International Vice President, American Federation of State, County and Municipal Employees, AFL-CIO (1981-2007). | | 12 | | Trustee of Cash Assets Trust and Hawaiian Tax-Free Trust (since 1993) and Aquila Three Peaks High Income Fund (since 2007) (registered investment companies); former Chairman of the Royal State Group (1988-2007); Trustee of: Blood Bank of Hawaii, Bishop Museum, Judicial Council of Hawaii and State of Hawaii Long Term Care Commission. |
| | | | | |
Douglas Philpotts 55 Dowsett Avenue Honolulu, Hawaii 96817 Age: 77 | | Trustee | | Indefinite; Since 10/92 | | Retired. Formerly Director, Chairman of the Board and President of Hawaiian Trust Co., Ltd. (until 1994), a predecessor of the Asset Management Group of Bank of Hawaii. | | 12 | | Trustee of Cash Assets Trust and Hawaiian Tax-Free Trust (registered investment companies) (since 1992); Trustee of the Strong Foundation (support of programs for Hawaiian youth) (since 1974). |
| | | | | |
Oswald K. Stender 711 Kapiolani Boulevard, Suite 1250 Honolulu, Hawaii 96813 Age: 77 | | Trustee | | Indefinite; Since 10/92 | | Trustee, Office of Hawaiian Affairs (since 1999). | | 12 | | Trustee of Cash Assets Trust and Hawaiian Tax-Free Trust (registered investment companies) (since 1992); Director of Grace Pacific Corp. (since 1995); Director of Alu Like Enterprises, LLC; Board member of various housing and real estate organizations. |
The Statement of Additional Information includes additional information about the Trustees of the Trust and is available, without charge, by calling (800) 258-9232.
105
PACIFIC CAPITAL FUNDS
Trustees and Officers, continued
July 31, 2009
(Unaudited)
Officers. The table below sets forth certain information about each of the Trust’s officers.
| | | | | | |
Name, Address and Age | | Position(s) Held
with Trust | | Term of Office
and Length of
Time Served | | Principal Occupation(s)
During Past 5 Years* |
Robert I. Crowell 130 Merchant Street 12th Floor Honolulu, Hawaii 96813 Age: 61 | | President | | Indefinite; Since 7/06 | | Executive Vice President, Bank of Hawaii (since 2002). |
| | | |
Frederick J. Schmidt 1 Rexcorp Plaza Uniondale, NY 11556 Age: 49 | | Chief Compliance Officer | | Term expires 2009; Since 5/08 | | Senior Vice President and Chief Compliance Officer, CCO Services of Citi Fund Services Ohio, Inc. (since 2004), President, FJS Associates (2002-2004). |
| | | |
Christopher E. Sabato 3435 Stelzer Road Columbus, Ohio 43219 Age: 40 | | Treasurer | | Indefinite; Since 9/05 | | Senior Vice President, Fund Administration of Citi Fund Services (since 1993). |
| | | |
Jennifer A. English 100 Summer Street, Suite 1500 Boston, Massachusetts 02110 Age: 37 | | Secretary | | Indefinite; Since 12/07 | | Senior Vice President, Regulatory Administration, Citi Fund Services Ohio, Inc. (since 2009),Vice President, Regulatory Administration, Citi Fund Services Ohio, Inc. (since 2005), Assistant Vice President and Assistant Counsel, PFPC, Inc. (2002-2005). |
| * | Each officer may have served in various other capacities for the same organization during the length of time served. |
106
PACIFIC CAPITAL FUNDS
Additional Information
July 31, 2009
(Unaudited)
Expense Examples
As a shareholder of the Pacific Capital Funds, you incur two types of costs: (1) transaction costs, including sales charges (loads) on purchases, redemption fees, and exchange fees; and (2) ongoing costs, including management fees, distribution 12b-1 fees, and other Fund expenses. This example is intended to help you understand your ongoing costs (in dollars) of investing in the Pacific Capital Funds and to compare these costs with the ongoing costs of investing in other mutual funds.
These Examples are based on an investment of $1,000 invested at the beginning of the period and held for the entire period from February 1, 2009 through July 31, 2009.
Actual Expenses
The table below provides information about actual account values and actual expenses. You may use the information below, together with the amount you invested, to estimate the expenses that you paid over the period. Simply divide your account value by $1,000 (for example, an $8,600 account value divided by $1,000 = 8.6), then multiply the result by the number in the table under the heading entitled “Expenses Paid During Period” to estimate the expenses you paid on your account during this period.
| | | | | | | | | | | | | | |
| | | | | Beginning
Account
Value
2/1/09 | | Ending
Account
Value
7/31/09 | | Expenses
Paid
During
Period*
2/1/09 -
7/31/09 | | Expense
Ratio
During
Period**
2/1/09 -
7/31/09 | |
New Asia Growth Fund | | Class A | | $ | 1,000.00 | | $ | 1,440.90 | | $ | 10.41 | | 1.72 | % |
| | Class B | | | 1,000.00 | | | 1,435.10 | | | 14.91 | | 2.47 | % |
| | Class C | | | 1,000.00 | | | 1,434.20 | | | 14.91 | | 2.47 | % |
| | Class Y | | | 1,000.00 | | | 1,441.70 | | | 8.90 | | 1.47 | % |
| | | | | |
International Stock Fund | | Class A | | | 1,000.00 | | | 1,430.60 | | | 11.81 | | 1.96 | % |
| | Class B | | | 1,000.00 | | | 1,425.80 | | | 16.30 | | 2.71 | % |
| | Class C | | | 1,000.00 | | | 1,424.50 | | | 16.29 | | 2.71 | % |
| | Class Y | | | 1,000.00 | | | 1,429.90 | | | 10.30 | | 1.71 | % |
| | | | | |
Small Cap Fund | | Class A | | | 1,000.00 | | | 1,226.50 | | | 9.83 | | 1.78 | % |
| | Class B | | | 1,000.00 | | | 1,225.90 | | | 9.82 | | 1.78 | % |
| | Class C | | | 1,000.00 | | | 1,220.20 | | | 13.93 | | 2.53 | % |
| | Class Y | | | 1,000.00 | | | 1,226.80 | | | 8.45 | | 1.53 | % |
| | | | | |
Mid-Cap Fund | | Class A | | | 1,000.00 | | | 1,247.10 | | | 7.91 | | 1.42 | % |
| | Class C | | | 1,000.00 | | | 1,243.00 | | | 12.07 | | 2.17 | % |
| | Class Y | | | 1,000.00 | | | 1,247.80 | | | 6.52 | | 1.17 | % |
| | | | | |
Growth Stock Fund | | Class A | | | 1,000.00 | | | 1,174.90 | | | 7.39 | | 1.37 | % |
| | Class B | | | 1,000.00 | | | 1,169.30 | | | 11.40 | | 2.12 | % |
| | Class C | | | 1,000.00 | | | 1,169.50 | | | 11.40 | | 2.12 | % |
| | Class Y | | | 1,000.00 | | | 1,175.10 | | | 6.04 | | 1.12 | % |
107
PACIFIC CAPITAL FUNDS
Additional Information, continued
July 31, 2009
(Unaudited)
| | | | | | | | | | | | | | |
| | | | | Beginning
Account
Value
2/1/09 | | Ending
Account
Value
7/31/09 | | Expenses
Paid
During
Period*
2/1/09 -
7/31/09 | | Expense
Ratio
During
Period**
2/1/09 -
7/31/09 | |
Growth and Income Fund | | Class A | | $ | 1,000.00 | | $ | 1,165.10 | | $ | 7.09 | | 1.32 | % |
| | Class B | | | 1,000.00 | | | 1,161.30 | | | 11.09 | | 2.07 | % |
| | Class C | | | 1,000.00 | | | 1,160.60 | | | 11.09 | | 2.07 | % |
| | Class Y | | | 1,000.00 | | | 1,166.20 | | | 5.75 | | 1.07 | % |
| | | | | |
Value Fund | | Class A | | | 1,000.00 | | | 1,193.60 | | | 6.96 | | 1.28 | % |
| | Class B | | | 1,000.00 | | | 1,189.70 | | | 11.02 | | 2.03 | % |
| | Class C | | | 1,000.00 | | | 1,187.70 | | | 11.01 | | 2.03 | % |
| | Class Y | | | 1,000.00 | | | 1,194.40 | | | 5.60 | | 1.03 | % |
| | | | | |
High Grade Core Fixed Income Fund | | Class A | | | 1,000.00 | | | 1,036.30 | | | 5.20 | | 1.03 | % |
| | Class B | | | 1,000.00 | | | 1,032.50 | | | 8.97 | | 1.78 | % |
| | Class C | | | 1,000.00 | | | 1,033.50 | | | 8.97 | | 1.78 | % |
| | Class Y | | | 1,000.00 | | | 1,037.30 | | | 3.94 | | 0.78 | % |
| | | | | |
Tax-Free Securities Fund | | Class A | | | 1,000.00 | | | 1,027.20 | | | 5.18 | | 1.03 | % |
| | Class B | | | 1,000.00 | | | 1,023.40 | | | 8.93 | | 1.78 | % |
| | Class C | | | 1,000.00 | | | 1,023.30 | | | 8.93 | | 1.78 | % |
| | Class Y | | | 1,000.00 | | | 1,028.30 | | | 3.92 | | 0.78 | % |
| | | | | |
High Grade Short Intermediate Fixed Income Fund | | Class A | | | 1,000.00 | | | 1,033.90 | | | 3.88 | | 0.77 | % |
| | Class C | | | 1,000.00 | | | 1,029.00 | | | 7.65 | | 1.52 | % |
| | Class Y | | | 1,000.00 | | | 1,035.10 | | | 2.62 | | 0.52 | % |
| | | | | |
Tax-Free Short Intermediate Securities Fund | | Class A | | | 1,000.00 | | | 1,009.50 | | | 5.33 | | 1.07 | % |
| | Class C | | | 1,000.00 | | | 1,005.80 | | | 9.05 | | 1.82 | % |
| | Class Y | | | 1,000.00 | | | 1,010.70 | | | 4.09 | | 0.82 | % |
| | | | | |
U.S. Government Short Fixed Income Fund | | Class A | | | 1,000.00 | | | 1,007.10 | | | 3.53 | | 0.71 | % |
| | Class B | | | 1,000.00 | | | 1,003.80 | | | 7.25 | | 1.46 | % |
| | Class C | | | 1,000.00 | | | 1,004.40 | | | 7.26 | | 1.46 | % |
| | Class Y | | | 1,000.00 | | | 1,008.40 | | | 2.29 | | 0.46 | % |
| * | Expenses are equal to the average account value times the Fund’s annualized expense ratio multiplied by the number of days in the most recent fiscal half-year divided by the number of days in the fiscal year. |
108
PACIFIC CAPITAL FUNDS
Additional Information, continued
July 31, 2009
(Unaudited)
Hypothetical Example
The table below provides information about hypothetical account values and hypothetical expenses based on each Pacific Capital Fund’s actual expense ratio and an assumed rate of return of 5% per year before expenses, which is not the Fund’s actual return. The hypothetical account values and expenses may not be used to estimate the actual ending account balance or expenses you paid for the period. You may use this information to compare this 5% hypothetical example with the 5% hypothetical examples that appear in the shareholder reports of other funds.
Please note that the expenses shown in the table are meant to highlight your ongoing costs only and do not reflect any transactional costs. Therefore, the table is useful in comparing ongoing costs only, and will not help you determine the relative total costs of owning different funds. In addition, if these transactional costs were included, your costs would have been higher.
| | | | | | | | | | | | | | |
| | | | | Beginning
Account Value
2/1/09 | | Ending
Account Value
7/31/09 | | Expenses Paid
During Period*
2/1/09 - 7/31/09 | | Expense Ratio
During Period**
2/1/09 - 7/31/09 | |
New Asia Growth Fund | | Class A | | $ | 1,000.00 | | $ | 1,016.27 | | $ | 8.60 | | 1.72 | % |
| | Class B | | | 1,000.00 | | | 1,012.55 | | | 12.33 | | 2.47 | |
| | Class C | | | 1,000.00 | | | 1,012.55 | | | 12.33 | | 2.47 | |
| | Class Y | | | 1,000.00 | | | 1,017.50 | | | 7.35 | | 1.47 | |
| | | | | |
International Stock Fund | | Class A | | | 1,000.00 | | | 1,015.08 | | | 9.79 | | 1.96 | |
| | Class B | | | 1,000.00 | | | 1,011.36 | | | 13.51 | | 2.71 | |
| | Class C | | | 1,000.00 | | | 1,011.36 | | | 13.51 | | 2.71 | |
| | Class Y | | | 1,000.00 | | | 1,016.31 | | | 8.55 | | 1.71 | |
| | | | | |
Small Cap Fund | | Class A | | | 1,000.00 | | | 1,015.97 | | | 8.90 | | 1.78 | |
| | Class B | | | 1,000.00 | | | 1,015.97 | | | 8.90 | | 1.78 | |
| | Class C | | | 1,000.00 | | | 1,012.25 | | | 12.62 | | 2.53 | |
| | Class Y | | | 1,000.00 | | | 1,017.21 | | | 7.65 | | 1.53 | |
| | | | | |
Mid-Cap Fund | | Class A | | | 1,000.00 | | | 1,017.75 | | | 7.10 | | 1.42 | |
| | Class C | | | 1,000.00 | | | 1,014.03 | | | 10.84 | | 2.17 | |
| | Class Y | | | 1,000.00 | | | 1,018.99 | | | 5.86 | | 1.17 | |
| | | | | |
Growth Stock Fund | | Class A | | | 1,000.00 | | | 1,018.00 | | | 6.85 | | 1.37 | |
| | Class B | | | 1,000.00 | | | 1,014.28 | | | 10.59 | | 2.12 | |
| | Class C | | | 1,000.00 | | | 1,014.28 | | | 10.59 | | 2.12 | |
| | Class Y | | | 1,000.00 | | | 1,019.24 | | | 5.61 | | 1.12 | |
| | | | | |
Growth and Income Fund | | Class A | | | 1,000.00 | | | 1,018.25 | | | 6.61 | | 1.32 | |
| | Class B | | | 1,000.00 | | | 1,014.53 | | | 10.34 | | 2.07 | |
| | Class C | | | 1,000.00 | | | 1,014.53 | | | 10.34 | | 2.07 | |
| | Class Y | | | 1,000.00 | | | 1,019.49 | | | 5.36 | | 1.07 | |
| | | | | |
Value Fund | | Class A | | | 1,000.00 | | | 1,018.45 | | | 6.41 | | 1.28 | |
| | Class B | | | 1,000.00 | | | 1,014.73 | | | 10.14 | | 2.03 | |
| | Class C | | | 1,000.00 | | | 1,014.73 | | | 10.14 | | 2.03 | |
| | Class Y | | | 1,000.00 | | | 1,019.69 | | | 5.16 | | 1.03 | |
| | | | | |
High Grade Core Fixed Income Fund | | Class A | | | 1,000.00 | | | 1,019.69 | | | 5.16 | | 1.03 | |
| | Class B | | | 1,000.00 | | | 1,015.97 | | | 8.90 | | 1.78 | |
| | Class C | | | 1,000.00 | | | 1,015.97 | | | 8.90 | | 1.78 | |
| | Class Y | | | 1,000.00 | | | 1,020.93 | | | 3.91 | | 0.78 | |
109
PACIFIC CAPITAL FUNDS
Additional Information, continued
July 31, 2009
(Unaudited)
| | | | | | | | | | | | | | |
| | | | | Beginning
Account Value
2/1/09 | | Ending
Account Value
7/31/09 | | Expenses Paid
During Period*
2/1/09 - 7/31/09 | | Expense Ratio
During Period**
2/1/09 - 7/31/09 | |
| | | | | |
Tax-Free Securities Fund | | Class A | | $ | 1,000.00 | | $ | 1,019.69 | | $ | 5.16 | | 1.03 | % |
| | Class B | | | 1,000.00 | | | 1,015.97 | | | 8.90 | | 1.78 | |
| | Class C | | | 1,000.00 | | | 1,015.97 | | | 8.90 | | 1.78 | |
| | Class Y | | | 1,000.00 | | | 1,020.93 | | | 3.91 | | 0.78 | |
| | | | | |
High Grade Short Intermediate Fixed Income Fund | | Class A | | | 1,000.00 | | | 1,020.98 | | | 3.86 | | 0.77 | |
| | Class C | | | 1,000.00 | | | 1,017.26 | | | 7.60 | | 1.52 | |
| | Class Y | | | 1,000.00 | | | 1,022.22 | | | 2.61 | | 0.52 | |
| | | | | |
Tax-Free Short Intermediate Securities Fund | | Class A | | | 1,000.00 | | | 1,019.49 | | | 5.36 | | 1.07 | |
| | Class C | | | 1,000.00 | | | 1,015.77 | | | 9.10 | | 1.82 | |
| | Class Y | | | 1,000.00 | | | 1,020.73 | | | 4.11 | | 0.82 | |
| | | | | |
U.S. Government Short Fixed Income
Fund | | Class A | | | 1,000.00 | | | 1,021.27 | | | 3.56 | | 0.71 | |
| | Class B | | | 1,000.00 | | | 1,017.55 | | | 7.30 | | 1.46 | |
| | Class C | | | 1,000.00 | | | 1,017.55 | | | 7.30 | | 1.46 | |
| | Class Y | | | 1,000.00 | | | 1,022.51 | | | 2.31 | | 0.46 | |
| * | Expenses are equal to the average account value times the Fund’s annualized expense ratio multiplied by the number of days in the most recent fiscal half-year divided by the number of days in the fiscal year. |
Proxy Voting
Information regarding the policies and procedures that the Funds use to determine how to vote proxies relating to portfolio securities is available without charge, upon request, by calling 1-800-258-9232. The information also is included in the Funds’ Statement of Additional Information, which is available on the Funds’ website at www.pacificcapitalfunds.com and on the Securities and Exchange Commission’s website at www.sec.gov. Information relating to how each fund voted proxies relating to portfolio securities held during the most recent twelve months ended June 30 is available on the Funds’ website at www.pacificcapitalfunds.com and on the Securities and Exchange Commission’s website at www.sec.gov.
Portfolio Holdings Information
The Funds file a complete list of their portfolio holdings with the Securities and Exchange Commission for the first and third quarters of each fiscal year on Form N-Q. Forms N-Q are available free of charge on the Securities and Exchange Commission’s website at www.sec.gov. You may also review or, for a fee, copy those documents by visiting the Securities and Exchange Commission’s Public Reference Room in Washington, D.C. Information on the operation of the Public Reference Room may be obtained by calling the Securities and Exchange Commission at 1-202-551-8090.
110

(a) The registrant has adopted a code of ethics that applies to the registrant’s principal executive officer, principal financial officer, principal accounting officer or controller, or persons performing similar functions. This code of ethics is included as an Exhibit.
(b) During the period covered by the report, with respect to the registrant’s code of ethics that applies to its principal executive officer, principal financial officer, principal accounting officer or controller, or persons performing similar functions; there have been no amendments to, nor any waivers granted from, a provision that relates to any element of the code of ethics definition enumerated in paragraph (b) of this Item 2.
| Item 3. | Audit Committee Financial Expert. |
3(a)(1) The Registrant’s Board of Trustees has determined that no member of the Board’s audit committee qualifies as an audit committee financial expert (“ACFE”).
3(a)(2) The audit committee has determined that no member is “independent” for purposes of this Item 3 of Form N-CSR.
3(a)(3) After evaluating the matter, the Board concluded that it was not necessary to add a Trustee to the Board who qualified as an ACFE, as the business experience of the current independent members of the Board was adequate to exercise their oversight responsibilities.
| Item 4. | Principal Accountant Fees and Services. |
| | | | | | |
| | | 2009 | | 2008 |
Audit Fees | | $ | 146,500 | | $ | 141,000 |
Audit-Related Fees | | $ | 16,000 | | $ | 14,750 |
Tax Fees | | $ | 61,500 | | $ | 59,220 |
All Other Fees | | $ | 0 | | $ | 0 |
Nature of services regarding Audit-Related Fees:
| | 2009: | Consent on N-1A charges: $5,000 plus $11,000 for 17f-2 count |
| | 2008: | Consent on N-1A charges: $4,750 plus $10,000 for 17f-2 count |
Nature of services regarding Tax Fees:
| | 2009: | Preparation of federal income tax and U.S. excise tax returns; preparation of Hawaiian corporate tax returns; excise tax distribution review. |
| | 2008: | Preparation of federal income tax and U.S. excise tax returns; preparation of Hawaiian corporate tax returns; excise tax distribution review. |
(e)(1) Registrant’s audit committee meets with the principal accountants and management to review and pre-approve all audit services to be provided by the principal accountants. The audit committee shall pre-approve all auditing services and permissible non-audit services (e.g., tax services) to be provided to the Funds by the auditor, including the fees therefore and has not adopted pre-approval policies and procedures as described in Rule 2-01 (c)(7)(i)(B) of Reg. S-X.
(e)(2) None of the services summarized in (a)-(d), above, were approved by the Audit Committee pursuant to Rule 2-01(c)(7)(i)(C) of Regulation S-X.
(f) Not applicable.
(g) For the fiscal years ended July 31, 2009 and July 31, 2008, Non-Audit Fees billed to the Funds for services provided to the Funds and any of the Funds’ investment advisers and any entity controlling, controlled by, or under common control with the investment adviser that provides ongoing services to the Funds for each of the last two fiscal years of the Funds, totaled approximately $0 for 2009 and $773,970 for 2008.
(h) Not applicable
| Item 5. | Audit Committee of Listed Registrants. |
Not applicable.
| Item 6. | Schedule of Investments. |
(a) Not applicable.
(b) Not applicable.
| Item 7. | Disclosure of Proxy Voting Policies and Procedures for Closed-End Management Investment Companies. |
Not applicable.
| Item 8. | Portfolio Managers of Closed-End Management Investment Companies. |
Not applicable.
| Item 9. | Purchases of Equity Securities by Closed-End Management Investment Company and Affiliated Purchasers. |
Not applicable.
| Item 10. | Submission of Matters to a Vote of Security Holders. |
Not applicable.
| Item 11. | Controls and Procedures. |
(a)The registrant’s principal executive officer and principal financial officer have concluded, based on their evaluation of the registrant’s disclosure controls and procedures as conducted within 90 days of the filing date of this report, that these disclosure controls and procedures are adequately designed and are operating effectively to ensure that information required to be disclosed by the registrant on Form N-CSR is recorded, processed, summarized and reported within the time periods specified in the Securities and Exchange Commission’s rules and forms.
(b)There were no changes in the registrant’s internal control over financial reporting (as defined in Rule 30a-3(d) under the Act (17 CFR 270.30a-3(d)) that occurred during the second fiscal quarter of the period covered by this report that have materially affected or are reasonably likely to materially affect, the registrant’s internal control over financial reporting.
(a)(1) The code of ethics that is the subject of the disclosure required by Item 2 is attached hereto.
(a)(2) Certifications pursuant to Rule 30a-2(a) are attached hereto.
(a)(3) Not applicable.
(b) Certifications pursuant to Rule 30a-2(b) are furnished herewith.
SIGNATURES
Pursuant to the requirements of the Securities Exchange Act of 1934 and the Investment Company Act of 1940, the registrant has duly caused this report to be signed on its behalf by the undersigned, thereunto duly authorized.
| | |
(Registrant) Pacific Capital Funds |
| By (Signature and Title)* | | /s/ Robert I Crowell |
| | Robert I. Crowell, President |
Date 9/23/09 |
Pursuant to the requirements of the Securities Exchange Act of 1934 and the Investment Company Act of 1940, this report has been signed below by the following persons on behalf of the registrant and in the capacities and on the dates indicated.
| | |
| By (Signature and Title)* | | /s/ Robert I Crowell |
| | Robert I. Crowell, President |
Date 9/23/09 |
| | |
| By (Signature and Title)* | | /s/ Christopher E Sabato |
| | Christopher E. Sabato, Treasurer |
Date 9/23/09 |
| * | Print the name and title of each signing officer under his or her signature. |