UNITED STATES
SECURITIES AND EXCHANGE COMMISSION
Washington, D.C. 20549
FORM N-CSR
CERTIFIED SHAREHOLDER REPORT OF REGISTERED MANAGEMENT INVESTMENT COMPANIES
Investment Company Act file number
(Exact name of registrant as specified in charter)
One Station Place, Suite 303
Stamford, CT 06902
(Address of principal executive offices) (Zip code)
Frederick C. Teufel, Jr.
Tweedy, Browne Company LLC
One Station Place, Suite 303
Stamford, CT 06902
(Name and address of agent for service)
Registrant's telephone number, including area code:
Date of reporting period:
Item 1. Report to Stockholders
(a) The registrant’s semi-annual report transmitted to shareholders pursuant to Rule 30e-1 under the Investment Company Act of 1940 is as follows:
INTERNATIONAL VALUE FUND
(TBGVX)
SEMI-ANNUAL SHAREHOLDER REPORT | September 30, 2024
This Semi-Annual shareholder report contains important information about the Tweedy, Browne International Value Fund (“Fund”) for the period of April 1, 2024 to September 30, 2024 as well as certain changes to the Fund. You can find additional information about the Fund at www.tweedyfunds.com. You can also request this information by contacting us at 1-800-432-4789.
What Were the Fund Expenses for the Last Six Months?
(Based on a hypothetical $10,000 investment)
| Fund (Class) | COSTS OF A $10,000 INVESTMENT | COSTS PAID AS A PERCENTAGE
OF A $10,000 INVESTMENT |
| INTERNATIONAL VALUE FUND (TBGVX) | $71 | 1.39% |
MANAGEMENTS’ DISCUSSION OF FUND PERFORMANCE
Market Overview
International equity markets continued to advance over the last six months, buoyed by better-than-expected economic data in many parts of the world, including declines in inflation and interest rates in Europe and China’s recent adoption of fiscal and monetary stimulus packages.
What Impacted Performance During the Period?
In this continued risk-on environment, the Tweedy, Browne International Value Fund made financial progress but underperformed its benchmark index. For the six months ending September 30, 2024, the Fund produced a return of 2.92% versus 6.81% for the MSCI EAFE Index in USD.
The Fund’s North American equity holdings contributed to returns during the period, while returns in Europe and Japan were somewhat dampened by geopolitical risks and concerns around the economic impact of a resurgent Japanese yen. The Fund’s considerable weight in European equities was a particular drag on returns.
The Fund’s materials, healthcare, financial, and communication services holdings led returns, while its consumer staples holdings, together with a number of its consumer discretionary and industrial holdings, produced disappointing results, as did its small and medium capitalization holdings. In terms of its industry segments, the Fund’s bank, chemical, interactive media, and pharmaceutical stocks were net contributors to returns, while its food and beverage, machinery, and auto-related holdings disappointed.
The Fund’s foreign currency hedging policy also detracted from returns as the US dollar weakened against most major currencies during the period, causing declines in the value of most forward hedging contracts.
Top Equity Performance Contributors
Contributors included Fresenius SE & Co, Roche Holding, United Overseas Bank, Alphabet, Berkshire Hathaway, Tencent, Kemira, Novartis, National Bank of Canada, and SOL SpA.
Top Equity Performance Detractors
Detractors included SCOR SE, Nestlé, Diageo, BAE Systems, Rubis, Samsung Electronics, Husqvarna, TotalEnergies, Heineken Holding, and Alten.
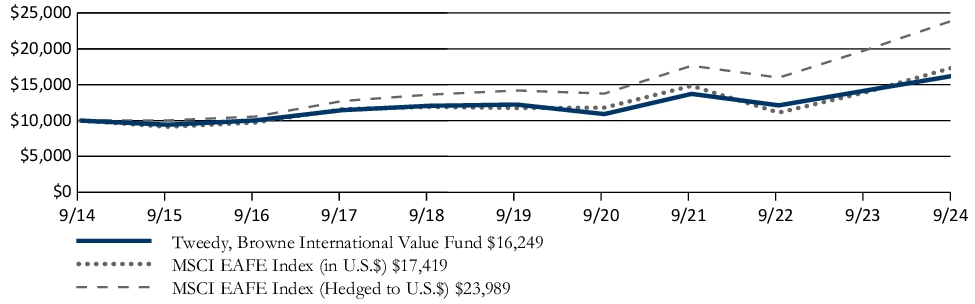
How Has the Fund Historically Performed?
The following graph and chart compare the initial and subsequent account values at the end of each of the most recently completed 10 years of the Fund. It assumes a $10,000 initial investment at the beginning of the first year in an appropriate, broad-based securities market index for the same period.
The Fund has changed its comparative broad-based securities market index from MSCI EAFE Index (Hedged to U.S.$) to the MSCI EAFE Index (in U.S.$) in order to comply with new regulatory requirements regarding the presentation of comparative index performance.
GROWTH OF $10,000
| AVERAGE ANNUAL TOTAL RETURNS | 6 MONTH | 1 YEAR | 5 YEARS | 10 YEARS |
| INTERNATIONAL VALUE FUND (TBGVX) | 2.92% | 14.48% | 5.85% | 4.97% |
| MSCI EAFE Index (in U.S.$) | 6.81% | 24.77% | 8.20% | 5.71% |
| MSCI EAFE Index (Hedged to U.S.$) | 3.20% | 20.88% | 11.06% | 9.14% |
The preceding performance data represents past performance and is not a guarantee of future results. Total return and principal value of an investment will fluctuate so that an investor’s shares, when redeemed, may be worth more or less than their original cost. The graph and table do not reflect the deduction of taxes that a shareholder would pay on Fund distributions or the redemption of Fund shares. Current performance may be lower or higher than the performance data shown. Results are annualized for all periods greater than one year. Please visit www.tweedyfunds.com to obtain performance data that is current to the most recent month end.
| Fund net assets | $5,656,343,621 |
| Total number of portfolio holdings | 96 |
| Total advisory fee paid | $36,409,905 |
| Portfolio turnover rate as of the end of the reporting period | 10% |
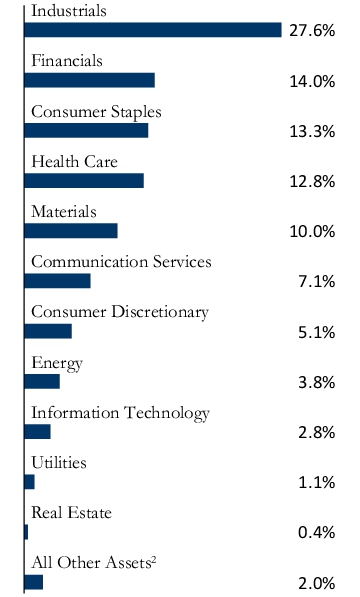
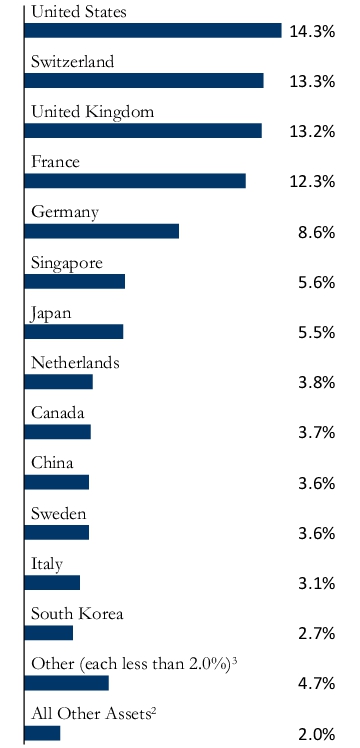
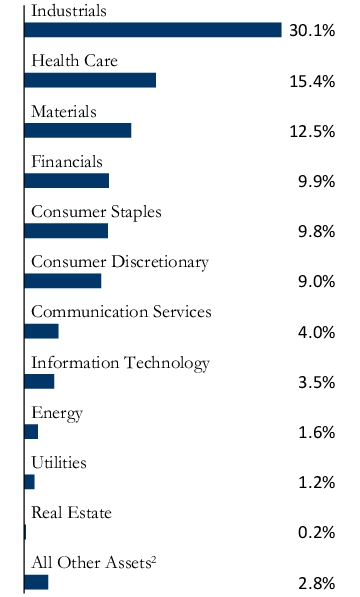
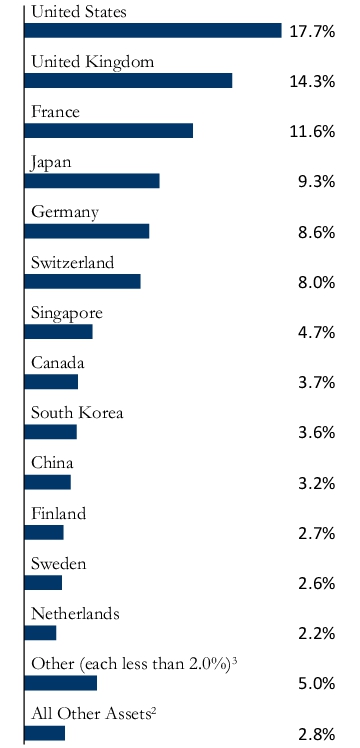
What Did the Fund Invest In?
(as of September 30, 2024)
| Berkshire Hathaway, Inc. | 4.1% |
| Safran SA | 3.9% |
| TotalEnergies SE | 3.8% |
| Alphabet, Inc. | 3.8% |
| BAE Systems plc | 3.7% |
| Nestlé SA | 3.4% |
| Roche Holding AG | 3.3% |
| United Overseas Bank, Ltd. | 3.2% |
| SOL SpA | 3.1% |
| Heineken Holding NV | 2.9% |
1 Excludes short-term investments.
2 Includes cash, Treasury Bills, and money market funds.
3 Includes Belgium, Chile, Croatia, Czech Republic, Finland, Hong Kong, Mexico and Philippines.
Material Fund Changes
There have been no material changes to the Fund since April 1, 2024.
Where Can I Find More Information?
You can find additional information about the Fund such as the prospectus, financial information, fund holdings and proxy voting information at www.tweedyfunds.com. You can also request this information by calling 1-800-432-4789.
Important Notice to Shareholders
In order to reduce expenses, we will deliver a single copy of prospectuses, proxies, financial reports and other communication to shareholders with the same residential address, provided they have the same last name or we reasonably believe them to be members of the same family. Unless we are notified otherwise, we will continue to send recipients only one copy of these materials for as long as they remain a shareholder of the Fund. If you would like to receive individual mailings, please call 1-800-432-4789 and we will begin sending you separate copies of these materials within 30 days after receiving your request. For additional information, please visit www.tweedyfunds.com.
INTERNATIONAL VALUE FUND II -
CURRENCY UNHEDGED (TBCUX)
SEMI-ANNUAL SHAREHOLDER REPORT | September 30, 2024
This Semi-Annual shareholder report contains important information about the Tweedy, Browne International Value Fund II - Currency Unhedged (“Fund”) for the period of April 1, 2024 to September 30, 2024 as well as certain changes to the Fund. You can find additional information about the Fund at www.tweedyfunds.com. You can also request this information by contacting us at 1-800-432-4789.
What Were the Fund Expenses for the Last Six Months?
(Based on a hypothetical $10,000 investment)
| Fund (Class) | COSTS OF A $10,000 INVESTMENT | COSTS PAID AS A PERCENTAGE
OF A $10,000 INVESTMENT |
| INTERNATIONAL VALUE FUND II - CURRENCY UNHEDGED (TBCUX) | $72 | 1.40% |
MANAGEMENTS’ DISCUSSION OF FUND PERFORMANCE
Market Overview
International equity markets continued to advance over the last six months, buoyed by better-than-expected economic data in many parts of the world, including declines in inflation and interest rates in Europe and China’s recent adoption of fiscal and monetary stimulus packages.
What Impacted Performance During the Period?
In this continued risk-on environment, the Tweedy, Browne International Value Fund II — Currency Unhedged made financial progress but underperformed its benchmark index. For the six months ending September 30, 2024, the Fund produced a return of 4.48% versus 6.81% for the MSCI EAFE Index in USD.
The Fund’s North American equity holdings contributed to returns during the period, while returns in Europe and Japan were somewhat dampened by geopolitical risks and concerns around the economic impact of a resurgent Japanese yen. The Fund’s considerable weight in European equities was a particular drag on returns.
The Fund’s materials, healthcare, financial, and communication services holdings led returns, while its information technology, utility, and consumer discretionary holdings produced disappointing results, as did its smaller capitalization holdings. In terms of its industry segments, the Fund’s chemical, pharmaceutical, bank, healthcare services, and interactive media stocks were net contributors to returns, while its information technology, insurance, industrial conglomerate, and gas utility holdings disappointed.
Top Equity Performance Contributors
Contributors included Kemira, Roche Holding, Fresenius SE & Co., Kuraray, Berkshire Hathaway, Inchcape, United Overseas Bank, Alphabet, Uni-President China Holdings, and Winpak.
Top Equity Performance Detractors
Detractors included SCOR SE, Rubis SCA, Alten, Samsung Electronics, Diageo, Aalberts NV, Ionis Pharmaceuticals, Nestlé, LG Corp, and Husqvarna AB.
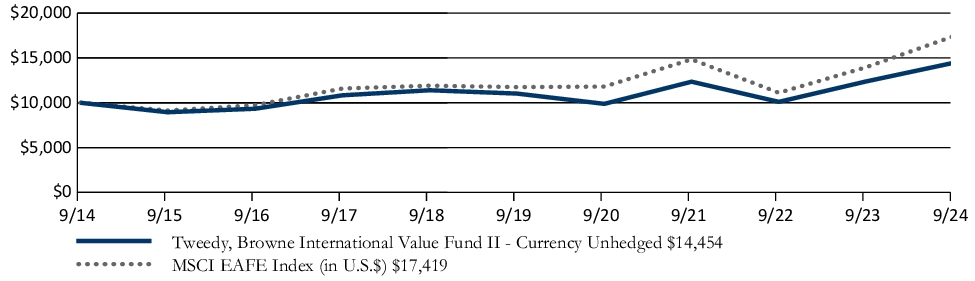
How Has the Fund Historically Performed?
The following graph and chart compare the initial and subsequent account values at the end of each of the most recently completed 10 years of the Fund. It assumes a $10,000 initial investment at the beginning of the first year in an appropriate, broad-based securities market index for the same period.
GROWTH OF $10,000
| AVERAGE ANNUAL TOTAL RETURNS | 6 MONTH | 1 YEAR | 5 YEARS | 10 YEARS |
| INTERNATIONAL VALUE FUND II - CURRENCY UNHEDGED (TBCUX) | 4.48% | 16.80% | 5.57% | 3.75% |
| MSCI EAFE Index (in U.S.$) | 6.81% | 24.77% | 8.20% | 5.71% |
The preceding performance data represents past performance and is not a guarantee of future results. Total return and principal value of an investment will fluctuate so that an investor’s shares, when redeemed, may be worth more or less than their original cost. The graph and table do not reflect the deduction of taxes that a shareholder would pay on Fund distributions or the redemption of Fund shares. Current performance may be lower or higher than the performance data shown. Results are annualized for all periods greater than one year. Please visit www.tweedyfunds.com to obtain performance data that is current to the most recent month end.
| Fund net assets | $271,160,876 |
| Total number of portfolio holdings | 77 |
| Total advisory fee paid | $1,760,862 |
| Portfolio turnover rate as of the end of the reporting period | 6% |
What Did the Fund Invest In?
(as of September 30, 2024)
| Berkshire Hathaway, Inc. | 3.8% |
| Roche Holding AG | 3.3% |
| Johnson & Johnson | 3.1% |
| Alphabet, Inc. | 3.1% |
| Safran SA | 3.0% |
| FMC Corp. | 2.8% |
| DHL Group | 2.8% |
| Kemira Oyj | 2.7% |
| Ionis Pharmaceuticals, Inc. | 2.6% |
| Novartis AG | 2.5% |
1 Excludes short-term investments.
2 Includes cash and money market funds.
3 Includes Belgium, Chile, Hong Kong, Italy, Mexico and Philippines.
Material Fund Changes
There have been no material changes to the Fund since April 1, 2024.
Where Can I Find More Information?
You can find additional information about the Fund such as the prospectus, financial information, fund holdings and proxy voting information at www.tweedyfunds.com. You can also request this information by calling 1-800-432-4789.
Important Notice to Shareholders
In order to reduce expenses, we will deliver a single copy of prospectuses, proxies, financial reports and other communication to shareholders with the same residential address, provided they have the same last name or we reasonably believe them to be members of the same family. Unless we are notified otherwise, we will continue to send recipients only one copy of these materials for as long as they remain a shareholder of the Fund. If you would like to receive individual mailings, please call 1-800-432-4789 and we will begin sending you separate copies of these materials within 30 days after receiving your request. For additional information, please visit www.tweedyfunds.com.
SEMI-ANNUAL SHAREHOLDER REPORT | September 30, 2024
This Semi-Annual shareholder report contains important information about the Tweedy, Browne Value Fund (“Fund”) for the period of April 1, 2024 to September 30, 2024 as well as certain changes to the Fund. You can find additional information about the Fund at www.tweedyfunds.com. You can also request this information by contacting us at 1-800-432-4789.
What Were the Fund Expenses for the Last Six Months?
(Based on a hypothetical $10,000 investment)
| Fund (Class) | COSTS OF A $10,000 INVESTMENT | COSTS PAID AS A PERCENTAGE
OF A $10,000 INVESTMENT |
| VALUE FUND (TWEBX) | $70 | 1.38% |
MANAGEMENTS’ DISCUSSION OF FUND PERFORMANCE
Market Overview
Global equity markets continued to surge ahead over the last six months, particularly in the U.S., driven by continued enthusiasm regarding all things “AI” related and buoyed by better-than-expected economic data in many parts of the world, including declines in inflation and interest rates in Europe and China’s more recent adoption of fiscal and monetary stimulus packages.
What Impacted Performance During the Period?
In this continued risk-on environment, the Tweedy, Browne Value Fund made financial progress but underperformed its benchmark index. For the six months ending September 30, 2024, the Fund produced a return of 1.95% versus 9.16% for the MSCI World Index in USD.
The Fund’s North American equity holdings contributed to returns during the period, while returns in Europe and Japan were somewhat dampened by geopolitical risks and concerns around the economic impact of a resurgent Japanese yen. The Fund’s considerable weight in European equities, particularly its French equities, was a drag on returns, as were the Fund’s smaller capitalization holdings.
The Fund’s healthcare, materials, financials, and communication services holdings led returns, while its utilities, consumer discretionary, energy, and information technology holdings, together with a number of its industrial holdings, produced disappointing results. In terms of its industry segments, the Fund’s health care providers, diversified financial services, pharmaceutical stocks, its bank, interactive media, and chemical holdings were net contributors to returns, while its insurance, gas utility, technology hardware, industrial conglomerate, and household durables holdings disappointed.
The Fund’s foreign currency hedging policy also detracted from returns as the US dollar weakened against most major currencies during the period, causing declines in the value of most forward hedging contracts.
Top Equity Performance Contributors
Contributors included Berkshire Hathaway, Fresenius SE & Co, Roche Holding, Alphabet, Kemira, United Overseas Bank, Winpak, Vertex Pharmaceuticals, Uni-President China Holdings, and Teleperformance.
Top Equity Performance Detractors
Detractors included SCOR SE, Rubis SCA, Samsung Electronics, Alten SA, Husqvarna AB, TotalEnergies, Heineken, Ubisoft, Autoliv, and Aalberts NV.
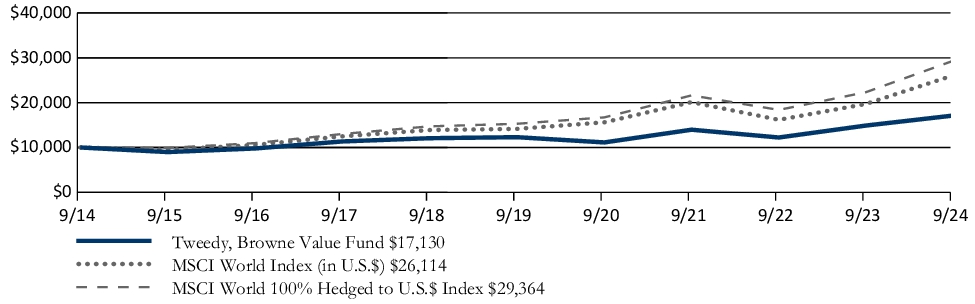
How Has the Fund Historically Performed?
The following graph and chart compare the initial and subsequent account values at the end of each of the most recently completed 10 years of the Fund. It assumes a $10,000 initial investment at the beginning of the first year in an appropriate, broad-based securities market index for the same period.
The Fund has changed its comparative broad-based securities market index from MSCI World Index (Hedged to U.S.$) to the MSCI World Index (in U.S.$) in order to comply with new regulatory requirements regarding the presentation of comparative index performance.
GROWTH OF $10,000
| AVERAGE ANNUAL TOTAL RETURNS | 6 MONTH | 1 YEAR | 5 YEARS | 10 YEARS |
| VALUE FUND (TWEBX) | 1.95% | 15.01% | 6.85% | 5.53% |
| MSCI World Index (in U.S.$) | 9.16% | 32.43% | 13.04% | 10.07% |
| MSCI World 100% Hedged to U.S.$ Index | 8.26% | 31.45% | 13.95% | 11.37% |
The preceding performance data represents past performance and is not a guarantee of future results. Total return and principal value of an investment will fluctuate so that an investor’s shares, when redeemed, may be worth more or less than their original cost. The graph and table do not reflect the deduction of taxes that a shareholder would pay on Fund distributions or the redemption of Fund shares. Current performance may be lower or higher than the performance data shown. Results are annualized for all periods greater than one year. Please visit www.tweedyfunds.com to obtain performance data that is current to the most recent month end.
| Fund net assets | $450,429,319 |
| Total number of portfolio holdings | 88 |
| Total advisory fee paid | $2,837,166 |
| Portfolio turnover rate as of the end of the reporting period | 10% |
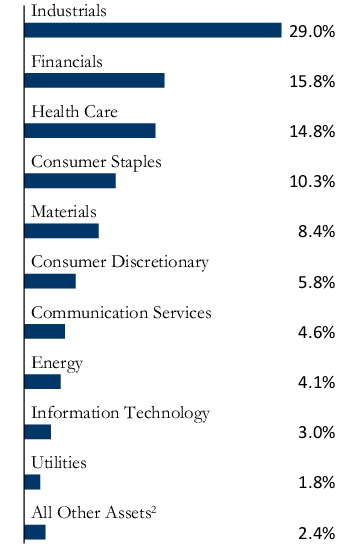
What Did the Fund Invest In?
(as of September 30, 2024)
| Berkshire Hathaway, Inc. | 6.8% |
| Safran SA | 3.8% |
| TotalEnergies SE | 3.4% |
| Alphabet, Inc. | 3.2% |
| Roche Holding AG | 3.2% |
| Wells Fargo & Co. | 2.8% |
| Nestlé SA | 2.6% |
| FMC Corp. | 2.5% |
| Johnson & Johnson | 2.3% |
| Teleperformance SE | 2.2% |
1 Excludes short-term investments.
2 Includes cash, Treasury Bills, and money market funds.
3 Includes Belgium, Canada, Chile, Finland, Hong Kong, Mexico and Philippines.
Material Fund Changes
There have been no material changes to the Fund since April 1, 2024.
Where Can I Find More Information?
You can find additional information about the Fund such as the prospectus, financial information, fund holdings and proxy voting information at www.tweedyfunds.com. You can also request this information by calling 1-800-432-4789.
Important Notice to Shareholders
In order to reduce expenses, we will deliver a single copy of prospectuses, proxies, financial reports and other communication to shareholders with the same residential address, provided they have the same last name or we reasonably believe them to be members of the same family. Unless we are notified otherwise, we will continue to send recipients only one copy of these materials for as long as they remain a shareholder of the Fund. If you would like to receive individual mailings, please call 1-800-432-4789 and we will begin sending you separate copies of these materials within 30 days after receiving your request. For additional information, please visit www.tweedyfunds.com.
WORLDWIDE HIGH DIVIDEND YIELD
VALUE FUND (TBHDX)
SEMI-ANNUAL SHAREHOLDER REPORT | September 30, 2024
This Semi-Annual shareholder report contains important information about the Tweedy, Browne Worldwide High Dividend Yield Value Fund (“Fund”) for the period of April 1, 2024 to September 30, 2024 as well as certain changes to the Fund. You can find additional information about the Fund at www.tweedyfunds.com. You can also request this information by contacting us at 1-800-432-4789.
What Were the Fund Expenses for the Last Six Months?
(Based on a hypothetical $10,000 investment)
| Fund (Class) | COSTS OF A $10,000 INVESTMENT | COSTS PAID AS A PERCENTAGE
OF A $10,000 INVESTMENT |
| WORLDWIDE HIGH DIVIDEND YIELD VALUE FUND (TBHDX) | $72 | 1.39% |
MANAGEMENTS’ DISCUSSION OF FUND PERFORMANCE
Market Overview
Global equity markets continued to surge ahead over the last six months, particularly in the U.S., driven by continued enthusiasm regarding all things “AI” related and buoyed by better-than-expected economic data in many parts of the world, including declines in inflation and interest rates in Europe and China’s more recent adoption of fiscal and monetary stimulus packages.
What Impacted Performance During the Period?
In this continued risk-on environment, the Tweedy, Browne Worldwide High Dividend Yield Value Fund made financial progress but underperformed its benchmark index. For the six months ending September 30, 2024, the Fund produced a return of 5.38% versus 9.16% for the MSCI World Index in USD.
The Fund’s North American equity holdings contributed to returns during the period, while returns in Europe and Japan were somewhat dampened by geopolitical risks and concerns around the economic impact of a resurgent Japanese yen. The Fund’s considerable weight in European equities, particularly its French equities, was a drag on returns, as were the Fund’s smaller capitalization holdings.
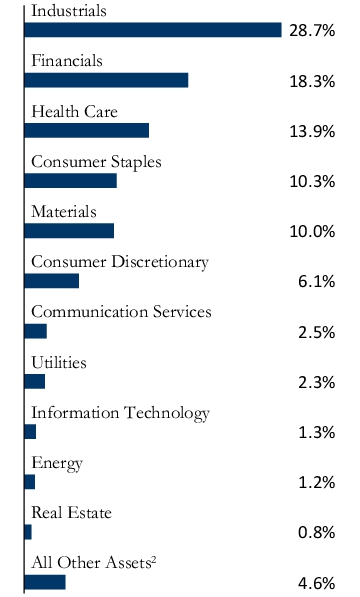
The Fund’s healthcare, materials, financials, and real estate holdings led returns, while its utility, consumer staples, and consumer discretionary holdings, together with a number of its industrial holdings, produced disappointing results. In terms of its industry segments, the Fund’s chemical, bank, healthcare services, pharmaceuticals, and distributor holdings were net contributors to returns, while its gas utility, beverage, machinery, aerospace & defense, and household durables holdings disappointed.
Top Equity Performance Contributors
Contributors included Kemira, Fresenius SE & Co, Roche Holding, Uni-President China Holdings, Progressive, United Overseas Bank, Kuraray, Inchcape, Novartis, and DBS Group.
Top Equity Performance Detractors
Detractors included SCOR SE, Rubis SCA, Diageo, Nestlé, BAE Systems, GSK PLC, Aalberts, Husqvarna, Sumitomo Heavy, and Autoliv.
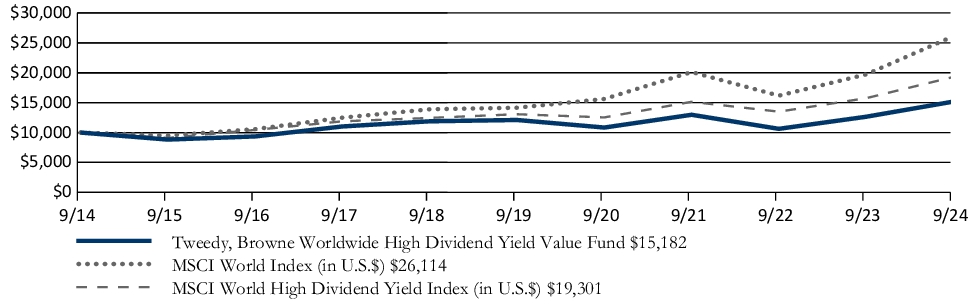
How Has the Fund Historically Performed?
The following graph and chart compare the initial and subsequent account values at the end of each of the most recently completed 10 years of the Fund. It assumes a $10,000 initial investment at the beginning of the first year in an appropriate, broad-based securities market index for the same period.
GROWTH OF $10,000
| AVERAGE ANNUAL TOTAL RETURNS | 6 MONTH | 1 YEAR | 5 YEARS | 10 YEARS |
| WORLDWIDE HIGH DIVIDEND YIELD VALUE FUND (TBHDX) | 5.38% | 20.13% | 4.64% | 4.26% |
| MSCI World Index (in U.S.$) | 9.16% | 32.43% | 13.04% | 10.07% |
| MSCI World High Dividend Yield Index (in U.S.$) | 8.59% | 22.60% | 8.12% | 6.80% |
The preceding performance data represents past performance and is not a guarantee of future results. Total return and principal value of an investment will fluctuate so that an investor’s shares, when redeemed, may be worth more or less than their original cost. The graph and table do not reflect the deduction of taxes that a shareholder would pay on Fund distributions or the redemption of Fund shares. Current performance may be lower or higher than the performance data shown. Results are annualized for all periods greater than one year. Please visit www.tweedyfunds.com to obtain performance data that is current to the most recent month end.
| Fund net assets | $68,496,412 |
| Total number of portfolio holdings | 59 |
| Total advisory fee paid | $374,111 |
| Portfolio turnover rate as of the end of the reporting period | 3% |
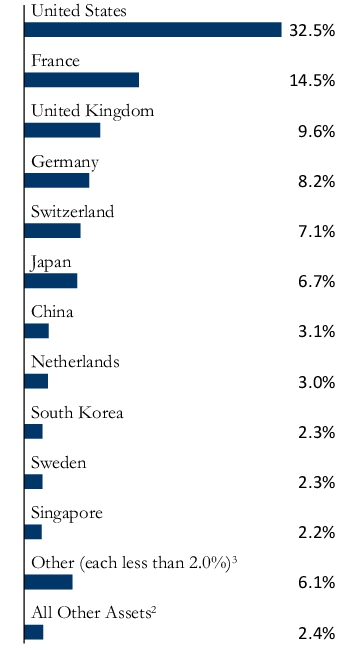
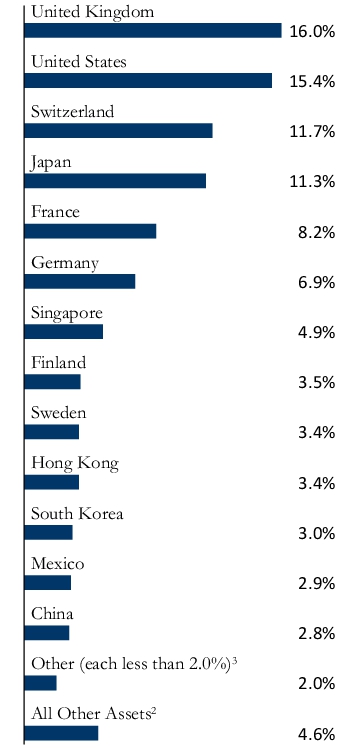
What Did the Fund Invest In?
(as of September 30, 2024)
| Nestlé SA | 4.2% |
| Kemira Oyj | 3.5% |
| BAE Systems plc | 3.5% |
| Diageo plc | 3.4% |
| Roche Holding AG | 3.1% |
| Johnson & Johnson | 3.0% |
| Safran SA | 3.0% |
| Fresenius SE & Co., KGaA | 2.8% |
| Novartis AG | 2.7% |
| FMC Corp. | 2.6% |
1 Excludes short-term investments.
2 Includes cash and money market funds.
3 Includes Belgium and Netherlands.
Material Fund Changes
There have been no material changes to the Fund since April 1, 2024.
Where Can I Find More Information?
You can find additional information about the Fund such as the prospectus, financial information, fund holdings and proxy voting information at www.tweedyfunds.com. You can also request this information by calling 1-800-432-4789.
Important Notice to Shareholders
In order to reduce expenses, we will deliver a single copy of prospectuses, proxies, financial reports and other communication to shareholders with the same residential address, provided they have the same last name or we reasonably believe them to be members of the same family. Unless we are notified otherwise, we will continue to send recipients only one copy of these materials for as long as they remain a shareholder of the Fund. If you would like to receive individual mailings, please call 1-800-432-4789 and we will begin sending you separate copies of these materials within 30 days after receiving your request. For additional information, please visit www.tweedyfunds.com.
| | (b) | The registrant has not yet relied upon Rule 30e-3 of the Act. |
Item 2. Code of Ethics.
Not applicable.
Item 3. Audit Committee Financial Expert.
Not applicable.
Item 4. Principal Accountant Fees and Services.
Not applicable.
Item 5. Audit Committee of Listed Registrants.
Not applicable.
Item 6. Investments.
| | (a) | Schedule of Investments in securities of unaffiliated issuers as of the close of the reporting period as set forth in § 210.1212 of Regulation S-X [17 CFR 210.12-12] is included as part of the report to shareholders filed under Item 7 of this Form. |
Item 7. Financial Statements and Financial Highlights for Open-End Management Investment Companies.
The semi-annual Financial Statements and Financial Highlights are attached herewith.
Tweedy, Browne Fund INC.
INVESTMENT TEAM

Tweedy, Browne Fund INC.
Tweedy, Browne International Value Fund
Portfolio of Investments
September 30, 2024 (Unaudited)
| | | | | | | | |
Shares | | | | | Value* | |
| |
| | COMMON STOCKS—95.8% | | | | |
| | |
| | | | Belgium—0.3% | | | | |
| | 926,488 | | | Fagron NV | | | $19,232,529 | |
| | | | | | | | |
| | |
| | | | Canada—3.7% | | | | |
| | 251,390 | | | Lassonde Industries, Inc., Class A(a) | | | 32,983,365 | |
| | 1,124,700 | | | National Bank of Canada | | | 106,346,777 | |
| | 1,926,024 | | | Winpak, Ltd. | | | 67,734,113 | |
| | | | | | | | |
| | | | | | | 207,064,255 | |
| | | | | | | | |
| | |
| | | | China—3.6% | | | | |
| | 815,426 | | | Baidu, Inc., Class A(b) | | | 11,085,804 | |
| | 8,383,895 | | | Haitian International Holdings, Ltd. | | | 26,983,891 | |
| | 6,463,000 | | | Shanghai Mechanical and Electrical Industry Co., Ltd., Class B | | | 6,579,334 | |
| | 1,444,150 | | | Tencent Holdings, Ltd. | | | 82,660,971 | |
| | 15,974,780 | | | Uni-President China Holdings, Ltd. | | | 14,992,745 | |
| | 2,768,830 | | | Wuliangye Yibin Co., Ltd., Class A | | | 64,132,861 | |
| | | | | | | | |
| | | | | | | 206,435,606 | |
| | | | | | | | |
| | |
| | | | Czech Republic—0.0%(c) | | | | |
| | 2,800 | | | Philip Morris CR a.s. | | | 1,896,079 | |
| | | | | | | | |
| | |
| | | | Finland—1.3% | | | | |
| | 2,919,753 | | | Kemira Oyj | | | 73,057,595 | |
| | | | | | | | |
| | |
| | | | France—12.3% | | | | |
| | 376,664 | | | Alten SA | | | 42,079,624 | |
| | 2,392,742 | | | Rubis SCA | | | 65,478,691 | |
| | 928,700 | | | Safran SA | | | 218,800,007 | |
| | 149,932 | | | Sopra Steria Group | | | 31,525,275 | |
| | 1,527,083 | | | Tarkett SA(b) | | | 16,054,515 | |
| | 1,011,618 | | | Teleperformance SE | | | 104,998,513 | |
| | 3,298,850 | | | TotalEnergies SE | | | 215,378,370 | |
| | 268,901 | | | Ubisoft Entertainment SA(b) | | | 3,031,080 | |
| | | | | | | | |
| | | | | | | 697,346,075 | |
| | | | | | | | |
| | |
| | | | Germany—6.9% | | | | |
| | 761,991 | | | Brenntag SE | | | 56,961,135 | |
| | 2,644,654 | | | DHL Group | | | 118,151,191 | |
| | 2,540,809 | | | Fresenius SE & Co., KGaA(b) | | | 97,064,980 | |
| | 369,659 | | | Krones AG | | | 53,219,973 | |
| | 42,354 | | | KSB SE & Co., KGaA | | | 31,197,660 | |
| | 65,633 | | | Rheinmetall AG | | | 35,628,659 | |
| | | | | | | | |
| | | | | | | 392,223,598 | |
| | | | | | | | |
| | |
| | | | Hong Kong—0.5% | | | | |
| | 1,550,676 | | | Great Eagle Holdings, Ltd. | | | 2,423,586 | |
| | 12,583,508 | | | Hang Lung Group, Ltd. | | | 17,010,214 | |
| | 2,791,715 | | | Johnson Electric Holdings, Ltd. | | | 4,140,400 | |
| | 7,780,578 | | | TAI Cheung Holdings, Ltd. | | | 3,125,253 | |
| | | | | | | | |
| | | | | | | 26,699,453 | |
| | | | | | | | |
| | |
| | | | Italy—3.1% | | | | |
| | 4,337,413 | | | SOL SpA | | | 172,815,481 | |
| | | | | | | | |
| | |
| | | | Japan—5.5% | | | | |
| | 891,970 | | | ADEKA Corp. | | | 18,186,735 | |
| | 750,785 | | | Fuso Chemical Co., Ltd. | | | 20,890,131 | |
| | 481,855 | | | Hosokawa Micron Corp. | | | 13,811,560 | |
| | | | | | | | |
Shares | | | | | Value* | |
| | |
| | | | Japan (continued) | | | | |
| | 508,890 | | | Kanadevia Corp. | | | $3,525,657 | |
| | 1,958,145 | | | Koito Manufacturing Co., Ltd. | | | 27,036,748 | |
| | 3,363,180 | | | Kuraray Co., Ltd. | | | 49,834,032 | |
| | 1,567,485 | | | Mitsubishi Gas Chemical Co., Inc. | | | 30,349,201 | |
| | 221,220 | | | Nifco, Inc. | | | 5,623,294 | |
| | 940 | | | Nihon Kohden Corp. | | | 13,978 | |
| | 164,400 | | | Nippon Kanzai Holdings Co., Ltd. | | | 3,080,201 | |
| | 820,800 | | | Niterra Co., Ltd. | | | 22,924,329 | |
| | 104,825 | | | Okamoto Industries, Inc. | | | 3,832,737 | |
| | 270,565 | | | Shoei Co., Ltd. | | | 4,223,795 | |
| | 1,162,405 | | | Star Micronics Co., Ltd. | | | 15,627,131 | |
| | 1,652,755 | | | Subaru Corp. | | | 28,678,257 | |
| | 1,284,760 | | | Sumitomo Heavy Industries, Ltd. | | | 30,897,472 | |
| | 328,885 | | | Taikisha, Ltd. | | | 11,254,838 | |
| | 588,565 | | | Transcosmos, Inc. | | | 14,586,570 | |
| | 164,305 | | | YAMABIKO Corp. | | | 2,918,757 | |
| | | | Miscellaneous Security(d) | | | 3,933,630 | |
| | | | | | | | |
| | | | | | | 311,229,053 | |
| | | | | | | | |
| | |
| | | | Mexico—1.9% | | | | |
| | 1,013,053 | | | Coca-Cola FEMSA SAB de CV, Sponsored ADR | | | 89,878,062 | |
| | 9,067,593 | | | Megacable Holdings SAB de CV | | | 18,956,737 | |
| | | | | | | | |
| | | | | | | 108,834,799 | |
| | | | | | | | |
| | |
| | | | Netherlands—3.8% | | | | |
| | 1,285,260 | | | Aalberts NV | | | 52,270,062 | |
| | 2,160,839 | | | Heineken Holding NV | | | 163,506,776 | |
| | | | | | | | |
| | | | | | | 215,776,838 | |
| | | | | | | | |
| | |
| | | | Philippines—0.1% | | | | |
| | 22,609,020 | | | Alliance Global Group, Inc. | | | 3,784,477 | |
| | | | | | | | |
| | |
| | | | Singapore—5.6% | | | | |
| | 4,511,761 | | | DBS Group Holdings, Ltd. | | | 133,909,911 | |
| | 7,345,990 | | | United Overseas Bank, Ltd. | | | 184,337,362 | |
| | | | | | | | |
| | | | | | | 318,247,273 | |
| | | | | | | | |
| | |
| | | | South Korea—2.7% | | | | |
| | 132,322 | | | Binggrae Co., Ltd. | | | 6,516,431 | |
| | 219,167 | | | DB Insurance Co., Ltd. | | | 18,821,178 | |
| | 167,062 | | | Dentium Co., Ltd. | | | 10,424,607 | |
| | 998,776 | | | LG Corp. | | | 60,413,842 | |
| | 991,707 | | | LX Holdings Corp. | | | 5,414,688 | |
| | 1,086,715 | | | Samsung Electronics Co., Ltd. | | | 51,107,267 | |
| | | | | | | | |
| | | | | | | 152,698,013 | |
| | | | | | | | |
| | |
| | | | Sweden—3.6% | | | | |
| | 344,776 | | | Autoliv, Inc. | | | 32,191,735 | |
| | 4,350,000 | | | Husqvarna AB, Class B | | | 30,468,796 | |
| | 2,755,869 | | | SKF AB, Class B | | | 54,918,369 | |
| | 2,266,594 | | | Trelleborg AB, Class B | | | 87,250,654 | |
| | | | | | | | |
| | | | | | | 204,829,554 | |
| | | | | | | | |
| | |
| | | | Switzerland—13.3% | | | | |
| | 142,761 | | | Coltene Holding AG, Registered | | | 8,631,155 | |
| | 1,925,964 | | | Nestlé SA, Registered | | | 193,977,715 | |
| | 1,284,801 | | | Novartis AG, Registered | | | 147,968,013 | |
| | | | |
| | |
| | SEE NOTES TO FINANCIAL STATEMENTS | | |
1
Tweedy, Browne International Value Fund
Portfolio of Investments
September 30, 2024 (Unaudited)
| | | | | | | | |
Shares | | | | | Value* | |
| | |
| | | | Switzerland (continued) | | | | |
| | 63,203 | | | Phoenix Mecano AG, Registered(a)(b) | | | $33,941,034 | |
| | 579,564 | | | Roche Holding AG | | | 185,916,683 | |
| | 400,000 | | | TX Group AG | | | 67,144,805 | |
| | 187,816 | | | Zurich Insurance Group AG | | | 113,506,724 | |
| | | | | | | | |
| | | | | | | 751,086,129 | |
| | | | | | | | |
| | |
| | | | United Kingdom—13.3% | | | | |
| | 4,003,983 | | | Babcock International Group plc | | | 25,382,129 | |
| | 12,603,785 | | | BAE Systems plc | | | 209,212,827 | |
| | 10,810,735 | | | CNH Industrial NV | | | 119,999,158 | |
| | 1,043,507 | | | Computacenter plc | | | 34,628,779 | |
| | 1,964,232 | | | CVS Group plc | | | 29,825,060 | |
| | 4,396,459 | | | Diageo plc | | | 153,503,863 | |
| | 2,704,933 | | | Grafton Group plc | | | 37,762,950 | |
| | 1,968,375 | | | Howden Joinery Group plc | | | 23,947,338 | |
| | 5,273,360 | | | Inchcape plc | | | 56,339,802 | |
| | 15,698,026 | | | Johnson Service Group plc | | | 32,806,100 | |
| | 2,567,623 | | | SThree plc | | | 12,949,745 | |
| | 16,292,379 | | | Vertu Motors plc | | | 13,155,977 | |
| | | | | | | | |
| | | | | | | 749,513,728 | |
| | | | | | | | |
| | |
| | | | United States—14.3% | | | | |
| | 1,281,722 | | | Alphabet, Inc., Class A | | | 212,573,594 | |
| | 339 | | | Berkshire Hathaway, Inc., Class A(b) | | | 234,310,020 | |
| | 1,950,303 | | | FMC Corp. | | | 128,602,980 | |
| | 2,589,316 | | | Ionis Pharmaceuticals, Inc.(b) | | | 103,727,999 | |
| | 750,927 | | | Johnson & Johnson | | | 121,695,229 | |
| | 293,905 | | | Kenvue, Inc. | | | 6,798,023 | |
| | | | | | | | |
| | | | | | | 807,707,845 | |
| | | | | | | | |
| |
| TOTAL COMMON STOCKS
(Cost $2,887,243,276) | | | 5,420,478,380 | |
| | | | | | | | |
| |
| | PREFERRED STOCKS—2.2% | | | | |
| | |
| | | | Chile—0.5% | | | | |
| | 11,044,000 | | | Embotelladora Andina SA, Class A | | | 26,567,591 | |
| | | | | | | | |
| | |
| | | | Croatia—0.1% | | | | |
| | 95,874 | | | Adris Grupa DD | | | 6,355,811 | |
| | | | | | | | |
| | |
| | | | Germany—1.6% | | | | |
| | 1,155,260 | | | Dr. Ing. h.c. F. Porsche AG | | | 92,186,946 | |
| | | | | | | | |
| |
| TOTAL PREFERRED STOCKS
(Cost $123,584,479) | | | 125,110,348 | |
| | | | | | | | |
| | | | | | | | |
Shares | | | | | Value* | |
| |
| | REGISTERED INVESTMENT COMPANY—1.2% | | | | |
| | 66,011,751 | | | Dreyfus Treasury Securities Cash Management– Institutional Shares 4.88%(e)
(Cost $66,011,751) | | | $66,011,751 | |
| | | | | | | | |
| | |
Face Value | | | | | | |
|
| | U.S. TREASURY BILLS—1.3% | |
| | $50,000,000 | | | 5.322%(f) due 10/10/2024 | | | 49,941,844 | |
| | 25,000,000 | | | 5.322%(f) due 11/14/2024 | | | 24,857,649 | |
| | | | | | | | |
| |
| TOTAL U.S. TREASURY BILLS
(Cost $74,778,633) | | | 74,799,493 | |
| | | | | | | | |
| | | | | | | | |
| | |
INVESTMENTS IN SECURITIES
(Cost $3,151,618,139) | | | 100.5 | % | | | 5,686,399,972 | |
| | |
UNREALIZED DEPRECIATION ON FORWARD CONTRACTS (Net) | | | (1.1 | ) | | | (62,214,647 | ) |
| | |
OTHER ASSETS
AND LIABILITIES (Net) | | | 0.6 | | | | 32,158,296 | |
| | | | | | | | |
| | |
NET ASSETS | | | 100.0 | % | | | $5,656,343,621 | |
| | | | | | | | |
| | | | | | | | |
* See Note 2 in Notes to Financial Statements. | | | | | | | | |
(a) “Affiliated company” as defined by the Investment Company Act of 1940. See Note 4. | | | | | | | | |
(b) Non-income producing security. | | | | | | | | |
(c) Amount represents less than 0.1% of net assets. | | | | | | | | |
(d) Represents one or more issuers where disclosure may be disadvantageous to the Fund’s accumulation or disposition program. The aggregate amount of $3,933,630 represents 0.1% of the net assets of the Fund. | | | | | | | | |
(e) Rate disclosed is the 7-day yield at September 30, 2024. | | | | | | | | |
(f) Rate represents annualized yield at date of purchase. | | | | | | | | |
| | | | | | |
|
| Abbreviations: |
| ADR | | | — | | | American Depositary Receipt |
| | | | |
| | |
| | SEE NOTES TO FINANCIAL STATEMENTS | | |
2
Tweedy, Browne International Value Fund
Schedule of Forward Exchange Contracts
September 30, 2024 (Unaudited)
| | | | | | | | | | | | | | | | | | | | | | | | | | | | | | |
Contracts | | | | Counter-
party | | Settlement
Date | | Contract Value on
Origination Date | | Value 09/30/24* | | Unrealized
Appreciation
(Depreciation) |
| | | FORWARD EXCHANGE CONTRACTS TO BUY(a) | | | | | | | | | | | | | | | | | | | | | | | | | |
| | | 420,000,000 | | | Chinese Yuan | | | | JPM | | | | | 2/28/25 | | | | | $59,857,045 | | | | | $60,671,645 | | | | | $814,600 | |
| | | 75,000,000 | | | Chinese Yuan | | | | JPM | | | | | 4/23/25 | | | | | 10,735,906 | | | | | 10,865,657 | | | | | 129,751 | |
| | | 195,000,000 | | | Swedish Krona | | | | NTC | | | | | 2/28/25 | | | | | 19,317,450 | | | | | 19,377,991 | | | | | 60,541 | |
| | | | | | | | | | | | | | | | | | | | | |
| | | TOTAL | | | | | | | | | | | | | | | | | $89,910,401 | | | | | $90,915,293 | | | | | $1,004,892 | |
| | | | | | | | | | | | | | | | | | | | | |
| | | FORWARD EXCHANGE CONTRACTS TO SELL(a) | | | | | | | | | | | | | | | | | | | | | | | | | | |
| | | 22,000,000 | | | Canadian Dollar | | | | NTC | | | | | 12/12/24 | | | | | $(16,299,194 | ) | | | | $(16,314,632 | ) | | | | $(15,438) | |
| | | 50,000,000 | | | Canadian Dollar | | | | SSB | | | | | 1/2/25 | | | | | (37,830,640 | ) | | | | (37,100,588 | ) | | | | 730,052 | |
| | | 44,000,000 | | | Canadian Dollar | | | | NTC | | | | | 4/3/25 | | | | | (32,547,508 | ) | | | | (32,709,720 | ) | | | | (162,212) | |
| | | 55,000,000 | | | Canadian Dollar | | | | NTC | | | | | 9/11/25 | | | | | (40,977,530 | ) | | | | (41,019,870 | ) | | | | (42,340) | |
| | | 7,500,000,000 | | | Chilean Peso | | | | JPM | | | | | 1/2/25 | | | | | (8,369,602 | ) | | | | (8,345,464 | ) | | | | 24,138 | |
| | | 12,850,000,000 | | | Chilean Peso | | | | SSB | | | | | 4/3/25 | | | | | (13,041,713 | ) | | | | (14,282,408 | ) | | | | (1,240,695) | |
| | | 420,000,000 | | | Chinese Yuan | | | | JPM | | | | | 2/28/25 | | | | | (59,816,279 | ) | | | | (60,671,645 | ) | | | | (855,366) | |
| | | 250,000,000 | | | Chinese Yuan | | | | JPM | | | | | 4/23/25 | | | | | (35,193,918 | ) | | | | (36,218,856 | ) | | | | (1,024,938) | |
| | | 300,000,000 | | | Chinese Yuan | | | | JPM | | | | | 4/30/25 | | | | | (42,216,656 | ) | | | | (43,476,050 | ) | | | | (1,259,394) | |
| | | 250,000,000 | | | Chinese Yuan | | | | SSB | | | | | 5/9/25 | | | | | (35,270,880 | ) | | | | (36,244,433 | ) | | | | (973,553) | |
| | | 280,000,000 | | | Chinese Yuan | | | | JPM | | | | | 6/6/25 | | | | | (39,537,971 | ) | | | | (40,643,994 | ) | | | | (1,106,023) | |
| | | 210,000,000 | | | European Union Euro | | | | SSB | | | | | 12/6/24 | | | | | (233,964,150 | ) | | | | (235,000,688 | ) | | | | (1,036,538) | |
| | | 100,000,000 | | | European Union Euro | | | | NTC | | | | | 12/12/24 | | | | | (109,953,500 | ) | | | | (111,933,294 | ) | | | | (1,979,794) | |
| | | 65,000,000 | | | European Union Euro | | | | SSB | | | | | 12/12/24 | | | | | (71,458,725 | ) | | | | (72,756,641 | ) | | | | (1,297,916) | |
| | | 100,000,000 | | | European Union Euro | | | | NTC | | | | | 4/15/25 | | | | | (110,133,500 | ) | | | | (112,437,151 | ) | | | | (2,303,651) | |
| | | 100,000,000 | | | European Union Euro | | | | SSB | | | | | 4/23/25 | | | | | (108,357,000 | ) | | | | (112,470,379 | ) | | | | (4,113,379) | |
| | | 110,000,000 | | | European Union Euro | | | | BNY | | | | | 5/23/25 | | | | | (121,689,040 | ) | | | | (123,854,678 | ) | | | | (2,165,638) | |
| | | 75,000,000 | | | European Union Euro | | | | NTC | | | | | 6/6/25 | | | | | (82,540,125 | ) | | | | (84,490,116 | ) | | | | (1,949,991) | |
| | | 75,000,000 | | | European Union Euro | | | | BNY | | | | | 6/10/25 | | | | | (82,835,250 | ) | | | | (84,502,623 | ) | | | | (1,667,373) | |
| | | 52,000,000 | | | Great Britain Pound Sterling | | | | JPM | | | | | 10/7/24 | | | | | (63,515,400 | ) | | | | (69,749,848 | ) | | | | (6,234,448) | |
| | | 50,000,000 | | | Great Britain Pound Sterling | | | | JPM | | | | | 7/28/25 | | | | | (64,911,500 | ) | | | | (66,856,486 | ) | | | | (1,944,986) | |
| | | 75,000,000 | | | Great Britain Pound Sterling | | | | NTC | | | | | 8/14/25 | | | | | (95,168,250 | ) | | | | (100,260,174 | ) | | | | (5,091,924) | |
| | | 94,000,000 | | | Great Britain Pound Sterling | | | | NTC | | | | | 8/26/25 | | | | | (120,884,000 | ) | | | | (125,637,704 | ) | | | | (4,753,704) | |
| | | 75,000,000 | | | Great Britain Pound Sterling | | | | NTC | | | | | 9/26/25 | | | | | (98,813,250 | ) | | | | (100,197,008 | ) | | | | (1,383,758) | |
| | | 49,000,000 | | | Hong Kong Dollar | | | | SSB | | | | | 5/9/25 | | | | | (6,309,501 | ) | | | | (6,325,342 | ) | | | | (15,841) | |
| | | 315,000,000 | | | Hong Kong Dollar | | | | NTC | | | | | 5/14/25 | | | | | (40,582,324 | ) | | | | (40,665,079 | ) | | | | (82,755) | |
| | | 3,500,000,000 | | | Japanese Yen | | | | SSB | | | | | 12/16/24 | | | | | (25,733,402 | ) | | | | (24,726,257 | ) | | | | 1,007,145 | |
| | | 5,800,000,000 | | | Japanese Yen | | | | SSB | | | | | 2/13/25 | | | | | (41,272,708 | ) | | | | (41,252,574 | ) | | | | 20,134 | |
| | | 2,700,000,000 | | | Japanese Yen | | | | SSB | | | | | 6/30/25 | | | | | (17,918,376 | ) | | | | (19,449,719 | ) | | | | (1,531,343) | |
| | | 6,400,000,000 | | | Japanese Yen | | | | JPM | | | | | 8/21/25 | | | | | (45,435,829 | ) | | | | (46,316,027 | ) | | | | (880,198) | |
| | | 2,200,000,000 | | | Japanese Yen | | | | JPM | | | | | 8/29/25 | | | | | (15,817,462 | ) | | | | (15,932,458 | ) | | | | (114,996) | |
| | | 6,100,000,000 | | | Japanese Yen | | | | JPM | | | | | 9/11/25 | | | | | (43,650,936 | ) | | | | (44,227,479 | ) | | | | (576,543) | |
| | | 3,800,000,000 | | | Japanese Yen | | | | BNY | | | | | 10/2/25 | | | | | (27,462,600 | ) | | | | (27,602,541 | ) | | | | (139,941) | |
| | | 290,000,000 | | | Mexican Peso | | | | BNY | | | | | 4/15/25 | | | | | (16,624,151 | ) | | | | (14,353,893 | ) | | | | 2,270,258 | |
| | | 265,000,000 | | | Mexican Peso | | | | NTC | | | | | 4/23/25 | | | | | (14,975,136 | ) | | | | (13,101,072 | ) | | | | 1,874,064 | |
| | | 290,000,000 | | | Mexican Peso | | | | BNY | | | | | 5/23/25 | | | | | (16,405,499 | ) | | | | (14,274,106 | ) | | | | 2,131,393 | |
| | | 100,000,000 | | | Mexican Peso | | | | JPM | | | | | 6/9/25 | | | | | (5,373,672 | ) | | | | (4,909,896 | ) | | | | 463,776 | |
| | | 73,000,000 | | | Mexican Peso | | | | NTC | | | | | 9/11/25 | | | | | (3,479,836 | ) | | | | (3,535,728 | ) | | | | (55,892) | |
| | | 76,000,000 | | | Philippine Peso | | | | JPM | | | | | 11/20/24 | | | | | (1,361,275 | ) | | | | (1,355,977 | ) | | | | 5,298 | |
| | | 155,000,000 | | | Philippine Peso | | | | SSB | | | | | 4/3/25 | | | | | (2,743,363 | ) | | | | (2,762,859 | ) | | | | (19,496) | |
| | | 60,000,000 | | | Singapore Dollar | | | | JPM | | | | | 1/2/25 | | | | | (45,984,059 | ) | | | | (47,019,039 | ) | | | | (1,034,980) | |
| | | 40,000,000 | | | Singapore Dollar | | | | SSB | | | | | 1/24/25 | | | | | (30,130,124 | ) | | | | (31,375,554 | ) | | | | (1,245,430) | |
| | | 70,000,000 | | | Singapore Dollar | | | | NTC | | | | | 4/23/25 | | | | | (52,262,207 | ) | | | | (55,102,457 | ) | | | | (2,840,250) | |
| | | 40,000,000 | | | Singapore Dollar | | | | NTC | | | | | 5/14/25 | | | | | (30,122,750 | ) | | | | (31,507,821 | ) | | | | (1,385,071) | |
| | | 75,000,000 | | | Singapore Dollar | | | | SSB | | | | | 7/3/25 | | | | | (56,114,539 | ) | | | | (59,169,794 | ) | | | | (3,055,255) | |
| | | 67,000,000 | | | Singapore Dollar | | | | JPM | | | | | 7/18/25 | | | | | (50,429,023 | ) | | | | (52,883,225 | ) | | | | (2,454,202) | |
| | | 32,335,000,000 | | | South Korean Won | | | | JPM | | | | | 12/9/24 | | | | | (25,000,000 | ) | | | | (24,827,734 | ) | | | | 172,266 | |
| | | 57,000,000,000 | | | South Korean Won | | | | SSB | | | | | 4/1/25 | | | | | (43,219,471 | ) | | | | (43,992,963 | ) | | | | (773,492) | |
| | | 55,000,000,000 | | | South Korean Won | | | | JPM | | | | | 5/23/25 | | | | | (41,548,631 | ) | | | | (42,514,618 | ) | | | | (965,987) | |
| | | 440,000,000 | | | Swedish Krona | | | | NTC | | | | | 2/28/25 | | | | | (43,027,156 | ) | | | | (43,724,698 | ) | | | | (697,542) | |
| | | 355,000,000 | | | Swedish Krona | | | | NTC | | | | | 4/15/25 | | | | | (33,881,967 | ) | | | | (35,352,014 | ) | | | | (1,470,047) | |
| | | 500,000,000 | | | Swedish Krona | | | | SSB | | | | | 5/9/25 | | | | | (46,357,806 | ) | | | | (49,845,435 | ) | | | | (3,487,629) | |
| | | | |
| | |
| | SEE NOTES TO FINANCIAL STATEMENTS | | |
3
Tweedy, Browne International Value Fund
Schedule of Forward Exchange Contracts
September 30, 2024 (Unaudited)
| | | | | | | | | | | | | | | | | | | | | | | | |
Contracts | | | | | Counter-
party | | | Settlement
Date | | | Contract Value on
Origination Date | | | Value 09/30/24* | | | Unrealized
Appreciation
(Depreciation) | |
| FORWARD EXCHANGE CONTRACTS TO SELL(a) (continued) | | | | | | | | | | | | | | | | | | | | |
| | 120,000,000 | | | Swiss Franc | | | SSB | | | | 12/17/24 | | | | $(141,626,342 | ) | | | $(143,490,042 | ) | | | $(1,863,700) | |
| | 85,000,000 | | | Swiss Franc | | | JPM | | | | 1/3/25 | | | | (102,955,426 | ) | | | (101,829,863 | ) | | | 1,125,563 | |
| | 26,000,000 | | | Swiss Franc | | | JPM | | | | 1/31/25 | | | | (31,185,530 | ) | | | (31,229,785 | ) | | | (44,255) | |
| | 50,000,000 | | | Swiss Franc | | | NTC | | | | 4/23/25 | | | | (57,039,209 | ) | | | (60,507,359 | ) | | | (3,468,150) | |
| | 36,000,000 | | | Swiss Franc | | | NTC | | | | 5/23/25 | | | | (41,436,941 | ) | | | (43,674,513 | ) | | | (2,237,572) | |
| | | | | | | | | | | | | | | | |
| TOTAL | | | | | | | | | | | | | | $(2,922,792,832 | ) | | | $(2,986,012,371 | ) | | | $(63,219,539) | |
| | | | | | | | | | | | | | | | |
| | Unrealized Depreciation on Forward Contracts (Net) | | | | | | | | | | | | | | | | | | | $(62,214,647) | |
| | | | | | | | | | | | | | | | | | | | | | | | |
| * | See Note 2 in Notes to Financial Statements. |
| (a) | Primary risk exposure being hedged against is currency risk. |
Counterparty Abbreviations:
BNY — The Bank of New York Mellon
JPM — JPMorgan Chase Bank NA
NTC — Northern Trust Company
SSB — State Street Bank and Trust Company
| | | | |
| | |
| | SEE NOTES TO FINANCIAL STATEMENTS | | |
4
Tweedy, Browne International Value Fund II - Currency Unhedged
Portfolio of Investments
September 30, 2024 (Unaudited)
| | | | | | | | |
Shares | | | | | Value* | |
| |
| | COMMON STOCKS—95.0% | | | | |
| | |
| | | | Belgium—0.6% | | | | |
| | 79,510 | | | Fagron NV | | | $1,650,511 | |
| | | | | | | | |
| | |
| | | | Canada—3.7% | | | | |
| | 1,750 | | | E-L Financial Corp., Ltd. | | | 1,638,662 | |
| | 21,490 | | | Lassonde Industries, Inc., Class A | | | 2,819,573 | |
| | 154,890 | | | Winpak, Ltd. | | | 5,447,147 | |
| | | | | | | | |
| | | | | | | 9,905,382 | |
| | | | | | | | |
| | |
| | | | China—3.2% | | | | |
| | 868,680 | | | Haitian International Holdings, Ltd. | | | 2,795,880 | |
| | 357,122 | | | Shanghai Mechanical and Electrical Industry Co., Ltd., Class B | | | 363,550 | |
| | 2,729,475 | | | Uni-President China Holdings, Ltd. | | | 2,561,683 | |
| | 131,955 | | | Wuliangye Yibin Co., Ltd., Class A | | | 3,056,400 | |
| | | | | | | | |
| | | | | | | 8,777,513 | |
| | | | | | | | |
| | |
| | | | Finland—2.7% | | | | |
| | 287,855 | | | Kemira Oyj | | | 7,202,662 | |
| | | | | | | | |
| | |
| | | | France—11.5% | | | | |
| | 24,440 | | | Alten SA | | | 2,730,354 | |
| | 123,575 | | | Rubis SCA | | | 3,381,697 | |
| | 34,834 | | | Safran SA | | | 8,206,826 | |
| | 7,040 | | | Sopra Steria Group | | | 1,480,257 | |
| | 475,398 | | | Tarkett SA(a) | | | 4,997,950 | |
| | 58,650 | | | Teleperformance SE | | | 6,087,439 | |
| | 68,000 | | | TotalEnergies SE | | | 4,439,647 | |
| | | | | | | | |
| | | | | | | 31,324,170 | |
| | | | | | | | |
| | |
| | | | Germany—6.9% | | | | |
| | 37,035 | | | Brenntag SE | | | 2,768,479 | |
| | 169,154 | | | DHL Group | | | 7,557,036 | |
| | 89,400 | | | Fresenius SE & Co., KGaA(a) | | | 3,415,294 | |
| | 8,988 | | | Rheinmetall AG | | | 4,879,106 | |
| | | | | | | | |
| | | | | | | 18,619,915 | |
| | | | | | | | |
| | |
| | | | Hong Kong—0.8% | | | | |
| | 1,663,100 | | | Chow Sang Sang Holdings International, Ltd. | | | 1,535,169 | |
| | 405,955 | | | Hang Lung Group, Ltd. | | | 548,765 | |
| | 45,710 | | | Luk Fook Holdings International, Ltd. | | | 98,511 | |
| | | | | | | | |
| | | | | | | 2,182,445 | |
| | | | | | | | |
| | |
| | | | Italy—0.8% | | | | |
| | 55,200 | | | SOL SpA | | | 2,199,333 | |
| | | | | | | | |
| | |
| | | | Japan—9.3% | | | | |
| | 103,690 | | | ADEKA Corp. | | | 2,114,177 | |
| | 12,000 | | | Fukuda Denshi Co., Ltd. | | | 645,973 | |
| | 43,320 | | | Fuso Chemical Co., Ltd. | | | 1,205,352 | |
| | 111,630 | | | Inaba Denki Sangyo Co., Ltd. | | | 2,988,975 | |
| | 20,600 | | | Kamigumi Co., Ltd. | | | 469,347 | |
| | 103,740 | | | Kanadevia Corp. | | | 718,724 | |
| | 89,190 | | | Koito Manufacturing Co., Ltd. | | | 1,231,476 | |
| | 288,625 | | | Kuraray Co., Ltd. | | | 4,276,711 | |
| | 143,035 | | | Mitsubishi Gas Chemical Co., Inc. | | | 2,769,403 | |
| | 115,710 | | | Nihon Kohden Corp. | | | 1,720,604 | |
| | 24,910 | | | Okamoto Industries, Inc. | | | 910,789 | |
| | | | | | | | |
Shares | | | | | Value* | |
| | |
| | | | Japan (continued) | | | | |
| | 86,595 | | | Star Micronics Co., Ltd. | | | $1,164,165 | |
| | 77,490 | | | Subaru Corp. | | | 1,344,590 | |
| | 44,060 | | | Taikisha, Ltd. | | | 1,507,786 | |
| | 92,200 | | | Transcosmos, Inc. | | | 2,285,018 | |
| | | | | | | | |
| | | | | | | 25,353,090 | |
| | | | | | | | |
| | |
| | | | Mexico—1.7% | | | | |
| | 23,120 | | | Coca-Cola FEMSA SAB de CV, Sponsored ADR | | | 2,051,207 | |
| | 1,244,322 | | | Megacable Holdings SAB de CV | | | 2,601,383 | |
| | | | | | | | |
| | | | | | | 4,652,590 | |
| | | | | | | | |
| | |
| | | | Netherlands—2.2% | | | | |
| | 70,260 | | | Aalberts NV | | | 2,857,394 | |
| | 41,905 | | | Heineken Holding NV | | | 3,170,876 | |
| | | | | | | | |
| | | | | | | 6,028,270 | |
| | | | | | | | |
| | |
| | | | Philippines—0.7% | | | | |
| | 6,997,100 | | | Alliance Global Group, Inc. | | | 1,171,230 | |
| | 893,400 | | | China Banking Corp. | | | 813,087 | |
| | | | | | | | |
| | | | | | | 1,984,317 | |
| | | | | | | | |
| | |
| | | | Singapore—4.7% | | | | |
| | 216,691 | | | DBS Group Holdings, Ltd. | | | 6,431,430 | |
| | 249,460 | | | United Overseas Bank, Ltd. | | | 6,259,850 | |
| | | | | | | | |
| | | | | | | 12,691,280 | |
| | | | | | | | |
| | |
| | | | South Korea—3.6% | | | | |
| | 15,005 | | | DB Insurance Co., Ltd. | | | 1,288,569 | |
| | 8,035 | | | Dentium Co., Ltd. | | | 501,381 | |
| | 89,851 | | | LG Corp. | | | 5,434,897 | |
| | 51,190 | | | Samsung Electronics Co., Ltd. | | | 2,407,421 | |
| | | | | | | | |
| | | | | | | 9,632,268 | |
| | | | | | | | |
| | |
| | | | Sweden—2.6% | | | | |
| | 16,520 | | | Autoliv, Inc. | | | 1,542,472 | |
| | 66,115 | | | SKF AB, Class B | | | 1,317,526 | |
| | 106,473 | | | Trelleborg AB, Class B | | | 4,098,590 | |
| | | | | | | | |
| | | | | | | 6,958,588 | |
| | | | | | | | |
| | |
| | | | Switzerland—8.0% | | | | |
| | 60,675 | | | Nestlé SA, Registered | | | 6,111,017 | |
| | 57,951 | | | Novartis AG, Registered | | | 6,674,103 | |
| | 27,835 | | | Roche Holding AG | | | 8,929,110 | |
| | | | | | | | |
| | | | | | | 21,714,230 | |
| | | | | | | | |
| | |
| | | | United Kingdom—14.3% | | | | |
| | 242,737 | | | BAE Systems plc | | | 4,029,242 | |
| | 499,182 | | | CNH Industrial NV | | | 5,540,920 | |
| | 82,845 | | | Computacenter plc | | | 2,749,211 | |
| | 179,539 | | | CVS Group plc | | | 2,726,135 | |
| | 161,513 | | | Diageo plc | | | 5,639,281 | |
| | 229,117 | | | Grafton Group plc | | | 3,198,650 | |
| | 243,576 | | | Howden Joinery Group plc | | | 2,963,356 | |
| | 552,500 | | | Inchcape plc | | | 5,902,829 | |
| | 1,504,280 | | | Johnson Service Group plc | | | 3,143,679 | |
| | 127,255 | | | SThree plc | | | 641,808 | |
| | 2,741,248 | | | Vertu Motors plc | | | 2,213,538 | |
| | | | | | | | |
| | | | | | | 38,748,649 | |
| | | | | | | | |
| | | | |
| | |
| | SEE NOTES TO FINANCIAL STATEMENTS | | |
5
Tweedy, Browne International Value Fund II - Currency Unhedged
Portfolio of Investments
September 30, 2024 (Unaudited)
| | | | | | | | |
Shares | | | | | Value* | |
| | |
| | | | United States—17.7% | | | | |
| | 49,976 | | | Alphabet, Inc., Class A | | | $8,288,520 | |
| | 1,945 | | | AutoZone, Inc.(a) | | | 6,126,828 | |
| | 22,551 | | | Berkshire Hathaway, Inc., Class B(a) | | | 10,379,323 | |
| | 116,052 | | | FMC Corp. | | | 7,652,469 | |
| | 175,002 | | | Ionis Pharmaceuticals, Inc.(a) | | | 7,010,580 | |
| | 52,371 | | | Johnson & Johnson | | | 8,487,244 | |
| | | | | | | | |
| | | | | | | 47,944,964 | |
| | | | | | | | |
| |
| TOTAL COMMON STOCKS
(Cost $181,409,686) | | | 257,570,177 | |
| | | | | | | | |
| |
| | PREFERRED STOCKS—2.2% | | | | |
| | | | Chile—0.4% | | | | |
| | 502,909 | | | Embotelladora Andina SA, Class A | | | 1,209,804 | |
| | | | | | | | |
| | |
| | | | Germany—1.8% | | | | |
| | 54,465 | | | Dr. Ing. h.c. F. Porsche AG | | | 4,346,175 | |
| | 648 | | | KSB AG | | | 433,920 | |
| | | | | | | | |
| | | | | | | 4,780,095 | |
| | | | | | | | |
| |
| TOTAL PREFERRED STOCKS
(Cost $6,131,673) | | | 5,989,899 | |
| | | | | | | | |
| | | | | | | | | | | | |
Shares | | | | | | | | Value* | |
|
| | REGISTERED INVESTMENT COMPANY—0.3% | |
| | 888,887 | | | Dreyfus Government Securities Cash Management– Institutional Shares 4.83%(b)
(Cost $888,887) | | | | $888,887 | |
| | | | | | | | | | | | |
| INVESTMENTS IN SECURITIES
(Cost $188,430,246) | | | 97.5 | % | | | 264,448,963 | |
| OTHER ASSETS
AND LIABILITIES (Net) | | | 2.5 | | | | 6,711,913 | |
| | | | | | | | | | | | |
| | NET ASSETS | | | 100.0 | % | | | $271,160,876 | |
| | | | | | | | | | | | |
| * | See Note 2 in Notes to Financial Statements. |
| (a) | Non-income producing security. |
| (b) | Rate disclosed is the 7-day yield at September 30, 2024. |
Abbreviations:
ADR — American Depositary Receipt
| | | | |
| | |
| | SEE NOTES TO FINANCIAL STATEMENTS | | |
6
Tweedy, Browne Value Fund
Portfolio of Investments
September 30, 2024 (Unaudited)
| | | | | | | | |
Shares | | | | | Value* | |
| |
| | COMMON STOCKS—95.8% | | | | |
| | |
| | | | Belgium—1.0% | | | | |
| | 66,181 | | | Fagron NV | | | $1,373,820 | |
| | 38,820 | | | KBC Group NV | | | 3,094,276 | |
| | | | | | | | |
| | | | | | | 4,468,096 | |
| | | | | | | | |
| | |
| | | | Canada—1.9% | | | | |
| | 18,010 | | | Lassonde Industries, Inc., Class A | | | 2,362,984 | |
| | 180,543 | | | Winpak, Ltd. | | | 6,349,308 | |
| | | | | | | | |
| | | | | | | 8,712,292 | |
| | | | | | | | |
| | |
| | | | China—3.1% | | | | |
| | 231,680 | | | Baidu, Inc., Class A(a) | | | 3,149,714 | |
| | 1,006,590 | | | Haitian International Holdings, Ltd. | | | 3,239,749 | |
| | 345,561 | | | Shanghai Mechanical and Electrical Industry Co., Ltd., Class B | | | 351,781 | |
| | 2,349,905 | | | Uni-President China Holdings, Ltd. | | | 2,205,447 | |
| | 215,487 | | | Wuliangye Yibin Co., Ltd., Class A | | | 4,991,205 | |
| | | | | | | | |
| | | | | | | 13,937,896 | |
| | | | | | | | |
| | |
| | | | Finland—1.3% | | | | |
| | 227,906 | | | Kemira Oyj | | | 5,702,628 | |
| | | | | | | | |
| | |
| | | | France—14.5% | | | | |
| | 39,502 | | | Alten SA | | | 4,413,029 | |
| | 299,826 | | | Rubis SCA | | | 8,204,902 | |
| | 72,857 | | | Safran SA | | | 17,164,975 | |
| | 233,983 | | | SCOR SE | | | 5,238,403 | |
| | 12,410 | | | Sopra Steria Group | | | 2,609,374 | |
| | 150,328 | | | Tarkett SA(a) | | | 1,580,427 | |
| | 95,170 | | | Teleperformance SE | | | 9,877,947 | |
| | 236,380 | | | Total Energies SE | | | 15,432,996 | |
| | 72,825 | | | Ubisoft Entertainment SA(a) | | | 820,891 | |
| | | | | | | | |
| | | | | | | 65,342,944 | |
| | | | | | | | |
| | |
| | | | Germany—6.6% | | | | |
| | 54,875 | | | Brenntag SE | | | 4,102,073 | |
| | 190,881 | | | DHL Group | | | 8,527,701 | |
| | 143,555 | | | Fresenius SE & Co., KGaA(a) | | | 5,484,144 | |
| | 150,000 | | | Norma Group SE | | | 2,504,416 | |
| | 16,413 | | | Rheinmetall AG | | | 8,909,743 | |
| | | | | | | | |
| | | | | | | 29,528,077 | |
| | | | | | | | |
| | |
| | | | Hong Kong—0.3% | | | | |
| | 1,046,000 | | | Chow Sang Sang Holdings International, Ltd. | | | 965,538 | |
| | 214,000 | | | Luk Fook Holdings International, Ltd. | | | 461,199 | |
| | | | | | | | |
| | | | | | | 1,426,737 | |
| | | | | | | | |
| | |
| | | | Japan—6.7% | | | | |
| | 63,220 | | | ADEKA Corp. | | | 1,289,018 | |
| | 72,285 | | | Dentsu Group, Inc. | | | 2,227,069 | |
| | 94,205 | | | Fuso Chemical Co., Ltd. | | | 2,621,196 | |
| | 37,260 | | | Hosokawa Micron Corp. | | | 1,067,995 | |
| | 36,595 | | | Inaba Denki Sangyo Co., Ltd. | | | 979,858 | |
| | | | | | | | |
Shares | | | | | Value* | |
| | |
| | | | Japan (continued) | | | | |
| | 352,585 | | | Kanadevia Corp. | | | $2,442,755 | |
| | 160,830 | | | Koito Manufacturing Co., Ltd. | | | 2,220,632 | |
| | 148,315 | | | Mitsubishi Gas Chemical Co., Inc. | | | 2,871,633 | |
| | 96,230 | | | Nihon Kohden Corp. | | | 1,430,937 | |
| | 28,005 | | | Okamoto Industries, Inc. | | | 1,023,952 | |
| | 80,005 | | | Shoei Co., Ltd. | | | 1,248,960 | |
| | 88,200 | | | Star Micronics Co., Ltd. | | | 1,185,742 | |
| | 127,885 | | | Subaru Corp. | | | 2,219,034 | |
| | 89,060 | | | Sumitomo Heavy Industries, Ltd. | | | 2,141,823 | |
| | 38,520 | | | Taikisha, Ltd. | | | 1,318,201 | |
| | 87,100 | | | Transcosmos, Inc. | | | 2,158,624 | |
| | 99,120 | | | YAMABIKO Corp. | | | 1,760,794 | |
| | | | | | | | |
| | | | | | | 30,208,223 | |
| | | | | | | | |
| | |
| | | | Mexico—1.1% | | | | |
| | 54,420 | | | Coca-Cola FEMSA SAB de CV, Sponsored ADR | | | 4,828,142 | |
| | | | | | | | |
| | |
| | | | Netherlands—3.0% | | | | |
| | 94,810 | | | Aalberts NV | | | 3,855,815 | |
| | 128,033 | | | Heineken Holding NV | | | 9,688,025 | |
| | | | | | | | |
| | | | | | | 13,543,840 | |
| | | | | | | | |
| | |
| | | | Philippines—0.2% | | | | |
| | 6,542,900 | | | Alliance Global Group, Inc. | | | 1,095,202 | |
| | | | | | | | |
| | |
| | | | Singapore—2.2% | | | | |
| | 386,517 | | | United Overseas Bank, Ltd. | | | 9,699,104 | |
| | | | | | | | |
| | |
| | | | South Korea—2.3% | | | | |
| | 16,075 | | | DB Insurance Co., Ltd. | | | 1,380,456 | |
| | 11,335 | | | Dentium Co., Ltd. | | | 707,300 | |
| | 70,858 | | | LG Corp. | | | 4,286,050 | |
| | 61,295 | | | LX Holdings Corp. | | | 334,669 | |
| | 81,980 | | | Samsung Electronics Co., Ltd. | | | 3,855,448 | |
| | | | | | | | |
| | | | | | | 10,563,923 | |
| | | | | | | | |
| | |
| | | | Sweden—2.3% | | | | |
| | 26,854 | | | Autoliv, Inc | | | 2,507,358 | |
| | 520,485 | | | Husqvarna AB, Class B | | | 3,645,644 | |
| | 111,490 | | | Trelleborg AB, Class B | | | 4,291,715 | |
| | | | | | | | |
| | | | | | | 10,444,717 | |
| | | | | | | | |
| | |
| | | | Switzerland—7.1% | | | | |
| | 118,780 | | | Nestlé SA, ADR | | | 11,957,583 | |
| | 50,749 | | | Novartis AG, Registered | | | 5,844,663 | |
| | 44,523 | | | Roche Holding AG | | | 14,282,406 | |
| | | | | | | | |
| | | | | | | 32,084,652 | |
| | | | | | | | |
| | |
| | | | United Kingdom—9.6% | | | | |
| | 389,775 | | | BAE Systems plc | | | 6,469,956 | |
| | 650,620 | | | CNH Industrial NV | | | 7,221,882 | |
| | 74,115 | | | Computacenter plc | | | 2,459,506 | |
| | 350,760 | | | CVS Group plc | | | 5,325,969 | |
| | 62,715 | | | Diageo plc, Sponsored ADR | | | 8,801,423 | |
| | 223,196 | | | Grafton Group plc | | | 3,115,988 | |
| | | | |
| | |
| | SEE NOTES TO FINANCIAL STATEMENTS | | |
7
Tweedy, Browne Value Fund
Portfolio of Investments
September 30, 2024 (Unaudited)
| | | | | | | | |
Shares | | | | | Value* | |
| | |
| | | | United Kingdom (continued) | | | | |
| | 252,750 | | | Howden Joinery Group plc | | | $3,074,968 | |
| | 282,425 | | | Inchcape plc | | | 3,017,387 | |
| | 1,269,763 | | | Johnson Service Group plc | | | 2,653,580 | |
| | 205,013 | | | SThree plc | | | 1,033,978 | |
| | | | | | | | |
| | | | | | | 43,174,637 | |
| | | | | | | | |
| | |
| | | | United States—32.6% | | | | |
| | 86,517 | | | Alphabet, Inc., Class A | | | 14,348,844 | |
| | 48,220 | | | Atmus Filtration Technologies, Inc. | | | 1,809,697 | |
| | 1,982 | | | AutoZone, Inc.(a) | | | 6,243,379 | |
| | 76,760 | | | Bank of America Corp. | | | 3,045,837 | |
| | 44 | | | Berkshire Hathaway, Inc., Class A(a) | | | 30,411,920 | |
| | 107,535 | | | Enterprise Products Partners LP | | | 3,130,344 | |
| | 372,000 | | | Envista Holdings Corp.(a) | | | 7,350,720 | |
| | 35,160 | | | FedEx Corp. | | | 9,622,589 | |
| | 167,744 | | | FMC Corp. | | | 11,061,039 | |
| | 190,425 | | | Ionis Pharmaceuticals, Inc.(a) | | | 7,628,426 | |
| | 63,514 | | | Johnson & Johnson | | | 10,293,079 | |
| | 22,968 | | | Kenvue, Inc. | | | 531,250 | |
| | 186,300 | | | Sealed Air Corp. | | | 6,762,690 | |
| | 131,295 | | | Truist Financial Corp. | | | 5,615,487 | |
| | 122,928 | | | U-Haul Holding Co. | | | 8,850,816 | |
| | 15,355 | | | Vertex Pharmaceuticals, Inc.(a) | | | 7,141,303 | |
| | 225,783 | | | Wells Fargo & Co. | | | 12,754,482 | |
| | | | | | | | |
| | | | | | | 146,601,902 | |
| | | | | | | | |
| |
| TOTAL COMMON STOCKS
(Cost $263,198,108) | | | 431,363,012 | |
| | | | | | | | |
| | | | | | | | |
Shares | | | | | Value* | |
| |
| | PREFERRED STOCKS—1.9% | | | | |
| | |
| | | | Chile—0.3% | | | | |
| | 492,000 | | | Embotelladora Andina SA, Class A | | | $1,183,562 | |
| | | | | | | | |
| | |
| | | | Germany—1.6% | | | | |
| | 91,851 | | | Dr. Ing. h.c. F. Porsche AG | | | 7,329,487 | |
| | | | | | | | |
| |
| TOTAL PREFERRED STOCKS
(Cost $8,224,185) | | | 8,513,049 | |
| | | | | | | | |
|
| | REGISTERED INVESTMENT COMPANY—2.1% | |
| | 9,747,173 | | | Dreyfus Government Securities Cash
Management– Institutional Shares
4.83%(b)
(Cost $9,747,173) | | | 9,747,173 | |
| | | | | | | | |
| | |
Face Value | | | | | | |
| |
| | U.S. TREASURY BILL—0.9% | | | | |
| | $4,000,000 | | | 5.288%(c) due 11/29/2024
(Cost $3,966,506) | | | 3,969,325 | |
| | | | | | | | |
| | | | | | | | |
| | |
INVESTMENTS IN SECURITIES
(Cost $285,135,972) | | | 100.7 | % | | | 453,592,559 | |
| | |
UNREALIZED DEPRECIATION ON
FORWARD CONTRACTS (Net) | | | (0.8 | ) | | | (3,489,483 | ) |
| | |
OTHER ASSETS
AND LIABILITIES (Net) | | | 0.1 | | | | 326,243 | |
| | | | | | | | |
| | |
NET ASSETS | | | 100.0 | % | | | $450,429,319 | |
| | | | | | | | |
| * | See Note 2 in Notes to Financial Statements. |
| (a) | Non-income producing security. |
| (b) | Rate disclosed is the 7-day yield at September 30, 2024. |
| (c) | Rate represents annualized yield at date of purchase. |
| | | | |
| Abbreviations: |
| ADR | | — American Depositary Receipt |
| | | | |
| | |
| | SEE NOTES TO FINANCIAL STATEMENTS | | |
8
Tweedy, Browne Value Fund
Schedule of Forward Exchange Contracts
September 30, 2024 (Unaudited)
| | | | | | | | | | | | | | | | | | | | | | | | |
Contracts | | | | | Counter-
party | | | Settlement
Date | | | Contract Value on
Origination Date | | | Value 09/30/24* | | | Unrealized
Appreciation
(Depreciation) | |
| | FORWARD EXCHANGE CONTRACTS TO BUY(a) | | | | | | | | | | | | | | | | | | | | |
| | 13,000,000 | | | Swedish Krona | | | NTC | | | | 2/28/25 | | | | $1,237,494 | | | | $1,291,866 | | | | $54,372 | |
| | 11,300,000 | | | Swedish Krona | | | NTC | | | | 4/15/25 | | | | 1,095,193 | | | | 1,125,289 | | | | 30,096 | |
| | | | | | | | | | | | | | | | |
| | TOTAL | | | | | | | | | | | | | | $2,332,687 | | | | $2,417,155 | | | | $84,468 | |
| | | | | | | | | | | | | | | | |
| | FORWARD EXCHANGE CONTRACTS TO SELL(a) | | | | | | | | | | | | | | | | | | | | |
| | 2,300,000 | | | Canadian Dollar | | | SSB | | | | 1/13/25 | | | | $(1,735,740) | | | | $(1,707,013) | | | | $28,727 | |
| | 630,000 | | | Canadian Dollar | | | SSB | | | | 9/9/25 | | | | (471,169) | | | | (469,845) | | | | 1,324 | |
| | 1,040,000,000 | | | Chilean Peso | | | SSB | | | | 8/14/25 | | | | (1,092,437) | | | | (1,152,625) | | | | (60,188) | |
| | 31,400,000 | | | Chinese Yuan | | | JPM | | | | 2/28/25 | | | | (4,471,979) | | | | (4,535,928) | | | | (63,949) | |
| | 18,400,000 | | | Chinese Yuan | | | SSB | | | | 5/9/25 | | | | (2,595,937) | | | | (2,667,590) | | | | (71,653) | |
| | 9,800,000 | | | Chinese Yuan | | | JPM | | | | 5/23/25 | | | | (1,391,454) | | | | (1,421,660) | | | | (30,206) | |
| | 4,700,000 | | | European Union Euro | | | NTC | | | | 10/31/24 | | | | (5,063,991) | | | | (5,252,631) | | | | (188,640) | |
| | 14,200,000 | | | European Union Euro | | | SSB | | | | 2/13/25 | | | | (15,515,687) | | | | (15,931,635) | | | | (415,948) | |
| | 10,000,000 | | | European Union Euro | | | NTC | | | | 4/15/25 | | | | (11,013,350) | | | | (11,243,715) | | | | (230,365) | |
| | 9,700,000 | | | European Union Euro | | | BNY | | | | 5/23/25 | | | | (10,730,761) | | | | (10,921,731) | | | | (190,970) | |
| | 12,500,000 | | | European Union Euro | | | BNY | | | | 5/30/25 | | | | (13,789,262) | | | | (14,078,040) | | | | (288,778) | |
| | 7,700,000 | | | Great Britain Pound Sterling | | | SSB | | | | 1/24/25 | | | | (9,757,163) | | | | (10,322,313) | | | | (565,150) | |
| | 1,800,000 | | | Great Britain Pound Sterling | | | BNY | | | | 5/23/25 | | | | (2,288,934) | | | | (2,409,124) | | | | (120,190) | |
| | 2,500,000 | | | Great Britain Pound Sterling | | | JPM | | | | 7/28/25 | | | | (3,245,575) | | | | (3,342,824) | | | | (97,249) | |
| | 4,400,000 | | | Great Britain Pound Sterling | | | NTC | | | | 8/14/25 | | | | (5,583,204) | | | | (5,881,930) | | | | (298,726) | |
| | 6,500,000 | | | Hong Kong Dollar | | | SSB | | | | 12/6/24 | | | | (836,734) | | | | (837,698) | | | | (964) | |
| | 5,200,000 | | | Hong Kong Dollar | | | SSB | | | | 2/13/25 | | | | (669,013) | | | | (670,603) | | | | (1,590) | |
| | 9,700,000 | | | Hong Kong Dollar | | | SSB | | | | 4/3/25 | | | | (1,248,329) | | | | (1,251,679) | | | | (3,350) | |
| | 3,500,000 | | | Hong Kong Dollar | | | JPM | | | | 5/23/25 | | | | (451,335) | | | | (451,878) | | | | (543) | |
| | 4,500,000 | | | Hong Kong Dollar | | | BNY | | | | 9/11/25 | | | | (581,023) | | | | (581,674) | | | | (651) | |
| | 375,000,000 | | | Japanese Yen | | | SSB | | | | 12/16/24 | | | | (2,757,150) | | | | (2,649,242) | | | | 107,908 | |
| | 580,000,000 | | | Japanese Yen | | | SSB | | | | 2/13/25 | | | | (4,127,271) | | | | (4,125,257) | | | | 2,014 | |
| | 405,000,000 | | | Japanese Yen | | | JPM | | | | 3/24/25 | | | | (2,881,001) | | | | (2,892,089) | | | | (11,088) | |
| | 160,000,000 | | | Japanese Yen | | | SSB | | | | 4/25/25 | | | | (1,091,171) | | | | (1,145,888) | | | | (54,717) | |
| | 466,000,000 | | | Japanese Yen | | | JPM | | | | 5/30/25 | | | | (3,138,380) | | | | (3,347,700) | | | | (209,320) | |
| | 434,000,000 | | | Japanese Yen | | | SSB | | | | 6/30/25 | | | | (2,880,213) | | | | (3,126,362) | | | | (246,149) | |
| | 220,000,000 | | | Japanese Yen | | | JPM | | | | 8/29/25 | | | | (1,581,746) | | | | (1,593,246) | | | | (11,500) | |
| | 145,000,000 | | | Japanese Yen | | | SSB | | | | 9/9/25 | | | | (1,043,585) | | | | (1,051,122) | | | | (7,537) | |
| | 190,000,000 | | | Japanese Yen | | | BNY | | | | 10/2/25 | | | | (1,373,130) | | | | (1,380,127) | | | | (6,997) | |
| | 23,500,000 | | | Mexican Peso | | | JPM | | | | 6/9/25 | | | | (1,262,813) | | | | (1,153,826) | | | | 108,987 | |
| | 17,000,000 | | | Mexican Peso | | | BNY | | | | 7/18/25 | | | | (898,853) | | | | (829,959) | | | | 68,894 | |
| | 18,000,000 | | | Philippine Peso | | | JPM | | | | 11/20/24 | | | | (322,407) | | | | (321,152) | | | | 1,255 | |
| | 44,000,000 | | | Philippine Peso | | | SSB | | | | 4/3/25 | | | | (778,761) | | | | (784,295) | | | | (5,534) | |
| | 10,000,000 | | | Singapore Dollar | | | SSB | | | | 1/24/25 | | | | (7,532,531) | | | | (7,843,889) | | | | (311,358) | |
| | 1,100,000 | | | Singapore Dollar | | | NTC | | | | 5/14/25 | | | | (828,376) | | | | (866,465) | | | | (38,089) | |
| | 1,700,000,000 | | | South Korean Won | | | JPM | | | | 1/2/25 | | | | (1,338,056) | | | | (1,307,198) | | | | 30,858 | |
| | 7,500,000,000 | | | South Korean Won | | | JPM | | | | 3/24/25 | | | | (5,776,118) | | | | (5,786,675) | | | | (10,557) | |
| | 1,650,000,000 | | | South Korean Won | | | JPM | | | | 5/14/25 | | | | (1,231,803) | | | | (1,275,099) | | | | (43,296) | |
| | 1,760,000,000 | | | South Korean Won | | | JPM | | | | 6/10/25 | | | | (1,296,787) | | | | (1,361,192) | | | | (64,405) | |
| | 13,000,000 | | | Swedish Krona | | | NTC | | | | 2/28/25 | | | | (1,271,257) | | | | (1,291,866) | | | | (20,609) | |
| | 46,500,000 | | | Swedish Krona | | | NTC | | | | 4/15/25 | | | | (4,438,060) | | | | (4,630,616) | | | | (192,556) | |
| | 1,700,000 | | | Swiss Franc | | | SSB | | | | 12/17/24 | | | | (2,006,373) | | | | (2,032,776) | | | | (26,403) | |
| | 8,800,000 | | | Swiss Franc | | | JPM | | | | 1/3/25 | | | | (10,658,915) | | | | (10,542,386) | | | | 116,529 | |
| | 2,500,000 | | | Swiss Franc | | | BNY | | | | 6/10/25 | | | | (2,886,299) | | | | (3,037,521) | | | | (151,222) | |
| | | | | | | | | | | | | | | | |
| | TOTAL | | | | | | | | | | | | | | $(155,934,133) | | | | $(159,508,084) | | | | $(3,573,951) | |
| | | | | | | | | | | | | | | | |
| | Unrealized Depreciation on Forward Contracts (Net) | | | | | | | | | | | | | | | | | | | $(3,489,483) | |
| | | | | | | | | | | | | | | | | | | | | | | | |
| * | See Note 2 in Notes to Financial Statements. |
| (a) | Primary risk exposure being hedged against is currency risk. |
Counterparty Abbreviations:
| | | | | | |
| BNY | | | — | | | The Bank of New York Mellon |
| JPM | | | — | | | JPMorgan Chase Bank NA |
| NTC | | | — | | | Northern Trust Company |
| SSB | | | — | | | State Street Bank and Trust Company |
| | | | |
| | |
| | SEE NOTES TO FINANCIAL STATEMENTS | | |
9
Tweedy, Browne Worldwide High Dividend Yield Value Fund
Portfolio of Investments
September 30, 2024 (Unaudited)
| | | | | | | | |
Shares | | | | | Value* | |
| |
| | COMMON STOCKS—95.4% | | | | |
| | |
| | | | Belgium—0.8% | | | | |
| | 7,175 | | | KBC Group NV | | | $571,907 | |
| | | | | | | | |
| | |
| | | | China—2.8% | | | | |
| | 308,710 | | | Haitian International Holdings, Ltd. | | | 993,595 | |
| | 976,845 | | | Uni-President China Holdings, Ltd. | | | 916,794 | |
| | | | | | | | |
| | | | | | | 1,910,389 | |
| | | | | | | | |
| | |
| | | | Finland—3.5% | | | | |
| | 95,220 | | | Kemira Oyj | | | 2,382,580 | |
| | | | | | | | |
| | |
| | | | France—8.2% | | | | |
| | 58,430 | | | Rubis SCA | | | 1,598,969 | |
| | 8,630 | | | Safran SA | | | 2,033,212 | |
| | 44,294 | | | Tarkett SA(a) | | | 465,671 | |
| | 14,570 | | | Teleperformance SE | | | 1,512,259 | |
| | | | | | | | |
| | | | | | | 5,610,111 | |
| | | | | | | | |
| | |
| | | | Germany—6.9% | | | | |
| | 36,145 | | | DHL Group | | | 1,614,795 | |
| | 50,225 | | | Fresenius SE & Co., KGaA(a) | | | 1,918,715 | |
| | 1,154 | | | Muenchener Rueckversicherungs AG, Registered | | | 636,620 | |
| | 31,624 | | | Norma Group SE | | | 527,998 | |
| | | | | | | | |
| | | | | | | 4,698,128 | |
| | | | | | | | |
| | |
| | | | Hong Kong—3.4% | | | | |
| | 407,000 | | | Hang Lung Group, Ltd. | | | 550,177 | |
| | 22,115 | | | Jardine Matheson Holdings, Ltd. | | | 863,812 | |
| | 360,840 | | | Johnson Electric Holdings, Ltd. | | | 535,163 | |
| | 172,775 | | | Luk Fook Holdings International, Ltd. | | | 372,353 | |
| | | | | | | | |
| | | | | | | 2,321,505 | |
| | | | | | | | |
| | |
| | | | Japan—11.3% | | | | |
| | 42,370 | | | ADEKA Corp. | | | 863,899 | |
| | 19,655 | | | Dentsu Group, Inc. | | | 605,562 | |
| | 45,315 | | | Inaba Denki Sangyo Co., Ltd. | | | 1,213,342 | |
| | 56,600 | | | Kuraray Co., Ltd. | | | 838,673 | |
| | 48,915 | | | Mitsubishi Gas Chemical Co., Inc. | | | 947,078 | |
| | 12,325 | | | Nippon Express Holdings, Inc. | | | 649,768 | |
| | 49,970 | | | Shoei Co., Ltd. | | | 780,083 | |
| | 38,870 | | | Subaru Corp. | | | 674,464 | |
| | 17,685 | | | Sumitomo Heavy Industries, Ltd. | | | 425,310 | |
| | 30,400 | | | Transcosmos, Inc. | | | 753,412 | |
| | | | | | | | |
| | | | | | | 7,751,591 | |
| | | | | | | | |
| | |
| | | | Mexico—2.9% | | | | |
| | 9,925 | | | Coca-Cola FEMSA SAB de CV, Sponsored ADR | | | 880,546 | |
| | 531,475 | | | Megacable Holdings SAB de CV | | | 1,111,103 | |
| | | | | | | | |
| | | | | | | 1,991,649 | |
| | | | | | | | |
| | |
| | | | Netherlands—1.2% | | | | |
| | 19,775 | | | Aalberts NV | | | 804,227 | |
| | | | | | | | |
| | |
| | | | Singapore—4.9% | | | | |
| | 59,174 | | | DBS Group Holdings, Ltd. | | | 1,756,295 | |
| | 63,030 | | | United Overseas Bank, Ltd. | | | 1,581,650 | |
| | | | | | | | |
| | | | | | | 3,337,945 | |
| | | | | | | | |
| | | | | | | | |
Shares | | | | | Value* | |
| | |
| | | | South Korea—3.0% | | | | |
| | 11,110 | | | DB Insurance Co., Ltd. | | | $954,082 | |
| | 13,365 | | | LG Corp. | | | 808,420 | |
| | 53,223 | | | LX Holdings Corp. | | | 290,596 | |
| | | | | | | | |
| | | | | | | 2,053,098 | |
| | | | | | | | |
| | |
| | | | Sweden—3.4% | | | | |
| | 3,940 | | | Autoliv, Inc. | | | 367,878 | |
| | 21,992 | | | Husqvarna AB, Class B | | | 154,039 | |
| | 30,705 | | | SKF AB, Class B. | | | 611,882 | |
| | 31,750 | | | Trelleborg AB, Class B | | | 1,222,190 | |
| | | | | | | | |
| | | | | | | 2,355,989 | |
| | | | | | | | |
| | |
| | | | Switzerland—11.7% | | | | |
| | 28,420 | | | Nestlé SA, Registered | | | 2,862,383 | |
| | 16,072 | | | Novartis AG, Registered | | | 1,850,981 | |
| | 6,570 | | | Roche Holding AG | | | 2,107,571 | |
| | 1,947 | | | Zurich Insurance Group AG | | | 1,176,671 | |
| | | | | | | | |
| | | | | | | 7,997,606 | |
| | | | | | | | |
| | |
| | | | United Kingdom—16.0% | | | | |
| | 143,330 | | | BAE Systems plc | | | 2,379,164 | |
| | 53,710 | | | CNH Industrial NV | | | 596,181 | |
| | 26,290 | | | Computacenter plc | | | 872,434 | |
| | 68,020 | | | Diageo plc | | | 2,374,941 | |
| | 40,695 | | | Grafton Group plc | | | 568,134 | |
| | 78,507 | | | GSK plc | | | 1,596,956 | |
| | 47,690 | | | Howden Joinery Group plc | | | 580,198 | |
| | 133,180 | | | Inchcape plc | | | 1,422,875 | |
| | 120,610 | | | SThree plc | | | 608,294 | |
| | | | | | | | |
| | | | | | | 10,999,177 | |
| | | | | | | | |
| | |
| | | | United States—15.4% | | | | |
| | 41,145 | | | Bank of America Corp. | | | 1,632,633 | |
| | 28,760 | | | Enterprise Products Partners LP | | | 837,204 | |
| | 27,445 | | | FMC Corp. | | | 1,809,723 | |
| | 12,783 | | | Johnson & Johnson | | | 2,071,613 | |
| | 1,098 | | | Kenvue, Inc. | | | 25,397 | |
| | 5,976 | | | Progressive Corp./The | | | 1,516,470 | |
| | 30,645 | | | Truist Financial Corp. | | | 1,310,687 | |
| | 30,030 | | | U.S. Bancorp. | | | 1,373,272 | |
| | | | | | | | |
| | | | | | | 10,576,999 | |
| | | | | | | | |
| |
| TOTAL COMMON STOCKS
(Cost $46,528,533) | | | 65,362,901 | |
| | | | | | | | |
| | | | |
| | |
| | SEE NOTES TO FINANCIAL STATEMENTS | | |
10
Tweedy, Browne Worldwide High Dividend Yield Value Fund
Portfolio of Investments
September 30, 2024 (Unaudited)
| | | | | | | | |
Shares | | | | | Value* | |
| |
| | REGISTERED INVESTMENT COMPANY—3.7% | | | | |
| | 2,518,798 | | | Dreyfus Government Securities Cash
Management– Institutional Shares
4.83%(b)
(Cost $2,518,798) | | | $2,518,798 | |
| | | | | | | | |
| | | | | | | | |
| | |
INVESTMENTS IN SECURITIES
(Cost $49,047,331) | | | 99.1 | % | | | 67,881,699 | |
| | |
OTHER ASSETS
AND LIABILITIES (Net) | | | 0.9 | | | | 614,713 | |
| | | | | | | | |
| | |
NET ASSETS | | | 100.0 | % | | | $68,496,412 | |
| | | | | | | | |
| * | See Note 2 in Notes to Financial Statements. |
| (a) | Non-income producing security. |
| (b) | Rate disclosed is the 7-day yield at September 30, 2024. |
| | | | |
| Abbreviations: |
| ADR | | — American Depositary Receipt |
| | | | |
| | |
| | SEE NOTES TO FINANCIAL STATEMENTS | | |
11
Tweedy, Browne Fund INC.
Statements of Assets and Liabilities
September 30, 2024 (Unaudited)
| | | | | | | | | | | | | | | | | | | | |
| | | International Value
Fund | | International Value
Fund II -
Currency
Unhedged | | Value
Fund | | Worldwide High
Dividend Yield
Value Fund |
ASSETS | | | | | | | | | | | | | | | | | | | | |
Investments in securities, at cost(a) | | | | $3,151,618,139 | | | | | $188,430,246 | | | | | $285,135,972 | | | | | $49,047,331 | |
| | | | | | | | | | | | | | | | | | | | |
Investments in securities of unaffiliated issuers, at value | | | | $5,619,475,573 | | | | | $264,448,963 | | | | | $453,592,559 | | | | | $67,881,699 | |
Investments in securities of affiliated issuers, at value | | | | 66,924,399 | | | | | — | | | | | — | | | | | — | |
Cash | | | | — | | | | | 4,997,602 | | | | | — | | | | | — | |
Dividends and interest receivable | | | | 11,824,577 | | | | | 555,823 | | | | | 847,483 | | | | | 190,390 | |
Receivable for investment securities sold | | | | 3,864,462 | | | | | — | | | | | — | | | | | — | |
Recoverable foreign withholding taxes | | | | 27,250,989 | | | | | 1,717,534 | | | | | 951,694 | | | | | 503,427 | |
Receivable for Fund shares sold | | | | 4,336,828 | | | | | 168,636 | | | | | 106,835 | | | | | — | |
Unrealized appreciation on forward exchange contracts (Note 2) | | | | 10,828,979 | | | | | — | | | | | 550,964 | | | | | — | |
Prepaid expense | | | | 183,559 | | | | | 8,496 | | | | | 13,977 | | | | | 3,218 | |
| | | | | | | | | | | | | | | | | | | | |
Total Assets | | | | $5,744,689,366 | | | | | $271,897,054 | | | | | $456,063,512 | | | | | $68,578,734 | |
| | | | | | | | | | | | | | | | | | | | |
| | | | |
LIABILITIES | | | | | | | | | | | | | | | | | | | | |
Unrealized depreciation of forward exchange contracts (Note 2) | | | | $ 73,043,626 | | | | | $ — | | | | | $ 4,040,447 | | | | | $ — | |
Payable for Fund shares redeemed | | | | 5,767,208 | | | | | 453,495 | | | | | 1,073,287 | | | | | 1,665 | |
Investment advisory fee payable (Note 3) | | | | 3,637,711 | | | | | 172,972 | | | | | 287,814 | | | | | 43,592 | |
Payable for investment securities purchased | | | | 2,818,509 | | | | | — | | | | | — | | | | | — | |
Shareholder servicing and administration fees payable (Note 3) | | | | 309,640 | | | | | 16,699 | | | | | 24,594 | | | | | 3,511 | |
Directors’ fees payable | | | | 2,483 | | | | | — | | | | | 986 | | | | | — | |
Due to custodian | | | | 1,270,277 | | | | | — | | | | | 84,122 | | | | | — | |
Transfer agent fees payable | | | | 268,407 | | | | | 8,239 | | | | | 18,596 | | | | | 4,986 | |
Fund administration and accounting fees payable | | | | 343,860 | | | | | 16,262 | | | | | 27,161 | | | | | 4,003 | |
Legal and audit fees payable | | | | 297,623 | | | | | 24,250 | | | | | 25,819 | | | | | 9,177 | |
Interest payable | | | | — | | | | | 1,298 | | | | | — | | | | | — | |
Accrued expenses and other payables | | | | 586,401 | | | | | 42,963 | | | | | 51,367 | | | | | 15,388 | |
| | | | | | | | | | | | | | | | | | | | |
Total Liabilities | | | | 88,345,745 | | | | | 736,178 | | | | | 5,634,193 | | | | | 82,322 | |
| | | | | | | | | | | | | | | | | | | | |
NET ASSETS | | | | $5,656,343,621 | | | | | $271,160,876 | | | | | $450,429,319 | | | | | $68,496,412 | |
| | | | | | | | | | | | | | | | | | | | |
| | | | |
NET ASSETS consists of | | | | | | | | | | | | | | | | | | | | |
Paid-in capital | | | | 2,642,289,522 | | | | | 156,120,158 | | | | | 238,723,766 | | | | | 46,777,639 | |
Total distributable earnings | | | | 3,014,054,099 | | | | | 115,040,718 | | | | | 211,705,553 | | | | | 21,718,773 | |
| | | | | | | | | | | | | | | | | | | | |
Total Net Assets | | | | $5,656,343,621 | | | | | $271,160,876 | | | | | $450,429,319 | | | | | $68,496,412 | |
| | | | | | | | | | | | | | | | | | | | |
CAPITAL STOCK (common stock outstanding) | | | | 190,916,578 | | | | | 14,721,963 | | | | | 22,608,826 | | | | | 11,054,752 | |
| | | | | | | | | | | | | | | | | | | | |
NET ASSET VALUE offering price per share | | | | $ 29.63 | | | | | $ 18.42 | | | | | $ 19.92 | | | | | $ 6.20 | |
| | | | | | | | | | | | | | | | | | | | |
| (a) | Includes investments in securities of affiliated issuers, at cost for International Value Fund, International Value Fund II – Currency Unhedged, Value Fund and Worldwide High Dividend Yield Value Fund of $48,686,462, $0, $0 and $0, respectively (Note 4). |
| | | | |
| | |
| | SEE NOTES TO FINANCIAL STATEMENTS | | |
12
Tweedy, Browne Fund INC.
Statements of Operations
For the Six Months Ended September 30, 2024 (Unaudited)
| | | | | | | | | | | | | | | | | | | | |
| | | International Value
Fund | | International Value
Fund II -
Currency
Unhedged | | Value
Fund | | Worldwide High
Dividend Yield
Value Fund |
INVESTMENT INCOME | | | | | | | | | | | | | | | | | | | | |
Dividends(a) | | | $ | 126,379,989 | | | | $ | 6,372,752 | | | | $ | 7,946,614 | | | | $ | 1,698,971 | |
Less foreign withholding taxes | | | | (11,118,674 | ) | | | | (588,307 | ) | | | | (677,545 | ) | | | | (126,001 | ) |
Interest | | | | 2,048,773 | | | | | — | | | | | 102,601 | | | | | — | |
Other | | | | 4,864,601 | | | | | 337,363 | | | | | 278,024 | | | | | 62,485 | |
| | | | | | | | | | | | | | | | | | | | |
Total Investment Income | | | | 122,174,689 | | | | | 6,121,808 | | | | | 7,649,694 | | | | | 1,635,455 | |
| | | | | | | | | | | | | | | | | | | | |
| | | | |
EXPENSES | | | | | | | | | | | | | | | | | | | | |
Investment advisory fee (Note 3) | | | | 36,414,468 | | | | | 1,770,690 | | | | | 2,837,166 | | | | | 418,370 | |
Transfer agent fees (Note 3) | | | | 1,187,446 | | | | | 43,601 | | | | | 77,239 | | | | | 21,134 | |
Fund administration and accounting fees (Note 3) | | | | 677,628 | | | | | 25,965 | | | | | 45,523 | | | | | 7,258 | |
Custodian fees (Note 3) | | | | 539,842 | | | | | 37,048 | | | | | 30,891 | | | | | 7,431 | |
Legal and audit fees | | | | 462,885 | | | | | 29,389 | | | | | 36,188 | | | | | 8,672 | |
Directors’ fees and expenses (Note 3) | | | | 417,982 | | | | | 20,728 | | | | | 31,125 | | | | | 4,753 | |
Shareholder servicing and administration fees (Note 3) | | | | 208,370 | | | | | 10,160 | | | | | 16,256 | | | | | 2,382 | |
Registration fees | | | | 46,535 | | | | | 15,274 | | | | | 16,876 | | | | | 27,031 | |
Interest expense | | | | — | | | | | 13,830 | | | | | — | | | | | — | |
Other | | | | 478,191 | | | | | 29,633 | | | | | 42,052 | | | | | 14,095 | |
| | | | | | | | | | | | | | | | | | | | |
Total expenses before waivers | | | | 40,433,347 | | | | | 1,996,318 | | | | | 3,133,316 | | | | | 511,126 | |
| | | | | | | | | | | | | | | | | | | | |
Investment advisory fees waived (Note 3) | | | | (4,563 | ) | | | | (9,828 | ) | | | | — | | | | | (44,259 | ) |
| | | | | | | | | | | | | | | | | | | | |
Net Expenses | | | | 40,428,784 | | | | | 1,986,490 | | | | | 3,133,316 | | | | | 466,867 | |
| | | | | | | | | | | | | | | | | | | | |
NET INVESTMENT INCOME | | | | 81,745,905 | | | | | 4,135,318 | | | | | 4,516,378 | | | | | 1,168,588 | |
| | | | | | | | | | | | | | | | | | | | |
| | | | |
REALIZED AND UNREALIZED GAIN (LOSS) | | | | | | | | | | | | | | | | | | | | |
Net realized gain (loss) on: | | | | | | | | | | | | | | | | | | | | |
Securities(a)(b) | | | | 341,518,018 | | | | | 29,174,054 | | | | | 34,516,535 | | | | | 744,643 | |
Forward exchange contracts | | | | 20,756,661 | | | | | — | | | | | 2,018,308 | | | | | — | |
Foreign currencies and net other assets | | | | (449,060 | ) | | | | (11,114 | ) | | | | 8,727 | | | | | (812 | ) |
| | | | | | | | | | | | | | | | | | | | |
Net realized gain | | | | 361,825,619 | | | | | 29,162,940 | | | | | 36,543,570 | | | | | 743,831 | |
| | | | | | | | | | | | | | | | | | | | |
Net unrealized appreciation (depreciation) of: | | | | | | | | | | | | | | | | | | | | |
Securities(c) | | | | (169,077,442 | ) | | | | (21,671,921 | ) | | | | (25,900,431 | ) | | | | 1,496,833 | |
Forward exchange contracts | | | | (110,062,208 | ) | | | | — | | | | | (6,566,123 | ) | | | | — | |
Foreign currencies and net other assets | | | | 1,496,151 | | | | | 97,646 | | | | | 46,532 | | | | | 21,451 | |
| | | | | | | | | | | | | | | | | | | | |
Net change in unrealized appreciation (depreciation) | | | | (277,643,499 | ) | | | | (21,574,275 | ) | | | | (32,420,022 | ) | | | | 1,518,284 | |
| | | | | | | | | | | | | | | | | | | | |
NET REALIZED AND UNREALIZED GAIN | | | | 84,182,120 | | | | | 7,588,665 | | | | | 4,123,548 | | | | | 2,262,115 | |
| | | | | | | | | | | | | | | | | | | | |
NET INCREASE IN NET ASSETS RESULTING FROM OPERATIONS | | | $ | 165,928,025 | | | | $ | 11,723,983 | | | | $ | 8,639,926 | | | | $ | 3,430,703 | |
| | | | | | | | | | | | | | | | | | | | |
| (a) | Dividends and Net realized gain (loss) on securities from affiliated issuers for International Value Fund were $2,061,358 and $162,605, respectively (Note 4). |
| (b) | Net realized gain (loss) on securities includes realized gains of $94,267,177, $1,717,169, $5,457,369, and $153,229 for International Value Fund, International Value Fund II - Currency Unhedged, Value Fund and Worldwide High Dividend Yield Value Fund, respectively, for redemption-in- kind activity, which will not be recognized by the Funds for tax purposes. |
| (c) | Net change in unrealized appreciation (depreciation) of securities from affiliated issuers for International Value Fund was $7,398,469 (Note 4). |
| | | | |
| | |
| | SEE NOTES TO FINANCIAL STATEMENTS | | |
13
Tweedy, Browne Fund INC.
Statements of Changes in Net Assets
| | | | | | | | | | | | | | | | |
| | | International Value Fund | | | International Value Fund II –
Currency Unhedged | |
| | | Six Months
Ended
9/30/2024
(Unaudited) | | | Year Ended
3/31/2024 | | | Six Months
Ended
9/30/2024
(Unaudited) | | | Year Ended
3/31/2024 | |
INVESTMENT ACTIVITIES: | | | | | | | | | | | | | | | | |
Net investment income | | $ | 81,745,905 | | | $ | 91,721,600 | | | $ | 4,135,318 | | | $ | 7,550,795 | |
Net realized gain | | | 361,825,619 | | | | 337,460,453 | | | | 29,162,940 | | | | 6,476,099 | |
Net change in unrealized appreciation (depreciation) | | | (277,643,499 | ) | | | 178,222,009 | | | | (21,574,275 | ) | | | 20,262,908 | |
| | | | | | | | | | | | | | | | |
Net increase in net assets resulting from operations | | | 165,928,025 | | | | 607,404,062 | | | | 11,723,983 | | | | 34,289,802 | |
| | | | | | | | | | | | | | | | |
| | | | |
DISTRIBUTIONS: | | | | | | | | | | | | | | | | |
Distributions to shareholders | | | — | | | | (259,301,054 | ) | | | — | | | | (6,696,927 | ) |
| | | | | | | | | | | | | | | | |
| | | | |
CAPITAL STOCK TRANSACTIONS: | | | | | | | | | | | | | | | | |
Net decrease in net assets from Fund share transactions (Note 5) | | | (450,851,281 | ) | | | (414,060,067 | ) | | | (97,613,183 | ) | | | (126,526,184 | ) |
| | | | | | | | | | | | | | | | |
Net decrease in net assets | | | (284,923,256 | ) | | | (65,957,059 | ) | | | (85,889,200 | ) | | | (98,933,309 | ) |
| | | | |
NET ASSETS: | | | | | | | | | | | | | | | | |
Beginning of period | | | 5,941,266,877 | | | | 6,007,223,936 | | | | 357,050,076 | | | | 455,983,385 | |
| | | | | | | | | | | | | | | | |
End of period | | $ | 5,656,343,621 | | | $ | 5,941,266,877 | | | $ | 271,160,876 | | | $ | 357,050,076 | |
| | | | | | | | | | | | | | | | |
| | | | |
| | |
| | SEE NOTES TO FINANCIAL STATEMENTS | | |
14
Tweedy, Browne Fund INC.
Statements of Changes in Net Assets
| | | | | | | | | | | | | | | | |
| | | Value Fund | | | Worldwide High Dividend
Yield Value Fund | |
| | | Six Months
Ended
9/30/2024
(Unaudited) | | | Year Ended
3/31/2024 | | | Six Months
Ended
9/30/2024
(Unaudited) | | | Year Ended
3/31/2024 | |
INVESTMENT ACTIVITIES: | | | | | | | | | | | | | | | | |
Net investment income | | $ | 4,516,378 | | | $ | 4,665,633 | | | $ | 1,168,588 | | | $ | 1,707,726 | |
Net realized gain | | | 36,543,570 | | | | 29,207,161 | | | | 743,831 | | | | 2,975,242 | |
Net change in unrealized appreciation (depreciation) | | | (32,420,022 | ) | | | 28,533,553 | | | | 1,518,284 | | | | 2,486,698 | |
| | | | | | | | | | | | | | | | |
Net increase in net assets resulting from operations | | | 8,639,926 | | | | 62,406,347 | | | | 3,430,703 | | | | 7,169,666 | |
| | | | | | | | | | | | | | | | |
| | | | |
DISTRIBUTIONS: | | | | | | | | | | | | | | | | |
Distributions to shareholders | | | — | | | | (30,901,815 | ) | | | (945,658 | ) | | | (2,543,483 | ) |
| | | | | | | | | | | | | | | | |
| | | | |
CAPITAL STOCK TRANSACTIONS: | | | | | | | | | | | | | | | | |
Net increase (decrease) in net assets from Fund share transactions (Note 5) | | | (15,375,864 | ) | | | 1,039,826 | | | | (1,558,642 | ) | | | (6,925,967 | ) |
| | | | | | | | | | | | | | | | |
Net increase (decrease) in net assets | | | (6,735,938 | ) | | | 32,544,358 | | | | 926,403 | | | | (2,299,784 | ) |
| | | | |
NET ASSETS: | | | | | | | | | | | | | | | | |
Beginning of period | | | 457,165,257 | | | | 424,620,899 | | | | 67,570,009 | | | | 69,869,793 | |
| | | | | | | | | | | | | | | | |
End of period | | $ | 450,429,319 | | | $ | 457,165,257 | | | $ | 68,496,412 | | | $ | 67,570,009 | |
| | | | | | | | | | | | | | | | |
| | | | |
| | |
| | SEE NOTES TO FINANCIAL STATEMENTS | | |
15
Tweedy, Browne Fund INC.
Financial Highlights
Tweedy, Browne International Value Fund
For a Fund share outstanding throughout each period/year.
| | | | | | | | | | | | | | | | | | | | | | | | |
| | | Six Months
Ended
9/30/2024
(Unaudited) | | | Year
Ended
3/31/2024 | | | Year
Ended
3/31/2023 | | | Year
Ended
3/31/2022 | | | Year
Ended
3/31/2021 | | | Year
Ended
3/31/2020 | |
Net asset value, beginning of period/year | | $ | 28.79 | | | $ | 27.16 | | | $ | 28.14 | | | $ | 29.41 | | | $ | 21.99 | | | $ | 26.91 | |
| | | | | | | | | | | | | | | | | | | | | | | | |
Income from investment operations: | | | | | | | | | | | | | | | | | | | | | | | | |
Net investment income | | | 0.43 | (a) | | | 0.44 | (a) | | | 0.43 | (a) | | | 0.37 | (a) | | | 0.23 | | | | 0.43 | |
Net realized and unrealized gain (loss) on investments | | | 0.41 | | | | 2.43 | | | | 0.04 | | | | 0.95 | | | | 7.45 | | | | (4.82 | ) |
| | | | | | | | | | | | | | | | | | | | | | | | |
Total from investment operations | | | 0.84 | | | | 2.87 | | | | 0.47 | | | | 1.32 | | | | 7.68 | | | | (4.39 | ) |
| | | | | | | | | | | | | | | | | | | | | | | | |
| | | | | | |
Distributions: | | | | | | | | | | | | | | | | | | | | | | | | |
Dividends from net investment income | | | — | | | | (0.46 | ) | | | (0.40 | ) | | | (0.41 | ) | | | (0.26 | ) | | | (0.45 | ) |
Distributions from net realized gains | | | — | | | | (0.78 | ) | | | (1.05 | ) | | | (2.18 | ) | | | — | | | | (0.08 | ) |
| | | | | | | | | | | | | | | | | | | | | | | | |
Total distributions | | | — | | | | (1.24 | ) | | | (1.45 | ) | | | (2.59 | ) | | | (0.26 | ) | | | (0.53 | ) |
| | | | | | | | | | | | | | | | | | | | | | | | |
Redemption fees | | | — | | | | — | | | | — | | | | — | | | | — | | | | 0.00 | (b) |
| | | | | | | | | | | | | | | | | | | | | | | | |
Net asset value, end of period/year | | $ | 29.63 | | | $ | 28.79 | | | $ | 27.16 | | | $ | 28.14 | | | $ | 29.41 | | | $ | 21.99 | |
| | | | | | | | | | | | | | | | | | | | | | | | |
Total return(c) | | | 2.92 | % | | | 10.99 | % | | | 1.94 | % | | | 4.36 | % | | | 34.89 | %(d) | | | (16.66 | )%(d) |
| | | | | | | | | | | | | | | | | | | | | | | | |
| | | | | | |
Ratios/Supplemental Data: | | | | | | | | | | | | | | | | | | | | | | | | |
Net assets, end of period/year (in 000s) | | $ | 5,656,344 | | | $ | 5,941,267 | | | $ | 6,007,224 | | | $ | 6,306,407 | | | $ | 6,419,446 | | | $ | 5,990,962 | |
Ratio of operating expenses to average net assets | | | 1.39 | %(e) | | | 1.39 | % | | | 1.40 | % | | | 1.34 | % | | | 1.37 | % | | | 1.36 | % |
Ratio of operating expenses to average net assets excluding waivers of expenses | | | 1.39 | %(e) | | | 1.39 | % | | | 1.40 | % | | | 1.38 | % | | | 1.38 | % | | | 1.36 | % |
Ratio of net investment income to average net assets | | | 2.81 | %(a)(e) | | | 1.56 | %(a) | | | 1.55 | %(a) | | | 1.19 | %(a) | | | 0.83 | % | | | 1.50 | % |
Portfolio turnover rate | | | 10 | % | | | 12 | % | | | 15 | % | | | 10 | % | | | 11 | % | | | 9 | % |
| (a) | Includes the impact of refunded European tax reclaims. If these reclaims were not included the Net Investment Income per Share would have been $0.40, $0.40, $0.40 and $0.35 and the Ratio of Net Investment Income to Average Net Assets would have been 2.64%, 1.42%, 1.44% and 1.10% for the period ended September 30, 2024 and the years ending March 31, 2024, March 31, 2023 and March 31, 2022, respectively. |
| (b) | Amount represents less than $0.01 per share. |
| (c) | Total return represents aggregate total return for the periods indicated. |
| (d) | The net asset value (NAV) disclosed in the March 31, 2020 annual report reflects adjustments in accordance with accounting principles generally accepted in the United States of America (U.S. GAAP) and as such, differs from the NAV reported on March 31, 2020. The total return reported is based on the unadjusted NAV which was the official NAV for executing transactions on March 31, 2020. The total return based on the NAV which reflects the adjustments in accordance with U.S. GAAP is (16.74)% for the year ended March 31, 2020 and 35.02% for the year ended March 31, 2021. |
| | | | |
| | |
| | SEE NOTES TO FINANCIAL STATEMENTS | | |
16
Tweedy, Browne Fund INC.
Financial Highlights
Tweedy, Browne International Value Fund II - Currency Unhedged
For a Fund share outstanding throughout each period/year.
| | | | | | | | | | | | | | | | | | | | | | | | |
| | | Six Months
Ended
9/30/2024
(Unaudited) | | | Year
Ended
3/31/2024 | | | Year
Ended
3/31/2023 | | | Year
Ended
3/31/2022 | | | Year
Ended
3/31/2021 | | | Year
Ended
3/31/2020 | |
Net asset value, beginning of period/year | | $ | 17.63 | | | $ | 16.36 | | | $ | 16.31 | | | $ | 16.30 | | | $ | 11.66 | | | $ | 15.10 | |
| | | | | | | | | | | | | | | | | | | | | | | | |
Income from investment operations: | | | | | | | | | | | | | | | | | | | | | | | | |
Net investment income | | | 0.30 | (a) | | | 0.34 | (a) | | | 0.27 | (a) | | | 0.18 | (a) | | | 0.09 | | | | 0.21 | |
Net realized and unrealized gain (loss) on investments | | | 0.49 | | | | 1.23 | | | | 0.04 | (b) | | | 0.01 | | | | 4.69 | | | | (3.31 | ) |
| | | | | | | | | | | | | | | | | | | | | | | | |
Total from investment operations | | | 0.79 | | | | 1.57 | | | | 0.31 | | | | 0.19 | | | | 4.78 | | | | (3.10 | ) |
| | | | | | | | | | | | | | | | | | | | | | | | |
| | | | | | |
Distributions: | | | | | | | | | | | | | | | | | | | | | | | | |
Dividends from net investment income | | | — | | | | (0.30 | ) | | | (0.26 | ) | | | (0.18 | ) | | | (0.10 | ) | | | (0.23 | ) |
Distributions from net realized gains | | | — | | | | — | | | | — | | | | — | | | | (0.04 | ) | | | (0.11 | ) |
| | | | | | | | | | | | | | | | | | | | | | | | |
Total distributions | | | — | | | | (0.30 | ) | | | (0.26 | ) | | | (0.18 | ) | | | (0.14 | ) | | | (0.34 | ) |
| | | | | | | | | | | | | | | | | | | | | | | | |
Redemption fees | | | — | | | | — | | | | — | | | | — | | | | — | | | | 0.00 | (c) |
| | | | | | | | | | | | | | | | | | | | | | | | |
Net asset value, end of period/year | | $ | 18.42 | | | $ | 17.63 | | | $ | 16.36 | | | $ | 16.31 | | | $ | 16.30 | | | $ | 11.66 | |
| | | | | | | | | | | | | | | | | | | | | | | | |
Total return(d) | | | 4.48 | % | | | 9.74 | % | | | 1.99 | % | | | 1.13 | % | | | 40.87 | %(e) | | | (20.94 | )%(e) |
| | | | | | | | | | | | | | | | | | | | | | | | |
| | | | | | |
Ratios/Supplemental Data: | | | | | | | | | | | | | | | | | | | | | | | | |
Net assets, end of period/year (in 000s) | | $ | 271,161 | | | $ | 357,050 | | | $ | 455,983 | | | $ | 520,524 | | | $ | 486,338 | | | $ | 374,832 | |
Ratio of operating expenses to average net assets | | | 1.40 | %(f) | | | 1.38 | % | | | 1.39 | % | | | 1.34 | % | | | 1.37 | % | | | 1.36 | % |
Ratio of operating expenses to average net assets excluding recoupments and/or waivers/reimbursements of expenses | | | 1.41 | %(f) | | | 1.39 | % | | | 1.39 | % | | | 1.37 | % | | | 1.37 | % | | | 1.36 | % |
Ratio of net investment income to average net assets | | | 2.92 | %(a)(f) | | | 1.85 | %(a) | | | 1.68 | %(a) | | | 1.07 | %(a) | | | 0.66 | % | | | 1.40 | % |
Portfolio turnover rate | | | 6 | % | | | 13 | % | | | 11 | % | | | 8 | % | | | 25 | % | | | 11 | % |
| (a) | Includes the impact of refunded European tax reclaims. If these reclaims were not included the Net Investment Income per Share would have been $0.28, $0.32, $0.26 and $0.17 and the Ratio of Net Investment Income to Average Net Assets would have been 2.68%, 1.71%, 1.60% and 1.02% for the period ended September 30, 2024 and the years ending March 31, 2024, March 31, 2023 and March 31, 2022, respectively. |
| (b) | The amount per share shown does not correlate with net realized and unrealized gain/(loss) on investments for the year due to the timing of purchases and sales of the Fund’s shares in relation to the fluctuating market values of the Fund’s investments. |
| (c) | Amount represents less than $0.01 per share. |
| (d) | Total return represents aggregate total return for the periods indicated. |
| (e) | The net asset value (NAV) disclosed in the March 31, 2020 annual report reflects adjustments in accordance with accounting principles generally accepted in the United States of America (U.S. GAAP) and as such, differs from the NAV reported on March 31, 2020. The total return reported is based on the unadjusted NAV which was the official NAV for executing transactions on March 31, 2020. The total return based on the NAV which reflects the adjustments in accordance with U.S. GAAP is (21.08)% for the year ended March 31, 2020 and 41.12% for the year ended March 31, 2021. |
| | | | |
| | |
| | SEE NOTES TO FINANCIAL STATEMENTS | | |
17
Tweedy, Browne Fund INC.
Financial Highlights
Tweedy, Browne Value Fund
For a Fund share outstanding throughout each period/year.
| | | | | | | | | | | | | | | | | | | | | | | | |
| | | Six Months
Ended
9/30/2024
(Unaudited) | | | Year
Ended
3/31/2024 | | | Year
Ended
3/31/2023 | | | Year
Ended
3/31/2022 | | | Year
Ended
3/31/2021 | | | Year
Ended
3/31/2020 | |
Net asset value, beginning of period/year | | $ | 19.54 | | | $ | 18.25 | | | $ | 19.10 | | | $ | 20.38 | | | $ | 15.34 | | | $ | 19.62 | |
| | | | | | | | | | | | | | | | | | | | | | | | |
Income from investment operations: | | | | | | | | | | | | | | | | | | | | | | | | |
Net investment income | | | 0.20 | (a) | | | 0.21 | (a) | | | 0.18 | (a) | | | 0.17 | (a) | | | 0.11 | | | | 0.19 | |
Net realized and unrealized gain (loss) on investments | | | 0.18 | | | | 2.47 | | | | 0.10 | | | | 0.93 | | | | 5.31 | | | | (3.38 | ) |
| | | | | | | | | | | | | | | | | | | | | | | | |
Total from investment operations | | | 0.38 | | | | 2.68 | | | | 0.28 | | | | 1.10 | | | | 5.42 | | | | (3.19 | ) |
| | | | | | | | | | | | | | | | | | | | | | | | |
| | | | | | |
Distributions: | | | | | | | | | | | | | | | | | | | | | | | | |
Dividends from net investment income | | | — | | | | (0.20 | ) | | | (0.18 | ) | | | (0.18 | ) | | | (0.12 | ) | | | (0.20 | ) |
Distributions from net realized gains | | | — | | | | (1.19 | ) | | | (0.95 | ) | | | (2.20 | ) | | | (0.26 | ) | | | (0.89 | ) |
| | | | | | | | | | | | | | | | | | | | | | | | |
Total distributions | | | — | | | | (1.39 | ) | | | (1.13 | ) | | | (2.38 | ) | | | (0.38 | ) | | | (1.09 | ) |
| | | | | | | | | | | | | | | | | | | | | | | | |
Net asset value, end of period/year | | $ | 19.92 | | | $ | 19.54 | | | $ | 18.25 | | | $ | 19.10 | | | $ | 20.38 | | | $ | 15.34 | |
| | | | | | | | | | | | | | | | | | | | | | | | |
Total return(b) | | | 1.95 | % | | | 15.35 | % | | | 1.74 | % | | | 5.35 | % | | | 35.58 | % | | | (17.47 | )% |
| | | | | | | | | | | | | | | | | | | | | | | | |
| | | | | | |
Ratios/Supplemental Data: | | | | | | | | | | | | | | | | | | | | | | | | |
Net assets, end of period/year (in 000s) | | $ | 450,429 | | | $ | 457,165 | | | $ | 424,621 | | | $ | 440,823 | | | $ | 426,946 | | | $ | 338,270 | |
Ratio of operating expenses to average net assets | | | 1.38 | %(c) | | | 1.38 | % | | | 1.40 | % | | | 1.34 | % | | | 1.37 | % | | | 1.36 | % |
Ratio of operating expenses to average net assets excluding waiver and/or reimbursements of expenses | | | 1.38 | %(c) | | | 1.39 | % | | | 1.40 | % | | | 1.39 | % | | | 1.40 | % | | | 1.38 | % |
Ratio of net investment income to average net assets | | | 1.99 | %(a)(c) | | | 1.08 | %(a) | | | 0.99 | %(a) | | | 0.77 | %(a) | | | 0.59 | % | | | 0.93 | % |
Portfolio turnover rate | | | 10 | % | | | 21 | % | | | 20 | % | | | 20 | % | | | 18 | % | | | 12 | % |
| (a) | Includes the impact of refunded European tax reclaims. If these reclaims were not included the Net Investment Income per Share would have been $0.19, $0.19, $0.17 and $0.16 and the Ratio of Net Investment Income to Average Net Assets would have been 1.87%, 0.98%, 0.93% and 0.73% for the period ended September 30, 2024 and the years ending March 31, 2024, March 31, 2023 and March 31, 2022, respectively. |
| (b) | Total return represents aggregate total return for the periods indicated. |
| | | | |
| | |
| | SEE NOTES TO FINANCIAL STATEMENTS | | |
18
Tweedy, Browne Fund INC.
Financial Highlights
Tweedy, Browne Worldwide High Dividend Yield Value Fund
For a Fund share outstanding throughout each period/year.
| | | | | | | | | | | | | | | | | | | | | | | | |
| | | Six Months
Ended
9/30/2024
(Unaudited) | | | Year
Ended
3/31/2024 | | | Year
Ended
3/31/2023 | | | Year
Ended
3/31/2022 | | | Year
Ended
3/31/2021 | | | Year
Ended
3/31/2020 | |
Net asset value, beginning of period/year | | $ | 5.97 | | | $ | 5.57 | | | $ | 6.37 | | | $ | 7.76 | | | $ | 6.30 | | | $ | 8.51 | |
| | | | | | | | | | | | | | | | | | | | | | | | |
Income from investment operations: | | | | | | | | | | | | | | | | | | | | | | | | |
Net investment income | | | 0.11 | (a) | | | 0.14 | (a) | | | 0.14 | (a) | | | 0.19 | (a) | | | 0.14 | | | | 0.20 | |
Net realized and unrealized gain (loss) on investments | | | 0.21 | | | | 0.47 | | | | (0.32 | ) | | | (0.02 | ) | | | 1.94 | | | | (1.43 | ) |
| | | | | | | | | | | | | | | | | | | | | | | | |
Total from investment operations | | | 0.32 | | | | 0.61 | | | | (0.18 | ) | | | 0.17 | | | | 2.08 | | | | (1.23 | ) |
| | | | | | | | | | | | | | | | | | | | | | | | |
| | | | | | |
Distributions: | | | | | | | | | | | | | | | | | | | | | | | | |
Dividends from net investment income | | | (0.09 | ) | | | (0.13 | ) | | | (0.14 | ) | | | (0.20 | ) | | | (0.14 | ) | | | (0.19 | ) |
Distributions from net realized gains | | | — | | | | (0.08 | ) | | | (0.48 | ) | | | (1.36 | ) | | | (0.48 | ) | | | (0.79 | ) |
| | | | | | | | | | | | | | | | | | | | | | | | |
Total distributions | | | (0.09 | ) | | | (0.21 | ) | | | (0.62 | ) | | | (1.56 | ) | | | (0.62 | ) | | | (0.98 | ) |
| | | | | | | | | | | | | | | | | | | | | | | | |
Net asset value, end of period/year | | $ | 6.20 | | | $ | 5.97 | | | $ | 5.57 | | | $ | 6.37 | | | $ | 7.76 | | | $ | 6.30 | |
| | | | | | | | | | | | | | | | | | | | | | | | |
Total return(b) | | | 5.38 | % | | | 11.40 | % | | | (2.30 | )% | | | 1.97 | % | | | 33.80 | % | | | (17.06 | )% |
| | | | | | | | | | | | | | | | | | | | | | | | |
| | | | | | |
Ratios/Supplemental Data: | | | | | | | | | | | | | | | | | | | | | | | | |
Net assets, end of period/year (in 000s) | | $ | 68,496 | | | $ | 67,570 | | | $ | 69,870 | | | $ | 83,978 | | | $ | 111,800 | | | $ | 109,674 | |
Ratio of operating expenses to average net assets | | | 1.39 | %(c) | | | 1.39 | % | | | 1.38 | % | | | 1.34 | % | | | 1.37 | % | | | 1.36 | % |
Ratio of operating expenses to average net assets excluding waiver and/or reimbursements of expenses | | | 1.53 | %(c) | | | 1.50 | % | | | 1.48 | % | | | 1.48 | % | | | 1.45 | % | | | 1.42 | % |
Ratio of net investment income to average net assets | | | 3.49 | %(a)(c) | | | 2.56 | %(a) | | | 2.46 | %(a) | | | 2.26 | %(a) | | | 1.82 | % | | | 2.20 | % |
Portfolio turnover rate | | | 3 | % | | | 16 | % | | | 11 | % | | | 16 | % | | | 22 | % | | | 7 | % |
| (a) | Includes the impact of refunded European tax reclaims. If these reclaims were not included the Net Investment Income per Share would have been $0.10, $0.12, $0.13 and $0.17 and the Ratio of Net Investment Income to Average Net Assets would have been 3.30%, 2.30%, 2.21% and 2.04% for the period ended September 30, 2024 and the years ending March 31, 2024, March 31, 2023 and March 31, 2022, respectively. |
| (b) | Total return represents aggregate total return for the periods indicated. |
| | | | |
| | |
| | SEE NOTES TO FINANCIAL STATEMENTS | | |
19
Tweedy, Browne Fund INC.
Notes to Financial Statements (Unaudited)
1. Organization
Tweedy, Browne Fund Inc. (the “Company”) is an open-end management investment company registered with the United States Securities and Exchange Commission (“SEC”) under the Investment Company Act of 1940, as amended (the “1940 Act”). The Company was organized as a Maryland corporation on January 28, 1993. Tweedy, Browne International Value Fund (“International Value Fund”), Tweedy, Browne International Value Fund II – Currency Unhedged (“International Value Fund II – Currency Unhedged”), Tweedy, Browne Value Fund (“Value Fund”), and Tweedy, Browne Worldwide High Dividend Yield Value Fund (“Worldwide High Dividend Yield Value Fund”) (each a “Fund” and together, the “Funds”) are each a diversified series of the Company.
The Funds commenced operations as follows:
| | | | |
International Value Fund | | | 06/15/93 | |
International Value Fund II - Currency Unhedged | | | 10/26/09 | |
Value Fund | | | 12/08/93 | |
Worldwide Worldwide High Dividend Yield Value Fund | | | 09/05/07 | |
International Value Fund and International Value Fund II – Currency Unhedged seek long-term capital growth by investing primarily in foreign equity securities that Tweedy, Browne Company LLC (the “Investment Adviser”) believes are undervalued. Value Fund seeks long-term capital growth by investing primarily in U.S. and foreign equity securities that the Investment Adviser believes are undervalued. Worldwide High Dividend Yield Value Fund seeks long-term capital growth by investing primarily in U.S. and foreign equity securities that the Investment Adviser believes to have above-average dividend yields and valuations that are reasonable.
2. Significant Accounting Policies
The Funds are investment companies and, accordingly, follow the investment company accounting and reporting guidance of the Financial Accounting Standards Board Accounting Standards Codification Topic 946 – Investment Companies, which is part of U.S. generally accepted accounting principles (“U.S. GAAP”). The preparation of financial statements in accordance with U.S. GAAP requires management to make estimates and assumptions that affect the reported amounts and disclosures in the financial statements. Actual results could differ from those estimates. The following is a summary of significant accounting policies consistently followed by the Funds in the preparation of their financial statements.
Portfolio Valuation. Under normal circumstances, portfolio securities and other assets listed on a U.S. national securities exchange, comparable foreign securities exchange or through any system providing for contemporaneous
publication of actual prices (and not subject to restrictions against sale by the Fund on such exchange or system) are valued at the last quoted sale price at or prior to the close of regular trading on the New York Stock Exchange or, if applicable, the NASDAQ Official Closing Price (“NOCP”), unless, in the view of the Valuation Designee (the Investment Adviser has been appointed “Valuation Designee” by the Company’s Board of Directors), such price is not reliable, or there is significant market movement that calls for application of fair value factors provided by a third party, as described below. Under normal circumstances, portfolio securities and other assets that are readily marketable but for which there are no reported sales on the valuation date, whether because they are not traded in a system providing for same day publication of sales or because there were no sales reported on such date, are generally valued at the mean between the last asked price and the last bid price prior to the close of regular trading, unless, in the view of the Valuation Designee, such price is not reliable. Forward exchange contracts are valued at the forward rate. Securities and other assets for which current market quotations are not readily available, and those securities which are generally not readily marketable due to significant legal or contractual restrictions, are valued at fair value as determined in good faith by the Valuation Designee pursuant to the Company’s Valuation Policies and Procedures, which were approved by the Company’s Board of Directors. Securities and other assets for which the most recent market quotations may not be reliable (including because the last sale price does not reflect current market value at the time of valuing the Fund’s assets due to developments since such last price) may be valued at fair value if the Valuation Designee concludes that fair valuation will likely result in a more accurate net asset valuation. The Company has retained a third-party service provider that, under certain circumstances (including certain market movements) selected by the Company, provides fair value pricing for international equity securities whose principal markets are no longer open when the Funds calculate their net asset values. This means that a Fund’s net asset value may be based, at least in part, on prices other than those determined as of the close of the principal market in which such assets trade. The Funds’ use of fair value pricing may cause the net asset value of a Fund’s shares to differ from the net asset value that would be calculated using market quotations. Fair value pricing involves subjective judgments, and it is possible that the fair value determined for a security may be materially different than the value that could be realized upon the sale of that security. Under normal circumstances, debt securities purchased with a remaining maturity of more than 60 days are valued through pricing obtained by pricing services approved by the Valuation Designee. Debt securities purchased with a remaining maturity of 60 days or less are valued at amortized cost, unless the Valuation Designee determines, in good faith, that such value does not represent fair value, in which case the securities will be valued in the same manner as debt securities
20
Tweedy, Browne Fund INC.
Notes to Financial Statements (Unaudited)
with a remaining maturity in excess of 60 days or otherwise fair valued. Investments in open-end mutual funds are valued at net asset value (NAV) except that stable NAV money funds held in a cash sweep vehicle will generally be priced at cost ($1).
Fair Value Measurements. The inputs and valuation techniques used to determine fair value of the Funds’ investments are summarized into three levels as described in the hierarchy below:
| | |
• Level 1 – | | quoted prices in active markets for identical securities |
| |
• Level 2 – | | other significant observable inputs (including quoted prices for similar securities, interest rates, credit risk, etc.) |
| |
• Level 3 – | | significant unobservable inputs (including a Fund’s own assumptions in determining the fair value of investments) |
The inputs or methodology used for valuing securities are not necessarily an indication of the risk associated with investing in those securities. The following is a summary of the inputs used to value each Fund’s assets carried at fair value as of September 30, 2024. See each Fund’s respective Portfolio of Investments for details on portfolio holdings.
| | | | | | | | | | | | | | | | |
| International Value Fund | | Total Value at
September 30, 2024 | | | Level 1 Quoted Price | | | Level 2 Other Significant
Observable Inputs | | | Level 3 Significant
Unobservable
Inputs | |
Investments in Securities: | | | | | | | | | | | | | | | | |
Common Stocks | | | $5,420,478,380 | | | | $5,420,478,380 | | | | $ — | | | | $— | |
Preferred Stocks | | | 125,110,348 | | | | 125,110,348 | | | | — | | | | — | |
Registered Investment Company | | | 66,011,751 | | | | 66,011,751 | | | | — | | | | — | |
U.S. Treasury Bills | | | 74,799,493 | | | | — | | | | 74,799,493 | | | | — | |
| | | | |
Total Investments in Securities | | | 5,686,399,972 | | | | 5,611,600,479 | | | | 74,799,493 | | | | — | |
| | | | |
Other Financial Instruments: | | | | | | | | | | | | | | | | |
Asset | | | | | | | | | | | | | | | | |
Unrealized appreciation of forward exchange contracts | | | 10,828,979 | | | | — | | | | 10,828,979 | | | | — | |
Liability | | | | | | | | | | | | | | | | |
Unrealized depreciation of forward exchange contracts | | | (73,043,626) | | | | — | | | | (73,043,626) | | | | — | |
| | | | |
Total | | | $5,624,185,325 | | | | $5,611,600,479 | | | | $ 12,584,846 | | | | $— | |
| | | | |
| | | | |
| International Value Fund II - Currency Unhedged | | Total Value at
September 30, 2024 | | | Level 1 Quoted Price | | | Level 2 Other Significant
Observable Inputs | | | Level 3 Significant
Unobservable
Inputs | |
Investments in Securities: | | | | | | | | | | | | | | | | |
Common Stocks | | | | | | | | | | | | | | | | |
Canada | | | $ 9,905,382 | | | | $ 8,266,720 | | | | $ 1,638,662 | | | | $— | |
All Other Countries | | | 247,664,795 | | | | 247,664,795 | | | | — | | | | — | |
Preferred Stocks | | | 5,989,899 | | | | 5,989,899 | | | | — | | | | — | |
Registered Investment Company | | | 888,887 | | | | 888,887 | | | | — | | | | — | |
| | | | |
Total | | | $ 264,448,963 | | | | $ 262,810,301 | | | | $ 1,638,662 | | | | $— | |
| | | | |
21
Tweedy, Browne Fund INC.
Notes to Financial Statements (Unaudited)
| | | | | | | | | | | | | | | | |
| Value Fund | | Total Value at
September 30, 2024 | | | Level 1 Quoted Price | | | Level 2 Other Significant
Observable Inputs | | | Level 3 Significant
Unobservable
Inputs | |
Investments in Securities: | | | | | | | | | | | | | | | | |
Common Stocks | | | $ 431,363,012 | | | | $ 431,363,012 | | | | $ — | | | | $— | |
Preferred Stocks | | | 8,513,049 | | | | 8,513,049 | | | | — | | | | — | |
Registered Investment Company | | | 9,747,173 | | | | 9,747,173 | | | | — | | | | — | |
U.S. Treasury Bill | | | 3,969,325 | | | | — | | | | 3,969,325 | | | | — | |
| | | | |
Total Investments in Securities | | | 453,592,559 | | | | 449,623,234 | | | | 3,969,325 | | | | — | |
Other Financial Instruments: | | | | | | | | | | | | | | | | |
Asset | | | | | | | | | | | | | | | | |
Unrealized appreciation of forward exchange contracts | | | 550,964 | | | | — | | | | 550,964 | | | | — | |
Liability | | | | | | | | | | | | | | | | |
Unrealized depreciation of forward exchange contracts | | | (4,040,447) | | | | — | | | | (4,040,447) | | | | — | |
| | | | |
Total | | | $ 450,103,076 | | | | $ 449,623,234 | | | | $ 479,842 | | | | $— | |
| | | | |
| | | | |
| Worldwide High Dividend Yield Value Fund | | Total Value at
September 30, 2024 | | | Level 1 Quoted Price | | | Level 2 Other Significant
Observable Inputs | | | Level 3 Significant
Unobservable
Inputs | |
Investments in Securities: | | | $67,881,699 | | | | $67,881,699 | | | | $— | | | | $— | |
| | | | |
Foreign Currency. The books and records of the Funds are maintained in U.S. dollars. Foreign currencies, investments and other assets and liabilities are translated into U.S. dollars at the exchange rates prevailing at the end of the period, and purchases and sales of investment securities, income and expenses are translated on the respective dates of such transactions. Unrealized gains and losses from investments in securities that result from changes in foreign currency exchange rates, have been included in net unrealized appreciation/depreciation of securities. All other unrealized gains and losses that result from changes in foreign currency exchange rates have been included in net unrealized appreciation/depreciation of foreign currencies and net other assets. Net realized foreign currency gains and losses resulting from changes in exchange rates include foreign currency gains and losses between trade date and settlement date on investments, securities transactions, foreign currency transactions and the difference between the amounts of interest and dividends recorded on the books of a Fund and the amount actually received. The portion of foreign currency gains and losses related to fluctuation in the exchange rates between the initial purchase trade date and subsequent sale trade date is included in realized gains and losses on investment securities sold.
Forward Exchange Contracts. International Value Fund and Value Fund enter into forward exchange contracts for hedging purposes in order to reduce their exposure to fluctuations in foreign currency exchange on their portfolio holdings. Forward exchange contracts are valued at the forward rate and are marked-to-market daily. The change in market value is recorded by each Fund as an unrealized gain or loss on the Fund’s Statement of Operations. When the contract is closed, each Fund records a realized gain or loss on
the Statement of Operations equal to the difference between the value of the contract at the time that it was opened and the value of the contract at the time that it was closed. The difference between the value of a Fund’s open contracts at September 30, 2024 and the value of those contracts at the time they were opened is included on the Statement of Assets and Liabilities as unrealized appreciation of forward exchange contracts (for contracts with unrealized gains) or unrealized depreciation of forward exchange contracts (for contracts with unrealized losses). A Fund may be required to post collateral with respect to certain “non-deliverable” forward exchange contracts in an unrealized loss position, and may receive collateral from the counterparty for certain non-deliverable forward exchange contracts in an unrealized gain position. Collateral is usually in the form of cash or U.S. Treasury Bills. Daily movement of collateral is subject to minimum threshold amounts. Collateral posted by a Fund is held in a segregated account at the Fund’s custodian bank, and is reported on the Statement of Assets and Liabilities as Cash segregated as collateral. Collateral received by a Fund is held in escrow in the Fund’s custodian bank, and is not reported on the Fund’s Statement of Assets and Liabilities, but would be disclosed in Note 9.
The use of forward exchange contracts does not eliminate fluctuations in the underlying prices of the International Value Fund’s and Value Fund’s investment securities, but it does establish a rate of exchange that can be achieved in the future. Although forward exchange contracts limit the risk of loss due to a decline in the value of the hedged currency, they also limit any potential gain that might result should the value of the hedged currency increase. In addition, the International Value and Value Funds could be exposed to risks
22
Tweedy, Browne Fund INC.
Notes to Financial Statements (Unaudited)
if the counterparties to the contracts are unable to meet the terms of their contracts.
Securities Transactions and Investment Income. Securities transactions are recorded as of the trade date. Realized gains and losses from securities transactions are recorded on the identified cost basis. Dividend income and distributions to shareholders are recorded on the ex-dividend date. In the case of certain foreign securities, dividend income is recorded as soon after the ex-date as the Funds become aware of such dividend. Interest income and expenses are recorded on an accrual basis.
Foreign Taxes. The Funds may be subject to foreign taxes on dividend and interest income, gains on investments or currency purchase/repatriation, all or a portion of which may be recoverable. Each Fund applies for refunds where available. The Funds will accrue such taxes and recoveries as applicable, based on their current interpretation of tax rules and regulations that exist in the markets in which they invest.
As a result of several court rulings in certain European countries, the Funds may also file withholding tax reclaims in certain jurisdictions to recover all or a portion of amounts withheld in prior periods that may now be reclaimable. Any payments received on such withholding tax reclaims are included in Other Income in the Statements of Operations and are recorded when the amount is known and there are no significant uncertainties on collectability.
Dividends and Distributions to Shareholders. Dividends from net investment income, if any, will be declared and paid annually for International Value Fund, International Value Fund II – Currency Unhedged, and Value Fund and semi-annually for Worldwide High Dividend Yield Value Fund. Distributions from realized capital gains after utilization of capital loss carryforwards, if any, will be declared and paid annually for each of the Funds. Additional distributions of net investment income and capital gains from the Funds may be made at the discretion of the Board of Directors in order to avoid the application of a 4% non-deductible federal excise tax on certain undistributed amounts of ordinary income and capital gains. Income dividends and capital gain distributions are determined in accordance with income tax regulations which may differ from U.S. GAAP. These differences are primarily due to differing treatments of income and gains on various investment securities held by the Funds, timing differences and differing characterization of distributions made by the Funds.
Federal Income Taxes. Each Fund has qualified and intends to continue to qualify as a regulated investment company by complying with the requirements of the U.S. Internal Revenue Code of 1986, as amended (the “Code”), applicable to regulated investment companies and by distributing substantially all of its taxable income to its shareholders. Therefore, no federal income tax provision is required.
The Funds are not aware of any events that are reasonably possible to occur in the next twelve months that would result in the amounts of any unrecognized tax benefits significantly increasing or decreasing for the Funds. However, the Funds’ conclusions may be subject to future review based on changes in accounting standards or tax laws and regulations or the interpretation thereof. In addition, utilization of any capital loss carryforwards could be subject to limitations imposed by the Code related to share ownership changes. Each of the Funds’ tax positions for the tax years for which the applicable statutes of limitations have not expired are subject to examination by the Internal Revenue Service, state departments of revenue and by foreign tax authorities.
Expenses. Expenses directly attributable to each Fund as a diversified series of the Company are charged to such Fund. Other expenses of the Company are allocated to each series based on the average net assets of each series or other equitable allocation method.
3. Investment Advisory Fee, Other Related Party Transactions and Administration Fee
The Company, on behalf of each Fund, has entered into separate investment advisory agreements with the Investment Adviser (each, an “Advisory Agreement”). Under the Advisory Agreement with respect to International Value Fund, International Value Fund pays the Investment Adviser a fee at the annual rate of 1.25% on the Fund’s average daily net assets up to $10.3 billion, and 0.75% on the remaining amount, if any. Under the Advisory Agreements with respect to each of International Value Fund II – Currency Unhedged, Value Fund and Worldwide High Dividend Yield Value Fund, each Fund pays the Investment Adviser a fee at the annual rate of 1.25% of the Fund’s average daily net assets. The fee is payable monthly, provided that each Fund makes interim payments as may be requested by the Investment Adviser of up to 75% of the amount of the fee then accrued on the books of the Fund and unpaid. For the six months ended September 30, 2024, the Investment Adviser earned $36,414,468, $1,770,690, $2,837,166 and $418,370 in fees, prior to any waivers and/or reimbursements, from International Value Fund, International Value Fund II –Currency Unhedged, Value Fund and Worldwide High Dividend Yield Value Fund, respectively.
With respect to International Value Fund, the Investment Adviser has entered into a voluntary fee waiver agreement with the Fund pursuant to which the Investment Adviser is entitled to receive investment advisory fees from the Fund at an annual rate of 1.25% on the first $6 billion of the Fund’s average daily net assets, 0.80% on the next $1 billion of the Fund’s average daily net assets over $6 billion up to $7 billion, 0.70% on the next $1 billion of the Fund’s average daily net assets over $7 billion up to $8 billion, and 0.60% on the remaining amount, if any, of average daily net assets over $8 billion. This arrangement with International Value Fund will remain in place at least through July 31, 2025. For the six
23
Tweedy, Browne Fund INC.
Notes to Financial Statements (Unaudited)
months ended September 30, 2024 the Investment Adviser waived $4,563 in fees from International Value Fund.
With respect to International Value Fund II – Currency Unhedged, Value Fund and Worldwide High Dividend Yield Value Fund, the Investment Adviser has voluntarily agreed to waive a portion of each Fund’s investment advisory fees and/or reimburse a portion of each Fund’s expenses to the extent necessary to keep each Fund’s expense ratio in line with the expense ratio of International Value Fund. (For purposes of this calculation, each Fund’s acquired fund fees and expenses, brokerage costs, interest, taxes and extraordinary expenses are disregarded, and each Fund’s expense ratio is rounded to two decimal points.) This arrangement will remain in place at least through July 31, 2025. For the six months ended September 30, 2024, the Investment Adviser waived and/or reimbursed $9,828, $0 and $44,259 in fees from International Value Fund II – Currency Unhedged Fund, Value Fund and Worldwide High Dividend Yield Value Fund, respectively. No waivers are subject to recoupment by the Investment Adviser.
The Company pays the Investment Adviser for certain shareholder servicing and administration services provided to the Funds at an annual amount of $475,000, which is allocated pro-rata based on the relative average net assets of the Funds.
No officer, director or employee of the Investment Adviser, the Funds’ administrator, The Bank of New York Mellon (“BNY”) or any parent or subsidiary of those corporations receives any compensation from the Company for serving as a director or officer of the Company. The Company pays each Independent Director $149,000 annually, in quarterly increments of $37,250, plus out-of-pocket expenses for their services as directors. The Lead Independent Director receives an additional annual fee of $31,000 and the Audit Committee Chair receives an additional annual fee of $10,250. These fees are allocated pro-rata based on the relative average net assets of the Funds.
The Company, on behalf of the Funds, has entered into an administration agreement (the “Administration Agreement”) with BNY, a subsidiary of The Bank of New York Mellon Corporation. Under the Administration Agreement, the Company pays BNY an administration fee and a fund accounting fee computed daily and payable monthly at the following annual rates of the aggregate average daily net assets of the Funds, allocated according to each Fund’s net assets:
| | | | | | | | | | | | | | | | | | | | |
| | | Up to
$1 Billion | | Between
$1 Billion
and
$5 Billion | | Between
$5 Billion
and
$10 Billion | | Exceeding
$10 Billion |
Administration Fees | | | | 0.0300 | % | | | | 0.0180 | % | | | | 0.0100 | % | | | | 0.0090 | % |
Accounting Fees | | | | 0.0075 | % | | | | 0.0060 | % | | | | 0.0050 | % | | | | 0.0040 | % |
| | | | | | | | | | | | | | | | | | | | | |
BNY, serves as the Funds’ custodian pursuant to a custody agreement. BNY Investment Servicing (US) Inc., a subsidiary of The Bank of New York Mellon Corporation, serves as the Funds’ transfer agent.
AMG Distributors, Inc., an affiliate of the Investment Adviser, serves as the distributor to the Funds. The Investment Adviser pays all distribution-related expenses. No distribution fees are paid by the Funds.
At September 30, 2024, excluding unaffiliated platforms that hold shares of the Funds via omnibus accounts, the Funds are aware of one shareholders who collectively owned 13.0% of International Value Fund II – Currency Unhedged’s outstanding shares; three shareholders who collectively owned 38.6% of Value Fund’s outstanding shares; and three shareholders who collectively owned 34.5% of Worldwide High Dividend Yield Value Fund’s outstanding shares. Significant transactions by these shareholders could have an impact on each respective Fund.
4. Securities Transactions
The 1940 Act defines “affiliated companies” to include securities in which a fund owns 5% or more of the outstanding voting shares of an issuer. The following chart lists the issuers owned by International Value Fund that may be deemed “affiliated companies,” as well as transactions that occurred in the securities of such issuers during the six months ended September 30, 2024:
| | | | | | | | | | | | | | | | | | | | | | | | | | | | | | | | | | | | | | | | | | | | | |
Shares Held
at 3/31/24 | | Name of
Issuer† | | Value at
3/31/24 | | Purchase
Cost | | Sales
Proceeds | | Value at
9/30/24 | | Shares Held
at 9/30/24 | | Dividend
Income 4/1/24
to 9/30/24 | | Net Realized Gain
(Loss) 4/1/24
9/30/24 | | Change in
Net Unrealized
Appreciation
4/1/24 to
9/30/24 |
| | | 251,390 | | | Lassonde
Industries Inc,
Class A | | | $ | 27,634,788 | | | | $ | — | | | | $ | — | | | | $ | 32,983,365 | | | | | 251,390 | | | | $ | 369,000 | | | | $ | — | | | | $ | 5,348,577 | |
| | | 68,178 | | | Phoenix
Mecano AG,
Registered | | | | 34,516,674 | | | | | — | | | | | 2,788,137 | | | | | 33,941,034 | | | | | 63,203 | | | | | 1,692,358 | | | | | 162,605 | | | | | 2,049,892 | |
| | | | | | | | | $ | 62,151,462 | | | | $ | — | | | | $ | 2,788,137 | | | | $ | 66,924,399 | | | | | | | | | $ | 2,061,358 | | | | $ | 162,605 | | | | $ | 7,398,469 | |
| | | | | | | | | | | | | | | | | | | | | | | | | | | | | | | | | | | | | | | | | | | | | | |
24
Tweedy, Browne Fund INC.
Notes to Financial Statements (Unaudited)
| † | Issuer countries: Canada and Switzerland, respectively. |
None of the other Funds owned 5% or more of the outstanding voting shares of any issuer.
The cost of purchases and proceeds from sales of investment securities, excluding short-term investments and in-kind transactions, for the six months ended September 30, 2024, are as follows:
| | | | | | | | | | | | | | | | | | | | |
| | | | | |
| | | International Value
Fund | | International Value
Fund II - Currency
Unhedged | | Value
Fund | | Worldwide High
Dividend Yield
Value Fund |
Purchases | | | $ | 562,669,558 | | | | $ | 17,450,389 | | | | $ | 43,354,856 | | | | $ | 2,142,331 | |
Sales | | | $ | 612,546,064 | | | | $ | 94,603,001 | | | | $ | 48,890,033 | | | | $ | 3,690,709 | |
| | | | | | | | | | | | | | | | | | | | | |
5. Capital Stock
The Company is authorized to issue 2.0 billion shares of $0.0001 par value capital stock, of which 600,000,000, 600,000,000, 400,000,000 and 400,000,000 shares have been designated as shares of International Value Fund, International Value Fund II – Currency Unhedged, Value Fund and Worldwide High Dividend Yield Value Fund, respectively. Changes in shares outstanding were as follows:
| | | | | | | | | | | | | | | | | | | | |
| | |
| | | Six Months Ended
September 30, 2024 | | Year Ended
March 31, 2024 |
| | | | |
| International Value Fund | | Shares | | Amount | | Shares | | Amount |
| Sold | | | | 8,113,038 | | | | | $ 236,744,650 | | | | | 15,734,457 | | | | | $ 432,290,114 | |
| Reinvested | | | | — | | | | | — | | | | | 8,732,229 | | | | | 231,229,310 | |
Redeemed | | | | (23,575,017 | ) | | | | (687,595,931 | ) | | | | (39,240,907 | ) | | | | (1,077,579,491 | ) |
Net Decrease | | | | (15,461,979 | ) | | | | $ (450,851,281 | ) | | | | (14,774,221 | ) | | | | $ (414,060,067 | ) |
| | | | | | | | | | | | | | | | | | | | | |
| | | | |
| | | | | | | | | | | | | | | | | | | | |
| | | | |
| International Value Fund II – Currency Unhedged | | Shares | | Amount | | Shares | | Amount |
| Sold | | | | 439,158 | | | | | $ 7,912,358 | | | | | 1,067,570 | | | | | $ 17,829,778 | |
| Reinvested | | | | — | | | | | — | | | | | 331,813 | | | | | 5,411,870 | |
Redeemed | | | | (5,967,847 | ) | | | | (105,525,541 | ) | | | | (9,027,513 | ) | | | | (149,767,832 | ) |
Net Decrease | | | | (5,528,689 | ) | | | | $ (97,613,183 | ) | | | | (7,628,130 | ) | | | | $ (126,526,184 | ) |
| | | | | | | | | | | | | | | | | | | | | |
| | | | |
| | | | | | | | | | | | | | | | | | | | |
| | | | |
| Value Fund | | Shares | | Amount | | Shares | | Amount |
| Sold | | | | 463,601 | | | | | $ 9,013,609 | | | | | 500,549 | | | | | $ 9,483,884 | |
| Reinvested | | | | — | | | | | — | | | | | 1,667,355 | | | | | 29,812,307 | |
Redeemed | | | | (1,246,462 | ) | | | | (24,389,473 | ) | | | | (2,042,759 | ) | | | | (38,256,365 | ) |
Net Increase (Decrease) | | | | (782,861 | ) | | | | $ (15,375,864 | ) | | | | 125,145 | | | | | $ 1,039,826 | |
| | | | | | | | | | | | | | | | | | | | | |
| | | | |
| | | | | | | | | | | | | | | | | | | | |
| | | | |
| Worldwide High Dividend Yield Value Fund | | Shares | | Amount | | Shares | | Amount |
| Sold | | | | 155,799 | | | | | $949,383 | | | | | 146,668 | | | | | $820,636 | |
| Reinvested | | | | 141,950 | | | | | 830,409 | | | | | 427,198 | | | | | 2,344,546 | |
Redeemed | | | | (556,365 | ) | | | | (3,338,434 | ) | | | | (1,807,112 | ) | | | | (10,091,149 | ) |
Net Decrease | | | | (258,616 | ) | | | | $ (1,558,642 | ) | | | | (1,233,246 | ) | | | | $ (6,925,967 | ) |
| | | | | | | | | | | | | | | | | | | | | |
6. Liquidity
ReFlow Fund LLC — The Funds may participate in the ReFlow Fund LLC liquidity program (“ReFlow”), which is designed to provide an alternative liquidity source for funds experiencing redemptions. In order to pay cash to shareholders who redeem their shares on a given day, a fund typically must hold cash in its portfolio, liquidate portfolio securities, or borrow money. ReFlow provides participating funds with another source of cash by standing ready to purchase shares from a fund up to the amount of the fund’s net redemptions on a given day, cumulatively limited to 3% of the outstanding voting shares of a Fund, or a total investment amount of $85,000,000 in any one Fund at any one time. ReFlow then generally redeems those shares (in cash or in-kind) when the Fund experiences net sales, at the end of a maximum holding period determined by ReFlow, or at other times at ReFlow’s discretion. In return for this service, the Fund will pay a fee to ReFlow at a rate determined by a daily auction with other participating mutual funds.
During the six months ended September 30, 2024, the following Funds utilized ReFlow. The shares ReFlow subscribed to and redemptions-in-kind were as follows:
25
Tweedy, Browne Fund INC.
Notes to Financial Statements (Unaudited)
| | | | | | | | | | | | | | | |
Fund | | Shares ReFlow Subscribed to | | Redemptions-in-kind | | Service Fees |
International Value Fund | | | | 3,806,391 | | | | $ | 104,407,881 | | | | $ | 155,547 | |
International Value Fund II - Currency Unhedged | | | | 173,098 | | | | | 2,823,263 | | | | | 4,420 | |
Value Fund | | | | 329,405 | | | | | 6,091,764 | | | | | 8,953 | |
Worldwide High Dividend Yield Value Fund | | | | 37,819 | | | | | 222,368 | | | | | 327 | |
7. Income Tax Information
As of March 31, 2024, the Funds did not have any capital loss carryforwards.
As of September 30, 2024, the aggregate cost of securities in each Fund’s portfolio for federal tax purposes is as follows:
| | | | |
International Value Fund | | | $3,151,618,139 | |
International Value Fund II - Currency Unhedged | | | $188,430,246 | |
Value Fund | | | $285,135,972 | |
Worldwide Worldwide High Dividend Yield Value Fund | | | $49,047,331 | |
| | | | | |
The aggregate gross unrealized appreciation/depreciation and net unrealized appreciation as computed on a federal income tax basis at September 30, 2024 for each Fund is as follows:
| | | | | | | | | | | | |
| | | Gross
Appreciation | | | Gross
Depreciation | | | Net
Appreciation | |
International Value Fund | | | $2,627,284,954 | | | | $(92,503,121 | ) | | | $2,534,781,833 | |
International Value Fund II—Currency Unhedged | | | 88,543,684 | | | | (12,524,967 | ) | | | 76,018,717 | |
Value Fund | | | 177,902,856 | | | | (9,446,269 | ) | | | 168,456,587 | |
Worldwide High Dividend Yield Value Fund | | | 22,567,314 | | | | (3,732,946 | ) | | | 18,834,368 | |
| | | | | | | | | | | | | |
8. Foreign Securities and Certain Other Risks
Investing in foreign securities involves additional risks beyond those associated with investing in U.S. securities. These risks, which are more pronounced in emerging markets, include changes in exchange rates and exchange rate controls (which may include suspension of the ability to transfer currency from a given country); costs incurred in conversions between currencies; non-negotiable brokerage commissions; less publicly available information; not generally being subject to uniform standards, practices and requirements with respect to accounting, auditing and financial reporting; lower trading volume and/or liquidity; delayed settlements; greater market volatility; the difficulty in enforcing obligations and contractual and other rights; less securities regulation; different tax provisions (including withholding on interest and dividends paid to a Fund); less well established contract law; war; seizure; political and social instability; and diplomatic developments.
Each Fund may invest in securities of Chinese issuers. Investments in securities of companies domiciled in the People’s Republic of China (“China”) involve a high degree of risk and special considerations not typically associated with
investing in other foreign or emerging securities markets. Such heightened risks include, among others: (a) military conflicts; (b) an authoritarian government, which, despite reforms and privatizations of companies in certain sectors, still exercises substantial influence over many aspects of the private sector, resulting in risks of losses due to expropriation, nationalization, confiscation of assets and property, and the imposition of restrictions on foreign investments and on repatriation of capital invested; (c) less regulatory oversight of issuers, brokers and other market participants; (d) currency risks associated with the Chinese Renminbi, including possible liquidity disruptions and the interference with conversion rights; (e) tax rules; (f) less rigorous accounting, auditing and financial reporting standards and practices than international accounting standards, which may result insignificant differences in the preparation of financial statements; and (g) to the extent investments are made through Stock Connect, a program that allows non-Chinese investors to invest in Chinese stocks and China A-Shares, substantial limitations imposed by the program, including, among other things, market wide quota limitations, new technologies risks, bans on day-trading, different trading holidays, and the sudden loss of a security’s eligibility to trade in the program.
Each Fund invests a significant portion of its assets insecurities of issuers located in Europe. The European financial markets have experienced, and may continue to experience, severe economic and financial difficulties, including risks associated with high levels of debt and negative interest rates. Among other things, these developments have adversely affected the value and exchange rate of the Euro and other currencies, and may continue to significantly affect the economies of European countries, which in turn may have a material adverse effect on the Funds’ investments in such countries, other countries that depend on European countries for significant amounts of trade or investment, or issuers with exposure to debt issued by certain European countries, particularly to the extent a Fund does not hedge its exposure to foreign currency.
Actions taken by European governments, central banks and others, including austerity measures and reforms, may not work, may result in social unrest, and may limit future growth and economic recovery or have other unintended consequences. In addition, the United Kingdom has withdrawn from the European Union, and one or more other countries may withdraw from the European Union and/or abandon the Euro, the common currency of the European Union, in the future, which would have significant
26
Tweedy, Browne Fund INC.
Notes to Financial Statements (Unaudited)
implications and could negatively affect the value and liquidity of the Funds’ investments.
Certain of the Fund’s investments may operate in, or have dealings with, countries subject to sanctions or embargos imposed by the U.S. government, foreign governments, or the United Nations or other international organizations. For example, the ongoing conflict due to Russia’s invasion of Ukraine, the ongoing conflict in the Middle East, and the rapidly evolving measures in response could be expected to have a negative impact on the economy and business activity globally (including in the countries in which the Funds invest). The severity and duration of these conflicts and their impact on global economic and market conditions are impossible to predict, and as a result, present material uncertainty and risk with respect to the Funds and their investments and operations, and the ability of the Funds to achieve their investment objectives.
The occurrence of events similar to those in recent years, such as localized wars, instability, new and ongoing pandemics(such as COVID-19), epidemics or outbreaks of infectious diseases in certain parts of the world, and catastrophic events such as fires, floods, earthquakes, tornadoes, hurricanes and global health epidemics, terrorist attacks in the U.S. and around the world, social and political discord, debt crises sovereign debt downgrades, increasingly strained relations between the U.S. and a number of foreign countries, new and continued political unrest in various countries, the exit or potential exit of one or more countries from the EU or the EMU, continued changes in the balance of political power among and within the branches of the U.S. government, government shutdowns, among others, may result in market volatility, may have long term effects on the U.S. and worldwide financial markets, and may cause further economic uncertainties in the U.S. and worldwide.
Investments in a fund which purchases value-oriented stocks as its guiding principle involve special risks. The Funds offer investors the opportunity to invest in a diversified portfolio of securities whose market prices may be well below the stocks’ intrinsic values at time of purchase. The Adviser may be wrong in its assessment of a company’s value, and the stocks owned by a Fund may not reach what the Adviser believes are their true or intrinsic values. The market may not favor value-oriented stocks and may not favor equities at all, which may cause a Fund’s relative performance to suffer. There may be periods during which a Fund is unable to find securities that meet its value investment criteria. If a Fund is selling investments or experiencing net subscriptions during those periods, the Fund could have a significant cash position, which could adversely impact the Fund’s performance under certain market conditions and could make it more difficult for the Fund to achieve its investment objective.
9. Derivative Instruments
During the six months ended September 30, 2024, International Value Fund and Value Fund had derivative
exposure to forward foreign currency exchange contracts. The primary underlying risk exposure for these derivatives is foreign currency risk. International Value Fund II – Currency Unhedged and Worldwide High Dividend Yield Value Fund had no exposure to derivatives. For open contracts at September 30, 2024, see the Portfolio of Investments.
The following table summarizes the volume of the International Value and Value Funds’ forward foreign currency exchange contract activity during the six months ended September 30, 2024:
| | | | | | | | | | |
| | | International Value Fund | | Value Fund |
Average Notional Amount Purchased | | | | $149,213,903 | | | | | $8,882,233 | |
Average Notional Amount Sold | | | | $2,994,909,428 | | | | | $2,266,887,305 | |
Notional Amount Purchased at September 30, 2024 | | | | $89,910,401 | | | | | $2,332,687 | |
| Notional Amount Sold at September 30, 2024 | | | | $2,922,792,832 | | | | | $155,934,134 | |
The following table presents the value of derivatives held as of September 30, 2024, by their respective location on the Statements of Assets and Liabilities:
| | | | | | | | | | | | |
Statement of Assets and Liabilities |
Derivative | | Assets Location | | International Value Fund | | Value Fund |
Forward
exchange
contracts | | Unrealized appreciation of forward exchange contracts | | | | $10,828,979 | | | | | $550,964 | |
| | | | | | | | | | | | | |
| | | | | | | | | | | | | |
Derivative | | Liabilities
Location | | International Value Fund | | Value Fund |
Forward exchange contracts | | Unrealized depreciation of forward exchange contracts | | | | $73,043,626 | | | | | $4,040,447 | |
| | | | | | | | | | | | | |
The following table presents the effect of derivatives on the Statements of Operations for the six months ended September 30, 2024:
| | | | | | | | | | | | |
Statement of Operations |
Derivative | | Location | | International Value Fund | | Value Fund |
Forward exchange contracts | | Net realized gain (loss) on forward exchange contracts | | | | $20,756,661 | | | | | $2,018,308 | |
| | | | | | | | | | | | | |
| | | | | | | | | | | | | |
Derivative | | Location | | International Value Fund | | Value Fund |
Forward exchange contracts | | Net change in unrealized appreciation (depreciation) of forward exchange contracts | | | | $(110,062,208) | | | | | $(6,566,123) | |
| | | | | | | | | | | | | |
27
Tweedy, Browne Fund INC.
Notes to Financial Statements (Unaudited)
For financial reporting purposes, the Funds do not offset assets and liabilities across derivative types that are subject to master netting arrangements on the Statements of Assets and Liabilities.
The following table presents derivative assets net of amounts available for offset under a master netting agreement for forward currency contracts as of September 30, 2024:
| | | | | | | | | | | | | | | | |
| Counterparty | | Derivative
Assets – Gross(a) | | | Derivatives
Available for Offset | | | Collateral Received | | | Derivative
Assets – Net(b) | |
| | | |
International Value Fund | | | | | | | | | | | | | |
| | | | |
BNY | | | $4,401,651 | | | | $3,972,952 | | | | $— | | | | $428,699 | |
| | | | |
JPM | | | 2,735,392 | | | | 2,735,392 | | | | — | | | | — | |
| | | | |
NTC | | | 1,934,605 | | | | 1,934,605 | | | | — | | | | — | |
| | | | |
SSB | | | 1,757,331 | | | | 1,757,331 | | | | — | | | | — | |
| | | | |
Total | | | $10,828,979 | | | | $10,400,280 | | | | $— | | | | $428,699 | |
| | | | | | | | | | | | | | | | | |
| | | | |
Value Fund | | | | | | | | | | | | | | | | |
| | | | |
BNY | | | $68,894 | | | | $68,894 | | | | $— | | | | $— | |
| | | | |
JPM | | | 257,629 | | | | 257,629 | | | | — | | | | — | |
| | | | |
NTC | | | 84,468 | | | | 84,468 | | | | — | | | | — | |
| | | | |
SSB | | | 139,973 | | | | 139,973 | | | | — | | | | — | |
| | | | |
Total | | | $550,964 | | | | $550,964 | | | | $— | | | | $— | |
| | | | | | | | | | | | | | | | | |
The following table presents derivative liabilities net of amounts available for offset under a master netting agreement for forward currency contracts as of September 30, 2024:
| | | | | | | | | | | | | | | | |
| Counterparty | | Derivative
Liabilities – Gross(a) | | | Derivatives
Available for Offset | | | Collateral
Posted | | | Derivative
Liabilities – Net(c) | |
| | | |
International Value Fund | | | | | | | | | | | | | |
| | | | |
BNY | | | $3,972,952 | | | | $3,972,952 | | | | $— | | | | $— | |
| | | | |
JPM | | | 18,496,316 | | | | 2,735,392 | | | | 400,000 | | | | 15,360,924 | |
| | | | |
NTC | | | 29,920,091 | | | | 1,934,605 | | | | — | | | | 27,985,486 | |
| | | | |
SSB | | | 20,654,267 | | | | 1,757,331 | | | | 1,720,000 | | | | 17,176,936 | |
| | | | |
Total | | | 73,043,626 | | | | 10,400,280 | | | | 2,120,000 | | | | 60,523,346 | |
| | | | | | | | | | | | | | | | | |
| | | |
Value Fund | | | | | | | | | | | | | |
| | | | |
BNY | | | $758,808 | | | | $68,894 | | | | $— | | | | $689,914 | |
| | | | |
JPM | | | 542,113 | | | | 257,629 | | | | — | | | | 284,484 | |
| | | | |
NTC | | | 968,985 | | | | 84,468 | | | | — | | | | 884,517 | |
| | | | |
SSB | | | 1,770,541 | | | | 139,973 | | | | — | | | | 1,630,568 | |
| | | | |
Total | | | 4,040,447 | | | | 550,964 | | | | — | | | | 3,489,483 | |
| | | | | | | | | | | | | | | | | |
| (a) | As presented in the Statement of Assets and Liabilities. |
| (b) | Net amount represents the net receivable due from counterparty in the event of default. |
| (c) | Net amount represents the net payable due to counterparty in the event of default. |
Counterparty Abbreviations:
| | | | | | |
| BNY | | | — | | | The Bank of New York Mellon |
| JPM | | | — | | | JPMorgan Chase Bank NA |
| NTC | | | — | | | Northern Trust Company |
| SSB | | | — | | | State Street Bank and Trust Company |
10. Committed Line of Credit
The Company, acting on behalf of and for the account of each Fund, has entered into a line of credit agreement with BNY (the “Credit Agreement”) that established are volving credit facility of $75,000,000 (the “Facility”) that may be used by the Funds for certain temporary or emergency purposes, including the meeting of redemption requests. Each Fund pays a commitment fee of 0.25% per annum on its pro rata share of the unused portion of the committed line. The interest rate on borrowing under the Credit Agreement is the higher of the Federal Funds Effective Rate or the secured overnight financing rate (SOFR) plus applicable margin of 1.25%. The Facility has a 364-day term currently in effect through April 16, 2025.
During the six months ended September 30, 2024, the International Value Fund II – Currency Unhedged Fund had loans outstanding for thirteen calendar days at a weighted average interest rate and average dollar amount of borrowings on days a loan was outstanding of 6.59% and $4,900,000, respectively. No other Funds borrowed under the Credit Agreement during the period. As of September 30, 2024, there were no loans outstanding with respect to the Credit Agreement.
11. Indemnifications
Under the Company’s organizational documents, its directors and officers are indemnified against certain liabilities that may arise out of the performance of their duties to the Funds. Additionally, in the course of business, the Company enters into contracts that contain a variety of indemnification clauses. The Funds’ maximum exposure under these arrangements is unknown, as this would involve future claims that may be made against the Funds that have not yet occurred. However, the Investment Adviser believes the risk of loss under these arrangements to be remote.
28
TWEEDY, BROWNE FUND INC.
Other Information (Unaudited)
| 1. | Investment in the Funds by Managing Directors and Employees of the Investment Adviser |
As of September 30, 2024, the current and retired managing directors and their families, as well as employees of the Investment Adviser, have approximately $113.8 million, $5.2 million, $66.3 million and $6.6 million of their own money invested in International Value Fund, International Value Fund II – Currency Unhedged, Value Fund and Worldwide High Dividend Yield Value Fund, respectively.
The Company files each Fund’s complete schedule of portfolio holdings with the SEC for the first and third quarters of each fiscal year on Part F of Form N-PORT. The Company’s Part F of Form N-PORT is available (1) on the SEC’s website at www.sec.gov; (2) for review and copying at the SEC’s Public Reference Room (“PRR”) in Washington, DC; or (3) by calling the Fund at 800-432-4789. Information regarding the operation of the PRR may be obtained by calling 202-551-8090.
| 3. | Proxy Voting Information |
The policies and procedures that the Company uses to determine how to vote proxies relating to portfolio securities held by the Funds are included in the Company’s Statement of Additional Information, which is available without charge and upon request by calling the Funds at 800-432-4789 or by visiting the Funds’ website at www.tweedyfunds.com. Information regarding how the Funds voted proxies relating to portfolio securities during the most recent twelve-month period ended June 30 is available, without charge, at www.sec.gov.
Approval of the Renewal of the Investment Advisory Agreement for Each Fund
On May 22, 2024, the Board of Directors (the “Board”) of Tweedy, Browne Fund Inc. (the “Company”), including a majority of the Independent Directors, approved the renewal of the Investment Advisory Agreements (the “Advisory Agreements”) between Tweedy, Browne Company LLC (“Tweedy, Browne” or the “Adviser”) and the Company on behalf of the Tweedy, Browne International Value Fund (the “International Value Fund”), the Tweedy, Browne Value Fund (the “Value Fund”), the Tweedy, Browne Worldwide High Dividend Yield Value Fund (the “Worldwide High Dividend Yield Value Fund”) and the Tweedy, Browne International Value Fund II – Currency Unhedged (the “International Value Fund II”) (each a “Fund” and collectively, the “Funds”) for an additional one-year term. In considering whether to approve the continuation of the Advisory Agreements, the Board reviewed materials provided for its evaluation, and the Independent Directors were advised by independent legal counsel with respect to these and other relevant matters. The
information, material factors and conclusions that formed the basis for the Board’s approval are described below.
In considering whether to approve the renewal of the Advisory Agreements, the Board took into account the written materials, oral presentations and other information received throughout the year and carefully reviewed the specific materials provided in advance of the meeting, which included a Memorandum from independent legal counsel regarding the duties and standards of review in connection with the consideration of the continuation of the Advisory Agreements; a narrative discussion prepared by Tweedy, Browne describing factors relevant to the 2024 contract renewal process; comparative information regarding the performance, fees and expense ratios of the Funds (including breakpoint and expense limitation agreements); information for several of Tweedy, Browne’s managed account performance composites; a sample report illustrating Tweedy, Browne’s extensive research process; fact sheets and performance histories for each of the Funds since inception; fee schedules; a memorandum from Management Practice, Inc. (“Management Practice”), a third party that specializes in advising mutual fund boards of directors on fund pricing and performance metrics that had been engaged by the Independent Directors to provide independent information regarding, among other things, the Funds’ performance and fee arrangements relative to certain industry peers; memoranda and related information from Tweedy, Browne concerning Tweedy, Browne’s brokerage practices and best execution policy; a description of key personnel of Tweedy, Browne; a profitability analysis of Tweedy, Browne; Statements of Financial Condition for Tweedy, Browne; the Form ADV of Tweedy, Browne; and copies of the Advisory Agreements. The Board also considered information regarding Tweedy, Browne’s business continuity and disaster recovery plans and cybersecurity procedures. The Board examined the detailed materials provided by Tweedy, Browne for its evaluation and the Management Practice memorandum, and the Independent Directors were advised by Dechert LLP, their independent legal counsel, and met in executive sessions, including on the day of the meeting, and throughout the year since the Board’s last consideration of the investment advisory agreements, at which no representatives of management were present with respect to these and other relevant matters.
| B. | Nature, Extent and Quality of the Services Provided Under the Advisory Agreements |
Among the factors considered by the Board as part of its review, the Board considered the nature, extent and quality of the services provided by Tweedy, Browne to the Funds. In examining Tweedy, Browne’s management of the Funds’ portfolios, the Board reviewed the narrative discussion provided by Tweedy, Browne, which includes a description of Tweedy, Browne’s fees, performance, research process and
29
TWEEDY, BROWNE FUND INC.
Other Information (Unaudited)
investment approach. The Board also considered comparative information regarding the Funds’ performance and fee structures relative to certain industry peers prepared by Management Practice.
The Board assessed the variety of services provided by Tweedy, Browne to the Funds, including: the experience, reputation and skills of Tweedy, Browne management and staff; the extensive shareholder communications provided by Tweedy, Browne; “behind the scenes” services, such as those provided by Tweedy, Browne’s order desk, which seeks best execution for transactions effected on behalf of the Funds; monitoring of the Funds’ service providers and the performance in certain instances of shadowing functions; implementing and monitoring, as appropriate, business continuity planning matters related to the Funds and their service providers; monitoring of information with respect to corporate reorganizations involving portfolio companies; preparing the Funds’ semi-annual and annual reports to shareholders and the accompanying Adviser’s letters; monitoring of aspects of transfer agency services on a daily basis; assisting brokers, consultants, financial advisors, intermediaries and third-party administrators with questions or problems of an operational nature; integrating certain environmental, social, and governance (ESG) considerations into the investment and valuation processes; developing and enforcing procedures to monitor trading activity in the Funds; monitoring Schedule 13D-like filing requirements in the various foreign jurisdictions in which the Funds are currently invested; arranging for proxy voting of portfolio securities; qualifying the Funds as approved purchasers in certain foreign jurisdictions; where necessary, consulting with an outside accounting firm with respect to the proper treatment of corporate actions and accounting requirements; and actively monitoring and assessing valuation issues for the Funds. The Board noted the substantial personal investment by the members of the Adviser’s Investment Committee in the Funds, which may encourage an alignment of management’s interests with the interests of Fund shareholders. The Board also noted actions that have been or will be taken in the future by Tweedy, Browne to comply with various regulatory requirements, including consulting with outside accounting and law firms as needed in this regard.
In addition, the Board noted that Tweedy, Browne provides a variety of administrative services not otherwise provided by the Funds’ third-party service providers, including: overseeing elements of the calculation of the Funds’ net asset value; preparing Board reports; overseeing the preparation and submission of regulatory filings; overseeing and assisting in the annual audit of the Funds’ financial statements; maintaining the Funds’ website; assisting with the preparation and filing of the Funds’ tax returns; monitoring the registration of shares of the Funds under applicable federal and state securities laws; assisting in the resolution of accounting and legal issues; establishing and monitoring the Funds’ operating budgets; coordinating the approval, review
and processing of payment of the Funds’ bills; assisting the Funds in, and otherwise arranging for, the payment of distributions and dividends; serving as the administrator of the Funds’ Liquidity Risk Management Program; communicating with the Funds’ shareholders with market commentary; participating in ongoing training and monitoring of BNY Mellon’s shareholder services representatives; and generally assisting each Fund in the conduct of its business. The Board also noted that certain officers and employees of Tweedy, Browne devote substantial time and effort to shareholder servicing efforts.
The Board discussed with management various matters relating to Tweedy, Browne’s ability to continue to provide high quality advisory and administrative services to the Funds, including staffing and personnel turnover, succession, long-term planning and contingency planning at Tweedy, Browne. In particular, the Board noted that the members of Tweedy, Browne’s Management Committee (Jay Hill, Thomas Shrager, John Spears, and Robert Wyckoff) have worked at Tweedy, Browne for between 21 and 50 years, that several long-serving employees of Tweedy, Browne have been promoted to the position of managing director, and that Tweedy, Browne generally maintained a consistent management approach that was facilitated by the very low personnel turnover at the firm. The Board considered previous industry awards and nominations received by Tweedy, Browne. The Board discussed with management the efforts of Tweedy, Browne to establish and implement succession plans for management.
In considering Tweedy, Browne’s services in managing the Funds’ portfolios and overseeing all aspects of the Funds’ business, the Board concluded that Tweedy, Browne was providing essential services to the Funds and that Tweedy, Browne likely will continue to be in a position to do so for the long-term.
The Board reviewed each Fund’s performance, both in absolute terms and relative to the various benchmarks against which the Funds were compared. To help evaluate each Fund’s relative peer performance, the Board considered the performance information as of December 31, 2023 contained in the Management Practice memorandum as well as the performance information prepared by Tweedy, Browne as of December 31, 2023, February 29, 2024, and March 31, 2024. The Board weighed the performance each Fund achieved in light of each Fund’s investment objective, strategies and risks as disclosed to investors in the Company’s registration statement.
With respect to the International Value Fund, the Board considered the Adviser’s analysis that the Fund, notwithstanding certain periods of disappointing performance, had exhibited excellent absolute and relative performance; that the Fund’s annualized rate of return was 8.41% (net of all fees and expenses) from its inception
30
TWEEDY, BROWNE FUND INC.
Other Information (Unaudited)
through February 29, 2024; and that the Fund’s annualized rate of return had exceeded the annualized returns of the MSCI EAFE Index (Hedged to U.S. $) by 1.62 percentage points and the MSCI EAFE Index (in U.S. $) by 3.05 percentage points for that period.1 The Board took into account that the International Value Fund has a policy to seek to hedge its perceived non-U.S. currency exposure, to the extent practicable, back to the U.S. dollar, and thus considered the Fund’s total returns against the returns of its primary benchmark, the MSCI EAFE Index (Hedged to U.S. $), noting that the Fund outperformed that index as of March 31, 2024 since inception and for the 30-year period. The Board also considered that the International Value Fund had underperformed the MSCI EAFE Index (Hedged to U.S. $) for the 1-year, 3-year, 5-year, 10-year, 15-year, and 20-year periods ended March 31, 2024. The Board took into account that the International Value Fund underperformed the MSCI EAFE Index (Hedged to U.S. $) year-to-date through March 31, 2024 by 5.28 percentage points and underperformed the MSCI EAFE Index (in U.S.$) during the same period by 0.55 percentage points. The Board also noted that the International Value Fund had outperformed the MSCI EAFE Index (Hedged to U.S. $) in 16 out of the last 30 calendar years. The Board considered Tweedy, Browne’s analysis that, over the long-term, the International Value Fund had enjoyed favorable performance when compared to other funds in its peer group. In addition, the Board noted that for the past 3-year, 5-year and 10-year periods, the International Value Fund has been categorized as “Low Risk” by Morningstar’s Risk Ratings, which means it is in the top 10% of funds within its category with respect to lowest measured risk.
The Board took into account the fact that the International Value Fund closed to new investors in May 2005 and reopened in January 2008 when Tweedy, Browne believed that the economic landscape provided new investment opportunities and would offer attractive discounts from intrinsic value estimates.
The Board reviewed the Value Fund’s performance, including the Fund’s relative and absolute performance since its inception through February 29, 2024. The Board observed that the Fund’s annualized rate of return since its inception had been 7.85%, underperforming its primary benchmark, the MSCI World Index (Hedged to U.S. $) and a combined index of the S&P 500 Index and MSCI World Index (Hedged to U.S. $) (the “combined index”) by 0.52 percentage points and 1.2 percentage points, respectively, during that period.2 The Board also considered that the Fund had underperformed each of the MSCI World Index (Hedged to U.S. $) and
combined index in each of the 1-year, 3-year, 5-year, 10-year, 15-year, 20-year, 30-year and since inception periods ended March 31, 2024. The Board considered that the Fund underperformed its primary and combined index year-to-date through March 31, 2024 each by 4.73 percentage points.
The Board took into consideration the Adviser’s analysis that the Value Fund has exhibited good performance over the long-term and has withstood periods of relative underperformance. For example, the Board noted that in calendar year 2008, the Value Fund lost 24.37%, while the S&P 500 lost 37% and the MSCI World Index (Hedged to U.S. $) lost 38.45%. The Board observed that the Fund’s ability to hold up so well on a relative basis in 2008 qualified Tweedy, Browne for the “Manager of the Year” nomination by Morningstar. The Board considered that, during the bull market period from February 28, 2009 through December 31, 2019, the Fund returned 216%, versus the 306% return of the MSCI World Index (Hedged to U.S. $). The Board also noted that the Value Fund is currently characterized as “Low Risk” by Morningstar’s Risk Ratings as of December 31, 2023. The Board noted that the Fund has a Morningstar risk score of “Low” for the 3-year, 5-year and 10-year periods ending March 31, 2024. A risk score of “Low” means the Fund is in the top 10% of funds within Morningstar’s World Large Stock category in terms of low risk.
The Board reviewed the performance of the High Dividend Yield Value Fund, taking into account that the Fund commenced operations on September 5, 2007. The Board noted that since the High Dividend Yield Value Fund’s inception date through February 29, 2024, on a cumulative basis, the Fund has gained 91.72% versus a gain of 194.81% for the Fund’s index, the MSCI World Index (in U.S. $). The Board noted that the High Dividend Yield Value Fund had modestly underperformed the MSCI World High Dividend Yield Index (in U.S. $) since the Fund’s inception through February 29, 2024. The Board observed that the Fund underperformed the MSCI World Index (in U.S. $) by 4.69 percentage points and underperformed the MSCI World High Dividend Yield Index (in U.S. $) by 1.34 percentage points year-to-date through March 31, 2024. The Board also noted that the Fund has an Overall Morningstar Risk Score of “Below Average”.
The Board examined the performance of the International Value Fund II, noting that the Fund commenced operations on October 26, 2009. The Board considered that the International Value Fund II has performed well over the long-term on an absolute basis since its inception through February 29, 2024, gaining cumulative
| 1 | Prior to 2004, information with respect to the MSCI EAFE Indexes was available at month end only; therefore, the since-inception performance of the MSCI EAFE Indexes quoted herein for the International Value Fund reflect performance from May 31, 1993, the closest month end to the International Value Fund’s inception date. |
| 2 | Prior to 2004, information with respect to the MSCI World Indexes used was available at month end only; therefore, the since-inception performance of the MSCI World Indexes quoted herein for the Value Fund reflects performance from November 30, 1993, the closest month end to the Value Fund’s inception date. |
31
TWEEDY, BROWNE FUND INC.
Other Information (Unaudited)
returns of 108.03%. The Board observed that the cumulative returns of the MSCI EAFE Index (in U.S. $) for the period had been 113.56%. The Board noted that the Fund’s annualized rate of return from inception through February 29, 2024 was 5.24% as compared to 5.43% for the MSCI EAFE Index (in U.S. $). The Board then reviewed the Fund’s performance and compared it with the performance of the International Value Fund, which follows the same principal investment strategy as the International Value Fund II except that it does not seek to reduce currency risk by hedging its perceived foreign currency exposure back into the US dollar. The Board noted that while short-term performance of the International Value Fund II may vary considerably from that of the International Value Fund due to currency fluctuations, portfolio holdings and other factors, the long-term performance of the Funds is expected to be similar over time.
The Board acknowledged that Tweedy, Browne’s unhedged international separate accounts (the “Unhedged International Equity Composite”) provide substantive information about the ability and quality of Tweedy, Browne’s management team and justification for the management of another international fund without a currency hedge. The Board also considered that while the International Value Fund II underperformed during the down-market year of 2015, it had outperformed during the down-market years of 2011, 2014, 2018 and 2022. In addition, the Board noted that the Fund has a Morningstar risk score of “Below Average” for the 3-year period ending February 29, 2024.
In addition, the Board noted that the Fund has a Morningstar risk score of “Below Average” for the 3-year period ending February 29, 2024. In addition, the Board reviewed other metrics contained in the Management Practice memorandum relevant to the Funds’ performance. These metrics included performance volatility, Active Share, portfolio turnover rates, brokerage commission expenses, and tax efficiency. The Board considered the results for each Fund relative to its respective industry peer group for each of these metrics.
| D. | Advisory Fees and Total Expenses |
The Board reviewed the advisory fees and total expenses of the Funds. In so doing, the Board reviewed several sets of information, including comparative fee and expense data for (i) comparable funds and the fees associated with Tweedy, Browne’s management of non-fund accounts and (ii) industry peers, which was compiled by Management Practice and Tweedy, Browne. The Board noted that the Adviser has approximately 245 separate client relationships, including the Funds, partnerships and offshore funds. The Board considered that the Adviser generally charges private accounts (i) 1.50% on the first $25 million and 1.25% thereafter annually based on the market value of equity assets for domestic separate account portfolios; (ii) 1.50% on the market value of equity assets for international and global separate account portfolios; and (iii) 1.25% on the market
value of equity assets for global high dividend separate accounts; and that institutional accounts are charged lower fees. The Board also considered that the Adviser generally gives a 10% discount for eleemosynary accounts invested in any strategy. The Board noted that there is no charge on cash reserves. The Board further noted that there is a standard fee rate of 1.25% for the Investor share class of the Adviser’s offshore funds, including cash reserves, and noted the voluntary fee waiver arrangement in place with respect to the offshore funds.
The Board considered that Tweedy, Browne implemented a breakpoint into the fee schedule of the International Value Fund effective October 2017, so that the Fund pays Tweedy, Browne a fee of 1.25% on the first $10.3 billion of the Fund’s daily net assets and 0.75% thereafter, in order to help make the Fund more competitive in today’s market environment and share savings resulting from economies of scale, if any, with Fund shareholders. The Board also considered that, since May 22, 2020, Tweedy, Browne had agreed to voluntarily waive advisory fees such that the International Value Fund would pay Tweedy, Browne a fee at the annual rate of 1.25% on the first $6 billion of the Fund’s average daily net assets; 0.80% on average daily net assets over $6 billion up to $7 billion; 0.70% on average daily net assets over $7 billion up to $8 billion; and 0.60% on average daily net assets over $8 billion. The Board noted that this fee waiver arrangement may not be terminated prior to the close of business on July 31, 2025 without the approval of the Board. The Board also considered that the International Value Fund II, the Value Fund and the High Dividend Yield Value Fund each pay Tweedy, Browne a fee of 1.25% of the Fund’s average daily assets and that Tweedy, Browne implemented a voluntary fee waiver/expense reimbursement effective December 1, 2017, with respect to these Funds to the extent necessary to keep each Fund’s expense ratio in line with that of the International Value Fund in order to make these Funds more competitive as they grow their assets (each Fund’s acquired fund fees and expenses, brokerage costs, interest, taxes and extraordinary expenses are disregarded for purposes of this calculation). The Board noted that this voluntary fee waiver/expense reimbursement will remain in place until at least July 31, 2025 and may not be terminated earlier without the approval of the Board.
The Board noted Tweedy, Browne’s analysis that the 1.25% fee rate applicable to the International Value Fund II, the Value Fund and the first $10.3 billion in assets of the International Value Fund is 16.7% less than Tweedy, Browne’s standard beginning fee rate of 1.50% charged on invested equity for most domestic, global and international separate account portfolios, and in line with Tweedy, Browne’s standard fee rate applicable to the international and global private funds (0.3125% quarterly) and the contractual rate applicable to the Investor share class of the offshore funds. The Board also observed that Tweedy, Browne’s 1.25% fee rate applicable to the High Dividend Yield Value Fund is in line
32
TWEEDY, BROWNE FUND INC.
Other Information (Unaudited)
with the standard fee rate charged to global high dividend private and offshore funds. The Board noted that institutional separately managed accounts invested in the global high dividend strategy are generally charged a fee of 0.85% on the first $100 million of invested equity and 0.75% on the remaining balance. The Board noted that the same institutional fee rate also applies to the other separately managed accounts, including domestic, international and global accounts. The Board also noted that the rate charged to the High Dividend Yield Value Fund was higher than the weighted average fee on all of Tweedy, Browne’s global high dividend strategy separate accounts (other than eleemosynary accounts and based on the account weighted average investment level of 95.6%).
The Board noted the different services that Tweedy, Browne provides in exchange for fees from different kinds of clients. The Board observed that the Funds receive a variety of services from Tweedy, Browne that it generally does not provide, or provides to a more limited extent, to its separate account clients, such as providing personnel to act as officers or directors; providing support and preparing materials for periodic board meetings; providing shareholder support services; preparing public filings; monitoring daily cash flows, transactions and liquidity; managing dividends and distributions; overseeing third-party service providers and monitoring compliance with regulatory obligations under the Securities Act of 1933 and the Investment Company Act of 1940, as amended. In addition to the differences in services, the Board noted that serving as an investment adviser to the Funds carried with it a significantly higher liability profile than serving as an investment adviser to separate account clients in light of the legal and regulatory framework for registered mutual funds. The Board considered that the difference in fees charged to the Funds and Tweedy, Browne’s other clients with similar investment mandates may be attributable in part to the kinds of services provided to the Funds.
The Board reviewed the narrative discussion provided by Tweedy, Browne that examined the Funds’ portfolio turnover rates and brokerage commission data. The Board considered that, as of February 29, 2024, the Global Stock Fund Average1
had a 44.55% annual portfolio turnover rate and the Foreign Stock Fund Average2 had a 45.04% portfolio turnover rate. The Board noted that the International Value Fund’s portfolio turnover rate was 11.9%, and the Value Fund’s portfolio turnover rate was 20.6% for the fiscal year ended March 31, 2024. The Board also noted that the High Dividend Yield Value Fund’s average annual portfolio turnover rate was 16.1%, and the International Value Fund II’s average annual portfolio turnover rate was 13.0% for the fiscal year ended March 31, 2024.
Turning its attention to comparative fund fee information, the Board noted at the outset that although the Funds pay higher investment advisory fees than certain other peer funds, the Funds’ overall expense ratios were competitive with peer funds, especially in light of the Funds’ performance and investor services. The Board noted that the International Value Fund’s net expense ratio (as reflected in the Fund’s financial statements) of 1.39% as of March 31, 2024, was 36 basis points higher than the average net expense ratio of the Foreign Stock Fund Average and 29 basis points higher than the average net expense ratio of the Fund’s perceived competitors. The Board observed that the Fund’s net expense ratio was 1 basis point lower than the previous year.
The Board considered the comparative fee data regarding the International Value Fund II and noted that the Fund’s net expense ratio (as reflected in the Fund’s financial statements) was 1.38% as of March 31, 2024, which is 35 basis points higher than the average net expense ratio of the Foreign Stock Fund Average and 28 basis points higher than the average net expense ratio of the Fund’s perceived competitors, based on data from Morningstar. The Board observed that the Fund’s net expense ratio was 1 basis point lower than the previous year.
The Board examined the comparative fee data regarding the Value Fund and noted that the Fund’s net expense ratio (as reflected in the Fund’s financial statements) was 1.38% (after waivers) as of March 31, 2024, which is 32 basis points higher than the average expense ratio of the Global Stock Fund Average and 20 basis points higher than the average net expense ratio for the Fund’s perceived competitors, based on
| 1 | Since April 28, 2017, the Global Stock Fund Average is calculated by Tweedy, Browne based on data provided by Morningstar, and reflects average returns or portfolio turnover rates of all mutual funds in the Morningstar Global Large Stock (including Global Large Value, Global Large Growth, and Global Large Blend categories) and Global Small/Mid Stock categories. Prior to April 28, 2017, the Global Stock Fund Average was calculated by Morningstar. Funds in these categories typically invest in stocks throughout the world while maintaining a percentage of their assets (normally 20% - 60%) invested in U.S. stocks. These funds may or may not be hedged to the U.S. dollar, which will affect reported returns. References to “Global Stock Funds” or the “Global Stock Fund Average” that predate April 28, 2017 are references to Morningstar’s Global Stock Funds and Global Stock Fund Average, respectively, while references to Global Stock Funds and the Global Stock Fund Average for the period beginning April 28, 2017 refer to the Global Stock Funds and World Stock Fund Average as calculated by Tweedy, Browne. |
| 2 | Since September 30, 2003, the Foreign Stock Fund Average is calculated by Tweedy, Browne based on data provided by Morningstar and reflects average returns or portfolio turnover rates of all mutual funds in the Morningstar Foreign Large-Value, Foreign Large-Blend, Foreign Large-Growth, Foreign Small/Mid- Value, Foreign Small/Mid-Blend, and Foreign Small/Mid-Growth categories. Funds in these categories typically invest in international stocks and have less than 20% of their assets invested in U.S. stocks. These funds may or may not be hedged to the U.S. dollar, which will affect reported returns. References to “Foreign Stock Funds” or the “Foreign Stock Fund Average” that predate September 30, 2003 are references to Morningstar’s Foreign Stock Funds and Foreign Stock Fund Average, respectively, while referrences to Foreign Stock Funds and the Foreign Stock Fund Average for the period beginning September 30, 2003 refer to Foreign Stock Funds and the Foreign Stock Fund Average as calculated by Tweedy, Browne. |
33
TWEEDY, BROWNE FUND INC.
Other Information (Unaudited)
data from Morningstar. The Board observed that the Fund’s net expense ratio was 2 basis points lower than the previous year.
The Board considered comparative fee data regarding the High Dividend Yield Value Fund and noted that the Fund’s net expense ratio (as reflected in the Fund’s financial statements) was 1.39% as of March 31, 2024, which was 33 basis points higher than the average expense ratio of the Global Large Value Stock Category and 21 basis points higher than the average net expense ratio for the Fund’s perceived competitors, based on data from Morningstar. The Board observed that the Fund’s net expense ratio was 1 basis point higher than the previous year.
The Board also considered the Funds’ fee and expense arrangements relative to industry peer groups generated by Management Practice, which consist of funds with similar investment objectives, operating characteristics, and asset sizes as the Funds. The Board observed that each Fund exceeds the median advisory fee rate and net expense ratio of the respective Management Practice industry peer groups. The Board also noted that the non-advisory fees incurred by the Funds were lower than the median of the respective Management Practice industry peer groups.
The Board also engaged in a discussion with Tweedy, Browne regarding management’s overall pricing philosophy and business model as context for the Board’s consideration of the reasonableness of the Funds’ investment advisory fees.
| E. | Adviser Costs, Level of Profits and Economies of Scale |
The Board reviewed information regarding Tweedy, Browne’s costs of providing services to the Funds, as well as the resulting level of profits to Tweedy, Browne. In so doing, the Board reviewed materials relating to Tweedy, Browne’s financial condition and reviewed the wide variety of services and intensive research performed for the Funds. The Board further noted that most of the Adviser’s employees work on Fund-related issues or projects on a regular basis. Pursuant to a Service Agreement approved annually by the Board, the Funds reimburse the Adviser for certain compliance, shareholder servicing and fund accounting services performed by three of these employees who are not officers or directors of the Company. The Board noted that the amount to be reimbursed, approximately $475,000 in 2024, is approved annually by the Board.
The Board considered materials regarding the profitability of Tweedy, Browne’s relationship with the Funds as a whole, and with each of the Funds separately. The Board considered the independent analysis of Tweedy, Browne’s contractual management fees and the Funds’ net expenses contained in the Management Practice memorandum. The Board examined the net profitability of Tweedy, Browne and its profit margins for each Fund for the fiscal year ended March 31, 2024. The Board noted that as of December 31,
2023, the total assets under management of Tweedy, Browne had decreased compared to the previous year to approximately $8.7 billion, approximately $6.7 billion of which represented the assets of the Funds. The Board acknowledged that, the Funds’ asset levels remained lower than they had been in recent years, which had resulted in lower revenues and profit for Tweedy, Browne over this period.
The Board took into account Tweedy, Browne’s research process and, in particular, Tweedy, Browne’s research with regard to non-U.S. securities. The Board considered Tweedy, Browne’s investment discipline for the International Value Fund, Value Fund and International Value Fund II with respect to smaller and medium market capitalization issues and noted that the research process is more intensive and time-consuming for the traditional highly diversified value approach it practices than for an investment adviser that invests in concentrated positions and/or only in larger market capitalization companies.
The Board considered whether economies of scale exist that may be shared with the Funds’ investors, given the Funds’ asset levels and expense structures. The Board recognized that economies of scale may be shared with the Funds in a number of ways, including, for example, through lower initial advisory fees (i.e., pricing at scale since inception), the imposition of advisory fee breakpoints, fee reductions or waivers and the continued enhancement of advisory and administrative services of the investment adviser and specifically with respect to those services provided to the Funds in return for fees paid. The Board acknowledged that Tweedy, Browne implemented a contractual breakpoint in the advisory fee schedule of the International Value Fund, a voluntary fee waiver agreement with respect to the International Value Fund through at least July 31, 2025, and a voluntary fee waiver/expense reimbursement agreement with respect to the International Value Fund II, the Value Fund and the High Dividend Yield Value Fund effective through at least July 31, 2025. The Board noted that the breakpoint and fee waiver arrangement could have the effect of further reducing the Fund’s total expense ratio if its assets were to increase. The Directors noted that breakpoint schedules can reverse when assets decline, leading to higher fees for fund shareholders when markets decline or assets leave a fund complex. The Board observed that the International Value Fund’s assets were below the first contractual breakpoint of $10.3 billion and could fluctuate above or below the breakpoint depending on asset flows and investment performance. Additionally, the Board recognized Tweedy, Browne’s view that its investment discipline and extensive research process for broadly diversified groups of companies in approximately 22 different countries (including the U.S.) is likely not as conducive to economies of scale that would be potentially realizable in the management of other large pools of capital invested exclusively in large market capitalization stocks. With respect to the High Dividend Yield Value Fund, which is generally
34
TWEEDY, BROWNE FUND INC.
Other Information (Unaudited)
expected to have a higher proportion of large market capitalization holdings in its portfolio (because smaller capitalization companies usually do not pay above average dividends), the Board noted that Tweedy, Browne must still perform extensive research regarding companies that pay above-average dividends and that satisfy a different level of undervaluation than Tweedy, Browne requires for the other Funds. The Board considered that such research would therefore not be less intensive or less expensive than the research performed for the other three Funds. The Board also noted the continued enhancements made at the Adviser, including the Adviser’s approach to reinvesting in the important areas of the business that support the Funds, and the continued enhancements specifically to the services provided to the Funds. While the Board recognized that no changes to advisory fees or additional breakpoints were being proposed at this time, the Board noted that it would continue to evaluate whether the Funds’ asset levels and expense structures appropriately reflected economies of scale that could be shared with Fund investors.
After discussion, the Independent Directors concluded that the fees charged by Tweedy, Browne relative to its cost of providing services to the Funds are reasonable, fair and consistent with the results of an arm’s-length negotiation.
Finally, the Board considered a variety of other benefits received by Tweedy, Browne as a result of its relationship with
the Funds, including any benefits derived by Tweedy, Browne from soft dollar arrangements with broker-dealers. In particular, the Board considered materials concerning Tweedy, Browne’s brokerage and best execution policies. The Board also reviewed Tweedy, Browne’s policies and procedures prohibiting the use of brokerage commissions to finance the distribution of Fund shares.
After taking into consideration a number of matters relating to Tweedy, Browne’s relationship with the Funds, the Independent Directors concluded that Tweedy, Browne was providing essential services and high quality personnel to the Funds and that Tweedy, Browne likely will continue to be in a position to do so for the long-term; the nature, extent and quality of the services provided by Tweedy, Browne have benefited and likely will continue to benefit the Funds and their shareholders; they were satisfied with each Fund’s performance and Tweedy, Browne’s performance record in managing the Funds warranted the continuation of the Advisory Agreements; and the advisory fee for each Fund and Tweedy, Browne’s profitability from its relationship with each Fund is reasonable. The Independent Directors based their decision on evaluations of all these factors as a whole and did not consider any one factor as all-important or controlling. Accordingly, the Independent Directors unanimously recommended that the Board approve the continuation of the Advisory Agreements at the present contractual rates.
35
This page left blank intentionally.

Item 8. Changes in and Disagreements with Accountants for Open-End Management Investment Companies.
Not applicable.
Item 9. Proxy Disclosures for Open-End Management Investment Companies.
Not applicable.
Item 10. Remuneration Paid to Directors, Officers, and Others of Open-End Management Investment Companies.
Included under Item 7 of this Form.
Item 11. Statement Regarding Basis for Approval of Investment Advisory Contract.
Included under Item 7 to this Form.
Item 12. Disclosure of Proxy Voting Policies and Procedures for Closed-End Management Investment Companies.
Not applicable.
Item 13. Portfolio Managers of Closed-End Management Investment Companies.
Not applicable.
Item 14. Purchases of Equity Securities by Closed-End Management Investment Company and Affiliated Purchasers.
Not applicable.
Item 15. Submission of Matters to a Vote of Security Holders.
There have been no material changes to the procedures by which the shareholders may recommend nominees to the registrant’s board of directors, where those changes were implemented after the registrant last provided disclosure in response to the requirements of Item 407(c)(2)(iv) of Regulation S-K (17 CFR 229.407) (as required by Item 22(b)(15) of Schedule 14A (17 CFR 240.14a-101)), or this Item.
Item 16. Controls and Procedures.
| | (a) | The registrant’s principal executive and principal financial officers, or persons performing similar functions, have concluded that the registrant’s disclosure controls and procedures (as defined in Rule 30a-3(c) under the Investment Company Act of 1940, as amended (the “1940 Act”) (17 CFR 270.30a-3(c))) are effective, as of a date within 90 days of the filing date of the report that includes the disclosure required by this paragraph, based on their evaluation of these controls and procedures required by Rule 30a-3(b) under the 1940 Act (17 CFR 270.30a-3(b)) and Rules 13a-15(b) or 15d-15(b) under the Securities Exchange Act of 1934, as amended (17 CFR 240.13a-15(b) or 240.15d-15(b)). |
| | (b) | There were no changes in the registrant’s internal control over financial reporting (as defined in Rule 30a-3(d) under the 1940 Act (17 CFR 270.30a-3(d)) that occurred during the period covered by this report that has materially affected, or is reasonably likely to materially affect, the registrant’s internal control over financial reporting. |
Item 17. Disclosure of Securities Lending Activities for Closed-End Management Investment Companies.
Not applicable.
Item 18. Recovery of Erroneously Awarded Compensation.
(a) Not applicable.
(b) Not applicable.
Item 19. Exhibits.
SIGNATURES
Pursuant to the requirements of the Securities Exchange Act of 1934 and the Investment Company Act of 1940, the registrant has duly caused this report to be signed on its behalf by the undersigned, thereunto duly authorized.
| | |
(Registrant) | | Tweedy, Browne Fund Inc. |
| | |
By (Signature and Title)* | | /s/ Thomas H. Shrager |
| | Thomas H. Shrager, President (principal executive officer) |
Pursuant to the requirements of the Securities Exchange Act of 1934 and the Investment Company Act of 1940, this report has been signed below by the following persons on behalf of the registrant and in the capacities and on the dates indicated.
| | |
By (Signature and Title)* | | /s/ Thomas H. Shrager |
| | Thomas H. Shrager, President (principal executive officer) |
| | |
By (Signature and Title)* | | /s/ Roger R. de Bree |
| | Roger R. de Bree, Treasurer (principal financial officer) |
* Print the name and title of each signing officer under his or her signature.