|
UNITED STATES |
SECURITIES AND EXCHANGE COMMISSION |
Washington, D.C. 20549 |
|
FORM N-CSR |
|
CERTIFIED SHAREHOLDER REPORT OF REGISTERED |
MANAGEMENT INVESTMENT COMPANIES |
|
Investment Company Act File Number: 811-07538 |
|
LORD ABBETT SECURITIES TRUST |
|
90 Hudson Street, Jersey City, NJ 07302 |
|
90 Hudson Street, Jersey City, NJ 07302 |
Registrant’s telephone number, including area code: (800) 201-6984
Date of fiscal year end: 10/31/2012
Date of reporting period: 10/31/2012
|
|
Item 1: | Report(s) to Shareholders. |

2 0 1 2
L O R D A B B E T T
A N N U A L
R E P O R T
Lord Abbett
Alpha Strategy Fund
Fundamental Equity Fund
Growth Leaders Fund
International Core Equity Fund
International Dividend Income Fund
International Opportunities Fund
Value Opportunities Fund
For the fiscal year ended October 31, 2012
|
|
Lord Abbett Securities Trust |
For the fiscal year ended October 31, 2012 |

From left to right: Robert S. Dow, Director and Chairman of the Lord Abbett Funds; E. Thayer Bigelow, Independent Lead Director of the Lord Abbett Funds; and Daria L. Foster, Director, President and Chief Executive Officer of the Lord Abbett Funds.
Dear Shareholders: We are pleased to provide you with this overview of the performance of the Funds for the fiscal year ended October 31, 2012. On this page and the following pages, we discuss the major factors that influenced fiscal year performance. For detailed and more timely information about the Funds, please visit our Website at www.lordabbett.com, where you also can access the quarterly commentaries that provide updates on each Fund’s performance and other portfolio related updates.
Thank you for investing in Lord Abbett mutual funds. We value the trust that you place in us and look forward to serving your investment needs in the years to come.

Chairman
|
|
For the 12-month period ended October 31, 2012, the Fund returned 9.12%, reflecting performance at the net asset value (NAV) of Class A shares, with all distributions reinvested, compared to its benchmark, the combined 85% Russell 2000® Index1 / 15% S&P Developed Ex-U.S. SmallCap® Index,2 which returned 11.10% over the same period.
During the 12-month period, global markets were negatively affected by ongoing sovereign debt and budgetary concerns in Europe, turmoil in the Middle East, and slowing growth in China. Meanwhile, the U.S. economy continued to strengthen, albeit at a slower pace than in prior economic recoveries. As a result, domestic equity markets (as represented by the S&P 500® Index3) outperformed foreign equity markets (as represented by the MSCI EAFE Index with Gross Dividends4). Furthermore, value stocks (as represented by the Russell 3000® Value Index5) outperformed growth stocks (as represented by the Russell 3000® Growth Index6), while micro cap stocks (as represented by the Russell Microcap®
1
|
|
While all individual investment strategies posted positive returns for the period, the domestic equity strategies within the Fund underperformed their respective indices. As a result, the Fund underperformed for the 12-month period.
Detracting from the Fund’s relative performance was the exposure to the domestic micro cap growth category, as this investment strategy underperformed its index and was the weakest performing segment of the portfolio. Within this asset class, stock selection in the health care and consumer discretionary sectors hurt the Fund’s relative performance. Also detracting from the Fund’s relative performance was exposure to the domestic smid cap value asset class, as stock selection within the materials and consumer discretionary sectors caused this investment strategy to underperform its index.
The Fund’s overweight exposure to international small cap equities benefited overall performance, as this investment strategy posted a performance return that was more than double the return of the underlying fund’s index. Within this asset class, stock selection in the financials, industrials, and information technology sectors buoyed performance. The Fund’s exposure to domestic micro cap value securities also contributed to relative performance, as this asset class outperformed the Fund’s index.
Fundamental Equity Fund
For the 12-month period ended October 31, 2012, the Fund returned 7.17%, reflecting performance at the net asset value (NAV) of Class A shares, with all distributions reinvested, compared to its benchmark, the Russell 3000® Value Index,5 which returned 16.70% over the same period.
Although the Fund’s index posted a double-digit return, the 12-month period has been a challenging and volatile environment for active managers. The market rose during the first five months of the fiscal period, as strong employment reports and increased housing activity provided evidence of an improving economy. Unfortunately, the risk-off environment returned during the second quarter of 2012, and the Fund’s cyclical positioning resulted in underperformance. Macroeconomic concerns about Europe and the slowdown of China’s economy caused investors to favor defensive sectors and dividend-paying stocks during this risk-off period. The stock market resumed its rise during the latter part of the year, mainly driven by a continuation of positive housing trends and earnings reports that exceeded the low expectations of investors. The volatile, macro-dominated environment that prevailed during the 12-month period was not favorable to our value-oriented, bottom-up, fundamental approach.
Stock selection within the energy sector was the largest detractor from Fund performance during the period. Natural gas producers were negatively affected during
2
|
|
The Fund’s performance benefited from both stock selection and our underweight position within the utilities sector. In aggregate, utility stocks underperformed the overall market, although the Fund’s holdings within this sector performed relatively well. The Fund’s significant overweight within the health care sector also boosted performance. One of the top contributors in the Fund was the health care holding Onyx Pharmaceuticals, Inc. Shares of the biopharmaceutical company rose owing to the initial, late-July launch of Kyprolis, a drug for multiple myeloma. In addition, strong stock selection within the information technology sector contributed to Fund performance. Shares of eBay, Inc., an online platform for the sale of goods and services, benefited from the company’s announcement of a new partnership between its subsidiary PayPal and Discover Financial Services, a bank holding company. The partnership is expected to help expand the number of retailers offering PayPal in-store payments.
Growth Leaders Fund
For the 12-month period ended October 31, 2012, the Fund returned 4.48%, reflecting performance at the net asset value (NAV) of Class A shares, with all distributions reinvested, compared to its benchmark, the Russell 3000® Growth Index,6 which returned 12.76% over the same period.
Global stock markets began the 12-month period on November 1, 2011, with a sharp sell-off. As political leaders toiled to lift the United States and Europe from an ongoing fiscal crisis, investors were on edge and volatility remained high. Equity markets quickly regained footing by November’s end, as investor fears abated following a move by central banks worldwide to stave off rising unemployment and provide a lifeline to ailing government balance sheets. By May, however, markets once again came under pressure: volatility soared and the S&P 500® Index3 posted its worst monthly decline since the tumultuous month of September 2011. Fearing the demise of the European Union, and facing the threat of global recession, European Central Bank president Mario Draghi made a pledge to keep the eurozone solvent and the United States announced a third round of quantitative easing; such action lead equity markets to finish the 12-month period in positive territory.
3
|
|
Security selection within the information technology sector detracted from Fund performance during the 12-month period. Shares of the world’s largest online social network, Facebook, Inc., were among the largest detractors. The firm came under immense selling pressure after questions were raised regarding the pace at which the company will be able to generate money from its ad services. VMware, Inc., a provider of desktop virtualization and cloud-based infrastructure, also saw its shares decline during the period. Although the firm has experienced significant growth, cloud-computing giants Amazon.com and Citrix Systems have added a significant amount of competitive pressure to the firm’s business.
Security selection within the health care sector also detracted from Fund performance. Dendreon Corporation, a biotechnology company involved in the development of drugs geared to treat a range of cancers, saw its shares decline during the period. A study released by a major competitor highlighted an upcoming drug that could rival the firm’s Provenge prostate cancer treatment. Shares of Cerner Corporation, a provider of cloud-based health care database solutions for hospitals and medical professionals also fell late in the period. Although the firm was able to beat profit expectations, the stock fell as investors became concerned that revenue growth was beginning to slow.
In addition to our underweight, security selection within the materials sector contributed to relative performance. The Sherwin-Williams Company, a leading retailer of paint products in North America, was the primary contributor to relative performance within the sector. A recovery in the housing market has caused demand for paint to rebound considerably. Monsanto Company also contributed to absolute performance. The provider of seeds and fertilizers used in farming globally saw its shares gain, as the firm continues to experience double-digit earnings growth, supported chiefly by the strong demand for corn.
Despite the industrials sector detracting slightly from relative performance, a number of securities within the sector benefited. Fastenal Company, a retailer of threads, bolts, and fasteners used in construction globally, saw its shares climb in the first half of the period. The firm has seen double-digit earnings growth as economic growth in the United States has improved. Shares of Genesee & Wyoming Inc. also rose, as the short-line freight rail operator continued to strengthen after diversifying its business through the purchase of the largest regional-rail operators in North America, RailAmerica, Inc.
4
|
|
For the 12-month period ended October 31, 2012, the Fund returned 3.81%, reflecting performance at the net asset value (NAV) of Class A shares, with all distributions reinvested, compared to its benchmark, the MSCI EAFE Index with Gross Dividends,4 which returned 5.15% over the same period.
Overall, global markets continued to exhibit a great deal of volatility during the 12-month period, with few of the major foreign markets able to match the returns exhibited in the United States. Southern Europe’s continuing financial and economic struggles led to negative returns in Greece, Italy, Portugal, and Spain. France, which could be the next country in the eurozone to crack under the fiscal crisis, eked out low single-digit returns. On the other hand, countries more insulated from the woes of Southern Europe posted very strong returns, particularly Belgium, Denmark, and Germany. Shares in the United Kingdom were up by high single digits. Elsewhere there were mixed results. Hong Kong, New Zealand, and Singapore, for example, rose. In emerging markets, Thailand and the Philippines were up sharply while Brazil, Chile, India, and Russia all posted declines. Japan, despite statements from government officials that they intended to take steps to reflate their economy, also fell during the period.
Overall, sector allocation was the primary reason for the Fund’s relative underperformance. The Fund’s overweight position in the information technology sector hurt performance, as this was the worst performing sector in the index. Also detracting from the Fund’s relative performance was stock selection in the consumer discretionary and energy sectors. Within the consumer discretionary sector, shares of Seven West Media Ltd., an Australia-based media conglomerate, dropped due to a challenging advertising environment that has seen a shift from print to online, notably affecting revenue in the newspaper and magazine segments. In addition, an equity offering during the third quarter resulted in some dilution to current shareholders. Within the energy sector, shares of YPF SA, an Argentina-based oil and gas company, suffered due to political tensions stemming from the announcement of the government’s controversial decision to take over 51% of YPF shares, all of which was to come from Spanish owner Repsol.
Contributing to the Fund’s relative performance was stock selection in the information technology and utilities sectors. Within the information technology sector, shares of ASUSTeK Computer, Inc., a Taiwan-based manufacturer and distributor of computers, communication products, and consumer electronics, saw its shares rise as performance numbers exceeded expectations due to improvements in design and lower operating expenses. Furthermore, shipments have increased due to the
5
|
|
International Dividend Income Fund
For the 12-month period ended October 31, 2012, the Fund returned 3.60%, reflecting performance at the net asset value (NAV) of Class A shares, with all distributions reinvested, compared to its benchmark, the MSCI All Country World Ex-U.S. Value Index with Gross Dividends,8 which returned 4.59% over the same period.
Overall, global markets continued to exhibit a great deal of volatility during the 12-month period, with few of the major foreign markets able to match the returns exhibited in the United States. Southern Europe’s continuing financial and economic struggles led to negative returns in Greece, Italy, Portugal, and Spain. France, which could be the next country in the eurozone to crack under the fiscal crisis, eked out low single-digit returns. On the other hand, countries more insulated from the woes of Southern Europe posted very strong returns, particularly Belgium, Denmark, and Germany. Shares in the United Kingdom were up by high single digits. Elsewhere there were mixed results. Hong Kong, New Zealand, and Singapore, for example, rose. In emerging markets, Thailand and the Philippines were up sharply while Brazil, Chile, India, and Russia all posted declines. Japan, despite statements from government officials that they intended to take steps to reflate their economy, also fell during the period.
Overall, weak sector allocation was the largest detractor from the Fund’s relative performance for the period. An overweight position in the telecommunication services sector hurt the Fund’s relative performance, as this was among the worst performing sectors in the Fund and index. Also hindering the Fund’s relative performance was an underweight position in the health care sector, which was among the best performing sectors in both the Fund and index. In addition, weak stock selection in the consumer discretionary sector hampered the Fund’s relative performance. Shares of Seven West Media Ltd., an Australia-based media conglomerate, dropped due to a challenging advertising environment that has seen a shift from print to online, notably affecting revenue in the
6
|
|
Contributing to the Fund’s relative performance was stock selection, particularly in the utilities and financials sector. Within the utilities sector, shares of Spark Infrastructure Group, an Australia-based electricity distribution company, were buoyed by increased tariffs and greater volumes of connection activity, which helped performance in ETSA, the firm’s segment that supplies electricity in South Australia. In addition, shares of National Grid plc, a United Kingdom-based international electricity and gas company, rose after improved performance and an increased rate base in the United States, as well as a strong dividend yield. Despite increased regulatory measures in the United Kingdom that will be finalized in December, dividend growth is expected to be approximately 3%. Within the financials sector, shares of New World Development Co. Ltd, a Hong Kong-based company engaged in property development and investment, were supported by successful sales from development launches. The company also has a number of projects in the pipeline which bodes well for future results.
International Opportunities Fund
For the 12-month period ended October 31, 2012, the Fund returned 10.59%, reflecting performance at the net asset value (NAV) of Class A shares, with all distributions reinvested, compared to its benchmark, the S&P Developed Ex-U.S. SmallCap® Index,2 which returned 5.12% over the same period.
Overall, global markets continued to exhibit a great deal of volatility during the 12-month period, with few of the major foreign markets able to match the returns exhibited in the United States. Southern Europe’s continuing financial and economic struggles led to negative returns in Greece, Italy, Portugal, and Spain. France, which could be the next country in the eurozone to crack under the fiscal crisis, eked out low single-digit returns. On the other hand, countries more insulated from the woes of Southern Europe posted very strong returns, particularly Belgium, Denmark, and Germany. Shares in the United Kingdom were up by high single digits. Elsewhere there were mixed results. Hong Kong, New Zealand, and Singapore, for example, rose. In emerging markets, Thailand and the Philippines were up sharply while Brazil, Chile, India, and Russia all posted declines. Japan, despite statements from government officials that they intended to take steps to reflate their economy, also fell during the period.
Contributing to the Fund’s relative performance was strong stock selection, particularly in the financials, industrials, and information technology sectors. Within the financial sector, Amlin plc, a United Kingdom-based insurance and reinsurance company, benefited from a decrease in volume of claims due to the lack of
7
|
|
Detracting from the Fund’s relative performance was stock selection in the energy and consumer staples sectors. Within the energy sector, shares of Bankers Petroleum Ltd., a Canada-based company involved in the exploration and production of oil in Albania, were hurt by flat production outputs due to operational issues during the first half of the year. In addition, the Fund’s overweight position in the energy sector relative to the index detracted from Fund performance, as this was among the weaker performing sectors in the index and the worst performing sector in the Fund during the period. Within the consumer staples sector, shares of Mitsui Sugar Co Ltd, a Japan-based sugar manufacturer, plummeted in November 2011 when lack of domestic demand prompted the announcement that the Okayama plant would suspend operations in the fall of 2012. A significant impairment loss was taken and net income forecasts were lowered.
Value Opportunities Fund
For the 12-month period ended October 31, 2012, the Fund returned 5.89%, reflecting performance at the net asset value (NAV) of Class A shares, with all distributions reinvested, compared to its benchmark, Russell 2500™ Value Index,9 which returned 15.55% over the same period.
A strong performance by domestic equities was overshadowed by persistent economic uncertainty during the 12-month period. Investors were forced to weigh the negative impacts of the European sovereign debt crisis, decelerating growth in China, and the fragile U.S. economy against the positive effects of global monetary easing and signs of a U.S. housing recovery. In a difficult environment for active money managers, the Fund underperformed during the period by 9.66% relative to the index. Performance lagged most notably in the second quarter of 2012, which accounted for 43% of the Fund’s overall underperformance on a relative basis.
Notable detractors to the Fund’s overall relative performance during the period include consumer discretionary holding Express, Inc., materials holding Allegheny Technologies, Inc., energy holding Key Energy Services, Inc., and information technology holding Synaptics, Inc. Shares of Express, Inc., a specialty retailer, were under pressure as management lowered
8
|
|
During the period, notable contributors to the Fund’s overall relative performance included health care holdings DaVita, Inc., PerkinElmer, Inc. and Watson Pharmaceuticals, and industrials holding Fortune Brands Home & Security, Inc. DaVita, Inc., a kidney dialysis services provider, announced in May 2012 that the company would acquire HealthCare Partners, the country’s largest operator of primary care medical networks. This was viewed positively by investors because they believed the acquisition to be accretive in both the near and long term. PerkinElmer, Inc., a provider of technology, services, and solutions in life sciences, was among the biggest contributors to the Fund’s relative performance. The company posted four straight quarters of earnings above consensus. Management cited strong organic growth and performance in emerging markets, such as China, as reasons for the strong year. Shares of home and security products provider Fortune Brands Home & Security, Inc. provided solid gains for the Fund during the period. A moderately recovering housing market provided a tailwind for the company’s plumbing, windows and doors, and cabinet segments. Investors applauded the acquisition announcement of Actavis Group by Watson Pharmaceuticals, Inc., a specialty pharmaceutical company. The acquisition is believed to be highly accretive, as the company benefits from operating synergies. Shares also received a boost when a generic version of Lidoderm® received Food and Drug Administration approval in August 2012.
Each Fund’s portfolio is actively managed and, therefore, its holdings and the weightings of a particular issuer or particular sector as a percentage of portfolio assets are subject to change. Sectors may include many industries.
9
|
|
2 The S&P Developed Ex-U.S. SmallCap® Index captures the bottom 15% of companies domiciled in the developed markets excluding the United States within the S&P Global BMI with a float-adjusted market capitalization of at least US$100 million and a minimum annual trading liquidity of US$50 million.
3 The S&P 500® Index is widely regarded as the standard for measuring large cap U.S. stock market performance and includes a representative sample of leading companies in leading industries.
4 The MSCI EAFE Index (Europe, Australasia, Far East) is a free float-adjusted market capitalization index that is designed to measure the equity market performance of developed markets, excluding the US & Canada. The MSCI EAFE Index consists of the following 22 developed market country indices: Australia, Austria, Belgium, Denmark, Finland, France, Germany, Greece, Hong Kong, Ireland, Israel, Italy, Japan, the Netherlands, New Zealand, Norway, Portugal, Singapore, Spain, Sweden, Switzerland, and the United Kingdom.
The MSCI EAFE Index is calculated with both gross and net dividends. The MSCI EAFE Index with Gross Dividends approximates the maximum possible dividend reinvestment. The amount reinvested is the entire dividend distributed to individuals resident in the country of the company, but does not include tax credits. The MSCI EAFE Index with Net Dividends approximates the minimum possible dividend reinvestment. The dividend is reinvested after deduction of withholding tax, applying the rate to non-resident individuals who do not benefit from double taxation treaties. MSCI uses withholding tax rates applicable to Luxembourg holding companies, as Luxembourg applies the highest rates.
5 The Russell 3000® Value Index measures the performance of those Russell 3000 Index companies with lower price-to-book ratios and lower forecasted growth values. The stocks in this index are also members of either the Russell 1000 Value or the Russell 2000 Value indexes.
6 The Russell 3000® Growth Index measures the performance of those Russell 3000 Index companies with higher price-to-book ratios and higher forecasted growth values.
7 The Russell Microcap® Index measures performance of the micro cap segment, representing less than 3% of the U.S. equity market. The Russell Microcap Index includes the smallest 1,000 securities in the small cap Russell 2000 Index plus the next smaller 1,000 securities.
8 The MSCI ACWI (All Country World Index) ex-U.S. Value Index is subset of the MSCI ACWI Index ex-U.S index. The index is a free float-adjusted market capitalization-weighted index that is designed to measure the equity market performance of developed and emerging markets excluding the United States from a value perspective.
The MSCI Global Value indexes cover the full range of developed, emerging, and All Country MSCI International Equity indexes across all size segmentations. MSCI uses a two-dimensional framework for style segmentation in which value and growth securities are categorized using a multi-factor approach, which uses three variables to define the value investment style characteristics and five variables to define the growth investment style characteristics, including forward looking variables. The objective of the index design is to divide constituents of an underlying MSCI Equity Index into respective value indexes, each targeting 50% of the free float-adjusted market capitalization of the underlying market index.
9 The Russell 2500™ Index measures the performance of the 2,500 smallest companies in the Russell 3000 Index, which represents approximately 20% of the total market capitalization of the Russell 3000 Index.
Unless otherwise specified, indexes reflect total return, with all dividends reinvested. Indexes are unmanaged, do not reflect the deduction of fees or expenses, and are not available for direct investment.
Important Performance and Other Information
Performance data quoted in the following pages reflect past performance and are no guarantee of future results. Current performance may be higher or lower than the performance quoted. The investment return and principal value of an investment in the Funds will fluctuate so that shares, on any given day or when redeemed, may be worth more or less than their original cost. You can obtain performance data current to the most recent month end by calling Lord Abbett at 888-522-2388 or referring to www.lordabbett.com.
10
|
|
During certain periods shown, expense waivers and reimbursements were in place for Alpha Strategy Fund, Growth Leaders Fund, International Core Equity Fund and International Dividend Income Fund. Without such expense waivers and reimbursements, each of the Fund’s returns would have been lower.
The annual commentary above discusses the views of the Funds’ management and various portfolio holdings of the Funds as of October 31, 2012. These views and portfolio holdings may have changed after this date. Information provided in the commentary is not a recommendation to buy or sell securities. Because the Funds’ portfolio is actively managed and may change significantly, the Funds’ may no longer own the securities described above or may have otherwise changed their positions in the securities. For more recent information about the Funds’ portfolio holdings, please visit www.lordabbett.com.
A Note about Risk: See Notes to Financial Statements for a discussion of investment risks. For a more detailed discussion of the risks associated with the Fund, please see the Fund’s prospectus.
Mutual funds are not insured by the FDIC, are not deposits or other obligations of, or guaranteed by, banks, and are subject to investment risks including possible loss of principal amount invested.
11
|
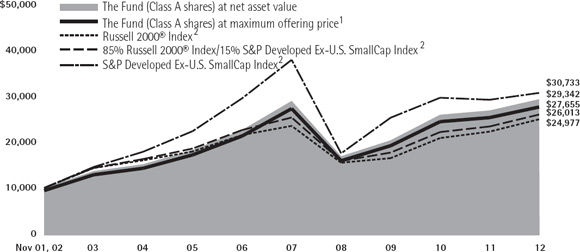
Alpha Strategy Fund |
Investment Comparison |
Below is a comparison of a $10,000 investment in Class A shares with the same investment in the Russell 2000® Index, 85% Russell 2000® Index/15% S&P Developed Ex-U.S. SmallCap Index, and the S&P Developed Ex-U.S. SmallCap Index, assuming reinvestment of all dividends and distributions. The performance of other classes will be greater than or less than the performance shown in the graph below due to different sales loads and expenses applicable to such classes. The graph and performance table below do not reflect the deduction of taxes that a shareholder would pay on Fund distributions or the redemption of Fund shares. During certain periods, expenses of the Fund have been waived or reimbursed by Lord Abbett; without such waiver or reimbursement of expenses, the Fund’s returns would have been lower. Past performance is no guarantee of future results.
Sales Charge for the Periods Ended October 31, 2012
|
|
|
|
|
|
|
|
|
|
|
| 1 Year |
| 5 Years |
| 10 Years |
| Life of Class |
|
Class A3 |
| 2.82% |
| -0.92% |
| 10.71% |
| — |
|
Class B4 |
| 3.29% |
| -0.76% |
| 10.79% |
| — |
|
Class C5 |
| 7.30% |
| -0.42% |
| 10.63% |
| — |
|
Class F6 |
| 9.28% |
| 0.49% |
| — |
| 1.40% |
|
Class I7 |
| 9.39% |
| 0.58% |
| — |
| 9.22% |
|
Class R28 |
| 8.73% |
| -0.02% |
| — |
| 0.89% |
|
Class R39 |
| 8.85% |
| 0.08% |
| — |
| 0.99% |
|
|
1 Reflects the deduction of the maximum initial sales charge of 5.75%. |
2 Performance for each unmanaged index does not reflect any fees or expenses. The performance of each index is not necessarily representative of the Fund’s performance. |
3 Total return, which is the percentage change in net asset value, after deduction of the maximum initial sales charge of 5.75% applicable to Class A shares, with all dividends and distributions reinvested for the periods shown ended October 31, 2012, is calculated using the SEC-required uniform method to compute such return. |
4 Performance reflects the deduction of a CDSC of 5% for 1 year, 2% for 5 years, and 0% for 10 years. Class B shares automatically convert to Class A shares after approximately 8 years. (There is no initial sales charge for automatic conversions.) All returns for periods greater than 8 years reflect this conversion. |
5 The 1% CDSC for Class C shares normally applies before the first anniversary of the purchase date. Performance for other periods is at net asset value. |
6 Class F shares commenced operations and performance for the Class began on September 28, 2007. Performance is at net asset value. |
7 Class I shares commenced operations on October 19, 2004. Performance is at net asset value. |
8 Class R2 shares commenced operations and performance for the Class began on September 28, 2007. Performance is at net asset value. |
9 Class R3 shares commenced operations and performance for the Class began on September 28, 2007. Performance is at net asset value. |
12
|
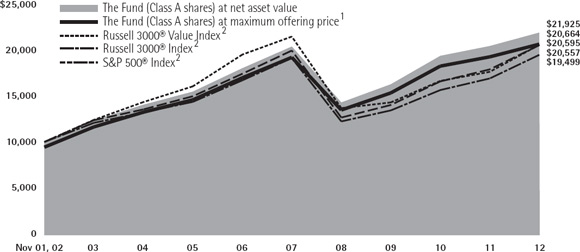
Fundamental Equity Fund |
Investment Comparison |
Below is a comparison of a $10,000 investment in Class A shares with the same investment in the Russell 3000® Value Index, Russell 3000® Index, and S&P 500® Index, assuming reinvestment of all dividends and distributions. The performance of other classes will be greater than or less than the performance shown in the graph below due to different sales loads and expenses applicable to such classes. The graph and performance table below do not reflect the deduction of taxes that a shareholder would pay on Fund distributions or the redemption of Fund shares. Past performance is no guarantee of future results.
Sales Charge for the Periods Ended October 31, 2012
|
|
|
|
|
|
|
|
|
|
|
| 1 Year |
| 5 Years |
| 10 Years |
| Life of Class |
|
Class A3 |
| 1.03% |
| 0.25% |
| 7.53% |
| — |
|
Class B4 |
| 1.47% |
| 0.42% |
| 7.62% |
| — |
|
Class C5 |
| 5.41% |
| 0.79% |
| 7.47% |
| — |
|
Class F6 |
| 7.40% |
| 1.69% |
| — |
| 1.78% |
|
Class I7 |
| 7.43% |
| 1.79% |
| — |
| 9.22% |
|
Class P8 |
| 7.03% |
| 1.33% |
| 8.05% |
| — |
|
Class R29 |
| 6.87% |
| 1.21% |
| — |
| 1.29% |
|
Class R310 |
| 6.95% |
| 1.29% |
| — |
| 1.37% |
|
|
1 Reflects the deduction of the maximum initial sales charge of 5.75%. |
2 Performance for each unmanaged index does not reflect any fees or expenses. The performance of each index is not necessarily representative of the Fund’s performance. |
3 Total return, which is the percentage change in net asset value, after deduction of the maximum initial sales charge of 5.75% applicable to Class A shares, with all dividends and distributions reinvested for the periods shown ended October 31, 2012, is calculated using the SEC-required uniform method to compute such return. |
4 Performance reflects the deduction of a CDSC of 5% for 1 year, 2% for 5 years, and 0% for 10 years. Class B shares automatically convert to Class A shares after approximately 8 years. (There is no initial sales charge for automatic conversions.) All returns for periods greater than 8 years reflect this conversion. |
5 The 1% CDSC for Class C shares normally applies before the first anniversary of the purchase date. Performance for other periods is at net asset value. |
6 Class F shares commenced operations and performance for the Class began on September 28, 2007. Performance is at net asset value. |
7 Class I shares commenced operations on March 31, 2003. |
Performance is at net asset value. |
8 Class P shares commenced operations on August 15, 2001. |
Performance is at net asset value. |
9 Class R2 shares commenced operations and performance for the Class began on September 28, 2007. Performance is at net asset value. |
10 Class R3 shares commenced operations and performance for the Class began on September 28, 2007. Performance is at net asset value. |
13
|
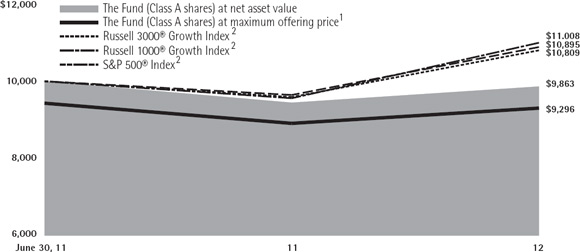
Growth Leaders Fund |
Investment Comparison |
Below is a comparison of a $10,000 investment in Class A shares with the same investment in the Russell 3000® Growth Index, Russell 1000® Growth Index and S&P 500® Index, assuming reinvestment of all dividends and distributions. The performance of other classes will be greater than or less than the performance shown in the graph below due to different sales loads and expenses applicable to such classes. The graph and performance table below do not reflect the deduction of taxes that a shareholder would pay on Fund distributions or the redemption of Fund shares. During certain periods, expenses of the Fund have been waived or reimbursed by Lord Abbett; without such waiver or reimbursement of expenses, the Fund’s returns would have been lower. Past performance is no guarantee of future results.
Sales Charge for the Periods Ended October 31, 2012
|
|
|
|
|
|
|
| 1 Year |
| Life of Class |
|
Class A3 |
| -1.50% |
| -5.33% |
|
Class C4 |
| 2.80% |
| -1.66% |
|
Class F5 |
| 4.69% |
| -0.82% |
|
Class I5 |
| 4.87% |
| -0.70% |
|
Class R25 |
| 4.83% |
| -0.83% |
|
Class R35 |
| 4.62% |
| -0.98% |
|
|
1 Reflects the deduction of the maximum initial sales charge of 5.75%. |
2 Performance for each unmanaged index does not reflect any fees or expenses. The performance of each index is not necessarily representative of the Fund’s performance. Performance for each index begins on June 30, 2011. |
3 Class A shares commenced operations on June 21, 2011 and performance for the Class began on June 30, 2011. Total return, which is the percentage change in net asset value, after deduction of the maximum initial sales charge of 5.75% applicable to Class A shares, with all dividends and distributions reinvested for the periods shown ended October 31, 2012, is calculated using the SEC-required uniform method to compute such return. |
4 Class C shares commenced operations on June 24, 2011 and performance for the Class began on June 30, 2011. The 1% CDSC for Class C shares normally applies before the first anniversary of the purchase date. Performance for other periods is at net asset value. |
5 Commenced operations on June 24, 2011 and performance for the Class began on June 30, 2011. Performance is at net asset value. |
14
|
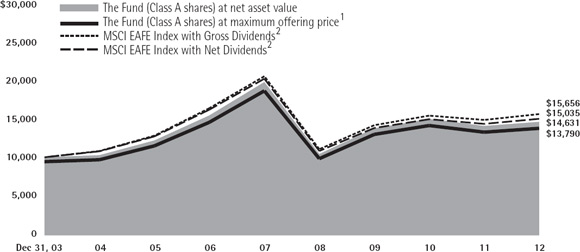
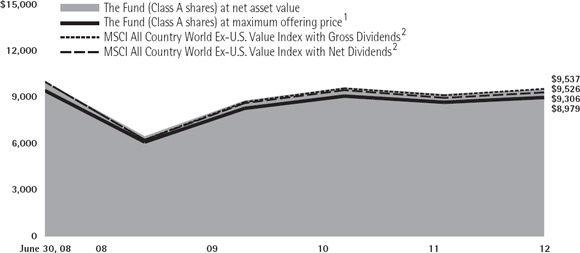
International Core Equity Fund |
Investment Comparison |
Below is a comparison of a $10,000 investment in Class A shares with the same investment in the Morgan Stanley Capital International Europe, Australasia, Far East Index (“MSCI EAFE® Index”) with Gross Dividends and the MSCI EAFE® Index with Net Dividends assuming reinvestment of all dividends and distributions. The MSCI EAFE Index with Net Dividends reflects a reduction in dividends after taking into account withholding of taxes by certain foreign countries represented in the MSCI EAFE Index. The performance of other classes will be greater than or less than the performance shown in the graph below due to different sales loads and expenses applicable to such classes. The graph and performance table below do not reflect the deduction of taxes that a shareholder would pay on Fund distributions or the redemption of Fund shares. During certain periods, expenses of the Fund have been waived or reimbursed by Lord Abbett; without such waiver or reimbursement of expenses, the Fund’s returns would have been lower. Past performance is no guarantee of future results.
Sales Charge for the Periods Ended October 31, 2012
|
|
|
|
|
|
|
|
|
| 1 Year |
| 5 Years |
| Life of Class |
|
Class A3 |
| -2.19% |
| -7.01% |
| 3.71% |
|
Class B4 |
| -1.87% |
| -6.84% |
| 3.80% |
|
Class C5 |
| 2.11% |
| -6.51% |
| 3.73% |
|
Class F6 |
| 4.02% |
| -5.68% |
| -4.87% |
|
Class I7 |
| 4.15% |
| -5.57% |
| 4.77% |
|
Class P8 |
| 3.63% |
| -6.00% |
| 4.29% |
|
Class R29 |
| 3.51% |
| -5.87% |
| -5.07% |
|
Class R310 |
| 3.68% |
| -6.01% |
| -5.21% |
|
|
1 Reflects the deduction of the maximum initial sales charge of 5.75%. |
2 Performance for each unmanaged index does not reflect any fees or expenses. The performance of each index is not necessarily representative of the Fund’s performance. Performance of each index begins on December 31, 2003. |
3 Class A shares commenced operations on December 15, 2003 and performance for the Class began on December 31, 2003. Total return, which is the percentage change in net asset value, after deduction of the maximum initial sales charge of 5.75% applicable to Class A shares, with all dividends and distributions reinvested for the periods shown ended October 31, 2012, is calculated using the SEC-required uniform method to compute such return. |
4 Class B shares commenced operations on December 15, 2003 and performance for the Class began on December 31, 2003. Performance reflects the deduction of a CDSC of 5% for 1 year, 2% for 5 years and 0% for the Life of the Class. Class B shares automatically convert to Class A shares after approximately 8 years. (There is no initial sales charge for automatic conversions.) All returns for periods greater than 8 years reflect this conversion. |
5 Class C shares commenced operations on December 15, 2003 and performance for the Class began on December 31, 2003. The 1% CDSC for Class C shares normally applies before the first anniversary of the purchase date. Performance for other periods is at net asset value. |
6 Class F shares commenced operations and performance for the Class began on September 28, 2007. Performance is at net asset value. |
7 Class I shares commenced operations on December 15, 2003 and performance for the Class began on December 31, 2003. Performance is at net asset value. |
8 Class P shares commenced operations on December 15, 2003 and performance for the Class began on December 31, 2003. Performance is at net asset value. |
9 Class R2 shares commenced operations and performance for the Class began on September 28, 2007. Performance is at net asset value. |
10 Class R3 shares commenced operations and performance for the Class began on September 28, 2007. Performance is at net asset value. |
15
|
International Dividend Income Fund |
Investment Comparison |
Below is a comparison of a $10,000 investment in Class A shares with the same investment in the Morgan Stanley Capital International (MSCI) All Country World Ex-U.S. Value Index with Gross Dividends and the MSCI All Country World Ex-U.S. Value Index with Net Dividends, assuming reinvestment of all dividends and distributions. The MSCI All Country World Ex-U.S. Value Index with Net Dividends reflects a reduction in dividends after taking into account withholding of taxes by certain foreign countries represented in the MSCI All Country World Ex-U.S. Value Index. The performance of other classes will be greater than or less than the performance shown in the graph below due to different sales loads and expenses applicable to such classes. The graph and performance table below do not reflect the deduction of taxes that a shareholder would pay on Fund distributions or the redemption of Fund shares. During certain periods, expenses of the Fund have been waived or reimbursed by Lord Abbett; without such waiver or reimbursements of expense, the Fund’s returns would have been lower. Past performance is no guarantee of future results.
Sales Charge for the Periods Ended October 31, 2012
|
|
|
|
|
|
|
| 1 Year |
| Life of Class |
|
Class A3 |
| -2.35% |
| -2.45% |
|
Class C4 |
| 1.96% |
| -1.74% |
|
Class F5 |
| 3.83% |
| -0.88% |
|
Class I6 |
| 3.91% |
| -0.75% |
|
Class R27 |
| 3.32% |
| -0.96% |
|
Class R38 |
| 3.39% |
| -1.12% |
|
|
1 Reflects the deduction of the maximum initial sales charge of 5.75%. |
2 Performance for each unmanaged index does not reflect any fees or expenses. The performance of each index is not necessarily representative of the Fund’s performance. Performance of each index begins on June 30, 2008. |
3 Class A shares commenced operations on June 23, 2008 and performance for the Class began on June 30, 2008. Total return, which is the percentage change in net asset value, after deduction of the maximum initial sales charge of 5.75% applicable to Class A shares, with all dividends and distributions reinvested for the periods shown ended October 31, 2012, is calculated using the SEC-required uniform method to compute such return. |
4 Class C shares commenced operations on June 23, 2008 and performance for the Class began on June 30, 2008. The 1% CDSC for Class C shares normally applies before the first anniversary of the purchase date. Performance for other periods is at net asset value. |
5 Class F shares commenced operations on June 23, 2008 and performance for the Class began on June 30, 2008. Performance is at net asset value. |
6 Class I shares commenced operations on June 23, 2008 and performance for the Class began on June 30, 2008. Performance is at net asset value. |
7 Class R2 shares commenced operations on June 23, 2008 and performance for the Class began on June 30, 2008. Performance is at net asset value. |
8 Class R3 shares commenced operations on June 23, 2008 and performance for the Class began on June 30, 2008. Performance is at net asset value. |
16
|
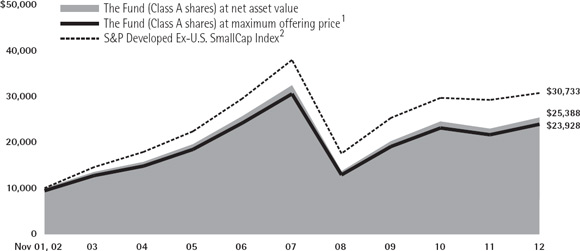
International Opportunities Fund |
Investment Comparison |
Below is a comparison of a $10,000 investment in Class A shares with the same investment in the S&P Developed Ex-U.S. SmallCap Index, assuming reinvestment of all dividends and distributions. The performance of other classes will be greater than or less than the performance shown in the graph below due to different sales loads and expenses applicable to such classes. The graph and performance table below do not reflect the deduction of taxes that a shareholder would pay on Fund distributions or the redemption of Fund shares. Past performance is no guarantee of future results.
Sales Charge for the Periods Ended October 31, 2012
|
|
|
|
|
|
|
|
|
|
|
| 1 Year |
| 5 Years |
| 10 Years |
| Life of Class |
|
Class A3 |
| 4.25% |
| -5.89% |
| 9.12% |
| — |
|
Class B4 |
| 4.95% |
| -5.72% |
| 9.16% |
| — |
|
Class C5 |
| 9.00% |
| -5.37% |
| 9.11% |
| — |
|
Class F6 |
| 10.83% |
| –4.54% |
| — |
| -3.49% |
|
Class I7 |
| 10.96% |
| -4.45% |
| 10.12% |
| — |
|
Class P7 |
| 10.49% |
| -4.87% |
| 9.72% |
| — |
|
Class R28 |
| 10.35% |
| -5.01% |
| — |
| -3.97% |
|
Class R39 |
| 10.49% |
| -4.85% |
| — |
| -3.80% |
|
|
1 Reflects the deduction of the maximum initial sales charge of 5.75%. |
2 Performance for the unmanaged index does not reflect any fees or expenses. The performance of the index is not necessarily representative of the Fund’s performance. |
3 Total return, which is the percentage change in net asset value, after deduction of the maximum initial sales charge of 5.75% applicable to Class A shares, with all dividends and distributions reinvested for the periods shown ended October 31, 2012, is calculated using the SEC-required uniform method to compute such return. |
4 Performance reflects the deduction of a CDSC of 5% for 1 year, 2% for 5 years, and 0% for 10 years. Class B shares automatically convert to Class A shares after approximately 8 years. (There is no initial sales charge for automatic conversions.) All returns for periods greater than 8 years reflect this conversion. |
5 The 1% CDSC for Class C shares normally applies before the first anniversary of the purchase date. Performance is at net asset value. |
6 Class F shares commenced operations and performance for the Class began on September 28, 2007. Performance is at net asset value. |
7 Performance is at net asset value. |
8 Class R2 shares commenced operations and performance for the Class began on September 28, 2007. Performance is at net asset value. |
9 Class R3 shares commenced operations and performance for the Class began on September 28, 2007. Performance is at net asset value. |
17
|
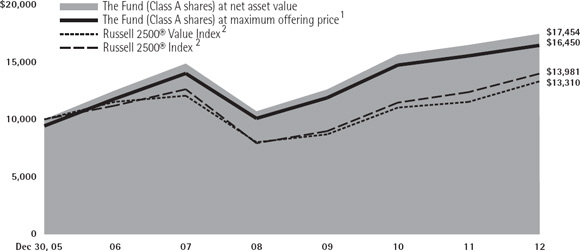
Value Opportunities Fund |
Investment Comparison |
Below is a comparison of a $10,000 investment in Class A shares with the same investment in the Russell 2500® Value Index and the Russell 2500® Index, assuming reinvestment of all dividends and distributions. The performance of other classes will be greater than or less than the performance shown in the graph below due to different sales loads and expenses applicable to such classes. The graph and performance table below do not reflect the deduction of taxes that a shareholder would pay on Fund distributions or the redemption of Fund shares. During certain periods, expenses of the Fund have been waived or reimbursed by Lord Abbett; without such waiver or reimbursement of expenses, the Fund’s returns would have been lower. Past performance is no guarantee of future results.
Sales Charge for the Periods Ended October 31, 2012
|
|
|
|
|
|
|
|
|
| 1 Year |
| 5 Years |
| Life of Class |
|
Class A3 |
| -0.17% |
| 2.06% |
| 7.55% |
|
Class B4 |
| 0.14% |
| 2.23% |
| 7.80% |
|
Class C5 |
| 4.21% |
| 2.60% |
| 7.80% |
|
Class F6 |
| 6.13% |
| 3.52% |
| 3.60% |
|
Class I7 |
| 6.21% |
| 3.62% |
| 8.86% |
|
Class P8 |
| 5.78% |
| 3.16% |
| 8.37% |
|
Class R29 |
| 5.61% |
| 3.01% |
| 3.09% |
|
Class R310 |
| 5.74% |
| 3.13% |
| 3.20% |
|
|
1 Reflects the deduction of the maximum initial sales charge of 5.75%. |
2 Performance for each unmanaged index does not reflect any fees or expenses. The performance of each index is not necessarily representative of the Fund’s performance. Performance for each index begins on December 30, 2005. |
3 Class A shares commenced operations on December 20, 2005 and performance for the Class began on December 30, 2005. Total return, which is the percentage change in net asset value, after deduction of the maximum initial sales charge of 5.75% applicable to Class A shares, with all dividends and distributions reinvested for the periods shown ended October 31, 2012, is calculated using the SEC-required uniform method to compute such return. |
4 Class B shares commenced operations on December 20, 2005 and performance for the Class began on December 30, 2005. Performance reflects the deduction of a CDSC of 5% for 1 year, 2% for 5 years, and 0% for Life of the Class. Class B shares automatically convert to Class A shares after approximately 8 years. (There is no initial sales charge for automatic conversions.) All returns for periods greater than 8 years reflect this conversion. |
5 Class C shares commenced operations on December 20, 2005 and performance for the Class began on December 30, 2005. The 1% CDSC for Class C shares normally applies before the first anniversary of the purchase date. Performance for other periods is at net asset value. |
6 Class F shares commenced operations and performance for the Class began on September 28, 2007. Performance is at net asset value. |
7 Class I shares commenced operations on December 20, 2005 and performance for the Class began on December 30, 2005. Performance is at net asset value. |
8 Class P shares commenced operations on December 20, 2005 and performance for the Class began on December 30, 2005. Performance is at net asset value. |
9 Class R2 shares commenced operations and performance for the Class began on September 28, 2007. Performance is at net asset value. |
10 Class R3 shares commenced operations and performance for the Class began on September 28, 2007. Performance is at net asset value. |
18
|
|
Expense Example |
As a shareholder of a Fund, you incur two types of costs: (1) transaction costs, including sales charges (loads) on purchase payments (these charges vary among the share classes); and (2) ongoing costs, including management fees; distribution and service (12b-1) fees (these charges vary among the share classes); and other Fund expenses. This Example is intended to help you understand your ongoing costs (in dollars) of investing in each Fund and to compare these costs with the ongoing costs of investing in other mutual funds.
The Example is based on an investment of $1,000 invested at the beginning of the period and held for the entire period (May 1, 2012 through October 31, 2012).
Actual Expenses
For each class of each Fund, the first line of the table on the following page provides information about actual account values and actual expenses. You may use the information in this line, together with the amount you invested, to estimate the expenses that you paid over the period. Simply divide your account value by $1,000 (for example, an $8,600 account value divided by $1,000 = 8.6), then multiply the result by the number in the first line under the heading titled “Expenses Paid During Period 5/1/12 – 10/31/12” to estimate the expenses you paid on your account during this period.
Hypothetical Example for Comparison Purposes
For each class of each Fund, the second line of the table on the following page provides information about hypothetical account values and hypothetical expenses based on the Fund’s actual expense ratio and an assumed rate of return of 5% per year before expenses, which is not the Fund’s actual return. The hypothetical account values and expenses may not be used to estimate the actual ending account balance or expenses you paid for the period. You may use this information to compare the ongoing costs of investing in each Fund and other funds. To do so, compare this 5% hypothetical example with the 5% hypothetical examples that appear in the shareholder reports of the other funds.
19
|
Alpha Strategy Fund |
Please note that the expenses shown in the table are meant to highlight your ongoing costs only and do not reflect any transactional costs, such as sales charges (loads). Therefore, the second line of the table is useful in comparing ongoing costs only, and will not help you determine the relative total costs of owning different funds. In addition, if these transactional costs were included, your costs would have been higher.
|
|
|
|
|
|
|
|
|
|
|
|
| Beginning |
| Ending |
| Expenses |
| |||
|
|
|
|
| ||||||
|
| 5/1/12 |
| 10/31/12 |
| 5/1/12 - |
| |||
|
|
|
|
| ||||||
Class A |
|
|
|
|
|
|
|
|
|
|
Actual |
| $ | 1,000.00 |
| $ | 979.80 |
| $ | 1.24 |
|
Hypothetical (5% Return Before Expenses) |
| $ | 1,000.00 |
| $ | 1,023.88 |
| $ | 1.27 |
|
Class B |
|
|
|
|
|
|
|
|
|
|
Actual |
| $ | 1,000.00 |
| $ | 976.30 |
| $ | 4.97 |
|
Hypothetical (5% Return Before Expenses) |
| $ | 1,000.00 |
| $ | 1,020.11 |
| $ | 5.08 |
|
Class C |
|
|
|
|
|
|
|
|
|
|
Actual |
| $ | 1,000.00 |
| $ | 976.10 |
| $ | 4.92 |
|
Hypothetical (5% Return Before Expenses) |
| $ | 1,000.00 |
| $ | 1,020.15 |
| $ | 5.03 |
|
Class F |
|
|
|
|
|
|
|
|
|
|
Actual |
| $ | 1,000.00 |
| $ | 980.60 |
| $ | 0.50 |
|
Hypothetical (5% Return Before Expenses) |
| $ | 1,000.00 |
| $ | 1,024.63 |
| $ | 0.51 |
|
Class I |
|
|
|
|
|
|
|
|
|
|
Actual |
| $ | 1,000.00 |
| $ | 981.20 |
| $ | 0.00 |
|
Hypothetical (5% Return Before Expenses) |
| $ | 1,000.00 |
| $ | 1,025.14 |
| $ | 0.00 |
|
Class R2 |
|
|
|
|
|
|
|
|
|
|
Actual |
| $ | 1,000.00 |
| $ | 977.90 |
| $ | 2.98 |
|
Hypothetical (5% Return Before Expenses) |
| $ | 1,000.00 |
| $ | 1,022.12 |
| $ | 3.05 |
|
Class R3 |
|
|
|
|
|
|
|
|
|
|
Actual |
| $ | 1,000.00 |
| $ | 978.70 |
| $ | 2.49 |
|
Hypothetical (5% Return Before Expenses) |
| $ | 1,000.00 |
| $ | 1,022.64 |
| $ | 2.54 |
|
|
|
† | For each class of the Fund, net expenses are equal to the annualized expense ratio for such class (0.25% for Class A, 1.00% for Class B, 0.99% for Class C, 0.10% for Class F, 0.00% for Class I, 0.60% for Class R2 and 0.50% for Class R3) multiplied by the average account value over the period, multiplied by 184/366 (to reflect one-half year period). |
|
|
Portfolio Holdings Presented by Portfolio Allocation |
October 31, 2012 |
|
|
| ||
Underlying Fund Name |
| %* | ||
Lord Abbett Developing Growth Fund, Inc. – Class I |
|
| 19.59 | % |
Lord Abbett Securities Trust – International Opportunities Fund – Class I |
|
| 20.43 | % |
Lord Abbett Securities Trust �� Micro-Cap Growth Fund – Class I |
|
| 9.81 | % |
Lord Abbett Securities Trust – Micro-Cap Value Fund – Class I |
|
| 10.26 | % |
Lord Abbett Equity Trust – Small-Cap Blend Fund – Class I |
|
| 9.95 | % |
Lord Abbett Research Fund, Inc. – Small-Cap Value Fund – Class I |
|
| 19.94 | % |
Lord Abbett Securities Trust – Value Opportunities Fund – Class I |
|
| 10.02 | % |
|
|
| 100.00 | % |
|
|
* | Represents percent of total investments. |
20
|
Fundamental Equity Fund |
Please note that the expenses shown in the table are meant to highlight your ongoing costs only and do not reflect any transactional costs, such as sales charges (loads). Therefore, the second line of the table is useful in comparing ongoing costs only, and will not help you determine the relative total costs of owning different funds. In addition, if these transactional costs were included, your costs would have been higher.
|
|
|
|
|
|
|
|
|
|
|
|
| Beginning |
| Ending |
| Expenses |
| |||
|
|
|
|
| ||||||
|
| 5/1/12 |
| 10/31/12 |
| 5/1/12 - |
| |||
|
|
|
|
| ||||||
Class A |
|
|
|
|
|
|
|
|
|
|
Actual |
| $ | 1,000.00 |
| $ | 979.80 |
| $ | 5.52 |
|
Hypothetical (5% Return Before Expenses) |
| $ | 1,000.00 |
| $ | 1,019.58 |
| $ | 5.63 |
|
Class B |
|
|
|
|
|
|
|
|
|
|
Actual |
| $ | 1,000.00 |
| $ | 976.30 |
| $ | 8.69 |
|
Hypothetical (5% Return Before Expenses) |
| $ | 1,000.00 |
| $ | 1,016.32 |
| $ | 8.87 |
|
Class C |
|
|
|
|
|
|
|
|
|
|
Actual |
| $ | 1,000.00 |
| $ | 976.20 |
| $ | 8.69 |
|
Hypothetical (5% Return Before Expenses) |
| $ | 1,000.00 |
| $ | 1,016.32 |
| $ | 8.87 |
|
Class F |
|
|
|
|
|
|
|
|
|
|
Actual |
| $ | 1,000.00 |
| $ | 980.40 |
| $ | 4.28 |
|
Hypothetical (5% Return Before Expenses) |
| $ | 1,000.00 |
| $ | 1,020.84 |
| $ | 4.37 |
|
Class I |
|
|
|
|
|
|
|
|
|
|
Actual |
| $ | 1,000.00 |
| $ | 981.30 |
| $ | 3.79 |
|
Hypothetical (5% Return Before Expenses) |
| $ | 1,000.00 |
| $ | 1,021.34 |
| $ | 3.86 |
|
Class P |
|
|
|
|
|
|
|
|
|
|
Actual |
| $ | 1,000.00 |
| $ | 978.80 |
| $ | 6.02 |
|
Hypothetical (5% Return Before Expenses) |
| $ | 1,000.00 |
| $ | 1,019.07 |
| $ | 6.14 |
|
Class R2 |
|
|
|
|
|
|
|
|
|
|
Actual |
| $ | 1,000.00 |
| $ | 978.70 |
| $ | 6.76 |
|
Hypothetical (5% Return Before Expenses) |
| $ | 1,000.00 |
| $ | 1,018.32 |
| $ | 6.90 |
|
Class R3 |
|
|
|
|
|
|
|
|
|
|
Actual |
| $ | 1,000.00 |
| $ | 978.80 |
| $ | 6.22 |
|
Hypothetical (5% Return Before Expenses) |
| $ | 1,000.00 |
| $ | 1,018.83 |
| $ | 6.34 |
|
|
|
† | For each class of the Fund, net expenses are equal to the annualized expense ratio for such class (1.11% for Class A, 1.75% for Classes B and C, 0.86% for Class F, 0.76% for Class I, 1.21% for Class P, 1.36% for Class R2 and 1.25% for Class R3) multiplied by the average account value over the period, multiplied by 184/366 (to reflect one-half year period). |
|
|
Portfolio Holdings Presented by Sector |
October 31, 2012 |
|
|
|
|
|
Sector* |
| %** | ||
Consumer Discretionary |
|
| 11.75 | % |
Consumer Staples |
|
| 6.03 | % |
Energy |
|
| 13.80 | % |
Financials |
|
| 24.78 | % |
Health Care |
|
| 17.81 | % |
Industrials |
|
| 5.78 | % |
|
|
|
|
|
Sector* |
| %** | ||
Information Technology |
|
| 7.92 | % |
Materials |
|
| 4.72 | % |
Telecommunication Services |
|
| 2.83 | % |
Utilities |
|
| 3.43 | % |
Short-Term Investment |
|
| 1.15 | % |
Total |
|
| 100.00 | % |
|
|
* | A sector may comprise several industries. |
** | Represents percent of total investments. |
21
|
Growth Leaders Fund |
Please note that the expenses shown in the table are meant to highlight your ongoing costs only and do not reflect any transactional costs, such as sales charges (loads). Therefore, the second line of the table is useful in comparing ongoing costs only, and will not help you determine the relative total costs of owning different funds. In addition, if these transactional costs were included, your costs would have been higher.
|
|
|
|
|
|
|
|
|
|
|
|
| Beginning |
| Ending |
| Expenses |
| |||
|
|
|
|
| ||||||
|
| 5/1/12 |
| 10/31/12 |
| 5/1/12 - |
| |||
|
|
|
|
| ||||||
Class A |
|
|
|
|
|
|
|
|
|
|
Actual |
|
| $1,000.00 |
| $ | 942.80 |
|
| $4.15 |
|
Hypothetical (5% Return Before Expenses) |
|
| $1,000.00 |
| $ | 1,020.86 |
|
| $4.32 |
|
Class C |
|
|
|
|
|
|
|
|
|
|
Actual |
|
| $1,000.00 |
| $ | 939.30 |
|
| $7.31 |
|
Hypothetical (5% Return Before Expenses) |
|
| $1,000.00 |
| $ | 1,017.62 |
|
| $7.61 |
|
Class F |
|
|
|
|
|
|
|
|
|
|
Actual |
|
| $1,000.00 |
| $ | 943.40 |
|
| $2.93 |
|
Hypothetical (5% Return Before Expenses) |
|
| $1,000.00 |
| $ | 1,022.12 |
|
| $3.05 |
|
Class I |
|
|
|
|
|
|
|
|
|
|
Actual |
|
| $1,000.00 |
| $ | 944.10 |
|
| $2.44 |
|
Hypothetical (5% Return Before Expenses) |
|
| $1,000.00 |
| $ | 1,022.62 |
|
| $2.54 |
|
Class R2 |
|
|
|
|
|
|
|
|
|
|
Actual |
|
| $1,000.00 |
| $ | 944.10 |
|
| $2.35 |
|
Hypothetical (5% Return Before Expenses) |
|
| $1,000.00 |
| $ | 1,022.71 |
|
| $2.44 |
|
Class R3 |
|
|
|
|
|
|
|
|
|
|
Actual |
|
| $1,000.00 |
| $ | 942.20 |
|
| $4.39 |
|
Hypothetical (5% Return Before Expenses) |
|
| $1,000.00 |
| $ | 1,020.62 |
|
| $4.57 |
|
|
|
† | For each class of the Fund, net expenses are equal to the annualized expense ratio for such class (0.85% for Class A, 1.50% for Class C, 0.60% for Class F, 0.50% for Class I, 0.48% for Class R2 and 0.90% for Class R3) multiplied by the average account value over the period, multiplied by 184/366 (to reflect one-half year period). |
|
|
Portfolio Holdings Presented by Sector |
|
|
|
|
|
Sector* |
|
| %** |
|
Consumer Discretionary |
|
| 14.31% |
|
Consumer Staples |
|
| 7.89% |
|
Energy |
|
| 7.35% |
|
Financials |
|
| 6.58% |
|
Health Care |
|
| 13.54% |
|
Industrials |
|
| 13.86% |
|
Information Technology |
|
| 31.89% |
|
Materials |
|
| 1.69% |
|
Telecommunication Services |
|
| 2.89% |
|
Total |
|
| 100.00% |
|
|
|
* | A sector may comprise several industries. |
** | Represents percent of total investments. |
22
|
International Core Equity Fund |
Please note that the expenses shown in the table are meant to highlight your ongoing costs only and do not reflect any transactional costs, such as sales charges (loads). Therefore, the second line of the table is useful in comparing ongoing costs only, and will not help you determine the relative total costs of owning different funds. In addition, if these transactional costs were included, your costs would have been higher.
|
|
|
|
|
|
|
|
|
|
|
|
| Beginning |
| Ending |
| Expenses |
| |||
|
|
|
|
| ||||||
|
| 5/1/12 |
| 10/31/12 |
| 5/1/12 - |
| |||
|
|
|
|
| ||||||
Class A |
|
|
|
|
|
|
|
|
|
|
Actual |
| $ | 1,000.00 |
| $ | 994.80 |
| $ | 5.62 |
|
Hypothetical (5% Return Before Expenses) |
| $ | 1,000.00 |
| $ | 1,019.50 |
| $ | 5.69 |
|
Class B |
|
|
|
|
|
|
|
|
|
|
Actual |
| $ | 1,000.00 |
| $ | 991.20 |
| $ | 8.86 |
|
Hypothetical (5% Return Before Expenses) |
| $ | 1,000.00 |
| $ | 1,016.25 |
| $ | 8.97 |
|
Class C |
|
|
|
|
|
|
|
|
|
|
Actual |
| $ | 1,000.00 |
| $ | 991.20 |
| $ | 8.76 |
|
Hypothetical (5% Return Before Expenses) |
| $ | 1,000.00 |
| $ | 1,016.35 |
| $ | 8.87 |
|
Class F |
|
|
|
|
|
|
|
|
|
|
Actual |
| $ | 1,000.00 |
| $ | 995.60 |
| $ | 4.36 |
|
Hypothetical (5% Return Before Expenses) |
| $ | 1,000.00 |
| $ | 1,020.77 |
| $ | 4.42 |
|
Class I |
|
|
|
|
|
|
|
|
|
|
Actual |
| $ | 1,000.00 |
| $ | 996.50 |
| $ | 3.86 |
|
Hypothetical (5% Return Before Expenses) |
| $ | 1,000.00 |
| $ | 1,021.27 |
| $ | 3.91 |
|
Class P |
|
|
|
|
|
|
|
|
|
|
Actual |
| $ | 1,000.00 |
| $ | 993.90 |
| $ | 6.11 |
|
Hypothetical (5% Return Before Expenses) |
| $ | 1,000.00 |
| $ | 1,019.00 |
| $ | 6.19 |
|
Class R2 |
|
|
|
|
|
|
|
|
|
|
Actual |
| $ | 1,000.00 |
| $ | 993.00 |
| $ | 6.86 |
|
Hypothetical (5% Return Before Expenses) |
| $ | 1,000.00 |
| $ | 1,018.25 |
| $ | 6.95 |
|
Class R3 |
|
|
|
|
|
|
|
|
|
|
Actual |
| $ | 1,000.00 |
| $ | 993.80 |
| $ | 6.31 |
|
Hypothetical (5% Return Before Expenses) |
| $ | 1,000.00 |
| $ | 1,018.80 |
| $ | 6.39 |
|
|
|
† | For each class of the Fund, net expenses are equal to the annualized expense ratio for such class (1.12% for Class A, 1.77% for Class B, 1.75% for Class C, 0.87% for Class F, 0.77% for Class I, 1.22% for Class P, 1.37% for Class R2 and 1.26% for Class R3) multiplied by the average account value over the period, multiplied by 184/366 (to reflect one-half year period). |
|
|
Portfolio Holdings Presented by Sector |
|
|
|
|
| |
Sector* |
| %** |
|
| |
Consumer Discretionary |
| 7.15% |
|
| |
Consumer Staples |
| 11.08% |
|
| |
Energy |
| 8.66% |
|
| |
Financials |
| 25.52% |
|
| |
Health Care |
| 7.58% |
|
| |
Industrials |
| 13.57% |
|
| |
| |||||
Sector* |
| %** |
|
| |
Information Technology |
| 5.13% |
|
| |
Materials |
| 10.48% |
|
| |
Telecommunication Services |
| 6.00% |
|
| |
Utilities |
| 3.78% |
|
| |
Short-Term Investment |
| 1.05% |
|
| |
Total |
| 100.00% |
|
| |
|
|
* | A sector may comprise several industries. |
** | Represents percent of total investments. |
23
|
International Dividend Income Fund |
Please note that the expenses shown in the table are meant to highlight your ongoing costs only and do not reflect any transactional costs, such as sales charges (loads). Therefore, the second line of the table is useful in comparing ongoing costs only, and will not help you determine the relative total costs of owning different funds. In addition, if these transactional costs were included, your costs would have been higher.
|
|
|
|
|
|
|
|
|
|
|
|
| Beginning |
| Ending |
| Expenses |
| |||
|
|
|
|
| ||||||
|
| 5/1/12 |
| 10/31/12 |
| 5/1/12 - |
| |||
|
|
|
|
| ||||||
Class A |
|
|
|
|
|
|
|
|
|
|
Actual |
| $ | 1,000.00 |
| $ | 1,005.00 |
| $ | 5.64 |
|
Hypothetical (5% Return Before Expenses) |
| $ | 1,000.00 |
| $ | 1,019.52 |
| $ | 5.69 |
|
Class C |
|
|
|
|
|
|
|
|
|
|
Actual |
| $ | 1,000.00 |
| $ | 1,002.20 |
| $ | 8.86 |
|
Hypothetical (5% Return Before Expenses) |
| $ | 1,000.00 |
| $ | 1,016.27 |
| $ | 8.92 |
|
Class F |
|
|
|
|
|
|
|
|
|
|
Actual |
| $ | 1,000.00 |
| $ | 1,006.10 |
| $ | 4.39 |
|
Hypothetical (5% Return Before Expenses) |
| $ | 1,000.00 |
| $ | 1,020.78 |
| $ | 4.42 |
|
Class I |
|
|
|
|
|
|
|
|
|
|
Actual |
| $ | 1,000.00 |
| $ | 1,007.80 |
| $ | 3.89 |
|
Hypothetical (5% Return Before Expenses) |
| $ | 1,000.00 |
| $ | 1,021.27 |
| $ | 3.91 |
|
Class R2 |
|
|
|
|
|
|
|
|
|
|
Actual |
| $ | 1,000.00 |
| $ | 1,005.20 |
| $ | 6.75 |
|
Hypothetical (5% Return Before Expenses) |
| $ | 1,000.00 |
| $ | 1,018.39 |
| $ | 6.80 |
|
Class R3 |
|
|
|
|
|
|
|
|
|
|
Actual |
| $ | 1,000.00 |
| $ | 1,004.10 |
| $ | 6.40 |
|
Hypothetical (5% Return Before Expenses) |
| $ | 1,000.00 |
| $ | 1,018.76 |
| $ | 6.44 |
|
|
|
† | For each class of the Fund, net expenses are equal to the annualized expense ratio for such class (1.12% for Class A, 1.76% for Class C, 0.87% for Class F, 0.77% for Class I, 1.34% for Class R2 and 1.27% for Class R3) multiplied by the average account value over the period, multiplied by 184/366 (to reflect one-half year period). |
|
|
|
|
|
|
|
Sector* |
| %** |
|
|
Consumer Discretionary |
| 9.17% |
|
|
Consumer Staples |
| 8.45% |
|
|
Energy |
| 9.46% |
|
|
Financials |
| 19.82% |
|
|
Health Care |
| 4.23% |
|
|
Industrials |
| 11.55% |
|
|
Information Technology |
| 3.06% |
|
|
Materials |
| 6.49% |
|
|
Telecommunication Services |
| 15.34% |
|
|
Utilities |
| 10.41% |
|
|
Short-Term Investment |
| 2.02% |
|
|
Total |
| 100.00% |
|
|
|
|
* | A sector may comprise several industries. |
** | Represents percent of total investments. |
24
|
International Opportunities Fund |
Please note that the expenses shown in the table are meant to highlight your ongoing costs only and do not reflect any transactional costs, such as sales charges (loads). Therefore, the second line of the table is useful in comparing ongoing costs only, and will not help you determine the relative total costs of owning different funds. In addition, if these transactional costs were included, your costs would have been higher.
|
|
|
|
|
|
|
|
|
|
|
|
| Beginning |
| Ending |
| Expenses |
| |||
|
|
|
|
| ||||||
|
| 5/1/12 |
| 10/31/2012 |
| 5/1/12 - |
| |||
|
|
|
|
| ||||||
Class A |
|
|
|
|
|
|
|
|
|
|
Actual |
| $ | 1,000.00 |
| $ | 1,011.50 |
| $ | 7.63 |
|
Hypothetical (5% Return Before Expenses) |
| $ | 1,000.00 |
| $ | 1,017.54 |
| $ | 7.66 |
|
Class B |
|
|
|
|
|
|
|
|
|
|
Actual |
| $ | 1,000.00 |
| $ | 1,008.90 |
| $ | 10.91 |
|
Hypothetical (5% Return Before Expenses) |
| $ | 1,000.00 |
| $ | 1,014.29 |
| $ | 10.94 |
|
Class C |
|
|
|
|
|
|
|
|
|
|
Actual |
| $ | 1,000.00 |
| $ | 1,008.90 |
| $ | 10.81 |
|
Hypothetical (5% Return Before Expenses) |
| $ | 1,000.00 |
| $ | 1,014.40 |
| $ | 10.84 |
|
Class F |
|
|
|
|
|
|
|
|
|
|
Actual |
| $ | 1,000.00 |
| $ | 1,013.20 |
| $ | 6.38 |
|
Hypothetical (5% Return Before Expenses) |
| $ | 1,000.00 |
| $ | 1,018.79 |
| $ | 6.39 |
|
Class I |
|
|
|
|
|
|
|
|
|
|
Actual |
| $ | 1,000.00 |
| $ | 1,013.50 |
| $ | 5.87 |
|
Hypothetical (5% Return Before Expenses) |
| $ | 1,000.00 |
| $ | 1,019.30 |
| $ | 5.89 |
|
Class P |
|
|
|
|
|
|
|
|
|
|
Actual |
| $ | 1,000.00 |
| $ | 1,011.40 |
| $ | 8.14 |
|
Hypothetical (5% Return Before Expenses) |
| $ | 1,000.00 |
| $ | 1,017.04 |
| $ | 8.16 |
|
Class R2 |
|
|
|
|
|
|
|
|
|
|
Actual |
| $ | 1,000.00 |
| $ | 1,010.80 |
| $ | 8.90 |
|
Hypothetical (5% Return Before Expenses) |
| $ | 1,000.00 |
| $ | 1,016.30 |
| $ | 8.92 |
|
Class R3 |
|
|
|
|
|
|
|
|
|
|
Actual |
| $ | 1,000.00 |
| $ | 1,010.90 |
| $ | 8.34 |
|
Hypothetical (5% Return Before Expenses) |
| $ | 1,000.00 |
| $ | 1,016.82 |
| $ | 8.36 |
|
|
|
† | For each class of the Fund, net expenses are equal to the annualized expense ratio for such class (1.51% for Class A, 2.16% for Class B, 2.14% for Class C, 1.26% for Class F, 1.16% for Class I, 1.61% for Class P, 1.76% for Class R2 and 1.65% for Class R3) multiplied by the average account value over the period, multiplied by 184/366 (to reflect one-half year period). |
|
|
Portfolio Holdings Presented by Sector |
|
|
|
|
|
Sector* |
| %** |
|
|
Consumer Discretionary |
| 20.14% |
|
|
Consumer Staples |
| 7.12% |
|
|
Energy |
| 8.56% |
|
|
Financials |
| 18.22% |
|
|
Health Care |
| 3.02% |
|
|
Industrials |
| 20.38% |
|
|
| ||||
Sector* |
| %** |
|
|
Information Technology |
| 7.76% |
|
|
Materials |
| 8.47% |
|
|
Telecommunication Services |
| 0.79% |
|
|
Utilities |
| 3.07% |
|
|
Short-Term Investment |
| 2.47% |
|
|
Total |
| 100.00% |
|
|
|
|
* | A sector may comprise several industries. |
** | Represents percent of total investments. |
25
|
Value Opportunities Fund |
Please note that the expenses shown in the table are meant to highlight your ongoing costs only and do not reflect any transactional costs, such as sales charges (loads). Therefore, the second line of the table is useful in comparing ongoing costs only, and will not help you determine the relative total costs of owning different funds. In addition, if these transactional costs were included, your costs would have been higher.
|
|
|
|
|
|
|
|
|
|
|
|
| Beginning |
| Ending |
| Expenses |
| |||
|
|
|
|
| ||||||
|
| 5/1/12 |
| 10/31/2012 |
| 5/1/12 - |
| |||
|
|
|
|
| ||||||
Class A |
|
|
|
|
|
|
|
|
|
|
Actual |
| $ | 1,000.00 |
| $ | 974.40 |
| $ | 6.65 |
|
Hypothetical (5% Return Before Expenses) |
| $ | 1,000.00 |
| $ | 1,018.42 |
| $ | 6.80 |
|
Class B |
|
|
|
|
|
|
|
|
|
|
Actual |
| $ | 1,000.00 |
| $ | 970.80 |
| $ | 9.86 |
|
Hypothetical (5% Return Before Expenses) |
| $ | 1,000.00 |
| $ | 1,015.15 |
| $ | 10.08 |
|
Class C |
|
|
|
|
|
|
|
|
|
|
Actual |
| $ | 1,000.00 |
| $ | 970.80 |
| $ | 9.86 |
|
Hypothetical (5% Return Before Expenses) |
| $ | 1,000.00 |
| $ | 1,015.15 |
| $ | 10.08 |
|
Class F |
|
|
|
|
|
|
|
|
|
|
Actual |
| $ | 1,000.00 |
| $ | 975.10 |
| $ | 5.41 |
|
Hypothetical (5% Return Before Expenses) |
| $ | 1,000.00 |
| $ | 1,019.68 |
| $ | 5.53 |
|
Class I |
|
|
|
|
|
|
|
|
|
|
Actual |
| $ | 1,000.00 |
| $ | 975.90 |
| $ | 4.92 |
|
Hypothetical (5% Return Before Expenses) |
| $ | 1,000.00 |
| $ | 1,020.18 |
| $ | 5.03 |
|
Class P |
|
|
|
|
|
|
|
|
|
|
Actual |
| $ | 1,000.00 |
| $ | 973.70 |
| $ | 7.14 |
|
Hypothetical (5% Return Before Expenses) |
| $ | 1,000.00 |
| $ | 1,017.92 |
| $ | 7.30 |
|
Class R2 |
|
|
|
|
|
|
|
|
|
|
Actual |
| $ | 1,000.00 |
| $ | 972.90 |
| $ | 7.89 |
|
Hypothetical (5% Return Before Expenses) |
| $ | 1,000.00 |
| $ | 1,017.16 |
| $ | 8.06 |
|
Class R3 |
|
|
|
|
|
|
|
|
|
|
Actual |
| $ | 1,000.00 |
| $ | 973.60 |
| $ | 7.39 |
|
Hypothetical (5% Return Before Expenses) |
| $ | 1,000.00 |
| $ | 1,017.67 |
| $ | 7.56 |
|
|
|
† | For each class of the Fund, net expenses are equal to the annualized expense ratio for such class (1.34% for Class A, 1.99% for Classes B and C, 1.09% for Class F, 0.99% for Class I, 1.44% for Class P, 1.59% for Class R2 and 1.49% for Class R3) multiplied by the average account value over the period, multiplied by 184/366 (to reflect one-half year period). |
|
|
Portfolio Holdings Presented by Sector |
|
|
|
|
|
Sector* |
| %** |
|
|
Consumer Discretionary |
| 8.99% |
|
|
Consumer Staples |
| 5.54% |
|
|
Energy |
| 5.29% |
|
|
Financials |
| 23.87% |
|
|
Health Care |
| 9.74% |
|
|
Industrials |
| 12.30% |
|
|
| ||||
Sector* |
| %** |
|
|
Information Technology |
| 15.55% |
|
|
Materials |
| 10.50% |
|
|
Utilities |
| 6.62% |
|
|
Short-Term Investment |
| 1.60% |
|
|
Total |
| 100.00% |
|
|
|
|
* | A sector may comprise several industries. |
** | Represents percent of total investments. |
26
|
Schedule of Investments |
ALPHA STRATEGY FUND October 31, 2012 |
|
|
|
|
|
|
|
|
Investments |
| Shares |
| Fair |
| ||
| |||||||
INVESTMENTS IN UNDERLYING |
|
|
|
|
|
|
|
FUNDS(a) 100.27% |
|
|
|
|
|
|
|
Lord Abbett Developing |
|
| 7,304,502 |
| $ | 168,734 |
|
Lord Abbett Securities |
|
| 13,041,845 |
|
| 175,935 |
|
Lord Abbett Securities |
|
| 5,771,909 |
|
| 84,501 |
|
Lord Abbett Securities |
|
| 3,236,470 |
|
| 88,420 |
|
Lord Abbett Equity |
|
| 5,134,095 |
|
| 85,739 |
|
Lord Abbett Research |
|
| 5,070,161 |
|
| 171,726 |
|
Lord Abbett Securities |
|
| 5,316,888 |
|
| 86,293 |
|
|
|
|
|
|
| ||
Total Investments in |
|
|
|
|
| 861,348 |
|
|
|
|
|
|
| ||
Liabilities in Excess of |
|
|
|
|
| (2,297 | ) |
|
|
|
|
|
| ||
Net Assets 100.00% |
|
|
|
| $ | 859,051 |
|
|
|
|
|
|
| ||
|
|
* | Non-income producing security. |
(a) | Affiliated issuers (See Note 10). |
(b) | Fund investment objective is long-term growth of capital through a diversified and actively managed portfolio consisting of developing growth companies, many of which are traded over the counter. |
(c) | Fund investment objective is long-term capital appreciation. |
(d) | Fund investment objective is to seek long-term growth of capital by investing primarily in stocks of small companies. |
|
|
|
| See Notes to Financial Statements. | 27 |
|
Schedule of Investments |
FUNDAMENTAL EQUITY FUND October 31, 2012 |
|
|
|
|
|
|
|
|
Investments |
| Shares |
| Fair |
| ||
| |||||||
COMMON STOCKS 99.05% |
|
|
|
|
|
|
|
|
|
|
|
|
|
|
|
Aerospace & Defense 0.46% |
|
|
|
|
|
|
|
United Technologies Corp. |
|
| 270,000 |
| $ | 21,103 |
|
|
|
|
|
|
| ||
|
|
|
|
|
|
|
|
Automobiles 1.07% |
|
|
|
|
|
|
|
Ford Motor Co. |
|
| 4,460,000 |
|
| 49,774 |
|
|
|
|
|
|
| ||
|
|
|
|
|
|
|
|
Beverages 1.62% |
|
|
|
|
|
|
|
Beam, Inc. |
|
| 168,900 |
|
| 9,384 |
|
Coca-Cola Co. (The) |
|
| 1,249,080 |
|
| 46,441 |
|
Diageo plc ADR |
|
| 170,000 |
|
| 19,421 |
|
|
|
|
|
|
| ||
Total |
|
|
|
|
| 75,246 |
|
|
|
|
|
|
| ||
|
|
|
|
|
|
|
|
Biotechnology 3.89% |
|
|
|
|
|
|
|
Celgene Corp.* |
|
| 1,035,000 |
|
| 75,886 |
|
Gilead Sciences, Inc.* |
|
| 204,300 |
|
| 13,721 |
|
Incyte Corp.* |
|
| 2,211,800 |
|
| 35,300 |
|
Onyx Pharmaceuticals, Inc.* |
|
| 705,000 |
|
| 55,244 |
|
|
|
|
|
|
| ||
Total |
|
|
|
|
| 180,151 |
|
|
|
|
|
|
| ||
|
|
|
|
|
|
|
|
Capital Markets 3.19% |
|
|
|
|
|
|
|
Affiliated Managers |
|
| 380,000 |
|
| 48,070 |
|
Franklin Resources, Inc. |
|
| 338,400 |
|
| 43,248 |
|
Raymond James Financial, |
|
| 1,475,000 |
|
| 56,256 |
|
|
|
|
|
|
| ||
Total |
|
|
|
|
| 147,574 |
|
|
|
|
|
|
| ||
|
|
|
|
|
|
|
|
Chemicals 1.97% |
|
|
|
|
|
|
|
Ashland, Inc. |
|
| 371,700 |
|
| 26,446 |
|
Celanese Corp. Series A |
|
| 265,000 |
|
| 10,067 |
|
E.I. du Pont de Nemours |
|
| 450,000 |
|
| 20,034 |
|
PPG Industries, Inc. |
|
| 145,000 |
|
| 16,977 |
|
Sigma-Aldrich Corp. |
|
| 250,000 |
|
| 17,535 |
|
|
|
|
|
|
| ||
Total |
|
|
|
|
| 91,059 |
|
|
|
|
|
|
| ||
|
|
|
|
|
|
|
|
Investments |
| Shares |
| Fair |
| ||
| |||||||
Commercial Banks 6.78% |
|
|
|
|
|
|
|
BB&T Corp. |
|
| 1,175,260 |
| $ | 34,024 |
|
Cullen/Frost Bankers, Inc. |
|
| 400,000 |
|
| 22,120 |
|
Fifth Third Bancorp |
|
| 2,950,000 |
|
| 42,863 |
|
PNC Financial Services |
|
| 1,107,700 |
|
| 64,457 |
|
Signature Bank* |
|
| 315,000 |
|
| 22,441 |
|
SunTrust Banks, Inc. |
|
| 749,951 |
|
| 20,399 |
|
U.S. Bancorp |
|
| 1,876,190 |
|
| 62,308 |
|
Wells Fargo & Co. |
|
| 1,345,000 |
|
| 45,313 |
|
|
|
|
|
|
| ||
Total |
|
|
|
|
| 313,925 |
|
|
|
|
|
|
| ||
|
|
|
|
|
|
|
|
Computers & Peripherals 1.05% |
|
|
|
|
|
|
|
EMC Corp.* |
|
| 1,030,000 |
|
| 25,152 |
|
NCR Corp.* |
|
| 1,106,900 |
|
| 23,555 |
|
|
|
|
|
|
| ||
Total |
|
|
|
|
| 48,707 |
|
|
|
|
|
|
| ||
|
|
|
|
|
|
|
|
Construction & Engineering 2.29% |
|
|
|
|
|
|
|
Jacobs Engineering |
|
|
|
|
|
|
|
Group, Inc.* |
|
| 1,025,000 |
|
| 39,555 |
|
URS Corp. |
|
| 1,990,000 |
|
| 66,625 |
|
|
|
|
|
|
| ||
Total |
|
|
|
|
| 106,180 |
|
|
|
|
|
|
| ||
|
|
|
|
|
|
|
|
Construction Materials 0.95% |
|
|
|
|
|
|
|
Berry Plastics Group, Inc.* |
|
| 1,625,600 |
|
| 23,035 |
|
Eagle Materials, Inc. |
|
| 396,900 |
|
| 21,024 |
|
|
|
|
|
|
| ||
Total |
|
|
|
|
| 44,059 |
|
|
|
|
|
|
| ||
|
|
|
|
|
|
|
|
Consumer Finance 2.36% |
|
|
|
|
|
|
|
Capital One Financial |
|
| 1,815,590 |
|
| 109,244 |
|
|
|
|
|
|
| ||
|
|
|
|
|
|
|
|
Diversified Financial Services 3.87% |
|
|
|
|
|
|
|
Bank of America Corp. |
|
| 4,560,000 |
|
| 42,499 |
|
Citigroup, Inc. |
|
| 1,870,000 |
|
| 69,920 |
|
JPMorgan Chase & Co. |
|
| 1,603,000 |
|
| 66,813 |
|
|
|
|
|
|
| ||
Total |
|
|
|
|
| 179,232 |
|
|
|
|
|
|
| ||
|
|
|
|
|
|
|
|
Diversified Telecommunication Services 2.83% |
|
|
|
|
|
|
|
AT&T, Inc. |
|
| 1,716,300 |
|
| 59,367 |
|
Verizon Communications, |
|
| 1,611,500 |
|
| 71,937 |
|
|
|
|
|
|
| ||
Total |
|
|
|
|
| 131,304 |
|
|
|
|
|
|
| ||
|
|
|
28 | See Notes to Financial Statements. |
|
|
Schedule of Investments (continued) |
FUNDAMENTAL EQUITY FUND October 31, 2012 |
|
|
|
|
|
|
|
|
Investments |
| Shares |
| Fair |
| ||
Electric: Utilities 2.21% |
|
|
|
|
|
|
|
Duke Energy Corp. |
|
| 548,100 |
| $ | 36,005 |
|
Edison International |
|
| 305,000 |
|
| 14,317 |
|
NextEra Energy, Inc. |
|
| 349,200 |
|
| 24,465 |
|
Xcel Energy, Inc. |
|
| 970,000 |
|
| 27,402 |
|
|
|
|
|
|
| ||
Total |
|
|
|
|
| 102,189 |
|
|
|
|
|
|
| ||
|
|
|
|
|
|
|
|
Electronic Equipment, Instruments & |
|
|
|
|
|
|
|
Anixter International, Inc. |
|
| 1,050,000 |
|
| 61,551 |
|
Arrow Electronics, Inc.* |
|
| 1,160,000 |
|
| 40,867 |
|
|
|
|
|
|
| ||
Total |
|
|
|
|
| 102,418 |
|
|
|
|
|
|
| ||
| |||||||
Energy Equipment & Services 4.33% |
|
|
|
|
|
|
|
Cameron International |
|
| 395,000 |
|
| 20,003 |
|
Ensco plc Class A |
|
| 334,500 |
|
| 19,341 |
|
GulfMark Offshore, Inc. |
|
| 360,000 |
|
| 11,635 |
|
Halliburton Co. |
|
| 2,500,000 |
|
| 80,725 |
|
Helmerich & Payne, Inc. |
|
| 194,087 |
|
| 9,277 |
|
Nabors Industries Ltd.* |
|
| 676,700 |
|
| 9,129 |
|
Schlumberger Ltd. |
|
| 570,000 |
|
| 39,632 |
|
Superior Energy Services, |
|
| 537,100 |
|
| 10,919 |
|
|
|
|
|
|
| ||
Total |
|
|
|
|
| 200,661 |
|
|
|
|
|
|
| ||
|
|
|
|
|
|
|
|
Food & Staples Retailing 0.50% |
|
|
|
|
|
|
|
CVS Caremark Corp. |
|
| 500,000 |
|
| 23,200 |
|
|
|
|
|
|
| ||
|
|
|
|
|
|
|
|
Food Products 3.91% |
|
|
|
|
|
|
|
Archer Daniels Midland Co. |
|
| 1,165,000 |
|
| 31,269 |
|
Bunge Ltd. |
|
| 895,000 |
|
| 63,572 |
|
H.J. Heinz Co. |
|
| 620,000 |
|
| 35,656 |
|
Kraft Foods Group, Inc.* |
|
| 405,833 |
|
| 18,457 |
|
Mondelez International, |
|
| 1,217,500 |
|
| 32,312 |
|
|
|
|
|
|
| ||
Total |
|
|
|
|
| 181,266 |
|
|
|
|
|
|
| ||
|
|
|
|
|
|
|
|
Investments |
| Shares |
| Fair |
| ||
Health Care Providers & Services 6.27% |
|
|
|
|
|
|
|
CIGNA Corp. |
|
| 1,153,140 |
| $ | 58,810 |
|
Community Health |
|
| 2,117,610 |
|
| 58,065 |
|
DaVita HealthCare |
|
| 385,000 |
|
| 43,320 |
|
Express Scripts |
|
| 1,360,000 |
|
| 83,694 |
|
Laboratory Corp. of |
|
| 547,700 |
|
| 46,407 |
|
|
|
|
|
|
| ||
Total |
|
|
|
|
| 290,296 |
|
|
|
|
|
|
| ||
|
|
|
|
|
|
|
|
Hotels, Restaurants & Leisure 1.21% |
|
|
|
|
|
|
|
Darden Restaurants, Inc. |
|
| 1,060,680 |
|
| 55,813 |
|
|
|
|
|
|
| ||
| |||||||
Insurance 6.54% |
|
|
|
|
|
|
|
ACE Ltd. (Switzerland)(a) |
|
| 659,300 |
|
| 51,854 |
|
Berkshire Hathaway, Inc. |
|
| 1,128,520 |
|
| 97,448 |
|
Marsh & McLennan |
|
| 790,000 |
|
| 26,884 |
|
Prudential Financial, Inc. |
|
| 960,000 |
|
| 54,768 |
|
Travelers Cos., Inc. (The) |
|
| 1,016,213 |
|
| 72,090 |
|
|
|
|
|
|
| ||
Total |
|
|
|
|
| 303,044 |
|
|
|
|
|
|
| ||
|
|
|
|
|
|
|
|
Internet Software & Services 1.42% |
|
|
|
|
|
|
|
eBay, Inc.* |
|
| 1,360,200 |
|
| 65,684 |
|
|
|
|
|
|
| ||
|
|
|
|
|
|
|
|
Life Sciences Tools & Services 2.75% |
|
|
|
|
|
|
|
Life Technologies Corp.* |
|
| 685,659 |
|
| 33,536 |
|
Thermo Fisher Scientific, |
|
| 1,539,650 |
|
| 94,011 |
|
|
|
|
|
|
| ||
Total |
|
|
|
|
| 127,547 |
|
|
|
|
|
|
| ||
|
|
|
|
|
|
|
|
Machinery 1.86% |
|
|
|
|
|
|
|
Eaton Corp. |
|
| 1,060,200 |
|
| 50,062 |
|
Kennametal, Inc. |
|
| 433,400 |
|
| 15,351 |
|
Nordson Corp. |
|
| 349,700 |
|
| 20,643 |
|
|
|
|
|
|
| ||
Total |
|
|
|
|
| 86,056 |
|
|
|
|
|
|
| ||
|
|
|
|
|
|
|
|
Marine 0.07% |
|
|
|
|
|
|
|
Kirby Corp.* |
|
| 55,459 |
|
| 3,188 |
|
|
|
|
|
|
| ||
|
|
|
| See Notes to Financial Statements. | 29 |
|
Schedule of Investments (continued) |
FUNDAMENTAL EQUITY FUND October 31, 2012 |
|
|
|
|
|
|
|
|
Investments |
| Shares |
| Fair |
| ||
| |||||||
Media 5.56% |
|
|
|
|
|
|
|
Comcast Corp. Class A |
|
| 1,390,000 |
| $ | 52,139 |
|
Interpublic Group of Cos., |
|
| 5,331,300 |
|
| 53,846 |
|
Omnicom Group, Inc. |
|
| 726,600 |
|
| 34,811 |
|
Time Warner, Inc. |
|
| 1,383,600 |
|
| 60,118 |
|
Walt Disney Co. (The) |
|
| 1,156,980 |
|
| 56,773 |
|
|
|
|
|
|
| ||
Total |
|
|
|
|
| 257,687 |
|
|
|
|
|
|
| ||
|
|
|
|
|
|
|
|
Metals & Mining 0.98% |
|
|
|
|
|
|
|
Reliance Steel & |
|
| 835,000 |
|
| 45,374 |
|
|
|
|
|
|
| ||
|
|
|
|
|
|
|
|
Multi-Line Retail 2.08% |
|
|
|
|
|
|
|
Macy’s, Inc. |
|
| 1,082,700 |
|
| 41,218 |
|
Target Corp. |
|
| 865,000 |
|
| 55,144 |
|
|
|
|
|
|
| ||
Total |
|
|
|
|
| 96,362 |
|
|
|
|
|
|
| ||
|
|
|
|
|
|
|
|
Multi-Utilities 1.23% |
|
|
|
|
|
|
|
Dominion Resources, Inc. |
|
| 664,060 |
|
| 35,049 |
|
PG&E Corp. |
|
| 520,000 |
|
| 22,110 |
|
|
|
|
|
|
| ||
Total |
|
|
|
|
| 57,159 |
|
|
|
|
|
|
| ||
|
|
|
|
|
|
|
|
Oil, Gas & Consumable Fuels 9.50% |
|
|
|
|
|
|
|
Anadarko Petroleum Corp. |
|
| 1,085,000 |
|
| 74,659 |
|
Apache Corp. |
|
| 398,900 |
|
| 33,009 |
|
Devon Energy Corp. |
|
| 615,000 |
|
| 35,799 |
|
EOG Resources, Inc. |
|
| 212,500 |
|
| 24,754 |
|
Exxon Mobil Corp. |
|
| 1,365,000 |
|
| 124,447 |
|
Kinder Morgan, Inc. |
|
| 1,140,000 |
|
| 39,569 |
|
Noble Energy, Inc. |
|
| 395,000 |
|
| 37,529 |
|
Occidental Petroleum Corp. |
|
| 585,000 |
|
| 46,192 |
|
Range Resources Corp. |
|
| 367,460 |
|
| 24,017 |
|
|
|
|
|
|
| ||
Total |
|
|
|
|
| 439,975 |
|
|
|
|
|
|
| ||
|
|
|
|
|
|
|
|
Paper & Forest Products 0.84% |
|
|
|
|
|
|
|
International Paper Co. |
|
| 1,080,000 |
|
| 38,696 |
|
|
|
|
|
|
| ||
|
|
|
|
|
|
|
|
Investments |
| Shares |
| Fair |
| ||
| |||||||
Pharmaceuticals 4.93% |
|
|
|
|
|
|
|
Eli Lilly & Co. |
|
| 1,658,890 |
| $ | 80,672 |
|
Teva Pharmaceutical |
|
| 1,807,820 |
|
| 73,072 |
|
Watson Pharmaceuticals, |
|
| 869,100 |
|
| 74,699 |
|
|
|
|
|
|
| ||
Total |
|
|
|
|
| 228,443 |
|
|
|
|
|
|
| ||
|
|
|
|
|
|
|
|
Real Estate Investment Trusts 0.90% |
|
|
|
|
|
|
|
CBL & Associates |
|
| 531,600 |
|
| 11,892 |
|
Vornado Realty Trust |
|
| 370,000 |
|
| 29,678 |
|
|
|
|
|
|
| ||
Total |
|
|
|
|
| 41,570 |
|
|
|
|
|
|
| ||
|
|
|
|
|
|
|
|
Real Estate Management & Development |
|
|
|
|
|
|
|
Jones Lang LaSalle, Inc. |
|
| 640,000 |
|
| 49,753 |
|
Realogy Holdings Corp.* |
|
| 165,300 |
|
| 5,875 |
|
|
|
|
|
|
| ||
Total |
|
|
|
|
| 55,628 |
|
|
|
|
|
|
| ||
|
|
|
|
|
|
|
|
Road & Rail 1.11% |
|
|
|
|
|
|
|
CSX Corp. |
|
| 2,039,500 |
|
| 41,749 |
|
Kansas City Southern |
|
| 122,300 |
|
| 9,840 |
|
|
|
|
|
|
| ||
Total |
|
|
|
|
| 51,589 |
|
|
|
|
|
|
| ||
|
|
|
|
|
|
|
|
Semiconductors & Semiconductor |
|
|
|
|
|
|
|
Altera Corp. |
|
| 325,700 |
|
| 9,927 |
|
Broadcom Corp. Class A* |
|
| 1,450,000 |
|
| 45,726 |
|
Texas Instruments, Inc. |
|
| 862,500 |
|
| 24,228 |
|
Xilinx, Inc. |
|
| 603,300 |
|
| 19,764 |
|
|
|
|
|
|
| ||
Total |
|
|
|
|
| 99,645 |
|
|
|
|
|
|
| ||
|
|
|
|
|
|
|
|
Software 1.11% |
|
|
|
|
|
|
|
Microsoft Corp. |
|
| 1,800,000 |
|
| 51,363 |
|
|
|
|
|
|
| ||
| |||||||
Specialty Retail 1.85% |
|
|
|
|
|
|
|
GNC Holdings, Inc. Class A |
|
| 643,600 |
|
| 24,888 |
|
Home Depot, Inc. (The) |
|
| 991,500 |
|
| 60,858 |
|
|
|
|
|
|
| ||
Total |
|
|
|
|
| 85,746 |
|
|
|
|
|
|
| ||
Total Common Stocks |
|
|
|
|
| 4,588,157 |
|
|
|
|
|
|
| ||
|
|
|
30 | See Notes to Financial Statements. |
|
|
Schedule of Investments (concluded) |
FUNDAMENTAL EQUITY FUND October 31, 2012 |
|
|
|
|
|
|
|
|
Investments |
| Principal |
| Fair |
| ||
| |||||||
SHORT-TERM INVESTMENT 1.15% |
|
|
|
|
|
|
|
|
|
|
|
|
|
|
|
Repurchase Agreement |
|
|
|
|
|
|
|
Repurchase Agreement |
| $ | 53,331 |
| $ | 53,331 |
|
|
|
|
|
|
| ||
Total Investments |
|
|
|
|
| 4,641,488 |
|
|
|
|
|
|
| ||
Liabilities in Excess of |
|
|
|
|
| (9,344 | ) |
|
|
|
|
|
| ||
Net Assets 100.00% |
|
|
|
| $ | 4,632,144 |
|
|
|
|
|
|
| ||
|
|
ADR | American Depositary Receipt. |
* | Non-income producing security. |
(a) | Foreign security traded in U.S. dollars. |
|
|
|
| See Notes to Financial Statements. | 31 |
Schedule of Investments
GROWTH LEADERS FUND October 31, 2012
|
|
|
|
|
|
|
|
Investments |
| Shares |
| Fair |
| ||
| |||||||
COMMON STOCKS 99.99% |
|
|
|
|
|
|
|
|
|
|
|
|
|
|
|
Aerospace & Defense 2.12% |
|
|
|
|
|
|
|
Honeywell International, Inc. |
|
| 8,249 |
| $ | 505 |
|
|
|
|
|
|
| ||
|
|
|
|
|
|
|
|
Biotechnology 4.92% |
|
|
|
|
|
|
|
Amgen, Inc. |
|
| 5,622 |
|
| 486 |
|
Gilead Sciences, Inc.* |
|
| 6,431 |
|
| 432 |
|
Onyx Pharmaceuticals, Inc.* |
|
| 3,216 |
|
| 252 |
|
|
|
|
|
|
| ||
Total |
|
|
|
|
| 1,170 |
|
|
|
|
|
|
| ||
|
|
|
|
|
|
|
|
Capital Markets 2.19% |
|
|
|
|
|
|
|
Affiliated Managers Group, |
|
| 2,147 |
|
| 272 |
|
Franklin Resources, Inc. |
|
| 1,944 |
|
| 248 |
|
|
|
|
|
|
| ||
Total |
|
|
|
|
| 520 |
|
|
|
|
|
|
| ||
|
|
|
|
|
|
|
|
Chemicals 1.69% |
|
|
|
|
|
|
|
Monsanto Co. |
|
| 4,676 |
|
| 402 |
|
|
|
|
|
|
| ||
|
|
|
|
|
|
|
|
Commercial Banks 1.11% |
|
|
|
|
|
|
|
U.S. Bancorp |
|
| 7,984 |
|
| 265 |
|
|
|
|
|
|
| ||
|
|
|
|
|
|
|
|
Communications Equipment 0.88% |
|
|
|
|
|
|
|
Riverbed Technology, Inc.* |
|
| 11,308 |
|
| 209 |
|
|
|
|
|
|
| ||
|
|
|
|
|
|
|
|
Computers & Peripherals 4.49% |
|
|
|
|
|
|
|
3D Systems Corp.* |
|
| 6,829 |
|
| 297 |
|
Apple, Inc. |
|
| 1,293 |
|
| 770 |
|
|
|
|
|
|
| ||
Total |
|
|
|
|
| 1,067 |
|
|
|
|
|
|
| ||
|
|
|
|
|
|
|
|
Consumer Finance 1.17% |
|
|
|
|
|
|
|
Capital One Financial Corp. |
|
| 4,642 |
|
| 279 |
|
|
|
|
|
|
| ||
|
|
|
|
|
|
|
|
Diversified Financial Services 1.03% |
|
|
|
|
|
|
|
JPMorgan Chase & Co. |
|
| 5,893 |
|
| 246 |
|
|
|
|
|
|
| ||
|
|
|
|
|
|
|
|
Diversified Telecommunication Services 2.89% |
|
|
|
|
|
|
|
Verizon Communications, Inc. |
|
| 15,412 |
|
| 688 |
|
|
|
|
|
|
| ||
|
|
|
|
|
|
|
|
Electronic Equipment, Instruments & |
|
|
|
|
|
|
|
Trimble Navigation Ltd.* |
|
| 5,592 |
|
| 264 |
|
|
|
|
|
|
| ||
|
|
|
|
|
|
|
|
Investments |
| Shares |
| Fair |
| ||
| |||||||
Energy Equipment & Services 3.45% |
|
|
|
|
|
|
|
Halliburton Co. |
|
| 8,140 |
| $ | 263 |
|
Oceaneering International, Inc. |
|
| 5,376 |
|
| 281 |
|
Seadrill Ltd. (Norway)(a) |
|
| 6,840 |
|
| 276 |
|
|
|
|
|
|
| ||
Total |
|
|
|
|
| 820 |
|
|
|
|
|
|
| ||
|
|
|
|
|
|
|
|
Food & Staples Retailing 6.22% |
|
|
|
|
|
|
|
Costco Wholesale Corp. |
|
| 3,865 |
|
| 380 |
|
Wal-Mart Stores, Inc. |
|
| 9,113 |
|
| 684 |
|
Whole Foods Market, Inc. |
|
| 4,394 |
|
| 416 |
|
|
|
|
|
|
| ||
Total |
|
|
|
|
| 1,480 |
|
|
|
|
|
|
| ||
|
|
|
|
|
|
|
|
Health Care Equipment & Supplies 2.22% |
|
|
|
|
|
|
|
Intuitive Surgical, Inc.* |
|
| 707 |
|
| 383 |
|
ResMed, Inc. |
|
| 3,628 |
|
| 145 |
|
|
|
|
|
|
| ||
Total |
|
|
|
|
| 528 |
|
|
|
|
|
|
| ||
|
|
|
|
|
|
|
|
Health Care Providers & Services 1.82% |
|
|
|
|
|
|
|
Express Scripts Holding Co.* |
|
| 7,044 |
|
| 434 |
|
|
|
|
|
|
| ||
|
|
|
|
|
|
|
|
Hotels, Restaurants & Leisure 2.64% |
|
|
|
|
|
|
|
Yum! Brands, Inc. |
|
| 8,944 |
|
| 627 |
|
|
|
|
|
|
| ||
|
|
|
|
|
|
|
|
Household Products 1.66% |
|
|
|
|
|
|
|
Colgate-Palmolive Co. |
|
| 3,761 |
|
| 395 |
|
|
|
|
|
|
| ||
|
|
|
|
|
|
|
|
Information Technology Services 6.70% |
|
|
|
|
|
|
|
Accenture plc Class A |
|
|
|
|
|
|
|
(Ireland)(a) |
|
| 6,471 |
|
| 436 |
|
MasterCard, Inc. Class A |
|
| 1,163 |
|
| 536 |
|
Visa, Inc. Class A |
|
| 4,477 |
|
| 622 |
|
|
|
|
|
|
| ||
Total |
|
|
|
|
| 1,594 |
|
|
|
|
|
|
| ||
|
|
|
|
|
|
|
|
Internet & Catalog Retail 1.31% |
|
|
|
|
|
|
|
Amazon.com, Inc.* |
|
| 1,333 |
|
| 310 |
|
|
|
|
|
|
| ||
|
|
|
|
|
|
|
|
Internet Software & Services 13.95% |
|
|
|
|
|
|
|
Cornerstone OnDemand, Inc.* |
|
| 2,421 |
|
| 68 |
|
CoStar Group, Inc.* |
|
| 3,131 |
|
| 259 |
|
eBay, Inc.* |
|
| 12,189 |
|
| 589 |
|
Facebook, Inc. Class A* |
|
| 32,104 |
|
| 678 |
|
Google, Inc. Class A* |
|
| 1,191 |
|
| 810 |
|
|
|
|
32 | See Notes to Financial Statements. |
|
Schedule of Investments (concluded)
GROWTH LEADERS FUND October 31, 2012
|
|
|
|
|
|
|
|
Investments |
| Shares |
| Fair |
| ||
| |||||||
Internet Software & Services (continued) |
|
|
|
|
|
|
|
LinkedIn Corp. Class A* |
|
| 3,593 |
| $ | 384 |
|
Rackspace Hosting, Inc.* |
|
| 4,457 |
|
| 284 |
|
Yelp, Inc.* |
|
| 10,255 |
|
| 247 |
|
|
|
|
|
|
| ||
Total |
|
|
|
|
| 3,319 |
|
|
|
|
|
|
| ||
|
|
|
|
|
|
|
|
Life Sciences Tools & Services 1.13% |
|
|
|
|
|
|
|
Illumina, Inc.* |
|
| 5,667 |
|
| 269 |
|
|
|
|
|
|
| ||
|
|
|
|
|
|
|
|
Machinery 5.14% |
|
|
|
|
|
|
|
Deere & Co. |
|
| 4,099 |
|
| 350 |
|
Middleby Corp.* |
|
| 2,317 |
|
| 290 |
|
Nordson Corp. |
|
| 4,611 |
|
| 272 |
|
Wabtec Corp. |
|
| 3,791 |
|
| 310 |
|
|
|
|
|
|
| ||
Total |
|
|
|
|
| 1,222 |
|
|
|
|
|
|
| ||
|
|
|
|
|
|
|
|
Media 3.81% |
|
|
|
|
|
|
|
Comcast Corp. Class A |
|
| 14,442 |
|
| 542 |
|
Walt Disney Co. (The) |
|
| 7,407 |
|
| 363 |
|
|
|
|
|
|
| ||
Total |
|
|
|
|
| 905 |
|
|
|
|
|
|
| ||
|
|
|
|
|
|
|
|
Oil, Gas & Consumable Fuels 3.90% |
|
|
|
|
|
|
|
Exxon Mobil Corp. |
|
| 4,053 |
|
| 369 |
|
Kosmos Energy Ltd.* |
|
| 20,995 |
|
| 239 |
|
Williams Cos., Inc. (The) |
|
| 9,140 |
|
| 320 |
|
|
|
|
|
|
| ||
Total |
|
|
|
|
| 928 |
|
|
|
|
|
|
| ||
|
|
|
|
|
|
|
|
Pharmaceuticals 3.45% |
|
|
|
|
|
|
|
Johnson & Johnson |
|
| 7,191 |
|
| 509 |
|
Watson Pharmaceuticals, Inc.* |
|
| 3,611 |
|
| 311 |
|
|
|
|
|
|
| ||
Total |
|
|
|
|
| 820 |
|
|
|
|
|
|
| ||
|
|
|
|
|
|
|
|
Real Estate Management & |
|
|
|
|
|
|
|
Zillow, Inc.* |
|
| 6,801 |
|
| 254 |
|
|
|
|
|
|
| ||
|
|
|
|
|
|
|
|
Road & Rail 4.04% |
|
|
|
|
|
|
|
Genesee & Wyoming, Inc. |
|
|
|
|
|
|
|
Class A* |
|
| 5,297 |
|
| 384 |
|
J.B. Hunt Transport Services, |
|
| 4,888 |
|
| 287 |
|
Kansas City Southern |
|
| 3,591 |
|
| 289 |
|
|
|
|
|
|
| ||
Total |
|
|
|
|
| 960 |
|
|
|
|
|
|
| ||
|
|
|
|
|
|
|
|
Investments |
| Shares |
| Fair |
| ||
| |||||||
Semiconductors & Semiconductor |
|
|
|
|
|
|
|
ARM Holdings plc ADR |
|
| 8,858 |
| $ | 287 |
|
Cree, Inc.* |
|
| 4,134 |
|
| 125 |
|
First Solar, Inc.* |
|
| 14,444 |
|
| 351 |
|
|
|
|
|
|
| ||
Total |
|
|
|
|
| 763 |
|
|
|
|
|
|
| ||
|
|
|
|
|
|
|
|
Software 1.55% |
|
|
|
|
|
|
|
Salesforce.com, Inc.* |
|
| 2,528 |
|
| 369 |
|
|
|
|
|
|
| ||
|
|
|
|
|
|
|
|
Specialty Retail 3.44% |
|
|
|
|
|
|
|
Home Depot, Inc. (The) |
|
| 9,194 |
|
| 565 |
|
Williams-Sonoma, Inc. |
|
| 5,479 |
|
| 253 |
|
|
|
|
|
|
| ||
Total |
|
|
|
|
| 818 |
|
|
|
|
|
|
| ||
|
|
|
|
|
|
|
|
Textiles, Apparel & Luxury Goods 3.12% |
|
|
|
|
|
|
|
Michael Kors Holdings Ltd. |
|
|
|
|
|
|
|
(Hong Kong)*(a) |
|
| 8,280 |
|
| 453 |
|
Tumi Holdings, Inc.* |
|
| 12,961 |
|
| 290 |
|
|
|
|
|
|
| ||
Total |
|
|
|
|
| 743 |
|
|
|
|
|
|
| ||
|
|
|
|
|
|
|
|
Trading Companies & Distributors 2.56% |
|
|
|
|
|
|
|
Fastenal Co. |
|
| 6,436 |
|
| 288 |
|
United Rentals, Inc.* |
|
| 7,894 |
|
| 321 |
|
|
|
|
|
|
| ||
Total |
|
|
|
|
| 609 |
|
|
|
|
|
|
| ||
|
|
|
|
|
|
|
|
Total Common Stocks |
|
|
|
|
| 23,782 |
|
|
|
|
|
|
| ||
Total Investments in Securities 99.99% |
|
|
|
|
| 23,782 |
|
|
|
|
|
|
| ||
Other Assets in Excess |
|
|
|
|
| 3 |
|
|
|
|
|
|
| ||
Net Assets 100.00% |
|
|
|
| $ | 23,785 |
|
|
|
|
|
|
| ||
|
|
ADR | American Depositary Receipt. |
* | Non-income producing security. |
(a) | Foreign security traded in U.S. dollars. |
|
|
|
| See Notes to Financial Statements. | 33 |
Schedule of Investments
INTERNATIONAL CORE EQUITY FUND October 31, 2012
|
|
|
|
|
|
|
|
Investments |
| Shares |
| U.S. $ |
| ||
| |||||||
COMMON STOCKS 97.57% |
|
|
|
|
|
|
|
|
|
|
|
|
|
|
|
Australia 2.18% |
|
|
|
|
|
|
|
|
|
|
|
|
|
|
|
Beverages 0.76% |
|
|
|
|
|
|
|
Coca-Cola Amatil Ltd. |
|
| 399,074 |
| $ | 5,572 |
|
|
|
|
|
|
| ||
|
|
|
|
|
|
|
|
Construction & Engineering 0.84% |
|
|
|
|
|
|
|
Leighton Holdings Ltd. |
|
| 331,447 |
|
| 6,159 |
|
|
|
|
|
|
| ||
|
|
|
|
|
|
|
|
Media 0.58% |
|
|
|
|
|
|
|
Seven West Media Ltd. |
|
| 3,368,578 |
|
| 4,248 |
|
|
|
|
|
|
| ||
Total Australia |
|
|
|
|
| 15,979 |
|
|
|
|
|
|
| ||
|
|
|
|
|
|
|
|
Belgium 0.97% |
|
|
|
|
|
|
|
|
|
|
|
|
|
|
|
Beverages |
|
|
|
|
|
|
|
Anheuser-Busch InBev NV |
|
| 85,108 |
|
| 7,116 |
|
|
|
|
|
|
| ||
|
|
|
|
|
|
|
|
Canada 3.21% |
|
|
|
|
|
|
|
|
|
|
|
|
|
|
|
Metals & Mining 2.75% |
|
|
|
|
|
|
|
Kinross Gold Corp. |
|
| 913,400 |
|
| 9,125 |
|
Yamana Gold, Inc. |
|
| 547,600 |
|
| 11,067 |
|
|
|
|
|
|
| ||
|
|
|
|
|
| 20,192 |
|
|
|
|
|
|
| ||
|
|
|
|
|
|
|
|
Oil, Gas & Consumable Fuels 0.46% |
|
|
|
|
|
|
|
Baytex Energy Corp. |
|
| 73,600 |
|
| 3,349 |
|
|
|
|
|
|
| ||
Total Canada |
|
|
|
|
| 23,541 |
|
|
|
|
|
|
| ||
|
|
|
|
|
|
|
|
China 2.08% |
|
|
|
|
|
|
|
|
|
|
|
|
|
|
|
Oil, Gas & Consumable Fuels 0.93% |
|
|
|
|
|
|
|
Yanzhou Coal Mining |
|
| 4,508,000 |
|
| 6,782 |
|
|
|
|
|
|
| ||
|
|
|
|
|
|
|
|
Real Estate Management & Development 1.15% |
|
|
|
|
|
|
|
China Overseas Land & |
|
| 3,230,000 |
|
| 8,461 |
|
|
|
|
|
|
| ||
Total China |
|
|
|
|
| 15,243 |
|
|
|
|
|
|
| ||
|
|
|
|
|
|
|
|
France 5.75% |
|
|
|
|
|
|
|
|
|
|
|
|
|
|
|
Aerospace & Defense 1.32% |
|
|
|
|
|
|
|
Safran SA |
|
| 243,243 |
|
| 9,678 |
|
|
|
|
|
|
| ||
|
|
|
|
|
|
|
|
Investments |
| Shares |
| U.S. $ |
| ||
| |||||||
Diversified Telecommunication Services 1.82% |
|
|
|
|
|
|
|
Vivendi SA |
|
| 652,693 |
| $ | 13,354 |
|
|
|
|
|
|
| ||
|
|
|
|
|
|
|
|
Electrical Equipment 0.81% |
|
|
|
|
|
|
|
Schneider Electric SA |
|
| 94,937 |
|
| 5,935 |
|
|
|
|
|
|
| ||
|
|
|
|
|
|
|
|
Food Products 0.82% |
|
|
|
|
|
|
|
Danone SA |
|
| 98,248 |
|
| 6,039 |
|
|
|
|
|
|
| ||
|
|
|
|
|
|
|
|
Insurance 0.98% |
|
|
|
|
|
|
|
AXA SA |
|
| 454,720 |
|
| 7,229 |
|
|
|
|
|
|
| ||
Total France |
|
|
|
|
| 42,235 |
|
|
|
|
|
|
| ||
|
|
|
|
|
|
|
|
Germany 4.55% |
|
|
|
|
|
|
|
|
|
|
|
|
|
|
|
Air Freight & Logistics 0.90% |
|
|
|
|
|
|
|
Deutsche Post AG Registered |
|
|
|
|
|
|
|
Shares |
|
| 333,810 |
|
| 6,618 |
|
|
|
|
|
|
| ||
|
|
|
|
|
|
|
|
Diversified Financial Services 1.21% |
|
|
|
|
|
|
|
Deutsche Boerse AG |
|
| 164,365 |
|
| 8,897 |
|
|
|
|
|
|
| ||
|
|
|
|
|
|
|
|
Health Care Equipment & Supplies 0.96% |
|
|
|
|
|
|
|
Fresenius SE & Co. KGaA |
|
| 61,672 |
|
| 7,034 |
|
|
|
|
|
|
| ||
|
|
|
|
|
|
|
|
Household Products 0.69% |
|
|
|
|
|
|
|
Henkel KGaA |
|
| 78,428 |
|
| 5,075 |
|
|
|
|
|
|
| ||
|
|
|
|
|
|
|
|
Software 0.79% |
|
|
|
|
|
|
|
SAP AG |
|
| 78,902 |
|
| 5,747 |
|
|
|
|
|
|
| ||
Total Germany |
|
|
|
|
| 33,371 |
|
|
|
|
|
|
| ||
|
|
|
|
|
|
|
|
Hong Kong 4.80% |
|
|
|
|
|
|
|
|
|
|
|
|
|
|
|
Chemicals 0.49% |
|
|
|
|
|
|
|
Huabao International |
|
| 7,186,000 |
|
| 3,588 |
|
|
|
|
|
|
| ||
|
|
|
|
|
|
|
|
Hotels, Restaurants & Leisure 1.18% |
|
|
|
|
|
|
|
SJM Holdings Ltd. |
|
| 3,975,000 |
|
| 8,658 |
|
|
|
|
|
|
| ||
|
|
|
|
|
|
|
|
Real Estate Management & Development 1.30% |
|
|
|
|
|
|
|
New World Development |
|
| 6,176,000 |
|
| 9,547 |
|
|
|
|
|
|
| ||
|
|
|
|
|
|
|
|
Water Utilities 1.06% |
|
|
|
|
|
|
|
Guangdong Investment Ltd. |
|
| 9,506,000 |
|
| 7,776 |
|
|
|
|
|
|
| ||
|
|
|
34 | See Notes to Financial Statements. |
|
Schedule of Investments (continued)
INTERNATIONAL CORE EQUITY FUND October 31, 2012
|
|
|
|
|
|
|
|
Investments |
| Shares |
| U.S. $ |
| ||
| |||||||
Hong Kong (continued) |
|
|
|
|
|
|
|
|
|
|
|
|
|
|
|
Wireless Telecommunication Services 0.77% |
|
|
|
|
|
|
|
China Mobile Ltd. |
|
| 512,500 |
| $ | 5,684 |
|
|
|
|
|
|
| ||
Total Hong Kong |
|
|
|
|
| 35,253 |
|
|
|
|
|
|
| ||
|
|
|
|
|
|
|
|
India 0.97% |
|
|
|
|
|
|
|
| |||||||
Commercial Banks |
|
|
|
|
|
|
|
Axis Bank Ltd. |
|
| 322,440 |
|
| 7,088 |
|
|
|
|
|
|
| ||
|
|
|
|
|
|
|
|
Indonesia 1.42% |
|
|
|
|
|
|
|
|
|
|
|
|
|
|
|
Commercial Banks 0.68% |
|
|
|
|
|
|
|
PT Bank Negara Indonesia |
|
| 12,468,814 |
|
| 4,998 |
|
|
|
|
|
|
| ||
|
|
|
|
|
|
|
|
Food Products 0.74% |
|
|
|
|
|
|
|
Indofood Sukses Makmur |
|
| 9,094,500 |
|
| 5,397 |
|
|
|
|
|
|
| ||
Total Indonesia |
|
|
|
|
| 10,395 |
|
|
|
|
|
|
| ||
|
|
|
|
|
|
|
|
Ireland 1.18% |
|
|
|
|
|
|
|
|
|
|
|
|
|
|
|
Pharmaceuticals |
|
|
|
|
|
|
|
Shire plc |
|
| 307,041 |
|
| 8,636 |
|
|
|
|
|
|
| ||
|
|
|
|
|
|
|
|
Israel 1.49% |
|
|
|
|
|
|
|
|
|
|
|
|
|
|
|
Pharmaceuticals |
|
|
|
|
|
|
|
Teva Pharmaceutical |
|
| 270,045 |
|
| 10,915 |
|
|
|
|
|
|
| ||
|
|
|
|
|
|
|
|
Japan 14.15% |
|
|
|
|
|
|
|
|
|
|
|
|
|
|
|
Airlines 1.02% |
|
|
|
|
|
|
|
Japan Airlines Co., Ltd. * |
|
| 156,500 |
|
| 7,450 |
|
|
|
|
|
|
| ||
|
|
|
|
|
|
|
|
Automobiles 1.64% |
|
|
|
|
|
|
|
Toyota Motor Corp. |
|
| 314,000 |
|
| 12,056 |
|
|
|
|
|
|
| ||
|
|
|
|
|
|
|
|
Chemicals 0.82% |
|
|
|
|
|
|
|
Asahi Kasei Corp. |
|
| 1,088,000 |
|
| 5,983 |
|
|
|
|
|
|
| ||
|
|
|
|
|
|
|
|
Commercial Banks 0.90% |
|
|
|
|
|
|
|
Bank of Yokohama Ltd. |
|
| 1,441,000 |
|
| 6,625 |
|
|
|
|
|
|
| ||
|
|
|
|
|
|
|
|
Investments |
| Shares |
| U.S. $ |
| ||
| |||||||
Consumer Finance 1.36% |
|
|
|
|
|
|
|
ORIX Corp. |
|
| 96,820 |
| $ | 9,945 |
|
|
|
|
|
|
| ||
|
|
|
|
|
|
|
|
Electronic Equipment, Instruments & |
|
|
|
|
|
|
|
Hitachi Ltd. |
|
| 1,854,000 |
|
| 9,824 |
|
|
|
|
|
|
| ||
|
|
|
|
|
|
|
|
Pharmaceuticals 1.04% |
|
|
|
|
|
|
|
Shionogi & Co., Ltd. |
|
| 460,200 |
|
| 7,633 |
|
|
|
|
|
|
| ||
|
|
|
|
|
|
|
|
Road & Rail 1.91% |
|
|
|
|
|
|
|
East Japan Railway Co. |
|
| 204,600 |
|
| 14,045 |
|
|
|
|
|
|
| ||
|
|
|
|
|
|
|
|
Tobacco 1.33% |
|
|
|
|
|
|
|
Japan Tobacco, Inc. |
|
| 354,400 |
|
| 9,793 |
|
|
|
|
|
|
| ||
|
|
|
|
|
|
|
|
Trading Companies & Distributors 1.31% |
|
|
|
|
|
|
|
Sumitomo Corp. |
|
| 705,300 |
|
| 9,612 |
|
|
|
|
|
|
| ||
|
|
|
|
|
|
|
|
Wireless Telecommunication Services 1.48% |
|
|
|
|
|
|
|
KDDI Corp. |
|
| 140,326 |
|
| 10,898 |
|
|
|
|
|
|
| ||
Total Japan |
|
|
|
|
| 103,864 |
|
|
|
|
|
|
| ||
|
|
|
|
|
|
|
|
Mexico 0.51% |
|
|
|
|
|
|
|
|
|
|
|
|
|
|
|
Construction & Engineering |
|
|
|
|
|
|
|
Empresas ICA SAB de CV * |
|
| 1,759,800 |
|
| 3,781 |
|
|
|
|
|
|
| ||
|
|
|
|
|
|
|
|
Netherlands 4.45% |
|
|
|
|
|
|
|
|
|
|
|
|
|
|
|
Beverages 1.50% |
|
|
|
|
|
|
|
Heineken Holding NV |
|
| 217,398 |
|
| 11,032 |
|
|
|
|
|
|
| ||
|
|
|
|
|
|
|
|
Diversified Financial Services 1.81% |
|
|
|
|
|
|
|
ING Groep NV CVA * |
|
| 1,505,770 |
|
| 13,303 |
|
|
|
|
|
|
| ||
|
|
|
|
|
|
|
|
Food & Staples Retailing 1.14% |
|
|
|
|
|
|
|
Koninklijke Ahold NV |
|
| 655,834 |
|
| 8,350 |
|
|
|
|
|
|
| ||
Total Netherlands |
|
|
|
|
| 32,685 |
|
|
|
|
|
|
| ||
|
|
|
|
|
|
|
|
New Zealand 1.43% |
|
|
|
|
|
|
|
|
|
|
|
|
|
|
|
Construction Materials |
|
|
|
|
|
|
|
Fletcher Building Ltd. |
|
| 1,816,157 |
|
| 10,515 |
|
|
|
|
|
|
| ||
|
|
|
| See Notes to Financial Statements. | 35 |
Schedule of Investments (continued)
INTERNATIONAL CORE EQUITY FUND October 31, 2012
|
|
|
|
|
|
|
|
Investments |
| Shares |
| U.S. $ |
| ||
| |||||||
Norway 5.79% |
|
|
|
|
|
|
|
|
|
|
|
|
|
|
|
Commercial Banks 1.58% |
|
|
|
|
|
|
|
DnB NOR ASA |
|
| 929,696 |
| $ | 11,610 |
|
|
|
|
|
|
| ||
|
|
|
|
|
|
|
|
Diversified Telecommunication Services 1.84% |
|
|
|
|
|
|
|
Telenor ASA |
|
| 685,497 |
|
| 13,478 |
|
|
|
|
|
|
| ||
|
|
|
|
|
|
|
|
Energy Equipment & Services 0.74% |
|
|
|
|
|
|
|
Ocean Rig UDW, Inc. * |
|
| 343,896 |
|
| 5,458 |
|
|
|
|
|
|
| ||
|
|
|
|
|
|
|
|
Insurance 1.63% |
|
|
|
|
|
|
|
Storebrand ASA * |
|
| 2,376,125 |
|
| 11,982 |
|
|
|
|
|
|
| ||
Total Norway |
|
|
|
|
| 42,528 |
|
|
|
|
|
|
| ||
|
|
|
|
|
|
|
|
Russia 1.86% |
|
|
|
|
|
|
|
|
|
|
|
|
|
|
|
Oil, Gas & Consumable Fuels 0.86% |
|
|
|
|
|
|
|
Gazprom OAO ADR |
|
| 686,400 |
|
| 6,270 |
|
|
|
|
|
|
| ||
|
|
|
|
|
|
|
|
Road & Rail 1.00% |
|
|
|
|
|
|
|
Globaltrans Investment |
|
| 397,860 |
|
| 7,361 |
|
|
|
|
|
|
| ||
Total Russia |
|
|
|
|
| 13,631 |
|
|
|
|
|
|
| ||
|
|
|
|
|
|
|
|
Singapore 2.14% |
|
|
|
|
|
|
|
|
|
|
|
|
|
|
|
Commercial Banks 0.90% |
|
|
|
|
|
|
|
DBS Group Holdings Ltd. |
|
| 576,100 |
|
| 6,565 |
|
|
|
|
|
|
| ||
|
|
|
|
|
|
|
|
Industrial Conglomerates 1.24% |
|
|
|
|
|
|
|
Keppel Corp., Ltd. |
|
| 1,042,400 |
|
| 9,109 |
|
|
|
|
|
|
| ||
Total Singapore |
|
|
|
|
| 15,674 |
|
|
|
|
|
|
| ||
|
|
|
|
|
|
|
|
South Korea 4.15% |
|
|
|
|
|
|
|
|
|
|
|
|
|
|
|
Automobiles 1.46% |
|
|
|
|
|
|
|
Hyundai Motor Co. |
|
| 52,190 |
|
| 10,743 |
|
|
|
|
|
|
| ||
|
|
|
|
|
|
|
|
Commercial Banks 0.93% |
|
|
|
|
|
|
|
DGB Financial Group, Inc. |
|
| 539,900 |
|
| 6,832 |
|
|
|
|
|
|
| ||
|
|
|
|
|
|
|
|
Semiconductors & Semiconductor Equipment 1.76% |
|
|
|
|
|
|
|
Samsung Electronics Co., Ltd. 10,754 |
|
|
|
|
| 12,917 |
|
|
|
|
|
|
| ||
Total South Korea |
|
|
|
|
| 30,492 |
|
|
|
|
|
|
| ||
|
|
|
|
|
|
|
|
Investments |
| Shares |
| U.S. $ |
| ||
| |||||||
Spain 1.36% |
|
|
|
|
|
|
|
|
|
|
|
|
|
|
|
Airlines 0.51% |
|
|
|
|
|
|
|
International Consolidated |
|
| 1,426,810 |
| $ | 3,714 |
|
|
|
|
|
|
| ||
|
|
|
|
|
|
|
|
Insurance 0.85% |
|
|
|
|
|
|
|
Mapfre SA |
|
| 2,257,240 |
|
| 6,255 |
|
|
|
|
|
|
| ||
Total Spain |
|
|
|
|
| 9,969 |
|
|
|
|
|
|
| ||
|
|
|
|
|
|
|
|
Sweden 1.02% |
|
|
|
|
|
|
|
|
|
|
|
|
|
|
|
Commercial Banks |
|
|
|
|
|
|
|
Swedbank AB A Shares |
|
| 403,866 |
|
| 7,489 |
|
|
|
|
|
|
| ||
|
|
|
|
|
|
|
|
Switzerland 6.64% |
|
|
|
|
|
|
|
|
|
|
|
|
|
|
|
Chemicals 1.70% |
|
|
|
|
|
|
|
Syngenta AG Registered |
|
| 31,945 |
|
| 12,479 |
|
|
|
|
|
|
| ||
|
|
|
|
|
|
|
|
Electrical Equipment 0.97% |
|
|
|
|
|
|
|
ABB Ltd. Registered Shares * |
|
| 396,446 |
|
| 7,143 |
|
|
|
|
|
|
| ||
|
|
|
|
|
|
|
|
Food Products 0.61% |
|
|
|
|
|
|
|
Nestle SA Registered Shares |
|
| 70,961 |
|
| 4,503 |
|
|
|
|
|
|
| ||
|
|
|
|
|
|
|
|
Insurance 1.22% |
|
|
|
|
|
|
|
Swiss Re Ltd. * |
|
| 129,705 |
|
| 8,962 |
|
|
|
|
|
|
| ||
|
|
|
|
|
|
|
|
Pharmaceuticals 2.14% |
|
|
|
|
|
|
|
Roche Holding Ltd. AG |
|
| 81,463 |
|
| 15,667 |
|
|
|
|
|
|
| ||
Total Switzerland |
|
|
|
|
| 48,754 |
|
|
|
|
|
|
| ||
|
|
|
|
|
|
|
|
Taiwan 1.17% |
|
|
|
|
|
|
|
|
|
|
|
|
|
|
|
Computers & Peripherals 0.42% |
|
|
|
|
|
|
|
Asustek Computer, Inc. |
|
| 291,000 |
|
| 3,118 |
|
|
|
|
|
|
| ||
|
|
|
|
|
|
|
|
Semiconductors & Semiconductor Equipment 0.75% |
|
|
|
|
|
|
|
Siliconware Precision |
|
| 1,144,500 |
|
| 5,494 |
|
|
|
|
|
|
| ||
Total Taiwan |
|
|
|
|
| 8,612 |
|
|
|
|
|
|
| ||
|
|
|
36 | See Notes to Financial Statements. |
Schedule of Investments (continued)
INTERNATIONAL CORE EQUITY FUND October 31, 2012
|
|
|
|
|
|
|
|
Investments |
| Shares |
| U.S. $ |
| ||
| |||||||
Thailand 0.97% |
|
|
|
|
|
|
|
|
|
|
|
|
|
|
|
Commercial Banks |
|
|
|
|
|
|
|
Bangkok Bank Public |
|
| 1,201,400 |
| $ | 7,095 |
|
|
|
|
|
|
| ||
|
|
|
|
|
|
|
|
United Kingdom 22.65% |
|
|
|
|
|
|
|
|
|
|
|
|
|
|
|
Commercial Banks 4.08% |
|
|
|
|
|
|
|
Barclays plc |
|
| 3,394,025 |
|
| 12,460 |
|
HSBC Holdings plc |
|
| 452,999 |
|
| 4,451 |
|
Lloyds Banking Group plc * |
|
| 19,913,946 |
|
| 13,039 |
|
|
|
|
|
|
| ||
|
|
|
|
|
| 29,950 |
|
|
|
|
|
|
| ||
|
|
|
|
|
|
|
|
Construction & Engineering 1.04% |
|
|
|
|
|
|
|
Balfour Beatty plc |
|
| 1,495,091 |
|
| 7,605 |
|
|
|
|
|
|
| ||
|
|
|
|
|
|
|
|
Electric: Utilities 1.39% |
|
|
|
|
|
|
|
SSE plc |
|
| 435,326 |
|
| 10,172 |
|
|
|
|
|
|
| ||
|
|
|
|
|
|
|
|
Food Products 1.41% |
|
|
|
|
|
|
|
Unilever plc |
|
| 277,937 |
|
| 10,365 |
|
|
|
|
|
|
| ||
|
|
|
|
|
|
|
|
Insurance 1.62% |
|
|
|
|
|
|
|
Prudential plc |
|
| 866,481 |
|
| 11,864 |
|
|
|
|
|
|
| ||
|
|
|
|
|
|
|
|
Media 2.19% |
|
|
|
|
|
|
|
British Sky Broadcasting |
|
|
|
|
|
|
|
Group plc |
|
| 438,583 |
|
| 5,018 |
|
WPP plc |
|
| 855,653 |
|
| 11,040 |
|
|
|
|
|
|
| ||
|
|
|
|
|
| 16,058 |
|
|
|
|
|
|
| ||
|
|
|
|
|
|
|
|
Metals & Mining 3.14% |
|
|
|
|
|
|
|
Anglo American plc |
|
| 305,082 |
|
| 9,369 |
|
Rio Tinto plc ADR |
|
| 274,500 |
|
| 13,720 |
|
|
|
|
|
|
| ||
|
|
|
|
|
| 23,089 |
|
|
|
|
|
|
| ||
|
|
|
|
|
|
|
|
Multi-Utilities 1.28% |
|
|
|
|
|
|
|
National Grid plc |
|
| 822,190 |
|
| 9,374 |
|
|
|
|
|
|
| ||
|
|
|
|
|
|
|
|
Oil, Gas & Consumable Fuels 5.56% |
|
|
|
|
|
|
|
Afren plc * |
|
| 3,904,098 |
|
| 8,675 |
|
BG Group plc |
|
| 431,080 |
|
| 7,983 |
|
Cairn Energy plc * |
|
| 2,548,524 |
|
| 11,528 |
|
Tullow Oil plc |
|
| 556,687 |
|
| 12,613 |
|
|
|
|
|
|
| ||
|
|
|
|
|
| 40,799 |
|
|
|
|
|
|
| ||
|
|
|
|
|
|
|
|
Investments |
| Shares |
| U.S. $ |
| ||
| |||||||
Tobacco 0.94% |
|
|
|
|
|
|
|
Imperial Tobacco Group plc |
|
| 183,361 |
| $ | 6,924 |
|
|
|
|
|
|
| ||
Total United Kingdom |
|
|
|
|
| 166,200 |
|
|
|
|
|
|
| ||
|
|
|
|
|
|
|
|
United States 0.68% |
|
|
|
|
|
|
|
|
|
|
|
|
|
|
|
Health Care Equipment & Supplies |
|
|
|
|
|
|
|
ResMed, Inc. |
|
| 124,700 |
|
| 4,981 |
|
|
|
|
|
|
| ||
Total Common Stocks |
|
|
|
|
| 716,042 |
|
|
|
|
|
|
| ||
|
|
|
|
|
|
|
|
|
| Principal |
|
|
|
| |
|
|
|
|
|
| ||
SHORT-TERM INVESTMENT 1.03% |
|
|
|
|
|
|
|
|
|
|
|
|
|
|
|
Repurchase Agreement |
|
|
|
|
|
|
|
Repurchase Agreement |
| $ | 7,580 |
|
| 7,580 |
|
|
|
|
|
|
| ||
Total Investments in Securities 98.60% |
|
|
|
|
| 723,622 |
|
|
|
|
|
|
| ||
Cash, Foreign Cash and Other |
|
|
|
|
| 10,251 |
|
|
|
|
|
|
| ||
Net Assets 100.00% |
|
|
|
| $ | 733,873 |
|
|
|
|
|
|
| ||
|
|
|
ADR |
| American Depositary Receipt. |
GDR |
| Global Depositary Receipt. |
* |
| Non-income producing security. |
† |
| Security was purchased pursuant to Rule 144A under the Securities Act of 1933 and, unless registered under such Act or exempted from registration, may only be resold to qualified institutional buyers. |
(a) |
| Cash, Foreign Cash and Other Assets in Excess of Liabilities include net unrealized depreciation on forward foreign currency exchange contracts as follows: |
|
|
|
| See Notes to Financial Statements. | 37 |
Open Forward Foreign Currency Exchange Contracts at October 31, 2012:
|
|
|
|
|
|
|
|
|
|
|
|
|
|
|
|
|
|
|
Forward |
| Transaction |
| Counterparty |
| Expiration |
| Foreign |
| U.S. $ |
| U.S. $ |
| Unrealized |
| |||
Australian dollar |
| Buy |
| J.P. Morgan |
| 11/13/2012 |
| 705,000 |
| $ | 710,471 |
| $ | 731,189 |
| $ | 20,718 |
|
Australian dollar |
| Buy |
| J.P. Morgan |
| 11/20/2012 |
| 2,080,000 |
|
| 2,118,875 |
|
| 2,156,073 |
|
| 37,198 |
|
Australian dollar |
| Buy |
| Deutsche Bank AG |
| 12/17/2012 |
| 1,355,000 |
|
| 1,387,791 |
|
| 1,401,469 |
|
| 13,678 |
|
Australian dollar |
| Buy |
| J.P. Morgan |
| 2/25/2013 |
| 19,670,000 |
|
| 20,015,995 |
|
| 20,235,965 |
|
| 219,970 |
|
Brazilian real |
| Buy |
| Barclays Bank plc |
| 12/7/2012 |
| 13,490,000 |
|
| 6,497,760 |
|
| 6,612,627 |
|
| 114,867 |
|
Canadian dollar |
| Sell |
| Goldman Sachs |
| 2/19/2013 |
| 2,096,000 |
|
| 2,136,290 |
|
| 2,093,595 |
|
| 42,695 |
|
Canadian dollar |
| Sell |
| J.P. Morgan |
| 2/25/2013 |
| 13,096,000 |
|
| 13,167,235 |
|
| 13,079,151 |
|
| 88,084 |
|
euro |
| Buy |
| Credit Suisse |
| 11/5/2012 |
| 2,080,000 |
|
| 2,633,093 |
|
| 2,696,061 |
|
| 62,968 |
|
euro |
| Buy |
| Morgan Stanley |
| 11/5/2012 |
| 2,335,000 |
|
| 2,902,568 |
|
| 3,026,588 |
|
| 124,020 |
|
euro |
| Buy |
| Barclays Bank plc |
| 11/19/2012 |
| 2,980,000 |
|
| 3,636,521 |
|
| 3,863,097 |
|
| 226,576 |
|
euro |
| Buy |
| Deutsche Bank AG |
| 11/19/2012 |
| 8,955,000 |
|
| 11,017,516 |
|
| 11,608,736 |
|
| 591,220 |
|
euro |
| Buy |
| Deutsche Bank AG |
| 11/19/2012 |
| 1,280,000 |
|
| 1,547,918 |
|
| 1,659,317 |
|
| 111,399 |
|
euro |
| Buy |
| J.P. Morgan |
| 11/19/2012 |
| 2,305,000 |
|
| 2,822,634 |
|
| 2,988,067 |
|
| 165,433 |
|
euro |
| Buy |
| Morgan Stanley |
| 11/19/2012 |
| 10,325,000 |
|
| 12,489,616 |
|
| 13,384,724 |
|
| 895,108 |
|
euro |
| Buy |
| Barclays Bank plc |
| 12/17/2012 |
| 2,265,000 |
|
| 2,844,500 |
|
| 2,937,078 |
|
| 92,578 |
|
euro |
| Buy |
| Barclays Bank plc |
| 12/17/2012 |
| 1,565,000 |
|
| 1,965,405 |
|
| 2,029,372 |
|
| 63,967 |
|
euro |
| Buy |
| Credit Suisse |
| 12/17/2012 |
| 1,470,000 |
|
| 1,818,655 |
|
| 1,906,183 |
|
| 87,528 |
|
euro |
| Buy |
| UBS AG |
| 12/17/2012 |
| 985,000 |
|
| 1,235,811 |
|
| 1,277,273 |
|
| 41,462 |
|
euro |
| Buy |
| Barclays Bank plc |
| 2/5/2013 |
| 3,500,000 |
|
| 4,519,774 |
|
| 4,540,836 |
|
| 21,062 |
|
euro |
| Buy |
| Goldman Sachs |
| 2/19/2013 |
| 3,521,000 |
|
| 4,566,948 |
|
| 4,568,681 |
|
| 1,733 |
|
Japanese yen |
| Sell |
| Barclays Bank plc |
| 11/19/2012 |
| 582,591,000 |
|
| 7,421,730 |
|
| 7,298,873 |
|
| 122,857 |
|
Japanese yen |
| Sell |
| Goldman Sachs |
| 11/19/2012 |
| 323,964,000 |
|
| 4,085,605 |
|
| 4,058,717 |
|
| 26,888 |
|
Japanese yen |
| Sell |
| Goldman Sachs |
| 11/30/2012 |
| 454,597,000 |
|
| 5,733,541 |
|
| 5,695,820 |
|
| 37,721 |
|
Russian ruble |
| Buy |
| UBS AG |
| 11/19/2012 |
| 46,900,000 |
|
| 1,408,599 |
|
| 1,490,855 |
|
| 82,256 |
|
Swiss franc |
| Buy |
| J.P. Morgan |
| 2/25/2013 |
| 4,875,000 |
|
| 5,236,586 |
|
| 5,244,668 |
|
| 8,082 |
|
|
|
|
|
|
|
|
|
|
|
|
|
|
|
|
| |||
Unrealized Appreciation on Forward Foreign Currency Exchange Contracts |
|
|
|
| $ | 3,300,068 |
| |||||||||||
|
|
|
|
| ||||||||||||||
|
|
|
38 | See Notes to Financial Statements. |
Schedule of Investments (concluded)
INTERNATIONAL CORE EQUITY FUND October 31, 2012
|
|
|
|
|
|
|
|
|
|
|
|
|
|
|
| |||
Forward |
| Transaction |
| Counterparty |
| Expiration |
| Foreign |
| U.S. $ |
| U.S. $ |
| Unrealized |
| |||
Australian dollar |
| Buy |
| Morgan Stanley |
| 12/3/2012 |
| 2,060,000 |
| $ | 2,145,622 |
| $ | 2,133,150 |
| $ | (12,472 | ) |
Australian dollar |
| Buy |
| Deutsche Bank AG |
| 12/10/2012 |
| 2,035,000 |
|
| 2,117,011 |
|
| 2,106,025 |
|
| (10,986 | ) |
Australian dollar |
| Buy |
| UBS AG |
| 12/13/2012 |
| 2,990,000 |
|
| 3,126,045 |
|
| 3,093,578 |
|
| (32,467 | ) |
Australian dollar |
| Buy |
| Barclays Bank plc |
| 12/17/2012 |
| 2,485,000 |
|
| 2,573,267 |
|
| 2,570,222 |
|
| (3,045 | ) |
Australian dollar |
| Buy |
| UBS AG |
| 1/22/2013 |
| 4,050,000 |
|
| 4,209,570 |
|
| 4,177,216 |
|
| (32,354 | ) |
British pound |
| Sell |
| Barclays Bank plc |
| 12/17/2012 |
| 2,305,000 |
|
| 3,656,952 |
|
| 3,719,160 |
|
| (62,208 | ) |
British pound |
| Sell |
| UBS AG |
| 2/12/2013 |
| 1,195,000 |
|
| 1,913,111 |
|
| 1,927,792 |
|
| (14,681 | ) |
British pound |
| Sell |
| J.P. Morgan |
| 2/25/2013 |
| 9,035,000 |
|
| 14,410,825 |
|
| 14,574,749 |
|
| (163,924 | ) |
euro |
| Sell |
| Deutsche Bank AG |
| 11/5/2012 |
| 1,100,000 |
|
| 1,420,293 |
|
| 1,425,802 |
|
| (5,509 | ) |
euro |
| Sell |
| UBS AG |
| 11/19/2012 |
| 9,705,000 |
|
| 11,748,582 |
|
| 12,580,992 |
|
| (832,410 | ) |
euro |
| Buy |
| UBS AG |
| 1/22/2013 |
| 6,355,000 |
|
| 8,355,681 |
|
| 8,243,806 |
|
| (111,875 | ) |
euro |
| Buy |
| Deutsche Bank AG |
| 2/5/2013 |
| 5,905,000 |
|
| 7,663,479 |
|
| 7,661,038 |
|
| (2,441 | ) |
Israeli new shekel |
| Sell |
| J.P. Morgan |
| 1/31/2013 |
| 27,290,000 |
|
| 6,938,436 |
|
| 7,002,975 |
|
| (64,539 | ) |
Japanese yen |
| Buy |
| J.P. Morgan |
| 11/19/2012 |
| 128,270,000 |
|
| 1,642,150 |
|
| 1,607,005 |
|
| (35,145 | ) |
Japanese yen |
| Buy |
| J.P. Morgan |
| 11/19/2012 |
| 445,385,000 |
|
| 5,646,004 |
|
| 5,579,916 |
|
| (66,088 | ) |
Japanese yen |
| Buy |
| UBS AG |
| 11/19/2012 |
| 332,900,000 |
|
| 4,226,121 |
|
| 4,170,670 |
|
| (55,451 | ) |
Japanese yen |
| Buy |
| UBS AG |
| 11/30/2012 |
| 902,880,000 |
|
| 11,536,737 |
|
| 11,312,530 |
|
| (224,207 | ) |
Japanese yen |
| Buy |
| Morgan Stanley |
| 12/3/2012 |
| 279,045,000 |
|
| 3,573,638 |
|
| 3,496,344 |
|
| (77,294 | ) |
Japanese yen |
| Buy |
| J.P. Morgan |
| 1/7/2013 |
| 214,035,000 |
|
| 2,734,573 |
|
| 2,683,052 |
|
| (51,521 | ) |
Japanese yen |
| Buy |
| Barclays Bank plc |
| 1/10/2013 |
| 297,090,000 |
|
| 3,775,424 |
|
| 3,724,289 |
|
| (51,135 | ) |
Japanese yen |
| Buy |
| Deutsche Bank AG |
| 1/10/2013 |
| 405,455,000 |
|
| 5,187,931 |
|
| 5,082,741 |
|
| (105,190 | ) |
Japanese yen |
| Buy |
| Credit Suisse |
| 2/12/2013 |
| 712,810,000 |
|
| 9,077,838 |
|
| 8,938,386 |
|
| (139,452 | ) |
New Zealand dollar |
| Sell |
| Goldman Sachs |
| 2/19/2013 |
| 3,825,000 |
|
| 3,096,395 |
|
| 3,123,528 |
|
| (27,133 | ) |
Norwegian krone |
| Sell |
| UBS AG |
| 11/19/2012 |
| 13,400,000 |
|
| 2,183,655 |
|
| 2,348,911 |
|
| (165,256 | ) |
Norwegian krone |
| Sell |
| J.P. Morgan |
| 12/10/2012 |
| 9,040,000 |
|
| 1,505,412 |
|
| 1,583,442 |
|
| (78,030 | ) |
Norwegian krone |
| Sell |
| UBS AG |
| 12/10/2012 |
| 10,045,000 |
|
| 1,682,608 |
|
| 1,759,477 |
|
| (76,869 | ) |
Norwegian krone |
| Sell |
| Barclays Bank plc |
| 12/17/2012 |
| 22,325,000 |
|
| 3,797,415 |
|
| 3,909,443 |
|
| (112,028 | ) |
Norwegian krone |
| Sell |
| Deutsche Bank AG |
| 1/14/2013 |
| 25,820,000 |
|
| 4,449,085 |
|
| 4,516,832 |
|
| (67,747 | ) |
Norwegian krone |
| Sell |
| J.P. Morgan |
| 2/25/2013 |
| 62,200,000 |
|
| 10,809,496 |
|
| 10,864,076 |
|
| (54,580 | ) |
Singapore dollar |
| Sell |
| J.P. Morgan |
| 12/10/2012 |
| 1,070,000 |
|
| 862,069 |
|
| 877,164 |
|
| (15,095 | ) |
South African rand |
| Buy |
| Deutsche Bank AG |
| 12/18/2012 |
| 22,100,000 |
|
| 2,579,982 |
|
| 2,531,327 |
|
| (48,655 | ) |
South Korean won |
| Sell |
| Deutsche Bank AG |
| 11/19/2012 |
| 2,673,090,000 |
|
| 2,320,592 |
|
| 2,449,057 |
|
| (128,465 | ) |
South Korean won |
| Sell |
| Deutsche Bank AG |
| 12/17/2012 |
| 8,976,808,000 |
|
| 7,891,699 |
|
| 8,213,225 |
|
| (321,526 | ) |
South Korean won |
| Sell |
| Goldman Sachs |
| 1/14/2013 |
| 5,045,500,000 |
|
| 4,447,922 |
|
| 4,609,772 |
|
| (161,850 | ) |
|
|
|
|
|
|
|
|
|
|
|
|
|
|
|
|
| ||
Unrealized Depreciation on Forward Foreign Currency Exchange Contracts |
|
|
|
| $ | (3,411,628 | ) | |||||||||||
|
|
|
|
|
| |||||||||||||
|
|
|
| See Notes to Financial Statements. | 39 |
|
Schedule of Investments |
INTERNATIONAL DIVIDEND INCOME FUND October 31, 2012 |
|
|
|
|
|
|
|
|
Investments |
| Shares |
| U.S. $ |
| ||
| |||||||
LONG-TERM INVESTMENTS 96.15% |
|
|
|
|
|
|
|
|
|
|
|
|
|
|
|
COMMON STOCKS 94.58% |
|
|
|
|
|
|
|
|
|
|
|
|
|
|
|
Australia 9.50% |
|
|
|
|
|
|
|
|
|
|
|
|
|
|
|
Air Freight & Logistics 0.72% |
|
|
|
|
|
|
|
Toll Holdings Ltd. |
|
| 2,714,563 |
| $ | 12,511 |
|
|
|
|
|
|
| ||
|
|
|
|
|
|
|
|
Beverages 0.59% |
|
|
|
|
|
|
|
Coca-Cola Amatil Ltd. |
|
| 734,431 |
|
| 10,254 |
|
|
|
|
|
|
| ||
|
|
|
|
|
|
|
|
Commercial Banks 1.28% |
|
|
|
|
|
|
|
National Australia Bank Ltd. |
|
| 837,015 |
|
| 22,408 |
|
|
|
|
|
|
| ||
|
|
|
|
|
|
|
|
Construction & Engineering 0.90% |
|
|
|
|
|
|
|
Leighton Holdings Ltd. |
|
| 848,671 |
|
| 15,769 |
|
|
|
|
|
|
| ||
|
|
|
|
|
|
|
|
Diversified Telecommunication Services 1.06% |
|
|
|
|
|
|
|
Telstra Corp., Ltd. |
|
| 4,312,331 |
|
| 18,532 |
|
|
|
|
|
|
| ||
|
|
|
|
|
|
|
|
Electric: Utilities 1.89% |
|
|
|
|
|
|
|
Spark Infrastructure |
|
| 18,818,884 |
|
| 33,014 |
|
|
|
|
|
|
| ||
|
|
|
|
|
|
|
|
Food & Staples Retailing 1.23% |
|
|
|
|
|
|
|
Metcash Ltd. |
|
| 5,678,053 |
|
| 21,573 |
|
|
|
|
|
|
| ||
|
|
|
|
|
|
|
|
Health Care Providers & Services 0.24% |
|
|
|
|
|
|
|
Sonic Healthcare Ltd. |
|
| 315,598 |
|
| 4,259 |
|
|
|
|
|
|
| ||
|
|
|
|
|
|
|
|
Media 0.71% |
|
|
|
|
|
|
|
Seven West Media Ltd. |
|
| 9,855,543 |
|
| 12,430 |
|
|
|
|
|
|
| ||
|
|
|
|
|
|
|
|
Multi-Line Retail 0.88% |
|
|
|
|
|
|
|
David Jones Ltd. |
|
| 5,557,640 |
|
| 15,404 |
|
|
|
|
|
|
| ||
Total Australia |
|
|
|
|
| 166,154 |
|
|
|
|
|
|
| ||
|
|
|
|
|
|
|
|
Austria 1.27% |
|
|
|
|
|
|
|
| |||||||
Metals & Mining |
|
|
|
|
|
|
|
Voestalpine AG |
|
| 705,310 |
|
| 22,215 |
|
|
|
|
|
|
| ||
|
|
|
|
|
|
|
|
Brazil 1.00% |
|
|
|
|
|
|
|
| |||||||
Insurance |
|
|
|
|
|
|
|
Sul America SA Unit |
|
| 2,221,085 |
|
| 17,497 |
|
|
|
|
|
|
| ||
|
|
|
|
|
|
|
|
Investments |
| Shares |
| U.S. $ |
| ||
| |||||||
Canada 2.30% |
|
|
|
|
|
|
|
|
|
|
|
|
|
|
|
Metals & Mining 1.03% |
|
|
|
|
|
|
|
Kinross Gold Corp. |
|
| 1,810,500 |
| $ | 17,982 |
|
|
|
|
|
|
| ||
|
|
|
|
|
|
|
|
Oil, Gas & Consumable Fuels 1.27% |
|
|
|
|
|
|
|
Baytex Energy Corp. |
|
| 232,400 |
|
| 10,576 |
|
PetroBakken Energy Ltd. |
|
| 918,200 |
|
| 11,593 |
|
|
|
|
|
|
| ||
|
|
|
|
|
| 22,169 |
|
|
|
|
|
|
| ||
Total Canada |
|
|
|
|
| 40,151 |
|
|
|
|
|
|
| ||
|
|
|
|
|
|
|
|
Chile 0.48% |
|
|
|
|
|
|
|
|
|
|
|
|
|
|
|
Electric: Utilities |
|
|
|
|
|
|
|
Enersis SA ADR |
|
| 498,500 |
|
| 8,445 |
|
|
|
|
|
|
| ||
|
|
|
|
|
|
|
|
China 0.92% |
|
|
|
|
|
|
|
|
|
|
|
|
|
|
|
Oil, Gas & Consumable Fuels |
|
|
|
|
|
|
|
Yanzhou Coal Mining Co., |
|
| 10,734,000 |
|
| 16,149 |
|
|
|
|
|
|
| ||
|
|
|
|
|
|
|
|
Czech Republic 3.05% |
|
|
|
|
|
|
|
|
|
|
|
|
|
|
|
Commercial Banks 1.50% |
|
|
|
|
|
|
|
Komercni Banka AS |
|
| 128,374 |
|
| 26,199 |
|
|
|
|
|
|
| ||
|
|
|
|
|
|
|
|
Electric: Utilities 1.55% |
|
|
|
|
|
|
|
CEZ AS |
|
| 733,912 |
|
| 27,058 |
|
|
|
|
|
|
| ||
Total Czech Republic |
|
|
|
|
| 53,257 |
|
|
|
|
|
|
| ||
|
|
|
|
|
|
|
|
France 8.87% |
|
|
|
|
|
|
|
|
|
|
|
|
|
|
|
Diversified Telecommunication Services 1.84% |
|
|
|
|
|
|
|
Vivendi SA |
|
| 1,571,066 |
|
| 32,143 |
|
|
|
|
|
|
| ||
|
|
|
|
|
|
|
|
Electrical Equipment 0.86% |
|
|
|
|
|
|
|
Schneider Electric SA |
|
| 239,343 |
|
| 14,964 |
|
|
|
|
|
|
| ||
|
|
|
|
|
|
|
|
Insurance 1.29% |
|
|
|
|
|
|
|
AXA SA |
|
| 1,421,057 |
|
| 22,591 |
|
|
|
|
|
|
| ||
|
|
|
|
|
|
|
|
Media 0.92% |
|
|
|
|
|
|
|
Lagardere SCA |
|
| 586,259 |
|
| 16,022 |
|
|
|
|
|
|
| ||
|
|
|
40 | See Notes to Financial Statements. |
|
|
Schedule of Investments (continued) |
INTERNATIONAL DIVIDEND INCOME FUND October 31, 2012 |
|
|
|
|
|
|
|
|
Investments |
| Shares |
| U.S. $ |
| ||
| |||||||
France (continued) |
|
|
|
|
|
|
|
| |||||||
Multi-Line Retail 1.24% |
|
|
|
|
|
|
|
PPR |
|
| 123,749 |
| $ | 21,758 |
|
|
|
|
|
|
| ||
|
|
|
|
|
|
|
|
Oil, Gas & Consumable Fuels 1.45% |
|
|
|
|
|
|
|
Total SA ADR |
|
| 504,480 |
|
| 25,426 |
|
|
|
|
|
|
| ||
|
|
|
|
|
|
|
|
Pharmaceuticals 1.27% |
|
|
|
|
|
|
|
Sanofi |
|
| 251,696 |
|
| 22,125 |
|
|
|
|
|
|
| ||
Total France |
|
|
|
|
| 155,029 |
|
|
|
|
|
|
| ||
|
|
|
|
|
|
|
|
Germany 1.49% |
|
|
|
|
|
|
|
|
|
|
|
|
|
|
|
Air Freight & Logistics 0.49% |
|
|
|
|
|
|
|
Deutsche Post AG |
|
| 431,594 |
|
| 8,556 |
|
|
|
|
|
|
| ||
|
|
|
|
|
|
|
|
Diversified Telecommunication Services 1.00% |
|
|
|
|
|
|
|
Deutsche Telekom AG |
|
| 1,529,420 |
|
| 17,463 |
|
|
|
|
|
|
| ||
Total Germany |
|
|
|
|
| 26,019 |
|
|
|
|
|
|
| ||
|
|
|
|
|
|
|
|
Hong Kong 7.64% |
|
|
|
|
|
|
|
|
|
|
|
|
|
|
|
Chemicals 0.47% |
|
|
|
|
|
|
|
Huabao International |
|
| 16,316,000 |
|
| 8,147 |
|
|
|
|
|
|
| ||
|
|
|
|
|
|
|
|
Communications Equipment 0.38% |
|
|
|
|
|
|
|
VTech Holdings Ltd. |
|
| 557,900 |
|
| 6,626 |
|
|
|
|
|
|
| ||
|
|
|
|
|
|
|
|
Hotels, Restaurants & Leisure 1.29% |
|
|
|
|
|
|
|
SJM Holdings Ltd. |
|
| 10,391,000 |
|
| 22,632 |
|
|
|
|
|
|
| ||
|
|
|
|
|
|
|
|
Industrial Conglomerates 1.97% |
|
|
|
|
|
|
|
NWS Holdings Ltd. |
|
| 11,132,000 |
|
| 16,806 |
|
Shanghai Industrial |
|
| 5,500,000 |
|
| 17,671 |
|
|
|
|
|
|
| ||
|
|
|
|
|
| 34,477 |
|
|
|
|
|
|
| ||
|
|
|
|
|
|
|
|
Real Estate Management & Development 2.10% |
|
|
|
|
|
|
|
New World Development |
|
| 14,647,000 |
|
| 22,642 |
|
Yuexiu Property Co. Ltd. |
|
| 51,282,000 |
|
| 14,094 |
|
|
|
|
|
|
| ||
|
|
|
|
|
| 36,736 |
|
|
|
|
|
|
| ||
|
|
|
|
|
|
|
|
Investments |
| Shares |
| U.S. $ |
| ||
| |||||||
Water Utilities 0.69% |
|
|
|
|
|
|
|
Guangdong Investment |
|
| 14,864,000 |
| $ | 12,160 |
|
|
|
|
|
|
| ||
|
|
|
|
|
|
|
|
Wireless Telecommunication Services 0.74% |
|
|
|
|
|
|
|
China Mobile Ltd. |
|
| 1,161,500 |
|
| 12,881 |
|
|
|
|
|
|
| ||
Total Hong Kong |
|
|
|
|
| 133,659 |
|
|
|
|
|
|
| ||
|
|
|
|
|
|
|
|
Israel 1.61% |
|
|
|
|
|
|
|
|
|
|
|
|
|
|
|
Diversified Telecommunication Services |
|
|
|
|
|
|
|
Bezeq The Israeli |
|
| 23,106,030 |
|
| 28,177 |
|
|
|
|
|
|
| ||
|
|
|
|
|
|
|
|
Italy 3.46% |
|
|
|
|
|
|
|
|
|
|
|
|
|
|
|
Oil, Gas & Consumable Fuels 1.47% |
|
|
|
|
|
|
|
Eni SpA ADR |
|
| 561,280 |
|
| 25,757 |
|
|
|
|
|
|
| ||
|
|
|
|
|
|
|
|
Transportation Infrastructure 1.99% |
|
|
|
|
|
|
|
Atlantia SpA |
|
| 2,104,277 |
|
| 34,721 |
|
|
|
|
|
|
| ||
Total Italy |
|
|
|
|
| 60,478 |
|
|
|
|
|
|
| ||
|
|
|
|
|
|
|
|
Japan 5.09% |
|
|
|
|
|
|
|
|
|
|
|
|
|
|
|
Automobiles 1.39% |
|
|
|
|
|
|
|
Toyota Motor Corp. |
|
| 630,200 |
|
| 24,196 |
|
|
|
|
|
|
| ||
|
|
|
|
|
|
|
|
Tobacco 1.15% |
|
|
|
|
|
|
|
Japan Tobacco, Inc. |
|
| 728,900 |
|
| 20,142 |
|
|
|
|
|
|
| ||
|
|
|
|
|
|
|
|
Trading Companies & Distributors 1.27% |
|
|
|
|
|
|
|
Sumitomo Corp. |
|
| 1,628,900 |
|
| 22,200 |
|
|
|
|
|
|
| ||
|
|
|
|
|
|
|
|
Wireless Telecommunication Services 1.28% |
|
|
|
|
|
|
|
KDDI Corp. |
|
| 288,338 |
|
| 22,394 |
|
|
|
|
|
|
| ||
Total Japan |
|
|
|
|
| 88,932 |
|
|
|
|
|
|
| ||
|
|
|
|
|
|
|
|
Netherlands 0.72% |
|
|
|
|
|
|
|
|
|
|
|
|
|
|
|
Diversified Telecommunication Services |
|
|
|
|
|
|
|
Koninklijke KPN NV |
|
| 1,982,700 |
|
| 12,518 |
|
|
|
|
|
|
| ||
|
|
|
| See Notes to Financial Statements. | 41 |
|
Schedule of Investments (continued) |
INTERNATIONAL DIVIDEND INCOME FUND October 31, 2012 |
|
|
|
|
|
|
|
|
Investments |
| Shares |
| U.S. $ |
| ||
| |||||||
New Zealand 1.22% |
|
|
|
|
|
|
|
|
|
|
|
|
|
|
|
Construction Materials |
|
|
|
|
|
|
|
Fletcher Building Ltd. |
|
| 3,689,227 |
| $ | 21,359 |
|
|
|
|
|
|
| ||
|
|
|
|
|
|
|
|
Norway 1.89% |
|
|
|
|
|
|
|
|
|
|
|
|
|
|
|
Diversified Telecommunication Services |
|
|
|
|
|
|
|
Telenor ASA |
|
| 1,680,297 |
|
| 33,038 |
|
|
|
|
|
|
| ||
|
|
|
|
|
|
|
|
Portugal 1.00% |
|
|
|
|
|
|
|
|
|
|
|
|
|
|
|
Electric: Utilities |
|
|
|
|
|
|
|
EDP - Energias de |
|
| 6,456,051 |
|
| 17,539 |
|
|
|
|
|
|
| ||
|
|
|
|
|
|
|
|
Russia 1.59% |
|
|
|
|
|
|
|
|
|
|
|
|
|
|
|
Oil, Gas & Consumable Fuels 0.94% |
|
|
|
|
|
|
|
Gazprom OAO ADR |
|
| 1,798,600 |
|
| 16,430 |
|
|
|
|
|
|
| ||
|
|
|
|
|
|
|
|
Road & Rail 0.65% |
|
|
|
|
|
|
|
Globaltrans Investment |
|
| 614,300 |
|
| 11,365 |
|
|
|
|
|
|
| ||
Total Russia |
|
|
|
|
| 27,795 |
|
|
|
|
|
|
| ||
|
|
|
|
|
|
|
|
Singapore 3.63% |
|
|
|
|
|
|
|
|
|
|
|
|
|
|
|
Commercial Banks 0.89% |
|
|
|
|
|
|
|
DBS Group Holdings Ltd. |
|
| 1,373,975 |
|
| 15,657 |
|
|
|
|
|
|
| ||
|
|
|
|
|
|
|
|
Diversified Telecommunication Services 0.77% |
|
|
|
|
|
|
|
Singapore |
|
| 5,112,000 |
|
| 13,495 |
|
|
|
|
|
|
| ||
|
|
|
|
|
|
|
|
Machinery 1.39% |
|
|
|
|
|
|
|
SembCorp Marine Ltd. |
|
| 6,296,000 |
|
| 24,311 |
|
|
|
|
|
|
| ||
|
|
|
|
|
|
| �� |
Real Estate Investment Trusts 0.58% |
|
|
|
|
|
|
|
Suntec REIT |
|
| 7,665,000 |
|
| 10,085 |
|
|
|
|
|
|
| ||
Total Singapore |
|
|
|
|
| 63,548 |
|
|
|
|
|
|
| ||
|
|
|
|
|
|
|
|
South Africa 1.09% |
|
|
|
|
|
|
|
|
|
|
|
|
|
|
|
Metals & Mining |
|
|
|
|
|
|
|
Kumba Iron Ore Ltd. |
|
| 306,174 |
|
| 19,139 |
|
|
|
|
|
|
| ||
|
|
|
|
|
|
|
|
Investments |
| Shares |
| U.S. $ |
| ||
| |||||||
South Korea 1.62% |
|
|
|
|
|
|
|
|
|
|
|
|
|
|
|
Tobacco |
|
|
|
|
|
|
|
KT&G Corp. |
|
| 372,535 |
| $ | 28,386 |
|
|
|
|
|
|
| ||
|
|
|
|
|
|
|
|
Spain 7.12% |
|
|
|
|
|
|
|
|
|
|
|
|
|
|
|
Diversified Telecommunication Services 1.39% |
|
|
|
|
|
|
|
Telefonica SA |
|
| 1,843,244 |
|
| 24,273 |
|
|
|
|
|
|
| ||
|
|
|
|
|
|
|
|
Electric: Utilities 1.57% |
|
|
|
|
|
|
|
Red Electrica Corp. SA |
|
| 585,680 |
|
| 27,461 |
|
|
|
|
|
|
| ||
|
|
|
|
|
|
|
|
Information Technology Services 0.91% |
|
|
|
|
|
|
|
Indra Sistemas SA |
|
| 1,393,241 |
|
| 15,891 |
|
|
|
|
|
|
| ||
|
|
|
|
|
|
|
|
Insurance 1.58% |
|
|
|
|
|
|
|
Mapfre SA |
|
| 9,942,957 |
|
| 27,554 |
|
|
|
|
|
|
| ||
|
|
|
|
|
|
|
|
Oil, Gas & Consumable Fuels 1.67% |
|
|
|
|
|
|
|
Repsol SA |
|
| 1,463,106 |
|
| 29,243 |
|
|
|
|
|
|
| ||
Total Spain |
|
|
|
|
| 124,422 |
|
|
|
|
|
|
| ||
|
|
|
|
|
|
|
|
Sweden 1.78% |
|
|
|
|
|
|
|
|
|
|
|
|
|
|
|
Diversified Telecommunication Services 1.24% |
|
|
|
|
|
|
|
Tele2 AB B Shares |
|
| 1,294,667 |
|
| 21,607 |
|
|
|
|
|
|
| ||
|
|
|
|
|
|
|
|
Personal Products 0.54% |
|
|
|
|
|
|
|
Oriflame Cosmetics SA SDR |
|
| 341,869 |
|
| 9,432 |
|
|
|
|
|
|
| ||
Total Sweden |
|
|
|
|
| 31,039 |
|
|
|
|
|
|
| ||
|
|
|
|
|
|
|
|
Switzerland 2.93% |
|
|
|
|
|
|
|
|
|
|
|
|
|
|
|
Insurance 1.25% |
|
|
|
|
|
|
|
Swiss Re Ltd. * |
|
| 316,663 |
|
| 21,881 |
|
|
|
|
|
|
| ||
|
|
|
|
|
|
|
|
Pharmaceuticals 1.68% |
|
|
|
|
|
|
|
Roche Holding Ltd. AG |
|
| 152,888 |
|
| 29,402 |
|
|
|
|
|
|
| ||
Total Switzerland |
|
|
|
|
| 51,283 |
|
|
|
|
|
|
| ||
|
|
|
|
|
|
|
|
Taiwan 1.72% |
|
|
|
|
|
|
|
|
|
|
|
|
|
|
|
Computers & Peripherals 0.67% |
|
|
|
|
|
|
|
Asustek Computer, Inc. |
|
| 1,090,000 |
|
| 11,679 |
|
|
|
|
|
|
| ||
|
|
|
42 | See Notes to Financial Statements. |
|
|
Schedule of Investments (continued) |
INTERNATIONAL DIVIDEND INCOME FUND October 31, 2012 |
|
|
|
|
|
|
|
|
Investments |
| Shares |
| U.S. $ |
| ||
| |||||||
Taiwan (continued) |
|
|
|
|
|
|
|
|
|
|
|
|
|
|
|
Semiconductors & Semiconductor Equipment 1.05% |
|
|
|
|
|
|
|
Siliconware Precision |
|
| 3,824,720 |
| $ | 18,359 |
|
|
|
|
|
|
| ||
Total Taiwan |
|
|
|
|
| 30,038 |
|
|
|
|
|
|
| ||
|
|
|
|
|
|
|
|
Thailand 0.49% |
|
|
|
|
|
|
|
|
|
|
|
|
|
|
|
Real Estate Management & Development |
|
|
|
|
|
|
|
L.P.N. Development pcl |
|
| 14,890,800 |
|
| 8,502 |
|
|
|
|
|
|
| ||
|
|
|
|
|
|
|
|
Turkey 2.16% |
|
|
|
|
|
|
|
|
|
|
|
|
|
|
|
Diversified Telecommunication Services 0.61% |
|
|
|
|
|
|
|
Turk Telekomunikasyon |
|
| 2,748,304 |
|
| 10,733 |
|
|
|
|
|
|
| ||
|
|
|
|
|
|
|
|
Oil, Gas & Consumable Fuels 1.55% |
|
|
|
|
|
|
|
Tupras Turkiye Petrol |
|
| 1,109,403 |
|
| 27,108 |
|
|
|
|
|
|
| ||
Total Turkey |
|
|
|
|
| 37,841 |
|
|
|
|
|
|
| ||
|
|
|
|
|
|
|
|
United Kingdom 18.94% |
|
|
|
|
|
|
|
|
|
|
|
|
|
|
|
Beverages 0.85% |
|
|
|
|
|
|
|
Britvic plc |
|
| 2,566,137 |
|
| 14,875 |
|
|
|
|
|
|
| ||
|
|
|
|
|
|
|
|
Commercial Banks 0.95% |
|
|
|
|
|
|
|
HSBC Holdings plc |
|
| 1,697,312 |
|
| 16,675 |
|
|
|
|
|
|
| ||
|
|
|
|
|
|
|
|
Construction & Engineering 1.10% |
|
|
|
|
|
|
|
Balfour Beatty plc |
|
| 3,779,943 |
|
| 19,227 |
|
|
|
|
|
|
| ||
|
|
|
|
|
|
|
|
Consumer Finance 0.88% |
|
|
|
|
|
|
|
Provident Financial plc |
|
| 697,082 |
|
| 15,434 |
|
|
|
|
|
|
| ||
|
|
|
|
|
|
|
|
Diversified Telecommunication Services 0.91% |
|
|
|
|
|
|
|
Cable & Wireless |
|
| 26,395,727 |
|
| 15,969 |
|
|
|
|
|
|
| ||
|
|
|
|
|
|
|
|
Electric: Utilities 1.54% |
|
|
|
|
|
|
|
SSE plc |
|
| 1,148,382 |
|
| 26,834 |
|
|
|
|
|
|
| ||
|
|
|
|
|
|
|
|
Food Products 1.28% |
|
|
|
|
|
|
|
Unilever plc |
|
| 601,464 |
|
| 22,431 |
|
|
|
|
|
|
| ||
|
|
|
|
|
|
|
|
Investments |
| Shares |
| U.S. $ |
| ||
| |||||||
Insurance 5.66% |
|
|
|
|
|
|
|
Admiral Group plc |
|
| 987,586 |
| $ | 17,658 |
|
Aviva plc |
|
| 5,671,933 |
|
| 30,333 |
|
Catlin Group Ltd. |
|
| 2,907,080 |
|
| 22,106 |
|
Prudential plc |
|
| 2,103,749 |
|
| 28,806 |
|
|
|
|
|
|
| ||
|
|
|
|
|
| 98,903 |
|
|
|
|
|
|
| ||
|
|
|
|
|
|
|
|
Media 0.99% |
|
|
|
|
|
|
|
Reed Elsevier plc |
|
| 1,775,143 |
|
| 17,360 |
|
|
|
|
|
|
| ||
|
|
|
|
|
|
|
|
Metals & Mining 1.29% |
|
|
|
|
|
|
|
Rio Tinto plc ADR |
|
| 357,100 |
|
| 17,848 |
|
Vedanta Resources plc |
|
| 254,426 |
|
| 4,656 |
|
|
|
|
|
|
| ||
|
|
|
|
|
| 22,504 |
|
|
|
|
|
|
| ||
|
|
|
|
|
|
|
|
Multi-Utilities 1.50% |
|
|
|
|
|
|
|
National Grid plc |
|
| 2,291,273 |
|
| 26,123 |
|
|
|
|
|
|
| ||
|
|
|
|
|
|
|
|
Pharmaceuticals 0.96% |
|
|
|
|
|
|
|
GlaxoSmithKline plc |
|
| 752,299 |
|
| 16,832 |
|
|
|
|
|
|
| ||
|
|
|
|
|
|
|
|
Tobacco 1.03% |
|
|
|
|
|
|
|
Imperial Tobacco Group plc |
|
| 474,675 |
|
| 17,925 |
|
|
|
|
|
|
| ||
Total United Kingdom |
|
|
|
|
| 331,092 |
|
|
|
|
|
|
| ||
Total Common Stocks |
|
|
|
|
| 1,653,701 |
|
|
|
|
|
|
| ||
|
|
|
|
|
|
|
|
PREFERRED STOCK 1.57% |
|
|
|
|
|
|
|
|
|
|
|
|
|
|
|
Germany |
|
|
|
|
|
|
|
|
|
|
|
|
|
|
|
Media |
|
|
|
|
|
|
|
ProSiebenSat.1 Media AG |
|
| 984,104 |
|
| 27,424 |
|
|
|
|
|
|
| ||
Total Long-Term Investments |
|
|
|
|
| 1,681,125 |
|
|
|
|
|
|
| ||
|
|
|
| See Notes to Financial Statements. | 43 |
|
Schedule of Investments (continued) |
INTERNATIONAL DIVIDEND INCOME FUND October 31, 2012 |
|
|
|
|
|
|
|
|
Investments |
| Principal |
| U.S. $ |
| ||
| |||||||
SHORT-TERM INVESTMENT 1.99% |
|
|
|
|
|
|
|
|
|
|
|
|
|
|
|
Repurchase Agreement |
|
|
|
|
|
|
|
Repurchase Agreement |
| $ | 34,722 |
| $ | 34,722 |
|
|
|
|
|
|
| ||
Total Investments in |
|
|
|
|
| 1,715,847 |
|
|
|
|
|
|
| ||
Cash, Foreign Cash and |
|
|
|
|
| 32,598 |
|
|
|
|
|
|
| ||
Net Assets 100.00% |
|
|
|
| $ | 1,748,445 |
|
|
|
|
|
|
| ||
|
|
|
ADR |
| American Depositary Receipt. |
GDR |
| Global Depositary Receipt. |
SDR |
| Special Drawing Rights. |
Unit |
| More than one class of securities traded together. |
* |
| Non-income producing security. |
† |
| Security was purchased pursuant to Rule 144A under the Securities Act of 1933 and, unless registered under such Act or exempted from registration, may only be resold to qualified institutional buyers. |
(a) |
| Cash, Foreign Cash and Other Assets in Excess of Liabilities include net unrealized appreciation on forward foreign currency exchange contracts as follows: |
|
|
|
44 | See Notes to Financial Statements. |
|
|
Schedule of Investments (continued) |
INTERNATIONAL DIVIDEND INCOME FUND October 31, 2012 |
Open Forward Foreign Currency Exchange Contracts at October 31, 2012:
|
|
|
|
|
|
|
|
|
|
|
|
|
|
|
|
|
|
|
Forward |
| Transaction |
| Counterparty |
| Expiration |
| Foreign |
| U.S. $ |
| U.S. $ |
| Unrealized |
| |||
Australian dollar |
| Buy |
| J.P.Morgan |
| 11/26/2012 |
| 1,710,000 |
| $ | 1,758,119 |
| $ | 1,771,701 |
| $ | 13,582 |
|
Australian dollar |
| Buy |
| J.P.Morgan |
| 11/30/2012 |
| 4,040,000 |
|
| 4,152,272 |
|
| 4,184,450 |
|
| 32,178 |
|
Australian dollar |
| Buy |
| UBS AG |
| 12/10/2012 |
| 2,945,000 |
|
| 3,045,425 |
|
| 3,047,786 |
|
| 2,361 |
|
Australian dollar |
| Buy |
| Barclays Bank plc |
| 1/24/2013 |
| 10,685,000 |
|
| 10,995,506 |
|
| 11,019,032 |
|
| 23,526 |
|
Australian dollar |
| Buy |
| Deutsche Bank AG |
| 2/4/2013 |
| 8,515,000 |
|
| 8,586,441 |
|
| 8,774,194 |
|
| 187,753 |
|
Australian dollar |
| Buy |
| UBS AG |
| 2/4/2013 |
| 7,500,000 |
|
| 7,706,175 |
|
| 7,728,298 |
|
| 22,123 |
|
Brazilian real |
| Buy |
| J.P.Morgan |
| 12/3/2012 |
| 23,385,000 |
|
| 11,321,166 |
|
| 11,469,214 |
|
| 148,048 |
|
Brazilian real |
| Buy |
| J.P.Morgan |
| 12/3/2012 |
| 7,615,000 |
|
| 3,651,403 |
|
| 3,734,790 |
|
| 83,387 |
|
Brazilian real |
| Buy |
| Morgan Stanley |
| 12/3/2012 |
| 9,520,000 |
|
| 4,574,064 |
|
| 4,669,100 |
|
| 95,036 |
|
euro |
| Buy |
| Credit Suisse |
| 11/5/2012 |
| 6,745,000 |
|
| 8,538,563 |
|
| 8,742,756 |
|
| 204,193 |
|
euro |
| Buy |
| J.P.Morgan |
| 11/5/2012 |
| 3,500,000 |
|
| 4,314,415 |
|
| 4,536,641 |
|
| 222,226 |
|
euro |
| Sell |
| UBS AG |
| 11/5/2012 |
| 10,245,000 |
|
| 13,378,023 |
|
| 13,279,398 |
|
| 98,625 |
|
euro |
| Buy |
| Goldman Sachs |
| 11/13/2012 |
| 5,055,000 |
|
| 6,226,795 |
|
| 6,552,663 |
|
| 325,868 |
|
euro |
| Buy |
| UBS AG |
| 11/13/2012 |
| 8,640,000 |
|
| 10,626,077 |
|
| 11,199,804 |
|
| 573,727 |
|
euro |
| Sell |
| UBS AG |
| 11/13/2012 |
| 2,850,000 |
|
| 3,721,815 |
|
| 3,694,380 |
|
| 27,435 |
|
euro |
| Buy |
| Goldman Sachs |
| 11/16/2012 |
| 41,125,000 |
|
| 50,203,549 |
|
| 53,310,644 |
|
| 3,107,095 |
|
euro |
| Buy |
| UBS AG |
| 11/16/2012 |
| 3,290,000 |
|
| 4,025,480 |
|
| 4,264,851 |
|
| 239,371 |
|
euro |
| Buy |
| Barclays Bank plc |
| 11/19/2012 |
| 11,780,000 |
|
| 14,375,240 |
|
| 15,270,901 |
|
| 895,661 |
|
euro |
| Buy |
| Deutsche Bank AG |
| 11/19/2012 |
| 13,920,000 |
|
| 17,126,054 |
|
| 18,045,071 |
|
| 919,017 |
|
euro |
| Buy |
| J.P.Morgan |
| 11/19/2012 |
| 6,705,000 |
|
| 8,210,742 |
|
| 8,691,968 |
|
| 481,226 |
|
euro |
| Buy |
| Deutsche Bank AG |
| 11/30/2012 |
| 58,660,000 |
|
| 72,103,699 |
|
| 76,050,667 |
|
| 3,946,968 |
|
euro |
| Buy |
| UBS AG |
| 12/17/2012 |
| 4,345,000 |
|
| 5,451,367 |
|
| 5,634,263 |
|
| 182,896 |
|
euro |
| Buy |
| Barclays Bank plc |
| 1/24/2013 |
| 13,250,000 |
|
| 17,172,928 |
|
| 17,188,422 |
|
| 15,494 |
|
euro |
| Buy |
| Deutsche Bank AG |
| 1/24/2013 |
| 9,390,000 |
|
| 12,135,073 |
|
| 12,181,078 |
|
| 46,005 |
|
euro |
| Buy |
| UBS AG |
| 2/12/2013 |
| 6,045,000 |
|
| 7,805,304 |
|
| 7,843,187 |
|
| 37,883 |
|
euro |
| Buy |
| Barclays Bank plc |
| 2/15/2013 |
| 4,740,000 |
|
| 6,132,280 |
|
| 6,150,166 |
|
| 17,886 |
|
Israeli new shekel |
| Buy |
| UBS AG |
| 12/17/2012 |
| 68,765,000 |
|
| 16,933,576 |
|
| 17,672,956 |
|
| 739,380 |
|
Japanese yen |
| Sell |
| Credit Suisse |
| 11/26/2012 |
| 361,060,000 |
|
| 4,600,539 |
|
| 4,523,716 |
|
| 76,823 |
|
Japanese yen |
| Sell |
| Credit Suisse |
| 2/12/2013 |
| 1,018,775,000 |
|
| 12,974,389 |
|
| 12,775,079 |
|
| 199,310 |
|
Norwegian krone |
| Buy |
| J.P.Morgan |
| 11/5/2012 |
| 53,900,000 |
|
| 8,984,232 |
|
| 9,452,969 |
|
| 468,737 |
|
Norwegian krone |
| Buy |
| Barclays Bank plc |
| 1/24/2013 |
| 51,560,000 |
|
| 8,940,117 |
|
| 9,016,324 |
|
| 76,207 |
|
Norwegian krone |
| Buy |
| UBS AG |
| 1/24/2013 |
| 51,135,000 |
|
| 8,913,972 |
|
| 8,942,004 |
|
| 28,032 |
|
Singapore dollar |
| Buy |
| Barclays Bank plc |
| 12/10/2012 |
| 10,541,000 |
|
| 8,594,024 |
|
| 8,641,297 |
|
| 47,273 |
|
South African rand |
| Buy |
| Deutsche Bank AG |
| 2/11/2013 |
| 61,100,000 |
|
| 6,844,439 |
|
| 6,943,777 |
|
| 99,338 |
|
Turkish lira |
| Buy |
| Credit Suisse |
| 1/17/2013 |
| 21,505,000 |
|
| 11,794,548 |
|
| 11,877,902 |
|
| 83,354 |
|
|
|
|
|
|
|
|
|
|
|
|
|
|
|
|
|
| ||
Unrealized Appreciation on Forward Foreign Currency Exchange Contracts |
|
|
|
| $ | 13,768,024 |
| |||||||||||
|
|
|
|
|
| |||||||||||||
|
|
|
| See Notes to Financial Statements. | 45 |
|
Schedule of Investments (concluded) |
INTERNATIONAL DIVIDEND INCOME FUND October 31, 2012 |
|
|
|
|
|
|
|
|
|
|
|
|
|
|
|
|
|
|
|
Forward |
| Transaction |
| Counterparty |
| Expiration |
| Foreign |
| U.S. $ |
| U.S. $ |
| Unrealized |
| |||
Australian dollar |
| Sell |
| Morgan Stanley |
| 11/26/2012 |
| 1,710,000 |
| $ | 1,731,272 |
| $ | 1,771,701 |
| $ | (40,429 | ) |
Australian dollar |
| Buy |
| J.P.Morgan |
| 11/30/2012 |
| 6,885,000 |
|
| 7,153,997 |
|
| 7,131,173 |
|
| (22,824 | ) |
Australian dollar |
| Buy |
| Deutsche Bank AG |
| 12/10/2012 |
| 5,655,000 |
|
| 5,882,897 |
|
| 5,852,370 |
|
| (30,527 | ) |
Australian dollar |
| Buy |
| Deutsche Bank AG |
| 12/10/2012 |
| 15,240,000 |
|
| 15,852,191 |
|
| 15,771,905 |
|
| (80,286 | ) |
Australian dollar |
| Buy |
| Goldman Sachs |
| 12/10/2012 |
| 6,660,000 |
|
| 6,930,196 |
|
| 6,892,446 |
|
| (37,750 | ) |
Brazilian real |
| Sell |
| UBS AG |
| 12/3/2012 |
| 7,665,000 |
|
| 3,756,285 |
|
| 3,759,312 |
|
| (3,027 | ) |
British pound |
| Sell |
| J.P.Morgan |
| 11/30/2012 |
| 14,590,000 |
|
| 22,841,229 |
|
| 23,542,360 |
|
| (701,131 | ) |
British pound |
| Sell |
| UBS AG |
| 11/30/2012 |
| 46,045,000 |
|
| 72,193,863 |
|
| 74,298,009 |
|
| (2,104,146 | ) |
British pound |
| Sell |
| Credit Suisse |
| 12/6/2012 |
| 500,000 |
|
| 777,888 |
|
| 806,783 |
|
| (28,895 | ) |
British pound |
| Sell |
| J.P.Morgan |
| 12/10/2012 |
| 2,280,000 |
|
| 3,548,911 |
|
| 3,678,891 |
|
| (129,980 | ) |
British pound |
| Sell |
| Barclays Bank plc |
| 12/13/2012 |
| 2,015,000 |
|
| 3,159,901 |
|
| 3,251,275 |
|
| (91,374 | ) |
British pound |
| Sell |
| Deutsche Bank AG |
| 12/13/2012 |
| 35,945,000 |
|
| 56,131,676 |
|
| 57,998,545 |
|
| (1,866,869 | ) |
British pound |
| Sell |
| Barclays Bank plc |
| 2/15/2013 |
| 16,170,000 |
|
| 25,913,880 |
|
| 26,085,419 |
|
| (171,539 | ) |
British pound |
| Sell |
| J.P.Morgan |
| 2/25/2013 |
| 17,570,000 |
|
| 28,024,150 |
|
| 28,342,927 |
|
| (318,777 | ) |
euro |
| Buy |
| Deutsche Bank AG |
| 2/11/2013 |
| 5,540,000 |
|
| 7,190,228 |
|
| 7,187,899 |
|
| (2,329 | ) |
euro |
| Buy |
| UBS AG |
| 2/11/2013 |
| 105,390,000 |
|
| 137,072,342 |
|
| 136,738,743 |
|
| (333,599 | ) |
euro |
| Buy |
| Goldman Sachs |
| 2/22/2013 |
| 9,230,000 |
|
| 12,109,299 |
|
| 11,976,742 |
|
| (132,557 | ) |
Israeli new shekel |
| Sell |
| UBS AG |
| 12/17/2012 |
| 20,105,000 |
|
| 5,123,990 |
|
| 5,167,087 |
|
| (43,097 | ) |
Japanese yen |
| Sell |
| J.P.Morgan |
| 2/25/2013 |
| 3,905,000,000 |
|
| 48,960,299 |
|
| 48,974,252 |
|
| (13,953 | ) |
New Zealand dollar |
| Sell |
| Deutsche Bank AG |
| 2/11/2013 |
| 8,870,000 |
|
| 7,184,035 |
|
| 7,247,250 |
|
| (63,215 | ) |
Norwegian krone |
| Sell |
| UBS AG |
| 11/5/2012 |
| 53,900,000 |
|
| 8,773,215 |
|
| 9,452,968 |
|
| (679,753 | ) |
Singapore dollar |
| Sell |
| J.P.Morgan |
| 12/10/2012 |
| 10,915,000 |
|
| 8,793,909 |
|
| 8,947,895 |
|
| (153,986 | ) |
South African rand |
| Buy |
| Goldman Sachs |
| 11/16/2012 |
| 54,160,000 |
|
| 6,387,957 |
|
| 6,233,811 |
|
| (154,146 | ) |
South African rand |
| Buy |
| J.P.Morgan |
| 12/3/2012 |
| 30,090,000 |
|
| 3,609,991 |
|
| 3,454,928 |
|
| (155,063 | ) |
South African rand |
| Buy |
| Barclays Bank plc |
| 12/14/2012 |
| 23,220,000 |
|
| 2,758,742 |
|
| 2,661,343 |
|
| (97,399 | ) |
South African rand |
| Buy |
| Deutsche Bank AG |
| 1/25/2013 |
| 27,450,000 |
|
| 3,233,049 |
|
| 3,126,751 |
|
| (106,298 | ) |
South African rand |
| Buy |
| Credit Suisse |
| 2/11/2013 |
| 39,605,000 |
|
| 4,572,798 |
|
| 4,500,954 |
|
| (71,844 | ) |
South Korean won |
| Sell |
| Morgan Stanley |
| 11/26/2012 |
| 5,335,460,000 |
|
| 4,598,345 |
|
| 4,886,674 |
|
| (288,329 | ) |
South Korean won |
| Sell |
| Deutsche Bank AG |
| 12/10/2012 |
| 7,026,000,000 |
|
| 6,197,188 |
|
| 6,430,621 |
|
| (233,433 | ) |
South Korean won |
| Sell |
| Deutsche Bank AG |
| 12/17/2012 |
| 2,128,192,000 |
|
| 1,870,938 |
|
| 1,947,164 |
|
| (76,226 | ) |
South Korean won |
| Sell |
| Goldman Sachs |
| 1/14/2013 |
| 1,641,000,000 |
|
| 1,446,643 |
|
| 1,499,284 |
|
| (52,641 | ) |
Swiss franc |
| Sell |
| UBS AG |
| 11/13/2012 |
| 2,155,000 |
|
| 2,210,030 |
|
| 2,314,349 |
|
| (104,319 | ) |
Swiss franc |
| Sell |
| J.P.Morgan |
| 11/27/2012 |
| 7,995,000 |
|
| 8,114,445 |
|
| 8,587,972 |
|
| (473,527 | ) |
Swiss franc |
| Sell |
| J.P.Morgan |
| 12/10/2012 |
| 5,075,000 |
|
| 5,249,710 |
|
| 5,452,564 |
|
| (202,854 | ) |
Swiss franc |
| Sell |
| Barclays Bank plc |
| 12/17/2012 |
| 2,945,000 |
|
| 3,083,511 |
|
| 3,164,490 |
|
| (80,979 | ) |
Swiss franc |
| Sell |
| Barclays Bank plc |
| 12/17/2012 |
| 4,005,000 |
|
| 4,106,652 |
|
| 4,303,492 |
|
| (196,840 | ) |
Swiss franc |
| Sell |
| J.P.Morgan |
| 1/31/2013 |
| 13,570,000 |
|
| 14,453,792 |
|
| 14,592,339 |
|
| (138,547 | ) |
Taiwan dollar |
| Sell |
| Barclays Bank plc |
| 12/17/2012 |
| 184,590,000 |
|
| 6,173,579 |
|
| 6,332,201 |
|
| (158,622 | ) |
Taiwan dollar |
| Sell |
| Barclays Bank plc |
| 2/5/2013 |
| 372,565,000 |
|
| 12,736,394 |
|
| 12,801,151 |
|
| (64,757 | ) |
|
|
|
|
|
|
|
|
|
|
|
|
|
|
|
|
| ||
Unrealized Depreciation on Forward Foreign Currency Exchange Contracts |
|
|
|
| $ | (9,705,867 | ) | |||||||||||
|
|
|
|
|
| |||||||||||||
|
|
|
46 | See Notes to Financial Statements. |
|
|
Schedule of Investments |
INTERNATIONAL OPPORTUNITIES FUND October 31, 2012 |
|
|
|
|
|
|
|
|
Investments |
| Shares |
| U.S. $ |
| ||
LONG-TERM INVESTMENTS 96.31% |
|
|
|
|
|
|
|
|
|
|
|
|
|
|
|
COMMON STOCKS 94.87% |
|
|
|
|
|
|
|
|
|
|
|
|
|
|
|
Australia 2.20% |
|
|
|
|
|
|
|
|
|
|
|
|
|
|
|
Beverages 0.68% |
|
|
|
|
|
|
|
Treasury Wine Estates Ltd. |
|
| 398,537 |
| $ | 2,044 |
|
|
|
|
|
|
| ||
|
|
|
|
|
|
|
|
Multi-Utilities 1.01% |
|
|
|
|
|
|
|
DUET Group |
|
| 1,406,728 |
|
| 3,052 |
|
|
|
|
|
|
| ||
|
|
|
|
|
|
|
|
Trading Companies & Distributors 0.51% |
|
|
|
|
|
|
|
Emeco Holdings Ltd. |
|
| 2,123,972 |
|
| 1,532 |
|
|
|
|
|
|
| ||
Total Australia |
|
|
|
|
| 6,628 |
|
|
|
|
|
|
| ||
|
|
|
|
|
|
|
|
Austria 1.05% |
|
|
|
|
|
|
|
|
|
|
|
|
|
|
|
Real Estate Management & Development |
|
| 814,974 |
|
| 3,148 |
|
|
|
|
|
|
| ||
|
|
|
|
|
|
|
|
Belgium 0.99% |
|
|
|
|
|
|
|
|
|
|
|
|
|
|
|
Electric: Utilities |
|
|
|
|
|
|
|
Elia System Operator SA |
|
| 73,228 |
|
| 2,992 |
|
|
|
|
|
|
| ||
|
|
|
|
|
|
|
|
Canada 6.55% |
|
|
|
|
|
|
|
|
|
|
|
|
|
|
|
Metals & Mining 2.90% |
|
|
|
|
|
|
|
Detour Gold Corp. * |
|
| 55,800 |
|
| 1,572 |
|
HudBay Minerals, Inc. |
|
| 430,866 |
|
| 3,999 |
|
IAMGOLD Corp. |
|
| 108,991 |
|
| 1,692 |
|
Osisko Mining Corp. * |
|
| 149,766 |
|
| 1,471 |
|
|
|
|
|
|
| ||
|
|
|
|
|
| 8,734 |
|
|
|
|
|
|
| ||
|
|
|
|
|
|
|
|
Oil, Gas & Consumable Fuels 3.65% |
|
|
|
|
|
|
|
Bankers Petroleum Ltd. * |
|
| 697,400 |
|
| 1,983 |
|
Bellatrix Exploration Ltd. * |
|
| 1,049,898 |
|
| 4,373 |
|
PetroBakken Energy Ltd. |
|
| 170,100 |
|
| 2,148 |
|
Vero Energy, Inc. |
|
| 917,290 |
|
| 2,461 |
|
|
|
|
|
|
| ||
|
|
|
|
|
| 10,965 |
|
|
|
|
|
|
| ||
Total Canada |
|
|
|
|
| 19,699 |
|
|
|
|
|
|
| ||
|
|
|
|
|
|
|
|
Investments |
| Shares |
| U.S. $ |
| ||
Finland 1.07% |
|
|
|
|
|
|
|
|
|
|
|
|
|
|
|
Leisure Equipment & Products |
|
| 228,446 |
| $ | 3,233 |
|
|
|
|
|
|
| ||
|
|
|
|
|
|
|
|
France 3.66% |
|
|
|
|
|
|
|
|
|
|
|
|
|
|
|
Computers & Peripherals 0.87% |
|
|
|
|
|
|
|
Gemalto NV |
|
| 29,119 |
|
| 2,627 |
|
|
|
|
|
|
| ||
|
|
|
|
|
|
|
|
Electronic Equipment, Instruments & Components |
|
|
|
|
|
|
|
Ingenico |
|
| 73,671 |
|
| 3,900 |
|
|
|
|
|
|
| ||
|
|
|
|
|
|
|
|
Information Technology Services 1.01% |
|
|
|
|
|
|
|
AtoS |
|
| 45,186 |
|
| 3,034 |
|
|
|
|
|
|
| ||
|
|
|
|
|
|
|
|
Media 0.39% |
|
|
|
|
|
|
|
Ipsos SA |
|
| 33,146 |
|
| 1,165 |
|
|
|
|
|
|
| ||
|
|
|
|
|
|
|
|
Semiconductors & Semiconductor Equipment 0.10% |
|
|
|
|
|
|
|
Inside Secure SA * |
|
| 99,729 |
|
| 291 |
|
|
|
|
|
|
| ||
Total France |
|
|
|
|
| 11,017 |
|
|
|
|
|
|
| ||
|
|
|
|
|
|
|
|
Germany 3.19% |
|
|
|
|
|
|
|
|
|
|
|
|
|
|
|
Chemicals 1.48% |
|
|
|
|
|
|
|
Symrise GmbH & Co. AG |
|
| 123,398 |
|
| 4,436 |
|
|
|
|
|
|
| ||
|
|
|
|
|
|
|
|
Life Sciences Tools & Services 0.51% |
|
|
|
|
|
|
|
Gerresheimer AG |
|
| 31,012 |
|
| 1,539 |
|
|
|
|
|
|
| ||
|
|
|
|
|
|
|
|
Machinery 0.29% |
|
|
|
|
|
|
|
Deutz AG * |
|
| 200,376 |
|
| 878 |
|
|
|
|
|
|
| ||
|
|
|
|
|
|
|
|
Real Estate Management & Development 0.91% |
|
|
|
|
|
|
|
Patrizia Immobilien AG * |
|
| 387,914 |
|
| 2,732 |
|
|
|
|
|
|
| ||
Total Germany |
|
|
|
|
| 9,585 |
|
|
|
|
|
|
| ||
|
|
|
|
|
|
|
|
Hong Kong 7.96% |
|
|
|
|
|
|
|
|
|
|
|
|
|
|
|
Auto Components 0.22% |
|
|
|
|
|
|
|
Minth Group Ltd. |
|
| 660,000 |
|
| 667 |
|
|
|
|
|
|
| ||
|
|
|
|
|
|
|
|
Communications Equipment 1.43% |
|
|
|
|
|
|
|
VTech Holdings Ltd. |
|
| 361,500 |
|
| 4,294 |
|
|
|
|
|
|
| ||
|
|
|
| See Notes to Financial Statements. | 47 |
|
Schedule of Investments (continued) |
INTERNATIONAL OPPORTUNITIES FUND October 31, 2012 |
|
|
|
|
|
|
|
|
Investments |
| Shares |
| U.S. $ |
| ||
Hong Kong (continued) |
|
|
|
|
|
|
|
|
|
|
|
|
|
|
|
Construction & Engineering 1.16% |
|
|
|
|
|
|
|
China State Construction |
|
| 2,920,800 |
| $ | 3,479 |
|
|
|
|
|
|
| ||
|
|
|
|
|
|
|
|
Hotels, Restaurants & Leisure 1.55% |
|
|
|
|
|
|
|
REXLot Holdings Ltd. |
|
| 64,575,000 |
|
| 4,666 |
|
|
|
|
|
|
| ||
|
|
|
|
|
|
|
|
Household Durables 1.70% |
|
|
|
|
|
|
|
Techtronic Industries Co. |
|
| 2,688,000 |
|
| 5,119 |
|
|
|
|
|
|
| ||
|
|
|
|
|
|
|
|
Machinery 0.61% |
|
|
|
|
|
|
|
Sinotruk Hong Kong Ltd. |
|
| 3,214,000 |
|
| 1,845 |
|
|
|
|
|
|
| ||
|
|
|
|
|
|
|
|
Multi-Line Retail 1.29% |
|
|
|
|
|
|
|
Maoye International |
|
| 19,329,000 |
|
| 3,891 |
|
|
|
|
|
|
| ||
Total Hong Kong |
|
|
|
|
| 23,961 |
|
|
|
|
|
|
| ||
|
|
|
|
|
|
|
|
India 0.91% |
|
|
|
|
|
|
|
|
|
|
|
|
|
|
|
Real Estate Management & Development |
|
| 1,530,196 |
|
| 2,729 |
|
|
|
|
|
|
| ||
|
|
|
|
|
|
|
|
Indonesia 0.85% |
|
|
|
|
|
|
|
|
|
|
|
|
|
|
|
Consumer Finance |
|
| 61,152,850 |
|
| 2,547 |
|
|
|
|
|
|
| ||
|
|
|
|
|
|
|
|
Ireland 1.04% |
|
|
|
|
|
|
|
|
|
|
|
|
|
|
|
Beverages |
|
| 654,912 |
|
| 3,136 |
|
|
|
|
|
|
| ||
|
|
|
|
|
|
|
|
Italy 3.25% |
|
|
|
|
|
|
|
|
|
|
|
|
|
|
|
Internet & Catalog Retail 1.18% |
|
|
|
|
|
|
|
Yoox SpA * |
|
| 234,153 |
|
| 3,542 |
|
|
|
|
|
|
| ||
|
|
|
|
|
|
|
|
Textiles, Apparel & Luxury Goods 2.07% |
|
|
|
|
|
|
|
Brunello Cucinelli SpA * |
|
| 160,618 |
|
| 2,842 |
|
Safilo Group SpA * |
|
| 400,905 |
|
| 3,380 |
|
|
|
|
|
|
| ||
|
|
|
|
|
| 6,222 |
|
|
|
|
|
|
| ||
Total Italy |
|
|
|
|
| 9,764 |
|
|
|
|
|
|
| ||
|
|
|
|
|
|
|
|
Investments |
| Shares |
| U.S. $ |
| ||
Japan 18.69% |
|
|
|
|
|
|
|
|
|
|
|
|
|
|
|
Auto Components 0.44% |
|
|
|
|
|
|
|
Keihin Corp. |
|
| 109,900 |
| $ | 1,324 |
|
|
|
|
|
|
| ||
|
|
|
|
|
|
|
|
Building Products 1.00% |
|
|
|
|
|
|
|
Aica Kogyo Co., Ltd. |
|
| 177,400 |
|
| 3,002 |
|
|
|
|
|
|
| ||
|
|
|
|
|
|
|
|
Commercial Services & Supplies 1.63% |
|
|
|
|
|
|
|
Park24 Co., Ltd. |
|
| 286,000 |
|
| 4,915 |
|
|
|
|
|
|
| ||
|
|
|
|
|
|
|
|
Containers & Packaging 1.80% |
|
|
|
|
|
|
|
FP Corp. |
|
| 71,900 |
|
| 5,404 |
|
|
|
|
|
|
| ||
|
|
|
|
|
|
|
|
Diversified Consumer Services 1.03% |
|
|
|
|
|
|
|
Benesse Holdings, Inc. |
|
| 64,200 |
|
| 3,092 |
|
|
|
|
|
|
| ||
|
|
|
|
|
|
|
|
Food & Staples Retailing 1.04% |
|
|
|
|
|
|
|
Sundrug Co., Ltd. |
|
| 85,200 |
|
| 3,137 |
|
|
|
|
|
|
| ||
|
|
|
|
|
|
|
|
Food Products 1.66% |
|
|
|
|
|
|
|
Nichirei Corp. |
|
| 636,000 |
|
| 3,505 |
|
Toyo Suisan Kaisha Ltd. |
|
| 60,000 |
|
| 1,495 |
|
|
|
|
|
|
| ||
|
|
|
|
|
| 5,000 |
|
|
|
|
|
|
| ||
|
|
|
|
|
|
|
|
Health Care Equipment & Supplies 1.34% |
|
|
|
|
|
|
|
Hogy Medical Co., Ltd. |
|
| 79,000 |
|
| 4,048 |
|
|
|
|
|
|
| ||
|
|
|
|
|
|
|
|
Information Technology Services 1.10% |
|
|
|
|
|
|
|
Obic Co., Ltd. |
|
| 16,100 |
|
| 3,314 |
|
|
|
|
|
|
| ||
|
|
|
|
|
|
|
|
Machinery 0.94% |
|
|
|
|
|
|
|
Nabtesco Corp. |
|
| 151,400 |
|
| 2,818 |
|
|
|
|
|
|
| ||
|
|
|
|
|
|
|
|
Multi-Line Retail 1.09% |
|
|
|
|
|
|
|
Don Quijote Co., Ltd. |
|
| 83,200 |
|
| 3,278 |
|
|
|
|
|
|
| ||
|
|
|
|
|
|
|
|
Pharmaceuticals 1.12% |
|
|
|
|
|
|
|
Sawai Pharmaceutical |
|
| 13,800 |
|
| 1,525 |
|
Towa Pharmaceutical |
|
| 29,300 |
|
| 1,861 |
|
|
|
|
|
|
| ||
|
|
|
|
|
| 3,386 |
|
|
|
|
|
|
| ||
|
|
|
|
|
|
|
|
Real Estate Management & Development 1.68% |
|
|
|
|
|
|
|
Tokyo Tatemono Co., Ltd. * |
|
| 1,232,000 |
|
| 5,062 |
|
|
|
|
|
|
| ||
|
|
|
48 | See Notes to Financial Statements. |
|
Schedule of Investments (continued) |
INTERNATIONAL OPPORTUNITIES FUND October 31, 2012 |
|
|
|
|
|
|
|
|
Investments |
| Shares |
| U.S. $ |
| ||
Japan (continued) |
|
|
|
|
|
|
|
|
|
|
|
|
|
|
|
Software 0.87% |
|
|
|
|
|
|
|
Capcom Co., Ltd. |
|
| 137,200 |
| $ | 2,614 |
|
|
|
|
|
|
| ||
|
|
|
|
|
|
|
|
Specialty Retail 1.17% |
|
|
|
|
|
|
|
United Arrows Ltd. |
|
| 137,100 |
|
| 3,512 |
|
|
|
|
|
|
| ||
|
|
|
|
|
|
|
|
Wireless Telecommunication Services 0.78% |
|
|
|
|
|
|
|
Okinawa Cellular |
|
| 112,600 |
|
| 2,346 |
|
|
|
|
|
|
| ||
Total Japan |
|
|
|
|
| 56,252 |
|
|
|
|
|
|
| ||
|
|
|
|
|
|
|
|
Netherlands 2.95% |
|
|
|
|
|
|
|
|
|
|
|
|
|
|
|
Construction & Engineering 1.02% |
|
|
|
|
|
|
|
Arcadis NV |
|
| 144,196 |
|
| 3,079 |
|
|
|
|
|
|
| ||
|
|
|
|
|
|
|
|
Professional Services 1.93% |
|
|
|
|
|
|
|
Brunel International NV |
|
| 120,502 |
|
| 5,803 |
|
|
|
|
|
|
| ||
Total Netherlands |
|
|
|
|
| 8,882 |
|
|
|
|
|
|
| ||
|
|
|
|
|
|
|
|
Norway 3.13% |
|
|
|
|
|
|
|
|
|
|
|
|
|
|
|
Energy Equipment & Services 2.41% |
|
|
|
|
|
|
|
Electromagnetic |
|
| 1,472,515 |
|
| 3,203 |
|
Ocean Rig UDW, Inc. * |
|
| 255,600 |
|
| 4,056 |
|
|
|
|
|
|
| ||
|
|
|
|
|
| 7,259 |
|
|
|
|
|
|
| ||
|
|
|
|
|
|
|
|
Internet Software & Services 0.26% |
|
|
|
|
|
|
|
Opera Software ASA |
|
| 144,037 |
|
| 793 |
|
|
|
|
|
|
| ||
|
|
|
|
|
|
|
|
Oil, Gas & Consumable Fuels 0.46% |
|
|
|
|
|
|
|
DNO International ASA * |
|
| 783,241 |
|
| 1,367 |
|
|
|
|
|
|
| ||
Total Norway |
|
|
|
|
| 9,419 |
|
|
|
|
|
|
| ||
|
|
|
|
|
|
|
|
Philippines 4.29% |
|
|
|
|
|
|
|
|
|
|
|
|
|
|
|
Commercial Banks 1.89% |
|
|
|
|
|
|
|
Rizal Commercial Banking |
|
| 2,380,000 |
|
| 2,652 |
|
Security Bank Corp. |
|
| 773,170 |
|
| 3,038 |
|
|
|
|
|
|
| ||
|
|
|
|
|
| 5,690 |
|
|
|
|
|
|
| ||
|
|
|
|
|
|
|
|
Investments |
| Shares |
| U.S. $ |
| ||
Real Estate Management & Development 2.40% |
|
|
|
|
|
|
|
Filinvest Land, Inc. |
|
| 101,915,000 |
| $ | 3,612 |
|
Megaworld Corp. |
|
| 60,581,000 |
|
| 3,603 |
|
|
|
|
|
|
| ||
|
|
|
|
|
| 7,215 |
|
|
|
|
|
|
| ||
Total Philippines |
|
|
|
|
| 12,905 |
|
|
|
|
|
|
| ||
|
|
|
|
|
|
|
|
Portugal 0.78% |
|
|
|
|
|
|
|
|
|
|
|
|
|
|
|
Commercial Banks |
|
|
|
|
|
|
|
Banco Espirito Santo SA * |
|
| 2,413,437 |
|
| 2,346 |
|
|
|
|
|
|
| ||
|
|
|
|
|
|
|
|
Singapore 2.22% |
|
|
|
|
|
|
|
|
|
|
|
|
|
|
|
Commercial Services & Supplies 1.21% |
|
|
|
|
|
|
|
Cape plc |
|
| 835,501 |
|
| 3,627 |
|
|
|
|
|
|
| ||
|
|
|
|
|
|
|
|
Real Estate Investment Trusts 1.01% |
|
|
|
|
|
|
|
CDL Hospitality Trusts |
|
| 1,919,000 |
|
| 3,044 |
|
|
|
|
|
|
| ||
Total Singapore |
|
|
|
|
| 6,671 |
|
|
|
|
|
|
| ||
|
|
|
|
|
|
|
|
South Korea 2.12% |
|
|
|
|
|
|
|
|
|
|
|
|
|
|
|
Auto Components 1.10% |
|
|
|
|
|
|
|
Mando Corp. |
|
| 25,226 |
|
| 3,331 |
|
|
|
|
|
|
| ||
|
|
|
|
|
|
|
|
Commercial Banks 1.02% |
|
|
|
|
|
|
|
DGB Financial Group, Inc. |
|
| 242,020 |
|
| 3,062 |
|
|
|
|
|
|
| ||
Total South Korea |
|
|
|
|
| 6,393 |
|
|
|
|
|
|
| ||
|
|
|
|
|
|
|
|
Spain 2.09% |
|
|
|
|
|
|
|
|
|
|
|
|
|
|
|
Food Products |
|
| 165,918 |
|
| 3,047 |
|
Viscofan SA |
|
| 67,146 |
|
| 3,250 |
|
|
|
|
|
|
| ||
Total Spain |
|
|
|
|
| 6,297 |
|
|
|
|
|
|
| ||
|
|
|
|
|
|
|
|
Sweden 3.77% |
|
|
|
|
|
|
|
|
|
|
|
|
|
|
|
Commercial Services & Supplies 2.74% |
|
|
|
|
|
|
|
Intrum Justitia AB |
|
| 299,760 |
|
| 4,338 |
|
Loomis AB |
|
| 286,000 |
|
| 3,924 |
|
|
|
|
|
|
| ||
|
|
|
|
|
| 8,262 |
|
|
|
|
|
|
| ||
|
|
|
|
|
|
|
|
Construction & Engineering 0.51% |
|
|
|
|
|
|
|
NCC AB |
|
| 81,689 |
|
| 1,528 |
|
|
|
|
|
|
| ||
|
|
|
| See Notes to Financial Statements. | 49 |
|
Schedule of Investments (continued) |
INTERNATIONAL OPPORTUNITIES FUND October 31, 2012 |
|
|
|
|
|
|
|
|
Investments |
| Shares |
| U.S. $ |
| ||
Sweden (continued) |
|
|
|
|
|
|
|
|
|
|
|
|
|
|
|
Food & Staples Retailing 0.52% |
|
|
|
|
|
|
|
Axfood AB |
|
| 42,008 |
| $ | 1,556 |
|
|
|
|
|
|
| ||
Total Sweden |
|
|
|
|
| 11,346 |
|
|
|
|
|
|
| ||
|
|
|
|
|
|
|
|
Switzerland 1.57% |
|
|
|
|
|
|
|
|
|
|
|
|
|
|
|
Capital Markets 0.80% |
|
|
|
|
|
|
|
EFG International AG * |
|
| 263,570 |
|
| 2,411 |
|
|
|
|
|
|
| ||
|
|
|
|
|
|
|
|
Household Durables 0.77% |
|
|
|
|
|
|
|
Forbo Holding AG |
|
|
|
|
|
|
|
Registered Shares * |
|
| 3,671 |
|
| 2,318 |
|
|
|
|
|
|
| ||
Total Switzerland |
|
|
|
|
| 4,729 |
|
|
|
|
|
|
| ||
|
|
|
|
|
|
|
|
United Kingdom 20.54% |
|
|
|
|
|
|
|
|
|
|
|
|
|
|
|
Airlines 1.91% |
|
|
|
|
|
|
|
easyJet plc |
|
| 569,047 |
|
| 5,739 |
|
|
|
|
|
|
| ||
|
|
|
|
|
|
|
|
Capital Markets 1.98% |
|
|
|
|
|
|
|
3i Group plc |
|
| 841,056 |
|
| 2,924 |
|
Jupiter Fund Management |
|
| 717,551 |
|
| 3,031 |
|
|
|
|
|
|
| ||
|
|
|
|
|
| 5,955 |
|
|
|
|
|
|
| ||
|
|
|
|
|
|
|
|
Chemicals 1.30% |
|
|
|
|
|
|
|
Croda International plc |
|
| 39,001 |
|
| 1,385 |
|
Filtrona plc |
|
| 273,756 |
|
| 2,532 |
|
|
|
|
|
|
| ||
|
|
|
|
|
| 3,917 |
|
|
|
|
|
|
| ||
|
|
|
|
|
|
|
|
Construction & Engineering 1.56% |
|
|
|
|
|
|
|
Balfour Beatty plc |
|
| 922,419 |
|
| 4,692 |
|
|
|
|
|
|
| ||
|
|
|
|
|
|
|
|
Electronic Equipment, Instruments & Components |
|
|
|
|
|
|
|
Electrocomponents plc |
|
| 639,703 |
|
| 2,199 |
|
|
|
|
|
|
| ||
|
|
|
|
|
|
|
|
Hotels, Restaurants & Leisure 0.77% |
|
|
|
|
|
|
|
Sportingbet plc |
|
| 2,702,178 |
|
| 2,333 |
|
|
|
|
|
|
| ||
|
|
|
|
|
|
|
|
Household Durables 1.28% |
|
|
|
|
|
|
|
Berkeley Group Holdings |
|
| 156,316 |
|
| 3,839 |
|
|
|
|
|
|
| ||
|
|
|
|
|
|
|
|
Investments |
| Shares |
| U.S. $ |
| ||
Independent Power Producers & Energy Traders |
|
|
|
|
|
|
|
APR Energy plc |
|
| 90,847 |
| $ | 997 |
|
|
|
|
|
|
| ||
|
|
|
|
|
|
|
|
Industrial Conglomerates 0.62% |
|
|
|
|
|
|
|
Lonrho plc * |
|
| 11,376,505 |
|
| 1,882 |
|
|
|
|
|
|
| ||
|
|
|
|
|
|
|
|
Insurance 2.73% |
|
|
|
|
|
|
|
Amlin plc |
|
| 571,109 |
|
| 3,440 |
|
Catlin Group Ltd. |
|
| 626,533 |
|
| 4,764 |
|
|
|
|
|
|
| ||
|
|
|
|
|
| 8,204 |
|
|
|
|
|
|
| ||
|
|
|
|
|
|
|
|
Internet & Catalog Retail 0.92% |
|
|
|
|
|
|
|
N Brown Group plc |
|
| 508,032 |
|
| 2,755 |
|
|
|
|
|
|
| ||
|
|
|
|
|
|
|
|
Metals & Mining 0.89% |
|
|
|
|
|
|
|
New World Resources |
|
| 648,731 |
|
| 2,685 |
|
|
|
|
|
|
| ||
|
|
|
|
|
|
|
|
Multi-Line Retail 1.85% |
|
|
|
|
|
|
|
Debenhams plc |
|
| 2,877,782 |
|
| 5,559 |
|
|
|
|
|
|
| ||
|
|
|
|
|
|
|
|
Oil, Gas & Consumable Fuels 1.94% |
|
|
|
|
|
|
|
Afren plc * |
|
| 1,375,028 |
|
| 3,055 |
|
Dragon Oil plc |
|
| 152,925 |
|
| 1,370 |
|
Genel Energy plc * |
|
| 107,728 |
|
| 1,412 |
|
|
|
|
|
|
| ||
|
|
|
|
|
| 5,837 |
|
|
|
|
|
|
| ||
|
|
|
|
|
|
|
|
Professional Services 0.50% |
|
|
|
|
|
|
|
Michael Page |
|
| 258,825 |
|
| 1,505 |
|
|
|
|
|
|
| ||
|
|
|
|
|
|
|
|
Trading Companies & Distributors 1.23% |
|
|
|
|
|
|
|
Ashtead Group plc |
|
| 615,197 |
|
| 3,703 |
|
|
|
|
|
|
| ||
Total United Kingdom |
|
|
|
|
| 61,801 |
|
|
|
|
|
|
| ||
Total Common Stocks |
|
|
|
|
| 285,480 |
|
|
|
|
|
|
| ||
|
|
|
50 | See Notes to Financial Statements. |
|
Schedule of Investments (continued) |
INTERNATIONAL OPPORTUNITIES FUND October 31, 2012 |
|
|
|
|
|
|
|
|
Investments |
| Shares |
| U.S. $ |
| ||
PREFERRED STOCKS 1.44% |
|
|
|
|
|
|
|
|
|
|
|
|
|
|
|
Brazil |
|
|
|
|
|
|
|
|
|
|
|
|
|
|
|
Gas Utilities 0.69% |
|
|
|
|
|
|
|
Companhia de Gas de |
|
| 78,800 |
| $ | 2,074 |
|
|
|
|
|
|
| ||
|
|
|
|
|
|
|
|
Machinery 0.75% |
|
|
|
|
|
|
|
Marcopolo SA |
|
| 387,058 |
|
| 2,270 |
|
|
|
|
|
|
| ||
Total Preferred Stocks |
|
|
|
|
| 4,344 |
|
|
|
|
|
|
| ||
Total Long-Term Investments |
|
|
|
|
| 289,824 |
|
|
|
|
|
|
| ||
|
|
|
|
|
|
|
|
Investments |
| Principal |
| Fair Value |
| ||
SHORT-TERM INVESTMENT 2.45% |
|
|
|
|
|
|
|
|
|
|
|
|
|
|
|
Repurchase Agreement |
|
|
|
|
|
|
|
Repurchase Agreement |
| $ | 7,353 |
| $ | 7,353 |
|
|
|
|
|
|
| ||
Total Investments in |
|
|
|
|
| 297,177 |
|
|
|
|
|
|
| ||
Cash, Foreign Cash and |
|
|
|
|
| 3,730 |
|
|
|
|
|
|
| ||
Net Assets 100.00% |
|
|
|
| $ | 300,907 |
|
|
|
|
|
|
| ||
|
|
* | Non-income producing security. |
(a) | Cash, Foreign Cash and Other Assets in Excess of Liabilities include net unrealized appreciation on forward foreign currency contracts as follows: |
|
|
|
| See Notes to Financial Statements. | 51 |
|
Schedule of Investments (concluded) |
INTERNATIONAL OPPORTUNITIES FUND October 31, 2012 |
|
Open Forward Foreign Currency Exchange Contracts at October 31, 2012: |
|
|
|
|
|
|
|
|
|
|
|
|
|
|
|
|
|
|
|
Forward |
| Transaction |
| Counterparty |
| Expiration |
| Foreign |
| U.S. $ |
| U.S. $ |
| Unrealized |
| |||
Australian dollar |
| Buy |
| Deutsche Bank AG |
| 1/7/2013 |
| 885,000 |
| $ | 905,890 |
| $ | 913,793 |
| $ | 7,903 |
|
Australian dollar |
| Buy |
| J.P. Morgan |
| 1/7/2013 |
| 1,050,000 |
|
| 1,064,018 |
|
| 1,084,161 |
|
| 20,143 |
|
Australian dollar |
| Buy |
| J.P. Morgan |
| 1/31/2013 |
| 1,172,000 |
|
| 1,200,151 |
|
| 1,208,025 |
|
| 7,874 |
|
Australian dollar |
| Buy |
| J.P. Morgan |
| 2/25/2013 |
| 8,340,000 |
|
| 8,486,701 |
|
| 8,579,967 |
|
| 93,266 |
|
Brazilian real |
| Buy |
| UBS AG |
| 11/26/2012 |
| 1,855,000 |
|
| 910,081 |
|
| 910,669 |
|
| 588 |
|
British pound |
| Buy |
| J.P. Morgan |
| 11/2/2012 |
| 1,710,000 |
|
| 2,741,062 |
|
| 2,759,511 |
|
| 18,449 |
|
euro |
| Buy |
| Goldman Sachs |
| 11/13/2012 |
| 430,000 |
|
| 529,678 |
|
| 557,398 |
|
| 27,720 |
|
euro |
| Buy |
| Barclays Bank plc |
| 1/24/2013 |
| 2,405,000 |
|
| 3,117,048 |
|
| 3,119,861 |
|
| 2,813 |
|
Japanese yen |
| Sell |
| UBS AG |
| 12/13/2012 |
| 43,950,000 |
|
| 559,395 |
|
| 550,756 |
|
| 8,639 |
|
Japanese yen |
| Sell |
| Deutsche Bank AG |
| 12/17/2012 |
| 71,755,000 |
|
| 914,338 |
|
| 899,242 |
|
| 15,096 |
|
Japanese yen |
| Sell |
| Credit Suisse |
| 2/12/2013 |
| 18,505,000 |
|
| 235,666 |
|
| 232,046 |
|
| 3,620 |
|
South Korean won |
| Buy |
| UBS AG |
| 11/2/2012 |
| 1,655,540,000 |
|
| 1,506,721 |
|
| 1,518,008 |
|
| 11,287 |
|
South Korean won |
| Buy |
| Deutsche Bank AG |
| 1/28/2013 |
| 10,700,000,000 |
|
| 9,488,760 |
|
| 9,768,945 |
|
| 280,185 |
|
Swiss franc |
| Buy |
| J.P. Morgan |
| 11/5/2012 |
| 1,635,000 |
|
| 1,721,179 |
|
| 1,755,689 |
|
| 34,510 |
|
Swiss franc |
| Buy |
| J.P. Morgan |
| 12/3/2012 |
| 11,550,000 |
|
| 11,843,421 |
|
| 12,407,748 |
|
| 564,327 |
|
Swiss franc |
| Buy |
| J.P. Morgan |
| 2/25/2013 |
| 415,000 |
|
| 445,781 |
|
| 446,469 |
|
| 688 |
|
|
|
|
|
|
|
|
|
|
|
|
|
|
|
|
|
| ||
Unrealized Appreciation on Forward Foreign Currency Exchange Contracts |
|
|
|
|
|
|
| $ | 1,097,108 |
| ||||||||
|
|
|
|
|
|
|
|
| ||||||||||
|
|
|
|
|
|
|
|
|
|
|
|
|
|
|
|
|
|
|
|
|
|
|
|
|
|
|
|
|
|
|
|
|
|
|
|
|
|
Forward |
| Transaction |
| Counterparty |
| Expiration |
| Foreign |
| U.S. $ |
| U.S. $ |
| Unrealized |
| |||
Brazilian real |
| Sell |
| Morgan Stanley |
| 11/26/2012 |
| 4,785,000 |
| $ | 2,300,702 |
| $ | 2,349,083 |
| $ | (48,381 | ) |
British pound |
| Buy |
| UBS AG |
| 11/2/2012 |
| 565,000 |
|
| 912,797 |
|
| 911,768 |
|
| (1,029 | ) |
British pound |
| Sell |
| UBS AG |
| 11/2/2012 |
| 2,700,000 |
|
| 4,193,100 |
|
| 4,357,123 |
|
| (164,023 | ) |
British pound |
| Sell |
| Barclays Bank plc |
| 1/14/2013 |
| 425,000 |
|
| 685,360 |
|
| 685,687 |
|
| (327 | ) |
British pound |
| Sell |
| Barclays Bank plc |
| 1/14/2013 |
| 1,885,000 |
|
| 3,030,298 |
|
| 3,041,221 |
|
| (10,923 | ) |
Canadian dollar |
| Buy |
| UBS AG |
| 2/4/2013 |
| 1,168,000 |
|
| 1,185,991 |
|
| 1,167,067 |
|
| (18,924 | ) |
Canadian dollar |
| Buy |
| J.P. Morgan |
| 2/25/2013 |
| 6,690,000 |
|
| 6,726,390 |
|
| 6,681,393 |
|
| (44,997 | ) |
euro |
| Sell |
| Barclays Bank plc |
| 11/13/2012 |
| 430,000 |
|
| 554,122 |
|
| 557,398 |
|
| (3,276 | ) |
euro |
| Sell |
| Barclays Bank plc |
| 11/26/2012 |
| 555,000 |
|
| 677,306 |
|
| 719,513 |
|
| (42,207 | ) |
euro |
| Sell |
| Deutsche Bank AG |
| 11/26/2012 |
| 435,000 |
|
| 526,090 |
|
| 563,943 |
|
| (37,853 | ) |
euro |
| Buy |
| UBS AG |
| 11/26/2012 |
| 990,000 |
|
| 1,300,900 |
|
| 1,283,456 |
|
| (17,444 | ) |
euro |
| Sell |
| Barclays Bank plc |
| 1/22/2013 |
| 205,000 |
|
| 264,395 |
|
| 265,929 |
|
| (1,534 | ) |
euro |
| Buy |
| UBS AG |
| 1/22/2013 |
| 205,000 |
|
| 269,538 |
|
| 265,929 |
|
| (3,609 | ) |
euro |
| Buy |
| Barclays Bank plc |
| 1/24/2013 |
| 1,147,000 |
|
| 1,490,194 |
|
| 1,487,934 |
|
| (2,260 | ) |
euro |
| Sell |
| Barclays Bank plc |
| 1/24/2013 |
| 1,155,000 |
|
| 1,493,865 |
|
| 1,498,311 |
|
| (4,446 | ) |
euro |
| Sell |
| Barclays Bank plc |
| 1/24/2013 |
| 1,040,000 |
|
| 1,342,804 |
|
| 1,349,129 |
|
| (6,325 | ) |
euro |
| Sell |
| Barclays Bank plc |
| 1/24/2013 |
| 891,000 |
|
| 1,149,179 |
|
| 1,155,840 |
|
| (6,661 | ) |
Norwegian krone |
| Sell |
| J.P. Morgan |
| 1/31/2013 |
| 13,810,000 |
|
| 2,384,429 |
|
| 2,414,335 |
|
| (29,906 | ) |
Philippine peso |
| Sell |
| Morgan Stanley |
| 1/28/2013 |
| 328,450,000 |
|
| 7,868,951 |
|
| 7,986,432 |
|
| (117,481 | ) |
South Korean won |
| Sell |
| UBS AG |
| 11/2/2012 |
| 1,655,540,000 |
|
| 1,420,699 |
|
| 1,518,008 |
|
| (97,309 | ) |
South Korean won |
| Sell |
| UBS AG |
| 1/28/2013 |
| 1,665,817,803 |
|
| 1,509,030 |
|
| 1,520,868 |
|
| (11,838 | ) |
|
|
|
|
|
|
|
|
|
|
|
|
|
|
|
|
| ||
Unrealized Depreciation on Forward Foreign Currency Exchange Contracts |
|
|
|
|
| $ | (670,753 | ) | ||||||||||
|
|
|
|
|
|
|
|
| ||||||||||
|
|
|
52 | See Notes to Financial Statements. |
|
Schedule of Investments |
VALUE OPPORTUNITIES FUND October 31, 2012 |
|
|
|
|
|
|
|
|
Investments |
| Shares |
| Fair |
| ||
| |||||||
COMMON STOCKS 98.57% |
|
|
|
|
|
|
|
|
|
|
|
|
|
|
|
Aerospace & Defense 0.77% |
|
|
|
|
|
|
|
Hexcel Corp.* |
|
| 604,136 |
| $ | 15,442 |
|
|
|
|
|
|
| ||
|
|
|
|
|
|
|
|
Air Freight & Logistics 1.51% |
|
|
|
|
|
|
|
Atlas Air Worldwide |
|
| 551,201 |
|
| 30,311 |
|
|
|
|
|
|
| ||
|
|
|
|
|
|
|
|
Airlines 0.56% |
|
|
|
|
|
|
|
Spirit Airlines, Inc.* |
|
| 644,629 |
|
| 11,313 |
|
|
|
|
|
|
| ||
|
|
|
|
|
|
|
|
Beverages 2.22% |
|
|
|
|
|
|
|
Beam, Inc. |
|
| 348,383 |
|
| 19,356 |
|
Constellation Brands, |
|
| 717,600 |
|
| 25,360 |
|
|
|
|
|
|
| ||
Total |
|
|
|
|
| 44,716 |
|
|
|
|
|
|
| ||
|
|
|
|
|
|
|
|
Building Products 1.05% |
|
|
|
|
|
|
|
Fortune Brands Home & |
|
| 746,128 |
|
| 21,220 |
|
|
|
|
|
|
| ||
|
|
|
|
|
|
|
|
Capital Markets 2.14% |
|
|
|
|
|
|
|
Ares Capital Corp. |
|
| 795,037 |
|
| 13,881 |
|
Raymond James Financial, |
|
| 766,983 |
|
| 29,253 |
|
|
|
|
|
|
| ||
Total |
|
|
|
|
| 43,134 |
|
|
|
|
|
|
| ||
|
|
|
|
|
|
|
|
Chemicals 4.06% |
|
|
|
|
|
|
|
Albemarle Corp. |
|
| 193,442 |
|
| 10,661 |
|
Celanese Corp. Series A |
|
| 650,400 |
|
| 24,709 |
|
Chemtura Corp.* |
|
| 1,793,000 |
|
| 28,562 |
|
Eastman Chemical Co. |
|
| 300,000 |
|
| 17,772 |
|
|
|
|
|
|
| ||
Total |
|
|
|
|
| 81,704 |
|
|
|
|
|
|
| ||
|
|
|
|
|
|
|
|
Commercial Banks 10.48% |
|
|
|
|
|
|
|
BOK Financial Corp. |
|
| 485,100 |
|
| 28,451 |
|
City National Corp. |
|
| 268,900 |
|
| 13,741 |
|
Comerica, Inc. |
|
| 1,291,857 |
|
| 38,510 |
|
Commerce Bancshares, Inc. |
|
| 355,281 |
|
| 13,529 |
|
Cullen/Frost Bankers, Inc. |
|
| 223,869 |
|
| 12,380 |
|
East West Bancorp, Inc. |
|
| 784,056 |
|
| 16,693 |
|
Signature Bank* |
|
| 456,711 |
|
| 32,536 |
|
Western Alliance Bancorp* |
|
| 796,523 |
|
| 8,172 |
|
|
|
|
|
|
|
|
|
Investments |
|
| Shares |
|
| Fair |
|
| |||||||
Wintrust Financial Corp. |
|
| 732,500 |
| $ | 27,066 |
|
Zions Bancorporation |
|
| 922,300 |
|
| 19,802 |
|
|
|
|
|
|
| ||
Total |
|
|
|
|
| 210,880 |
|
|
|
|
|
|
| ||
|
|
|
|
|
|
|
|
Commercial Services & Supplies 1.59% |
|
|
|
|
|
|
|
Tetra Tech, Inc.* |
|
| 885,470 |
|
| 22,969 |
|
Waste Connections, Inc. |
|
| 275,122 |
|
| 9,032 |
|
|
|
|
|
|
| ||
Total |
|
|
|
|
| 32,001 |
|
|
|
|
|
|
| ||
|
|
|
|
|
|
|
|
Computers & Peripherals 0.57% |
|
|
|
|
|
|
|
Synaptics, Inc.* |
|
| 495,549 |
|
| 11,477 |
|
|
|
|
|
|
| ||
|
|
|
|
|
|
|
|
Construction & Engineering 1.97% |
|
|
|
|
|
|
|
Chicago Bridge & Iron Co. |
|
| 239,100 |
|
| 8,978 |
|
Jacobs Engineering |
|
| 794,100 |
|
| 30,644 |
|
|
|
|
|
|
| ||
Total |
|
|
|
|
| 39,622 |
|
|
|
|
|
|
| ||
|
|
|
|
|
|
|
|
Construction Materials 0.64% |
|
|
|
|
|
|
|
Berry Plastics Group, Inc.* |
|
| 908,300 |
|
| 12,871 |
|
|
|
|
|
|
| ||
|
|
|
|
|
|
|
|
Containers & Packaging 2.52% |
|
|
|
|
|
|
|
Rock-Tenn Co. Class A |
|
| 532,300 |
|
| 38,959 |
|
Sealed Air Corp. |
|
| 723,600 |
|
| 11,737 |
|
|
|
|
|
|
| ||
Total |
|
|
|
|
| 50,696 |
|
|
|
|
|
|
| ||
|
|
|
|
|
|
|
|
Diversified Financial Services 0.59% |
|
|
|
|
|
|
|
CIT Group, Inc.* |
|
| 321,500 |
|
| 11,966 |
|
|
|
|
|
|
| ||
|
|
|
|
|
|
|
|
Electric: Utilities 3.94% |
|
|
|
|
|
|
|
Cleco Corp. |
|
| 269,300 |
|
| 11,620 |
|
Great Plains Energy, Inc. |
|
| 482,600 |
|
| 10,830 |
|
ITC Holdings Corp. |
|
| 306,000 |
|
| 24,364 |
|
NV Energy, Inc. |
|
| 1,702,500 |
|
| 32,364 |
|
|
|
|
|
|
| ||
Total |
|
|
|
|
| 79,178 |
|
|
|
|
|
|
| ||
|
|
|
|
|
|
|
|
Electrical Equipment 0.55% |
|
|
|
|
|
|
|
EnerSys* |
|
| 320,521 |
|
| 11,052 |
|
|
|
|
|
|
| ||
|
|
|
|
|
|
|
|
Electronic Equipment, Instruments & |
|
|
|
|
|
|
|
Amphenol Corp. Class A |
|
| 283,900 |
|
| 17,071 |
|
Jabil Circuit, Inc. |
|
| 1,138,700 |
|
| 19,745 |
|
|
|
|
| See Notes to Financial Statements. | 53 |
|
Schedule of Investments (continued) |
VALUE OPPORTUNITIES FUND October 31, 2012 |
|
|
|
|
|
|
|
|
Investments |
|
| Shares |
|
| Fair |
|
| |||||||
Electronic Equipment, Instruments & |
|
|
|
|
|
|
|
ScanSource, Inc.* |
|
| 30,935 |
| $ | 905 |
|
Trimble Navigation Ltd.* |
|
| 150,000 |
|
| 7,077 |
|
|
|
|
|
|
| ||
Total |
|
|
|
|
| 44,798 |
|
|
|
|
|
|
| ||
|
|
|
|
|
|
|
|
Energy Equipment & Services 3.08% |
|
|
|
|
|
|
|
GulfMark Offshore, Inc. |
|
| 447,096 |
|
| 14,450 |
|
Helix Energy Solutions |
|
| 1,088,900 |
|
| 18,827 |
|
Helmerich & Payne, Inc. |
|
| 217,400 |
|
| 10,392 |
|
Superior Energy Services, |
|
| 900,100 |
|
| 18,299 |
|
|
|
|
|
|
| ||
Total |
|
|
|
|
| 61,968 |
|
|
|
|
|
|
| ||
|
|
|
|
|
|
|
|
Food & Staples Retailing 0.71% |
|
|
|
|
|
|
|
Harris Teeter |
|
| 381,400 |
|
| 14,283 |
|
|
|
|
|
|
| ||
|
|
|
|
|
|
|
|
Food Products 1.71% |
|
|
|
|
|
|
|
Bunge Ltd. |
|
| 342,900 |
|
| 24,356 |
|
Ralcorp Holdings, Inc.* |
|
| 137,998 |
|
| 9,962 |
|
|
|
|
|
|
| ||
Total |
|
|
|
|
| 34,318 |
|
|
|
|
|
|
| ||
|
|
|
|
|
|
|
|
Health Care Equipment & Supplies 0.34% |
|
|
|
|
|
|
|
Hologic, Inc.* |
|
| 330,500 |
|
| 6,815 |
|
|
|
|
|
|
| ||
|
|
|
|
|
|
|
|
Health Care Providers & Services 4.59% |
|
|
|
|
|
|
|
Community Health |
|
| 840,307 |
|
| 23,041 |
|
DaVita HealthCare |
|
| 189,506 |
|
| 21,323 |
|
Hanger, Inc.* |
|
| 334,900 |
|
| 8,490 |
|
Laboratory Corp. of |
|
| 192,100 |
|
| 16,277 |
|
MEDNAX, Inc.* |
|
| 335,400 |
|
| 23,136 |
|
|
|
|
|
|
| ||
Total |
|
|
|
|
| 92,267 |
|
|
|
|
|
|
| ||
|
|
|
|
|
|
|
|
Hotels, Restaurants & Leisure 1.97% |
|
|
|
|
|
|
|
Darden Restaurants, Inc. |
|
| 407,500 |
|
| 21,443 |
|
Hyatt Hotels Corp. Class A* |
|
| 131,977 |
|
| 4,817 |
|
|
|
|
|
|
| ||
|
|
|
|
|
|
|
|
Investments |
|
| Shares |
|
| Fair |
|
| |||||||
Red Robin Gourmet |
|
| 399,700 |
| $ | 13,350 |
|
|
|
|
|
|
| ||
Total |
|
|
|
|
| 39,610 |
|
|
|
|
|
|
| ||
|
|
|
|
|
|
|
|
Household Durables 2.41% |
|
|
|
|
|
|
|
Jarden Corp. |
|
| 511,100 |
|
| 25,453 |
|
Mohawk Industries, Inc.* |
|
| 276,398 |
|
| 23,071 |
|
|
|
|
|
|
| ||
Total |
|
|
|
|
| 48,524 |
|
|
|
|
|
|
| ||
|
|
|
|
|
|
|
|
Household Products 0.91% |
|
|
|
|
|
|
|
Spectrum Brands Holdings, |
|
| 401,400 |
|
| 18,260 |
|
|
|
|
|
|
| ||
|
|
|
|
|
|
|
|
Information Technology Services 9.22% |
|
|
|
|
|
|
|
Acxiom Corp.* |
|
| 463,400 |
|
| 8,457 |
|
Alliance Data Systems Corp.* |
|
| 163,700 |
|
| 23,417 |
|
Amdocs Ltd. |
|
| 904,398 |
|
| 29,908 |
|
Fiserv, Inc.* |
|
| 331,959 |
|
| 24,877 |
|
FleetCor Technologies, Inc.* |
|
| 568,275 |
|
| 26,942 |
|
Global Payments, Inc. |
|
| 527,322 |
|
| 22,543 |
|
Lender Processing Services, |
|
| 1,239,300 |
|
| 29,880 |
|
Sapient Corp.* |
|
| 1,897,327 |
|
| 19,505 |
|
|
|
|
|
|
| ||
Total |
|
|
|
|
| 185,529 |
|
|
|
|
|
|
| ||
|
|
|
|
|
|
|
|
Insurance 6.95% |
|
|
|
|
|
|
|
Alterra Capital Holdings Ltd. |
|
| 824,119 |
|
| 20,133 |
|
Arch Capital Group Ltd.* |
|
| 994,406 |
|
| 43,903 |
|
Brown & Brown, Inc. |
|
| 688,800 |
|
| 17,599 |
|
Hartford Financial Services |
|
| 581,800 |
|
| 12,631 |
|
PartnerRe Ltd. |
|
| 246,800 |
|
| 19,991 |
|
RenaissanceRe Holdings Ltd. |
|
| 314,000 |
|
| 25,547 |
|
|
|
|
|
|
| ||
Total |
|
|
|
|
| 139,804 |
|
|
|
|
|
|
| ||
|
|
|
|
|
|
|
|
Life Sciences Tools & Services 2.23% |
|
|
|
|
|
|
|
PerkinElmer, Inc. |
|
| 1,448,900 |
|
| 44,814 |
|
|
|
|
|
|
| ||
|
|
|
|
|
|
|
|
Machinery 0.76% |
|
|
|
|
|
|
|
ESCO Technologies, Inc. |
|
| 408,800 |
|
| 15,305 |
|
|
|
|
|
|
|
|
|
|
54 | See Notes to Financial Statements. |
|
|
Schedule of Investments (continued) |
VALUE OPPORTUNITIES FUND October 31, 2012 |
|
|
|
|
|
|
|
|
Investments |
|
| Shares |
|
| Fair |
|
| |||||||
Media 0.93% |
|
|
|
|
|
|
|
Interpublic Group of Cos., |
|
| 1,853,643 |
| $ | 18,722 |
|
|
|
|
|
|
| ||
|
|
|
|
|
|
|
|
Metals & Mining 3.30% |
|
|
|
|
|
|
|
Allegheny Technologies, Inc. |
|
| 644,400 |
|
| 16,980 |
|
Carpenter Technology Corp. |
|
| 317,476 |
|
| 15,432 |
|
Reliance Steel & Aluminum |
|
| 623,900 |
|
| 33,903 |
|
|
|
|
|
|
| ||
Total |
|
|
|
|
| 66,315 |
|
|
|
|
|
|
| ||
|
|
|
|
|
|
|
|
Multi-Utilities 1.76% |
|
|
|
|
|
|
|
CMS Energy Corp. |
|
| 776,600 |
|
| 18,887 |
|
Wisconsin Energy Corp. |
|
| 429,099 |
|
| 16,507 |
|
|
|
|
|
|
| ||
Total |
|
|
|
|
| 35,394 |
|
|
|
|
|
|
| ||
|
|
|
|
|
|
|
|
Oil, Gas & Consumable Fuels 2.22% |
|
|
|
|
|
|
|
EQT Corp. |
|
| 442,400 |
|
| 26,823 |
|
Range Resources Corp. |
|
| 271,400 |
|
| 17,738 |
|
|
|
|
|
|
| ||
Total |
|
|
|
|
| 44,561 |
|
|
|
|
|
|
| ||
|
|
|
|
|
|
|
|
Pharmaceuticals 2.60% |
|
|
|
|
|
|
|
Watson Pharmaceuticals, |
|
| 609,500 |
|
| 52,386 |
|
|
|
|
|
|
| ||
|
|
|
|
|
|
|
|
Real Estate Investment Trusts 3.20% |
|
|
|
|
|
|
|
American Campus |
|
|
|
|
|
|
|
Communities, Inc. |
|
| 469,101 |
|
| 21,255 |
|
Digital Realty Trust, Inc. |
|
| 153,500 |
|
| 9,430 |
|
Home Properties, Inc. |
|
| 155,700 |
|
| 9,465 |
|
Liberty Property Trust |
|
| 510,900 |
|
| 17,943 |
|
Sovran Self Storage, Inc. |
|
| 110,112 |
|
| 6,364 |
|
|
|
|
|
|
| ||
Total |
|
|
|
|
| 64,457 |
|
|
|
|
|
|
| ||
|
|
|
|
|
|
|
|
Real Estate Management & Development |
|
|
|
|
|
|
|
Realogy Holdings Corp.* |
|
| 300,130 |
|
| 10,667 |
|
|
|
|
|
|
| ||
|
|
|
|
|
|
|
|
Road & Rail 2.25% |
|
|
|
|
|
|
|
Genesee & Wyoming, Inc. |
|
| 333,600 |
|
| 24,176 |
|
Kansas City Southern |
|
| 133,300 |
|
| 10,725 |
|
Werner Enterprises, Inc. |
|
| 444,200 |
|
| 10,288 |
|
|
|
|
|
|
| ||
Total |
|
|
|
|
| 45,189 |
|
|
|
|
|
|
| ||
|
|
|
|
|
|
|
|
Investments |
|
| Shares |
|
| Fair |
|
| |||||||
Semiconductors & Semiconductor Equipment |
|
|
|
|
|
|
|
Lam Research Corp.* |
|
| 666,000 |
| $ | 23,576 |
|
|
|
|
|
|
| ||
|
|
|
|
|
|
|
|
Software 2.39% |
|
|
|
|
|
|
|
Nuance Communications, |
|
| 1,536,585 |
|
| 34,204 |
|
Rovi Corp.* |
|
| 1,022,000 |
|
| 13,828 |
|
|
|
|
|
|
| ||
Total |
|
|
|
|
| 48,032 |
|
|
|
|
|
|
| ||
|
|
|
|
|
|
|
|
Specialty Retail 1.41% |
|
|
|
|
|
|
|
Men’s Wearhouse, Inc. (The) |
|
| 451,539 |
|
| 14,806 |
|
Penske Automotive Group, |
|
| 242,000 |
|
| 7,405 |
|
Tiffany & Co. |
|
| 95,700 |
|
| 6,050 |
|
|
|
|
|
|
| ||
Total |
|
|
|
|
| 28,261 |
|
|
|
|
|
|
| ||
|
|
|
|
|
|
|
|
Textiles, Apparel & Luxury Goods 2.29% |
|
|
|
|
|
|
|
Gildan Activewear, Inc. |
|
| 444,800 |
|
| 15,177 |
|
PVH Corp. |
|
| 281,199 |
|
| 30,929 |
|
|
|
|
|
|
| ||
Total |
|
|
|
|
| 46,106 |
|
|
|
|
|
|
| ||
|
|
|
|
|
|
|
|
Trading Companies & Distributors 1.31% |
|
|
|
|
|
|
|
TAL International Group, |
|
| 773,996 |
|
| 26,424 |
|
|
|
|
|
|
| ||
|
|
|
|
|
|
|
|
Water Utilities 0.94% |
|
|
|
|
|
|
|
Aqua America, Inc. |
|
| 741,505 |
|
| 18,827 |
|
|
|
|
|
|
| ||
Total Common Stocks |
|
|
|
|
| 1,982,795 |
|
|
|
|
|
|
|
|
|
|
| See Notes to Financial Statements. | 55 |
|
Schedule of Investments (concluded) |
VALUE OPPORTUNITIES FUND October 31, 2012 |
|
|
|
|
|
|
|
|
Investments |
|
| Principal |
|
| Fair |
|
| |||||||
SHORT-TERM INVESTMENT 1.61% |
|
|
|
|
|
|
|
|
|
|
|
|
|
|
|
Repurchase Agreement |
|
|
|
|
|
|
|
Repurchase Agreement |
| $ | 32,312 |
| $ | 32,312 |
|
|
|
|
|
|
| ||
Total Investments in |
|
|
|
|
|
|
|
Securities 100.18% |
|
|
|
|
|
|
|
(cost $1,741,483,996) |
|
|
|
|
| 2,015,107 |
|
|
|
|
|
|
| ||
Liabilities in Excess of |
|
|
|
|
| (3,585 | ) |
|
|
|
|
|
| ||
Net Assets 100.00% |
|
|
|
| $ | 2,011,522 |
|
|
|
|
|
|
|
|
|
* | Non-income producing security. |
(a) | Foreign security traded in U.S. dollars. |
|
|
|
56 | See Notes to Financial Statements. |
|
This page is intentionally left blank.
|
Statements of Assets and Liabilities |
October 31, 2012 |
|
|
|
|
|
|
|
|
|
|
|
|
| Alpha Strategy |
| Fundamental |
| Growth |
| |||
ASSETS: |
|
|
|
|
|
|
|
|
|
|
Investments in securities, at cost |
| $ | 755,950,497 |
| $ | 4,097,753,205 |
| $ | 23,641,402 |
|
Investments in securities, at fair value |
| $ | 861,348,417 |
| $ | 4,641,488,280 |
| $ | 23,781,942 |
|
Cash |
|
| — |
|
| — |
|
| 22,035 |
|
Foreign cash, at value (cost $0, $0, $0, $4,919,579, |
|
| — |
|
| — |
|
| — |
|
Receivables: |
|
|
|
|
|
|
|
|
|
|
Interest and dividends |
|
| — |
|
| 3,930,857 |
|
| 10,560 |
|
Investment securities sold |
|
| — |
|
| 12,330,079 |
|
| — |
|
Capital shares sold |
|
| 1,295,179 |
|
| 7,147,174 |
|
| 46,554 |
|
From advisor (See Note 3) |
|
| — |
|
| 29 |
|
| 9,594 |
|
From affiliates (See Note 3) |
|
| 134,573 |
|
| — |
|
| — |
|
Unrealized appreciation on forward foreign |
|
| — |
|
| — |
|
| — |
|
Prepaid expenses and other assets |
|
| 32,656 |
|
| 144,696 |
|
| 18,459 |
|
Total assets |
|
| 862,810,825 |
|
| 4,665,041,115 |
|
| 23,889,144 |
|
LIABILITIES: |
|
|
|
|
|
|
|
|
|
|
Payables: |
|
|
|
|
|
|
|
|
|
|
To bank |
|
| 293,393 |
|
| — |
|
| — |
|
Investment securities purchased |
|
| — |
|
| 6,901,997 |
|
| — |
|
Capital shares reacquired |
|
| 2,671,017 |
|
| 19,595,075 |
|
| 32,631 |
|
Management fee |
|
| — |
|
| 2,069,144 |
|
| 11,683 |
|
12b-1 distribution fees |
|
| 377,627 |
|
| 2,086,403 |
|
| 8,944 |
|
Fund administration |
|
| — |
|
| 160,677 |
|
| 850 |
|
Trustees’ fees |
|
| 76,080 |
|
| 586,056 |
|
| — |
|
To affiliates (See Note 3) |
|
| — |
|
| 7,127 |
|
| — |
|
Unrealized depreciation on forward foreign |
|
| — |
|
| — |
|
| — |
|
Accrued expenses and other liabilities |
|
| 342,075 |
|
| 1,490,913 |
|
| 49,570 |
|
Total liabilities |
|
| 3,760,192 |
|
| 32,897,392 |
|
| 103,678 |
|
NET ASSETS |
| $ | 859,050,633 |
| $ | 4,632,143,723 |
| $ | 23,785,466 |
|
COMPOSITION OF NET ASSETS: |
|
|
|
|
|
|
|
|
|
|
Paid-in capital |
| $ | 728,260,839 |
| $ | 4,024,044,318 |
| $ | 24,071,192 |
|
Undistributed (distributions in excess of) net |
|
| (2,098,018 | ) |
| 19,602,384 |
|
| 11,717 |
|
Accumulated net realized gain (loss) on |
|
| 27,489,892 |
|
| 44,761,946 |
|
| (437,983 | ) |
Net unrealized appreciation on investments |
|
| 105,397,920 |
|
| 543,735,075 |
|
| 140,540 |
|
Net Assets |
| $ | 859,050,633 |
| $ | 4,632,143,723 |
| $ | 23,785,466 |
|
|
|
|
58 | See Notes to Financial Statements. |
|
|
|
|
|
|
|
|
|
|
|
|
|
|
| International |
| International |
| International |
| Value |
| ||||
|
|
|
|
|
|
|
|
|
|
|
|
|
|
|
|
|
|
|
|
|
|
|
|
|
|
| $ | 677,283,852 |
| $ | 1,603,374,260 |
| $ | 280,977,356 |
| $ | 1,741,483,996 |
|
| $ | 723,622,275 |
| $ | 1,715,847,151 |
| $ | 297,176,660 |
| $ | 2,015,107,062 |
|
|
| 1,612,144 |
|
| 4,777,569 |
|
| 260,000 |
|
| 2,416,656 |
|
|
|
|
|
|
|
|
|
|
|
|
|
|
|
| 4,924,205 |
|
| 17,898,150 |
|
| 3,510,551 |
|
| — |
|
|
|
|
|
|
|
|
|
|
|
|
|
|
|
| 1,719,946 |
|
| 4,508,077 |
|
| 855,174 |
|
| 602,434 |
|
|
| 5,351,352 |
|
| 8,329,804 |
|
| — |
|
| 4,157,317 |
|
|
| 2,028,115 |
|
| 7,095,427 |
|
| 80,794 |
|
| 3,608,636 |
|
|
| 218,872 |
|
| 456,057 |
|
| — |
|
| — |
|
|
| — |
|
| — |
|
| — |
|
| — |
|
|
|
|
|
|
|
|
|
|
|
|
|
|
|
| 3,300,068 |
|
| 13,768,024 |
|
| 1,097,108 |
|
| — |
|
|
| 24,917 |
|
| 65,400 |
|
| 16,342 |
|
| 39,463 |
|
|
| 742,801,894 |
|
| 1,772,745,659 |
|
| 302,996,629 |
|
| 2,025,931,568 |
|
|
|
|
|
|
|
|
|
|
|
|
|
|
|
|
|
|
|
|
|
|
|
|
|
|
|
|
| — |
|
| — |
|
| — |
|
| — |
|
|
| 2,622,039 |
|
| 10,578,893 |
|
| 631,373 |
|
| 3,129,347 |
|
|
| 1,667,276 |
|
| 2,001,305 |
|
| 308,389 |
|
| 8,367,715 |
|
|
| 474,778 |
|
| 1,077,292 |
|
| 191,988 |
|
| 1,250,741 |
|
|
| 204,149 |
|
| 297,707 |
|
| 54,031 |
|
| 770,997 |
|
|
| 25,321 |
|
| 59,139 |
|
| 10,239 |
|
| 69,150 |
|
|
| 129,577 |
|
| 36,376 |
|
| 52,415 |
|
| 71,841 |
|
|
| 4,743 |
|
| 72,548 |
|
| 30,221 |
|
| 22,433 |
|
|
|
|
|
|
|
|
|
|
|
|
|
|
|
| 3,411,628 |
|
| 9,705,867 |
|
| 670,753 |
|
| — |
|
|
| 389,805 |
|
| 471,998 |
|
| 140,502 |
|
| 726,912 |
|
|
| 8,929,316 |
|
| 24,301,125 |
|
| 2,089,911 |
|
| 14,409,136 |
|
| $ | 733,872,578 |
| $ | 1,748,444,534 |
| $ | 300,906,718 |
| $ | 2,011,522,432 |
|
|
|
|
|
|
|
|
|
|
|
|
|
|
| $ | 1,023,874,714 |
| $ | 1,783,625,865 |
| $ | 343,668,399 |
| $ | 1,749,896,694 |
|
|
|
|
|
|
|
|
|
|
|
|
|
|
|
| 15,478,272 |
|
| 641,610 |
|
| 4,603,947 |
|
| (3,923,259 | ) |
|
|
|
|
|
|
|
|
|
|
|
|
|
|
|
|
|
|
|
|
|
|
|
|
|
|
|
| (351,680,439 | ) |
| (152,358,645 | ) |
| (63,970,818 | ) |
| (8,074,069 | ) |
|
|
|
|
|
|
|
|
|
|
|
|
|
|
|
|
|
|
|
|
|
|
|
|
|
|
|
| 46,200,031 |
|
| 116,535,704 |
|
| 16,605,190 |
|
| 273,623,066 |
|
| $ | 733,872,578 |
| $ | 1,748,444,534 |
| $ | 300,906,718 |
| $ | 2,011,522,432 |
|
|
|
|
| See Notes to Financial Statements. | 59 |
|
Statements of Assets and Liabilities (concluded) |
October 31, 2012 |
|
|
|
|
|
|
|
|
|
|
|
|
| Alpha Strategy |
| Fundamental |
| Growth |
| |||
Net assets by class: |
|
|
|
|
|
|
|
|
|
|
Class A Shares |
| $ | 421,927,032 |
| $ | 2,439,465,932 |
| $ | 15,371,864 |
|
Class B Shares |
| $ | 21,776,335 |
| $ | 76,532,987 |
|
| — |
|
Class C Shares |
| $ | 223,165,298 |
| $ | 802,052,818 |
| $ | 1,897,914 |
|
Class F Shares |
| $ | 140,859,827 |
| $ | 598,687,718 |
| $ | 3,797,323 |
|
Class I Shares |
| $ | 18,676,946 |
| $ | 394,842,079 |
| $ | 2,696,952 |
|
Class P Shares |
|
| — |
| $ | 27,936,859 |
|
| — |
|
Class R2 Shares |
| $ | 2,982,424 |
| $ | 22,335,220 |
| $ | 10,163 |
|
Class R3 Shares |
| $ | 29,662,771 |
| $ | 270,290,110 |
| $ | 11,250 |
|
Outstanding shares by class (unlimited number |
|
|
|
|
|
|
|
|
|
|
Class A Shares |
|
| 17,075,108 |
|
| 186,560,259 |
|
| 1,014,827 |
|
Class B Shares |
|
| 944,936 |
|
| 6,192,295 |
|
| — |
|
Class C Shares |
|
| 9,750,239 |
|
| 65,162,401 |
|
| 126,388 |
|
Class F Shares |
|
| 5,687,446 |
|
| 45,942,121 |
|
| 250,130 |
|
Class I Shares |
|
| 747,524 |
|
| 30,016,791 |
|
| 177,467 |
|
Class P Shares |
|
| — |
|
| 2,161,935 |
|
| — |
|
Class R2 Shares |
|
| 122,481 |
|
| 1,735,460 |
|
| 669 |
|
Class R3 Shares |
|
| 1,215,438 |
|
| 20,883,853 |
|
| 742 |
|
Net asset value, offering and redemption price |
|
|
|
|
|
|
|
|
|
|
Class A Shares-Net asset value |
| $ | 24.71 |
| $ | 13.08 |
| $ | 15.15 |
|
Class A Shares-Maximum offering price |
| $ | 26.22 |
| $ | 13.88 |
| $ | 16.07 |
|
Class B Shares-Net asset value |
| $ | 23.05 |
| $ | 12.36 |
|
| — |
|
Class C Shares-Net asset value |
| $ | 22.89 |
| $ | 12.31 |
| $ | 15.02 |
|
Class F Shares-Net asset value |
| $ | 24.77 |
| $ | 13.03 |
| $ | 15.18 |
|
Class I Shares-Net asset value |
| $ | 24.99 |
| $ | 13.15 |
| $ | 15.20 |
|
Class P Shares-Net asset value |
|
| — |
| $ | 12.92 |
|
| — |
|
Class R2 Shares-Net asset value |
| $ | 24.35 |
| $ | 12.87 |
| $ | 15.19 |
|
Class R3 Shares-Net asset value |
| $ | 24.41 |
| $ | 12.94 |
| $ | 15.16 |
|
|
|
|
60 | See Notes to Financial Statements. |
|
|
|
|
|
|
|
|
|
|
|
|
|
|
| International |
| International |
| International |
| Value |
| ||||
|
|
|
|
|
|
|
|
|
|
|
|
|
|
|
|
|
|
|
|
|
|
|
|
|
|
| $ | 383,243,640 |
| $ | 618,824,132 |
| $ | 76,138,540 |
| $ | 870,566,970 |
|
| $ | 20,124,893 |
|
| — |
| $ | 6,854,038 |
| $ | 13,315,165 |
|
| $ | 54,056,368 |
| $ | 74,664,380 |
| $ | 13,952,942 |
| $ | 248,356,966 |
|
| $ | 151,246,328 |
| $ | 128,360,450 |
| $ | 944,298 |
| $ | 369,321,128 |
|
| $ | 107,075,800 |
| $ | 893,065,792 |
| $ | 195,784,785 |
| $ | 411,545,807 |
|
| $ | 282,176 |
|
| — |
| $ | 929,200 |
| $ | 918,481 |
|
| $ | 568,383 |
| $ | 464,480 |
| $ | 90,684 |
| $ | 11,056,423 |
|
| $ | 17,274,990 |
| $ | 33,065,300 |
| $ | 6,212,231 |
| $ | 86,441,492 |
|
|
|
|
|
|
|
|
|
|
|
|
|
|
|
|
|
|
|
|
|
|
|
|
|
|
|
|
| 33,532,056 |
|
| 79,323,049 |
|
| 5,780,681 |
|
| 54,458,999 |
|
|
| 1,787,387 |
|
| — |
|
| 548,912 |
|
| 868,900 |
|
|
| 4,794,845 |
|
| 9,636,870 |
|
| 1,124,540 |
|
| 16,208,164 |
|
|
| 13,308,354 |
|
| 16,431,968 |
|
| 72,119 |
|
| 22,975,305 |
|
|
| 9,305,514 |
|
| 114,093,222 |
|
| 14,510,198 |
|
| 25,352,448 |
|
|
| 24,766 |
|
| — |
|
| 69,530 |
|
| 57,750 |
|
|
| 49,823 |
|
| 58,527 |
|
| 6,937 |
|
| 700,202 |
|
|
| 1,531,849 |
|
| 4,204,704 |
|
| 478,456 |
|
| 5,461,996 |
|
|
|
|
|
|
|
|
|
|
|
|
|
|
|
|
|
|
|
|
|
|
|
|
|
|
|
|
|
|
|
|
|
|
|
|
|
|
|
|
|
|
|
|
|
|
|
|
|
|
|
|
|
|
|
|
|
|
|
|
|
|
|
|
|
|
| $ | 11.43 |
| $ | 7.80 |
| $ | 13.17 |
| $ | 15.99 |
|
|
|
|
|
|
|
|
|
|
|
|
|
|
| $ | 12.13 |
| $ | 8.28 |
| $ | 13.97 |
| $ | 16.97 |
|
| $ | 11.26 |
|
| — |
| $ | 12.49 |
| $ | 15.32 |
|
| $ | 11.27 |
| $ | 7.75 |
| $ | 12.41 |
| $ | 15.32 |
|
| $ | 11.36 |
| $ | 7.81 |
| $ | 13.09 |
| $ | 16.07 |
|
| $ | 11.51 |
| $ | 7.83 |
| $ | 13.49 |
| $ | 16.23 |
|
| $ | 11.39 |
|
| — |
| $ | 13.36 |
| $ | 15.90 |
|
| $ | 11.41 |
| $ | 7.94 |
| $ | 13.07 |
| $ | 15.79 |
|
| $ | 11.28 |
| $ | 7.86 |
| $ | 12.98 |
| $ | 15.83 |
|
|
|
|
| See Notes to Financial Statements. | 61 |
|
|
Statements of Operations | |
For the Year Ended October 31, 2012 |
|
|
|
|
|
|
|
|
|
|
|
|
|
| Alpha Strategy |
| Fundamental |
| Growth |
| |||
Investment income: |
|
|
|
|
|
|
|
|
|
|
Dividends (net of foreign withholding taxes of $0, |
| $ | 1,835,422 |
| $ | 83,750,198 |
| $ | 163,976 |
|
Interest and other |
|
| 29 |
|
| 7,437 |
|
| 416 |
|
Total investment income |
|
| 1,835,451 |
|
| 83,757,635 |
|
| 164,392 |
|
Expenses: |
|
|
|
|
|
|
|
|
|
|
Management fee |
|
| 884,208 |
|
| 24,671,124 |
|
| 113,695 |
|
12b-1 distribution plan-Class A |
|
| 1,063,012 |
|
| 8,603,394 |
|
| 46,009 |
|
12b-1 distribution plan-Class B |
|
| 248,196 |
|
| 963,719 |
|
| — |
|
12b-1 distribution plan-Class C |
|
| 2,250,347 |
|
| 8,305,190 |
|
| 11,095 |
|
12b-1 distribution plan-Class F |
|
| 149,603 |
|
| 671,211 |
|
| 4,057 |
|
12b-1 distribution plan-Class P |
|
| — |
|
| 137,845 |
|
| — |
|
12b-1 distribution plan-Class R2 |
|
| 20,481 |
|
| 137,468 |
|
| — |
|
12b-1 distribution plan-Class R3 |
|
| 143,795 |
|
| 1,255,473 |
|
| 26 |
|
Shareholder servicing |
|
| 1,632,129 |
|
| 7,002,461 |
|
| 5,170 |
|
Professional |
|
| 36,919 |
|
| 77,917 |
|
| 41,689 |
|
Reports to shareholders |
|
| 130,058 |
|
| 587,884 |
|
| 15,360 |
|
Fund administration |
|
| — |
|
| 1,897,690 |
|
| 8,269 |
|
Custody |
|
| 15,204 |
|
| 82,047 |
|
| 9,644 |
|
Trustees’ fees |
|
| 31,802 |
|
| 169,668 |
|
| 722 |
|
Registration |
|
| 106,662 |
|
| 298,924 |
|
| 34,230 |
|
Subsidy (See Note 3) |
|
| — |
|
| 109,080 |
|
| — |
|
Offering costs |
|
| — |
|
| — |
|
| 18,258 |
|
Other |
|
| 21,287 |
|
| 166,895 |
|
| 3,209 |
|
Gross expenses |
|
| 6,733,703 |
|
| 55,137,990 |
|
| 311,433 |
|
Expense reductions (See Note 7) |
|
| (575 | ) |
| (3,251 | ) |
| (14 | ) |
Management fee waived and expenses |
|
| (884,208 | ) |
| — |
|
| (146,870 | ) |
Expenses assumed by Underlying Funds |
|
| (1,973,486 | ) |
| — |
|
| — |
|
Net expenses |
|
| 3,875,434 |
|
| 55,134,739 |
|
| 164,549 |
|
Net investment income (loss) |
|
| (2,039,983 | ) |
| 28,622,896 |
|
| (157 | ) |
Net realized and unrealized gain: |
|
|
|
|
|
|
|
|
|
|
Capital gains received from Underlying Funds |
|
| 23,324,449 |
|
| — |
|
| — |
|
Net realized gain (loss) on investments (net of |
|
| 13,988,321 |
|
| 56,031,069 |
|
| 723,147 |
|
Net change in unrealized appreciation/depreciation |
|
| 39,699,323 |
|
| 238,428,823 |
|
| (698,127 | ) |
Net realized and unrealized gain |
|
| 77,012,093 |
|
| 294,459,892 |
|
| 25,020 |
|
Net Increase in Net Assets Resulting |
| $ | 74,972,110 |
| $ | 323,082,788 |
| $ | 24,863 |
|
|
|
|
62 | See Notes to Financial Statements. |
|
|
|
|
|
|
|
|
|
|
|
|
|
|
|
|
| International |
| International |
| International |
| Value |
| ||||
|
|
|
|
|
|
|
|
|
| ||||
|
|
|
|
|
|
|
|
|
| ||||
|
|
|
|
|
|
|
|
|
| ||||
|
| $ | 26,380,787 |
| $ | 78,864,543 |
| $ | 8,275,608 |
| $ | 23,523,897 |
|
|
|
| 8,126 |
|
| 8,510 |
|
| 1,340 |
|
| 4,112 |
|
|
|
| 26,388,913 |
|
| 78,873,053 |
|
| 8,276,948 |
|
| 23,528,009 |
|
|
|
|
|
|
|
|
|
|
|
|
|
|
|
|
|
| 5,538,876 |
|
| 10,090,610 |
|
| 2,289,977 |
|
| 15,071,953 |
|
|
|
| 1,399,575 |
|
| 1,642,021 |
|
| 266,644 |
|
| 3,128,771 |
|
|
|
| 234,907 |
|
| — |
|
| 79,143 |
|
| 146,668 |
|
|
|
| 581,505 |
|
| 464,395 |
|
| 142,346 |
|
| 2,684,710 |
|
|
|
| 118,210 |
|
| 76,467 |
|
| 971 |
|
| 421,193 |
|
|
|
| 1,574 |
|
| — |
|
| 3,832 |
|
| 13,711 |
|
|
|
| 3,471 |
|
| 1,273 |
|
| 480 |
|
| 68,575 |
|
|
|
| 74,137 |
|
| 131,076 |
|
| 26,268 |
|
| 414,955 |
|
|
|
| 1,681,512 |
|
| 1,244,884 |
|
| 349,343 |
|
| 3,204,039 |
|
|
|
| 62,043 |
|
| 60,956 |
|
| 59,979 |
|
| 60,455 |
|
|
|
| 148,915 |
|
| 147,650 |
|
| 27,132 |
|
| 305,287 |
|
|
|
| 295,407 |
|
| 548,270 |
|
| 122,132 |
|
| 835,634 |
|
|
|
| 280,333 |
|
| 658,595 |
|
| 157,748 |
|
| 41,833 |
|
|
|
| 27,286 |
|
| 47,386 |
|
| 11,112 |
|
| 74,513 |
|
|
|
| 110,837 |
|
| 247,420 |
|
| 79,750 |
|
| 205,279 |
|
|
|
| 109,795 |
|
| 804,908 |
|
| 444,193 |
|
| 315,099 |
|
|
|
| — |
|
| — |
|
| — |
|
| — |
|
|
|
| 42,341 |
|
| 36,302 |
|
| 20,677 |
|
| 54,082 |
|
|
|
| 10,710,724 |
|
| 16,202,213 |
|
| 4,081,727 |
|
| 27,046,757 |
|
|
|
| (450 | ) |
| (660 | ) |
| (66 | ) |
| (1,368 | ) |
|
|
|
|
|
|
|
|
|
|
|
|
|
|
|
|
| (2,610,315 | ) |
| (3,332,119 | ) |
| — |
|
| — |
|
|
|
|
|
|
|
|
|
|
|
|
|
|
|
|
|
| — |
|
| — |
|
| — |
|
| — |
|
|
|
| 8,099,959 |
|
| 12,869,434 |
|
| 4,081,661 |
|
| 27,045,389 |
|
|
|
| 18,288,954 |
|
| 66,003,619 |
|
| 4,195,287 |
|
| (3,517,380 | ) |
|
|
|
|
|
|
|
|
|
|
|
|
|
|
|
|
| — |
|
| — |
|
| — |
|
| — |
|
|
|
|
|
|
|
|
|
|
|
|
|
|
|
|
|
|
|
|
|
|
|
|
| ||||
|
|
|
|
|
|
|
|
|
| ||||
|
|
|
|
|
|
|
|
|
| ||||
|
|
| (7,748,252 | ) |
| (109,644,672 | ) |
| 7,557,973 |
|
| (6,641,357 | ) |
|
|
|
|
|
|
|
|
|
|
|
|
|
|
|
|
|
|
|
|
|
|
|
| ||||
|
|
|
|
|
|
|
|
|
| ||||
|
|
| 17,454,403 |
|
| 114,844,497 |
|
| 19,362,776 |
|
| 122,363,437 |
|
|
|
| 9,706,151 |
|
| 5,199,825 |
|
| 26,920,749 |
|
| 115,722,080 |
|
|
|
|
|
|
|
|
|
|
|
|
|
|
|
|
| $ | 27,995,105 |
| $ | 71,203,444 |
| $ | 31,116,036 |
| $ | 112,204,700 |
|
|
|
|
| See Notes to Financial Statements. | 63 |
Statements of Changes in Net Assets
|
|
|
|
|
|
|
|
|
| Alpha Strategy Fund |
| ||||
|
| ||||||
INCREASE (DECREASE) IN NET ASSETS |
| For the |
| For the |
| ||
Operations: |
|
|
|
|
|
|
|
Net investment income (loss) |
| $ | (2,039,983 | ) | $ | (2,550,297 | ) |
Capital gains distributions received from Underlying Funds |
|
| 23,324,449 |
|
| 405,375 |
|
Net realized gain (loss) on investments and foreign |
|
| 13,988,321 |
|
| 16,326,792 |
|
Net change in unrealized appreciation/depreciation |
|
| 39,699,323 |
|
| 8,433,503 |
|
Net increase (decrease) in net assets resulting from operations |
|
| 74,972,110 |
|
| 22,615,373 |
|
Distributions to shareholders from: |
|
|
|
|
|
|
|
Net investment income |
|
|
|
|
|
|
|
Class A |
|
| — |
|
| — |
|
Class F |
|
| — |
|
| — |
|
Class I |
|
| — |
|
| — |
|
Class P |
|
| — |
|
| — |
|
Class R2 |
|
| — |
|
| — |
|
Class R3 |
|
| — |
|
| — |
|
Net realized gain |
|
|
|
|
|
|
|
Class A |
|
| (1,320,901 | ) |
| — |
|
Class B |
|
| (89,833 | ) |
| — |
|
Class C |
|
| (758,348 | ) |
| — |
|
Class F |
|
| (496,799 | ) |
| — |
|
Class I |
|
| (86,333 | ) |
| — |
|
Class P |
|
| — |
|
| — |
|
Class R2 |
|
| (10,876 | ) |
| — |
|
Class R3 |
|
| (88,046 | ) |
| — |
|
Total distributions to shareholders |
|
| (2,851,136 | ) |
| — |
|
Capital share transactions (Net of share conversions) (See Note 12): |
|
|
|
|
|
|
|
Net proceeds from sales of shares |
|
| 160,376,566 |
|
| 339,786,770 |
|
Net proceeds from reorganizations (See Note 13) |
|
| — |
|
| — |
|
Reinvestment of distributions |
|
| 2,290,398 |
|
| — |
|
Cost of shares reacquired |
|
| (257,960,933 | ) |
| (298,546,378 | ) |
Net increase (decrease) in net assets resulting from |
|
| (95,293,969 | ) |
| 41,240,392 |
|
Net increase (decrease) in net assets |
|
| (23,172,995 | ) |
| 63,855,765 |
|
NET ASSETS: |
|
|
|
|
|
|
|
Beginning of year |
| $ | 882,223,628 |
| $ | 818,367,863 |
|
End of year |
| $ | 859,050,633 |
| $ | 882,223,628 |
|
Undistributed (distributions in excess of) |
| $ | (2,098,018 | ) | $ | (58,035 | ) |
|
|
|
64 | See Notes to Financial Statements. |
|
|
|
|
|
|
|
|
|
|
|
|
|
|
|
|
| Fundamental Equity Fund |
| Growth Leaders Fund |
| ||||||||
|
| For the |
| For the |
| For the |
| For the |
| ||||
|
|
|
|
|
|
|
|
|
| ||||
|
| $ | 28,622,896 |
| $ | 2,410,156 |
| $ | (157 | ) | $ | (4,010 | ) |
|
|
| — |
|
| — |
|
| — |
|
| — |
|
|
|
|
|
|
|
|
|
|
|
|
|
|
|
|
|
| 56,031,069 |
|
| 225,744,959 |
|
| 723,147 |
|
| (1,080,958 | ) |
|
|
| 238,428,823 |
|
| (136,463,491 | ) |
| (698,127 | ) |
| 838,667 |
|
|
|
| 323,082,788 |
|
| 91,691,624 |
|
| 24,863 |
|
| (246,301 | ) |
|
|
|
|
|
|
|
|
|
|
|
|
|
|
|
|
|
|
|
|
|
|
|
| ||||
|
|
| (4,346,345 | ) |
| (5,446,274 | ) |
| — |
|
| — |
|
|
|
| (2,767,175 | ) |
| (1,986,437 | ) |
| (4,091 | ) |
| — |
|
|
|
| (1,297,980 | ) |
| (1,037,377 | ) |
| (1,877 | ) |
| — |
|
|
|
| (15,617 | ) |
| (61,422 | ) |
| — |
|
| — |
|
|
|
| (9,753 | ) |
| (15,396 | ) |
| — |
|
| — |
|
|
|
| (295,096 | ) |
| (184,856 | ) |
| — |
|
| — |
|
|
|
|
|
|
|
|
|
|
|
|
|
|
|
|
|
| (50,846,537 | ) |
| — |
|
| — |
|
| — |
|
|
|
| (2,537,677 | ) |
| — |
|
| — |
|
| — |
|
|
|
| (18,296,808 | ) |
| — |
|
| — |
|
| — |
|
|
|
| (13,809,878 | ) |
| — |
|
| — |
|
| — |
|
|
|
| (5,334,579 | ) |
| — |
|
| — |
|
| — |
|
|
|
| (658,136 | ) |
| — |
|
| — |
|
| — |
|
|
|
| (438,898 | ) |
| — |
|
| — |
|
| — |
|
|
|
| (4,123,564 | ) |
| — |
|
| — |
|
| — |
|
|
|
| (104,778,043 | ) |
| (8,731,762 | ) |
| (5,968 | ) |
| — |
|
|
|
|
|
|
|
|
|
|
|
|
|
|
|
|
|
| 1,267,974,937 |
|
| 2,373,450,067 |
|
| 20,271,860 |
|
| 21,794,501 |
|
|
|
| 39,288,499 |
|
| — |
|
| — |
|
| — |
|
|
|
| 89,512,509 |
|
| 7,768,549 |
|
| 262 |
|
| — |
|
|
|
| (1,414,939,992 | ) |
| (1,182,901,281 | ) |
| (12,527,193 | ) |
| (5,526,558 | ) |
|
|
|
|
|
|
|
|
|
|
|
|
|
|
|
|
| (18,164,047 | ) |
| 1,198,317,335 |
|
| 7,744,929 |
|
| 16,267,943 |
|
|
|
| 200,140,698 |
|
| 1,281,277,197 |
|
| 7,763,824 |
|
| 16,021,642 |
|
|
|
|
|
|
|
|
|
|
|
|
|
|
|
|
| $ | 4,432,003,025 |
| $ | 3,150,725,828 |
| $ | 16,021,642 |
| $ | — |
|
|
| $ | 4,632,143,723 |
| $ | 4,432,003,025 |
| $ | 23,785,466 |
| $ | 16,021,642 |
|
|
|
|
|
|
|
|
|
|
|
|
|
|
|
|
| $ | 19,602,384 |
| $ | 240,045 |
| $ | 11,717 |
| $ | 4,051 |
|
|
|
* | For the period June 24, 2011 (commencement of operations) to October 31, 2011. |
|
|
|
| See Notes to Financial Statements. | 65 |
Statements of Changes in Net Assets (continued)
|
|
|
|
|
|
|
|
|
| International Core Equity Fund |
| ||||
|
| ||||||
INCREASE (DECREASE) IN NET ASSETS |
| For the |
| For the |
| ||
Operations: |
|
|
|
|
|
|
|
Net investment income |
| $ | 18,288,954 |
| $ | 17,118,913 |
|
Net realized gain (loss) on investments and |
|
| (7,748,252 | ) |
| 48,354,554 |
|
Net change in unrealized appreciation/depreciation on |
|
| 17,454,403 |
|
| (121,294,924 | ) |
Net increase (decrease) in net assets resulting from operations |
|
| 27,995,105 |
|
| (55,821,457 | ) |
Distributions to shareholders from: |
|
|
|
|
|
|
|
Net investment income |
|
|
|
|
|
|
|
Class A |
|
| (8,371,658 | ) |
| (5,752,133 | ) |
Class B |
|
| (316,771 | ) |
| (156,229 | ) |
Class C |
|
| (830,063 | ) |
| (373,209 | ) |
Class F |
|
| (2,022,225 | ) |
| (520,403 | ) |
Class I |
|
| (4,638,582 | ) |
| (4,388,679 | ) |
Class P |
|
| (6,017 | ) |
| (18,601 | ) |
Class R2 |
|
| (12,015 | ) |
| (6,379 | ) |
Class R3 |
|
| (249,020 | ) |
| (124,689 | ) |
Total distributions to shareholders |
|
| (16,446,351 | ) |
| (11,340,322 | ) |
Capital share transactions (Net of share conversions) (See Note 12): |
|
|
|
|
|
|
|
Net proceeds from sales of shares |
|
| 205,500,578 |
|
| 228,058,700 |
|
Reinvestment of distributions |
|
| 15,573,757 |
|
| 10,835,934 |
|
Cost of shares reacquired |
|
| (352,301,226 | ) |
| (302,597,602 | ) |
Net increase (decrease) in net assets resulting from |
|
| (131,226,891 | ) |
| (63,702,968 | ) |
Net increase (decrease) in net assets |
|
| (119,678,137 | ) |
| (130,864,747 | ) |
NET ASSETS: |
|
|
|
|
|
|
|
Beginning of year |
| $ | 853,550,715 |
| $ | 984,415,462 |
|
End of year |
| $ | 733,872,578 |
| $ | 853,550,715 |
|
Undistributed net investment income |
| $ | 15,478,272 |
| $ | 12,933,976 |
|
|
|
|
66 | See Notes to Financial Statements. |
|
|
|
|
|
|
|
|
|
|
|
|
|
|
|
|
| International Dividend Income Fund |
| International Opportunities Fund |
| ||||||||
|
| For the |
| For the |
| For the |
| For the |
| ||||
|
|
|
|
|
|
|
|
|
|
|
|
|
|
|
| $ | 66,003,619 |
| $ | 29,860,805 |
| $ | 4,195,287 |
| $ | 3,827,143 |
|
|
|
|
|
|
|
|
|
|
|
|
|
|
|
|
|
| (109,644,672 | ) |
| (8,159,195 | ) |
| 7,557,973 |
|
| 44,777,133 |
|
|
|
|
|
|
|
|
|
|
|
|
|
|
|
|
|
|
|
|
|
|
|
|
|
|
|
|
|
|
|
| 114,844,497 |
|
| (51,744,570 | ) |
| 19,362,776 |
|
| (72,731,225 | ) |
|
|
| 71,203,444 |
|
| (30,042,960 | ) |
| 31,116,036 |
|
| (24,126,949 | ) |
|
|
|
|
|
|
|
|
|
|
|
|
|
|
|
|
|
|
|
|
|
|
|
|
|
|
|
|
|
|
| (22,602,992 | ) |
| (10,420,529 | ) |
| (555,543 | ) |
| (390,888 | ) |
|
|
| — |
|
| — |
|
| — |
|
| — |
|
|
|
| (2,102,331 | ) |
| (723,292 | ) |
| (10,632 | ) |
| — |
|
|
|
| (4,103,730 | ) |
| (1,074,651 | ) |
| (10,276 | ) |
| (8,779 | ) |
|
|
| (37,908,179 | ) |
| (17,419,521 | ) |
| (2,327,143 | ) |
| (1,691,088 | ) |
|
|
| — |
|
| — |
|
| (4,835 | ) |
| (2,941 | ) |
|
|
| (10,747 | ) |
| (434 | ) |
| (384 | ) |
| (139 | ) |
|
|
| (1,138,500 | ) |
| (9,576 | ) |
| (35,689 | ) |
| (14,604 | ) |
|
|
| (67,866,479 | ) |
| (29,648,003 | ) |
| (2,944,502 | ) |
| (2,108,439 | ) |
|
|
|
|
|
|
|
|
|
|
|
|
|
|
|
|
| 1,047,552,615 |
|
| 564,714,201 |
|
| 19,978,248 |
|
| 73,495,448 |
|
|
|
| 59,256,416 |
|
| 27,261,523 |
|
| 2,867,207 |
|
| 2,089,619 |
|
|
|
| (250,121,696 | ) |
| (98,249,560 | ) |
| (79,691,628 | ) |
| (89,288,286 | ) |
|
|
|
|
|
|
|
|
|
|
|
|
|
|
|
|
| 856,687,335 |
|
| 493,726,164 |
|
| (56,846,173 | ) |
| (13,703,219 | ) |
|
|
| 860,024,300 |
|
| 434,035,201 |
|
| (28,674,639 | ) |
| (39,938,607 | ) |
|
|
|
|
|
|
|
|
|
|
|
|
|
|
|
| $ | 888,420,234 |
| $ | 454,385,033 |
| $ | 329,581,357 |
| $ | 369,519,964 |
|
|
| $ | 1,748,444,534 |
| $ | 888,420,234 |
| $ | 300,906,718 |
| $ | 329,581,357 |
|
|
| $ | 641,610 |
| $ | 1,821,542 |
| $ | 4,603,947 |
| $ | 2,333,006 |
|
|
|
|
| See Notes to Financial Statements. | 67 |
Statements of Changes in Net Assets (concluded)
|
|
|
|
|
|
|
|
|
| Value Opportunities Fund |
| ||||
|
| ||||||
INCREASE IN NET ASSETS |
| For the |
| For the |
| ||
Operations: |
|
|
|
|
|
|
|
Net investment loss |
| $ | (3,517,380 | ) | $ | (5,090,334 | ) |
Net realized gain (loss) on investments and foreign |
|
| (6,641,357 | ) |
| 6,361,369 |
|
Net change in unrealized appreciation/depreciation |
|
| 122,363,437 |
|
| (3,667,311 | ) |
Net increase (decrease) in net assets resulting |
|
| 112,204,700 |
|
| (2,396,276 | ) |
Distributions to shareholders from: |
|
|
|
|
|
|
|
Net realized gain |
|
|
|
|
|
|
|
Class A |
|
| (3,286,340 | ) |
| (3,052,445 | ) |
Class B |
|
| (59,750 | ) |
| (100,233 | ) |
Class C |
|
| (1,016,764 | ) |
| (811,906 | ) |
Class F |
|
| (1,427,757 | ) |
| (958,671 | ) |
Class I |
|
| (1,077,354 | ) |
| (955,523 | ) |
Class P |
|
| (11,405 | ) |
| (22,412 | ) |
Class R2 |
|
| (35,968 | ) |
| (14,042 | ) |
Class R3 |
|
| (245,680 | ) |
| (112,302 | ) |
Total distributions to shareholders |
|
| (7,161,018 | ) |
| (6,027,534 | ) |
Capital share transactions (Net of share conversions) (See Note 12): |
|
|
|
|
|
|
|
Net proceeds from sales of shares |
|
| 775,084,950 |
|
| 1,396,347,849 |
|
Reinvestment of distributions |
|
| 6,175,022 |
|
| 5,241,207 |
|
Cost of shares reacquired |
|
| (790,564,647 | ) |
| (612,346,535 | ) |
Net increase (decrease) in net assets resulting |
|
| (9,304,675 | ) |
| 789,242,521 |
|
Net increase in net assets |
|
| 95,739,007 |
|
| 780,818,711 |
|
NET ASSETS: |
|
|
|
|
|
|
|
Beginning of year |
| $ | 1,915,783,425 |
| $ | 1,134,964,714 |
|
End of year |
| $ | 2,011,522,432 |
| $ | 1,915,783,425 |
|
Undistributed (distributions in excess of) |
| $ | (3,923,259 | ) | $ | 296,695 |
|
|
|
|
68 | See Notes to Financial Statements. |
|
|
Financial Highlights |
ALPHA STRATEGY FUND |
|
|
|
|
|
|
|
|
|
|
|
|
|
|
|
|
|
|
| Class A Shares |
| |||||||||||||
|
| |||||||||||||||
|
| Year Ended 10/31 |
| |||||||||||||
|
| |||||||||||||||
|
| 2012 |
| 2011 |
| 2010 |
| 2009 |
| 2008 |
| |||||
Per Share Operating Performance |
|
|
|
|
|
|
|
|
|
|
|
|
|
|
|
|
Net asset value, beginning of year |
|
| $22.72 |
|
| $21.93 |
|
| $17.24 |
|
| $15.58 |
|
| $29.08 |
|
|
|
|
|
|
|
| ||||||||||
Investment operations: |
|
|
|
|
|
|
|
|
|
|
|
|
|
|
|
|
Net investment income (loss)(a) |
|
| (.01 | ) |
| (.02 | ) |
| (.03 | ) |
| .01 |
|
| (.02 | ) |
Net realized and unrealized gain (loss) |
|
| 2.07 |
|
| .81 |
|
| 4.74 |
|
| 2.81 |
|
| (11.23 | ) |
|
|
|
|
|
|
| ||||||||||
Total from investment operations |
|
| 2.06 |
|
| .79 |
|
| 4.71 |
|
| 2.82 |
|
| (11.25 | ) |
|
|
|
|
|
|
| ||||||||||
Distributions to shareholders from: |
|
|
|
|
|
|
|
|
|
|
|
|
|
|
|
|
Net investment income |
|
| — |
|
| — |
|
| (.02 | ) |
| (.03 | ) |
| (.76 | ) |
Net realized gain |
|
| (.07 | ) |
| — |
|
| — |
|
| (1.13 | ) |
| (1.49 | ) |
|
|
|
|
|
|
| ||||||||||
Total distributions |
|
| (.07 | ) |
| — |
|
| (.02 | ) |
| (1.16 | ) |
| (2.25 | ) |
|
|
|
|
|
|
| ||||||||||
Net asset value, end of year |
|
| $24.71 |
|
| $22.72 |
|
| $21.93 |
|
| $17.24 |
|
| $15.58 |
|
|
|
|
|
|
|
| ||||||||||
| ||||||||||||||||
Total Return(b) |
|
| 9.12 | % |
| 3.60 | % |
| 27.36 | % |
| 20.57 | % |
| (41.64 | )% |
Ratios to Average Net Assets:* |
|
|
|
|
|
|
|
|
|
|
|
|
|
|
|
|
| ||||||||||||||||
Expenses, excluding expense |
|
| .25 | % |
| .28 | % |
| .35 | % |
| .35 | % |
| .35 | % |
| ||||||||||||||||
Expenses, including expense |
|
| .25 | % |
| .28 | % |
| .35 | % |
| .35 | % |
| .35 | % |
| ||||||||||||||||
Expenses, excluding expense |
|
| .57 | % |
| .60 | % |
| .70 | % |
| .87 | % |
| .76 | % |
| ||||||||||||||||
Net investment income (loss) |
|
| (.05 | )% |
| (.10 | )% |
| (.16 | )% |
| .09 | % |
| (.09 | )% |
|
|
|
|
|
|
|
|
|
|
|
|
|
|
|
|
|
Supplemental Data: |
|
|
|
|
|
|
|
|
|
|
|
|
|
|
|
|
Net assets, end of year (000) |
|
| $421,927 |
|
| $432,698 |
|
| $404,804 |
|
| $296,989 |
|
| $257,398 |
|
Portfolio turnover rate |
|
| 3.84 | % |
| 6.78 | % |
| 1.16 | % |
| 7.18 | % |
| 7.64 | % |
|
|
* | Does not include expenses of the Underlying Funds in which the Fund invests. |
(a) | Calculated using average shares outstanding during the year. |
(b) | Total return does not consider the effects of sales loads and assumes the reinvestment of all distributions. |
|
|
|
| See Notes to Financial Statements. | 69 |
|
Financial Highlights (continued) |
ALPHA STRATEGY FUND |
|
|
|
|
|
|
|
|
|
|
|
|
|
|
|
|
|
|
| Class B Shares |
| |||||||||||||
|
| |||||||||||||||
|
| Year Ended 10/31 |
| |||||||||||||
|
| |||||||||||||||
|
| 2012 |
| 2011 |
| 2010 |
| 2009 |
| 2008 |
| |||||
Per Share Operating Performance |
|
|
|
|
|
|
|
|
|
|
|
|
|
|
|
|
Net asset value, beginning of year |
|
| $21.36 |
|
| $20.76 |
|
| $16.41 |
|
| $14.94 |
|
| $27.98 |
|
|
|
|
|
|
|
| ||||||||||
Investment operations: |
|
|
|
|
|
|
|
|
|
|
|
|
|
|
|
|
Net investment loss(a) |
|
| (.17 | ) |
| (.18 | ) |
| (.15 | ) |
| (.08 | ) |
| (.15 | ) |
Net realized and unrealized gain (loss) |
|
| 1.93 |
|
| .78 |
|
| 4.50 |
|
| 2.68 |
|
| (10.81 | ) |
|
|
|
|
|
|
| ||||||||||
Total from investment operations |
|
| 1.76 |
|
| .60 |
|
| 4.35 |
|
| 2.60 |
|
| (10.96 | ) |
|
|
|
|
|
|
| ||||||||||
Distributions to shareholders from: |
|
|
|
|
|
|
|
|
|
|
|
|
|
|
|
|
Net investment income |
|
| — |
|
| — |
|
| — |
|
| — |
|
| (.59 | ) |
Net realized gain |
|
| (.07 | ) |
| — |
|
| — |
|
| (1.13 | ) |
| (1.49 | ) |
|
|
|
|
|
|
| ||||||||||
Total distributions |
|
| (.07 | ) |
| — |
|
| — |
|
| (1.13 | ) |
| (2.08 | ) |
|
|
|
|
|
|
| ||||||||||
Net asset value, end of year |
|
| $23.05 |
|
| $21.36 |
|
| $20.76 |
|
| $16.41 |
|
| $14.94 |
|
|
|
|
|
|
|
| ||||||||||
| ||||||||||||||||
Total Return(b) |
|
| 8.29 | % |
| 2.89 | % |
| 26.51 | % |
| 19.86 | % |
| (42.04 | )% |
Ratios to Average Net Assets:* |
|
|
|
|
|
|
|
|
|
|
|
|
|
|
|
|
| ||||||||||||||||
Expenses, excluding expense |
|
| 1.00 | % |
| 1.00 | % |
| 1.00 | % |
| 1.00 | % |
| 1.00 | % |
| ||||||||||||||||
Expenses, including expense |
|
| 1.00 | % |
| 1.00 | % |
| 1.00 | % |
| 1.00 | % |
| 1.00 | % |
| ||||||||||||||||
Expenses, excluding expense |
|
| 1.32 | % |
| 1.32 | % |
| 1.35 | % |
| 1.52 | % |
| 1.42 | % |
| ||||||||||||||||
Net investment loss |
|
| (.78 | )% |
| (.79 | )% |
| (.79 | )% |
| (.55 | )% |
| (.70 | )% |
|
|
|
|
|
|
|
|
|
|
|
|
|
|
|
|
|
Supplemental Data: |
|
|
|
|
|
|
|
|
|
|
|
|
|
|
|
|
Net assets, end of year (000) |
|
| $21,776 |
|
| $26,877 |
|
| $33,394 |
|
| $31,294 |
|
| $31,193 |
|
Portfolio turnover rate |
|
| 3.84 | % |
| 6.78 | % |
| 1.16 | % |
| 7.18 | % |
| 7.64 | % |
|
|
* | Does not include expenses of the Underlying Funds in which the Fund invests. |
(a) | Calculated using average shares outstanding during the year. |
(b) | Total return does not consider the effects of sales loads and assumes the reinvestment of all distributions. |
|
|
|
70 | See Notes to Financial Statements. |
|
|
Financial Highlights (continued) |
ALPHA STRATEGY FUND |
|
|
|
|
|
|
|
|
|
|
|
|
|
|
|
|
|
|
| Class C Shares |
| |||||||||||||
|
| |||||||||||||||
|
| Year Ended 10/31 |
| |||||||||||||
|
| |||||||||||||||
|
| 2012 |
| 2011 |
| 2010 |
| 2009 |
| 2008 |
| |||||
Per Share Operating Performance |
|
|
|
|
|
|
|
|
|
|
|
|
|
|
|
|
Net asset value, beginning of year |
|
| $21.21 |
|
| $20.61 |
|
| $16.29 |
|
| $14.85 |
|
| $27.87 |
|
|
|
|
|
|
|
| ||||||||||
Investment operations: |
|
|
|
|
|
|
|
|
|
|
|
|
|
|
|
|
Net investment loss(a) |
|
| (.18 | ) |
| (.18 | ) |
| (.15 | ) |
| (.08 | ) |
| (.16 | ) |
Net realized and unrealized gain (loss) |
|
| 1.93 |
|
| .78 |
|
| 4.47 |
|
| 2.65 |
|
| (10.73 | ) |
|
|
|
|
|
|
| ||||||||||
Total from investment operations |
|
| 1.75 |
|
| .60 |
|
| 4.32 |
|
| 2.57 |
|
| (10.89 | ) |
|
|
|
|
|
|
| ||||||||||
Distributions to shareholders from: |
|
|
|
|
|
|
|
|
|
|
|
|
|
|
|
|
Net investment income |
|
| — |
|
| — |
|
| — |
|
| — |
|
| (.64 | ) |
Net realized gain |
|
| (.07 | ) |
| — |
|
| — |
|
| (1.13 | ) |
| (1.49 | ) |
|
|
|
|
|
|
| ||||||||||
Total distributions |
|
| (.07 | ) |
| — |
|
| — |
|
| (1.13 | ) |
| (2.13 | ) |
|
|
|
|
|
|
| ||||||||||
Net asset value, end of year |
|
| $22.89 |
|
| $21.21 |
|
| $20.61 |
|
| $16.29 |
|
| $14.85 |
|
|
|
|
|
|
|
| ||||||||||
| ||||||||||||||||
Total Return(b) |
|
| 8.30 | % |
| 2.91 | % |
| 26.52 | % |
| 19.78 | % |
| (42.02 | )% |
Ratios to Average Net Assets:* |
|
|
|
|
|
|
|
|
|
|
|
|
|
|
|
|
| ||||||||||||||||
Expenses, excluding expense |
|
| .99 | % |
| .99 | % |
| 1.00 | % |
| 1.00 | % |
| 1.00 | % |
| ||||||||||||||||
Expenses, including expense |
|
| .99 | % |
| .99 | % |
| 1.00 | % |
| 1.00 | % |
| 1.00 | % |
| ||||||||||||||||
Expenses, excluding expense |
|
| 1.31 | % |
| 1.31 | % |
| 1.35 | % |
| 1.52 | % |
| 1.41 | % |
| ||||||||||||||||
Net investment loss |
|
| (.79 | )% |
| (.80 | )% |
| (.81 | )% |
| (.59 | )% |
| (.74 | )% |
|
|
|
|
|
|
|
|
|
|
|
|
|
|
|
|
|
Supplemental Data: |
|
|
|
|
|
|
|
|
|
|
|
|
|
|
|
|
Net assets, end of year (000) |
|
| $223,165 |
|
| $223,295 |
|
| $208,051 |
|
| $150,633 |
|
| $122,504 |
|
Portfolio turnover rate |
|
| 3.84 | % |
| 6.78 | % |
| 1.16 | % |
| 7.18 | % |
| 7.64 | % |
|
|
* | Does not include expenses of the Underlying Funds in which the Fund invests. |
(a) | Calculated using average shares outstanding during the year. |
(b) | Total return does not consider the effects of sales loads and assumes the reinvestment of all distributions. |
|
|
|
| See Notes to Financial Statements. | 71 |
|
Financial Highlights (continued) |
ALPHA STRATEGY FUND |
|
|
|
|
|
|
|
|
|
|
|
|
|
|
|
|
|
|
| Class F Shares |
| |||||||||||||
|
| |||||||||||||||
|
| Year Ended 10/31 |
| |||||||||||||
|
| |||||||||||||||
|
| 2012 |
| 2011 |
| 2010 |
| 2009 |
| 2008 |
| |||||
Per Share Operating Performance |
|
|
|
|
|
|
|
|
|
|
|
|
|
|
|
|
Net asset value, beginning of year |
|
| $22.74 |
|
| $21.91 |
|
| $17.22 |
|
| $15.58 |
|
| $29.09 |
|
|
|
|
|
|
|
| ||||||||||
Investment operations: |
|
|
|
|
|
|
|
|
|
|
|
|
|
|
|
|
Net investment income (loss)(a) |
|
| .03 |
|
| .02 |
|
| — | (b) |
| .01 |
|
| (.02 | ) |
Net realized and unrealized gain (loss) |
|
| 2.07 |
|
| .81 |
|
| 4.76 |
|
| 2.85 |
|
| (11.17 | ) |
|
|
|
|
|
|
| ||||||||||
Total from investment operations |
|
| 2.10 |
|
| .83 |
|
| 4.76 |
|
| 2.86 |
|
| (11.19 | ) |
|
|
|
|
|
|
| ||||||||||
Distributions to shareholders from: |
|
|
|
|
|
|
|
|
|
|
|
|
|
|
|
|
Net investment income |
|
| — |
|
| — |
|
| (.07 | ) |
| (.09 | ) |
| (.83 | ) |
Net realized gain |
|
| (.07 | ) |
| — |
|
| — |
|
| (1.13 | ) |
| (1.49 | ) |
|
|
|
|
|
|
| ||||||||||
Total distributions |
|
| (.07 | ) |
| — |
|
| (.07 | ) |
| (1.22 | ) |
| (2.32 | ) |
|
|
|
|
|
|
| ||||||||||
Net asset value, end of year |
|
| $24.77 |
|
| $22.74 |
|
| $21.91 |
|
| $17.22 |
|
| $15.58 |
|
|
|
|
|
|
|
| ||||||||||
| ||||||||||||||||
Total Return(c) |
|
| 9.28 | % |
| 3.79 | % |
| 27.67 | % |
| 20.95 | % |
| (41.50 | )% |
Ratios to Average Net Assets:* |
|
|
|
|
|
|
|
|
|
|
|
|
|
|
|
|
| ||||||||||||||||
Expenses, excluding expense |
|
| .10 | % |
| .10 | % |
| .10 | % |
| .10 | % |
| .10 | % |
| ||||||||||||||||
Expenses, including expense |
|
| .10 | % |
| .10 | % |
| .10 | % |
| .10 | % |
| .10 | % |
| ||||||||||||||||
Expenses, excluding expense |
|
| .42 | % |
| .42 | % |
| .44 | % |
| .60 | % |
| .55 | % |
| ||||||||||||||||
Net investment income (loss) |
|
| .12 | % |
| .08 | % |
| (.01 | )% |
| .05 | % |
| (.11 | )% |
|
|
|
|
|
|
|
|
|
|
|
|
|
|
|
|
|
Supplemental Data: |
|
|
|
|
|
|
|
|
|
|
|
|
|
|
|
|
Net assets, end of year (000) |
|
| $140,860 |
|
| $142,150 |
|
| $120,316 |
|
| $29,762 |
|
| $6,845 |
|
Portfolio turnover rate |
|
| 3.84 | % |
| 6.78 | % |
| 1.16 | % |
| 7.18 | % |
| 7.64 | % |
|
|
* | Does not include expenses of the Underlying Funds in which the Fund invests. |
(a) | Calculated using average shares outstanding during the year. |
(b) | Amount is less than $.01. |
(c) | Total return assumes the reinvestment of all distributions. |
|
|
|
72 | See Notes to Financial Statements. |
|
|
Financial Highlights (continued) |
ALPHA STRATEGY FUND |
|
|
|
|
|
|
|
|
|
|
|
|
|
|
|
|
|
|
| Class I Shares |
| |||||||||||||
|
| |||||||||||||||
|
| Year Ended 10/31 |
| |||||||||||||
|
| |||||||||||||||
|
| 2012 |
| 2011 |
| 2010 |
| 2009 |
| 2008 |
| |||||
Per Share Operating Performance |
|
|
|
|
|
|
|
|
|
|
|
|
|
|
|
|
Net asset value, beginning of year |
|
| $22.92 |
|
| $22.06 |
|
| $17.33 |
|
| $15.67 |
|
| $29.23 |
|
|
|
|
|
|
|
| ||||||||||
Investment operations: |
|
|
|
|
|
|
|
|
|
|
|
|
|
|
|
|
Net investment income(a) |
|
| .06 |
|
| .05 |
|
| .04 |
|
| .06 |
|
| .01 |
|
Net realized and unrealized gain (loss) |
|
| 2.08 |
|
| .81 |
|
| 4.77 |
|
| 2.83 |
|
| (11.24 | ) |
|
|
|
|
|
|
| ||||||||||
Total from investment operations |
|
| 2.14 |
|
| .86 |
|
| 4.81 |
|
| 2.89 |
|
| (11.23 | ) |
|
|
|
|
|
|
| ||||||||||
Distributions to shareholders from: |
|
|
|
|
|
|
|
|
|
|
|
|
|
|
|
|
Net investment income |
|
| — |
|
| — |
|
| (.08 | ) |
| (.10 | ) |
| (.84 | ) |
Net realized gain |
|
| (.07 | ) |
| — |
|
| — |
|
| (1.13 | ) |
| (1.49 | ) |
|
|
|
|
|
|
| ||||||||||
Total distributions |
|
| (.07 | ) |
| — |
|
| (.08 | ) |
| (1.23 | ) |
| (2.33 | ) |
|
|
|
|
|
|
| ||||||||||
Net asset value, end of year |
|
| $24.99 |
|
| $22.92 |
|
| $22.06 |
|
| $17.33 |
|
| $15.67 |
|
|
|
|
|
|
|
| ||||||||||
| ||||||||||||||||
Total Return(b) |
|
| 9.39 | % |
| 3.90 | % |
| 27.80 | % |
| 21.06 | % |
| (41.45 | )% |
Ratios to Average Net Assets:* |
|
|
|
|
|
|
|
|
|
|
|
|
|
|
|
|
| ||||||||||||||||
Expenses, excluding expense |
|
| .00 | % |
| .00 | % |
| .00 | % |
| .00 | % |
| .00 | % |
| ||||||||||||||||
Expenses, including expense |
|
| .00 | % |
| .00 | % |
| .00 | % |
| .00 | % |
| .00 | % |
| ||||||||||||||||
Expenses, excluding expense |
|
| .32 | % |
| .32 | % |
| .35 | % |
| .52 | % |
| .41 | % |
| ||||||||||||||||
Net investment income |
|
| .24 | % |
| .20 | % |
| .18 | % |
| .39 | % |
| .06 | % |
|
|
|
|
|
|
|
|
|
|
|
|
|
|
|
|
|
Supplemental Data: |
|
|
|
|
|
|
|
|
|
|
|
|
|
|
|
|
Net assets, end of year (000) |
|
| $18,677 |
|
| $26,906 |
|
| $25,426 |
|
| $11,785 |
|
| $8,293 |
|
Portfolio turnover rate |
|
| 3.84 | % |
| 6.78 | % |
| 1.16 | % |
| 7.18 | % |
| 7.64 | % |
|
|
* | Does not include expenses of the Underlying Funds in which the Fund invests. |
(a) | Calculated using average shares outstanding during the year. |
(b) | Total return assumes the reinvestment of all distributions. |
|
|
|
| See Notes to Financial Statements. | 73 |
|
Financial Highlights (continued) |
ALPHA STRATEGY FUND |
|
|
|
|
|
|
|
|
|
|
|
|
|
|
|
|
|
|
| Class R2 Shares |
| |||||||||||||
|
| |||||||||||||||
|
| Year Ended 10/31 |
| |||||||||||||
|
| |||||||||||||||
|
| 2012 |
| 2011 |
| 2010 |
| 2009 |
| 2008 |
| |||||
Per Share Operating Performance |
|
|
|
|
|
|
|
|
|
|
|
|
|
|
|
|
Net asset value, beginning of year |
|
| $22.47 |
|
| $21.76 |
|
| $17.13 |
|
| $15.51 |
|
| $29.08 |
|
|
|
|
|
|
|
| ||||||||||
Investment operations: |
|
|
|
|
|
|
|
|
|
|
|
|
|
|
|
|
Net investment loss(a) |
|
| (.09 | ) |
| (.09 | ) |
| (.09 | ) |
| (.05 | ) |
| (.12 | ) |
Net realized and unrealized gain (loss) |
|
| 2.04 |
|
| .80 |
|
| 4.72 |
|
| 2.83 |
|
| (11.16 | ) |
|
|
|
|
|
|
| ||||||||||
Total from investment operations |
|
| 1.95 |
|
| .71 |
|
| 4.63 |
|
| 2.78 |
|
| (11.28 | ) |
|
|
|
|
|
|
| ||||||||||
Distributions to shareholders from: |
|
|
|
|
|
|
|
|
|
|
|
|
|
|
|
|
Net investment income |
|
| — |
|
| — |
|
| — |
|
| (.03 | ) |
| (.80 | ) |
Net realized gain |
|
| (.07 | ) |
| — |
|
| — |
|
| (1.13 | ) |
| (1.49 | ) |
|
|
|
|
|
|
| ||||||||||
Total distributions |
|
| (.07 | ) |
| — |
|
| — |
|
| (1.16 | ) |
| (2.29 | ) |
|
|
|
|
|
|
| ||||||||||
Net asset value, end of year |
|
| $24.35 |
|
| $22.47 |
|
| $21.76 |
|
| $17.13 |
|
| $15.51 |
|
|
|
|
|
|
|
| ||||||||||
| ||||||||||||||||
Total Return(b) |
|
| 8.73 | % |
| 3.26 | % |
| 27.03 | % |
| 20.37 | % |
| (41.82 | )% |
Ratios to Average Net Assets:* |
|
|
|
|
|
|
|
|
|
|
|
|
|
|
|
|
| ||||||||||||||||
Expenses, excluding expense |
|
| .60 | % |
| .60 | % |
| .60 | % |
| .60 | % |
| .60 | % |
| ||||||||||||||||
Expenses, including expense |
|
| .60 | % |
| .60 | % |
| .60 | % |
| .60 | % |
| .59 | % |
| ||||||||||||||||
Expenses, excluding expense |
|
| .92 | % |
| .92 | % |
| .94 | % |
| 1.11 | % |
| 1.02 | % |
| ||||||||||||||||
Net investment loss |
|
| (.39 | )% |
| (.39 | )% |
| (.44 | )% |
| (.32 | )% |
| (.59 | )% |
|
|
|
|
|
|
|
|
|
|
|
|
|
|
|
|
|
Supplemental Data: |
|
|
|
|
|
|
|
|
|
|
|
|
|
|
|
|
Net assets, end of year (000) |
|
| $2,982 |
|
| $3,373 |
|
| $3,437 |
|
| $1,433 |
|
| $564 |
|
Portfolio turnover rate |
|
| 3.84 | % |
| 6.78 | % |
| 1.16 | % |
| 7.18 | % |
| 7.64 | % |
|
|
* | Does not include expenses of the Underlying Funds in which the Fund invests. |
(a) | Calculated using average shares outstanding during the year. |
(b) | Total return assumes the reinvestment of all distributions. |
|
|
|
74 | See Notes to Financial Statements. |
|
|
Financial Highlights (concluded) |
ALPHA STRATEGY FUND |
|
|
|
|
|
|
|
|
|
|
|
|
|
|
|
|
|
|
| Class R3 Shares |
| |||||||||||||
|
| |||||||||||||||
|
| Year Ended 10/31 |
| |||||||||||||
|
| |||||||||||||||
|
| 2012 |
| 2011 |
| 2010 |
| 2009 |
| 2008 |
| |||||
Per Share Operating Performance |
|
|
|
|
|
|
|
|
|
|
|
|
|
|
|
|
Net asset value, beginning of year |
|
| $22.50 |
|
| $21.76 |
|
| $17.12 |
|
| $15.53 |
|
| $29.08 |
|
|
|
|
|
|
|
| ||||||||||
Investment operations: |
|
|
|
|
|
|
|
|
|
|
|
|
|
|
|
|
Net investment loss(a) |
|
| (.07 | ) |
| (.07 | ) |
| (.08 | ) |
| (.02 | ) |
| (.10 | ) |
Net realized and unrealized gain (loss) |
|
| 2.05 |
|
| .81 |
|
| 4.73 |
|
| 2.79 |
|
| (11.15 | ) |
|
|
|
|
|
|
| ||||||||||
Total from investment operations |
|
| 1.98 |
|
| .74 |
|
| 4.65 |
|
| 2.77 |
|
| (11.25 | ) |
|
|
|
|
|
|
| ||||||||||
Distributions to shareholders from: |
|
|
|
|
|
|
|
|
|
|
|
|
|
|
|
|
Net investment income |
|
| — |
|
| — |
|
| (.01 | ) |
| (.05 | ) |
| (.81 | ) |
Net realized gain |
|
| (.07 | ) |
| — |
|
| — |
|
| (1.13 | ) |
| (1.49 | ) |
|
|
|
|
|
|
| ||||||||||
Total distributions |
|
| (.07 | ) |
| — |
|
| (.01 | ) |
| (1.18 | ) |
| (2.30 | ) |
|
|
|
|
|
|
| ||||||||||
Net asset value, end of year |
|
| $24.41 |
|
| $22.50 |
|
| $21.76 |
|
| $17.12 |
|
| $15.53 |
|
|
|
|
|
|
|
| ||||||||||
| ||||||||||||||||
Total Return(b) |
|
| 8.85 | % |
| 3.40 | % |
| 27.18 | % |
| 20.39 | % |
| (41.72 | )% |
Ratios to Average Net Assets:* |
|
|
|
|
|
|
|
|
|
|
|
|
|
|
|
|
| ||||||||||||||||
Expenses, excluding expense |
|
| .50 | % |
| .50 | % |
| .50 | % |
| .50 | % |
| .50 | % |
| ||||||||||||||||
Expenses, including expense |
|
| .50 | % |
| .50 | % |
| .50 | % |
| .50 | % |
| .49 | % |
| ||||||||||||||||
Expenses, excluding expense |
|
| .82 | % |
| .82 | % |
| .84 | % |
| 1.01 | % |
| .95 | % |
| ||||||||||||||||
Net investment loss |
|
| (.30 | )% |
| (.31 | )% |
| (.39 | )% |
| (.15 | )% |
| (.51 | )% |
|
|
|
|
|
|
|
|
|
|
|
|
|
|
|
|
|
Supplemental Data: |
|
|
|
|
|
|
|
|
|
|
|
|
|
|
|
|
Net assets, end of year (000) |
|
| $29,663 |
|
| $26,924 |
|
| $22,941 |
|
| $6,979 |
|
| $3,949 |
|
Portfolio turnover rate |
|
| 3.84 | % |
| 6.78 | % |
| 1.16 | % |
| 7.18 | % |
| 7.64 | % |
|
|
* | Does not include expenses of the Underlying Funds in which the Fund invests. |
(a) | Calculated using average shares outstanding during the year. |
(b) | Total return assumes the reinvestment of all distributions. |
|
|
|
| See Notes to Financial Statements. | 75 |
|
Financial Highlights |
FUNDAMENTAL EQUITY FUND |
|
|
|
|
|
|
|
|
|
|
|
|
|
|
|
|
|
|
| Class A Shares |
| |||||||||||||
|
| |||||||||||||||
|
| Year Ended 10/31 |
| |||||||||||||
|
| |||||||||||||||
|
| 2012 |
| 2011 |
| 2010 |
| 2009 |
| 2008 |
| |||||
Per Share Operating Performance |
|
|
|
|
|
|
|
|
|
|
|
|
|
|
|
|
Net asset value, beginning of year |
|
| $12.51 |
|
| $11.89 |
|
| $9.99 |
|
| $8.85 |
|
| $13.69 |
|
|
|
|
|
|
|
| ||||||||||
Investment operations: |
|
|
|
|
|
|
|
|
|
|
|
|
|
|
|
|
Net investment income(a) |
|
| .09 |
|
| .02 |
|
| .04 |
|
| .03 |
|
| .07 |
|
Net realized and unrealized gain (loss) |
|
| .77 |
|
| .64 |
|
| 1.86 |
|
| 1.17 |
|
| (3.89 | ) |
|
|
|
|
|
|
| ||||||||||
Total from investment operations |
|
| .86 |
|
| .66 |
|
| 1.90 |
|
| 1.20 |
|
| (3.82 | ) |
|
|
|
|
|
|
| ||||||||||
Distributions to shareholders from: |
|
|
|
|
|
|
|
|
|
|
|
|
|
|
|
|
Net investment income |
|
| (.02 | ) |
| (.04 | ) |
| — | (b) |
| (.06 | ) |
| (.08 | ) |
Net realized gain |
|
| (.27 | ) |
| — |
|
| — |
|
| — |
|
| (.94 | ) |
|
|
|
|
|
|
| ||||||||||
Total distributions |
|
| (.29 | ) |
| (.04 | ) |
| — | (b) |
| (.06 | ) |
| (1.02 | ) |
|
|
|
|
|
|
| ||||||||||
Net asset value, end of year |
|
| $13.08 |
|
| $12.51 |
|
| $11.89 |
|
| $9.99 |
|
| $8.85 |
|
|
|
|
|
|
|
| ||||||||||
| ||||||||||||||||
Total Return(c) |
|
| 7.17 | % |
| 5.53 | % |
| 19.06 | % |
| 13.84 | % |
| (29.89 | )% |
Ratios to Average Net Assets: |
|
|
|
|
|
|
|
|
|
|
|
|
|
|
|
|
| ||||||||||||||||
Expenses, including expense |
|
| 1.09 | % |
| 1.09 | % |
| 1.12 | % |
| 1.19 | % |
| 1.12 | % |
| ||||||||||||||||
Expenses, excluding expense |
|
| 1.09 | % |
| 1.09 | % |
| 1.12 | % |
| 1.19 | % |
| 1.12 | % |
| ||||||||||||||||
Net investment income |
|
| .68 | % |
| .16 | % |
| .38 | % |
| .28 | % |
| .58 | % |
|
|
|
|
|
|
|
|
|
|
|
|
|
|
|
|
|
Supplemental Data: |
|
|
|
|
|
|
|
|
|
|
|
|
|
|
|
|
Net assets, end of year (000) |
|
| $2,439,466 |
|
| $2,379,453 |
|
| $1,850,569 |
|
| $1,656,209 |
|
| $1,512,312 |
|
Portfolio turnover rate |
|
| 83.80 | %(d) |
| 55.07 | % |
| 80.98 | % |
| 88.13 | % |
| 85.13 | % |
|
|
(a) | Calculated using average shares outstanding during the year. |
(b) | Amount is less than $.01. |
(c) | Total return does not consider the effects of sales loads and assumes the reinvestment of all distributions. |
(d) | Excludes purchases and sales of securities in connection with the acquisition of Large Cap Value Fund on June 15, 2012. |
|
|
|
76 | See Notes to Financial Statements. |
|
|
Financial Highlights (continued) |
FUNDAMENTAL EQUITY FUND |
|
|
|
|
|
|
|
|
|
|
|
|
|
|
|
|
|
|
| Class B Shares |
| |||||||||||||
|
| |||||||||||||||
|
| Year Ended 10/31 |
| |||||||||||||
|
| |||||||||||||||
|
| 2012 |
| 2011 |
| 2010 |
| 2009 |
| 2008 |
| |||||
Per Share Operating Performance |
|
|
|
|
|
|
|
|
|
|
|
|
|
|
|
|
Net asset value, beginning of year |
|
| $11.89 |
|
| $11.35 |
|
| $9.58 |
|
| $8.48 |
|
| $13.16 |
|
|
|
|
|
|
|
| ||||||||||
Investment operations: |
|
|
|
|
|
|
|
|
|
|
|
|
|
|
|
|
Net investment income (loss)(a) |
|
| .01 |
|
| (.06 | ) |
| (.03 | ) |
| (.03 | ) |
| (.01 | ) |
Net realized and unrealized gain (loss) |
|
| .73 |
|
| .60 |
|
| 1.80 |
|
| 1.13 |
|
| (3.73 | ) |
|
|
|
|
|
|
| ||||||||||
Total from investment operations |
|
| .74 |
|
| .54 |
|
| 1.77 |
|
| 1.10 |
|
| (3.74 | ) |
|
|
|
|
|
|
| ||||||||||
Distributions to shareholders from: |
|
|
|
|
|
|
|
|
|
|
|
|
|
|
|
|
Net realized gain |
|
| (.27 | ) |
| — |
|
| — |
|
| — |
|
| (.94 | ) |
|
|
|
|
|
|
| ||||||||||
Total distributions |
|
| (.27 | ) |
| — |
|
| — |
|
| — |
|
| (.94 | ) |
|
|
|
|
|
|
| ||||||||||
Net asset value, end of year |
|
| $12.36 |
|
| $11.89 |
|
| $11.35 |
|
| $9.58 |
|
| $8.48 |
|
|
|
|
|
|
|
| ||||||||||
| ||||||||||||||||
Total Return(b) |
|
| 6.47 | % |
| 4.76 | % |
| 18.48 | % |
| 12.97 | % |
| (30.35 | )% |
Ratios to Average Net Assets: |
|
|
|
|
|
|
|
|
|
|
|
|
|
|
|
|
| ||||||||||||||||
Expenses, including expense |
|
| 1.74 | % |
| 1.73 | % |
| 1.77 | % |
| 1.84 | % |
| 1.77 | % |
| ||||||||||||||||
Expenses, excluding expense |
|
| 1.74 | % |
| 1.73 | % |
| 1.77 | % |
| 1.84 | % |
| 1.77 | % |
| ||||||||||||||||
Net investment income (loss) |
|
| .04 | % |
| (.49 | )% |
| (.29 | )% |
| (.35 | )% |
| (.07 | )% |
|
|
|
|
|
|
|
|
|
|
|
|
|
|
|
|
|
Supplemental Data: |
|
|
|
|
|
|
|
|
|
|
|
|
|
|
|
|
Net assets, end of year (000) |
|
| $76,533 |
|
| $114,980 |
|
| $149,531 |
|
| $161,233 |
|
| $169,131 |
|
Portfolio turnover rate |
|
| 83.80 | %(c) |
| 55.07 | % |
| 80.98 | % |
| 88.13 | % |
| 85.13 | % |
|
|
(a) | Calculated using average shares outstanding during the year. |
(b) | Total return does not consider the effects of sales loads and assumes the reinvestment of all distributions. |
(c) | Excludes purchases and sales of securities in connection with the acquisition of Large Cap Value Fund on June 15, 2012. |
|
|
|
| See Notes to Financial Statements. | 77 |
|
Financial Highlights (continued) |
FUNDAMENTAL EQUITY FUND |
|
|
|
|
|
|
|
|
|
|
|
|
|
|
|
|
|
|
| Class C Shares |
| |||||||||||||
|
| |||||||||||||||
|
| Year Ended 10/31 |
| |||||||||||||
|
| |||||||||||||||
|
| 2012 |
| 2011 |
| 2010 |
| 2009 |
| 2008 |
| |||||
Per Share Operating Performance |
|
|
|
|
|
|
|
|
|
|
|
|
|
|
|
|
Net asset value, beginning of year |
|
| $11.85 |
|
| $11.30 |
|
| $9.55 |
|
| $8.45 |
|
| $13.11 |
|
|
|
|
|
|
|
| ||||||||||
Investment operations: |
|
|
|
|
|
|
|
|
|
|
|
|
|
|
|
|
Net investment income (loss)(a) |
|
| — | (b) |
| (.06 | ) |
| (.03 | ) |
| (.03 | ) |
| (.01 | ) |
Net realized and unrealized gain (loss) |
|
| .73 |
|
| .61 |
|
| 1.78 |
|
| 1.13 |
|
| (3.71 | ) |
|
|
|
|
|
|
| ||||||||||
Total from investment operations |
|
| .73 |
|
| .55 |
|
| 1.75 |
|
| 1.10 |
|
| (3.72 | ) |
|
|
|
|
|
|
| ||||||||||
Distributions to shareholders from: |
|
|
|
|
|
|
|
|
|
|
|
|
|
|
|
|
Net investment income |
|
| — |
|
| — |
|
| — |
|
| — |
|
| — | (b) |
Net realized gain |
|
| (.27 | ) |
| — |
|
| — |
|
| — |
|
| (.94 | ) |
|
|
|
|
|
|
| ||||||||||
Total distributions |
|
| (.27 | ) |
| — |
|
| — |
|
| — |
|
| (.94 | ) |
|
|
|
|
|
|
| ||||||||||
Net asset value, end of year |
|
| $12.31 |
|
| $11.85 |
|
| $11.30 |
|
| $9.55 |
|
| $8.45 |
|
|
|
|
|
|
|
| ||||||||||
| ||||||||||||||||
Total Return(c) |
|
| 6.41 | % |
| 4.87 | % |
| 18.32 | % |
| 13.02 | % |
| (30.31 | )% |
Ratios to Average Net Assets: |
|
|
|
|
|
|
|
|
|
|
|
|
|
|
|
|
| ||||||||||||||||
Expenses, including expense |
|
| 1.74 | % |
| 1.73 | % |
| 1.77 | % |
| 1.84 | % |
| 1.77 | % |
| ||||||||||||||||
Expenses, excluding expense |
|
| 1.74 | % |
| 1.73 | % |
| 1.77 | % |
| 1.84 | % |
| 1.77 | % |
| ||||||||||||||||
Net investment income (loss) |
|
| .03 | % |
| (.49 | )% |
| (.26 | )% |
| (.37 | )% |
| (.07 | )% |
|
|
|
|
|
|
|
|
|
|
|
|
|
|
|
|
|
Supplemental Data: |
|
|
|
|
|
|
|
|
|
|
|
|
|
|
|
|
Net assets, end of year (000) |
|
| $802,053 |
|
| $817,590 |
|
| $603,639 |
|
| $485,484 |
|
| $419,157 |
|
Portfolio turnover rate |
|
| 83.80 | %(d) |
| 55.07 | % |
| 80.98 | % |
| 88.13 | % |
| 85.13 | % |
|
|
(a) | Calculated using average shares outstanding during the year. |
(b) | Amount is less than $.01. |
(c) | Total return does not consider the effects of sales loads and assumes the reinvestment of all distributions. |
(d) | Excludes purchases and sales of securities in connection with the acquisition of Large Cap Value Fund on June 15, 2012. |
|
|
|
78 | See Notes to Financial Statements. |
|
|
Financial Highlights (continued) |
FUNDAMENTAL EQUITY FUND |
|
|
|
|
|
|
|
|
|
|
|
|
|
|
|
|
|
|
| Class F Shares |
| |||||||||||||
|
| |||||||||||||||
|
| Year Ended 10/31 |
| |||||||||||||
|
| |||||||||||||||
|
| 2012 |
| 2011 |
| 2010 |
| 2009 |
| 2008 |
| |||||
Per Share Operating Performance |
|
|
|
|
|
|
|
|
|
|
|
|
|
|
|
|
Net asset value, beginning of year |
|
| $12.47 |
|
| $11.86 |
|
| $9.96 |
|
| $8.85 |
|
| $13.70 |
|
|
|
|
|
|
|
| ||||||||||
Investment operations: |
|
|
|
|
|
|
|
|
|
|
|
|
|
|
|
|
Net investment income(a) |
|
| .12 |
|
| .05 |
|
| .09 |
|
| .03 |
|
| .08 |
|
Net realized and unrealized gain (loss) |
|
| .76 |
|
| .63 |
|
| 1.84 |
|
| 1.18 |
|
| (3.87 | ) |
|
|
|
|
|
|
| ||||||||||
Total from investment operations |
|
| .88 |
|
| .68 |
|
| 1.93 |
|
| 1.21 |
|
| (3.79 | ) |
|
|
|
|
|
|
| ||||||||||
Distributions to shareholders from: |
|
|
|
|
|
|
|
|
|
|
|
|
|
|
|
|
Net investment income |
|
| (.05 | ) |
| (.07 | ) |
| (.03 | ) |
| (.10 | ) |
| (.12 | ) |
Net realized gain |
|
| (.27 | ) |
| — |
|
| — |
|
| — |
|
| (.94 | ) |
|
|
|
|
|
|
| ||||||||||
Total distributions |
|
| (.32 | ) |
| (.07 | ) |
| (.03 | ) |
| (.10 | ) |
| (1.06 | ) |
|
|
|
|
|
|
| ||||||||||
Net asset value, end of year |
|
| $13.03 |
|
| $12.47 |
|
| $11.86 |
|
| $9.96 |
|
| $8.85 |
|
|
|
|
|
|
|
| ||||||||||
| ||||||||||||||||
Total Return(b) |
|
| 7.40 | % |
| 5.75 | % |
| 19.42 | % |
| 14.03 | % |
| (29.70 | )% |
Ratios to Average Net Assets: |
|
|
|
|
|
|
|
|
|
|
|
|
|
|
|
|
| ||||||||||||||||
Expenses, including expense |
|
| .84 | % |
| .84 | % |
| .86 | % |
| .93 | % |
| .87 | % |
| ||||||||||||||||
Expenses, excluding expense |
|
| .84 | % |
| .84 | % |
| .86 | % |
| .93 | % |
| .88 | % |
| ||||||||||||||||
Net investment income |
|
| .93 | % |
| .41 | % |
| .77 | % |
| .29 | % |
| .77 | % |
|
|
|
|
|
|
|
|
|
|
|
|
|
|
|
|
|
Supplemental Data: |
|
|
|
|
|
|
|
|
|
|
|
|
|
|
|
|
Net assets, end of year (000) |
|
| $598,688 |
|
| $642,636 |
|
| $282,018 |
|
| $73,742 |
|
| $8,995 |
|
Portfolio turnover rate |
|
| 83.80 | %(c) |
| 55.07 | % |
| 80.98 | % |
| 88.13 | % |
| 85.13 | % |
|
|
(a) | Calculated using average shares outstanding during the year. |
(b) | Total return assumes the reinvestment of all distributions. |
(c) | Excludes purchases and sales of securities in connection with the acquisition of Large Cap Value Fund on June 15, 2012. |
|
|
|
| See Notes to Financial Statements. | 79 |
Financial Highlights (continued)
FUNDAMENTAL EQUITY FUND
|
|
|
|
|
|
|
|
|
|
|
|
|
|
|
|
|
|
| Class I Shares |
| |||||||||||||
|
| |||||||||||||||
|
| Year Ended 10/31 |
| |||||||||||||
|
| |||||||||||||||
|
| 2012 |
| 2011 |
| 2010 |
| 2009 |
| 2008 |
| |||||
Per Share Operating Performance |
|
|
|
|
|
|
|
|
|
|
|
|
|
|
|
|
Net asset value, beginning of year |
|
| $12.59 |
|
| $11.96 |
|
| $10.04 |
|
| $8.92 |
|
| $13.79 |
|
|
|
|
|
|
|
| ||||||||||
Investment operations: |
|
|
|
|
|
|
|
|
|
|
|
|
|
|
|
|
Net investment income(a) |
|
| .13 |
|
| .07 |
|
| .08 |
|
| .05 |
|
| .11 |
|
Net realized and unrealized gain (loss) |
|
| .76 |
|
| .64 |
|
| 1.88 |
|
| 1.17 |
|
| (3.92 | ) |
|
|
|
|
|
|
| ||||||||||
Total from investment operations |
|
| .89 |
|
| .71 |
|
| 1.96 |
|
| 1.22 |
|
| (3.81 | ) |
|
|
|
|
|
|
| ||||||||||
Distributions to shareholders from: |
|
|
|
|
|
|
|
|
|
|
|
|
|
|
|
|
Net investment income |
|
| (.06 | ) |
| (.08 | ) |
| (.04 | ) |
| (.10 | ) |
| (.12 | ) |
Net realized gain |
|
| (.27 | ) |
| — |
|
| — |
|
| — |
|
| (.94 | ) |
|
|
|
|
|
|
| ||||||||||
Total distributions |
|
| (.33 | ) |
| (.08 | ) |
| (.04 | ) |
| (.10 | ) |
| (1.06 | ) |
|
|
|
|
|
|
| ||||||||||
Net asset value, end of year |
|
| $13.15 |
|
| $12.59 |
|
| $11.96 |
|
| $10.04 |
|
| $8.92 |
|
|
|
|
|
|
|
| ||||||||||
| ||||||||||||||||
Total Return(b) |
|
| 7.43 | % |
| 5.94 | % |
| 19.54 | % |
| 14.11 | % |
| (29.62 | )% |
Ratios to Average Net Assets: |
|
|
|
|
|
|
|
|
|
|
|
|
|
|
|
|
| ||||||||||||||||
Expenses, including expense |
|
| .74 | % |
| .74 | % |
| .77 | % |
| .84 | % |
| .77 | % |
| ||||||||||||||||
Expenses, excluding expense |
|
| .74 | % |
| .74 | % |
| .77 | % |
| .84 | % |
| .77 | % |
| ||||||||||||||||
Net investment income |
|
| 1.00 | % |
| .52 | % |
| .75 | % |
| .58 | % |
| .92 | % |
|
|
|
|
|
|
|
|
|
|
|
|
|
|
|
|
|
Supplemental Data: |
|
|
|
|
|
|
|
|
|
|
|
|
|
|
|
|
Net assets, end of year (000) |
|
| $394,842 |
|
| $245,329 |
|
| $162,114 |
|
| $98,570 |
|
| $54,483 |
|
Portfolio turnover rate |
|
| 83.80 | %(c) |
| 55.07 | % |
| 80.98 | % |
| 88.13 | % |
| 85.13 | % |
|
|
(a) | Calculated using average shares outstanding during the year. |
(b) | Total return assumes the reinvestment of all distributions. |
(c) | Excludes purchases and sales of securities in connection with the acquisition of Large Cap Value Fund on June 15, 2012. |
80 | See Notes to Financial Statements. |
|
Financial Highlights (continued)
FUNDAMENTAL EQUITY FUND
|
|
|
|
|
|
|
|
|
|
|
|
|
|
|
|
|
|
| Class P Shares |
| |||||||||||||
|
| |||||||||||||||
|
| Year Ended 10/31 |
| |||||||||||||
|
| |||||||||||||||
|
| 2012 |
| 2011 |
| 2010 |
| 2009 |
| 2008 |
| |||||
Per Share Operating Performance |
|
|
|
|
|
|
|
|
|
|
|
|
|
|
|
|
Net asset value, beginning of year |
|
| $12.36 |
|
| $11.75 |
|
| $9.87 |
|
| $8.75 |
|
| $13.55 |
|
|
|
|
|
|
|
| ||||||||||
Investment operations: |
|
|
|
|
|
|
|
|
|
|
|
|
|
|
|
|
Net investment income(a) |
|
| .07 |
|
| .01 |
|
| .03 |
|
| .01 |
|
| .06 |
|
Net realized and unrealized gain (loss) |
|
| .77 |
|
| .62 |
|
| 1.85 |
|
| 1.16 |
|
| (3.85 | ) |
|
|
|
|
|
|
| ||||||||||
Total from investment operations |
|
| .84 |
|
| .63 |
|
| 1.88 |
|
| 1.17 |
|
| (3.79 | ) |
|
|
|
|
|
|
| ||||||||||
Distributions to shareholders from: |
|
|
|
|
|
|
|
|
|
|
|
|
|
|
|
|
Net investment income |
|
| (.01 | ) |
| (.02 | ) |
| — |
|
| (.05 | ) |
| (.07 | ) |
Net realized gain |
|
| (.27 | ) |
| — |
|
| — |
|
| — |
|
| (.94 | ) |
|
|
|
|
|
|
| ||||||||||
Total distributions |
|
| (.28 | ) |
| (.02 | ) |
| — |
|
| (.05 | ) |
| (1.01 | ) |
|
|
|
|
|
|
| ||||||||||
Net asset value, end of year |
|
| $12.92 |
|
| $12.36 |
|
| $11.75 |
|
| $9.87 |
|
| $8.75 |
|
|
|
|
|
|
|
| ||||||||||
| ||||||||||||||||
Total Return(b) |
|
| 7.03 | % |
| 5.40 | % |
| 19.05 | % |
| 13.59 | % |
| (29.98 | )% |
Ratios to Average Net Assets: |
|
|
|
|
|
|
|
|
|
|
|
|
|
|
|
|
| ||||||||||||||||
Expenses, including expense |
|
| 1.19 | % |
| 1.19 | % |
| 1.22 | % |
| 1.29 | % |
| 1.22 | % |
| ||||||||||||||||
Expenses, excluding expense |
|
| 1.19 | % |
| 1.19 | % |
| 1.22 | % |
| 1.29 | % |
| 1.22 | % |
| ||||||||||||||||
Net investment income |
|
| .58 | % |
| .05 | % |
| .28 | % |
| .17 | % |
| .49 | % |
|
|
|
|
|
|
|
|
|
|
|
|
|
|
|
|
|
Supplemental Data: |
|
|
|
|
|
|
|
|
|
|
|
|
|
|
|
|
Net assets, end of year (000) |
|
| $27,937 |
|
| $31,223 |
|
| $30,598 |
|
| $29,361 |
|
| $24,711 |
|
Portfolio turnover rate |
|
| 83.80 | %(c) |
| 55.07 | % |
| 80.98 | % |
| 88.13 | % |
| 85.13 | % |
|
|
(a) | Calculated using average shares outstanding during the year. |
(b) | Total return assumes the reinvestment of all distributions. |
(c) | Excludes purchases and sales of securities in connection with the acquisition of Large Cap Value Fund on June 15, 2012. |
| See Notes to Financial Statements. | 81 |
Financial Highlights (continued)
FUNDAMENTAL EQUITY FUND
|
|
|
|
|
|
|
|
|
|
|
|
|
|
|
|
|
|
| Class R2 Shares |
| |||||||||||||
|
| |||||||||||||||
|
| Year Ended 10/31 |
| |||||||||||||
|
| |||||||||||||||
|
| 2012 |
| 2011 |
| 2010 |
| 2009 |
| 2008 |
| |||||
Per Share Operating Performance |
|
|
|
|
|
|
|
|
|
|
|
|
|
|
|
|
Net asset value, beginning of year |
|
| $12.33 |
|
| $11.75 |
|
| $9.89 |
|
| $8.82 |
|
| $13.69 |
|
|
|
|
|
|
|
| ||||||||||
Investment operations: |
|
|
|
|
|
|
|
|
|
|
|
|
|
|
|
|
Net investment income (loss)(a) |
|
| .05 |
|
| (.01 | ) |
| .04 |
|
| (.01 | ) |
| .05 |
|
Net realized and unrealized gain (loss) |
|
| .77 |
|
| .63 |
|
| 1.82 |
|
| 1.17 |
|
| (3.88 | ) |
|
|
|
|
|
|
| ||||||||||
Total from investment operations |
|
| .82 |
|
| .62 |
|
| 1.86 |
|
| 1.16 |
|
| (3.83 | ) |
|
|
|
|
|
|
| ||||||||||
Distributions to shareholders from: |
|
|
|
|
|
|
|
|
|
|
|
|
|
|
|
|
Net investment income |
|
| (.01 | ) |
| (.04 | ) |
| — | (b) |
| (.09 | ) |
| (.10 | ) |
Net realized gain |
|
| (.27 | ) |
| — |
|
| — |
|
| — |
|
| (.94 | ) |
|
|
|
|
|
|
| ||||||||||
Total distributions |
|
| (.28 | ) |
| (.04 | ) |
| — | (b) |
| (.09 | ) |
| (1.04 | ) |
|
|
|
|
|
|
| ||||||||||
Net asset value, end of year |
|
| $12.87 |
|
| $12.33 |
|
| $11.75 |
|
| $9.89 |
|
| $8.82 |
|
|
|
|
|
|
|
| ||||||||||
| ||||||||||||||||
Total Return(c) |
|
| 6.87 | % |
| 5.27 | % |
| 18.81 | % |
| 13.44 | % |
| (29.98 | )% |
Ratios to Average Net Assets: |
|
|
|
|
|
|
|
|
|
|
|
|
|
|
|
|
| ||||||||||||||||
Expenses, including expense |
|
| 1.34 | % |
| 1.34 | % |
| 1.36 | % |
| 1.42 | % |
| 1.30 | % |
| ||||||||||||||||
Expenses, excluding expense |
|
| 1.34 | % |
| 1.34 | % |
| 1.36 | % |
| 1.42 | % |
| 1.31 | % |
| ||||||||||||||||
Net investment income (loss) |
|
| .43 | % |
| (.11 | )% |
| .36 | % |
| (.14 | )% |
| .47 | % |
|
|
|
|
|
|
|
|
|
|
|
|
|
|
|
|
|
Supplemental Data: |
|
|
|
|
|
|
|
|
|
|
|
|
|
|
|
|
Net assets, end of year (000) |
|
| $22,335 |
|
| $19,997 |
|
| $4,444 |
|
| $1,187 |
|
| $319 |
|
Portfolio turnover rate |
|
| 83.80 | %(d) |
| 55.07 | % |
| 80.98 | % |
| 88.13 | % |
| 85.13 | % |
|
|
(a) | Calculated using average shares outstanding during the year. |
(b) | Amount is less than $.01. |
(c) | Total return assumes the reinvestment of all distributions. |
(d) | Excludes purchases and sales of securities in connection with the acquisition of Large Cap Value Fund on June 15, 2012. |
|
|
|
82 | See Notes to Financial Statements. |
|
Financial Highlights (concluded)
FUNDAMENTAL EQUITY FUND
|
|
|
|
|
|
|
|
|
|
|
|
|
|
|
|
|
|
| Class R3 Shares |
| |||||||||||||
|
| |||||||||||||||
|
| Year Ended 10/31 |
| |||||||||||||
|
| |||||||||||||||
|
| 2012 |
| 2011 |
| 2010 |
| 2009 |
| 2008 |
| |||||
Per Share Operating Performance |
|
|
|
|
|
|
|
|
|
|
|
|
|
|
|
|
Net asset value, beginning of year |
|
| $12.40 |
|
| $11.80 |
|
| $9.92 |
|
| $8.82 |
|
| $13.69 |
|
|
|
|
|
|
|
| ||||||||||
Investment operations: |
|
|
|
|
|
|
|
|
|
|
|
|
|
|
|
|
Net investment income(a) |
|
| .06 |
|
| — | (b) |
| .03 |
|
| — | (b) |
| .04 |
|
Net realized and unrealized gain (loss) |
|
| .77 |
|
| .63 |
|
| 1.85 |
|
| 1.17 |
|
| (3.86 | ) |
|
|
|
|
|
|
| ||||||||||
Total from investment operations |
|
| .83 |
|
| .63 |
|
| 1.88 |
|
| 1.17 |
|
| (3.82 | ) |
|
|
|
|
|
|
| ||||||||||
Distributions to shareholders from: |
|
|
|
|
|
|
|
|
|
|
|
|
|
|
|
|
Net investment income |
|
| (.02 | ) |
| (.03 | ) |
| — | (b) |
| (.07 | ) |
| (.11 | ) |
Net realized gain |
|
| (.27 | ) |
| — |
|
| — |
|
| — |
|
| (.94 | ) |
|
|
|
|
|
|
| ||||||||||
Total distributions |
|
| (.29 | ) |
| (.03 | ) |
| — | (b) |
| (.07 | ) |
| (1.05 | ) |
|
|
|
|
|
|
| ||||||||||
Net asset value, end of year |
|
| $12.94 |
|
| $12.40 |
|
| $11.80 |
|
| $9.92 |
|
| $8.82 |
|
|
|
|
|
|
|
| ||||||||||
| ||||||||||||||||
Total Return(c) |
|
| 6.95 | % |
| 5.36 | % |
| 18.96 | % |
| 13.55 | % |
| (29.96 | )% |
Ratios to Average Net Assets: |
|
|
|
|
|
|
|
|
|
|
|
|
|
|
|
|
| ||||||||||||||||
Expenses, including expense |
|
| 1.24 | % |
| 1.24 | % |
| 1.26 | % |
| 1.33 | % |
| 1.26 | % |
| ||||||||||||||||
Expenses, excluding expense |
|
| 1.24 | % |
| 1.24 | % |
| 1.26 | % |
| 1.33 | % |
| 1.26 | % |
| ||||||||||||||||
Net investment income |
|
| .51 | % |
| .01 | % |
| .30 | % |
| .05 | % |
| .37 | % |
|
|
|
|
|
|
|
|
|
|
|
|
|
|
|
|
|
Supplemental Data: |
|
|
|
|
|
|
|
|
|
|
|
|
|
|
|
|
Net assets, end of year (000) |
|
| $270,290 |
|
| $180,795 |
|
| $67,814 |
|
| $28,510 |
|
| $14,303 |
|
Portfolio turnover rate |
|
| 83.80 | %(d) |
| 55.07 | % |
| 80.98 | % |
| 88.13 | % |
| 85.13 | % |
|
|
(a) | Calculated using average shares outstanding during the year. |
(b) | Amount is less than $.01. |
(c) | Total return assumes the reinvestment of all distributions. |
(d) | Excludes purchases and sales of securities in connection with the acquisition of Large Cap Value Fund on June 15, 2012. |
|
|
|
| See Notes to Financial Statements. | 83 |
|
Financial Highlights |
GROWTH LEADERS FUND |
|
|
|
|
|
|
|
|
|
|
|
|
|
| Class A Shares |
| ||||||||
|
|
| |||||||||
|
| Year |
| 6/24/2011(a) |
| ||||||
Per Share Operating Performance |
|
|
|
|
|
|
| ||||
Net asset value, beginning of period |
|
|
| $14.50 |
|
|
|
| $15.00 |
|
|
|
|
|
|
|
|
|
| ||||
Investment operations: |
|
|
|
|
|
|
|
|
|
|
|
Net investment loss(b) |
|
|
| (.01 | ) |
|
|
| (.01 | ) |
|
Net realized and unrealized gain (loss) |
|
|
| .66 |
|
|
|
| (.49 | ) |
|
|
|
|
|
|
|
|
| ||||
Total from investment operations |
|
|
| .65 |
|
|
|
| (.50 | ) |
|
|
|
|
|
|
|
|
| ||||
Net asset value, end of period |
|
|
| $15.15 |
|
|
|
| $14.50 |
|
|
|
|
|
|
|
|
|
| ||||
| |||||||||||
Total Return(c) |
|
|
| 4.48 | % |
|
|
| (3.33 | )%(d) |
|
Ratios to Average Net Assets: |
|
|
|
|
|
|
|
|
|
|
|
Expenses, excluding expense reductions and including management |
|
|
| .85 | % |
|
|
| .84 | %(e) |
|
Expenses, including expense reductions, management fee waived and |
|
|
| .85 | % |
|
|
| .84 | %(e) |
|
Expenses, excluding expense reductions, management fee waived and |
|
|
| 1.55 | % |
|
|
| 3.04 | %(e) |
|
Net investment loss |
|
|
| (.06 | )% |
|
|
| (.23 | )%(e) |
|
|
|
|
|
|
|
|
|
|
|
|
|
Supplemental Data: |
|
|
|
|
|
|
|
|
|
|
|
Net assets, end of period (000) |
|
| $ | 15,372 |
|
|
|
| $7,882 |
|
|
Portfolio turnover rate |
|
|
| 683.50 | % |
|
|
| 208.96 | % |
|
|
|
(a) | Commencement of operations was 6/24/2011, SEC effective date was 6/15/2011 and date shares first became available to the public was 7/1/2011. |
(b) | Calculated using average shares outstanding during the period. |
(c) | Total return does not consider the effects of sales loads and assumes the reinvestment of all distributions. |
(d) | Not annualized. |
(e) | Annualized. |
|
|
|
84 | See Notes to Financial Statements. |
|
|
Financial Highlights (continued) |
GROWTH LEADERS FUND |
|
|
|
|
|
|
|
|
|
|
|
|
|
| Class C Shares |
| ||||||||
|
|
| |||||||||
|
| Year |
| 6/24/2011(a) |
| ||||||
Per Share Operating Performance |
|
|
|
|
|
|
| ||||
Net asset value, beginning of period |
|
|
| $14.47 |
|
|
|
| $15.00 |
|
|
|
|
|
|
|
|
|
| ||||
Investment operations: |
|
|
|
|
|
|
|
|
|
|
|
Net investment loss(b) |
|
|
| (.11 | ) |
|
|
| (.05 | ) |
|
Net realized and unrealized gain (loss) |
|
|
| .66 |
|
|
|
| (.48 | ) |
|
|
|
|
|
|
|
|
| ||||
Total from investment operations |
|
|
| .55 |
|
|
|
| (.53 | ) |
|
|
|
|
|
|
|
|
| ||||
Net asset value, end of period |
|
|
| $15.02 |
|
|
|
| $14.47 |
|
|
|
|
|
|
|
|
|
| ||||
| |||||||||||
Total Return(c) |
|
|
| 3.80 | % |
|
|
| (3.53 | )%(d) |
|
Ratios to Average Net Assets: |
|
|
|
|
|
|
|
|
|
|
|
Expenses, excluding expense reductions and including management |
|
|
| 1.49 | % |
|
|
| 1.47 | %(e) |
|
Expenses, including expense reductions, management fee waived and |
|
|
| 1.49 | % |
|
|
| 1.47 | %(e) |
|
Expenses, excluding expense reductions, management fee waived and |
|
|
| 2.15 | % |
|
|
| 2.78 | %(e) |
|
| |||||||||||
Net investment income loss |
|
|
| (.70 | )% |
|
|
| (.91 | )%(e) |
|
|
|
|
|
|
|
|
|
|
|
|
|
Supplemental Data: |
|
|
|
|
|
|
|
|
|
|
|
Net assets, end of period (000) |
|
|
| $1,898 |
|
|
|
| $175 |
|
|
Portfolio turnover rate |
|
|
| 683.50 | % |
|
|
| 208.96 | % |
|
|
|
(a) | Commencement of operations was 6/24/2011, SEC effective date was 6/15/2011 and date shares first became available to the public was 7/1/2011. |
(b) | Calculated using average shares outstanding during the period. |
(c) | Total return does not consider the effects of sales loads and assumes the reinvestment of all distributions. |
(d) | Not annualized. |
(e) | Annualized. |
|
|
|
| See Notes to Financial Statements. | 85 |
|
Financial Highlights (continued) |
GROWTH LEADERS FUND |
|
|
|
|
|
|
|
|
|
|
|
|
|
| Class F Shares |
| ||||||||
|
|
| |||||||||
|
| Year |
| 6/24/2011(a) |
| ||||||
Per Share Operating Performance |
|
|
|
|
|
|
| ||||
Net asset value, beginning of period |
|
|
| $14.51 |
|
|
|
| $15.00 |
|
|
|
|
|
|
|
|
|
| ||||
Investment operations: |
|
|
|
|
|
|
|
|
|
|
|
Net investment income(b) |
|
|
| .03 |
|
|
|
| — | (c) |
|
Net realized and unrealized gain (loss) |
|
|
| .65 |
|
|
|
| (.49 | ) |
|
|
|
|
|
|
|
|
| ||||
Total from investment operations |
|
|
| .68 |
|
|
|
| (.49 | ) |
|
|
|
|
|
|
|
|
| ||||
Distributions to shareholders from: |
|
|
|
|
|
|
|
|
|
|
|
Net investment income |
|
|
| (.01 | ) |
|
|
| — |
|
|
|
|
|
|
|
|
|
| ||||
Net asset value, end of period |
|
|
| $15.18 |
|
|
|
| $14.51 |
|
|
|
|
|
|
|
|
|
| ||||
| |||||||||||
Total Return(d) |
|
|
| 4.69 | % |
|
|
| (3.27 | )%(e) |
|
Ratios to Average Net Assets: |
|
|
|
|
|
|
|
|
|
|
|
Expenses, excluding expense reductions and including management |
|
|
| .60 | % |
|
|
| .59 | %(f) |
|
Expenses, including expense reductions, management fee waived and |
|
|
| .60 | % |
|
|
| .59 | %(f) |
|
Expenses, excluding expense reductions, management fee waived and |
|
|
| 1.33 | % |
|
|
| 1.95 | %(f) |
|
| |||||||||||
Net investment income |
|
|
| .21 | % |
|
|
| .08 | %(f) |
|
| �� |
|
|
|
|
|
|
|
|
|
|
Supplemental Data: |
|
|
|
|
|
|
|
|
|
|
|
Net assets, end of period (000) |
|
|
| $3,797 |
|
|
|
| $5,993 |
|
|
Portfolio turnover rate |
|
|
| 683.50 | % |
|
|
| 208.96 | % |
|
|
|
(a) | Commencement of operations was 6/24/2011, SEC effective date was 6/15/2011 and date shares first became available to the public was 7/1/2011. |
(b) | Calculated using average shares outstanding during the period. |
(c) | Amount is less than $.01. |
(d) | Total return assumes the reinvestment of all distributions. |
(e) | Not annualized. |
(f) | Annualized. |
|
|
|
86 | See Notes to Financial Statements. |
|
|
Financial Highlights (continued) |
GROWTH LEADERS FUND |
|
|
|
|
|
|
|
|
|
|
|
|
|
| Class I Shares |
| ||||||||
|
|
| |||||||||
|
| Year |
| 6/24/2011(a) |
| ||||||
Per Share Operating Performance |
|
|
|
|
|
|
| ||||
Net asset value, beginning of period |
|
|
| $14.51 |
|
|
|
| $15.00 |
|
|
|
|
|
|
|
|
|
| ||||
Investment operations: |
|
|
|
|
|
|
|
|
|
|
|
Net investment income(b) |
|
|
| .04 |
|
|
|
| .01 |
|
|
Net realized and unrealized gain (loss) |
|
|
| .67 |
|
|
|
| (.50 | ) |
|
|
|
|
|
|
|
|
| ||||
Total from investment operations |
|
|
| .71 |
|
|
|
| (.49 | ) |
|
|
|
|
|
|
|
|
| ||||
Distributions to shareholders from: |
|
|
|
|
|
|
|
|
|
|
|
Net investment income |
|
|
| (.02 | ) |
|
|
| — |
|
|
|
|
|
|
|
|
|
| ||||
Net asset value, end of period |
|
|
| $15.20 |
|
|
|
| $14.51 |
|
|
|
|
|
|
|
|
|
| ||||
| |||||||||||
Total Return(c) |
|
|
| 4.87 | % |
|
|
| (3.27 | )%(d) |
|
Ratios to Average Net Assets: |
|
|
|
|
|
|
|
|
|
|
|
Expenses, excluding expense reductions and including management |
|
|
| .50 | % |
|
|
| .49 | %(e) |
|
Expenses, including expense reductions, management fee waived and |
|
|
| .50 | % |
|
|
| .49 | %(e) |
|
Expenses, excluding expense reductions, management fee waived and |
|
|
| 1.22 | % |
|
|
| 2.20 | %(e) |
|
| |||||||||||
Net investment income |
|
|
| .29 | % |
|
|
| .17 | %(e) |
|
|
|
|
|
|
|
|
|
|
|
|
|
Supplemental Data: |
|
|
|
|
|
|
|
|
|
|
|
Net assets, end of period (000) |
|
|
| $2,697 |
|
|
|
| $1,952 |
|
|
Portfolio turnover rate |
|
|
| 683.50 | % |
|
|
| 208.96 | % |
|
|
|
(a) | Commencement of operations was 6/24/2011, SEC effective date was 6/15/2011 and date shares first became available to the public was 7/1/2011. |
(b) | Calculated using average shares outstanding during the period. |
(c) | Total return assumes the reinvestment of all distributions. |
(d) | Not annualized. |
(e) | Annualized. |
|
|
|
| See Notes to Financial Statements. | 87 |
|
Financial Highlights (continued) |
GROWTH LEADERS FUND |
|
|
|
|
|
|
|
|
|
|
|
|
|
| Class R2 Shares |
| ||||||||
|
|
| |||||||||
|
| Year |
| 6/24/2011(a) |
| ||||||
Per Share Operating Performance |
|
|
|
|
|
|
| ||||
Net asset value, beginning of period |
|
|
| $14.49 |
|
|
|
| $15.00 |
|
|
|
|
|
|
|
|
|
| ||||
Investment operations: |
|
|
|
|
|
|
|
|
|
|
|
Net investment income (loss)(b) |
|
|
| .05 |
|
|
|
| (.03 | ) |
|
Net realized and unrealized gain (loss) |
|
|
| .65 |
|
|
|
| (.48 | ) |
|
|
|
|
|
|
|
|
| ||||
Total from investment operations |
|
|
| .70 |
|
|
|
| (.51 | ) |
|
|
|
|
|
|
|
|
| ||||
Net asset value, end of period |
|
|
| $15.19 |
|
|
|
| $14.49 |
|
|
|
|
|
|
|
|
|
| ||||
| |||||||||||
Total Return(c) |
|
|
| 4.83 | % |
|
|
| (3.40 | )%(d) |
|
Ratios to Average Net Assets: |
|
|
|
|
|
|
|
|
|
|
|
Expenses, excluding expense reductions and including management |
|
|
| .48 | % |
|
|
| 1.06 | %(e) |
|
Expenses, including expense reductions, management fee waived and |
|
|
| .48 | % |
|
|
| 1.06 | %(e) |
|
Expenses, excluding expense reductions, management fee waived and |
|
|
| 1.22 | % |
|
|
| 5.05 | %(e) |
|
| |||||||||||
Net investment income (loss) |
|
|
| .31 | % |
|
| �� | (.49 | )%(e) |
|
|
|
|
|
|
|
|
|
|
|
|
|
Supplemental Data: |
|
|
|
|
|
|
|
|
|
|
|
Net assets, end of period (000) |
|
|
| $10 |
|
|
|
| $10 |
|
|
Portfolio turnover rate |
|
|
| 683.50 | % |
|
|
| 208.96 | % |
|
|
|
(a) | Commencement of operations was 6/24/2011, SEC effective date was 6/15/2011 and date shares first became available to the public was 7/1/2011. |
(b) | Calculated using average shares outstanding during the period. |
(c) | Total return assumes the reinvestment of all distributions. |
(d) | Not annualized. |
(e) | Annualized. |
|
|
|
88 | See Notes to Financial Statements. |
|
|
Financial Highlights (concluded) |
GROWTH LEADERS FUND |
|
|
|
|
|
|
|
|
|
|
|
|
|
| Class R3 Shares |
| ||||||||
|
|
| |||||||||
|
| Year |
| 6/24/2011(a) |
| ||||||
Per Share Operating Performance |
|
|
|
|
|
|
| ||||
Net asset value, beginning of period |
|
|
| $14.49 |
|
|
|
| $15.00 |
|
|
|
|
|
|
|
|
|
| ||||
Investment operations: |
|
|
|
|
|
|
|
|
|
|
|
Net investment income (loss)(b) |
|
|
| .01 |
|
|
|
| (.02 | ) |
|
Net realized and unrealized gain (loss) |
|
|
| .66 |
|
|
|
| (.49 | ) |
|
|
|
|
|
|
|
|
| ||||
Total from investment operations |
|
|
| .67 |
|
|
|
| (.51 | ) |
|
|
|
|
|
|
|
|
| ||||
Net asset value, end of period |
|
|
| $15.16 |
|
|
|
| $14.49 |
|
|
|
|
|
|
|
|
|
| ||||
| |||||||||||
Total Return(c) |
|
|
| 4.62 | % |
|
|
| (3.40 | )%(d) |
|
Ratios to Average Net Assets: |
|
|
|
|
|
|
|
|
|
|
|
Expenses, excluding expense reductions and including management |
|
|
| .72 | % |
|
|
| .97 | %(e) |
|
Expenses, including expense reductions, management fee waived and |
|
|
| .72 | % |
|
|
| .97 | %(e) |
|
Expenses, excluding expense reductions, management fee waived and |
|
|
| 1.42 | % |
|
|
| 4.96 | %(e) |
|
| |||||||||||
Net investment income (loss) |
|
|
| .08 | % |
|
|
| (.40 | )%(e) |
|
|
|
|
|
|
|
|
|
|
|
|
|
Supplemental Data: |
|
|
|
|
|
|
|
|
|
|
|
Net assets, end of period (000) |
|
|
| $11 |
|
|
|
| $10 |
|
|
Portfolio turnover rate |
|
|
| 683.50 | % |
|
|
| 208.96 | % |
|
|
|
(a) | Commencement of operations was 6/24/2011, SEC effective date was 6/15/2011 and date shares first became available to the public was 7/1/2011. |
(b) | Calculated using average shares outstanding during the period. |
(c) | Total return assumes the reinvestment of all distributions. |
(d) | Not annualized. |
(e) | Annualized. |
|
|
|
| See Notes to Financial Statements. | 89 |
Financial Highlights
INTERNATIONAL CORE EQUITY FUND
|
|
|
|
|
|
|
|
|
|
|
|
|
|
|
|
|
|
| Class A Shares |
| |||||||||||||
|
| |||||||||||||||
|
| Year Ended 10/31 |
| |||||||||||||
|
| |||||||||||||||
|
| 2012 |
| 2011 |
| 2010 |
| 2009 |
| 2008 |
| |||||
Per Share Operating Performance |
|
|
|
|
|
|
|
|
|
|
|
|
|
|
|
|
Net asset value, beginning of year |
|
| $11.25 |
|
| $12.12 |
|
| $11.20 |
|
| $8.68 |
|
| $18.34 |
|
|
|
|
|
|
|
| ||||||||||
Investment operations: |
|
|
|
|
|
|
|
|
|
|
|
|
|
|
|
|
Net investment income(a) |
|
| .28 |
|
| .20 |
|
| .12 |
|
| .08 |
|
| .23 |
|
Net realized and unrealized gain (loss) |
|
| .12 |
|
| (.94 | ) |
| .88 |
|
| 2.66 |
|
| (8.23 | ) |
|
|
|
|
|
|
| ||||||||||
Total from investment operations |
|
| .40 |
|
| (.74 | ) |
| 1.00 |
|
| 2.74 |
|
| (8.00 | ) |
|
|
|
|
|
|
| ||||||||||
Distributions to shareholders from: |
|
|
|
|
|
|
|
|
|
|
|
|
|
|
|
|
Net investment income |
|
| (.22 | ) |
| (.13 | ) |
| (.08 | ) |
| (.22 | ) |
| (.13 | ) |
Net realized gain |
|
| — |
|
| — |
|
| — |
|
| — |
|
| (1.53 | ) |
|
|
|
|
|
|
| ||||||||||
Total distributions |
|
| (.22 | ) |
| (.13 | ) |
| (.08 | ) |
| (.22 | ) |
| (1.66 | ) |
|
|
|
|
|
|
| ||||||||||
Net asset value, end of year |
|
| $11.43 |
|
| $11.25 |
|
| $12.12 |
|
| $11.20 |
|
| $8.68 |
|
|
|
|
|
|
|
| ||||||||||
| ||||||||||||||||
Total Return(b) |
|
| 3.81 | % |
| (6.16 | )% |
| 8.95 | % |
| 32.32 | % |
| (47.48 | )% |
Ratios to Average Net Assets: |
|
|
|
|
|
|
|
|
|
|
|
|
|
|
|
|
| ||||||||||||||||
Expenses, excluding expense |
|
| 1.12 | % |
| 1.12 | % |
| 1.18 | % |
| 1.55 | % |
| 1.43 | % |
| ||||||||||||||||
Expenses, including expense |
|
| 1.12 | % |
| 1.12 | % |
| 1.18 | % |
| 1.55 | % |
| 1.42 | % |
| ||||||||||||||||
Expenses, excluding expense |
|
| 1.47 | % |
| 1.42 | % |
| 1.44 | % |
| 1.55 | % |
| 1.43 | % |
| ||||||||||||||||
Net investment income |
|
| 2.53 | % |
| 1.64 | % |
| 1.05 | % |
| .92 | % |
| 1.68 | % |
|
|
|
|
|
|
|
|
|
|
|
|
|
|
|
|
|
Supplemental Data: |
|
|
|
|
|
|
|
|
|
|
|
|
|
|
|
|
Net assets, end of year (000) |
|
| $383,244 |
|
| $439,938 |
|
| $542,452 |
|
| $574,731 |
|
| $527,567 |
|
Portfolio turnover rate |
|
| 81.50 | % |
| 83.78 | % |
| 98.73 | % |
| 132.22 | % |
| 125.37 | % |
|
|
(a) | Calculated using average shares outstanding during the year. |
(b) | Total return does not consider the effects of sales loads and assumes the reinvestment of all distributions. |
|
|
|
90 | See Notes to Financial Statements. |
|
Financial Highlights (continued)
INTERNATIONAL CORE EQUITY FUND
|
|
|
|
|
|
|
|
|
|
|
|
|
|
|
|
|
|
| Class B Shares |
| |||||||||||||
|
| |||||||||||||||
|
| Year Ended 10/31 |
| |||||||||||||
|
| |||||||||||||||
|
| 2012 |
| 2011 |
| 2010 |
| 2009 |
| 2008 |
| |||||
Per Share Operating Performance |
|
|
|
|
|
|
|
|
|
|
|
|
|
|
|
|
Net asset value, beginning of year |
|
| $11.06 |
|
| $11.91 |
|
| $11.02 |
|
| $8.50 |
|
| $18.00 |
|
|
|
|
|
|
|
| ||||||||||
Investment operations: |
|
|
|
|
|
|
|
|
|
|
|
|
|
|
|
|
Net investment income(a) |
|
| .21 |
|
| .12 |
|
| .04 |
|
| .02 |
|
| .14 |
|
Net realized and unrealized gain (loss) |
|
| .12 |
|
| (.92 | ) |
| .87 |
|
| 2.62 |
|
| (8.07 | ) |
|
|
|
|
|
|
| ||||||||||
Total from investment operations |
|
| .33 |
|
| (.80 | ) |
| .91 |
|
| 2.64 |
|
| (7.93 | ) |
|
|
|
|
|
|
| ||||||||||
Distributions to shareholders from: |
|
|
|
|
|
|
|
|
|
|
|
|
|
|
|
|
Net investment income |
|
| (.13 | ) |
| (.05 | ) |
| (.02 | ) |
| (.12 | ) |
| (.04 | ) |
Net realized gain |
|
| — |
|
| — |
|
| — |
|
| — |
|
| (1.53 | ) |
|
|
|
|
|
|
| ||||||||||
Total distributions |
|
| (.13 | ) |
| (.05 | ) |
| (.02 | ) |
| (.12 | ) |
| (1.57 | ) |
|
|
|
|
|
|
| ||||||||||
Net asset value, end of year |
|
| $11.26 |
|
| $11.06 |
|
| $11.91 |
|
| $11.02 |
|
| $8.50 |
|
|
|
|
|
|
|
| ||||||||||
| ||||||||||||||||
Total Return(b) |
|
| 3.13 | % |
| (6.75 | )% |
| 8.23 | % |
| 31.46 | % |
| (47.80 | )% |
Ratios to Average Net Assets: |
|
|
|
|
|
|
|
|
|
|
|
|
|
|
|
|
| ||||||||||||||||
Expenses, excluding expense |
|
| 1.77 | % |
| 1.77 | % |
| 1.84 | % |
| 2.20 | % |
| 2.08 | % |
| ||||||||||||||||
Expenses, including expense |
|
| 1.77 | % |
| 1.77 | % |
| 1.84 | % |
| 2.20 | % |
| 2.08 | % |
| ||||||||||||||||
Expenses, excluding expense |
|
| 2.12 | % |
| 2.06 | % |
| 2.09 | % |
| 2.20 | % |
| 2.08 | % |
| ||||||||||||||||
Net investment income |
|
| 1.91 | % |
| .96 | % |
| .40 | % |
| .27 | % |
| 1.02 | % |
|
|
|
|
|
|
|
|
|
|
|
|
|
|
|
|
|
Supplemental Data: |
|
|
|
|
|
|
|
|
|
|
|
|
|
|
|
|
Net assets, end of year (000) |
|
| $20,125 |
|
| $27,896 |
|
| $39,255 |
|
| $43,492 |
|
| $39,604 |
|
Portfolio turnover rate |
|
| 81.50 | % |
| 83.78 | % |
| 98.73 | % |
| 132.22 | % |
| 125.37 | % |
|
|
(a) | Calculated using average shares outstanding during the year. |
(b) | Total return does not consider the effects of sales loads and assumes the reinvestment of all distributions. |
|
|
|
| See Notes to Financial Statements. | 91 |
Financial Highlights (continued)
INTERNATIONAL CORE EQUITY FUND
|
|
|
|
|
|
|
|
|
|
|
|
|
|
|
|
|
|
| Class C Shares |
| |||||||||||||
|
| |||||||||||||||
|
| Year Ended 10/31 |
| |||||||||||||
|
| |||||||||||||||
|
| 2012 |
| 2011 |
| 2010 |
| 2009 |
| 2008 |
| |||||
Per Share Operating Performance |
|
|
|
|
|
|
|
|
|
|
|
|
|
|
|
|
Net asset value, beginning of year |
|
| $11.08 |
|
| $11.93 |
|
| $11.04 |
|
| $8.50 |
|
| $18.00 |
|
|
|
|
|
|
|
| ||||||||||
Investment operations: |
|
|
|
|
|
|
|
|
|
|
|
|
|
|
|
|
Net investment income(a) |
|
| .21 |
|
| .12 |
|
| .04 |
|
| .03 |
|
| .14 |
|
Net realized and unrealized gain (loss) |
|
| .12 |
|
| (.92 | ) |
| .87 |
|
| 2.62 |
|
| (8.07 | ) |
|
|
|
|
|
|
| ||||||||||
Total from investment operations |
|
| .33 |
|
| (.80 | ) |
| .91 |
|
| 2.65 |
|
| (7.93 | ) |
|
|
|
|
|
|
| ||||||||||
Distributions to shareholders from: |
|
|
|
|
|
|
|
|
|
|
|
|
|
|
|
|
Net investment income |
|
| (.14 | ) |
| (.05 | ) |
| (.02 | ) |
| (.11 | ) |
| (.04 | ) |
Net realized gain |
|
| — |
|
| — |
|
| — |
|
| — |
|
| (1.53 | ) |
|
|
|
|
|
|
| ||||||||||
Total distributions |
|
| (.14 | ) |
| (.05 | ) |
| (.02 | ) |
| (.11 | ) |
| (1.57 | ) |
|
|
|
|
|
|
| ||||||||||
Net asset value, end of year |
|
| $11.27 |
|
| $11.08 |
|
| $11.93 |
|
| $11.04 |
|
| $8.50 |
|
|
|
|
|
|
|
| ||||||||||
| ||||||||||||||||
Total Return(b) |
|
| 3.11 | % |
| (6.73 | )% |
| 8.21 | % |
| 31.52 | % |
| (47.82 | )% |
Ratios to Average Net Assets: |
|
|
|
|
|
|
|
|
|
|
|
|
|
|
|
|
| ||||||||||||||||
Expenses, excluding expense |
|
| 1.75 | % |
| 1.74 | % |
| 1.84 | % |
| 2.20 | % |
| 2.08 | % |
| ||||||||||||||||
Expenses, including expense |
|
| 1.75 | % |
| 1.74 | % |
| 1.84 | % |
| 2.20 | % |
| 2.08 | % |
| ||||||||||||||||
Expenses, excluding expense |
|
| 2.10 | % |
| 2.03 | % |
| 2.09 | % |
| 2.20 | % |
| 2.08 | % |
| ||||||||||||||||
Net investment income |
|
| 1.91 | % |
| 1.01 | % |
| .38 | % |
| .28 | % |
| 1.01 | % |
|
|
|
|
|
|
|
|
|
|
|
|
|
|
|
|
|
Supplemental Data: |
|
|
|
|
|
|
|
|
|
|
|
|
|
|
|
|
Net assets, end of year (000) |
|
| $54,056 |
|
| $68,316 |
|
| $91,550 |
|
| $105,557 |
|
| $95,496 |
|
Portfolio turnover rate |
|
| 81.50 | % |
| 83.78 | % |
| 98.73 | % |
| 132.22 | % |
| 125.37 | % |
|
|
(a) | Calculated using average shares outstanding during the year. |
(b) | Total return does not consider the effects of sales loads and assumes the reinvestment of all distributions. |
|
|
|
92 | See Notes to Financial Statements. |
|
Financial Highlights (continued)
INTERNATIONAL CORE EQUITY FUND
|
|
|
|
|
|
|
|
|
|
|
|
|
|
|
|
|
|
| Class F Shares |
| |||||||||||||
|
| |||||||||||||||
|
| Year Ended 10/31 |
| |||||||||||||
|
| |||||||||||||||
|
|
| 2012 |
|
| 2011 |
|
| 2010 |
|
| 2009 |
|
| 2008 |
|
Per Share Operating Performance |
|
|
|
|
|
|
|
|
|
|
|
|
|
|
|
|
Net asset value, beginning of year |
|
| $11.20 |
|
| $12.08 |
|
| $11.16 |
|
| $8.68 |
|
| $18.34 |
|
|
|
|
|
|
|
| ||||||||||
Investment operations: |
|
|
|
|
|
|
|
|
|
|
|
|
|
|
|
|
Net investment income(a) |
|
| .30 |
|
| .24 |
|
| .16 |
|
| .16 |
|
| .24 |
|
Net realized and unrealized gain (loss) |
|
| .12 |
|
| (.95 | ) |
| .86 |
|
| 2.59 |
|
| (8.19 | ) |
|
|
|
|
|
|
| ||||||||||
Total from investment operations |
|
| .42 |
|
| (.71 | ) |
| 1.02 |
|
| 2.75 |
|
| (7.95 | ) |
|
|
|
|
|
|
| ||||||||||
Distributions to shareholders from: |
|
|
|
|
|
|
|
|
|
|
|
|
|
|
|
|
Net investment income |
|
| (.26 | ) |
| (.17 | ) |
| (.10 | ) |
| (.27 | ) |
| (.18 | ) |
Net realized gain |
|
| — |
|
| — |
|
| — |
|
| — |
|
| (1.53 | ) |
|
|
|
|
|
|
| ||||||||||
Total distributions |
|
| (.26 | ) |
| (.17 | ) |
| (.10 | ) |
| (.27 | ) |
| (1.71 | ) |
|
|
|
|
|
|
| ||||||||||
Net asset value, end of year |
|
| $11.36 |
|
| $11.20 |
|
| $12.08 |
|
| $11.16 |
|
| $8.68 |
|
|
|
|
|
|
|
| ||||||||||
| ||||||||||||||||
Total Return(b) |
|
| 4.02 | % |
| (5.98 | )% |
| 9.25 | % |
| 32.76 | % |
| (47.37 | )% |
Ratios to Average Net Assets: |
|
|
|
|
|
|
|
|
|
|
|
|
|
|
|
|
| ||||||||||||||||
Expenses, excluding expense |
|
| .87 | % |
| .87 | % |
| .90 | % |
| 1.27 | % |
| 1.26 | % |
| ||||||||||||||||
Expenses, including expense |
|
| .87 | % |
| .87 | % |
| .90 | % |
| 1.27 | % |
| 1.25 | % |
| ||||||||||||||||
Expenses, excluding expense |
|
| 1.22 | % |
| 1.18 | % |
| 1.18 | % |
| 1.27 | % |
| 1.26 | % |
| ||||||||||||||||
Net investment income |
|
| 2.71 | % |
| 1.98 | % |
| 1.45 | % |
| 1.73 | % |
| 2.02 | % |
|
|
|
|
|
|
|
|
|
|
|
|
|
|
|
|
|
Supplemental Data: |
|
|
|
|
|
|
|
|
|
|
|
|
|
|
|
|
Net assets, end of year (000) |
|
| $151,246 |
|
| $80,747 |
|
| $31,153 |
|
| $9,009 |
|
| $1,869 |
|
Portfolio turnover rate |
|
| 81.50 | % |
| 83.78 | % |
| 98.73 | % |
| 132.22 | % |
| 125.37 | % |
|
|
(a) | Calculated using average shares outstanding during the year. |
(b) | Total return assumes the reinvestment of all distributions. |
|
|
|
| See Notes to Financial Statements. | 93 |
Financial Highlights (continued)
INTERNATIONAL CORE EQUITY FUND
|
|
|
|
|
|
|
|
|
|
|
|
|
|
|
|
|
|
| Class I Shares |
| |||||||||||||
|
| Year Ended 10/31 |
| |||||||||||||
|
| 2012 |
| 2011 |
| 2010 |
| 2009 |
| 2008 |
| |||||
Per Share Operating Performance |
|
|
|
|
|
|
|
|
|
|
|
|
|
|
|
|
Net asset value, beginning of year |
|
| $11.34 |
|
| $12.21 |
|
| $11.28 |
|
| $8.77 |
|
| $18.49 |
|
|
|
|
|
|
|
| ||||||||||
Investment operations: |
|
|
|
|
|
|
|
|
|
|
|
|
|
|
|
|
Net investment income(a) |
|
| .27 |
|
| .25 |
|
| .15 |
|
| .13 |
|
| .29 |
|
Net realized and unrealized gain (loss) |
|
| .17 |
|
| (.95 | ) |
| .89 |
|
| 2.65 |
|
| (8.30 | ) |
|
|
|
|
|
|
| ||||||||||
Total from investment operations |
|
| .44 |
|
| (.70 | ) |
| 1.04 |
|
| 2.78 |
|
| (8.01 | ) |
|
|
|
|
|
|
| ||||||||||
Distributions to shareholders from: |
|
|
|
|
|
|
|
|
|
|
|
|
|
|
|
|
Net investment income |
|
| (.27 | ) |
| (.17 | ) |
| (.11 | ) |
| (.27 | ) |
| (.18 | ) |
Net realized gain |
|
| — |
|
| — |
|
| — |
|
| — |
|
| (1.53 | ) |
|
|
|
|
|
|
| ||||||||||
Total distributions |
|
| (.27 | ) |
| (.17 | ) |
| (.11 | ) |
| (.27 | ) |
| (1.71 | ) |
|
|
|
|
|
|
| ||||||||||
Net asset value, end of year |
|
| $11.51 |
|
| $11.34 |
|
| $12.21 |
|
| $11.28 |
|
| $8.77 |
|
|
|
|
|
|
|
| ||||||||||
| ||||||||||||||||
Total Return(b) |
|
| 4.15 | % |
| (5.78 | )% |
| 9.31 | % |
| 32.86 | % |
| (47.30 | )% |
Ratios to Average Net Assets: |
|
|
|
|
|
|
|
|
|
|
|
|
|
|
|
|
| ||||||||||||||||
Expenses, excluding expense |
|
| .77 | % |
| .77 | % |
| .82 | % |
| 1.19 | % |
| 1.07 | % |
| ||||||||||||||||
Expenses, including expense |
|
| .77 | % |
| .77 | % |
| .82 | % |
| 1.19 | % |
| 1.07 | % |
| ||||||||||||||||
Expenses, excluding expense |
|
| 1.12 | % |
| 1.07 | % |
| 1.08 | % |
| 1.19 | % |
| 1.07 | % |
| ||||||||||||||||
Net investment income |
|
| 2.48 | % |
| 2.06 | % |
| 1.34 | % |
| 1.34 | % |
| 2.05 | % |
|
|
|
|
|
|
|
|
|
|
|
|
|
|
|
|
|
Supplemental Data: |
|
|
|
|
|
|
|
|
|
|
|
|
|
|
|
|
Net assets, end of year (000) |
|
| $107,076 |
|
| $222,808 |
|
| $267,253 |
|
| $167,574 |
|
| $113,975 |
|
Portfolio turnover rate |
|
| 81.50 | % |
| 83.78 | % |
| 98.73 | % |
| 132.22 | % |
| 125.37 | % |
|
|
(a) | Calculated using average shares outstanding during the year. |
(b) | Total return assumes the reinvestment of all distributions. |
|
|
|
94 | See Notes to Financial Statements. |
|
|
Financial Highlights (continued) |
INTERNATIONAL CORE EQUITY FUND |
|
|
|
|
|
|
|
|
|
|
|
|
|
|
|
|
|
|
| Class P Shares |
| |||||||||||||
|
| |||||||||||||||
|
| Year Ended 10/31 |
| |||||||||||||
|
| |||||||||||||||
|
| 2012 |
| 2011 |
| 2010 |
| 2009 |
| 2008 |
| |||||
Per Share Operating Performance |
|
|
|
|
|
|
|
|
|
|
|
|
|
|
|
|
Net asset value, beginning of year |
|
| $11.17 |
|
| $12.04 |
|
| $11.13 |
|
| $8.63 |
|
| $18.30 |
|
|
|
|
|
|
|
| ||||||||||
Investment operations: |
|
|
|
|
|
|
|
|
|
|
|
|
|
|
|
|
Net investment income(a) |
|
| .27 |
|
| .10 |
|
| .10 |
|
| .07 |
|
| .23 |
|
Net realized and unrealized gain (loss) |
|
| .12 |
|
| (.84 | ) |
| .88 |
|
| 2.64 |
|
| (8.19 | ) |
|
|
|
|
|
|
| ||||||||||
Total from investment operations |
|
| .39 |
|
| (.74 | ) |
| .98 |
|
| 2.71 |
|
| (7.96 | ) |
|
|
|
|
|
|
| ||||||||||
Distributions to shareholders from: |
|
|
|
|
|
|
|
|
|
|
|
|
|
|
|
|
Net investment income |
|
| (.17 | ) |
| (.13 | ) |
| (.07 | ) |
| (.21 | ) |
| (.18 | ) |
Net realized gain |
|
| — |
|
| — |
|
| — |
|
| — |
|
| (1.53 | ) |
|
|
|
|
|
|
| ||||||||||
Total distributions |
|
| (.17 | ) |
| (.13 | ) |
| (.07 | ) |
| (.21 | ) |
| (1.71 | ) |
|
|
|
|
|
|
| ||||||||||
Net asset value, end of year |
|
| $11.39 |
|
| $11.17 |
|
| $12.04 |
|
| $11.13 |
|
| $8.63 |
|
|
|
|
|
|
|
| ||||||||||
| ||||||||||||||||
Total Return(b) |
|
| 3.63 | % |
| (6.23 | )% |
| 8.84 | % |
| 32.29 | % |
| (47.56 | )% |
Ratios to Average Net Assets: |
|
|
|
|
|
|
|
|
|
|
|
|
|
|
|
|
| ||||||||||||||||
Expenses, excluding expense |
|
| 1.22 | % |
| 1.22 | % |
| 1.29 | % |
| 1.64 | % |
| 1.52 | % |
| ||||||||||||||||
Expenses, including expense |
|
| 1.22 | % |
| 1.22 | % |
| 1.29 | % |
| 1.64 | % |
| 1.52 | % |
| ||||||||||||||||
Expenses, excluding expense |
|
| 1.58 | % |
| 1.51 | % |
| 1.54 | % |
| 1.64 | % |
| 1.52 | % |
| ||||||||||||||||
Net investment income |
|
| 2.45 | % |
| .83 | % |
| .92 | % |
| .78 | % |
| 1.68 | % |
|
|
|
|
|
|
|
|
|
|
|
|
|
|
|
|
|
Supplemental Data: |
|
|
|
|
|
|
|
|
|
|
|
|
|
|
|
|
Net assets, end of year (000) |
|
| $282 |
|
| $470 |
|
| $1,765 |
|
| $1,825 |
|
| $1,135 |
|
Portfolio turnover rate |
|
| 81.50 | % |
| 83.78 | % |
| 98.73 | % |
| 132.22 | % |
| 125.37 | % |
|
|
(a) | Calculated using average shares outstanding during the year. |
(b) | Total return assumes the reinvestment of all distributions. |
|
|
|
| See Notes to Financial Statements. | 95 |
|
Financial Highlights (continued) |
INTERNATIONAL CORE EQUITY FUND |
|
|
|
|
|
|
|
|
|
|
|
|
|
|
|
|
|
|
| Class R2 Shares |
| |||||||||||||
|
| |||||||||||||||
|
| Year Ended 10/31 |
| |||||||||||||
|
| |||||||||||||||
|
| 2012 |
| 2011 |
| 2010 |
| 2009 |
| 2008 |
| |||||
Per Share Operating Performance |
|
|
|
|
|
|
|
|
|
|
|
|
|
|
|
|
Net asset value, beginning of year |
|
| $11.24 |
|
| $12.14 |
|
| $11.20 |
|
| $8.69 |
|
| $18.33 |
|
|
|
|
|
|
|
| ||||||||||
Investment operations: |
|
|
|
|
|
|
|
|
|
|
|
|
|
|
|
|
Net investment income(a) |
|
| .23 |
|
| .18 |
|
| .08 |
|
| .12 |
|
| .27 |
|
Net realized and unrealized gain (loss) |
|
| .14 |
|
| (.95 | ) |
| .91 |
|
| 2.65 |
|
| (8.21 | ) |
|
|
|
|
|
|
| ||||||||||
Total from investment operations |
|
| .37 |
|
| (.77 | ) |
| .99 |
|
| 2.77 |
|
| (7.94 | ) |
|
|
|
|
|
|
| ||||||||||
Distributions to shareholders from: |
|
|
|
|
|
|
|
|
|
|
|
|
|
|
|
|
Net investment income |
|
| (.20 | ) |
| (.13 | ) |
| (.05 | ) |
| (.26 | ) |
| (.17 | ) |
Net realized gain |
|
| — |
|
| — |
|
| — |
|
| — |
|
| (1.53 | ) |
|
|
|
|
|
|
| ||||||||||
Total distributions |
|
| (.20 | ) |
| (.13 | ) |
| (.05 | ) |
| (.26 | ) |
| (1.70 | ) |
|
|
|
|
|
|
| ||||||||||
Net asset value, end of year |
|
| $11.41 |
|
| $11.24 |
|
| $12.14 |
|
| $11.20 |
|
| $8.69 |
|
|
| �� |
|
|
|
| ||||||||||
| ||||||||||||||||
Total Return(b) |
|
| 3.51 | % |
| (6.38 | )% |
| 8.86 | % |
| 32.77 | % |
| (47.24 | )% |
Ratios to Average Net Assets: |
|
|
|
|
|
|
|
|
|
|
|
|
|
|
|
|
| ||||||||||||||||
Expenses, excluding expense |
|
| 1.37 | % |
| 1.37 | % |
| 1.35 | % |
| 1.16 | % |
| 1.17 | % |
| ||||||||||||||||
Expenses, including expense |
|
| 1.37 | % |
| 1.37 | % |
| 1.35 | % |
| 1.16 | % |
| 1.16 | % |
| ||||||||||||||||
Expenses, excluding expense |
|
| 1.72 | % |
| 1.67 | % |
| 1.64 | % |
| 1.16 | % |
| 1.17 | % |
| ||||||||||||||||
Net investment income |
|
| 2.13 | % |
| 1.46 | % |
| .73 | % |
| 1.33 | % |
| 1.92 | % |
|
|
|
|
|
|
|
|
|
|
|
|
|
|
|
|
|
Supplemental Data: |
|
|
|
|
|
|
|
|
|
|
|
|
|
|
|
|
Net assets, end of year (000) |
|
| $568 |
|
| $651 |
|
| $570 |
|
| $7 |
|
| $5 |
|
Portfolio turnover rate |
|
| 81.50 | % |
| 83.78 | % |
| 98.73 | % |
| 132.22 | % |
| 125.37 | % |
|
|
(a) | Calculated using average shares outstanding during the year. |
(b) | Total return assumes the reinvestment of all distributions. |
|
|
|
96 | See Notes to Financial Statements. |
|
|
Financial Highlights (concluded) |
INTERNATIONAL CORE EQUITY FUND |
|
|
|
|
|
|
|
|
|
|
|
|
|
|
|
|
|
|
| Class R3 Shares |
| |||||||||||||
|
| |||||||||||||||
|
| Year Ended 10/31 |
| |||||||||||||
|
| |||||||||||||||
|
| 2012 |
| 2011 |
| 2010 |
| 2009 |
| 2008 |
| |||||
Per Share Operating Performance |
|
|
|
|
|
|
|
|
|
|
|
|
|
|
|
|
Net asset value, beginning of year |
|
| $11.11 |
|
| $12.00 |
|
| $11.10 |
|
| $8.65 |
|
| $18.33 |
|
|
|
|
|
|
|
| ||||||||||
Investment operations: |
|
|
|
|
|
|
|
|
|
|
|
|
|
|
|
|
Net investment income(a) |
|
| .26 |
|
| .19 |
|
| .11 |
|
| .06 |
|
| .22 |
|
Net realized and unrealized gain (loss) |
|
| .12 |
|
| (.94 | ) |
| .87 |
|
| 2.64 |
|
| (8.20 | ) |
|
|
|
|
|
|
| ||||||||||
Total from investment operations |
|
| .38 |
|
| (.75 | ) |
| .98 |
|
| 2.70 |
|
| (7.98 | ) |
|
|
|
|
|
|
| ||||||||||
Distributions to shareholders from: |
|
|
|
|
|
|
|
|
|
|
|
|
|
|
|
|
Net investment income |
|
| (.21 | ) |
| (.14 | ) |
| (.08 | ) |
| (.25 | ) |
| (.17 | ) |
Net realized gain |
|
| — |
|
| — |
|
| — |
|
| — |
|
| (1.53 | ) |
|
|
|
|
|
|
| ||||||||||
Total distributions |
|
| (.21 | ) |
| (.14 | ) |
| (.08 | ) |
| (.25 | ) |
| (1.70 | ) |
|
|
|
|
|
|
| ||||||||||
Net asset value, end of year |
|
| $11.28 |
|
| $11.11 |
|
| $12.00 |
|
| $11.10 |
|
| $8.65 |
|
|
|
|
|
|
|
| ||||||||||
| ||||||||||||||||
Total Return(b) |
|
| 3.68 | % |
| (6.35 | )% |
| 8.89 | % |
| 32.23 | % |
| (47.55 | )% |
Ratios to Average Net Assets: |
|
|
|
|
|
|
|
|
|
|
|
|
|
|
|
|
| ||||||||||||||||
Expenses, excluding expense |
|
| 1.26 | % |
| 1.26 | % |
| 1.28 | % |
| 1.68 | % |
| 1.62 | % |
| ||||||||||||||||
Expenses, including expense |
|
| 1.26 | % |
| 1.26 | % |
| 1.28 | % |
| 1.68 | % |
| 1.62 | % |
| ||||||||||||||||
Expenses, excluding expense |
|
| 1.61 | % |
| 1.57 | % |
| 1.57 | % |
| 1.68 | % |
| 1.62 | % |
| ||||||||||||||||
Net investment income |
|
| 2.36 | % |
| 1.54 | % |
| 1.02 | % |
| .65 | % |
| 1.79 | % |
|
|
|
|
|
|
|
|
|
|
|
|
|
|
|
|
|
Supplemental Data: |
|
|
|
|
|
|
|
|
|
|
|
|
|
|
|
|
Net assets, end of year (000) |
|
| $17,275 |
|
| $12,725 |
|
| $10,418 |
|
| $1,439 |
|
| $523 |
|
Portfolio turnover rate |
|
| 81.50 | % |
| 83.78 | % |
| 98.73 | % |
| 132.22 | % |
| 125.37 | % |
|
|
(a) | Calculated using average shares outstanding during the year. |
(b) | Total return assumes the reinvestment of all distributions. |
|
|
|
| See Notes to Financial Statements. | 97 |
|
Financial Highlights |
INTERNATIONAL DIVIDEND INCOME FUND |
|
|
|
|
|
|
|
|
|
|
|
|
|
|
|
|
|
|
|
|
| Class A Shares |
| |||||||||||||||
|
| |||||||||||||||||
|
|
|
| 6/23/2008(a) |
| |||||||||||||
|
|
| ||||||||||||||||
|
| 2012 |
| 2011 |
| 2010 |
| 2009 |
|
| ||||||||
Per Share Operating Performance |
|
|
|
|
|
|
|
|
|
|
|
|
|
|
|
|
|
|
Net asset value, beginning of period |
|
| $7.88 |
|
| $8.64 |
|
| $8.22 |
|
| $6.29 |
|
|
| $10.00 |
|
|
|
|
|
|
|
|
|
|
| ||||||||||
Investment operations: |
|
|
|
|
|
|
|
|
|
|
|
|
|
|
|
|
|
|
Net investment income(b) |
|
| .35 |
|
| .42 |
|
| .34 |
|
| .28 |
|
|
| .16 |
|
|
Net realized and unrealized gain (loss) |
|
| (.08 | ) |
| (.78 | ) |
| .42 |
|
| 1.90 |
|
|
| (3.74 | ) |
|
|
|
|
|
|
|
|
|
| ||||||||||
Total from investment operations |
|
| .27 |
|
| (.36 | ) |
| .76 |
|
| 2.18 |
|
|
| (3.58 | ) |
|
|
|
|
|
|
|
|
|
| ||||||||||
Distributions to shareholders from: |
|
|
|
|
|
|
|
|
|
|
|
|
|
|
|
|
|
|
Net investment income |
|
| (.35 | ) |
| (.40 | ) |
| (.34 | ) |
| (.25 | ) |
|
| (.13 | ) |
|
|
|
|
|
|
|
|
|
| ||||||||||
Net asset value, end of period |
|
| $7.80 |
|
| $7.88 |
|
| $8.64 |
|
| $8.22 |
|
|
| $6.29 |
|
|
|
|
|
|
|
|
|
|
| ||||||||||
| ||||||||||||||||||
Total Return(c) |
|
| 3.60 | % |
| (4.42 | )% |
| 9.58 | % |
| 35.88 | % |
|
| (36.10 | )%(d) |
|
Ratios to Average Net Assets: |
|
|
|
|
|
|
|
|
|
|
|
|
|
|
|
|
|
|
| ||||||||||||||||||
Expenses, excluding expense |
|
| 1.12 | % |
| 1.12 | % |
| 1.14 | % |
| 1.35 | % |
|
| .48 | %(d) |
|
| ||||||||||||||||||
Expenses, including expense |
|
| 1.12 | % |
| 1.12 | % |
| 1.14 | % |
| 1.35 | % |
|
| .48 | %(d) |
|
| ||||||||||||||||||
Expenses, excluding expense |
|
| 1.36 | % |
| 1.43 | % |
| 1.46 | % |
| 1.63 | % |
|
| .68 | %(d) |
|
| ||||||||||||||||||
Net investment income |
|
| 4.59 | % |
| 4.96 | % |
| 4.23 | % |
| 4.08 | % |
|
| 1.98 | %(d) |
|
|
|
|
|
|
|
|
|
|
|
|
|
|
|
|
|
|
|
|
Supplemental Data: |
|
|
|
|
|
|
|
|
|
|
|
|
|
|
|
|
|
|
Net assets, end of period (000) |
|
| $618,824 |
|
| $278,975 |
|
| $162,611 |
|
| $52,935 |
|
|
| $9,075 |
|
|
Portfolio turnover rate |
|
| 84.81 | % |
| 100.16 | % |
| 100.06 | % |
| 105.74 | % |
|
| 53.94 | % |
|
|
|
(a) | Commencement of operations was 6/23/2008, SEC effective date was 6/20/2008 and date shares first became available to the public was 6/30/2008. |
(b) | Calculated using average shares outstanding during the period. |
(c) | Total return does not consider the effects of sales loads and assumes the reinvestment of all distributions. |
(d) | Not annualized. |
|
|
|
98 | See Notes to Financial Statements. |
|
|
Financial Highlights (continued) |
INTERNATIONAL DIVIDEND INCOME FUND |
|
|
|
|
|
|
|
|
|
|
|
|
|
|
|
|
|
|
|
|
| Class C Shares |
| |||||||||||||||
|
| |||||||||||||||||
|
|
|
| 6/23/2008(a) |
| |||||||||||||
|
|
| ||||||||||||||||
|
| 2012 |
| 2011 |
| 2010 |
| 2009 |
|
| ||||||||
Per Share Operating Performance |
|
|
|
|
|
|
|
|
|
|
|
|
|
|
|
|
|
|
Net asset value, beginning of period |
|
| $7.84 |
|
| $8.60 |
|
| $8.19 |
|
| $6.28 |
|
|
| $10.00 |
|
|
|
|
|
|
|
|
|
|
| ||||||||||
Investment operations: |
|
|
|
|
|
|
|
|
|
|
|
|
|
|
|
|
|
|
Net investment income(b) |
|
| .29 |
|
| .36 |
|
| .29 |
|
| .21 |
|
|
| .09 |
|
|
Net realized and unrealized gain (loss) |
|
| (.07 | ) |
| (.77 | ) |
| .41 |
|
| 1.92 |
|
|
| (3.68 | ) |
|
|
|
|
|
|
|
|
|
| ||||||||||
Total from investment operations |
|
| .22 |
|
| (.41 | ) |
| .70 |
|
| 2.13 |
|
|
| (3.59 | ) |
|
|
|
|
|
|
|
|
|
| ||||||||||
Distributions to shareholders from: |
|
|
|
|
|
|
|
|
|
|
|
|
|
|
|
|
|
|
Net investment income |
|
| (.31 | ) |
| (.35 | ) |
| (.29 | ) |
| (.22 | ) |
|
| (.13 | ) |
|
|
|
|
|
|
|
|
|
| ||||||||||
Net asset value, end of period |
|
| $7.75 |
|
| $7.84 |
|
| $8.60 |
|
| $8.19 |
|
|
| $6.28 |
|
|
|
|
|
|
|
|
|
|
| ||||||||||
| ||||||||||||||||||
Total Return(c) |
|
| 2.95 | % |
| (5.03 | )% |
| 8.99 | % |
| 34.87 | % |
|
| (36.22 | )%(d) |
|
Ratios to Average Net Assets: |
|
|
|
|
|
|
|
|
|
|
|
|
|
|
|
|
|
|
| ||||||||||||||||||
Expenses, excluding expense |
|
| 1.76 | % |
| 1.76 | % |
| 1.79 | % |
| 1.98 | % |
|
| .68 | %(d) |
|
| ||||||||||||||||||
Expenses, including expense |
|
| 1.76 | % |
| 1.76 | % |
| 1.79 | % |
| 1.98 | % |
|
| .68 | %(d) |
|
| ||||||||||||||||||
Expenses, excluding expense |
|
| 2.01 | % |
| 2.07 | % |
| 2.10 | % |
| 2.26 | % |
|
| 1.44 | %(d) |
|
| ||||||||||||||||||
Net investment income |
|
| 3.88 | % |
| 4.29 | % |
| 3.61 | % |
| 2.93 | % |
|
| 1.23 | %(d) |
|
|
|
|
|
|
|
|
|
|
|
|
|
|
|
|
|
|
|
|
Supplemental Data: |
|
|
|
|
|
|
|
|
|
|
|
|
|
|
|
|
|
|
Net assets, end of period (000) |
|
| $74,664 |
|
| $22,329 |
|
| $13,561 |
|
| $4,376 |
|
|
| $177 |
|
|
Portfolio turnover rate |
|
| 84.81 | % |
| 100.16 | % |
| 100.06 | % |
| 105.74 | % |
|
| 53.94 | % |
|
|
|
(a) | Commencement of operations was 6/23/2008, SEC effective date was 6/20/2008 and date shares first became available to the public was 6/30/2008. |
(b) | Calculated using average shares outstanding during the period. |
(c) | Total return does not consider the effects of sales loads and assumes the reinvestment of all distributions. |
(d) | Not annualized. |
|
|
|
| See Notes to Financial Statements. | 99 |
|
Financial Highlights (continued) |
INTERNATIONAL DIVIDEND INCOME FUND |
|
|
|
|
|
|
|
|
|
|
|
|
|
|
|
|
|
|
|
|
| Class F Shares |
| |||||||||||||||
|
| |||||||||||||||||
|
|
|
| 6/23/2008(a) |
| |||||||||||||
|
|
| ||||||||||||||||
|
| 2012 |
| 2011 |
| 2010 |
| 2009 |
|
| ||||||||
Per Share Operating Performance |
|
|
|
|
|
|
|
|
|
|
|
|
|
|
|
|
|
|
Net asset value, beginning of period |
|
| $7.89 |
|
| $8.65 |
|
| $8.23 |
|
| $6.29 |
|
|
| $10.00 |
|
|
|
|
|
|
|
|
|
|
| ||||||||||
Investment operations: |
|
|
|
|
|
|
|
|
|
|
|
|
|
|
|
|
|
|
Net investment income(b) |
|
| .37 |
|
| .45 |
|
| .39 |
|
| .18 |
|
|
| .15 |
|
|
Net realized and unrealized gain (loss) |
|
| (.08 | ) |
| (.79 | ) |
| .39 |
|
| 2.02 |
|
|
| (3.72 | ) |
|
|
|
|
|
|
|
|
|
| ||||||||||
Total from investment operations |
|
| .29 |
|
| (.34 | ) |
| .78 |
|
| 2.20 |
|
|
| (3.57 | ) |
|
|
|
|
|
|
|
|
|
| ||||||||||
Distributions to shareholders from: |
|
|
|
|
|
|
|
|
|
|
|
|
|
|
|
|
|
|
Net investment income |
|
| (.37 | ) |
| (.42 | ) |
| (.36 | ) |
| (.26 | ) |
|
| (.14 | ) |
|
|
|
|
|
|
|
|
|
| ||||||||||
Net asset value, end of period |
|
| $7.81 |
|
| $7.89 |
|
| $8.65 |
|
| $8.23 |
|
|
| $6.29 |
|
|
|
|
|
|
|
|
|
|
| ||||||||||
| ||||||||||||||||||
Total Return(c) |
|
| 3.83 | % |
| (4.18 | )% |
| 9.95 | % |
| 36.13 | % |
|
| (36.08 | )%(d) |
|
Ratios to Average Net Assets: |
|
|
|
|
|
|
|
|
|
|
|
|
|
|
|
|
|
|
| ||||||||||||||||||
Expenses, excluding expense |
|
| .87 | % |
| .87 | % |
| .88 | % |
| 1.07 | % |
|
| .35 | %(d) |
|
| ||||||||||||||||||
Expenses, including expense |
|
| .87 | % |
| .87 | % |
| .88 | % |
| 1.07 | % |
|
| .35 | %(d) |
|
| ||||||||||||||||||
Expenses, excluding expense |
|
| 1.11 | % |
| 1.18 | % |
| 1.21 | % |
| 1.39 | % |
|
| 1.53 | %(d) |
|
| ||||||||||||||||||
Net investment income |
|
| 4.79 | % |
| 5.27 | % |
| 4.78 | % |
| 2.32 | % |
|
| 1.91 | %(d) |
|
|
|
|
|
|
|
|
|
|
|
|
|
|
|
|
|
|
|
|
Supplemental Data: |
|
|
|
|
|
|
|
|
|
|
|
|
|
|
|
|
|
|
Net assets, end of period (000) |
|
| $128,360 |
|
| $26,892 |
|
| $12,745 |
|
| $1,772 |
|
|
| $28 |
|
|
Portfolio turnover rate |
|
| 84.81 | % |
| 100.16 | % |
| 100.06 | % |
| 105.74 | % |
|
| 53.94 | % |
|
|
|
(a) | Commencement of operations was 6/23/2008, SEC effective date was 6/20/2008 and date shares first became available to the public was 6/30/2008. |
(b) | Calculated using average shares outstanding during the period. |
(c) | Total return assumes the reinvestment of all distributions. |
(d) | Not annualized. |
|
|
|
100 | See Notes to Financial Statements. |
|
|
|
|
|
|
|
|
|
|
|
|
|
|
|
|
|
|
|
|
|
|
|
|
|
|
|
|
|
|
|
|
|
|
|
|
|
|
| Class I Shares |
| |||||||||||||
|
| |||||||||||||||
|
|
|
| 6/23/2008(a) | ||||||||||||
|
|
| ||||||||||||||
|
| 2012 |
| 2011 |
| 2010 |
| 2009 |
| |||||||
Per Share Operating Performance |
|
|
|
|
|
|
|
|
|
|
|
|
|
|
|
|
Net asset value, beginning of period |
|
| $7.91 |
|
| $8.66 |
|
| $8.24 |
|
| $6.29 |
|
| $10.00 |
|
|
|
|
|
|
|
|
| |||||||||
Investment operations: |
|
|
|
|
|
|
|
|
|
|
|
|
|
|
|
|
Net investment income(b) |
|
| .38 |
|
| .43 |
|
| .37 |
|
| .29 |
|
| .19 |
|
Net realized and unrealized gain (loss) |
|
| (.09 | ) |
| (.75 | ) |
| .41 |
|
| 1.93 |
|
| (3.76 | ) |
|
|
|
|
|
|
|
| |||||||||
Total from investment operations |
|
| .29 |
|
| (.32 | ) |
| .78 |
|
| 2.22 |
|
| (3.57 | ) |
|
|
|
|
|
|
|
| |||||||||
Distributions to shareholders from: |
|
|
|
|
|
|
|
|
|
|
|
|
|
|
|
|
Net investment income |
|
| (.37 | ) |
| (.43 | ) |
| (.36 | ) |
| (.27 | ) |
| (.14 | ) |
|
|
|
|
|
|
|
| |||||||||
Net asset value, end of period |
|
| $7.83 |
|
| $7.91 |
|
| $8.66 |
|
| $8.24 |
|
| $6.29 |
|
|
|
|
|
|
|
|
| |||||||||
| ||||||||||||||||
Total Return(c) |
|
| 3.91 | % |
| (3.97 | )% |
| 10.03 | % |
| 36.38 | % |
| (36.07 | )%(d) |
Ratios to Average Net Assets: |
|
|
|
|
|
|
|
|
|
|
|
|
|
|
|
|
| ||||||||||||||||
Expenses, excluding expense |
|
| .77 | % |
| .77 | % |
| .81 | % |
| .99 | % |
| .36 | %(d) |
| ||||||||||||||||
Expenses, including expense |
|
| .77 | % |
| .77 | % |
| .81 | % |
| .99 | % |
| .36 | %(d) |
| ||||||||||||||||
Expenses, excluding expense |
|
| 1.01 | % |
| 1.09 | % |
| 1.10 | % |
| 1.28 | % |
| .54 | %(d) |
| ||||||||||||||||
Net investment income |
|
| 5.00 | % |
| 5.06 | % |
| 4.53 | % |
| 4.13 | % |
| 2.19 | %(d) |
|
|
|
|
|
|
|
|
|
|
|
|
|
|
|
|
|
Supplemental Data: |
|
|
|
|
|
|
|
|
|
|
|
|
|
|
|
|
Net assets, end of period (000) |
|
| $893,066 |
|
| $559,879 |
|
| $265,348 |
|
| $225,668 |
|
| $83,413 |
|
Portfolio turnover rate |
|
| 84.81 | % |
| 100.16 | % |
| 100.06 | % |
| 105.74 | % |
| 53.94 | % |
|
|
(a) | Commencement of operations was 6/23/2008, SEC effective date was 6/20/2008 and date shares first became available to the public was 6/30/2008. |
(b) | Calculated using average shares outstanding during the period. |
(c) | Total return assumes the reinvestment of all distributions. |
(d) | Not annualized. |
|
|
|
| See Notes to Financial Statements. | 101 |
|
|
|
|
|
|
|
|
|
|
|
|
|
|
|
|
|
|
| Class R2 Shares |
| |||||||||||||
|
| |||||||||||||||
|
|
|
| 6/23/2008(a) | ||||||||||||
|
|
| ||||||||||||||
|
| 2012 |
| 2011 |
| 2010 |
| 2009 |
| |||||||
Per Share Operating Performance |
|
|
|
|
|
|
|
|
|
|
|
|
|
|
|
|
Net asset value, beginning of period |
|
| $8.03 |
|
| $8.76 |
|
| $8.29 |
|
| $6.30 |
|
| $10.00 |
|
|
|
|
|
|
|
|
| |||||||||
Investment operations: |
|
|
|
|
|
|
|
|
|
|
|
|
|
|
|
|
Net investment income(b) |
|
| .33 |
|
| .45 |
|
| .37 |
|
| .31 |
|
| .18 |
|
Net realized and unrealized gain (loss) |
|
| (.08 | ) |
| (.79 | ) |
| .42 |
|
| 1.91 |
|
| (3.76 | ) |
|
|
|
|
|
|
|
| |||||||||
Total from investment operations |
|
| .25 |
|
| (.34 | ) |
| .79 |
|
| 2.22 |
|
| (3.58 | ) |
|
|
|
|
|
|
|
| |||||||||
Distributions to shareholders from: |
|
|
|
|
|
|
|
|
|
|
|
|
|
|
|
|
Net investment income |
|
| (.34 | ) |
| (.39 | ) |
| (.32 | ) |
| (.23 | ) |
| (.12 | ) |
|
|
|
|
|
|
|
| |||||||||
Net asset value, end of period |
|
| $7.94 |
|
| $8.03 |
|
| $8.76 |
|
| $8.29 |
|
| $6.30 |
|
|
|
|
|
|
|
|
| |||||||||
| ||||||||||||||||
Total Return(c) |
|
| 3.32 | % |
| (4.15 | )% |
| 9.96 | % |
| 36.26 | % |
| (36.08 | )%(d) |
Ratios to Average Net Assets: |
|
|
|
|
|
|
|
|
|
|
|
|
|
|
|
|
| ||||||||||||||||
Expenses, excluding expense |
|
| 1.34 | % |
| .91 | % |
| .84 | % |
| .96 | % |
| .50 | %(d) |
| ||||||||||||||||
Expenses, including expense |
|
| 1.34 | % |
| .91 | % |
| .84 | % |
| .96 | % |
| .50 | %(d) |
| ||||||||||||||||
Expenses, excluding expense |
|
| 1.60 | % |
| 1.22 | % |
| 1.13 | % |
| 1.27 | % |
| 2.87 | %(d) |
| ||||||||||||||||
Net investment income |
|
| 4.24 | % |
| 5.15 | % |
| 4.45 | % |
| 4.63 | % |
| 2.07 | %(d) |
|
|
|
|
|
|
|
|
|
|
|
|
|
|
|
|
|
Supplemental Data: |
|
|
|
|
|
|
|
|
|
|
|
|
|
|
|
|
Net assets, end of period (000) |
|
| $464 |
|
| $16 |
|
| $10 |
|
| $9 |
|
| $6 |
|
Portfolio turnover rate |
|
| 84.81 | % |
| 100.16 | % |
| 100.06 | % |
| 105.74 | % |
| 53.94 | % |
|
|
(a) | Commencement of operations was 6/23/2008, SEC effective date was 6/20/2008 and date shares first became available to the public was 6/30/2008. |
(b) | Calculated using average shares outstanding during the period. |
(c) | Total return assumes the reinvestment of all distributions. |
(d) | Not annualized. |
|
|
|
102 | See Notes to Financial Statements. |
|
|
|
|
|
|
|
|
|
|
|
|
|
|
|
|
|
|
|
| Class R3 Shares |
| |||||||||||||
|
| |||||||||||||||
|
|
|
| 6/23/2008(a) | ||||||||||||
|
| |||||||||||||||
|
| 2012 |
| 2011 |
| 2010 |
| 2009 |
| |||||||
Per Share Operating Performance |
|
|
|
|
|
|
|
|
|
|
|
|
|
|
|
|
Net asset value, beginning of period |
|
| $7.94 |
|
| $8.71 |
|
| $8.28 |
|
| $6.30 |
|
| $10.00 |
|
|
|
|
|
|
|
|
| |||||||||
Investment operations: |
|
|
|
|
|
|
|
|
|
|
|
|
|
|
|
|
Net investment income(b) |
|
| .37 |
|
| .41 |
|
| .36 |
|
| .31 |
|
| .18 |
|
Net realized and unrealized gain (loss) |
|
| (.12 | ) |
| (.79 | ) |
| .40 |
|
| 1.91 |
|
| (3.75 | ) |
|
|
|
|
|
|
|
| |||||||||
Total from investment operations |
|
| .25 |
|
| (.38 | ) |
| .76 |
|
| 2.22 |
|
| (3.57 | ) |
|
|
|
|
|
|
|
| |||||||||
Distributions to shareholders from: |
|
|
|
|
|
|
|
|
|
|
|
|
|
|
|
|
Net investment income |
|
| (.33 | ) |
| (.39 | ) |
| (.33 | ) |
| (.24 | ) |
| (.13 | ) |
|
|
|
|
|
|
|
| |||||||||
Net asset value, end of period |
|
| $7.86 |
|
| $7.94 |
|
| $8.71 |
|
| $8.28 |
|
| $6.30 |
|
|
|
|
|
|
|
|
| |||||||||
| ||||||||||||||||
Total Return(c) |
|
| 3.39 | % |
| (4.61 | )% |
| 9.62 | % |
| 36.22 | % |
| (36.06 | )%(d) |
Ratios to Average Net Assets: |
|
|
|
|
|
|
|
|
|
|
|
|
|
|
|
|
| ||||||||||||||||
Expenses, excluding expense |
|
| 1.27 | % |
| 1.26 | % |
| 1.24 | % |
| .96 | % |
| .46 | %(d) |
| ||||||||||||||||
Expenses, including expense |
|
| 1.27 | % |
| 1.26 | % |
| 1.24 | % |
| .96 | % |
| .46 | %(d) |
| ||||||||||||||||
Expenses, excluding expense |
|
| 1.50 | % |
| 1.59 | % |
| 1.58 | % |
| 1.27 | % |
| 2.84 | %(d) |
| ||||||||||||||||
Net investment income |
|
| 4.80 | % |
| 4.80 | % |
| 4.40 | % |
| 4.62 | % |
| 2.10 | %(d) |
|
|
|
|
|
|
|
|
|
|
|
|
|
|
|
|
|
Supplemental Data: |
|
|
|
|
|
|
|
|
|
|
|
|
|
|
|
|
Net assets, end of period (000) |
|
| $33,065 |
|
| $331 |
|
| $111 |
|
| $9 |
|
| $6 |
|
Portfolio turnover rate |
|
| 84.81 | % |
| 100.16 | % |
| 100.06 | % |
| 105.74 | % |
| 53.94 | % |
|
|
(a) | Commencement of operations was 6/23/2008, SEC effective date was 6/20/2008 and date shares first became available to the public was 6/30/2008. |
(b) | Calculated using average shares outstanding during the period. |
(c) | Total return assumes the reinvestment of all distributions. |
(d) | Not annualized. |
|
|
|
| See Notes to Financial Statements. | 103 |
|
Financial Highlights |
INTERNATIONAL OPPORTUNITIES FUND |
|
|
|
|
|
|
|
|
|
|
|
|
|
|
|
|
|
|
| Class A Shares |
| |||||||||||||
|
| |||||||||||||||
|
| Year Ended 10/31 |
| |||||||||||||
|
| |||||||||||||||
|
| 2012 |
| 2011 |
| 2010 |
| 2009 |
| 2008 |
| |||||
Per Share Operating Performance |
|
|
|
|
|
|
|
|
|
|
|
|
|
|
|
|
Net asset value, beginning of year |
| $12.00 |
| $12.87 |
| $10.70 |
| $7.29 |
| $19.81 |
| |||||
|
|
|
|
|
|
| ||||||||||
Investment operations: |
|
|
|
|
|
|
|
|
|
|
|
|
|
|
|
|
Net investment income(a) |
|
| .15 |
|
| .10 |
|
| .06 |
|
| .04 |
|
| .09 |
|
Net realized and unrealized gain (loss) |
|
| 1.10 |
|
| (.92 | ) |
| 2.20 |
|
| 3.42 |
|
| (10.36 | ) |
|
|
|
|
|
|
| ||||||||||
Total from investment operations |
|
| 1.25 |
|
| (.82 | ) |
| 2.26 |
|
| 3.46 |
|
| (10.27 | ) |
|
|
|
|
|
|
| ||||||||||
Distributions to shareholders from: |
|
|
|
|
|
|
|
|
|
|
|
|
|
|
|
|
Net investment income |
|
| (.08 | ) |
| (.05 | ) |
| (.09 | ) |
| (.05 | ) |
| (.08 | ) |
Net realized gain |
|
| — |
|
| — |
|
| — |
|
| — |
|
| (2.17 | ) |
|
|
|
|
|
|
| ||||||||||
Total distributions |
|
| (.08 | ) |
| (.05 | ) |
| (.09 | ) |
| (.05 | ) |
| (2.25 | ) |
|
|
|
|
|
|
| ||||||||||
Net asset value, end of year |
| $13.17 |
| $12.00 |
| $12.87 |
| $10.70 |
| $7.29 |
| |||||
|
|
|
|
|
|
| ||||||||||
| ||||||||||||||||
Total Return(b) |
|
| 10.59 | % |
| (6.39 | )% |
| 21.21 | % |
| 47.94 | % |
| (57.81 | )% |
Ratios to Average Net Assets: |
|
|
|
|
|
|
|
|
|
|
|
|
|
|
|
|
| ||||||||||||||||
Expenses, including expense |
|
| 1.52 | % |
| 1.49 | % |
| 1.54 | % |
| 1.77 | % |
| 1.60 | % |
| ||||||||||||||||
Expenses, excluding expense |
|
| 1.52 | % |
| 1.49 | % |
| 1.54 | % |
| 1.77 | % |
| 1.61 | % |
| ||||||||||||||||
Net investment income |
|
| 1.20 | % |
| .79 | % |
| .54 | % |
| .50 | % |
| .65 | % |
|
|
|
|
|
|
|
|
|
|
|
|
|
|
|
|
|
Supplemental Data: |
|
|
|
|
|
|
|
|
|
|
|
|
|
|
|
|
Net assets, end of year (000) |
| $76,139 |
| $83,729 |
| $98,272 |
| $92,188 |
| $67,815 |
| |||||
Portfolio turnover rate |
|
| 91.18 | % |
| 103.98 | % |
| 83.13 | % |
| 115.58 | % |
| 130.51 | % |
|
|
(a) | Calculated using average shares outstanding during the year. |
(b) | Total return does not consider the effects of sales loads and assumes the reinvestment of all distributions. |
|
|
|
104 | See Notes to Financial Statements. |
|
|
Financial Highlights (continued) |
INTERNATIONAL OPPORTUNITIES FUND |
|
|
|
|
|
|
|
|
|
|
|
|
|
|
|
|
|
|
| Class B Shares |
| |||||||||||||
|
| |||||||||||||||
|
| Year Ended 10/31 |
| |||||||||||||
|
| |||||||||||||||
|
| 2012 |
| 2011 |
| 2010 |
| 2009 |
| 2008 |
| |||||
Per Share Operating Performance |
|
|
|
|
|
|
|
|
|
|
|
|
|
|
|
|
Net asset value, beginning of year |
| $11.36 |
| $12.21 |
| $10.17 |
| $6.92 |
| $18.96 |
| |||||
|
|
|
|
|
|
| ||||||||||
Investment operations: |
|
|
|
|
|
|
|
|
|
|
|
|
|
|
|
|
Net investment income (loss)(a) |
|
| .06 |
|
| .02 |
|
| (.01 | ) |
| (.01 | ) |
| — | (b) |
Net realized and unrealized gain (loss) |
|
| 1.07 |
|
| (.87 | ) |
| 2.08 |
|
| 3.26 |
|
| (9.87 | ) |
|
|
|
|
|
|
| ||||||||||
Total from investment operations |
|
| 1.13 |
|
| (.85 | ) |
| 2.07 |
|
| 3.25 |
|
| (9.87 | ) |
|
|
|
|
|
|
| ||||||||||
Distributions to shareholders from: |
|
|
|
|
|
|
|
|
|
|
|
|
|
|
|
|
Net investment income |
|
| — |
|
| — |
|
| (.03 | ) |
| — |
|
| — |
|
Net realized gain |
|
| — |
|
| — |
|
| — |
|
| — |
|
| (2.17 | ) |
|
|
|
|
|
|
| ||||||||||
Total distributions |
|
| — |
|
| — |
|
| (.03 | ) |
| — |
|
| (2.17 | ) |
|
|
|
|
|
|
| ||||||||||
Net asset value, end of year |
| $12.49 |
| $11.36 |
| $12.21 |
| $10.17 |
| $6.92 |
| |||||
|
|
|
|
|
|
| ||||||||||
| ||||||||||||||||
Total Return(c) |
|
| 9.95 | % |
| (6.96 | )% |
| 20.35 | % |
| 46.97 | % |
| (58.10 | )% |
Ratios to Average Net Assets: |
|
|
|
|
|
|
|
|
|
|
|
|
|
|
|
|
| ||||||||||||||||
Expenses, including expense |
|
| 2.16 | % |
| 2.13 | % |
| 2.19 | % |
| 2.42 | % |
| 2.25 | % |
| ||||||||||||||||
Expenses, excluding expense |
|
| 2.16 | % |
| 2.13 | % |
| 2.19 | % |
| 2.42 | % |
| 2.26 | % |
| ||||||||||||||||
Net investment income (loss) |
|
| .52 | % |
| .12 | % |
| (.13 | )% |
| (.15 | )% |
| (.01 | )% |
|
|
|
|
|
|
|
|
|
|
|
|
|
|
|
|
|
Supplemental Data: |
|
|
|
|
|
|
|
|
|
|
|
|
|
|
|
|
Net assets, end of year (000) |
| $6,854 |
| $9,439 |
| $14,307 |
| $17,103 |
| $14,192 |
| |||||
Portfolio turnover rate |
|
| 91.18 | % |
| 103.98 | % |
| 83.13 | % |
| 115.58 | % |
| 130.51 | % |
|
|
(a) | Calculated using average shares outstanding during the year. |
(b) | Amount is less than $.01. |
(c) | Total return does not consider the effects of sales loads and assumes the reinvestment of all distributions. |
|
|
|
| See Notes to Financial Statements. | 105 |
|
Financial Highlights (continued) |
INTERNATIONAL OPPORTUNITIES FUND |
|
|
|
|
|
|
|
|
|
|
|
|
|
|
|
|
|
|
| Class C Shares |
| |||||||||||||
|
| |||||||||||||||
|
| Year Ended 10/31 |
| |||||||||||||
|
| |||||||||||||||
|
| 2012 |
| 2011 |
| 2010 |
| 2009 |
| 2008 |
| |||||
Per Share Operating Performance |
|
|
|
|
|
|
|
|
|
|
|
|
|
|
|
|
Net asset value, beginning of year |
| $11.29 |
| $12.14 |
| $10.12 |
| $6.88 |
| $18.86 |
| |||||
|
|
|
|
|
|
| ||||||||||
Investment operations: |
|
|
|
|
|
|
|
|
|
|
|
|
|
|
|
|
Net investment income (loss)(a) |
|
| .07 |
|
| .02 |
|
| (.01 | ) |
| (.01 | ) |
| — | (b) |
Net realized and unrealized gain (loss) |
|
| 1.06 |
|
| (.87 | ) |
| 2.06 |
|
| 3.25 |
|
| (9.81 | ) |
|
|
|
|
|
|
| ||||||||||
Total from investment operations |
|
| 1.13 |
|
| (.85 | ) |
| 2.05 |
|
| 3.24 |
|
| (9.81 | ) |
|
|
|
|
|
|
| ||||||||||
Distributions to shareholders from: |
|
|
|
|
|
|
|
|
|
|
|
|
|
|
|
|
Net investment income |
|
| (.01 | ) |
| — |
|
| (.03 | ) |
| — |
|
| — |
|
Net realized gain |
|
| — |
|
| — |
|
| — |
|
| — |
|
| (2.17 | ) |
|
|
|
|
|
|
| ||||||||||
Total distributions |
|
| (.01 | ) |
| — |
|
| (.03 | ) |
| — |
|
| (2.17 | ) |
|
|
|
|
|
|
| ||||||||||
Net asset value, end of year |
| $12.41 |
| $11.29 |
| $12.14 |
| $10.12 |
| $6.88 |
| |||||
|
|
|
|
|
|
| ||||||||||
| ||||||||||||||||
Total Return(c) |
|
| 10.00 | % |
| (7.00 | )% |
| 20.34 | % |
| 47.09 | % |
| (58.09 | )% |
Ratios to Average Net Assets: |
|
|
|
|
|
|
|
|
|
|
|
|
|
|
|
|
| ||||||||||||||||
Expenses, including expense |
|
| 2.14 | % |
| 2.10 | % |
| 2.19 | % |
| 2.42 | % |
| 2.25 | % |
| ||||||||||||||||
Expenses, excluding expense |
|
| 2.14 | % |
| 2.10 | % |
| 2.19 | % |
| 2.42 | % |
| 2.26 | % |
| ||||||||||||||||
Net investment income (loss) |
|
| .59 | % |
| .17 | % |
| (.13 | )% |
| (.14 | )% |
| .00 | %(d) |
|
|
|
|
|
|
|
|
|
|
|
|
|
|
|
|
|
Supplemental Data: |
|
|
|
|
|
|
|
|
|
|
|
|
|
|
|
|
Net assets, end of year (000) |
| $13,953 |
| $15,603 |
| $19,969 |
| $21,668 |
| $15,297 |
| |||||
Portfolio turnover rate |
|
| 91.18 | % |
| 103.98 | % |
| 83.13 | % |
| 115.58 | % |
| 130.51 | % |
|
|
(a) | Calculated using average shares outstanding during the year. |
(b) | Amount is less than $.01. |
(c) | Total return does not consider the effects of sales loads and assumes the reinvestment of all distributions. |
(d) | Amount is less than .01%. |
|
|
|
106 | See Notes to Financial Statements. |
|
|
Financial Highlights (continued) |
INTERNATIONAL OPPORTUNITIES FUND |
|
|
|
|
|
|
|
|
|
|
|
|
|
|
|
|
|
|
| Class F Shares |
| |||||||||||||
|
| |||||||||||||||
|
| Year Ended 10/31 |
| |||||||||||||
|
| |||||||||||||||
|
| 2012 |
| 2011 |
| 2010 |
| 2009 |
| 2008 |
| |||||
Per Share Operating Performance |
|
|
|
|
|
|
|
|
|
|
|
|
|
|
|
|
Net asset value, beginning of year |
| $11.94 |
| $12.81 |
| $10.65 |
| $7.28 |
| $19.81 |
| |||||
|
|
|
|
|
|
| ||||||||||
Investment operations: |
|
|
|
|
|
|
|
|
|
|
|
|
|
|
|
|
Net investment income(a) |
|
| .18 |
|
| .13 |
|
| .10 |
|
| .09 |
|
| .09 |
|
Net realized and unrealized gain (loss) |
|
| 1.09 |
|
| (.91 | ) |
| 2.17 |
|
| 3.37 |
|
| (10.31 | ) |
|
|
|
|
|
|
| ||||||||||
Total from investment operations |
|
| 1.27 |
|
| (.78 | ) |
| 2.27 |
|
| 3.46 |
|
| (10.22 | ) |
|
|
|
|
|
|
| ||||||||||
Distributions to shareholders from: |
|
|
|
|
|
|
|
|
|
|
|
|
|
|
|
|
Net investment income |
|
| (.12 | ) |
| (.09 | ) |
| (.11 | ) |
| (.09 | ) |
| (.14 | ) |
Net realized gain |
|
| — |
|
| — |
|
| — |
|
| — |
|
| (2.17 | ) |
|
|
|
|
|
|
| ||||||||||
Total distributions |
|
| (.12 | ) |
| (.09 | ) |
| (.11 | ) |
| (.09 | ) |
| (2.31 | ) |
|
|
|
|
|
|
| ||||||||||
Net asset value, end of year |
| $13.09 |
| $11.94 |
| $12.81 |
| $10.65 |
| $7.28 |
| |||||
|
|
|
|
|
|
| ||||||||||
| ||||||||||||||||
Total Return(b) |
|
| 10.83 | % |
| (6.16 | )% |
| 21.47 | % |
| 48.36 | % |
| (57.70 | )% |
Ratios to Average Net Assets: |
|
|
|
|
|
|
|
|
|
|
|
|
|
|
|
|
| ||||||||||||||||
Expenses, including expense |
|
| 1.27 | % |
| 1.24 | % |
| 1.28 | % |
| 1.49 | % |
| 1.42 | % |
| ||||||||||||||||
Expenses, excluding expense |
|
| 1.27 | % |
| 1.24 | % |
| 1.28 | % |
| 1.49 | % |
| 1.43 | % |
| ||||||||||||||||
Net investment income |
|
| 1.47 | % |
| 1.00 | % |
| .88 | % |
| 1.00 | % |
| .84 | % |
|
|
|
|
|
|
|
|
|
|
|
|
|
|
|
|
|
Supplemental Data: |
|
|
|
|
|
|
|
|
|
|
|
|
|
|
|
|
Net assets, end of year (000) |
| $944 |
| $934 |
| $934 |
| $384 |
| $121 |
| |||||
Portfolio turnover rate |
|
| 91.18 | % |
| 103.98 | % |
| 83.13 | % |
| 115.58 | % |
| 130.51 | % |
|
|
(a) | Calculated using average shares outstanding during the year. |
(b) | Total return assumes the reinvestment of all distributions. |
|
|
|
| See Notes to Financial Statements. | 107 |
|
Financial Highlights (continued) |
INTERNATIONAL OPPORTUNITIES FUND |
|
|
|
|
|
|
|
|
|
|
|
|
|
|
|
|
|
|
| Class I Shares |
| |||||||||||||
|
| |||||||||||||||
|
| Year Ended 10/31 |
| |||||||||||||
|
| |||||||||||||||
|
| 2012 |
| 2011 |
| 2010 |
| 2009 |
| 2008 |
| |||||
Per Share Operating Performance |
|
|
|
|
|
|
|
|
|
|
|
|
|
|
|
|
Net asset value, beginning of year |
| $12.30 |
| $13.18 |
| $10.96 |
| $7.48 |
| $20.29 |
| |||||
|
|
|
|
|
|
| ||||||||||
Investment operations: |
|
|
|
|
|
|
|
|
|
|
|
|
|
|
|
|
Net investment income(a) |
|
| .19 |
|
| .16 |
|
| .11 |
|
| .08 |
|
| .14 |
|
Net realized and unrealized gain (loss) |
|
| 1.13 |
|
| (.95 | ) |
| 2.23 |
|
| 3.50 |
|
| (10.64 | ) |
|
|
|
|
|
|
| ||||||||||
Total from investment operations |
|
| 1.32 |
|
| (.79 | ) |
| 2.34 |
|
| 3.58 |
|
| (10.50 | ) |
|
|
|
|
|
|
| ||||||||||
Distributions to shareholders from: |
|
|
|
|
|
|
|
|
|
|
|
|
|
|
|
|
Net investment income |
|
| (.13 | ) |
| (.09 | ) |
| (.12 | ) |
| (.10 | ) |
| (.14 | ) |
Net realized gain |
|
| — |
|
| — |
|
| — |
|
| — |
|
| (2.17 | ) |
|
|
|
|
|
|
| ||||||||||
Total distributions |
|
| (.13 | ) |
| (.09 | ) |
| (.12 | ) |
| (.10 | ) |
| (2.31 | ) |
|
|
|
|
|
|
| ||||||||||
Net asset value, end of year |
| $13.49 |
| $12.30 |
| $13.18 |
| $10.96 |
| $7.48 |
| |||||
|
|
|
|
|
|
| ||||||||||
| ||||||||||||||||
Total Return(b) |
|
| 10.96 | % |
| (6.01 | )% |
| 21.50 | % |
| 48.47 | % |
| (57.66 | )% |
Ratios to Average Net Assets: |
|
|
|
|
|
|
|
|
|
|
|
|
|
|
|
|
| ||||||||||||||||
Expenses, including expense |
|
| 1.17 | % |
| 1.14 | % |
| 1.18 | % |
| 1.42 | % |
| 1.27 | % |
| ||||||||||||||||
Expenses, excluding expense |
|
| 1.17 | % |
| 1.14 | % |
| 1.18 | % |
| 1.42 | % |
| 1.27 | % |
| ||||||||||||||||
Net investment income |
|
| 1.54 | % |
| 1.17 | % |
| .93 | % |
| .87 | % |
| 1.05 | % |
|
|
|
|
|
|
|
|
|
|
|
|
|
|
|
|
|
Supplemental Data: |
|
|
|
|
|
|
|
|
|
|
|
|
|
|
|
|
Net assets, end of year (000) |
| $195,785 |
| $213,865 |
| $232,027 |
| $160,456 |
| $110,838 |
| |||||
Portfolio turnover rate |
|
| 91.18 | % |
| 103.98 | % |
| 83.13 | % |
| 115.58 | % |
| 130.51 | % |
|
|
(a) | Calculated using average shares outstanding during the year. |
(b) | Total return assumes the reinvestment of all distributions. |
|
|
|
108 | See Notes to Financial Statements. |
|
|
Financial Highlights (continued) |
INTERNATIONAL OPPORTUNITIES FUND |
|
|
|
|
|
|
|
|
|
|
|
|
|
|
|
|
|
|
| Class P Shares |
| |||||||||||||
|
| |||||||||||||||
|
| Year Ended 10/31 |
| |||||||||||||
|
| |||||||||||||||
|
| 2012 |
| 2011 |
| 2010 |
| 2009 |
| 2008 |
| |||||
Per Share Operating Performance |
|
|
|
|
|
|
|
|
|
|
|
|
|
|
|
|
Net asset value, beginning of year |
| $12.17 |
| $13.06 |
| $10.86 |
| $7.36 |
| $20.00 |
| |||||
|
|
|
|
|
|
| ||||||||||
Investment operations: |
|
|
|
|
|
|
|
|
|
|
|
|
|
|
|
|
Net investment income(a) |
|
| .14 |
|
| .09 |
|
| .05 |
|
| .03 |
|
| .07 |
|
Net realized and unrealized gain (loss) |
|
| 1.12 |
|
| (.94 | ) |
| 2.22 |
|
| 3.48 |
|
| (10.46 | ) |
|
|
|
|
|
|
| ||||||||||
Total from investment operations |
|
| 1.26 |
|
| (.85 | ) |
| 2.27 |
|
| 3.51 |
|
| (10.39 | ) |
|
|
|
|
|
|
| ||||||||||
Distributions to shareholders from: |
|
|
|
|
|
|
|
|
|
|
|
|
|
|
|
|
Net investment income |
|
| (.07 | ) |
| (.04 | ) |
| (.07 | ) |
| (.01 | ) |
| (.08 | ) |
Net realized gain |
|
| — |
|
| — |
|
| — |
|
| — |
|
| (2.17 | ) |
|
|
|
|
|
|
| ||||||||||
Total distributions |
|
| (.07 | ) |
| (.04 | ) |
| (.07 | ) |
| (.01 | ) |
| (2.25 | ) |
|
|
|
|
|
|
| ||||||||||
Net asset value, end of year |
| $13.36 |
| $12.17 |
| $13.06 |
| $10.86 |
| $7.36 |
| |||||
|
|
|
|
|
|
| ||||||||||
| ||||||||||||||||
Total Return(b) |
|
| 10.49 | % |
| (6.51 | )% |
| 21.05 | % |
| 47.86 | % |
| (57.86 | )% |
Ratios to Average Net Assets: |
|
|
|
|
|
|
|
|
|
|
|
|
|
|
|
|
| ||||||||||||||||
Expenses, including expense |
|
| 1.62 | % |
| 1.59 | % |
| 1.64 | % |
| 1.87 | % |
| 1.70 | % |
| ||||||||||||||||
Expenses, excluding expense |
|
| 1.62 | % |
| 1.59 | % |
| 1.64 | % |
| 1.87 | % |
| 1.71 | % |
| ||||||||||||||||
Net investment income |
|
| 1.14 | % |
| .69 | % |
| .44 | % |
| .36 | % |
| .55 | % |
|
|
|
|
|
|
|
|
|
|
|
|
|
|
|
|
|
Supplemental Data: |
|
|
|
|
|
|
|
|
|
|
|
|
|
|
|
|
Net assets, end of year (000) |
| $929 |
| $820 |
| $900 |
| $781 |
| $834 |
| |||||
Portfolio turnover rate |
|
| 91.18 | % |
| 103.98 | % |
| 83.13 | % |
| 115.58 | % |
| 130.51 | % |
|
|
(a) | Calculated using average shares outstanding during the year. |
(b) | Total return assumes the reinvestment of all distributions. |
|
|
|
| See Notes to Financial Statements. | 109 |
|
Financial Highlights (continued) |
INTERNATIONAL OPPORTUNITIES FUND |
|
|
|
|
|
|
|
|
|
|
|
|
|
|
|
|
|
|
| Class R2 Shares |
| |||||||||||||
|
| |||||||||||||||
|
| Year Ended 10/31 |
| |||||||||||||
|
| |||||||||||||||
|
| 2012 |
| 2011 |
| 2010 |
| 2009 |
| 2008 |
| |||||
Per Share Operating Performance |
|
|
|
|
|
|
|
|
|
|
|
|
|
|
|
|
Net asset value, beginning of year |
| $11.90 |
| $12.77 |
| $10.64 |
| $7.24 |
| $19.80 |
| |||||
|
|
|
|
|
|
| ||||||||||
Investment operations: |
|
|
|
|
|
|
|
|
|
|
|
|
|
|
|
|
Net investment income(a) |
|
| .11 |
|
| .07 |
|
| .03 |
|
| .03 |
|
| .06 |
|
Net realized and unrealized gain (loss) |
|
| 1.11 |
|
| (.92 | ) |
| 2.18 |
|
| 3.40 |
|
| (10.32 | ) |
|
|
|
|
|
|
| ||||||||||
Total from investment operations |
|
| 1.22 |
|
| (.85 | ) |
| 2.21 |
|
| 3.43 |
|
| (10.26 | ) |
|
|
|
|
|
|
| ||||||||||
Distributions to shareholders from: |
|
|
|
|
|
|
|
|
|
|
|
|
|
|
|
|
Net investment income |
|
| (.05 | ) |
| (.02 | ) |
| (.08 | ) |
| (.03 | ) |
| (.13 | ) |
Net realized gain |
|
| — |
|
| — |
|
| — |
|
| — |
|
| (2.17 | ) |
|
|
|
|
|
|
| ||||||||||
Total distributions |
|
| (.05 | ) |
| (.02 | ) |
| (.08 | ) |
| (.03 | ) |
| (2.30 | ) |
|
|
|
|
|
|
| ||||||||||
Net asset value, end of year |
| $13.07 |
| $11.90 |
| $12.77 |
| $10.64 |
| $7.24 |
| |||||
|
|
|
|
|
|
| ||||||||||
| ||||||||||||||||
Total Return(b) |
|
| 10.35 | % |
| (6.68 | )% |
| 20.90 | % |
| 47.69 | % |
| (57.93 | )% |
Ratios to Average Net Assets: |
|
|
|
|
|
|
|
|
|
|
|
|
|
|
|
|
| ||||||||||||||||
Expenses, including expense |
|
| 1.76 | % |
| 1.74 | % |
| 1.79 | % |
| 1.97 | % |
| 1.84 | % |
| ||||||||||||||||
Expenses, excluding expense |
|
| 1.76 | % |
| 1.74 | % |
| 1.79 | % |
| 1.97 | % |
| 1.84 | % |
| ||||||||||||||||
Net investment income |
|
| .90 | % |
| .56 | % |
| .31 | % |
| .34 | % |
| .51 | % |
|
|
|
|
|
|
|
|
|
|
|
|
|
|
|
|
|
Supplemental Data: |
|
|
|
|
|
|
|
|
|
|
|
|
|
|
|
|
Net assets, end of year (000) |
| $91 |
| $95 |
| $96 |
| $91 |
| $31 |
| |||||
Portfolio turnover rate |
|
| 91.18 | % |
| 103.98 | % |
| 83.13 | % |
| 115.58 | % |
| 130.51 | % |
|
|
(a) | Calculated using average shares outstanding during the year. |
(b) | Total return assumes the reinvestment of all distributions. |
|
|
|
110 | See Notes to Financial Statements. |
|
|
Financial Highlights (concluded) |
INTERNATIONAL OPPORTUNITIES FUND |
|
|
|
|
|
|
|
|
|
|
|
|
|
|
|
|
|
|
| Class R3 Shares |
| |||||||||||||
|
| |||||||||||||||
|
| Year Ended 10/31 |
| |||||||||||||
|
| |||||||||||||||
|
| 2012 |
| 2011 |
| 2010 |
| 2009 |
| 2008 |
| |||||
Per Share Operating Performance |
|
|
|
|
|
|
|
|
|
|
|
|
|
|
|
|
Net asset value, beginning of year |
| $11.84 |
| $12.72 |
| $10.60 |
| $7.27 |
| $19.81 |
| |||||
|
|
|
|
|
|
| ||||||||||
Investment operations: |
|
|
|
|
|
|
|
|
|
|
|
|
|
|
|
|
Net investment income(a) |
|
| .13 |
|
| .10 |
|
| .05 |
|
| .01 |
|
| .10 |
|
Net realized and unrealized gain (loss) |
|
| 1.09 |
|
| (.92 | ) |
| 2.17 |
|
| 3.41 |
|
| (10.34 | ) |
|
|
|
|
|
|
| ||||||||||
Total from investment operations |
|
| 1.22 |
|
| (.82 | ) |
| 2.22 |
|
| 3.42 |
|
| (10.24 | ) |
|
|
|
|
|
|
| ||||||||||
Distributions to shareholders from: |
|
|
|
|
|
|
|
|
|
|
|
|
|
|
|
|
Net investment income |
|
| (.08 | ) |
| (.06 | ) |
| (.10 | ) |
| (.09 | ) |
| (.13 | ) |
Net realized gain |
|
| — |
|
| — |
|
| — |
|
| — |
|
| (2.17 | ) |
|
|
|
|
|
|
| ||||||||||
Total distributions |
|
| (.08 | ) |
| (.06 | ) |
| (.10 | ) |
| (.09 | ) |
| (2.30 | ) |
|
|
|
|
|
|
| ||||||||||
Net asset value, end of year |
| $12.98 |
| $11.84 |
| $12.72 |
| $10.60 |
| $7.27 |
| |||||
|
|
|
|
|
|
| ||||||||||
| ||||||||||||||||
Total Return(b) |
|
| 10.49 | % |
| (6.51 | )% |
| 21.04 | % |
| 47.75 | % |
| (57.77 | )% |
Ratios to Average Net Assets: |
|
|
|
|
|
|
|
|
|
|
|
|
|
|
|
|
| ||||||||||||||||
Expenses, including expense |
|
| 1.65 | % |
| 1.60 | % |
| 1.67 | % |
| 1.81 | % |
| 1.52 | % |
| ||||||||||||||||
Expenses, excluding expense |
|
| 1.65 | % |
| 1.60 | % |
| 1.67 | % |
| 1.81 | % |
| 1.52 | % |
| ||||||||||||||||
Net investment income |
|
| 1.11 | % |
| .74 | % |
| .45 | % |
| .14 | % |
| .81 | % |
|
|
|
|
|
|
|
|
|
|
|
|
|
|
|
|
|
Supplemental Data: |
|
|
|
|
|
|
|
|
|
|
|
|
|
|
|
|
Net assets, end of year (000) |
| $6,212 |
| $5,097 |
| $3,016 |
| $573 |
| $22 |
| |||||
Portfolio turnover rate |
|
| 91.18 | % |
| 103.98 | % |
| 83.13 | % |
| 115.58 | % |
| 130.51 | % |
|
|
(a) | Calculated using average shares outstanding during the year. |
(b) | Total return assumes the reinvestment of all distributions. |
|
|
|
| See Notes to Financial Statements. | 111 |
|
Financial Highlights |
VALUE OPPORTUNITIES FUND |
|
|
|
|
|
|
|
|
|
|
|
|
|
|
|
|
|
|
| Class A Shares |
| |||||||||||||
|
| |||||||||||||||
|
| Year Ended 10/31 |
| |||||||||||||
|
| |||||||||||||||
|
| 2012 |
| 2011 |
| 2010 |
| 2009 |
| 2008 |
| |||||
Per Share Operating Performance |
|
|
|
|
|
|
|
|
|
|
|
|
|
|
|
|
Net asset value, beginning of year |
|
| $15.16 |
|
| $14.45 |
|
| $11.65 |
|
| $9.91 |
|
| $14.31 |
|
|
|
|
|
|
|
| ||||||||||
Investment operations: |
|
|
|
|
|
|
|
|
|
|
|
|
|
|
|
|
Net investment income (loss)(a) |
|
| (.03 | ) |
| (.05 | ) |
| (.03 | ) |
| (.04 | ) |
| .04 |
|
Net realized and unrealized gain (loss) |
|
| .92 |
|
| .83 |
|
| 2.83 |
|
| 1.80 |
|
| (3.92 | ) |
|
|
|
|
|
|
| ||||||||||
Total from investment operations |
|
| .89 |
|
| .78 |
|
| 2.80 |
|
| 1.76 |
|
| (3.88 | ) |
|
|
|
|
|
|
| ||||||||||
Distributions to shareholders from: |
|
|
|
|
|
|
|
|
|
|
|
|
|
|
|
|
Net investment income |
|
| — |
|
| — |
|
| — |
|
| (.02 | ) |
| (.01 | ) |
Net realized gain |
|
| (.06 | ) |
| (.07 | ) |
| — |
|
| — |
|
| (.51 | ) |
|
|
|
|
|
|
| ||||||||||
Total distributions |
|
| (.06 | ) |
| (.07 | ) |
| — |
|
| (.02 | ) |
| (.52 | ) |
|
|
|
|
|
|
| ||||||||||
Net asset value, end of year |
|
| $15.99 |
|
| $15.16 |
|
| $14.45 |
|
| $11.65 |
|
| $9.91 |
|
|
|
|
|
|
|
| ||||||||||
| ||||||||||||||||
Total Return(b) |
|
| 5.89 | % |
| 5.45 | % |
| 24.03 | % |
| 17.81 | % |
| (28.01 | )% |
Ratios to Average Net Assets: |
|
|
|
|
|
|
|
|
|
|
|
|
|
|
|
|
| ||||||||||||||||
Expenses, excluding expense |
|
| 1.31 | % |
| 1.31 | % |
| 1.34 | % |
| 1.35 | % |
| 1.34 | % |
| ||||||||||||||||
Expenses, including expense |
|
| 1.31 | % |
| 1.31 | % |
| 1.34 | % |
| 1.35 | % |
| 1.33 | % |
| ||||||||||||||||
Expenses, excluding expense |
|
| 1.31 | % |
| 1.31 | % |
| 1.34 | % |
| 1.46 | % |
| 1.44 | % |
| ||||||||||||||||
Net investment income (loss) |
|
| (.19 | )% |
| (.29 | )% |
| (.19 | )% |
| (.34 | )% |
| .33 | % |
|
|
|
|
|
|
|
|
|
|
|
|
|
|
|
|
|
Supplemental Data: |
|
|
|
|
|
|
|
|
|
|
|
|
|
|
|
|
Net assets, end of year (000) |
| $870,567 |
| $883,444 |
| $582,806 |
| $250,435 |
| $117,992 |
| |||||
Portfolio turnover rate |
|
| 58.84 | % |
| 56.87 | % |
| 69.83 | % |
| 77.87 | % |
| 83.92 | % |
|
|
(a) | Calculated using average shares outstanding during the year. |
(b) | Total return does not consider the effects of sales loads and assumes the reinvestment of all distributions. |
|
|
|
112 | See Notes to Financial Statements. |
|
|
|
Financial Highlights (continued) | |
VALUE OPPORTUNITIES FUND | |
|
|
|
|
|
|
|
|
|
|
|
|
|
|
|
|
|
|
| Class B Shares |
| |||||||||||||
|
| |||||||||||||||
|
| Year Ended 10/31 |
| |||||||||||||
|
| |||||||||||||||
|
| 2012 |
| 2011 |
| 2010 |
| 2009 |
| 2008 |
| |||||
Per Share Operating Performance |
|
|
|
|
|
|
|
|
|
|
|
|
|
|
|
|
Net asset value, beginning of year |
|
| $14.63 |
|
| $14.03 |
|
| $11.39 |
|
| $9.74 |
|
| $14.14 |
|
|
|
|
|
|
|
| ||||||||||
Investment operations: |
|
|
|
|
|
|
|
|
|
|
|
|
|
|
|
|
Net investment loss(a) |
|
| (.12 | ) |
| (.14 | ) |
| (.11 | ) |
| (.09 | ) |
| (.04 | ) |
Net realized and unrealized gain (loss) |
|
| .87 |
|
| .81 |
|
| 2.75 |
|
| 1.74 |
|
| (3.85 | ) |
|
|
|
|
|
|
| ||||||||||
Total from investment operations |
|
| .75 |
|
| .67 |
|
| 2.64 |
|
| 1.65 |
|
| (3.89 | ) |
|
|
|
|
|
|
| ||||||||||
Distributions to shareholders from: |
|
|
|
|
|
|
|
|
|
|
|
|
|
|
|
|
Net realized gain |
|
| (.06 | ) |
| (.07 | ) |
| — |
|
| — |
|
| (.51 | ) |
|
|
|
|
|
|
| ||||||||||
Net asset value, end of year |
|
| $15.32 |
|
| $14.63 |
|
| $14.03 |
|
| $11.39 |
|
| $9.74 |
|
|
|
|
|
|
|
| ||||||||||
| ||||||||||||||||
Total Return(b) |
|
| 5.14 | % |
| 4.83 | % |
| 23.18 | % |
| 16.94 | % |
| (28.40 | )% |
Ratios to Average Net Assets: |
|
|
|
|
|
|
|
|
|
|
|
|
|
|
|
|
| ||||||||||||||||
Expenses, excluding expense |
|
| 1.96 | % |
| 1.96 | % |
| 1.99 | % |
| 2.00 | % |
| 1.99 | % |
| ||||||||||||||||
Expenses, including expense |
|
| 1.96 | % |
| 1.96 | % |
| 1.99 | % |
| 2.00 | % |
| 1.99 | % |
| ||||||||||||||||
Expenses, excluding expense |
|
| 1.96 | % |
| 1.96 | % |
| 1.99 | % |
| 2.12 | % |
| 2.09 | % |
| ||||||||||||||||
Net investment loss |
|
| (.83 | )% |
| (.91 | )% |
| (.85 | )% |
| (.95 | )% |
| (.32 | )% |
|
|
|
|
|
|
|
|
|
|
|
|
|
|
|
|
|
Supplemental Data: |
|
|
|
|
|
|
|
|
|
|
|
|
|
|
|
|
Net assets, end of year (000) |
|
| $13,315 |
|
| $15,700 |
|
| $19,110 |
|
| $18,739 |
|
| $14,239 |
|
Portfolio turnover rate |
|
| 58.84 | % |
| 56.87 | % |
| 69.83 | % |
| 77.87 | % |
| 83.92 | % |
|
|
(a) | Calculated using average shares outstanding during the year. |
(b) | Total return does not consider the effects of sales loads and assumes the reinvestment of all distributions. |
|
|
|
| See Notes to Financial Statements. | 113 |
|
|
Financial Highlights (continued) |
|
VALUE OPPORTUNITIES FUND |
|
|
|
|
|
|
|
|
|
|
|
|
|
|
|
|
|
|
|
| Class C Shares |
| |||||||||||||
|
| |||||||||||||||
|
| Year Ended 10/31 |
| |||||||||||||
|
| |||||||||||||||
|
| 2012 |
| 2011 |
| 2010 |
| 2009 |
| 2008 |
| |||||
Per Share Operating Performance |
|
|
|
|
|
|
|
|
|
|
|
|
|
|
|
|
Net asset value, beginning of year |
|
| $14.62 |
|
| $14.03 |
|
| $11.39 |
|
| $9.74 |
|
| $14.14 |
|
|
|
|
|
|
|
| ||||||||||
Investment operations: |
|
|
|
|
|
|
|
|
|
|
|
|
|
|
|
|
Net investment loss(a) |
|
| (.13 | ) |
| (.14 | ) |
| (.11 | ) |
| (.10 | ) |
| (.04 | ) |
Net realized and unrealized gain (loss) |
|
| .89 |
|
| .80 |
|
| 2.75 |
|
| 1.75 |
|
| (3.85 | ) |
|
|
|
|
|
|
| ||||||||||
Total from investment operations |
|
| .76 |
|
| .66 |
|
| 2.64 |
|
| 1.65 |
|
| (3.89 | ) |
|
|
|
|
|
|
| ||||||||||
Distributions to shareholders from: |
|
|
|
|
|
|
|
|
|
|
|
|
|
|
|
|
Net realized gain |
|
| (.06 | ) |
| (.07 | ) |
| — |
|
| — |
|
| (.51 | ) |
|
|
|
|
|
|
| ||||||||||
Net asset value, end of year |
|
| $15.32 |
|
| $14.62 |
|
| $14.03 |
|
| $11.39 |
|
| $9.74 |
|
|
|
|
|
|
|
| ||||||||||
| ||||||||||||||||
Total Return(b) |
|
| 5.21 | % |
| 4.76 | % |
| 23.18 | % |
| 17.06 | % |
| (28.47 | )% |
Ratios to Average Net Assets: |
|
|
|
|
|
|
|
|
|
|
|
|
|
|
|
|
| ||||||||||||||||
Expenses, excluding expense |
|
| 1.96 | % |
| 1.96 | % |
| 1.99 | % |
| 2.00 | % |
| 1.99 | % |
| ||||||||||||||||
Expenses, including expense |
|
| 1.96 | % |
| 1.96 | % |
| 1.99 | % |
| 2.00 | % |
| 1.98 | % |
| ||||||||||||||||
Expenses, excluding expense |
|
| 1.96 | % |
| 1.96 | % |
| 1.99 | % |
| 2.11 | % |
| 2.09 | % |
| ||||||||||||||||
Net investment loss |
|
| (.83 | )% |
| (.95 | )% |
| (.83 | )% |
| (.97 | )% |
| (.33 | )% |
|
|
|
|
|
|
|
|
|
|
|
|
|
|
|
|
|
Supplemental Data: |
|
|
|
|
|
|
|
|
|
|
|
|
|
|
|
|
Net assets, end of year (000) |
|
| $248,357 |
|
| $263,798 |
|
| $147,193 |
|
| $79,527 |
|
| $48,837 |
|
Portfolio turnover rate |
|
| 58.84 | % |
| 56.87 | % |
| 69.83 | % |
| 77.87 | % |
| 83.92 | % |
|
|
(a) | Calculated using average shares outstanding during the year. |
(b) | Total return does not consider the effects of sales loads and assumes the reinvestment of all distributions. |
|
|
|
114 | See Notes to Financial Statements. |
|
|
|
Financial Highlights (continued) |
|
VALUE OPPORTUNITIES FUND |
|
|
|
|
|
|
|
|
|
|
|
|
|
|
|
|
|
|
|
| Class F Shares |
| |||||||||||||
|
| |||||||||||||||
|
| Year Ended 10/31 |
| |||||||||||||
|
| |||||||||||||||
|
| 2012 |
| 2011 |
| 2010 |
| 2009 |
| 2008 |
| |||||
Per Share Operating Performance |
|
|
|
|
|
|
|
|
|
|
|
|
|
|
|
|
Net asset value, beginning of year |
|
| $15.20 |
|
| $14.45 |
|
| $11.62 |
|
| $9.91 |
|
| $14.31 |
|
|
|
|
|
|
|
| ||||||||||
Investment operations: |
|
|
|
|
|
|
|
|
|
|
|
|
|
|
|
|
Net investment income (loss)(a) |
|
| .01 |
|
| (.01 | ) |
| .01 |
|
| (.02 | ) |
| .06 |
|
Net realized and unrealized gain (loss) |
|
| .92 |
|
| .83 |
|
| 2.82 |
|
| 1.78 |
|
| (3.91 | ) |
|
|
|
|
|
|
| ||||||||||
Total from investment operations |
|
| .93 |
|
| .82 |
|
| 2.83 |
|
| 1.76 |
|
| (3.85 | ) |
|
|
|
|
|
|
| ||||||||||
Distributions to shareholders from: |
|
|
|
|
|
|
|
|
|
|
|
|
|
|
|
|
Net investment income |
|
| — |
|
| — |
|
| — |
|
| (.05 | ) |
| (.04 | ) |
Net realized gain |
|
| (.06 | ) |
| (.07 | ) |
| — |
|
| — |
|
| (.51 | ) |
|
|
|
|
|
|
| ||||||||||
Total distributions |
|
| (.06 | ) |
| (.07 | ) |
| — |
|
| (.05 | ) |
| (.55 | ) |
|
|
|
|
|
|
| ||||||||||
Net asset value, end of year |
|
| $16.07 |
|
| $15.20 |
|
| $14.45 |
|
| $11.62 |
|
| $9.91 |
|
|
|
|
|
|
|
| ||||||||||
| ||||||||||||||||
Total Return(b) |
|
| 6.13 | % |
| 5.73 | % |
| 24.25 | % |
| 18.12 | % |
| (27.81 | )% |
Ratios to Average Net Assets: |
|
|
|
|
|
|
|
|
|
|
|
|
|
|
|
|
| ||||||||||||||||
Expenses, excluding expense |
|
| 1.06 | % |
| 1.07 | % |
| 1.10 | % |
| 1.09 | % |
| 1.09 | % |
| ||||||||||||||||
Expenses, including expense |
|
| 1.06 | % |
| 1.07 | % |
| 1.10 | % |
| 1.09 | % |
| 1.09 | % |
| ||||||||||||||||
Expenses, excluding expense |
|
| 1.06 | % |
| 1.07 | % |
| 1.10 | % |
| 1.20 | % |
| 1.21 | % |
| ||||||||||||||||
Net investment income (loss) |
|
| .06 | % |
| (.06 | )% |
| .07 | % |
| (.19 | )% |
| .50 | % |
|
|
|
|
|
|
|
|
|
|
|
|
|
|
|
|
|
Supplemental Data: |
|
|
|
|
|
|
|
|
|
|
|
|
|
|
|
|
Net assets, end of year (000) |
|
| $369,321 |
|
| $385,086 |
|
| $168,415 |
|
| $51,757 |
|
| $4,157 |
|
Portfolio turnover rate |
|
| 58.84 | % |
| 56.87 | % |
| 69.83 | % |
| 77.87 | % |
| 83.92 | % |
|
|
(a) | Calculated using average shares outstanding during the year. |
(b) | Total return assumes the reinvestment of all distributions. |
|
|
|
| See Notes to Financial Statements. | 115 |
|
|
Financial Highlights (continued) |
|
VALUE OPPORTUNITIES FUND |
|
|
|
|
|
|
|
|
|
|
|
|
|
|
|
|
|
|
|
| Class I Shares |
| |||||||||||||
|
| |||||||||||||||
|
| Year Ended 10/31 |
| |||||||||||||
|
| |||||||||||||||
|
| 2012 |
| 2011 |
| 2010 |
| 2009 |
| 2008 |
| |||||
Per Share Operating Performance |
|
|
|
|
|
|
|
|
|
|
|
|
|
|
|
|
Net asset value, beginning of year |
|
| $15.34 |
|
| $14.57 |
|
| $11.70 |
|
| $9.98 |
|
| $14.39 |
|
|
|
|
|
|
|
| ||||||||||
Investment operations: |
|
|
|
|
|
|
|
|
|
|
|
|
|
|
|
|
Net investment income(a) |
|
| .02 |
|
| .01 |
|
| .02 |
|
| — | (b) |
| .08 |
|
Net realized and unrealized gain (loss) |
|
| .93 |
|
| .83 |
|
| 2.85 |
|
| 1.78 |
|
| (3.93 | ) |
|
|
|
|
|
|
| ||||||||||
Total from investment operations |
|
| .95 |
|
| .84 |
|
| 2.87 |
|
| 1.78 |
|
| (3.85 | ) |
|
|
|
|
|
|
| ||||||||||
Distributions to shareholders from: |
|
|
|
|
|
|
|
|
|
|
|
|
|
|
|
|
Net investment income |
|
| — |
|
| — |
|
| — |
|
| (.06 | ) |
| (.05 | ) |
Net realized gain |
|
| (.06 | ) |
| (.07 | ) |
| — |
|
| — |
|
| (.51 | ) |
|
|
|
|
|
|
| ||||||||||
Total distributions |
|
| (.06 | ) |
| (.07 | ) |
| — |
|
| (.06 | ) |
| (.56 | ) |
|
|
|
|
|
|
| ||||||||||
Net asset value, end of year |
|
| $16.23 |
|
| $15.34 |
|
| $14.57 |
|
| $11.70 |
|
| $9.98 |
|
|
|
|
|
|
|
| ||||||||||
| ||||||||||||||||
Total Return(c) |
|
| 6.21 | % |
| 5.82 | % |
| 24.42 | % |
| 18.27 | % |
| (27.77 | )% |
Ratios to Average Net Assets: |
|
|
|
|
|
|
|
|
|
|
|
|
|
|
|
|
| ||||||||||||||||
Expenses, excluding expense |
|
| .97 | % |
| .97 | % |
| .99 | % |
| 1.00 | % |
| .99 | % |
| ||||||||||||||||
Expenses, including expense |
|
| .97 | % |
| .97 | % |
| .99 | % |
| 1.00 | % |
| .98 | % |
| ||||||||||||||||
Expenses, excluding expense |
|
| .97 | % |
| .97 | % |
| .99 | % |
| 1.12 | % |
| 1.08 | % |
| ||||||||||||||||
Net investment income |
|
| .15 | % |
| .06 | % |
| .16 | % |
| .03 | % |
| .67 | % |
|
|
|
|
|
|
|
|
|
|
|
|
|
|
|
|
|
Supplemental Data: |
|
|
|
|
|
|
|
|
|
|
|
|
|
|
|
|
Net assets, end of year (000) |
|
| $411,546 |
|
| $291,056 |
|
| $190,103 |
|
| $121,462 |
|
| $74,335 |
|
Portfolio turnover rate |
|
| 58.84 | % |
| 56.87 | % |
| 69.83 | % |
| 77.87 | % |
| 83.92 | % |
|
|
(a) | Calculated using average shares outstanding during the year. |
(b) | Amount is less than $.01. |
(c) | Total return assumes the reinvestment of all distributions. |
|
|
|
116 | See Notes to Financial Statements. |
|
|
|
Financial Highlights (continued) |
|
VALUE OPPORTUNITIES FUND |
|
|
|
|
|
|
|
|
|
|
|
|
|
|
|
|
|
|
|
| Class P Shares |
| |||||||||||||
|
| |||||||||||||||
|
| Year Ended 10/31 |
| |||||||||||||
|
| |||||||||||||||
|
| 2012 |
| 2011 |
| 2010 |
| 2009 |
| 2008 |
| |||||
Per Share Operating Performance |
|
|
|
|
|
|
|
|
|
|
|
|
|
|
|
|
Net asset value, beginning of year |
|
| $15.09 |
|
| $14.40 |
|
| $11.62 |
|
| $9.88 |
|
| $14.28 |
|
|
|
|
|
|
|
| ||||||||||
Investment operations: |
|
|
|
|
|
|
|
|
|
|
|
|
|
|
|
|
Net investment income (loss)(a) |
|
| (.04 | ) |
| (.05 | ) |
| (.04 | ) |
| (.04 | ) |
| .03 |
|
Net realized and unrealized gain (loss) |
|
| .91 |
|
| .81 |
|
| 2.82 |
|
| 1.78 |
|
| (3.91 | ) |
|
|
|
|
|
|
| ||||||||||
Total from investment operations |
|
| .87 |
|
| .76 |
|
| 2.78 |
|
| 1.74 |
|
| (3.88 | ) |
|
|
|
|
|
|
| ||||||||||
Distributions to shareholders from: |
|
|
|
|
|
|
|
|
|
|
|
|
|
|
|
|
Net investment income |
|
| — |
|
| — |
|
| — |
|
| — |
|
| (.01 | ) |
Net realized gain |
|
| (.06 | ) |
| (.07 | ) |
| — |
|
| — |
|
| (.51 | ) |
|
|
|
|
|
|
| ||||||||||
Total distributions |
|
| (.06 | ) |
| (.07 | ) |
| — |
|
| — |
|
| (.52 | ) |
|
|
|
|
|
|
| ||||||||||
Net asset value, end of year |
|
| $15.90 |
|
| $15.09 |
|
| $14.40 |
|
| $11.62 |
|
| $9.88 |
|
|
|
|
|
|
|
| ||||||||||
| ||||||||||||||||
Total Return(b) |
|
| 5.78 | % |
| 5.33 | % |
| 23.92 | % |
| 17.61 | % |
| (28.04 | )% |
Ratios to Average Net Assets: |
|
|
|
|
|
|
|
|
|
|
|
|
|
|
|
|
| ||||||||||||||||
Expenses, excluding expense |
|
| 1.41 | % |
| 1.41 | % |
| 1.44 | % |
| 1.45 | % |
| 1.44 | % |
| ||||||||||||||||
Expenses, including expense |
|
| 1.41 | % |
| 1.41 | % |
| 1.44 | % |
| 1.45 | % |
| 1.43 | % |
| ||||||||||||||||
Expenses, excluding expense |
|
| 1.41 | % |
| 1.41 | % |
| 1.44 | % |
| 1.57 | % |
| 1.53 | % |
| ||||||||||||||||
Net investment income (loss) |
|
| (.24 | )% |
| (.35 | )% |
| (.29 | )% |
| (.39 | )% |
| .23 | % |
|
|
|
|
|
|
|
|
|
|
|
|
|
|
|
|
|
Supplemental Data: |
|
|
|
|
|
|
|
|
|
|
|
|
|
|
|
|
Net assets, end of year (000) |
|
| $918 |
|
| $3,392 |
|
| $4,344 |
|
| $3,445 |
|
| $2,905 |
|
Portfolio turnover rate |
|
| 58.84 | % |
| 56.87 | % |
| 69.83 | % |
| 77.87 | % |
| 83.92 | % |
|
|
(a) | Calculated using average shares outstanding during the year. |
(b) | Total return assumes the reinvestment of all distributions. |
|
|
|
| See Notes to Financial Statements. | 117 |
|
|
Financial Highlights (continued) |
|
VALUE OPPORTUNITIES FUND |
|
|
|
|
|
|
|
|
|
|
|
|
|
|
|
|
|
|
|
| Class R2 Shares |
| |||||||||||||
|
| |||||||||||||||
|
| Year Ended 10/31 |
| |||||||||||||
|
| |||||||||||||||
|
| 2012 |
| 2011 |
| 2010 |
| 2009 |
| 2008 |
| |||||
Per Share Operating Performance |
|
|
|
|
|
|
|
|
|
|
|
|
|
|
|
|
Net asset value, beginning of year |
|
| $15.01 |
|
| $14.34 |
|
| $11.59 |
|
| $9.87 |
|
| $14.30 |
|
|
|
|
|
|
|
| ||||||||||
Investment operations: |
|
|
|
|
|
|
|
|
|
|
|
|
|
|
|
|
Net investment income (loss)(a) |
|
| (.07 | ) |
| (.09 | ) |
| (.06 | ) |
| (.09 | ) |
| .01 |
|
Net realized and unrealized gain (loss) |
|
| .91 |
|
| .83 |
|
| 2.81 |
|
| 1.81 |
|
| (3.90 | ) |
|
|
|
|
|
|
| ||||||||||
Total from investment operations |
|
| .84 |
|
| .74 |
|
| 2.75 |
|
| 1.72 |
|
| (3.89 | ) |
|
|
|
|
|
|
| ||||||||||
Distributions to shareholders from: |
|
|
|
|
|
|
|
|
|
|
|
|
|
|
|
|
Net investment income |
|
| — |
|
| — |
|
| — |
|
| — |
|
| (.03 | ) |
Net realized gain |
|
| (.06 | ) |
| (.07 | ) |
| — |
|
| — |
|
| (.51 | ) |
|
|
|
|
|
|
| ||||||||||
Total distributions |
|
| (.06 | ) |
| (.07 | ) |
| — |
|
| — |
|
| (.54 | ) |
|
|
|
|
|
|
| ||||||||||
Net asset value, end of year |
|
| $15.79 |
|
| $15.01 |
|
| $14.34 |
|
| $11.59 |
|
| $9.87 |
|
|
|
|
|
|
|
| ||||||||||
| ||||||||||||||||
Total Return(b) |
|
| 5.61 | % |
| 5.21 | % |
| 23.62 | % |
| 17.53 | % |
| (28.14 | )% |
Ratios to Average Net Assets: |
|
|
|
|
|
|
|
|
|
|
|
|
|
|
|
|
| ||||||||||||||||
Expenses, excluding expense |
|
| 1.56 | % |
| 1.57 | % |
| 1.60 | % |
| 1.59 | % |
| 1.58 | % |
| ||||||||||||||||
Expenses, including expense |
|
| 1.56 | % |
| 1.57 | % |
| 1.60 | % |
| 1.59 | % |
| 1.58 | % |
| ||||||||||||||||
Expenses, excluding expense |
|
| 1.56 | % |
| 1.57 | % |
| 1.60 | % |
| 1.68 | % |
| 1.66 | % |
| ||||||||||||||||
Net investment income (loss) |
|
| (.44 | )% |
| (.58 | )% |
| (.42 | )% |
| (.83 | )% |
| .11 | % |
|
|
|
|
|
|
|
|
|
|
|
|
|
|
|
|
|
Supplemental Data: |
|
|
|
|
|
|
|
|
|
|
|
|
|
|
|
|
Net assets, end of year (000) |
|
| $11,056 |
|
| $8,804 |
|
| $2,538 |
|
| $1,466 |
|
| $33 |
|
Portfolio turnover rate |
|
| 58.84 | % |
| 56.87 | % |
| 69.83 | % |
| 77.87 | % |
| 83.92 | % |
|
|
(a) | Calculated using average shares outstanding during the year. |
(b) | Total return assumes the reinvestment of all distributions. |
|
|
|
118 | See Notes to Financial Statements. |
|
|
|
Financial Highlights (concluded) |
|
VALUE OPPORTUNITIES FUND |
|
|
|
|
|
|
|
|
|
|
|
|
|
|
|
|
|
|
|
| Class R3 Shares |
| |||||||||||||
|
| |||||||||||||||
|
| Year Ended 10/31 |
| |||||||||||||
|
| |||||||||||||||
|
| 2012 |
| 2011 |
| 2010 |
| 2009 |
| 2008 |
| |||||
Per Share Operating Performance |
|
|
|
|
|
|
|
|
|
|
|
|
|
|
|
|
Net asset value, beginning of year |
|
| $15.03 |
|
| $14.34 |
|
| $11.58 |
|
| $9.87 |
|
| $14.30 |
|
|
|
|
|
|
|
| ||||||||||
Investment operations: |
|
|
|
|
|
|
|
|
|
|
|
|
|
|
|
|
Net investment income (loss)(a) |
|
| (.05 | ) |
| (.07 | ) |
| (.04 | ) |
| (.05 | ) |
| .02 |
|
Net realized and unrealized gain (loss) |
|
| .91 |
|
| .83 |
|
| 2.80 |
|
| 1.78 |
|
| (3.90 | ) |
|
|
|
|
|
|
| ||||||||||
Total from investment operations |
|
| .86 |
|
| .76 |
|
| 2.76 |
|
| 1.73 |
|
| (3.88 | ) |
|
|
|
|
|
|
| ||||||||||
Distributions to shareholders from: |
|
|
|
|
|
|
|
|
|
|
|
|
|
|
|
|
Net investment income |
|
| — |
|
| — |
|
| — |
|
| (.02 | ) |
| (.04 | ) |
Net realized gain |
|
| (.06 | ) |
| (.07 | ) |
| — |
|
| — |
|
| (.51 | ) |
|
|
|
|
|
|
| ||||||||||
Total distributions |
|
| (.06 | ) |
| (.07 | ) |
| — |
|
| (.02 | ) |
| (.55 | ) |
|
|
|
|
|
|
| ||||||||||
Net asset value, end of year |
|
| $15.83 |
|
| $15.03 |
|
| $14.34 |
|
| $11.58 |
|
| $9.87 |
|
|
|
|
|
|
|
| ||||||||||
| ||||||||||||||||
Total Return(b) |
|
| 5.74 | % |
| 5.35 | % |
| 23.73 | % |
| 17.69 | % |
| (28.08 | )% |
Ratios to Average Net Assets: |
|
|
|
|
|
|
|
|
|
|
|
|
|
|
|
|
| ||||||||||||||||
Expenses, excluding expense |
|
| 1.46 | % |
| 1.47 | % |
| 1.49 | % |
| 1.49 | % |
| 1.49 | % |
| ||||||||||||||||
Expenses, including expense |
|
| 1.46 | % |
| 1.47 | % |
| 1.49 | % |
| 1.49 | % |
| 1.49 | % |
| ||||||||||||||||
Expenses, excluding expense |
|
| 1.46 | % |
| 1.47 | % |
| 1.50 | % |
| 1.61 | % |
| 1.58 | % |
| ||||||||||||||||
Net investment income (loss) |
|
| (.35 | )% |
| (.47 | )% |
| (.31 | )% |
| (.50 | )% |
| .19 | % |
|
|
|
|
|
|
|
|
|
|
|
|
|
|
|
|
|
Supplemental Data: |
|
|
|
|
|
|
|
|
|
|
|
|
|
|
|
|
Net assets, end of year (000) |
|
| $86,441 |
|
| $64,504 |
|
| $20,456 |
|
| $4,227 |
|
| $1,814 |
|
Portfolio turnover rate |
|
| 58.84 | % |
| 56.87 | % |
| 69.83 | % |
| 77.87 | % |
| 83.92 | % |
|
|
(a) | Calculated using average shares outstanding during the year. |
(b) | Total return assumes the reinvestment of all distributions. |
|
|
|
| See Notes to Financial Statements. | 119 |
Notes to Financial Statements
|
|
1. | ORGANIZATION |
Lord Abbett Securities Trust (the “Trust”) is registered under the Investment Company Act of 1940, as amended (the “Act”), as a diversified, open-end management investment company and was organized as a Delaware statutory trust on February 26, 1993.
The Trust currently consists of nine funds. This report covers the following seven funds (separately, a “Fund” and collectively, the “Funds”) and their respective classes:
|
|
Funds | Classes |
Lord Abbett Alpha Strategy Fund (“Alpha Strategy Fund”) | A, B, C, F, I, P, R2 and R3 |
Lord Abbett Fundamental Equity Fund (“Fundamental Equity Fund”) | A, B, C, F, I, P, R2 and R3 |
Lord Abbett Growth Leaders Fund (“Growth Leaders Fund”) | A, C, F, I, R2 and R3 |
Lord Abbett International Core Equity Fund (“International Core Equity Fund”) | A, B, C, F, I, P, R2 and R3 |
Lord Abbett International Dividend Income Fund | A, C, F, I, R2 and R3 |
Lord Abbett International Opportunities Fund | A, B, C, F, I, P, R2 and R3 |
Lord Abbett Value Opportunities Fund (“Value Opportunities Fund”) | A, B, C, F, I, P, R2 and R3 |
The Funds no longer issue Class B shares for purchase. The Funds’ Class P shares are closed to substantially all investors, with certain exceptions as set forth in the Funds’ prospectus. As of the date of this report, Alpha Strategy Fund has not issued Class P shares.
Each of Alpha Strategy Fund’s, International Core Equity Fund’s, International Opportunities Fund’s, and Value Opportunities Fund’s investment objective is to seek long-term capital appreciation. Alpha Strategy Fund invests in other funds (“Underlying Funds”) managed by Lord, Abbett & Co. LLC (“Lord Abbett”). Fundamental Equity Fund’s investment objective is long-term growth of capital and income without excessive fluctuations in market value. Growth Leaders Fund’s investment objective is to seek capital appreciation. International Dividend Income Fund’s investment objective is to seek a high level of total return.
Each class of shares has different expenses and dividends. A front-end sales charge is normally added to the net asset value (“NAV”) for Class A shares. There is no front-end sales charge in the case of Class B, C, F, I, P, R2 and R3 shares, although there may be a contingent deferred sales charge (“CDSC”) in certain cases as follows: Class A shares purchased without a sales charge and redeemed before the first day of the month in which the one-year anniversary of the purchase falls (subject to certain exceptions as set forth in each Fund’s prospectus); Class B shares redeemed before the sixth anniversary of purchase; and Class C shares redeemed before the first anniversary of purchase. Class B shares will automatically convert to Class A shares on the 25th day of the month (or, if the 25th day is not a business day, the next business day thereafter) following the eighth anniversary of the day on which the purchase order was accepted.
On June 15, 2012, Fundamental Equity Fund acquired the net assets of Lord Abbett Large-Cap Value Fund (“Large Cap Value Fund”) of Lord Abbett Securities Trust. Refer to Note 13 Reorganization for additional information.
The preparation of the financial statements in conformity with accounting principles generally accepted in the United States of America requires management to make certain estimates and assumptions that affect the reported amounts of assets and liabilities and disclosure of contingent assets and liabilities at the date of the financial statements and the reported amounts of increases
120
Notes to Financial Statements (continued)
and decreases in net assets from operations during the reporting period. Actual results could differ from those estimates.
|
|
2. | SIGNIFICANT ACCOUNTING POLICIES |
|
|
(a) | Investment Valuation–Under procedures approved by the Funds’ Board of Trustees (the “Board”), Lord Abbett, the Funds’ investment manager, has formed a Pricing Committee to administer the pricing and valuation of portfolio investments and to ensure that prices utilized reasonably reflect fair value. Among other things, these procedures allow each Fund to utilize independent pricing services, quotations from securities and financial instrument dealers and other market sources to determine fair value. |
|
|
| Securities actively traded on any recognized U.S. or non-U.S. exchange or on The NASDAQ Stock Market LLC are valued at the last sale price or official closing price on the exchange or system on which they are principally traded. Events occurring after the close of trading on non-U.S. exchanges may result in adjustments to the valuation of foreign securities to reflect their fair value as of the close of regular trading on the New York Stock Exchange LLC (“NYSE”). Each Fund may rely on an independent fair valuation service in adjusting the valuations of foreign securities. Unlisted equity securities are valued at the last quoted sale price or, if no sale price is available, at the mean between the most recently quoted bid and asked prices. Forward foreign currency exchange contracts are valued using daily forward exchange rates. Investments in the Underlying Funds are valued at their NAV each business day at the close of regular trading on the NYSE, normally 4:00 p.m. Eastern time. |
|
|
| Securities for which prices are not readily available are valued at fair value as determined by the Pricing Committee and approved by the Board. The Pricing Committee considers a number of factors, including observable and unobservable inputs, when arriving at fair value. The Pricing Committee may use related or comparable assets or liabilities, recent transactions, market multiples, book values and other relevant information to determine fair value of portfolio investments. The Board or a designated committee thereof regularly reviews fair value determinations made by the Pricing Committee and employs techniques such as reviewing related market activity, reviewing inputs and assumptions, and retrospectively comparing prices of subsequent purchases and sales transactions to fair value determinations made by the Pricing Committee. |
|
|
| Short-term securities with 60 days or less remaining to maturity are valued using the amortized cost method, which approximates fair value. |
|
|
(b) | Security Transactions–Security transactions are recorded as of the date that the securities are purchased or sold (trade date). Realized gains and losses on sales of portfolio securities are calculated using the identified-cost method. Realized and unrealized gains (losses) are allocated to each class of shares based upon the relative proportion of net assets at the beginning of the day. |
|
|
(c) | Investment Income–Dividend income is recorded on the ex-dividend date. Interest income is recorded on the accrual basis as earned. Discounts are accreted and premiums are amortized using the effective interest method and are included in Interest and other income on the Statements of Operations. Withholding taxes on foreign dividends have been provided for in accordance with the applicable country’s tax rules and rates. Investment income is allocated to each class of shares based upon the relative proportion of net assets at the beginning of the day. |
121
Notes to Financial Statements (continued)
|
|
(d) | Income Taxes–It is the policy of each Fund to meet the requirements of Subchapter M of the Internal Revenue Code (“IRC”) applicable to regulated investment companies and to distribute substantially all taxable income and capital gains to its shareholders. Therefore, no income tax provision is required. |
|
|
| Each Fund files U.S. federal and various state and local tax returns. No income tax returns are currently under examination. The statute of limitations on the Funds’ filed U.S. federal tax returns remains open for the fiscal years ended October 31, 2009 through October 31, 2012. The statutes of limitations on the Trust’s state and local tax returns may remain open for an additional year depending upon the jurisdiction. |
|
|
(e) | Expenses–Expenses incurred by the Trust that do not specifically relate to an individual fund are generally allocated to the Funds within the Trust on a pro rata basis by relative net assets. Expenses, excluding class-specific expenses, are allocated to each class of shares based upon the relative proportion of net assets at the beginning of the day. Class A, B, C, F, P, R2 and R3 shares bear their class-specific share of all expenses and fees relating to the Funds’ 12b-1 Distribution Plan. |
|
|
(f) | Foreign Transactions–The books and records of each Fund are maintained in U.S. dollars and transactions denominated in foreign currencies are recorded in each Fund’s records at the rate prevailing when earned or recorded. Asset and liability accounts that are denominated in foreign currencies are adjusted daily to reflect current exchange rates and any unrealized gain (loss) is included in Net change in unrealized appreciation/depreciation on investments and translation of assets and liabilities denominated in foreign currencies on each Fund’s Statement of Operations. The resultant exchange gains and losses upon settlement of such transactions are included in Net realized gain (loss) on investments (net of foreign capital gains tax) and foreign currency related transactions on each Fund’s Statement of Operations. Each Fund does not isolate that portion of the results of operations arising as a result of changes in the foreign exchange rates from the changes in market prices of the securities. |
|
|
| The Funds use foreign currency exchange contracts to facilitate transactions in foreign-denominated securities. Losses from these transactions may arise from changes in the value of the foreign currency or if the counterparties do not perform under the contracts’ terms. |
|
|
(g) | Forward Foreign Currency Exchange Contracts–International Core Equity Fund, International Dividend Income Fund and International Opportunities Fund may enter into forward foreign currency exchange contracts in order to reduce their exposure to changes in foreign currency exchange rates on their foreign portfolio holdings or gain or reduce exposure to foreign currency for investment purposes. A forward foreign currency exchange contract is a commitment to purchase or sell a foreign currency at a future date at a negotiated rate. The contracts are valued daily at forward exchange rates and any unrealized gain (loss) is included in Net change in unrealized appreciation/depreciation on investments and translation of assets and liabilities denominated in foreign currencies on each Fund’s Statement of Operations. The gain (loss) arising from the difference between the U.S. dollar cost of the original contract and the value of the foreign currency in U.S. dollars upon closing of such contracts is included in Net realized gain (loss) on investments (net of foreign capital gains tax) and foreign currency related transactions on each Fund’s Statement of Operations. |
|
|
(h) | Repurchase Agreements–Each Fund may enter into repurchase agreements with respect to securities. A repurchase agreement is a transaction in which a fund acquires a security and |
122
Notes to Financial Statements (continued)
|
|
| simultaneously commits to resell that security to the seller (a bank or securities dealer) at an agreed-upon price on an agreed-upon date. Each Fund requires at all times that the repurchase agreement be collateralized by cash, or by securities of the U.S. Government, its agencies, its instrumentalities, or U.S. Government sponsored enterprises having a value equal to, or in excess of, the value of the repurchase agreement (including accrued interest). If the seller of the agreement defaults on its obligation to repurchase the underlying securities at a time when the fair value of these securities has declined, a Fund may incur a loss upon disposition of the securities. |
|
|
(i) | When-Issued or Forward Transactions–Each Fund may purchase portfolio securities on a when-issued or forward basis. When-issued or forward transactions involve a commitment by a Fund to purchase securities, with payment and delivery (“settlement”) to take place in the future, in order to secure what is considered to be an advantageous price or yield at the time of entering into the transaction. During the period between purchase and settlement, the fair value of the securities will fluctuate and assets consisting of cash and/or marketable securities (normally short-term U.S. Government or U.S. Government sponsored enterprise securities) marked to market daily in an amount sufficient to make payment at settlement will be segregated at each Fund’s custodian in order to pay for the commitment. At the time each Fund makes the commitment to purchase a security on a when-issued basis, it will record the transaction and reflect the liability for the purchase and fair value of the security in determining its NAV. Each Fund, generally, has the ability to close out a purchase obligation on or before the settlement date rather than take delivery of the security. Under no circumstances will settlement for such securities take place more than 120 days after the purchase date. |
|
|
(j) | Fair Value Measurements–Fair value is defined as the price that each Fund would receive upon selling an investment or transferring a liability in an orderly transaction to an independent buyer in the principal or most advantageous market of the investment. A three-tier hierarchy is used to maximize the use of observable market data and minimize the use of unobservable inputs and to establish classification of fair value measurements for disclosure purposes. Inputs refer broadly to the assumptions that market participants would use in pricing the asset or liability, including assumptions about risk—for example, the risk inherent in a particular valuation technique used to measure fair value (such as a pricing model) and/or the risk inherent in the inputs to the valuation technique. Inputs may be observable or unobservable. Observable inputs reflect the assumptions market participants would use in pricing the asset or liability. Observable inputs are based on market data obtained from sources independent of the reporting entity. Unobservable inputs reflect the reporting entity’s own assumptions about the assumptions market participants would use in pricing the asset or liability. Unobservable inputs are based on the best information available in the circumstances. The three-tier hierarchy of inputs is summarized in the three broad Levels listed below: |
|
|
|
• | Level 1 – | unadjusted quoted prices in active markets for identical investments; |
|
|
|
• | Level 2 – | other significant observable inputs (including quoted prices for similar investments, interest rates, prepayment speeds, credit risk, etc.); and |
|
|
|
• | Level 3 – | significant unobservable inputs (including each Fund’s own assumptions in determining the fair value of investments). |
|
|
|
Changes in valuation techniques may result in transfers into or out of an assigned level within the three-tier hierarachy. All transfers between different levels within the three-tier hierarchy are deemed to have occurred as of the beginning of the reporting period. The inputs or | ||
123
Notes to Financial Statements (continued)
|
|
| methodology used for valuing securities are not necessarily an indication of the risk associated with investing in those securities. |
The following is a summary of the inputs used as of October 31, 2012 in valuing each Fund’s investments carried at fair value:
|
|
|
|
|
|
|
|
|
|
|
|
|
|
|
|
|
|
|
|
|
|
|
|
|
|
|
|
| Alpha Strategy Fund |
|
| Fundamental Equity Fund |
| ||||||||||||||||||||
Investment Type* |
| Level 1 |
| Level 2 |
| Level 3 |
| Total |
|
| Level 1 |
| Level 2 |
| Level 3 |
| Total |
| ||||||||
Common Stocks |
| $ | — |
| $ | — |
| $ | — |
| $ | — |
|
| $ | 4,588,157 |
| $ | — |
| $ | — |
| $ | 4,588,157 |
|
Investments in |
|
|
|
|
|
|
|
|
|
|
|
|
|
|
|
|
|
|
|
|
|
|
|
|
|
|
Underlying Funds |
|
| 861,348 |
|
| — |
|
| — |
|
| 861,348 |
|
|
| — |
|
| — |
|
| — |
|
| — |
|
Repurchase Agreement |
|
| — |
|
| — |
|
| — |
|
| — |
|
|
| — |
|
| 53,331 |
|
| — |
|
| 53,331 |
|
Total |
| $ | 861,348 |
| $ | — |
| $ | — |
| $ | 861,348 |
|
| $ | 4,588,157 |
| $ | 53,331 |
| $ | — |
| $ | 4,641,488 |
|
|
|
|
|
|
|
|
|
|
|
|
|
|
|
|
|
|
|
|
|
|
|
|
|
|
|
|
|
| Growth Leaders Fund |
|
| International Core Equity Fund** |
| ||||||||||||||||||||
Investment Type* |
| Level 1 |
| Level 2 |
| Level 3 |
| Total |
|
| Level 1 |
| Level 2 |
| Level 3 |
| Total |
| ||||||||
Common Stocks |
| $ | 23,782 |
| $ | — |
| $ | — |
| $ | 23,782 |
|
| $ | 708,681 |
| $ | 7,361 | (1) | $ | — |
| $ | 716,042 |
|
Repurchase Agreement |
|
| — |
|
| — |
|
| — |
|
| — |
|
|
| — |
|
| 7,580 |
|
| — |
|
| 7,580 |
|
Total |
| $ | 23,782 |
| $ | — |
| $ | — |
| $ | 23,782 |
|
| $ | 708,681 |
| $ | 14,941 |
| $ | — |
| $ | 723,622 |
|
|
|
|
|
|
|
|
|
|
|
|
|
|
|
|
|
|
|
|
|
|
|
|
|
|
|
|
Other Financial Instruments |
|
|
|
|
|
|
|
|
|
|
|
|
|
|
|
|
|
|
|
|
|
|
| |||
Forward Foreign Currency Exchange Contracts |
|
|
|
|
|
|
|
|
|
|
|
|
|
|
|
|
| |||||||||
Assets |
| $ | — |
| $ | — |
| $ | — |
| $ | — |
|
| $ | — |
| $ | 3,300 |
| $ | — |
| $ | 3,300 |
|
Liabilities |
|
| — |
|
| — |
|
| — |
|
| — |
|
|
| — |
|
| (3,412 | ) |
| — |
|
| (3,412 | ) |
Total |
| $ | — |
| $ | — |
| $ | — |
| $ | — |
|
| $ | — |
| $ | (112 | ) | $ | — |
| $ | (112 | ) |
|
|
|
|
|
|
|
|
|
|
|
|
|
|
|
|
|
|
|
|
|
|
|
|
|
|
|
|
| International Dividend Income Fund** |
|
| International Opportunities Fund** |
| ||||||||||||||||||||
Investment Type* |
| Level 1 |
| Level 2 |
| Level 3 |
| Total |
|
| Level 1 |
| Level 2 |
| Level 3 |
| Total |
| ||||||||
Common Stocks |
| $ | 1,633,834 |
| $ | 19,867 | (2) | $ | — |
| $ | 1,653,701 |
|
| $ | 285,480 |
| $ | — |
| $ | — |
| $ | 285,480 |
|
Preferred Stocks |
|
| 27,424 |
|
| — |
|
| — |
|
| 27,424 |
|
|
| 4,344 |
|
| — |
|
| — |
|
| 4,344 |
|
Repurchase Agreement |
|
| — |
|
| 34,722 |
|
| — |
|
| 34,722 |
|
|
| — |
|
| 7,353 |
|
| — |
|
| 7,353 |
|
Total |
| $ | 1,661,258 |
| $ | 54,589 |
| $ | — |
| $ | 1,715,847 |
|
| $ | 289,824 |
| $ | 7,353 |
| $ | — |
| $ | 297,177 |
|
|
|
|
|
|
|
|
|
|
|
|
|
|
|
|
|
|
|
|
|
|
|
|
|
|
|
|
Other Financial Instruments |
|
|
|
|
|
|
|
|
|
|
|
|
|
|
|
|
|
|
|
|
|
|
| |||
Forward Foreign Currency Exchange Contracts |
|
|
|
|
|
|
|
|
|
|
|
|
|
|
|
|
| |||||||||
Assets |
| $ | — |
| $ | 13,768 |
| $ | — |
| $ | 13,768 |
|
| $ | — |
| $ | 1,097 |
| $ | — |
| $ | 1,097 |
|
Liabilities |
|
| — |
|
| (9,706 | ) |
| — |
|
| (9,706 | ) |
|
| — |
|
| (671 | ) |
| — |
|
| (671 | ) |
Total |
| $ | — |
| $ | 4,062 |
| $ | — |
| $ | 4,062 |
|
| $ | — |
| $ | 426 |
| $ | — |
| $ | 426 |
|
|
|
|
|
|
|
|
|
|
|
|
|
|
|
|
|
|
|
|
|
|
|
|
|
|
|
| |
|
|
| Value Opportunities Fund |
| |||||||||||||||||||||||
Investment Type* |
|
| Level 1 |
|
| Level 2 |
|
| Level 3 |
|
| Total |
| ||||||||||||||
Common Stocks |
| $ | 1,982,795 |
| $ | — |
| $ | — |
| $ | 1,982,795 |
| ||||||||||||||
Repurchase Agreement |
|
| — |
|
| 32,312 |
|
| — |
|
| 32,312 |
| ||||||||||||||
Total |
| $ | 1,982,795 |
| $ | 32,312 |
| $ | — |
| $ | 2,015,107 |
| ||||||||||||||
|
|
* | See Schedule of Investments for fair values in each industry or investment strategy of underlying Funds. |
** | See Schedule of Investments for fair value in each country. |
(1) | Globaltrans Investment plc (Russia) represents the Fund’s only Level 2 common stock as of October 31, 2012. |
(2) | L.P.N. Development pcl (Thailand) and Globaltrans Investment plc (Russia) represent the Fund’s only Level 2 common stocks as of October 31, 2012. |
124
Notes to Financial Statements (continued)
|
|
| As of October 31, 2011, International Core Equity Fund, International Dividend Income Fund and International Opportunities Fund utilized adjusted valuations of foreign securities (as described in Note 2(a)) to reflect their fair value as of the close of regular trading on the NYSE, which resulted in Level 2 inputs for certain foreign securities. As of October 31, 2012, the Fund utilized the last sale or official closing price on the exchange or system on which the foreign securities are principally traded, which resulted in Level 1 inputs for substantially all foreign securities. Accordingly, the valuations of substantially all foreign securities as of October 31, 2012 were categorized as Level 1 inputs. For the fiscal year ended October 31, 2012, the total transfers related to adjusted valuations for foreign securities were as follows: |
|
|
|
|
|
|
|
|
|
|
|
|
| International |
| International |
| International |
| |||
From Level 2 to Level 1: |
| $ | 423,862 |
| $ | 459,300 |
| $ | 163,947 |
|
|
|
(k) | Disclosures about Derivative Instruments and Hedging Activities–International Core Equity Fund, International Dividend Income Fund and International Opportunities Fund entered into forward foreign currency exchange contracts for the fiscal year ended October 31, 2012 (as described in note 2(g)). A forward foreign currency exchange contract reduces each Fund’s exposure to changes in the value of the currency it will deliver (or settle in cash) and increases its exposure to changes in the value of the currency it will receive (or settle in cash) for the duration of the contract. Each Fund’s use of forward foreign currency exchange contracts involves the risk that Lord Abbett will not accurately predict currency movements, and each Fund’s returns could be reduced as a result. Forward foreign currency exchange contracts are subject to the risk that those currencies will decline in value relative to the U.S. dollar, or, in the case of hedged positions, that the U.S. dollar will decline relative to the currency being hedged. Currency rates in foreign countries may fluctuate significantly over short periods of time. Each Fund’s risk of loss from counterparty credit risk is the unrealized appreciation on forward foreign currency exchange contracts. |
|
|
| As of October 31, 2012, International Core Equity Fund, International Dividend Income Fund and International Opportunities Fund had the following forward foreign currency exchange contracts: |
|
|
|
|
|
|
|
|
|
|
|
|
|
|
|
| Asset |
| Liability |
| ||
International Core Equity Fund |
|
|
|
| $ | 3,300,068 |
| $ | 3,411,628 |
|
International Dividend Income Fund |
|
|
|
|
| 13,768,024 |
|
| 9,705,867 |
|
International Opportunities Fund |
|
|
|
|
| 1,097,108 |
|
| 670,753 |
|
|
|
|
|
|
|
|
|
|
|
|
|
| Net Realized |
| Net Change in |
| Average |
| |||
International Core Equity Fund |
| $ | (4,309,295 | ) | $ | (118,116 | ) | $ | 239,863,117 |
|
International Dividend Income Fund |
|
| (9,458,968 | ) |
| 5,423,120 |
|
| 795,726,499 |
|
International Opportunities Fund |
|
| (1,284,054 | ) |
| 783,417 |
|
| 180,980,170 |
|
|
|
* | Calculated based on the notional amounts for the fiscal year ended October 31, 2012. |
(1) | Statements of Assets and Liabilities location: Unrealized appreciation on forward foreign currency exchange contracts. |
(2) | Statements of Assets and Liabilities location: Unrealized depreciation on forward foreign currency exchange contracts. |
(3) | Statements of Operations location: Net realized gain (loss) on investments (net of foreign capital gains tax) and foreign currency related transactions. |
(4) | Statements of Operations location: Net change in unrealized appreciation/depreciation on investments and translation of assets and liabilities denominated in foreign currencies. |
(5) | Amount represents notional amounts in U.S. dollars. |
125
|
|
|
Notes to Financial Statements (continued) | ||
| ||
3. | MANAGEMENT FEE AND OTHER TRANSACTIONS WITH AFFILIATES |
|
Management Fee
The Trust has a management agreement with Lord Abbett, pursuant to which Lord Abbett supplies each Fund with investment management services and executive and other personnel, provides office space and pays for ordinary and necessary office and clerical expenses relating to research and statistical work and supervision of each Fund’s investment portfolio.
For the fiscal year ended October 31, 2012, the effective management fee, net of any applicable waivers or reimbursements, was based on each Fund’s average daily net assets at the following annualized rates:
|
|
|
|
| Effective |
Alpha Strategy Fund |
| .00%(1) |
Fundamental Equity Fund |
| .52%(2) |
Growth Leaders Fund |
| .00%(3) |
International Core Equity Fund |
| .40%(4) |
International Dividend Income Fund |
| .49%(4) |
International Opportunities Fund |
| .75%(4) |
Value Opportunities Fund |
| .72%(4) |
|
|
(1) | The management fee for Alpha Strategy Fund is based on the Fund’s average daily net assets at an annual rate of .10%. For the fiscal year ended October 31, 2012 and continuing through February 28, 2013, Lord Abbett has contractually agreed to waive .05% of its management fee. For the fiscal year ended October 31, 2012, Lord Abbett voluntarily waived an additional .05% of its management fee. Lord Abbett may discontinue the voluntary reimbursement or change the level of its voluntary reimbursement at any time. |
(2) | The management fee for Fundamental Equity Fund is based on the Fund’s average daily net assets at the following annual rates: |
|
|
|
| First $200 million | .75% |
| Next $300 million | .65% |
| Over $500 million | .50% |
|
|
|
(3) | The management fee for Growth Leaders Fund is based on the Fund’s average daily net assets at the following annual rates: | |
|
|
|
| First $2 billion | .55% |
| Over $2 billion | .50% |
|
|
| |
(4) | The management fee for International Core Equity Fund, International Dividend Income Fund, International Opportunities Fund and Value Opportunities Fund is based on the average daily net assets at the following annual rates: | ||
|
|
|
| First $1 billion | .75% |
| Next $1 billion | .70% |
| Over $2 billion | .65% |
For the fiscal year ended October 31, 2012 and continuing through February 28, 2014, Lord Abbett contractually agreed to waive all or a portion of its management fee for Growth Leaders Fund and, if necessary, reimburse other expenses, to the extent necessary so that the total net annual operating expenses for each class, excluding 12b-1 fees, do not exceed an annualized rate of .50%.
For fiscal year ended October 31, 2012 and continuing through February 28, 2013, Lord Abbett contractually agreed to waive all or a portion of its management fee and, if necessary, reimburse other expenses, to the extent necessary so that the total net annual operating expenses for each class, excluding 12b-1 fees, do not exceed the following annual rates:
|
|
|
Fund |
| Rate |
International Core Equity Fund |
| .77% |
International Dividend Income Fund |
| .77% |
126
Notes to Financial Statements (continued)
For the annual period through February 29, 2012, Lord Abbett contractually agreed to waive all or a portion of its management fee and, if necessary, reimburse International Opportunities Fund’s other expenses to the extent necessary so that the total net annual operating expenses for each class, excluding 12b-1 fees, did not exceed an annual rate of 1.35%. Effective March 1, 2012, the contractual waiver for the Fund was discontinued.
All contractual management fee waiver and expense reimbursement agreements between the Funds and Lord Abbett may be terminated only upon the approval of the Board.
In addition, Lord Abbett provides certain administrative services to each Fund pursuant to an Administrative Services Agreement in return for a fee at an annual rate of .04% of each Fund’s average daily net assets. Alpha Strategy Fund does not pay such a fee.
Alpha Strategy Fund has entered into a Servicing Arrangement with the Underlying Funds in which it invests, pursuant to which each Underlying Fund will pay a portion of the expenses (excluding management fees and distribution and service fees) of Alpha Strategy Fund in proportion to the average daily value of total Underlying Fund shares owned by Alpha Strategy Fund. The expenses assumed by the Underlying Funds are reflected in Expenses assumed by Underlying Funds on Alpha Strategy Fund’s Statement of Operations and Receivables from affiliates on Alpha Strategy Fund’s Statement of Assets and Liabilities.
In addition, Fundamental Equity Fund, International Core Equity Fund, International Dividend Income Fund, International Opportunities Fund, and Value Opportunities Fund, along with certain other funds managed by Lord Abbett, have entered into a Servicing Arrangement with Alpha Strategy Fund, Lord Abbett Balanced Strategy Fund, Lord Abbett Diversified Equity Strategy Fund, Lord Abbett Diversified Income Strategy Fund, and Lord Abbett Growth & Income Strategy Fund of Lord Abbett Investment Trust, and Lord Abbett Global Allocation Fund of Lord Abbett Global Fund, Inc. (each, a “Fund of Funds”), pursuant to which each Underlying Fund pays a portion of the expenses (excluding management fees and distribution and service fees) of each Fund of Funds in proportion to the average daily value of the Underlying Fund shares owned by each Fund of Funds. Amounts paid pursuant to the Servicing Arrangement are included in Subsidy expense on each Fund’s Statement of Operations and Payable to affiliates on each Fund’s Statement of Assets and Liabilities.
As of October 31, 2012, the percentages of Fundamental Equity Fund’s, International Core Equity Fund’s, International Dividend Income Fund’s, International Opportunities Fund’s and Value Opportunities Fund’s outstanding shares owned by each Fund of Funds were as follows:
|
|
|
|
|
|
|
|
|
|
|
|
|
|
|
|
|
|
|
|
|
|
|
|
| Underlying Funds |
| |||||||
Fund of Funds |
| Fundamental |
| International |
| International |
| International |
| Value |
| |||||
Alpha Strategy Fund |
|
| — |
|
| — |
|
| — |
|
| 57.73 | % |
| 4.22 | % |
Balanced Strategy Fund |
|
| — |
|
| — |
|
| 12.26 | % |
| — |
|
| — |
|
Diversified Equity |
|
| .38 | % |
| 2.93 | % |
| — |
|
| 4.91 | % |
| .89 | % |
Diversified Income |
|
| — |
|
| — |
|
| 3.69 | % |
| — |
|
| — |
|
Global Allocation Fund |
|
| — |
|
| — |
|
| 4.21 | % |
| — |
|
| — |
|
Growth & Income |
|
| .17 | % |
| — |
|
| 8.98 | % |
| — |
|
| 1.65 | % |
127
Notes to Financial Statements (continued)
|
|
|
|
|
|
|
|
|
|
|
|
|
|
|
Fees* |
| Class A(1) |
| Class B(2) |
| Class C |
| Class F |
| Class P(3) |
| Class R2 |
| Class R3 |
Service |
| .25% |
| .25% |
| .25% |
| — |
| .25% |
| .25% |
| .25% |
Distribution |
| .10% |
| .75% |
| .75% |
| .10% |
| .20% |
| .35% |
| .25% |
|
|
* | The Funds may designate a portion of the aggregate fee as attributable to service activities for purposes of calculating Financial Industry Regulatory Authority, Inc. (“FINRA”) sales charge limitations. |
(1) | The Class A 12b-1 fee for Alpha Strategy Fund is .25% (.25% service, .00% distribution) of the Fund’s average daily net assets. |
(2) | Growth Leaders Fund did not offer Class B shares during the fiscal year. |
(3) | Fundamental Equity Fund, International Core Equity Fund, International Opportunities Fund and Value Opportunities Fund only. |
Class I shares do not have a distribution plan.
|
|
|
|
|
|
|
|
|
| Distributor |
| Dealers’ |
| ||
Alpha Strategy Fund |
| $ | 164,836 |
| $ | 926,778 |
|
Fundamental Equity Fund |
|
| 684,007 |
|
| 3,806,159 |
|
Growth Leaders Fund |
|
| 35,361 |
|
| 193,171 |
|
International Core Equity Fund |
|
| 119,155 |
|
| 634,949 |
|
International Dividend Income Fund |
|
| 673,566 |
|
| 3,641,503 |
|
International Opportunities Fund |
|
| 16,544 |
|
| 91,315 |
|
Value Opportunities Fund |
|
| 289,822 |
|
| 1,616,021 |
|
|
|
|
|
|
|
|
|
Distributor received the following amount of CDSCs for the fiscal year ended October 31, 2012:
|
|
|
|
|
|
|
|
|
| Class A |
| Class C |
| ||
Alpha Strategy Fund |
| $ | 1,240 |
|
| $18,039 |
|
Fundamental Equity Fund |
|
| 19,993 |
|
| 94,555 |
|
Growth Leaders Fund |
|
| 1,484 |
|
| 85 |
|
International Core Equity Fund |
|
| 999 |
|
| 3,680 |
|
International Dividend Income Fund |
|
| 1,077 |
|
| 9,975 |
|
International Opportunities Fund |
|
| 757 |
|
| 1,293 |
|
Value Opportunities Fund |
|
| 9,989 |
|
| 64,190 |
|
|
|
|
Two Trustees and certain of the Trust’s officers have an interest in Lord Abbett. | ||
| ||
4. | DISTRIBUTIONS AND CAPITAL LOSS CARRYFORWARDS |
|
Dividends from net investment income, if any, are declared and paid quarterly for International Dividend Income Fund and annually for Alpha Strategy Fund, Fundamental Equity Fund, Growth Leaders Fund, International Core Equity Fund, International Opportunities Fund and Value Opportunities Fund. Taxable net realized gains from investment transactions, reduced by allowable capital loss carryforwards, if any, are declared and distributed to shareholders at least annually. The capital loss carryforward amount, if any, is available to offset future net capital gains. Dividends and distributions to shareholders are recorded on the ex-dividend date. The amounts of dividends and
128
Notes to Financial Statements (continued)
distributions from net investment income and net realized capital gains are determined in accordance with federal income tax regulations, which may differ from accounting principles generally accepted in the United States of America. These book/tax differences are either considered temporary or permanent in nature. To the extent these differences are permanent in nature, such amounts are reclassified within the components of net assets based on their federal tax basis treatment; temporary differences do not require reclassification. Dividends and distributions, which exceed earnings and profits for tax purposes, are reported as a tax return of capital.
Subsequent to the Funds’ fiscal year ended October 31, 2012, distributions were declared on November 16, 2012 and paid on November 20, 2012 to shareholders of record on November 19, 2012. The approximate amounts were as follows:
|
|
|
|
|
|
|
|
|
| Net Investment |
| Net Long-Term |
| ||
Fundamental Equity Fund |
| $ | 28,885,000 |
| $ | 53,172,000 |
|
Growth Leaders Fund |
|
| 36,000 |
|
| — |
|
Subsequent to the Funds’ fiscal year ended October 31, 2012, distributions were declared on December 12, 2012 and paid on December 18, 2012 to shareholders of record on December 17, 2012. The approximate amounts were as follows:
|
|
|
|
|
|
|
|
|
|
|
|
|
|
|
|
|
|
|
| Net Investment |
| ||
International Core Equity Fund |
|
|
|
| $ | 17,152,000 |
|
International Dividend Income Fund |
|
|
|
|
| 3,253,000 |
|
International Opportunities Fund |
|
|
|
|
| 6,064,000 |
|
Subsequent to the Funds’ fiscal year ended October 31, 2012, distributions were declared on December 12, 2012 and paid on December 20, 2012 to shareholders of record on December 19, 2012. The approximate amounts were as follows:
|
|
|
|
|
|
|
|
|
| Net Investment |
| Net Long-Term |
| ||
Alpha Strategy Fund |
| $ | 1,232,000 |
| $ | 36,731,000 |
|
The tax character of distributions paid during the fiscal years ended October 31, 2012 and 2011 were as follows:
|
|
|
|
|
|
|
|
|
|
|
|
|
|
|
| Alpha Strategy Fund |
| Fundamental Equity Fund |
| ||||||||
|
| Year Ended |
| Year Ended |
| Year Ended |
| Year Ended |
| ||||
Distributions paid from: |
|
|
|
|
|
|
|
|
|
|
|
|
|
Ordinary income |
| $ | — |
| $ | — |
| $ | 8,731,966 |
| $ | 7,992,067 |
|
Net long-term capital gains |
|
| 2,851,136 |
|
| — |
|
| 96,046,077 |
|
| 739,695 |
|
Total distributions paid |
| $ | 2,851,136 |
| $ | — |
| $ | 104,778,043 |
| $ | 8,731,762 |
|
|
|
|
|
|
|
|
|
|
|
|
|
|
|
|
| Growth Leaders Fund |
| International Core Equity Fund |
| ||||||||
|
| Year Ended |
| Period Ended |
| Year Ended |
| Year Ended |
| ||||
Distributions paid from: |
|
|
|
|
|
|
|
|
|
|
|
|
|
Ordinary income |
| $ | 5,968 |
| $ | — |
| $ | 16,446,351 |
| $ | 11,340,322 |
|
Total distributions paid |
| $ | 5,968 |
| $ | — |
| $ | 16,446,351 |
| $ | 11,340,322 |
|
129
Notes to Financial Statements (continued)
|
|
|
|
|
|
|
|
|
|
|
|
|
|
|
| International Dividend Income Fund |
| International Opportunities Fund |
| ||||||||
|
| Year Ended |
| Year Ended |
| Year Ended |
| Year Ended |
| ||||
Distributions paid from: |
|
|
|
|
|
|
|
|
|
|
|
|
|
Ordinary income |
| $ | 67,866,479 |
| $ | 29,648,003 |
| $ | 2,944,502 |
| $ | 2,108,439 |
|
Total distributions paid |
| $ | 67,866,479 |
| $ | 29,648,003 |
| $ | 2,944,502 |
| $ | 2,108,439 |
|
|
|
|
|
|
|
|
|
|
|
|
|
|
|
|
| Value Opportunities Fund |
|
|
|
|
|
|
| ||||
|
|
|
|
|
|
| |||||||
|
| Year Ended |
| Year Ended |
|
|
|
|
|
|
| ||
|
|
|
|
|
|
| |||||||
Distributions paid from: |
|
|
|
|
|
|
|
|
|
|
|
|
|
Net long-term capital gains |
| $ | 7,161,018 |
| $ | 6,027,534 |
|
|
|
|
|
|
|
|
|
|
|
|
|
| |||||||
Total distributions paid |
| $ | 7,161,018 |
| $ | 6,027,534 |
|
|
|
|
|
|
|
|
|
|
|
|
|
| |||||||
|
|
* | For the period June 24, 2011 (commencement of operations) through October 31, 2011. |
|
|
As of October 31, 2012, the components of accumulated gains (losses) on a tax-basis were as follows: | |
|
|
|
|
|
|
|
|
|
| Alpha |
| Fundamental |
| ||
Undistributed ordinary income-net |
| $ | 1,213,824 |
| $ | 20,188,440 |
|
Undistributed long-term capital gains |
|
| 36,728,952 |
|
| 53,166,049 |
|
Total undistributed earnings |
| $ | 37,942,776 |
| $ | 73,354,489 |
|
Capital loss carryforwards* |
|
| — |
|
| (5,123,220 | ) |
Temporary differences |
|
| (3,311,842 | ) |
| (586,056 | ) |
Unrealized gains-net |
|
| 96,158,860 |
|
| 540,454,192 |
|
Total accumulated gains-net |
| $ | 130,789,794 |
| $ | 608,099,405 |
|
|
|
|
|
|
|
|
|
|
| Growth |
| International |
| ||
Undistributed ordinary income-net |
| $ | 18,552 |
| $ | 17,150,657 |
|
Total undistributed earnings |
| $ | 18,552 |
| $ | 17,150,657 |
|
Capital loss carryforwards* |
|
| — |
|
| (344,055,879 | ) |
Temporary differences |
|
| — |
|
| (129,577 | ) |
Unrealized gains (losses)-net |
|
| (304,278 | ) |
| 37,032,663 |
|
Total accumulated losses-net |
| $ | (285,726 | ) | $ | (290,002,136 | ) |
|
|
|
|
|
|
|
|
|
| International |
| International |
| ||
Undistributed ordinary income-net |
| $ | 3,237,545 |
| $ | 5,613,678 |
|
Total undistributed earnings |
| $ | 3,237,545 |
| $ | 5,613,678 |
|
Capital loss carryforwards* |
|
| (113,824,711 | ) |
| (59,542,093 | ) |
Temporary differences |
|
| (36,375 | ) |
| (52,415 | ) |
Unrealized gains-net |
|
| 75,442,210 |
|
| 11,219,149 |
|
Total accumulated |
| $ | (35,181,331 | ) | $ | (42,761,681 | ) |
130
Notes to Financial Statements (continued)
|
|
|
|
|
|
| Value Opportunities Fund |
| |
Capital loss carryforwards* |
| $ | (5,885,399 | ) |
Temporary differences |
|
| (3,923,259 | ) |
Unrealized gains-net |
|
| 271,434,396 |
|
Total accumulated gains-net |
| $ | 261,625,738 |
|
|
|
* | As of October 31, 2012, the capital loss carryforwards, along with the related expiration dates, were as follows: |
|
|
|
|
|
|
|
|
|
|
|
|
|
|
|
| 2016 |
| 2017 |
| Indefinite |
| Total |
| ||||
Fundamental Equity Fund |
| $ | 5,123,220 |
| $ | — |
| $ | — |
| $ | 5,123,220 |
|
International Core Equity Fund |
|
| 101,070,389 |
|
| 232,452,344 |
|
| 10,533,146 |
|
| 344,055,879 |
|
International Dividend Income Fund |
|
| 7,593,041 |
|
| 13,669,537 |
|
| 92,562,133 |
|
| 113,824,711 |
|
International Opportunities Fund |
|
| — |
|
| 59,542,093 |
|
| — |
|
| 59,542,093 |
|
Value Opportunities Fund |
|
| — |
|
| — |
|
| 5,885,399 |
|
| 5,885,399 |
|
As of June 15, 2012 (the date Fundamental Equity Fund acquired the net assets of Large Cap Value Fund), the cumulative allowable capital loss carryforwards of Large Cap Value Fund transferred into Fundamental Equity Fund were $5,607,470. These amounts are subject to IRC annual limitations.
In accordance with the Regulated Investment Company Modernization Act of 2010, each Fund will carryforward capital losses incurred in taxable years beginning after December 22, 2010 (“post-enactment losses”) indefinitely. Post-enactment losses will also retain their character as either short-term or long-term and be utilized before any pre-enactment losses.
At each Fund’s election, certain losses incurred within the taxable year (Qualified Late-Year Losses) are deemed to arise on the first business day of the Fund’s next taxable year. The following Funds incurred and will elect to defer late-year ordinary losses during fiscal 2012 as follows:
|
|
|
|
|
|
| Alpha Strategy Fund |
| $ | 3,235,762 |
|
| Value Opportunities Fund |
|
| 3,851,418 |
|
As of October 31, 2012, the aggregate unrealized security gains and losses based on cost for U.S. federal income tax purposes were as follows:
|
|
|
|
|
|
|
|
|
|
|
|
| Alpha |
| Fundamental |
| Growth |
| |||
Tax cost |
| $ | 765,189,557 |
| $ | 4,101,034,088 |
| $ | 24,086,220 |
|
Gross unrealized gain |
|
| 96,158,860 |
|
| 617,805,390 |
|
| 186,835 |
|
Gross unrealized loss |
|
| — |
|
| (77,351,198 | ) |
| (491,113 | ) |
Net unrealized security gain (loss) |
| $ | 96,158,860 |
| $ | 540,454,192 |
| $ | (304,278 | ) |
|
|
|
|
|
|
|
|
|
|
|
|
|
|
|
|
|
|
|
|
|
|
|
| International Core |
| International |
| International |
| |||
Tax cost |
| $ | 686,547,061 |
| $ | 1,640,071,341 |
| $ | 285,819,560 |
|
Gross unrealized gain |
|
| 69,111,554 |
|
| 123,101,211 |
|
| 27,797,737 |
|
Gross unrealized loss |
|
| (32,036,340 | ) |
| (47,325,401 | ) |
| (16,440,637 | ) |
Net unrealized security gain |
| $ | 37,075,214 |
| $ | 75,775,810 |
| $ | 11,357,100 |
|
131
Notes to Financial Statements (continued)
|
|
|
|
|
|
| Value |
| |
Tax cost |
| $ | 1,743,672,666 |
|
Gross unrealized gain |
|
| 338,582,890 |
|
Gross unrealized loss |
|
| (67,148,494 | ) |
Net unrealized security gain |
| $ | 271,434,396 |
|
The difference between book-basis and tax-basis unrealized gains (losses) is attributable to the tax treatment of certain securities and wash sales.
Permanent items identified during the fiscal year ended October 31, 2012 have been reclassified among the components of net assets based on their tax basis treatment as follows:
|
|
|
|
|
|
|
|
|
|
|
|
| Undistributed |
| Accumulated Net |
| Paid-in Capital |
| |||
Fundamental Equity Fund |
| $ | (520,861 | ) | $ | 9,297,277 |
| $ | (8,776,416 | ) |
Growth Leaders |
|
| 13,791 |
|
| (80,172 | ) |
| 66,381 |
|
International Core Equity Fund |
|
| 701,693 |
|
| (701,693 | ) |
| — |
|
International Dividend Income Fund |
|
| 682,928 |
|
| (682,928 | ) |
| — |
|
International Opportunities Fund |
|
| 1,020,156 |
|
| (1,020,156 | ) |
| — |
|
Value Opportunities Fund |
|
| (702,574 | ) |
| 708,616 |
|
| (6,042 | ) |
The permanent differences are attributable to the tax treatment of capital loss carryforwards, net investment losses, certain distributions, certain expenses, foreign currency transactions and certain securities.
|
|
|
5. | PORTFOLIO SECURITIES TRANSACTIONS |
|
Purchases and sales of investment securities (excluding short-term investments) for the fiscal year ended October 31, 2012 were as follows:
|
|
|
|
|
|
|
|
|
| Purchases |
| Sales |
| ||
Alpha Strategy Fund |
| $ | 33,955,716 |
| $ | 106,986,976 |
|
Fundamental Equity Fund |
|
| 3,911,384,002 |
|
| 3,958,667,637 |
|
Growth Leaders Fund |
|
| 145,459,481 |
|
| 137,337,650 |
|
International Core Equity Fund |
|
| 589,338,017 |
|
| 736,410,865 |
|
International Dividend Income Fund |
|
| 1,930,740,106 |
|
| 1,117,874,515 |
|
International Opportunities Fund |
|
| 271,107,544 |
|
| 323,778,791 |
|
Value Opportunities Fund |
|
| 1,229,936,037 |
|
| 1,200,069,917 |
|
There were no purchases or sales of U.S. Government securities for the fiscal year ended October 31, 2012.
|
|
|
6. | TRUSTEES’ REMUNERATION |
|
The Trust’s officers and the two Trustees who are associated with Lord Abbett do not receive any compensation from the Trust for serving in such capacities. Independent Trustees’ fees are allocated among all Lord Abbett-sponsored funds based on the net assets of each fund. There is an equity-based plan available to all Independent Trustees under which Independent Trustees must defer receipt of a portion of, and may elect to defer receipt of an additional portion of Trustees’ fees. The deferred amounts are treated as though equivalent dollar amounts had been invested in
132
Notes to Financial Statements (continued)
the funds. Such amounts and earnings accrued thereon are included in Trustees’ fees on the Statements of Operations and in Trustees’ fees payable on the Statements of Assets and Liabilities and are not deductible for U.S. federal income tax purposes until such amounts are paid.
|
|
|
7. | EXPENSE REDUCTIONS |
|
The Trust has entered into an arrangement with its transfer agent and custodian, whereby credits realized as a result of uninvested cash balances are used to reduce a portion of each Fund’s expenses.
|
|
|
8. | LINE OF CREDIT |
|
On April 2, 2012, the Funds (except for Alpha Strategy Fund) and certain other funds managed by Lord Abbett (the “participating funds”) entered into an unsecured revolving credit facility (“Facility”) with State Street Bank and Trust Company (“SSB”), to be used for temporary or emergency purposes as an additional source of liquidity to fund redemptions of investor shares. The Facility is renewed annually under terms that depend on market conditions at the time of the renewal. The amounts available under the Facility are (i) the lesser of either $250,000,000 or 33.33% of total assets per participating fund and (ii) $350,000,000 in the aggregate for all participating funds. The annual fee to maintain the Facility is .09% of the amount available under the Facility. Each participating fund pays its pro rata share based on the net assets of each participating fund. This amount is included in Other expenses on the Funds’ Statements of Operations. Any borrowings under this Facility will bear interest at current market rates as set forth in the credit agreement. As of October 31, 2012, there were no loans outstanding pursuant to this Facility, nor was the Facility utilized at any time during the fiscal year ended October 31, 2012.
For the period February 3, 2011 through April 1, 2012, the Funds (except for Alpha Strategy Fund) and certain other funds managed by Lord Abbett had an amount of $200,000,000 available under a Facility from SSB with an annual fee to maintain the Facility of .125% of the amount available under the Facility.
|
|
|
9. | CUSTODIAN AND ACCOUNTING AGENT |
|
SSB is the Trust’s custodian and accounting agent. SSB performs custodial, accounting and recordkeeping functions relating to portfolio transactions and calculating each Fund’s NAV.
|
|
|
10. | TRANSACTIONS WITH AFFILIATED ISSUERS |
|
An affiliated issuer is one in which a Fund has ownership of at least 5% of the outstanding voting securities of the underlying issuer at any point during the fiscal year or any company which is under common ownership or control. Alpha Strategy Fund had the following transactions with affiliated issuers (i.e. the Underlying Funds) during the fiscal year ended October 31, 2012:
133
Notes to Financial Statements (continued)
|
|
|
|
|
|
|
|
|
|
|
|
|
|
|
|
|
|
|
Affiliated Issuer |
| Balance of |
| Gross |
| Gross |
| Balance of |
| Fair |
| Net Realized |
| Dividend |
| |||
Lord Abbett Developing |
| 7,815,831 |
| 479,603 |
| (990,932 | ) | 7,304,502 |
| $ | 168,734,007 |
| $ | 14,264,392 | (a) | $ | — |
|
Lord Abbett Securities |
| 13,700,286 |
| 600,507 |
| (1,258,948 | ) | 13,041,845 |
|
| 175,934,486 |
|
| 2,191,991 |
|
| 1,835,422 |
|
Lord Abbett Securities |
| 5,359,440 |
| 1,113,764 |
| (701,295 | ) | 5,771,909 |
|
| 84,500,742 |
|
| 13,259,268 | (b) |
| — |
|
Lord Abbett Securities |
| 3,703,927 |
| — |
| (467,457 | ) | 3,236,470 |
|
| 88,420,363 |
|
| (1,008,028 | ) |
| — |
|
Lord Abbett Equity |
| 5,798,678 |
| 81,595 |
| (746,178 | ) | 5,134,095 |
|
| 85,739,392 |
|
| (2,365,689 | ) |
| — |
|
Lord Abbett Research |
| 5,789,070 |
| 12,369 |
| (731,278 | ) | 5,070,161 |
|
| 171,726,338 |
|
| 9,836,495 |
|
| — |
|
Lord Abbett Securities |
| 5,872,414 |
| 22,513 |
| (578,039 | ) | 5,316,888 |
|
| 86,293,089 |
|
| 1,134,341 | (c) |
| — |
|
|
|
|
|
|
|
|
|
|
| $ | 861,348,417 |
| $ | 37,312,770 |
| $ | 1,835,422 |
|
|
|
|
(a) | Includes $9,803,096 of distributed capital gains. | |
(b) | Includes $13,193,334 of distributed capital gains. | |
(c) | Includes $328,019 of distributed capital gains. | |
|
| |
11. | INVESTMENT RISKS |
|
Each Fund is subject to the general risks and considerations associated with equity investing. The value of an investment will fluctuate in response to movements in the equity securities markets in general and to the changing prospects of individual companies in which the Funds invest. If a Fund’s assessment of a company’s value or prospects for exceeding earnings expectations or market conditions is wrong, the Fund could suffer losses or produce poor performance relative to other funds, even in a rising market.
Large company stocks, in which Fundamental Equity Fund and Growth Leaders Fund invest, may perform differently than the market as a whole and other types of stocks, such as small company stocks. Small and mid-sized company stocks, in which Fundamental Equity Fund, Growth Leaders Fund, and Value Opportunities Fund invest, may be less able to weather economic shifts or other adverse developments than those of larger, more established companies.
In general, Growth Leaders Fund employs a growth investing style and Fundamental Equity Fund, International Dividend Income Fund and Value Opportunities Fund employ a value investing style. Growth stocks generally are more volatile than value stocks. The price of value stocks may lag the market for long periods of time.
134
Notes to Financial Statements (continued)
International Core Equity Fund is subject to the risks of investing in foreign securities, the securities of large foreign companies, and derivatives. Foreign securities may pose greater risks than domestic securities, including greater price fluctuations and higher transaction costs. Foreign investments also may be affected by changes in currency rates or currency controls.
International Dividend Income Fund is subject to the risks of investing in foreign securities, dividend yielding stocks, and derivatives. Foreign securities may pose greater risks than domestic securities, including price fluctuations and higher transaction costs. These risks are generally greater for securities issued by companies in emerging market companies. Dividend paying stocks may be sensitive to changes in market interest rates, and the prices of such stocks may decline as rates rise. International Dividend Income Fund may be subject to the volatility of stocks that have high dividends per share due to recent decreases in their share prices. International Dividend Income Fund may invest a significant portion of its assets in small and mid-sized companies that may be less able to weather economic shifts or other adverse developments than larger, more established companies.
International Opportunities Fund is subject to the risks of investing in foreign securities, the securities of small-cap companies, and derivatives. Foreign securities may pose greater risks than domestic securities, including greater price fluctuations and higher transaction costs. Foreign investments also may be affected by changes in currency rates or currency controls. Investing in small-cap companies generally involves greater risks than investing in the stocks of large-cap companies, including more volatility and less liquidity.
Alpha Strategy Fund’s investments are concentrated in the Underlying Funds and, as a result, the Fund’s performance is directly related to their performance and subject to their risks, including those associated with foreign investments, small-cap companies, and derivatives.
Due to their investments in multinational and foreign companies, Fundamental Equity Fund, Growth Leaders Fund, Value Opportunities Fund, and Alpha Strategy Fund may experience increased market, liquidity, currency, political, information and other risks.
Each Fund is subject to the risks associated with derivatives, which may be different from and greater than the risks associated with investing directly in securities and other investments.
These factors can affect each Fund’s performance.
135
Notes to Financial Statements (continued)
|
|
|
12. | SUMMARY OF CAPITAL TRANSACTIONS |
|
Transactions in shares of beneficial interest were as follows:
|
|
|
|
|
|
|
|
|
|
|
|
|
|
Alpha Strategy Fund |
| Year Ended |
| Year Ended |
| ||||||||
| |||||||||||||
Class A Shares |
| Shares |
| Amount |
| Shares |
| Amount |
| ||||
| |||||||||||||
Shares sold |
|
| 2,744,394 |
| $ | 65,776,411 |
|
| 6,640,241 |
| $ | 159,946,305 |
|
Converted from Class B* |
|
| 98,618 |
|
| 2,352,294 |
|
| 102,248 |
|
| 2,504,396 |
|
Reinvestment of distributions |
|
| 52,615 |
|
| 1,177,003 |
|
| — |
|
| — |
|
Shares reacquired |
|
| (4,862,332 | ) |
| (114,861,666 | ) |
| (6,159,141 | ) |
| (145,994,284 | ) |
| |||||||||||||
Increase (decrease) |
|
| (1,966,705 | ) | $ | (45,555,958 | ) |
| 583,348 |
| $ | 16,456,417 |
|
| |||||||||||||
|
|
|
|
|
|
|
|
|
|
|
|
|
|
Class B Shares |
|
|
|
|
|
|
|
|
|
|
|
|
|
| |||||||||||||
Shares sold |
|
| 26,108 |
| $ | 595,005 |
|
| 54,091 |
| $ | 1,232,992 |
|
Reinvestment of distributions |
|
| 3,822 |
|
| 80,274 |
|
| — |
|
| — |
|
Shares reacquired |
|
| (238,199 | ) |
| (5,402,978 | ) |
| (295,959 | ) |
| (6,641,009 | ) |
Converted to Class A* |
|
| (105,294 | ) |
| (2,352,294 | ) |
| (108,324 | ) |
| (2,504,396 | ) |
| |||||||||||||
Decrease |
|
| (313,563 | ) | $ | (7,079,993 | ) |
| (350,192 | ) | $ | (7,912,413 | ) |
| |||||||||||||
|
|
|
|
|
|
|
|
|
|
|
|
|
|
Class C Shares |
|
|
|
|
|
|
|
|
|
|
|
|
|
| |||||||||||||
Shares sold |
|
| 1,240,736 |
| $ | 27,780,678 |
|
| 2,626,226 |
| $ | 59,639,136 |
|
Reinvestment of distributions |
|
| 26,850 |
|
| 559,832 |
|
| — |
|
| — |
|
Shares reacquired |
|
| (2,045,175 | ) |
| (45,478,583 | ) |
| (2,190,655 | ) |
| (48,656,526 | ) |
| |||||||||||||
Increase (decrease) |
|
| (777,589 | ) | $ | (17,138,073 | ) |
| 435,571 |
| $ | 10,982,610 |
|
| |||||||||||||
|
|
|
|
|
|
|
|
|
|
|
|
|
|
Class F Shares |
|
|
|
|
|
|
|
|
|
|
|
|
|
| |||||||||||||
Shares sold |
|
| 2,147,676 |
| $ | 50,410,369 |
|
| 3,732,518 |
| $ | 89,435,955 |
|
Reinvestment of distributions |
|
| 14,535 |
|
| 325,435 |
|
| — |
|
| — |
|
Shares reacquired |
|
| (2,725,631 | ) |
| (65,356,755 | ) |
| (2,973,729 | ) |
| (70,809,906 | ) |
| |||||||||||||
Increase (decrease) |
|
| (563,420 | ) | $ | (14,620,951 | ) |
| 758,789 |
| $ | 18,626,049 |
|
| |||||||||||||
|
|
|
|
|
|
|
|
|
|
|
|
|
|
Class I Shares |
|
|
|
|
|
|
|
|
|
|
|
|
|
| |||||||||||||
Shares sold |
|
| 172,714 |
| $ | 4,159,050 |
|
| 549,071 |
| $ | 13,510,835 |
|
Reinvestment of distributions |
|
| 2,583 |
|
| 58,300 |
|
| — |
|
| — |
|
Shares reacquired |
|
| (601,810 | ) |
| (14,841,437 | ) |
| (527,852 | ) |
| (13,290,638 | ) |
| |||||||||||||
Increase (decrease) |
|
| (426,513 | ) | $ | (10,624,087 | ) |
| 21,219 |
| $ | 220,197 |
|
| |||||||||||||
|
|
|
|
|
|
|
|
|
|
|
|
|
|
Class R2 Shares |
|
|
|
|
|
|
|
|
|
|
|
|
|
| |||||||||||||
Shares sold |
|
| 56,946 |
| $ | 1,352,217 |
|
| 70,443 |
| $ | 1,636,829 |
|
Reinvestment of distributions |
|
| 69 |
|
| 1,514 |
|
| — |
|
| — |
|
Shares reacquired |
|
| (84,622 | ) |
| (2,041,694 | ) |
| (78,320 | ) |
| (1,953,815 | ) |
| |||||||||||||
Decrease |
|
| (27,607 | ) | $ | (687,963 | ) |
| (7,877 | ) | $ | (316,986 | ) |
| |||||||||||||
|
|
|
|
|
|
|
|
|
|
|
|
|
|
Class R3 Shares |
|
|
|
|
|
|
|
|
|
|
|
|
|
| |||||||||||||
Shares sold |
|
| 436,089 |
| $ | 10,302,836 |
|
| 607,348 |
| $ | 14,384,718 |
|
Reinvestment of distributions |
|
| 3,977 |
|
| 88,040 |
|
| — |
|
| — |
|
Shares reacquired |
|
| (421,261 | ) |
| (9,977,820 | ) |
| (464,862 | ) |
| (11,200,200 | ) |
| |||||||||||||
Increase |
|
| 18,805 |
| $ | 413,056 |
|
| 142,486 |
| $ | 3,184,518 |
|
| |||||||||||||
136
Notes to Financial Statements (continued)
|
|
|
|
|
|
|
|
|
|
|
|
|
|
Fundamental Equity Fund |
| Year Ended |
| Year Ended |
| ||||||||
| |||||||||||||
Class A Shares |
|
| Shares |
|
| Amount |
|
| Shares |
|
| Amount |
|
| |||||||||||||
Shares sold |
|
| 39,985,762 |
| $ | 506,102,792 |
|
| 80,101,819 |
| $ | 1,038,519,597 |
|
Converted from Class B* |
|
| 2,454,435 |
|
| 31,130,048 |
|
| 1,429,972 |
|
| 18,358,256 |
|
Reinvestment of distributions |
|
| 4,400,057 |
|
| 50,688,649 |
|
| 431,589 |
|
| 5,179,024 |
|
Shares reacquired |
|
| (52,610,694 | ) |
| (667,045,386 | ) |
| (47,379,706 | ) |
| (601,962,789 | ) |
Shares issued in reorganization |
|
| 2,156,271 |
|
| 26,522,140 |
|
| — |
|
| — |
|
| |||||||||||||
Increase (decrease) |
|
| (3,614,169 | ) | $ | (52,601,757 | ) |
| 34,583,674 |
| $ | 460,094,088 |
|
| |||||||||||||
|
|
|
|
|
|
|
|
|
|
|
|
|
|
Class B Shares |
|
|
|
|
|
|
|
|
|
|
|
|
|
| |||||||||||||
Shares sold |
|
| 259,123 |
| $ | 3,094,646 |
|
| 467,149 |
| $ | 5,797,056 |
|
Reinvestment of distributions |
|
| 210,371 |
|
| 2,303,564 |
|
| — |
|
| — |
|
Shares reacquired |
|
| (1,491,769 | ) |
| (18,070,978 | ) |
| (2,479,322 | ) |
| (30,525,253 | ) |
Converted to Class A* |
|
| (2,588,385 | ) |
| (31,130,048 | ) |
| (1,500,727 | ) |
| (18,358,256 | ) |
Shares issued in reorganization |
|
| 135,760 |
|
| 1,581,601 |
|
| — |
|
| — |
|
| |||||||||||||
Decrease |
|
| (3,474,900 | ) | $ | (42,221,215 | ) |
| (3,512,900 | ) | $ | (43,086,453 | ) |
| |||||||||||||
|
|
|
|
|
|
|
|
|
|
|
|
|
|
Class C Shares |
|
|
|
|
|
|
|
|
|
|
|
|
|
| |||||||||||||
Shares sold |
|
| 9,592,080 |
| $ | 115,153,465 |
|
| 26,481,110 |
| $ | 330,738,446 |
|
Reinvestment of distributions |
|
| 1,197,637 |
|
| 13,066,217 |
|
| — |
|
| — |
|
Shares reacquired |
|
| (15,179,762 | ) |
| (183,197,750 | ) |
| (10,881,312 | ) |
| (131,285,633 | ) |
Shares issued in reorganization |
|
| 536,052 |
|
| 6,223,563 |
|
| — |
|
| — |
|
| |||||||||||||
Increase (decrease) |
|
| (3,853,993 | ) | $ | (48,754,505 | ) |
| 15,599,798 |
| $ | 199,452,813 |
|
| |||||||||||||
|
|
|
|
|
|
|
|
|
|
|
|
|
|
Class F Shares |
|
|
|
|
|
|
|
|
|
|
|
|
|
| |||||||||||||
Shares sold |
|
| 22,401,344 |
| $ | 279,779,635 |
|
| 47,488,655 |
| $ | 613,663,776 |
|
Reinvestment of distributions |
|
| 1,049,284 |
|
| 12,014,305 |
|
| 113,052 |
|
| 1,349,838 |
|
Shares reacquired |
|
| (29,070,202 | ) |
| (369,441,214 | ) |
| (19,856,321 | ) |
| (244,823,681 | ) |
Shares issued in reorganization |
|
| 37,059 |
|
| 453,972 |
|
| — |
|
| — |
|
| |||||||||||||
Increase (decrease) |
|
| (5,582,515 | ) | $ | (77,193,302 | ) |
| 27,745,386 |
| $ | 370,189,933 |
|
| |||||||||||||
|
|
|
|
|
|
|
|
|
|
|
|
|
|
Class I Shares |
|
|
|
|
|
|
|
|
|
|
|
|
|
| |||||||||||||
Shares sold |
|
| 17,857,696 |
| $ | 224,988,551 |
|
| 15,499,795 |
| $ | 201,042,105 |
|
Reinvestment of distributions |
|
| 526,879 |
|
| 6,085,451 |
|
| 85,242 |
|
| 1,026,317 |
|
Shares reacquired |
|
| (8,203,133 | ) |
| (107,105,769 | ) |
| (9,643,350 | ) |
| (117,946,920 | ) |
Shares issued in reorganization |
|
| 342,949 |
|
| 4,238,850 |
|
| — |
|
| — |
|
| |||||||||||||
Increase |
|
| 10,524,391 |
| $ | 128,207,083 |
|
| 5,941,687 |
| $ | 84,121,502 |
|
| |||||||||||||
|
|
|
|
|
|
|
|
|
|
|
|
|
|
Class P Shares |
|
|
|
|
|
|
|
|
|
|
|
|
|
| |||||||||||||
Shares sold |
|
| 424,212 |
| $ | 5,277,811 |
|
| 701,531 |
| $ | 8,975,649 |
|
Reinvestment of distributions |
|
| 59,153 |
|
| 673,752 |
|
| 5,136 |
|
| 60,973 |
|
Shares reacquired |
|
| (848,069 | ) |
| (10,726,453 | ) |
| (784,591 | ) |
| (10,161,435 | ) |
Shares issued in reorganization |
|
| 1,089 |
|
| 13,238 |
|
| — |
|
| — |
|
| |||||||||||||
Decrease |
|
| (363,615 | ) | $ | (4,761,652 | ) |
| (77,924 | ) | $ | (1,124,813 | ) |
| |||||||||||||
137
Notes to Financial Statements (continued)
|
|
|
|
|
|
|
|
|
|
|
|
|
|
Fundamental Equity Fund |
| Year Ended |
| Year Ended |
| ||||||||
Class R2 Shares |
| Shares |
| Amount |
| Shares |
| Amount |
| ||||
Shares sold |
|
| 777,833 |
| $ | 9,731,475 |
|
| 1,743,023 |
| $ | 22,258,410 |
|
Reinvestment of distributions |
|
| 23,061 |
|
| 261,971 |
|
| 327 |
|
| 3,877 |
|
Shares reacquired |
|
| (687,844 | ) |
| (8,640,098 | ) |
| (499,848 | ) |
| (6,429,314 | ) |
Shares issued in reorganization |
|
| 851 |
|
| 10,317 |
|
| — |
|
| — |
|
Increase |
|
| 113,901 |
| $ | 1,363,665 |
|
| 1,243,502 |
| $ | 15,832,973 |
|
|
|
|
|
|
|
|
|
|
|
|
|
|
|
Class R3 Shares |
|
|
|
|
|
|
|
|
|
|
|
|
|
Shares sold |
|
| 9,889,962 |
| $ | 123,846,562 |
|
| 11,864,112 |
| $ | 152,455,028 |
|
Reinvestment of distributions |
|
| 386,918 |
|
| 4,418,600 |
|
| 12,471 |
|
| 148,520 |
|
Shares reacquired |
|
| (3,992,062 | ) |
| (50,712,344 | ) |
| (3,043,492 | ) |
| (39,766,256 | ) |
Shares issued in reorganization |
|
| 20,100 |
|
| 244,818 |
|
| — |
|
| — |
|
Increase |
|
| 6,304,918 |
| $ | 77,797,636 |
|
| 8,833,091 |
| $ | 112,837,292 |
|
|
|
|
|
|
|
|
|
|
|
|
|
|
|
Growth Leaders Fund |
| Year Ended |
| Period Ended |
| ||||||||
Class A Shares |
| Shares |
| Amount |
| Shares |
| Amount |
| ||||
Shares sold |
|
| 827,488 |
| $ | 12,762,189 |
|
| 741,893 |
| $ | 11,010,377 |
|
Shares reacquired |
|
| (356,168 | ) |
| (5,434,181 | ) |
| (198,386 | ) |
| (2,795,313 | ) |
Increase |
|
| 471,320 |
| $ | 7,328,008 |
|
| 543,507 |
| $ | 8,215,064 |
|
|
|
|
|
|
|
|
|
|
|
|
|
|
|
Class C Shares |
|
|
|
|
|
|
|
|
|
|
|
|
|
Shares sold |
|
| 118,327 |
| $ | 1,815,979 |
|
| 12,760 |
| $ | 177,222 |
|
Shares reacquired |
|
| (4,025 | ) |
| (61,737 | ) |
| (674 | ) |
| (9,649 | ) |
Increase |
|
| 114,302 |
| $ | 1,754,242 |
|
| 12,086 |
| $ | 167,573 |
|
|
|
|
|
|
|
|
|
|
|
|
|
|
|
Class F Shares |
|
|
|
|
|
|
|
|
|
|
|
|
|
Shares sold |
|
| 236,829 |
| $ | 3,656,780 |
|
| 564,988 |
| $ | 8,008,604 |
|
Reinvestment of distributions |
|
| 17 |
|
| 239 |
|
| — |
|
| — |
|
Shares reacquired |
|
| (399,733 | ) |
| (5,645,144 | ) |
| (151,971 | ) |
| (2,179,817 | ) |
Increase (decrease) |
|
| (162,887 | ) | $ | (1,988,125 | ) |
| 413,017 |
| $ | 5,828,787 |
|
|
|
|
|
|
|
|
|
|
|
|
|
|
|
Class I Shares |
|
|
|
|
|
|
|
|
|
|
|
|
|
Shares sold |
|
| 133,948 |
| $ | 2,032,231 |
|
| 176,705 |
| $ | 2,578,224 |
|
Reinvestment of distributions |
|
| 2 |
|
| 23 |
|
| — |
|
| — |
|
Shares reacquired |
|
| (90,997 | ) |
| (1,382,487 | ) |
| (42,191 | ) |
| (541,779 | ) |
Increase |
|
| 42,953 |
| $ | 649,767 |
|
| 134,514 |
| $ | 2,036,445 |
|
|
|
|
|
|
|
|
|
|
|
|
|
|
|
Class R2 Shares |
|
|
|
|
|
|
|
|
|
|
|
|
|
Shares sold |
|
| — |
| $ | — |
|
| 669 |
| $ | 10,037 |
|
Increase |
|
| — |
| $ | — |
|
| 669 |
| $ | 10,037 |
|
|
|
|
|
|
|
|
|
|
|
|
|
|
|
Class R3 Shares |
|
|
|
|
|
|
|
|
|
|
|
|
|
Shares sold |
|
| 302 |
| $ | 4,681 |
|
| 669 |
| $ | 10,037 |
|
Shares reacquired |
|
| (229 | ) |
| (3,644 | ) |
| — |
|
| — |
|
Increase |
|
| 73 |
| $ | 1,037 |
|
| 669 |
| $ | 10,037 |
|
138
Notes to Financial Statements (continued)
|
|
|
|
|
|
|
|
|
|
|
|
|
|
International Core Equity Fund |
| Year Ended |
| Year Ended |
| ||||||||
Class A Shares |
| Shares |
| Amount |
| Shares |
| Amount |
| ||||
Shares sold |
|
| 3,727,406 |
| $ | 41,287,807 |
|
| 5,431,077 |
| $ | 66,865,824 |
|
Converted from Class B* |
|
| 176,957 |
|
| 1,972,039 |
|
| 172,770 |
|
| 2,118,045 |
|
Reinvestment of distributions |
|
| 787,259 |
|
| 8,030,039 |
|
| 461,749 |
|
| 5,504,062 |
|
Shares reacquired |
|
| (10,252,135 | ) |
| (113,126,489 | ) |
| (11,716,592 | ) |
| (142,642,633 | ) |
Decrease |
|
| (5,560,513 | ) | $ | (61,836,604 | ) |
| (5,650,996 | ) | $ | (68,154,702 | ) |
|
|
|
|
|
|
|
|
|
|
|
|
|
|
Class B Shares |
|
|
|
|
|
|
|
|
|
|
|
|
|
Shares sold |
|
| 41,508 |
| $ | 454,177 |
|
| 97,051 |
| $ | 1,185,490 |
|
Reinvestment of distributions |
|
| 28,856 |
|
| 291,736 |
|
| 12,172 |
|
| 143,389 |
|
Shares reacquired |
|
| (625,293 | ) |
| (6,835,933 | ) |
| (707,349 | ) |
| (8,467,456 | ) |
Converted to Class A* |
|
| (179,135 | ) |
| (1,972,039 | ) |
| (175,248 | ) |
| (2,118,045 | ) |
Decrease |
|
| (734,064 | ) | $ | (8,062,059 | ) |
| (773,374 | ) | $ | (9,256,622 | ) |
|
|
|
|
|
|
|
|
|
|
|
|
|
|
Class C Shares |
|
|
|
|
|
|
|
|
|
|
|
|
|
Shares sold |
|
| 435,377 |
| $ | 4,753,980 |
|
| 624,087 |
| $ | 7,558,239 |
|
Reinvestment of distributions |
|
| 68,444 |
|
| 692,650 |
|
| 25,820 |
|
| 304,674 |
|
Shares reacquired |
|
| (1,872,058 | ) |
| (20,516,594 | ) |
| (2,157,857 | ) |
| (25,964,464 | ) |
Decrease |
|
| (1,368,237 | ) | $ | (15,069,964 | ) |
| (1,507,950 | ) | $ | (18,101,551 | ) |
|
|
|
|
|
|
|
|
|
|
|
|
|
|
Class F Shares |
|
|
|
|
|
|
|
|
|
|
|
|
|
Shares sold |
|
| 8,371,734 |
| $ | 90,303,015 |
|
| 5,902,735 |
| $ | 71,196,973 |
|
Reinvestment of distributions |
|
| 187,398 |
|
| 1,896,476 |
|
| 33,906 |
|
| 401,453 |
|
Shares reacquired |
|
| (2,457,327 | ) |
| (26,960,730 | ) |
| (1,309,583 | ) |
| (15,900,801 | ) |
Increase |
|
| 6,101,805 |
| $ | 65,238,761 |
|
| 4,627,058 |
| $ | 55,697,625 |
|
|
|
|
|
|
|
|
|
|
|
|
|
|
|
Class I Shares |
|
|
|
|
|
|
|
|
|
|
|
|
|
Shares sold |
|
| 5,807,790 |
| $ | 60,866,395 |
|
| 6,056,012 |
| $ | 73,817,288 |
|
Reinvestment of distributions |
|
| 430,129 |
|
| 4,404,522 |
|
| 364,403 |
|
| 4,361,900 |
|
Shares reacquired |
|
| (16,582,054 | ) |
| (180,734,077 | ) |
| (8,650,892 | ) |
| (104,247,092 | ) |
Decrease |
|
| (10,344,135 | ) | $ | (115,463,160 | ) |
| (2,230,477 | ) | $ | (26,067,904 | ) |
|
|
|
|
|
|
|
|
|
|
|
|
|
|
Class P Shares |
|
|
|
|
|
|
|
|
|
|
|
|
|
Shares sold |
|
| 5,023 |
| $ | 55,967 |
|
| 17,278 |
| $ | 210,353 |
|
Reinvestment of distributions |
|
| 591 |
|
| 6,018 |
|
| 485 |
|
| 5,747 |
|
Shares reacquired |
|
| (22,920 | ) |
| (249,460 | ) |
| (122,264 | ) |
| (1,508,434 | ) |
Decrease |
|
| (17,306 | ) | $ | (187,475 | ) |
| (104,501 | ) | $ | (1,292,334 | ) |
|
|
|
|
|
|
|
|
|
|
|
|
|
|
Class R2 Shares |
|
|
|
|
|
|
|
|
|
|
|
|
|
Shares sold |
|
| 20,563 |
| $ | 221,494 |
|
| 19,620 |
| $ | 246,233 |
|
Reinvestment of distributions |
|
| 323 |
|
| 3,297 |
|
| 151 |
|
| 1,801 |
|
Shares reacquired |
|
| (29,013 | ) |
| (325,485 | ) |
| (8,775 | ) |
| (99,504 | ) |
Increase (decrease) |
|
| (8,127 | ) | $ | (100,694 | ) |
| 10,996 |
| $ | 148,530 |
|
|
|
|
|
|
|
|
|
|
|
|
|
|
|
Class R3 Shares |
|
|
|
|
|
|
|
|
|
|
|
|
|
Shares sold |
|
| 685,964 |
| $ | 7,557,743 |
|
| 575,644 |
| $ | 6,978,300 |
|
Reinvestment of distributions |
|
| 24,704 |
|
| 249,019 |
|
| 9,577 |
|
| 112,908 |
|
Shares reacquired |
|
| (323,827 | ) |
| (3,552,458 | ) |
| (308,676 | ) |
| (3,767,218 | ) |
Increase |
|
| 386,841 |
| $ | 4,254,304 |
|
| 276,545 |
| $ | 3,323,990 |
|
139
Notes to Financial Statements (continued)
|
|
|
|
|
|
|
|
|
|
|
|
|
|
International Dividend Income Fund |
| Year Ended |
| Year Ended |
| ||||||||
Class A Shares |
| Shares |
| Amount |
| Shares |
| Amount |
| ||||
Shares sold |
|
| 56,664,307 |
| $ | 434,591,248 |
|
| 22,238,700 |
| $ | 187,313,303 |
|
Reinvestment of distributions |
|
| 2,852,503 |
|
| 21,595,541 |
|
| 1,162,728 |
|
| 9,775,690 |
|
Shares reacquired |
|
| (15,575,692 | ) |
| (118,722,581 | ) |
| (6,836,394 | ) |
| (58,116,906 | ) |
Increase |
|
| 43,941,118 |
| $ | 337,464,208 |
|
| 16,565,034 |
| $ | 138,972,087 |
|
|
|
|
|
|
|
|
|
|
|
|
|
|
|
Class C Shares |
|
|
|
|
|
|
|
|
|
|
|
|
|
Shares sold |
|
| 7,586,498 |
| $ | 58,324,210 |
|
| 1,850,727 |
| $ | 15,281,234 |
|
Reinvestment of distributions |
|
| 238,003 |
|
| 1,789,711 |
|
| 70,621 |
|
| 592,985 |
|
Shares reacquired |
|
| (1,035,013 | ) |
| (7,783,211 | ) |
| (651,210 | ) |
| (5,483,306 | ) |
Increase |
|
| 6,789,488 |
| $ | 52,330,710 |
|
| 1,270,138 |
| $ | 10,390,913 |
|
|
|
|
|
|
|
|
|
|
|
|
|
|
|
Class F Shares |
|
|
|
|
|
|
|
|
|
|
|
|
|
Shares sold |
|
| 16,261,875 |
| $ | 126,253,262 |
|
| 3,229,799 |
| $ | 27,029,321 |
|
Reinvestment of distributions |
|
| 409,351 |
|
| 3,107,094 |
|
| 68,361 |
|
| 572,480 |
|
Shares reacquired |
|
| (3,646,404 | ) |
| (27,845,351 | ) |
| (1,364,580 | ) |
| (11,432,859 | ) |
Increase |
|
| 13,024,822 |
| $ | 101,515,005 |
|
| 1,933,580 |
| $ | 16,168,942 |
|
|
|
|
|
|
|
|
|
|
|
|
|
|
|
Class I Shares |
|
|
|
|
|
|
|
|
|
|
|
|
|
Shares sold |
|
| 51,100,305 |
| $ | 393,452,662 |
|
| 40,893,914 |
| $ | 334,834,823 |
|
Reinvestment of distributions |
|
| 4,160,567 |
|
| 31,622,657 |
|
| 1,957,711 |
|
| 16,310,360 |
|
Shares reacquired |
|
| (11,980,127 | ) |
| (92,074,620 | ) |
| (2,668,858 | ) |
| (23,193,268 | ) |
Increase |
|
| 43,280,745 |
| $ | 333,000,699 |
|
| 40,182,767 |
| $ | 327,951,915 |
|
|
|
|
|
|
|
|
|
|
|
|
|
|
|
Class R2 Shares |
|
|
|
|
|
|
|
|
|
|
|
|
|
Shares sold |
|
| 59,977 |
| $ | 477,167 |
|
| 884 |
| $ | 7,335 |
|
Reinvestment of distributions |
|
| 376 |
|
| 2,913 |
|
| 50 |
|
| 433 |
|
Shares reacquired |
|
| (3,857 | ) |
| (29,286 | ) |
| — |
|
| — |
|
Increase |
|
| 56,496 |
| $ | 450,794 |
|
| 934 |
| $ | 7,768 |
|
|
|
|
|
|
|
|
|
|
|
|
|
|
|
Class R3 Shares |
|
|
|
|
|
|
|
|
|
|
|
|
|
Shares sold |
|
| 4,481,895 |
| $ | 34,454,066 |
|
| 30,256 |
| $ | 248,185 |
|
Reinvestment of distributions |
|
| 148,376 |
|
| 1,138,500 |
|
| 1,149 |
|
| 9,575 |
|
Shares reacquired |
|
| (467,185 | ) |
| (3,666,647 | ) |
| (2,564 | ) |
| (23,221 | ) |
Increase |
|
| 4,163,086 |
| $ | 31,925,919 |
|
| 28,841 |
| $ | 234,539 |
|
140
Notes to Financial Statements (continued)
|
|
|
|
|
|
|
|
|
|
|
|
|
|
International Opportunities Fund |
| Year Ended |
| Year Ended |
| ||||||||
Class A Shares |
| Shares |
| Amount |
| Shares |
| Amount |
| ||||
Shares sold |
|
| 571,200 |
| $ | 6,970,134 |
|
| 1,150,691 |
| $ | 15,035,819 |
|
Converted from Class B* |
|
| 84,119 |
|
| 1,031,741 |
|
| 107,995 |
|
| 1,412,156 |
|
Reinvestment of distributions |
|
| 48,282 |
|
| 528,688 |
|
| 28,802 |
|
| 373,845 |
|
Shares reacquired |
|
| (1,902,468 | ) |
| (23,143,319 | ) |
| (1,944,941 | ) |
| (25,406,734 | ) |
Decrease |
|
| (1,198,867 | ) | $ | (14,612,756 | ) |
| (657,453 | ) | $ | (8,584,914 | ) |
|
|
|
|
|
|
|
|
|
|
|
|
|
|
Class B Shares |
|
|
|
|
|
|
|
|
|
|
|
|
|
Shares sold |
|
| 13,973 |
| $ | 163,791 |
|
| 31,006 |
| $ | 395,816 |
|
Shares reacquired |
|
| (207,503 | ) |
| (2,417,152 | ) |
| (257,614 | ) |
| (3,202,108 | ) |
Converted to Class A* |
|
| (88,508 | ) |
| (1,031,741 | ) |
| (113,693 | ) |
| (1,412,156 | ) |
Decrease |
|
| (282,038 | ) | $ | (3,285,102 | ) |
| (340,301 | ) | $ | (4,218,448 | ) |
|
|
|
|
|
|
|
|
|
|
|
|
|
|
Class C Shares |
|
|
|
|
|
|
|
|
|
|
|
|
|
Shares sold |
|
| 133,306 |
| $ | 1,541,145 |
|
| 198,688 |
| $ | 2,457,879 |
|
Reinvestment of distributions |
|
| 947 |
|
| 9,818 |
|
| — |
|
| — |
|
Shares reacquired |
|
| (391,251 | ) |
| (4,492,730 | ) |
| (461,967 | ) |
| (5,736,735 | ) |
Decrease |
|
| (256,998 | ) | $ | (2,941,767 | ) |
| (263,279 | ) | $ | (3,278,856 | ) |
|
|
|
|
|
|
|
|
|
|
|
|
|
|
Class F Shares |
|
|
|
|
|
|
|
|
|
|
|
|
|
Shares sold |
|
| 27,200 |
| $ | 326,612 |
|
| 66,658 |
| $ | 872,261 |
|
Reinvestment of distributions |
|
| 786 |
|
| 8,537 |
|
| 549 |
|
| 7,072 |
|
Shares reacquired |
|
| (34,100 | ) |
| (422,407 | ) |
| (61,873 | ) |
| (790,038 | ) |
Increase (decrease) |
|
| (6,114 | ) | $ | (87,258 | ) |
| 5,334 |
| $ | 89,295 |
|
|
|
|
|
|
|
|
|
|
|
|
|
|
|
Class I Shares |
|
|
|
|
|
|
|
|
|
|
|
|
|
Shares sold |
|
| 668,608 |
| $ | 8,076,274 |
|
| 3,731,275 |
| $ | 50,794,344 |
|
Reinvestment of distributions |
|
| 203,773 |
|
| 2,278,186 |
|
| 127,433 |
|
| 1,691,087 |
|
Shares reacquired |
|
| (3,754,194 | ) |
| (46,866,735 | ) |
| (4,065,081 | ) |
| (52,681,810 | ) |
Decrease |
|
| (2,881,813 | ) | $ | (36,512,275 | ) |
| (206,373 | ) | $ | (196,379 | ) |
|
|
|
|
|
|
|
|
|
|
|
|
|
|
Class P Shares |
|
|
|
|
|
|
|
|
|
|
|
|
|
Shares sold |
|
| 9,237 |
| $ | 116,256 |
|
| 8,696 |
| $ | 113,721 |
|
Reinvestment of distributions |
|
| 435 |
|
| 4,835 |
|
| 223 |
|
| 2,941 |
|
Shares reacquired |
|
| (7,514 | ) |
| (94,510 | ) |
| (10,434 | ) |
| (143,808 | ) |
Increase (decrease) |
|
| 2,158 |
| $ | 26,581 |
|
| (1,515 | ) | $ | (27,146 | ) |
|
|
|
|
|
|
|
|
|
|
|
|
|
|
Class R2 Shares |
|
|
|
|
|
|
|
|
|
|
|
|
|
Shares sold |
|
| 1,414 |
| $ | 17,337 |
|
| 861 |
| $ | 11,208 |
|
Reinvestment of distributions |
|
| 25 |
|
| 268 |
|
| 7 |
|
| 92 |
|
Shares reacquired |
|
| (2,471 | ) |
| (29,392 | ) |
| (408 | ) |
| (5,415 | ) |
Increase (decrease) |
|
| (1,032 | ) | $ | (11,787 | ) |
| 460 |
| $ | 5,885 |
|
|
|
|
|
|
|
|
|
|
|
|
|
|
|
Class R3 Shares |
|
|
|
|
|
|
|
|
|
|
|
|
|
Shares sold |
|
| 230,198 |
| $ | 2,766,699 |
|
| 294,165 |
| $ | 3,814,400 |
|
Reinvestment of distributions |
|
| 3,414 |
|
| 36,875 |
|
| 1,137 |
|
| 14,582 |
|
Shares reacquired |
|
| (185,619 | ) |
| (2,225,383 | ) |
| (101,985 | ) |
| (1,321,638 | ) |
Increase |
|
| 47,993 |
| $ | 578,191 |
|
| 193,317 |
| $ | 2,507,344 |
|
141
Notes to Financial Statements (continued)
|
|
|
|
|
|
|
|
|
|
|
|
|
|
Value Opportunities Fund |
| Year Ended |
| Year Ended |
| ||||||||
Class A Shares |
| Shares |
| Amount |
| Shares |
| Amount |
| ||||
Shares sold |
|
| 16,555,751 |
| $ | 258,790,532 |
|
| 40,572,808 |
| $ | 642,999,510 |
|
Converted from Class B* |
|
| 86,539 |
|
| 1,336,917 |
|
| 116,216 |
|
| 1,851,249 |
|
Reinvestment of distributions |
|
| 211,564 |
|
| 3,044,400 |
|
| 195,812 |
|
| 2,841,224 |
|
Shares reacquired |
|
| (20,683,779 | ) |
| (320,940,218 | ) |
| (22,941,658 | ) |
| (347,588,834 | ) |
Increase (decrease) |
|
| (3,829,925 | ) | $ | (57,768,369 | ) |
| 17,943,178 |
| $ | 300,103,149 |
|
|
|
|
|
|
|
|
|
|
|
|
|
|
|
Class B Shares |
|
|
|
|
|
|
|
|
|
|
|
|
|
Shares sold |
|
| 46,272 |
| $ | 697,395 |
|
| 119,334 |
| $ | 1,826,992 |
|
Reinvestment of distributions |
|
| 3,513 |
|
| 48,759 |
|
| 5,846 |
|
| 82,368 |
|
Shares reacquired |
|
| (164,436 | ) |
| (2,472,173 | ) |
| (293,484 | ) |
| (4,383,470 | ) |
Converted to Class A* |
|
| (89,917 | ) |
| (1,336,917 | ) |
| (119,985 | ) |
| (1,851,249 | ) |
Decrease |
|
| (204,568 | ) | $ | (3,062,936 | ) |
| (288,289 | ) | $ | (4,325,359 | ) |
|
|
|
|
|
|
|
|
|
|
|
|
|
|
Class C Shares |
|
|
|
|
|
|
|
|
|
|
|
|
|
Shares sold |
|
| 3,511,263 |
| $ | 52,966,007 |
|
| 10,347,523 |
| $ | 160,773,372 |
|
Reinvestment of distributions |
|
| 56,316 |
|
| 781,663 |
|
| 43,442 |
|
| 611,665 |
|
Shares reacquired |
|
| (5,397,467 | ) |
| (81,438,102 | ) |
| (2,843,088 | ) |
| (42,098,995 | ) |
Increase (decrease) |
|
| (1,829,888 | ) | $ | (27,690,432 | ) |
| 7,547,877 |
| $ | 119,286,042 |
|
|
|
|
|
|
|
|
|
|
|
|
|
|
|
Class F Shares |
|
|
|
|
|
|
|
|
|
|
|
|
|
Shares sold |
|
| 13,711,141 |
| $ | 213,852,078 |
|
| 22,230,832 |
| $ | 355,426,842 |
|
Reinvestment of distributions |
|
| 69,134 |
|
| 998,292 |
|
| 43,212 |
|
| 627,438 |
|
Shares reacquired |
|
| (16,135,037 | ) |
| (253,947,633 | ) |
| (8,596,138 | ) |
| (131,399,436 | ) |
Increase (decrease) |
|
| (2,354,762 | ) | $ | (39,097,263 | ) |
| 13,677,906 |
| $ | 224,654,844 |
|
|
|
|
|
|
|
|
|
|
|
|
|
|
|
Class I Shares |
|
|
|
|
|
|
|
|
|
|
|
|
|
Shares sold |
|
| 12,381,658 |
| $ | 195,795,308 |
|
| 10,069,306 |
| $ | 164,687,851 |
|
Reinvestment of distributions |
|
| 70,413 |
|
| 1,025,918 |
|
| 65,097 |
|
| 952,376 |
|
Shares reacquired |
|
| (6,077,148 | ) |
| (95,981,797 | ) |
| (4,207,704 | ) |
| (65,816,748 | ) |
Increase |
|
| 6,374,923 |
| $ | 100,839,429 |
|
| 5,926,699 |
| $ | 99,823,479 |
|
|
|
|
|
|
|
|
|
|
|
|
|
|
|
Class P Shares |
|
|
|
|
|
|
|
|
|
|
|
|
|
Shares sold |
|
| 32,674 |
| $ | 507,505 |
|
| 94,923 |
| $ | 1,521,886 |
|
Reinvestment of distributions |
|
| 795 |
|
| 11,405 |
|
| 1,286 |
|
| 18,586 |
|
Shares reacquired |
|
| (200,514 | ) |
| (3,140,409 | ) |
| (173,146 | ) |
| (2,767,227 | ) |
Decrease |
|
| (167,045 | ) | $ | (2,621,499 | ) |
| (76,937 | ) | $ | (1,226,755 | ) |
|
|
|
|
|
|
|
|
|
|
|
|
|
|
Class R2 Shares |
|
|
|
|
|
|
|
|
|
|
|
|
|
Shares sold |
|
| 501,459 |
| $ | 7,801,233 |
|
| 554,464 |
| $ | 8,612,420 |
|
Reinvestment of distributions |
|
| 1,329 |
|
| 18,938 |
|
| 524 |
|
| 7,548 |
|
Shares reacquired |
|
| (389,132 | ) |
| (6,032,819 | ) |
| (145,378 | ) |
| (2,272,836 | ) |
Increase |
|
| 113,656 |
| $ | 1,787,352 |
|
| 409,610 |
| $ | 6,347,132 |
|
|
|
|
|
|
|
|
|
|
|
|
|
|
|
Class R3 Shares |
|
|
|
|
|
|
|
|
|
|
|
|
|
Shares sold |
|
| 2,867,553 |
| $ | 44,674,892 |
|
| 3,878,230 |
| $ | 60,498,976 |
|
Reinvestment of distributions |
|
| 17,214 |
|
| 245,647 |
|
| 6,944 |
|
| 100,002 |
|
Shares reacquired |
|
| (1,715,112 | ) |
| (26,611,496 | ) |
| (1,018,897 | ) |
| (16,018,989 | ) |
Increase |
|
| 1,169,655 |
| $ | 18,309,043 |
|
| 2,866,277 |
| $ | 44,579,989 |
|
|
|
* | Automatic conversion of Class B shares occurs on the 25th day of the month (or, if the 25th day is not a business day, the next business day thereafter) following the eighth anniversary of the day on which the purchase order was accepted. |
† | For the period June 24, 2011 (commencement of operations) to October 31, 2011. |
142
Notes to Financial Statements (concluded)
|
|
|
13. | REORGANIZATION |
|
As of the close of business on June 15, 2012, Fundamental Equity Fund acquired the net assets of Large Cap Value Fund pursuant to a plan of reorganization approved by Large Cap Value Fund’s shareholders on May 18, 2012. The reorganization permitted Large Cap Value Fund shareholders to pursue substantially similar investment objectives and strategies, but as part of a larger fund with greater investment flexibility and lower expenses. The acquisition was accomplished by a tax-free exchange whereas holders of 4,041,590 shares of Large Cap Value Fund outstanding on June 15, 2012 received 3,230,131 shares (valued at $39,288,499) of Fundamental Equity Fund. Large Cap Value Fund’s net assets at the date of the acquisition, including $3,457,796 of unrealized appreciation, $7,730 of distributions in excess of net investment income, and $14,876,070 of accumulated net realized losses, were combined with those of Fundamental Equity Fund. The cost basis of securities received from Large Cap Value Fund was carried forward.
The total net assets of Fundamental Equity Fund immediately before the transfer were $4,619,436,391. Total net assets of Large Cap Value Fund immediately before the transfer were $39,288,499. Total net assets of Fundamental Equity Fund immediately after the transfer were $4,658,724,890.
The following table illustrates share conversion ratios of the reorganization on June 15, 2012:
|
|
|
Class |
| Conversion |
A |
| 0.792366 |
B |
| 0.826215 |
C |
| 0.827692 |
F |
| 0.790408 |
I |
| 0.790558 |
P |
| 0.804581 |
R2 |
| 0.814447 |
R3 |
| 0.796634 |
Had the acquisition been completed on November 1, 2011, the beginning of the current reporting period of Fundamental Equity Fund, the Fund’s condensed pro forma results of operations for the year ended October 31, 2012, would be as follows:
|
|
|
|
|
Net investment income |
| $ | 28,890,815 |
|
Net realized and unrealized gain |
|
| 299,455,283 |
|
Net increase in net assets resulting from operations |
|
| 328,346,098 |
|
The combined investment portfolios have been managed as a single integrated portfolio since the acquisition was completed. Revenue and earnings of Large Cap Value Fund’s portfolio holdings have been included in Fundamental Equity Fund’s Statement of Operations since the date of acquisition.
143
Report of Independent Registered Public Accounting Firm
To the Board of Trustees of Lord Abbett Securities Trust and the Shareholders of
Lord Abbett Alpha Strategy Fund, Lord Abbett Fundamental Equity Fund,
Lord Abbett Growth Leaders Fund, Lord Abbett International Core Equity Fund,
Lord Abbett International Dividend Income Fund, Lord Abbett International
Opportunities Fund and Lord Abbett Value Opportunities Fund:
We have audited the accompanying statements of assets and liabilities, including the schedules of investments, of the Lord Abbett Alpha Strategy Fund, Lord Abbett Fundamental Equity Fund, Lord Abbett Growth Leaders Fund, Lord Abbett International Core Equity Fund, Lord Abbett International Dividend Income Fund, Lord Abbett International Opportunities Fund and Lord Abbett Value Opportunities Fund, (collectively, the “Funds”) seven of the portfolios constituting the Lord Abbett Securities Trust (the “Trust) as of October 31, 2012, the related statements of operations for the year then ended, and the statements of changes in net assets and the financial highlights for each of the periods presented. These financial statements and financial highlights are the responsibility of the Trust’s management. Our responsibility is to express an opinion on these financial statements and financial highlights based on our audits.
We conducted our audits in accordance with the standards of the Public Company Accounting Oversight Board (United States). Those standards require that we plan and perform the audits to obtain reasonable assurance about whether the financial statements and financial highlights are free of material misstatement. The Trust is not required to have, nor were we engaged to perform, an audit of its internal control over financial reporting. Our audits included consideration of internal control over financial reporting as a basis for designing audit procedures that are appropriate in the circumstances, but not for the purpose of expressing an opinion on the effectiveness of the Trust’s internal control over financial reporting. Accordingly, we express no such opinion. An audit also includes examining, on a test basis, evidence supporting the amounts and disclosures in the financial statements, assessing the accounting principles used and significant estimates made by management, as well as evaluating the overall financial statement presentation. Our procedures included confirmation of securities owned as of October 31, 2012, by correspondence with the custodian and brokers; where replies were not received from brokers, we performed other auditing procedures. We believe that our audits provide a reasonable basis for our opinion.
In our opinion, the financial statements and financial highlights referred to above present fairly, in all material respects, the financial position of each of the Funds as of October 31, 2012, the results of their operations for the year then ended, and the changes in their net assets and the financial highlights for each of the periods presented, in conformity with accounting principles generally accepted in the United States of America.
DELOITTE & TOUCHE LLP
New York, New York
December 21, 2012
144
Investments in Underlying Funds (unaudited)
Alpha Strategy Fund invests in Underlying Funds managed by Lord Abbett. As of October 31, 2012, Alpha Strategy Fund’s long-term investments were allocated among the Underlying Funds as follows:
|
|
|
|
|
Underlying Fund Name |
| % of Investments |
| |
| ||||
Lord Abbett Developing Growth Fund, Inc. - Class I |
|
| 19.59% |
|
Lord Abbett Securities Trust - Lord Abbett International Opportunities Fund - Class I |
|
| 20.43% |
|
Lord Abbett Securities Trust - Lord Abbett Micro-Cap Growth Fund - Class I |
|
| 9.81% |
|
Lord Abbett Securities Trust - Lord Abbett Micro-Cap Value Fund - Class I |
|
| 10.26% |
|
Lord Abbett Equity Trust - Lord Abbett Small-Cap Blend Fund - Class I |
|
| 9.95% |
|
Lord Abbett Research Fund, Inc. - Lord Abbett Small-Cap Value Fund - Class I |
|
| 19.94% |
|
Lord Abbett Securities Trust - Lord Abbett Value Opportunities Fund - Class I |
|
| 10.02% |
|
| ||||
The Ten Largest Holdings and the Holdings by Sector, as of October 31, 2012, for each Underlying Fund are presented below. Each Underlying Fund’s annual and semiannual reports, which are sent to shareholders and filed with the SEC, contain information about the Fund’s portfolio holdings, including a complete schedule of holdings. A complete schedule of holdings for each Underlying Fund is also filed with the SEC on Form N-Q as of the end of each respective Underlying Fund’s first and third quarters. In addition, on or about the first day of the second month following each calendar quarter-end, each Fund makes publicly available a complete schedule of its portfolio holdings as of the last day of each such quarter. The information for the most recently ended calendar quarter may be viewed at www.lordabbett.com or requested at no charge by calling Lord Abbett at 888–522–2388.
|
|
|
|
|
Lord Abbett Developing Growth Fund, Inc. |
|
|
|
|
|
|
|
|
|
Ten Largest Holdings |
| % of Investments |
| |
| ||||
Middleby Corp. (The) |
|
| 1.93% |
|
Genesee & Wyoming, Inc. Class A |
|
| 1.92% |
|
Cornerstone OnDemand, Inc. |
|
| 1.71% |
|
CoStar Group, Inc. |
|
| 1.58% |
|
Onyx Pharmaceuticals, Inc. |
|
| 1.57% |
|
United Rentals, Inc. |
|
| 1.55% |
|
3D Systems Corp. |
|
| 1.51% |
|
CommVault Systems, Inc. |
|
| 1.43% |
|
Cavium, Inc. |
|
| 1.42% |
|
First Solar, Inc. |
|
| 1.39% |
|
| ||||
|
|
|
|
|
Holdings by Sector* |
| % of Investments |
| |
| ||||
Consumer Discretionary |
|
| 11.90% |
|
Consumer Staples |
|
| 5.86% |
|
Energy |
|
| 6.72% |
|
Financials |
|
| 8.60% |
|
Health Care |
|
| 18.71% |
|
Industrials |
|
| 13.65% |
|
Information Technology |
|
| 30.01% |
|
Materials |
|
| 1.13% |
|
Short-Term Investment |
|
| 3.42% |
|
| ||||
Total |
|
| 100.00% |
|
| ||||
|
|
* | A sector may comprise several industries. |
145
Investments in Underlying Funds (unaudited)(continued)
Lord Abbett Securities Trust – International Opportunities Fund
|
|
|
|
|
Ten Largest Holdings |
| % of Investments |
| |
| ||||
Brunel International NV |
|
| 1.95% |
|
easyJet plc |
|
| 1.93% |
|
Debenhams plc |
|
| 1.87% |
|
FP Corp. |
|
| 1.82% |
|
Techtronic Industries Co. |
|
| 1.72% |
|
Tokyo Tatemono Co., Ltd. |
|
| 1.70% |
|
Park24 Co., Ltd. |
|
| 1.65% |
|
Catlin Group Ltd. |
|
| 1.60% |
|
Balfour Beatty plc |
|
| 1.58% |
|
REXLot Holdings Ltd. |
|
| 1.57% |
|
| ||||
|
|
|
|
|
Holdings by Sector* |
| % of Investments |
| |
| ||||
Consumer Discretionary |
|
| 20.14% |
|
Consumer Staples |
|
| 7.12% |
|
Energy |
|
| 8.56% |
|
Financials |
|
| 18.22% |
|
Health Care |
|
| 3.02% |
|
Industrials |
|
| 20.38% |
|
Information Technology |
|
| 7.76% |
|
Materials |
|
| 8.47% |
|
Telecommunication Services |
|
| 0.79% |
|
Utilities |
|
| 3.07% |
|
Short-Term Investment |
|
| 2.47% |
|
| ||||
Total |
|
| 100.00% |
|
| ||||
|
|
* | A sector may comprise several industries. |
Lord Abbett Securities Trust – Micro Cap Growth Fund
|
|
|
|
|
Ten Largest Holdings |
| % of Investments |
| |
| ||||
Home Loan Servicing Solutions Ltd. |
|
| 2.58% |
|
Affymax, Inc. |
|
| 2.46% |
|
WageWorks, Inc. |
|
| 2.46% |
|
Eloqua, Inc. |
|
| 2.42% |
|
NetSpend Holdings, Inc. |
|
| 2.21% |
|
Lumber Liquidators Holdings, Inc. |
|
| 2.10% |
|
Imperva, Inc. |
|
| 2.05% |
|
eHealth, Inc. |
|
| 1.94% |
|
Vocera Communications, Inc. |
|
| 1.87% |
|
DexCom, Inc. |
|
| 1.80% |
|
| ||||
|
|
|
| |
Holdings by Sector* |
| % of Investments |
| |
| ||||
Consumer Discretionary |
|
| 13.78% |
|
Consumer Staples |
|
| 4.91% |
|
Energy |
|
| 4.37% |
|
Financials |
|
| 12.17% |
|
Health Care |
|
| 32.60% |
|
Industrials |
|
| 10.38% |
|
Information Technology |
|
| 18.73% |
|
Short-Term Investment |
|
| 3.06% |
|
| ||||
Total |
|
| 100.00% |
|
| ||||
|
|
* | A sector may comprise several industries. |
146
Investments in Underlying Funds (unaudited)(continued)
Lord Abbett Securities Trust – Micro Cap Value Fund
|
|
|
|
|
Ten Largest Holdings |
| % of Investments |
| |
| ||||
Multi-Color Corp. |
|
| 2.44% |
|
Marlin Business Services Corp. |
|
| 2.25% |
|
Overhill Farms, Inc. |
|
| 2.07% |
|
Asbury Automotive Group, Inc. |
|
| 1.86% |
|
Lithia Motors, Inc. Class A |
|
| 1.83% |
|
Metropolitan Health Networks, Inc. |
|
| 1.82% |
|
Rush Enterprises, Inc. Class A |
|
| 1.74% |
|
SeaCube Container Leasing Ltd. |
|
| 1.72% |
|
MYR Group, Inc. |
|
| 1.70% |
|
Territorial Bancorp, Inc. |
|
| 1.66% |
|
| ||||
|
|
|
|
|
Holdings by Sector* |
| % of Investments |
| |
| ||||
Consumer Discretionary |
|
| 10.76% |
|
Consumer Staples |
|
| 2.07% |
|
Energy |
|
| 0.35% |
|
Financials |
|
| 28.33% |
|
Health Care |
|
| 10.02% |
|
Industrials |
|
| 28.30% |
|
Information Technology |
|
| 9.85% |
|
Materials |
|
| 6.47% |
|
Utilities |
|
| 2.32% |
|
Short-Term Investment |
|
| 1.53% |
|
| ||||
Total |
|
| 100.00% |
|
| ||||
|
|
* | A sector may comprise several industries. |
Lord Abbett Equity Trust – Small Cap Blend Fund
|
|
|
|
|
Ten Largest Holdings |
| % of Investments |
| |
| ||||
Cardtronics, Inc. |
|
| 2.48% |
|
Jones Lang LaSalle, Inc. |
|
| 2.22% |
|
Middleby Corp. (The) |
|
| 2.11% |
|
FleetCor Technologies, Inc. |
|
| 2.10% |
|
Ocwen Financial Corp. |
|
| 1.95% |
|
Semtech Corp. |
|
| 1.93% |
|
Plains Exploration & Production Co. |
|
| 1.93% |
|
Altisource Portfolio Solutions SA |
|
| 1.76% |
|
Detour Gold Corp. |
|
| 1.73% |
|
SS&C Technologies Holdings, Inc. |
|
| 1.71% |
|
| ||||
|
|
|
|
|
Holdings by Sector* |
| % of Investments |
| |
| ||||
Consumer Discretionary |
|
| 11.99% |
|
Consumer Staples |
|
| 3.89% |
|
Energy |
|
| 7.81% |
|
Financials |
|
| 21.73% |
|
Health Care |
|
| 9.98% |
|
Industrials |
|
| 17.05% |
|
Information Technology |
|
| 14.04% |
|
Materials |
|
| 10.08% |
|
Short-Term Investment |
|
| 3.43% |
|
| ||||
Total |
|
| 100.00% |
|
| ||||
|
|
* | A sector may comprise several industries. |
147
Investments in Underlying Funds (unaudited)(concluded)
Lord Abbett Research Fund, Inc. – Small Cap Value Fund
|
|
|
|
|
Ten Largest Holdings |
| % of Investments |
| |
| ||||
Cabot Corp. |
|
| 2.01% |
|
FleetCor Technologies, Inc. |
|
| 1.65% |
|
Alterra Capital Holdings Ltd. |
|
| 1.46% |
|
MAXIMUS, Inc. |
|
| 1.46% |
|
Penske Automotive Group, Inc. |
|
| 1.43% |
|
Superior Energy Services, Inc. |
|
| 1.32% |
|
Jack Henry & Associates, Inc. |
|
| 1.29% |
|
Ryder System, Inc. |
|
| 1.28% |
|
Littelfuse, Inc. |
|
| 1.26% |
|
Signature Bank |
|
| 1.24% |
|
| ||||
|
|
|
|
|
Holdings by Sector* |
| % of Investments |
| |
| ||||
Consumer Discretionary |
|
| 11.70% |
|
Consumer Staples |
|
| 2.42% |
|
Energy |
|
| 6.02% |
|
Financials |
|
| 24.61% |
|
Health Care |
|
| 8.38% |
|
Industrials |
|
| 19.75% |
|
Information Technology |
|
| 13.10% |
|
Materials |
|
| 9.65% |
|
Utilities |
|
| 2.79% |
|
Short-Term Investment |
|
| 1.58% |
|
| ||||
Total |
|
| 100.00% |
|
| ||||
|
|
* | A sector may comprise several industries. |
Lord Abbett Securities Trust – Value Opportunities Fund
|
|
|
|
|
Ten Largest Holdings |
| % of Investments |
| |
| ||||
Watson Pharmaceuticals, Inc. |
|
| 2.60% |
|
PerkinElmer, Inc. |
|
| 2.22% |
|
Arch Capital Group Ltd. |
|
| 2.18% |
|
Rock-Tenn Co. Class A |
|
| 1.93% |
|
Comerica, Inc. |
|
| 1.91% |
|
Nuance Communications, Inc. |
|
| 1.70% |
|
Reliance Steel & Aluminum Co. |
|
| 1.68% |
|
Signature Bank |
|
| 1.61% |
|
NV Energy, Inc. |
|
| 1.61% |
|
PVH Corp. |
|
| 1.53% |
|
| ||||
|
|
|
|
|
Holdings by Sector* |
| % of Investments |
| |
| ||||
Consumer Discretionary |
|
| 8.99% |
|
Consumer Staples |
|
| 5.54% |
|
Energy |
|
| 5.29% |
|
Financials |
|
| 23.87% |
|
Health Care |
|
| 9.74% |
|
Industrials |
|
| 12.30% |
|
Information Technology |
|
| 15.55% |
|
Materials |
|
| 10.50% |
|
Utilities |
|
| 6.62% |
|
Short-Term Investment |
|
| 1.60% |
|
| ||||
Total |
|
| 100.00% |
|
| ||||
|
|
* | A sector may comprise several industries. |
148
Basic Information About Management
The Board of Trustees (the “Board”) is responsible for the management of the business and affairs of Trust in accordance with the laws of the State of Delaware. The Board elects officers who are responsible for the day-to-day operations of Trust and who execute policies authorized by the Board. The Board also approves an investment adviser to Trust and continues to monitor the cost and quality of the services the investment adviser provides, and annually considers whether to renew the contract with the adviser. Generally, each Trustee holds office until his/her successor is elected and qualified or until his/her earlier resignation or removal, as provided in the Trust’s organizational documents.
Lord Abbett, a Delaware limited liability company, is the Trust’s investment adviser. Designated Lord Abbett personnel are responsible for the day-to-day management of the Funds.
Interested Trustees
The following Trustees are affiliated with Lord Abbett and are “interested persons” of the Trust as defined in the Act. Mr. Dow and Ms. Foster are trustees of each of the 13 Lord Abbett-sponsored funds, which consist of 56 portfolios or series. Ms. Foster also serves as an officer of each of those funds.
|
|
|
|
|
Name, Address and |
| Current Position and |
| Principal Occupation and Other Directorships |
Robert S. Dow |
| Trustee since 1993 and |
| Principal Occupation: Formerly was Senior Partner of Lord Abbett (2007 - 2012), Managing Partner (1996 - 2007), and Chief Investment Officer (1995 - 2007), joined Lord Abbett in 1972. |
|
|
|
|
|
|
|
|
| Other Directorships: None. |
|
|
|
|
|
Daria L. Foster |
| Trustee and President |
| Principal Occupation: Managing Partner of Lord Abbett (since 2007), and was formerly Director of Marketing and Client Service, joined Lord Abbett in 1990. |
|
|
|
|
|
|
|
|
| Other Directorships: None. |
| ||||
Independent Trustees
The following Independent Trustees also are trustees of each of the 13 Lord Abbett-sponsored funds, which consist of 56 portfolios or series.
|
|
|
|
|
Name, Address and |
| Current Position and |
| Principal Occupation and Other Directorships |
E. Thayer Bigelow |
| Trustee since 1994 |
| Principal Occupation: Managing General Partner, Bigelow Media, LLC (since 2000); Senior Adviser, Time Warner Inc. (1998 - 2000). |
|
|
|
| |
|
|
| Other Directorships: Currently serves as director of Crane Co. (since 1984) and Huttig Building Products Inc. (since 1998). Previously served as a director of R.H. Donnelley Inc. (2009 - 2010) and Adelphia Communications Inc. (2003 - 2007). |
149
Basic Information About Management (continued)
|
|
|
|
|
Name, Address and |
| Current Position and |
| Principal Occupation and Other Directorships |
Robert B. Calhoun, Jr. |
| Trustee since 1998 |
| Principal Occupation: Senior Advisor of Monitor Clipper Partners, a private equity investment fund (since 1997); President of Clipper Asset Management Corp. (1991 - 2009). |
|
|
|
|
|
Evelyn E. Guernsey |
| Trustee since 2011 |
| Principal Occupation: CEO, Americas of J.P. Morgan Asset Management (2004 - 2010). |
|
|
|
|
|
Julie A. Hill |
| Trustee since 2004 |
| Principal Occupation: Owner and CEO of The Hill Company, a business consulting firm (since 1998). |
|
|
|
|
|
Franklin W. Hobbs |
| Trustee since 2001 |
| Principal Occupation: Advisor of One Equity Partners, a private equity firm (since 2004). |
|
|
|
|
|
James M. McTaggart |
| Trustee since 2012* |
| Principal Occupation: Independent management advisor and consultant (since 2012); Vice President, CRA International, Inc. (doing business as Charles River Associates), a global management consulting firm (2009 - 2012); Founder and Chairman of Marakon Associates, Inc., a strategy consulting firm (1978 - 2009); and Officer and Director of Trinsum Group, a holding company (2007 – 2009). |
|
|
|
|
|
|
|
|
| Other Directorships: Currently serves as director of Blyth, Inc., a home products company (since 2004). |
|
|
|
|
|
Thomas J. Neff |
| Trustee since 1993** |
| Principal Occupation: Chairman of Spencer Stuart (U.S.), an executive search consulting firm (since 1996). |
|
|
|
|
|
James L.L. Tullis |
| Trustee since 2006 |
| Principal Occupation: CEO of Tullis-Dickerson and Lord, Abbett & Co. LLC Co. Inc., a venture capital management firm (since 1990). |
| ||||
|
|
* | Election to the Boards of Directors/Trustees of the Lord Abbett Funds effective December 1, 2012. |
** | Retirement from the Boards of Directors/Trustees of the Lord Abbett Funds, effective December 31, 2012. |
150
Basic Information About Management (continued)
Officers
None of the officers listed below have received compensation from the Trust. All of the officers of the Trust also may be officers of the other Lord Abbett-sponsored funds and maintain offices at 90 Hudson Street, Jersey City, NJ 07302. Unless otherwise indicated, the position(s) and title(s) listed under the “Principal Occupation During the Past Five Years” column indicate each officer’s position(s) and title(s) with Lord Abbett.
|
|
|
|
|
|
|
Name and |
| Current Position |
| Length of Service |
| Principal Occupation |
Daria L. Foster |
| President and Chief |
| Elected as |
| Managing Partner of Lord Abbett (since 2007), and was formerly Director of Marketing and Client Service, joined Lord Abbett in 1990. |
|
|
|
|
|
|
|
Robert P. Fetch |
| Executive Vice President |
| Elected in 1999 |
| Partner and Director, joined Lord Abbett in 1995. |
|
|
|
|
|
|
|
Robert I. Gerber |
| Executive Vice President |
| Elected in 2005 |
| Partner and Chief Investment Officer (since 2007), joined Lord Abbett in 1997 as Director of Taxable Fixed Income Management. |
|
|
|
|
|
|
|
Gerard S. E. Heffernan, Jr. |
| Executive Vice President |
| Elected in 1999 |
| Partner and Director, joined Lord Abbett in 1998. |
|
|
|
|
|
|
|
Todd D. Jacobson |
| Executive Vice President |
| Elected in 2003 |
| Portfolio Manager, joined Lord Abbett in 2003. |
|
|
|
|
|
|
|
Vincent J. McBride |
| Executive Vice President |
| Elected in 2003 |
| Partner and Director, joined Lord Abbett in 2003. |
|
|
|
|
|
|
|
F. Thomas O’Halloran, III |
| Executive Vice President |
| Elected in 2003 |
| Partner and Director, joined Lord Abbett in 2001. |
|
|
|
|
|
|
|
Harold E. Sharon |
| Executive Vice President |
| Elected in 2003 |
| Partner and Director, joined Lord Abbett in 2003. |
|
|
|
|
|
|
|
A. Edward Allinson |
| Vice President |
| Elected in 2011 |
| Portfolio Manager, joined Lord Abbett in 2005. |
|
|
|
|
|
|
|
James W. Bernaiche |
| Chief Compliance Officer |
| Elected in 2004 |
| Partner and Chief Compliance Officer, joined Lord Abbett in 2001. |
|
|
|
|
|
|
|
Joan A. Binstock |
| Chief Financial Officer and Vice President |
| Elected in 1999 |
| Partner and Chief Operations Officer, joined Lord Abbett in 1999. |
151
Basic Information About Management (concluded)
|
|
|
|
|
|
|
Name and |
| Current Position |
| Length of Service |
| Principal Occupation |
John K. Forst |
| Vice President and |
| Elected in 2005 |
| Deputy General Counsel, joined Lord Abbett in 2004. |
|
|
|
|
|
|
|
Anthony W. Hipple |
| Vice President |
| Elected in 2006 |
| Portfolio Manager, joined Lord Abbett in 2002. |
|
|
|
|
|
|
|
Lawrence H. Kaplan |
| Vice President and |
| Elected in 1997 |
| Partner and General Counsel, joined Lord Abbett in 1997. |
|
|
|
|
|
|
|
Deepak Khanna |
| Vice President |
| Elected in 2008 |
| Partner and Portfolio Manager, rejoined Lord Abbett in 2007. |
|
|
|
|
|
|
|
David J. Linsen |
| Vice President |
| Elected in 2011 |
| Partner and Director, joined Lord Abbett in 2001. |
|
|
|
|
|
|
|
Steven M. Lipper |
| Vice President |
| Elected in 2011 |
| Director, Product Management, joined Lord Abbett in 2004. |
|
|
|
|
|
|
|
Thomas B. Maher |
| Vice President |
| Elected in 2008 |
| Partner and Portfolio Manager, joined Lord Abbett in 2003. |
|
|
|
|
|
|
|
Justin C. Maurer |
| Vice President |
| Elected in 2008 |
| Partner and Portfolio Manager, joined Lord Abbett in 2001. |
|
|
|
|
|
|
|
A. Edward Oberhaus, III |
| Vice President |
| Elected in 1993 |
| Partner and Director, joined Lord Abbett in 1983. |
|
|
|
|
|
|
|
Thomas R. Phillips |
| Vice President and |
| Elected in 2008 |
| Partner and Deputy General Counsel, joined Lord Abbett in 2006. |
|
|
|
|
|
|
|
Lawrence B. Stoller |
| Vice President and |
| Elected in 2007 |
| Partner and Senior Deputy General Counsel, joined Lord Abbett in 2007. |
|
|
|
|
|
|
|
Paul J. Volovich |
| Vice President |
| Elected in 2011 |
| Partner and Director, joined Lord Abbett in 1997. |
|
|
|
|
|
|
|
Arthur K. Weise |
| Vice President |
| Elected in 2011 |
| Partner and Portfolio Manager, joined Lord Abbett in 2007 and was formerly a Managing Director, Portfolio Manager and Analyst at Bank of New York Institutional Asset Management (2005 - 2007). |
|
|
|
|
|
|
|
Scott S. Wallner |
| AML Compliance Officer |
| Elected in 2011 |
| Assistant General Counsel, joined Lord Abbett in 2004. |
|
|
|
|
|
|
|
Bernard J. Grzelak |
| Treasurer |
| Elected in 2003 |
| Partner and Director of Fund Administration, joined Lord Abbett in 2003. |
Please call 888–522–2388 for a copy of the statement of additional information (“SAI”), which contains further information about the Trust’s Trustees. It is available free upon request.
152
Supplemental Proxy Information (unaudited)
A special meeting of the shareholders (the “Meeting”) of Large Cap Value Fund was held on May 18, 2012. Large Cap Value Fund was a series of the Trust.
The Meeting was held for the purpose of approving a Plan of Reorganization between Large Cap Value Fund and Lord Abbett Fundamental Equity Fund, providing for: (a) the transfer of all of the assets of Large Cap Value Fund to Fundamental Equity Fund in exchange for shares of the corresponding class of Fundamental Equity Fund and the assumption by Fundamental Equity Fund of all of the liabilities of Large Cap Value Fund; (b) the distribution of such shares to the shareholders of Large Cap Value Fund; and (c) the termination of Large Cap Value Fund.
The results of the shareholder vote on the preceding matter were as follows:
|
|
|
|
|
|
|
|
Matter |
| Votes For |
| Votes Against |
| Abstentions |
|
1. Proposal — Approval of a Plan of Reorganization |
| 1,872,475.370 |
| 376,963.490 |
| 66,995.293 |
|
153
Householding
The Trust has adopted a policy that allows it to send only one copy of each Fund’s prospectus, proxy material, annual report and semiannual report to certain shareholders residing at the same “household.” This reduces Fund expenses, which benefits you and other shareholders. If you need additional copies or do not want your mailings to be “householded,” please call Lord Abbett at 888–522–2388 or send a written request with your name, the name of your fund or funds and your account number or numbers to Lord Abbett Family of Funds, P.O. Box 219336, Kansas City, MO 64121.
Proxy Voting Policies, Procedures and Records
A description of the policies and procedures that Lord Abbett uses to vote proxies related to each Fund’s portfolio securities, and information on how Lord Abbett voted each Fund’s proxies during the 12-month period ended June 30 are available without charge, upon request, (i) by calling 888–522–2388; (ii) on Lord Abbett’s Website at www.lordabbett.com; and (iii) on the Securities and Exchange Commission’s (“SEC”) Website at www.sec.gov.
Shareholder Reports and Quarterly Portfolio Disclosure
The Funds are required to file their complete schedule of portfolio holdings with the SEC for their first and third fiscal quarters on Form N-Q. Copies of the filings are available without charge, upon request on the SEC’s Website at www.sec.gov and may be available by calling Lord Abbett at 888–522–2388. You can also obtain copies of Form N-Q by visiting the SEC’s Public Reference Room in Washington, DC (information on the operation of the Public Reference Room may be obtained by calling 800-SEC-0330).
154
Tax Information
The percentages below reflect the portion of ordinary income distributions that are eligible for the corporate dividend received deduction (DRD) and qualified income (QDI) for individual shareholders:
|
|
|
|
Fund Name | DRD | QDI |
|
Fundamental Equity Fund | 100% | 100% |
|
Growth Leaders Fund | 100% | 100% |
|
International Core Equity Fund | 0% | 100% |
|
International Dividend Income Fund | 0% | 91.22% |
|
International Opportunities Fund | 0% | 100% |
|
Additionally, of the distributions paid to shareholders during the fiscal year ended October 31, 2012, the following amounts represent long-term capital gains:
|
|
|
Fund Name |
|
|
Alpha Strategy Fund | $ 2,851,136 |
|
Fundamental Equity Fund | 96,046,077 |
|
Value Opportunities Fund | 7,161,018 |
|
The International Core Equity Fund, International Dividend Income Fund and International Opportunities Fund intend to pass through foreign source income and foreign taxes as follows:
|
|
|
|
Fund Name | Foreign | Foreign Taxes |
|
International Core Equity Fund | $28,153,066 | $2,061,939 |
|
International Dividend Income Fund | 84,517,845 | 6,050,522 |
|
International Opportunities Fund | 8,899,197 | 603,796 |
|
155
Lord Abbett Privacy Policy
Your privacy is important to us. We respect every individual’s right to privacy and security of information that personally identifies you or your account with us. That is why we are committed to our Privacy Policy, which is outlined below.
We safeguard, according to strict standards of security and confidentiality, any nonpublic personal information our customers share with us. We do not sell personal information to anyone.
In order to properly execute your transactions, we may collect personal information, such as your name, address and social security number, from the applications or other forms that you complete, through your use of our Website, and from market research companies. We also may collect information about your transactions with us or others, such as your account balance and investment and transaction history.
We may share nonpublic personal information with companies that provide services to us, such as transfer agents, printers, technology vendors and others, for your benefit and for the administration of our business. We require these companies to protect the confidentiality of your nonpublic personal information and to use it only for the purposes for which we disclosed the information.
We do not otherwise share nonpublic personal information we collect about you or any of our customers with anyone, except as required or permitted by law.
Our Website uses cookies, which are small files placed on a computer’s hard drive that allows our Website to recognize that computer each time someone uses it to visit our Website. The file contains information about preferences for using our Website that have been established by someone using that computer. Cookies may also be used to keep track of certain other information regarding the use of our Website, such as Website traffic data, that we may use to make decisions about ways to improve our Website. The cookies we use do not include any information about your personal identity or your accounts.
We protect the integrity and privacy of your information in a number of ways. We restrict access to nonpublic personal information about you to those employees who need to know that information to provide products or services to our customers. We maintain physical, electronic and procedural safeguards to guard your nonpublic personal information.
The accuracy of your personal information is important. If you need to correct or update your personal or account information, please call us at 800–821–5129. We will be happy to review, correct or update your personal or account information.
Note: If you invest in the Lord Abbett Family of Funds through an account that is controlled by another financial institution, such as a bank or broker-dealer, the other financial institution’s Privacy Policy may apply to you.
This Privacy Notice is being provided on behalf of the following entities:
Lord Abbett Family of Funds
Lord, Abbett & Co. LLC
Lord Abbett Distributor LLC
This page is not part of the Annual Report
This page is intentionally left blank.
This page is intentionally left blank.
This page is intentionally left blank.
This page is intentionally left blank.

|
|
|
|
|
|
|
|
|
|
|
|
|
|
|
|
|
|
|
|
|
|
|
|
|
|
|
|
|
|
|
|
|
|
|
|
|
|
|
|
|
|
| |
| Lord Abbett Securities Trust |
| |
|
| ||
This report, when not used for the general information of shareholders of the Fund, is to be distributed only if preceded or accompanied by a current fund prospectus. |
| Lord Abbett Alpha Strategy Fund | LST-2-1012 |


2 0 1 2
L O R D A B B E T T
A N N U A L
R E P O R T
Lord Abbett
Micro Cap Growth Fund
Micro Cap Value Fund
For the fiscal year ended October 31, 2012
|
|
Lord Abbett Securities Trust |
Lord Abbett Micro Cap Growth Fund and Lord Abbett Micro Cap Value Fund Annual Report |
For the fiscal year ended October 31, 2012

From left to right: Robert S. Dow, Director and Chairman of the Lord Abbett Funds; E. Thayer Bigelow, Independent Lead Director of the Lord Abbett Funds; and Daria L. Foster, Director, President and Chief Executive Officer of the Lord Abbett Funds.
Dear Shareholders: We are pleased to provide you with this overview of the performance of the Funds for the fiscal year ended October 31, 2012. On this page and the following pages, we discuss the major factors that influenced fiscal year performance. For detailed and more timely information about the Funds, please visit our Website at www.lordabbett.com, where you also can access the quarterly commentaries that provide updates on each Fund’s performance and other portfolio related updates.
Thank you for investing in Lord Abbett mutual funds. We value the trust that you place in us and look forward to serving your investment needs in the years to come.
Best regards,

Chairman
|
Micro Cap Growth Fund |
For the 12-month period ended October 31, 2012, the Fund returned 4.86%, reflecting performance at the net asset value (NAV) of Class A shares, with all distributions reinvested, compared to its benchmark, the Russell Microcap® Growth Index,1 which returned 12.73% over the same period.
Global stock markets began the 12-month period on November 1, 2011, with a sharp sell-off. As political leaders toiled to lift the United States and Europe from an ongoing fiscal crisis, investors were on edge and volatility remained high. Equity markets quickly regained footing by November’s end, as investor fears abated following a move by central banks worldwide to stave off rising unemployment and provide a lifeline to ailing government balance sheets. By May, however, markets once again came under pressure: volatility soared, and the S&P 500® Index2 posted its worst monthly decline since the tumultuous month of September 2011. Fearing the demise of the European Union, and facing the threat of
1
|
|
global recession, European Central Bank president Mario Draghi made a pledge to keep the eurozone solvent and the United States announced a third round of quantitative easing; such action led equity markets to finish the 12-month period in positive territory. |
Despite the Fund showing positive absolute performance for the year, it lagged the index significantly: security-specific issues within the information technology sector and our large underweight to biotechnology names within the health care sector were among the most notable detractors.
In addition to our security selection within the information technology sector, our overweight also detracted from Fund performance during the period. Maxwell Technologies, Inc., a manufacturer of energy storage and power delivery solutions used in mass-transit buses and heavy-transportation vehicles, declined on weakening demand from European markets. Audience, Inc., a leading provider of intelligent voice/audio processors, also saw its shares decline after announcing its audio intellectual property would no longer be used in Apple, Inc.’s new iPhone 5.
Our underweight within the health care sector also detracted from Fund performance; this was predominantly due to our significant underweight to biotechnology names that rallied strongly during the period. We generally are underweight this industry owing to uncertainty surrounding early stage biotechnology companies that commonly have product pipelines still in the clinical trial phase and, thus, typically lack a clear path to profitability. In addition, security selection within the sector detracted from Fund performance. Shares of STAAR Surgical Company, a developer of implantable lenses used in surgical procedures on the human eye, declined sharply following a disappointing earnings report in July. Sagent Pharmaceuticals, Inc., a producer of injectable generic drugs in the United States, also saw its shares decline after management provided weak guidance, citing competitive pressure and supply constraints as key factors weighing on future profitability.
Within the financials sector, our overweight and security selection contributed to Fund performance. Home BancShares, Inc., a provider of commercial and retail banking, contributed to absolute performance within the sector. Shares of the firm have continued to rise on a resurgence in loan growth, with double-digit growth anticipated to carry profits into 2013. Home Loan Servicing Solutions, Ltd. also saw its shares rise following an initial public offering in February 2012. The servicer of mortgage loans has continued to see strong growth, as more banks seek to sell off mortgage assets in an effort to meet new regulatory requirements.
Also benefiting relative performance was our underweight within the energy sector; the sector often provides fewer high-quality microcap names due to the
2
|
|
capital-intensive nature of many energy based industries. A number of notable securities did, however, benefit Fund performance within the sector, including Kodial Oil & Gas Corp. The United States-based producer of crude oil and natural gas has seen its revenue grow substantially after ramping up production in one of the most prolific oil plains in North America. Shares of GasLog Ltd., an international shipper of liquefied natural gas, also benefited Fund performance during the period, as the firm’s fleet of natural gas tankers is anticipated to expand in 2013, which should benefit cash flows. |
Micro Cap Value Fund
For the 12-month period ended October 31, 2012, the Fund returned 15.91%, reflecting performance at the net asset value (NAV) of Class A shares, with all distributions reinvested, compared to its benchmark, Russell Micro-Cap Value Index,3 which returned 19.08% over the same period.
A strong performance by domestic equities was overshadowed by persistent economic uncertainty during the 12-month period. Investors were forced to weigh the negative impacts of the European sovereign debt crisis, decelerating growth in China, and the fragile U.S. economy against the positive effects of global monetary easing and signs of a U.S. housing recovery. In a difficult environment for active money managers, the Fund underperformed during the period by 3.17% relative to the index. Performance lagged most notably in the second quarter of 2012, which accounted for the majority of the Fund’s overall underperformance on a relative basis.
During the period, notable detractors from the Fund’s overall relative performance included two information technology holdings, AXT, Inc. and Lattice Semiconductor Corp. After climbing in the first months of 2012, shares of AXT, Inc., a producer of semiconductor substrates, reversed course, starting in March. The weakness was attributed to the lowered guidance of a significant end customer, and was exacerbated days later when AXT, Inc. guided lower on weak gallium pricing. Due to fundamental disappointments, we closed the position in August 2012. For Lattice Semiconductor Corp., a developer of programmable logic devices, the weakening European economy was blamed for a negative revision in guidance. In September 2012, we decided to exit the position based on fundamental concerns. Industrials holding Commercial Vehicle Group, Inc. was another notable detractor from the Fund’s relative performance. The product supplier of commercial vehicle components continued to experience growth in both earnings and revenues. However, perceived headwinds, such as softening demand within the heavy duty truck market, as well as weakness in the global construction market, weighed on share price. Energy holding Tesco Corp. struggled during the period. The manufacturer and servicer of oil and
3
|
|
natural gas drilling equipment experienced a tough second quarter, as a slowdown in North American activity, coupled with continued issues with gear box casting, were viewed negatively by investors. |
Notable contributors to the Fund’s overall relative performance include materials holding TPC Group, Inc., financials holding Marlin Business Services Corp., industrials holding H&E Equipment Services, Inc., and financials holding Homeowners Choice, Inc. Shares of TPC Group, Inc., a producer of products derived from petrochemical raw materials, moved up significantly in early 2012, which was attributed to a rise in butadiene prices. In August 2012, the company announced it would be acquired by First Reserve Corporation and SK Capital Partners. Marlin Business Services Corp., which provides commercial equipment financing solutions, capitalized on four straight quarters of positive earnings surprises. The company continued to build momentum as the period ended, with net interest income at an all-time high and improving operating efficiency. H & E Equipment Services, Inc., an equipment services company, benefited from improving market trends as well as strong revenues during the period. During September 2012, the company completed a $7 one-time cash dividend that was viewed as positive by investors. Shares of Homeowners Choice, Inc., an insurance holding company, were positively affected by Florida regulators approval of a rate increase in November 2011, policies acquired from HomeWise Insurance, and a 33% increase in annual dividend payout effective March 2012. These three factors contributed to the steady climb in share price throughout the period.
Each Fund’s portfolio is actively managed and, therefore, its holdings and the weightings of a particular issuer or particular sector as a percentage of portfolio assets are subject to change. Sectors may include many industries.
1 The Russell Microcap® Growth Index measures the performance of the microcap growth segment of the U.S. equity market. It includes those Russell Microcap Index companies with higher price-to-book ratios and higher forecasted growth values.
2 The S&P 500® Index is widely regarded as the standard for measuring large cap U.S. stock market performance and includes a representative sample of leading companies in leading industries.
3 The Russell Microcap® Value Index measures the performance of those Russell Midcap companies with lower price-to-book ratios and lower forecasted growth values. The stocks are also members of the Russell 1000 Value Index.
Unless otherwise specified, indexes reflect total return, with all dividends reinvested. Indexes are unmanaged, do not reflect the deduction of fees or expenses, and are not available for direct investment.
Important Performance and Other Information Performance data quoted in the following pages reflect past performance and are no guarantee of future results. Current performance may be higher or lower than the performance quoted. The investment return and principal value of an investment in the Fund will fluctuate so that shares, on any given day or when redeemed, may be worth more or less than their original cost. You can obtain performance data current to the most recent month end by calling Lord Abbett at 888-522-2388 or referring to www.lordabbett.com.
Except where noted, comparative Fund performance does not account for the deduction of sales charges
4
|
|
and would be different if sales charges were included. The Fund offers several classes of shares with distinct pricing options. For a full description of the differences in pricing alternatives, please see the Fund’s prospectus. |
During certain periods shown, expense waivers and reimbursements were in place. Without such expense reimbursements, the Funds’ returns would have been lower.
The annual commentary above discusses the views of the Funds’ management and various portfolio holdings of the Funds as of October 31, 2012. These views and portfolio holdings may have changed after this date. Information provided in the commentary is not a recommendation to buy or sell securities. Because the Funds’ portfolios are actively managed and may change significantly, the Funds may no longer own the securities described above or may have otherwise changed their positions in the securities. For more recent information about the Funds’ portfolio holdings, please visit www.lordabbett.com.
A Note about Risk: See Notes to Financial Statements for a discussion of investment risks. For a more detailed discussion of the risks associated with the Fund, please see the Fund’s prospectus.
Mutual funds are not insured by the FDIC, are not deposits or other obligations of, or guaranteed by, banks, and are subject to investment risks including possible loss of principal amount invested.
5
|
Micro Cap Growth Fund |
Investment Comparison |
Below is a comparison of a $10,000 investment in Class A shares with the same investment in the Russell Microcap® Index and the Russell Microcap® Growth Index, assuming reinvestment of all dividends and distributions. The performance of the other class will be greater than or less than the performance shown in the graph below due to different sales loads and expenses applicable to such class. The graph and performance table below do not reflect the deduction of taxes that a shareholder would pay on Fund distributions or the redemption of Fund shares. During certain periods, expenses of the Fund have been waived or reimbursed by Lord Abbett; without such waiver or reimbursement of expenses, the Fund’s returns would have been lower. Past performance is no guarantee of future results.
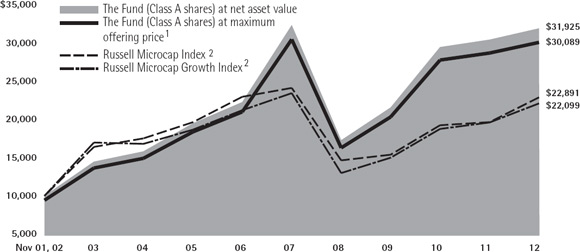
Average Annual Total Returns at Maximum Applicable
Sales Charge for the Periods Ended October 31, 2012
|
|
|
|
|
|
|
|
|
| 1 Year |
| 5 Years |
| 10 Years |
|
Class A3 |
| -1.14% |
| -1.43% |
| 11.64% |
|
Class I4 |
| 5.10% |
| 0.00% |
| 12.59% |
|
|
1 Reflects the deduction of the maximum initial sales charge of 5.75%. |
2 Performance for each unmanaged index does not reflect any fees or expenses. The performance of each index is not necessarily representative of the Fund’s performance. |
3 Total return, which is the percent change in net asset value, after deduction of the maximum initial sales charge of 5.75% applicable to Class A shares, with all dividends and distributions reinvested for the periods shown ended October 31, 2012, is calculated using the SEC required uniform method to compute such return. |
4 Performance is at net asset value. |
6
|
Micro Cap Value Fund |
Investment Comparison |
Below is a comparison of a $10,000 investment in Class A shares with the same investment in the Russell Microcap® Index and the Russell Microcap® Value Index, assuming reinvestment of all dividends and distributions. The performance of the other class will be greater than or less than the performance shown in the graph below due to different sales loads and expenses applicable to such class. The graph and performance table below do not reflect the deduction of taxes that a shareholder would pay on Fund distributions or the redemption of Fund shares. During certain periods, expenses of the Fund have been waived or reimbursed by Lord Abbett; without such waiver or reimbursement of expenses, the Fund’s returns would have been lower. Past performance is no guarantee of future results.
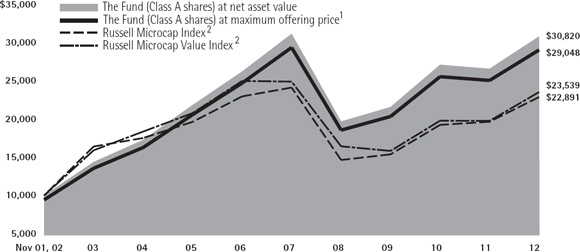
Average Annual Total Returns at Maximum Applicable
Sales Charge for the Periods Ended October 31, 2012
|
|
|
|
|
|
|
|
|
| 1 Year |
| 5 Years |
| 10 Years |
|
Class A3 |
| 9.23% |
| -1.39% |
| 11.25% |
|
Class I4 |
| 16.21% |
| 0.03% |
| 12.21% |
|
|
1 Reflects the deduction of the maximum initial sales charge of 5.75%. |
2 Performance for each unmanaged index does not reflect any fees or expenses. The performance of each index is not necessarily representative of the Fund’s performance. |
3 Total return, which is the percent change in net asset value, after deduction of the maximum initial sales charge of 5.75% applicable to Class A shares, with all dividends and distributions reinvested for the periods shown ended October 31, 2012, is calculated using the SEC required uniform method to compute such return. |
4 Performance is at net asset value. |
7
|
|
Expense Example |
As a shareholder of a Fund, you incur two types of costs: (1) transaction costs, including sales charges (loads) on purchase payments (these charges vary among the share classes); and (2) ongoing costs, including management fees; distribution and service (12b-1) fees (these charges vary among the share classes); and other Fund expenses. This Example is intended to help you understand your ongoing costs (in dollars) of investing in the Funds and to compare these costs with the ongoing costs of investing in other mutual funds.
The Example is based on an investment of $1,000 invested at the beginning of the period and held for the entire period (May 1, 2012 through October 31, 2012).
Actual Expenses
For each class of each Fund, the first line of the tables on the following pages provides information about actual account values and actual expenses. You may use the information in this line, together with the amount you invested, to estimate the expenses that you paid over the period. Simply divide your account value by $1,000 (for example, an $8,600 account value divided by $1,000 = 8.6), then multiply the result by the number in the first line under the heading titled “Expenses Paid During Period 5/1/12—10/31/12” to estimate the expenses you paid on your account during this period.
Hypothetical Example for Comparison Purposes
For each class of each Fund, the second line of the tables on the following pages provides information about hypothetical account values and hypothetical expenses based on the Fund’s actual expense ratio and an assumed rate of return of 5% per year before expenses, which is not each Fund’s actual return. The hypothetical account values and expenses may not be used to estimate the actual ending account balance or expenses you paid for the period. You may use this information to compare the ongoing costs of investing in each Fund and other funds. To do so, compare this 5% hypothetical example with the 5% hypothetical examples that appear in the shareholder reports of the other funds.
8
|
Micro Cap Growth Fund |
Please note that the expenses shown in the table are meant to highlight your ongoing costs only and do not reflect any transactional costs, such as sales charges (loads). Therefore, the second line of the table is useful in comparing ongoing costs only, and will not help you determine the relative total costs of owning different funds. In addition, if these transactional costs were included, your costs would have been higher.
|
|
|
|
|
|
|
|
|
|
|
|
|
|
| Beginning |
| Ending |
| Expenses |
| |||||
|
|
|
|
| ||||||||
|
| 5/1/12 |
| 10/31/12 |
| 5/1/12 - |
| |||||
|
|
|
|
| ||||||||
Class A |
|
|
|
|
|
|
|
|
|
|
|
|
Actual |
|
| $1,000.00 |
| $ | 909.90 |
|
| $ | 10.08 |
|
|
Hypothetical (5% Return Before Expenses) |
|
| $1,000.00 |
| $ | 1,014.56 |
|
| $ | 10.63 |
|
|
Class I |
|
|
|
|
|
|
|
|
|
|
|
|
Actual |
|
| $1,000.00 |
| $ | 911.00 |
|
| $ | 8.89 |
|
|
Hypothetical (5% Return Before Expenses) |
|
| $1,000.00 |
| $ | 1,015.82 |
|
| $ | 9.37 |
|
|
|
|
† | For each class of the Fund, net expenses are equal to the annualized expense ratio for such class (2.10% for Class A and 1.85% for Class I) multiplied by the average account value over the period, multiplied by 184/366 (to reflect one-half year period). |
|
Portfolio Holdings Presented by Sector |
October 31, 2012 |
|
|
|
Sector* | %** |
|
Consumer Discretionary | 13.78% |
|
Consumer Staples | 4.91% |
|
Energy | 4.37% |
|
Financials | 12.17% |
|
Health Care | 32.60% |
|
Industrials | 10.38% |
|
Information Technology | 18.73% |
|
Short-Term Investment | 3.06% |
|
Total | 100.00% |
|
|
|
* | A sector may comprise several industries. |
** | Represents percent of total investments. |
9
|
Micro Cap Value Fund |
Please note that the expenses shown in the table are meant to highlight your ongoing costs only and do not reflect any transactional costs, such as sales charges (loads). Therefore, the second line of the table is useful in comparing ongoing costs only, and will not help you determine the relative total costs of owning different funds. In addition, if these transactional costs were included, your costs would have been higher.
|
|
|
|
|
|
|
|
|
|
|
|
|
|
| Beginning |
| Ending |
| Expenses |
| |||||
|
|
|
|
| ||||||||
|
| 5/1/12 |
| 10/31/12 |
| 5/1/12 - |
| |||||
|
|
|
|
| ||||||||
Class A |
|
|
|
|
|
|
|
|
|
|
|
|
Actual |
|
| $1,000.00 |
|
| $1,020.80 |
|
| $ | 10.41 |
|
|
Hypothetical (5% Return Before Expenses) |
|
| $1,000.00 |
|
| $1,014.82 |
|
| $ | 10.38 |
|
|
Class I |
|
|
|
|
|
|
|
|
|
|
|
|
Actual |
|
| $1,000.00 |
|
| $1,022.50 |
|
| $ | 9.15 |
|
|
Hypothetical (5% Return Before Expenses) |
|
| $1,000.00 |
|
| $1,016.08 |
|
| $ | 9.12 |
|
|
|
|
† | For each class of the Fund, net expenses are equal to the annualized expense ratio for such class (2.05% for Class A and 1.80% for Class I) multiplied by the average account value over the period, multiplied by 184/366 (to reflect one year period). |
|
Portfolio Holdings Presented by Sector |
October 31, 2012 |
|
|
|
|
Sector* |
| %** |
|
Consumer Discretionary |
| 10.76% |
|
Consumer Staples |
| 2.07% |
|
Energy |
| 0.35% |
|
Financials |
| 28.33% |
|
Health Care |
| 10.02% |
|
Industrials |
| 28.30% |
|
Information Technology |
| 9.85% |
|
Materials |
| 6.47% |
|
Utilities |
| 2.32% |
|
Short-Term Investment |
| 1.53% |
|
Total |
| 100.00% |
|
|
|
* | A sector may comprise several industries. |
** | Represents percent of total investments. |
10
|
Schedule of Investments |
MICRO CAP GROWTH FUND October 31, 2012 |
|
|
|
|
|
|
|
|
Investments |
| Shares |
| Fair |
| ||
| |||||||
LONG-TERM INVESTMENTS 97.11% |
|
|
|
|
|
|
|
|
|
|
|
|
|
|
|
COMMON STOCKS 97.11% |
|
|
|
|
|
|
|
|
|
|
|
|
|
|
|
Air Freight & Logistics 1.01% |
|
|
|
|
|
|
|
Echo Global Logistics, Inc.* |
|
| 60,902 |
| $ | 1,024 |
|
|
|
|
|
|
| ||
|
|
|
|
|
|
|
|
Biotechnology 13.65% |
|
|
|
|
|
|
|
Achillion |
|
|
|
|
|
|
|
Pharmaceuticals, Inc.* |
|
| 184,336 |
|
| 1,740 |
|
Aegerion |
|
|
|
|
|
|
|
Pharmaceuticals, Inc.* |
|
| 31,885 |
|
| 717 |
|
Affymax, Inc.* |
|
| 109,763 |
|
| 2,501 |
|
Array BioPharma, Inc.* |
|
| 345,845 |
|
| 1,432 |
|
Celldex Therapeutics, Inc.* |
|
| 274,473 |
|
| 1,512 |
|
Dynavax Technologies Corp.* |
|
| 272,465 |
|
| 1,128 |
|
Genomic Health, Inc.* |
|
| 27,732 |
|
| 867 |
|
Puma Biotechnology, Inc.* |
|
| 32,900 |
|
| 678 |
|
Rigel Pharmaceuticals, Inc.* |
|
| 183,804 |
|
| 1,638 |
|
Sarepta Therapeutics, Inc.* |
|
| 76,112 |
|
| 1,622 |
|
|
|
|
|
|
| ||
Total |
|
|
|
|
| 13,835 |
|
|
|
|
|
|
| ||
|
|
|
|
|
|
|
|
Commercial Banks 3.39% |
|
|
|
|
|
|
|
Home BancShares, Inc. |
|
| 47,624 |
|
| 1,650 |
|
Western Alliance Bancorp* |
|
| 174,096 |
|
| 1,786 |
|
|
|
|
|
|
| ||
Total |
|
|
|
|
| 3,436 |
|
|
|
|
|
|
| ||
|
|
|
|
|
|
|
|
Commercial Services & Supplies 0.96% |
|
|
|
|
|
|
|
Encore Capital Group, Inc.* |
|
| 33,565 |
|
| 973 |
|
|
|
|
|
|
| ||
|
|
|
|
|
|
|
|
Consumer Finance 2.21% |
|
|
|
|
|
|
|
NetSpend Holdings, Inc.* |
|
| 209,456 |
|
| 2,243 |
|
|
|
|
|
|
| ||
|
|
|
|
|
|
|
|
Diversified Consumer Services 1.06% |
|
|
|
|
|
|
|
LifeLock, Inc.* |
|
| 147,584 |
|
| 1,070 |
|
|
|
|
|
|
| ||
|
|
|
|
|
|
|
|
Electrical Equipment 1.63% |
|
|
|
|
|
|
|
Capstone Turbine Corp.* |
|
| 526,259 |
|
| 526 |
|
Thermon Group |
|
|
|
|
|
|
|
Holdings, Inc.* |
|
| 45,449 |
|
| 1,129 |
|
|
|
|
|
|
| ||
Total |
|
|
|
|
| 1,655 |
|
|
|
|
|
|
| ||
|
|
|
|
|
|
|
|
Investments |
| Shares |
| Fair |
| ||
| |||||||
Electronic Equipment, Instruments & |
|
|
|
|
|
|
|
FARO Technologies, Inc.* |
|
| 12,589 |
| $ | 506 |
|
|
|
|
|
|
| ||
|
|
|
|
|
|
|
|
Energy Equipment & Services 2.88% |
|
|
|
|
|
|
|
Geospace Technologies Corp.* |
|
| 10,852 |
|
| 703 |
|
Global Geophysical |
|
| 174,083 |
|
| 804 |
|
RigNet, Inc.* |
|
| 76,112 |
|
| 1,413 |
|
|
|
|
|
|
| ||
Total |
|
|
|
|
| 2,920 |
|
|
|
|
|
|
| ||
|
|
|
|
|
|
|
|
Food & Staples Retailing 0.96% |
|
|
|
|
|
|
|
Natural Grocers by Vitamin |
|
| 48,245 |
|
| 978 |
|
|
|
|
|
|
| ||
|
|
|
|
|
|
|
|
Food Products 2.90% |
|
|
|
|
|
|
|
Annie’s, Inc.* |
|
| 44,265 |
|
| 1,748 |
|
Smart Balance, Inc.* |
|
| 99,816 |
|
| 1,188 |
|
|
|
|
|
|
| ||
Total |
|
|
|
|
| 2,936 |
|
|
|
|
|
|
| ||
|
|
|
|
|
|
|
|
Health Care Equipment & Supplies 9.84% |
|
|
|
|
|
|
|
Conceptus, Inc.* |
|
| 85,465 |
|
| 1,610 |
|
DexCom, Inc.* |
|
| 139,235 |
|
| 1,824 |
|
Endologix, Inc.* |
|
| 19,568 |
|
| 263 |
|
Insulet Corp.* |
|
| 50,833 |
|
| 1,078 |
|
Novadaq Technologies, |
|
| 132,165 |
|
| 1,520 |
|
OraSure Technologies, Inc.* |
|
| 131,679 |
|
| 1,193 |
|
SurModics, Inc.* |
|
| 53,888 |
|
| 969 |
|
Vascular Solutions, Inc.* |
|
| 100,509 |
|
| 1,515 |
|
|
|
|
|
|
| ||
Total |
|
|
|
|
| 9,972 |
|
|
|
|
|
|
| ||
|
|
|
|
|
|
|
|
Health Care Providers & Services 1.70% |
|
|
|
|
|
|
|
IPC The Hospitalist Co., Inc.* |
|
| 21,162 |
|
| 730 |
|
MWI Veterinary Supply, Inc.* |
|
| 9,449 |
|
| 992 |
|
|
|
|
|
|
| ||
Total |
|
|
|
|
| 1,722 |
|
|
|
|
|
|
| ||
|
|
|
|
|
|
|
|
Health Care Technology 4.84% |
|
|
|
|
|
|
|
Greenway Medical |
|
|
|
|
|
|
|
Technologies* |
|
| 99,250 |
|
| 1,647 |
|
HealthStream, Inc.* |
|
| 53,300 |
|
| 1,361 |
|
Vocera Communications, Inc.* |
|
| 70,742 |
|
| 1,902 |
|
|
|
|
|
|
| ||
Total |
|
|
|
|
| 4,910 |
|
|
|
|
|
|
| ||
|
|
|
| See Notes to Financial Statements. | 11 |
|
Schedule of Investments (continued) |
MICRO CAP GROWTH FUND October 31, 2012 |
|
|
|
|
|
|
|
|
Investments |
| Shares |
| Fair |
| ||
| |||||||
Hotels, Restaurants & Leisure 1.68% |
|
|
|
|
|
|
|
Chuy’s Holdings, Inc.* |
|
| 42,321 |
| $ | 1,034 |
|
Ignite Restaurant Group, Inc.* |
|
| 58,182 |
|
| 667 |
|
|
|
|
|
|
| ||
Total |
|
|
|
|
| 1,701 |
|
|
|
|
|
|
| ||
|
|
|
|
|
|
|
|
Household Durables 0.51% |
|
|
|
|
|
|
|
iRobot Corp.* |
|
| 29,039 |
|
| 522 |
|
|
|
|
|
|
| ||
|
|
|
|
|
|
|
|
Information Technology Services 1.27% |
|
|
|
|
|
|
|
EPAM Systems, Inc.* |
|
| 71,373 |
|
| 1,283 |
|
|
|
|
|
|
| ||
|
|
|
|
|
|
|
|
Insurance 2.88% |
|
|
|
|
|
|
|
eHealth, Inc.* |
|
| 90,622 |
|
| 1,966 |
|
Hilltop Holdings, Inc.* |
|
| 69,894 |
|
| 950 |
|
|
|
|
|
|
| ||
Total |
|
|
|
|
| 2,916 |
|
|
|
|
|
|
| ||
|
|
|
|
|
|
|
|
Internet & Catalog Retail 0.98% |
|
|
|
|
|
|
|
Blue Nile, Inc.* |
|
| 26,215 |
|
| 990 |
|
|
|
|
|
|
| ||
|
|
|
|
|
|
|
|
Internet Software & Services 8.27% |
|
|
|
|
|
|
|
Angie’s List, Inc.* |
|
| 138,706 |
|
| 1,587 |
|
Cornerstone OnDemand, Inc.* |
|
| 57,422 |
|
| 1,607 |
|
Demandware, Inc.* |
|
| 30,295 |
|
| 899 |
|
E2open, Inc.* |
|
| 61,069 |
|
| 1,069 |
|
LivePerson, Inc.* |
|
| 54,244 |
|
| 851 |
|
Trulia, Inc.* |
|
| 47,579 |
|
| 1,073 |
|
Velti plc (Ireland)*(a) |
|
| 178,247 |
|
| 1,301 |
|
|
|
|
|
|
| ||
Total |
|
|
|
|
| 8,387 |
|
|
|
|
|
|
| ||
|
|
|
|
|
|
|
|
Leisure Equipment & Products 0.73% |
|
|
|
|
|
|
|
Arctic Cat, Inc.* |
|
| 20,393 |
|
| 740 |
|
|
|
|
|
|
| ||
|
|
|
|
|
|
|
|
Life Sciences Tools & Services 1.25% |
|
|
|
|
|
|
|
Fluidigm Corp.* |
|
| 83,958 |
|
| 1,267 |
|
|
|
|
|
|
| ||
|
|
|
|
|
|
|
|
Machinery 3.08% |
|
|
|
|
|
|
|
Dynamic Materials Corp. |
|
| 48,060 |
|
| 645 |
|
Proto Labs, Inc.* |
|
| 25,537 |
|
| 886 |
|
RBC Bearings, Inc.* |
|
| 32,155 |
|
| 1,597 |
|
|
|
|
|
|
| ||
Total |
|
|
|
|
| 3,128 |
|
|
|
|
|
|
| ||
|
|
|
|
|
|
|
|
Media 1.72% |
|
|
|
|
|
|
|
Shutterstock, Inc.* |
|
| 73,400 |
|
| 1,743 |
|
|
|
|
|
|
| ||
|
|
|
|
|
|
|
|
Investments |
| Shares |
| Fair |
| ||
| |||||||
Oil, Gas & Consumable Fuels 1.50% |
|
|
|
|
|
|
|
GasLog Ltd. (Monaco)*(a) |
|
| 131,401 |
| $ | 1,516 |
|
|
|
|
|
|
| ||
|
|
|
|
|
|
|
|
Personal Products 1.06% |
|
|
|
|
|
|
|
Schiff Nutrition |
|
| 31,637 |
|
| 1,071 |
|
|
|
|
|
|
| ||
|
|
|
|
|
|
|
|
Pharmaceuticals 1.38% |
|
|
|
|
|
|
|
Pacira Pharmaceuticals, Inc. |
|
| 88,424 |
|
| 1,404 |
|
|
|
|
|
|
| ||
|
|
|
|
|
|
|
|
Professional Services 2.46% |
|
|
|
|
|
|
|
WageWorks, Inc.* |
|
| 128,646 |
|
| 2,495 |
|
|
|
|
|
|
| ||
|
|
|
|
|
|
|
|
Semiconductors & Semiconductor |
|
|
|
|
|
|
|
Monolithic Power |
|
| 54,867 |
|
| 1,066 |
|
PDF Solutions, Inc.* |
|
| 78,958 |
|
| 1,046 |
|
|
|
|
|
|
| ||
Total |
|
|
|
|
| 2,112 |
|
|
|
|
|
|
| ||
|
|
|
|
|
|
|
|
Software 6.64% |
|
|
|
|
|
|
|
Allot Communications |
|
| 29,257 |
|
| 684 |
|
Eloqua, Inc.* |
|
| 105,399 |
|
| 2,459 |
|
Imperva, Inc.* |
|
| 65,994 |
|
| 2,081 |
|
Proofpoint, Inc.* |
|
| 114,556 |
|
| 1,513 |
|
|
|
|
|
|
| ||
Total |
|
|
|
|
| 6,737 |
|
|
|
|
|
|
| ||
|
|
|
|
|
|
|
|
Specialty Retail 5.69% |
|
|
|
|
|
|
|
Hibbett Sports, Inc.* |
|
| 17,733 |
|
| 957 |
|
Lithia Motors, Inc. Class A |
|
| 29,199 |
|
| 999 |
|
Lumber Liquidators |
|
| 38,188 |
|
| 2,132 |
|
Tilly’s, Inc.* |
|
| 103,924 |
|
| 1,677 |
|
|
|
|
|
|
| ||
Total |
|
|
|
|
| 5,765 |
|
|
|
|
|
|
| ||
|
|
|
|
|
|
|
|
Textiles, Apparel & Luxury Goods 1.44% |
|
|
|
|
|
|
|
G-III Apparel Group Ltd.* |
|
| 39,562 |
|
| 1,462 |
|
|
|
|
|
|
| ||
|
|
|
|
|
|
|
|
Thrifts & Mortgage Finance 3.71% |
|
|
|
|
|
|
|
Home Loan Servicing |
|
| 135,222 |
|
| 2,624 |
|
ViewPoint Financial |
|
| 54,582 |
|
| 1,135 |
|
|
|
|
|
|
| ||
Total |
|
|
|
|
| 3,759 |
|
|
|
|
|
|
| ||
|
|
|
12 | See Notes to Financial Statements. |
|
|
Schedule of Investments (concluded) |
MICRO CAP GROWTH FUND October 31, 2012 |
|
|
|
|
|
|
|
|
Investments |
| Shares |
| Fair |
| ||
| |||||||
Trading Companies & Distributors 1.25% |
|
|
|
|
|
|
|
DXP Enterprises, Inc.* |
|
| 25,820 |
| $ | 1,271 |
|
|
|
|
|
|
| ||
Total Common Stocks |
|
|
|
|
| 98,449 |
|
|
|
|
|
|
| ||
|
|
|
|
|
|
|
|
WARRANT 0.00% |
|
|
|
|
|
|
|
|
|
|
|
|
|
|
|
Oil, Gas & Consumable Fuels |
|
|
|
|
|
|
|
Magnum Hunter Resources |
|
| 13,683 |
|
| — | (c) |
|
|
|
|
|
| ||
Total Long-Term Investments |
|
|
|
|
| 98,449 |
|
|
|
|
|
|
| ||
|
|
|
|
|
|
|
|
Investments |
| Principal |
|
| Fair |
| |
| |||||||
SHORT-TERM INVESTMENT 3.06% |
|
|
|
|
|
|
|
|
|
|
|
|
|
|
|
Repurchase Agreement |
|
|
|
|
|
|
|
Repurchase Agreement |
| $ | 3,109 |
| $ | 3,109 |
|
|
|
|
|
|
| ||
Total Investments in |
|
|
|
|
| 101,558 |
|
|
|
|
|
|
| ||
Liabilities in Excess of |
|
|
|
|
| (177 | ) |
|
|
|
|
|
| ||
Net Assets 100.00% |
|
|
|
| $ | 101,381 |
|
|
|
|
|
|
| ||
|
|
* | Non-income producing security. |
(a) | Foreign security traded in U.S. dollars. |
(b) | Exercise price of $10.50 and expiration date of 10/14/2013. |
(c) | Valued at zero as of October 31, 2012. |
|
|
|
| See Notes to Financial Statements. | 13 |
|
Schedule of Investments |
MICRO CAP VALUE FUND October 31, 2012 |
|
|
|
|
|
|
|
|
Investments |
| Shares |
| Fair |
| ||
| |||||||
COMMON STOCKS 98.60% |
|
|
|
|
|
|
|
|
|
|
|
|
|
|
|
Aerospace & Defense 1.28% |
|
|
|
|
|
|
|
CPI Aerostructures, Inc.* |
|
| 147,900 |
| $ | 1,628 |
|
|
|
|
|
|
| ||
|
|
|
|
|
|
|
|
Auto Components 2.94% |
|
|
|
|
|
|
|
Dorman Products, Inc.* |
|
| 55,000 |
|
| 1,680 |
|
Drew Industries, Inc.* |
|
| 65,275 |
|
| 2,068 |
|
|
|
|
|
|
| ||
Total |
|
|
|
|
| 3,748 |
|
|
|
|
|
|
| ||
|
|
|
|
|
|
|
|
Chemicals 4.14% |
|
|
|
|
|
|
|
Balchem Corp. |
|
| 41,400 |
|
| 1,442 |
|
KMG Chemicals, Inc. |
|
| 108,648 |
|
| 1,856 |
|
Quaker Chemical Corp. |
|
| 37,400 |
|
| 1,982 |
|
|
|
|
|
|
| ||
Total |
|
|
|
|
| 5,280 |
|
|
|
|
|
|
| ||
|
|
|
|
|
|
|
|
Commercial Banks 15.21% |
|
|
|
|
|
|
|
Bank of Marin Bancorp |
|
| 41,800 |
|
| 1,560 |
|
Bryn Mawr Bank Corp. |
|
| 69,782 |
|
| 1,580 |
|
CoBiz Financial, Inc. |
|
| 141,974 |
|
| 1,012 |
|
Lakeland Financial Corp. |
|
| 50,000 |
|
| 1,334 |
|
MidSouth Bancorp, Inc. |
|
| 127,946 |
|
| 1,983 |
|
Northrim BanCorp, Inc. |
|
| 76,074 |
|
| 1,714 |
|
Park Sterling Corp.* |
|
| 237,900 |
|
| 1,190 |
|
Sandy Spring Bancorp, Inc. |
|
| 104,891 |
|
| 2,006 |
|
SCBT Financial Corp. |
|
| 47,960 |
|
| 1,903 |
|
Southern National Bancorp |
|
| 126,400 |
|
| 1,029 |
|
Sterling Bancorp |
|
| 215,394 |
|
| 2,057 |
|
Washington Banking Co. |
|
| 147,701 |
|
| 2,019 |
|
|
|
|
|
|
| ||
Total |
|
|
|
|
| 19,387 |
|
|
|
|
|
|
| ||
|
|
|
|
|
|
|
|
Commercial Services & Supplies 8.12% |
|
|
|
|
|
|
|
McGrath RentCorp |
|
| 69,200 |
|
| 1,817 |
|
Mobile Mini, Inc.* |
|
| 102,494 |
|
| 1,786 |
|
Multi-Color Corp. |
|
| 136,886 |
|
| 3,110 |
|
Team, Inc.* |
|
| 56,900 |
|
| 1,865 |
|
TMS International Corp. |
|
| 169,100 |
|
| 1,772 |
|
|
|
|
|
|
| ||
Total |
|
|
|
|
| 10,350 |
|
|
|
|
|
|
| ||
|
|
|
|
|
|
|
|
Investments |
| Shares |
| Fair |
| ||
| |||||||
Communications Equipment 0.71% |
|
|
|
|
|
|
|
Bel Fuse, Inc. Class B |
|
| 54,996 |
| $ | 911 |
|
|
|
|
|
|
| ||
|
|
|
|
|
|
|
|
Computers & Peripherals 1.64% |
|
|
|
|
|
|
|
Electronics for Imaging, Inc.* |
|
| 120,600 |
|
| 2,094 |
|
|
|
|
|
|
| ||
|
|
|
|
|
|
|
|
Construction & Engineering 1.70% |
|
|
|
|
|
|
|
MYR Group, Inc.* |
|
| 102,400 |
|
| 2,169 |
|
|
|
|
|
|
| ||
|
|
|
|
|
|
|
|
Diversified Financial Services 2.25% |
|
|
|
|
|
|
|
Marlin Business |
|
| 127,068 |
|
| 2,870 |
|
|
|
|
|
|
| ||
|
|
|
|
|
|
|
|
Electrical Equipment 2.63% |
|
|
|
|
|
|
|
AZZ, Inc. |
|
| 19,200 |
|
| 757 |
|
Powell Industries, Inc.* |
|
| 25,200 |
|
| 1,003 |
|
Thermon Group |
|
| 63,900 |
|
| 1,587 |
|
|
|
|
|
|
| ||
Total |
|
|
|
|
| 3,347 |
|
|
|
|
|
|
| ||
|
|
|
|
|
|
|
|
Electronic Equipment, Instruments & |
|
|
|
|
|
|
|
CTS Corp. |
|
| 203,825 |
|
| 1,688 |
|
Measurement |
|
| 54,400 |
|
| 1,774 |
|
Methode Electronics, Inc. |
|
| 132,000 |
|
| 1,336 |
|
|
|
|
|
|
| ||
Total |
|
|
|
|
| 4,798 |
|
|
|
|
|
|
| ||
|
|
|
|
|
|
|
|
Energy Equipment & Services 0.35% |
|
|
|
|
|
|
|
Tesco Corp.* |
|
| 50,700 |
|
| 447 |
|
|
|
|
|
|
| ||
|
|
|
|
|
|
|
|
Food Products 2.08% |
|
|
|
|
|
|
|
Overhill Farms, Inc.* |
|
| 587,957 |
|
| 2,646 |
|
|
|
|
|
|
| ||
|
|
|
|
|
|
|
|
Gas Utilities 1.17% |
|
|
|
|
|
|
|
Chesapeake Utilities Corp. |
|
| 31,600 |
|
| 1,484 |
|
|
|
|
|
|
| ||
|
|
|
|
|
|
|
|
Health Care Equipment & Supplies 3.51% |
|
|
|
|
|
|
|
ICU Medical, Inc.* |
|
| 33,300 |
|
| 1,976 |
|
Merit Medical Systems, Inc.* |
|
| 99,125 |
|
| 1,431 |
|
SurModics, Inc.* |
|
| 59,015 |
|
| 1,061 |
|
|
|
|
|
|
| ||
Total |
|
|
|
|
| 4,468 |
|
|
|
|
|
|
| ||
|
|
|
14 | See Notes to Financial Statements. |
|
|
Schedule of Investments (continued) |
MICRO CAP VALUE FUND October 31, 2012 |
|
|
|
|
|
|
|
|
Investments |
| Shares |
| Fair |
| ||
| |||||||
Health Care Providers & Services 6.52% |
|
|
|
|
|
|
|
BioScrip, Inc.* |
|
| 157,200 |
| $ | 1,448 |
|
CorVel Corp.* |
|
| 33,920 |
|
| 1,443 |
|
Gentiva Health Services, Inc.* |
|
| 122,618 |
|
| 1,152 |
|
Metropolitan Health |
|
| 212,000 |
|
| 2,317 |
|
U.S. Physical Therapy, Inc. |
|
| 73,245 |
|
| 1,956 |
|
|
|
|
|
|
| ||
Total |
|
|
|
|
| 8,316 |
|
|
|
|
|
|
| ||
|
|
|
|
|
|
|
|
Hotels, Restaurants & Leisure 1.49% |
|
|
|
|
|
|
|
Caribou Coffee Co., Inc.* |
|
| 86,500 |
|
| 1,035 |
|
Marcus Corp. (The) |
|
| 79,732 |
|
| 869 |
|
|
|
|
|
|
| ||
Total |
|
|
|
|
| 1,904 |
|
|
|
|
|
|
| ||
|
|
|
|
|
|
|
|
Information Technology Services 2.70% |
|
|
|
|
|
|
|
Computer Task Group, Inc.* |
|
| 102,135 |
|
| 1,905 |
|
Virtusa Corp.* |
|
| 89,400 |
|
| 1,534 |
|
|
|
|
|
|
| ||
Total |
|
|
|
|
| 3,439 |
|
|
|
|
|
|
| ||
|
|
|
|
|
|
|
|
Insurance 2.15% |
|
|
|
|
|
|
|
Donegal Group, Inc. Class A |
|
| 121,108 |
|
| 1,569 |
|
Homeowners Choice, Inc. |
|
| 53,000 |
|
| 1,177 |
|
|
|
|
|
|
| ||
Total |
|
|
|
|
| 2,746 |
|
|
|
|
|
|
| ||
|
|
|
|
|
|
|
|
Machinery 0.72% |
|
|
|
|
|
|
|
Commercial Vehicle |
|
| 120,228 |
|
| 913 |
|
|
|
|
|
|
| ||
|
|
|
|
|
|
|
|
Metals & Mining 1.27% |
|
|
|
|
|
|
|
Universal Stainless & |
|
| 47,131 |
|
| 1,621 |
|
|
|
|
|
|
| ||
|
|
|
|
|
|
|
|
Paper & Forest Products 1.06% |
|
|
|
|
|
|
|
Neenah Paper, Inc. |
|
| 52,275 |
|
| 1,354 |
|
|
|
|
|
|
| ||
|
|
|
|
|
|
|
|
Professional Services 0.99% |
|
|
|
|
|
|
|
Exponent, Inc.* |
|
| 22,839 |
|
| 1,256 |
|
|
|
|
|
|
| ||
|
|
|
|
|
|
|
|
Real Estate Investment Trusts 3.20% |
|
|
|
|
|
|
|
Campus Crest |
|
|
|
|
|
|
|
Communities, Inc. |
|
| 157,400 |
|
| 1,746 |
|
Parkway Properties, Inc. |
|
| 89,800 |
|
| 1,236 |
|
Terreno Realty Corp. |
|
| 72,100 |
|
| 1,100 |
|
|
|
|
|
|
| ||
Total |
|
|
|
|
| 4,082 |
|
|
|
|
|
|
| ||
|
|
|
|
|
|
|
|
Investments |
| Shares |
| Fair |
| ||
| |||||||
Road & Rail 4.31% |
|
|
|
|
|
|
|
Celadon Group, Inc. |
|
| 111,400 |
| $ | 1,905 |
|
Marten Transport Ltd. |
|
| 98,403 |
|
| 1,820 |
|
Roadrunner Transportation |
|
| 101,600 |
|
| 1,771 |
|
|
|
|
|
|
| ||
Total |
|
|
|
|
| 5,496 |
|
|
|
|
|
|
| ||
|
|
|
|
|
|
|
|
Semiconductors & Semiconductor |
|
|
|
|
|
|
|
Pericom Semiconductor |
|
| 172,127 |
|
| 1,331 |
|
|
|
|
|
|
| ||
|
|
|
|
|
|
|
|
Specialty Retail 6.35% |
|
|
|
|
|
|
|
America’s Car-Mart, Inc.* |
|
| 33,750 |
|
| 1,413 |
|
Asbury Automotive |
|
| 74,900 |
|
| 2,376 |
|
Lithia Motors, Inc. Class A |
|
| 68,400 |
|
| 2,339 |
|
Shoe Carnival, Inc. |
|
| 83,900 |
|
| 1,961 |
|
|
|
|
|
|
| ||
Total |
|
|
|
|
| 8,089 |
|
|
|
|
|
|
| ||
|
|
|
|
|
|
|
|
Thrifts & Mortgage Finance 5.55% |
|
|
|
|
|
|
|
Brookline Bancorp, Inc. |
|
| 148,800 |
|
| 1,262 |
|
Federal Agricultural |
|
| 25,034 |
|
| 705 |
|
First PacTrust Bancorp, Inc. |
|
| 135,817 |
|
| 1,597 |
|
HomeStreet, Inc.* |
|
| 31,300 |
|
| 1,402 |
|
Territorial Bancorp, Inc. |
|
| 93,500 |
|
| 2,113 |
|
|
|
|
|
|
| ||
Total |
|
|
|
|
| 7,079 |
|
|
|
|
|
|
| ||
|
|
|
|
|
|
|
|
Trading Companies & Distributors 8.60% |
|
|
|
|
|
|
|
CAI International, Inc.* |
|
| 95,200 |
|
| 2,110 |
|
Essex Rental Corp.* |
|
| 366,584 |
|
| 1,250 |
|
H&E Equipment |
|
| 124,100 |
|
| 1,889 |
|
Rush Enterprises, Inc. |
|
| 116,939 |
|
| 2,222 |
|
SeaCube Container |
|
| 118,824 |
|
| 2,200 |
|
Titan Machinery, Inc.* |
|
| 54,600 |
|
| 1,291 |
|
|
|
|
|
|
| ||
Total |
|
|
|
|
| 10,962 |
|
|
|
|
|
|
| ||
|
|
|
| See Notes to Financial Statements. | 15 |
|
Schedule of Investments (concluded) |
MICRO CAP VALUE FUND October 31, 2012 |
|
|
|
|
|
|
|
|
|
|
|
|
|
|
|
|
Investments |
| Shares |
| Fair |
| ||
| |||||||
Water Utilities 1.16% |
|
|
|
|
|
|
|
Connecticut Water |
|
| 48,300 |
| $ | 1,479 |
|
|
|
|
|
|
| ||
Total Common Stocks |
|
|
|
|
| 125,694 |
|
|
|
|
|
|
| ||
|
|
|
|
|
|
|
|
|
| Principal |
|
|
|
| |
|
|
|
|
|
| ||
SHORT-TERM INVESTMENT 1.53% |
|
|
|
|
|
|
|
|
|
|
|
|
|
|
|
Repurchase Agreement |
|
|
|
|
|
|
|
Repurchase Agreement |
| $ | 1,950 |
|
| 1,950 |
|
|
|
|
|
|
| ||
Total Investments in |
|
|
|
|
| 127,644 |
|
|
|
|
|
|
| ||
Liabilities in Excess of |
|
|
|
|
| (170 | ) |
|
|
|
|
|
| ||
Net Assets 100.00% |
|
|
|
| $ | 127,474 |
|
|
|
|
|
|
| ||
|
|
* | Non-income producing security. |
|
|
|
16 | See Notes to Financial Statements. |
|
Statements of Assets and Liabilities
October 31, 2012
|
|
|
|
|
|
|
|
|
| Micro Cap |
| Micro Cap |
| ||
ASSETS: |
|
|
|
|
|
|
|
Investments in securities, at cost |
| $ | 89,047,993 |
| $ | 105,095,618 |
|
Investments in securities, at fair value |
| $ | 101,558,227 |
| $ | 127,644,422 |
|
Receivables: |
|
|
|
|
|
|
|
Interest and dividends |
|
| 14,875 |
|
| 53,684 |
|
Investment securities sold |
|
| — |
|
| 52,247 |
|
Prepaid expenses |
|
| 4,072 |
|
| 12,214 |
|
Total assets |
|
| 101,577,174 |
|
| 127,762,567 |
|
LIABILITIES: |
|
|
|
|
|
|
|
Payables: |
|
|
|
|
|
|
|
Investment securities purchased |
|
| — |
|
| 11,211 |
|
Capital shares reacquired |
|
| — |
|
| 43,366 |
|
Management fee |
|
| 132,964 |
|
| 162,310 |
|
12b-1 distribution fees |
|
| 2,621 |
|
| 6,767 |
|
Trustees’ fees |
|
| 7,702 |
|
| 10,013 |
|
Fund administration |
|
| 3,546 |
|
| 4,328 |
|
To affiliate (See Note 3) |
|
| 13,525 |
|
| 13,673 |
|
Accrued expenses |
|
| 35,480 |
|
| 36,659 |
|
Total liabilities |
|
| 195,838 |
|
| 288,327 |
|
NET ASSETS |
| $ | 101,381,336 |
| $ | 127,474,240 |
|
COMPOSITION OF NET ASSETS: |
|
|
|
|
|
|
|
Paid-in capital |
| $ | 90,309,525 |
| $ | 109,695,110 |
|
Accumulated net investment loss |
|
| (1,617,640 | ) |
| (418,815 | ) |
Accumulated net realized gain (loss) on investments |
|
| 179,217 |
|
| (4,350,859 | ) |
Net unrealized appreciation on investments |
|
| 12,510,234 |
|
| 22,548,804 |
|
Net Assets |
| $ | 101,381,336 |
| $ | 127,474,240 |
|
Net assets by class: |
|
|
|
|
|
|
|
Class A Shares |
| $ | 11,484,125 |
| $ | 30,511,851 |
|
Class I Shares |
| $ | 89,897,211 |
| $ | 96,962,389 |
|
Outstanding shares by class (unlimited number of |
|
|
|
|
|
|
|
Class A Shares |
|
| 818,717 |
|
| 1,150,421 |
|
Class I Shares |
|
| 6,141,451 |
|
| 3,549,393 |
|
Net asset value, offering and redemption price per share |
|
|
|
|
|
|
|
Class A Shares-Net asset value |
| $ | 14.03 |
| $ | 26.52 |
|
Class A Shares-Maximum offering price |
| $ | 14.89 |
| $ | 28.14 |
|
Class I Shares-Net asset value |
| $ | 14.64 |
| $ | 27.32 |
|
|
|
|
| See Notes to Financial Statements. | 17 |
Statements of Operations
For the Year Ended October 31, 2012
|
|
|
|
|
|
|
|
|
| Micro Cap |
| Micro Cap |
| ||
Investment income: |
|
|
|
|
|
|
|
Dividends |
| $ | 170,852 |
| $ | 2,162,614 |
|
Interest |
|
| 266 |
|
| 209 |
|
Total investment income |
|
| 171,118 |
|
| 2,162,823 |
|
Expenses: |
|
|
|
|
|
|
|
Management fee |
|
| 1,594,144 |
|
| 1,895,619 |
|
12b-1 distribution plan-Class A |
|
| 31,068 |
|
| 72,085 |
|
Shareholder servicing |
|
| 19,757 |
|
| 33,047 |
|
Professional |
|
| 42,212 |
|
| 42,311 |
|
Reports to shareholders |
|
| 7,850 |
|
| 9,353 |
|
Fund administration |
|
| 42,511 |
|
| 50,550 |
|
Custody |
|
| 17,654 |
|
| 8,141 |
|
Trustees’ fees |
|
| 3,820 |
|
| 4,521 |
|
Registration |
|
| 28,862 |
|
| 28,442 |
|
Subsidy (See Note 3) |
|
| 194,624 |
|
| 198,877 |
|
Other |
|
| 3,318 |
|
| 3,761 |
|
Gross expenses |
|
| 1,985,820 |
|
| 2,346,707 |
|
Expense reductions (See Note 7) |
|
| (13 | ) |
| (26 | ) |
Net expenses |
|
| 1,985,807 |
|
| 2,346,681 |
|
Net investment loss |
|
| (1,814,689 | ) |
| (183,858 | ) |
Net realized and unrealized gain: |
|
|
|
|
|
|
|
Net realized gain on investments |
|
| 1,219,638 |
|
| 3,480,033 |
|
Net change in unrealized appreciation/depreciation on investments |
|
| 6,331,957 |
|
| 15,593,852 |
|
| |||||||
Net realized and unrealized gain |
|
| 7,551,595 |
|
| 19,073,885 |
|
Net Increase in Net Assets Resulting From Operations |
| $ | 5,736,906 |
| $ | 18,890,027 |
|
|
|
|
18 | See Notes to Financial Statements. |
|
Statements of Changes in Net Assets
|
|
|
|
|
|
|
|
|
| Micro Cap Growth Fund |
| ||||
|
|
| |||||
INCREASE (DECREASE) IN NET ASSETS |
| For the |
| For the |
| ||
Operations: |
|
|
|
|
|
|
|
Net investment loss |
| $ | (1,814,689 | ) | $ | (2,070,238 | ) |
Net realized gain on investments |
|
| 1,219,638 |
|
| 24,812,106 |
|
Net change in unrealized appreciation/depreciation |
|
| 6,331,957 |
|
| (19,800,201 | ) |
Net increase in net assets resulting from operations |
|
| 5,736,906 |
|
| 2,941,667 |
|
Distributions to shareholders from: |
|
|
|
|
|
|
|
Net realized gain |
|
|
|
|
|
|
|
Class A |
|
| (2,348,826 | ) |
| — |
|
Class I |
|
| (13,998,254 | ) |
| — |
|
Total distributions to shareholders |
|
| (16,347,080 | ) |
| — |
|
Capital share transactions (See Note 11): |
|
|
|
|
|
|
|
Net proceeds from sales of shares |
|
| 4,579,643 |
|
| 14,332,083 |
|
Reinvestment of distributions |
|
| 14,787,271 |
|
| — |
|
Cost of shares reacquired |
|
| (16,580,478 | ) |
| (11,880,855 | ) |
Net increase in net assets resulting from |
|
| 2,786,436 |
|
| 2,451,228 |
|
Net increase (decrease) in net assets |
|
| (7,823,738 | ) |
| 5,392,895 |
|
NET ASSETS: |
|
|
|
|
|
|
|
Beginning of year |
| $ | 109,205,074 |
| $ | 103,812,179 |
|
End of year |
| $ | 101,381,336 |
| $ | 109,205,074 |
|
Accumulated net investment loss |
| $ | (1,617,640 | ) | $ | (89,587 | ) |
|
|
|
| See Notes to Financial Statements. | 19 |
Statements of Changes in Net Assets (concluded)
|
|
|
|
|
|
|
|
|
| Micro Cap Value Fund |
| ||||
|
|
| |||||
INCREASE IN NET ASSETS |
| For the |
| For the |
| ||
Operations: |
|
|
|
|
|
|
|
Net investment loss |
| $ | (183,858 | ) | $ | (1,339,550 | ) |
Net realized gain on investments |
|
| 3,480,033 |
|
| 7,571,775 |
|
Net change in unrealized appreciation/depreciation |
|
| 15,593,852 |
|
| (9,989,094 | ) |
Net increase (decrease) in net assets resulting |
|
| 18,890,027 |
|
| (3,756,869 | ) |
Capital share transactions (See Note 11): |
|
|
|
|
|
|
|
Net proceeds from sales of shares |
|
| 1,918,385 |
|
| 29,570,017 |
|
Cost of shares reacquired |
|
| (14,368,859 | ) |
| (20,785,659 | ) |
Net increase (decrease) in net assets resulting |
|
| (12,450,474 | ) |
| 8,784,358 |
|
Net increase in net assets |
|
| 6,439,553 |
|
| 5,027,489 |
|
NET ASSETS: |
|
|
|
|
|
|
|
Beginning of year |
| $ | 121,034,687 |
| $ | 116,007,198 |
|
End of year |
| $ | 127,474,240 |
| $ | 121,034,687 |
|
Accumulated net investment loss |
| $ | (418,815 | ) | $ | (7,446 | ) |
|
|
|
20 | See Notes to Financial Statements. |
|
|
Financial Highlights |
MICRO CAP GROWTH FUND |
|
|
|
|
|
|
|
|
|
|
|
|
|
|
|
|
|
|
| Class A Shares |
| |||||||||||||
|
| |||||||||||||||
|
| Year Ended 10/31 |
| |||||||||||||
|
| |||||||||||||||
|
| 2012 |
| 2011 |
| 2010 |
| 2009 |
| 2008 |
| |||||
Per Share Operating Performance |
|
|
|
|
|
|
|
|
|
|
|
|
|
|
|
|
Net asset value, beginning of year |
|
| $15.98 |
|
| $15.47 |
|
| $11.32 |
|
| $9.07 |
|
| $17.36 |
|
|
|
|
|
|
|
| ||||||||||
Investment operations: |
|
|
|
|
|
|
|
|
|
|
|
|
|
|
|
|
Net investment loss(a) |
|
| (.28 | ) |
| (.33 | ) |
| (.27 | ) |
| (.19 | ) |
| (.24 | ) |
Net realized and unrealized gain (loss) |
|
| .79 |
|
| .84 |
|
| 4.42 |
|
| 2.44 |
|
| (7.71 | ) |
|
|
|
|
|
|
| ||||||||||
Total from investment operations |
|
| .51 |
|
| .51 |
|
| 4.15 |
|
| 2.25 |
|
| (7.95 | ) |
|
|
|
|
|
|
| ||||||||||
Distributions to shareholders from: |
|
|
|
|
|
|
|
|
|
|
|
|
|
|
|
|
Net realized gain |
|
| (2.46 | ) |
| — |
|
| — |
|
| — |
|
| (.34 | ) |
|
|
|
|
|
|
| ||||||||||
Net asset value, end of year |
|
| $14.03 |
|
| $15.98 |
|
| $15.47 |
|
| $11.32 |
|
| $9.07 |
|
|
|
|
|
|
|
| ||||||||||
Total Return(b) |
|
| 4.86 | % |
| 3.30 | % |
| 36.66 | % |
| 24.81 | % |
| (46.57 | )% |
| ||||||||||||||||
Ratios to Average Net Assets: |
|
|
|
|
|
|
|
|
|
|
|
|
|
|
|
|
| ||||||||||||||||
Expenses, excluding expense |
|
| 2.09 | % |
| 2.07 | % |
| 2.10 | % |
| 2.09 | % |
| 2.09 | % |
| ||||||||||||||||
Expenses, including expense |
|
| 2.09 | % |
| 2.07 | % |
| 2.10 | % |
| 2.09 | % |
| 2.09 | % |
| ||||||||||||||||
Expenses, excluding expense |
|
| 2.09 | % |
| 2.07 | % |
| 2.11 | % |
| 2.30 | % |
| 2.23 | % |
| ||||||||||||||||
Net investment loss |
|
| (1.92 | )% |
| (1.98 | )% |
| (2.03 | )% |
| (1.99 | )% |
| (1.88 | )% |
|
|
|
|
|
|
|
|
|
|
|
|
|
|
|
|
|
Supplemental Data: |
|
|
|
|
|
|
|
|
|
|
|
|
|
|
|
|
Net assets, end of year (000) |
|
| $11,484 |
|
| $15,271 |
|
| $13,779 |
|
| $10,421 |
|
| $5,264 |
|
Portfolio turnover rate |
|
| 119.77 | % |
| 120.62 | % |
| 115.89 | % |
| 147.34 | % |
| 173.93 | % |
|
|
(a) | Calculated using average shares outstanding during the year. |
(b) | Total return does not consider the effects of sales loads and assumes the reinvestment of all distributions. |
|
|
|
| See Notes to Financial Statements. | 21 |
|
Financial Highlights (concluded) |
MICRO CAP GROWTH FUND |
|
|
|
|
|
|
|
|
|
|
|
|
|
|
|
|
|
|
| Class I Shares |
| |||||||||||||
|
| |||||||||||||||
|
| Year Ended 10/31 |
| |||||||||||||
|
| |||||||||||||||
|
| 2012 |
| 2011 |
| 2010 |
| 2009 |
| 2008 |
| |||||
Per Share Operating Performance |
|
|
|
|
|
|
|
|
|
|
|
|
|
|
| �� |
Net asset value, beginning of year |
|
| $16.52 |
|
| $15.96 |
|
| $11.65 |
|
| $9.31 |
|
| $17.76 |
|
|
|
|
|
|
|
| ||||||||||
Investment operations: |
|
|
|
|
|
|
|
|
|
|
|
|
|
|
|
|
Net investment loss(a) |
|
| (.25 | ) |
| (.30 | ) |
| (.24 | ) |
| (.17 | ) |
| (.22 | ) |
Net realized and unrealized gain (loss) |
|
| .83 |
|
| .86 |
|
| 4.55 |
|
| 2.51 |
|
| (7.89 | ) |
|
|
|
|
|
|
| ||||||||||
Total from investment operations |
|
| .58 |
|
| .56 |
|
| 4.31 |
|
| 2.34 |
|
| (8.11 | ) |
|
|
|
|
|
|
| ||||||||||
Distributions to shareholders from: |
|
|
|
|
|
|
|
|
|
|
|
|
|
|
|
|
Net realized gain |
|
| (2.46 | ) |
| — |
|
| — |
|
| — |
|
| (.34 | ) |
|
|
|
|
|
|
| ||||||||||
Net asset value, end of year |
|
| $14.64 |
|
| $16.52 |
|
| $15.96 |
|
| $11.65 |
|
| $9.31 |
|
|
|
|
|
|
|
| ||||||||||
Total Return(b) |
|
| 5.10 | % |
| 3.57 | % |
| 37.00 | % |
| 25.13 | % |
| (46.41 | )% |
| ||||||||||||||||
Ratios to Average Net Assets: |
|
|
|
|
|
|
|
|
|
|
|
|
|
|
|
|
| ||||||||||||||||
Expenses, excluding expense |
|
| 1.84 | % |
| 1.82 | % |
| 1.85 | % |
| 1.85 | % |
| 1.84 | % |
| ||||||||||||||||
Expenses, including expense |
|
| 1.84 | % |
| 1.82 | % |
| 1.85 | % |
| 1.85 | % |
| 1.84 | % |
| ||||||||||||||||
Expenses, excluding expense |
|
| 1.84 | % |
| 1.82 | % |
| 1.86 | % |
| 2.05 | % |
| 1.98 | % |
| ||||||||||||||||
Net investment loss |
|
| (1.68 | )% |
| (1.73 | )% |
| (1.78 | )% |
| (1.75 | )% |
| (1.64 | )% |
|
|
|
|
|
|
|
|
|
|
|
|
|
|
|
|
|
Supplemental Data: |
|
|
|
|
|
|
|
|
|
|
|
|
|
|
|
|
Net assets, end of year (000) |
|
| $89,897 |
|
| $93,934 |
|
| $90,033 |
|
| $53,973 |
|
| $44,336 |
|
Portfolio turnover rate |
|
| 119.77 | % |
| 120.62 | % |
| 115.89 | % |
| 147.34 | % |
| 173.93 | % |
|
|
(a) | Calculated using average shares outstanding during the year. |
(b) | Total return assumes the reinvestment of all distributions. |
|
|
|
22 | See Notes to Financial Statements. |
|
|
Financial Highlights |
MICRO CAP VALUE FUND |
|
|
|
|
|
|
|
|
|
|
|
|
|
|
|
|
|
|
| Class A Shares |
| |||||||||||||
|
| |||||||||||||||
|
| Year Ended 10/31 |
| |||||||||||||
|
| |||||||||||||||
|
| 2012 |
| 2011 |
| 2010 |
| 2009 |
| 2008 |
| |||||
Per Share Operating Performance |
|
|
|
|
|
|
|
|
|
|
|
|
|
|
|
|
Net asset value, beginning of year |
|
| $22.88 |
|
| $23.33 |
|
| $18.57 |
|
| $16.94 |
|
| $28.90 |
|
|
|
|
|
|
|
| ||||||||||
Investment operations: |
|
|
|
|
|
|
|
|
|
|
|
|
|
|
|
|
Net investment loss(a) |
|
| (.08 | ) |
| (.29 | ) |
| (.31 | ) |
| (.19 | ) |
| (.22 | ) |
Net realized and unrealized gain (loss) |
|
| 3.72 |
|
| (.16 | ) |
| 5.07 |
|
| 1.82 |
|
| (9.79 | ) |
|
|
|
|
|
|
| ||||||||||
Total from investment operations |
|
| 3.64 |
|
| (.45 | ) |
| 4.76 |
|
| 1.63 |
|
| (10.01 | ) |
|
|
|
|
|
|
| ||||||||||
Distributions to shareholders from: |
|
|
|
|
|
|
|
|
|
|
|
|
|
|
|
|
Net realized gain |
|
| — |
|
| — |
|
| — |
|
| — |
|
| (1.95 | ) |
|
|
|
|
|
|
| ||||||||||
Net asset value, end of year |
|
| $26.52 |
|
| $22.88 |
|
| $23.33 |
|
| $18.57 |
|
| $16.94 |
|
|
|
|
|
|
|
| ||||||||||
Total Return(b) |
|
| 15.91 | % |
| (1.93 | )% |
| 25.63 | % |
| 9.62 | % |
| (36.82 | )% |
| ||||||||||||||||
Ratios to Average Net Assets: |
|
|
|
|
|
|
|
|
|
|
|
|
|
|
|
|
| ||||||||||||||||
Expenses, excluding expense |
|
| 2.05 | % |
| 2.04 | % |
| 2.06 | % |
| 2.10 | % |
| 2.09 | % |
| ||||||||||||||||
Expenses, including expense |
|
| 2.05 | % |
| 2.04 | % |
| 2.06 | % |
| 2.10 | % |
| 2.08 | % |
| ||||||||||||||||
Expenses, excluding expense |
|
| 2.05 | % |
| 2.04 | % |
| 2.06 | % |
| 2.22 | % |
| 2.14 | % |
| ||||||||||||||||
Net investment loss |
|
| (.32 | )% |
| (1.17 | )% |
| (1.48 | )% |
| (1.14 | )% |
| (.95 | )% |
|
|
|
|
|
|
|
|
|
|
|
|
|
|
|
|
|
Supplemental Data: |
|
|
|
|
|
|
|
|
|
|
|
|
|
|
|
|
Net assets, end of year (000) |
|
| $30,512 |
|
| $26,239 |
|
| $30,139 |
|
| $22,730 |
|
| $17,522 |
|
Portfolio turnover rate |
|
| 34.25 | % |
| 56.97 | % |
| 48.03 | % |
| 42.27 | % |
| 56.70 | % |
|
|
(a) | Calculated using average shares outstanding during the year. |
(b) | Total return does not consider the effects of sales loads and assumes the reinvestment of all distributions. |
|
|
|
| See Notes to Financial Statements. | 23 |
|
Financial Highlights (concluded) |
MICRO CAP VALUE FUND |
|
|
|
|
|
|
|
|
|
|
|
|
|
|
|
|
|
|
| Class I Shares |
| |||||||||||||
|
| |||||||||||||||
|
| Year Ended 10/31 |
| |||||||||||||
|
| |||||||||||||||
|
| 2012 |
| 2011 |
| 2010 |
| 2009 |
| 2008 |
| |||||
Per Share Operating Performance |
|
|
|
|
|
|
|
|
|
|
|
|
|
|
|
|
Net asset value, beginning of year |
|
| $23.50 |
|
| $23.91 |
|
| $18.98 |
|
| $17.27 |
|
| $29.36 |
|
|
|
|
|
|
|
| ||||||||||
Investment operations: |
|
|
|
|
|
|
|
|
|
|
|
|
|
|
|
|
Net investment loss(a) |
|
| (.02 | ) |
| (.24 | ) |
| (.27 | ) |
| (.15 | ) |
| (.16 | ) |
Net realized and unrealized gain (loss) |
|
| 3.84 |
|
| (.17 | ) |
| 5.20 |
|
| 1.86 |
|
| (9.98 | ) |
|
|
|
|
|
|
| ||||||||||
Total from investment operations |
|
| 3.82 |
|
| (.41 | ) |
| 4.93 |
|
| 1.71 |
|
| (10.14 | ) |
|
|
|
|
|
|
| ||||||||||
Distributions to shareholders from: |
|
|
|
|
|
|
|
|
|
|
|
|
|
|
|
|
Net realized gain |
|
| — |
|
| — |
|
| — |
|
| — |
|
| (1.95 | ) |
|
|
|
|
|
|
| ||||||||||
Net asset value, end of year |
|
| $27.32 |
|
| $23.50 |
|
| $23.91 |
|
| $18.98 |
|
| $17.27 |
|
|
|
|
|
|
|
| ||||||||||
Total Return(b) |
|
| 16.21 | % |
| (1.67 | )% |
| 25.97 | % |
| 9.90 | % |
| (36.68 | )% |
| ||||||||||||||||
Ratios to Average Net Assets: |
|
|
|
|
|
|
|
|
|
|
|
|
|
|
|
|
| ||||||||||||||||
Expenses, excluding expense |
|
| 1.80 | % |
| 1.79 | % |
| 1.81 | % |
| 1.85 | % |
| 1.84 | % |
| ||||||||||||||||
Expenses, including expense |
|
| 1.80 | % |
| 1.79 | % |
| 1.81 | % |
| 1.85 | % |
| 1.83 | % |
| ||||||||||||||||
Expenses, excluding expense |
|
| 1.80 | % |
| 1.79 | % |
| 1.81 | % |
| 1.97 | % |
| 1.89 | % |
| ||||||||||||||||
Net investment loss |
|
| (.09 | )% |
| (.92 | )% |
| (1.23 | )% |
| (.90 | )% |
| (.70 | )% |
|
|
|
|
|
|
|
|
|
|
|
|
|
|
|
|
|
Supplemental Data: |
|
|
|
|
|
|
|
|
|
|
|
|
|
|
|
|
Net assets, end of year (000) |
|
| $96,962 |
|
| $94,796 |
|
| $85,868 |
|
| $57,977 |
|
| $47,883 |
|
Portfolio turnover rate |
|
| 34.25 | % |
| 56.97 | % |
| 48.03 | % |
| 42.27 | % |
| 56.70 | % |
|
|
(a) | Calculated using average shares outstanding during the year. |
(b) | Total return assumes the reinvestment of all distributions. |
|
|
|
24 | See Notes to Financial Statements. |
|
Notes to Financial Statements
|
|
|
1. | ORGANIZATION |
|
Lord Abbett Securities Trust (the “Trust”) is registered under the Investment Company Act of 1940, as amended (the “Act”), as a diversified, open-end management investment company and was organized as a Delaware statutory trust on February 26, 1993. The Trust currently consists of nine funds. This report covers the following two funds (separately, a “Fund” and collectively, the “Funds”) and their respective classes: Lord Abbett Micro-Cap Growth Fund (“Micro Cap Growth Fund”), Class A and I shares and Lord Abbett Micro-Cap Value Fund (“Micro Cap Value Fund”), Class A and I shares. The investment objective of both Micro Cap Growth Fund and Micro Cap Value Fund is long-term capital appreciation.
Each class of shares has different expenses and dividends. A front-end sales charge is normally added to the net asset value (“NAV”) for Class A shares. A contingent deferred sales charge (“CDSC”) may apply to certain redemptions of Class A shares purchased without a sales charge and redeemed before the first day of the month in which the one-year anniversary of the purchase falls (subject to certain exceptions as set forth in each Fund’s prospectus). Class I shares are not subject to any sales charges.
The preparation of the financial statements in conformity with accounting principles generally accepted in the United States of America requires management to make certain estimates and assumptions that affect the reported amounts of assets and liabilities and disclosure of contingent assets and liabilities at the date of the financial statements and the reported amounts of increases and decreases in net assets from operations during the reporting period. Actual results could differ from those estimates.
|
|
|
2. | SIGNIFICANT ACCOUNTING POLICIES |
|
|
|
|
(a) | Investment Valuation–Under procedures approved by the Funds’ Board of Trustees (the “Board”), Lord, Abbett & Co. LLC (“Lord Abbett”), each Fund’s investment manager, has formed a Pricing Committee to administer the pricing and valuation of portfolio investments and to ensure that prices utilized reasonably reflect fair value. Among other things, these procedures allow the Funds to utilize independent pricing services, quotations from securities and financial instrument dealers and other market sources to determine fair value. | |
|
| |
| Securities actively traded on any recognized U.S. or non-U.S. exchange or on The NASDAQ Stock Market LLC are valued at the last sale price or official closing price on the exchange or system on which they are principally traded. Events occurring after the close of trading on non-U.S. exchanges may result in adjustments to the valuation of foreign securities to reflect their fair value as of the close of regular trading on the New York Stock Exchange LLC. Each Fund may rely on an independent fair valuation service in adjusting the valuations of foreign securities. Unlisted equity securities are valued at the last quoted sale price or, if no sale price is available, at the mean between the most recently quoted bid and asked prices. | |
|
| |
| Securities for which prices are not readily available are valued at fair value as determined by the Pricing Committee and approved by the Board. The Pricing Committee considers a number of factors, including observable and unobservable inputs, when arriving at fair value. The Pricing Committee may use related or comparable assets or liabilities, recent transactions, market multiples, book values and other relevant information to determine fair value of portfolio investments. The Board or a designated committee thereof regularly reviews fair value determinations made by the Pricing Committee and employs techniques such as | |
25
Notes to Financial Statements (continued)
|
|
| reviewing related market activity, reviewing inputs and assumptions, and retrospectively comparing prices of subsequent purchases and sales transactions to fair value determinations made by the Pricing Committee. |
|
|
| Short-term securities with 60 days or less remaining to maturity are valued using the amortized cost method, which approximates fair value. |
|
|
(b) | Security Transactions–Security transactions are recorded as of the date that the securities are purchased or sold (trade date). Realized gains and losses on sales of portfolio securities are calculated using the identified-cost method. Realized and unrealized gains (losses) are allocated to each class of shares based upon the relative proportion of net assets at the beginning of the day. |
|
|
(c) | Investment Income–Dividend income is recorded on the ex-dividend date. Interest income is recorded on the accrual basis as earned. Discounts are accreted and premiums are amortized using the effective interest method and are included in Interest income on the Statements of Operations. Investment income is allocated to each class of shares based upon the relative proportion of net assets at the beginning of the day. |
|
|
(d) | Income Taxes–It is the policy of each Fund to meet the requirements of Subchapter M of the Internal Revenue Code applicable to regulated investment companies and to distribute substantially all taxable income and capital gains to its shareholders. Therefore, no income tax provision is required. |
|
|
| Each Fund files U.S. federal and various state and local tax returns. No income tax returns are currently under examination. The statute of limitations on the Funds’ filed U.S. federal tax returns remains open for the fiscal years ended October 31, 2009 through October 31, 2012. The statutes of limitations on the Trust’s state and local tax returns may remain open for an additional year depending upon the jurisdiction. |
|
|
(e) | Expenses–Expenses incurred by the Trust that do not specifically relate to an individual fund are generally allocated to the Funds within the Trust on a pro rata basis by relative net assets. Expenses incurred by the Funds, excluding class-specific expenses, are allocated to each class of shares based upon the relative proportion of net assets at the beginning of the day. Class A shares bear class-specific expenses and fees relating to the Funds’ 12b-1 Distribution Plan. |
|
|
(f) | Repurchase Agreements–Each Fund may enter into repurchase agreements with respect to securities. A repurchase agreement is a transaction in which a fund acquires a security and simultaneously commits to resell that security to the seller (a bank or securities dealer) at an agreed-upon price on an agreed-upon date. Each Fund requires at all times that the repurchase agreement be collateralized by cash, or by securities of the U.S. Government, its agencies, its instrumentalities, or U.S. Government sponsored enterprises having a value equal to, or in excess of, the value of the repurchase agreement (including accrued interest). If the seller of the agreement defaults on its obligation to repurchase the underlying securities at a time when the fair value of these securities has declined, a Fund may incur a loss upon disposition of the securities. |
|
|
(g) | Fair Value Measurements–Fair value is defined as the price that each Fund would receive upon selling an investment or transferring a liability in an orderly transaction to an independent buyer in the principal or most advantageous market of the investment. A three-tier hierarchy is used to maximize the use of observable market data and minimize the use of |
26
Notes to Financial Statements (continued)
|
|
| unobservable inputs and to establish classification of fair value measurements for disclosure purposes. Inputs refer broadly to the assumptions that market participants would use in pricing the asset or liability, including assumptions about risk—for example, the risk inherent in a particular valuation technique used to measure fair value (such as a pricing model) and/or the risk inherent in the inputs to the valuation technique. Inputs may be observable or unobservable. Observable inputs reflect the assumptions market participants would use in pricing the asset or liability. Observable inputs are based on market data obtained from sources independent of the reporting entity. Unobservable inputs reflect the reporting entity’s own assumptions about the assumptions market participants would use in pricing the asset or liability. Unobservable inputs are based on the best information available in the circumstances. The three-tier hierarchy of inputs is summarized in the three broad Levels listed below: |
|
|
|
|
| • | Level 1 – | unadjusted quoted prices in active markets for identical investments; |
|
|
| |
| • | Level 2 – | other significant observable inputs (including quoted prices for similar investments, interest rates, prepayment speeds, credit risk, etc.); and |
|
|
| |
| • | Level 3 – | significant unobservable inputs (including each Fund’s own assumptions in determining the fair value of investments). |
|
|
| |
| Changes in valuation techniques may result in transfers into or out of an assigned level within the three-tier hierarchy. All transfers between different levels within the three-tier hierarchy are deemed to have occurred as of the beginning of the reporting period. The inputs or methodology used for valuing securities are not necessarily an indication of the risk associated with investing in those securities. | ||
The following is a summary of the inputs used as of October 31, 2012 in valuing each Fund’s investments carried at fair value:
|
|
|
|
|
|
|
|
|
|
|
|
|
|
|
|
|
|
|
|
|
|
|
|
|
|
|
|
| Micro Cap Growth Fund |
|
| Micro Cap Value Fund |
| ||||||||||||||||||||
Investment Type* |
|
|
| Level 2 |
| Level 3 |
| Total |
|
| Level 1 |
| Level 2 |
| Level 3 |
| Total |
| ||||||||
Common Stocks |
| $ | 98,449 |
| $ | — |
| $ | — |
| $ | 98,449 |
|
| $ | 125,694 |
| $ | — |
| $ | — |
| $ | 125,694 |
|
Warrant |
|
| — |
|
| — |
|
| — | (1) |
| — |
|
|
| — |
|
| — |
|
| — |
|
| — |
|
Repurchase Agreement |
|
| — |
|
| 3,109 |
|
| — |
|
| 3,109 |
|
|
| — |
|
| 1,950 |
|
| — |
|
| 1,950 |
|
Total |
| $ | 98,449 |
| $ | 3,109 |
| $ | — |
| $ | 101,558 |
|
| $ | 125,694 |
| $ | 1,950 |
| $ | — |
| $ | 127,644 |
|
|
|
* | See Schedule of Investments for fair values in each industry. |
|
|
(1) | Fair valued at zero as of October 31, 2012. Fair values were zero at the beginning and end of the period. |
|
|
|
3. | MANAGEMENT FEE AND OTHER TRANSACTIONS WITH AFFILIATES |
|
Management Fee
The Trust has a management agreement with Lord Abbett, pursuant to which Lord Abbett supplies each Fund with investment management services and executive and other personnel, provides office space and pays for ordinary and necessary office and clerical expenses relating to research and statistical work and supervision of each Fund’s investment portfolio.
The management fee is based on each Fund’s average daily net assets at an annual rate of 1.50%, which was the Funds’ annualized effective management fee rate for the fiscal year ended October 31, 2012.
27
Notes to Financial Statements (continued)
In addition, Lord Abbett provides certain administrative services to each Fund pursuant to an Administrative Services Agreement in return for a fee at an annual rate of .04% of each Fund’s average daily net assets.
For the fiscal year ended October 31, 2012 and continuing through February 28, 2013, Lord Abbett contractually agreed to waive all or a portion of its management fee for each Fund and, if necessary, reimburse each Fund’s other expenses to the extent necessary so that each class’ total net annual operating expenses, excluding 12b-1 fees, do not exceed an annualized rate of 1.85%. This agreement may be terminated, with respect to each Fund only upon the approval of the Board.
The Funds, along with certain other funds managed by Lord Abbett (collectively, the “Underlying Funds”), have entered into a Servicing Arrangement with Lord Abbett Alpha Strategy Fund (the “Alpha Strategy Fund”) of the Trust, pursuant to which each Underlying Fund pays a portion of the expenses (excluding management fees and distribution and service fees) of Alpha Strategy Fund in proportion to the average daily value of the Underlying Fund shares owned by Alpha Strategy Fund. Amounts paid pursuant to the Servicing Arrangement are included in Subsidy expense on each Fund’s Statement of Operations and Payable to affiliate on each Fund’s Statement of Assets and Liabilities.
As of October 31, 2012, the percentages of Micro Cap Growth Fund’s and Micro Cap Value Fund’s outstanding shares owned by Lord Abbett Alpha Strategy Fund were 82.93% and 68.86%, respectively.
12b-1 Distribution Plan
Each Fund has adopted a distribution plan with respect to Class A shares pursuant to Rule 12b-1 under the Act, which provides for the payment of ongoing distribution and service fees to Lord Abbett Distributor LLC (the “Distributor”), an affiliate of Lord Abbett. The fees are accrued daily at an annual rate of .25% based upon each Fund’s average daily net assets attributable to Class A shares.
Class I shares do not have a distribution plan.
Two Trustees and certain of the Trust’s officers have an interest in Lord Abbett.
|
|
|
4. | DISTRIBUTIONS AND CAPITAL LOSS CARRYFORWARDS |
|
Dividends from net investment income, if any, are declared and paid at least annually. Taxable net realized gains from investment transactions, reduced by allowable capital loss carryforwards, if any, are declared and distributed to shareholders at least annually. The capital loss carryforward amount, if any, is available to offset future net capital gains. Dividends and distributions to shareholders are recorded on the ex-dividend date. The amounts of dividends and distributions from net investment income and net realized capital gains are determined in accordance with federal income tax regulations, which may differ from accounting principles generally accepted in the United States of America. These book/tax differences are either considered temporary or permanent in nature. To the extent these differences are permanent in nature, such amounts are reclassified within the components of net assets based on their federal tax basis treatment; temporary differences do not require reclassification. Dividends and distributions, which exceed earnings and profits for tax purposes, are reported as a tax return of capital.
Subsequent to Micro Cap Growth Fund’s fiscal year ended October 31, 2012, a long-term capital gain distribution of approximately $736,000 was declared on November 16, 2012 and paid on November 20, 2012 to shareholders of record on November 19, 2012.
28
Notes to Financial Statements (continued)
As of October 31, 2012, the components of accumulated gains on a tax-basis were as follows:
|
|
|
|
|
|
|
|
|
| Micro Cap |
| Micro Cap |
| ||
| |||||||
Undistributed long-term capital gains |
| $ | 735,409 |
| $ | — |
|
| |||||||
Total undistributed earnings |
| $ | 735,409 |
| $ | — |
|
Capital loss carryforwards* |
|
| — |
|
| (4,255,555 | ) |
Temporary differences |
|
| (1,085,726 | ) |
| (161,437 | ) |
Unrealized gains – net |
|
| 11,422,128 |
|
| 22,196,122 |
|
| |||||||
Total accumulated gains – net |
| $ | 11,071,811 |
| $ | 17,779,130 |
|
| |||||||
|
|
* | As of October 31, 2012, Micro Cap Value Fund had a capital loss carryforward of $4,255,555, set to expire in 2017. |
In accordance with the Regulated Investment Company Modernization Act of 2010, each Fund will carryforward capital losses incurred in taxable years beginning after December 22, 2010 (“post-enactment losses”) indefinitely. Post-enactment losses will also retain their character as either short-term or long-term and be utilized before any pre-enactment losses.
At each Fund’s election, certain losses incurred within the taxable year (Qualified Late-Year Losses) are deemed to arise on the first business day of the Fund’s next taxable year. The following Funds incurred and will elect to defer late-year ordinary losses during fiscal 2012 as follows:
|
|
|
Micro Cap Growth Fund | $1,078,024 |
|
Micro Cap Value Fund | 151,424 |
|
As of October 31, 2012, the aggregate unrealized security gains and losses based on cost for U.S. federal income tax purposes were as follows:
|
|
|
|
|
|
|
|
|
| Micro Cap |
| Micro Cap |
| ||
| |||||||
Tax cost |
| $ | 90,136,099 |
| $ | 105,448,300 |
|
| |||||||
Gross unrealized gain |
|
| 16,081,468 |
|
| 25,290,684 |
|
Gross unrealized loss |
|
| (4,659,340 | ) |
| (3,094,562 | ) |
| |||||||
Net unrealized security gain |
| $ | 11,422,128 |
| $ | 22,196,122 |
|
| |||||||
The difference between book-basis and tax-basis unrealized gains (losses) is attributable to the tax treatment of certain securities and wash sales.
Permanent items identified during the fiscal year ended October 31, 2012 have been reclassified among the components of net assets based on their tax basis treatment as follows:
|
|
|
|
|
|
|
|
|
|
|
| Accumulated Net |
|
| Accumulated |
| Paid-in | ||
Micro Cap Growth Fund |
| $ | 286,636 |
|
| $(286,636 | ) | $ | — |
Micro Cap Value Fund |
|
| (227,511 | ) |
| 78,544 |
|
| 148,967 |
The permanent differences are attributable to the tax treatment of certain securities and net operating losses.
29
Notes to Financial Statements (continued)
|
|
|
5. | PORTFOLIO SECURITIES TRANSACTIONS |
|
Purchases and sales of investment securities (excluding short-term investments) for the fiscal year ended October 31, 2012 were as follows:
|
|
|
|
|
|
| Purchases |
| Sales |
Micro Cap Growth Fund |
| $124,362,195 |
| $139,122,535 |
Micro Cap Value Fund |
| 42,543,441 |
| 53,536,630 |
There were no purchases or sales of U.S. Government securities for the fiscal year ended October 31, 2012.
|
|
|
6. | TRUSTEES’ REMUNERATION |
|
The Trust’s officers and the two Trustees who are associated with Lord Abbett do not receive any compensation from the Trust for serving in such capacities. Independent Trustees’ fees are allocated among all Lord Abbett-sponsored funds based on the net assets of each fund. There is an equity-based plan available to all Independent Trustees under which Independent Trustees must defer receipt of a portion of, and may elect to defer receipt of an additional portion of Trustees’ fees. The deferred amounts are treated as though equivalent dollar amounts had been invested in the funds. Such amounts and earnings accrued thereon are included in Trustees’ fees on the Statements of Operations and in Trustees’ fees payable on the Statements of Assets and Liabilities and are not deductible for U.S. federal income tax purposes until such amounts are paid.
|
|
|
7. | EXPENSE REDUCTIONS |
|
The Trust has entered into an arrangement with its transfer agent and custodian, whereby credits realized as a result of uninvested cash balances are used to reduce a portion of each Fund’s expenses.
|
|
|
8. | LINE OF CREDIT |
|
On April 2, 2012, the Funds and certain other funds managed by Lord Abbett (the “participating funds”) entered into an unsecured revolving credit facility (“Facility”) with State Street Bank and Trust Company (“SSB”), to be used for temporary or emergency purposes as an additional source of liquidity to fund redemptions of investor shares. The Facility is renewed annually under terms that depend on market conditions at the time of the renewal. The amounts available under the Facility are (i) the lesser of either $250,000,000 or 33.33% of total assets per participating fund and (ii) $350,000,000 in the aggregate for all participating funds. The annual fee to maintain the Facility is .09% of the amount available under the Facility. Each participating fund pays its pro rata share based on the net assets of each participating fund. This amount is included in Other expenses on the Funds’ Statements of Operations. Any borrowings under this Facility will bear interest at current market rates as set forth in the credit agreement. As of October 31, 2012, there were no loans outstanding pursuant to this Facility nor was the Facility utilized at any time during the fiscal year ended October 31, 2012.
For the period February 3, 2011 through April 1, 2012, the Funds and certain other funds managed by Lord Abbett had an amount of $200,000,000 available under a Facility from SSB with an annual fee to maintain the Facility of .125% of the amount available under the Facility.
|
|
|
9. | CUSTODIAN AND ACCOUNTING AGENT |
|
SSB is the Trust’s custodian and accounting agent. SSB performs custodial, accounting and recordkeeping functions relating to portfolio transactions and calculating each Fund’s NAV.
30
Notes to Financial Statements (concluded)
|
|
|
10. | INVESTMENT RISKS |
|
Each Fund is subject to the general risks and considerations associated with equity investing, as well as the particular risks associated with micro-cap and growth or value stocks. The value of an investment in each Fund will fluctuate in response to movements in the equity securities market in general and to the changing prospects of individual companies in which the Funds invest. Micro-cap companies may be subject to greater risks and may be more sensitive to changes in economic conditions than larger, more established companies. There may be less liquidity in micro-cap company stocks, subjecting them to greater price fluctuations than larger company stocks. In the case of Micro Cap Growth Fund, the growth stocks in which it generally invests may add to the Fund’s volatility. In the case of Micro Cap Value Fund, the prices of value stocks in which it generally invests may lag the stock market for long periods of time if the market fails to recognize the company’s intrinsic worth.
These factors can affect each Fund’s performance.
|
|
|
11. | SUMMARY OF CAPITAL TRANSACTIONS |
|
Transactions in shares of beneficial interest were as follows:
|
|
|
|
|
|
|
|
|
|
|
|
|
|
Micro Cap Growth Fund |
| Year Ended |
| Year Ended |
| ||||||||
|
|
|
|
|
|
|
|
|
|
|
|
|
|
Class A Shares |
|
| Shares |
|
| Amount |
|
| Shares |
|
| Amount |
|
| |||||||||||||
Shares sold |
|
| 80,587 |
| $ | 1,191,934 |
|
| 67,906 |
| $ | 1,138,505 |
|
Reinvestment of distributions |
|
| 125,804 |
|
| 1,593,934 |
|
| — |
|
| — |
|
Shares reacquired |
|
| (343,431 | ) |
| (4,640,849 | ) |
| (2,966 | ) |
| (45,750 | ) |
| |||||||||||||
Increase (decrease) |
|
| (137,040 | ) | $ | (1,854,981 | ) |
| 64,940 |
| $ | 1,092,755 |
|
| |||||||||||||
|
|
|
|
|
|
|
|
|
|
|
|
|
|
Class I Shares |
|
|
|
|
|
|
|
|
|
|
|
|
|
| |||||||||||||
Shares sold |
|
| 230,718 |
| $ | 3,387,709 |
|
| 730,124 |
| $ | 13,193,578 |
|
Reinvestment of distributions |
|
| 1,000,253 |
|
| 13,193,337 |
|
| — |
|
| — |
|
Shares reacquired |
|
| (774,017 | ) |
| (11,939,629 | ) |
| (687,583 | ) |
| (11,835,105 | ) |
| |||||||||||||
Increase |
|
| 456,954 |
| $ | 4,641,417 |
|
| 42,541 |
| $ | 1,358,473 |
|
| |||||||||||||
|
|
|
|
|
|
|
|
|
|
|
|
|
|
Micro Cap Value Fund |
| Year Ended |
| Year Ended |
| ||||||||
| |||||||||||||
|
|
|
|
|
|
|
|
|
|
|
|
|
|
Class A Shares |
|
| Shares |
|
| Amount |
|
| Shares |
|
| Amount |
|
| |||||||||||||
Shares sold |
|
| 25,487 |
| $ | 648,867 |
|
| 117,157 |
| $ | 2,875,802 |
|
Shares reacquired |
|
| (21,988 | ) |
| (539,590 | ) |
| (262,120 | ) |
| (5,733,339 | ) |
| |||||||||||||
Increase (decrease) |
|
| 3,499 |
| $ | 109,277 |
|
| (144,963 | ) | $ | (2,857,537 | ) |
| |||||||||||||
|
|
|
|
|
|
|
|
|
|
|
|
|
|
Class I Shares |
|
|
|
|
|
|
|
|
|
|
|
|
|
| |||||||||||||
Shares sold |
|
| 50,766 |
| $ | 1,269,518 |
|
| 998,515 |
| $ | 26,694,215 |
|
Shares reacquired |
|
| (534,409 | ) |
| (13,829,269 | ) |
| (557,135 | ) |
| (15,052,320 | ) |
| |||||||||||||
Increase (decrease) |
|
| (483,643 | ) | $ | (12,559,751 | ) |
| 441,380 |
| $ | 11,641,895 |
|
| |||||||||||||
31
Report of Independent Registered Public Accounting Firm
To the Board of Trustees of Lord Abbett Securities Trust and Shareholders of
Lord Abbett Micro-Cap Growth Fund and Lord Abbett Micro-Cap Value Fund:
We have audited the accompanying statements of assets and liabilities, including the schedules of investments, of the Lord Abbett Micro-Cap Growth Fund and Lord Abbett Micro-Cap Value Fund, two of the portfolios constituting the Lord Abbett Securities Trust (the “Trust”), as of October 31, 2012, the related statements of operations for the year then ended, and the statements of changes in net assets for each of the two years in the period then ended, and the financial highlights for each of the five years in the period then ended. These financial statements and financial highlights are the responsibility of the Trust’s management. Our responsibility is to express an opinion on these financial statements and financial highlights based on our audits.
We conducted our audits in accordance with the standards of the Public Company Accounting Oversight Board (United States). Those standards require that we plan and perform the audits to obtain reasonable assurance about whether the financial statements and financial highlights are free of material misstatement. The Trust is not required to have, nor were we engaged to perform, an audit of its internal control over financial reporting. Our audits included consideration of internal control over financial reporting as a basis for designing audit procedures that are appropriate in the circumstances, but not for the purpose of expressing an opinion on the effectiveness of the Trust’s internal control over financial reporting. Accordingly, we express no such opinion. An audit also includes examining, on a test basis, evidence supporting the amounts and disclosures in the financial statements, assessing the accounting principles used and significant estimates made by management, as well as evaluating the overall financial statement presentation. Our procedures included confirmation of securities owned as of October 31, 2012, by correspondence with the custodian and brokers; where replies were not received from brokers, we performed other auditing procedures. We believe that our audits provide a reasonable basis for our opinion.
In our opinion, the financial statements and financial highlights referred to above present fairly, in all material respects, the financial position of the Lord Abbett Micro-Cap Growth Fund and Lord Abbett Micro-Cap Value Fund of the Lord Abbett Securities Trust as of October 31, 2012, the results of their operations for the year then ended, and the changes in their net assets for each of the two years in the period then ended, and the financial highlights for each of the five years in the period then ended, in conformity with accounting principles generally accepted in the United States of America.
DELOITTE & TOUCHE LLP
New York, New York
December 21, 2012
32
Basic Information About Management
The Board of Trustees (the “Board”) is responsible for the management of the business and affairs of Trust in accordance with the laws of the State of Delaware. The Board elects officers who are responsible for the day-to-day operations of Trust and who execute policies authorized by the Board. The Board also approves an investment adviser to Trust and continues to monitor the cost and quality of the services the investment adviser provides, and annually considers whether to renew the contract with the adviser. Generally, each Trustee holds office until his/her successor is elected and qualified or until his/her earlier resignation or removal, as provided in the Trust’s organizational documents.
Lord Abbett, a Delaware limited liability company, is the Trust’s investment adviser. Designated Lord Abbett personnel are responsible for the day-to-day management of the Funds.
Interested Trustees
The following Trustees are affiliated with Lord Abbett and are “interested persons” of the Trust as defined in the Act. Mr. Dow and Ms. Foster are trustees of each of the 13 Lord Abbett-sponsored funds, which consist of 56 portfolios or series. Ms. Foster also serves as an officer of each of those funds.
|
|
|
|
|
Name, Address and |
| Current Position and |
| Principal Occupation and Other Directorships |
| ||||
Robert S. Dow |
| Trustee since 1993 and |
| Principal Occupation: Formerly was Senior Partner of Lord Abbett (2007 – 2012), Managing Partner (1996 – 2007), and Chief Investment Officer (1995 – 2007), joined Lord Abbett in 1972. |
|
|
|
|
|
|
|
|
| Other Directorships: None. |
|
|
|
|
|
Daria L. Foster |
| Trustee and President |
| Principal Occupation: Managing Partner of Lord Abbett (since 2007), and was formerly Director of Marketing and Client Service, joined Lord Abbett in 1990. |
|
|
|
|
|
|
|
|
| Other Directorships: None. |
|
Independent Trustees
The following Independent Trustees also are trustees of each of the 13 Lord Abbett-sponsored funds, which consist of 56 portfolios or series.
|
|
|
|
|
Name, Address and |
| Current Position and |
| Principal Occupation and Other Directorships |
| ||||
E. Thayer Bigelow |
| Trustee since 1994 |
| Principal Occupation: Managing General Partner, Bigelow Media, LLC (since 2000); Senior Adviser, Time Warner Inc. (1998 – 2000). |
33
Basic Information About Management (continued)
|
|
|
|
|
Name, Address and |
| Current Position and |
| Principal Occupation and Other Directorships |
| ||||
Robert B. Calhoun, Jr. |
| Trustee since 1998 |
| Principal Occupation: Senior Advisor of Monitor Clipper Partners, a private equity investment fund (since 1997); President of Clipper Asset Management Corp. (1991 – 2009). |
|
|
|
|
|
Evelyn E. Guernsey |
| Trustee since 2011 |
| Principal Occupation: CEO, Americas of J.P. Morgan Asset Management (2004 – 2010). |
|
|
|
|
|
Julie A. Hill |
| Trustee since 2004 |
| Principal Occupation: Owner and CEO of The Hill Company, a business consulting firm (since 1998). |
|
|
|
|
|
Franklin W. Hobbs |
| Trustee since 2001 |
| Principal Occupation: Advisor of One Equity Partners, a private equity firm (since 2004). |
|
|
|
|
|
James M. McTaggart |
| Trustee since 2012* |
| Principal Occupation: Independent management advisor and consultant (since 2012); Vice President, CRA International, Inc. (doing business as Charles River Associates), a global management consulting firm (2009 – 2012); Founder and Chairman of Marakon Associates, Inc., a strategy consulting firm (1978 – 2009); and Officer and Director of Trinsum Group, a holding company (2007 – 2009). |
|
|
|
|
|
Thomas J. Neff |
| Trustee since 1993** |
| Principal Occupation: Chairman of Spencer Stuart (U.S.), an executive search consulting firm (since 1996). |
34
Basic Information About Management (continued)
|
|
|
|
|
Name, Address and |
| Current Position and |
| Principal Occupation and Other Directorships |
James L.L. Tullis |
| Trustee since 2006 |
| Principal Occupation: CEO of Tullis-Dickerson and Co. Inc., a venture capital management firm (since 1990). |
|
|
* | Election to the Boards of Directors/Trustees of the Lord Abbett Funds effective December 1, 2012. |
** | Retirement from the Boards of Directors/Trustees of the Lord Abbett Funds effective December 31, 2012. |
|
Officers
None of the officers listed below have received compensation from the Trust. All of the officers of the Trust also may be officers of the other Lord Abbett-sponsored funds and maintain offices at 90 Hudson Street, Jersey City, NJ 07302. Unless otherwise indicated, the position(s) and title(s) listed under the “Principal Occupation During the Past Five Years” column indicate each officer’s position(s) and title(s) with Lord Abbett.
|
|
|
|
|
|
|
Name and |
| Current Position |
| Length of Service |
| Principal Occupation |
Daria L. Foster |
| President and Chief |
| Elected as President in 2006 and Chief Executive Officer in 2012 |
| Managing Partner of Lord Abbett (since 2007), and was formerly Director of Marketing and Client Service, joined Lord Abbett in 1990. |
|
|
|
|
|
|
|
Robert P. Fetch |
| Executive Vice President |
| Elected in 1999 |
| Partner and Director, joined Lord Abbett in 1995. |
|
|
|
|
|
|
|
Robert I. Gerber |
| Executive Vice President |
| Elected in 2005 |
| Partner and Chief Investment Officer (since 2007), joined Lord Abbett in 1997 as Director of Taxable Fixed Income Management. |
|
|
|
|
|
|
|
Gerard S. E. Heffernan, Jr. |
| Executive Vice President |
| Elected in 1999 |
| Partner and Director, joined Lord Abbett in 1998. |
|
|
|
|
|
|
|
Todd D. Jacobson |
| Executive Vice President |
| Elected in 2003 |
| Portfolio Manager, joined Lord Abbett in 2003. |
|
|
|
|
|
|
|
Vincent J. McBride |
| Executive Vice President |
| Elected in 2003 |
| Partner and Director, joined Lord Abbett in 2003. |
|
|
|
|
|
|
|
F. Thomas O’Halloran, III |
| Executive Vice President |
| Elected in 2003 |
| Partner and Director, joined Lord Abbett in 2001. |
|
|
|
|
|
|
|
Harold E. Sharon |
| Executive Vice President |
| Elected in 2003 |
| Partner and Director, joined Lord Abbett in 2003. |
35
Basic Information About Management (continued)
|
|
|
|
|
|
|
Name and |
| Current Position |
| Length of Service of Current Position |
| Principal Occupation |
A. Edward Allinson |
| Vice President |
| Elected in 2011 |
| Portfolio Manager, joined Lord Abbett in 2005. |
|
|
|
|
|
|
|
James W. Bernaiche |
| Chief Compliance Officer |
| Elected in 2004 |
| Partner and Chief Compliance Officer, joined Lord Abbett in 2001. |
|
|
|
|
|
|
|
Joan A. Binstock |
| Chief Financial Officer |
| Elected in 1999 |
| Partner and Chief Operations Officer, joined Lord Abbett in 1999. |
|
|
|
|
|
|
|
John K. Forst |
| Vice President and |
| Elected in 2005 |
| Deputy General Counsel, joined Lord Abbett in 2004. |
|
|
|
|
|
|
|
Anthony W. Hipple |
| Vice President |
| Elected in 2006 |
| Portfolio Manager, joined Lord Abbett in 2002. |
|
|
|
|
|
|
|
Lawrence H. Kaplan |
| Vice President and |
| Elected in 1997 |
| Partner and General Counsel, joined Lord Abbett in 1997. |
|
|
|
|
|
|
|
Deepak Khanna |
| Vice President |
| Elected in 2008 |
| Partner and Portfolio Manager, rejoined Lord Abbett in 2007. |
|
|
|
|
|
|
|
David J. Linsen |
| Vice President |
| Elected in 2011 |
| Partner and Director, joined Lord Abbett in 2001. |
|
|
|
|
|
|
|
Steven M. Lipper |
| Vice President |
| Elected in 2011 |
| Director, Product Management, joined Lord Abbett in 2004. |
|
|
|
|
|
|
|
Thomas B. Maher |
| Vice President |
| Elected in 2008 |
| Partner and Portfolio Manager, joined Lord Abbett in 2003. |
|
|
|
|
|
|
|
Justin C. Maurer |
| Vice President |
| Elected in 2008 |
| Partner and Portfolio Manager, joined Lord Abbett in 2001. |
|
|
|
|
|
|
|
A. Edward Oberhaus, III |
| Vice President |
| Elected in 1993 |
| Partner and Director, joined Lord Abbett in 1983. |
|
|
|
|
|
|
|
Thomas R. Phillips |
| Vice President and |
| Elected in 2008 |
| Partner and Deputy General Counsel, joined Lord Abbett in 2006. |
|
|
|
|
|
|
|
Lawrence B. Stoller |
| Vice President and |
| Elected in 2007 |
| Partner and Senior Deputy General Counsel, joined Lord Abbett in 2007. |
|
|
|
|
|
|
|
Paul J. Volovich |
| Vice President |
| Elected in 2011 |
| Partner and Director, joined Lord Abbett in 1997. |
36
Basic Information About Management (concluded)
|
|
|
|
|
|
|
Name and |
| Current Position |
| Length of Service |
| Principal Occupation |
Arthur K. Weise |
| Vice President |
| Elected in 2011 |
| Partner and Portfolio Manager, joined Lord Abbett in 2007 and was formerly a Managing Director, Portfolio Manager and Analyst at Bank of New York Institutional Asset Management (2005 – 2007). |
|
|
|
|
|
|
|
Scott S. Wallner |
| AML Compliance Officer |
| Elected in 2011 |
| Assistant General Counsel, joined Lord Abbett in 2004. |
|
|
|
|
|
|
|
Bernard J. Grzelak |
| Treasurer |
| Elected in 2003 |
| Partner and Director of Fund Administration, joined Lord Abbett in 2003. |
Please call 888–522–2388 for a copy of the statement of additional information (“SAI”), which contains further information about the Trust’s Trustees. It is available free upon request.
37
Householding
The Trust has adopted a policy that allows it to send only one copy of each Fund’s prospectus, proxy material, annual report and semiannual report to certain shareholders residing at the same “household.” This reduces Fund expenses, which benefits you and other shareholders. If you need additional copies or do not want your mailings to be “householded,” please call Lord Abbett at 888-522-2388 or send a written request with your name, the name of your fund or funds and your account number or numbers to Lord Abbett Family of Funds, P.O. Box 219336, Kansas City, MO 64121.
Proxy Voting Policies, Procedures and Records
A description of the policies and procedures that Lord Abbett uses to vote proxies related to each Fund’s portfolio securities, and information on how Lord Abbett voted each Fund’s proxies during the 12-month period ended June 30 are available without charge, upon request, (i) by calling 888-522-2388; (ii) on Lord Abbett’s Website at www.lordabbett.com; and (iii) on the Securities and Exchange Commission’s (“SEC”) Website at www.sec.gov.
Shareholder Reports and Quarterly Portfolio Disclosure
The Funds are required to file their complete schedule of portfolio holdings with the SEC for their first and third fiscal quarters on Form N-Q. Copies of the filings are available without charge, upon request on the SEC’s Website at www.sec.gov and may be available by calling Lord Abbett at 888–522–2388. You can also obtain copies of Form N-Q by visiting the SEC’s Public Reference Room in Washington, DC (information on the operation of the Public Reference Room may be obtained by calling 800-SEC-0330).
|
|
|
| Tax Information |
|
|
|
|
| Of the distributions paid by Micro Cap Growth Fund to shareholders during the fiscal year ended October 31, 2012, $16,347,080 represents long-term capital gains. |
|
|
|
|
38
Lord Abbett Privacy Policy
Your privacy is important to us. We respect every individual’s right to privacy and security of information that personally identifies you or your account with us. That is why we are committed to our Privacy Policy, which is outlined below.
We safeguard, according to strict standards of security and confidentiality, any nonpublic personal information our customers share with us. We do not sell personal information to anyone.
In order to properly execute your transactions, we may collect personal information, such as your name, address and social security number, from the applications or other forms that you complete, through your use of our Website, and from market research companies. We also may collect information about your transactions with us or others, such as your account balance and investment and transaction history.
We may share nonpublic personal information with companies that provide services to us, such as transfer agents, printers, technology vendors and others, for your benefit and for the administration of our business. We require these companies to protect the confidentiality of your nonpublic personal information and to use it only for the purposes for which we disclosed the information.
We do not otherwise share nonpublic personal information we collect about you or any of our customers with anyone, except as required or permitted by law.
Our Website uses cookies, which are small files placed on a computer’s hard drive that allows our Website to recognize that computer each time someone uses it to visit our Website. The file contains information about preferences for using our Website that have been established by someone using that computer. Cookies may also be used to keep track of certain other information regarding the use of our Website, such as Website traffic data, that we may use to make decisions about ways to improve our Website. The cookies we use do not include any information about your personal identity or your accounts.
We protect the integrity and privacy of your information in a number of ways. We restrict access to nonpublic personal information about you to those employees who need to know that information to provide products or services to our customers. We maintain physical, electronic and procedural safeguards to guard your nonpublic personal information.
The accuracy of your personal information is important. If you need to correct or update your personal or account information, please call us at 800-821-5129. We will be happy to review, correct or update your personal or account information.
Note: If you invest in the Lord Abbett Family of Funds through an account that is controlled by another financial institution, such as a bank or broker-dealer, the other financial institution’s Privacy Policy may apply to you.
This Privacy Notice is being provided on behalf of the following entities:
Lord Abbett Family of Funds
Lord, Abbett & Co. LLC
Lord Abbett Distributor LLC
This page is not part of the Annual Report
|
|
|
|
|
|

|
|
|
|
|
|
|
|
|
|
| |
|
|
| |
|
|
| |
This report, when not used for the general information of shareholders of the Fund, is to be distributed only if preceded or accompanied by a current fund prospectus. |
| Lord Abbett Securities Trust | LAMCVF-2-1012 |

|
|
Item 2: | Code of Ethics. |
|
|
|
| (a) | In accordance with applicable requirements, the Registrant adopted a Sarbanes-Oxley Code of Ethics on June 19, 2003 that applies to the principal executive officer and senior financial officers of the Registrant (“Code of Ethics”). The Code of Ethics was in effect during the fiscal year ended October 31, 2012 (the “Period”). |
|
|
|
| (b) | Not applicable. |
|
|
|
| (c) | The Registrant has not amended the Code of Ethics as described in Form N-CSR during the Period. |
|
|
|
| (d) | The Registrant has not granted any waiver, including an implicit waiver, from a provision of the Code of Ethics as described in Form N-CSR during the Period. |
|
|
|
| (e) | Not applicable. |
|
|
|
| (f) | See Item 12(a)(1) concerning the filing of the Code of Ethics. The Registrant will provide a copy of the Code of Ethics to any person without charge, upon request. To obtain a copy, please call Lord Abbett at 888-522-2388. |
|
|
|
Item 3: | Audit Committee Financial Expert. | |
|
| |
| The Registrant’s board of trustees has determined that each of the following independent trustees who are members of the audit committee is an audit committee financial expert: E. Thayer Bigelow, Robert B. Calhoun Jr., and James L.L. Tullis. Each of these persons is independent within the meaning of the Form N-CSR. | |
|
| |
Item 4: | Principal Accountant Fees and Services. | |
|
| |
| In response to sections (a), (b), (c) and (d) of Item 4, the aggregate fees billed to the Registrant for the fiscal years ended October 31, 2012 and 2011 by the Registrant’s principal accounting firm, Deloitte & Touche LLP, the member firms of Deloitte Touche Tohmatsu and their respective affiliates (collectively, “Deloitte”) were as follows: | |
|
|
|
|
|
|
|
|
|
| Fiscal year ended: |
| ||||
|
| 2012 |
| 2011 |
| ||
Audit Fees {a} |
| $ | 351,500 |
| $ | 385,000 |
|
Audit-Related Fees |
|
| - 0 - |
|
| - 0 - |
|
|
|
| |||||
Total audit and audit-related fees |
|
| 351,500 |
|
| 385,000 |
|
|
|
| |||||
|
|
|
|
|
|
|
|
Tax Fees {b} |
|
| 77,513 |
|
| 82,122 |
|
All Other Fees |
|
| - 0 - |
|
| - 0 - |
|
|
|
| |||||
Total Fees |
| $ | 429,013 |
| $ | 467,122 |
|
|
|
| |||||
|
|
|
| ||
|
|
|
| {a} Consists of fees for audits of the Registrant’s annual financial statements. | |
|
|
|
| {b} Fees for the fiscal year ended October 31, 2012 and 2011 consist of fees for preparing the U.S. Income Tax Return for Regulated Investment Companies, New Jersey Corporation Business Tax Return, New Jersey Annual Report Form, U.S. Return of Excise Tax on Undistributed Income of Investment Companies, IRS Forms 1099-MISC and 1096 Annual Summary and Transmittal of U.S. Information Returns. | |
(e) (1) Pursuant to Rule 2-01(c) (7) of Regulation S-X, the Registrant’s Audit Committee has adopted pre-approval policies and procedures. Such policies and procedures generally provide that the Audit Committee must pre-approve:
|
|
|
| • | any audit, audit-related, tax, and other services to be provided to the Lord Abbett Funds, including the Registrant, and |
| ||
| • | any audit-related, tax, and other services to be provided to the Registrant’s investment adviser and any entity controlling, controlled by or under common control with the investment adviser that provides ongoing services to one or more Funds comprising the Registrant if the engagement relates directly to operations and financial reporting of a Fund, by the independent auditor to assure that the provision of such services does not impair the auditor’s independence. |
The Audit Committee has delegated pre-approval authority to its Chairman, subject to a fee limit of $10,000 per event, and not to exceed $25,000 annually. The Chairman will report any pre-approval decisions to the Audit Committee at its next scheduled meeting. Unless a type of service to be provided by the independent auditor has received general pre-approval, it must be pre-approved by the Audit Committee. Any proposed services exceeding pre-approved cost levels will require specific pre-approval by the Audit Committee.
(e) (2) The Registrant’s Audit Committee has approved 100% of the services described in this Item 4 (b) through (d).
(f) Not applicable.
(g) The aggregate non-audit fees billed by Deloitte for services rendered to the Registrant are shown above in the response to Item 4 (a), (b), (c) and (d) as “All Other Fees”.
The aggregate non-audit fees billed by Deloitte for services rendered to the Registrant’s investment adviser, Lord, Abbett & Co. LLC (“Lord Abbett”), for the fiscal years ended October 31, 2012 and 2011 were:
|
|
|
|
|
|
|
|
|
| Fiscal year ended: |
| ||||
|
| 2012 |
| 2011 |
| ||
All Other Fees {a} |
| $ | 170,618 |
| $ | 172,220 |
|
|
|
|
| ||
| ||
| {a} Consist of fees for Independent Services Auditors’ Report on Controls Placed in Operation and Tests of Operating Effectiveness related to Lord Abbett’s Asset Management Services (“SAS 70 Report”). | |
The aggregate non-audit fees billed by Deloitte for services rendered to entities under the common control of Lord Abbett for the fiscal years ended October 31, 2012 and 2011 were:
|
|
|
|
|
|
|
|
|
| Fiscal year ended: |
| ||||
|
| 2012 |
| 2011 |
| ||
All Other Fees |
| $ | - 0 - |
| $ | - 0- |
|
|
|
|
| ||
| ||
(h) The Registrant’s Audit Committee has considered the provision of non-audit services that were rendered to the Registrant’s investment adviser, and any entity controlling, controlled by or under common control with the investment adviser that provides ongoing services to the Registrant, that were not pre-approved pursuant to Rule 2-01 (c)(7)(ii) of Regulation S-X and has determined that the provision of such services is compatible with maintaining Deloitte’s independence. | ||
|
|
|
Item 5: | Audit Committee of Listed Registrants. | |
|
|
|
|
| Not applicable. |
|
|
|
Item 6: | Investments. | |
|
|
|
|
| Not applicable. |
|
|
|
Item 7: | Disclosure of Proxy Voting Policies and Procedures for Closed-End Management Investment Companies. | |
|
|
|
|
| Not applicable. |
|
|
|
Item 8: | Portfolio Managers of Closed-End Management Investment Companies. | |
|
|
|
|
| Not applicable. |
|
|
|
Item 9: | Purchases of Equity Securities by Closed-End Management Investment Company and Affiliated Purchasers. | |
|
|
|
|
| Not applicable. |
|
|
|
Item 10: | Submission of Matters to a Vote of Security Holders. | |
|
|
|
|
| Not applicable. |
|
|
|
Item 11: | Controls and Procedures. | |
|
|
|
| (a) | Based on their evaluation of the Registrant’s disclosure controls and procedures (as defined in Rule 30a-3(c) under the Investment Company Act of 1940) as of a date within 90 days prior to the filing date of this report, the Chief Executive Officer and Chief Financial Officer of the Registrant have concluded that such disclosure controls and procedures are reasonably designed and effective to ensure that material information relating to the Registrant, including its consolidated subsidiaries, is made known to them by others within those entities. |
|
|
|
| (b) | There were no changes in the Registrant’s internal control over financial reporting (as defined in Rule 30a-3(d) under the Investment Company Act of 1940) that occurred during the second fiscal quarter of the period covered by this report that have materially affected, or are reasonably likely to materially affect, the Registrant’s internal control over financial reporting. |
|
|
|
Item 12: | Exhibits. | |
|
|
|
| (a)(1) | The Lord Abbett Family of Funds Sarbanes Oxley Code of Ethics for the Principal Executive Officer and Senior Financial Officers is attached hereto as part of Ex-99. CODEETH. |
|
|
|
| (a)(2) | Certification of each Principal Executive Officer and Principal Financial Officer of the Registrant as required by Rule 30a-2 under the Investment Company Act of 1940 is attached hereto as a part of EX-99.CERT. |
|
|
|
| (b) | Certification of each Principal Executive Officer and Principal Financial Officer of the Registrant as required by Section 906 of the Sarbanes-Oxley Act of 2002 is provided as a part of EX-99.906CERT. |
SIGNATURES
Pursuant to the requirements of the Securities Exchange Act of 1934 and the Investment Company Act of 1940, the Registrant has duly caused this report to be signed on its behalf by the undersigned, thereunto duly authorized.
|
|
|
|
| LORD ABBETT SECURITIES TRUST |
|
|
|
| By: | /s/ Daria L. Foster |
|
| |
|
| Daria L. Foster |
|
| President and Chief Executive Officer |
|
|
|
Date: December 19, 2012 |
|
|
|
|
|
| By: | /s/ Joan A. Binstock |
|
| |
|
| Joan A. Binstock |
|
| Chief Financial Officer and Vice President |
|
|
|
Date: December 19, 2012 |
|
|
Pursuant to the requirements of the Securities Exchange Act of 1934 and the Investment Company Act of 1940, this report has been signed below by the following persons on behalf of the Registrant and in the capacities and on the dates indicated.
|
|
|
|
|
|
| By: | /s/ Daria L. Foster |
|
| |
|
| Daria L. Foster |
|
| President and Chief Executive Officer |
|
|
|
Date: December 19, 2012 |
|
|
|
|
|
| By: | /s/ Joan A. Binstock |
|
| |
|
| Joan A. Binstock |
|
| Chief Financial Officer and Vice President |
|
|
|
Date: December 19, 2012 |
|
|