QuickLinks -- Click here to rapidly navigate through this document
Exhibit 99.1(c)(i) to Form 18-K
Delivered on 7 May 2002
by the Honourable John Brumby, MP
Treasurer of the State of Victoria
Honourable Speaker
I move that this Bill be read a second time.
INTRODUCTION
This budget invests in our future—in the future of our people and our State.
It invests in more jobs and stronger communities.
It delivers record investment in education and innovation—driving new opportunities for all Victorians.
And it reinforces this Government's determination to make sure that all Victorians—wherever they live and whatever they do—can step into the future with confidence as part of a strong and thriving Victoria.
The first two budgets of the Bracks Labor Government began the task of undoing years of damage in education, health and community safety. We took up the challenge of rebuilding our regions. And we committed ourselves to getting the conditions right for jobs and economic growth across Victoria.
The results are there for all Victorians to see.
Strong economic growth above the national average.
Jobs growth, consumer spending, business investment—all well above the national average.
Strong economic and employment growth in regional Victoria.
And Victoria's triple-A credit rating confirmed.
Education is back in its rightful place—as the Government's top priority. Our health system is turning around. Our vital community services are being restored and repaired.
And Victorian businesses can now invest with confidence, with lower and fewer taxes, in a competitive, innovative and connected environment.
GROWING VICTORIA TOGETHER
Last year, the Government released our framework for Victoria's future, Growing Victoria Together, which balances economic, social and environmental goals in growing the whole State.
This budget puts that plan to work.
This budget continues to invest in Victoria's greatest asset: our people—in their education and health, and in the communities where they live.
We continue to invest in country Victoria—generating new jobs and investment after years of decline.
We invest in our expanding suburbs and growth corridors—places where more and more Victorian families are choosing to live.
We invest in our great city of Melbourne—in the projects and developments that will transform Melbourne into a truly 'global' waterfront city.
And we deliver services and infrastructure to link our communities together—and connect all of us to the world and to a future of high quality jobs, strong economic growth and a better standard of living.
With this budget—the third budget of the Bracks Labor Government—Victoria steps with confidence into a stronger, brighter future.
Responsible and sound financial management
Responsible financial management is crucial to Victoria's future.
This budget continues to meet the Bracks Government's commitment to maintain a substantial operating surplus of at least $100 million.
An operating surplus of $522 million is projected for 2002-03, with expected surpluses averaging around $600 million in the following three years.
Standard and Poor's and Moody's Investors Service have again acknowledged the Government's responsible financial management, confirming Victoria's triple-A credit rating.
The Government is committed to keeping these excellent ratings by maintaining the State's net financial liabilities at prudent levels.
General government net financial liabilities, excluding the Growing Victoria infrastructure reserve assets, are forecast to fall from 10.8 per cent of GSP at June 1999 to 7.1 per cent by June 2006.
And general government net debt falls even further, from $4.9 billion in 1999 to $2.3 billion by June 2006—just 1 per cent of GSP.
Honourable Speaker, the Bracks Government has provided—and will continue to provide—responsible financial management and leadership to ensure that Victoria's financial position remains strong, sound and secure.
A growing economy—Victoria leads the way
The Victorian economy is also leading the way—proving to be robust and resilient in the face of global economic uncertainties.
This year, the Victorian economy is expected to grow by 3.75 per cent, significantly exceeding our original forecast of 2.75 per cent.
Growth in 2002-03 and beyond is forecast at 3.5 per cent—a strong performance that confirms the benefit of the Government's commitment to sound financial management.
It also reinforces the benefits of the Government's strategy to grow the whole State and invest in the drivers of growth: education, innovation and infrastructure.
Victoria's labour market continues to out-perform the national economy, with our unemployment rate at or below the national average for the past 22 months.
Since October 1999, employment in Victoria has grown by more than 110 000 people—representing more new jobs than any other State.
There's a new climate of confidence in Victoria—a confidence that, for the first time in many years, extends beyond central Melbourne and reaches out across the State.
It's a confidence reflected in private business investment and consumer spending growing faster than the national average.
And it's reflected, too, in the record numbers of Australians choosing to call Victoria home.
We are now attracting more and more people from other States.
People who see Victoria as a place of renewed opportunity, with a commitment to building strong, caring communities—in short, a great place to live, work and raise a family.
It's just one factor in Victoria's strong economic performance over the past two years.
And in this budget, we put the proceeds of that strong performance to work—reinvesting in the assets and services that are attracting people to Victoria, and benefiting all Victorians.
Investing for our future—stronger communities
As in previous budgets, the Government is directing substantial investment towards growing and linking the whole State.
To meet that goal over the long-term, we need stronger communities.
Communities where there is trust and support—communities that can work together to create new opportunities.
High quality infrastructure is the cornerstone of such communities, and a key driver of long-term, sustainable economic growth across Victoria.
The Bracks Government has already taken investment in public infrastructure to an all-time high.
And our infrastructure program is not about monuments—it's about people.
It's about world-class schools and hospitals.
It's about modern transport and internet connections.
It's about better, safer places for people to live and work.
The 2002-03 Budget boosts asset investment by a further $3 billion for major capital works across Victoria.
It's the biggest infrastructure program in the State's history—and it's been fully funded from our budget surpluses, without adding one single dollar to debt.
This year, we focus on linking and strengthening our country and regional areas, our expanding suburbs and our growth corridors—investing in the infrastructure they need to step into the future with confidence.
Stronger suburbs
Honourable Speaker, a major focus of this budget is the expanding suburbs and growth corridors of Melbourne.
These are the places where Victorian families are increasingly choosing to live—and where much of Victoria's future population growth will be concentrated.
In this budget, the Government has committed $704 million to a major Linking the Suburbs transport strategy.
We are extending the electrified suburban rail network to Craigieburn in Melbourne's northwest, and extending tram services to Vermont South.
We are upgrading major suburban roads in Narre Warren, Langwarrin, Sunbury, Laverton and Epping.
And we are providing a massive $36 million boost for 25 suburban bus routes across Melbourne—extending routes, adding new services and introducing more low-floor, air conditioned buses.
The budget also provides $445 million for Victoria's contribution to the Scoresby Freeway.
As many people live along the Scoresby route as live in the whole of Adelaide, and the corridor is a major source of exports for Victoria and Australia.
This $1 billion, 34-kilometre project will provide a seamless link from the southeast to the city and to Victoria's ports, airports and major freight routes.
It will bring significant economic and employment benefits to Melbourne's eastern and southeastern suburbs, and the regions beyond those suburbs.
And it will cement Victoria's reputation as the transport capital of Australia.
To generate further opportunities in Melbourne's east and southeast, the budget also allocates funds for the development of Dandenong, Ringwood and Frankston as key retail and transport hubs—known as Transit Cities.
$23 million is provided in 2002-03 for five new schools in the high growth suburbs of Roxburgh Park, Melton, Narre Warren, Berwick and Carrum Downs.
Significant hospital capital works are also approved for the redevelopment of the Angliss and Dandenong Hospitals.
Stronger regions
The 2002-03 Budget continues the Government's unwavering commitment to country Victoria.
When we came to office, country Victoria had been left behind, ignored and neglected by the previous government.
The Bracks Government has worked hard to turn that around—and worked closely with country and regional communities to give them the services and infrastructure they need to compete for investment and jobs.
And, once again, the results are there for all Victorians to see.
Jobs are up, unemployment is down—with the average unemployment rate last year across country Victoria the lowest in more than a decade.
Our agricultural industries are performing exceptionally well.
And building approvals are outstripping the state average, with strong residential growth in cities like Geelong, Ballarat and Bendigo.
The Government's Regional Infrastructure Development Fund has contributed to the turnaround in many of our regions.
It is a great success story, which has changed forever the relationship between country communities and the State Government.
And that Fund now sits at the heart of this Government's ongoing commitment to country and regional Victoria.
The 2002-03 Budget builds on the Government's current major infrastructure commitments in regional areas and focuses on improving transport links, supporting regional industry and investing in schools and health services.
We are investing $102 million to create better regional transport links, including an upgrade of the Warrnambool train line, major arterial road improvements and the biggest single boost to country bus services in decades.
We are undertaking a major $101 million upgrade of the Royal Melbourne Showgrounds, securing the future of the Show to build enduring links between the suburbs of Melbourne and the regions of country Victoria.
In a major economic and environmental initiative, the Government is allocating $77 million towards the construction of the Wimmera-Mallee pipeline—one of the most significant water infrastructure projects ever undertaken in Victoria.
This new pipeline will give 40 communities across Victoria's west a more secure and higher quality water supply.
It will create jobs, open up new opportunities for regional industry, and protect the environment.
The budget also includes a major $40 million package to upgrade regional public hospitals, health centres and aged care facilities—in places such as Lorne, Stawell, Beechworth, Geelong and Omeo.
We are undertaking upgrades of more than 40 schools in country and regional Victoria, including building two new schools in Lara and Bairnsdale.
We're replacing 12 police stations in small rural communities, from towns like Pyramid Hill in Victoria's northwest and Whitfield in the northeast, to Bunyip in Gippsland.
We are investing $26 million to boost our food and fibre industries and $5 million to upgrade rail access for regional exporters to the Port of Geelong.
And we are securing the long-term future of Victoria's water and forest resources, and the regional industries and communities that rely on them.
A thriving and innovative Victorian economy
Let me now turn to innovation.
Innovation is the 21st Century's main driver of economic growth, quality jobs and high living standards—and a modern, outward looking economy must have innovation at its heart.
Innovation not only transforms existing industries, such as manufacturing and agriculture—it creates jobs in new industries, such as design and biotechnology.
Since 1999, the Government has invested heavily in science and technology, and in education, innovation and research.
We have done so because we are determined to position Victoria as a global player in fields such as biotechnology, advanced manufacturing, design, aerospace, ICT and environmental technologies.
This budget reflects and reinforces that determination.
It commits $100 million towards the construction of Australia's first synchrotron facility at Monash University in Clayton—giving Victoria the leading edge in scientific infrastructure.
We are doubling funding for medical research infrastructure in Victoria, with a $35 million boost over four years.
This will ensure we keep our best scientists and researchers here in Victoria and maintain our international leadership in medical research.
The Government is also investing $27 million over four years in biotechnology research and development, commercialisation and marketing—in line with our goal of positioning Victoria as one of the top five biotech locations in the world.
Turning good ideas into good business is critical to a successful innovation economy.
This budget builds on the Government's existing $20 million Technology Commercialisation Program by providing $7 million for a Centre for Innovation and Technology Commercialisation, cooperative research centres and a technology transfer program.
The Government is also providing funding to drive new, knowledge based industries in Victoria, including:
- •
- $9.2 million over two years to position Victoria as an international centre of design excellence;
- •
- $12 million over three years to establish a new Centre for Energy and Greenhouse Technologies in Gippsland; and
- •
- $27 million over four years for our Agenda for New Manufacturing—increasing the capacity of Victorian manufacturing to become more innovative and connect to global markets.
New initiatives in this budget will add to Victoria's growing reputation as a world leader in the modernisation of government—including a $71 million strategy to streamline government telecommunications services and $24 million for a new electronic Land Exchange.
As well as leading the way on innovation, the Government is also investing in Victoria's future as a creative State—building on our long-held reputation as Australia's arts capital.
The 2002-03 Budget delivers more than $100 million for arts projects, including:
- •
- the new Dame Elisabeth Murdoch Recital Hall and a new home for the Melbourne Theatre Company;
- •
- an additional $2 million over four years for Arts Victoria's successful Regional Arts Infrastructure Fund; and
- •
- $21 million to improve exhibition spaces and facilities at the Melbourne Museum and the State Library.
Alongside the Government's commitment to innovation, these projects deliver a strong program to drive Victoria's future as an innovative economy and a smart, creative and enterprising State.
Building Tomorrow's Businesses Today
The Government's commitment to innovation also includes the Building Tomorrow's Businesses Today package, recently announced by the Premier.
The budget gives effect to that package, allocating $364 million to create a more competitive business environment, encourage more innovative businesses and give Victorian business and industry a stronger international focus.
The package brings forward payroll tax cuts and the abolition of stamp duty on unquoted marketable securities.
It provides further cuts to payroll and land tax—bringing total business tax relief announced since October 1999 to more than $1 billion.
The Government will also provide $102 million in initiatives aimed at improving the way Victoria does business, including support for innovation and international expansion.
The Building Tomorrow's Businesses Today package is a great step forward for Victorian business—and it will help all businesses, big or small, city or country, to become more competitive, more innovative and better connected to global markets.
Valuing and investing in lifelong education
Building a successful innovative economy is simply not possible without a world-class education system.
Education is crucial to Victoria's long-term economic success, and to building strong, caring and tolerant communities.
That is why record investment in education is the cornerstone of the 2002-03 Budget.
We are making this investment to improve access and drive excellence in Victoria's education system, from preschool to post-compulsory level.
We want all Victorians to have access to world-class, lifelong education—from young children in kindergarten, to adults wanting to upgrade their qualifications, to someone wanting to learn a new language or skill later in life.
We want to make a real difference to young people's lives and give them every chance to succeed.
We want young Victorians to have the same access to education wherever they live—whether that's a country town like Birchip, a regional centre like Benalla, or suburbs like Fitzroy or Carrum Downs.
That means driving excellence and high standards across the entire State.
It means revitalising the way young people learn, and finding new, innovative ways to deliver better educational outcomes.
When we came to office, Victoria's school system was struggling.
Thousands of teachers had been taken out of the system.
Hundreds of schools had been closed down—or allowed to run down.
There were fewer apprenticeships.
We are undoing the damage of those years.
We have reduced class sizes in the critical early years of schooling.
We have set formal targets to improve literacy and numeracy, increase year 12 completion rates and improve student participation and achievement in regional Victoria.
We have put in place a Middle Years of Schooling initiative to keep students engaged in years 5 to 9.
We have invested in computers, technology, science labs and libraries.
We have upgraded TAFEs and schools across Victoria.
And we have invested in valuing, training and supporting one of this State's greatest resources—our teachers.
This year, we go even further. This year, we take the next steps to deliver a new era of opportunity and excellence in Victorian schools.
The 2002-03 Budget invests a further $550 million in education over four years—on top of the substantial commitment in our previous two budgets.
The Government is making a major new $28 million investment to improve the learning, health and wellbeing of children before they go to school.
In response to the Kirby Preschool Review, we are upgrading preschool facilities, providing extra support for children with special needs and developing a better management model for kindergartens.
In primary and secondary schools, we have allocated an extra $334 million over four years:
- •
- to improve literacy and numeracy in the early years of schooling;
- •
- for a new Access to Excellence program that will employ an additional 300 secondary teachers in schools with high absentee rates or low literacy and numeracy standards;
- •
- to deliver a new middle years program focusing on innovation and excellence; and
- •
- to roll-out, statewide, the new Victorian Certificate of Applied Learning, which offers young Victorians an alternative pathway to the VCE.
In total, more than 900 additional teachers will be employed across the State to ensure these outcomes are delivered.
The budget also focuses on improving access to education, with an injection of $31 million over four years to improve school bus services for country students, and an additional $3.6 million to support Koori students.
Across the State, the Government is building and upgrading more than 110 schools and four TAFEs—as part of a $216 million major building program.
This record investment in education will improve access and drive excellence across our schools and TAFEs.
And it confirms the Government's commitment to build a public education system that is the best in this country and among the very best in the world.
Ensuring high quality and accessible health services
The Government also continues to turn around Victoria's public health system.
The 2002-03 Budget builds on the successful Hospital Demand Management Strategy introduced last year that has more than halved ambulance bypass and reduced waiting lists for the first time in many years.
The budget provides additional funding of $464 million over four years, enabling Victoria's public hospitals to treat 30 000 more patients and employ 700 more nurses and health workers.
The Government is providing a $100 million boost to upgrade medical equipment and hospital facilities.
We will expand and improve the delivery of ambulance services, and employ an additional 43 paramedics.
We will support older Victorians to live independently at home, through a $29 million boost to Home and Community Care services.
And we will extend a range of vital health services, including dental health, women's health and breast screening services.
In this budget, the Government makes a major $61 million commitment to improving community mental health services and opening new mental health hospital beds.
The Government will continue its program of major capital works—redeveloping the Royal Melbourne, Angliss and Dandenong Hospitals, upgrading country and regional health services, and establishing four new country ambulance stations at Kyneton, Ararat, Colac and Hopetoun.
Honourable Speaker, the Bracks Government is restoring our health services after years of chronic underfunding—and we will continue to work with our nurses, doctors and health workers to rebuild Victoria's great public health system.
Community safety
Strong communities are also safe communities, and the Bracks Government is proud of its achievement in providing additional frontline police.
Victorian police numbers are now well over the 10 000 mark and Victoria has more than 800 extra police on the frontline than we did two and a half years ago.
In addition to increasing police numbers, the Government is building 20 new police stations across Victoria, replacing a further 31 country stations and upgrading police equipment.
The 2002-03 Budget provides an additional $26 million to build two new police stations at Footscray and Coburg, and replace 12 stations in small country towns.
This year, the budget focuses on delivering major improvements to Victoria's police and emergency services communications network.
The Government has approved funding for three major projects under the Statewide Integrated Public Safety Communications Strategy.
These projects will give all Victorian emergency services state-of-the-art communications equipment—reducing response times, improving coverage and giving staff access to computer data bases from their vehicles.
The Government will not continue the previous government's flawed experiment of privatising Victoria's emergency services communications.
This budget provides the funds to take these vital services back into public hands.
Road safety is also a priority for the Bracks Government, which has set a goal of reducing death and serious injury by road accidents by 20 per cent over five years.
The 2002-03 Budget invests record funding in upgrading roads and transport infrastructure, as well as providing $21 million in specific road safety initiatives, including a new program focusing on motorcyclists.
As part of the Linking the Suburbs strategy, $48 million will also be used to target roads and intersections with high accident rates in Melbourne's outer suburbs.
Promoting sustainable development and protecting the environment for future generations
Honourable Speaker, valuing and protecting our environment is one of the most important legacies we can leave our children and grandchildren.
We have an obligation to use our natural resources wisely and responsibly.
Victorians want leadership on protecting the environment and promoting sustainable development—and the Government is showing that leadership.
We have already committed more than $300 million to tackle salinity, restore the Snowy River, and improve flows in the Murray River.
Our plan to create world-first marine parks has received international attention and acclaim.
In this budget, we take further action to protect our waterways, our forests and our land.
Some of Victoria's most important rivers are under great and growing stress.
This is not a problem we can ignore—and we must take action now to manage our waterways more responsibly.
This budget provides an additional $11 million to improve the health of our most stressed rivers, and $13 million for a Gippsland Lakes Rescue Package.
The construction of the new Wimmera-Mallee pipeline will also benefit waterways in Victoria's west, improving flows in the Glenelg and Wimmera Rivers as well as opening up new agricultural opportunities.
The 2002-03 Budget also gives effect to the Government's Our Forests, Our Future statement.
The budget allocates $80 million to promote sustainable forest practices, establish new industry arrangements and provide assistance to workers and timber communities as Victoria moves to cut logging in our native forests by one third.
The Government is also moving to protect Victoria's fragile Box-Ironbark areas, with a $21 million package to set up forests, woodlands and reserves, and provide additional support to regional communities and the users of these areas.
The budget provides an additional $6 million for the Second Generation Landcare Action Plan—and $3 million for a statewide fox control program, to protect both our native wildlife and our wool industry.
Honourable Speaker, this budget, and our actions to date, confirm that the Bracks Government will lead the way in protecting our most valuable natural resources.
We will take the tough decisions as we work towards a long-term sustainable future for all Victorians.
Building strong and caring communities
Honourable Speaker, many of the investments in this budget are directed towards the Government's goal of building strong and caring communities.
Across Victoria, most people and places are doing very well, with prosperity rising on the back of strong economic growth and a significant increase in asset values, especially housing.
But others are not doing so well, and the Government recognises that inequality and disadvantage unfairly undermine the hopes and opportunities of these Victorians and these communities.
This budget takes the proceeds of prosperity and growth, and reinvests some of those proceeds in assisting families and communities in need of support.
In response to increasing notifications of suspected child abuse and neglect, the Government is funding a $65 million new approach to child protection services.
We will improve intensive services for abused children, provide additional support for vulnerable families and assist Victoria's Koori communities protect children and young people.
This package will put 60 new child protection workers on the frontline, and it is one of the most significant improvements in community service delivery in Victoria for many years.
The budget delivers an additional $55 million over four years to improve services for people with disabilities, including the first stage of the redevelopment of Kew Residential Services.
The Government is also providing $13 million over four years to improve the safety of railway pedestrian crossings and wheelchair access to railway stations.
As part of the Government's strong commitment to reconciliation between indigenous and non-indigenous Victorians, we are providing $12 million over four years to support indigenous communities.
The Government is also undertaking a series of neighbourhood renewal projects to upgrade run-down public housing estates and assist local communities create job and education opportunities.
These projects run from Maidstone/Braybrook in Melbourne's west to communities in Seymour, Shepparton and Geelong.
$8.8 million is also provided over four years to extend services for homeless people.
To improve access to housing in our suburbs and regions, the budget allocates $13 million in 2002-03 to streamline and expand concessional arrangements to enable more Victorian families and people on low incomes to purchase a home.
The Government is also funding a $15 million redevelopment of the inadequate and outdated Turana Juvenile Justice facility, and providing $8 million to improve access to legal aid, victim support and dispute resolution services.
The Government also recognises that tolerance and diversity are important features of strong communities, as well as some of this State's greatest assets.
This budget expands the Victorian Multicultural Commission's Community Grants Program and provides funding to improve language and interpreting.
APPROPRIATION BILL
Honourable Speaker, the Appropriation (2002-03) Bill provides authority to enable government departments to meet their agreed service delivery responsibilities in 2002-03.
The Bill supports a financial management system that recognises the full cost of service delivery in Victoria and is thus based on an accrual framework.
Schedule One of the Bill contains estimates for 2002-03 and provides a comparison with the 2001-02 figures.
In line with established practices, the estimates included in Schedule One of the Bill are provided on a net appropriation basis.
These estimates do not include certain receipts that are credited to departments pursuant to Section 29 of the Financial Management Act 1994.
This budget has again been examined by the Auditor-General as required by the new standards of financial reporting and transparency established by the Government in 2000.
CONCLUSION
Honourable Speaker, Victoria in the year 2002 is a great place to live—a great place to be.
We are leading Australia in so many ways—with our strong economic and jobs growth set to continue over the years ahead.
Some of the most exciting and important projects in this State's history have already started—or are about to begin.
The redevelopment of the Austin Hospital—the largest public sector hospital project in Australia.
The new National Neuroscience Facility—kick-started by the Victorian Government and set to become a world leader in neuroscientific research.
The redevelopment of Australia's greatest sporting ground, the MCG.
New regional fast rail links to Bendigo, Ballarat, Geelong and Traralgon.
The new Holden engine plant.
The Scoresby Freeway.
The Wimmera-Mallee pipeline.
New state-of-the-art sports facilities across Victoria as we prepare for the 2006 Commonwealth Games.
Our education system is driving forward into a new era of excellence.
Literacy and numeracy standards are up. Completion rates are up. Class sizes are down. New schools are being built.
Our health system is turning around, treating more Victorians and delivering better quality care right across the State.
Our business and industry are becoming more competitive, more innovative and more connected to the world.
And new opportunities are being created in our regions and our suburbs, and in the industries of the future.
Victoria is headed in the right direction—and we have the wind in our sails.
The Government is investing well to ensure we stay on course, maintain our strong growth, and give all Victorians the chance to be part of a thriving and successful Victoria.
The 2002-03 Budget puts the proceeds of Victoria's strong economic performance over the past two years to work—renewing and rebuilding our suburbs and regions, and driving new opportunities in education and innovation.
This budget reinvests in the foundations we need for an even stronger, brighter future—for our children and for all Victorians.
Honourable Speaker, I commend the Bill to the House.

Presented by
The Honourable John Brumby, M.P.
Treasurer of the State of Victoria
for the information of Honourable Members
Budget Paper No. 2
| 2002-03 Budget highlights | |||
Chapter 1: Financial policy objectives and strategies | |||
| Financial strategies, objectives and priorities | |||
| Seeking a better Commonwealth-State funding deal | |||
Chapter 2: Budget position and outlook | |||
| 2002-03 Budget initiatives | |||
| 2002-03 Budget estimates | |||
| Forward estimates outlook 2002-03 to 2005-06 | |||
| Reconciliation of forward estimates to previously published estimates | |||
| Use of cash resources | |||
Chapter 3: Economic conditions and outlook | |||
| World and Australian economic environment | |||
| Victorian economic conditions | |||
| Victorian economic outlook | |||
Chapter 4: Budget initiatives | |||
| Growing Victoria Together | |||
| Investing for our future—stronger communities | |||
| Thriving and innovative industries across Victoria | |||
| Valuing and investing in lifelong education | |||
| High quality, accessible health and community services | |||
| Public safety and justice | |||
| Other Growing Victoria Together strategies | |||
Chapter 5: Balance sheet management and outlook | |||
| Asset management strategy | |||
| Liability management strategy | |||
| Net assets | |||
Chapter 6: Statement of Risks | |||
| Economic risks | |||
| Sensitivity of the budget to economic conditions | |||
| Expenditure and revenue risks | |||
| Contingent liabilities | |||
Chapter 7: Estimated Financial Statements and notes | |||
| Introduction | |||
| Estimated Financial Statements for the Victorian general government (budget) sector | |||
| Notes to the Estimated Financial Statements | |||
| Department of Treasury and Finance Statement in relation to the Estimated Financial Statements | |||
Appendix A: Specific policy initiatives affecting the budget position | |||
| Output and asset investment initiatives | |||
| Revenue initiatives | |||
| Savings initiatives | |||
Appendix B: Growing Victoria Infrastructure Reserve | |||
Appendix C: Revised 2001-02 budget outcome | |||
| Revised 2001-02 Statement of Financial Performance | |||
| Revised 2001-02 Cash Flow Statement | |||
| Revised 2001-02 Statement of Financial Position | |||
Appendix D: Historical and forward estimates tables | |||
Appendix E: Uniform presentation of Government Finance Statistics | |||
| The accrual GFS presentation | |||
| Institutional sectors | |||
Appendix F: Tax expenditures | |||
Appendix G: Commonwealth-State financial relations | |||
Appendix H: Requirements of the Financial Management (Financial Responsibility) Act 2000 | |||
Style Conventions | |||
Index | |||
Growing Victoria Together—priorities for the 2002-03 Budget
- •
- The Bracks Government's vision for Victoria is that by 2010 we will be a State where:
- —
- innovation leads to thriving industries generating high quality jobs;
- —
- protecting the environment for future generations is built into all government decision making;
- —
- there are caring, safe communities with equitable opportunities; and
- —
- all Victorians have access to the highest quality health and education services all through their lives.
- •
- The priority actions required to deliver these long-term commitments are identified in Growing Victoria Together and have guided budget choices and the directions of government departments in the 2002-03 Budget.
- •
- The 2002-03 Budget invests for Victoria's future. It invests in more jobs and stronger communities, with education and innovation driving new opportunities.
Sound financial management
- •
- The Bracks Government believes that a strong and secure financial base provides an essential foundation for Victoria's long-term economic, social and environmental wellbeing.
- •
- Demonstrating the Government's commitment to sound financial management, the 2002-03 Budget delivers:
- —
- a substantial general government operating surplus of $522 million in 2002-03, and surpluses averaging around $600 million for the following three years;
- —
- a reduction in general government net financial liabilities, excluding Growing Victoria infrastructure reserve, from $16.3 billion or 10.8 per cent of gross state product (GSP) at 30 June 1999 to an estimated $15.9 billion or 7.1 per cent of GSP at 30 June 2006;
- —
- over the same period general government net debt, excluding Growing Victoria infrastructure reserve, is expected fall by more than half from $4.9 billion or 3.3 per cent of GSP in June 1999 to $2.3 billion or 1.0 per cent of GSP in June 2006;
- —
- new output initiatives worth $317 million in 2002-03 and averaging $326 million per annum over the following three years;
- —
- $3 billion total estimated investment (TEI) to boost infrastructure assets, including the Scoresby Freeway; and
- —
- through Building Tomorrow's Businesses Today, tax cuts of $262 million over the next four years.
- •
- The Government's prudent financial management was acknowledged recently with the international ratings agencies Standard and Poor's and Moody's affirming Victoria's triple-A credit rating.
A growing economy—Victoria leads the way
- •
- Despite the global slowdown, the Victorian economy performed strongly over the past year, exceeding the national average in key measures such as consumer spending, business investment and employment.
- •
- Domestic demand rebounded strongly during calendar 2001, particularly in the second half, underpinned by consumer spending, government capital expenditure and acceleration in housing construction.
- •
- The Victorian labour market recorded further solid gains following on from its exceptionally strong employment growth in 2000-01.
- •
- Recent evidence of a global recovery is positive for the 2002-03 outlook.
- •
- Victorian economic growth is now estimated at 3.75 per cent in 2001-02, exceeding the original budget estimate of 2.75 per cent, and 3.5 per cent in 2002-03.
- •
- Employment is forecast to grow 1.5 per cent in 2002-03, following 1.25 per cent in 2001-02.
Investing for our future—stronger communities
- •
- The Government is committed to growing and linking the whole State. The Government recognises that the key to Victoria's future lies in strong communities, contributing to and sharing in the benefits of a thriving and innovative state economy.
- •
- The 2002-03 Budget provides a major boost to infrastructure focusing on generating more jobs, strengthening our communities and securing new opportunities across Victoria's suburbs, regions and growth corridors, including a $101 million redevelopment of the Royal Melbourne Showgrounds.
- •
- Key highlights of investment in Melbourne's growing suburbs include:
- —
- $637 million TEI (excluding Federal Government funding) in new public transport and upgrading roads, including Scoresby Freeway, electrification of rail line to Craigieburn, key arterial road upgrades and extension of Knox tram service;
- —
- $36 million over four years for 25 new and upgraded bus routes around Melbourne;
- —
- additional investment in 2002-03 in education and training facilities in Melbourne's growing suburbs; and
- —
- the redevelopment of the Royal Melbourne, Dandenong and Angliss Hospitals.
- •
- The 2002-03 Budget continues to build stronger rural and regional communities. Key highlights include:
- —
- $77 million TEI for the construction of the Wimmera-Mallee pipeline;
- —
- a $94 million investment package, including duplication of the Calder Highway between Kyneton and Faraday and other major regional road upgrades and upgrading the Warrnambool rail line, in addition to $8 million over four years to enhance bus services;
- —
- $40 million to continue the redevelopment and upgrade of rural health and public sector residential aged care facilities;
- —
- $130 million over four years for the sustainable use of Victoria's natural resources; and
- —
- improving access and excellence in regional education and training.
Thriving and innovative industries across Victoria
- •
- Innovation is the 21st Century driver of economic growth, high quality jobs, wealth and improved living standards. The 2002-03 Budget focuses on enhancing Victoria as an innovative economy by:
- —
- committing $139 million over four years to new output initiatives as well as $148 million TEI. This includes doubling of the current level of funding for medical research infrastructure and the construction of Australia's first synchrotron facility;
- —
- allocating $364 million over four years to create a more competitive business environment through Building Tomorrow's Businesses Today initiatives. This comprises $262 million in significant business taxation relief and $63 million in new output initiatives, in addition to $39 million in asset investment aimed at improving the way that Victoria does business; and
- —
- targeting agriculture and regional industries by providing $26 million over four years to promote innovation, improve skills and business management, tackle disease and boost exports in the food and fibre industries.
Valuing and investing in lifelong education
- •
- Improving access and driving innovation and excellence in education, from preschool to post-compulsory levels, is the Government's top priority. The 2002-03 Budget builds on major investments in education in the previous two budgets.
- •
- The budget provides $27 million over four years to improve the health, development, learning and wellbeing of children before they start school through reforms to preschools and the new BEST START initiative.
- •
- $334 million over four years in output initiatives, as well as asset investment of $216 million TEI, is allocated to:
- —
- support learning in the early years of schooling through reducing the average class size in prep to year 2 and the implementation of an early years numeracy program;
- —
- improve participation and achievement in education through a new Access to Excellence initiative and a Middle Years Reform and Innovations program;
- —
- address equity and access issues through funding additional Koori educators and home liaison officers to provide education services and support to Koori students;
- —
- place at least 900 additional teachers into schools across Victoria; and
- —
- the modernisation of over 110 government schools and TAFE institutes across Victoria.
Ensuring high quality, accessible health and community services
- •
- The 2002-03 Budget continues to turn around Victoria's health system with better facilities, new approaches and more health workers to give Victorians the highest quality of care.
- •
- In this budget the Government has committed $1.2 billion over four years, as well as asset investment of $217 million TEI, to:
- —
- extend the multi-year Hospital Demand Management Strategy to provide more beds to treat extra patients, including 30 000 patients in hospital emergency departments and 14 000 extra elective surgery, renal, palliative care and radiotherapy patients;
- —
- deliver enhanced community services through a new approach to the delivery of child protection and placement services;
- —
- support older people to live active lives in the community through the ongoing implementation of a program to upgrade and redevelop residential aged care and expanding the Home and Community Care program; and
- —
- respond to the growing need for community and home-based disability support services and tackle homelessness.
Creating safe streets, homes and workplaces
- •
- The Government is committed to preventing crime and maintaining community safety whether in public places, roads, homes or workplaces. The 2002-03 Budget provides $81 million TEI in asset investment, as well as $34 million over four years in new output initiatives, to:
- —
- enhance police services by providing police with upgraded equipment, and modernising and replacing metropolitan and rural police stations;
- —
- ensure seamless transition of emergency call taking and dispatch services and implementation of the Statewide Integrated Public Safety Communications Strategy; and
- —
- improve the safety of all Victorian road and transport users through substantial investment towards reducing death and serious injury from road accidents by 20 per cent over five years.
Promoting sustainable development and protecting the environment for future generations
- •
- The 2002-03 Budget provides key initiatives designed to value Victoria's natural resources. The Government is allocating $130 million over four years, as well as asset investment of $77 million TEI, specifically designed to value and protect Victoria's water, forest and land resources by:
- —
- protecting the health of Victoria's most precious rivers and providing more secure and higher quality water supply;
- —
- the construction of the Wimmera-Mallee pipeline;
- —
- ensuring the long-term future of Victorian forests and regional communities, including the Box Ironbark package; and
- —
- supporting the sustainable management of Victoria's agricultural land and ski fields.
- •
- Funding will be provided for a Centre for Energy and Greenhouse Technologies in Gippsland and the Cooperative Research Centre for Clean Power from Lignite.
Building cohesive communities and reducing inequalities
- •
- The Government has committed $192 million over four years to build strong communities to ensure that there are job opportunities,suport for families and improved access to affordable, high quality services, and making communities good places in which to live and work. This includes:
- —
- additional funding of $12 million over four years to target areas of indigenous disadvantage and to progress reconciliation between indigenous and non-indigenous Victorians;
- —
- expanding the supply of public housing and making housing more affordable. At least an extra 1500 public and community housing units will be created and $12 million provided
from the Office of Housing for neighbourhood renewal across the State. The budget also allocates $13 million in 2002-03 to reform, streamline and expand concessional arrangements to enable more Victorian families and people on low incomes to purchase their own homes; and
- —
- an injection of $84 million into Victorian sport with a focus on developing state-of-the-art facilities ahead of the 2006 Commonwealth Games, including an upgrade of the Melbourne Sports and Aquatic Centre and detailed planning and coordination of the Melbourne 2006 Commonwealth Games.
- •
- The budget also provides a $106 million boost for arts and cultural projects, including new exhibitions, maintenance of state collections and the Yarra Precinct Arts Integration project.
Promoting rights and respecting diversity
- •
- The Government recognises that the diverse cultural backgrounds, languages and abilities of Victorians are some of the State's greatest strengths.
- •
- The 2002-03 Budget builds on the Government's commitment to support and enhance the role of the Victorian Multicultural Commission through the continuation and expansion of the current community grants program.
- •
- The Government has committed $8.3 million to improve access to legal aid, victim support and alternative resolution procedures.
CHAPTER 1: FINANCIAL POLICY OBJECTIVES AND STRATEGIES
- •
- The Government's strategic priorities for Victoria are highlighted in Growing Victoria Together, the framework that balances economic, social and environmental goals and actions.
- •
- The Government is committed to maintaining a substantial operating surplus of at least $100 million in each year.
- •
- The Government is using operating surpluses to invest for the future, providing capital works to enhance social and economic infrastructure throughout Victoria, with expenditure on strategic infrastructure projects boosted by funding from the Growing Victoria infrastructure reserve.
- •
- Improved services will be delivered to all Victorians, with the key priorities being education, health and community safety.
- •
- The Government is committed to ensuring competitive and fair taxes and charges apply to Victorian businesses and households through implementation of the Government's Better Business Taxes and Building Tomorrow's Businesses Today packages.
- •
- Victoria's triple-A credit rating will be maintained by keeping net financial liabilities at prudent levels.
FINANCIAL STRATEGIES, OBJECTIVES AND PRIORITIES
This chapter set outs the Government's financial policy objectives and strategies as required by the Financial Management (Financial Responsibility) Act 2000. The Act includes a set of sound financial management principles. These are to:
- •
- manage financial risks faced by the State prudently, having regard to economic circumstances;
- •
- pursue spending and taxation policies that are consistent with a reasonable degree of stability and predictability in the level of the tax burden;
- •
- maintain the integrity of the Victorian tax system;
- •
- ensure that government policy decisions have regard to their financial effects on future generations; and
- •
- provide full, accurate and timely disclosure of financial information relating to the activities of the Government and its agencies.
The Government's financial responsibility legislation requires a statement of its short and long-term financial objectives in each budget and budget update. It is also a necessary element of the financial management principle of providing full, accurate and timely disclosure of financial information relating to the activities of the Government and its agencies.
Consistent with Growing Victoria Together the Government has a number of short and long-term financial objectives, as shown in Table 1.1.
Table 1.1: Financial objectives
| Long-term | Short-term | |
|---|---|---|
| Maintain a substantial budget operating surplus | Operating surplus of at least $100 million in each year | |
Provide capital works to enhance social and economic infrastructure throughout Victoria | Implement strategic infrastructure projects, including those funded from the Growing Victoria infrastructure reserve | |
Provide improved service delivery to all Victorians | Expenditure priority on education, health and community safety | |
Ensure competitive and fair taxes and charges to Victorian businesses and households | Implement reforms to Victoria's business taxation system | |
Maintain state government net financial liabilities at prudent levels | Maintain a triple-A credit rating |
The Government has met its commitment to maintain an operating surplus of at least $100 million. At the same time the Government has used the operating surplus to upgrade and modernise the State's infrastructure to address economic, social and environmental outcomes, without incurring additional borrowings. Victoria's triple-A credit rating has been maintained. Net financial liabilities are projected to fall over the forward estimates period as a proportion of gross state product (GSP).
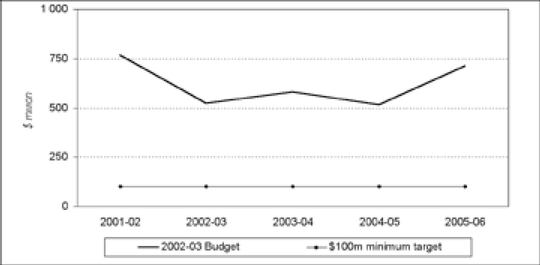
Operating surplus
The outlook for the budget surplus remains consistent with this objective, as can be seen in Chart 1.1. Following an estimated surplus of $765 million in 2001-02, the operating surplus is now forecast to be $522 million in 2002-03 and to average around $600 million in the following three years. This substantial operating surplus is an important funding source for the Government's strong capital investment program.
The operating surplus has been achieved despite relatively low growth in taxation revenue, which is expected to grow by 0.5 per cent in 2002-03 and by an average of 1.8 per cent in the following three years. The low average annual growth over the projection period reflects a forecast moderation of property and other asset markets, the business tax cuts announced in the Government's Better Business Taxes and Building Tomorrow's Businesses Today packages, and the abolition of debits tax from 1 July 2005 (subject to review by the Ministerial Council in accordance with the Intergovernmental Agreement).
Given the continued uncertainties in the world economy (see Chapter 3, Economic Conditions and Outlook for further information), the Government is maintaining a buffer above the $100 million minimum operating surplus target. This provides protection of the operating surplus target against a moderate deterioration in the national and world economies and asset markets. For a more detailed discussion of economic and other risks, and the sensitivity of the operating surplus to changes in economic conditions, see Chapter 6, Statement of Risks.
Chart 1.1: General government sector operating surplus(a)
Source: Department of Treasury and Finance
Note:
- (a)
- The general government sector operating surplus is equivalent to the "net result" in the statement of financial performance in Chapter 7, Estimated Financial Statements and Notes.
The operating surplus objective and buffer are in accord with the financial management principle of pursuing expenditure and taxation policies that allow reasonable stability and predictability in tax burden levels. Thus, businesses and households can have confidence that tax rates and the level of service delivery will not need to be adjusted markedly and unexpectedly at some future date to retrieve the State's financial position.
Table 1.2 shows that the substantial operating surpluses and Growing Victoria infrastructure reserve are being used to fund the significant infrastructure spending program. For example, 2002-03 net infrastructure investment of $2 066 million is more than double the depreciation expense of $952 million, with the shortfall being sourced from the operating surplus ($522 million) and a drawdown in the Growing Victoria infrastructure reserve of $570 million. As a consequence, and despite the large infrastructure program, net debt falls slightly in the budget and forward estimate years.
Table 1.2: Application of cash resources
| | 2001-02 Revised | 2002-03 Budget | 2003-04 Estimate | 2004-05 Estimate | 2005-06 Estimate | |||||
|---|---|---|---|---|---|---|---|---|---|---|
| | ($ million) | |||||||||
| Budget operating surplus | 765 | 522 | 580 | 517 | 712 | |||||
| Plus: Depreciation expense | 895 | 952 | 1003 | 1067 | 1115 | |||||
| Plus: Other non-cash expenses (net)(a) | 1041 | 123 | 388 | 648 | 307 | |||||
| Plus: Net drawdown from Growing Victoria infrastructure reserve | -174 | 570 | 426 | 170 | 130 | |||||
| Cash available for asset investment | 2528 | 2166 | 2397 | 2403 | 2264 | |||||
| Less: Net infrastructure investment | 1929 | 2066 | 2292 | 2299 | 2166 | |||||
| Less: Other investment activities (net)(b) | -56 | 13 | 13 | 12 | 10 | |||||
| Reduction in net debt excluding Growing Victoria(c) | 655 | 87 | 92 | 91 | 88 | |||||
Source: Department of Treasury and Finance
Notes:
- (a)
- Includes increase in unfunded superannuation liability and increase in liability for employee entitlements.
- (b)
- Comprises increase in other financial assets and decrease in gross borrowing.
- (c)
- Growing Victoria investments are excluded as an offset to gross debt on grounds that these investments are earmarked for infrastructure projects and are therefore not available to redeem gross debt.
The Government uses the Australian Accounting Standards Board (AAS 31) operating result as its measure of the headline budget surplus. A method of presentation alternative to AAS 31 is the Government Finance Statistics (GFS) system employed by the Australian Bureau of Statistics (ABS). AAS 31 and GFS measures are shown in Table 1.3. For a detailed reconciliation between AAS 31 and the GFS measures refer to Table E.12 in Appendix E, Uniform Presentation of Government Finance Statistics.
The operating result—designed to match taxes, grants and other revenue earned in the year to expenses incurred—is similar under both generally accepted accounting principles (AAS 31) and the ABS (GFS) frameworks. The other two GFS measures incorporate a mixture of operating statement and balance sheet items. Traditionally GFS cash surplus has closely mirrored the change in net debt, although recent accounting changes have loosened this link.
GFS cash surplus measures the surplus of cash receipts over cash payments, and produces a lower surplus largely because of the inclusion of infrastructure asset expenditure as a cash payment.
GFS net lending (or fiscal balance) is equal to the change in net debt and other financial liabilities. It moves into deficit over the forward estimates because the increasing present value of accrued members' benefit entitlements pushes up the State's unfunded superannuation liability. However, as noted below, net financial liabilities fall as a proportion of GSP over the period and the Government's commitment is to eliminate the unfunded superannuation liability by 2035.
Table 1.3: AAS 31 net result and GFS budget measures (excluding Growing Victoria)
| | 2001-02 Revised | 2002-03 Budget | 2003-04 Estimate | 2004-05 Estimate | 2005-06 Estimate | |||||
|---|---|---|---|---|---|---|---|---|---|---|
| | ($ million) | |||||||||
| Net operating result (AAS 31) | 765 | 522 | 580 | 517 | 712 | |||||
| Net operating balance (GFS) | 1161 | 489 | 545 | 483 | 680 | |||||
| GFS net lending(a) | -30 | 163 | -145 | -359 | -89 | |||||
| GFS cash surplus(a) | 663 | 305 | 265 | 315 | 240 | |||||
Source: Department of Treasury and Finance
Note:
- (a)
- The table shows GFS net lending (+) / borrowing (-) and GFS cash surplus (+) / deficit (-) excluding the impact of Growing Victoria. Growing Victoria investments are excluded as an offset to gross debt on grounds that these investments are earmarked for infrastructure projects and are therefore not available to redeem gross debt.
Infrastructure
The Government recognises that building effective infrastructure is essential for delivering improved services and promoting growth across the whole State. In Growing Victoria Together the Government identified the following priority infrastructure actions:
In addition, the Government is aiming to rebuild and modernise the State's social infrastructure including schools, hospitals, prisons, police stations, community services and recreational and culture resources—the foundations for a prosperous and equitable society.
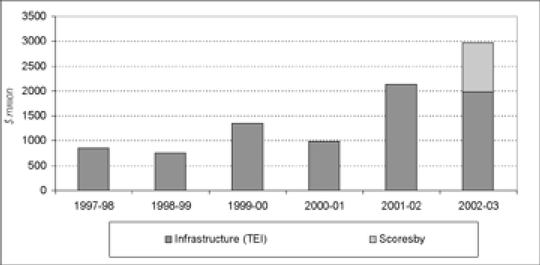
The 2002-03 Budget commits $3.0 billion (total estimated investment—TEI) to boost infrastructure assets (see Chart 1.2). A significant component of this program is the Scoresby Freeway. The Victorian Government has matched the Commonwealth Government's contribution of $445 million, in addition to the $110 million in land purchases. The Scoresby Freeway will deliver significant road and public transport improvements in one of Melbourne's most important growth corridors, creating a seamless link stretching between Ringwood and Frankston and improving east-west connections for travel to the CBD and beyond.
Chart 1.2: Infrastructure spending commitments in recent budgets (TEI)
Source: Department of Treasury and Finance
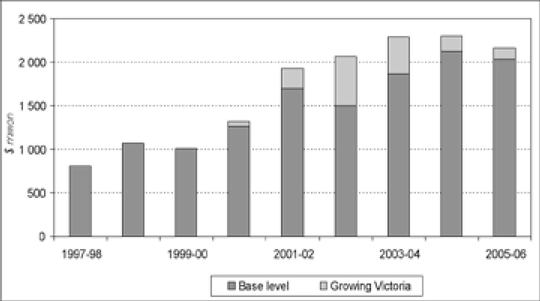
Chart 1.3 shows past actual yearly expenditure on net infrastructure investment, together with forward projections.
Chart 1.3: General government sector net infrastructure investment
Source: Department of Treasury and Finance
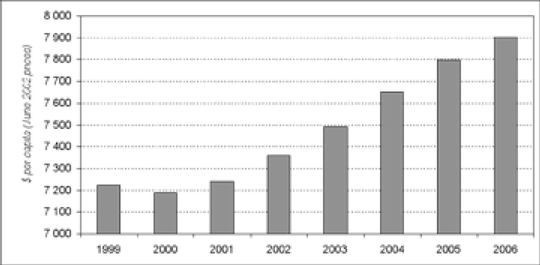
Over the period 2002-03 to 2005-06 annual expenditure on fixed assets will average $2.2 billion. This increased level of expenditure far outstrips estimated depreciation of around $1 billion per annum, and results in growth of the real capital stock over the four years to June 2006 of over 11 per cent compared to projected population growth of around 4 per cent (see Chart 1.4).
Chart 1.4: Real capital stock per capita as at 30 June
Source: Department of Treasury and Finance
Service delivery
The Government is building on last year's service delivery initiatives by continuing with medium to long-term strategies to improve quality, access and equity, particularly in education, health and community safety.
Since coming to office, the Government has lifted Victoria's spending in the areas of education, health and community safety. Chart 1.5 shows that the level of the Government's spending per capita in health has outstripped that of New South Wales and Queensland. Government expenditure per capita on education is higher than that in New South Wales and closely aligned to that in Queensland (the growth per capita in education spending has been higher in Victoria than Queensland).
This expenditure has produced better outcomes for health, education and community safety:
- •
- emergency department ambulance bypass rates have fallen significantly during 2002, while the number of patients waiting for more than 12 hours in emergency departments for admission to a ward has also decreased. Metropolitan emergency departments continue to treat more patients, and hospital capacity taken up by people waiting for residential aged care has reduced;
- •
- year 7-12 retention rates for Victorian government schools increased from 69.8 per cent in 1999 to 73.7 per cent in 2001. For the first time in many years Victorian government school retention rates were better than all other States excluding the ACT; and
- •
- in 2000, Victoria had the lowest proportion of victims of crime against both property and persons of all the States.
The 2002-03 Budget provides additional funding for new output initiatives of $317 million in 2002-03 and an average of $326 million over the following three years. This is net of $163 million of funding in 2002-03 from existing forward estimates demand contingencies (put aside for increasing service delivery required by population and demonstrated demand growth). It is also in addition to $161 million in 2002-03 of output initiatives announced since the 2001-02 Budget and reflected in the 2001-02 Budget Update.
Chart 1.5: Per capita spending in selected portfolios
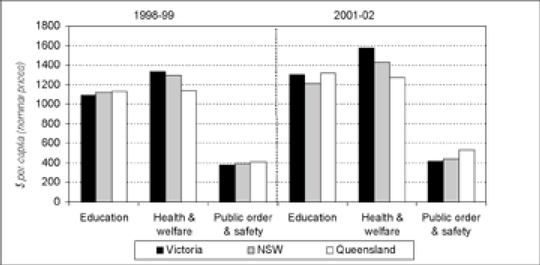
Source: Australian Bureau of Statistics; Victorian Department of Treasury and Finance; NSW Department of Treasury; Queensland Department of Treasury
In 2002-03, resources are targeted towards the following key service areas identified in Growing Victoria Together:
The 2002-03 Budget continues the expenditure to date by focusing on initiatives which will give all schools and students the opportunity to participate in Victoria's drive towards excellence in education and training, with $334 million in new output initiatives over four years, as well as $216 million (TEI) in asset investment. The priority initiatives targeted in the 2002-03 Budget are focused on achieving the education and training goals and targets.
The 2002-03 Budget continues to turn around Victoria's health and community services system, building on new service delivery approaches implemented in the last budget, with $1.2 billion in new initiatives over four years. The budget also continues to rebuild the health and community services system with a $217 million investment in new human services infrastructure.
In the 2002-03 Budget the Government has allocated $81 million TEI and $34 million in new output initiatives over four years to preventing crime and maintaining community safety, whether in public places, homes or workplaces. The Government is committed to improving road and workplace safety and to reducing offending and re-offending.
Taxation
In Growing Victoria Together the Government reiterated its commitment to ensuring a competitive tax system in Victoria in order to foster a business environment conducive to investment and job creation.
The Government's tax reform package, Better Business Taxes announced tax cuts of $774 million on 26 April 2001, which reduced the burden of payroll tax, cut the number of state business taxes, and reduced paperwork and red tape.
The Building Tomorrow's Businesses Today statement, released on 22 April 2002, continues the Government's ongoing commitment to ensure a competitive tax regime for Victorian businesses. The Government's strong financial position enables further cuts in business taxes of $262 million to 2005-06, providing an additional boost to jobs and growth in Victoria by:
- •
- raising the payroll tax threshold from $515 000 to $550 000 from 1 July 2002, a year ahead of schedule;
- •
- reducing the payroll tax rate from 5.45 per cent to 5.35 per cent from 1 July 2002, a year ahead of schedule;
- •
- further reducing the payroll tax rate from 5.35 per cent to 5.25 per cent from 1 July 2003. The payroll tax initiatives will further stimulate business growth and employment and will represent a 9 per cent reduction in the payroll tax rate under the Bracks Government;
- •
- raising the land tax threshold from $125 000 to $150 000 from 2002-03; and
- •
- abolishing the stamp duty on unquoted marketable securities from 1 July 2002, a year ahead of schedule.
In total, across Better Business Taxes and Building Tomorrow's Businesses Today, the Government has announced tax cuts of over $1 billion in its first term of office.
This budget allocates $13 million in 2002-03 to reform, streamline and expand existing concessions on conveyancing duty to enable more Victorian families and people on low incomes to purchase their own homes. The maximum concession available will rise to $4 660. This will double the numbers of concession card holders and families with dependent children expected to receive a concession in 2002-03.
The competitiveness of Victoria's tax regime plays an important role in underpinning economic growth and investment. Consistent with the Government's strategic priority to promote growth across the whole of Victoria, the Government is aiming to ensure Victoria's taxes remain competitive with the Australian average.
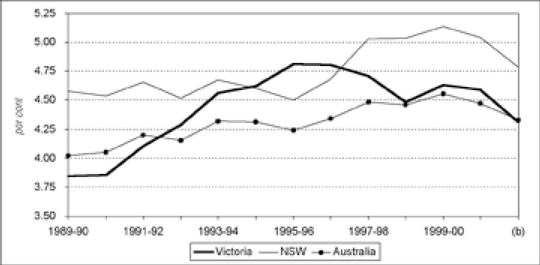
State taxation revenue expressed as a share of nominal GSP is Victoria's preferred measure of tax competitiveness as it relates the level of taxation revenue to economic capacity. Taxation revenue as a share of nominal GSP for Victoria, New South Wales and the Australian average is shown in Chart 1.6.
Chart 1.6: Taxation revenue as a share of nominal GSP(a)
Source: Australian Bureau of Statistics; Department of Treasury and Finance
Notes:
- (a)
- Historical taxation data have been recast to reflect only those taxes that remain after 1 July 2001.
- (b)
- 2000-01 data further adjusted for Victorian tax changes announced in this budget, but assuming no further tax changes in other States in their 2002-03 budgets.
Using 2000-01 actual taxation data (the latest year which is available from the ABS) and adjusting for all tax changes announced in the 2001-02 budgets of all States, as well as tax changes announced in this budget, Victoria's taxation as a share of nominal GSP is estimated to be slightly below the Australian average and a substantial 0.48 percentage points of GSP below that of New South Wales.
Net financial liabilities
The Government is committed to maintaining net financial liabilities (net debt and unfunded superannuation liability) at prudent levels in order to achieve its objective of maintaining Victoria's triple-A credit rating.
Victoria's triple-A long-term local currency rating was reaffirmed by Standard and Poor's on 24 January 2002 and by Moody's on 28 March 2002. Both ratings agencies cited Victoria's low debt levels, strong fiscal position and very strong financial performance in recent years as key reasons behind their decision.
The 2002-03 budget outlook reinforces these positive factors. Substantial operating surpluses are projected for 2002-03 and the remainder of the forward estimates period. General government net financial liabilities (excluding Growing Victoria) were $16.3 billion or 10.8 per cent of GSP at June 1999. In nominal terms, they are projected to reach $15.4 billion as at June 2002 and $15.9 billion as at June 2006 (see Chart 1.7). The change during the forward estimates period reflects movement in unfunded superannuation liabilities arising from the increasing present value of accrued members' benefit entitlements. As a proportion of GSP net financial liabilities are expected to decrease to 7.1 per cent of GSP by June 2006.
Net debt as a component of net financial liabilities is forecast to fall by more than half from $4.9 billion (3.3 per cent of GSP) in 1999 to $2.3 billion (1.0 per cent of GSP) by 2006. Victoria's net financial liabilities position is expected to remain comparable with other triple-A jurisdictions.
Chart 1.7: General government net financial liabilities excluding Growing Victoria(a)(b)

Source: Department of Treasury and Finance
Notes:
- (a)
- General government net financial liabilities are calculated as the sum of net debt and net unfunded superannuation liabilities.
- (b)
- Net debt is calculated as gross debt less liquid financial assets. Growing Victoria investments are excluded as an offset to gross debt on grounds that these investments are earmarked for infrastructure projects and are therefore not available to redeem gross debt.
SEEKING A BETTER COMMONWEALTH-STATE FUNDING DEAL
The distribution of Commonwealth grants between the States and Territories is important to the achievement of the Government's financial objectives. The existing Commonwealth arrangements are in need of reform. The poor grant shares flowing to Victoria under existing arrangements reduces Victoria's capacity to deliver services, provide additional infrastructure investment and reduce taxes.
The share of Commonwealth general purpose grants redistributed away from Victoria under the Commonwealth Grants Commission (CGC) process continues to increase. Table 1.4 shows the levels and changes in cross-subsidies for each State and Territory as a result of the CGC's 2002 Update. Victoria's cross-subsidy to the other States and Territories for 2002-03, compared to the equal per capita share, is now estimated at over $1 billion, an increase of $120 million from 2001-02.
In addition, for every dollar of GST revenue raised from Victorians, it is estimated that only 83 cents is returned as revenue to Victoria. This is a result of the CGC determinations and the fact that Victorians spend more per head on goods and services than the average Australian.
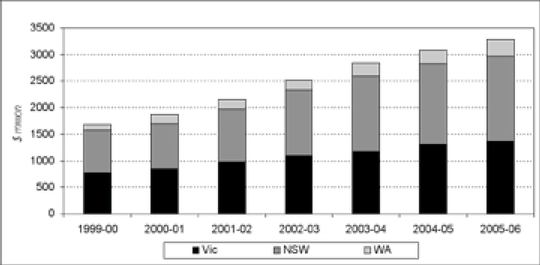
The cross-subsidy from Victoria, New South Wales and Western Australia has been growing steadily since the current CGC relativities were introduced in 1999 and is projected to double to $3.4 billion from 1999-2000 to 2005-06 (see Chart 1.8). This compares with projected Victorian nominal GSP growth of around 40 per cent over the same period. Such an increasing burden on Victoria and the other subsidising States is clearly unsustainable.
In particular, the cross-subsidy to Queensland ($207 million) and ACT ($90 million) cannot be justified on fiscal grounds when:
- •
- Queensland's tax rates are the lowest in Australia;
- •
- Queensland and the ACT are the only jurisdictions in a negative net debt position; and
- •
- ACT residents have income 40 per cent higher than the national average.
Table 1.4: Estimates of cross-subsidy paid and received for 2002-03 and changes from 2001-02
| | NSW | Vic | Qld | WA | SA | Tas | ACT | NT | Total(a) | |||||||||
|---|---|---|---|---|---|---|---|---|---|---|---|---|---|---|---|---|---|---|
| | ($ million) | | ||||||||||||||||
| Cross-subsidy paid | 1 242 | 1 096 | 185 | 2 522 | ||||||||||||||
| Change | 245 | 120 | -2 | 363 | ||||||||||||||
| Cross-subsidy received | 207 | 596 | 480 | 90 | 1 150 | 2 522 | ||||||||||||
| Change | 112 | 55 | 56 | 12 | 128 | 363 | ||||||||||||
Source: Department of Treasury and Finance
Note:
- (a)
- Totals may not add due to rounding.
Chart 1.8: Cross-subsidisation by Victoria, New South Wales and Western Australia
Source: Department of Treasury and Finance
The unsustainable grant shares are the result of the CGC's outdated method of constructing relativities. Victoria, along with New South Wales and Western Australia, representing 70 per cent of Australia's population, has been calling for an independent review of the current system for some years. The Commonwealth has continued to ignore these calls. Given this lack of support, on 30 November 2001, the three States commissioned a review into the methods for allocating Commonwealth grants to the States and Territories.
The Committee established to undertake this review is independent of the three governments and will examine the efficiency, equity, simplicity and transparency of the current system.
Key conclusions emerging from the review so far suggest that the current system:
The Committee will deliver its Final Report around the middle of 2002.
CHAPTER 2: BUDGET POSITION AND OUTLOOK
- •
- The budget incorporates the impact of significant new policy measures, including funding for new output initiatives with a net budget impact of $317 million in 2002-03.
- •
- The 2002-03 Budget provides funding for the commencement of new infrastructure investment projects with a total estimated investment of $3.0 billion (including both the Victorian and Commonwealth Government's contribution to the Scoresby Freeway).
- •
- The Government's strong financial position enables further cuts in business taxes of $262 million over the next four years, including $83 million in 2002-03, announced in Building Tomorrow's Businesses Today.
- •
- Total operating expenses are expected to increase by 2.1 per cent in 2002-03, in part reflecting the impact of 2002-03 Budget funding initiatives, with growth remaining stable at around 2.2 per cent per annum on average in the following three years.
- •
- A budget operating surplus of $522 million is forecast for 2002-03. The operating surplus is expected to average around $600 million over the remainder of the outlook period.
This chapter provides details of the projected budget position for the period 2002-03 to 2005-06. The discussion of the budget and forward estimates focuses on trends in the aggregate budget position, as well as reconciliation of major variations in key budget aggregates since the 2001-02 Budget released in May 2001 and the 2001-02 Budget Update published in January 2002.
The forward estimates outlined in this chapter are based on the economic projections outlined in Chapter 3, Economic Conditions and Outlook and reflect the detailed accounting policies and assumptions documented in Chapter 7, Estimated Financial Statements and Notes. The estimates take into account all announced policy commitments of the Victorian Government. Appendix G, Commonwealth—State Financial Relations provides additional information on the impact of intergovernmental financial issues on the State Budget.
The forward estimates presented in this chapter represent planning projections for future budgets based on an unchanged policy assumption.
2002-03 BUDGET INITIATIVES
Responsible financial management has enabled the Government to continue to deliver improved services and promote growth across the whole State. In the 2002-03 Budget the Government builds on last year's service delivery initiatives by continuing with medium to long-term strategies to improve quality, access and equity, particularly in education, health and community services, community safety and transport.
Initiatives affecting operating expenses
The 2002-03 Budget provides additional funding for new output initiatives of $317 million in 2002-03, decreasing slightly to $284 million in 2005-06. This is net of $147 million funding from existing forward estimates demand contingencies (put aside for increasing service delivery on account of population and demonstrated client demand growth). Further new initiatives totalling $113 million in 2002-03 will be funded from reprioritisation of existing departmental resources and other funding sources. It is also in addition to $161 million of output initiatives in 2002-03 already announced and reflected in the 2001-02 Budget Update.
Table 2.1 shows the total value of net additional funding provided for output initiatives by Departments in 2002-03. In 2002-03, resources are targeted towards the following key service areas identified in Growing Victoria Together:
- •
- creating more jobs and thriving innovative industries across Victoria;
- •
- valuing and investing in lifelong education;
- •
- high quality, accessible health and community services;
- •
- safe streets, homes and workplaces; and
- •
- growing and linking all of Victoria.
Other elements of Growing Victoria Together are also addressed in this budget and include boosting investment in suburbs, growth corridors and regions, protecting the environment, promoting sustainable development, and building cohesive communities and reducing inequalities.
Chapter 4, Budget Initiatives provides more detailed information on the Government's service delivery and revenue priorities and strategy, while Appendix A, Specific Policy Initiatives Affecting the Budget Position, provides a detailed list and description of all service delivery and revenue initiatives implemented in this budget.
Table 2.1: New output initiatives by Department since the 2001-02 Budget
| Department(a) | 2002-03 Budget | 2003-04 Estimate | 2004-05 Estimate | 2005-06 Estimate | ||||
|---|---|---|---|---|---|---|---|---|
| | ($ million) | |||||||
| Education and Training | 55.9 | 98.4 | 99.3 | 76.8 | ||||
| Human Services | 250.1 | 244.3 | 245.2 | 229.0 | ||||
| Infrastructure | 52.3 | 43.3 | 42.4 | 49.8 | ||||
| Innovation, Industry and Regional Development | 28.1 | 42.5 | 38.4 | 33.5 | ||||
| Justice | 8.1 | 13.0 | 13.1 | 14.2 | ||||
| Natural Resources and Environment | 36.1 | 51.4 | 17.3 | 8.9 | ||||
| Premier and Cabinet | 10.0 | 8.7 | 8.3 | 8.3 | ||||
| Tourism, Sport and the Commonwealth Games | 10.5 | 1.8 | 1.8 | 1.8 | ||||
| Treasury and Finance | 9.9 | 9.0 | 7.4 | 7.4 | ||||
| Parliament | 3.0 | 2.8 | 1.1 | 0.9 | ||||
| Less: Funding from demand contingency | 146.9 | 146.9 | 146.9 | 146.9 | ||||
| Total 2002-03 Budget output initiatives | 317.0 | 368.2 | 327.3 | 283.7 | ||||
| Initiatives announced in 2001-02 Budget Update | 160.8 | 172.7 | 199.5 | 211.7 | ||||
| Total output initiatives | 477.8 | 540.9 | 526.8 | 495.4 | ||||
Source: Department of Treasury and Finance
- Note:
- (a)
- Excludes initiatives funded through internal reprioritisation or other existing fund sources.
In addition, a number of savings initiatives have been implemented in this budget including:
- •
- whole of Government motor vehicle savings, intended to curtail or reduce costs associated with the motor vehicle fleet and reduce associated greenhouse emissions ($3.5 million in 2002-03 rising to $10.5 million ongoing by 2005-06);
- •
- suspension of the issue of motor vehicle registration labels from 2003-04 ($1.0 million in 2003-04 rising to $3.4 million ongoing by 2005-06);
- •
- a redirection of funding from the Living Regions, Living Suburbs Fund to other rural and regional activities ($2 million ongoing); and
- •
- centralisation of a number of corporate businesses across the Justice portfolio to assist in improving coordination and consistency across the portfolio (rising to $1.2 million ongoing by 2005-06).
For detail on these initiatives refer to Appendix A, Specific Policy Initiatives Affecting the Budget Position.
Asset investment initiatives
The 2002-03 Budget provides funding for the commencement of new infrastructure investment projects with a total estimated investment of $3 045 million, including both Victorian and Commonwealth Government funding for Scoresby Freeway and investment expenditure in 2002-03 of $505 million. This includes the balance of the Growing Victoria infrastructure reserve, including additional funding of $400 million for 2002-03 and 2003-04.
The scale of the 2002-03 infrastructure program and the scope and nature of projects approved demonstrate the Government's commitment to promoting economic, social and sustainable development across the whole State.
Table 2.2 provides a summary of new infrastructure asset investment funding by Department. Chapter 4, Budget Initiatives, Appendix A, Specific Policy Initiatives Affecting the Budget Position, and Appendix B, Growing Victoria Infrastructure Reserve provide more detailed information on the Government's 2002-03 infrastructure investment initiatives.
Table 2.2: New asset funding by Department
| Department | 2002-03 Budget | TEI(a) | ||
|---|---|---|---|---|
| | ($ million) | |||
| Education and Training | 82.1 | 216.4 | ||
| Human Services | 79.8 | 217.2 | ||
| Infrastructure(b)(c) | 169.7 | 1,336.3 | ||
| Innovation, Industry and Regional Development(b) | 55.8 | 187.7 | ||
| Justice | 37.0 | 84.0 | ||
| Natural Resources and Environment | 57.5 | 236.6 | ||
| Premier and Cabinet | 8.4 | 78.3 | ||
| Tourism, Sport and the Commonwealth Games | 7.8 | 50.8 | ||
| Treasury and Finance | 2.9 | 4.9 | ||
| Parliament | 3.5 | 3.5 | ||
| Other(d) | 629.1 | |||
| Total | 504.5 | 3 044.6 | ||
Source: Department of Treasury and Finance
- Notes:
- (a)
- Total estimated investment. Includes funding in 2001-02 for the Departments of Human Services, Infrastructure, Innovation, Industry and Regional Development, Justice and Premier and Cabinet.
- (b)
- Includes initiatives announced in the 2001-02 Budget Update—Scoresby Transport Corridor (includes Victorian and Commonwealth funding) and the Film and Television Studio.
- (c)
- Includes projects funded from the Better Roads Victoria Trust.
- (d)
- Partnerships Victoria project funding is provided for in the forward estimates for Berwick Community Hospital, the redevelopment of Spencer Street Station and Metropolitan Mobile Radio. However, project cost information will not be published until after completion of the tender process due to commercial sensitivity.
Revenue initiatives
The Government's Building Tomorrow's Businesses Today statement, released on 22 April 2002, continues the Government's ongoing commitment to ensuring a competitive tax regime for Victorian businesses. The Government's strong financial position enables further cuts in business taxes of $262 million to 2005-06, providing an additional boost to jobs and growth in Victoria by:
- •
- raising the payroll tax threshold from $515 000 to $550 000 from 1 July 2002, a year ahead of schedule;
- •
- reducing the payroll tax rate from 5.45 per cent to 5.35 per cent from 1 July 2002, a year ahead of schedule;
- •
- further reducing the payroll tax rate from 5.35 per cent to 5.25 per cent from 1 July 2003. The payroll tax initiatives will further stimulate business growth and employment and will represent a 9 per cent reduction in the payroll tax rate under the Bracks Government;
- •
- raising the land tax threshold from $125 000 to $150 000 from 2002-03; and
- •
- abolishing the stamp duty on unquoted marketable securities from 1 July 2002, a year ahead of schedule.
These changes represent a further $262 million reduction in the tax burden on Victorian businesses, in addition to the $774 million announced last year. This brings the total tax cuts announced by the Bracks Government to over $1 billion in its first term of office.
In addition to the Building Tomorrow's Businesses Today package, the Government will make housing more affordable by targeting assistance to families buying their first home and concession card holders at an additional cost to revenue of $13 million per annum (see Table 2.3). The number of purchasers receiving a concession is likely to almost double to about 8 000.
Table 2.3: Revenue Initiatives
| | 2001-02 | 2002-03 | 2003-04 | 2004-05 | 2005-06 | |||||
|---|---|---|---|---|---|---|---|---|---|---|
| | ($ million) | |||||||||
| Bring forward payroll tax threshold increase to 1 July 2002 | — | -23.0 | -2.0 | — | — | |||||
| Bring forward payroll tax rate cut to 5.35 per cent to 1 July 2002 | — | -47.0 | -4.0 | — | — | |||||
| Payroll tax rate reduction to 5.25 per cent from 1 July 2003 | — | — | -49.0 | -56.0 | -59.0 | |||||
| Increase in land tax threshold | — | -3.0 | -3.0 | -3.0 | -3.0 | |||||
| Bring forward abolition of stamp duty on unquoted marketable securities | — | -10.0 | — | — | — | |||||
| Reforming existing concessions on conveyancing duty | — | -13.0 | -13.0 | -13.0 | -13.0 | |||||
| Total revenue initiatives | 0.0 | -96.0 | -71.0 | -72.0 | -75.0 | |||||
Source: Department of Treasury and Finance
2002-03 BUDGET ESTIMATES
Table 2.4 provides a summary of the statement of financial performance for the 2002-03 Budget compared to the revised estimated outcome for 2001-02. For a detailed discussion of the revised estimates of the 2001-02 budget sector outcome, including an explanation of the variation from the published 2001-02 Budget estimates, see Appendix C, Revised 2001-02 Budget Outcome.
Table 2.4: Summary statement of financial performance 2002-03
| | 2001-02 Revised | 2002-03 Budget | Change | Change | ||||
|---|---|---|---|---|---|---|---|---|
| | ($ million) | (%) | ||||||
| Taxation | 8 758.0 | 8 802.7 | 44.7 | 0.5 | ||||
| Investment income | 1 049.4 | 1 061.6 | 12.2 | 1.2 | ||||
| Grants | 11 755.3 | 11 753.5 | -1.8 | 0.0 | ||||
| Sales of goods and services | 2 037.7 | 2 049.9 | 12.3 | 0.6 | ||||
| Other revenue(a) | 1 406.4 | 1 614.0 | 207.6 | 14.8 | ||||
| Total revenue | 25 006.8 | 25 281.7 | 275.0 | 1.1 | ||||
Superannuation | 2 048.8 | 1 713.1 | - -335.7 | - -16.4 | ||||
| Depreciation | 895.4 | 952.2 | 56.8 | 6.3 | ||||
| Borrowing costs | 496.2 | 495.2 | -1.0 | -0.2 | ||||
| Employee entitlements | 8 531.7 | 9 041.5 | 509.8 | 6.0 | ||||
| Supplies and services | 7 830.0 | 8 299.9 | 469.9 | 6.0 | ||||
| Other expenses(b) | 4 439.4 | 4 258.1 | -181.3 | -4.1 | ||||
| Total expenses | 24 241.5 | 24 760.0 | 518.5 | 2.1 | ||||
| Operating surplus | 765.3 | 521.8 | -243.5 | -31.8 | ||||
Source: Department of Treasury and Finance
- Notes:
- (a)
- Comprises regulatory fees and fines, fair value of assets received free of charge, gains/losses on disposal of physical assets, capital asset charge revenues and other miscellaneous revenue.
- (b)
- Includes grants and transfer payments and amortisation expense.
As indicated in Table 2.4, the operating surplus is expected to decline from $765 million in 2001-02 to $522 million in 2002-03, a reduction of $244 million.
The projected decline in the operating surplus in 2002-03 reflects a small increase in operating revenue of $275 million and projected growth in operating expenses of $519 million. The increase in operating expenses in part reflects the significant new service delivery initiatives announced by the Government since the 2001-02 Budget. The low growth in revenue forecast for 2002-03 is largely due to an expected moderation in property market activity and to the wind-down of distributions from the gas industry.
Operating expenses
Total operating expenses are budgeted at $24 760 million in 2002-03, representing an increase of $519 million (2.1 per cent) on the 2001-02 revised estimate. Low growth in operating expenses reflects a combination of a number of factors. Policy decisions contributing to the increase in expenses include:
- •
- 2002-03 Budget output initiatives of $317 million;
- •
- output initiatives totalling $161 million previously announced in the 2001-02 Budget Update;
- •
- the full-year impact of output initiatives announced in the 2001-02 Budget ($47 million); and
- •
- an increase in depreciation expense ($57 million), reflecting the combined impact of revaluation of existing assets and the substantial boost to infrastructure provided by the Bracks Government since the 2001-02 Budget.
These factors are partly offset by a number of factors which boosted operating expenses in 2001-02 including:
- •
- a decline in superannuation expense ($336 million), following a higher than expected expense in 2001-02 due to the poor equity market performance of superannuation funds and one-off actuarial revisions;
- •
- the impact of one-off policy initiatives in 2001-02 including:
- •
- the $118 million Special Power Payment in 2001-02;
- •
- $84 million for a range of one-off initiatives including boosting water flows in the Murray River ($15 million), funding for the Timber Communities in Partnership package ($9 million) to assist rural and regional areas adversely affected by the restructuring of the State's timber industry, and $6 million for initiatives which aim to reduce elective surgery patient waiting times and lists; and
- •
- a decline in First Home Owner grants and the cessation of the Commonwealth Additional Grant for first home owners in 2002-03 ($271 million).
The balance of the growth in 2002-03 operating expenses ($749 million or 3.1 per cent) is broadly in line with expected wage and price inflation and population growth.
Operating revenue
Total operating revenue amounts to $25 282 million in 2002-03, representing a $275 million increase on the 2001-02 revised estimate.
The moderate increase in revenue is essentially the result of low growth in taxation revenue, of only 0.5 per cent in 2002-03, which is lower than the expected growth in nominal gross state product, together with a largely unchanged level of Commonwealth grants.
The low growth in taxation revenue in 2002-03 compared to the 2001-02 revised estimate largely reflects:
- •
- an expected moderation in property market activity in 2002-03 resulting in a return towards long-term trend in levels of conveyancing and mortgage duties ($284 million) (see section on land transfers and Chart 2.1 below);
- •
- the full-year effect of the Government's 2001-02 tax reform initiatives which were announced in the 26 April 2001 tax reform package, Better Business Taxes, combined with the $96 million of tax relief measures announced in Building Tomorrow's Businesses Today and in this budget;
- •
- the full-year effect of the abolition of financial institutions duty ($36 million) and stamp duty on quoted marketable securities from 1 July 2001 ($10 million) as part of changes agreed to in the Intergovernmental Agreement on the Reform of Commonwealth-State Financial Relations;
- •
- offset by a $92 million increase in land tax and underlying growth in a range of other taxes.
A $168 million increase in regulatory fees and fines is the main contributor to the $208 million increase in other revenue. This largely reflects the continuing impact of recent initiatives introduced as part of an effort to reduce Victoria's road toll (see Chapter 4, Budget Initiatives for more details). The balance of the increase in other revenue is mainly due to:
- •
- asset recoveries associated with the winding down of Tri-Continental which is expected to be deregistered by 2003 ($28 million); and
- •
- capital assets charges revenue received from VicTrack ($12 million).
A moderate increase in investment income of $12 million is primarily due to an increase in interest revenue and higher distributions (tax equivalent revenue and dividends) from the Transport Accident Commission ($102 million impact), based on investment market returns equivalent to a long-term average real return of 5 per cent per annum. This is offset by:
- •
- lower distributions from the gas industry following the expected introduction of full retail contestability in the gas market ($120 million); and
- •
- lower distributions from the metropolitan water industry reflecting a forecast lower level of land developer activity ($20 million).
Commonwealth grants are expected to decline by $1.8 million in 2002-03 compared with the revised estimate for 2001-02. This largely reflects the reduction in Victoria's share of the grants pool ($84 million), cessation of the Commonwealth Additional Grant for first home owners ($93 million) and a decline in GST transitional grants driven by revised estimates of the First Home Owners' Grant scheme ($180 million). In addition, the level of transitional assistance that Victoria will receive in 2002-03 is $30 million lower than that consistent with the Intergovernmental Agreement. This is due to the Commonwealth unilaterally withdrawing $134 million of funding in 2002-03 from the States and Territories under the pretence that it was collecting less petrol excise following its decision to cease the indexation of petroleum excise.
Land transfers
The 2001-02 Budget estimates assumed a slowdown in property market activity which has yet to occur. Indeed the property market became stronger in 2001-02 in terms of both prices and volumes transacted.
The continuing strength in 2001-02 reflects several factors including strong population growth from interstate migration, the relative resilience of the Victorian economy and labour market during the current global slowdown, the First Home Owners' Grant, low interest rates and instability in equity markets.
Chart 2.1 shows conveyancing duty revenue and as a share of gross state product (GSP), and includes estimates for the period 2002-03 to 2005-06. Conveyancing duty is projected to return towards long-term trends over the projection period, in particular towards its long-term average ratio of around 0.7 per cent of GSP.
Chart 2.1: Conveyancing duty revenue(a)
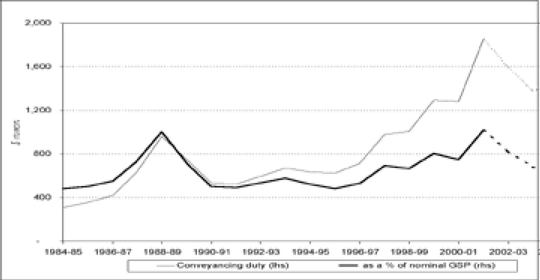
Source: Department of Treasury and Finance
- Note:
- (a)
- Dashed sections of lines show forecasts 2002-03 to 2005-06.
The Department of Treasury and Finance forecasts that the moderation in 2002-03 will predominantly reflect a reduction in the turnover, with some moderation in price growth, on the back of:
- •
- an expected rise in interest rates during 2002-03;
- •
- the cessation of the Commonwealth Additional Grant for first home owners from 1 July 2002; and
- •
- a decline in speculative housing investment as buyers realise recent dramatic house price growth cannot continue and vacancy rates remain high.
Recent housing approval statistics are consistent with these forecasts.
FORWARD ESTIMATES OUTLOOK 2002-03 TO 2005-06
Table 2.5 provides a snapshot of the aggregate budget outlook over the forward estimates period 2002-03 to 2005-06. (A more detailed statement of financial performance for the outlook period is provided in Chapter 7, Estimated Financial Statements and Notes.) The forward estimate projections take into account all announced policy initiatives.
As indicated in Table 2.5, an operating surplus of $522 million is forecast for 2002-03 and expected to average around $600 million over the remainder of the outlook period.
The projected moderate increase in the operating surplus in 2003-04 reflects continued low growth in both operating revenue and expenses expected in that year.
The operating surplus is expected to increase from $517 million in 2004-05 to $712 million in 2005-06. The increase in 2005-06 is due mainly to a return to normal taxation revenue growth following completion of the implementation of the Government's business tax reforms.
Table 2.5: Summary statement of financial performance 2002-03 to 2005-06
| | 2001-02 Revised | 2002-03 Budget | 2003-04 Estimate | 2004-05 Estimate | 2005-06 Estimate | |||||
|---|---|---|---|---|---|---|---|---|---|---|
| | ($ million) | |||||||||
| Taxation | 8 758.0 | 8 802.7 | 8 926.7 | 9 101.7 | 9 281.6 | |||||
| Investment income | 1 049.4 | 1 061.6 | 991.9 | 1 017.7 | 1 056.8 | |||||
| Grants | 11 755.3 | 11 753.5 | 12 072.2 | 12 462.5 | 13 070.9 | |||||
| Sales of goods and services | 2 037.7 | 2 049.9 | 2 082.4 | 2 113.5 | 2 146.1 | |||||
| Other revenue(a) | 1 406.4 | 1 614.0 | 1 615.4 | 1 683.0 | 1 617.1 | |||||
| Total revenue | 25 006.8 | 25 281.7 | 25 688.6 | 26 378.4 | 27 172.5 | |||||
| % change | 1.1 | 1.6 | 2.7 | 3.0 | ||||||
Superannuation | 2 048.8 | 1 713.1 | 1 725.3 | 1 765.9 | 1 804.3 | |||||
| Depreciation | 895.4 | 952.2 | 1 002.7 | 1 067.0 | 1 115.1 | |||||
| Borrowing costs | 496.2 | 495.2 | 494.6 | 492.1 | 488.4 | |||||
| Employee entitlements | 8 531.7 | 9 041.5 | 9 386.0 | 9 687.6 | 10 001.3 | |||||
| Supplies and services | 7 830.0 | 8 299.9 | 8 363.9 | 8 694.1 | 8 840.0 | |||||
| Other expenses(b) | 4 439.4 | 4 258.1 | 4 136.1 | 4 154.4 | 4 211.5 | |||||
| Total expenses | 24 241.5 | 24 760.0 | 25 108.6 | 25 861.1 | 26 460.6 | |||||
| % change | 2.1 | 1.4 | 3.0 | 2.3 | ||||||
| Operating surplus | 765.3 | 521.8 | 580.0 | 517.3 | 711.9 | |||||
Source: Department of Treasury and Finance
- Notes:
- (a)
- Comprises regulatory fees and fines, fair value of assets received free of charge, gains/losses on disposal of physical assets, capital asset charge revenue and other miscellaneous revenue.
- (b)
- Includes grants and transfer payments and amortisation expense.
Operating expenses
Total operating expenses are expected to increase by 2.2 per cent per annum on average between 2002-03 and 2005-06, which is broadly in line with expected price and wage inflation net of productivity growth.
Employee entitlements are expected to increase on average 3.4 per cent per annum over the period, the result of underlying wage increases and policy decisions taken by the Government. These are expected to have a positive impact on service delivery outcomes through the attraction and retention of high quality staff across the public service, including in education, policing, nursing and community services.
Finance costs are expected to decline by an average 0.5 per cent per annum over the forecast period. This mainly reflects the flow-through impact of lower interest rates as the debt portfolio gradually matures and is refinanced.
However, the decline in finance costs is more than offset by projected growth in depreciation expenses of around 5.4 per cent per annum on average over this period. The increase in depreciation expenses is due to the substantial investment in new infrastructure to be undertaken over this period.
Growth in total operating expenses is expected to moderate to 1.4 per cent in 2003-04, mainly reflecting the completion in 2002-03 of a four-year program of election commitments in relation to various grants programs.
Operating revenue
Total revenue is expected to increase by 2.4 per cent per annum on average between 2002-03 and 2005-06. This reflects projected low growth in taxation revenue and Commonwealth grants.
Victoria's own-source revenue is expected to grow by an average 1.4 per cent between 2002-03 and 2005-06, lower than growth in nominal GSP. This reflects underlying growth in payroll tax and most other taxes in line with forecast employment, wages and economic growth (see Chapter 3, Economic Conditions and Outlook), offset by:
- •
- lower land transfer tax collections as activity in the property market declines further towards long-term trend levels (see Chart 2.1 and commentary above);
- •
- tax cuts for business announced as part of the 2001 Better Business Taxes and 2002 Building Tomorrow's Businesses Today statements such as payroll tax reductions in 2002-03 and 2003-04 and mortgage duty removal in 2004-05; and
- •
- removal of debits tax in 2005-06 as specified in the Intergovernmental Agreement.
With respect to other major revenue categories:
- •
- revenue from Commonwealth grants is expected to grow by 3.6 per cent per annum over the forward estimates period reflecting higher specific purpose payments and higher GST grants stemming from the Commonwealth's forecasts of nominal consumption growth and additional compliance effort by the Australian Tax Office; and
- •
- revenue from sales of goods and services exhibits moderate growth over the forward estimates period. The impact of this growth in sales revenue on the budget bottom line is offset by a similar growth assumption for operating expenses related to the cost of goods and services sold.
RECONCILIATION OF FORWARD ESTIMATES TO PREVIOUSLY PUBLISHED ESTIMATES
Table 2.6 compares the revised outlook for the operating surplus for the period 2002-03 to 2004-05 to previously published budget estimates.
The projected budget operating surplus has improved from the original 2001-02 Budget estimates published in May 2001. The operating surplus is now expected to average around $540 million per annum over this period compared to an original budget estimate of around $500 million.
A better than expected outlook for taxation revenue is forecast resulting from stronger land tax revenues and a less severe downturn in the property market than that originally assessed in the 2001-02 Budget. The outlook for both Commonwealth grants and regulatory fees and fines has also improved. These changes have been offset by:
- •
- an increase in operating expenses, mainly reflecting implementation of 2002-03 Budget output initiatives; and
- •
- tax initiatives announced as part of the Building Tomorrow's Businesses Today package.
Variations to total operating revenue
Table 2.6 highlights the increase in projected operating revenue for the period 2002-03 to 2004-05 relative to the original budget estimates published in May 2001. The projected operating revenue for 2002-03 is $1 357 million higher than the published budget estimates, with the improvement over the remainder of the outlook period averaging around $1 374 million per year.
A large component of this improvement in revenue ($634 million in 2002-03) was factored into the revised 2001-02 Budget estimates published in the 2001-02 Budget Update in January 2002. The factors underlying this improvement mainly reflected the impact of strong employment and strong property market conditions on taxation revenue and higher Commonwealth grants, and were detailed in the Budget Update.
As indicated in Table 2.6, there has been a further improvement in the revenue outlook since the publication of the 2001-02 Budget Update. Total revenue for 2002-03 has been revised up by $723 million, $921 million in 2003-04 and $957 million in 2004-05.
Table 2.6: Reconciliation of 2002-03 Budget estimates to 2001-02 Budget
| | 2002-03 Estimate | 2003-04 Estimate | 2004-05 Estimate | |||
|---|---|---|---|---|---|---|
| | ($ million) | |||||
| General government sector operating surplus—2001-02 Budget | 346.3 | 602.4 | 546.7 | |||
| Plus: Revenue variations in Budget Update | 634.0 | 395.7 | 472.9 | |||
| Less: Expense variations in Budget Update | 352.3 | 406.0 | 468.5 | |||
| Budget sector operating surplus—2001-02 Budget Update | 628.1 | 592.1 | 551.1 | |||
| Plus: Revenue variations since Budget Update | ||||||
| Economic/demographic effects | ||||||
| Taxation revenue | 405.8 | 350.4 | 229.9 | |||
| Investment income | 1.2 | 44.4 | 46.8 | |||
| Sales of goods and services | 76.7 | 81.0 | 96.1 | |||
| Total economic/demographic variations | 483.8 | 475.7 | 372.8 | |||
| Policy decisions | ||||||
| Taxation initiatives | -96.0 | -71.0 | -72.0 | |||
| Other initiatives affecting revenue | 134.1 | 150.2 | 149.7 | |||
Total policy variations | 38.1 | 79.2 | 77.7 | |||
| Commonwealth funding revisions | ||||||
| General purpose grants | -4.0 | 85.9 | 102.3 | |||
| Specific purpose payments | 113.5 | 171.3 | 253.9 | |||
| Total Commonwealth funding variations | 109.5 | 257.2 | 356.2 | |||
| Administrative variations | ||||||
| Fines and regulatory fees | 51.5 | 53.6 | 55.2 | |||
| Other miscellaneous variations | 40.5 | 55.6 | 95.4 | |||
| Total administrative variations | 92.0 | 109.2 | 150.6 | |||
| Total variation in operating revenue since Budget Update | 723.4 | 921.2 | 957.3 | |||
Table 2.6: Reconciliation of 2002-03 Budget estimates to 2001-02 Budget—continued
| | 2002-03 Estimate | 2003-04 Estimate | 2004-05 Estimate | |||
|---|---|---|---|---|---|---|
| | ($ million) | |||||
| Less: Variations in operating expenses since Budget Update | ||||||
| Economic/demographic effects | ||||||
| Expenses funded by increased sales | 76.7 | 81.0 | 96.1 | |||
| Total economic/demographic variations | 76.7 | 81.0 | 96.1 | |||
| Policy decisions | ||||||
| 2002-03 Budget output initiatives | 477.8 | 540.9 | 526.8 | |||
| Less: Amount included in 2001-02 Budget Update | -160.8 | -172.7 | -199.5 | |||
| Total output initiatives | 317.0 | 368.2 | 327.3 | |||
| Less: 2002-03 Budget saving initiatives | -5.5 | -11.1 | -15.6 | |||
| Total policy variations | 311.5 | 357.1 | 311.8 | |||
| Commonwealth funding revisions | 12.6 | 95.8 | 113.7 | |||
| Administrative variations | ||||||
| Budget financing—borrowing costs | 7.8 | 9.5 | 10.9 | |||
| Superannuation—actuarial revisions | 10.2 | 8.7 | 10.2 | |||
| Other administrative variations | 405.3 | 370.2 | 432.8 | |||
| Total administrative variations | 423.3 | 388.4 | 453.9 | |||
| Total variation in operating expenses since Budget Update | 829.7 | 933.4 | 991.1 | |||
| General government sector operating surplus—2002-03 Budget | 521.8 | 580.0 | 517.3 | |||
Source: Department of Treasury and Finance
The combined effect of economic conditions on taxes, investment income and other revenue accounts for around half of the aggregate increase, boosting projected revenues since the 2001-02 Budget Update by $484 million in 2002-03 and an average of $424 million per annum over the outlook period (see Table 2.6). This reflects a number of factors:
- •
- changes to land tax revenue resulting from revised land valuation data provided by the Valuer General's Office;
- •
- the continued strength of property markets and property prices which has resulted in increased projected revenues from stamp duties on conveyancing. The property market has not slowed to the extent predicted at the time of the Budget Update, but is expected to moderate over the forward estimates period; and
- •
- projected revenue from sales of goods and services has also been revised up by $77 million in 2002-03 since the Budget Update.
The increase in revenue from these sources has been partly offset by:
- •
- decreases in distributions anticipated from the Transport Accident Commission, due to higher estimates of future long-term care costs and a lower investment base following weaker than expected investment returns in 2000-01 and 2001-02.
Policy decisions taken since the 2001-02 Budget have the effect of increasing revenue (relative to the 2001-02 Budget Update) by around $65 million per annum on average over the period. This reflects a reduction in business taxes announced in the Government's business statement Building Tomorrow's Businesses Today, and an increase in revenue from fines associated with the implementation of the Government's road safety strategy—arrive alive!
Total Commonwealth funding revisions are expected to result in an increase in total revenue, relative to the 2001-02 Budget Update estimates, of $110 million in 2002-03 rising to $356 million per annum in 2005-06. Higher projected specific purpose payments from the Commonwealth totalling $114 million in 2002-03, and rising to $254 million in 2005-06, are mainly due to:
- •
- additional Commonwealth capital grants funding for the Scoresby Freeway;
- •
- increased health funding grants under the Australian Health Care Agreement, Home and Community Care funding and the Commonwealth-State Disability Agreement; and
- •
- higher grants associated with the National Heritage Trust.
The increase in specific purpose payments is partly offset by general purpose grants, which are estimated to decline in 2002-03 relative to the published update estimate driven by Commonwealth revisions to Victoria's GST transitional grants. At the recent Treasurer's Conference the Commonwealth unilaterally withdrew funding of $134 million in 2002-03 from the States and Territories, including $30 million from Victoria, on the pretence that it was collecting less petrol excise following its decision to cease the indexation of petroleum excise.
Administrative variations (comprising miscellaneous variations such as revisions to interest revenue, non-public account revenue and fines) contribute to an increase in total revenue in 2002-03, relative to the 2001-02 Budget Update estimates, of $92 million.
Variations to total operating expenses
Projected operating expenses for 2002-03 are $1 182 million higher than the budget estimates published in the May 2001 Budget, with the increase over the remainder of the outlook period averaging around $1 400 million per year.
As indicated in Table 2.6, some of this increase ($352 million in 2002-03) was factored into the revised estimates published in the 2001-02 Budget Update. Implementation of new policy initiatives, Commonwealth funding revisions and revised actuarial assessments of superannuation expenses accounted for the major part of the revision, which was explained in detail in the 2001-02 Budget Update.
As indicated in Table 2.6, projected operating expenses for 2002-03 have increased by a further $830 million since the 2001-02 Budget Update, with the increase for the following two years averaging $960 million per annum.
New policy initiatives announced in this budget account for a large part of this increase. As noted earlier, the 2002-03 Budget provides additional funding for new output initiatives of $317 million increasing slightly to $327 million in 2004-05. A range of savings initiatives included in this budget reduce expenses by an average of $11 million over the period (see Appendix A, Specific Policy Initiatives Affecting the Budget Position, for details).
An increase in the cost of goods and services funded by increased sales revenue accounts for a further $77 million of the overall increase in 2002-03 operating expenses since the 2001-02 Budget Update.
Commonwealth funding variations, including revised estimates of the First Home Owners' Grant scheme, increase expenses by an average $74 million over the period.
A range of other administrative variations has resulted in a net increase in expenses of $405 million in 2002-03 and $433 million in 2004-05. Around half the increase is due to increases in expenses in outer budget agencies funded by own-source revenue. This is largely due to the inclusion in the general government budget estimates for the first time of a range of non-budget agencies including the Docklands Authority, Building Control Commission, Eco Recycle Victoria, Royal Botanical Gardens Board and Melbourne Parks and Waterways. This ensures alignment between the general government budget estimates and the annual financial results published in the Financial Report for the State of Victoria. There is no impact on the overall budget, since revenue of these agencies has also been included and contributes to an equivalent revenue variation.
The balance of the administrative variations is mainly due to updated actuarial revisions to the superannuation expense, an increase in the contingency to take account of various risks facing the budget and the amortisation of motor vehicle leases largely associated with the centrally managed vehicle leasing facility.
USE OF CASH RESOURCES
Table 2.7 provides a summary of cash generated through the operations of Victorian government departments and other general government sector agencies and how that cash is applied to infrastructure investment and financing activities. The table also provides a reconciliation of the projected budget operating result to the projected change in general government net debt over the forward estimates period.
The estimated statement of cash flows presented in Chapter 7, Estimated Financial Statements and Notes provides a detailed breakdown of the projected source and application of cash resources generated in the course of general government sector activities.
Table 2.7 shows that the expected budget operating surplus for 2002-03 is $522 million. However, the operating result is affected by a number of expense and revenue items which do not require or provide cash resources during the year. These include depreciation, amortisation and growth in unfunded superannuation liabilities and employee entitlement liabilities. Subtracting these non-cash items yields projected net cash inflow from operating activities for 2002-03 of $1 597 million, compared to a revised estimate of $2 702 million for 2001-02.
Expenditure on the purchase of infrastructure and other fixed assets is projected to increase to $2 066 million in 2002-03, compared to a revised estimate of $1 929 million for 2001-02. The $1 597 million cash surplus from operating activities will be the main source of funding for the 2002-03 infrastructure program, with the balance sourced from a $570 million drawdown of the Growing Victoria reserve financial assets, which were explicitly put aside in 1999-2000, 2000-01 and 2001-02 to provide a boost to future infrastructure spending. An additional $400 million has been allocated to the reserve in the 2002-03 Budget. (For further details on the Growing Victoria infrastructure program see Appendix B, Growing Victoria Infrastructure Reserve.)
Table 2.7: Application of cash resources
| | 2001-02 Revised | 2002-03 Budget | 2003-04 Estimate | 2004-05 Estimate | 2005-06 Estimate | |||||
|---|---|---|---|---|---|---|---|---|---|---|
| | ($ million) | |||||||||
| Budget operating surplus | 765.3 | 521.8 | 580.0 | 517.3 | 711.9 | |||||
| Plus: Non-cash expenses (net)(a) | 1 936.8 | 1 074.7 | 1 391.0 | 1 715.4 | 1 422.4 | |||||
| Net cash flow from operating activities | 2 702.1 | 1 596.5 | 1 971.0 | 2 232.8 | 2 134.4 | |||||
| Plus: Net drawdown of Growing Victoria infrastructure reserve | -174.0 | 570.0 | 426.0 | 170.0 | 130.0 | |||||
| Total cash available for asset investment | 2 528.1 | 2 166.5 | 2 397.0 | 2 402.8 | 2 264.4 | |||||
| Less: | ||||||||||
| Net investment in fixed assets(b) | 1 929.2 | 2 066.1 | 2 292.0 | 2 299.5 | 2 166.5 | |||||
| Other investment activities (net) | -56.4 | 13.5 | 13.0 | 12.0 | 9.7 | |||||
| Decrease in net debt (excluding Growing Victoria) | 655 | 87 | 92 | 91 | 88 | |||||
Source: Department of Treasury and Finance
- Notes:
- (d)
- Includes depreciation and increase in unfunded superannuation liability and increase in liability for employee entitlements.
- (e)
- Includes net contribution to other sectors of government.
As indicated in Table 2.7, as a consequence of these activities general government sector net debt (excluding Growing Victoria) is expected to decline by $87 million in 2002-03.
The cash surplus from operating activities is expected to increase to $1 971 million in 2003-04 (consistent with the projected increase in the operating surplus). Expenditure on the purchase of infrastructure and other fixed assets is expected to remain strong over the forward estimates period. This reflects maintenance of underlying infrastructure expenditure in line with growth in nominal GSP, together with the additional boost to infrastructure spending provided by the Growing Victoria infrastructure reserve.
The cash surplus from operating activities (combined with a further progressive drawdown of the Growing Victoria infrastructure reserve) will continue to be applied to financing infrastructure investment over the remainder of the forward estimates period. The balance of the cash surplus will mainly be applied to reducing net debt (excluding Growing Victoria) through a modest increase in financial assets, with borrowings expected to remain fairly steady over the outlook period.
CHAPTER 3: ECONOMIC CONDITIONS AND OUTLOOK
- •
- Global economic conditions weakened over the past year, with the downturn exacerbated by the 11 September terrorist attacks on the United States.
- •
- The Australian economy has proved resilient to the global slowdown. Domestic demand rebounded strongly over calendar 2001, particularly in the second half, underpinned by consumer spending, government expenditure and an acceleration in housing construction.
- •
- The Victorian economy performed strongly over the past year, exceeding the national average in key measures such as consumer spending, business investment and population growth. Forward indicators are positive, notably non-residential building approvals which are at record levels.
- •
- The Victorian labour market recorded further solid gains following on from exceptionally strong growth in 2000-01. The unemployment rate is now approaching levels of the early 1990s, and has been consistently at or below the national average for almost two years.
- •
- Recent evidence of a global recovery is positive for the 2002-03 outlook.
- •
- Victorian economic growth is now estimated at 3.75 per cent in 2001-02, exceeding the original budget estimate of 2.75 per cent. Growth in 2002-03 is forecast at 3.5 per cent.
WORLD AND AUSTRALIAN ECONOMIC ENVIRONMENT
Global economic conditions deteriorated over the past year, reflected in a progressive lowering of consensus growth forecasts. The most significant revisions occurred after the 11 September terrorist attacks on the United States, although a global downturn was well underway prior to these events.
The US economy grew by just 1.2 per cent in 2001 (following 4.1 per cent in 2000), with negative contributions from business investment, inventories and net exports. However, the economy appears to have defied expectations of a prolonged post-11 September downturn. With the US economy slowing and subdued global demand for IT products, growth in our trading partners in Asia also weakened, particularly in Japan which entered a recession. Activity in Europe slowed, although not to the same extent as in the United States.
Global interest rates were reduced sharply during 2001, including a coordinated reduction post-11 September. With significant stimulus in the pipeline, there is increasing evidence that global economic conditions are improving.
According to the April 2002 Consensus Economics survey, world economic growth is set to improve from 1.2 per cent in 2001 to 1.6 per cent in 2002 and 3.0 per cent in 2003. The 2002 growth forecast has been upgraded slightly in recent months (see Chart 3.1) due to a markedly improved outlook in the United States. US GDP growth is currently predicted to be 2.6 per cent in 2002 and 3.5 per cent in 2003. The Consensus Economics survey also sees an improvement in growth in Europe and Asia, excluding Japan where a recovery is not expected until 2003.
Chart 3.1: World, US and Australian 2002 consensus growth forecasts(a)
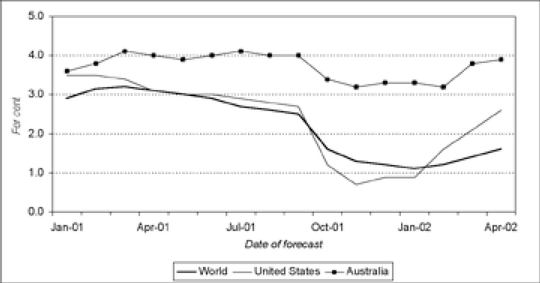
Source: Consensus Economics
Note:
- (a)
- The world growth forecast is a weighted average using 1995 GDP weights, converted at average 1995 exchange rates.
The Australian economy has proved resilient to this global slowdown. Although GDP grew by just 1.9 per cent in 2000-01, this was due to weakness in the first half of the year following the introduction of the GST. Domestic demand rebounded strongly over calendar 2001, particularly in the second half of the year, underpinned by consumer spending, government expenditure and an acceleration in housing construction. The events of 11 September had only a temporary impact on business and consumer sentiment, and both have rebounded to high levels.
The national economy therefore entered 2002 on a solid footing, supported by historically low interest rates. The major area of weakness in the economy has been exports and, until recently, business investment.
Private sector forecasts of Australian economic growth improved in March following the release of unexpectedly strong December quarter GDP data (see Chart 3.1). Average forecasts reported in the Consensus Economics survey imply growth of around 3.6 per cent in 2001-02 and 3.7 per cent in 2002-03. The forecasts show an increase in business investment in 2002-03, which will offset an anticipated slowing in the housing sector.
The Reserve Bank of Australia (as at end April) has left interest rates unchanged since December 2001, at 4.25 per cent, following a cumulative easing of 200 basis points from 6.25 per cent in February 2001. Financial market commentators expect a gradual return to tighter policy conditions over the remainder of 2002.
VICTORIAN ECONOMIC CONDITIONS
The Victorian economy performed well over the past year, exceeding the national average in key measures such as consumer spending and business investment (see Chart 3.2). As with the national economy, strong domestic demand growth offset weaker exports as the global economy slowed.
In year-average terms, state final demand (i.e. total private and public final consumption and investment spending) grew by 2.3 per cent in Victoria in 2001. However, the growth rate in the year to the December quarter 2001 was 6.6 per cent (5.2 per cent nationally) as demand growth accelerated through the year. Consumer spending growth was higher in Victoria than nationally over the past year, as was business investment. Dwelling investment rebounded strongly, although a little below the national average as the post-GST decline in Victoria was not as marked. Merchandise exports rose in the June and September quarters of 2001, but declined in the December quarter.
Labour market conditions improved, although the gains were more moderate compared with the exceptionally strong performance of 2000-01. The State's economic performance of recent years continues to support an influx of people from other States, with net interstate immigration at record levels.
Chart 3.2: Comparative growth in domestic demand(a)
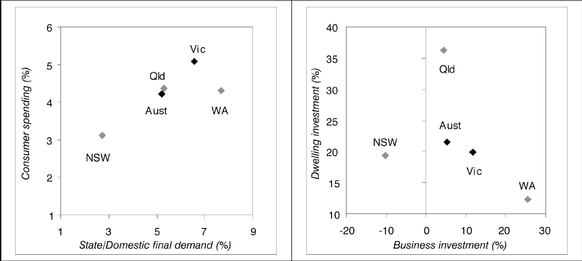
Source: Australian Bureau of Statistics
Note:
- (a)
- Per cent change between the December quarter 2000 and December quarter 2001. Seasonally adjusted, chain volume measures (1999-2000 prices).
The following sections provide more detail on recent trends in the Victorian economy.
Consumer spending
Consumer spending was one of the key drivers of growth in 2001, and recent retail sales, motor vehicle and consumer sentiment data indicate this momentum was sustained into the new year. Consumer spending in Victoria rose by 5.1 per cent during 2001, the strongest increase of all the States. The events of 11 September appear to have had minimal impact on consumer spending, and the impact on sentiment was short-lived.
A number of factors supported this growth in spending, including the reduction in interest rates over 2001, falling petrol prices and moderate growth in income. The significant rise in Melbourne house prices has also been important due its impact on household wealth.
The housing boom has further contributed to the growth in consumer spending via increased expenditure on home furnishings and related items. The household goods component of Victorian retail sales surged more than 16 per cent in calendar 2001 (see Chart 3.3).
Chart 3.3: Retail sales growth by industry group, 2001(a)
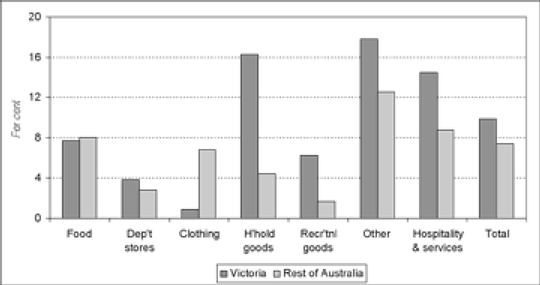
Source: Australian Bureau of Statistics
Note:
- (a)
- Per cent change on calendar year 2000, original data at current prices.
Housing
Housing construction has been an important driver of growth in the Victorian (and national) economy over the past year, reversing the GST-induced slump of late 2000.
Forward indicators of housing activity such as building approvals suggest that activity will likely stabilise around current high levels in the first half of 2002. The number of private housing approvals in Victoria rose strongly over the past year, to be 70 per cent above their post-GST trough, although it now seems approvals have peaked for this cycle. Victoria accounted for 30 per cent of national private dwelling approvals in 2001, well above its population share of 25 per cent.
The key factors supporting the Victorian housing market have been historically low interest rates, the operation of the first home owners' grant, continued strong population gains and greater latent demand in Victoria.
The strength of the Victorian housing market is clearly reflected in house price movements. According to the Australian Bureau of Statistics, established house prices in Melbourne rose by 21 per cent in the year to December 2001, the strongest increase of any capital city (see Chart 3.4).
Chart 3.4: Established house price indices(a)
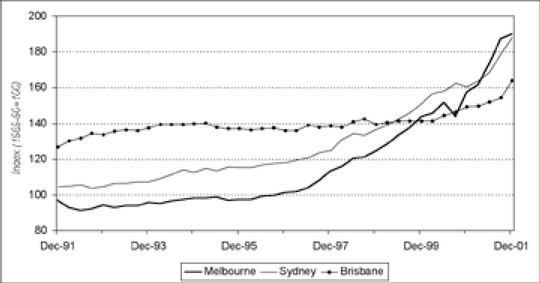
Source: Australian Bureau of Statistics
Note:
- (a)
- Quarterly data, index (1989-90=100).
Business investment
Private business investment in Victoria grew moderately in 2001, outperforming the national average. In year-average terms, machinery and equipment investment was marginally weaker (although it rebounded strongly in the December quarter), other building and structures investment was flat, while intangible fixed assets investment (mainly computer software) recorded further growth, albeit at a slower pace than in recent years. The uncertain outlook for the global economy may partly explain the investment pause over much of 2001.
In a longer-term context, business investment in Victoria has grown strongly (see Chart 3.5). There has been a cumulative increase of almost 36 per cent in the five years to 2001, the strongest increase of all States.
The investment environment is expected be more favourable in 2002-03. The outlook for the global economy has improved, business confidence is at high levels, and there is evidence that corporate profitability is on the improve. There is also a large pipeline of non-residential construction work to be done in Victoria. The value of private non-residential building approvals rose 17 per cent in 2001 (compared to only 3 per cent in the rest of Australia) and was at a record level in the December quarter.
Chart 3.5: Business investment per capita(a)
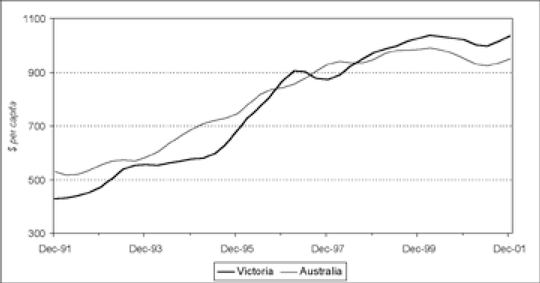
Source: Australian Bureau of Statistics
Note:
- (a)
- Business investment is quarterly trend data, chain volume measure (1999-2000 prices). Trend data abstract from major second-hand asset sales from the public to private sector.
International trade
Victoria enjoyed a reasonable export performance for much of 2001, although the global slowdown had impacted by year-end. The low value of the Australian dollar has provided support to exporters, as has the increase in some key commodity prices.
In value terms, merchandise exports (excluding gold) rose 12.2 per cent to $21.1 billion in 2001, despite a fall in the December quarter. There was an increase in exports to most major destinations. By commodity, strong growth was recorded in food exports (notably dairy, cereals and meat), textile fibres (wool), and a number of advanced manufactures, including medicinal and pharmaceutical products, motor vehicles, and professional and scientific instruments.
In volume terms, exports fell sharply in the December quarter following two quarters of growth. In contrast, imports rose strongly in the December quarter. Overall, net exports detracted from Victorian growth in the first half of 2001-02. The strength of domestic demand and the soft global economy suggest the net exports contribution will remain subdued in the second half of the year.
Labour market
The Victorian labour market improved over the past year, although not to the same extent as in 2000-01 when employment growth was exceptionally strong. In March 2002, 2.35 million Victorians were employed, which was 1.8 per cent higher than a year earlier.
Victorian employment was relatively flat over much of 2001, a delayed response to the GST-induced slowing in demand in the second half of 2000. Uncertainty surrounding the global economic outlook is also likely to have been a key factor. In the March quarter 2002, however, employment growth rebounded strongly (see Chart 3.6a).
The Victorian unemployment rate edged higher over the second half of 2001, in line with slower employment growth, before declining again more recently. Victoria's seasonally adjusted unemployment rate fell 0.3 percentage points over the year to March 2002 to 5.8 per cent (see Chart 3.6b). This was below the national average (6.3 per cent) and the second lowest rate of all States. The Victorian participation rate has remained at high levels.
Chart 3.6: Victorian labour market conditions(a)
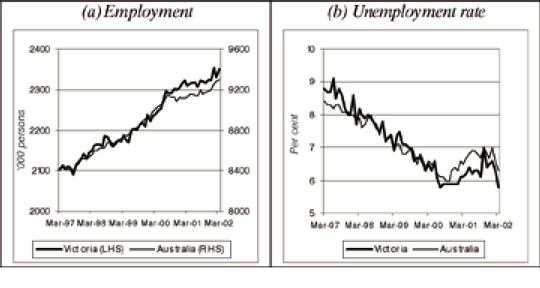
Source: Australian Bureau of Statistics
Note:
- (a)
- Monthly seasonally adjusted data.
Population
Victoria's population was 4.84 million as at September 2001, representing 24.9 per cent of the Australian total. During the year to September, the State's population grew 1.3 per cent (or 60 400 persons), the third consecutive year that Victoria's population growth has exceeded the national average (1.2 per cent). Current growth rates are well above the State's long-term average of 1.0 per cent per annum.
The largest contribution to Victoria's population growth last year was from natural increase (26 600 persons), closely followed by net overseas migration (26 100). Net interstate migration contributed 7 700 persons (see Chart 3.7). Over the past few years, the largest net flows have been from New South Wales, South Australia and Tasmania.
Victoria's population growth in 2000-01 was concentrated in Melbourne, large regional centres (such as Ballarat, Bendigo, Geelong, Mildura, Shepparton and Wodonga), and coastal areas (such as the Bass Coast and Surf Coast). This continues the long-term trend towards inner city and coastal living which is also evident in other parts of Australia.
Chart 3.7: Interstate migration and population growth(a)
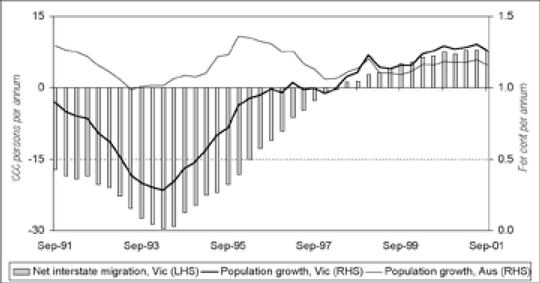
Source: Australian Bureau of Statistics
Note:
- (a)
- Annual original data.
Prices and wages
The Melbourne consumer price index rose by 2.9 per cent over the year to the March quarter 2002, in line with the national increase and well down from the peak following the introduction of the GST (6.3 per cent).
Wages growth, as measured by the wage cost index, remained moderate over the past year, rising 3.4 per cent in the year to the December quarter 2001. This was consistent with the national increase.
VICTORIAN ECONOMIC OUTLOOK
The economic projections used in the 2002-03 Budget are set out in Table 3.1. As usual, these have been prepared on a no policy change basis.
The Victorian economy performed strongly in 2001-02, and it is anticipated that GSP growth will exceed the original Budget estimate of 2.75 per cent. Economic growth is now estimated at 3.75 per cent in 2001-02, with growth of 3.5 per cent in 2002-03.
Over 2002-03, the composition of growth is expected to see a switch towards an improved export performance and a change in the drivers of state final demand.
While consumer spending will remain an important contributor to growth in 2002-03, housing investment is expected to recede as the first home owners' scheme is wound back and interest rates are raised. However, private business investment is forecast to be stronger in 2002-03 and merchandise exports should rebound over the year as the international recovery firms.
Employment growth is forecast to rise from 1.25 per cent in 2001-02 (up from the original budget estimate of 0.5 per cent) to 1.5 per cent in 2002-03 in year-average terms. The participation rate is expected to ease slightly from current high levels, with the unemployment rate to average around 6.00 per cent in 2002-03.
Consumer price inflation is forecast to moderate to 2.25 per cent in 2002-03, from an estimated 2.75 per cent in 2001-02. The economic projections assume annual wage growth will remain moderate at around 3.5 per cent over the forecast period.
The population growth projections are based on the ABS Series R projections which assume, among other things, net interstate migration eventually eases to a gain of 2 000 persons per year. Of the range of population projections prepared by the ABS, Series R is the most consistent with recent Victorian trends. A slight adjustment has been made to the near-term population growth rates to reflect the fact that interstate and overseas migration continue to exceed the Series R assumptions.
Table 3.1: Victorian economic projections(a)
| | 2000-01 Actual | 2001-02 Forecast | 2002-03 Forecast | |||
|---|---|---|---|---|---|---|
| Gross state product | 2.4 | 3.75 | 3.50 | |||
| Employment | 3.5 | 1.25 | 1.50 | |||
| Unemployment rate(b) | 6.0 | 6.25 | 6.00 | |||
| Consumer price index | 6.0 | 2.75 | 2.25 | |||
| Wage cost index(c) | 3.4 | 3.75 | 3.50 | |||
| Population(d) | 1.3 | 1.20 | 1.00 |
Source: Australian Bureau of Statistics
Note:
- (a)
- Year-average per cent change on previous year unless otherwise indicated. All projections apart from population are rounded to the nearest 0.25 percentage point.
- (b)
- Year-average level, per cent.
- (c)
- Total hourly rate excluding bonuses.
- (d)
- June quarter, per cent change on previous June quarter. Based on ABS Series R projections.
A discussion of the major risks to the economic projections is included in Chapter 6, Statement of Risks.
- •
- The Government's vision for Victoria is highlighted under Growing Victoria Together, the framework that balances economic, social and environmental goals and actions in growing all of Victoria.
- •
- The 2002-03 Budget delivers initiatives that advance the Government's priorities in the strategic issues of importance to Victoria over the next ten years as set out in Growing Victoria Together.
- •
- Key new initiatives of the 2002-03 Budget include:
- —
- $202 million over four years in output initiatives, as well as asset investment of $187 million TEI, to create more jobs and thriving innovative industries across Victoria;
- —
- $334 million over four years in output initiatives, as well as asset investment of $216 million TEI, that value and invest in lifelong education;
- —
- $1.2 billion over four years, as well as asset investment of $217 million, to ensure the provision of high quality, accessible health and community services;
- —
- $81 million TEI in asset investment, as well as $34 million over four years in new output initiatives, to make our streets, homes and workplaces safe;
- —
- $1.3 billion TEI (including contributions for Scoresby Freeway) in asset investment, as well as $76 million over four years in new output initiatives, to grow and link Victoria, including initiatives that link regional centres to Melbourne and improve road and rail;
- —
- $130 million over four years, as well as asset investment of $77 million TEI to promote sustainable development and protect the environment for future generations; and
- —
- $192 million over four years towards building cohesive communities and reducing inequalities.
GROWING VICTORIA TOGETHER
The Government's vision is that by 2010 Victoria will be a State where:
- •
- innovation leads to thriving industries generating high quality jobs;
- •
- all Victorians have access to the highest quality health and education services;
- •
- there are caring, safe communities with equitable opportunities; and
- •
- protecting the environment for future generations is built into all government decision making.
This vision is expressed in Growing Victoria Together, which was released in November 2001. Growing Victoria Together identifies the important strategic issues that will guide budget and policy choices. The strategic issues of importance identified are:
- •
- sound financial management;
- •
- more jobs and thriving, innovative industries across Victoria;
- •
- valuing and investing in lifelong education;
- •
- high quality, accessible health and community services;
- •
- safe streets, homes and workplaces;
- •
- growing and linking all of Victoria;
- •
- protecting the environment for future generations and promoting sustainable development;
- •
- building cohesive communities and reducing inequalities;
- •
- promoting rights and respecting diversity; and
- •
- government that listens and leads.
The 2002-03 Budget invests for our future. It invests in more jobs and stronger communities—with record investment in education and innovation driving new opportunities for all Victorians.
This chapter concentrates on the key budget initiatives in these priority areas, whilst also outlining some of the initiatives under the other elements of the Growing Victoria Together framework.
INVESTING FOR OUR FUTURE—STRONGER COMMUNITIES
Growing Victoria Together commits the Government to growing and linking the whole State. The Government recognises that the key to Victoria's future lies in strong communities, contributing to and sharing in the benefits of a thriving and innovative state economy.
Community access to quality services such as health, education, community safety and transport is essential to building strong and inclusive communities. At the same time, communities must also be assisted to attract new investment, create jobs and increase their capacity to connect with each other, with the rest of Victoria and with the global economy.
The 2002-03 Budget provides a major $3.0 billion boost to infrastructure focusing on generating more jobs, strengthening our communities and securing new opportunities across Victoria's suburbs, regions and growth corridors.
Stronger suburbs
In the period between 1996 and 2001, the population of Melbourne's outer suburbs grew by more than 10 per cent and continuing strong growth is expected in the years ahead. These growing communities are a vital and dynamic part of the Victorian economy. Measures in the 2002-03 Budget build improved social infrastructure and target key drivers of economic growth in these suburbs.
Greater detail on these initiatives is provided in other sections of this chapter.
Key highlights of investment in Melbourne's growing suburbs include:
- •
- $1.2 billion TEI for Linking the Suburbs strategy to improve road, rail, and tram transport, including construction of the Scoresby Freeway (including a $445 million contribution from the Federal Government) and extending the electrification of the rail line to Craigieburn;
- •
- a Transit Cities program to restructure parts of the metropolitan area and the establishment of the Dandenong Development Board;
- •
- $36 million over four years for new and enhanced bus services in outer metropolitan areas;
- •
- additional investment in 2002-03 in education and training facilities in Melbourne's growing suburbs, including the construction of new schools in outer metropolitan areas, the modernisation of school facilities in high growth suburbs, and new TAFE facilities in Epping; and
- •
- the redevelopment of the Royal Melbourne, Dandenong and Angliss Hospitals.
High growth suburbs will also benefit from the redevelopment and upgrading of residential aged care facilities, the expansion of the Home and Community Care program, mental health and public dental services, and improvements to the delivery of metropolitan ambulance services.
Further strategies to strengthen Melbourne's suburbs will be released later in 2002 as part of the draft Metropolitan Strategy which will outline the Government's approach to managing urban growth and change in Melbourne.
Stronger regions
The Government is continuing to rebuild rural and regional communities.
Over the past two years, funding for improved services and new projects has been distributed more evenly across the State and the Government's Connecting Victoria and Linking Victoria programs are delivering major improvements in regional communications and transport links. Across Victoria, vital regional infrastructure is being built, upgraded and replaced.
The 2002-03 Budget initiatives target the drivers of growth across regional Victoria, including education, skills and innovation, and focus on improving regional links and continuing to build stronger rural and regional communities.
Greater detail on these initiatives is provided in other sections of this chapter.
Key highlights include:
- •
- a major $101 million redevelopment of the Royal Melbourne Showgrounds to secure the future of the Royal Melbourne Show with an increased focus on promoting Victorian agriculture and regional industry;
- •
- Victoria's contribution of $77 million TEI to provide a more secure and higher quality water supply for 40 regional communities through the construction of a new Wimmera-Mallee pipeline;
- •
- a $94 million TEI package and an additional $8 million over four years to create better transport links for regional Victoria, including improved bus services, an upgrade of the Warrnambool rail line and investment in key regional arterial roads and highways;
- •
- funding of $130 million over four years for the sustainable use of Victoria's natural resources, including the Our Forests, Our Future, Box-Ironbark forests, Gippsland Lakes rescue packages and increased funding for Landcare and stressed Victorian rivers;
- •
- improving access and excellence in regional education and training, including the construction of a new secondary college at Lara and a major school redevelopment on the Bellarine Peninsula, a new specialist school in Bairnsdale, the development of an education precinct in Maryborough and increases in allowances for rural and regional school bus travel;
- •
- a major $51 million investment for country health and aged care facilities, including new investment in Warrnambool, Maryborough, Geelong, Bairnsdale, Beechworth, Lorne and Stawell, and improvements in the delivery of ambulance services; and
- •
- improving community safety in rural and regional communities through the replacement of inadequate and substandard police stations.
Regional communities will also benefit from statewide initiatives including school modernisation, additional teaching staff, improvements to public housing and neighbourhood renewals and expanded health and community services.
THRIVING AND INNOVATIVE INDUSTRIES ACROSS VICTORIA
Innovation is the 21st Century driver of economic growth, high quality jobs, wealth and improved living standards. The Government is committed to placing innovation at the heart of the Victorian economy—turning ideas and knowledge into positive economic outcomes for the whole State.
Since 1999, the Victorian Government has made a substantial investment in Victoria's future economic prosperity. Initiatives undertaken in the last two budgets include:
- •
- $287 million in investment in education and training infrastructure with a particular focus on science and technology;
- •
- $72 million investment in research and education institutions, particularly in the areas of agriculture, viticulture and gene technology;
- •
- establishment of the biotechnology precinct Bio21 which will enhance Victoria's standing as a global leader in biotechnology and scientific research;
- •
- $40 million for a high technology film and television studio facility at the Melbourne Docklands; and
- •
- establishment of the Technology Commercialisation Program which turns good ideas into good business.
In addition, the Government recently created a new portfolio of innovation.
Driving innovation
The Government recognises its key role in ensuring Victoria has globally competitive industries and sustainable high-value jobs. The Government is committed to positioning Victoria as a global player in fields such as biotechnology, advanced manufacturing, design, information and communication technologies (ICT), and environmental technologies.
Innovation and new technologies not only transform existing industries but also create the industries of the future. Key initiatives in the 2002-03 Budget target these industries and assist Victorian businesses become more innovative and competitive.
In addition, the Government is showing leadership in its ICT uptake and modernisation of the delivery of public and community services.
Synchrotron
The Government has committed $100 million TEI as its contribution towards the construction of a $157 million synchrotron facility at Monash University's Clayton campus. This facility will be a major addition to Australia's research infrastructure, as well as a long-term investment in the Victorian economy.
In addition, $2.9 million per annum has been committed to project and clients management costs associated with its construction. The synchrotron is expected to be ready for use in 2007.
Biotechnology
Biotechnology is an enabling technology that is transforming many sectors of the economy, including food and animal production, pharmaceuticals and medical instruments.
In June 2001 the Government released its Biotechnology Strategic Plan which aims to develop Victoria as one of the top five locations in the world for biotechnology.
Funding to implement the biotechnology strategy will total $4.5 million in 2002-03 and $22 million over the following three years.
Commercialisation
Turning good ideas into good businesses, in order to generate new jobs and opportunities, is a key component of a successful innovative economy. The Government is funding a range of measures to enhance the level of commercialisation in the State and turn world-class Victorian research into commercial products, ventures and outcomes.
Individual initiatives include funding for a Centre for Innovation and Technology Commercialisation, cooperative research centres and a technology transfer program. The additional funding for commercialisation is $6.7 million over four years. These measures build on the existing $20 million Technology Commercialisation Program.
Medical research
Victoria is home to Australia's leading health and medical research institutes. Victoria's universities and health and medical research institutes win 40 per cent of the national competitive medical research grants annually.
To consolidate Victoria's position at the forefront of international medical research the Government is providing a significant boost to medical research infrastructure.
In 2002-03 the Government will commit additional funding of $35 million over the next four years to Victoria's medical research institutes. This additional operational support to institutes will progressively rise to $13 million per annum by 2005-06. In conjunction with the Government's existing $310 million Science, Technology and Innovation program this investment will sustain Victoria's leadership position for medical research.
Developing knowledge based industries
Design
Good design is an area of fundamental importance to an innovative economy, playing a crucial role in industries as diverse as engineering, aerospace, IT, fashion, automotive and environmental technologies. The 2002-03 Budget provides $9.2 million over two years to boost Victoria's already strong design capabilities and position Victoria as an international centre of design.
Budget initiatives will lead to more jobs in key industries, improve design skills and qualifications and create stronger links between design education, training, research and business.
Environmental technologies
In 2002-03 the Government will fund the establishment of the Centre for Energy and Greenhouse Technologies in Gippsland. The Centre will facilitate research, development, demonstration and commercialisation of technologies to reduce the greenhouse intensity of energy supply and use in Victoria.
While the Centre will not undertake research itself, it will coordinate, facilitate and fund relevant energy projects, act as an information centre and database for energy and greenhouse technologies, and promote and establish links within the Victorian energy sector. The funding for this initiative is $12 million over the next three years.
The Government will also allocate $2.8 million towards the Cooperative Research Centre for Clean Power from Lignite.
New manufacturing
Manufacturing accounts for almost three-quarters of world trade and underpins all of the world's fastest-growing economies. Almost one-third of Australia's manufacturing output comes from Victoria and the manufacturing sector is the largest employer of full-time workers in Victoria. The Government has announced its Agenda for New Manufacturing designed to maximise the industry's capacity to innovate, grow and contribute to Victoria's prosperity.
The 2002-03 Budget provides $27 million over four years for initiatives to stimulate growth in the manufacturing industry and create high value, high skilled jobs through a greater focus on export and innovation.
Building Tomorrow's Businesses Today
On 22 April 2002, the Government released its Building Tomorrow's Businesses Today statement. The statement lays out how Government and business can work together to make Victoria a more competitive, innovative and connected place to do business. Building Tomorrow's Businesses Today delivers the strategic direction, resources and on-the-ground support to give Victoria:
- •
- a more highly competitive, friction-free business environment;
- •
- more innovative businesses and an innovation driven economy;
- •
- a stronger international focus;
- •
- better business linkages and networks;
- •
- sustained performance in starting and growing new businesses; and
- •
- more productive and cooperative workplaces.
A competitive cost environment is critical to business success, and that means keeping taxes low. Maintaining a low taxation environment plays an important role in enhancing the ability of firms and consumers to drive economic activity, jobs growth and higher standards of living. In 2002-03, the Government is:
- •
- increasing the payroll tax threshold from $515 000 to $550 000 from 1 July 2002, a year ahead of schedule;
- •
- reducing the payroll tax rate from 5.45 per cent to 5.35 per cent from 1 July 2002, a year ahead of schedule;
- •
- further reducing the payroll tax rate from 5.35 per cent to 5.25 per cent from 1 July 2003;
- •
- increasing the land tax threshold from $125 000 to $150 000 from 2002-03; and
- •
- abolishing stamp duty on unquoted marketable securities from 1 July 2002, a year earlier than scheduled.
Together these initiatives will deliver an additional $262 million worth of taxation cuts over four years, bringing total business tax relief announced since October 1999 to over $1 billion.
In addition, Building Tomorrow's Businesses Today announces measures that will stabilise and simplify WorkCover premiums. For the second year running, businesses with an annual remuneration of $1 million or less will pay the same premium rate in 2002-03 as in the previous year. For the third year running, the average WorkCover premium rate will remain at 2.22 per cent of wages in 2002-03.
Building Tomorrow's Businesses Today also includes a range of initiatives aimed at improving the way Victoria does business. This will promote innovation, competitiveness and sustainable growth.
Modernising government
The Government is continuing to lead the way in its uptake and application of ICT and the modernisation of public and community service delivery.
The 2002-03 Budget provides a major funding boost to improve the ICT interface between government and the community and build the capacity of the public sector to manage communications and information. Key initiatives include:
- •
- $48 million TEI as well as $23 million in output funding over four years for the Telecommunications Purchasing and Management Strategy (TPAMS) to streamline the Government's telecommunications needs and establish a whole-of-government electronic directory;
- •
- funding for a Statewide Integrated Public Safety Communications Strategy (SIPSaCS) to improve communications systems for emergency services across Victoria, including funding for a Mobile Data Network Project to equip emergency service vehicles with data terminals, a Statewide Personnel Alerting System to provide pagers to emergency services across the State, and for the Metropolitan Mobile Radio project. Funding will be determined upon the appointment of successful tenders;
- •
- $5.5 million TEI for the development of appropriate infrastructure as part of the Victorian Electronic Records Strategy to ensure important digital information is securely managed and accessible in the long term;
- •
- $2 million over four years for the first stage of EASY government that will enable people wanting to start up a new business to lodge all necessary application forms in the one office; and
- •
- $24 million TEI for a new electronic Land Exchange, providing business with a single point of access to state and local government land information and transactions.
These initiatives will contribute to Victoria's growing status as an international leader in the modernisation of government.
VALUING AND INVESTING IN LIFELONG EDUCATION
Improving access and driving innovation and excellence in education, from preschool to post-compulsory education, is one of the Government's major priorities.
Access to world-class, lifelong education is the key to our children's future, Victoria's prosperity and the success of an innovative economy. Education and training opens the door to high quality jobs, to a full and creative life and a sense of common citizenship.
Growing Victoria Together underpins the Government's commitment to education. That commitment is reinforced by the major investment in education and training made by the Government in its previous two budgets. The 2002-03 Budget continues to ensure that Victoria's preschool services, schools and TAFE institutes have the people, resources, community links and technology they need to access excellence, create exciting learning environments, boost student participation and achievement, and improve opportunities for all Victorians.
Education goals and targets
The Victorian Government has set education and training goals and targets for 2005 and beyond including:
- •
- Victorian primary school children will be at or above national benchmark levels for reading, writing and numeracy by 2005;
- •
- 90 per cent of young people in Victoria will successfully complete year 12 or its equivalent by 2010;
- •
- the percentage of young people aged 15-19 years in rural and regional Victoria engaged in education and training will rise by 6 per cent by 2005; and
- •
- the proportion of Victorians learning new skills will increase.
The priority actions to help deliver on these targets include improving overall participation, driving innovation and excellence in education and training, providing better links between schools, business and communities, and expanding opportunities for training and learning throughout life.
Substantial resources have already been committed by the Government to achieve the goals and targets in the following areas:
- •
- the rebuilding of many public schools and TAFE institutes;
- •
- reaching over 100 000 apprenticeships and traineeships for the first time in Victoria;
- •
- reductions in class sizes;
- •
- ensuring there is at least one computer to every five students—one of the best computer to student ratios in the world;
- •
- assisting young people to move from school to work through Local Learning and Employment Networks; and
- •
- funding nine Learning Towns and over 500 Neighbourhood Houses and Adult Community Learning Centres to deliver lifelong learning.
The commitment to education by the Victorian Government is reflected in Chart 4.1, which shows the significant increase in funding for education and training since October 1999.
Chart 4.1: Expenditure on education and training
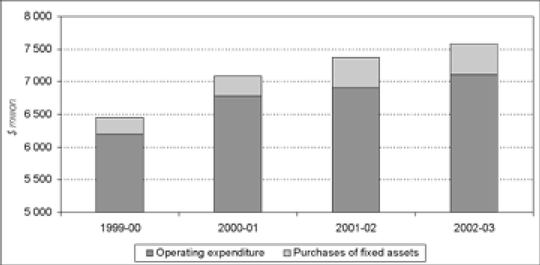
Source: Department of Treasury and Finance
Key strategies in education
The 2002-03 Budget strengthens this investment by boosting funding for initiatives which improve access to education, and drive excellence across all Victorian schools and TAFEs, building on the solid foundations laid over the past two years in the Victorian education and training system.
The priority initiatives targeted in the 2002-03 Budget are focused on achieving the Government's goals and targets for education and training:
- •
- $27 million over four years and $5 million committed in 2001-02 to improve the health, development, learning and wellbeing of children before they start school, through initiatives in preschools and the BEST START initiative;
- •
- funding of $78 million over four years to improve the standards of literacy and numeracy in the early years of schooling and meet higher than expected enrolment growth in government schools;
- •
- $214 million over four years to improve participation and achievement so as to increase the percentage of young people who successfully complete year 12 or its equivalent, including initiatives aimed at the middle years of schooling;
- •
- policy initiatives that drive excellence and improve access, particularly in rural and regional Victoria and among groups where it is presently low, including $3.6 million over four years for additional Koori educators and home liaison officers;
- •
- $31 million over four years to make Victoria's school bus services fairer, safer and more accessible for all students; and
- •
- $216 million TEI to continue the Government's commitment to bringing Victoria's government education and training facilities into line with world-class standards, including $52 million not previously allocated of Growing Victoria projects to enhance learning environments in schools.
The 2002-03 Budget initiatives in education will provide at least 900 extra teachers across Victorian government schools.
Investing for our children's future
Better preschool services and facilities
The Government recognises that preschools play an important role in the early development of young children. In response to community concerns about the preschool system, the Government established an independent Review of the Issues that Impact on the Delivery of Preschool Services to Children and Their Families in Victoria in 2001 which highlighted the need for increased support to restructure and renew preschool services.
A new professional career structure for preschool teachers that has substantially improved salaries has been implemented, and the Government is working in partnership with preschool teachers and parents to strengthen the preschool system, and improve the quality of preschool services for all Victorian children.
Funding of $23 million has been provided over four years to support the implementation of a range of initiatives which improve preschool participation for Koori children and children with disability or special needs, provide additional places for children who require a second year of preschool, and ease the workload of parents' committees of management through the commencement of the group employment model.
In addition, the Government has committed $5 million in 2001-02 to assist community-based preschools to upgrade facilities to meet new service standards.
BEST START
BEST START is a prevention and early intervention project being delivered jointly by the Department of Human Services and the Department of Education and Training to improve the health, development, learning and wellbeing of all Victorian children from before birth and through the transition to school.
Funding of $4 million has been allocated over three years to implement demonstration projects that support communities, parents and service providers to develop innovative approaches to services for children in the early years, and to improve access to child and family support, health services and early education.
Early years initiatives
Support for learning in the early years is critical to giving children a good start in life. Research shows that the greatest gains come from investment in the early years of life. Early years initiatives implemented since 1999 and in 2002-03 will see further increases in the number of children achieving a firm grounding in the 'basics' as a platform for further learning and participation in the education and training system.
Government primary schools will receive additional funding of $35 million over four years to further enhance the skills and understanding of early years teachers as part of the coordinated early years numeracy program. This initiative has a clear focus on improving student learning and the professional development of teachers. The initiative is also aligned to the BEST START strategy.
The numeracy program is also well integrated with the years prep to 2 class size initiative. In 2000-01 the Government made a commitment to reduce the average years prep to 2 class size to 21 by 2003. The Government is well placed to achieve this commitment with average years prep to 2 class sizes in 2002 at a ten-year low of 21.8. Additional funding of $43 million over three years is provided to meet higher than expected enrolments in years prep to 2 in government primary schools.
Driving excellence and innovation in education
Improving student participation and achievement in education is a priority action under the Growing Victoria Together framework. The Government is committed to ensuring that all Victorians have the opportunity to access quality education and training pathways. The 2002-03 Budget provides an additional $214 million over four years in output funding, to fulfil this commitment.
Teaching and learning strategies which promote attendance, active engagement and participation of students through the middle years are vital to ensure as many young people as possible gain a base qualification (year 12 or equivalent) that links them to further education and skilled work as a starting point for their adult life.
Development of a strategy for reform in the middle years of schooling began in 1999 to address the issues of poor performance and disengagement of students in years 5 to 9. Substantial funding was provided in the 2001-02 Budget for initiatives aimed at enhancing student engagement, improving literacy and numeracy outcomes and increasing student attendance rates.
Building on this investment, the next phase of the strategy is to substantially change the way middle years education is delivered, particularly the approaches to teaching and learning, class and school organisation, and effective connections between the school, home and the community. The focus will be on the engagement and performance of students in the middle years so as to encourage retention, and provide the necessary incentives for completion of year 12 or its equivalent.
To meet these challenges, the Government will commit additional funding of $84 million over four years for a Middle Years Reform and Innovations program aimed at providing systemic support for primary and secondary schools to implement innovative curriculum and structural reform in the middle years. The program will focus on innovative and strategic programs aimed at stimulating the learning environment and providing students with the best chance of success in the future. It will target 250 school clusters, and be supported by an initial innovation grant to support reform implementation.
In addition, the Government will commit $82 million over four years to provide a boost for targeted secondary schools continuing to experience difficulties in relation to absenteeism, disengagement, or where literacy and numeracy skills are below standard. The Access to Excellence initiative will provide these targeted schools with additional teaching resources to increase face-to-face teaching efforts, provide additional educational mentoring and engage students in learning outcomes.
Continuing the focus across all educational years, the 2002-03 Budget provides for statewide rollout of the Victorian Certificate of Applied Learning (VCAL). The VCAL offers an alternative vocational pathway for young people whose needs are not being met by the current range of available qualifications in the senior years. The VCAL provides a distinctive qualification, based on a coherent and challenging program of applied learning which aims to improve the employment opportunities of young people by giving them skills and pathway choices.
Improving access
For the Government's goals and targets to be achieved, programs that reduce educational disadvantage, in particular for young people in rural and regional Victoria and indigenous groups, are essential. In particular, equity programs which allow students to achieve their personal best outcomes regardless of their circumstances will need to be implemented.
The 2002-03 Budget provides additional funding to support policy initiatives aimed at improving equity in Victoria's school system, including $3.6 million over four years to appoint additional Koori educators and home liaison officers. The Koori educators and home liaison officers will provide valuable support to Koori students and their communities, focusing on lifting literacy and numeracy outcomes, reducing absenteeism and increasing retention towards achieving the Government's benchmarks.
To support the implementation of the recommendations of the 2001 Review of School Bus Services, which examined the adequacy of bus services and the impact of route closures in rural Victoria, $31 million over four years is provided in the 2002-03 Budget. The funds will be used to assist students meet the costs of transport in rural and regional Victoria as well as further assist a number of existing recipients of the conveyance allowance. Implementation of the initiatives will commence at the beginning of the 2003 school year.
Programs that maximise opportunities for the development and wellbeing of young Victorians remain a priority for Government. Achievement of the Growing Victoria Together framework will rely on the input of young people and specific approaches that address their needs and interests. The Government will provide $8 million over four years to fund Freeza events which provide opportunities for young people to develop skills and training as well as creating employment paths in music and entertainment related industries.
Building better schools and TAFE institutes
In 2002-03 the Government continues its commitment to providing world-class learning and training environments for Victoria's students. Evidence shows that sound education and training environments have a demonstrable and quantifiable impact on educational outcomes and the motivation of both students and teachers. The 2002-03 Budget provides a further $216 million TEI designed to enhance and improve Victoria's education and training facilities. This investment builds on the $658 million in asset investment the Government has committed since 1999 to build, upgrade and modernise Victoria's learning institutions.
Of the total asset investment of $216 million TEI allocated in this budget, $141 million TEI is provided for the modernisation of over 110 government schools and TAFE institutes across Victoria, including asset funding of $52 million TEI from the Growing Victoria infrastructure reserve not previously allocated to projects.
To meet increasing populations in the growth centres of Victoria, asset investment of $32 million TEI will also be provided for the development of a new special school, two new primary and five new secondary schools in various metropolitan and rural regions. Funding will also be provided for the replacement of schools destroyed by fire, redevelopments and upgrades for both primary and secondary schools and TAFE institutes in various locations.
The 2002-03 Budget allocates $52 million TEI from the Growing Victoria infrastructure reserve to projects designed to provide Victoria's schools and TAFE institutes with high technology learning tools and facilities.
HIGH QUALITY, ACCESSIBLE HEALTH AND COMMUNITY SERVICES
Delivering high quality, accessible health and community services is one of the Government's highest priorities under Growing Victoria Together. The Government is turning around Victoria's health and community system in response to challenges including:
- •
- responding to demand for services from a growing and ageing population;
- •
- sustaining and improving essential hospital, community health, aged care, mental health, disability, child protection and family support services;
- •
- enhancing service quality and efficiency by attracting and retaining high quality staff in the health and community services system, and implementing new technologies and infrastructure; and
- •
- developing service models to respond to complex needs and reduce inequalities.
The Victorian Government recognises the importance of access by all Victorians to high quality services. Priorities in this budget include health and community services. Many of the initiatives will improve the quality of services available to people in outer metropolitan and regional areas, as well as targeting groups such as the elderly.
The 2002-03 Budget continues to restore Victoria's human services system, building on new service delivery approaches implemented in the last budget, with $1.2 billion in new output initiatives over four years. The 2002-03 Budget also delivers $217 million TEI in new human services infrastructure.
The Hospital Demand Management Strategy has been enhanced in 2002-03 by broadening the range of services used to respond to needs, and increasing funding for initiatives that will reduce future service demands and costs.
In 2002-03 the Government will extend the demand management approach through new strategies focusing on child protection and placement services, and mental health services.
A new approach to managing demand for hospital services
Since its introduction in 2001-02, the Hospital Demand Management Strategy has improved the quality and effectiveness of Victoria's public hospital system. Emergency department ambulance bypass rates have fallen significantly, as shown in Chart 4.2, and the number of patients waiting for more than 12 hours in emergency departments for admission to a ward has decreased. Metropolitan emergency departments continue to treat more patients, and hospital capacity taken up by people waiting for residential aged care has reduced.
Chart 4.2: Number of incidents of ambulance bypass in Victorian public hospitals in 2001
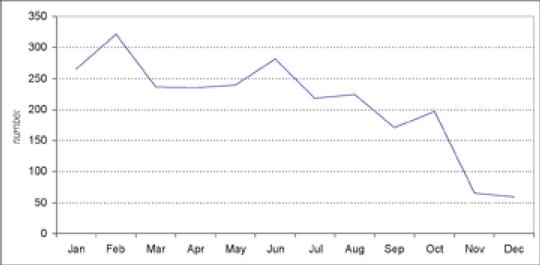
Source: Department of Human Services
The number of patients treated in Victorian hospitals has continued to increase in 2001-02 (see Chart 4.3), while the elective surgery waiting list fell by 5.5 per cent in the 12 months to December 2001, and 100 per cent of urgent cases were treated within clinically ideal waiting times.
Chart 4.3: Number of public patients treated in Victorian public hospitals
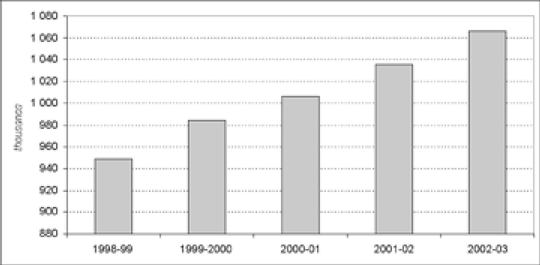
Source: Department of Human Services
In the 2002-03 Budget, the Government will extend the multi-year Hospital Demand Management Strategy with new funding totalling $464 million over four years to:
- •
- expand public hospitals' capacity to respond to demand growth, with additional funding of $381 million over four years focused on emergency services and elective surgery. This will enable hospitals to respond to expected growth in emergency admissions; and
- •
- commence greater diversion of emergency department and inpatient services to other more appropriate services, as well as investing in improved clinical practice and service efficiency in sub-acute services. This will include redesign of inpatient care and continued development of community care, with additional funding of $83 million over four years.
An additional $16 million will be available to boost investment in prevention initiatives that are directed at improving the quality of care for the elderly and other frequent users of emergency services, in order to reduce the need for emergency department presentation and hospital readmission. Funding will also enable continuing clinical practice reform with an emphasis on the use of same-day surgery and admitting patients to hospital on the day of surgery. Funding for these initiatives was allocated in the 2001-02 Budget.
As a result of the Hospital Demand Management Strategy there will be:
- •
- 30 000 extra patients treated in public hospital emergency departments;
- •
- 16 000 extra patients admitted from emergency departments;
- •
- additional mental health services for 3 500 people; and
- •
- 14 000 extra elective surgery, renal, palliative care and radiotherapy patients treated.
The Government will also support the ongoing viability of the public hospital system with funding of $169 million over four years to meet increased costs associated with medical and pharmaceutical supplies and consumables, and employer superannuation costs.
Better hospital facilities
The 2002-03 Budget continues the rebuilding of Victoria's public health system with a significant investment in new hospitals, equipment upgrades and redevelopments.
An additional $25 million in 2001-02 and $20 million in 2002-03 will be provided to replace, upgrade and expand medical equipment and instruments to meet service needs in hospitals, dental health facilities and laboratories.
New health infrastructure investment include:
- •
- a $32 million TEI major redevelopment at the Royal Melbourne Hospital for a new helipad to further develop the trauma service and 120-bed new ward accommodation;
- •
- $10 million TEI for the Dandenong Hospital for redevelopment and new wards;
- •
- $19 million TEI for the Angliss Hospital; and
- •
- $6 million TEI for Stawell District Hospital and Lorne Community Hospital.
Enhancing health services
Improved access to health and community services, and a clear focus on early intervention and prevention are fundamental to helping address issues of inequality and assisting Victorians of all ages and abilities to live healthy and active lives.
The 2002-03 Budget continues the Government's commitment to provide comprehensive and timely ambulance services for all Victorians. Funding of $20 million over four years has been provided to:
- •
- maintain emergency ambulance response times at 13 minutes in metropolitan areas;
- •
- respond to ambulance services caseload growth across Victoria;
- •
- deliver new and upgraded ambulance services across metropolitan and regional areas, including the recruitment and training of additional paramedics; and
- •
- implement a telephone triage service to ensure that callers to 000 who do not require an emergency ambulance response are referred to appropriate alternative services.
As part of the Government's policy to treat more people with a mental illness at home and in the community and to improve access to hospital services, funding of $61 million has been provided over the next four years for inpatient services as part of the Hospital Demand Management Strategy and non-hospital based community mental health services. The initiatives to be implemented include:
- •
- an increase in the provision of acute inpatient services, adult and aged clinical community services and psychiatric disability support services to clients and areas with high needs; and
- •
- new diversion, early intervention and prevention initiatives, including sub-acute beds, intensive support for homeless people with a mental illness and co-existing substance abuse, and expansion of the dual diagnosis program to young people with mental illness and co-existing substance abuse.
Free breast screening services will continue to be provided to women aged 50-69 years. Additional funding of $5.7 million over four years will maintain the participation rate for free breast screening services for women in this age group, reducing avoidable deaths and health care costs associated with breast cancer. Breast screening services are an important tool for early detection and prevention of cancer for women, and reduce the need for invasive diagnosis and treatment.
The Government has targeted $2 million to primary health services in 2002-03 and ongoing under the Hospital Demand Management Strategy. Funding is provided for allied health services for children, older people and people with chronic conditions and will assist to prevent avoidable admissions to hospital.
The Government is committed to a public dental health program which provides a critical platform from which to address equality of access to health services throughout the community. Since coming to office, the Government has expanded the school dental program which now covers children from preschool to year 12, and reduced the cost of dentures for people receiving public dental treatment from a maximum of $200 to a maximum of $100.
The 2002-03 Budget commits a further $4 million over four years to treat an additional 2 800 Victorians requiring public dental services.
The Government has committed $1 million in 2001-02 to support the development of the Nerve Centre, a national neurological centre for services to people with multiple sclerosis and other neurological conditions.
Investing in improved community services
In 2002-03 the Government continues its commitment to delivering better community services with a significant investment in families, children, people with a disability, older people and homeless people. This budget builds on funding provided last year to turn around and enhance community services, including residential care services for young people at risk of abuse and neglect, disability services and juvenile justice.
Integrated strategy for child protection and placement services
As in most States and Territories in Australia, the number of notifications of suspected child abuse and neglect in Victoria has increased substantially over the past decade. The current system is effective in identifying cases of child abuse and neglect, but can do more to support children and families through prevention and early intervention services and to respond to their diverse needs and circumstances.
The Government has committed funding of $60 million over the next four years to implement a new approach to the delivery of child protection services in Victoria.
The new approach includes a mixture of short-term actions designed to manage demand through an increased focus on early intervention initiatives to prevent families and children entering the system, and initiatives to divert clients to more appropriate services. In 2002-03 six new innovation projects will be established in areas that have some of the highest rates of notification of suspected child abuse and neglect in Victoria. In addition, two innovation projects will also be established to support Koori communities.
The child protection workforce will be increased to ease the workload on direct line staff and to build a stronger system.
In addition, the Government is providing an additional $5 million TEI for the upgrade of residential care facilities for placement and support programs.
In the 2002-03 Budget, the Government has provided $15 million TEI to redevelop its Senior Youth Training facilities. This will include closing the substandard Turana buildings by the end of 2004 and building new facilities on the Parkville and Malmsbury sites.
This substantial investment in juvenile justice facilities builds upon Government's Juvenile Justice Reform Strategy with a focus on diversion, rehabilitation and transitional post-release support. This strategy has been successful in helping to break the cycle of re-offending for a large number of young offenders. However, the increasing incidence of drug related offences has meant that it is necessary to redevelop and upgrade the existing custodial facilities for young offenders.
Improving disability services
The 2002-03 Budget delivers a substantial investment to help build stronger communities through targeting high need areas to improve services for people with disabilities. Every person has a right to be an active member of a community that maximises their ability for participation and independent living.
The 2002-03 Budget provides for increased home-based support for people with a disability, more post-educational services for young adults with a disability, and the first stage of the closure and redevelopment of Kew Residential Services.
The redevelopment of Kew Residential Services is a major turnaround in the quality of disability services provided for 460 residents with an intellectual disability. Funding of $25 million over four years has been provided to relocate 100 residents into 20 new community houses. Funding for the relocation of the remaining residents will be factored into subsequent years' budgets.
An additional $20 million has been provided over four years in response to the growing need for community and home-based disability support services, and to provide additional places in the Futures for Young Adults program.
The Futures for Young Adults program assists people with disabilities in their transition from school to a range of adult options including supported and open employment, vocational training and further education, community participation, recreation and leisure activities.
Supporting senior Victorians
The 2002-03 Budget builds on the Government's commitment to promote the wellbeing of senior Victorians and to support active, independent living in the community. Initiatives to improve services for senior Victorians in the 2002-03 Budget include:
- •
- $40 million TEI for the ongoing implementation of the residential aged care strategy to upgrade and redevelop residential aged care and rural health services to meet Victorian requirements and Commonwealth certification and accreditation standards. This funding builds on previous investments of $92 million since the Bracks Government was elected;
- •
- fire safety upgrades for residential aged care facilities, funded from the $10 million fire risk management strategy for human services facilities;
- •
- $29 million over four years to expand Home and Community Care services to support people to live independent lives with support in their own homes and communities.
Senior Victorians will also benefit from the Hospital Demand Management Strategy initiatives that prevent hospital admissions and improve the quality of hospital care for the elderly. Funding of $3.7 million has been committed in 2002-03 and ongoing to programs including aged care and primary health services aimed at managing complex and chronic conditions and reducing the need for emergency services.
Improving access to housing for people in need
The Government is committed to enhancing and protecting the health and wellbeing of all Victorians, with an emphasis on vulnerable groups and those most in need.
The Victorian Homelessness Strategy, Directions for Change was released in February 2002. The Government will invest an additional $8.8 million in funding over four years in homelessness support services to help tackle homelessness, address critical service gaps and increase capacity, particularly in areas such as Melbourne's growing south eastern suburbs, boosting services to young people in major centres such as Bendigo, and improving services for people with complex needs.
In addition, funding for non-hospital based mental health services includes $4.6 million over four years to implement a housing and mental health partnership to provide specialist mental health treatment and support services and pathways out of homelessness for people with a mental illness.
The Government has reformed, streamlined and expanded existing concessions for conveyancing duty to target concession card holders and first home buying families with dependent children. As a result, a full concession of up to $4 660 will be available from 1 July 2002 for the purchase of homes valued up to $150 000 for eligible persons and a partial concession for the purchase of homes valued between $150 000 and $200 000. The income test for families will be removed. About 8 000 Victorians on low incomes and families with children are expected to receive a concession in 2002-03.
Currently first home buyers with families receive a full stamp duty concession when they purchase a home up to $115 000 in value, with a partial concession payable when they purchase a home from $115 000 to $165 000 in value, provided they have income below a maximum threshold. Concession card holders currently receive a full stamp duty concession where they purchase a home up to $100 000 in value, with a partial concession from $100 000 to $130 000.
Neighbourhood renewal and housing quality
In 2002-03, the Office of Housing budget will provide at least an extra 1500 homes for low income Victorians through buying, building, replacing or leasing additional housing across Victoria, with a focus on meeting growing demand in areas such as Melbourne's south east suburbs and regional centres such as Bendigo, Bairnsdale, Kyneton and Wangaratta.
The physical form of older public housing estates is being progressively transformed as part of a concerted whole-of-government effort in community building. These projects involve coordinated action with local communities linking housing renewal with employment, education and training, community safety and local involvement in decision making.
This includes provision for ongoing work on the redevelopment of rundown public housing estates in areas such as East Geelong, Bendigo, Wodonga, Ashburton, Richmond and Port Melbourne.
Funding will also be provided to upgrade and improve the security and energy efficiency of public and community housing, and rebuild communities through new neighbourhood renewal schemes in communities such as Geelong North, Bendigo, Seymour, Shepparton, Maidstone/Braybrook and Collingwood/Fitzroy, as well the Latrobe Valley and Wendouree West where renewal projects have already commenced.
PUBLIC SAFETY AND JUSTICE
Improving safety and confidence in the places Victorians live and work is one of the Government's key priorities under Growing Victoria Together.
The Government is committed to preventing crime and maintaining community safety, in public places, roads, homes and workplaces. This requires highly skilled, well-resourced police and emergency services, working together to improve safety through both preventative actions and improved response capabilities.
Responsive police and emergency communication services
The Government is committed to building a highly professional and well-resourced police force, through increasing the number of frontline police officers, improving pay and conditions of police, upgrading and building new police stations, and upgrading equipment.
The Government has over the past two years provided funding for an additional 800 frontline police. The Government has also committed significant additional funding over a period of five years and four months from 1 August 2001 for an Enterprise Bargaining Agreement for Victoria Police. The Agreement achieves significant benefits for police built around key reforms sought by the Chief Commissioner and aimed at bringing wage certainty during this period.
The 2002-03 Budget also provides $26 million TEI for new police stations in Footscray, Coburg and 12 replacement stations in small country towns.
To ensure a seamless transition and improved operational efficiency and reliability of emergency call taking and dispatch services, the Government has provided net additional funding of $15 million in 2001-02, with a net additional $18 million allocated over four years, as well as net asset funding of $1 million in 2001-02 and $23 million over four years.
Improved safety
Growing Victoria Together sets out the Government's priorities for improved safety for Victorians. This budget provides funding for initiatives that target the safety of women, strengthens the Government's public safety communications capability and improves the safety of Victoria's roads.
The Government has endorsed a five-year Women's Safety Strategy. The objective of the strategy is to improve women's safety, wellbeing and capacity to fully participate in Victorian life by reducing the level, and fear, of violence towards women and improving the responses available to women affected by family violence.
Statewide Integrated Public Safety Communications Strategy
Funding is provided in 2001-02 and ongoing for the management of a number of emergency service telecommunications projects. The additional resources will strengthen the capacity of the Government to deliver efficient and reliable communication services to Victoria's emergency service organisations. The Statewide Integrated Public Safety Communications Strategy is a ten-year strategy to ensure Victoria's emergency services organisations are equipped with robust and appropriate communications equipment. The strategy identified the following priority projects:
- •
- an integrated and flexible Statewide Personal Alerting System for the Country Fire Authority, the Victorian State Emergency Service and Rural Ambulance Victoria;
- •
- the Metropolitan Mobile Radio project, which will provide Victoria Police, the Metropolitan Fire and Emergency Services Board and the Metropolitan Ambulance Service with an up-to-date digital trunked radio system. Radio coverage will be extended in metropolitan areas, and for the first time the various emergency services organisations will be using the same radio system allowing for direct multi-agency operational communications. The level of funding will be determined following appointment of a successful tenderer; and
- •
- the Mobile Data Network project to equip emergency service vehicles with data terminals. The equipment will enable automated dispatch and onscreen vehicle location, as well as providing personnel with remote data access from their vehicles.
Improving road safety
Improving the safety of all Victorian road and transport users is a key objective of Growing Victoria Together. In particular, the Government is committed to reducing death and serious injury from road accidents by 20 per cent over five years. The 2002-03 Budget contains several important initiatives designed to continue improvements in Victoria's road safety.
These include the installation of new and converted digital red light and speed detection cameras at key intersections ($6 million), the installation of new median barriers on the Monash Freeway ($5 million), a new program focusing on the safety of motorcyclists, and $48 million TEI of unallocated funds from the Accident Blackspot program, targeting the outer metropolitan areas of Melbourne.
In addition to the road safety initiatives above, 2002-03 will see the first full-year impact of previously funded road safety measures. These measures include $12 million of initiatives announced in 2001-02, such as the installation of fixed speed and point-to-point cameras, the purchase of speed measuring devices, and drink driving programs including the upgrade and purchase of additional 'booze buses' for Victoria Police.
The Government's Road Safety Strategy 2002-2007, arrive alive!, will provide the framework for the development of new programs in areas such as crash investigation, road design, fatigue management, occupant protection, post-crash trauma support and measures to target high-risk groups such as novice and older drivers, motorcyclists and pedestrians. New initiatives will range from additional research into the causes of road crashes and the performance of road safety audits to the construction of new rest areas and innovative public education programs.
These road safety initiatives complement the Government's substantial investment in 2002-03 in new roads, road upgrades and safety improvements across the whole state.
The Government is also providing $3 million per annum to manage improvements to the safety of railway pedestrian crossings and wheelchair access.
OTHER GROWING VICTORIA TOGETHER STRATEGIES
While the 2002-03 Budget has focused on the priority areas of innovation, lifelong education, high quality health and community services and public safety, other elements of Growing Victoria Together have also received attention. Important new initiatives relate to the areas of infrastructure delivery and sustainable development and environment management.
Infrastructure—growing and linking all of Victoria
Fast, reliable and integrated transport services are critical to achieving sustainable economic growth and accessible communities across the State. Melbourne is now the transport hub of south-east Australia and the gateway for 25 per cent of the nation's exports and imports. In addition, regional areas are critical to Victoria's export earnings. The Government's infrastructure investment strategy is led by these factors and its commitment to:
- •
- ensure efficient freight transfer between transport modes, reduce bottlenecks and handling delays;
- •
- respond to the effects of transport globalisation and changes in supply and delivery chains;
- •
- reduce the impact of traffic congestion and adverse environmental effects on major urban and regional roads; and
- •
- encourage the use of public transport and focus on the changing needs of users and communities.
The centrepiece to the Government's transport policy is the $3.5 billion Linking Victoria program—an integrated strategy to upgrade Victoria's ports, roads and rail networks. These strong themes of supporting sustainable economic growth and community accessibility through infrastructure provision are continued in the 2002-03 Budget with initiatives focusing on developing Victoria's ports and roads, including the construction of the Scoresby Freeway, and enhancing Victoria's rail network.
Linking the Suburbs
The Government is committed to improving infrastructure and services that support growing populations in Melbourne's outer suburbs and to developing integrated transport solutions which enhance economic development and create new opportunities in growth corridors.
Residents in Melbourne's growing suburbs and growth corridors will benefit from investment of $637 million TEI (excluding Federal Government funding) in new public transport and upgraded roads, consisting of:
- •
- $445 million for Scoresby Freeway to integrate transport infrastructure services in Melbourne's south-east, creating a link between Ringwood and Frankston and improved east-west connections for travel to the CBD and beyond;
- •
- $98 million for electrification of the train service from Broadmeadows to Craigieburn, including the construction of a new station at Roxburgh Park and the redevelopment of the existing Craigieburn Station;
- •
- $63 million to upgrade key arterial roads in outer suburbs to improve road safety and reduce congestion; and
- •
- $31 million for extension of the Knox tram service along Burwood Highway to Vermont South Shopping Centre.
The Linking the Suburbs package also comprises operating funding of $67 million over four years, including:
- •
- a boost to suburban bus services of $36 million over four years; and
- •
- $13 million over four years to undertake rail safety works.
In October 2001, the Government signed an agreement with the Commonwealth Government to secure joint funding of the construction of the Scoresby Freeway in Melbourne's south-east. As part of this agreement, the Victorian Government has committed to provide $445 million TEI towards the cost of the Freeway. This is in addition to $110 million the Victorian Government has spent in land purchases for the Freeway.
The Freeway development will offer enormous benefits to this high-growth area, which is home to one million people, 40 per cent of Victoria's manufacturing activity and 28 per cent of Melbourne's jobs. The Freeway will deliver better links to ports, airports, freight terminals and other industrial centres, relieving congestion and providing a boost to business in the area. The removal of heavy trucks from local and arterial roads will also improve safety and community amenity.
Transit Cities
The Government has identified several 'Transit Cities' that are located on key transport nodes and are well suited to further residential and commercial development. The Government sees these Transit Cities as critical to connecting communities in Melbourne's growing suburbs, creating new opportunities for investment and jobs, and managing urban growth.
Funding of $4 million over four years has been allocated for the establishment and operation of the Dandenong Development Board to coordinate local involvement. An additional $6.5 million TEI will be used to target opportunities within designated Transit Cities through land assembly and other measures to facilitate investment.
Better links for regional Victoria
Transport links across regional Victoria will be boosted with a $94 million program, continuing the Government's commitment to modernising and restoring transport services in rural and regional communities.
Initiatives funded in the 2002-03 Budget include:
- •
- $70 million TEI to duplicate the Calder Highway between Kyneton and Faraday;
- •
- $15 million TEI to upgrade major regional roads, including the Bayside Road in Geelong, safety improvements along the Maroondah Highway between Healesville and Narbethong and upgrades along the Henty Highway; and
- •
- $9 million TEI to upgrade the Warrnambool rail line.
In addition, funding of $8 million will be provided over four years for new and enhanced regional bus services that will focus on high demand areas.
Developing Victoria's ports
The Ports Agenda 2001 set the foundation for the Government's integrated approach to growing and enhancing the ports and marine sectors including generating economic benefits to the State through improving access to Victoria's ports. The Government has approved $5.2 million TEI for detailed investigations into a proposal to deepen the shipping channels in Port Phillip Bay to allow access for the world's largest container ships. This will ensure the Port of Melbourne's continued status as Australia's biggest container port, handling 37 per cent of the nation's containerised imports and exports and $60 billion of trade per annum. The investigations will cover technical issues and environmental impacts.
In addition, $5.1 million TEI has been allocated for a rail connection at Lascelles Wharf in Geelong. The initiative will eliminate freight double handling, leading to increased efficiency and reduced costs for regional exporters.
Redeveloping Spencer Street Station
During 2001, the Government announced the redevelopment of Spencer Street Station as a world-class public transport interchange to meet the needs of Victorian, national and international users. This substantial project, with estimated TEI of $200-300 million, will be delivered under the Partnerships Victoria framework and is expected to create around 2 000 jobs during construction. The redevelopment plans include a high-quality passenger rail terminal and infrastructure to facilitate transfers to bus, tram and taxi services and services and amenities to meet the needs of both business travellers and tourists.
The redeveloped Spencer Street Station will significantly improve links and access to Melbourne's central city from outer metropolitan Melbourne and the city's growth corridors, and regional Victoria.
Promoting sustainable development and protecting the environment
The Victorian Government already has in place a number of programs in response to the challenges of sustainable development and protecting the environment.
In conjunction with the Commonwealth Government, the Victorian Government is working on an action plan to address the impact of salinity on the environment and economic growth. Victoria's contribution to the program is expected to be $157 million over seven years.
The Victorian Government has committed $244 million to restore the Snowy River, including $150 million to fund the tripartite $375 million agreement between Victoria, New South Wales and the Commonwealth to restore the Snowy River flows and to improve flows in the rivers in the Kosciuszko National Park and also the River Murray. It is expected that the first increase in environmental flows in the Snowy River will commence this year.
Sustainable Energy Authority Victoria was established in 2000 to ensure Victorians have access to energy efficient choices, programs and rebates. Moreover, the implementation of RESCODE aims to secure the character of local neighbourhoods and make housing more environmentally friendly. The Victorian Government has also committed to the establishment of marine national parks and sanctuaries and the protection of an additional 450 000 hectares of forest through the Regional Forest Agreement process.
To further its commitment to balancing social, economic and environmental goals, the Government will introduce in 2002-03 a range of additional initiatives to progress the Growing Victoria Together objectives of promoting sustainable development and protecting the environment for future generations. These initiatives are designed to value Victoria's forest, water and land resources.
Valuing our resources—forests
Our Forests, Our Future is an $80 million package over the next four years to ensure the long-term future of our forests and regional communities. It comprises initiatives to assist affected workers and communities, to improve information on timber resources, and establish a new timber licensing and pricing system, the Sustainable Timber Industry Council and an assistance program for industry and regional communities, and new institutional arrangements.
Under the new timber licensing and pricing system, all new short and long-term (up to ten-years) licences will be sufficiently flexible to ensure that they remain consistent with the latest sustainable yield and resource data. Furthermore, to ensure a fair return to the State for resources supplied to the industry, licences will be based on market prices.
A Sustainable Timber Industry Council will be established to provide advice on strategic issues affecting industry reform, including supply chain management, occupational health and safety, new products and markets, and plantation establishment and management.
The key elements of the assistance package and new institutional arrangements include a voluntary licence reduction program and a comprehensive workers assistance program. As part of the new institutional arrangements, a new fully commercial forest service entity will be established to transparently disentangle the commercial objectives from the regulatory functions of forest management.
Box-Ironbark forests is a $21 million package over the next four years in response to the Environment Conservation Council's recommendations in relation to Box-Ironbark forests and woodlands. This package includes a structural adjustment package for affected forest industry workers and businesses, and establishment costs for parks, state forests and reserves. The latter involves ongoing public land management, including integrated pest plant and animal management. The package also includes community capacity building and participation and the development of an energy strategy to replace the reliance on firewood from Box-Ironbark forests.
Valuing our resources—water
Improving the health of Victoria's rivers and waterways and effective action to reduce salinity are priority actions in the Government's Growing Victoria Together framework.
These initiatives will generate significant benefits for regional Victoria. Key benefits arise from increasing the security of water supply for domestic, agricultural and recreational purposes and improving the environmental health of our rivers. This will open up opportunities for new industry and high value added agriculture, while safeguarding existing agricultural activities. There will also be opportunities for increased tourism and recreation.
Healthy Rivers is an $11 million package over three years to improve the health of Victoria's rivers. The initiative will make an important contribution to meeting Victoria's commitments under the Council of Australian Governments' water reform framework. The initiative includes:
- •
- the development of regional river health strategies and the improvement of environmental flows in priority stressed rivers;
- •
- complementary works including riparian restoration, fishways enhancement and instream habitat restoration; and
- •
- the enhancement of the Environment Protection Authority's regular monitoring and evaluation of water quality and river health.
The construction of a new Wimmera-Mallee pipeline will provide a more secure and higher quality water supply for domestic and stock use. The Victorian Government's contribution of $77 million TEI over ten years is subject to Commonwealth matching funding and confirmation of the package's feasibility through detailed design. Under this package, a new pipeline to 9 000 service points and 40 towns throughout the Wimmera-Mallee region will replace the existing 17 500 kilometres of open channels. Converting the open channels to a pipeline system will release up to 93 000 megalitres of water for return to the environment, particularly stressed river systems, and potential new developments such as agricultural and mineral sand exploration.
The Government will commit a further $13 million over four years to the Gippsland Lakes rescue package. This initiative, aimed at reducing the severity and occurrence of algal blooms in the Gippsland Lakes, is part of the Government's broader commitment to best practice water resource management across Victoria.
The package will establish the priority areas for nutrient management works, provide incentives for landowners to implement best practice to reduce fertiliser run-off and undertake on-ground works to complement nutrient management works. Further technical and scientific investigation into algal control and a second ocean entrance will also be undertaken. Collectively, these initiatives will enhance Gippsland's water dependent regional fishing, tourism and recreation. It will also be a key element to improved agricultural production.
Valuing our resources—land
The 2002-03 Budget will build on the highly successful Landcare movement which started in Victoria. In 2002-03 the Second Generation Landcare Action Plan will provide $6 million over four years to support the volunteer-based Landcare network. Funding will provide a statewide Landcare Coordinator and nine Regional Landcare Coordinators to implement the ten-year action plan and provide training for volunteers and on-ground project support to Landcare groups. Support for the Landcare network will enable its efforts to be targeted on Victoria's highest priority environmental issues: salinisation of land, water quality, pest animal programs and loss of biodiversity.
Building cohesive communities and reducing inequalities
Growing Victoria Together provides a framework for building cohesive communities and reducing inequalities. Both approaches are important to ensure there is support for families, job opportunities and improved access to affordable, high-quality services. The approach to cohesive communities and reducing inequalities is based on the Government listening to local experience, supporting local connections, providing responsive services and investing in infrastructure which makes communities good places to live and work.
Reducing inequalities and strengthening communities
Within Growing Victoria Together the Government is strongly committed to achieving reconciliation between indigenous and non-indigenous Victorians. The 2002-03 Budget will provide funding for initiatives that target significant areas of indigenous disadvantage identified by Government and the indigenous community.
Building on that investment, the Government is committing additional funding of $12 million over four years to target areas of indigenous disadvantage. The package includes funding for the:
- •
- implementation of an Indigenous Family Violence Strategy, which will support and resource the indigenous community to prevent, reduce and respond to high levels of family violence;
- •
- establishment of a stolen generations organisation to provide a range of counselling, support, self-help and advocacy, family tracing and reunion services; and
- •
- implementation of the Indigenous Community Capacity Building program which aims to increase the stability and effectiveness of local Aboriginal community organisations in strengthening indigenous communities.
As previously mentioned in this chapter, in 2002-03 the Government is also providing funding of $27 million over four years towards initiatives that improve participation and access in preschools and schools, with particular focus on Koori children.
Better places to live and work
In addition to the initiatives aimed at community building and reducing inequality, the Government has committed funding for projects which will make communities better places to live and work.
In 2002-03 the Government will commit $101 million TEI for the redevelopment of the Royal Melbourne Showgrounds at Ascot Vale. The project will secure the future of the Royal Melbourne Show, which will have an increased focus on providing opportunities for agricultural and industry development and promotion. It is expected that the upgraded Showgrounds and continuation of the Show will have significant economic benefits for Victoria, particularly rural and regional areas of the State.
In response to more people using and enjoying Melbourne's waterways, in particular the Yarra River, the revitalized Docklands precinct and the Bayside, the Government is committing funding of $7 million over 2002-03 and 2003-04 for the development of the Sandridge Bridge and the Queensbridge Square, a public space located at the southern end of the bridge. The increased use of Melbourne's waterways means there is a greater need for attractive and safe access. This investment is consistent with the Yarra Plan, announced by the Government in 2001, which envisages that major activities and amenities will be linked by pedestrian and bike paths, water taxi services and public transport.
Funding of up to $50 million TEI will be provided for the redevelopment of the Melbourne Sports and Aquatic Centre. The redevelopment will involve the construction of a 12 000 seat capacity competition pool as well as car parking and leisure water facilities.
Public library resources will be enhanced in 2001-02 by $1.2 million, to be used by the State's local libraries for book purchases. Additional grants will also be provided to each of the country services operated by rural and regional councils.
To enable the Melbourne Museum and the State Library of Victoria to continue to deliver current levels of visitor experience, improved research, new exhibitions and maintenance of state collections, $21 million has been provided over four years. Also as part of the Government's commitment to creating better places to live and work, the 2002-03 Budget will provide $2.7 million over two years to enable the Scienceworks campus of Museum Victoria to refresh and renew a number of its permanent exhibits. Further, to ensure that the community benefits are maximised at the refurbished Heide Museum of Modern Art and at the new Malthouse Plaza complex additional funding of $2.8 million over four years has been provided in the 2002-03 Budget.
Melbourne 2006 Commonwealth Games
The Government is committing funding in 2002-03 to continue the detailed planning and coordination of the Melbourne 2006 Commonwealth Games. Funded initiatives include $10.4 million contribution from the State Government in 2002-03 to the Melbourne 2006 Commonwealth Games Organising Committee (M2006).
Funding for the Commonwealth Games is for 2002-03 only at this stage as the Government, in conjunction with M2006, is currently undertaking a full budget review of the requirements for the Games. The review is expected to be finalised following, and drawing on the experience of, the Commonwealth Games in Manchester to be held in late July 2002.
In addition, funding has been provided in 2001-02 for an upfront payment of the remaining licence fees to the Australian Commonwealth Games Association and the Commonwealth Games Federation. This will meet in full the State's remaining obligations to pay licence fees under the Endorsement and Host City contracts.
Promoting rights and respecting diversity
The Victorian Government recognises that the diverse cultural backgrounds, languages and abilities of Victorians are some of the State's greatest strengths.
The 2002-03 Budget builds on the Government's commitment to support and enhance the role of the Victorian Multicultural Commission through the continuation and expansion of the current Community Grants Program. The program provides support to ethnic and community-based organisations for activities and projects that support the State's culturally and linguistically diverse communities.
In addition, a number of new initiatives will be introduced in 2002-03 to improve access to services for culturally and linguistically diverse Victorians. The Victorian Office of Multicultural Affairs, in consultation with government departments, will be implementing a number of innovations and improvements to the quality and provision of interpreting services for Victorians accessing government services.
Specific initiatives include the establishment of regional and metropolitan TAFE courses to expand the capacity to train accredited interpreters, the piloting of new and innovative technologies in the provision of language services, greater use of bilingual employees and information and awareness projects. A particular emphasis of these initiatives will be on improving language services for rural and regional communities.
CHAPTER 5: BALANCE SHEET MANAGEMENT AND OUTLOOK
- •
- Moody's and Standard and Poor's have both cited Victoria's low debt levels, high degree of financial flexibility, strong fiscal position and the Government's commitment to financial responsibility as the key reasons for Victoria's triple-A credit rating.
- •
- General government net debt (excluding Growing Victoria infrastructure reserve) is forecast to fall by more than half from $4.9 billion or 3.3 per cent of GSP in June 1999 to $2.3 billion or 1.0 per cent of GSP by June 2006.
- •
- General government net financial liabilities (excluding Growing Victoria infrastructure reserve) are expected to fall from $16.3 billion as at June 1999 (10.8 per cent of GSP) to $15.9 billion by June 2006 (7.1 per cent of GSP).
- •
- Unfunded superannuation liabilities, at $12.8 billion in June 2002, represent the State's largest liability. The State has adopted a funding framework with the aim of achieving 100 per cent funding of this liability by 2035.
- •
- The growth in general government assets is expected to average 4.3 per cent per annum between June 2001 and June 2006. As a result, the real capital stock deployed in the general government sector will grow at more than twice the rate of population growth over this period. This underlines the Government's ongoing commitment to building effective infrastructure for delivering improved services and promoting growth across the whole State.
- •
- The Government's Partnerships Victoria policy provides the framework for a whole-of-government approach to the provision of public infrastructure and related ancillary services through public-private partnerships.
- •
- Around $1 billion of Partnerships Victoria projects are in the market, including the Spencer Street Station redevelopment and Berwick Community Hospital, with other projects, including two new prisons, being prepared for market.
ASSET MANAGEMENT STRATEGY
As shown in Chart 5.1, the main component of general government assets is property, equipment and infrastructure. The Government is committed to growing and maintaining a portfolio of assets to enable services to be delivered effectively to the community, and to provide a strong foundation for economic growth across the whole State.
Chart 5.1: General government assets by category as at 30 June
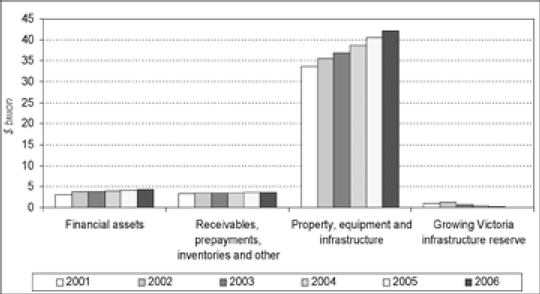
Source: Department of Treasury and Finance
Capital stock
Preserving the level of capital stock used to deliver services is broadly achieved by ensuring that investment in refurbishing and replacing assets is equivalent to the expected depreciation of the asset stock during the year. The Government also plans to pursue growth in the level of the capital stock in order to meet increased demand and to improve the quality of the services provided to the whole community.
Growth in real capital stock of over 11 per cent is expected to more than double the rate of growth in the population over the four years to June 2006. Chart 5.2 shows an increase in real capital stock per capita from $7 223 at June 1999 to $7 901 at June 2006. This reflects the Government's commitment to a major program of infrastructure investment expenditure over this period, with net purchases of fixed assets expected to average approximately $2.2 billion per annum between 2001-02 and 2005-06.
Chart 5.2: Real capital stock per capita as at 30 June
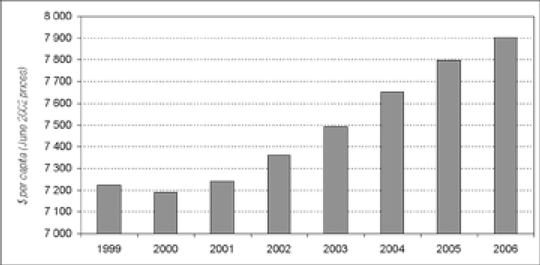
Source: Department of Treasury and Finance
This substantial infrastructure investment program will be funded in part by the Growing Victoria infrastructure reserve. In 2001-02, the Government approved a $400 million addition to the Growing Victoria infrastructure reserve to fund planned future capital projects. The reserve will gradually decline over the forward estimates period, reflecting the drawdown to fund infrastructure investment expenditure over the period, particularly in the areas of transport, education and information and communications technology. The Government's policy is to finance additional asset investment from the budget operating surpluses, or from the Growing Victoria infrastructure reserve, avoiding the need to incur additional borrowings.
The Government has established the Infrastructure Planning Council as a forum for providing advice on the planning and evaluation of the State's infrastructure strategy. This forum, along with government initiatives such as the Partnerships Victoria public-private partnership policy, are being used to drive economic growth and improve service delivery in Victoria through more efficient asset investment.
Partnerships Victoria projects
The Government is committed to maximising the value of infrastructure spending through the responsible use of both public and private sectors. Partnerships Victoria, launched in June 2000, provides the policy for a whole-of-government approach to the provision of public infrastructure and related ancillary services through public-private partnerships and for integrating private sector investment in public infrastructure. The policy focuses on whole-of-life costing and a full consideration of the benefits of risk transfer to private parties.
Where there is the potential to offer enhanced value for money compared to conventional procurement approaches, the Partnerships Victoria framework allows the Government to provide improved services at lower cost. The potential for this is likely to occur in larger projects where there is scope for some or all of the following attributes:
- •
- integration of design, construction, operation and maintenance over the life of an asset, within a single project package;
- •
- significant transfer of risk to the private sector; and
- •
- appropriate third party usage of facilities, either concurrently or 'out-of-hours', thereby reducing net cost to government.
Under Partnerships Victoria, the Government will retain direct control over those core services where it is in the public interest to do so (such as police, government schools and judiciary).
Value for money, rather than capital scarcity or balance sheet treatment, is the driver for use of a Partnerships Victoria approach. Full budget funding will be set aside for non self-funding projects before market interest is formally sought, while some projects are likely to be recorded on the State's balance sheet.
At present, procurement processes are underway for about $1 billion of Partnerships Victoria projects across a range of industry sectors and a number of other projects are being prepared for tender. Projects in the market include:
- •
- Echuca/Rochester Wastewater Treatment Plant—the plant will comply with the necessary Environmental Protection Agency (EPA) standards and will meet anticipated requirements for the next 25 years;
- •
- Enviro Altona—the project involves redevelopment of the existing Altona Wastewater Treatment Plant to enable the plant to meet new EPA standards for discharge into Port Phillip Bay and cater for significant salt loads due to infiltration of the reticulation system;
- •
- Fibre Optic Cable—the project involves rollout of fibre optic cable to regional fast rail destinations;
- •
- Spencer Street redevelopment—the project will deliver a state-of-the-art intermodal hub for passengers on country and metropolitan rail services, trams and regional buses;
- •
- Berwick Community Hospital—the project involves design, construction, finance, and maintenance of hospital accommodation services for the Berwick Community Hospital, while the Government will directly provide patient care services;
- •
- Box Hill Hospital Carpark—the project seeks to engage the private sector to build a new multistorey carpark on the hospital site and operate the new and existing carpark facilities;
- •
- Westgate Container Terminal—the project involves the possible development of a third independent international container terminal in the Port of Melbourne; and
- •
- TV and Film Studio—the project will see a private operator establish a film and TV studio to grow the local industry and attract new productions to Victoria.
Projects being prepared for market include:
- •
- Permanent new prisons—the project involves building, financing and maintaining two new metropolitan men's prisons with the public sector providing custodial services and the private sector providing accommodation and ancillary services;
- •
- Statewide Personnel Alerting System (SPAS)—the project is a multi-agency initiative to equip career and volunteer emergency services personnel throughout Victoria with alerting devices;
- •
- Mobile Data Network (MDN)—the project involves equipping emergency services vehicles with data terminals. The equipment will enable automated dispatch and onscreen vehicle location, as well as providing personnel with remote data access from their vehicles; and
- •
- Metropolitan Mobile Radio—the project is an initiative to replace and modernise radio infrastructure for metropolitan police officers and vehicles.
Composition of capital stock
Chart 5.3 shows the composition of general government sector non-financial assets for 2002-03.
Chart 5.3: Property, equipment and infrastructure projected for 30 June 2003
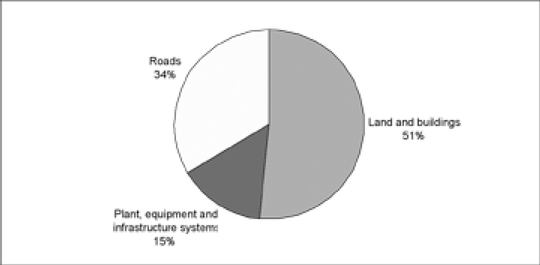
Source: Department of Treasury and Finance
Physical infrastructure, including land and buildings, plant and equipment and roads, accounts for the majority of general government non-financial assets. The value of infrastructure assets is expected to grow strongly over the forecast period, from $33.7 billion as at June 2001 to $42.2 billion by June 2006.
Land and buildings are projected to account for the largest proportion of Victorian general government infrastructure assets ($19.0 billion in June 2003 or 51 per cent), followed by roads ($12.4 billion in June 2003 or 34 per cent) and other plant, equipment and infrastructure systems ($5.5 billion in June 2003 or 15 per cent).
As shown in Table 5.4, annual growth in non-current physical assets averaging around 4.5 per cent is expected. This rate indicates the net change in the asset base after allowing for additions to, and disposals of, assets.
LIABILITY MANAGEMENT STRATEGY
The main components of general government liabilities are debt and unfunded superannuation associated with the defined benefit schemes of the State Superannuation Fund (SSF).
The Government is committed to maintaining net financial liabilities at prudent levels. Moody's Investors Service and Standard and Poor's rating agencies have both cited Victoria's exceptionally low debt levels, high degree of financial flexibility, strong fiscal position and the Government's commitment to financial responsibility as the key reasons for Victoria's triple-A credit rating.
The budget and forward estimates assume future cash resources are held as financial assets, thereby reducing net debt. The application of these financial assets to reducing liabilities by debt repayment or reducing unfunded superannuation will be based on the economic return to the State and market opportunities at the time. Chart 5.4 shows the trend of general government liabilities over the forward estimates period by category.
Chart 5.4: General government sector liabilities by category as at 30 June
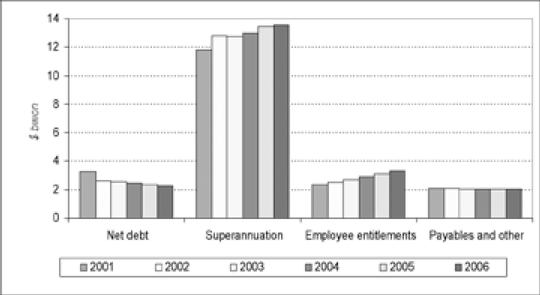
Source: Department of Treasury and Finance
Note:
- (a)
- Net debt is gross debt less liquid financial assets (excluding Growing Victoria infrastructure reserve).
Debt
General government gross debt is expected to be $6.3 billion at June 2002 and remain stable over the forecast period. Management of the general government debt portfolio continues to be based on the key objectives of achieving relative certainty of interest costs, while minimising borrowing costs and refinancing risk, and managing the financial and operational risks of the general government sector treasury operations in a prudent manner. The debt portfolio is primarily comprised of a fixed rate borrowing facility from Treasury Corporation of Victoria, with an evenly spread maturity profile. This ensures that a relatively small proportion of the debt portfolio is subject to repricing and hence uncertainty in any one period.The standard measure used to assess state government indebtedness is non-financial public sector net debt, as defined in the Uniform Presentation Framework and reported in Appendix E, Uniform Presentation of Government Finance Statistics. Under this framework, net debt is determined by deducting liquid financial assets from gross borrowings. The rationale for deducting liquid financial assets is that in a period of financial difficulty they would be readily available to redeem debt. Following this logic, Growing Victoria financial assets are not deducted from net debt, as these assets have been earmarked and, in many cases, committed to infrastructure projects.
The budget forecasts include an assumption that all future cash surpluses are held as financial assets. Given this, general government sector net debt (excluding Growing Victoria infrastructure reserve) is projected to fall from $4.9 billion as at June 1999 to $2.6 billion at June 2002 and further to $2.3 billion as at June 2006 (see Table 5.1).
General government sector net debt to GSP is also expected to decline from 3.3 per cent in 1998-99 to 1.0 per cent in 2005-06. The general government debt-servicing ratio is projected to decline from 3.6 per cent in 1998-99 to 1.8 per cent in 2005-06 (see Table 5.4).
Chart 5.5 shows the reduction in both general government net debt and non-financial public sector net debt in dollar terms and as a percentage of GSP over the forecast period.
Table 5.1: General government net debt and non-financial public sector (excluding Growing Victoria) as at 30 June(a)
| | 1999 Actual | 2000 Actual | 2001 Actual | 2002 Revised | 2003 Budget | 2004 Estimate | 2005 Estimate | 2006 Estimate | ||||||||
|---|---|---|---|---|---|---|---|---|---|---|---|---|---|---|---|---|
| | ($ billion) | |||||||||||||||
| General government net debt | 4.9 | 3.9 | 3.3 | 2.6 | 2.5 | 2.5 | 2.4 | 2.3 | ||||||||
| Non-financial public sector net debt (b) | 6.1 | 4.2 | 4.6 | 4.1 | 4.4 | 4.3 | 4.2 | 4.1 | ||||||||
| General government net debt to GSP | 3.3 | 2.5 | 1.9 | 1.4 | 1.3 | 1.2 | 1.1 | 1.0 | ||||||||
| Non-financial public sector net debt to GSP(b) | 4.0 | 2.6 | 2.7 | 2.3 | 2.3 | 2.1 | 2.0 | 1.8 | ||||||||
Source: Department of Treasury and Finance
- Note:
- (a)
- Growing Victoria investments are excluded as an offset to gross debt on grounds that these investments are earmarked for infrastructure projects and are therefore not available to redeem gross debt.
- (b)
- Non-financial public sector net debt is the sum of general government net debt plus public non-financial corporations net debt, less inter-sector transactions. As public non-financial corporations data is not available for the years 2003-04 to 2005-06, the data for this sector has been assumed to be constant from the year 2002-03.
Chart 5.5: General government net debt and non-financial public sector net debt (excluding Growing Victoria) as at 30 June
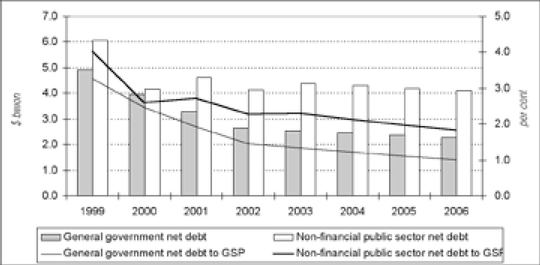
Source: Department of Treasury and Finance
Unfunded superannuation liabilities
Unfunded superannuation is the most significant liability on the State's balance sheet. At 30 June 2002, the State's unfunded superannuation liability is projected to be $12.8 billion.
The unfunded liability of Victoria's superannuation schemes represents the present value of future benefits that members have already accrued that are not covered by fund assets. The prior service costs are being funded by an annual payment determined on the basis of actuarial advice that is consistent with the Government's aim of 100 per cent funding of the State's unfunded superannuation liabilities by 2035.
The superannuation liabilities reported in the general government sector's balance sheet exclude the Commonwealth's share of unfunded superannuation liabilities reported by universities. (The Commonwealth is responsible for funding the majority of superannuation liabilities associated with universities.)
The fund actuary estimates that the unfunded superannuation liability will grow to $13.6 billion on a nominal basis by June 2006 (6.1 per cent of GSP). This represents an average annual growth rate of 1.9 per cent. The level of unfunded superannuation liabilities is expected to peak at $13.9 billion in 2011. However, Chart 5.6 shows the level of unfunded liabilities, measured in real terms (June 2002 dollars), is expected to fall as the impact of previous policy changes takes effect.
Chart 5.6: General government sector unfunded superannuation liabilities—long-term projections
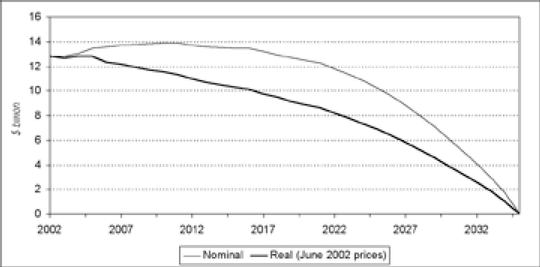
Source: Department of Treasury and Finance
The Beneficiary Choice Program was implemented during 2001 and provided:
- •
- SSF pensioners with a one-off opportunity to commute half or all of their pensions to a lump sum;
- •
- SSF deferred benefit members with the opportunity to convert their deferred pension benefit entitlement to a lump sum to be rolled over into a fund of their choice; and
- •
- pensioners whose pensions were administered by the Emergency Services Superannuation Board with a one-off opportunity to commute their pensions to a lump sum.
In addition, the program introduced changes to fund rules expanding the commutation options of those who become eligible for pensions or deferred benefits in the future.
Overall, 35 per cent of pensioners took the opportunity to commute half or all of their pension to a lump sum with 25 per cent opting for full commutation. Approximately 29 per cent of deferred beneficiaries took the opportunity to commute their deferred benefit to a present lump sum that was then transferred to a superannuation fund of their choice.
These take-up rates exceeded expectations. Prior to the commencement of the program, the actuary estimated that a take-up rate in the order of 20 per cent might be expected (based on the results of similar previous commutation programs in other jurisdictions).
The actuary has estimated that all other things being equal, the program reduced unfunded liabilities by $538 million. As lump sum payments were made in several tranches spanning 30 June 2001, $368 million of this amount was recognised in the 2000-01 financial year, with the balance of $170 million to be recognised in 2001-02.
In addition, the program increased the Emergency Services Superannuation Scheme's surplus by $43 million. As this scheme was already in surplus, this increase has no immediate effect on the State's reported financial position or performance.
Net financial liabilities
The Government is committed to maintaining net financial liabilities (net debt and unfunded superannuation liabilities) at prudent levels in order to maintain Victoria's triple-A credit rating. Table 5.2 shows projected general government net financial liabilities for the period from June 2001 to June 2006.
Table 5.2: General government net financial liabilities as at 30 June(a)
| | 2001 Actual | 2002 Revised | 2003 Budget | 2004 Estimate | 2005 Estimate | 2006 Estimate | ||||||
|---|---|---|---|---|---|---|---|---|---|---|---|---|
| | ($ billion) | |||||||||||
| Financial assets | ||||||||||||
| Cash and deposits | 0.9 | 0.9 | 0.9 | 1.0 | 1.0 | 1.0 | ||||||
| Advances paid | 0.3 | 0.3 | 0.3 | 0.2 | 0.2 | 0.1 | ||||||
| Investments, loans and placements | 2.2 | 2.9 | 2.9 | 3.0 | 3.2 | 3.3 | ||||||
| Growing Victoria | 1.1 | 1.3 | 0.7 | 0.3 | 0.1 | 0.0 | ||||||
| Total | 4.5 | 5.3 | 4.8 | 4.5 | 4.4 | 4.4 | ||||||
| Financial liabilities | ||||||||||||
| Deposits held | 0.3 | 0.3 | 0.3 | 0.3 | 0.3 | 0.3 | ||||||
| Advances received | 0.0 | 0.0 | 0.0 | 0.0 | 0.0 | 0.0 | ||||||
| Borrowings | 6.4 | 6.3 | 6.3 | 6.3 | 6.3 | 6.3 | ||||||
| Total | 6.7 | 6.6 | 6.6 | 6.6 | 6.6 | 6.6 | ||||||
| Net debt | 2.2 | 1.3 | 1.8 | 2.2 | 2.2 | 2.3 | ||||||
| Net debt (excl. Growing Victoria) | 3.3 | 2.6 | 2.5 | 2.5 | 2.4 | 2.3 | ||||||
| Unfunded superannuation | 11.8 | 12.8 | 12.8 | 13.0 | 13.5 | 13.6 | ||||||
| Net financial liabilities | 14.0 | 14.1 | 14.6 | 15.1 | 15.7 | 15.9 | ||||||
| Net financial liabilities (excl. Growing Victoria) | 15.1 | 15.4 | 15.3 | 15.4 | 15.8 | 15.9 | ||||||
| Net financial liabilities to GSP (excl. Growing Victoria) — % | 8.8 | 8.5 | 8.0 | 7.6 | 7.4 | 7.1 | ||||||
Source: Department of Treasury and Finance
- Note:
- (a)
- This table is based on Table E.4, General government sector balance sheet, in Appendix E. Totals may not add due to rounding.
General government net financial liabilities (excluding Growing Victoria infrastructure reserve) are projected to decrease from $16.3 billion as at June 1999 to $15.4 billion at June 2002 and $15.9 billion as at June 2006. The latter movement is a result of the forecast increase in unfunded superannuation liabilities. As a percentage of GSP, net financial liabilities are forecast to decline from 10.8 per cent as at June 1999 to 7.1 per cent as at June 2006 (see Chart 5.7).
Chart 5.7: General government net financial liabilities as at 30 June
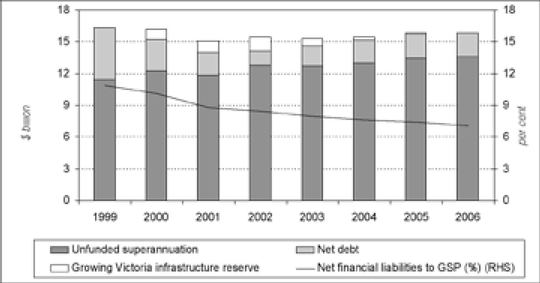
Source: Department of Treasury and Finance
Note:
- (a)
- Net debt equals net debt (excluding Growing Victoria infrastructure reserve) plus Growing Victoria infrastructure reserve.
Chart 5.8 shows that the ratio of Victoria's net financial liabilities to GSP (as reported by the ABS) compares favourably with other triple-A rated States such as New South Wales and Western Australia.
Chart 5.8: Comparison of general government net financial liabilities to GSP as at 30 June and current Australian state ratings
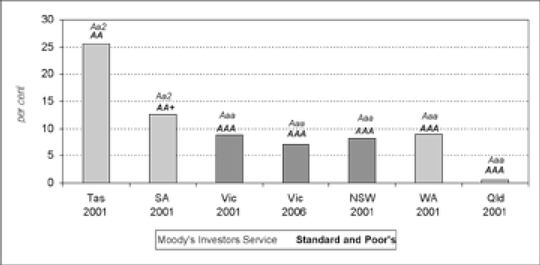
Source: Department of Treasury and Finance
NET ASSETS
The estimated statement of financial position in Table 5.3 shows an increase in general government net assets from $18.6 billion as at June 2001 to $24.8 billion as at June 2006. The projected $6.2 billion growth in net assets over this period primarily reflects the projected operating surpluses over the forward estimates period.
Table 5.3: General government sector statement of financial position as at 30 June
| | 2001 Actual | 2002 Revised | 2003 Budget | 2004 Estimate | 2005 Estimate | 2006 Estimate | ||||||
|---|---|---|---|---|---|---|---|---|---|---|---|---|
| | ($ billion) | |||||||||||
| Assets | ||||||||||||
| Financial assets(a) | 3.1 | 3.7 | 3.8 | 4.0 | 4.1 | 4.3 | ||||||
| Receivables, prepayments, inventories and other | 3.3 | 3.4 | 3.5 | 3.5 | 3.5 | 3.6 | ||||||
| Property, equipment and infrastructure | 33.7 | 35.4 | 36.9 | 38.7 | 40.5 | 42.2 | ||||||
| Growing Victoria infrastructure reserve(b) | 1.1 | 1.3 | 0.7 | 0.3 | 0.1 | 0.0 | ||||||
| Total assets | 41.2 | 43.8 | 44.9 | 46.5 | 48.3 | 50.0 | ||||||
| Liabilities | ||||||||||||
| Borrowings | 6.4 | 6.3 | 6.3 | 6.3 | 6.3 | 6.3 | ||||||
| Superannuation | 11.8 | 12.8 | 12.8 | 13.0 | 13.5 | 13.6 | ||||||
| Other liabilities | 4.4 | 4.6 | 4.8 | 5.0 | 5.2 | 5.4 | ||||||
| Total liabilities | 22.6 | 23.7 | 23.8 | 24.2 | 24.9 | 25.3 | ||||||
| Net assets | 18.6 | 20.1 | 21.1 | 22.3 | 23.4 | 24.8 | ||||||
Source: Department of Treasury and Finance
Notes:
- (a)
- Financial assets include cash assets, and other financial assets. It does not include the Growing Victoria infrastructure reserve, which is currently invested in financial assets.
- (b)
- Growing Victoria infrastructure reserve is earmarked for physical asset investment and therefore treated as non-financial.
Over the forward estimates period, the growth in total assets is expected to average 4.3 per cent per annum between June 2001 and June 2006. This anticipated increase in total assets reflects increased investment and the Government's ongoing commitment to delivering improved services, and promoting growth across the whole State. Total general government liabilities are projected to increase from $22.6 billion at June 2001 to $25.3 billion at June 2006, averaging growth of 2.0 per cent per annum over the same period. As a percentage of total assets, total liabilities are projected to decline from 54.9 per cent as at June 2001 to 50.5 per cent by June 2006.
Gearing ratios (or indebtedness in terms of borrowings or liabilities to total assets or to GSP) of the general government sector are projected to decrease over the forward estimates period, as a result of the application of budget surpluses to financial assets (see Table 5.4 below). Declines are also projected in the ratios of total and long-term borrowings to total assets, and total borrowings to GSP for the general government sector.
Table 5.4: Indicators of financial condition—general government
| | 2000-01 Actual | 2001-02 Revised | 2002-03 Budget | 2003-04 Estimate | 2004-05 Estimate | 2005-06 Estimate | ||||||
|---|---|---|---|---|---|---|---|---|---|---|---|---|
| Gearing ratios | ||||||||||||
| Long-term borrowings to total assets | 15.1 | 14.2 | 13.8 | 13.3 | 12.8 | 12.4 | ||||||
| Total borrowings to total assets | 15.4 | 14.4 | 14.0 | 13.5 | 13.0 | 12.6 | ||||||
| Unfunded superannuation liabilities to total assets | 28.7 | 29.3 | 28.4 | 27.9 | 27.9 | 27.2 | ||||||
| Total liabilities to total assets | 54.9 | 54.1 | 53.0 | 52.1 | 51.6 | 50.5 | ||||||
| Long-term borrowings to GSP | 3.6 | 3.4 | 3.2 | 3.1 | 2.9 | 2.8 | ||||||
| Total borrowings to GSP | 3.7 | 3.5 | 3.3 | 3.1 | 3.0 | 2.8 | ||||||
| Unfunded superannuation to GSP | 6.9 | 7.0 | 6.6 | 6.4 | 6.3 | 6.1 | ||||||
| Total liabilities to GSP | 13.2 | 13.0 | 12.4 | 12.0 | 11.7 | 11.3 | ||||||
Debt servicing ratios | ||||||||||||
| Borrowing costs to total revenue | 2.5 | 2.0 | 2.0 | 1.9 | 1.9 | 1.8 | ||||||
| Superannuation expenses to total revenue | 6.0 | 8.2 | 6.8 | 6.7 | 6.7 | 6.6 | ||||||
| Superannuation expenses and borrowing costs to total revenue | 8.6 | 10.2 | 8.7 | 8.6 | 8.6 | 8.4 | ||||||
Capital stock ratios | ||||||||||||
| Growth in non-current physical assets | 3.8 | 4.9 | 4.4 | 4.9 | 4.6 | 4.2 | ||||||
| Asset investment to non-current physical assets | n/a | 5.7 | 5.2 | 5.6 | 5.3 | 4.9 |
Source: Department of Treasury and Finance
- •
- The general government operating surplus is sensitive to a range of economic and financial developments.
- •
- Key economic risks include uncertainties associated with international economic growth, potential inflationary pressures due to strong domestic demand, and changes in net interstate migration patterns.
- •
- Key financial uncertainties include variations in equity, property and bond markets.
- •
- Changes in economic activity, inflation and wages impact on the general government operating surplus through taxation and grants revenue and departmental expenses.
- •
- Variations in equity, property and bond markets affect the operating surplus through their impact on investment income, taxation revenue and changes to unfunded superannuation liabilities.
- •
- A number of contingent liabilities have been identified.
ECONOMIC RISKS
The main risks to the Victorian economic projections stem from international developments and other risks to the national economy from which Victoria would not be immune. Specific to Victoria is the risk that population growth may vary due to unexpected changes in net interstate migration patterns.
The balance of risks to the global economic outlook appears to have changed slightly over 2002, from weaker growth prospects post-11 September to the risk that growth may surprise on the upside. Underpinned by significant monetary policy stimulus, the US economy has shown signs of recovery since late 2001, as have the economies of Asia (excluding Japan) and Europe. Under this scenario, demand for Victorian exports could be stronger than expected, although it is also likely that global interest rates would be higher.
However, the risk still remains that the global recovery will not be sustained or that the rebound will not be as strong as financial markets are anticipating. This would limit the scope for a rise in Victoria's overseas exports and have implications for global equity markets, although it would also reduce pressure on interest rates. Changes in global economic growth also have implications for Victoria via the impact on national economic growth prospects and hence interstate demand for Victorian output.
The strong growth in domestic demand over the past year appears to have placed some upward pressure on consumer prices. If the strength in domestic demand continues, aided by a strong global economy, there is the risk of further pressure on prices and the potential for a flow through to higher wage claims. This could result in interest rates being higher and economic growth lower than would otherwise occur.
The Victorian population projections assume net interstate migration gains stabilise at 2 000 persons per annum over the forecast period. This is below the gains recorded in the past three years, but well above the average net loss of 10 000 persons per annum recorded over the past two decades. A change in net interstate migration of 10 000 persons per annum in either direction would, other things equal, change Victoria's annual population and GSP growth by around 0.25 percentage points.
Potentially mitigating these adverse risks is the likelihood of only limited further downside to the Australian dollar, which will ease some pressure on consumer prices and hence interest rates.
SENSITIVITY OF THE BUDGET TO ECONOMIC CONDITIONS
The importance of these economic risks can be gauged by the sensitivity of the budget to changes in economic conditions. This section shows the sensitivity of the general government operating surplus to changes in key economic and financial indicators.
Sensitivity analysis
The sensitivity analysis estimates the impact on revenue, expenses and the operating surplus of an increase in selected economic and financial indicators, and in so doing, indicates the risk associated with the forecasts or projections of each variable. The major variables that affect Victoria's operating surplus are economic growth, employment, prices, wages, interest rates and volatility within asset markets.
To assess sensitivity to change, the level of the economic indicator, in each case, is permanently increased by 1 percentage point in the first year (above the forecasts detailed in Chapter 3, Economic Conditions and Outlook), and is then reverted back to the forecast growth rate. It is assumed during the analysis of each indicator that all others follow their forecast growth rates.
Table 6.1 shows the full-year impact, beginning 2002-03, of this 1 percentage point increase in each indicator on the general government operating surplus over a four-year period.
Table 6.1: Impact on the general government operating surplus of a 1 percentage point increase in selected economic indicators in 2002-03(a)
| | 2002-03 | 2003-04 | 2004-05 | 2005-06 | |||||
|---|---|---|---|---|---|---|---|---|---|
| | ($ million) | ||||||||
| GSP | |||||||||
| Taxes, regulatory fees and fines | 25 | 27 | 28 | 28 | |||||
| Other revenue | 18 | 21 | 23 | 24 | |||||
| Superannuation expenses | — | — | — | — | |||||
| Other expenses | — | 1 | 2 | 1 | |||||
| Operating surplus | 43 | 47 | 49 | 51 | |||||
Employment | |||||||||
| Taxes, regulatory fees and fines | 27 | 28 | 30 | 31 | |||||
| Other revenue | 1 | 2 | 4 | 6 | |||||
| Superannuation expenses | — | — | — | — | |||||
| Other expenses | — | — | — | — | |||||
| Operating surplus | 28 | 30 | 34 | 37 | |||||
Consumer prices | |||||||||
| Taxes, regulatory fees and fines | 26 | 27 | 28 | 28 | |||||
| Other revenue | 122 | 130 | 138 | 148 | |||||
| Superannuation expenses | 95 | — | — | — | |||||
| Other expenses | 57 | 56 | 57 | 58 | |||||
| Operating surplus | -4 | 101 | 110 | 119 | |||||
Average weekly earnings(b) | |||||||||
| Taxes, regulatory fees and fines | 27 | 27 | 29 | 30 | |||||
| Other revenue | -16 | -21 | -12 | -17 | |||||
| Superannuation expenses | 58 | 8 | 9 | 9 | |||||
| Other expenses | 87 | 91 | 93 | 96 | |||||
| Operating surplus | -135 | -92 | -85 | -92 | |||||
Share prices | |||||||||
| Taxes, regulatory fees and fines | — | — | — | — | |||||
| Other revenue | 8 | 9 | 1 | 2 | |||||
| Superannuation expenses | -41 | -3 | -3 | -3 | |||||
| Other expenses | — | — | — | — | |||||
| Operating surplus | 49 | 12 | 4 | 4 | |||||
Property prices (volumes)(c) | |||||||||
| Taxes, regulatory fees and fines | 24 | (17) | 21 | (15) | 29 | (14) | 30 | (15) | |
| Other revenue | 2 | (—) | 3 | (1) | 4 | (2) | 5 | (3) | |
| Superannuation expenses | -6 | (—) | — | (—) | — | (—) | — | (—) | |
| Other expenses | — | (—) | — | (—) | — | (—) | — | (—) | |
| Operating surplus | 32 | (18) | 24 | (17) | 33 | (16) | 36 | (18) | |
Interest rates(d) | |||||||||
| Taxes, regulatory fees and fines | — | — | — | — | |||||
| Other revenue | 89 | 93 | 44 | 47 | |||||
| Superannuation expenses | 42 | — | — | — | |||||
| Other expenses | 3 | 7 | 12 | 17 | |||||
| Operating surplus | 45 | 86 | 32 | 30 | |||||
Source: Department of Treasury and Finance
Notes:
- (a)
- A positive number for taxes, regulatory fees and fines, and other revenue denotes an increase in revenue. A positive number for superannuation expenses and other expenses denotes an increase in expenses (and hence a reduction in the operating surplus). A positive number for the operating surplus denotes an improvement in the operating surplus. Numbers may not balance due to rounding.
- (b)
- Assumes wages of Victorian Government employees also increase by 1 per cent above what was expected.
- (c)
- Numbers in brackets represent the impact of 1 per cent change in property volumes holding property prices constant.
- (d)
- Assumes a 1 percentage point increase in interest rates over the entire period.
Sensitivity to economic growth
An assumed 1 per cent increase in GSP is estimated to increase the operating surplus by $43 million in 2002-03, growing to $51 million by 2005-06. The majority of this increase is due to a rise in a broad range of taxation receipts resulting from the heightened level of economic activity.
There is little impact on the combined level of GST grants and transitional assistance during this period as any resulting increase in GST grants to Victoria would be largely offset by a reduction in transitional assistance (as the estimated level of revenue forgone is not increased by variations in GSP).
Sensitivity to employment growth
Employment growth directly affects the operating surplus through its impact on payroll tax revenue. A 1 per cent rise in employment above forecast growth is estimated to increase the operating surplus by $28 million in 2002-03, growing to $37 million by 2005-06.
Sensitivity to prices
A 1 per cent rise in the level of consumer prices is estimated to result in substantial rises in revenue. Combined GST grants and transitional assistance will be raised by an increase in prices, as a number of components of estimated forgone revenue (principally financial assistance grants and safety net revenues) are raised by higher inflation. Other sources of revenue likely to rise (albeit to a lesser extent) include gambling taxes and revenue from sales of goods and services. Nevertheless, there is estimated to be almost no impact on the operating surplus in 2002-03 as there is a large offsetting one-off increase in superannuation expenses due to the impact of the CPI on the present value of deferred pensions and benefits in the State Superannuation Fund.
However, in subsequent years the CPI rise will have a positive influence on the operating position. This is because a number of revenue sources (including some taxes, grants and sales of goods and services) are more sensitive to inflation than is departmental expenditure.
The sensitivity of the operating result to variations in inflation has reduced since the 2001-02 Budget due to a less price sensitive superannuation expense component of the operating surplus. This is a result of a large take up of the Government's beneficiary choice program which has reduced superannuation pension liabilities, the component of the liability most sensitive to inflation.
Sensitivity to wages
As with an increase in prices, a 1 per cent rise in the level of wages also has a substantial one-off increase in the net unfunded superannuation liability, and as a result, the operating surplus would be reduced by $135 million in 2002-03.
A one-off wage rise would have an ongoing substantial negative impact on the operating surplus, as a rise in departmental salary and superannuation expenses, combined with a reduction in dividends payments received (primarily from a reduction in the value of assets held by the Transport Accident Commission), is only partly offset by an increase in payroll tax receipts.
Sensitivity to share prices
In aggregate, it is estimated that a 1 per cent rise in both domestic and international equity prices would improve the 2002-03 operating surplus by $49 million, with the benefit then falling to only $4 million in the fourth year. The initial improvement arises from a reduction in superannuation expenses due to a gain in the value of assets held by the State Superannuation Fund (and hence reduction in the unfunded liability), and increases in the receipt of dividend payments (largely a result of gains in the value of assets held by the Transport Accident Commission).
Sensitivity to property prices and volumes
A 1 per cent increase in property prices is estimated to improve the operating surplus by $32 million in 2002-03, falling to $24 million in the next year before rising over the ensuing two years.
The rise in property prices (assuming a constant number of property transfers) would increase conveyancing, land transfer and mortgage stamp duty receipts by $24 million in 2002-03. In addition, the improvement in 2002-03 would be boosted by a one-off decrease in superannuation expenses resulting from a rise in the value of superannuation fund property asset holdings.
Revenues are less sensitive to the volume of property transfers. A 1 per cent rise in the number of property transfers (holding prices constant) would increase receipts from property taxes and the operating surplus by $18 million in 2002-03.
Sensitivity to interest rates
A 1 per cent rise in interest rates (over what is already assumed in the yield curve) increases the operating surplus by $45 million in 2002-03. This is due primarily to an increase in interest revenue (from general government financial assets), and higher dividends received as a result of a reduction in the Transport Accident Commission claims liabilities emanating from higher discount factors (assuming an unchanged dividend payout ratio).
However, this positive impact is partly offset in 2002-03 by a one-off increase in superannuation expenses arising from a reduction in the value of fixed interest assets held by the State Superannuation Fund.
Over the remaining forward estimates period, the rate rise has a net positive impact on the operating position, as the increased interest revenue from the general government financial assets offsets higher general government sector borrowing costs and reduced dividend payments from various public authorities exposed to increased debt servicing costs.
The interest rate sensitivity of interest revenue is greater than the sensitivity of borrowing costs as a result of a larger proportion of the general government financial assets (on which interest revenue is calculated) being exposed in the year of the interest rate shock than general government debt (on which borrowing costs are calculated). This is because the average duration of general government financial assets is around 31/2 years, compared with around 10 years for general government debt.
The interest rate sensitivity of the surplus has increased significantly since the 2001-02 Budget largely because there is now a higher base level of general government financial assets, compared with last budget, on which the sensitivity of interest revenue is calculated. The higher level of general government financial assets is a result of the Government's policy of investing cash surpluses into financial assets.
Variability of economic indicators
In interpreting the estimates in Table 6.1, it is worth noting that historically, some of the economic indicators listed have been more volatile than others. In particular, although variations in GSP and employment growth, wage and consumer price inflation, and interest rates have been broadly similar since the mid-1980s, property and share markets have been considerably more volatile (see Chart 6.1).
Chart 6.1: Comparison of volatility of economic parameters(a)
Source: Department of Treasury and Finance
Note:
- (a)
- Annual percentage growth on preceding year.
In combination with the outcomes of the sensitivity analysis, these results suggest:
- •
- share prices, due to their inherent volatility, are likely to be a major source of variation in the operating surplus in the year in which they occur;
- •
- property prices, like share prices, are also relatively volatile. Although their initial impact on the operating surplus is smaller than that of share prices, property prices have a more substantial ongoing impact;
- •
- interest rate fluctuations will also have a significant impact on the operating surplus. However, due to the comparative lack of volatility in interest rates, this variable poses little risk to the outlook;
- •
- fluctuations in economic activity (GSP and employment) and wages are also likely to be a major source of variation in the operating surplus, over the entire forward estimates period, not just in the first year; and
- •
- variations in inflation rates are likely to have a significant impact on the operating surplus after the first year (although they are not volatile and pose little risk to the outlook).
EXPENDITURE AND REVENUE RISKS
There are a number of general risks, such as unforeseen changes in the size and structure of the Victorian population, which can impact on the expenditure outlook. These risks can be classified into those that affect all government departments and those that are department specific.
A government-wide factor that has the potential to increase general expenditures above those allowed for in the forward estimates is unplanned increases in award wage costs.
The main risks to specific departmental expenditures relate to growth in demand for key services and the modernisation of assets. Examples of these types of impacts include emerging pressures related to the need to maintain government schools and TAFE institutes.
The 2002-03 Budget and forward estimates include a contingency provision to allow for the likelihood that some of these department-specific and government-wide expenditure risks will be realised during the budget year or over the course of the outlook period. The contingency provision includes a general allowance for:
- •
- the impact of planned award wage increases, consistent with government policy, on departmental operating costs;
- •
- growth in Victoria's population, and from it, derived demand for government services;
- •
- asset investment funding to be allocated in future budgets to meet emerging needs; and
- •
- other expenditure risks which are unforseen or not able to be quantified at the time of construction of the budget estimates.
The inclusion of a contingency provision in the budget estimates serves to mitigate the potential impact of expenditure risks on the overall budget position. Realised expenditure risks will only impact on total expenditure and the overall budget position to the extent that they cannot be accommodated within the contingency provision built into the budget estimates.
Significant events that could represent a call on this contingency provision and/or impact on the total budget expenditure forecasts are detailed below.
Commonwealth Games
Melbourne will be hosting the 2006 Commonwealth Games and the State has an obligation under the Endorsement and Host City contracts to underwrite the Games. The Government has committed to undertake a full budget review of the requirements for the Games and this review is expected to be finalised following, and drawing on the experience of, the 2002 Commonwealth Games in Manchester. The level of support provided by Commonwealth and local governments will also affect the net cost to the State Government.
Public transport franchise arrangements
In February 2002, the Government and the rail franchisees reached an interim agreement that brought an increased level of certainty and stability to Victoria's rail businesses. Since then the Government is continuing to work with the rail franchisees on possible business recovery proposals to grow patronage and revenue, ensuring an appropriate level of service is provided to passengers.
Roads
Roads of National Importance are funded on a 50:50 basis between state and Commonwealth governments. Depending on the size and timing of announcements made by the Commonwealth, the Victorian Government may be required to provide matching funding for road construction and operating expenditure.
Gas industry dividends
No dividends from the gas industry have been incorporated in the 2002-03 Budget estimates. However, negotiations are underway on the resolution of commercial contractual matters arising from the deferral of full retail contestability in the Victorian gas market. It was originally envisaged that full retail contestability in the Victorian gas market would occur on 1 September 2001. However, due to delays with the finalisation of proposed business rules and the availability of systems and procedures, full retail contestability is now expected in the second half of 2002. Any further dividends from the gas industry are dependent on the resolution of these commercial contractual matters.
CONTINGENT LIABILITIES
Contingent liabilities represent circumstances under which there is a possibility, due to some future event or situation, the outcome of which is uncertain, that an actual liability could arise. Quantifiable contingent liabilities are set out in Table 6.2.
Quantifiable contingent liabilities
Table 6.2: General government quantifiable contingent liabilities at 30 June
| | 2000 | 2001 | ||
|---|---|---|---|---|
| | ($ million) | |||
| Guarantees and indemnities | 254.1 | 218.8 | ||
| Legal proceedings and disputes | 111.9 | 166.5 | ||
| Other | 791.7 | 722.3 | ||
| Non-general government debt | 2 629.6 | 2 638.7 | ||
| Total contingent liabilities | 3 787.3 | 3 746.3 | ||
Source: Department of Treasury and Finance
Guarantees and indemnities comprise specific guarantees and indemnities under statute in respect of Co-operative Housing Societies Guarantees, Co-operative Housing Indemnities and Co-operatives (General). In addition, the category includes other guarantees for loans under statute.
The category "Legal proceedings and disputes" includes contingent liabilities that arise from legal disputes or legal claims made on departments and agencies.
The largest quantifiable contingent liability item, in the "Other" category, relates to a commercial arrangement for the provision of correctional services beyond an initial five-year contract period amount. The State has the option to re-tender for the provision of correctional services every three years, after the initial five-year period for each contract. Therefore, payments for the provision of services beyond the current tender period are treated as a contingent liability rather than a contractual commitment.
Non-general government debt relates to loans, guaranteed by the Treasurer of Victoria, to agencies outside of the general government sector. Treasury Corporation of Victoria has provided most of these loans to metropolitan water companies, and other participating authorities.
Non-quantifiable contingent liabilities
A number of potential obligations, which are non-quantifiable at this time, have been made by the Government arising from:
- •
- indemnities provided in relation to transactions, including financial arrangements and consultancy services, as well as for directors and administrators;
- •
- performance guarantees, warranties, letters of comfort, and the like;
- •
- deeds in respect of certain obligations of the Docklands Authority; and
- •
- unclaimed moneys which may be subject to future claims by the general public against the State.
Asset sales
There are potential exposures associated with the sale of a number of assets and services where the purchaser was provided with various indemnities and warranties.
Commonwealth Games
In winning the bid to host the 2006 Commonwealth Games in Melbourne, the State entered into two contracts:
- •
- Endorsement Contract with the Australian Commonwealth Games Association; and
- •
- Host City Contract with the Commonwealth Games Federation.
Subsequent to winning the rights to host the Games, the Government established the Melbourne 2006 Commonwealth Games Pty Ltd (M2006) as the Organising Committee for the Games with the Premier as the single shareholder. An agreement between the State and the company provides the basis for funding the company from 2001 to 2007.
Under the Endorsement Contract, the State is obliged to underwrite any shortfall between revenue and expenditure of the Organising Committee for the organisation of the Games. The State has also agreed to buy out the Association's marketing and fundraising rights under the Joint Marketing Program.
The Host City Contract specifies the rights and obligations of the Organising Committee in relation to organising the Games. The contract also includes the licence fee payable for broadcast and sponsorship rights and the commitment the State gave in its bid document to offer travel grants to competitors and team officials attending the Games. Also under this contract, any remaining surplus resulting from the Games after the Organising Committee has discharged all financial commitments and other obligations, is to be transferred to the Association. This surplus is, in turn, required to be paid to the State to be used for the benefit of sport in Victoria.
M2006 has an agreement with Nine Network Australia Pty Ltd in relation to broadcast rights to the Games for Australia and Papua New Guinea. The agreement includes certain force majeure and major change provisions, which may be invoked in certain circumstances. M2006 has obtained insurance against the risk of these circumstances arising and resulting in payments becoming refundable to the Nine Network.
Automated ticketing
In May 1994, the Public Transport Corporation (PTC) entered into contracts with the OneLink Consortium to provide automated ticketing and fare collection services to the PTC for its metropolitan public transport services over a period of ten years ending in 2007. Payments under the Automated Ticketing Service Contract will be in the order of $300 million over the term of the contract, on a performance basis. This amount does not include any additional payments relating to variations to the system which have been, or may be, implemented under this contract.
The Treasurer of Victoria has guaranteed the payment obligations of the PTC under the terms of the Service Contract. As a result of the restructuring of the public transport system, it is proposed that the rights and obligations of the PTC under the Service Contract are to be transferred to a corporation named Revenue Clearing House Pty Ltd (RCH). The shareholders of RCH are the franchisees of the passenger transport businesses and the Secretary of the Department of Infrastructure, on behalf of the private bus operators. Contract assignment from the PTC to RCH has not yet occurred. However, RCH currently manages the Service Contract on behalf of the PTC under an interim arrangement. After assignment, it is proposed that the Treasurer will guarantee the payment obligations of RCH under the Service Contract.
In April 2000, OneLink Transit Systems Pty Ltd (OLT) lodged a claim under the Consolidated Service Contract claiming that the scope of the automatic ticketing project was increased during the period between the signing of the contract in May 1994 and September 1995. The amount of the claim is $132 million plus $17 million per annum for ongoing maintenance of the equipment. Negotiations in relation to this claim are continuing.
Land remediation—environmental concerns
A number of properties have been identified as potentially contaminated sites. The State does not admit any liability in respect of these sites. However, remedial expenditure may be incurred to restore the sites to an acceptable environmental standard in the event of future developments taking place.
Melbourne City Link
The key arrangements for Melbourne City Link are set out in the Concession Deed, which has effect from 20 October 1995.
Under the arrangements as set out in the Concession Deed and the legislation, the State is responsible for acquiring and paying for the land necessary for the project to proceed, paying for certain state works and general project costs. It is also subject to certain compensation claims in the event that it can be shown that Transurban's revenue has been adversely affected by state actions.
While virtually all land has been acquired, the final compensation payable is subject to resolution in some instances. The balance of the state works will be funded by underspent funds carried forward from the 2000-01 year.
There is currently an outstanding claim from Transurban relating to an alleged "Appendix Event" and leading to a Material Adverse Event claim from Transurban in relation to the construction of Wurundjeri Way and widening of the Westgate Freeway. This claim is currently being handled by the documented dispute resolution processes and the Department of Infrastructure is managing the claim for the State.
As regards to compensation for land acquisitions, some matters remain in the negotiation/determination phase in an effort to agree the ultimate level of compensation for the acquisitions.
In accordance with the Melbourne City Link (Miscellaneous Amendments) Act 2000, the Melbourne City Link Authority was abolished on 28 February 2002 and all responsibilities and functions were transferred to the Department of Infrastructure.
Public Transport Corporation lease arrangements
Under various transport lease arrangements made by the PTC, the Treasurer of Victoria has indemnified the lessors against adverse tax rulings and third party personal injury claims, where the third party is injured by the operation of the equipment during the period of the lease. The last of these lease arrangements was terminated by June 1998. The normal statute of limitations is five years for tax claims and six years for personal injury claims.
Public transport rail franchise agreements
During 1999-2000 the Director of Public Transport, on behalf of the Crown, entered into contractual arrangements with franchisees to operate passenger rail transport services in the State. The following summarises the major contingent liabilities arising from those arrangements.
Contingent liabilities on early termination or expiry of franchise agreements
New rolling stock lease direct agreements: As part of the franchising arrangements, the franchisee of each passenger rail business has undertaken to provide new rolling stock. Each franchisee is expected to enter into a lease with a third party lessor with respect to this rolling stock. In addition, the Director is expected to enter into rolling stock direct agreements with the respective lessors to protect the State's interest in the rolling stock. In the event of expiry or on early termination of the franchises the Director can either exercise a right to acquire the new rolling stock at predetermined values or the lease payment obligations are transferred to the Director or a successor franchisee. At 31 March 2002, four of the five required rolling stock direct agreements have been entered into. The contingent liability of the Director to take over the lease payments only commences upon delivery of the units of new rolling stock. A total of 24 units of new rolling stock have been delivered as at 31 March 2002.
Other direct agreements: The Director is also party to a number of other direct agreements with the providers of key services to franchisees in respect of carrying out their operations. The intention of these agreements is that in the event of a "Step-in Event' occurring or on early termination or expiry of a franchise that the key services will be (at the option of the Director), continued by the providers for the Director or his nominee under the same terms and conditions as the original contract where the Director or his nominee assumes the rights and obligations of the original franchisee.
Payments on termination: On termination of the franchise agreements by expiry or otherwise the Director will have a liability:
- •
- to pay for certain assets and liabilities on the basis set out in the agreements. If on termination there is a net liability, then franchisees will pay the Director; and
- •
- for termination value payments in respect of designated rolling stock improvements and capital projects (estimated contingent liability at 31 March 2002 of $42 million).
Contingent liability offsets on early termination of franchise agreements
With respect to any additional costs arising to the Director on the early termination of a franchise, the franchisee must indemnify the Director for any losses, damages or costs incurred by him as a result of the early termination. If the franchisee does not do so, the Director has the right to draw on the franchisee's performance bond for the amount of those losses, damages or costs. These bonds total $235 million as at 31 March 2002 as a result new initiatives announced by the Victorian Government to the franchisees on 26 February 2002.
The Director also has a fixed and floating charge over franchisee assets as security for amounts payable by franchisees.
Contingent liabilities arising from potential changes to existing conditions
Change in Victorian law: Franchisees may make a claim against the Director for any net losses incurred as a result of a change in Victorian law which directly relates to the franchise business.
Latent defects: If a latent defect is identified in any part of the infrastructure which has been leased to the franchisees, and the cost of rectifying the defect is in excess of a threshold amount, then the Director will indemnify the franchisee for the amount by which the cost of the works to rectify the defect exceeds the threshold amount.
Pre-existing contamination: The Director has indemnified franchisees from and against all losses, damages, liabilities, actions, suits, claims, demands, costs and expenses of every kind arising from a failure by the Director to clean up the land as defined in the infrastructure leases entered into with franchisees.
Native Title: The Director is liable for payments of any valid compensation claim to native title holders made under the Native Title Act 1993or other laws relating to native and aboriginal title in respect of the land as defined in the infrastructure leases entered into with franchisees.
Net gain and net loss provisions: On the occurrence of certain events specified in the franchise agreements, including the undertaking of infrastructure works by the State, the franchisees may make a claim against the Director if the franchisee incurs a net loss as a result of those events. The Director also has the right to claim against the franchisees any net gain as a result of those events.
Other
A number of minor contractual issues are being addressed in ongoing negotiations between the Director of Public Transport and the franchisees.
Contingent liabilities relating to the Department of Infrastructure as bus industry representative
The Secretary of the Department is a shareholder in the Revenue Clearing House Pty Ltd (RCH) and VicTrip Pty Ltd as the appointed representative of route bus operators with whom the Department has a bus service contract.
The RCH Shareholders Agreement and the VicTrip Shareholders Agreement contain several clauses which mean that the State (along with the franchisees) will become liable for additional capital requirements for the RCH and VicTrip to remain solvent and any losses suffered by the RCH and VicTrip.
The MetCard Management Agreement with the RCH contains several clauses in the agreement which mean that the State (along with the franchisees) will become liable for any shortfalls suffered by the RCH in specific circumstances.
Native Title
A number of claims have been filed with the Federal Court under the Native Title Act 1993 that affect Victoria. While many such claims are being processed through the legal system, the Government has committed itself to resolving claims through mediation, where possible. It is not feasible at this time to quantify any future liability.
Victorian Managed Insurance Authority (VMIA)
VMIA was established in 1996 as a captive insurer for departments and participating bodies (predominantly general government sector). VMIA provides its client bodies with a range of insurance cover, including for property, public and products liability, professional indemnity and contract works. VMIA re-insures in the private market for losses above $50 million arising out of any one event, up to a maximum for each type of cover (e.g. $1 250 million for property and $750 million for public liability). The risk of losses above these re-insured levels is borne by the State.
Gas supply incident
The State, and a number of its instrumentalities, have been named as parties in a class action before the Supreme Court arising from the explosion and fire in September 1998 at Esso's gas processing plant at Longford.
Transmission of business under Section 149 of the Workplace Relations Act 1996
Contractors now performing government functions have sometimes engaged staff on lesser rates and conditions than those that previously applied under awards for public sector employees. This matter specifically involves hospital employees.
Federal Court decisions have indicated that previous award rates and conditions may apply to the contractor's employees in that situation. The application of this principle requires transfer of part of the business (of the Government) and the test that is generally applied is whether there is a "substantial identity" between the activities before and after the outsourcing. If applicable, the principle would generally cause increases in employment costs for the contractor.
Following an appeal by the State of Victoria, the High Court has referred the case to mediation outside of court. Pending the outcome relating to hospital employees, there may be widespread application for the State. The financial implications remain unclear.
HIH Insurance
The State's quantifiable direct exposures arising from the collapse of the HIH Insurance Group are included in the liabilities shown in the financial statements of the agencies directly responsible for them (such as the Victorian WorkCover Authority and VMIA), and are consolidated in the financial statements of the State.
The State's obligations in respect of its builders' warranty insurance rescue package are direct liabilities of the State itself. They do not form part of the liabilities of Housing Guarantee Fund Limited, which manages claims on behalf of the State.
The State also retains some unquantifiable contingent exposures arising from the collapse. These contingent exposures arise primarily through the possibility that the State may be involved in litigation in which it would be entitled to recover damages from third parties. If these third parties were insured by HIH, recovery in full may not be possible.
Builders' warranty
The builders' warranty insurance market, like other insurance markets, has been affected by the 11 September 2001 terrorist attacks in the United States and adverse claims experience. In mid-April 2002, the State agreed to provide temporary (to 30 June 2002) re-insurance support to builders' warranty insurance provider Dexta Corporation following the withdrawal of some of its commercial re-insurance support. The State will receive re-insurance premiums for this participation, and will be required to contribute to payment of re-insured claims, as well as paying management fees. The precise timing and value of these receipts and payments is uncertain, as claims may be made by home owners for up to 61/2 years after the arrangement ceases.
Details of the arrangements had not been finalised at the time of preparation of these budget papers, and receipts and payments will be contingent on the volume of insurance underwritten and re-insured by 30 June 2002. Based on Dexta's previous levels of activity, the central estimate of the State's gross exposure (i.e. before premium receipts) is not more than $3 million. While the State expects, like the commercial re-insurers who are party to the agreement, to at least break even on these arrangements, the State retains an unquantifiable contingent liability that claims may exceed the central estimate.
As part of the agreement between the State and the insurance industry on revisions to the builders' warranty product, the State may assume further contingent liabilities in relation to builders' warranty insurance. However, no formal arrangements have yet been concluded.
Gambling/gaming licences
In 1994, the State sold TABCORP Holdings Limited (TABCORP) a wagering and gambling licence for $597 million. The Gaming and Betting Act 1994 requires the State to provide in 2012 a refund to TABCORP of an amount equal to the licence value of the former licences or the premium payment paid by the new licensee, whichever is the lesser. While this creates an obligation on the State to refund the licence value to TABCORP, it will be offset by the premium payment from the issue of any new licences.
In 1992, a gaming operator's licence was issued to the Trustees of the Will and Estate of the late George Adams (the licensee). The Gaming Machine Control Act 1991 entitles the licensee to be paid, at the end of its current licence period in 2012, an amount equal to the value of its current licence or the premium payment paid by the new licensee, whichever is the lesser. This entitlement is contingent on the licensee not being granted a new licence.
CHAPTER 7: ESTIMATED FINANCIAL STATEMENTS AND NOTES
INTRODUCTION
The Estimated Financial Statements in this chapter have been prepared in accordance with the provisions in the Financial Management Act 1994. This Act requires the Estimated Financial Statements to be based on generally accepted accounting principles (GAAP) and to be consistent with the Financial Policy Objectives and Strategies Statement (see Chapter 1).
The purpose of the Estimated Financial Statements is to set out the forecast financial results for the Victorian general government (budget) sector. Because of the prospective nature of these statements they reflect a number of professional judgements about the most likely operating and financial conditions for the Victorian general government (budget) sector.
The accompanying notes to the Estimated Financial Statements provide details of material economic and other assumptions used and the specific forecast assumptions underlying material items in the financial statements. A number of these assumptions are subject to inherent uncertainties, which are outside the control of the Government.
The Auditor-General's review was conducted to ensure that the Estimated Financial Statements:
- •
- have been prepared on a basis consistent with the accounting policies on which they are stated to be based;
- •
- are consistent with the Government's key financial measure;
- •
- have been prepared on the basis of the economic assumptions stated in the accompanying notes to the statements; and
- •
- employ assumptions that are determined using methodology that is reasonable.
The Auditor-General's Report on the Estimated Financial Statements can be found at the end of this chapter.
ESTIMATED FINANCIAL STATEMENTS FOR THE VICTORIAN GENERAL GOVERNMENT (BUDGET) SECTOR
Table 7.1: Estimated statement of financial performance for the year ending 30 June
| | Note | 2002-03 Budget | 2003-04 Estimate | 2004-05 Estimate | 2005-06 Estimate | |||||
|---|---|---|---|---|---|---|---|---|---|---|
| | | ($ million) | ||||||||
| Revenue from ordinary activities | ||||||||||
| Taxation | 2 | 8 802.7 | 8 926.7 | 9 101.7 | 9 281.6 | |||||
| Fines and regulatory fees | 554.0 | 556.6 | 579.1 | 577.1 | ||||||
| Investment revenue | 3 | 1 061.6 | 991.9 | 1 017.7 | 1 056.8 | |||||
| Grants revenue | 4 | 11 753.5 | 12 072.2 | 12 462.5 | 13 070.9 | |||||
| Sale of goods and services | 2 049.9 | 2 082.4 | 2 113.5 | 2 146.1 | ||||||
| Gains/(losses) on the disposal of physical assets | 19.6 | 12.9 | 13.0 | 13.2 | ||||||
| Fair value of assets received free of charge | 1.1 | 1.1 | 6.2 | 1.2 | ||||||
| Inter sector capital asset charge | 501.0 | 514.0 | 514.0 | 514.0 | ||||||
| Other revenue | 538.3 | 530.8 | 570.8 | 511.7 | ||||||
| Total revenue | 25 281.7 | 25 688.6 | 26 378.4 | 27 172.5 | ||||||
| Expenses from ordinary activities | ||||||||||
| Employee entitlements | 9 041.5 | 9 386.0 | 9 687.6 | 10 001.3 | ||||||
| Superannuation | 1 713.1 | 1 725.3 | 1 765.9 | 1 804.3 | ||||||
| Depreciation | 5 | 952.2 | 1 002.7 | 1 067.0 | 1 115.1 | |||||
| Amortisation | 6 | 70.6 | 65.4 | 65.3 | 65.4 | |||||
| Borrowing costs | 7 | 495.2 | 494.6 | 492.1 | 488.4 | |||||
| Grants and transfer payments | 8 | 4 118.9 | 4 001.1 | 4 017.2 | 4 077.2 | |||||
| Supplies and services | 8 299.9 | 8 363.9 | 8 694.1 | 8 840.0 | ||||||
| Other expenses | 68.6 | 69.6 | 71.9 | 68.8 | ||||||
| Total expenses | 9 | 24 760.0 | 25 108.6 | 25 861.1 | 26 460.6 | |||||
| Net result | 521.8 | 580.0 | 517.3 | 711.9 | ||||||
Movements in asset revaluation reserve | 737.8 | 768.6 | 800.6 | 833.8 | ||||||
| Total changes in equity other than contributions to other sectors by the State in its capacity as owner | 1 259.6 | 1 348.6 | 1 317.9 | 1 545.7 | ||||||
The accompanying notes form part of these Estimated Financial Statements.
Table 7.2: Estimated statement of financial position as at 30 June
| | Note | 2003 Budget | 2004 Estimate | 2005 Estimate | 2006 Estimate | |||||
|---|---|---|---|---|---|---|---|---|---|---|
| | ($ million) | |||||||||
| Current assets | ||||||||||
| Cash assets | 912.8 | 960.4 | 973.6 | 987.7 | ||||||
| Other financial assets | 1 219.1 | 1 238.5 | 1 266.5 | 1 294.4 | ||||||
| Receivables | 1 084.5 | 1 165.3 | 1 236.3 | 1 307.6 | ||||||
| Prepayments | 37.0 | 37.1 | 37.1 | 37.1 | ||||||
| Inventories | 163.9 | 163.9 | 164.0 | 164.0 | ||||||
| Other assets | 13 | 0.1 | 0.1 | 0.1 | 0.1 | |||||
| Total current assets | 3 417.4 | 3 565.3 | 3 677.6 | 3 790.9 | ||||||
| Non-current assets | ||||||||||
| Other financial assets | 2 418.4 | 2 080.8 | 2 015.1 | 1 981.8 | ||||||
| Receivables | 248.4 | 196.3 | 164.3 | 141.7 | ||||||
| Inventories | 135.0 | 135.0 | 135.0 | 135.0 | ||||||
| Property, plant and equipment | 10 | 23 921.6 | 25 264.6 | 26 539.3 | 27 726.7 | |||||
| Roads and earthworks | 11 | 12 996.0 | 13 468.4 | 13 952.0 | 14 444.7 | |||||
| Other assets | 13 | 1 794.2 | 1 814.0 | 1 819.9 | 1 823.2 | |||||
| Total non-current assets | 41 513.7 | 42 959.2 | 44 625.7 | 46 253.1 | ||||||
| Total assets | 44 931.1 | 46 524.4 | 48 303.3 | 50 044.0 | ||||||
| Current liabilities | ||||||||||
| Payables | 1 154.7 | 1 162.2 | 1 171.1 | 1 180.0 | ||||||
| Interest-bearing liabilities | 85.5 | 89.2 | 102.6 | 118.5 | ||||||
| Employee entitlements | 14 | 826.6 | 873.2 | 904.0 | 934.6 | |||||
| Superannuation | 15 | 990.1 | 713.9 | 487.7 | 866.4 | |||||
| Other liabilities | 531.1 | 513.7 | 512.3 | 511.0 | ||||||
| Total current liabilities | 3 588.0 | 3 352.2 | 3 177.6 | 3 610.6 | ||||||
Non-current liabilities | ||||||||||
| Payables | 8.6 | 8.5 | 8.4 | 8.3 | ||||||
| Interest-bearing liabilities | 6 215.8 | 6 208.0 | 6 200.1 | 6 189.8 | ||||||
| Employee entitlements | 14 | 1 879.4 | 2 047.1 | 2 226.5 | 2 410.4 | |||||
| Superannuation | 15 | 11 771.0 | 12 274.9 | 12 974.4 | 12 727.2 | |||||
| Other liabilities | 358.5 | 348.7 | 337.9 | 326.2 | ||||||
| Total non-current liabilities | 20 233.4 | 20 887.2 | 21 747.3 | 21 661.9 | ||||||
| Total liabilities | 23 821.4 | 24 239.4 | 24 924.9 | 25 272.5 | ||||||
| Net assets | 21 109.8 | 22 285.1 | 23 378.4 | 24 771.5 | ||||||
| Equity | ||||||||||
| Retained earnings | — | 13 918.8 | 14 267.3 | 14 622.7 | 14 987.4 | |||||
| Reserves | 6 669.2 | 7 437.8 | 8 238.4 | 9 072.1 | ||||||
| Net result for year | 521.8 | 580.0 | 517.3 | 711.9 | ||||||
| Total equity | 16 | 21 109.8 | 22 285.1 | 23 378.4 | 24 771.5 | |||||
The accompanying notes form part of these Estimated Financial Statements.
Table 7.3: Estimated statement of cash flows for the year ending 30 June
| | Note | 2002-03 Budget | 2003-04 Estimate | 2004-05 Estimate | 2005-06 Estimate | ||||||
|---|---|---|---|---|---|---|---|---|---|---|---|
| | | ($ million) | |||||||||
| Cash flows from operating activities | |||||||||||
| Receipts | |||||||||||
| Taxation | 8 788.0 | 8 911.1 | 9 084.8 | 9 259.2 | |||||||
| Fines and regulatory fees | 429.6 | 430.5 | 450.1 | 451.4 | |||||||
| Grants | 11 752.0 | 12 072.2 | 12 462.5 | 13 070.9 | |||||||
| Sale of goods and services | 2 052.0 | 2 077.8 | 2 110.6 | 2 143.4 | |||||||
| Interest received | 338.1 | 316.7 | 320.4 | 334.0 | |||||||
| Dividends received | 406.5 | 356.8 | 367.3 | 377.1 | |||||||
| Capital asset charge received | 501.0 | 514.0 | 514.0 | 514.0 | |||||||
| Other receipts | 842.4 | 817.9 | 877.1 | 831.9 | |||||||
| Total receipts | 25 109.6 | 25 497.0 | 26 186.8 | 26 982.0 | |||||||
| Payments | |||||||||||
| Employee entitlements | 8 844.4 | 9 171.8 | 9 477.4 | 9 786.8 | |||||||
| Superannuation | 1 757.9 | 1 497.7 | 1 292.7 | 1 672.6 | |||||||
| Grants and transfer payments | 4 117.2 | 3 999.4 | 4 015.5 | 4 075.5 | |||||||
| Supplies and services | 8 308.3 | 8 371.9 | 8 684.6 | 8 830.2 | |||||||
| Interest paid | 479.3 | 479.0 | 477.4 | 475.9 | |||||||
| Other payments | 6.0 | 6.2 | 6.4 | 6.7 | |||||||
| Total payments | 23 513.1 | 23 526.0 | 23 954.0 | 24 847.7 | |||||||
| Net cash flows from operating activities | 17 | 1 596.5 | 1 971.0 | 2 232.8 | 2 134.4 | ||||||
| Cash flows from investing activities | |||||||||||
| Net customer loans repaid | 1.8 | 67.6 | 48.8 | 44.8 | |||||||
| Net disposal/(purchase) of investments | 518.6 | 318.1 | 37.6 | 5.3 | |||||||
| Net contribution to other sectors of government | 1B | (218.0 | ) | (173.3 | ) | (224.6 | ) | (152.6 | ) | ||
| Proceeds from sale of property, plant and equipment | 79.2 | 62.5 | 54.0 | 49.3 | |||||||
| Purchases of property, plant and equipment | (1 927.3 | ) | (2 181.3 | ) | (2 128.9 | ) | (2 063.1 | ) | |||
| Net cash flows from investing activities | (1 545.6 | ) | (1 906.4 | ) | (2 213.1 | ) | (2 116.4 | ) | |||
Cash flows from financing activities | |||||||||||
| Net repayments of borrowings | (19.0 | ) | (17.6 | ) | (5.8 | ) | (2.9 | ) | |||
| Net cash flows from financing activities | (19.0 | ) | (17.6 | ) | (5.8 | ) | (2.9 | ) | |||
Net increase in cash and deposits held | 31.9 | 47.0 | 13.9 | 15.1 | |||||||
| Cash at beginning of reporting period | 877.5 | 909.4 | 956.4 | 970.3 | |||||||
| Cash and deposits at end of reporting period | 909.4 | 956.4 | 970.3 | 985.4 | |||||||
The accompanying notes form part of these Estimated Financial Statements.
NOTES TO THE ESTIMATED FINANCIAL STATEMENTS
Due to the possibility that circumstances or events outlined in the Estimated Financial Statements may not occur as expected, actual results may differ from those forecast and the difference may be material. Accordingly, no guarantee is given that the financial results will be achieved. However, the best professional judgement has been applied in preparing the Estimated Financial Statements.
Table of contents
| Assumptions | ||||
Note 1: | Statement of significant accounting policies and forecast assumptions | |||
Note 2: | Taxation | |||
Note 3: | Investment revenue | |||
Note 4: | Grants revenue | |||
Note 5: | Depreciation | |||
Note 6: | Amortisation | |||
Note 7: | Borrowing costs | |||
Note 8: | Grants and transfer payments | |||
Note 9: | Total expenses from ordinary activities by Department | |||
Note 10: | Property, plant, equipment and infrastructure systems | |||
Note 11: | Roads and earthworks | |||
Note 12: | Reconciliation of movements in fixed assets(a) | |||
Note 13: | Other assets | |||
Note 14: | Employee entitlements | |||
Note 15: | Superannuation | |||
Note 16: | Reconciliation of changes in equity | |||
Note 17: | Cash flow information | |||
Note 18: | General government (budget) sector entities |
Assumptions
The Estimated Financial Statements have been prepared using the material economic and other assumptions listed below.
Material economic and other assumptions(a)
| | 2002-03 | 2003-04 | 2004-05 | 2005-06 | ||||
|---|---|---|---|---|---|---|---|---|
| Gross state product | 3.50 | 3.50 | 3.50 | 3.50 | ||||
| Employment | 1.50 | 1.50 | 1.50 | 1.50 | ||||
| Consumer price index | 2.25 | 2.25 | 2.25 | 2.25 | ||||
| Wage cost index(b) | 3.50 | 3.50 | 3.50 | 3.50 | ||||
| Population(c) | 1.00 | 1.00 | 0.90 | 0.90 |
Source: Australian Bureau of Statistics, Department of Treasury and Finance
Notes:
- (a)
- Year-average per cent change on previous year unless otherwise indicated. All projections apart from population are rounded to the nearest 0.25 percentage point.
- (b)
- Total hourly rate excluding bonuses and Superannuation Guarantee Levy.
- (c)
- June quarter, per cent change on previous June quarter. Based on ABS Series R projections.
Economic risks
The material economic and other assumptions and specific forecast assumptions underlying the material items in the Estimated Financial Statements are subject to uncertainties, all of which are beyond the control of the Government. The Department of Treasury and Finance has identified a number of risks to the Victorian economic outlook.
The main uncertainties to the Victorian economic outlook stem from:
- •
- the global recovery not being sustained, which would limit the scope for a rise in Victoria's overseas exports and potentially reduce demand for Victorian goods in interstate markets due to weaker national growth prospects;
- •
- the risk that continued strength in domestic demand could place upward pressure on consumer prices, with the potential for a flow through to higher wage claims and, hence, interest rates being higher and economic growth lower than would otherwise be the case; and
- •
- the impact on gross state product from adverse movements in population growth.
These potential adverse impacts may be mitigated by:
- •
- the stimulus to global growth prospects from current low global interest rate settings; and
- •
- the likelihood of only limited further downside to the Australian dollar, which will ease some pressure on consumer prices and hence interest rates.
Key financial measure
The Government has set out its key financial measure in the Financial Policy Objectives and Strategies Statement. The key financial measure of a substantial budget operating surplus (referred to as "net result' in the statement of financial performance) is expected to be achieved throughout the forecast period.
| Fiscal target | ||
| Key financial measure | Target | |
| Maintain a substantial budget sector operating surplus | At least $100 million |
Sensitivity analysis
The estimates of revenue, expenses and the budget sector's operating surplus have been subject to sensitivity analysis by the Department of Treasury and Finance.
The Department's analysis shows that if there was a 1 per cent rise in each of the following key economic variables, the budget's operating position over the forward estimates period would change as follows:
Impact of a 1 percentage point increase in the economic variable on the budget operating surplus(a)
| | 2002-03 | 2003-04 | 2004-05 | 2005-06 | ||||
|---|---|---|---|---|---|---|---|---|
| | ($ million) | |||||||
| Gross state product | 43 | 47 | 49 | 51 | ||||
| Employment | 28 | 30 | 34 | 37 | ||||
| Consumer prices | -4 | 101 | 110 | 119 | ||||
| Average weekly earnings | -135 | -92 | -85 | -92 | ||||
| Share prices | 49 | 12 | 4 | 4 | ||||
| Property prices | 32 | 24 | 33 | 36 | ||||
| Property volumes | 18 | 17 | 16 | 18 | ||||
| Interest rates | 45 | 86 | 32 | 30 | ||||
Source: Department of Treasury and Finance
Note:
- (a)
- A positive number denotes an improvement in the operating surplus.
Note 1: Statement of significant accounting policies and forecast assumptions
In order to assist in understanding the financial information presented, the following summary presents the significant accounting policies and forecast assumptions which have been adopted in preparing and presenting the Estimated Financial Statements for the forecast period (which includes the budget year and the estimates for the three subsequent years).
A. Compliance framework
These Estimated Financial Statements have been prepared in accordance with sections 23H—23N of the Financial Management Act 1994 (the FMA) and are based on Australian GAAP. In accordance with the FMA, the information presented in the Estimated Financial Statements take into account Government decisions and other circumstances that may have a material effect on the statements.
In accordance with Australian GAAP, all applicable Australian Accounting Standards (AAS) have been applied in the preparation and presentation of the Estimated Financial Statements. However, as there is no specific AAS or other Australian authoritative pronouncements on the preparation and presentation of prospective financial statements, AAS6 Accounting Policies permits the application of pronouncements of other national accounting standard setting bodies. Because Australian and New Zealand accounting standards are closely harmonised, the major requirements of New Zealand Financial Reporting Standard (FRS29) Prospective Financial Information have been applied in presenting the Estimated Financial Statements. The requirements of FRS29 have been modified to achieve presentation consistency with AAS1 Statement of Financial Performance, AAS36 Statement of Financial Position and AAS37 Financial Report Presentation and Disclosures.
Future reporting basis
The Financial Management Act 1994 requires the identification of the reporting basis on which subsequent government financial reports will be prepared.
Future Estimated Financial Statements are expected to be prepared on a consistent basis, except for any changes in reporting required by new or revised Australian Accounting Standards.
B. Basis of accounting and measurement
The accrual basis of accounting has been employed in the preparation of the Estimated Financial Statements whereby assets, liabilities, equity, revenues and expenses are recognised in the reporting period to which they relate, regardless of when cash is received or paid.
The actual (audited) opening balances as at 30 June 2001 are based on either a cost or a fair value basis. Those items measured at valuation include:
- •
- non-current physical assets which are reassessed with sufficient regularity to ensure that the carrying amount does not differ from its fair value;
- •
- investments and productive trees in commercial native forests which are recognised at their net market value; and
- •
- certain liabilities (e.g. unfunded superannuation) which are calculated with regard to actuarial assessment.
The estimated impact of future revaluations of non-current physical assets is included in the forecasts at the total general government level.
Liabilities other than those actuarially determined do not include the impact of revaluations due to the inherent difficulties in identifying and forecasting these amounts.
Change in accounting policy for contributed capital
In previous reporting periods up to 30 June 2001, the following items were recognised as revenues and expenses in the statement of financial performance:
- •
- assets received free of charge from other government sectors, and
- •
- grants paid to other sectors of government for capital purposes.
For the reporting period ending 30 June 2002, these transactions between wholly-owned public sector entities, which are designated by the Government as additions to and divestment of net assets, are not recognised as revenues and expenses and are only recognised in the estimated statement of cash flows as contributions to/from other sectors of government.
This change in accounting policy for transfers of assets and liabilities is in compliance with the accounting requirements of Urgent Issues Group Abstract 38 'Contributions by Owners Made to Wholly-Owned Public Sector Entities' and the Accounting and Financial Reporting Bulletin No. 39 'Accounting for Contributed Capital', issued under authority of the FMA 1994.
As a result of this change in accounting policy, $177.2 million was recognised as an adjustment to net assets in the budget reporting period.
C. Basis of consolidation
The Estimated Financial Statements include all reporting entities in the Victorian general government (budget) sector, which is a sector of the State of Victoria reporting entity. Entities in the public non-financial corporations and public financial corporations sectors are not consolidated as the intent of the Estimated Financial Statements is to convey the financial performance, position and cash flows of the general government (budget) sector alone.
In reporting on the general government (budget) sector, all material inter-agency transactions and balances are eliminated. In addition, all capital transactions between the general government sector and the public non-financial corporations and public financial corporations sectors are eliminated in the Estimated Statement of Financial Position.
D. Forecast reporting periods
The reporting period for the general government (budget) sector is the year ending 30 June. However, for those entities with a reporting period other than the year ending 30 June, the latest audited financial statements since that date are used as the basis of the opening balance for 1 July 2002. For example, TAFE institutes have reporting periods ending 31 December.
E. Revenues
Taxation
Accounting policy
Budget sector taxation and fee revenue is recognised upon the earlier of either the receipt by the State of a taxpayer's self-assessment or the time the taxpayer's obligation to pay arises, pursuant to the issue of an assessment.
The types of revenue included in the estimates are as follows:
- •
- payroll tax;
- •
- land tax;
- •
- stamp duties—including conveyancing, land transfers, and mortgages;
- •
- bank accounts debit tax;
- •
- gambling taxes—including private lotteries, electronic gaming machines, casino and racing;
- •
- insurance duty—compulsory third party, life and non-life; and
- •
- motor vehicle taxes—registration fees, stamp duty and driver licence fees.
Forecast assumption
The state's tax revenues are forecast by a process, which involves:
- •
- assessment of demand and supply conditions in the markets from which the taxes are sourced (e.g. in the case of payroll tax, assessment of employment and wages outlooks; in the case of motor vehicle fees, assessment of the outlook for demand for cars reflecting long-term underlying demand factors and cyclical demand factors);
- •
- analysis of historical information and relationships using econometric and other statistical methods;
- •
- application of the Department of Treasury and Finance's economic forecasts where there is a relationship between taxation variables and economic variables; and
- •
- consultation with private sector economists, industry associations, and relevant government authorities (e.g. State Revenue Office, Vic Roads, Office of Gambling Regulation).
Some State taxes are sourced from tax bases, which are particularly volatile, hence, tax revenue from these sources is subject to substantial annual variation. Stamp duty on land transfers and mortgages are clear examples of this.
Regulatory fees and fines
Accounting policy
Revenue is recognised at the time the fine or regulatory fee is issued.
Forecast assumption
The forecasts of regulatory fees and fines are prepared by those government agencies which collect them. Some of the components may be based on contractual obligations, while the prediction of fines involves assessment of the behaviour of people on the roads and elsewhere. The estimation of the many small, miscellaneous fees is based on an assessment of recent experience in each of the markets.
Investment revenue
Accounting policy
This revenue category includes interest, dividends, income tax and rate equivalent revenue and other revenue earned during the financial year from bank term deposits, shares and other investments. Interest revenue is recognised on an accrual basis and dividend income is recognised when dividends are determined. Net realised and unrealised gains/losses on the revaluation of investments form part of investment revenue.
Forecast assumption
As part of the budget process, government business enterprises provide their best available estimates of these future payments for the forecast period.
In determining the forecast dividend payments the following two general benchmarks are used:
- •
- 50 per cent of net profit after tax; or
- •
- dividends and income tax equivalent paid or payable of 65 per cent of pre-tax profit.
Other commercial factors which are considered and will affect the dividend forecasts include the views of the board of directors, the liquidity, operating cash flow and forecast cash requirements of each government business enterprise (including planned capital works), gearing and interest cover of the business, retained earnings and any other specific commercial factors relating to individual businesses.
Dividend and income tax equivalent forecasts can be significantly influenced by a number of factors including the volatility of the financial markets and climatic conditions impacting on the water authorities. The National Tax Equivalent Regime (NTER), administered by the ATO, will over time replace the existing Victorian Income Tax Equivalent Regime. Fifteen government business enterprises commenced under the NTER on 1 July 2001. A further twenty government businesses will commence on 1 July 2002. Revenue raised under the NTER will remain with the State.
Forecast interest revenue is based on projected cash budget surpluses being invested.
Grants
Accounting policy
These are mainly funds provided by the Commonwealth to assist the State in meeting general or specific service delivery obligations. They are recognised when the State obtains control over them. They also include grants from other jurisdictions.
Forecast assumption
The forecast receipt of financial assistance from the Commonwealth is determined on the latest available advice from the Commonwealth at the time of preparation of the Estimated Financial Statements, taking into account the payment schedules and escalation factors relevant to each type of grant. The payment schedules for some financial assistance from the Commonwealth are on a monthly, quarterly or annual basis, while others are on an irregular basis such as on a project-progress basis.
Sale of goods and services
Accounting policy
Revenue is recognised to the extent that it is probable that the economic benefits will flow to the entity and the revenue can be reliably measured.
Revenue from sale of goods and services is recognised when control of goods has passed to the buyer.
For rendering of services, where the contract outcome can be reliably measured, revenue is recognised when control of the right to be compensated for the services and the stage of completion can be reliably measured.
Forecast assumption
Revenues arising from the sale of goods and services are forecast by taking into account all known factors, such as proposed fee increases in line with the Guidelines for Setting Fees and Charges Imposed by Departments and Budget Sector Agencies issued by the Department of Treasury and Finance, and projected variations in activities. Unless government policy states otherwise, fees will be set to recover the full costs of the goods or services provided.
F. Expenses
Expenses are recognised on an accrual basis, that is, when they are incurred, and are thereby reported in the financial year to which they relate.
Employee entitlements
Accounting policy
These expenses include all costs related to employment (other than superannuation which is accounted for separately) including wages and salaries, fringe benefits tax, leave entitlements and redundancy payments.
Forecast assumption
Employee entitlements are forecast on the basis of staffing profiles and current salaries and conditions. For the forecast period employee entitlements are adjusted for approved wage agreements with allowance made for further changes in the future.
Superannuation
Accounting policy
Superannuation expense is determined on the following basis:
- •
- funded schemes: the expense reflects the superannuation contribution payable by entities within the general government (budget) sector; and
- •
- unfunded schemes: the expense includes the superannuation contributions payable by public sector employers, the net movement in the unfunded superannuation liability during each period and the annual payments by the State.
Forecast assumption
The net movement in the unfunded superannuation liability becomes more sensitive to investment earnings as fund assets increase. The budget assumes a standard fund earning rate across the budget and forward estimates consistent with long-term actuarial assumptions. However in any year, the actual fund earnings can vary significantly from assumed earnings producing a large variance in the actual result compared to budget.
For the forecast period, superannuation expenses for unfunded schemes have been estimated by the Department of Treasury and Finance and are consistent with projections provided by various actuaries of each superannuation fund (Refer to Note 15).
Depreciation
Accounting policy
All infrastructure, buildings, plant and equipment and other non-current physical assets that have a limited useful life are depreciated. Depreciation is generally calculated on a straight-line basis at a rate, that allocates the asset's value, less any residual value, over its estimated useful life.
The following are typical estimated useful lives for the different asset classes used by the budget sector entities and in developing forecasts:
| Asset class | Useful life | |
|---|---|---|
| Dwellings | 40 to 50 years | |
Other buildings | 30 to 60 years | |
Other infrastructure | 10 to 32 years | |
Road pavement | 60 years | |
Bridges | 90 years | |
Plant and equipment | 3 to 10 years | |
Heritage assets | 100 years |
Land and earthworks associated with the declared road network and core cultural assets, which are considered to have an indefinite life, are not depreciated. Depreciation is not recognised in respect of these assets as their service potential will not, in any material sense, be consumed over an extended period.
Forecast assumption
Depreciation is forecast on the basis of known asset profiles, asset sales programs and approved new asset investment programs. The expense is based on the assumption that there will be no change in depreciation rates over the forecast period. The estimated impact of future revaluation of assets on depreciation is also included.
Borrowing costs
Accounting policy
Borrowing costs, other than those capitalised in relation to qualifying assets, are recognised as expenses in the period in which they are forecast to be incurred. Borrowing costs include:
- •
- interest on outstanding borrowings;
- •
- amortisation of discounts or premiums relating to borrowings;
- •
- amortisation of ancillary costs incurred in connection with the arrangement of borrowings;
- •
- indexation of principal outstanding for capital indexed securities and indexed annuities in line with movements in the Consumer Price Index;
- •
- capital gains/losses incurred on debt retirement or debt portfolio restructuring, and
- •
- finance lease charges.
Forecast assumption
Estimates for borrowing costs are based on the forecast level of outstanding general government (budget) sector debt. This is expected to mainly comprise approximately $5 billion in a fixed rate facility, $1 billion of indexed-linked securities from the Treasury Corporation of Victoria and a motor vehicle finance lease facility with forecast liability $280 million. All maturities in the forecast period are assumed to be refinanced at forward interest rates. The indexed securities are adjusted in line with movements in the Consumer Price Index and any movements in the principal outstanding is recognised as a finance cost.
Accounting policy
Payments to third parties are recognised as an expense during the financial year in which they are paid or payable. They include transactions such as grants, subsidies and other transfer payments made to local government, non-government schools, community groups, public non-financial corporations and public financial corporations.
Forecast assumption
Grants and transfer payments are forecast on the basis of known activity and adjusted by the appropriate economic parameters. Where payments are tied to third party revenue, such as Commonwealth grants for on-passing, forecasts are in line with estimated receipts.
Supplies and services (including maintenance)
Accounting policy
These generally represent the day-to-day running costs incurred in the normal operation of budget sector entities. These items are recognised as an expense in the financial year in which they are forecast to be incurred.
Forecast assumption
Supplies and services are forecast on the basis of known activity changes including the application of government policy such as savings strategies, changes in the method of service delivery and the application of the appropriate economic parameters.
An allowance is made for emerging demand that may arise over the forecast period.
G. Assets
Other financial assets
Accounting policy
The opening balance of other financial assets represents the audited value as at 1 July 2001 revised for estimated movements for 2001-02. It comprises marketable securities (less provision for diminution) and deposits that are valued at market value, except for long-term investments. Long-term investments, such as international bonds, are investments that are expected to be held for greater than 12 months. Long-term investments are recognised using the cost method of valuation, being the cost at the date of acquisition. Any discount or premium is amortised over the life of the investments and gains or losses arising from the investments prior to maturity are recognised in the statement of financial performance.
Forecast assumption
All surplus cash resources for the period 2002-03 to 2005-06 are assumed to be held as financial assets to preserve budget decision-making flexibility.
Receivables
Receivables include debtors in relation to goods and services, taxes and fines, accrued investment income and the GST input tax credits recoverable. Receivables are recognised at the nominal amounts due, less any provision for bad and doubtful debts.
Accounting policy
The opening balance of receivables represents the audited value as at 1 July 2001, revised for estimated movements for 2001-02 and is recognised at the nominal amounts due, less any provision for bad and doubtful debts forecast to be collected.
Forecast assumption
Receivables are forecast on the basis of revenue activity levels.
Inventories
Accounting policy
The opening balance of inventories represents the audited value as at 1 July 2001, revised for estimated movements for 2001-02 and is valued at the lower of cost and net realisable value. The methods used to assign costs to inventories, other than land held for resale, are based on purchase cost on a weighted average cost and cost on a "first-in first-out" basis.
Land held for resale is valued at the lower of cost and net realisable value.
Forecast assumption
Inventories forecast to be purchased are valued at the forecast cost.
Non-current physical assets
Capitalisation
In general, all non-current physical assets with a value over $1 000 are capitalised.
Valuation
Designated plant, equipment and vehicles (both owned and leased) are required to be measured on a cost basis. Cost is either of the following:
- (a)
- where the assets had not been revalued in the preceding reporting period, cost is the cost of acquisition less any accumulated depreciation and accumulated recoverable amount write-downs or impairment losses, or
- (b)
- where the assets had been revalued in the preceding reporting period, cost is deemed to be the carrying amount of the asset less any subsequent accumulated depreciation and any subsequent recoverable amount write-downs or impairment losses.
Non-current physical assets other than designated plant, equipment and vehicles are required to be measured on a fair value basis. Fair value is determined on the following basis:
- (a)
- where there is a quoted market price in an active and liquid market for an asset, the market price would represent the fair value of the asset, or
- (b)
- where there is no quoted market price for an asset, but there is available market evidence of fair value with respect to similar assets, the market evidence would represent the estimated fair value, or
- (c)
- where the market buying and selling prices differ materially or where no market exists for the asset, the fair value is determined in reference to the asset's market buying price, the best indicator of this is usually the replacement cost of the asset's remaining future economic benefits.
New investments in assets are valued at the forecast purchase price or, where appropriate, recognised progressively over the estimated construction period.
The opening balance of non-current physical assets is the actual audited balances as at 1 July 2001 revised for estimated movements in 2001-02. The forward estimates now include the estimated impact of revaluations of non-current physical assets. These estimates have been derived based on examination and extrapolation of historical trends in asset revaluations by major asset class. These estimates have been included in the forward estimates at a total general government level.
Partnership Victoria projects
Budget funded infrastructure projects approved in-principle by the Government for possible delivery under the Partnerships Victoria model are initially reflected in the financial statements as non-current physical assets (with associated financing and depreciation costs).
A final decision on whether to proceed with a Partnerships Victoria delivery approach will be made following evaluation of bids arising from the tender process for the project and will be based on a value for money assessment. If, at the conclusion of the tender process, a decision is made to proceed with a Partnerships Victoria delivery approach, the financial statements will be adjusted as required, to convert the budgeted asset investment, depreciation and financing flows to an appropriate stream of service payments to the private sector.
Land and buildings
Accounting policy
The opening balance of land and buildings is recognised at historical cost or at the latest available valuation.
Forecast assumption
The value of land and buildings will change during the forecast period to account for acquisitions, disposals, and the impact of depreciation and revaluation.
Plant and equipment
Accounting policy
The opening balance of certain classes of plant and equipment are recognised at historical cost, others are recognised at the latest available valuation.
Forecast assumption
The value of plant and equipment will change during the forecast period to account for acquisitions, disposals, and the impact of depreciation and revaluation.
Infrastructure assets
Infrastructure assets include such items as road pavements, bridges, earthworks, and construction in-progress. Individual components of infrastructure assets are valued as follows.
Road pavements and bridges
Accounting policy
The opening balance of road pavements and bridges are recognised at written down replacement cost.
Forecast assumption
The value of road pavements and bridges will change during the forecast period to account for acquisitions, disposals, and the impact of depreciation and revaluation.
Earthworks
Accounting policy
The opening balance of earthworks is recognised at replacement cost.
Forecast assumption
The value of earthworks will change during the forecast period to account for acquisitions and disposals and the impact of revaluation.
Land under roads
Accounting policy
Land under roads and road reserves has not been recognised.
Other non-current physical assets
National parks, state forests and other Crown land
Accounting policy
National parks and state forests are generally recognised at the estimated current market-buying price of adjacent land, discounted to adjust for the restricted nature of current use. This valuation methodology does not take into account the intrinsic value of these assets to the community.
Other Crown land in rural areas has been recognised at values determined by applying an average valuation for broad area rural improved land (cropping and grazing) and unimproved land (bushland and water) for all parishes and townships in the State.
Forecast assumption
The value of national parks, state forests and other Crown land will change during the forecast period to account for acquisitions and disposals and the impact of revaluation.
Natural resources
The majority of natural resource assets comprise of commercial native forests.
Accounting policy
The opening value of native forests is measured at their net market value. The net market value is determined as the difference between the net present value of cash flows expected to be generated by the native forests (discounted at a risk adjusted interest rate) less the net market value of the land on which the native forests are growing.
The net market value of the land has been determined in accordance with an independent valuation.
Forecast assumption
The value of natural resources will change during the forecast period to account for acquisitions and disposals and the impact of revaluations.
Heritage assets and collections
Accounting policy
Heritage assets and collections are defined as those non-current physical assets that the State intends to preserve because of their unique historical, cultural or environmental attributes. These assets include items such as the Royal Botanical Gardens Herbarium, State Library, Government House, Parliament House, historic houses, monuments, certain museum exhibits, art collections, archival collections and other items of cultural significance.
The opening balances of heritage assets and collections are generally recognised at their estimated current value. In particular, core heritage assets and collections that generate substantial revenues are valued at the greater of current market buying price and net present value. All other core heritage assets and collections are valued at estimated written-down replacement cost. All natural non-core heritage assets and collections are valued at estimated realisable value or net present value, whichever is the higher.
Forecast assumption
The value of heritage assets and collections will change during the forecast period to account for acquisitions, disposals, and the impact of depreciation and revaluation.
Leases
Accounting policy
A distinction is made between finance leases, which effectively transfer from the lessor to the lessee substantially all the risks and benefits incident to ownership of the leased assets, and operating leases, under which the lessor effectively retains substantially all such risks and benefits.
Finance leases are recognised as assets and liabilities at the present value of the minimum lease payments. The lease asset is amortised over the shorter of the estimated useful life of the asset or the term of the lease. Minimum lease payments are allocated between the principal component of the lease liability and the interest expense calculated using the interest rate implicit in the lease and charged directly to the statement of financial performance.
Operating lease payments are recognised as an expense on a straight-line basis in the statement of financial performance.
Any lease incentive liability in relation to a non-cancellable operating lease is reduced on an imputed interest basis over the lease term at the rate implicit in the lease.
Contingent rentals are recognised as an expense in the financial year in which they are incurred.
The cost of leasehold improvements is capitalised as an asset and amortised over the remaining term of the lease or the estimated useful life of the improvements, whichever is the shorter.
Forecast assumption
Unless otherwise stated existing leases are assumed to be replaced by leases with similar terms and conditions.
H. Liabilities
Payables
Accounting policy
This item consists predominantly of creditors and other sundry liabilities.
They are carried at cost, which is the fair value of the consideration to be paid in the future for goods and services received, whether or not billed as at 30 June to the economic entity.
Forecast assumption
For the forecast period payables are based on known movements in contractual arrangements and other outstanding payables.
Interest-bearing liabilities
Accounting policy
The interest bearing liabilities of the State represent funds raised from the following sources:
- •
- public borrowings mainly through the Treasury Corporation of Victoria;
- •
- the residual amount outstanding for loans raised in previous years by the Commonwealth government on behalf of the State; and
- •
- the motor vehicle finance lease.
The opening balance of interest bearing liabilities represents the audited value as at 1 July 2001, revised for estimated movements for 2001-02.
Forecast assumption
For forecasting, budget sector debt is valued at its historical cost including unamortised premiums/discounts.
Employee entitlements
Accounting policy
An estimate of the provision is made in the Estimated Financial Statements for entitlements not taken at the end of each forecast reporting date in respect of wages and salaries, annual leave and long service leave. The amounts are accrued consistent with the level of wages included in the statement of financial performance except for long service leave, which is estimated at the present value of the estimated future cash outflows arising from forecast employees' service at the end of each period.
Forecast assumption
Employee entitlements are forecast on the basis of staffing profiles and current salaries and conditions. For the forecast period, employee entitlements are adjusted for approved wage agreements with allowance made for future movements.
Superannuation
Accounting policy
The opening balance of the State's superannuation obligations is based on the latest actuarial assessment of the members' entitlements, net of scheme assets, and represents the audited value as at 1 July 2001 revised for estimated movements in 2001-02, in respect of the contributory service of current and past government employees. The valuation is determined by discounting to present value the gross benefit payments at a current, actuarially determined, risk-adjusted discount rate appropriate to the plan.
Forecast assumption
For the forecast period the superannuation liability has been estimated by the Department of Treasury and Finance and is consistent with projections provided by the various fund actuaries (refer to Note 15).
Other liabilities
Accounting policy
All other liabilities are recognised at the estimated amounts payable.
I. Accounting for the goods and services tax (GST)
Accounting policy
Revenues, expenses and assets are recognised net of GST except where the amount of GST incurred is not recoverable, in which case it is recognised as part of the cost of acquisition of an asset or part of an item of expense. GST receivable from and payable to the Australian Taxation Office is included in the statement of financial position.
J. Statement of cash flows
Accounting policy
For the purposes of the statement of cash flows, cash comprises cash on hand, cash at bank, bank overdrafts and deposits at call, and highly liquid investments with short periods to maturity, which are readily convertible to cash on hand and are subject to an insignificant risk of changes in value.
K. Rounding
Accounting policy
All amounts in the Estimated Financial Statements have been rounded to the nearest hundred thousand dollars unless otherwise stated.
Figures in the financial statements may not add due to rounding.
Note 2: Taxation
| | 2002-03 Budget | 2003-04 Estimate | 2004-05 Estimate | 2005-06 Estimate | ||||
|---|---|---|---|---|---|---|---|---|
| | ($ million) | |||||||
| Payroll tax | 2 710.1 | 2 797.4 | 2 939.6 | 3 102.4 | ||||
| Taxes on immovable property | 709.8 | 807.9 | 796.1 | 783.8 | ||||
| Financial and capital transactions | 2 054.3 | 1 826.1 | 1 725.8 | 1 582.9 | ||||
| Gambling | 1 455.0 | 1 536.1 | 1 620.1 | 1 708.8 | ||||
| Insurance | 789.8 | 841.3 | 869.7 | 912.2 | ||||
| Motor vehicles | 1 050.8 | 1 083.5 | 1 114.5 | 1 150.3 | ||||
| Other licences and levies | 32.8 | 34.4 | 35.8 | 41.2 | ||||
| Total taxation | 8 802.7 | 8 926.7 | 9 101.7 | 9 281.6 | ||||
Note 3: Investment revenue
| | 2002-03 Budget | 2003-04 Estimate | 2004-05 Estimate | 2005-06 Estimate | ||||
|---|---|---|---|---|---|---|---|---|
| | ($ million) | |||||||
| Dividends | 406.5 | 356.8 | 367.3 | 377.1 | ||||
| Tax and rate equivalent revenue | 106.4 | 141.1 | 154.9 | 170.4 | ||||
| Interest | 338.1 | 316.7 | 320.4 | 334.0 | ||||
| Royalties | 41.4 | 43.3 | 38.8 | 39.8 | ||||
| Rents | 16.6 | 16.7 | 16.9 | 16.8 | ||||
| Other | 152.7 | 117.3 | 119.5 | 118.5 | ||||
| Total investment revenue | 1 061.6 | 991.9 | 1 017.7 | 1 056.8 | ||||
Note 4: Grants revenue
| | 2002-03 Budget | 2003-04 Estimate | 2004-05 Estimate | 2005-06 Estimate | ||||
|---|---|---|---|---|---|---|---|---|
| | ($ million) | |||||||
| Current grants | ||||||||
| General purpose grants | 6 772.4 | 7 019.5 | 7 151.5 | 7 603.2 | ||||
| Specific purpose grants for onpassing | 1 179.4 | 1 216.0 | 1 253.8 | 1 262.3 | ||||
| Other specific purpose grants | 3 146.1 | 3 232.7 | 3 375.0 | 3 532.5 | ||||
| Total current grants | 11 097.9 | 11 468.2 | 11 780.2 | 12 398.0 | ||||
| Capital grants | ||||||||
| Specific purpose grants for onpassing | 116.9 | 120.6 | 124.4 | 127.5 | ||||
| Other specific purpose grants | 538.7 | 483.4 | 557.9 | 545.4 | ||||
| Total capital grants | 655.6 | 604.0 | 682.3 | 672.9 | ||||
| Total grants | 11 753.5 | 12 072.2 | 12 462.5 | 13 070.9 | ||||
Note 5: Depreciation
| | 2002-03 Budget | 2003-04 Estimate | 2004-05 Estimate | 2005-06 Estimate | ||||
|---|---|---|---|---|---|---|---|---|
| | ($ million) | |||||||
| Plant, equipment and infrastructure | 451.2 | 470.2 | 489.9 | 490.1 | ||||
| Buildings(a) | 274.8 | 303.8 | 345.5 | 390.5 | ||||
| Roads | 223.9 | 226.8 | 229.7 | 232.5 | ||||
| Other assets | 2.3 | 1.9 | 1.9 | 2.0 | ||||
| Total depreciation | 952.2 | 1 002.7 | 1 067.0 | 1 115.1 | ||||
- Note:
- (a)
- Includes estimated depreciation on amounts not yet allocated to projects in 2002-03 to 2005-06.
Note 6: Amortisation
| | 2002-03 Budget | 2003-04 Estimate | 2004-05 Estimate | 2005-06 Estimate | ||||
|---|---|---|---|---|---|---|---|---|
| | ($ million) | |||||||
| Plant and equipment | 56.6 | 53.6 | 53.5 | 53.6 | ||||
| Buildings | 5.5 | 5.5 | 5.5 | 5.5 | ||||
| Intangible assets | 8.6 | 6.3 | 6.3 | 6.3 | ||||
| Total amortisation | 70.6 | 65.4 | 65.3 | 65.4 | ||||
Note 7: Borrowing costs
| | 2002-03 Budget | 2003-04 Estimate | 2004-05 Estimate | 2005-06 Estimate | ||||
|---|---|---|---|---|---|---|---|---|
| | ($ million) | |||||||
| Interest on long-term interest bearing liabilities | 432.0 | 432.2 | 430.6 | 429.2 | ||||
| Interest on short-term interest bearing liabilities | 13.0 | 13.6 | 14.5 | 15.7 | ||||
| Finance charges on finance leases | 12.5 | 11.8 | 10.8 | 9.4 | ||||
| Other borrowing costs | 37.7 | 37.0 | 36.2 | 34.1 | ||||
| Total borrowing costs | 495.2 | 494.6 | 492.1 | 488.4 | ||||
Note 8: Grants and transfer payments
| | 2002-03 Budget | 2003-04 Estimate | 2004-05 Estimate | 2005-06 Estimate | ||||
|---|---|---|---|---|---|---|---|---|
| | ($ million) | |||||||
| Commonwealth | 5.0 | 5.1 | 5.3 | 5.5 | ||||
| Local government | 547.9 | 425.3 | 429.5 | 437.7 | ||||
| Private sector | 2 509.0 | 2 566.8 | 2 592.3 | 2 649.8 | ||||
| Grants within Victorian Government | 1 055.9 | 1 002.4 | 988.8 | 982.7 | ||||
| Other | 1.0 | 1.5 | 1.5 | 1.5 | ||||
| Total grants and transfer payments | 4 118.9 | 4 001.1 | 4 017.2 | 4 077.2 | ||||
Note 9: Total expenses from ordinary activities by Department
| | 2002-03 Budget | 2003-04 Estimate | 2004-05 Estimate | 2005-06 Estimate | |||||
|---|---|---|---|---|---|---|---|---|---|
| | ($ million) | ||||||||
| Expenses from ordinary activities | |||||||||
| Education and Training | 7 140.0 | 7 297.4 | 7 329.2 | 7 302.6 | |||||
| Human Services | 8 905.5 | 8 953.8 | 9 038.2 | 9 079.3 | |||||
| Infrastructure | 3 030.9 | 2 857.5 | 2 996.8 | 2 997.5 | |||||
| Justice | 2 192.9 | 2 182.7 | 2 258.8 | 2 263.6 | |||||
| Natural Resources and Environment | 1 142.4 | 1 056.5 | 1 003.8 | 998.4 | |||||
| Premier and Cabinet | 508.8 | 497.6 | 536.3 | 543.7 | |||||
| Innovation, Industry and Regional Development | 431.9 | 266.7 | 202.6 | 194.1 | |||||
| Tourism, Sport and the Commonwealth Games | 105.1 | 85.0 | 75.7 | 72.4 | |||||
| Treasury and Finance | 2 018.4 | 2 067.2 | 2 091.3 | 2 135.4 | |||||
| Parliament | 102.6 | 100.0 | 98.2 | 98.6 | |||||
| Contingencies not allocated to departments(a) | 427.0 | 1 008.0 | 1 507.2 | 2 030.0 | |||||
| Regulatory bodies and other part budget funded agencies(b) | 835.1 | 856.5 | 879.1 | 903.0 | |||||
| Total | 26 840.7 | 27 228.9 | 28 017.2 | 28 618.7 | |||||
| Less eliminations(c) | (2 080.7 | ) | (2 120.3 | ) | (2 156.1 | ) | (2 158.1 | ) | |
| Total expenses from ordinary activities | 24 760.0 | 25 108.6 | 25 861.1 | 26 460.6 | |||||
Notes:
- (a)
- Departmental expenses will be supplemented for certain costs that are provided for in contingencies.
- (b)
- Other general government sector agencies which receive less than 50 per cent of their revenue from appropriations.
- (c)
- Comprised of payroll tax, capital assets charge and inter-departmental transfers.
Note 10: Property, plant and equipment
| | 2003 Budget | 2004 Estimate | 2005 Estimate | 2006 Estimate | |||||
|---|---|---|---|---|---|---|---|---|---|
| | ($ million) | ||||||||
| Land, national parks and other land only holdings | 7 569.9 | 7 861.4 | 8 172.5 | 8 500.9 | |||||
| Buildings(a) | 11 895.5 | 13 122.3 | 14 423.1 | 15 613.0 | |||||
| Less: Accumulated depreciation | (1 074.9 | ) | (1 383.3 | ) | (1 738.7 | ) | (2 138.6 | ) | |
| Buildings (written down value) | 10 820.6 | 11 739.0 | 12 684.4 | 13 474.4 | |||||
| Infrastructure systems | 4 902.6 | 5 147.5 | 5 331.2 | 5 549.0 | |||||
| Less: Accumulated depreciation | (1 148.0 | ) | (1 163.0 | ) | (1 183.9 | ) | (1 204.6 | ) | |
| Infrastructure systems (written down value) | 3 754.6 | 3 984.5 | 4 147.4 | 4 344.4 | |||||
| Plant, equipment and vehicles | 4 113.4 | 4 478.1 | 4 800.7 | 5 137.6 | |||||
| Less: Accumulated depreciation | (2 517.7 | ) | (2 952.5 | ) | (3 393.2 | ) | (3 831.4 | ) | |
| Plant, equipment and vehicles (written down value) | 1 595.7 | 1 525.6 | 1 407.5 | 1 306.2 | |||||
| Leased plant, equipment and vehicles | 310.8 | 337.8 | 364.8 | 391.7 | |||||
| Less: Accumulated amortisation | (130.1 | ) | (183.7 | ) | (237.2 | ) | (290.9 | ) | |
| Leased plant, equipment and vehicles (written down value) | 180.8 | 154.1 | 127.6 | 100.9 | |||||
| Total property, plant and equipment | 23 921.6 | 25 264.6 | 26 539.3 | 27 726.7 | |||||
- Note:
- (a)
- Includes amounts not yet allocated to projects in 2003-04 to 2005-06.
Note 11: Roads and earthworks
| | 2003 Budget | 2004 Estimate | 2005 Estimate | 2006 Estimate | |||||
|---|---|---|---|---|---|---|---|---|---|
| | ($ million) | ||||||||
| Roads and earthworks | 16 642.1 | 17 341.2 | 18 054.6 | 18 779.7 | |||||
| Less: Accumulated depreciation | (3 646.0 | ) | (3 872.9 | ) | (4 102.6 | ) | (4 335.1 | ) | |
| Total roads and earthworks | 12 996.0 | 13 468.4 | 13 952.0 | 14 444.7 | |||||
Note 12: Reconciliation of movements in fixed assets(a)
| | 2003 Budget | 2004 Estimate | 2005 Estimate | 2006 Estimate | |||||
|---|---|---|---|---|---|---|---|---|---|
| | ($ million) | ||||||||
| Carrying amount at start of the year | 35 360.1 | 36 917.7 | 38 733.0 | 40 491.4 | |||||
| Additions | 1 927.3 | 2 181.3 | 2 128.9 | 2 063.1 | |||||
| Disposals at written down value | (89.3 | ) | (68.4 | ) | (40.6 | ) | (38.3 | ) | |
| Revaluation increments | 731.5 | 762.3 | 794.2 | 827.4 | |||||
| Depreciation/amortisation expense | (1 012.0 | ) | (1 059.8 | ) | (1 124.1 | ) | (1 172.2 | ) | |
| Carrying amount at end of the year | 36 917.7 | 38 733.0 | 40 491.4 | 42 171.4 | |||||
- Note:
- (a)
- Fixed assets comprise land and buildings, infrastructure systems, plant, equipment, vehicles, roads and earthworks. Excludes movements in other non-current assets in Note 13 below.
Note 13: Other assets
| | 2003 Budget | 2004 Estimate | 2005 Estimate | 2006 Estimate | |||||
|---|---|---|---|---|---|---|---|---|---|
| | ($ million) | ||||||||
| Current | |||||||||
| Other assets | 0.1 | 0.1 | 0.1 | 0.1 | |||||
| Total current | 0.1 | 0.1 | 0.1 | 0.1 | |||||
Non-current | |||||||||
| Natural resource reserves at valuation | 315.1 | 318.2 | 321.3 | 324.4 | |||||
| Other assets-including works of art, museum collections, rare book collections and intangibles | 1 550.0 | 1 576.6 | 1 589.2 | 1 599.4 | |||||
| Less: Accumulated depreciation/amortisation | (71.0 | ) | (80.9 | ) | (90.7 | ) | (100.7 | ) | |
| Total non-current | 1 794.2 | 1 814.0 | 1 819.9 | 1 823.2 | |||||
Note 14: Employee entitlements
| | 2003 Budget | 2004 Estimate | 2005 Estimate | 2006 Estimate | ||||
|---|---|---|---|---|---|---|---|---|
| | ($ million) | |||||||
| Current | ||||||||
| Accrued salaries and wages | 130.3 | 151.0 | 165.2 | 179.3 | ||||
| Annual leave | 460.9 | 462.8 | 464.8 | 466.7 | ||||
| Long service leave | 235.4 | 259.4 | 274.0 | 288.6 | ||||
| Total current employee entitlements | 826.6 | 873.2 | 904.0 | 934.6 | ||||
Non-current | ||||||||
| Long service leave | 1 878.8 | 2 046.4 | 2 225.9 | 2 409.8 | ||||
| Other employee entitlements | 0.7 | 0.6 | 0.6 | 0.6 | ||||
| Total non-current employee entitlements | 1 879.4 | 2 047.1 | 2 226.5 | 2 410.4 | ||||
| Total employee entitlements | 2 706.0 | 2 920.2 | 3 130.5 | 3 345.0 | ||||
Note 15: Superannuation
The liability for employee superannuation entitlements is the responsibility of the State's public sector superannuation funds. These funds are not consolidated in the Estimated Financial Statements as they are not controlled by the State. However, the major proportion of unfunded superannuation liabilities are the responsibility of the State and are recognised accordingly.
Changes have been made to some of the assumptions used in the calculation of the liability since the release of the 2001-02 budget based on actuarial advice and actual investment returns achieved for the period 1 July 2001 through to 31 March 2002. These changes reflect an increasing rate of resignations between the ages of 54 and 55 within the Revised Scheme of the State Superannuation Fund, a slowing of the retirement rate after age 55 within the State Superannuation Fund, and assumed earnings for the State Superannuation Fund in 2001-02 of 1 per cent.
The State's share of the unfunded superannuation liability based on Department of Treasury and Finance estimates is as follows:
| | 2003 Budget | 2004 Estimate | 2005 Estimate | 2006 Estimate | ||||
|---|---|---|---|---|---|---|---|---|
| | ($ million) | |||||||
| State Superannuation Fund | 12 561.0 | 12 770.7 | 13 224.3 | 13 334.5 | ||||
| Other | 200.1 | 218.2 | 237.8 | 259.2 | ||||
| Total unfunded superannuation liability | 12 761.2 | 12 988.8 | 13 462.0 | 13 593.7 | ||||
Current liability | 990.1 | 713.9 | 487.7 | 866.4 | ||||
| Non-current liability | 11 771.0 | 12 274.9 | 12 974.4 | 12 727.2 | ||||
| Total liability | 12 761.2 | 12 988.8 | 13 462.0 | 13 593.7 | ||||
The weighted average discount rate used by the Actuary is 7 per cent per annum and the weighted average rate of salary increases assumed is 4 per cent per annum (excluding promotions). A long-term rate of 3 per cent per annum is assumed for inflation growth. However, a rate of 2.5 per cent has been used for 2001-02, 2.25 per cent for 2002-03 and 3.0 per cent for the out years.
The long-term rates assumed by the Actuary can differ from the economic assumptions that are listed at the start of the Notes to the Estimated Financial Statements.
Note 16: Reconciliation of changes in equity
| | 2003 Budget | 2004 Estimate | 2005 Estimate | 2006 Estimate | |||||
|---|---|---|---|---|---|---|---|---|---|
| | ($ million) | ||||||||
| Total equity at beginning of year | 20 068.2 | 21 109.8 | 22 285.1 | 23 378.4 | |||||
| Movements in revaluation reserves | 737.8 | 768.6 | 800.6 | 833.8 | |||||
| Contributions by the State to other sectors in its capacity as owner | (218.0 | ) | (173.3 | ) | (224.6 | ) | (152.6 | ) | |
| Net result for year | 521.8 | 580.0 | 517.3 | 711.9 | |||||
| Total movements in equity | 1 041.6 | 1 175.3 | 1 093.3 | 1 393.1 | |||||
| Total equity at end of year | 21 109.8 | 22 285.1 | 23 378.4 | 24 771.5 | |||||
Note 17: Cash flow information
| | 2002-03 Budget | 2003-04 Estimate | 2004-05 Estimate | 2005-06 Estimate | |||||
|---|---|---|---|---|---|---|---|---|---|
| | ($ million) | ||||||||
| (a) Reconciliation of cash | |||||||||
| Cash | 354.0 | 379.6 | 372.0 | 365.3 | |||||
| Deposits at call | 558.8 | 580.8 | 601.6 | 622.4 | |||||
| Bank overdraft | (3.4 | ) | (4.0 | ) | (3.3 | ) | (2.3 | ) | |
| Cash held as at 30 June | 909.4 | 956.4 | 970.3 | 985.4 | |||||
| (b) Reconciliation of the net result to net cash flows from operating activities | |||||||||
| Net result | 521.8 | 580.0 | 517.3 | 711.9 | |||||
Non-cash movements | |||||||||
| Depreciation | 952.2 | 1 002.7 | 1 067.0 | 1 115.1 | |||||
| Amortisation | 70.6 | 65.4 | 65.3 | 65.4 | |||||
| Revaluation of investments | 0.1 | 0.1 | 0.1 | 0.1 | |||||
| Assets received/given free of charge | — | — | (5.0 | ) | — | ||||
| Revaluation of assets | (3.1 | ) | (3.1 | ) | (3.1 | ) | (3.1 | ) | |
| Discount/premium on other financial assets/interest bearing liabilities | 14.9 | 14.5 | 13.5 | 11.3 | |||||
| Write down of liabilities | (1.5 | ) | (1.6 | ) | (1.6 | ) | (1.7 | ) | |
Movements included in investing and financing activities | |||||||||
| Net revenues from sale of property, plant & equipment | (19.6 | ) | (12.9 | ) | (13.0 | ) | (13.2 | ) | |
Movements in assets and liabilities | |||||||||
| Increase/(decrease) in provision for doubtful debts | (0.2 | ) | 0.1 | 0.0 | 0.0 | ||||
| Increase/(decrease) in payables | 10.6 | 7.5 | 8.9 | 8.8 | |||||
| Increase/(decrease) in employee entitlements | 197.3 | 214.3 | 210.1 | 214.6 | |||||
| Increase/(decrease) in superannuation | (44.8 | ) | 227.7 | 473.2 | 131.6 | ||||
| Increase/(decrease) in other liabilities | (32.2 | ) | (27.3 | ) | (12.1 | ) | (13.0 | ) | |
| (Increase)/decrease in receivables | (69.4 | ) | (96.3 | ) | (87.8 | ) | (93.5 | ) | |
| (Increase)/decrease in other current assets | (0.2 | ) | (0.0 | ) | (0.1 | ) | 0.0 | ||
| Net cash flows from operating activities | 1 596.5 | 1 971.0 | 2 232.8 | 2 134.4 | |||||
Note 18: General government (budget) sector entities
The following is a list of entities, which have been consolidated for the purposes of the Estimated Financial Statements. For further details on consolidation policy see Note 1 C, Basis of Consolidation.
Public non-financial and public financial corporations do not form part of the general government (budget) sector and are therefore not included in this list of controlled entities. For a complete listing of all government entities, please refer to the Annual Financial Report and the Mid-Year Financial Report.
| | | |
|---|---|---|
| General government (budget) sector entities | ||
| Department of Education and Training | ||
| Adult, Community and Further Education Board | ||
| Adult Multicultural Education Services | ||
| Bendigo Regional Institute of TAFE | ||
| Box Hill Institute of TAFE |
| Central Gippsland Institute of TAFE | ||
| Centre for Adult Education | ||
| Chisholm Institute of TAFE | ||
| Driver Education Centre of Australia Ltd | ||
| East Gippsland Institute of TAFE | ||
| Gordon Institute of TAFE | ||
| Goulburn Ovens Institute of TAFE | ||
| Holmesglen Institute of TAFE | ||
| Institute of Land and Food Resources (TAFE Division) | ||
| International Fibre Centre Limited | ||
| Kangan Batman Institute of TAFE | ||
| Northern Melbourne Institute of TAFE | ||
| Royal Melbourne Institute of Technology (TAFE Division) | ||
| South West Institute of TAFE | ||
| Sunraysia Institute of TAFE | ||
| Swinburne University of Technology (TAFE Division) | ||
| University of Ballarat (TAFE Division) | ||
| Victoria University of Technology (TAFE Division) | ||
| Victorian Curriculum and Assessment Authority | ||
| Victorian Learning and Employment Skills Commission | ||
| Victorian Qualifications Authority | ||
| William Angliss Institute of TAFE | ||
| Wodonga Institute of TAFE | ||
| Department of Human Services | ||
| Alexandra and District Ambulance Service | ||
| Alexandra District Hospital | ||
| Alpine Health | ||
| Ambulance Service Victoria Metropolitan Region | ||
| Austin and Repatriation Medical Centre | ||
| Bairnsdale Regional Health Service | ||
| Ballarat Health Services | ||
| Barwon Health | ||
| Bayside Health | ||
| Beaufort and Skipton Health Service | ||
| Beechworth Hospital | ||
| Benalla and District Memorial Hospital | ||
| Bendigo Health Care Group | ||
| Boort District Hospital | ||
| Casterton Memorial Hospital | ||
| Central Gippsland Health Service | ||
| Chinese Medicine Registration Board of Victoria |
| Chiropractors Registration Board of Victoria | ||
| Cobram District Hospital | ||
| Cohuna District Hospital | ||
| Colac Community Health Services | ||
| Coleraine District Health Services | ||
| Dental Health Services Victoria | ||
| Dental Practice Board of Victoria | ||
| Djerriwarrh Health Services | ||
| Dunmunkle Health Services | ||
| East Grampians Health Service | ||
| East Wimmera Health Service | ||
| Eastern Health | ||
| Echuca Regional Health | ||
| Edenhope and District Memorial Hospital | ||
| Far East Gippsland Health and Support Service | ||
| Gippsland Southern Health Service | ||
| Goulburn Valley Health | ||
| Hepburn Health Service | ||
| Hesse Rural Health Service | ||
| Heywood and District Memorial Hospital | ||
| Infertility Treatment Authority | ||
| Inglewood and District Health Service | ||
| Kerang and District Hospital | ||
| Kilmore and District Hospital, | ||
| Kooweerup Regional Health Service | ||
| Kyabram and District Memorial Community Hospital | ||
| Kyneton District Health Service | ||
| Latrobe Regional Hospital | ||
| Lorne Community Hospital | ||
| Maldon Hospital | ||
| Mallee Track Health and Community Services | ||
| Manangatang and District Hospital | ||
| Mansfield District Hospital | ||
| Maryborough District Health Service | ||
| McIvor Health and Community Services | ||
| Medical Practitioners Board of Victoria | ||
| Melbourne Health | ||
| Mental Health Review Board | ||
| Moyne Health Services | ||
| Mt Alexander Hospital | ||
| Nathalia District Hospital |
| Northern Health | ||
| Numurkah District Health Service | ||
| Nurses Board of Victoria | ||
| Omeo District Hospital | ||
| Optometrists Registration Board of Victoria | ||
| Osteopaths Registration Board of Victoria | ||
| Otway Health and Community Services | ||
| Peninsula Health | ||
| Peter MacCallum Cancer Institute | ||
| Pharmacy Board of Victoria | ||
| Physiotherapists Registration Board of Victoria | ||
| Podiatrists Registration Board of Victoria | ||
| Portland and District Hospital | ||
| Prince Henry's Institute of Medical Research | ||
| Psychologists Registration Board of Victoria | ||
| Psychosurgery Review Board | ||
| Queen Elizabeth Centre | ||
| Robinvale District Health Service | ||
| Rochester and Elmore District Health Service | ||
| Royal Victorian Eye and Ear Hospital | ||
| Rural Ambulance Victoria | ||
| Rural Northwest Health | ||
| Seymour District Memorial Hospital | ||
| South Gippsland Hospital | ||
| South West Healthcare | ||
| Southern Health | ||
| Stawell District Hospital | ||
| Swan Hill District Hospital | ||
| Tallangatta Health Service | ||
| Terang and Mortlake Health Service | ||
| Timboon and District Health Care Service | ||
| Tweddle Child and Family Health Service | ||
| Upper Murray Health and Community Services | ||
| Victorian Health Promotion Foundation | ||
| Victorian Institute of Forensic Mental Health | ||
| Wangaratta District Base Hospital | ||
| West Gippsland Health Care Group | ||
| West Wimmera Health Service | ||
| Western District Health Service | ||
| Western Health | ||
| Wimmera Health Care Group |
| Wodonga Regional Health Service | ||
| Women's and Children's Health | ||
| Wonthaggi and District Hospital | ||
| Yarram and District Health Service | ||
| Yarrawonga District Health Service | ||
| Yea and District Memorial Hospital | ||
Department of Infrastructure | ||
| Architects Registration Board of Victoria | ||
| Building Control Commission | ||
| Docklands Authority | ||
| Heritage Council | ||
| Marine Board of Victoria | ||
| Plumbing Industry Commission | ||
| Roads Corporation | ||
| Spencer Street Station Authority | ||
Department of Justice | ||
| Country Fire Authority | ||
| Domestic Building (HIH) Indemnity Fund | ||
| Equal Opportunity Commission | ||
| Legal Practice Board | ||
| Metropolitan Fire and Emergency Services Board | ||
| Office of Public Prosecutions | ||
| Office of the Legal Ombudsman | ||
| Office of the Public Advocate | ||
| Victoria Legal Aid | ||
| Victoria Police (Office of the Chief Commissioner of Police) | ||
| Victorian Electoral Commission | ||
| Victorian Institute of Forensic Medicine | ||
| Victorian Law Reform Commission | ||
Department of Natural Resources and Environment | ||
| Corangamite Catchment Management Authority | ||
| East Gippsland Catchment Management Authority | ||
| EcoRecycle Victoria | ||
| Environment Protection Authority | ||
| Glenelg-Hopkins Catchment Management Authority | ||
| Goulburn-Broken Catchment Management Authority | ||
| Mallee Catchment Management Authority | ||
| Melbourne Parks and Waterways (shell) | ||
| North Central Catchment Management Authority | ||
| North East Catchment Management Authority |
| Office of Gas Safety | ||
| Office of the Chief Electrical Inspector | ||
| Parks Victoria | ||
| Royal Botanic Gardens Board | ||
| Shrine of Remembrance Trustees | ||
| Surveyors Board | ||
| Trust for Nature (Victoria) | ||
| Veterinary Practitioners Registration Board of Victoria | ||
| Department of Premier and Cabinet | ||
| Australian Centre for Moving Image | ||
| Film Victoria | ||
| Library Board of Victoria | ||
| Museums Board of Victoria | ||
| National Gallery of Victoria, Council of Trustees | ||
| Office of Public Employment | ||
| Office of the Ombudsman | ||
| Victorian Relief Committee | ||
Department of Innovation, Industry and Regional Development | ||
| Liquor Licensing Panel | ||
Department of Tourism, Sport and the Commonwealth Games | ||
| Melbourne 2006 Commonwealth Games Pty Ltd | ||
| Tourism Victoria | ||
| Victorian Institute of Sport Ltd | ||
| Victorian Institute of Sport Trust | ||
Department of Treasury and Finance | ||
| Gambling Research Panel | ||
| Office of the Regulator-General | ||
| Victorian Casino and Gaming Authority | ||
Parliament of Victoria | ||
| Victorian Auditor-General's Office |
DEPARTMENT OF TREASURY AND FINANCE STATEMENT IN RELATION TO THE ESTIMATED FINANCIAL STATEMENTS
The Estimated Financial Statements for the Victorian general government (budget) sector have been prepared on the basis of the economic and fiscal information available to the Department of Treasury and Finance. Given the prospective nature of the Estimated Financial Statements, it has been necessary to apply the best professional judgment in preparing the Estimated Financial Statements.
In my opinion, the Estimated Financial Statements have been properly prepared for the purposes of sections 23H—23K of the Financial Management Act 1994 and take into account government decisions and other circumstances that have a material effect.

Ian W Little
Secretary
Department of Treasury and Finance
May 2002

AUDITOR-GENERAL'S REPORT
To the Members of the Parliament of Victoria
Scope of Review
I have reviewed the accompanying estimated financial statements of the Victorian General Government (Budget) Sector, as defined in note 18 to the statements, for the financial year ended 30 June 2003 and the three forward financial years ended 30 June 2004, 2005 and 2006. The statements comprise an estimated statement of financial performance, an estimated statement of financial position, an estimated statement of cash flows and accompanying notes. The remaining parts of the Budget Papers have not been subject to my review.
The Treasurer of Victoria is responsible for the preparation and presentation of the estimated financial statements and the information they contain. The estimated financial statements have been prepared for inclusion in the State Budget which is presented to the Parliament. Any assumption of responsibility for any reliance on this report or on the estimated financial statements of the Victorian General Government (Budget) Sector to which this report relates is disclaimed to any person other than the Members of the Parliament of Victoria.
My review of the estimated financial statements has been conducted under section 16B of the Audit Act 1994 which requires me to state whether anything has come to my attention that would cause me to not believe that the statements have been prepared on a basis consistent with the accounting policies on which they are stated to be based, are consistent with the target established for the key financial measure specified in the accompanying notes to the statements and have been properly prepared on the basis of the economic assumptions stated in the accompanying notes to the statements, and the methodologies used to determine those assumptions were reasonable.
The review has been conducted in accordance with Australian Auditing Standards applicable to review engagements, and has been limited primarily to inquiries of relevant personnel and assessments of the reasonableness of the key methodologies and processes followed to determine the assumptions and data upon which the estimated financial statements are based, and appropriate analytical procedures. These procedures do not provide all the evidence that would be required in an audit, thus the level of assurance provided is less than that which would be given in an audit. Accordingly, an audit has not been performed and an audit opinion is not expressed.
Prospective financial information relates to events and actions that have not yet occurred and may not occur. While evidence may be available to support the assumptions and underlying data upon which prospective financial information is based, such evidence is generally future oriented and therefore less certain in nature. As a result, I am not in a position to obtain the level of assurance necessary to express a positive opinion on those assumptions and the accompanying forecast information included in the estimated financial statements. Accordingly, an opinion is not expressed on whether the forecasts will be achieved.
Review Statement
Based on my review, which is not an audit, nothing has come to my attention that causes me to not believe that:
- •
- the estimated financial statements have been prepared on a basis consistent with the accounting policies on which they are stated to be based;
- •
- the estimated financial statements are consistent with the target established for the key financial measure specified in the accompanying notes to the statements;
- •
- the estimated financial statements have been properly prepared on the basis of the economic assumptions stated in the accompanying notes to the statements; and
- •
- the methodologies used to determine those assumptions were reasonable.
Actual results achieved by the Victorian General Government (Budget) Sector are likely to be different from those forecast in the estimated financial statements since anticipated results frequently do not occur as expected and the variation may be material. Accordingly, I express no opinion as to whether the forecasts will be achieved.
| MELBOURNE 2/5/2002 | J W CAMERON Auditor-General |
Victorian Auditor-General's Office Level 34, 140 William Street, Melbourne Victoria 3000
Telephone (03) 8601 7000 Facsimile (03) 8601 7010 Email comments @audit. vic.gov. an Website www.audit.vic.gov.au
![]()
APPENDIX A: SPECIFIC POLICY INITIATIVES AFFECTING THE BUDGET POSITION
Appendix A outlines output, asset investment, revenue and savings initiatives since the 2001-02 Budget.
OUTPUT AND ASSET INVESTMENT INITIATIVES
Government—wide initiatives
The following table provides details of the total cost of government-wide output initiatives. The figures included are the total cost of initiatives. Funding from reprioritisation and existing fund sources has not been deducted from the total cost of the initiative.
Table A1: Output initiatives—Government—wide
| | 2001-02 | 2002-03 | 2003-04 | 2004-05 | 2005-06 | |||||
|---|---|---|---|---|---|---|---|---|---|---|
| | ($ million) | |||||||||
| Victorian Public Service EBA(a) | 10.0 | 23.5 | 23.5 | 23.4 | 23.4 | |||||
| Enhancing women's safety | — | 1.1 | 1.1 | 1.1 | — | |||||
| Total output initiatives | 10.0 | 24.6 | 24.6 | 24.5 | 23.4 | |||||
Source: Department of Treasury and Finance
Note:
- (a)
- Figures are net of wage contingency funding.
Victorian Public Service Enterprise Bargaining Agreement
The Government and the Community and Public Sector Union (CPSU) have reached agreement on a service-wide collective agreement. The agreement has been negotiated with the CPSU, as the union covering public service staff, under section 170LJ (Agreement with organisations of employees) of the Commonwealth Workplace Relations Act 1996.
The agreement covers non-executive employees in all public service departments and agencies and the following benefits are payable under the agreement:
- •
- salary increases of 3 per cent applying from 1 July 2001 and 1 July 2002;
- •
- performance payments based on performance ratings received through the applicable performance management system; and
- •
- three lump sum non-recurrent payments equivalent to 0.5 per cent of salary payable from 1 July 2001, 1 July 2002 and 1 July 2003.
Enhancing women's safety
Funding has been provided to address two key areas identified in the Women's Safety Strategy which is expected to be finalised in mid-2002. The areas cover improving and increasing housing and support options available for women in situations of family violence and enhancing the capacity of local communities to prevent and respond to violence against women. The strategy is coordinated by the Office of Women's Policy with the identified initiatives being delivered through the Department of Human Services.
Departmental initiatives
The following tables provide details of output and asset investment initiatives for each department. Except where specified, figures indicate the total cost of initiatives. Funding from reprioritisation and existing fund sources has not been deducted from the total cost of the initiative.
The budget incorporates the impact of significant new policy measures, including additional funding of $322 million in 2002-03 decreasing slightly to $278 million by 2005-06. An additional $163 million in initiatives in 2002-03 will be funded through existing forward estimates demand contingencies. The budget also provides funding for new asset investment initiatives of $3 billion.
Education and Training
Output initiatives
Table A2: Output initiatives—Department of Education and Training
| | 2001-02 | 2002-03 | 2003-04 | 2004-05 | 2005-06 | |||||
|---|---|---|---|---|---|---|---|---|---|---|
| | ($ million) | |||||||||
| Early years numeracy—school based coordinators | — | 5.7 | 11.7 | 11.5 | 5.7 | |||||
| Reduction of average class sizes in prep to year 2 | — | 10.8 | 19.0 | 13.5 | — | |||||
| Literacy intervention and improved participation | 4.6 | 9.2 | 9.5 | 9.5 | 9.5 | |||||
| Middle years reform and innovation (years 5-9) | — | 7.9 | 20.1 | 28.5 | 27.8 | |||||
| Victorian Certificate of Applied Learning | — | 10.8 | 13.0 | 12.8 | 11.1 | |||||
| Access to excellence | — | 11.4 | 23.2 | 23.5 | 23.5 | |||||
| Koori educators and Koori home school liaison officers | — | 0.9 | 0.9 | 0.9 | 0.9 | |||||
| School bus services | — | 6.6 | 9.2 | 7.5 | 7.8 | |||||
| Feeeza—urban and regional youth events | — | 2.0 | 2.0 | 2.0 | 2.0 | |||||
| Pacific School Games | — | 0.2 | 0.7 | 1.1 | 1.1 | |||||
| TAFE EBA framework(a) | — | 0.5 | 0.5 | 0.5 | 0.5 | |||||
| Assistance package for retrenched Ansett staff | 1.5 | — | — | — | — | |||||
| Sports and physical equipment—schools | 5.0 | — | — | — | — | |||||
| School library resources—schools | 5.0 | — | — | — | — | |||||
| Total output initiatives | 16.1 | 65.9 | 109.7 | 111.1 | 89.7 | |||||
Source: Department of Treasury and Finance
Note:
- (a)
- Net of wage contingency
Early years numeracy—school-based coordinators
Funding is provided for the appointment of school based coordinators and regional infrastructure support. The school-based coordinators will facilitate the implementation of the early years numeracy program to improve numeracy outcomes for students in the early years of schooling.
Reduction of average class sizes in prep to year 2
Class sizes for years prep to 2 (P—2) are being reduced to an average of 21 students to improve student learning outcomes in the areas of literacy and numeracy. Funding is provided for additional teachers in years P-2 to meet enrolment growth pressures within this age cohort over the next three years. This will ensure that the Government meets its target of an average P-2 class size of 21 students per teacher.
Literacy intervention and improved participation
Funding was provided in January 2002 for the recruitment of 121 new teachers in 2002 to implement a literacy intervention program and pilot the Victorian Certificate of Applied Learning. Both programs are targeted towards secondary students by assisting junior secondary students to achieve national literacy and numeracy benchmarks, and by providing senior secondary students with alternative education options to support continuing participation in the education system.
Middle years reform and innovation (years 5-9)
The middle years reform and innovation program aims to improve student participation and achievement for years 5 to 9 students. Funding has been allocated to provide grants to 250 education clusters of government primary and secondary schools across Victoria to work together with local communities to reform middle school curriculum and education structures through the implementation of innovative projects.
Victorian Certificate of Applied Learning
The Victorian Certificate of Applied Learning (VCAL) is a recently developed qualification for years 11 and 12 students to provide an alternative option to the Victorian Certificate of Education. In 2002 VCAL is being piloted in a number of government, Catholic and independent schools across Victoria. Funding in 2002-03 will enable statewide implementation of the Victorian Certificate of Applied Learning to all Victorian schools in 2003.
Access to excellence
Funding is provided to enable the appointment of 300 additional teachers to facilitate teacher release and flexibility to deliver a variety of teaching and learning outcomes. Outcomes will include enhanced student literacy and numeracy, participation and retention, and improved VCE performance in identified target schools across Victoria.
Koori educators and Koori home school liaison officers
The initiative aims to improve the education and social outcomes for Koori students and builds on Yalca, an existing formal education and training partnership between the Government and the Aboriginal Education Association. Funding is provided for additional Koori educators and home school liaison officers to enhance the provision of education and support services for Koori students within schools and their community.
School bus services
This initiative implements key recommendations of the Government's 2001 Review of School Bus Services, which focus on rural and regional Victoria. Funding is provided for enhancements to the conveyance allowances paid for private car travel, bus travel to schools for government and non-government students, and travel for disabled students.
Freeza—urban and regional youth events
Funding has been allocated to enhance the Freeza program, which funds local drug and alcohol—free music entertainment events that are organised and attended by young people. Involvement in Freeza events strengthens young people's links to their communities.
Pacific School Games
Melbourne will host the 2005 Pacific School Games in the lead up the 2006 Commonwealth Games. Funding is provided for additional resources to facilitate the planning and hosting of the Pacific School Games.
TAFE EBA framework
Additional supplementation was provided for TAFE Enterprise Bargaining Agreements (EBAs) negotiated with individual TAFE institutes and the Council for Adult Education. Separate agreements for teaching staff, and professional administration, clerical computing and technical (PACCT) staff were negotiated to reflect different roles and responsibilities.
Assistance package for retrenched Ansett staff
Funding of $1.5 million is provided in 2001-02 only for employment and training assistance for retrenched Ansett workers. While the package is particularly targeted at semi-skilled and unskilled workers, assistance will be available to all Ansett workers retrenched since September 2001. Separate initiatives include a telephone help line, and employment placement and support services.
Sports and physical equipment—schools
Additional funding is provided in 2001-02 only for the purchase of sports and physical equipment in all government primary, secondary, special and language schools.
School library resources—schools
Additional funding is provided in 2001-02 only for the purchase of library resources in all government primary, secondary, special and language schools.
Asset investment initiatives
Table A3: Asset investment initiatives—Department of Education and Training
| | 2001-02 | 2002-03 | 2003-04 | 2004-05 | 2005-06 | TEI | ||||||
|---|---|---|---|---|---|---|---|---|---|---|---|---|
| | ($ million) | |||||||||||
| Construction and upgrade of schools—Labor's Financial Statement | — | 5.9 | 13.8 | — | — | 19.7 | ||||||
| New facilities—TAFE institutes | — | 1.1 | 9.4 | 4.8 | — | 15.3 | ||||||
| Construction of new schools | — | 3.3 | 7.8 | — | — | 11.1 | ||||||
| Replacement schools | — | 4.1 | 9.5 | — | — | 13.5 | ||||||
| Reinstatement projects in schools | — | 3.0 | 4.5 | — | — | 7.5 | ||||||
| Planning projects—schools | — | 2.5 | — | — | — | 2.5 | ||||||
| Maryborough Community Education Precinct | — | 0.8 | 3.2 | — | — | 4.0 | ||||||
| Modernisation of facilities—schools(a) | — | 61.0 | 80.3 | — | — | 141.3 | ||||||
| Modernisation of TAFE institutes | — | 0.4 | 1.0 | — | — | 1.4 | ||||||
| Total asset investment initiatives | 0.0 | 82.1 | 129.5 | 4.8 | 0.0 | 216.4 | ||||||
Source: Department of Treasury and Finance
Note:
Construction and upgrade of schools—Labor's Financial Statement
Consistent with Labor's Financial Statement, funding is provided for the development of new schools, which are currently at various stages of construction, and the upgrade of existing schools. New schools under construction include: Lara Secondary College, Narre Warren P-12 College, Berwick South Secondary College and Carrum Downs Secondary College. Funding is provided for the redevelopment and upgrade of Bellarine Secondary College.
New facilities—TAFE institutes
Funding is provided for the establishment of new TAFE facilities including the completion of the construction of new facilities at the Epping Campus of North Melbourne Institute.
Construction of new schools
Funding is provided for the construction of Gourlay East Primary School (Melton East) and Stage 2 of the construction of Roxburgh Park Secondary College. Funding is also provided for the construction of a specialist school in Bairnsdale for students with disabilities.
Replacement schools
Funding is provided for the replacement of Deer Park Primary and Peninsula Special Development School and the re-opening of Fitzroy Secondary College for years 7-10.
Reinstatement projects in schools
Funding is provided for the replacement of facilities destroyed by fire at Mooroopna Primary School, Copperfield College, Corio Bay Senior College and the complete replacement of Leopold Primary School.
Planning projects—schools
Funding is provided in 2002-03 to develop project and architectural plans for general building projects and community education clusters. This will enable schools to undertake adequate planning and design for specific school building projects such as extensions and upgrades, as well as evaluate other construction alternatives.
Maryborough Community Education Precinct
Funding is provided for stage 1 of the development of an education precinct in Maryborough. Once established, a single committee of management will govern the Maryborough Community Education Precinct, which will include primary and specialist schools, and the Maryborough Regional College.
Modernisation of facilities—schools
Funding is provided to modernise 98 schools across Victoria. In addition to making the school facilities better suited to modern teaching methods, the modernisation projects will significantly reduce the maintenance backlogs at each school. This includes $52.1 million of funding from the Growing Victoria Infrastructure Reserve.
Modernisation of TAFE institutes
Funding is provided for the completion of stage 2 of the development of a Cyber Centre at William Angliss Institute of TAFE and modernisation of the Food Technology and Koori Education Centre at Wodonga Institute.
Human Services
Output initiatives
Table A4: Output initiatives—Department of Human Services
| | 2001-02 | 2002-03 | 2003-04 | 2004-05 | 2005-06 | |||||
|---|---|---|---|---|---|---|---|---|---|---|
| | ($ million) | |||||||||
| Hospital Demand Management Strategy | — | 113.0 | 116.0 | 117.0 | 118.0 | |||||
| Public hospital superannuation costs | — | 48.3 | 45.2 | 42.1 | 21.8 | |||||
| Increased costs of medical and pharmaceutical supplies and consumables | — | 12.0 | — | — | — | |||||
| Elective surgery strategy | 6.0 | — | — | — | — | |||||
| Expansion and enhancement of community mental health services | — | 9.0 | 9.0 | 9.0 | 9.0 | |||||
| Metropolitan and rural ambulance services | — | 5.0 | 5.0 | 5.0 | 5.0 | |||||
| Home and community care services | — | 6.9 | 7.1 | 7.3 | 7.4 | |||||
| Targeted assistance for low-cost supported accommodation services at significant risk of closure | 0.8 | 1.0 | — | — | — | |||||
| Nerve Centre development | 1.0 | — | — | — | — | |||||
| Public dental services | — | 1.0 | 1.0 | 1.0 | 1.0 | |||||
| Early detection and prevention of breast cancer | — | 1.4 | 1.4 | 1.5 | 1.5 | |||||
| Women's Health and Wellbeing Strategy(a) | — | 1.0 | 0.9 | 0.9 | — | |||||
| Operational infrastructure support for medical research institutes | — | 4.9 | 7.3 | 9.9 | 12.6 | |||||
| BEST START | — | 1.4 | 1.4 | 1.0 | — | |||||
| Enhancement of child protection and placement services | — | 15.0 | 15.0 | 15.0 | 15.0 | |||||
| Support to preschools | — | 3.2 | 6.5 | 6.7 | 6.9 | |||||
| Better preschools facilities | 5.0 | — | — | — | — | |||||
| Enhancements to technological infrastructure for children's services | 0.4 | — | — | — | — | |||||
| Specialist resources for children services | 0.2 | — | — | — | — | |||||
| Enhancing technologies—neighbourhood houses and telephone counselling services | 0.4 | — | — | — | — | |||||
| Expansion of disability services | — | 5.0 | 5.0 | 5.0 | 5.0 | |||||
| Kew Residential Services redevelopment | — | 6.2 | 6.4 | 6.4 | 6.4 | |||||
| Latrobe Valley Public Housing Project | 4.0 | 5.0 | 4.5 | 3.5 | — | |||||
| Assistance for homeless people | — | 2.2 | 2.2 | 2.2 | 2.2 | |||||
| Neighbourhood renewal projects | 0.8 | — | — | — | — | |||||
| Security projects for public housing estates | 0.8 | — | — | — | — | |||||
| Support to non-government organisations | — | 4.5 | 4.5 | 4.5 | 4.5 | |||||
| Human Services industrial relations issues(b) | 82.9 | 73.1 | 77.3 | 77.0 | 77.0 | |||||
| Total output initiatives | 102.3 | 319.1 | 315.7 | 315.0 | 293.3 | |||||
Source: Department of Treasury and Finance
- (a)
- Funding includes an additional $0.31m in 2002-03 and $0.42m ongoing from new demand growth funding in recognition of the importance of improving women's health and wellbeing outcomes.
- (b)
- Figures are net of wage contingency funding.
Hospital Demand Management Strategy
The Government will continue to support a multi-year approach to respond to and manage demand for public hospital services. The Hospital Demand Management Strategy incorporates close collaboration with clinicians and hospital management in responding to demand pressures, and reform of patient care processes. A key component of the Strategy is funding to respond to growth in demand and increase hospital capacity. This includes funding of $25 million over four years for expansion of mental health services provided within the hospital setting.
Funds will also be used to implement hospital diversion programs which provide patients with more appropriate, lower-cost care options such as sub-acute and home-based care, with the aim of keeping people out of hospitals and assisting them to continue living independently within the community.
The Hospitals Admission Risk Program will also be expanded and prevention measures implemented to reduce hospital admissions and emergency presentations for conditions that could be more appropriately treated or prevented. This includes expansion of primary health services and community health programs such as allied health treatment, community nursing and health promotion. Funding for public hospital prevention services was provided in the 2001-02 Budget for four years. An additional $16 million for prevention initiatives was provided for 2002-03, bringing the overall prevention component of the Strategy to $33 million in 2002-03. Funding for prevention is in recognition that these initiatives typically take time to impact on the pattern of demand growth, and that development and application of new approaches to prevention is best undertaken where there is funding certainty.
Public hospital superannuation costs
Public hospitals will receive assistance to meet increased employer superannuation costs arising from increases in the Commonwealth Superannuation Guarantee Levy from 1 July 2002, and increased employer contributions in 2002-03 to the defined benefits scheme of Health Super.
Increased costs of medical and pharmaceutical supplies and consumables
Supplementation is provided to address continued significant cost increases for medical and pharmaceutical supplies and consumables.
Elective surgery strategy
Funding is provided for initiatives which aim to reduce elective surgery patient waiting times and waiting lists. A new model of referral for rural and metropolitan health services will be implemented with particular emphasis on ophthalmology, orthopaedic and plastic surgery patients. A number of health services have also been identified to deliver additional elective surgery activity for 2001-02.
Expansion and enhancement of community mental health services
Funding provides for the expansion and enhancement of a range of community-based and residential programs and support services for Victorians who suffer from a serious mental illness. Existing adult and aged community services will be increased and new prevention and early intervention initiatives for young adults will be implemented. Crisis and relapse prevention services will be made available for people with serious mental illness, and people with dual diagnosis of drug and alcohol abuse as well as mental illness. Housing support for homeless people with a mental illness will also be provided. In addition, support will be available through the Hospital Demand Management Strategy for the expansion of hospital inpatient programs provided to clients with a mental illness.
Metropolitan and rural ambulance services
Funding is provided to expand and improve emergency and non-emergency ambulance transport services. New and upgraded services will be provided through the recruitment and training of new paramedics in Albert Park/St Kilda, Bentleigh/Brighton, Bundoora/Reservoir, Shepparton and Mildura. The increasing caseload on ambulance services will be better managed through the implementation of a referral service that will redirect calls not requiring an ambulance emergency response to appropriate alternate services.
Home and community care services
The needs of frail aged people, people with disabilities, and their carers will continue to be met through the expansion of home and community care services. A range of services will support individuals to continue living independently in their own homes and actively participate in the community for as long as possible, thereby enhancing quality of life, reducing unnecessary or premature admissions to a hospital or residential care and improving care after discharge from hospital.
Targeted assistance for low-cost supported accommodation services at significant risk of closure
Assistance will be provided for selected supported residential services requiring one-off assistance to comply with new fire safety regulations which come into force in August 2002. The continued operation of the supported residential service sector provides for low-cost supported accommodation and care for people with a significant disability who are on a pension level income.
Nerve Centre development
Funding will provide support for the development of a National Neurological Centre (the 'Nerve Centre') which will provide services for people with multiple sclerosis and other neurological conditions. The Nerve Centre will house an information service, lifestyle assessment program, health centre and clinical unit.
Public dental services
Funding will expand the service capacity of public dental services in community dental clinics across Victoria. This initiative will help improve the accessibility of dental services for people in specific target groups, including concession cardholders and their dependents.
Early detection and prevention of breast cancer
Funding is provided to enhance early detection and prevention of breast cancer through increased provision of free mammograms for Victorian women aged 50 to 69.
Women's Health and Wellbeing Strategy
Funding will provide for the commencement of the Women's Health and Wellbeing Strategy which aims to improve the health and welfare of women in Victoria. The Strategy involves a range of service initiatives, which seek primarily to improve women's mental and emotional health, increase women's participation and leadership in the community, and extend knowledge about women's health.
Operational infrastructure support for medical research institutes
In recognition of the positive impact of research activities in generating major health and economic benefits for the State, operational infrastructure support for Victoria's medical research institutes will be boosted. This will help sustain the ability to attract additional national and international research and development funds into Victoria.
BEST START
Funding is provided for the implementation of the first stage of the BEST START initiative by the Department of Human Services in partnership with the Department of Education and Training. This prevention and early intervention project aims to improve the health, development, learning and wellbeing of Victorian children up to eight years of age by supporting communities, parents and service providers. The first stage, implemented in partnership with local communities, comprises ten projects in 2002-03 that trial ways of improving the effectiveness, responsiveness and inclusiveness of universal local early years services.
Enhancement of child protection and placement services
Funding will expand and enhance child protection and placement services that aim to protect children and adolescents at risk from abuse and neglect. In particular, new diversion and prevention services will be piloted in six selected rural and regional areas of Victoria, and in indigenous communities. The new innovation projects will be established in areas that have some of the highest rates of notification of suspected child abuse and neglect in Victoria. Two indigenous innovation projects will also be established in 2002-03. The preventative capacity of current services will be strengthened through community-based services that enhance support for vulnerable families. Funds will also improve the quality of care for children and young people in out of home care. The child protection workforce will also be increased to ease the workload on direct line staff and to build a stronger system.
Support to preschools
Preschools will receive additional support to implement a range of initiatives arising from the Government's response to the independent Review of the Issues that Impact on the Delivery of Preschool Services to Children and their Families in Victoria. These initiatives focus on improving access for indigenous children and children with complex needs, improving administration and easing the workload of parents' committees of management through the commencement of group employment models, and providing improved access to children who require a second year of preschool.
Better preschools facilities
Funding is provided to assist community-based preschool services meet new Children's Services Regulations which come into force on 1 June 2003. Funding will support preschools to provide childproof fencing, toilet visibility works and toilet and hand basin works.
Enhancements to technological infrastructure for children's services
Funding will enable enhancements to the technological infrastructure and training of funded non-government early childhood intervention agencies.
Specialist resources for children's services
Funding will provide specialist resources for funded non-government early childhood intervention agencies. Standardised assessment tools and specialised equipment and resources are an integral part of the provision of services for children with disabilities and/or developmental delay.
Enhancing technologies—neighbourhood houses and telephone counselling services
Funding is to provide computer upgrades in neighbourhood houses and technological enhancements to statewide telephone counselling services including the Women's Information Referral Exchange, Men's Referral Services and Lifeline Melbourne. Funding will be used to develop and enhance websites, develop online responses to clients, improve telephone technology and develop intranet sites.
Expansion of disability services
Additional community and home-based support services, and shared supported accommodation services for people with disabilities will be provided to allow people to continue living and participating within the community. Funding will also allow the expansion of the Futures for Young Adults program, which assists students with disabilities in their transition from school to a range of post school options including supported and open employment, vocational training, further education, community participation, and recreational and leisure activities.
Kew Residential Services redevelopment
Funding is provided for the relocation of residents as part of the first stage of the redevelopment of Kew Residential Services. This will enable the transfer of 100 people from Kew Residential Services into 20 new community residential units. The proceeds from the sale of land at the Kew site will be used to provide accommodation for current residents of Kew Residential Services.
Latrobe Valley Public Housing Project
Funding has been provided to transform and renew the public housing stock in the Latrobe Valley. This program will be linked with community building processes, involving the community and local government in renewal projects in the Moe/Morwell/Traralgon areas.
Assistance for homeless people
Funding will address demand and enhance service capacity to deal with increased complexity of need among homeless people. Services for victims of domestic violence and people with multiple service needs, such as drug or alcohol dependence, disability or mental health issues, will also be strengthened. Funding will enhance the ability of people exiting homelessness to better access independent housing and appropriate community support services.
Neighbourhood renewal projects
Public housing tenants will benefit from improvements to Office of Housing estates in broad acre estates and regional centres, which involve front and side fencing and gardening to improve security and amenity to a total of 280 properties.
Security projects for public housing estates
Public housing tenants will benefit from increased security and occupational health and safety in inner city housing estates such as Fitzroy and Collingwood high-rise estates and the Horace Petty Estate in Prahran.
Support to non-government organisations
Funding will be provided to support the financial viability of non-government organisations which deliver health and community services to the community. Allowance will be made for cost increases through price adjustments for services provided by non-government organisations.
Human Services industrial relations issues
Funding has been provided to implement new enterprise agreements for disability, ambulance, psychiatric services and health sector professionals, and to extend the existing Early Childhood Teachers Multi-employer Certified Agreement. These industrial agreements will improve service delivery outcomes through initiatives to improve recruitment and retention of high quality staff, career structures, workplace flexibility, workload and conditions.
Funding is also provided for wage rises, increases in staff numbers and improved conditions in a number of areas, including hospital, psychiatric and departmental nurses, radiation therapists, ambulance administrative staff, and community services provided by the non-government sector.
Asset investment initiatives
Table A5: Asset investment initiatives—Department of Human Services
| | 2001-02 | 2002-03 | 2003-04 | 2004-05 | 2005-06 | TEI | ||||||
|---|---|---|---|---|---|---|---|---|---|---|---|---|
| | ($ million) | |||||||||||
| Berwick Community Hospital(a) | — | tbd | tbd | tbd | tbd | tbd | ||||||
| Royal Melbourne Hospital redevelopment | — | 8.0 | 18.0 | 6.0 | — | 32.0 | ||||||
| Stawell District Hospital redevelopment | — | 0.5 | 2.0 | 0.5 | — | 3.0 | ||||||
| Angliss Hospital redevelopment | — | 2.0 | 11.0 | 5.5 | — | 18.5 | ||||||
| Dandenong Hospital redevelopment | — | 3.0 | 7.0 | — | — | 10.0 | ||||||
| Lorne Community Hospital redevelopment | — | 0.3 | 2.8 | 3.0 | ||||||||
| Hospital IT systems replacement | — | 1.0 | — | — | — | 1.0 | ||||||
| Rural Ambulance co—locations | — | 0.5 | 0.9 | — | — | 1.4 | ||||||
| Ambulance services facilities development | — | 0.5 | 2.0 | 0.9 | — | 3.4 | ||||||
| Residential aged care and rural health redevelopment and upgrade | — | 8.0 | 20.0 | 12.0 | — | 40.0 | ||||||
| Upgrade of residential care facilities for placement and support program | — | 1.5 | 3.5 | — | — | 5.0 | ||||||
| Juvenile justice facility redevelopment | — | 7.0 | 7.8 | — | — | 14.8 | ||||||
| Community disability services | — | 2.5 | 5.0 | 2.5 | — | 10.0 | ||||||
| Fire risk management strategy | — | 10.0 | — | — | — | 10.0 | ||||||
| Equipment upgrade program | 25.0 | 20.0 | — | — | — | 45.0 | ||||||
| Infrastructure upgrade program | — | 15.0 | 5.0 | — | — | 20.0 | ||||||
| Total asset investment initiatives | 25.0 | 79.8 | 85.0 | 27.4 | 0.0 | 217.1 | ||||||
Source: Department of Treasury and Finance
Note:
- (a)
- Detailed project cost information will be published following tender processes.
Berwick Community Hospital
The Government has committed to building the Berwick Community Hospital. The facility will consist of 229 beds, including 141 inpatient beds, 40 sub-acute beds, 25 adult mental health inpatient beds, ambulatory day places, with 24-hour emergency department, medical and surgical care, renal dialysis services and community mental health services. The project is to be delivered under the Partnerships Victoria framework. Southern Health will operate the new hospital, which is expected to open in the second quarter of 2004.
Royal Melbourne Hospital redevelopment
Redevelopment funding will allow for the extension of the front entry building, replacement of ward accommodation on three new floors with fit out of two floors to provide 120-beds, installation of a helipad to further develop the trauma service and the upgrade of infrastructure services to support the new facilities.
Stawell District Hospital redevelopment
Funding is provided to enhance operating theatres and the radiology unit and to provide new accident and emergency services. This initiative builds on the redevelopment and expansion announced in last year's budget.
Angliss Hospital redevelopment
The second stage of redevelopment at the Angliss Hospital includes a new and expanded emergency department, a new eight-bed short stay unit, creation of a new critical care/high dependency unit and a new general x-ray facility.
Dandenong Hospital redevelopment
Funding is for the commencement of refurbishment and expansion works as part of the Dandenong Hospital Stage 2 redevelopment.
Lorne Community Hospital redevelopment
Additional funding to enable the redevelopment of the Lorne Community Hospital on its current site, to provide for integrated acute, aged care and primary care services. The redevelopment will provide a total of 30 acute and residential aged care beds and enhance community health facilities.
Hospital IT systems replacement
Funding is provided as an initial contribution towards replacement of core hospital patient management and financial systems. Funding will allow work on scoping a replacement system to begin, while extending the license for the current system.
Rural Ambulance co-locations
The replacement and co-locating of four Rural Ambulance stations with health services in Kyneton, Ararat, Colac and Hopetoun will provide service linkages and substantial service delivery improvements.
Ambulance services facilities development
This initiative will support the enhancement and expansion of ambulance services across Victoria. This includes land purchase and building costs for the two new rural ambulance stations, together with the purchase of new ambulance vehicles and equipment for these stations and the three new services to be established in metropolitan Melbourne. It also provides for the enhancement of the call-taking system used in the metropolitan ambulance communications centre to enable the identification of calls that do not require an ambulance emergency response.
Residential aged care and rural health redevelopment and upgrade
Continuation of the redevelopment and upgrade of rural health and public sector residential aged care facilities at locations including Warrnambool, Maryborough, Geelong, Omeo, Bairnsdale and Beechworth. This will ensure these facilities meet both state requirements and Commonwealth certification and accreditation standards.
Upgrade of residential care facilities for placement and support program
Funding for the continuation of the program to refurbish and replace existing residential facilities that are used to provide residential services for children removed from their families or primary carer.
Juvenile justice facility redevelopment
Funding will enable a new 26-bed facility at Parkville to be constructed to replace the existing Senior Youth Training facility (Turana) and a 16-bed demountable at Malmsbury that will enable the redevelopment to proceed without losing bed capacity. Construction of the demountable facility during 2002-03 will allow commencement of movement of young offenders out of substandard facilities at Turana, with the Parkville site to be operational by late 2004.
Community disability services
This project will continue to address the provision of accommodation to assist more people with a disability to live in the community, target initiatives aiming to involve people with a disability in their local communities by increasing access to a range of local government and funded sector facilities and address priority upgrade works for existing day services facilities.
Fire risk management strategy
The continuation of the fire risk management strategy aims to ensure that facilities, which the Department of Human Services is responsible for, attain an acceptable level of safety for clients. This includes the conduct of fire safety audits, fire risk assessments and associated upgrade works.
Equipment upgrade program
The equipment upgrade program provides for the replacement, upgrade and expansion of medical equipment to meet service needs. The funding will address medical equipment needs for health services, dental health facilities and public health laboratories.
Infrastructure upgrade program
Funding for the renewal of critical infrastructure investment requirements including plant upgrade and renewal, trunk reticulation services and demolition works to support improved reliability of health service delivery.
Output initiatives
Table A6: Output initiatives—Department of Infrastructure
| | 2001-02 | 2002-03 | 2003-04 | 2004-05 | 2005-06 | |||||
|---|---|---|---|---|---|---|---|---|---|---|
| | ($ million) | |||||||||
| New bus services—growth suburbs | — | 8.2 | 8.7 | 9.2 | 9.8 | |||||
| New bus services—regional | — | 1.8 | 1.9 | 2.0 | 2.1 | |||||
| Transit Cities | — | 1.0 | 1.0 | 1.0 | 1.0 | |||||
| Revenue Clearing House | — | 8.5 | 8.7 | 8.9 | 9.2 | |||||
| Office of City Link—contract management and safety | — | 4.1 | 4.2 | 4.3 | 4.4 | |||||
| Railway pedestrian crossings—wheelchair access | — | 3.0 | 3.1 | 3.2 | 3.2 | |||||
| Linking the Suburbs—Knox tram extension to Vermont South | — | 2.0 | 2.3 | 3.4 | 4.4 | |||||
| Linking the Suburbs—Craigieburn rail line electrification | — | — | — | — | 7.2 | |||||
| Multi-purpose taxi program | — | 7.2 | — | — | — | |||||
| Design works—new integrated transport projects | — | 3.0 | 3.0 | 2.0 | — | |||||
| Transport for World Masters Games | — | 1.2 | — | — | — | |||||
| Pride of Place | — | 4.0 | 4.0 | — | — | |||||
| Maintaining the road network | — | 17.0 | 17.0 | 17.0 | 17.0 | |||||
| Melbourne Exhibition and Convention Centre—feasibility | — | 2.0 | — | — | — | |||||
| Public heritage services and restoration project | — | 4.0 | — | — | — | |||||
| Public libraries grant | 1.3 | — | — | — | — | |||||
| Total output initiatives | 1.3 | 67.0 | 53.9 | 51.0 | 58.3 | |||||
Source: Department of Treasury and Finance
New bus services—growth suburbs and regional
A total of 25 new and enhanced bus services are to be provided in outer metropolitan Melbourne to meet community needs and recognise demographic changes. Regional Victoria will also see 27 new and improved services in areas including Phillip Island, Bellarine Peninsula, Wodonga, Latrobe Valley, Echuca, Warrnambool and Mildura. These services will support access to work, education, community services and recreation.
Transit Cities
The Transit Cities project targets cities on transport nodes for residential and commercial development. Dandenong has been announced as a Transit City and a Regional Development Board will be established to coordinate local public and private sector investment in the city.
Revenue Clearing House
The Revenue Clearing House allocates revenue between Melbourne's public transport operators based upon an agreed formula. The additional funding reflects the new revenue allocation formula agreed by all public transport operators in December 2001.
Office of City Link—contract management and safety
The Melbourne City Link Authority was established in December 1994 to oversee the Melbourne City Link project on behalf of the Government. This Authority has been abolished and an Office of City Link has been established within the Department of Infrastructure to oversee public safety, operational matters, including contract management, concession fees, enforcement issues, transport policy changes, overview maintenance and traffic management.
Railway pedestrian crossings—wheelchair access
To ensure the continued safety of the railway system, several issues need to be addressed to enhance safety levels at identified crossing hazards for users, especially those requiring wheelchair access. A Railway Crossing Upgrade Committee will be established to manage risk mitigation works at stand-alone pedestrian crossings. In addition, funding has been provided to improve suburban train signalling.
Linking the Suburbs—Knox tram extension to Vermont South
Tram Route 75, which currently terminates at the intersection of Burwood Highway and Blackburn Road, will be extended along the Burwood Highway to Vermont South Shopping Centre as the first stage of an extension to Knox City.
Linking the Suburbs—Craigieburn rail electrification
Electrified rail services are to be extended to Craigieburn from the suburban rail terminus at Broadmeadows to meet strong demand in this growth corridor. A new station will be constructed at Roxburgh Park and the Craigieburn Station will be redeveloped.
Multi-purpose taxi program
The multi-purpose taxi program provides concessions on the metered taxi fares for people with eligible disabilities. Additional capacity will be provided to enhance delivery of the program.
Design works—new integrated transport projects
The Department of Infrastructure's capacity for integrated transport planning and policy development will be strengthened, and the strategic planning function broadened. Increased resources will be provided for improved development of new integrated transport projects.
Transport for World Masters Games
Participants, delegates and officials in the 2002 World Masters Games will receive free public transport travel in Zone 1 and free travel between Melbourne and the four regional venues during the period of the games.
Pride of Place
This program will assist councils, residents and traders to develop and implement urban design solutions to improve public places.
Maintaining the road network
Fuel and bitumen costs represent a significant component of road maintenance expenditure and are heavily influenced by movements in crude oil prices and the exchange rate. Contract prices for the fuel increases have increased in recent years, following the upturn in world oil prices. Funding has been provided to ensure that the standard of Victoria's road network is maintained.
Melbourne Exhibition and Convention Centre—feasibility
Funding will be provided to undertake a feasibility study for an upgrade of the Melbourne Exhibition and Convention Centre at Southbank. The study will examine options for constructing a 5 000-seat plenary centre.
Public heritage services and restoration project
Funding is provided to maintain Victoria's position as a world leader in the preservation of public heritage. This program provides grants to local government and community groups for the repair and adaptation of heritage assets in public use.
Public libraries grant
Funding is provided for one-off grants to public libraries for book purchases. Grants of $15 000 are to be given to the 78 local libraries and two print disabled libraries (Vision Australia and Victorian Institute for the Blind). In addition, grants of $4 000 are to be given to each of the 19 country library services operated by rural and regional councils.
Asset investment initiatives
Table A7: Asset investment initiatives—Department of Infrastructure
| | 2001-02 | 2002-03 | 2003-04 | 2004-05 | 2005-06 | TEI | ||||||
|---|---|---|---|---|---|---|---|---|---|---|---|---|
| | ($ million) | |||||||||||
| Spencer Street Station(a) | — | tbd | tbd | tbd | tbd | tbd | ||||||
| Scoresby Transport Corridor(b) | 25.3 | 73.4 | 83.3 | 103.0 | 130.0 | 1000.0 | ||||||
| Linking the Suburbs—Knox tram extension to Vermont South | — | 2.0 | 14.1 | 14.4 | — | 30.5 | ||||||
| Linking the Suburbs—rail electrification to Craigieburn | — | 3.0 | 46.6 | 22.1 | 26.3 | 98.0 | ||||||
| Linking the Suburbs—major road improvements | — | 20.3 | 30.1 | 12.0 | — | 62.4 | ||||||
| Linking rural economies | — | 7.1 | 6.5 | 1.7 | — | 15.3 | ||||||
| Calder Highway upgrade (Kyneton to Faraday) | — | 21.5 | 21.0 | 19.0 | 8.5 | 70.0 | ||||||
| Channel deepening—investigation | — | 5.2 | — | — | — | 5.2 | ||||||
| Road safety initiatives | — | 5.0 | — | — | — | 5.0 | ||||||
| Motorcycle safety | — | 2.5 | 3.4 | 3.4 | 0.9 | 10.2 | ||||||
| Commonwealth Games planning | — | 3.3 | — | — | — | 3.3 | ||||||
| Yarra Precinct(c) | — | 8.8 | 7.0 | — | — | 15.8 | ||||||
| Lascelles Wharf rail connection | — | 5.1 | — | — | — | 5.1 | ||||||
| Warrnambool rail line upgrade | — | 9.0 | — | — | — | 9.0 | ||||||
| Transit cities | — | 3.5 | 2.0 | 1.0 | — | 6.5 | ||||||
| Total asset investment initiatives | 25.3 | 169.7 | 214.0 | 176.6 | 165.7 | 1336.3 | ||||||
Source: Department of Treasury and Finance
Note:
- (a)
- Detailed project cost information will be published following tender processes.
- (b)
- Subject to change following tender processes.
- (c)
- Includes private sector contributions.
Spencer Street Station
The Government is redeveloping the Spencer Street Station transport interchange and integrating Melbourne's West End with the emerging Docklands development. The project will link Victoria and the rest of Australia. The new station will offer world-class facilities to Victorian, national and international travellers.
The project will be delivered under the Partnerships Victoria framework and is expected to cost $200 million to $300 million. Further project cost information will be published following the tender process.
Scoresby Transport Corridor
In October 2001 the Victorian Government secured the agreement of the Commonwealth Government to 50/50 funding for the construction of the Scoresby Freeway as a Road of National Importance. The Commonwealth Government's initial $445 million contribution has been matched by Victoria's $445 million in addition to the $110 million in land purchases already made. The Freeway will be developed in conjunction with a program of public transport initiatives. This project will create integrated transport infrastructure and services in Melbourne's south-east, creating a link between Ringwood and Frankston and improved east-west connections for travel to the CBD and beyond.
Linking the Suburbs—Knox tram extension to Vermont South
Tram Route 75, which currently terminates at the intersection of Burwood Highway and Blackburn Road, will be extended along the Burwood Highway to Vermont South Shopping Centre and an enhanced bus service will operate from there to the Knox Activity Centre.
Linking the Suburbs—Craigieburn rail electrification
Electrified rail services are to be extended to Craigieburn from the suburban rail terminus at Broadmeadows. A new station will be constructed at Roxburgh Park and the Craigieburn Station will be redeveloped.
Linking the Suburbs—major road improvements
Several roads will be upgraded to improve safety and road capacity in Melbourne's growth suburbs for drivers and other users. Sites that will be funded include Narre Warren-Cranbourne Road, Frankston-Cranbourne Road, and Fitzgerald Road in Laverton. Other major road projects will be undertaken at Macedon Street Bridge (Sunbury), Edgars Road Extension and Duplication (Epping) and continuing the planning work on Plummer St, Port Melbourne.
Linking rural economies—roads
Several key roads in rural areas will be upgraded to support the effective flow of goods and people. Road upgrading will take place on Bayside Road in Geelong, the Maroondah Highway between Healesville and Narbethong, the Henty Highway from Heywood to the south of McKenzies and the Wallan Road Overpass, Wallan.
Calder Highway upgrade (Kyneton to Faraday)
A 21-kilometre divided highway is to be constructed on the Calder Highway between Kyneton and Faraday. This is part of the progressive upgrading and duplication of the highway between Melbourne and Bendigo. As this is a Road of National Importance, Victoria will be seeking matching funding from the Commonwealth Government.
Channel deepening—investigation
A detailed investigation will be undertaken of the proposal to deepen the approach channels to the Port of Melbourne in Port Phillip Heads, Port Phillip Bay and the Yarra River. The investigations will examine the engineering, economic and social issues associated with channel deepening. Extensive stakeholder consultation across all issues will also be undertaken.
Road safety initiatives
Median barriers will be fitted on a 20-kilometre section of the Monash Freeway, as part of the Government's commitment to improving road safety.
Motorcycle safety
The Transport Accident Commission will establish a fund to focus on the safety of motorcyclists, a high-risk road user group. Planned initiatives include engineering, training and licensing projects.
Commonwealth Games planning
A detailed transport and traffic plan for the 2006 Commonwealth Games will be developed in conjunction with the Office of Commonwealth Games Coordination. In addition to this, scoping studies will be undertaken for potential infrastructure projects that, if undertaken, would be scheduled to be completed for use during the 2006 Commonwealth Games.
Yarra Precinct
Development of Melbourne as a riverside city demands effective access for potential users. Major attractions and activities will be linked together by pedestrian paths, bike routes, water taxis and public transport. As part of this plan, Sandridge Bridge will be redeveloped and will include Queensbridge Square as a public space at the southern end of the bridge.
Lascelles Wharf rail connection
Lascelles Wharf (in Geelong) will be connected to the rail system. This will eliminate the current double handling of freight between the rail yard and the wharf thereby increasing efficiency and reducing freight costs.
Warrnambool rail line upgrade
The Warrnambool rail track is to be upgraded to a standard that conforms with the majority of the rest of Victoria's country passenger rail network. Resleepering, ballast replacement and drainage works are to be undertaken to improve the track formation.
Transit Cities
The Government's Transit Cities program aims to restructure parts of the metropolitan area and regional cities by focusing higher density mixed use development around key transport nodes. It will unlock the potential for commercial and residential development in these centres through land assembly and other means to help attract activity and services to targeted regions.
Innovation, Industry and Regional Development
Output initiatives
Table A8: Output initiatives—Department of Innovation, Industry and Regional Development
| | 2001-02 | 2002-03 | 2003-04 | 2004-05 | 2005-06 | |||||
|---|---|---|---|---|---|---|---|---|---|---|
| | ($ million) | |||||||||
| Australian synchrotron project—client management | — | 2.9 | 2.9 | 2.9 | 2.9 | |||||
| Biotechnology | — | 4.5 | 7.4 | 7.5 | 7.6 | |||||
| Science, technology and innovation commercialisation | — | 1.8 | 2.0 | 1.9 | 1.0 | |||||
| Centre for Energy and Greenhouse Technologies | — | 3.0 | 4.5 | 4.5 | — | |||||
| Developing Victoria's design capabilities | — | 4.0 | 5.2 | — | — | |||||
| Telecommunications Purchasing and Management Strategy | — | 1.0 | 7.3 | 7.3 | 7.3 | |||||
| Agenda for New Manufacturing | — | 8.0 | 6.4 | 6.4 | 6.4 | |||||
| Investment and internationalisation for the innovation economy | — | 1.8 | 1.8 | 1.8 | 1.8 | |||||
| EASY Government—Victorian Government made EASY | — | 0.4 | 0.6 | 0.6 | 0.4 | |||||
| Transport and logistics supply chain | — | 0.4 | 0.3 | 0.3 | — | |||||
| Trade fairs and missions program | — | 0.3 | 0.3 | 0.3 | 0.3 | |||||
| Regional small business mentoring trial | — | 0.1 | — | — | — | |||||
| ICT centre of excellence | — | — | 4.0 | 5.0 | 6.0 | |||||
| Timber Communities in Partnership | 9.0 | — | — | — | — | |||||
| Dried fruit industry assistance | 0.8 | — | — | — | — | |||||
| Development of a strategic vision for the mineral sands industry in the Murray Basin | 0.2 | — | — | — | — | |||||
| Biocomm Capital Pool | 1.7 | — | — | — | — | |||||
| Total output initiatives | 11.6 | 28.1 | 42.5 | 38.4 | 33.6 | |||||
Source: Department of Treasury and Finance
Australian synchrotron project
The Government has committed $100 million as its contribution towards construction of an Australian synchrotron facility at Clayton. Developed with other contributions, including the private sector, the synchrotron will provide Victoria with an important element of scientific research infrastructure. It will be used for basic and applied research and development by industry and academia.
Biotechnology
Funding is provided to implement the Biotechnology Strategic Development Plan that was released in June 2001. Initiatives will focus on commercialisation of biotechnology research and development, training and career development, international marketing and promotion of the Victorian biotechnology sector, and providing strategic direction and support for the industry.
Science, technology and innovation commercialisation
Funding is provided to enhance the State's commercialisation infrastructure for science, technology and innovation research and development. Individual initiatives include ongoing funding for a number of cooperative research centres, an extension of technology diffusion contracts, and additional funding for the Centre of Innovation and Technology Commercialisation.
Centre for Energy and Greenhouse Technologies
The Government proposes to establish a centre which will facilitate research, development, demonstration and commercialisation of technologies to reduce the greenhouse intensity of energy supply and use in Victoria. This is subject to obtaining matching Commonwealth funds.
Developing Victoria's design capabilities
Funding is provided for initiatives aimed at expanding Victoria's profile as an international design centre. Individual initiatives will target the enhancement of design in education, training, research and development. This also includes the international promotion of Victoria as a recognised design centre by showcasing Victorian design through an international exhibition.
Telecommunications Purchasing and Management Strategy
Funding is provided to introduce a whole-of-government Telecommunications Purchasing and Management Strategy (TPAMS). TPAMS will establish a streamlined integrated telecommunications service through a single connectivity hub. TPAMS will include a whole-of-government electronic directory and competition to providers of network services to government.
Agenda for New Manufacturing
Funding is provided to encourage the growth of the manufacturing industry and to create high-value manufacturing employment in Victoria. Specific initiatives will aim to assist current and potential exporters, assist skills development in the manufacturing industry, and undertake promotion in the community on the value of manufacturing.
Investment and internationalisation for the innovation economy
Funding is provided to strengthen a range of activities to promote Victoria as a destination for foreign direct investment. Additional functions will focus on promotional activities in key overseas markets, and relationship building with existing and potential foreign investors. Funding is also provided to open a Victorian Government Business Office in San Francisco.
EASY Government—Victorian Government made EASY
Funding is provided to develop and implement streamlined licensing application systems for business. This will eventually enable on-the-spot business licence processing at all Victorian Business Centres across the State, and by telephone and the internet. A new application form to combine applications for small business will also be developed and implemented.
Transport and logistics supply chain
Funding is provided for establishing a survey to identify Victorian supply chains that are internationally competitive, to be used for industry-wide benchmarking. Demonstration projects, to promote supply chain best practice, will also be funded.
Trade fairs and missions program
Funding is provided to increase the level of assistance to Victorian companies to enter and expand into export markets, through participation in trade fairs and missions.
Regional small business mentoring trial
Funding is provided for a business-based mentoring trial for small regional businesses. The aim of the initiative is use the skills and experience of successful retired people in rural and regional areas to assist existing small businesses.
ICT centre of excellence
The government has committed $15 million over three years, from 2004-05, as its contribution to the Victorian bid for a national ICT centre of excellence. Funding is conditional on the Federation Consortium's bid being successful.
Timber Communities in Partnership
Funding is provided to assist rural and regional areas adversely affected by the restructuring of the State's timber industry. Most projects will be undertaken in partnership with local governments and should particularly benefit regions such as Gippsland, where timber is an important local industry.
Dried fruit industry assistance
The Australian Dried Fruit Association will receive a grant which will be used to ensure the sustainability of the Victorian dried fruit industry by restructuring the industry. Industry reform will be aimed at improving the performance of Victorian participants through restructure and consolidation. The grant will assist companies in their streamlining efforts.
Development of a strategic vision for the mineral sands industry in the Murray Basin
Funding of $150 000 is provided for the production of a joint strategic plan for the mineral sands industry in the Murray Basin. Planning will be aimed at providing vision and direction for the attraction of investment to create an industry capable of fully exploiting the rich mineral sands deposit identified in the area.
Biocomm Capital Pool
The Government will provide $1.7 million to the Biocomm Capital Pool, a fund which will provide seeding finance to biotechnology start-up companies based in Victoria. The funding will represent the Government's contribution towards the Pool's administrative costs.
Asset investment initiatives
Table A9: Asset investment initiatives—Department of Innovation, Industry and Regional Development
| | 2001-02 | 2002-03 | 2003-04 | 2004-05 | 2005-06 | TEI | ||||||
|---|---|---|---|---|---|---|---|---|---|---|---|---|
| | ($ million) | |||||||||||
| Film and television studio | 19.6 | 20.4 | — | — | — | 40.0 | ||||||
| Telecommunications Purchasing and Management Strategy(a) | — | 21.9 | 25.8 | — | — | 47.7 | ||||||
| Australian synchrotron project(a) | — | 13.5 | 35.9 | 35.5 | 15.1 | 100.0 | ||||||
| Total asset investment initiatives | 19.6 | 55.8 | 61.7 | 35.5 | 15.1 | 187.7 | ||||||
Source: Department of Treasury and Finance
Film and television studio
Funding is provided for the Government's contribution towards the development of a film and television studio complex at the Melbourne Docklands. The studio will cater for all forms of film production, and address the infrastructure gap of the industry in Victoria.
Justice
Output initiatives
Table A10: Output initiatives—Department of Justice
| | 2001-02 | 2002-03 | 2003-04 | 2004-05 | 2005-06 | |||||
|---|---|---|---|---|---|---|---|---|---|---|
| | ($ million) | |||||||||
| Mobile Data Network project(a) | — | tbd | tbd | tbd | tbd | |||||
| Police EBA(b) | 38.0 | 58.5 | 64.3 | 79.3 | 95.1 | |||||
| Statewide Personnel Alerting System(c) | — | tbd | tbd | tbd | tbd | |||||
| Improved emergency communications services(c) | 18.5 | 32.1 | 29.7 | 30.3 | 31.1 | |||||
| Justice Statement project | — | 0.7 | — | — | — | |||||
| Strengthening alternative dispute resolution | — | 1.9 | 0.9 | 0.5 | 0.4 | |||||
| Police management information system pilot | — | 0.3 | — | — | — | |||||
| Custodial services | — | 2.4 | 2.4 | 2.4 | 2.4 | |||||
| Support for Victorian Legal Aid | 1.4 | 2.5 | -0.5 | -0.5 | -0.5 | |||||
| State Emergency Services volunteers | 0.7 | — | — | — | — | |||||
| Total output initiatives | 58.6 | 98.4 | 96.8 | 112.0 | 128.5 | |||||
Source: Department of Treasury and Finance
- Note:
- (a)
- Project cost information will be published following tender processes.
- (b)
- Figures are net of wage contingency funding.
- (c)
- Figures include existing funding of $3.6m in 2001-02, $32.1m in 2002-03, $24.5m in 2003-04, $24.5m in 2004-05 and $24.5m in 2005-06. The figure for 2001-02 does not include current service payments for call taking and dispatch.
Mobile Data Network project
Additional funding will be provided for the Mobile Data Network project to equip emergency service vehicles with data terminals. The equipment will enable automated dispatch and onscreen vehicle location, as well as providing personnel with remote data access from their vehicles. Victoria Police and the Metropolitan Ambulance Service will be the first agencies to implement the technology. It is anticipated that the full service will be delivered by July 2004.
The project will be delivered under the Partnerships Victoria framework and is expected to cost greater than $100 million. Further costs information will be published following the tender process.
Police Enterprise Bargaining Agreement
The Government has entered into an Enterprise Bargaining Agreement for Victoria Police. The Agreement achieves significant benefits for police including a revamped police career structure, key reforms sought by the Chief Commissioner, and provides certainty of wage outcomes during this period.
Statewide Personnel Alerting System
As a priority component of the Government's Statewide Integrated Public Safety Communications Strategy (SIPSaCS), funding is provided to implement the Statewide Personnel Alerting System (SPAS) for alerting emergency services personnel throughout Victoria. The network will enable the Country Fire Authority, Victorian State Emergency Service and Rural Ambulance Victoria to contact career and volunteer staff individually or en masse to alert them to emergency situations and communicate situation specific information.
The project will be delivered under the Partnerships Victoria framework and is expected to cost greater than $100 million. Further cost information will be published following the tender process.
Improved emergency communications services
Funding has been provided to ensure the seamless transition and improved operational efficiency and reliability of emergency call taking and dispatch services as operations are transferred from Intergraph to Government control. Funding is also being provided for the ongoing management of a number of other emergency services telecommunications projects. The additional resources will strengthen the capacity of government to deliver efficient and reliable communication services to Victoria's emergency service organisations.
Justice Statement project
Funding is provided for the Justice Statement development project. The Justice Statement focuses on the development of a clear vision and future direction for the Victorian Justice system over the next five years. As well, the project will produce a strategic plan for the State's court system.
Strengthening alternative dispute resolution
Funding is provided for a pilot program to develop online tools to aid Victorians in resolving their own disputes without having to refer the matter to a court. This involves development of an interactive web site as well as researching leading edge technical and support facilities necessary to permit interactive online dispute resolution anywhere in Victoria. A key element of the project is to support dispute resolution in rural and remote areas which presently experience difficulties in accessing such services.
Police management information system pilot
Funding is provided in 2002-03 for a pilot program to evaluate the establishment of a management information system to facilitate proactive policing strategies.
Custodial services
Funding is provided for the Public Correctional Enterprise (CORE) to assume responsibility for custodial services at the new County Court, the Supreme Court and the higher courts at Geelong from May 2002. CORE will provide custodial services as well as managing prisoners detained within the Courts' custody centres.
Support for Victorian Legal Aid
Funding is provided for initiatives including development of a videoconferencing network linking Victoria Legal Aid's 12 offices and five Department of Human Services non-metropolitan regions, improvements to Community Legal Centres including disability access and installation of basic amenities, the translation and/or publication and distribution of Victorian Legal Aid publications, and the creation of an interactive website for communication between Community Legal Centres.
Funding is also provided for enhancement of Victoria Legal Aid computer system to enable the implementation of a fully integrated information technology system to provide document, case and grants management functions.
State Emergency Services volunteers
Funding of $0.7 million in 2001-02 to provide support of State Emergency Services volunteers for training and personal protective equipment.
Asset investment initiatives
Table A11: Asset investment initiatives—Department of Justice
| | 2001-02 | 2002-03 | 2003-04 | 2004-05 | 2005-06 | TEI | ||||||
|---|---|---|---|---|---|---|---|---|---|---|---|---|
| | ($ million) | |||||||||||
| Improved emergency services(a)(b) | 0.8 | 18.9 | 6.1 | 0.1 | 0.1 | 25.9 | ||||||
| Correctional services prisoner information system | — | 3.4 | 0.4 | — | — | 3.8 | ||||||
| Consolidated logistics facility | — | 2.2 | 9.0 | 3.7 | — | 14.9 | ||||||
| Office of Public Prosecutions, Lonsdale Street refurbishment | — | 1.3 | — | — | — | 1.3 | ||||||
| Courts upgrade program | — | 2.0 | — | — | — | 2.0 | ||||||
| New police stations | — | 4.2 | 10.5 | 10.4 | — | 25.1 | ||||||
| Rural police station replacement program stage 5 | — | 2.0 | 3.0 | — | — | 5.0 | ||||||
| Metropolitan Mobile Radio(c) | — | tbd | tbd | tbd | tbd | tbd | ||||||
| Road safety investment | — | 3.0 | 3.0 | — | — | 6.0 | ||||||
| Total asset investment initiatives | 0.8 | 37.0 | 31.9 | 14.2 | 0.1 | 84.0 | ||||||
Source: Department of Treasury and Finance
- Notes:
- (a)
- Refer to output initiatives for the description of this initiative.
- (b)
- Figures include existing funding of $2.1m in 2002-03.
- (c)
- Project cost information will be published following tender processes.
Correctional Services Prisoner Information System
Funding for replacement and upgrade of existing information technology assets in the Correctional Services Prisoner Information System (PIMS), which will contribute to better management of the corrections system particularly given increased prisoner numbers. This is essential to the functioning of diversion and rehabilitation programs in prisons, community corrections and drug courts.
Consolidated logistics facility
Funding is provided for the amalgamation and rationalisation of various Victoria Police logistic services within a centralised facility located in Melbourne. This initiative will involve consolidating 12 existing facilities located throughout metropolitan Melbourne.
Office of Public Prosecutions, Lonsdale Street refurbishment
This project will provide improvements to meet occupational, health and safety standards.
Courts upgrade program
Funding to upgrade facilities at Bendigo and Wangaratta.
New police stations
Funding is provided for new police stations in Footscray and Coburg. Additional funding is also provided for the completion of Rowville police station. These projects will improve the local management and delivery of Victoria Police services and achieve a safer community.
Rural police station replacement program stage 5
Funding is provided to replace existing 8 and 16-hour police stations in rural Victoria, at Bendoc, Beaufort, Bunyip, Cressy, Gordon, Inglewood, Macarthur, Merbein, Pyramid Hill, Smythesdale, Tarnagulla and Whitfield. Most of the existing facilities fail to meet operational requirements.
Metropolitan Mobile Radio
The Metropolitan Mobile Radio project will provide Victoria Police, the Metropolitan Fire and Emergency Services Board and the Metropolitan Ambulance Service with new digital trunked radio system. Radio coverage will extend to 95 per cent of metropolitan areas, and for the first time the various emergency services organisations will be using the same radio system allowing for direct multi-agency operational communications. The Metropolitan Mobile Radio project will help to deliver best practice multi-agency emergency services to the community and strengthen the capacity of our emergency services organisations to continue to set high standards for service delivery.
The project will be delivered under the Partnerships Victoria framework and is expected to cost in excess of $130 million. Further cost information will be published following the tender process.
Road safety investment
As part of the Government's commitment to improving road safety, 25 new digital red light and speed detection cameras will be fitted at intersections throughout Victoria. A further 26 existing red light cameras will be upgraded to speed and red light cameras.
Natural Resources and Environment
Output initiatives
Table A12: Output initiatives—Department of Natural Resources and Environment
| | 2001-02 | 2002-03 | 2003-04 | 2004-05 | 2005-06 | |||||
|---|---|---|---|---|---|---|---|---|---|---|
| | ($ million) | |||||||||
| Special Power Payment | 118.0 | — | — | — | — | |||||
| Imported red fire ants eradication | 4.3 | — | — | — | — | |||||
| New directions for sustainable forestry | — | 25.0 | 40.0 | 11.0 | 4.0 | |||||
| Community building—achieving reconciliation with indigenous Victorian communities | — | 3.6 | 3.6 | 2.6 | 1.9 | |||||
| FarmBis | — | 4.0 | 4.0 | — | — | |||||
| Marine national parks | — | — | 1.1 | 1.0 | 1.1 | |||||
| Community engagement in enhanced fox management | — | 0.9 | 1.1 | 1.1 | — | |||||
| Implementation of the Box—Ironbark Forests Adjustment Package | — | 5.6 | 5.6 | 5.3 | 4.3 | |||||
| Victorian Ovine Johne's disease control program | — | 2.5 | 2.5 | 2.6 | 2.7 | |||||
| Gippsland Lakes rescue package | — | 2.7 | 3.2 | 3.7 | 3.2 | |||||
| Implementation of Second Generation Landcare Action Plan | — | 1.5 | 1.5 | 1.5 | 1.5 | |||||
| Risk mitigation for alpine resorts | — | 1.0 | 1.0 | 1.0 | 1.0 | |||||
| Protecting Victoria's food and agricultural exports | — | 1.1 | 1.1 | 1.1 | 1.1 | |||||
| Healthy Rivers and Environmental Flows | — | 3.5 | 3.6 | 3.5 | — | |||||
| Victorian Agribusiness Network—Think Globally, Act Locally | — | 0.8 | 0.8 | 0.8 | 0.8 | |||||
| River Murray environmental flows | 15.0 | — | — | — | — | |||||
| Total output initiatives | 137.3 | 52.0 | 69.0 | 35.2 | 21.6 | |||||
Source: Department of Treasury and Finance
Special Power Payment
The Government has allocated $118 million in 2001-02 to provide assistance to householders, small businesses, and farmers in outer suburban and regional and rural areas. The rebate means the average power bill paid by these customers will generally be no more than the highest average bill in the city for customers on equivalent tariffs.
The $118 million rebate package includes additional assistance for small business and farm customers on higher consumption tariffs who have an unusually high level of off-peak use.
Imported red fire ants eradication
The Government has committed funds under a national campaign to eradicate fire ants. The eradication program involves baiting of ants and extensive monitoring and surveillance. Funding provided in 2001-02 represents Victoria's matching contribution to the national red fire ant eradication program.
New directions for sustainable forestry
The Government is taking swift action to save the hardwood timber industry and give it a long-term sustainable future. Funding is provided over the next four-years for a voluntary reduction scheme to buy back licences, assist workers and affected communities, implement the recommendations of the Expert Data Reference Group, set up a new entity (VicForests) to manage the state forests on a sustainable and commercial footing, establish a sustainable Timber Industry Council and improve the stewardship of our forests. Our Forests, Our Future will ensure our forests, the timber industry and their communities are protected for the long-term.
Community building—achieving reconciliation with indigenous Victorian communities
This initiative targets areas of indigenous disadvantage and will progress reconciliation between indigenous and non-indigenous Victorians. The initiative includes three components—Indigenous Family Violence Strategy, Stolen Generation Initiative, and an Indigenous Community Capacity Building Program.
FarmBis
The FarmBis initiative matches Commonwealth funding and will continue to provide grants to farmers undertaking training to upgrade their farm business and natural resource management skills. The national FarmBis program aims to improve the financial self-reliance of the farming sector.
Marine national parks
The Government is committed to introducing a world-class system of 13 marine national parks and 11 sanctuaries along the Victorian coastline. This additional funding will cover increased implementation costs.
Community engagement in enhanced fox management
Funding is provided for fox management which will include a trial bounty program and regional fox action plans. Research based monitoring and evaluation processes and alternate fox management technologies will also be developed. Fox management will be based on the different landscapes, and will enhance biodiversity.
Implementation of the Box-Ironbark Forests Adjustment Package
This initiative implements the Government's response to the Environment Conservation Council's recommendations in relation to box-ironbark forests and woodlands. The funding is for a structural adjustment package for affected forest industry workers and businesses, establishment costs for parks, state forests and reserves, ongoing public land management including integrated pest plant and animal management, community capacity building and participation and development of an energy strategy.
Victorian Ovine Johne's disease control program
The Victorian Ovine Johne's Disease (OJD) control program will shift the emphasis from eradicating to controlling it. The program will also provide active support for producers through on-farm management plans and greatly improved communication with affected producers. The initiative provides coordination of counselling and other assistance at the local community level, and communication and information dissemination.
Gippsland Lakes rescue package
This initiative will reduce the severity and occurrence of algal blooms in the Gippsland Lakes. Specific components are to: establish priority areas for nutrient management works and the nutrient reduction targets within these areas; provide incentives for landowners to implement best practices to reduce fertiliser run-off; undertake on-ground works to complement nutrient management works (e.g. revegetation, water management structures); and complete further technical and scientific investigation into the control and management of algal blooms.
Implementation of Second Generation Landcare Action Plan
The Second Generation Landcare Action Plan will improve land management and use, including the uptake of sustainable practices, by funding support for Landcare groups. It will provide nine regional Landcare coordinators and a statewide Landcare position to develop and implement regional five-year support strategies, engage the community and undertake community advocacy, and fund support for volunteers and community engagement.
Risk mitigation for alpine resorts
This initiative will continue implementation of a land stability/risk management program (geotechnical engineering investigations, remedial works, and monitoring systems) in Victoria's alpine resorts to support their sustainable use and development.
Protecting Victoria's food and agricultural exports
This initiative will help to upgrade the Department of Natural Resources and Environment's biosecurity services for diseases and pests, particularly foot and mouth disease and mad cow disease, thereby addressing the increasing risks to market access, food safety and supply, human health, the rural economy and the environment.
Healthy Rivers and Environmental Flows
This initiative will improve environmental flows in priority stressed rivers by developing regional river health strategies, implementing priority works and implementing measures to improve irrigators' water use efficiency. It forms a major contribution towards meeting Victoria's 2002 environmental commitments under the Council of Australian Governments' water reform framework. It will also include complementary works (such as riparian restoration, fishways enhancement and instream habitat restoration), and will enable the Environment Protection Authority to undertake regular monitoring and evaluation of water quality and river health.
Victorian Agribusiness Network—Think Globally, Act Locally
Funding for this initiative will set up additional infrastructure to extend the agribusiness forum framework. The Agribusiness Network will promote regional agribusiness development through activities such as regional agribusiness audits, regional branding, regional agribusiness development plans, participation in trade shows, the distribution of market information, and export training.
River Murray environmental flows
Victoria has allocated $15 million to improve the health of the River Murray. South Australia will also contribute funding to this goal, providing $10 million of the total $25 million by 1 July 2005. The funding aims to achieve a range of environmental objectives, including increasing flows in the River Murray by up to 30-gigalitres on top of the 70-gigalitres targeted in the outcomes of the Snowy Water Inquiry.
Asset investment initiatives
Table A13: Asset investment initiatives—Department of Natural Resources and Environment
| | 2001-02 | 2002-03 | 2003-04 | 2004-05 | 2005-06 | TEI | ||||||
|---|---|---|---|---|---|---|---|---|---|---|---|---|
| | ($ million) | |||||||||||
| Improving quality and access to Victoria's parks | — | 0.7 | 1.5 | 1.7 | 0.1 | 4.0 | ||||||
| Cooperative Research Centre for Clean Power from Lignite | — | 0.7 | 0.7 | 0.7 | 0.7 | 2.8 | ||||||
| Bendigo consolidation and Bairnsdale replacement | — | 2.8 | 7.6 | 0.4 | — | 10.8 | ||||||
| CBD accommodation consolidation | — | 9.2 | 8.3 | — | — | 17.5 | ||||||
| Piping the System—Wimmera-Mallee (state component only) | — | 7.8 | 7.7 | 7.7 | 7.7 | 76.8 | ||||||
| Land Exchange | — | 11.2 | 10.3 | 2.5 | — | 24.0 | ||||||
| Showgrounds redevelopment | — | 25.2 | 50.3 | 25.2 | — | 100.7 | ||||||
| Total asset investment initiatives | 0.0 | 57.5 | 86.4 | 38.2 | 8.5 | 236.6 | ||||||
Source: Department of Treasury and Finance
Improving quality and access to Victoria's parks
This initiative is for works involving repairs and upgrades to four dam structures and decommissioning of two dams. The works are to reduce risks to acceptable levels following evaluations by the Snowy Mountain Engineering Corporation in light of the probability and potential consequences of failure.
Cooperative Research Centre for Clean Power from Lignite
Funding for the Cooperative Research Centre for Clean Power from Lignite will jointly fund (with the Commonwealth Government, industry and academia) Australia's only research body that develops technologies to reduce greenhouse emissions from brown coal. Development of this technology is likely to maintain Victoria's comparative advantage in low-cost electricity generation, which will contribute to the State's environmentally sustainable economic growth.
Bendigo consolidation and Bairnsdale replacement
This funding is to consolidate four separate Department of Natural Resources and Environment locations onto one existing site in Bairnsdale and to consolidate two locations and extend the existing office facility for new programs in Bendigo. Emergency response infrastructure will be upgraded in Bairnsdale as well as providing a "One-Stop Shop" and addressing occupational health and safety issues. The Bendigo consolidation will provide facilities for existing programs at Epsom and provision for staff to manage new programs related to the National Action Plan for Water Quality and Salinity and Box-Ironbark.
CBD accommodation consolidation
This initiative will provide for the fit-out of new CBD accommodation for the Department's Melbourne offices. This will consolidate the Department's activities (excluding Land Victoria) into one CBD location. This consolidation will take advantage of the completion of current leasing arrangements to address accommodation occupational health and safety issues and improve the Department's operational effectiveness.
Piping the System—Wimmera-Mallee
Subject to Commonwealth matching funding and confirmation of feasibility, this initiative will replace the existing 17 500 kilometres of open channels with a new pipeline system in the Wimmera-Mallee region. This system will provide a more secure and higher quality water supply for domestic and stock use. Water saved by curtailing the current massive losses of over 70 per cent from evaporation and seepage will be allocated to stressed river systems and new agricultural and other developments in the Wimmera-Mallee region.
Land Exchange
The Land Exchange will provide business with a single point of access to state and local government land information and transactions through a comprehensive commercial online marketplace. The Land Exchange will also include an electronic conveyancing system for transferring ownership in land, a digital vendor certificate system, and an online application/planning permit process.
Showgrounds redevelopment
Funding of $101 million has been provided to redevelop the Royal Melbourne Showgrounds at Ascot Vale. The redevelopment will address compliance and safety issues at the Showgrounds, and will provide high quality facilities for the Royal Melbourne Show and other activities held at the site.
Premier and Cabinet
Output initiatives
Table A14: Output initiatives—Department of Premier and Cabinet
| | 2001-02 | 2002-03 | 2003-04 | 2004-05 | 2005-06 | |||||
|---|---|---|---|---|---|---|---|---|---|---|
| | ($ million) | |||||||||
| Victorian Electronic Records Strategy—Centre of Excellence | — | 1.5 | 1.2 | — | — | |||||
| Australian Graduate School of Government | — | 2.4 | 0.4 | 0.5 | 0.5 | |||||
| Museum Victoria new spaces | 4.8 | 4.3 | 4.3 | 4.3 | 4.3 | |||||
| State Library of Victoria new spaces | — | 0.3 | 0.8 | 1.5 | 1.5 | |||||
| State-owned facilities new spaces | — | 0.7 | 0.7 | 0.7 | 0.7 | |||||
| Language services provision | — | 0.5 | 0.5 | 0.5 | 0.5 | |||||
| Victorian Multicultural Commission grant program | — | 0.3 | 0.8 | 0.8 | 0.8 | |||||
| Enhancing skills and capabilities of the public sector | — | 2.3 | 2.3 | 2.3 | 2.3 | |||||
| Regional Arts Infrastructure Fund | — | 0.5 | 0.5 | 0.5 | 0.5 | |||||
| Melbourne Symphony Orchestra | 0.4 | — | — | — | — | |||||
| Gift to East Timor | 0.1 | — | — | — | — | |||||
| Total output initiatives | 5.3 | 12.7 | 11.4 | 11.0 | 11.0 | |||||
Source: Department of Treasury and Finance
Victorian Electronic Records Strategy—Centre of Excellence
Funding is provided for the Electronic Records Centre of Excellence which is the first step in the implementation of the Public Record Office Victoria's Victorian Electronic Records Strategy across Government. This will ensure that the important digital information of the Government is securely managed and accessible in the long term (20+ years).
Australian Graduate School of Government
In February 2001 the Premier announced that Victoria would work with universities and other governments to develop a world-class school of government. Funding has been provided to support the initial set-up costs associated with the School and an ongoing endowment.
Museum Victoria new spaces
Since opening the Melbourne Museum at Carlton Gardens in October 2000, Museum Victoria revised its costs and revenues estimates for the operation of the campus. The additional funding is designed to enable the Melbourne Museum to continue to deliver the current levels of visitor experience, improved research, new exhibitions and maintenance of collections and the building.
State Library of Victoria new spaces
Additional funds have been provided to address operating costs associated with increased open access spaces resulting from the Library's redevelopment.
State-owned facilities new spaces
Funding has been provided for the Malthouse Plaza and the Museum of Modern Art at Heide to address additional costs associated with maintenance, essential services, programming and increased gallery spaces.
Language services provision
Funding has been provided to enable the Victorian Office of Multicultural Affairs to implement a range of ongoing improvements to service delivery designed to generally improve the level of supply and quality of interpreters.
Victorian Multicultural Commission grant program
Funding has been provided to continue the Government's commitment to expanding the Victorian Multicultural Commission community grants program.
Enhancing skills and capabilities of the public sector
Funding has been provided for a new division within the Department to lead public service employment issues and represent the interests of government as employer. This involves a transfer of functions from the Office of Public Employment and Industrial Relations Victoria.
Regional Arts Infrastructure Fund
Funds have been provided to continue the Government's election commitment to a Regional Arts Infrastructure Fund to tackle the backlog of arts infrastructure projects in regional Victoria. This fund will provide additional capital funds to improve regional museum buildings, concert halls, theatre and other cultural facilities.
Melbourne Symphony Orchestra
The State Government has provided funds to support the Melbourne Symphony Orchestra's tour of China and participation in the Shanghai International Festival.
Gift to East Timor
Funds have been provided to help develop soccer infrastructure in East Timor through the East Timor Football Federation and provide equipment and uniforms for the sporting events that will take place as part of the East Timor independence celebrations.
Asset investment initiatives
Table A15: Asset investment initiatives—Department of Premier and Cabinet
| | 2001-02 | 2002-03 | 2003-04 | 2004-05 | 2005-06 | TEI | ||||||
|---|---|---|---|---|---|---|---|---|---|---|---|---|
| | ($ million) | |||||||||||
| Victorian Electronic Records Strategy—Repository | — | 2.5 | 3.0 | — | — | 5.5 | ||||||
| Exhibition redevelopment—Museum Victoria | — | 1.3 | 1.4 | — | — | 2.7 | ||||||
| Victorian Arts Centre Trust | — | 2.1 | 2.1 | 2.1 | 2.1 | 8.4 | ||||||
| Yarra Precinct arts integration project | — | 2.5 | 10.0 | 14.0 | 15.5 | 61.0 | ||||||
| Malthouse Plaza | 0.7 | — | — | — | — | 0.7 | ||||||
| Total asset investment initiatives | 0.7 | 8.4 | 16.5 | 16.1 | 17.6 | 78.3 | ||||||
Source: Department of Treasury and Finance
Victorian Electronic Records Strategy—Repository
This funding is to enable the Public Records Office Victoria to build appropriate infrastructure to support the Victorian Electronic Records Strategy and house the permanent electronic records of the State.
Exhibition redevelopment—Museum Victoria
Additional funds are provided to enable the Scienceworks campus of Museum Victoria to refresh and renew a number of its permanent exhibits.
Victorian Arts Centre Trust
Funding is provided to enable the Victorian Arts Centre Trust to implement its 25-year asset management plan which focuses on the responsible management of the Trust's significant physical assets.
Yarra Precinct arts integration project
Funding for a new project to provide a 1000-seat recital hall, a permanent home for the Melbourne Theatre Company and a pedestrian connection between the arts precinct and Southbank.
Malthouse Plaza
Additional funds have been provided to enable the completion of public open space amenity works surrounding the new contemporary art complex at the Malthouse Plaza.
Tourism, Sport and the Commonwealth Games
Output initiatives
Table A16: Output initiatives—Department of Tourism, Sport and the Commonwealth Games
| | 2001-02 | 2002-03 | 2003-04 | 2004-05 | 2005-06 | |||||
|---|---|---|---|---|---|---|---|---|---|---|
| | ($ million) | |||||||||
| Assistance to Victorian racing industry | — | 4.0 | 4.0 | 4.0 | 4.0 | |||||
| Tourism recovery package | 10.0 | — | — | — | — | |||||
| Commonwealth Games Organising Committee | — | 10.4 | — | — | — | |||||
| Office of Commonwealth Games Coordination | — | 1.8 | — | — | — | |||||
| Commonwealth Games Athletes' Village | — | 1.5 | — | — | — | |||||
| Safer and improved aquatic recreation | — | 2.2 | — | — | — | |||||
| Injury prevention and women's participation in sport | — | 0.3 | 0.3 | 0.3 | 0.3 | |||||
| Melbourne Convention and Visitors Bureau | — | 1.5 | 1.5 | 1.5 | 1.5 | |||||
| Tourism marketing | — | 0.6 | — | — | — | |||||
| Licence fees for the Australian Commonwealth Games Association and the Commonwealth Games Federation | 21.4 | — | — | — | — | |||||
| Victorian Institute of Sport | 1.5 | — | — | — | — | |||||
| Kardinia Park redevelopment | 0.2 | — | — | — | — | |||||
| Total output initiatives | 33.1 | 22.3 | 5.8 | 5.8 | 5.8 | |||||
Source: Department of Treasury and Finance
Assistance to Victorian racing industry
The 2001-02 Budget provided transitional funding to compensate the Victorian racing industry from the impact of the additional government levy on gaming machines. Compensation funding is now being extended beyond the 2001-02 financial year to cover future year impacts of the additional gaming machine levy on the Victorian racing industry. This is to be reviewed in 2004-05.
Tourism recovery package
Funding is allocated in 2001-02 to provide assistance to the tourism industry in response to the Ansett collapse and terrorism. The funding is to be directed to domestic and international marketing and promotion of Victoria to help minimise the impacts.
Commonwealth Games Organising Committee (M2006)
Funding is provided to the 2006 Commonwealth Games Organising Committee to continue the detailed planning and coordination for the Melbourne 2006 Commonwealth Games.
Office of Commonwealth Games Coordination
Funding is provided to establish a dedicated Office of Commonwealth Games Coordination within the Department of Tourism, Sport and the Commonwealth Games. The office will be the Government's liaison point with M2006 and manage the Government's involvement in the preparations for the Melbourne 2006 Commonwealth Games.
Commonwealth Games Athletes' Village
Funding is provided for the continuation of project management and the tender process for the design and construction of the Commonwealth Games Athletes' Village. The village will accommodate the 6 000 athletes and officials involved in the Commonwealth Games. The Commonwealth Games Athletes' Village project is a joint venture between the private and public sectors.
Safer and improved aquatic recreation
Funding is provided from the Community Support Fund for the continuation of the Government's safer and improved aquatic recreation policy. Specific initiatives include improved water safety signage and public awareness campaign designed to prevent toddler drownings.
Injury prevention and women's participation in sport
Funding is provided from the footy tipping competition revenue for improved research and evaluation in the areas of women's sport and sports injury. This policy includes funding for up to eight research grants in this area.
Melbourne Convention and Visitors Bureau
Funding is provided for the Melbourne Convention and Visitors Bureau to expand international sales activities in key markets and expand current levels of promotional programs established around conference-related trade events.
Tourism marketing
Funding is provided to Tourism Victoria for activities to be undertaken as part of tourism promotion at the Manchester 2002 Commonwealth Games. These activities include international promotional activities in key Commonwealth markets, familiarisation programs with inbound operators and journalists, and local and interstate campaigns to increase interest in the 2006 Commonwealth Games.
Licence fees for the Australian Commonwealth Games Association and the Commonwealth Games Federation
Funding is provided in 2001-02 for upfront payment of the remaining outstanding licence fees to the Australian Commonwealth Games Association and the Commonwealth Games Federation.
Victorian Institute of Sport
Additional funding is provided in 2001-02 to enable the Victorian Institute of Sport to intensify talent identification in Commonwealth Games sports, for example to boost the Victorian representation at the Melbourne 2006 Commonwealth Games.
Kardinia Park redevelopment
Funding is provided in 2001-02 to undertake additional work on the proposed redevelopment of Kardinia Park. This involves examining issues such as the socio-economic impacts on Geelong and the region, options for project delivery and options for future stadium management.
Asset investment initiatives
Table A17: Asset investment initiatives—Department of Tourism, Sport and the Commonwealth Games
| | 2001-02 | 2002-03 | 2003-04 | 2004-05 | 2005-06 | TEI | ||||||
|---|---|---|---|---|---|---|---|---|---|---|---|---|
| | ($ million) | |||||||||||
| Melbourne Sports and Aquatic Centre | — | 7.0 | 22.0 | 21.0 | — | 50.0 | ||||||
| Sports and recreation camps | — | 0.8 | — | — | — | 0.8 | ||||||
| Total asset investment initiatives | 0.0 | 7.8 | 22.0 | 21.0 | 0.0 | 50.8 | ||||||
Source: Department of Treasury and Finance
Melbourne Sports and Aquatic Centre
Funding is provided for the redevelopment of the Melbourne Sports and Aquatic Centre (MSAC). The MSAC redevelopment will involve the construction of a 12 000-seat capacity competition pool as well as car parking and leisure water facilities.
Sport and recreation camps
Funding is provided for upgrading sport and recreation camps located at Howman's Gap, Manyung and Mt Evelyn to eliminate potential risks to employees and the general public using these facilities.
Treasury and Finance
Output initiatives
Table A18: Output initiatives—Department of Treasury and Finance
| | 2001-02 | 2002-03 | 2003-04 | 2004-05 | 2005-06 | |||||
|---|---|---|---|---|---|---|---|---|---|---|
| | ($ million) | |||||||||
| Essential Services Commission | — | 4.3 | 4.4 | 4.4 | 4.4 | |||||
| SRO compliance activity | — | 2.6 | 1.6 | — | — | |||||
| Ensuring DTF's policy and risk management capability | — | 3.5 | 3.5 | 3.5 | 3.5 | |||||
| Total output initiatives | 0.0 | 10.4 | 9.5 | 7.9 | 7.9 | |||||
Source: Department of Treasury and Finance
Essential Services Commission
Additional funds to provide for the ongoing operation of the Commission which is charged with ensuring high quality, reliable and safe provision of electricity, gas and water services for all Victorians. Funding for the Commission follows the completion of the budget and management review that was undertaken during 2001-02.
SRO compliance activity
Funding is provided to the State Revenue Office to increase the level of compliance activity, using online compliance measures and data-matching methodology with respect to payroll tax and document return duty on behalf of the State Revenue Office.
Ensuring DTF's policy and risk management capability
Additional funding is provided to enable the Department to meet its expanded service delivery requirements.
Asset investment initiatives
Table A19: Asset investment initiatives—Department of Treasury and Finance
| | 2001-02 | 2002-03 | 2003-04 | 2004-05 | 2005-06 | TEI | ||||||
|---|---|---|---|---|---|---|---|---|---|---|---|---|
| | ($ million) | |||||||||||
| Refurbishment of floors 1 and 2 of 565 Lonsdale Street | — | 2.9 | — | — | — | 2.9 | ||||||
| IT network upgrade | 2.0 | — | — | — | — | 2.0 | ||||||
| Total asset investment initiatives | 2.0 | 2.9 | 0.0 | 0.0 | 0.0 | 4.9 | ||||||
Source: Department of Treasury and Finance
Refurbishment of floors 1 and 2 of 565 Lonsdale Street
Funding has been approved to allow the refurbishment of two floors at 565 Lonsdale Street vacated by the County Court. The project will convert the current specific purpose courtrooms and central congregation areas to office space to enable the Victorian Government Reporting Service to occupy the floors, following the expiry of the Service's current lease.
IT network upgrade
Funding has been provided to assist with the upgrade of the present IT network configuration supporting the Departments of Treasury and Finance and Premier and Cabinet, which has been in place for the last 31/2 years and is considered to be old technology by current industry standards.
Parliament
Output initiatives
Table A20: Output initiatives—Parliament
| | 2001-02 | 2002-03 | 2003-04 | 2004-05 | 2005-06 | |||||
|---|---|---|---|---|---|---|---|---|---|---|
| | ($ million) | |||||||||
| Electorate Office redistribution | — | — | 1.9 | — | — | |||||
| IT catch-up initiatives | — | 2.8 | 0.8 | 0.9 | 0.8 | |||||
| Human resource system (Empower) | — | 0.1 | 0.0 | 0.0 | 0.0 | |||||
| Electronic news service | — | 0.3 | 0.3 | 0.3 | 0.3 | |||||
| Parliamentary Chambers audio system | — | 0.1 | 0.1 | 0.1 | 0.1 | |||||
| Total output initiatives | 0.0 | 3.3 | 3.0 | 1.3 | 1.1 | |||||
Source: Department of Treasury and Finance
Electorate Office redistribution
Additional funds have been provided to enable the relocation of 14 member offices as a result of the Australian Electorate Commission redistribution of Victoria's state electoral boundaries.
IT catch-up initiatives
Funding is provided to enable Parliament to address a number of critical shortfalls. This initiative will provide Parliament with a standard operating environment consistent with government departments and enable it to interact online with these departments and agencies.
Human resource system (Empower)
Funding is provided to allow Parliament to enter into an ongoing contract with Empower to provide its human resource system and to implement a number of improvements to optimise the use of technology-based solutions for a broader range of HR issues.
Electronic news service
Parliament will implement an electronic news service for Members of Parliament in partnership with Australian Associated Press.
Parliamentary Chambers audio system
Funding has been provided for the ongoing maintenance of the audio system in the Legislative Council and Legislative Assembly.
Asset investment initiatives
Table A21: Asset investment initiatives—Parliament
| | 2001-02 | 2002-03 | 2003-04 | 2004-05 | 2005-06 | TEI | ||||||
|---|---|---|---|---|---|---|---|---|---|---|---|---|
| | ($ million) | |||||||||||
| Air quality improvement project (stage 3 and 4) | — | 1.4 | — | — | — | 1.4 | ||||||
| Refurbishment of the Legislative Assembly Chamber | — | 0.9 | — | — | — | 0.9 | ||||||
| Refurbishment of office accommodation at 157 Spring Street | — | 1.2 | — | — | — | 1.2 | ||||||
| Total asset investment initiatives | 0.0 | 3.5 | 0.0 | 0.0 | 0.0 | 3.5 | ||||||
Source: Department of Treasury and Finance
Air quality improvement project (stage 3 and 4)
Additional funds have been provided to complete the installation of air conditioning throughout Parliament House and address additional requirements related to the heritage status of the building.
Refurbishment of the Legislative Assembly Chamber
Additional funds have been provided for this project to address costs associated with heritage considerations and to take advantage of the refurbishment to complete disability access to the public and press gallery spaces and install integrated technology for lighting, audio and data cabling.
Refurbishment of office accommodation at 157 Spring Street
Funding is provided for costs associated with the fit-out and refurbishment of office space located at 157 Spring Street.
REVENUE INITIATIVES
Table A22: Revenue initiatives
| | 2001-02 | 2002-03 | 2003-04 | 2004-05 | 2005-06 | |||||
|---|---|---|---|---|---|---|---|---|---|---|
| | ($ million) | |||||||||
| Bring forward payroll tax threshold increase to 1 July 2002 | — | -23.0 | -2.0 | — | — | |||||
| Bring forward payroll tax rate cut to 5.35 per cent to 1 July 2002 | — | -47.0 | -4.0 | — | — | |||||
| Payroll tax rate reduction to 5.25 per cent from 1 July 2003 | — | — | -49.0 | -56.0 | -59.0 | |||||
| Increase in land tax threshold | — | -3.0 | -3.0 | -3.0 | -3.0 | |||||
| Bring forward abolition of stamp duty on unquoted marketable securities | — | -10.0 | — | — | — | |||||
| Reforming existing concessions on conveyancing duty | — | -13.0 | -13.0 | -13.0 | -13.0 | |||||
| Total revenue initiatives | 0.0 | -96.0 | -71.0 | -72.0 | -75.0 | |||||
Source: Department of Treasury and Finance
Bring forward the payroll tax threshold increase to 1 July 2002
The decision to increase the payroll tax threshold to $550 000 (from $515 000) on 1 July 2003 was part of the Bracks Government's package of Better Business Taxes aimed at, among other things, reducing the burden of payroll tax for all Victorian businesses.
This initiative, announced in the Government's Building Tomorrow's Businesses Today package, brings forward the previously announced increase in the payroll tax threshold to $550 000 by one year to 1 July 2002. This will have a one-off impact on business growth and employment in Victoria. Over 300 small Victorian businesses that have been liable to payroll tax in the past will now drop out of the net one year earlier than they would otherwise. The majority of these businesses are likely to be in the manufacturing, wholesale trade and the property and business services sectors. This change will also reduce tax compliance costs for small businesses that will move below the payroll tax threshold.
Bring forward the payroll tax rate cut to 1 July 2002
The decision to reduce the payroll tax rate to 5.35 per cent (from 5.45 per cent) on 1 July 2003 was also part of the Bracks Government's package of Better Business Taxes aimed at, among other things, reducing the burden of payroll tax for all Victorian businesses and consolidating Victoria's payroll tax competitiveness position.
This initiative, announced in Building Tomorrow's Businesses Today, brings forward the previously announced reduction in the payroll tax rate to 5.35 per cent by one year to 1 July 2002.
Reducing the payroll tax rate will lower the payroll tax burden by 1.8 per cent for around 12 000 payroll tax paying employer groups one year earlier than would otherwise occur, providing a boost to employment for the Victorian economy.
Payroll tax rate reduction to 5.25 per cent from 1 July 2003
The Victorian Government will further reduce the payroll tax rate to 5.25 per cent from 1 July 2003 in light of its commitment to improve the tax environment for business. This Building Tomorrow's Businesses Today initiative will represent a 9 per cent reduction in the payroll tax rate under the Bracks Government.
Increase in land tax threshold to $150 000 from $125 000
The land tax threshold was raised from $85 000 to $125 000 as part of the Bracks Government's Better Business Taxes package. At the time, this reform was expected to remove 46 000 small businesses, investors and self-funded retirees from the land tax net in 2001-02.
The Building Tomorrow's Businesses Today initiative to increase the land tax threshold to $150 000 will remove 21 000 land tax payers from the burden of paying land tax in the 2003 land tax year.
Bring forward the abolition of stamp duty on unquoted marketable securities
Stamp duty on unquoted marketable securities impedes investment decisions and financing, especially for small businesses. As part of the Government's commitment to improve business outcomes through the Building Tomorrow's Businesses Today package, it will bring forward the previously announced abolition of unquoted marketable securities by one year (from 1 July 2003 to 1 July 2002).
Reforming existing concessions on conveyancing duty
The Government has reformed, streamlined and expanded existing concessions for conveyancing duty to target concession card holders and first home buying families with dependent children. As a result, a full concession of up to $4 660 will be available from 1 July 2002 for the purchase of homes valued up to $150 000 for eligible persons and a partial concession for the purchase of homes valued between $150 000 and $200 000. The income test for families will be removed. Total beneficiaries under both schemes are likely to almost double to about 8 000.
SAVINGS INITIATIVES
| | 2002-03 | 2003-04 | 2004-05 | 2005-06 | ||||
|---|---|---|---|---|---|---|---|---|
| | ($ million) | |||||||
| Government motor vehicle fleet savings | -3.5 | -7.5 | -9.0 | -10.5 | ||||
| Motor vehicle registration labels (DOI) | — | -1.0 | -3.4 | -3.4 | ||||
| Rural and regional (DIIRD) | -2.0 | -2.0 | -2.0 | -2.0 | ||||
| Corporate service savings (DoJ) | — | -0.6 | -1.2 | -1.2 | ||||
| Total revenue initiatives | -5.5 | -11.1 | -15.6 | -17.1 | ||||
Source: Department of Treasury and Finance
Government motor vehicle fleet savings
A range of initiatives will be implemented across Government to curtail costs associated with the motor vehicle fleet and reduce the associated greenhouse emissions. These initiatives include changed vehicle retention regimes, a modest reduction in the fleet size, the appropriate use of high environmental performance vehicles, increased use of LPG and four cylinder vehicles, the examination of options for regional car pools and more comprehensive driver training.
Motor vehicle registration labels
Savings will be generated by VicRoads as a result of the suspension of the issue of motor vehicle registration labels from the 2003-04 financial year. The issue of registration labels is not required as they are not used by Victoria Police or VicRoads to authenticate vehicle registration. Verification of vehicle registration can only reliably occur by contacting VicRoads directly. Motorists will continue to receive invoices.
Living Regions, Living Suburbs
The Living Regions, Living Suburbs fund will be reduced by $2 million ongoing. This funding will be redirected to the Government's other rural and regional activities.
Corporate service savings
Streamlining a number of corporate business units across the Justice portfolio will result in operational savings of $0.6 million in 2003-04 and $1.2 million ongoing. The stramlining of business functions such as finance, human resources, IT support, property management and fleet services will assist in improving coordination and consistency across the Justice portfolio.
APPENDIX B: GROWING VICTORIA INFRASTRUCTURE RESERVE
Table B1: Growing Victoria infrastructure reserve—funding by project
| Project | 2001-02 | 2002-03 | 2003-04 | 2004-05 | 2005-06 | TEI(a) from GV | ||||||
|---|---|---|---|---|---|---|---|---|---|---|---|---|
| | ($ million) | |||||||||||
| Linking Victoria | ||||||||||||
| Fast rail links to regional centres (DOI) | 32.0 | 110.0 | 110.0 | 170.0 | 128.0 | 550.0 | ||||||
| Total allocated to Linking Victoria | 32.0 | 110.0 | 110.0 | 170.0 | 128.0 | 550.0 | ||||||
| Skilling Victoria | ||||||||||||
| Modernisation/upgrade of facilities—schools (DE&T)(b) | 53.0 | — | — | — | — | 110.0 | ||||||
| Innovating Victoria: Enhanced learning environments—schools (DE&T) | 21.9 | 36.8 | 31.3 | — | — | 90.0 | ||||||
| Innovating Victoria: Enhanced learning environments—TAFE (DE&T) | 9.2 | 23.3 | 12.5 | — | — | 45.0 | ||||||
| Education precinct in Gippsland (DE&T) | 2.5 | 7.0 | 1.0 | — | — | 10.5 | ||||||
| Ballarat Vocational Education and Training Centre (DE&T) | 2.0 | 3.0 | — | — | — | 5.0 | ||||||
| Modernisation of facilities—Maryborough education precinct (DE&T) | 0.6 | — | — | — | — | 0.6 | ||||||
| Australian College of Wine (DE&T) | 4.0 | 3.4 | — | — | — | 7.4 | ||||||
| Bacchus Marsh Science and Technology Centre (DE&T) | 1.8 | 2.2 | — | — | — | 4.0 | ||||||
| Gene Technology Access Centre (DE&T) | 2.2 | 1.4 | 0.6 | — | — | 4.2 | ||||||
| Space Science Education Centre (DE&T) | 2.4 | 2.8 | 1.2 | — | — | 6.4 | ||||||
| Science innovation and education precincts across regional Victoria (DNRE) | 10.0 | 20.0 | 20.0 | — | — | 50.0 | ||||||
| Total allocated to Skilling Victoria | 109.6 | 99.9 | 66.6 | — | — | 333.1 | ||||||
Connecting Victoria | ||||||||||||
| E-Government—redevelopment of vic.gov.au portal (DIIRD) | 4.0 | — | — | — | — | 4.0 | ||||||
| Modernisation of school facilities to incorporate ICT (DE&T) | 20.0 | 20.0 | — | — | — | 40.0 | ||||||
| Broadband ICT delivery infrastructure for TAFE (DE&T) | 6.8 | 8.1 | 4.1 | — | — | 19.0 | ||||||
| Regional telecommunications infrastructure (DNRE) | 2.4 | 0.3 | 0.3 | — | — | 3.0 | ||||||
| Bridging the Digital Divide (DE&T) | 17.0 | 3.0 | 3.0 | — | — | 23.0 | ||||||
| Information and communication technology strategy for health care (DHS) | 9.5 | 14.0 | 6.5 | — | — | 30.0 | ||||||
| Land titles automation project (DNRE) | 18.2 | — | — | — | — | 18.2 | ||||||
| Information technology document management centre (DNRE) | 4.8 | — | — | — | — | 4.8 | ||||||
| Total allocated to Connecting Victoria | 82.7 | 45.4 | 13.9 | — | — | 142.0 | ||||||
| Other asset projects(c) | 315.0 | 315.0 | ||||||||||
| Total Growing Victoria allocation to date(b) | 224.2 | 570.3 | 190.5 | 170.0 | 128.0 | 1340.0 | ||||||
| Unallocated(d) | 235.0 | 235.0 | ||||||||||
| Total Growing Victoria infrastructure reserve | 1575.0 | |||||||||||
Source: Department of Treasury and Finance
- Notes:
- (a)
- Total estimated investment.
- (b)
- Total estimated investment includes $57 million expenditure in 2000-01, which is the difference between the sum of the years and the $1 340 million total.
- (c)
- Allocated to fund projects approved as part of 2002-03 asset program generally.
- (d)
- The unallocated component will contribute to funding Government's general asset investment initiatives in the 2003-04 Budget.
APPENDIX C: REVISED 2001-02 BUDGET OUTCOME
This appendix provides revised estimates of the reported budget outcome for the 2001-02 financial year. The revised 2001-02 estimates take into account government policy decisions and economic developments impacting on both revenue and expenses since the presentation of the 2001-02 Budget to Parliament.
REVISED 2001-02 STATEMENT OF FINANCIAL PERFORMANCE
The revised 2001-02 statement of financial performance is presented in Table C1. The revised budget sector operating result for 2001-02 is a surplus of $765 million, which is $257 million higher than published at budget time in May 2001. The improvement in the budget outlook over this period is mainly attributable to stronger than expected revenue growth, partly offset by an increase in operating expenses. The latest estimate is marginally lower than the $792 million forecast provided in the January 2002 Budget Update.
Operating revenue
Total estimated operating revenue for 2001-02 has been revised upward by $1 541 million, or 6.6 per cent, from the budget estimate of $23 466 million. A large part of the improvement in the revenue outlook is attributable to the continued strength of the Victorian economy. Property market activity, in particular, is much stronger than anticipated at budget time. There has also been higher than budgeted revenue from Commonwealth grants, investments and from a range of other miscellaneous revenue items.
Table C1: 2001-02 Statement of financial performance
| | 2001-02 Budget | 2001-02 Revised | Change | Change | ||||
|---|---|---|---|---|---|---|---|---|
| | ($ million) | (%) | ||||||
| Revenue | ||||||||
| Taxation | 7 976.5 | 8 758.0 | 781.4 | 9.8 | ||||
| Fines and regulatory fees | 374.2 | 386.6 | 12.4 | 3.3 | ||||
| Investment revenue | 938.2 | 1 049.4 | 111.3 | 11.9 | ||||
| Grants | 11 311.7 | 11 755.3 | 443.6 | 3.9 | ||||
| Sale of goods and services | 2 111.6 | 2 037.7 | -74.0 | -3.5 | ||||
| Gains on the disposal of physical assets | 13.2 | 24.0 | 10.8 | 81.6 | ||||
| Fair value of assets received free of charge | — | 4.5 | 4.5 | — | ||||
| Inter sector capital asset charge | 489.0 | 489.0 | — | — | ||||
| Other revenue | 251.0 | 502.4 | 251.4 | 100.1 | ||||
| Total revenue | 23 465.5 | 25 006.8 | 1 541.3 | 6.6 | ||||
Expenses | ||||||||
| Employee entitlements | 8 411.5 | 8 531.7 | 120.2 | 1.4 | ||||
| Superannuation | 1 506.9 | 2 048.8 | 541.9 | 36.0 | ||||
| Depreciation | 871.3 | 895.4 | 24.2 | 2.8 | ||||
| Amortisation | 23.8 | 59.1 | 35.4 | 148.8 | ||||
| Borrowing costs | 477.6 | 496.2 | 18.7 | 3.9 | ||||
| Grants and transfer payments | 3 954.9 | 4 347.4 | 392.5 | 9.9 | ||||
| Supplies and services | 7 672.3 | 7 830.0 | 157.7 | 2.1 | ||||
| Other expenses | 38.8 | 32.8 | -6.0 | -15.4 | ||||
| Total expenses | 22 957.0 | 24 241.5 | 1 284.5 | 5.6 | ||||
| Operating surplus | 508.5 | 765.3 | 256.8 | 50.5 | ||||
Source: Department of Treasury and Finance
Taxation
In 2001-02, state taxation revenue is expected to total $8 758 million, $781 million or 9.8 per cent higher than the 2001-02 Budget estimate (see Table C2). The anticipated additional revenue for 2001-02 mainly reflects higher collections of conveyancing and mortgage stamp duty revenue.
Table C2: 2001-02 Taxation
| | 2001-02 Budget | 2001-02 Revised | Change | Change | ||||
|---|---|---|---|---|---|---|---|---|
| | ($ million) | (%) | ||||||
| Payroll tax | 2 607.2 | 2 608.5 | 1.3 | 0.0 | ||||
| Taxes on property | 659.7 | 614.4 | -45.3 | -6.9 | ||||
| Financial and capital transactions | 1 618.0 | 2 391.0 | 772.9 | 47.8 | ||||
| Gambling | 1 374.1 | 1 373.4 | -0.7 | -0.1 | ||||
| Insurance | 695.8 | 725.5 | 29.7 | 4.3 | ||||
| Motor vehicles | 989.9 | 1 013.4 | 23.5 | 2.4 | ||||
| Other licences and levies | 31.7 | 31.7 | — | — | ||||
| Total taxation | 7 976.5 | 8 758.0 | 781.4 | 9.8 | ||||
Source: Department of Treasury and Finance
Payroll tax
Payroll tax revenue in 2001-02 is estimated to be $2 609 million, which is on track with the 2001-02 Budget estimate.
Taxes on property
Taxes on property include land tax, the metropolitan improvement levy and local government contributions to fire brigades.
Total property tax collections in 2001-02 are estimated to be $614 million, $45 million or 6.9 per cent lower than the budget estimate, mainly due to lower than expected land tax revenue. The 2001-02 budget estimate for land tax was based on estimated land values as at 1 January 2000 using indicative equalisation factors provided by the Valuer-General while the current revised estimate is based on the actual site value of land as at 1 January 2000, as determined by individual local councils.
Taxes on financial and capital transactions
Taxes on financial and capital transactions include stamp duties principally from land transfers, mortgages and debits tax.
Total taxation revenue from financial and capital transactions in 2001-02 is estimated to be $2 391 million, $773 million or 47.8 per cent higher than the 2001-02 Budget estimate.
Stamp duty revenue from land transfers and mortgages accounts for $759 million of the increase. The 2001-02 Budget estimates assumed a slowdown in property market activity which has failed to occur, indeed the property market has become stronger in terms of both prices and volumes.
The continuing strength in 2001-02 reflects several factors including strong population growth from interstate migration, the relative resilience of the Victorian economy and labour market during the current global slowdown, the First Home Owners' Grant, low interest rates and instability in equity markets.
Gambling
Aggregate gambling tax revenue in 2001-02 is estimated at $1 373 million, largely unchanged from the 2001-02 Budget estimate.
Insurance
Insurance tax revenue in 2001-02 is estimated at $726 million, which is $30 million or 4.3 per cent higher than the 2001-02 Budget estimate.
Stamp duty from general (non-life) insurance accounts for the majority of the growth. Premiums for some risk categories (e.g. public liability and professional indemnity) rose substantially while household and motor vehicle premiums showed more moderate growth. The reasons for the strong premium growth include balance sheet improvements by insurers, cyclical price movements, recent world events and issues under investigation by the HIH Royal Commission.
Motor vehicles
Motor vehicle taxation revenue in 2001-02 is estimated at $1 013 million which is $24 million or 2.4 per cent higher than the 2001-02 Budget estimate. The higher than expected revenue largely reflects increases in both heavy vehicle registration fees and stamp duty revenue on motor vehicle transfers, reflecting strong population growth.
Other licences and levies
Revenue from other licences and levies comprises the landfill levy and Transurban concession fees and is in line with the 2001-02 Budget estimate.
Fines and regulatory fees
Revenue from fines and regulatory fees is estimated at $387 million, which is $12 million or 3.3 per cent higher than the 2001-02 Budget estimate. The estimated increase reflects stronger than expected growth in Traffic Camera Office fines.
Investment income
Total investment income is expected to be $111 million higher than forecast in the 2001-02 Budget (see Table C3). This is largely due to an increase in interest revenue of $111 million, mainly reflecting investment returns generated on higher than expected general government sector cash surpluses. "Other' investment revenue is also higher than budgeted by $60 million, mainly reflecting an increase in notional revenue of $39 million associated with the centrally managed vehicle leasing facility and building rental and signage income ($15 million) of hospitals.
These increases are partially offset by lower income tax equivalent revenue of $68 million, mainly attributable to a refund for the overpayment of income tax by the Transport Accident Commission (TAC) in 2000-01, and the impact of lower than expected investment returns for the TAC in 2001-02. Dividend revenue is expected to be broadly in line with the 2001-02 Budget, with higher than anticipated dividends from water sector enterprises (reflecting increased activity in the property market) being offset by lower than anticipated dividends from the TAC.
Table C3: 2001-02 Investment income
| | 2001-02 Budget | 2001-02 Revised | Change | Change % | ||||
|---|---|---|---|---|---|---|---|---|
| | ($ million) | (%) | ||||||
| Dividends | 498.9 | 505.1 | 6.2 | 1.2 | ||||
| Tax and rate equivalent revenue | 120.3 | 52.4 | -67.9 | -56.4 | ||||
| Interest | 206.7 | 318.1 | 111.4 | 53.9 | ||||
| Investment gains | — | 9.4 | 9.4 | — | ||||
| Royalties | 42.0 | 41.3 | -0.6 | -1.5 | ||||
| Rents | 23.9 | 17.2 | -6.8 | -28.3 | ||||
| Other | 46.4 | 106.0 | 59.5 | 128.2 | ||||
| Total investment revenue | 938.2 | 1 049.4 | 111.3 | 11.9 | ||||
Source: Department of Treasury and Finance
Grants
As highlighted in Table C4, total grants received are now expected to be $444 million higher than budget, with both general purpose and specific purpose grants contributing approximately equal proportions to the overall grants increase. It is noteworthy that in both cases there is typically an associated spending pressure such as a price increase, increased service need linked to population growth or a requirement to deliver agreed Commonwealth programs.
The increase in general purpose grants largely relates to increased expenditure on the First Home Owners Grant scheme, revised estimates of Victoria's share of the national population and CPI linked adjustments.
The increase in specific purpose payments from the Commonwealth, mainly relates to the Commonwealth New First Home Owners' Grant, fringe benefits tax transitional grants for public hospitals and higher than budgeted grants to TAFE by the Australian National Training Authority (ANTA) to fund extra training outcomes.
Table C4: 2001-02 Grants
| | 2001-02 Budget | 2001-02 Revised | Change | Change | ||||
|---|---|---|---|---|---|---|---|---|
| | ($ million) | (%) | ||||||
| Current grants | ||||||||
| General purpose grants | 6 583.7 | 6 799.3 | 215.6 | 3.3 | ||||
| Specific purpose grants for onpassing | 1 146.1 | 1 143.9 | -2.2 | -0.2 | ||||
| Other specific purpose grants | 2 949.6 | 3 166.8 | 217.2 | 7.4 | ||||
| Total current grants | 10 679.4 | 11 110.0 | 430.6 | 4.0 | ||||
Capital grants | ||||||||
| Specific purpose grants for onpassing | 110.7 | 113.3 | 2.6 | 2.3 | ||||
| Other specific purpose grants | 521.6 | 532.0 | 10.4 | 2.0 | ||||
| Total capital grants | 632.3 | 645.3 | 13.0 | 2.1 | ||||
| Total grants | 11 311.7 | 11 755.3 | 443.6 | 3.9 | ||||
Source: Department of Treasury and Finance
Sales of goods and services
The 2001-02 revised estimate for sales of goods and services is $2 038 million, which is $74 million lower than the budgeted estimate of $2 112 million. The variation is largely attributable to a $170 million reclassification to 'Other revenue' to better reflect the nature of revenue raised by schools from their own external activities. This is partially offset by a range of miscellaneous variations including:
- •
- a correction to the General Government Budget estimates to recognise, for the first time, revenue and expenses of a range of non-budget sector agencies (including the Building Control Commission, Docklands Authority, Melbourne Parks and Waterways, Shrine of Remembrance Trustees) has led to an increase in revenue of $67 million;
- •
- an increase in titles office revenue of $20 million, resulting from strong activity in the property market; and
- •
- increased fees of $15 million received by Victorian hospitals for Veterans and repatriation services.
Other revenue
The 2001-02 revised estimate for other revenue is $502 million, which is $251 million higher than the budget estimate. This is largely due to the $170 million reclassification from 'Sales of goods and services' of miscellaneous revenue from schools' own external activities. Other factors contributing to the variance include an increase in third party revenue which is mainly from schools' locally raised funds, additional revenue from private donations to schools and the receipt of recovery money from Tricontinental which is paid as a dividend back to the State.
Operating expenses
As shown in Table C1, general government sector operating expenses for 2001-02 are now forecast to be $24 242 million, around 5.6 per cent or $1 285 million above the budget estimate of $22 957 million.
The increase in operating expenses since the 2001-02 published budget is attributable to a number of factors including:
- •
- superannuation expenses being revised up since the 2001-02 Budget by $542 million. This mainly reflects the impact of new actuarial projections of the State's unfunded superannuation liability which take into account a downward revision to the fund earnings assumption for 2001-02 due to weaker than expected equity markets as well as other revisions to underlying actuarial and economic assumptions, partly offset by savings from the Beneficiary Choice Program;
- •
- higher than budgeted costs associated with implementation of changes to the national taxation system ($123 million in 2001-02), mainly reflecting increased costs associated with the First Home Owners Grant Scheme;
- •
- the impact of the Special Power Payment of $118 million, which provides assistance to householders, small businesses and farmers in outer suburban and regional and rural areas;
- •
- post-budget revisions to Commonwealth specific purpose grants are expected to contribute to an increase in expenses of $105 million in 2001-02. This mainly reflects increased expenditure on the Commonwealth New First Home Owners' Grant. The First Home Owners' Grant was supposed to cease on 31 December 2001, however the Federal Government has extended it to 30 June 2002 resulting in estimated expenditure being revised up by $67 million. Higher than budgeted Commonwealth funding for TAFE programs, the Commonwealth State Disability Agreement and special education programs in health services also contribute to the increase in specific purpose grants;
- •
- increases in expenses of outer budget agencies funded by own source revenue of $116 million (including first time recognition of expenses noted above in sales of goods and services);
- •
- a range of further one-off output initiatives ($84 million), details of which are provided in Appendix A, Specific Policy Initiatives Affecting The Budget Position, including:
- —
- $6 million for initiatives which aim to reduce elective surgery patient waiting times and elective surgery waiting lists;
- —
- funding for the Timber Communities in Partnership package ($9 million) to assist rural and regional areas adversely affected by the restructuring of the State's timber industry;
- —
- $15 million to a joint fund shared with South Australia to boost water flows in the Murray River;
- —
- additional funding for the purchase of sports and physical equipment ($5 million) and for the purchase of library resources ($5 million) in all government primary, secondary, special and language schools; and
- —
- $21 million for upfront payment of the remaining outstanding licence fees to the Australian Commonwealth Games Association (ACGA) and the Commonwealth Games Federation;
- •
- amortisation of motor vehicle leases largely associated with the centrally managed vehicle leasing facility ($32 million);
- •
- costs of $69 million in relation to an interim agreement with tram and train franchisees to enable settlement of contractual claims and disputes and a one-off payment tied to future agreements with operators on business recovery proposals. The interim agreement will bring greater certainty and stability to the franchised public transport system; and
- •
- a range of miscellaneous variations including increased expenses funded by miscellaneous revenue sources, such as increased fees received by Victorian hospitals for Veterans and repatriation services, building rental and signage income and third party revenue in schools.
REVISED 2001-02 CASH FLOW STATEMENT
Table C5 provides the revised cash flow statement for 2001-02.
Net cash flow from operating activities is now expected to be $2 702 million compared with the published estimate of $1 579 million. The $1 124 million variation reflects a $1 489 million increase in operating receipts and a $365 million increase in payments in relation to operating activities.
The expected increase in receipts is attributable to the factors underpinning the $1 541 million increase in operating revenue outlined earlier in this Appendix (see Table C1). The projected increase in payments is lower than the corresponding variance in operating expenses, mainly due to:
- •
- lower than budgeted cash contributions to the State Superannuation Fund of $353 million, reflecting post budget changes to the timing of superannuation contributions, including the bringing forward of the budgeted 2001-02 contribution to 2000-01;
- •
- variations in expenses reflected in the revised operating result but not requiring a cash outlay (mainly in relation to the growth in unfunded superannuation liabilities) of $542 million.
Net infrastructure investment (including net contributions to other sectors of government and the purchase of property, plant and equipment net of asset sales) is expected to total $1 929 million in 2001-02, $190 million higher than the original budget estimate. This increase reflects the result of the following asset investment developments since the 2001-02 Budget of:
- •
- $20 million being invested in 2001-02 in the development of a film and television studio complex at the Melbourne Docklands;
- •
- a range of one-off initiatives ($28 million) which includes $25 million for the purchase of medical equipment for public hospitals;
- •
- $27 million relating to motor vehicle finance leases due to the upwards escalation of new car prices, largely through exchange rate variations;
- •
- an additional $44 million in 2001-02 towards the completion of Federation Square; and
- •
- increased assets funded by own-source revenue in outer budget agencies accounts for the bulk of the balance, the most significant being $41 million in schools.
Net additions to cash and financial investments (including net customer loans repaid and purchases of investments) totals $809 million, which is $1 035 million higher than the budget estimate. This reflects the impact of the higher than expected cash surplus, after allowing for the increased funding requirements of infrastructure investment activities.
Table C5: 2001-02 Cash flow statement
| | 2001-02 Budget | 2001-02 Revised | Change | Change | ||||
|---|---|---|---|---|---|---|---|---|
| | ($ million) | (%) | ||||||
| Cash flows from operating activities | ||||||||
| Receipts | ||||||||
| Taxation | 7 963.1 | 8 744.4 | 781.3 | 9.8 | ||||
| Fines and regulatory fees | 304.7 | 302.7 | -2.0 | -0.7 | ||||
| Grants | 11 311.7 | 11 755.4 | 443.7 | 3.9 | ||||
| Sale of goods and services | 2 110.3 | 2 021.7 | -88.6 | -4.2 | ||||
| Interest received | 206.7 | 318.0 | 111.3 | 53.9 | ||||
| Dividends received | 498.9 | 505.1 | 6.2 | 1.2 | ||||
| Capital asset charge received | 489.0 | 489.0 | — | 0.0 | ||||
| Other receipts | 484.1 | 720.9 | 236.8 | 48.9 | ||||
| Total receipts | 23 368.4 | 24 857.2 | 1 488.8 | 6.4 | ||||
Payments | ||||||||
| Employee entitlements | 8 245.2 | 8 366.9 | 121.7 | 1.5 | ||||
| Superannuation | 1 371.8 | 1 060.4 | -311.4 | -22.7 | ||||
| Grants and transfer payments | 3 953.0 | 4 345.8 | 392.8 | 9.9 | ||||
| Supplies and services | 7 661.6 | 7 836.0 | 174.4 | 2.3 | ||||
| Interest paid | 558.1 | 540.4 | -17.6 | -3.2 | ||||
| Other payments | 0.2 | 5.7 | 5.6 | 3249.1 | ||||
| Total payments | 21 789.8 | 22 155.1 | 365.3 | 1.7 | ||||
| Net cash flows from operating activities | 1 578.6 | 2 702.1 | 1 123.5 | 71.2 | ||||
Cash flows from investing activities | ||||||||
| Net customer loans repaid | 70.6 | 45.6 | -25.0 | -35.5 | ||||
| Net purchases of investments | 126.0 | -830.2 | -956.1 | -759.0 | ||||
| Net contribution to other sectors of government | — | -18.2 | -18.2 | — | ||||
| Sale of property, plant and equipment | 98.2 | 105.5 | 7.3 | 7.4 | ||||
| Purchases of property, plant and equipment | -1 837.6 | -2 016.5 | -178.9 | 9.7 | ||||
| Net cash flows from investing activities | -1 542.7 | -2 713.8 | -1 171.0 | 75.9 | ||||
Cash flows from financing activities | ||||||||
| Net repayments of borrowings | -6.0 | -12.6 | -6.6 | 109.3 | ||||
| Net cash flows from financing activities | - 6.0 | -12.6 | -6.6 | 109.3 | ||||
| Net increase in cash held | 29.9 | -24.3 | -54.1 | -181.2 | ||||
| Cash at beginning of reporting period | 901.8 | 901.8 | — | — | ||||
| Cash at end of reporting period | 931.7 | 877.5 | -54.1 | -5.8 | ||||
Source: Department of Treasury and Finance
REVISED 2001-02 STATEMENT OF FINANCIAL POSITION
The revised 2001-02 statement of financial position is presented in Table C6. Net assets are projected to increase from $18 616 million as at 30 June 2001 to $20 068 million at 30 June 2002. This represents an increase of $1 452 million (7.6 per cent) over the course of 2001-02.
The increase in net assets reflects the impact of the projected operating surplus of $765 million, asset revaluations of $173 million and an increase in accumulated contributions and accumulated surpluses of $514 million (largely due to the integration of the Melbourne Parks and Waterways into the Department of Natural Resources and Environment).
The increase in total assets of $2 519 million is mainly due to an increase in infrastructure expenditure over the period (including projects to be funded by the Growing Victoria infrastructure reserve) and to a lesser extent, growth in general government sector financial investments.
The increase in liabilities of $1 067 million mainly results from an increase in the unfunded superannuation liability for the reasons mentioned earlier.
Table C6: Budget sector statement of financial position as at 30 June
| | 2001 Actual | 2002 Budget | 2002 Revised | Change | Change | |||||
|---|---|---|---|---|---|---|---|---|---|---|
| | ($ million) | (%) | ||||||||
| Current assets | ||||||||||
| Cash assets | 908.4 | 937.6 | 880.6 | -27.8 | -3.0 | |||||
| Other financial assets | 1 186.7 | 1 199.7 | 1 193.4 | 6.6 | 0.6 | |||||
| Receivables | 976.9 | 1 002.8 | 1 028.7 | 51.8 | 5.2 | |||||
| Prepayments | 37.1 | 37.2 | 37.0 | -0.1 | -0.3 | |||||
| Inventories | 165.4 | 165.6 | 163.7 | -1.7 | -1.0 | |||||
| Other assets | 0.1 | 0.1 | 0.1 | — | 0.0 | |||||
| Total current assets | 3 274.6 | 3 343.0 | 3 303.5 | 28.8 | 0.9 | |||||
Non-current assets | ||||||||||
| Other financial assets | 2 129.9 | 1 991.0 | 2 962.9 | 833.0 | 41.8 | |||||
| Receivables | 269.2 | 211.4 | 236.4 | -32.8 | -15.5 | |||||
| Inventories | 135.0 | 135.0 | 135.0 | — | 0.0 | |||||
| Property, plant and equipment | 21 667.6 | 22 353.8 | 22 853.3 | 1 185.7 | 5.3 | |||||
| Roads and earthworks | 12 028.0 | 12 174.4 | 12 506.8 | 478.8 | 3.9 | |||||
| Other assets | 1 740.8 | 1 765.9 | 1 766.0 | 25.2 | 1.4 | |||||
| Total non-current assets | 37 970.5 | 38 631.5 | 40 460.4 | 2 489.9 | 6.4 | |||||
| Total assets | 41 245.2 | 41 974.5 | 43 763.9 | 2 518.7 | 6.0 | |||||
Current liabilities | ||||||||||
| Payables | 1 156.8 | 1 171.4 | 1 144.0 | -12.8 | -1.1 | |||||
| Interest-bearing liabilities | 157.2 | 63.5 | 80.6 | -76.6 | -120.6 | |||||
| Employee entitlements | 758.2 | 763.6 | 791.9 | 33.7 | 4.4 | |||||
| Superannuation | 63.6 | 119.4 | 382.4 | 318.8 | 266.9 | |||||
| Other liabilities | 549.7 | 548.8 | 549.8 | 0.2 | 0.0 | |||||
| Total current liabilities | 2 685.5 | 2 666.8 | 2 948.7 | 263.2 | 9.9 | |||||
Non-current liabilities | ||||||||||
| Payables | 8.7 | 8.7 | 8.6 | -0.1 | -1.2 | |||||
| Interest-bearing liabilities | 6 212.1 | 6 218.3 | 6 226.0 | 13.9 | 0.2 | |||||
| Employee entitlements | 1 585.8 | 1 746.8 | 1 717.0 | 131.2 | 7.5 | |||||
| Superannuation | 11 754.0 | 11 833.2 | 12 423.6 | 669.6 | 5.7 | |||||
| Other liabilities | 382.6 | 375.8 | 371.8 | -10.8 | -2.9 | |||||
| Total non-current liabilities | 19 943.3 | 20 182.8 | 20 747.0 | 803.7 | 4.0 | |||||
| Total liabilities | 22 628.8 | 22 849.6 | 23 695.7 | 1 066.9 | 4.7 | |||||
| Net assets | 18 616.4 | 19 124.9 | 20 068.2 | 1 451.8 | 7.6 | |||||
Equity | ||||||||||
| Accumulated contributions by the Victorian Government including prior year surpluses | 12 858.0 | 12 858.0 | 13 371.5 | 513.5 | 4.0 | |||||
| Reserves | 5 758.4 | 5 758.4 | 5 931.4 | 173.0 | 3.0 | |||||
| Net result for year | 508.5 | 765.3 | 765.3 | 150.5 | ||||||
| Total equity | 18 616.4 | 19 124.9 | 20 068.2 | 1 451.8 | 7.6 | |||||
Source: Department of Treasury and Finance
- Note:
- (a)
- 2001-02 Budget is based on actual opening balances as at 1 July 2001 plus 2001-02 Budget movement.
- (b)
- The change reflects the difference between 2001-02 revised and 2000-01 actuals.
APPENDIX D: HISTORICAL AND FORWARD ESTIMATES TABLES
Table D1 shows the trends in general government sector aggregate cash flows over the period 1986-87 to 2005-06. This table of historical data has been compiled as far as possible according to current accounting standards and consistent with the cash flow statement included in Chapter 7, Estimated Financial Statements and Notes.
The data from 1997-98 include the transactions of government schools and the arts institutions on a gross operating basis as well as the full trading operations of TAFE institutes and hospitals, nursing homes and ambulances. Although this expanded coverage does not materially influence the net operating result for the general government sector, it does significantly increase the inflows and outflows presented in the cash flow statement.
Where possible, significant year-on-year variations in operating receipts and payments and abnormal items (in the main related to major business asset sales, the repatriation of surplus cash to the general government sector from non-budget agencies, and three special payments to reduce the State's unfunded superannuation liability) have been footnoted.
The effects of changes in taxation rates over the years have not been listed apart from the introduction (1992-93) and abolition (from 1995-96) of the state deficit levy, and the introduction of the GST grants from the Commonwealth (from 2000-01).
Table D2 shows the general government operating result on a GAAP basis since accrual accounts were first introduced in 1996-97. Following changes to accounting standards operative from 2000-01, the statement of financial performance no longer recognises abnormal items as a separate item. Table D2 has been adjusted to conform to this new reporting standard. However, details of previously reported abnormal items associated with the operating results up to 1999-2000 are included in table D3.
Table D4 presents general government sector current outlays classified by function—that is by government purpose classification. As there is no functional classification of government expenditure on a GAAP basis, the classifications conform to the standards for presenting cash outlays by government purpose on a GFS basis up to 1998-99, when this series ceased with the introduction of accrual GFS. Readers should note that this cash outlay information has been sourced from the ABS historical data. Because of the absence of accrual information for these years, it is not possible to convert or compare these tables with the current series of accrual GFS information included in the next table below and in Appendix E, Uniform Presentation of Government Finance Statistics, table. E 10.
From 1999-00, the new GFS accruals series of expenses classified by purpose is included as Table D5. As noted above these accruals data are not comparable to the old cash series.
Table D1: General government cash flow statement—historical series
| | 1986-87 Actual | 1987-88 Actual | 1988-89 Actual | 1989-90 Actual | 1990-91 Actual | |||||
|---|---|---|---|---|---|---|---|---|---|---|
| | ($ million) | |||||||||
| Cash flows from operating activities | ||||||||||
| Taxation(a)(b) | 3 914 | 4 474 | 5 061 | 5 365 | 5 710 | |||||
| Regulatory fees and fines | 96 | 96 | 90 | 105 | 132 | |||||
| Grants(b)(c) | 4 665 | 4 857 | 5 011 | 5 240 | 5 676 | |||||
| Sales of goods and services | 646 | 724 | 811 | 907 | 963 | |||||
| Interest received | 189 | 155 | 162 | 144 | 152 | |||||
| Dividends received | 251 | 296 | 354 | 399 | 327 | |||||
| Other receipts | 483 | 493 | 487 | 484 | 326 | |||||
| Total receipts from operating activities | 10 245 | 11 094 | 11 975 | 12 645 | 13 287 | |||||
| Employee entitlements(d) | -4 457 | -4 808 | -5 110 | -5 471 | -5 855 | |||||
| Superannuation | -367 | -416 | -519 | -586 | -685 | |||||
| Grants and transfer payments(d)(e) | -2 463 | -2 533 | -2 788 | -2 834 | -2 807 | |||||
| Supplies and services | -2 138 | -2 327 | -2 530 | -2 869 | -2 885 | |||||
| Interest paid | -1 079 | -1 163 | -1 254 | -1 423 | -1 602 | |||||
| Total payments from operating activities | -10 505 | -11 247 | -12 200 | -13 184 | -13 834 | |||||
| Net cash flows from operating activities | - 260 | -152 | -225 | -538 | -547 | |||||
Cash flows from investing activities | ||||||||||
| Sales of property plant and equipment | 104 | 207 | 189 | 168 | 114 | |||||
| Purchases of property plant and equipment | -953 | -1 031 | -1 042 | -1 085 | -1 129 | |||||
| Net privatisation proceeds and other abnormals(f) | 35 | 35 | 35 | 35 | 1 292 | |||||
| Net customer loans repaid | — | — | — | — | — | |||||
| Net purchases of investments | 77 | 77 | 99 | 111 | 186 | |||||
| Net cash flows from investing activities | - 737 | -712 | -720 | -771 | 464 | |||||
Cash flows from financing activities | ||||||||||
| Net proceeds of borrowings | 1 038 | 973 | 852 | 1 233 | 410 | |||||
| Net cash flows from financing activities | 1 038 | 973 | 852 | 1 233 | 410 | |||||
| Net increase in cash held | 42 | 109 | -93 | -76 | 327 | |||||
| Cash at beginning of reporting period | 841 | 883 | 992 | 898 | 823 | |||||
| Cash at end of reporting period | 883 | 992 | 898 | 823 | 1 149 | |||||
Source: Department of Treasury and Finance
Table D1 (cont): General government cash flow statement—historical series
| | 1991-92 Actual | 1992-93 Actual | 1993-94 Actual | 1994-95 Actual | 1995-96 Actual | |||||
|---|---|---|---|---|---|---|---|---|---|---|
| | ($ million) | |||||||||
| Cash flows from operating activities | ||||||||||
| Taxation(a)(b) | 6 049 | 6 582 | 7 445 | 7 787 | 8 368 | |||||
| Regulatory fees and fines | 182 | 176 | 181 | 194 | 193 | |||||
| Grants(b)(c) | 5 921 | 6 138 | 6 215 | 6 355 | 6 659 | |||||
| Sales of goods and services | 1 038 | 1 006 | 1 004 | 1 034 | 1 136 | |||||
| Interest received | 121 | 95 | 94 | 117 | 107 | |||||
| Dividends received | 566 | 581 | 815 | 765 | 624 | |||||
| Other receipts | 308 | 251 | 323 | 285 | 346 | |||||
| Total receipts from operating activities | 14 185 | 14 830 | 16 076 | 16 537 | 17 432 | |||||
| Employee entitlements(d) | -6 337 | -6 846 | -6 435 | -6 001 | -6 187 | |||||
| Superannuation | -782 | -853 | -492 | -1 149 | -1 046 | |||||
| Grants and transfer payments(d)(e) | -3 134 | -3 501 | -3 893 | -3 324 | -3 101 | |||||
| Supplies and services | -2 943 | -3 024 | -2 897 | -3 273 | -3 682 | |||||
| Interest paid | -1 787 | -2 064 | -2 195 | -2 007 | -1 923 | |||||
| Total payments from operating activities | -14 983 | -16 288 | -15 912 | -15 754 | -15 939 | |||||
| Net cash flows from operating activities | - 798 | -1 458 | 165 | 783 | 1 493 | |||||
Cash flows from investing activities | ||||||||||
| Sales of property plant and equipment | 103 | 132 | 189 | 189 | 156 | |||||
| Purchases of property plant and equipment | -1 066 | -1 068 | -980 | -1 288 | -1 285 | |||||
| Net privatisation proceeds and other abnormals(f) | 6 | 304 | 498 | 735 | 4 794 | |||||
| Net customer loans repaid | — | — | — | — | — | |||||
| Net purchases of investments | 143 | -261 | -501 | 402 | -464 | |||||
| Net cash flows from investing activities | - 815 | -892 | -794 | 39 | 3 200 | |||||
Cash flows from financing activities | ||||||||||
| Net proceeds of borrowings | 1 506 | 2 315 | 841 | -902 | -4 703 | |||||
| Net cash flows from financing activities | 1 506 | 2 315 | 841 | -902 | -4 703 | |||||
| Net increase in cash held | - 107 | -36 | 211 | -80 | -9 | |||||
| Cash at beginning of reporting period | 1 149 | 1 043 | 1 007 | 1 219 | 1 138 | |||||
| Cash at end of reporting period | 1 043 | 1 007 | 1 219 | 1 138 | 1 129 | |||||
Source: Department of Treasury and Finance
Table D1 (cont): General government cash flow statement—historical series
| | 1996-97 Actual | 1997-98 Actual(1) | 1998-99 Actual(2) | 1999-00 Actual(3) | 2000-01 Actual | |||||
|---|---|---|---|---|---|---|---|---|---|---|
| | ($ million) | |||||||||
| Cash flows from operating activities | ||||||||||
| Taxation(a)(b) | 8 786 | 8 532 | 8 846 | 9 719 | 8 533 | |||||
| Regulatory fees and fines | 186 | 230 | 272 | 306 | 302 | |||||
| Grants(b)(c) | 6 928 | 7 440 | 7 480 | 7 735 | 10 370 | |||||
| Sales of goods and services | 1 119 | 1 606 | 1 659 | 1 776 | 1 957 | |||||
| Interest received | 129 | 140 | 202 | 195 | 301 | |||||
| Dividends received | 967 | 786 | 932 | 888 | 798 | |||||
| Other receipts | 275 | 982 | 1 430 | 1 238 | 1 053 | |||||
| Total receipts from operating activities | 18 389 | 19 717 | 20 821 | 21 857 | 23 314 | |||||
| Employee entitlements(d) | -6 557 | -6 621 | -7 041 | -7 378 | -7 962 | |||||
| Superannuation | -1 213 | -1 257 | -2 083 | -1 370 | -1 898 | |||||
| Grants and transfer payments(d)(e) | -3 238 | -3 514 | -3 598 | -3 363 | -3 757 | |||||
| Supplies and services | -3 943 | -5 503 | -5 796 | -6 373 | -7 077 | |||||
| Interest paid | -1 403 | -1 162 | -732 | -448 | -464 | |||||
| Total payments from operating activities | -16 354 | -18 057 | -19 250 | -18 931 | -21 158 | |||||
| Net cash flows from operating activities | 2 035 | 1 660 | 1 571 | 2 926 | 2 155 | |||||
Cash flows from investing activities | ||||||||||
| Sales of property plant and equipment | 163 | 363 | 211 | 187 | 150 | |||||
| Purchases of property plant and equipment | -1 288 | -1 209 | -1 327 | -1 208 | -1 629 | |||||
| Net privatisation proceeds and other abnormals(f) | 4 514 | 1 610 | 3 344 | — | — | |||||
| Net customer loans repaid | — | 297 | 309 | 122 | 98 | |||||
| Net purchases of investments | -141 | -422 | 390 | -1 091 | -689 | |||||
| Net cash flows from investing activities | 3 248 | 639 | 2 927 | -1 991 | -2 071 | |||||
Cash flows from financing activities | ||||||||||
| Net proceeds of borrowings | -5 406 | -2 364 | -4 718 | -766 | -72 | |||||
| Net cash flows from financing activities | -5 406 | -2 364 | -4 718 | -766 | -72 | |||||
| Net increase in cash held | - 124 | -65 | -221 | 169 | 13 | |||||
| Cash at beginning of reporting period | 1 129 | 1 005 | 940 | 719 | 889 | |||||
| Cash at end of reporting period | 1 005 | 940 | 719 | 889 | 902 | |||||
Source: Department of Treasury and Finance
- Notes:
- (1)
- From 1997-98 includes schools own purpose receipts and payments and equivalent receipts from public non-financial corporations and public financial corporations.
- (2)
- From 1998-99 other receipts includes a capital assets charge receipt from the public non-financial corporations sector.
- (3)
- Sales of goods and services and purchases supplies and services do not include the GST component following its introduction in 1999-00.
Table D1 (cont): General government sector cash flow statement—historical series
| | 2001-02 Revised | 2002-03 Budget | 2003-04 Estimate | 2004-05 Estimate | 2005-06 Estimate | |||||
|---|---|---|---|---|---|---|---|---|---|---|
| | ($ million) | |||||||||
| Cash flows from operating activities | ||||||||||
| Taxation(a)(b) | 8 744 | 8 788 | 8 911 | 9 085 | 9 259 | |||||
| Regulatory fees and fines | 303 | 430 | 431 | 450 | 451 | |||||
| Grants(b)(c) | 11 755 | 11 752 | 12 072 | 12 463 | 13 071 | |||||
| Sales of goods and services | 2 022 | 2 052 | 2 078 | 2 111 | 2 143 | |||||
| Interest received | 318 | 338 | 317 | 320 | 334 | |||||
| Dividends received | 505 | 406 | 357 | 367 | 377 | |||||
| Other receipts | 1 210 | 1 343 | 1 332 | 1 391 | 1 346 | |||||
| Total receipts from operating activities | 24 857 | 25 110 | 25 497 | 26 187 | 26 982 | |||||
| Employee entitlements(d) | -8 367 | -8 844 | -9 172 | -9 477 | -9 787 | |||||
| Superannuation | -1 060 | -1 758 | -1 498 | -1 293 | -1 673 | |||||
| Grants and transfer payments(d)(e) | -4 346 | -4 117 | -3 999 | -4 015 | -4 075 | |||||
| Supplies and services | -7 842 | -8 314 | -8 378 | -8 691 | -8 837 | |||||
| Interest paid | -540 | -479 | -479 | -477 | -476 | |||||
| Total payments from operating activities | -22 155 | -23 513 | -23 526 | -23 954 | -24 848 | |||||
| Net cash flows from operating activities | 2 702 | 1 596 | 1 971 | 2 233 | 2 134 | |||||
Cash flows from investing activities | ||||||||||
| Sales of property plant and equipment | 106 | 79 | 63 | 54 | 49 | |||||
| Purchases of property plant and equipment | -2 016 | -1 927 | -2 181 | -2 129 | -2 063 | |||||
| Net contribution to other sectors of government | -18 | -218 | -173 | -225 | -153 | |||||
| Net customer loans repaid | 46 | 2 | 68 | 49 | 45 | |||||
| Net purchases of investments | -830 | 519 | 318 | 38 | 5 | |||||
| Net cash flows from investing activities | -2 714 | -1 546 | -1 906 | -2 213 | -2 116 | |||||
Cash flows from financing activities | ||||||||||
| Net proceeds of borrowings | -13 | -19 | -18 | -6 | -3 | |||||
| Net cash flows from financing activities | - 13 | -19 | -18 | -6 | -3 | |||||
| Net increase in cash held | - 24 | 32 | 47 | 14 | 15 | |||||
| Cash at beginning of reporting period | 902 | 878 | 909 | 956 | 970 | |||||
| Cash at end of reporting period | 878 | 909 | 956 | 970 | 985 | |||||
Source: Department of Treasury and Finance
Notes to Table D1: General government sector cash flow statement
Receipts from operating activities
- (a)
- State deficit levy commenced in 1992-93 ($173 million), and ceased in 1994-95 ($180 million).
- (b)
- Includes effect of GST grants from 2000-01 onwards. However, the GST collected on sales of goods and services and the GST paid on purchases of supplies and services has not been included in this cash flow statement since this amount is recouped in full from the Australian Taxation Office.
- (c)
- Significant offshore petroleum compensation grants from the Commonwealth in 1990-91 ($178 million) and 1991-92 ($191 million, including $60 million rent resource tax compensation).
The works (capital) grant from the Commonwealth ceased in 1993-94 ($68 million per annum).
Payments from operating activities
- (d)
- Separation payments up to 1989-90, mainly for early retirement and enhanced resignation packages to the Public Transport Corporation are included under 'grants'. Payments in later years were for voluntary redundancy and targeted separation packages across the general government sector and are included under 'employee entitlements'.
- (e)
- Operating subsidy payments to Tricontinental Corporation commenced in 1991-92 subsequent to the sale of the State Bank. Significant payments were in 1991-92 ($150 million), 1992-93 ($123 million), 1993-94 ($53 million), and 1994-95 ($39 million).
Major annual subsidy payments for electricity supplied to the Portland aluminium smelter under the flexible tariff agreement commenced in 1992-93 and ceased in 1997-98.
Cost of restructure of the Accelerated Infrastructure Program in 1994-95 ($200 million).
Investing activities
- (f)
- Privatisation and other abnormal items to the general government sector include:
- •
- 1986-87 to 1990-91: payments received from the former Melbourne and Metropolitan Board of Works regarding the transfer of ownership of the Thomson-Cardinia Dam of $35 million per annum;
- •
- 1990-91: net proceeds from the sale of the State Bank ($1 257 million);
- •
- 1992-93: sale of the State Insurance Office ($140 million);
- •
- 1993-94: recall of capital from the Transport Accident Commission ($1 200 million), wind-up of the Victorian Equity Trust ($437 million), casino licence fee ($200 million), offset by a special payment to the State Superannuation Fund ($1 399 million);
- •
- 1994-95: sale of Totalisator Agency Board ($609 million);
- •
- 1995-96: sale of electricity sector businesses ($4 641 million), 1996-97 ($4 262 million), and 1997-98 ($2 101 million) offset by a special payment to the State Superannuation Fund ($490 million); and
- •
- 1998-99: sale of the remainder of the electricity businesses ($361 million), gas businesses ($4 690 million), Victorian Plantations Corporation ($550 million), Aluvic ($401 million), V/line Freight ($20 million), offset by a special payment to reduce the State's unfunded superannuation liabilities ($2 574 million).
The above proceeds from the sale of government businesses are the amounts paid in cash (net) to the Consolidated Fund and are not necessarily the total proceeds of sale.
Chart D1: Total receipts from operating activities (in real terms)
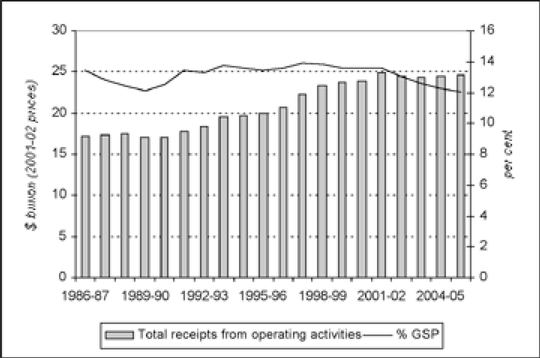
Source: Department of Treasury and Finance
Chart D2: Total payments from operating activities (in real terms)
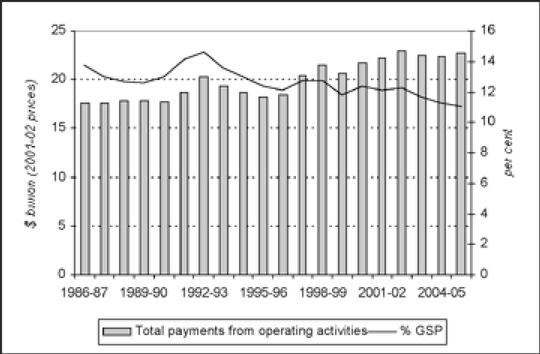
Source: Department of Treasury and Finance
Table D2: General government sector statement of financial performance—historical series
| | 1996-97 Actual | 1997-98 Actual | 1998-99 Actual | 1999-00 Actual | 2000-01 Actual | |||||
|---|---|---|---|---|---|---|---|---|---|---|
| | ($ million) | |||||||||
| Revenue from ordinary activities | ||||||||||
| Taxation | 8 670.2 | 8 590.3 | 9 151.6 | 9 760.0 | 8 590.9 | |||||
| Fines and regulatory fees | 241.7 | 261.2 | 330.1 | 359.3 | 380.6 | |||||
| Investment income | 5 147.9 | 3 568.0 | 7 061.9 | 1 416.1 | 1 476.8 | |||||
| Grants | 7 516.1 | 7 533.3 | 7 480.0 | 7 710.6 | 10 365.5 | |||||
| Sale of goods and services | 813.8 | 1 246.3 | 1 428.3 | 1 788.6 | 1 992.1 | |||||
| Net surplus/(deficit) from disposal of physical assets | -36.6 | 106.3 | 6.7 | 2.0 | 21.4 | |||||
| Fair value of assets received free of charge | 69.8 | 42.7 | 65.5 | 19.8 | 69.4 | |||||
| Inter sector capital asset charge | 493.0 | 493.0 | 477.0 | |||||||
| Other revenue | 477.6 | 2 139.4 | 1 263.6 | 510.3 | 422.6 | |||||
| Total revenue | 22 900.5 | 23 487.4 | 27 280.6 | 22 059.8 | 23 796.3 | |||||
Expenses from ordinary activities | ||||||||||
| Employee entitlements | 6 722.4 | 6 831.8 | 6 983.7 | 7 438.6 | 8 170.2 | |||||
| Superannuation | 1 364.8 | 1 359.7 | 1 303.7 | 2 216.0 | 1 437.7 | |||||
| Depreciation | 696.4 | 759.7 | 776.2 | 761.8 | 799.3 | |||||
| Amortisation | 15.5 | 28.7 | 28.6 | 27.2 | 39.1 | |||||
| Borrowing costs | 1 948.9 | 1 127.0 | 735.7 | 477.3 | 605.3 | |||||
| Grants | 2 574.7 | 3 422.5 | 3 595.6 | 3 382.7 | 3 793.0 | |||||
| Supplies and services | 4 162.8 | 4 846.3 | 5 447.6 | 6 221.8 | 7 486.1 | |||||
| Other expenses | 182.7 | 1 819.5 | 466.6 | 366.9 | 249.4 | |||||
| Total expenses | 17 668.2 | 20 195.3 | 19 337.9 | 20 892.4 | 22 580.1 | |||||
| Result from ordinary activities | 5 232.3 | 3 292.1 | 7 942.7 | 1 167.5 | 1 216.2 | |||||
| Increase/(decrease) in asset revaluation reserve | — | 1 174.1 | 1 543.7 | 1 534.6 | 815.8 | |||||
| Other adjustments other than contributions by owner(a) | — | — | 496.0 | 301.6 | 46.6 | |||||
| Total | — | 1 174.1 | 2 039.7 | 1 836.2 | 862.4 | |||||
| Total changes in equity other than contributions to other sectors by the State in its capacity as owner | 5 232.3 | 4 466.2 | 9 982.4 | 3 003.6 | 2 078.6 | |||||
Source: Department of Treasury and Finance
Table D2 (cont): General government sector statement of financial performance—historical series
| | 2001-02 Revised | 2002-03 Budget | 2003-04 Estimate | 2004-05 Estimate | 2005-06 Estimate | |||||
|---|---|---|---|---|---|---|---|---|---|---|
| | ($ million) | |||||||||
| Revenue from ordinary activities | ||||||||||
| Taxation | 8 758.0 | 8 802.7 | 8 926.7 | 9 101.7 | 9 281.6 | |||||
| Fines and regulatory fees | 386.6 | 554.0 | 556.6 | 579.1 | 577.1 | |||||
| Investment income | 1 049.4 | 1 061.6 | 991.9 | 1 017.7 | 1 056.8 | |||||
| Grants | 11 755.3 | 11 753.5 | 12 072.2 | 12 462.5 | 13 070.9 | |||||
| Sale of goods and services | 2 037.7 | 2 049.9 | 2 082.4 | 2 113.5 | 2 146.1 | |||||
| Net surplus/(deficit) from disposal of physical assets | 24.0 | 19.6 | 12.9 | 13.0 | 13.2 | |||||
| Fair value of assets received free of charge | 4.5 | 1.1 | 1.1 | 6.2 | 1.2 | |||||
| Inter sector capital asset charge | 489.0 | 501.0 | 514.0 | 514.0 | 514.0 | |||||
| Other revenue | 502.4 | 538.3 | 530.8 | 570.8 | 511.7 | |||||
| Total revenue | 25 006.8 | 25 281.7 | 25 688.6 | 26 378.4 | 27 172.5 | |||||
Expenses from ordinary activities | ||||||||||
| Employee entitlements | 8 531.7 | 9 041.5 | 9 386.0 | 9 687.6 | 10 001.3 | |||||
| Superannuation | 2 048.8 | 1 713.1 | 1 725.3 | 1 765.9 | 1 804.3 | |||||
| Depreciation | 895.4 | 952.2 | 1 002.7 | 1 067.0 | 1 115.1 | |||||
| Amortisation | 59.1 | 70.6 | 65.4 | 65.3 | 65.4 | |||||
| Borrowing costs | 496.2 | 495.2 | 494.6 | 492.1 | 488.4 | |||||
| Grants | 4 347.4 | 4 118.9 | 4 001.1 | 4 017.2 | 4 077.2 | |||||
| Supplies and services | 7 830.0 | 8 299.9 | 8 363.9 | 8 694.1 | 8 840.0 | |||||
| Other expenses | 32.8 | 68.6 | 69.6 | 71.9 | 68.8 | |||||
| Total expenses | 24 241.5 | 24 760.0 | 25 108.6 | 25 861.1 | 26 460.6 | |||||
| Result from ordinary activities | 765.3 | 521.8 | 580.0 | 517.3 | 711.9 | |||||
| Increase/(decrease) in asset revaluation reserve | 704.7 | 737.8 | 768.6 | 800.6 | 833.8 | |||||
| Other adjustments other than contributions by owner | — | — | — | — | — | |||||
| Total | 704.7 | 737.8 | 768.6 | 800.6 | 833.8 | |||||
| Total changes in equity other than contributions to other sectors by the State in its capacity as owner | 1 470.0 | 1 259.6 | 1 348.6 | 1 317.9 | 1 545.7 | |||||
Source: Department of Treasury and Finance
Table D3: Abnormal Items—historical series
| | 1996-97 Actual | 1997-98 Actual | 1998-99 Actual | |||
|---|---|---|---|---|---|---|
| | ($ million) | |||||
| Revenue from ordinary activities | ||||||
| Taxation | ||||||
| —Business asset sales(a) | 468.9 | 16.0 | 295.7 | |||
Investment income | ||||||
| —Business asset sales(a) | 3 820.3 | 1 880.2 | 5 722.9 | |||
| —Gascor disaggregation—assumption of debt | 391.7 | |||||
Other revenue | ||||||
| —Business asset sales](a) | 87.5 | 60.2 | 234.5 | |||
| —Reversal of Flexible Tariff Management Unit Trust liability | 1 275.2 | |||||
| —Forgiveness of debt owed to Department of Treasury and Finance by SEMCL | 106.7 | |||||
Expenses from ordinary activities | ||||||
| Supplies and services | ||||||
| —Business asset sales(a) | -55.7 | -49.5 | -100.8 | |||
Other expenses | ||||||
| —Forgiveness of debt owed by Director of Housing to Department of Treasury and Finance | -1 086.8 | |||||
| —Loss on revaluation of water sector debt | -334.4 | |||||
| —Diminution of VAIP bonds | — | — | -122.0 | |||
| Total abnormal items | 4 321.0 | 2 152.6 | 6 136.9 | |||
Source: Department of Treasury and Finance
- Note:
| (a) Total business asset sales: | 4 321.0 | 1 906.9 | 6 152.2 |
Table D4: General government current outlays by purpose 1986-87 to 1998-99—historical series
| | 1986-87 Actual | 1987-88 Actual | 1988-89 Actual | 1989-90 Actual | 1990-91 Actual | |||||
|---|---|---|---|---|---|---|---|---|---|---|
| | ($ million) | |||||||||
| Government superannuation benefits | 524 | 632 | 609 | 657 | 819 | |||||
| Other general public services | 293 | 306 | 326 | 336 | 268 | |||||
| General public services | 817 | 938 | 935 | 993 | 1 087 | |||||
| Police and fire protection services | 478 | 518 | 560 | 625 | 670 | |||||
| Law courts and legal services | 32 | 24 | 31 | 76 | 126 | |||||
| Prisons and corrective services | 62 | 75 | 86 | 104 | 116 | |||||
| Other public order and safety | 3 | 2 | 3 | 3 | 8 | |||||
| Public order and safety | 575 | 619 | 680 | 808 | 920 | |||||
| Primary and secondary education | 2 044 | 2 135 | 2 398 | 2 520 | 2 467 | |||||
| Tertiary education | 922 | 1 031 | 1 044 | 1 097 | 1 261 | |||||
| Pre-school education and education not definable by level | 136 | 170 | 187 | 204 | 185 | |||||
| Transportation of students | 72 | 78 | 84 | 91 | 99 | |||||
| Education n.e.c. | 78 | 92 | 34 | 37 | 17 | |||||
| Education | 3 252 | 3 506 | 3 747 | 3 949 | 4 029 | |||||
| Acute care institutions | 1 374 | 1 480 | 1 609 | 1 737 | 1 962 | |||||
| Mental health institutions | 255 | 312 | 346 | 377 | 295 | |||||
| Nursing homes for the aged | 69 | 103 | 119 | 130 | 41 | |||||
| Community health services | 75 | 112 | 111 | 121 | 139 | |||||
| Public health services | 52 | 82 | 128 | 155 | 145 | |||||
| Pharmaceuticals | -1 | -2 | — | — | — | |||||
| Health research | 2 | 3 | 5 | 6 | 7 | |||||
| Health administration n.e.c. | 29 | 20 | 32 | 44 | 78 | |||||
| Health | 1 855 | 2 110 | 2 350 | 2 570 | 2 667 | |||||
| Social security | 93 | 97 | 105 | 111 | 105 | |||||
| Welfare services | 298 | 302 | 370 | 416 | 554 | |||||
| Social security and welfare n.e.c. | 1 | — | — | — | 1 | |||||
| Social security and welfare | 392 | 399 | 475 | 527 | 660 | |||||
| Housing and community development | 119 | 117 | 146 | 149 | 178 | |||||
| Water supply | 13 | 15 | 16 | 11 | 7 | |||||
| Sanitation and protection of the environment | 7 | 7 | 7 | 12 | 17 | |||||
| Other community amenities | — | — | — | — | 1 | |||||
| Housing and community amenities | 139 | 139 | 169 | 172 | 203 | |||||
| Recreation facilities and services | 69 | 74 | 111 | 118 | 121 | |||||
| Cultural facilities and services | 65 | 66 | 77 | 84 | 72 | |||||
| Broadcasting and film production | 4 | 5 | 4 | 3 | 3 | |||||
| Recreation and culture n.e.c. | -1 | — | — | — | — | |||||
| Recreation and culture | 137 | 145 | 192 | 205 | 196 | |||||
Source: Australian Bureau of Statistics
Note: Current outlays—cash GFS basis
Table D4 (cont): General government current outlays by purpose 1986-87 to 1998-99—historical series
| | 1986-87 Actual | 1987-88 Actual | 1988-89 Actual | 1989-90 Actual | 1990-91 Actual | |||||
|---|---|---|---|---|---|---|---|---|---|---|
| | ($ million) | |||||||||
| Fuel affairs and services | — | 1 | — | 1 | 1 | |||||
| Electricity and other energy | 27 | 15 | 2 | 2 | 1 | |||||
| Fuel and energy n.e.c. | 6 | 6 | 5 | 17 | 16 | |||||
| Fuel and energy | 33 | 22 | 7 | 20 | 18 | |||||
| Agriculture | 90 | 92 | 109 | 120 | 107 | |||||
| Forestry | 58 | 63 | 69 | 72 | 85 | |||||
| Agriculture, forestry, fishing and hunting | 148 | 155 | 178 | 192 | 192 | |||||
| Mining and mineral resources other than fuels | 6 | 5 | 6 | 9 | 5 | |||||
| Manufacturing | 51 | 54 | 38 | 37 | 28 | |||||
| Construction | 1 | 2 | 1 | — | — | |||||
| Mining and mineral resources other than fuels; manufacturing; and construction | 58 | 61 | 45 | 46 | 33 | |||||
| Road transport | 231 | 257 | 290 | 291 | 328 | |||||
| Water transport | — | 1 | 2 | 2 | 3 | |||||
| Rail transport | 374 | 307 | 316 | — | — | |||||
| Other transport | 476 | 327 | 323 | 671 | 720 | |||||
| Communications | — | — | — | 3 | 2 | |||||
| Transport and communications | 1 081 | 892 | 931 | 967 | 1 053 | |||||
| Storage | — | 1 | — | — | — | |||||
| Tourism and area promotion | 23 | 26 | 26 | 30 | 35 | |||||
| Labour and employment affairs | 102 | 97 | 70 | 72 | 95 | |||||
| Other economic affairs n.e.c. | -2 | -15 | -23 | -27 | -22 | |||||
| Other economic affairs | 123 | 109 | 73 | 75 | 108 | |||||
| Public debt transactions | 804 | 1 124 | 1 219 | 1 410 | 1 523 | |||||
| General purpose inter-government transactions | 148 | 166 | 173 | 177 | 182 | |||||
| Natural disaster relief | 2 | — | — | 1 | 1 | |||||
| Other purposes n.e.c. | 1 | — | -4 | -2 | -12 | |||||
| Other purposes | 955 | 1 290 | 1 388 | 1 586 | 1 694 | |||||
| Total current outlays | 9 565 | 10 385 | 11 170 | 12 110 | 12 860 | |||||
Source: Australian Bureau of Statistics
Note: Current outlays—cash GFS basis
Table D4 (cont): General government current outlays by purpose 1986-87 to 1998-99—historical series
| | 1991-92 Actual | 1992-93 Actual | 1993-94 Actual | 1994-95 Actual | 1995-96 Actual | |||||
|---|---|---|---|---|---|---|---|---|---|---|
| | ($ million) | |||||||||
| Government superannuation benefits | 1 023 | 1 392 | 1 454 | 1 411 | 1 114 | |||||
| Other general public services | 226 | 271 | 229 | 202 | 250 | |||||
| General public services | 1 249 | 1 663 | 1 683 | 1 613 | 1 364 | |||||
| Police and fire protection services | 706 | 760 | 778 | 799 | 854 | |||||
| Law courts and legal services | 107 | 118 | 121 | 122 | 168 | |||||
| Prisons and corrective services | 115 | 103 | 98 | 106 | 108 | |||||
| Other public order and safety | 9 | 4 | 3 | 2 | -2 | |||||
| Public order and safety | 937 | 985 | 1 000 | 1 029 | 1 128 | |||||
| Primary and secondary education | 2 745 | 2 723 | 2 655 | 2 627 | 2 697 | |||||
| Tertiary education | 1 269 | 853 | 460 | 468 | 576 | |||||
| Pre-school education and education not definable by level | 187 | 183 | 186 | 207 | 223 | |||||
| Transportation of students | 102 | 106 | 112 | 121 | 127 | |||||
| Education n.e.c. | 24 | 21 | 20 | 14 | -6 | |||||
| Education | 4 327 | 3 886 | 3 433 | 3 437 | 3 617 | |||||
| Acute care institutions | 2 064 | 1 974 | 1 828 | 1 879 | 2 139 | |||||
| Mental health institutions | 308 | 356 | 333 | 353 | 372 | |||||
| Nursing homes for the aged | 33 | 52 | 109 | 91 | 115 | |||||
| Community health services | 151 | 179 | 180 | 204 | 243 | |||||
| Public health services | 135 | 118 | 119 | 133 | 140 | |||||
| Pharmaceuticals | — | — | — | — | 9 | |||||
| Health research | 8 | 6 | 5 | 5 | 6 | |||||
| Health administration n.e.c. | 80 | 85 | 85 | -1 | -47 | |||||
| Health | 2 779 | 2 770 | 2 659 | 2 664 | 2 977 | |||||
| Social security | 134 | 148 | 186 | 222 | 216 | |||||
| Welfare services | 604 | 677 | 656 | 734 | 735 | |||||
| Social security and welfare n.e.c. | 1 | 1 | 1 | 1 | — | |||||
| Social security and welfare | 739 | 826 | 843 | 957 | 951 | |||||
| Housing and community development | 213 | 199 | 203 | 295 | 192 | |||||
| Water supply | 11 | 19 | 16 | 20 | 5 | |||||
| Sanitation and protection of the environment | 20 | 20 | 22 | 25 | 18 | |||||
| Other community amenities | 1 | — | — | — | -1 | |||||
| Housing and community amenities | 245 | 238 | 241 | 340 | 214 | |||||
| Recreation facilities and services | 104 | 104 | 62 | 51 | 88 | |||||
| Cultural facilities and services | 89 | 91 | 92 | 118 | 118 | |||||
| Broadcasting and film production | 3 | 3 | 3 | 4 | 5 | |||||
| Recreation and culture n.e.c. | — | — | — | — | — | |||||
| Recreation and culture | 196 | 198 | 157 | 173 | 211 | |||||
Source: Australian Bureau of Statistics
Note: Current outlays—cash GFS basis
Table D4 (cont): General government current outlays by purpose 1986-87 to 1998-99—historical series
| | 1991-92 Actual | 1992-93 Actual | 1993-94 Actual | 1994-95 Actual | 1995-96 Actual | |||||
|---|---|---|---|---|---|---|---|---|---|---|
| | ($ million) | |||||||||
| Fuel affairs and services | -1 | 1 | 13 | 28 | -1 | |||||
| Electricity and other energy | 1 | 52 | 3 | 28 | 212 | |||||
| Fuel and energy n.e.c. | 12 | 5 | 2 | -2 | -6 | |||||
| Fuel and energy | 12 | 58 | 18 | 54 | 205 | |||||
| Agriculture | 112 | 83 | 87 | 103 | 153 | |||||
| Forestry | 81 | 90 | 91 | 95 | 47 | |||||
| Agriculture, forestry, fishing and hunting | 193 | 173 | 178 | 198 | 200 | |||||
| Mining and mineral resources other than fuels | 5 | 7 | 6 | 8 | 10 | |||||
| Manufacturing | 37 | 36 | 17 | 34 | 36 | |||||
| Construction | — | — | — | — | — | |||||
| Mining and mineral resources other than fuels; manufacturing; and construction | 42 | 43 | 23 | 42 | 46 | |||||
| Road transport | 386 | 357 | 366 | 434 | 342 | |||||
| Water transport | -2 | -2 | -2 | 5 | 5 | |||||
| Rail transport | — | — | — | — | 9 | |||||
| Other transport | 671 | 657 | 613 | 321 | 448 | |||||
| Communications | 2 | — | — | — | 4 | |||||
| Transport and communications | 1 057 | 1 012 | 977 | 760 | 808 | |||||
| Storage | — | — | — | — | — | |||||
| Tourism and area promotion | 38 | 41 | 46 | 58 | 29 | |||||
| Labour and employment affairs | 95 | 82 | 57 | 69 | 62 | |||||
| Other economic affairs n.e.c. | 171 | 139 | 37 | 86 | 9 | |||||
| Other economic affairs | 304 | 262 | 140 | 213 | 100 | |||||
| Public debt transactions | 1 717 | 2 027 | 2 185 | 1 972 | 1 910 | |||||
| General purpose inter-government transactions | 186 | 191 | 191 | 191 | 202 | |||||
| Natural disaster relief | — | — | — | 30 | — | |||||
| Other purposes n.e.c | — | 251 | 259 | 153 | 9 | |||||
| Other purposes | 1 903 | 2 469 | 2 635 | 2 346 | 2 121 | |||||
| Total current outlays | 13 983 | 14 583 | 13 987 | 13 826 | 13 942 | |||||
Source: Australian Bureau of Statistics
Note: Current outlays—cash GFS basis
Table D4 (cont): General government current outlays by purpose 1986-87 to 1998-99—historical series
| | 1996-97 Actual | 1997-98 Actual | 1998-99 Actual | |||
|---|---|---|---|---|---|---|
| | ($ million) | |||||
| Government superannuation benefits | 1 295 | 1 732 | 1 712 | |||
| Other general public services | 288 | 324 | 421 | |||
| General public services | 1 583 | 2 056 | 2 133 | |||
| Police and fire protection services | 998 | 941 | 979 | |||
| Law courts and legal services | 138 | 133 | -46 | |||
| Prisons and corrective services | 144 | 131 | 148 | |||
| Other public order and safety | 43 | 161 | 173 | |||
| Public order and safety | 1 323 | 1 366 | 1 254 | |||
| Primary and secondary education | 2 824 | 3 213 | 3 362 | |||
| Tertiary education | 617 | 540 | 502 | |||
| Pre-school education and education not definable by level | 248 | 24 | 126 | |||
| Transportation of students | 136 | 108 | 157 | |||
| Education n.e.c. | 20 | 118 | -61 | |||
| Education | 3 845 | 4 003 | 4 086 | |||
| Acute care institutions | 2 186 | 2 599 | 2 482 | |||
| Mental health institutions | 400 | 313 | 401 | |||
| Nursing homes for the aged | 122 | — | 153 | |||
| Community health services | 248 | — | 288 | |||
| Public health services | 187 | 781 | 203 | |||
| Pharmaceuticals | 11 | — | 14 | |||
| Health research | 7 | 16 | 22 | |||
| Health administration n.e.c. | -74 | -111 | -51 | |||
| Health | 3 087 | 3 598 | 3 512 | |||
| Social security | 236 | 244 | 261 | |||
| Welfare services | 762 | 966 | 902 | |||
| Social security and welfare n.e.c. | — | — | — | |||
| Social security and welfare | 998 | 1 210 | 1 163 | |||
| Housing and community development | 187 | 477 | 96 | |||
| Water supply | 11 | 1 | 10 | |||
| Sanitation and protection of the environment | 31 | 35 | 35 | |||
| Other community amenities | -1 | 1 | -1 | |||
| Housing and community amenities | 228 | 514 | 140 | |||
| Recreation facilities and services | 89 | 84 | 70 | |||
| Cultural facilities and services | 127 | 152 | 159 | |||
| Broadcasting and film production | 12 | 1 | 9 | |||
| Recreation and culture n.e.c. | 6 | — | 11 | |||
| Recreation and culture | 234 | 237 | 249 | |||
Source: Australian Bureau of Statistics
Note: Current outlays—cash GFS basis
Table D4 (cont): General government current outlays by purpose 1986-87 to 1998-99—historical series
| | 1996-97 Actual | 1997-98 Actual | 1998-99 Actual | |||
|---|---|---|---|---|---|---|
| | ($ million) | |||||
| Fuel affairs and services | -1 | -3 | -3 | |||
| Electricity and other energy | 22 | 2 | 92 | |||
| Fuel and energy n.e.c. | -4 | -4 | -5 | |||
| Fuel and energy | 17 | -5 | 84 | |||
| Agriculture | 162 | 170 | 208 | |||
| Forestry | 76 | 108 | 89 | |||
| Agriculture, forestry, fishing and hunting | 238 | 278 | 297 | |||
| Mining and mineral resources other than fuels | 12 | 12 | 10 | |||
| Manufacturing | 28 | 44 | 41 | |||
| Construction | — | — | — | |||
| Mining and mineral resources other than fuels; manufacturing; and construction | 40 | 56 | 51 | |||
| Road transport | 348 | 427 | 246 | |||
| Water transport | 4 | -3 | 4 | |||
| Rail transport | 10 | 42 | 190 | |||
| Other transport | 378 | 384 | 377 | |||
| Communications | 11 | 10 | 7 | |||
| Transport and communications | 751 | 860 | 824 | |||
| Storage | — | — | — | |||
| Tourism and area promotion | 57 | 36 | 69 | |||
| Labour and employment affairs | 45 | 29 | 26 | |||
| Other economic affairs n.e.c. | -14 | -23 | 10 | |||
| Other economic affairs | 88 | 42 | 105 | |||
| Public debt transactions | 1 450 | 1 132 | 801 | |||
| General purpose inter-government transactions | 210 | 1 | 301 | |||
| Natural disaster relief | — | — | — | |||
| Other purposes n.e.c. | 176 | 180 | -7 | |||
| Other purposes | 1 836 | 1 313 | 1 095 | |||
| Total current outlays | 14 268 | 15 528 | 14 993 | |||
Source: Australian Bureau of Statistics
Note: Current outlays—cash GFS basis
Table D5: General government expenses by purpose 1999-00 to 2005-06—historical series
| | 1999-00 Actual | 2000-01 Actual | 2001-02 Revised | 2002-03 Budget | 2003-04 Estimate | 2004-05 Estimate | 2005-06 Estimate | |||||||
|---|---|---|---|---|---|---|---|---|---|---|---|---|---|---|
| | ($ million) | |||||||||||||
| General Public Services | 838 | 744 | 752 | 920 | 1 085 | 1 292 | 1 487 | |||||||
| Public Order and Safety | 1 956 | 2 004 | 2 139 | 2 352 | 2 391 | 2 487 | 2 523 | |||||||
| Education | 5 629 | 6 274 | 6 392 | 6 455 | 6 720 | 6 858 | 6 899 | |||||||
| Health | 5 027 | 5 666 | 5 939 | 6 182 | 6 387 | 6 572 | 6 715 | |||||||
| Social Security & Welfare | 1 594 | 1 737 | 1 845 | 1 917 | 1 960 | 1 980 | 2 012 | |||||||
| Housing and community amenities | 833 | 1 336 | 1 500 | 1 258 | 1 288 | 1 299 | 1 307 | |||||||
| Recreation and culture | 486 | 491 | 543 | 521 | 476 | 462 | 461 | |||||||
| Fuel and energy | 16 | 134 | 134 | 17 | 18 | 18 | 19 | |||||||
| Agriculture, forestry, fishing and hunting | 480 | 468 | 522 | 509 | 489 | 452 | 459 | |||||||
| Mining and mineral resources other than fuels; manufacturing; and construction | 27 | 12 | 19 | 17 | 16 | 15 | 17 | |||||||
| Transport and communications | 2 029 | 2 151 | 2 384 | 2 374 | 2 212 | 2 337 | 2 368 | |||||||
| Other economic affairs | 146 | 158 | 326 | 483 | 348 | 329 | 369 | |||||||
| Other purposes(a) | 1 260 | 1 337 | 1 314 | 1 765 | 1 737 | 1 777 | 1 839 | |||||||
| Total expenses | 20 321 | 22 512 | 23 809 | 24 770 | 25 127 | 25 879 | 26 477 | |||||||
Source: Department of Treasury and Finance
Note:
- (a)
- Includes nominal superannuation interest expense
Expenses by purpose—accrual GFS basis
APPENDIX E: UNIFORM PRESENTATION OF GOVERNMENT FINANCE STATISTICS
THE ACCRUAL GFS PRESENTATION
The Government Finance Statistics (GFS) system employed by the Australian Bureau of Statistics (ABS) is designed to provide statistics relating to all Australian public sector entities. The statistics show consolidated transactions of the various institutional sectors of government from an economic viewpoint, providing details of the revenue, expenses, payments, receipts, assets and liabilities. It includes only those transactions over which a government exercises control under its legislative or policy framework. This means that, unlike the accounting viewpoint, the GFS excludes from the calculation of net operating balance both revaluations (holding gains or losses) arising from a change in market prices, and other changes in the volume of assets that result from discoveries, depletion and destruction of assets. This means that differences arise between the GFS and accounting frameworks, particularly within the operating statement.
Operating statement
The operating statement, also referred to as a Statement of financial position, is designed to capture the composition of GFS revenues and GFS expenses and the net cost of a government's activities within a financial year. It shows the full cost of resources consumed by government in achieving its objectives, and how these costs are met from various revenue sources.
Unlike a standard accounting operating statement, the GFS operating statement reports two major fiscal measures—the GFS net operating balance and GFS net lending. The GFS net operating balance is calculated as GFS revenue minus GFS expenses. In contrast, GFS net lending, or fiscal balance, includes net capital expenditure but excludes depreciation, thereby giving a measure of a jurisdiction's call on financial markets.
Balance sheet
The balance sheet records a government's stocks of financial and non-financial assets and liabilities. This statement, also referred to as a statement of financial position, discloses the resources over which a government maintains control.
The GFS balance sheet differs from the standard accounting presentation in that it provides information on financial and non-financial assets, and does not distinguish between current and non-current assets and liabilities.
Cash flow statement
The cash flow statement records a government's cash receipts and payments and shows how a government obtains and expends cash.
The GFS cash flow statement reports two major fiscal measures—the net increase in cash held and the cash surplus. Net increase in cash held is the sum of net cash flows from all operating, investing and financing activities. The cash surplus comprises only net cash received from operating activities, and from sales and purchases of non-financial assets, minus distributions paid (in the case of public financial corporations and public non-financial corporations), minus finance leases and similar arrangements.
The GFS cash surplus measure is broadly comparable with the old cash-GFS surplus measure, allowing for comparisons between the two frameworks.
INSTITUTIONAL SECTORS
General government sector
The general government sector comprises all government departments, offices and other bodies engaged in providing services free of charge or at prices significantly below their cost of production. General government services include those which are mainly non-market in nature, those which are largely for collective consumption by the community, and those which involve the transfer or redistribution of income. These services are financed mainly through taxes, other compulsory levies and user charges.
Public non-financial corporations sector
The public non-financial corporations sector was formerly known as the public trading enterprises sector. It comprises bodies mainly engaged in the production of goods and services (of a non-financial nature) for sale in the market place at prices that aim to recover most of the costs involved (e.g. water and port authorities). In general, public non-financial corporations are legally distinguishable from the governments which own them.
Non-financial public sector
The non-financial public sector represents the consolidated transactions and assets and liabilities of the general government and public non-financial corporations sectors. In compiling statistics for the non-financial public sector, transactions and debtor-creditor relationships between sub-sectors are eliminated to avoid double counting.
Public financial corporations
Public financial corporations are bodies primarily engaged in the provision of financial intermediation services or auxiliary financial services. They are able to incur financial liabilities on their own account (e.g. taking deposits, issuing securities or providing insurance services). The public financial corporations sector includes the Treasury Corporation of Victoria, and the Transport Accident Corporation. Estimates are not published for the public financial corporations sector.
Table E.1: General government sector operating statement
| | 2001-02 Revised | 2002-03 Budget | 2003-04 Estimate | 2004-05 Estimate | 2005-06 Estimate | |||||
|---|---|---|---|---|---|---|---|---|---|---|
| | ($ million) | |||||||||
| GFS revenue | ||||||||||
| Taxation revenue | 8 666 | 8 701 | 8 818 | 8 993 | 9 170 | |||||
| Current grants and subsidies | 11 198 | 11 190 | 11 566 | 11 883 | 12 498 | |||||
| Capital grants | 558 | 565 | 511 | 586 | 573 | |||||
| Sales of goods and services | 2 478 | 2 555 | 2 542 | 2 583 | 2 619 | |||||
| Interest income | 318 | 338 | 317 | 320 | 334 | |||||
| Other | 1 752 | 1 909 | 1 919 | 1 997 | 1 962 | |||||
| Total revenue | 24 970 | 25 259 | 25 673 | 26 362 | 27 156 | |||||
GFS expenses | ||||||||||
| Gross operating expenses | 18 689 | 19 603 | 20 164 | 20 900 | 21 427 | |||||
| Nominal superannuation interest expense | 827 | 896 | 893 | 909 | 942 | |||||
| Other interest expense | 474 | 472 | 472 | 469 | 466 | |||||
| Other property expenses | — | — | — | — | — | |||||
| Current transfers | 3 285 | 3 280 | 3 144 | 3 160 | 3 210 | |||||
| Capital transfers | 534 | 518 | 453 | 441 | 432 | |||||
| Total expenses | 23 809 | 24 770 | 25 127 | 25 879 | 26 477 | |||||
| GFS net operating balance | 1 161 | 489 | 545 | 483 | 680 | |||||
Less: Net acquisition of non-financial assets | ||||||||||
| Gross fixed capital formation | 1 914 | 1 848 | 2 119 | 2 080 | 2 014 | |||||
| Less: Depreciation | 895 | 952 | 1 003 | 1 067 | 1 115 | |||||
| Plus: Change in inventories | -2 | 0 | 0 | 0 | 0 | |||||
| Plus: Other movements in non-financial assets | — | — | — | — | — | |||||
| Total net acquisition of non-financial assets | 1 017 | 896 | 1 116 | 1 013 | 899 | |||||
| GFS net lending (+)/borrowing (-)(a) | 144 | -407 | -571 | -529 | -219 | |||||
Source: Department of Treasury and Finance
- Note:
- (a)
- GFS net lending also equals net transactions in financial assets less net transactions in liabilities. If the boost to infrastructure investment funded by the Growing Victoria infrastructure reserve is excluded the GFS net lending / borrowing aggregates are:
| GFS net lending (+)/borrowing (-) (excluding Growing Victoria) | -30 | 163 | -145 | -359 | -89 | ||||||
Table E.2: Public non-financial corporations sector operating statement
| | 2001-02 Revised | 2002-03 Budget | ||
|---|---|---|---|---|
| | ($ million) | |||
| GFS revenue | ||||
| Sales of goods and services | 3 652 | 3 475 | ||
| Current grants and subsidies | 632 | 664 | ||
| Capital grants | 317 | 318 | ||
| Interest income | 72 | 54 | ||
| Other | 340 | 341 | ||
| Total revenue | 5 013 | 4 851 | ||
GFS expenses | ||||
| Gross operating expenses | 3 841 | 3 819 | ||
| Property expenses | 753 | 567 | ||
| Current transfers | 142 | 92 | ||
| Capital transfers | 52 | 58 | ||
| Total expenses | 4 788 | 4 536 | ||
| GFS net operating balance | 224 | 315 | ||
Less: Net acquisition of non-financial assets | ||||
| Gross fixed capital formation | 1 032 | 1 424 | ||
| Less: Depreciation | 531 | 561 | ||
| Plus: Change in inventories | 10 | -10 | ||
| Plus: Other movements in non-financial assets | 0 | 0 | ||
| Total net acquisition of non-financial assets | 511 | 852 | ||
| GFS net lending (+)/borrowing (-)(a) | -286 | -537 | ||
Source: Department of Treasury and Finance
- Note:
- (a)
- GFS net lending also equals net transactions in financial assets less net transactions in liabilities
Table E.3: Non-financial public sector operating statement
| | 2001-02 Revised | 2002-03 Budget | ||
|---|---|---|---|---|
| | ($ million) | |||
| GFS revenue | ||||
| Taxation revenue | 8 616 | 8 644 | ||
| Current grants and subsidies | 11 155 | 11 194 | ||
| Capital grants | 560 | 566 | ||
| Sales of goods and services | 6 129 | 6 028 | ||
| Interest income | 390 | 392 | ||
| Other | 1 122 | 1 387 | ||
| Total revenue | 27 971 | 28 211 | ||
| GFS expenses | ||||
| Gross operating expenses | 22 029 | 22 892 | ||
| Nominal superannuation interest expense | 827 | 896 | ||
| Other interest expense | 636 | 643 | ||
| Other property expenses | — | — | ||
| Current transfers | 2 701 | 2 654 | ||
| Capital transfers | 270 | 259 | ||
| Total expenses | 26 463 | 27 345 | ||
| GFS net operating balance | 1 508 | 866 | ||
| Less: Net acquisition of non-financial assets | ||||
| Gross fixed capital formation | 2 946 | 3 272 | ||
| Less: Depreciation | 1 427 | 1 513 | ||
| Plus: Change in inventories | 9 | -10 | ||
| Plus: Other movements in non-financial assets | — | — | ||
| Total net acquisition of non-financial assets | 1 528 | 1 748 | ||
| GFS net lending (+)/borrowing (-)(a) | -20 | -882 | ||
Source: Department of Treasury and Finance
- Note:
- (a)
- GFS net lending also equals net transactions in financial assets less net transactions in liabilities. If the boost to infrastructure investment funded by the Growing Victoria infrastructure reserve is excluded the GFS net lending/borrowing aggregates are:
| GFS net lending (+)/borrowing (-) (excluding Growing Victoria) | - 194 | -312 | |||
Table E.4: General government sector balance sheet
| | as at 30 June | |||||||||||
|---|---|---|---|---|---|---|---|---|---|---|---|---|
| | 2001 Opening | 2002 Revised | 2003 Budget | 2004 Estimate | 2005 Estimate | 2006 Estimate | ||||||
| | ($ million) | |||||||||||
| Assets | ||||||||||||
| Financial assets | ||||||||||||
| Cash and deposits | 908 | 881 | 913 | 960 | 974 | 988 | ||||||
| Advances paid | 314 | 269 | 267 | 199 | 151 | 106 | ||||||
| Investments, loans and placements | 3 312 | 4 152 | 3 633 | 3 315 | 3 277 | 3 272 | ||||||
| Other non-equity assets | 898 | 970 | 1 047 | 1 151 | 1 247 | 1 350 | ||||||
| Equity | 25 050 | 26 300 | 27 013 | 27 186 | 27 410 | 27 563 | ||||||
| Total financial assets | 30 483 | 32 571 | 32 873 | 32 812 | 33 059 | 33 278 | ||||||
| Non-financial assets | ||||||||||||
| Land and fixed assets | 34 745 | 36 366 | 37 821 | 39 526 | 41 163 | 42 714 | ||||||
| Other non-financial assets | 1 029 | 1 029 | 1 044 | 1 050 | 1 044 | 1 034 | ||||||
| Total non-financial assets | 35 774 | 37 395 | 38 865 | 40 576 | 42 207 | 43 748 | ||||||
| Total assets | 66 257 | 69 967 | 71 737 | 73 388 | 75 266 | 77 026 | ||||||
Liabilities | ||||||||||||
| Deposits held | 337 | 336 | 336 | 336 | 336 | 336 | ||||||
| Advances received | 10 | 10 | 9 | 8 | 8 | 8 | ||||||
| Borrowing | 6 358 | 6 296 | 6 291 | 6 288 | 6 293 | 6 299 | ||||||
| Superannuation liability | 11 818 | 12 806 | 12 761 | 12 989 | 13 462 | 13 594 | ||||||
| Other employee entitlements and provisions | 2 635 | 2 800 | 2 974 | 3 168 | 3 374 | 3 585 | ||||||
| Other non-equity liabilities | 1 418 | 1 394 | 1 397 | 1 397 | 1 397 | 1 397 | ||||||
| Total liabilities | 22 575 | 23 642 | 23 768 | 24 186 | 24 871 | 25 219 | ||||||
| Net worth | 43 681 | 46 324 | 47 970 | 49 202 | 50 395 | 51 807 | ||||||
| Net financial worth(a) | 7 908 | 8 929 | 9 105 | 8 626 | 8 188 | 8 059 | ||||||
| Net debt(b) | 2 170 | 1 341 | 1 824 | 2 158 | 2 236 | 2 278 | ||||||
Source: Department of Treasury and Finance
- Notes:
- (a)
- Net financial worth equals total financial assets minus total liabilities
- (b)
- Net debt equals the sum of deposits held, advances received and borrowings, minus the sum of cash and deposits, advances paid, and investments, loans and placements. If Growing Victoria investments are not included as an offset to debt, on the grounds that these investments are earmarked for infrastructure projects and are therefore not available to redeem debt, the net debt figures are:
| Net debt (excluding Growing Victoria) | 3 292 | 2 637 | 2 550 | 2 458 | 2 366 | 2 278 | |||||||
Table E.5: Public non-financial corporations sector balance sheet
| | as at 30 June | |||||
|---|---|---|---|---|---|---|
| | 2001 Opening | 2002 Revised | 2003 Budget | |||
| | ($ million) | |||||
| Assets | ||||||
| Financial assets | ||||||
| Cash and deposits | 436 | 326 | 256 | |||
| Advances paid | 352 | 288 | 237 | |||
| Investments, loans and placements | 606 | 516 | 405 | |||
| Other non-equity assets | 1 962 | 1 822 | 1 597 | |||
| Equity | — | — | — | |||
| Total financial assets | 3 356 | 2 952 | 2 495 | |||
Non-financial assets | ||||||
| Land and fixed assets | 26 564 | 28 113 | 29 131 | |||
| Other non-financial assets | 118 | 110 | 118 | |||
| Total non-financial assets | 26 682 | 28 223 | 29 249 | |||
| Total assets | 30 037 | 31 175 | 31 744 | |||
Liabilities | ||||||
| Deposits held | 33 | 34 | 33 | |||
| Advances received | 236 | 190 | 186 | |||
| Borrowing | 2 539 | 2 493 | 2 592 | |||
| Superannuation liability | 64 | 64 | 64 | |||
| Other employee entitlements and provisions | 2 141 | 2 155 | 2 063 | |||
| Other non-equity liabilities | 645 | 609 | 464 | |||
| Total liabilities | 5 658 | 5 546 | 5 402 | |||
| Shares and other contributed capital | 24 379 | 25 629 | 26 342 | |||
| Net worth | — | — | — | |||
| Net financial worth(a) | -26 682 | -28 223 | -29 249 | |||
| Net debt(b) | 1 414 | 1 587 | 1 913 | |||
Source: Department of Treasury and Finance
- Notes:
- (a)
- Net financial worth equals total financial assets minus total liabilities
- (b)
- Net debt equals the sum of deposits held, advances received and borrowings, minus the sum of cash and deposits, advances paid, and investments, loans and placements.
Table E.6: Non-financial public sector balance sheet
| | as at 30 June | |||||
|---|---|---|---|---|---|---|
| | 2001 Opening | 2002 Revised | 2003 Budget | |||
| | ($ million) | |||||
| Assets | ||||||
| Financial assets | ||||||
| Cash and deposits | 1 333 | 1 196 | 1 158 | |||
| Advances paid | 449 | 385 | 334 | |||
| Investments, loans and placements | 3 834 | 4 583 | 3 953 | |||
| Other non-equity assets | 2 773 | 2 725 | 2 585 | |||
| Equity | 671 | 671 | 671 | |||
| Total financial assets | 9 060 | 9 560 | 8 701 | |||
Non-financial assets | ||||||
| Land and fixed assets | 61 309 | 64 479 | 66 952 | |||
| Other non-financial assets | 1 096 | 1 098 | 1 141 | |||
| Total non-financial assets | 62 405 | 65 576 | 68 093 | |||
| Total assets | 71 466 | 75 136 | 76 794 | |||
Liabilities | ||||||
| Deposits held | 369 | 370 | 369 | |||
| Advances received | 38 | 37 | 33 | |||
| Borrowing | 8 714 | 8 607 | 8 701 | |||
| Superannuation liability | 11 882 | 12 870 | 12 826 | |||
| Other employee entitlements and provisions | 4 111 | 4 164 | 4 181 | |||
| Other non-equity liabilities | 2 054 | 1 995 | 1 852 | |||
| Total liabilities | 27 169 | 28 043 | 27 961 | |||
| Net worth | 44 297 | 47 093 | 48 833 | |||
| Net financial worth(a) | -18 109 | -18 483 | -19 261 | |||
| Net debt(b) | 3 505 | 2 849 | 3 658 | |||
Source: Department of Treasury and Finance
- Notes:
- (a)
- Net financial worth equals total financial assets minus total liabilities
- (b)
- Net debt equals the sum of deposits held, advances received and borrowings, minus the sum of cash and deposits, advances paid, and investments, loans and placements. If Growing Victoria investments are not included as an offset to debt, on the grounds that these investments are earmarked for infrastructure projects and are therefore not available to redeem debt, the net debt figures are:
| Net debt (excluding Growing Victoria) | 4 627 | 4 145 | 4 384 | ||||
Table E.7: General government sector cash flow statement
| | 2001-02 Revised | 2002-03 Budget | 2003-04 Estimate | 2004-05 Estimate | 2005-06 Estimate | |||||
|---|---|---|---|---|---|---|---|---|---|---|
| | ($ million) | |||||||||
| Cash receipts from operating activities | ||||||||||
| Taxes received | 8 653 | 8 687 | 8 803 | 8 976 | 9 148 | |||||
| Receipts from sales of goods and services | 2 434 | 2 496 | 2 476 | 2 517 | 2 556 | |||||
| Grants/subsidies received | 11 756 | 11 754 | 12 077 | 12 469 | 13 071 | |||||
| Other receipts | 2 017 | 2 180 | 2 148 | 2 233 | 2 216 | |||||
| Total receipts | 24 861 | 25 117 | 25 504 | 26 195 | 26 991 | |||||
Cash payments from operating activities | ||||||||||
| Payment for goods and services | -17 825 | -19 280 | -19 498 | -19 944 | -20 796 | |||||
| Grants and subsidies paid | -3 623 | -3 662 | -3 461 | -3 463 | -3 507 | |||||
| Interest paid | -473 | -471 | -471 | -468 | -464 | |||||
| Other payments | -192 | -121 | -117 | -100 | -100 | |||||
| Total payments | -22 113 | -23 534 | -23 547 | -23 975 | -24 868 | |||||
| Net cash flows from operating activities | 2 749 | 1 583 | 1 957 | 2 220 | 2 123 | |||||
| Net cash flows from investing in non-financial assets | ||||||||||
| Sales of non-financial assets | 106 | 79 | 63 | 54 | 49 | |||||
| Purchases of non-financial assets | -2 017 | -1 927 | -2 181 | -2 128 | -2 062 | |||||
| Total cash flows—non-financial assets | -1 911 | -1 848 | -2 118 | -2 074 | -2 013 | |||||
| Net cash flows from investments in financial assets for policy purposes | 24 | -210 | -110 | -180 | -112 | |||||
| Net cash flows from investments in financial assets for liquidity | - 896 | 513 | 322 | 42 | 9 | |||||
| Net cash flows from financing activities | ||||||||||
| Advances received (net) | -1 | -1 | -1 | — | — | |||||
| Borrowings (net) | 8 | -3 | -2 | 7 | 7 | |||||
| Deposits received (net) | -0 | -0 | -0 | -0 | -0 | |||||
| Other financing (net) | — | — | — | — | — | |||||
| Total net cash flows from financing activities | 7 | -4 | -3 | 7 | 7 | |||||
| Net increase in cash held | - 27 | 33 | 49 | 14 | 15 | |||||
| Net cash from operating activities & investments in non-financial assets | 837 | -265 | -161 | 145 | 110 | |||||
| Acquisitions under finance leases | — | — | — | — | — | |||||
| Surplus (+)/deficit (-)(a) | 837 | -265 | -161 | 145 | 110 | |||||
Source: Department of Treasury and Finance
- Note:
- (a)
- Table below shows GFS surplus (+)/deficit (-) excluding impact of Growing Victoria.
| Surplus (+)/deficit (-) exl Growing Victoria | 663 | 305 | 265 | 315 | 240 | ||||||
Table E.8: Public non-financial corporations sector cash flow statement
| | 2001-02 Revised | 2002-03 Budget | ||
|---|---|---|---|---|
| | ($ million) | |||
| Cash receipts from operating activities | ||||
| Receipts from sales of goods and services | 3 676 | 3 629 | ||
| Grants/subsidies received | 950 | 984 | ||
| Other receipts | 384 | 318 | ||
| Total receipts | 5 010 | 4 931 | ||
| Cash payments from operating activities | ||||
| Payment for goods and services | -2 866 | -2 834 | ||
| Grants and subsidies paid | -107 | -73 | ||
| Interest paid | -169 | -167 | ||
| Other payments | -672 | -773 | ||
| Total payments | -3 814 | -3 847 | ||
| Net cash flows from operating activities | 1 196 | 1 085 | ||
| Net cash flows from investing in non-financial assets | ||||
| Sales of non-financial assets | 88 | 85 | ||
| Purchases of non-financial assets | -1 014 | -1 387 | ||
| Total cash flows from investing in non-financial assets | -926 | -1 303 | ||
| Net cash flows from investments in financial assets for policy purposes | 39 | 286 | ||
| Net cash flows from investments in financial assets for liquidity purposes | 90 | 111 | ||
| Net cash flows from financing activities | ||||
| Advances received (net) | 12 | -3 | ||
| Borrowings (net) | -46 | 99 | ||
| Deposits received (net) | 1 | -1 | ||
| Distributions paid | -487 | -342 | ||
| Other Financing (net) | 11 | -2 | ||
| Total net cash flows from financing activities | -509 | -249 | ||
| Net increase in cash held | -110 | -70 | ||
| Net cash from operating activities, dividends paid, and investments in non-financial assets | -217 | -561 | ||
| Acquisition of assets under finance leases and similar arrangements | — | — | ||
| Surplus (+)/deficit (-) | -217 | -561 | ||
Source: Department of Treasury and Finance
Table E.9: Non-financial public sector cash flow statement
| | 2001-02 Revised | 2002-03 Budget | ||
|---|---|---|---|---|
| | ($ million) | |||
| Cash receipts from operating activities | ||||
| Taxes received | 8 602 | 8 629 | ||
| Receipts from sales of goods and services | 6 109 | 6 124 | ||
| Grants/subsidies received | 11 717 | 11 760 | ||
| Other receipts | 1 412 | 1 627 | ||
| Total receipts | 27 840 | 28 140 | ||
Cash payments from operating activities | ||||
| Payment for goods and services | -20 689 | -22 113 | ||
| Grants and subsidies paid | -2 741 | -2 757 | ||
| Interest paid | -641 | -639 | ||
| Other payments | -312 | -307 | ||
| Total payments | -24 383 | -25 816 | ||
| Net cash flows from operating activities | 3 458 | 2 325 | ||
| Net cash flows from investing in non-financial assets | ||||
| Sales of non-financial assets | 194 | 164 | ||
| Purchases of non-financial assets | -3 031 | -3 315 | ||
| Total cash flows from investing in non-financial assets | -2 837 | -3 151 | ||
| Net cash flows from investments in financial assets for policy purposes | 75 | 74 | ||
| Net cash flows from investments in financial assets for liquidity purposes | -806 | 624 | ||
| Net cash flows from financing activities | ||||
| Advances received (net) | -1 | -2 | ||
| Borrowings (net) | -38 | 96 | ||
| Deposits received (net) | 1 | -1 | ||
| Other financing (net) | 11 | -2 | ||
| Total net cash flows from financing activities | -27 | 91 | ||
| Net increase in cash held | -137 | -37 | ||
| Net cash from operating activities and investments in non-financial assets | 621 | -826 | ||
| Acquisition of assets under finance leases and similar arrangements | — | — | ||
| Surplus (+)/deficit (-)(a) | 621 | -826 | ||
Source: Department of Treasury and Finance
- Note:
- (a)
- Table below shows GFS surplus (+)/deficit (-) excluding impact of Growing Victoria.
| Surplus (+)/deficit (-) excl Growing Victoria | 795 | -1 396 | |||
Table E.10: General government sector expenses by function
| | 2001-02 Revised | 2002-03 Budget | ||
|---|---|---|---|---|
| | ($ million) | |||
| General public services | 752 | 920 | ||
| Public order and safety | 2 139 | 2 352 | ||
| Education | 6 392 | 6 455 | ||
| Health | 5 939 | 6 182 | ||
| Social security and welfare | 1 845 | 1 917 | ||
| Housing and community amenities | 1 500 | 1 258 | ||
| Recreation and culture | 543 | 521 | ||
| Fuel and energy | 134 | 17 | ||
| Agriculture, forestry, fishing, and hunting | 522 | 509 | ||
| Mining, manufacturing, and construction | 19 | 17 | ||
| Transport and communications | 2 384 | 2 374 | ||
| Other economic affairs | 326 | 483 | ||
| Other purposes | 1 314 | 1 765 | ||
| Total GFS expenses | 23 809 | 24 770 | ||
Table E.11: General government sector taxation
| | 2001-02 Revised | 2002-03 Budget | ||
|---|---|---|---|---|
| | ($ million) | |||
| Taxes on employers' payroll and labour force | 2 609 | 2 710 | ||
Taxes on property | ||||
| Land taxes | 519 | 611 | ||
| Stamp duties on financial and capital transactions | 2 104 | 1 805 | ||
| Financial institutions' transaction taxes | 287 | 249 | ||
| Other | 95 | 98 | ||
| Total | 3 005 | 2 764 | ||
| Taxes on the provision of goods and services | ||||
| Excises and levies | — | — | ||
| Taxes on gambling | 1 373 | 1 455 | ||
| Taxes on insurance | 725 | 790 | ||
| Total | 2 099 | 2 245 | ||
| Taxes on the use of goods and performance of activities | ||||
| Motor vehicle taxes | 922 | 949 | ||
| Franchise taxes | 7 | 7 | ||
| Other | 25 | 26 | ||
| Total | 954 | 982 | ||
| Total GFS taxation revenue | 8 666 | 8 701 | ||
Table E.12: Reconciliation between general government AAS31 net result and GFS measures
| | 2001-02 Revised | 2002-03 Budget | 2003-04 Estimate | 2004-05 Estimate | 2005-06 Estimate | |||||
|---|---|---|---|---|---|---|---|---|---|---|
| | ($ million) | |||||||||
| General government net result | 765 | 522 | 580 | 517 | 712 | |||||
| less operating revaluations & gains on sale of physical assets | -24 | -20 | -13 | -13 | -13 | |||||
| add back expense for doubtful debts | 7 | 8 | 8 | 8 | 9 | |||||
| Amortisation not included as GFS expenses | 59 | 71 | 65 | 65 | 65 | |||||
| Change to provision for employees superannuation (difference between nominal interest and expense) | 366 | -89 | -92 | -91 | -90 | |||||
| Unrealised gains on sales of investments | -13 | -3 | -3 | -3 | -3 | |||||
| General government net operating balance (GFS) | 1 161 | 489 | 545 | 483 | 680 | |||||
| Less: Gross fixed capital formation | -1 914 | -1 848 | -2 119 | -2 080 | -2 014 | |||||
| Add: Depreciation | 895 | 952 | 1 003 | 1 067 | 1 115 | |||||
| Change in inventories | 2 | -0 | -0 | -0 | -0 | |||||
| GFS net lending(+)/borrowing(-)(a) | 144 | -407 | -571 | -529 | -219 | |||||
Plus | ||||||||||
| Superannuation expense (non-cash) | 623 | 44 | 320 | 565 | 222 | |||||
| Other non-cash expenses | 71 | 98 | 90 | 110 | 108 | |||||
| GFS cash surplus(+)/deficit(-)(a) | 837 | -265 | -161 | 145 | 110 | |||||
| Growing Victoria net cash flow | 174 | -570 | -426 | -170 | -130 | |||||
| GFS cash surplus (+)/deficit (-) (exluding Growing Victoria) | 663 | 305 | 265 | 315 | 240 | |||||
| Net contributions to other sectors of government and other | -8 | -218 | -173 | -225 | -153 | |||||
| Movement in General Government Net Debt (excluding Growing Victoria) | 655 | 87 | 92 | 91 | 88 | |||||
Source: Department of Treasury and Finance
- Note:
- (a)
- The table below shows GFS net lending (+)/borrowing (-) and GFS cash surplus (+)/deficit (-) excluding the impact of Growing Victoria.
| GFS net lending (+) / borrowing (-) (excluding Growing Victoria) | - 30 | 163 | -145 | -359 | -89 | ||||||
Victoria's 2002-03 Nominated Loan Council Allocation
Table E.13 compares Victoria's 2002-03 Loan Council Allocation (LCA), as approved by Loan Council in March 2002, with the revised LCA based on the 2002-03 Budget estimates.
Victoria's revised LCA for 2002-03 has increased since Loan Council due largely to increased capital expenditure initiated in this Budget.
Table E.13: Loan Council Allocation 2002-03
| | 2002-03 Nomination | 2002-03 Revised | ||
|---|---|---|---|---|
| | ($ million) | |||
| General government sector cash (+) deficit/(-) surplus | -1 | 265 | ||
| Public non-financial corporation sector cash (+) deficit/(-) surplus | -87 | 561 | ||
| Non-financial public sector cash (+) deficit/(-) surplus(a)(b) | -87 | 826 | ||
Less: Net cash flows from investments | ||||
| in financial assets for policy purposes(c) | 69 | 74 | ||
| Plus: Memorandum items(c) | 181 | -19 | ||
| Loan Council Allocation | 25 | 733 | ||
| Tolerance limit (2% of non-financial public sector cash receipts from operating activities)(e) | 545 | 545 | ||
Source: Department of Treasury and Finance
- Notes:
- (a)
- The sum of the surplus / deficit of the general government and public non-financial corporation sector does not directly equal the non-financial public sector surplus due to intersectoral transfers, which are netted out in the calculation of the non-financial public sector figure.
- (b)
- The non-financial public sector surplus relating to the 2002-03 nomination includes net cash flows from investments in financial assets for policy purposes.
- (c)
- This item is the negative of net advances paid under a cash accounting framework.
- (d)
- Memorandum items are used to adjust the ABS deficit to include in LCAs certain transactions, such as operating leases, that have many of the characteristics of public sector borrowings but do not constitute formal borrowings. They are also used, where appropriate, to deduct from the ABS deficit certain transactions that Loan Council has agreed should not be included in LCAs (e.g., the over/under funding of employers' emerging costs under public sector superannuation schemes, or borrowings by entities such as statutory marketing authorities).
- (e)
- A tolerance limit equal to 2 per cent of 'total non-financial public sector cash receipts from operating activities' (2001-02 Budget Update) applies to jurisdictions' LCA nomination and revised LCA at budget time. The tolerance limit applying to Victoria's 2002-03 LCA nomination and revised is $545 million (2% of $27 240 million).
Listed below are details of Victoria's infrastructure projects with private sector involvement for which it is expected that contracts will be signed in the 2002-2003 financial year.
In line with the current Loan Council guidelines for the treatment of such projects, the termination liabilities as measured by the Government's contingent exposure, are to be included as a footnote to the LCA.
As the following projects are still in development stages, full details about the extent and nature of actual payments, forward commitments and contingent liabilities associated with the projects cannot be provided at this stage, but will be included in the 2002-03 LCA outcome.
Enviro Altona (City West Water)
City West Water is proposing to redevelop the existing Altona Treatment Plant. The project scope also involves the establishment of effluent reuse systems. The project will meet new licence conditions for discharge into Port Phillip Bay and cater for significant salt loads due to infiltration in the reticulation system.
The project transfers to a private party responsibility for design, construction and operational risks.
Westgate Terminal
In response to government objectives, the Melbourne Ports Corporation (MPC) has identified a 62 hectare site for the development of a third international container terminal.
The project transfers to a private party responsibility for construction, financial and operational (including demand) risks. MPC has retained a number of 'facilitation' risks such as provision of site.
Berwick Community Hospital
The Berwick Community Hospital project is being delivered under the Partnerships Victoria policy. The delivery of health and other core services will be managed by a public body, Southern Metropolitan Health Services. A private party will provide design, construction, building maintenance, carparking and security services.
Box Hill Hospital
Box Hill Hospital is seeking to engage the private sector to build a new multi-storey car park on the hospital site and operate the new and existing car parking facilities. This Partnerships Victoria project aims to address car parking shortages around the hospital. It is proposed that the private provider design, build, finance and operate the car park with the asset transferring back to the hospital after a period of 21 years. It is anticipated that the private provider will take on responsibility for design, construction, financing, commissioning and operating risks.
Statewide Personnel Alerting System
The Statewide Personnel Alerting System (SPAS) project is a multi-agency initiative to equip career and volunteer emergency services personnel throughout Victoria with alerting devices. SPAS will enable the Country Fire Authority, the Victorian Statewide Emergency Services and Rural Ambulance Victoria to contact their career and volunteer staff to alert them to emergency situations. The SPAS project will establish a network of sites that could be re-used for other projects arising from the Statewide Integrated Public Safety Communications Strategy.
The project is being delivered under the Partnerships Victoria policy framework. It is anticipated that the private provider will take on significant risks in relation to construction and commissioning of the network and ongoing maintenance of an alerting service.
Part of the higher level of disclosure required under the Financial Management (Financial Responsibility) Act 2000 is an overview of tax expenditures.
The Victorian tax system, in common with those of other state jurisdictions and the Commonwealth, contains a variety of concessions or exemptions as a means of providing assistance, encouragement or relief to particular taxpayers or particular activities. This assistance can take the form of tax exemptions, deductions, rebates, credits, concessionary rates or deferrals of payment of tax.
Table F.1 shows aggregate tax expenditure estimates by the main categories of tax for the period 2001-02 to 2005-06. The big rise in tax expenditures from $1496 million in 2001-02 to $1871 million by 2003-04 mainly reflects the impact of fast rising property prices on land tax and property related stamp duty exemptions. To a lesser extent it also reflects initiatives in this budget to increase the concessions to certain first home buyers.
Table F.1: Aggregate tax expenditures (excluding thresholds) by type of tax
| Description | 2001-02 Estimate | 2002-03 Estimate | 2003-04 Estimate | 2004-05 Estimate | 2005-06 Estimate | |||||
|---|---|---|---|---|---|---|---|---|---|---|
| | ($ million) | |||||||||
| Land tax | 782 | 931 | 1 076 | 1 053 | 1 029 | |||||
| Payroll tax | 419 | 430 | 444 | 466 | 492 | |||||
| Gambling taxes | 83 | 88 | 93 | 98 | 103 | |||||
| Vehicle taxation | 108 | 109 | 112 | 116 | 119 | |||||
| Other stamp duties | 104 | 146 | 146 | 146 | 146 | |||||
| Total estimated tax expenditures | 1 496 | 1 704 | 1 871 | 1 879 | 1 890 | |||||
Source: Department of Treasury and Finance
Table F.2 lists individual tax expenditures that can be costed and exceeded zero during the period 2000-01 to 2002-03 (excluding tax-free thresholds). The aggregates do not represent the total value of assistance provided via tax expenditures, as many tax expenditures cannot be estimated.
A land tax exemption applicable to land vested or held in trust for an association of ex-servicemen (or their dependents) and which is used for the purposes of the association is reported for the first time. Previous estimates for this exemption did not exceed zero and therefore were not reported.
Estimates of some tax expenditures in 2001-02 vary from previous years reflecting the effect of tax reform initiatives, including the abolition of financial institutions duty, the availability of up-to-date information and more accurate land valuation data.
This budget allocates $13 million in 2002-03 to reform, streamline and expand existing concessions on conveyancing duty to enable more Victorian families and people on low incomes to purchase their own homes. The maximum concession available will rise to $4 660. This will double the numbers of concession card holders and families with dependent children expected to receive a concession in 2002-03. As the exemptions for families buying their first home and concession card holders have been combined they are now shown on a consolidated basis.
Table F.2: Tax expenditures that can be costed and exceed zero (excluding thresholds)
| Description | 2000-01 Estimate | 2001-02 Estimate | 2002-03 Estimate | |||
|---|---|---|---|---|---|---|
| | ($ million) | |||||
| Land tax | ||||||
| Land tax exemption for property of the Crown in right of the State of Victoria | 179 | 205 | 229 | |||
| Principal place of residence exemption from land tax | 170 | 198 | 272 | |||
| Land tax exemption for land held in trust for public or municipal purposes or vested in any municipality | 89 | 157 | 178 | |||
| Land tax exemption for land used by a charitable institution exclusively for charitable purposes | 59 | 72 | 81 | |||
| Land tax exemption for Commonwealth land(a) | 61 | 59 | 65 | |||
| Land tax exemption for land used for primary production | 50 | 48 | 57 | |||
| Land tax exemption for land which is vested in a public statutory authority | 7 | 12 | 13 | |||
| Exemption from land tax for the City Link corporation in respect of land used for the City Link network(b) | 6 | 6 | 6 | |||
| Assessment of land tax on a single holding basis for land owned by a municipality and not used for other purposes | 3 | 9 | 10 | |||
| Land tax concessional rate for non-profit organisations carried on exclusively for social, sporting, cultural, literary purposes; or horse, pony or harness racing | 7 | 7 | 8 | |||
| Assessment of land tax on a single holding basis for land owned by a charity and not used for other purposes | 6 | 6 | 7 | |||
| Land tax exemption for retirement villages | 1 | 2 | 2 | |||
| Land tax exemption for a non-profit organisation providing or promoting outdoor cultural or sporting recreation (excluding horse, pony or harness racing) | 3 | 1 | 1 | |||
| Land tax exemption for friendly societies | 1 | 0 | 1 | |||
| Land tax exemption for association of ex-servicemen | 0 | 0 | 1 | |||
| Total | 642 | 782 | 931 | |||
Payroll tax | ||||||
| Payroll tax exemption for public hospitals | 114 | 114 | 116 | |||
| Payroll tax exemption for wages paid by a public benevolent institution or charity | 107 | 108 | 110 | |||
| Payroll tax exemption for wages paid by a non-profit, non-public, school | 51 | 51 | 52 | |||
| Payroll tax exemption for wages paid to an approved apprentice or trainee | 43 | 49 | 53 | |||
| Payroll tax exemption for Commonwealth Government departments and agencies, other than transport and communication enterprises | 38 | 39 | 40 | |||
| Payroll tax exemption for wages paid by non-profit hospitals | 24 | 24 | 24 | |||
| Description | 2000-01 Estimate | 2001-02 Estimate | 2002-03 Estimate | |||
|---|---|---|---|---|---|---|
| | ($ million) | |||||
| Payroll tax exemption for municipal councils (except wages associated with a council's trading activities) | 21 | 21 | 22 | |||
| Exemption from payroll tax for provision of fringe benefits excluded from Fringe Benefits Tax Assessment Act 1986 (Commonwealth) | 8 | 9 | 8 | |||
| Payroll tax exemption for religious institutions | 3 | 3 | 3 | |||
| Payroll tax exemption for leave entitlements paid by the Construction Industry Long Service Leave Board (now CONINVEST) | 1 | 1 | 1 | |||
| Payroll tax concession resulting from the non-grossing up of fringe benefits | 43 | 0 | 0 | |||
| Exemption from payroll tax for severance or redundancy payments made as compensation for loss of employment | 22 | 0 | 0 | |||
| Exemption from payroll tax for accrued sick leave, annual leave and long service leave paid on retirement or termination and accrued before 1 January 1996 | 9 | 0 | 0 | |||
| Total | 484 | 419 | 430 | |||
| Gambling | ||||||
| Lower rate of tax applied to the net cash balance of electronic gaming machines located in clubs | 78 | 83 | 88 | |||
| Total | 78 | 83 | 88 | |||
Other stamp duties | ||||||
| Stamp duty exemptions for corporate reconstruction | 113 | 98 | 125 | |||
| Conveyance duty concession for concession card holders and for family first home buyers | 5 | 6 | 19 | |||
| Mortgage duty exemption for eligible first home buyers and concession card holders | 0 | 0 | 2 | |||
| Mortgage duty exemption for dairy structural adjustment program | 1 | 0 | 0 | |||
| Total | 119 | 104 | 146 | |||
Vehicle taxation | ||||||
| Exemption from motor vehicle (non-commercial) registration fee for eligible beneficiaries | 103 | 104 | 105 | |||
| Exemption from registration fee for a vehicle of 4.5 tonnes or less that is used solely for primary production | 3 | 3 | 3 | |||
| Registration fee concession for commercial passenger vehicle licensed for the carriage of school children | 1 | 1 | 1 | |||
| Registration fee exemption for non-commercial vehicle owned by an incapacitated war service pensioner | 1 | 0 | 0 | |||
| Total | 108 | 108 | 109 | |||
| Description | 2000-01 Estimate | 2001-02 Estimate | 2002-03 Estimate | |||
|---|---|---|---|---|---|---|
| | ($ million) | |||||
| Financial institutions duty | ||||||
| FID exemption for the credit of an account kept for the payment of a pension, benefit, allowance, family assistance or bonus paid to older person | 8 | 0 | 0 | |||
| Financial institutions duty exemption for the credit of an account kept by a local government | 2 | 0 | 0 | |||
| Financial institutions duty exemption for the credit of an account kept for the payment of a veteran's pension | 1 | 0 | 0 | |||
| Total | 11 | 0 | 0 | |||
| Total estimated tax expenditures | 1 442 | 1 496 | 1 704 | |||
Source: Department of Treasury and Finance
- Notes:
- (a)
- See Commonwealth Constitution, section 114.
- (b)
- This figure has been revised and is based on the deprival value of the City Link reported in Melbourne City Link Authority's Annual Report.
Table F.3 shows the value of the tax-free thresholds provided by Victoria's tax system. In 2002-03, the tax-free threshold for land tax will be increased to $150 000 and the payroll tax threshold will be increased to $550 000.
Table F.3: Tax expenditure value of tax-free thresholds that can be costed
| Description | 2000-01 Estimate | 2001-02 Estimate | 2002-03 Estimate | |||
|---|---|---|---|---|---|---|
| | ($ million) | |||||
| Exemption from land tax—aggregated site value below $125 000 ($150 000 for 2002-03)(a) | 5 | 17 | 20 | |||
| Payroll tax exemption for employers' payroll below $515 000 ($550 000 for 2002-03) | 1 441 | 1 372 | 1 395 | |||
| Total for items estimated | 1 446 | 1 389 | 1 415 | |||
Source: Department of Treasury and Finance
- Note:
- (a)
- The tax-free threshold for 2000-01 was $85 000.
Including tax-free thresholds in tax expenditures, the total value of tax assistance provided by the Government is estimated at $3.1 billion in 2002-03.
The ratio of tax expenditures to taxation revenue for 2001-02 is estimated at 17 per cent (see Table F.4).
Table F.4: Estimated aggregate tax expenditures (excluding thresholds) and tax receipts in 2001-02
| Description | Tax expenditures | Tax receipts | Ratio | |||
|---|---|---|---|---|---|---|
| | ($ million) | |||||
| Land tax | 782 | 519 | 1.51 | |||
| Payroll tax | 419 | 2 609 | 0.16 | |||
| Financial institutions duty | — | 36 | 0.00 | |||
| Debits tax | — | 251 | 0.00 | |||
| Gambling taxes | 83 | 1 373 | 0.06 | |||
| Vehicle taxation | 108 | 1 013 | 0.11 | |||
| Other stamp duties | 104 | 2 191 | 0.05 | |||
| Other/miscellaneous | — | 766 | 0.00 | |||
| Total for items estimated | 1 496 | 8 758 | 0.17 | |||
Source: Department of Treasury and Finance
Table F.5 provides a grouping of tax expenditures to particular persons or entities based on the legal incidence of state taxes.
Table F.5: Aggregate tax expenditures (excluding thresholds) classified by persons or entities affected
| Description | 2000-01 Estimate | 2001-02 Estimate | 2002-03 Estimate | |||
|---|---|---|---|---|---|---|
| | ($ million) | |||||
| Business | 200 | 113 | 139 | |||
| Construction industry | 1 | 1 | 1 | |||
| Charitable organisations | 172 | 186 | 198 | |||
| Employees | 43 | 49 | 53 | |||
| Educational institutions | 52 | 52 | 53 | |||
| Gamblers | 78 | 83 | 88 | |||
| Commonwealth/State government departments and agencies | 285 | 315 | 347 | |||
| Local government | 115 | 187 | 210 | |||
| Hospitals | 138 | 138 | 140 | |||
| Concession card holders | 117 | 110 | 120 | |||
| Property owners | 172 | 200 | 281 | |||
| Primary producers | 54 | 51 | 60 | |||
| Religious institutions | 3 | 3 | 3 | |||
| Sporting, recreation and cultural organisations | 10 | 8 | 9 | |||
| Other | 1 | 0 | 1 | |||
| Total for items estimated | 1 442 | 1 496 | 1 704 | |||
Source: Department of Treasury and Finance
APPENDIX G: COMMONWEALTH-STATE FINANCIAL RELATIONS
IMPACT OF NATIONAL TAX CHANGES
The introduction of the goods and services tax (GST) in July 2000 brought about substantial changes in Commonwealth-State financial relations.
In June 1999, the Commonwealth, States and Territories signed the Intergovernmental Agreement on the Reform of Commonwealth-State Financial Relations (IGA). Under the IGA the States receive all GST revenue collected by the Commonwealth. However, in return, the Commonwealth ceased to pay the States and Territories financial assistance grants and revenue replacement payments from 1 July 2000. The IGA also required the States and Territories to adjust gambling taxes to take account of the GST, and abolish financial institutions duty and stamp duty on quoted marketable securities from 1 July 2001. The IGA also requires the States and Territories to fund the First Home Owners' Grant scheme and pay for the Australian Taxation Office (ATO) costs associated with administering the GST.
Net impact on budget
As the amount of GST revenue the States and Territories receive is currently less than the guaranteed minimum amount, which comprises revenue forgone and additional expenditure responsibilities, the Commonwealth makes payments to the States and Territories in the form of budget balancing assistance.
The net impact of all the GST-related measures on the State's budget for the period 2001-02 to 2005-06 is summarised in Table G.1.
Table G.1: Impact of the GST on the Victorian budget
| | 2001-02 Revised | 2002-03 Budget | 2003-04 Estimate | 2004-05 Estimate | 2005-06 Estimate | |||||
|---|---|---|---|---|---|---|---|---|---|---|
| | ($ million) | |||||||||
| Change in revenue | ||||||||||
| GST revenue | 5 689.0 | 6 154.2 | 6 472.0 | 6 735.6 | 7 117.5 | |||||
| Growth dividend(a) | 36.7 | 49.9 | 64.0 | 79.3 | 96.2 | |||||
| Financial institutions duty(a) | -342.2 | -386.7 | -398.3 | -410.2 | -422.6 | |||||
| Debits tax(b) | -257.8 | |||||||||
| Marketable securities(a) | -204.9 | -234.4 | -251.4 | -267.1 | -284.5 | |||||
| Gambling taxes | -413.1 | -438.2 | -464.8 | -491.0 | -518.8 | |||||
| Safety net revenues(c) | -1 583.7 | -1 632.5 | -1 688.0 | -1 745.2 | -1 795.3 | |||||
| Off-road diesel rebate | 57.4 | 56.5 | 57.3 | 58.1 | 58.9 | |||||
| WST equivalent payments from GBEs(a) | -5.0 | -5.0 | ||||||||
| Financial assistance grants forgone | -3 762.7 | -3 819.8 | -3 919.9 | -3 967.5 | -4 077.8 | |||||
| Total change in revenue | -528.6 | -256.0 | -129.0 | -8.0 | -84.2 | |||||
Change in expenditure | ||||||||||
| First Home Owners' Scheme | 360.0 | 181.9 | 256.7 | 262.7 | 268.0 | |||||
| Embedded tax savings(a) | -107.4 | -115.0 | -122.9 | -131.5 | -140.5 | |||||
| Interest cost on changed Commonwealth payments(a) | 3.4 | 4.2 | ||||||||
| Reimbursement of ATO administration costs | 128.9 | 139.3 | 142.3 | 145.1 | 148.0 | |||||
| Total change in expenditure | 384.9 | 210.4 | 276.1 | 276.3 | 275.5 | |||||
| Adjustments(d) | 17.1 | |||||||||
| Net budget impact prior to Commonwealth transitional guarantee | -930.7 | -466.4 | -405.1 | -284.3 | -359.8 | |||||
| Net Commonwealth guarantee payments | 930.7 | 436.3 | 360.9 | 225.3 | 289.5 | |||||
Source: Intergovenmental Agreement on the Reform of Commonwealth-State Financial Relations; Department of Treasury and Finance
- Notes:
- (a)
- These estimates have been agreed and will not be subject to further negotiation.
- (b)
- Under the Intergovenmental Agreement on the Reform of Commonwealth-State Financial Relations, debits tax will cease to apply by 1 July 2005, subject to review by the Ministerial Council on Commonwealth-State Financial Relations.
- (c)
- The estimated payments based on the Intergovernmental Agreement were reduced by the following amounts by the Commonwealth at the March 2002 Treasurer's Conference under the pretence that the Commonwealth was collecting less petrol excise following its decision to cease indexation of petroleum excise.
| | 2002-03 Budget | 2003-04 Estimate | 2004-05 Estimate | 2005-06 Estimate | ||||
|---|---|---|---|---|---|---|---|---|
| Commonwealth reduction | 30.1 | 44.2 | 59.0 | 70.3 | ||||
Victoria expects to receive budget balancing assistance of $436 million in 2002-03, compared with around $931 million in 2001-02. This assistance will continue for each State and Territory until GST grants exceed the guaranteed minimum amount. Victoria is likely to receive budget balancing assistance until 2006-07 and will not gain from the IGA until at least 2007-08 (see Chart G.1).
The difference between the 2001-02 budget and revised estimates for budget balancing assistance is due to an increase in Victoria's population share; lower Commonwealth collection of GST; higher foregone gambling revenue and a large rise in the number of first home owners grants.
The budget balancing assistance estimates for 2002-03 have been revised downwards due to increased collection of GST revenue from additional ATO compliance effort, the Commonwealth expectation that Victoria's number of first home owner grant recipients would halve between 2001-02 and 2002-03 and a reduction in Commonwealth payments below that provided for in the IGA.
Specifically, Victoria will receive $30 million less than the estimate of budget balancing assistance provided for in the IGA due to the Commonwealth unilaterally withdrawing $134 million of funding in 2002-03 from the States and Territories under the pretence that it was collecting less petrol excise following its decision to cease the indexation of petroleum excise. The agreed methodology for calculating the guaranteed minimum amount has broken the nexus between the amount of petroleum excise collected and the payments to the States and Territories, hence the Commonwealth's decision is clear breach of the IGA.
Chart G.1: Dependence on budget balancing assistance(a)
Source: Net Impact of the Intergovenmental Agreement on the Reform of Commonwealth-State Financial Relations table prepared by the States and Territories
- Note:
- (a)
- Based on parameters acknowledged at the March 2002 Heads of Treasuries, other than the petroleum indexation adjustment, which is based on the Commonwealth decision provided at the Treasurer's Conference.
APPENDIX H: REQUIREMENTS OF THE FINANCIAL MANAGEMENT (FINANCIAL RESPONSIBILITY) ACT 2000
This appendix describes the provisions of the amendments to the Financial Management Act 1994 and the Audit Act 1994, as contained in the Financial Management (Financial Responsibility) Act 2000, passed by Parliament in April 2000.
The provisions of the Financial Management (Financial Responsibility) Act 2000 have been complied with in these budget papers. Table H1 details the statements required to be included in the budget under the provisions of the Act, together with the respective chapters of the 2002-03 Budget Statement where these statements can be found.
Table H1: Statements required by the Financial Management (Financial Responsibility) Act 2000 and their location in Budget Statement 2002-03
| Relevant section of the amended Acts and corresponding requirement | Location | |
|---|---|---|
| Sections 23 E-G of the Financial Management Act 1994 | ||
Statement of financial policy objectives and strategies for the year | Chapter 1, Financial Policy Objectives and Strategies & Chapter 7, Estimated Financial Statements and Notes | |
Sections 23 H-J of the Financial Management Act 1994 | ||
Estimated financial statements for the year comprising: | Chapter 7, Estimated Financial Statements and Notes | |
— an estimated statement of financial performance over the year; | ||
— an estimated statement of financial position at the end of the year; | ||
Relevant section of the amended Acts and corresponding Location requirement | ||
— an estimated statement of cash flows for the year; and | ||
— a statement of the accounting policies on which these statements are based and explanatory notes. (Section 23 K of the Financial Management Act 1994) | ||
Statement accompanying the budget which: | ||
— outlines the material economic assumptions used in preparation of the estimated financial statements; | Chapter 3, Economic Conditions and Outlook & Chapter 7, Estimated Financial Statements and Notes | |
— discusses the sensitivity of the estimated financial statements to changes in these assumptions; | Chapter 6, Statement of Risks | |
— provides an overview of estimated tax expenditures in the budget; | Appendix F, Tax Expenditures | |
— provides a statement of the risks that may have a material effect on the estimated financial statements. | Chapter 6, Statement of Risks | |
Section 16B of the Audit Act 1994 | ||
The Auditor-General review and report on the estimated financial statements to ensure they are consistent with accounting convention and that the methodologies and assumptions used are reasonable. | Chapter 7, Estimated Financial Statements and Notes |
Figures in the tables and in the text have been rounded. Discrepancies in tables between totals and sums of components reflect rounding. Percentage changes in all tables are based on the underlying unrounded amounts.
The notation used in the tables and charts is as follows:
| LHS | left-hand-side | |
RHS | right-hand-side | |
s.a. | seasonally adjusted | |
n.a. | not available or not applicable | |
Cat. No. | catalogue number | |
1 billion | 1 000 million | |
1 basis point | 0.01 per cent |
A
Accounting policies, 138-54
Assets, 28, 96-100, 96-100
Auditor-General, 131
B
Balance sheet. See Estimated financial statements, Budget sector
Best start, 70, 180
Better Business Taxes. See Taxation
Better places to work and live. See also Department of Human Services,
Department of Infrastructure,
Department of Justice
Box Iron Bark. See Department of Natural Resources and Environment
Budget
Expenditure risks, 118-20
Revenue risks, 120
Sensitivity analysis, 112-18, 137
Budget aggregates
Operating expenses, 26, 31, 35, 40, 227
Operating revenue, 32-34, 36, 37, 32-34
Operating surplus, 10-13
Budget sector
Debt portfolio, 101
Statement of cash flows. See Estimated financial statements
Statement of financial performance. See Estimated financial statements
Statement of financial position. See Estimated financial statements
Building Tomorrow's Businesses Today. See also Department of Innovation, Industry and Regional Development
Building Tomorrow's Businesses Today, 64-65, 216
Business investment. See Economy
C
Capital expenditure. See Infrastructure
Capital grants. See Commonwealth grants
Commonwealth grants, 21-23, 155, 225 Community building, 91, 181, 202. See also Department of Infrastructure,
Department of Human Services, Department of Justice
Community safety, 82
Connecting Victoria. See also Department of Innovation, Industry and Regional Development
Conservation. See Department of Natural Resources and Environment
Consumer prices. See Economy
Contingent liabilities. See Liabilities
Current grants. See Commonwealth grants
D
Debt. See Budget sector
Department of Education and Training, 27, 157, 170-75, 219-20. See also Skilling Victoria
Literacy and numeracy, 71, 72, 172
Output initiatives, 171
School services, 66-73, 170-75
TAFE, 67, 72, 73, 93, 173, 175
Department of Human Services, 27, 157, 175-85, 219-20
Aged care, 73, 74, 185
Community services, 73-78, 178, 182
Health care, 78
Hospitals, 73-78, 177-78, 183-84
Output initiatives, 176, 177
Department of Infrastructure, 27, 157, 186-92, 219-20. See also Linking Victoria
Output initiatives, 186
Public transport, 84-87, 92, 186-90
Roads, 84-86
Department of Innovation, Industry and Regional Development, 27, 157, 192-96, 219-20
Output initiatives, 192
Synchrotron, 62, 193
Department of Justice, 27, 157, 196-200, 219-20
Emergency services, 80-84, 197, 198
Output initiatives, 196
Police, 81-83, 196, 200
Department of Natural Resources and Environment, 27, 157, 200-206, 219-20. See also Environment
Agriculture, 89
Conservation, 89, 203
Forests, 88, 89, 203
Healthy rivers, 89, 204
Land Exchange, 206
Output initiatives, 201
River Murray, 204
Showgrounds, 206
Department of Parliament, 27, 214-15, 219-20
Output initiatives, 214
Department of Parliment, 157
Department of Premier and Cabinet, 27, 157, 206-9, 219-20
Arts, 208, 209
Output initiatives, 207
Department of Tourism, Sport and the Commonwealth Games, 27, 157, 209-12, 219-20
Commonwealth Games, 92, 191, 209-12
Output initiatives, 210
Tourism, 210-11
Department of Treasury and Finance, 27, 157, 212-14, 219-20
Output initiatives, 213
E
Economic conditions
National economy, 46-47
Victorian economy, 47
Economic outlook, 54-55
Global outlook. See World economy
Risks, 111-12, 136
Economy
Business investment, 50
Consumer spending, 48
Dwelling construction, 49
Employment, 52
Exports, 51
Gross State Product. See Gross State Product (GSP)
Housing. See Dwelling construction
Inflation, 54. See Consumer prices
Population, 53
State final demand, 47
Unemployment, 52
Wages, 54
Education. See Department of Education and Training
Enhancing health services, 77. See also Department of Human Services
Environment, 64. See also Department of Natural Resources and Environment
Essential Services Commission, 213
Estimated financial statements, 132-34, 253-54
Estimated statement of cash flows, 134, 228, 235, 262-64
Estimated statement of financial performance, 132, 221-28, 242, 256-58
Estimated statement of financial position, 108, 133, 231, 259-61
Excellence in education. See also Department of Education and Training
F
Fees and fines. See Revenue
Financial assistance grants. See Commonwealth grants
Financial management, 219
Financial Management Act, 131, 167, 219
Financial objectives, 9-10
Financial statements. See Estimated financial statements
Forests. See Department of Natural Resources and Environment
Franchise fees. See Revenue
G
Gambling taxes. See Taxation
General government sector, 108, 132-34, 162, 235-51, 254, 256, 259, 262, 265
General purpose payments. See Commonwealth grants
Goods and services tax (GST), 277-79
Government Finance Statistics (GFS), 253
Gross state product, 54-55
Growing Victoria. See also Infrastructure
Growing Victoria Together, 58, 67, 70-74, 82-84, 87-91
H
Health rivers. See Department of Natural Resources and Environment
Hospitals. See Department of Human Services
I
Improved community services, 78. See also Department of Human Services, Department of Education and Training
Improved safety, 82. See also Department of Justice
Infrastructure, 13-16, 84, 219-20. See also Growing Victoria
Investment, 28, 84. See also Department of Infrastructure
Private provision. See Partnerships Victoria
Innovative industry, 61-66. See also Department of Innovation, Industry and Regional Development
Intergovernmental Agreement on the Reform of Commonwealth-State Financial Relations (IGA), 277-80
L
Land Exchange. See Department of Natural Resources and Environment
Land tax. See Taxation
Liabilities, 100-107
Contingent liabilities, 120-29
Unfunded sperannuation liabilities, 103-5
Unfunded superannuation liabilities, 160
Linking Victoria, 60, 85. See also Department of Infrastructure
M
Motor vehicle taxes. See Taxation
N
National Competition Policy payments. See Commonwealth grants
National tax reform. See Goods and services tax (GST)
Net assets. See Budget sector
Net financial liabilities, 20-21
Non-financial public sector, 255, 258, 261, 264
O
Operating statement. See Estimated financial statements
Operating surplus. See Budget aggregates
P
Partnerships Victoria, 87, 97-99, 97-99, 200
Payroll tax. See Taxation
Public non-financial corporations sector, 254, 257, 260, 263
Public transport. See Department of Infrastructure
R
Reducing inequalities, 90. See also Department of Human Services, Department of Education and Training
Regional unemployment. See Economy
Revenue, 29, 155. See also Commonwealth grants, Taxation
Sales of goods and services, 226
River Murray. See Department of Natural Resources and Environment
Roads. See Department of Infrastructure
Rural and regional Victoria. See Economy, Department of Innovation, Industry and Regional Development
S
Scoresby Freeway, 190. See Department of Infrastructure
Service delivery, 16-18. See also, Linking Victoria
Private provision. See Partnerships Victoria
Showgrounds. See Department of Natural Resources and Environment
Specific purpose payments. See Commonwealth grants
Spending initiatives. See Service delivery
Statement of cash flows. See Estimated financial statements
Statement of financial performance. See Estimated financial statements
Statement of financial position. See Estimated financial statements
Stronger communities, 58-61, 79, 91. See also Department of Infrastructure, Department of Human Services, Department of
Justice
T
Taxation, 18-20, 155, 222-24. See also Goods and services tax (GST)
Better Business Taxes, 216
Competitivness, 216
Gambling, 223
Land tax, 65, 217
Motor vehicles, 224
Payroll tax, 65, 216, 223
Property taxes, 223
Tax expenditures, 18-20
Transport Accident Commission, 191
U
Unfunded superannuation liability. See Liabilities
Uniform Reporting Framework Agreement (URF). See Government Finance Statistics (GFS)
V
Valuing our resources, 87-90. See also Department of Natural Resources and Environment. See also Department of Natural
Resources and Environment
W
World economy, 45-46
Presented by
The Honourable John Brumby, M.P.
Treasurer of the State of Victoria
for the information of Honourable Members
Budget Paper No. 3
| Introduction | |||
| Statement 1—Departmental Overview | |||
| Statement 2—Departmental Statements | |||
| Statement 3—State Revenue | |||
| Statement 4—Public Account | |||
| Format of information | |||
| Differences in estimates between Budget Paper No. 2 and Budget Paper No. 3 | |||
| Rounding convention | |||
| Appropriations | |||
Departmental Overview | |||
| Departmental resources | |||
| Parliamentary authority for resources | |||
| Management reform and Growing Victoria Together | |||
| Departmental objectives supporting Growing Victoria Together | |||
| Valuing and investing in lifelong education | |||
| High quality, accessible health and community services | |||
| Sound financial management | |||
| Safe streets, homes and workplaces | |||
| Growing and linking all of Victoria | |||
| Promoting sustainable development | |||
| More jobs and thriving, innovative industries across Victoria | |||
| Building cohesive communities and reducing inequalities | |||
| Protecting the environment for future generations | |||
| Promoting rights and respecting diversity | |||
| Government that listens and leads | |||
Department of Education and Training | |||
| Part 1: Outlook and Outputs | |||
| Overview | |||
| Departmental objectives | |||
| Review of 2001-02 | |||
| Outlook for 2002-03 | |||
| Output information | |||
| Part 2: Financial Information | |||
| Financial Statements | |||
| Authority for Resources | |||
Department of Human Services | |||
| Part 1: Outlook and Outputs | |||
| Overview | |||
| Review of 2001-02 | |||
| 2002-03 Outlook | |||
| Output Information | |||
| Part 2: Financial Information | |||
| Financial Statements | |||
| Authority for Resources | |||
Department of Infrastructure | |||
| Part 1: Outlook and Outputs | |||
| Overview | |||
| Departmental Objectives | |||
| 2001-02 Review | |||
| 2002-03 Outlook | |||
| Output Information | |||
| Part 2: Financial Information | |||
| Financial Statements | |||
| Authority for Resources | |||
| Payments on behalf of State | |||
Department of Innovation, Industry and Regional Development | |||
| Part 1: Outlook and Outputs | |||
| Overview | |||
| Departmental Objectives | |||
| Review of 2001-02 | |||
| 2002-03 Outlook | |||
| Output Information | |||
| Part 2: Financial Information | |||
| Financial Statements | |||
| Authority for Resources | |||
Department of Justice | |||
| Part 1: Outlook and Outputs | |||
| Overview | |||
| Review of 2001-02 | |||
| 2002-03 Outlook | |||
| Output Information | |||
| Part 2: Financial Information | |||
| Financial Statements | |||
| Authority for Resources | |||
Department of Natural Resources and Environment | |||
| Part 1: Outlook and Outputs | |||
| Overview | |||
| Departmental Objectives | |||
| Review of 2001-02 | |||
| 2002-03 Outlook | |||
| Output Information | |||
| Part 2: Financial Information | |||
| Financial Statements | |||
| Authority for Resources | |||
| Payments on behalf of the State | |||
Department of Premier and Cabinet | |||
| Part 1: Outlook and Outputs | |||
| Overview | |||
| Departmental Objectives | |||
| Review of 2001-02 | |||
| 2002-03 Outlook | |||
| Output Information | |||
| Part 2: Financial Information | |||
| Financial Statements | |||
| Authority for Resources | |||
Department of Tourism, Sport and the Commonwealth Games | |||
| Part 1: Outlook and Outputs | |||
| Overview | |||
| Departmental Objectives | |||
| Review of 2001-02 | |||
| 2002-03 Outlook | |||
| Output Information | |||
| Part 2: Financial Information | |||
| Financial Statements | |||
| Authority for Resources | |||
| Payments on behalf of State | |||
Department of Treasury and Finance | |||
| Part 1: Outlook and Outputs | |||
| Overview | |||
| Scope and Coverage | |||
| Review of 2001-02 | |||
| 2002-03 Outlook | |||
| Output Information | |||
| Part 2: Financial Information | |||
| Financial Statements | |||
| Authority for Resources | |||
| Payments on behalf of State | |||
Parliament | |||
| Part 1: Outlook and Outputs | |||
| Overview | |||
| Review of 2001-02 | |||
| 2002-03 Outlook | |||
| Output Information | |||
| Part 2: Financial Information | |||
| Financial Statements | |||
| Authority for Resources | |||
State Revenue | |||
| Summary of general government sector State revenue | |||
| State sourced revenue | |||
| Taxation | |||
| Regulatory fees and fines | |||
| Sale of goods and services | |||
| Investment income | |||
| Other revenue | |||
| Grants Received | |||
| General purpose grants | |||
| Specific purpose grants | |||
| Specific purpose grants for on-passing | |||
Public Account | |||
| Consolidated Fund | |||
| The Trust Fund | |||
Abbreviations and Acronyms | |||
Style Conventions | |||
Index | |||
The 2002-03 Budget Estimates, Budget Paper No. 3, comprises a summary of the activities supported predominantly from the Budget, revenue and expenses, and the outputs which the Government expects to purchase. It also identifies the departmental objectives that are to be achieved through the delivery of outputs. This document is the primary source of information for readers interested in the detailed output delivery plans of individual departments.
The 2002-03 Budget Estimates, Budget Paper No. 3 consists of the following four statements:
Statement 1—Departmental Overview
Statement 1 provides a brief discussion of departmental financial estimates.
Statement 2—Departmental Statements
The Departmental Statements in Statement 2 incorporate a 'total resources' view of each department, showing the financial resources available to the department from all sources, the way these resources are used and the basis of the authority of the department to obtain and use these resources. The content for each department is separated into two parts.
Part One provides a set of output tables outlining the description of the outputs and the relationship between the outputs and the departmental objectives to be achieved. Also included are selected performance measures and targets for the quantity, quality, timeliness and cost for each output produced by the department.
Part Two summarises financial information about the resources available to a department as well as the use of those resources. This section also provides details of the parliamentary authority for the department's resources.
Section 40 of the Financial Management Act 1994 requires a separate statement to accompany the annual Appropriation Bills detailing the goods and services produced or provided by each department, a description of the amounts available to each department during the period, the estimated receipts and receivables of the department and such other information as the Minister determines. This requirement is fulfilled with the publication of Statement 2 of this Budget paper.
Statement 3—State Revenue
Statement 3 outlines the various sources of State Government revenue, including taxes, regulatory fees and fines, public authority income and grants made to the State by the Commonwealth Government, for both general and specific purposes.
Statement 4—Public Account
Statement 4 provides details of Public Account receipts and payments giving details of the consolidated receipts, special appropriation and total annual appropriations from the Consolidated Fund for departments.
Format of information
The financial information presented in this paper is prepared consistent with generally accepted accounting principles.
The format of the financial statements provided in Statement 2 (Part Two) of this paper have been revised in accordance with the Model Financial Report (MFR) for Victorian Government Departments. These statements include:
- •
- a statement of financial performance, detailing total revenue earned and expenses incurred in relation to departmental activities during the financial year;
- •
- a statement of financial position, detailing assets and liabilities of departments as at the end of the financial year;
- •
- a statement of cash flows, providing information in relation to total cash receipts and payments during the financial year; and
- •
- an administered items statement, providing information on the transactions and balances relating to activities that departments administer or manage on behalf of the State.
In accordance with the adoption of the MFR, Section 29 receipts are now receipted into the administered entity of each department, and then re-appropriated into the controlled entity as output appropriation.
In addition, consistent with the application of a new accounting standard (UIG38 Abstract 38 Contributions by Owners Made to Wholly-Owned Public Sector Entities) certain transactions (mainly relating to funding provided by government for asset investment) between government entities that were previously classified in departmental statements of financial performance as revenue and expenses, are now treated as equity contributions by Government in the statement of financial position.
Actual outcomes for 2000-01 are included in all financial statements, in the new MFR format. Also included are revised estimates of the projected outcome for the 2001-02 financial year (2001-02 revised estimates) as well as the normal budget to budget comparison for the financial and output performance estimates. In keeping with established practice, adjustments have been made to the published 2001-02 Budget figures so that comparisons are made on a consistent basis. These adjustments mainly relate to the inclusion of actual carryover amounts from 2000-01 replacing the estimated departmental carryovers incorporated in the 2001-02 Budget.
Since the 2002-03 Budget is brought down prior to the start of the financial year, no actual financial and only limited performance measurement data for the 2001-02 year is available for publication. However, when available, 2000-01 actuals information on performance measures has been included. The 2001-02 revised estimates take into account any additional funding approved during 2001-02 for departments and provide the best available estimate of the actual financial and performance information for the current financial year.
The Government uses the general government sector as the basis of whole-of-government reporting in the 2002-03 Budget Papers. The general government sector is an institutional classification defined by the Australian Bureau of Statistics in accordance with international classification systems. It includes all government entities where revenues are considered to be non-market in nature and whose output is for the collective consumption of the community. The general government non-budget sector in Victoria is comprised of around 30 entities and includes Parks Victoria, Country Fire Authority and the Royal Botanical Gardens.
Differences in estimates between Budget Paper No. 2 and Budget Paper No. 3
A number of differences exist between estimates presented in Budget Paper No. 2 and Budget Paper No. 3. These reflect the different purposes of each Budget Paper.
Budget Paper No. 2 focuses on outlining the government's budgetary strategies and the impact of government policy on the economy. This Paper contains the consolidated general government sector financial estimates in Australian Accounting Standard 31 (AAS31) format.
Budget Paper No. 3, on the other hand, is prepared from the perspective of departmental operations. As stated above, the financial information is prepared using generally accepted accounting principles (in particular, adopting Australian Accounting Standard 29 (AAS29)) and therefore reflects the full cost of all activities undertaken by each department. The financial statements in this paper provide financial details on a department by department basis to support the aggregated AAS31 information provided in Budget Paper No. 2. This information is used as a management and reporting tool to assist departments in making better decisions about the allocation of departmental resources.
Budget Paper No. 2 provides financial information on a whole-of-government basis which is consolidated to eliminate internal transfers between budget sector entities such as payroll tax. This means that the individual departmental financial estimates, provided on an AAS29 format, when aggregated will not reconcile to the information provided in Budget Paper No. 2, as the internal eliminations would not have been taken into account.
Rounding convention
Figures in the tables and in the text in this Budget Paper have been rounded. Discrepancies in tables between totals and sums of components reflect rounding. Percentage variations in all tables are based on the underlying unrounded amounts.
Appropriations
Parliament appropriates funds either under a standing authority through special appropriations provided for under various Acts or annually pursuant to annual appropriation acts and the Financial Management Act 1994. Special appropriations are generally provided for payments that are made on an ongoing basis independent of the Government's annual budget.
The Appropriation (2002/2003) Act provides global appropriations for departments. In a number of instances the global appropriation is supplemented by separate appropriations required by legislation for specific purposes, such as in the Department of Natural Resources and Environment for the Environment Protection Authority. In the case of the Parliament, the Appropriation (Parliament 2002/2003) Act provides appropriations on a departmental basis.
As in previous years, the appropriation acts for 2002-03 will provide legislative authority for the Government to incur expenses for the purposes set out in Schedule 1 and to make arrangements for departments to earn revenue up to the appropriation authority in the bills.
The Acts will again provide for three appropriation purposes:
- •
- provision of outputs;
- •
- additions to the net asset base; and
- •
- payments made on behalf of the State.
STATEMENT 1
DEPARTMENTAL OVERVIEW
DEPARTMENTAL RESOURCES
Statement 2 of this paper provides detailed information on departmental resources, including output and financial statements for each department.
The information included in Statement 2 gives a complete picture of departmental resources both in aggregate and by output. The information provided on outputs includes the major outputs to be provided by each department and performance measures for quantity, quality, timeliness and cost of delivery.
Table 1.1: Operating expenses by department
| Controlled and administered expenses | 2002-03 Budget | 2003-04 Estimate | 2004-05 Estimate | 2005-06 Estimate | |||||
|---|---|---|---|---|---|---|---|---|---|
| | ($ million) | ||||||||
| Education and Training | 7 140.0 | 7 297.4 | 7 329.2 | 7 302.6 | |||||
| Human Services | 8 905.5 | 8 953.8 | 9 038.2 | 9 079.3 | |||||
| Infrastructure | 3 030.9 | 2 857.5 | 2 996.8 | 2 997.5 | |||||
| Innovation, Industry and Regional Development | 431.9 | 266.7 | 202.6 | 194.1 | |||||
| Justice | 2 192.9 | 2 182.7 | 2 258.8 | 2 263.6 | |||||
| Natural Resources and Environment | 1 142.4 | 1 056.5 | 1 003.8 | 998.4 | |||||
| Premier and Cabinet | 508.8 | 497.6 | 536.3 | 543.7 | |||||
| Tourism, Sport and the Commonwealth Games | 105.1 | 85.0 | 75.7 | 72.4 | |||||
| Treasury and Finance | 2 018.4 | 2 067.2 | 2 091.3 | 2 135.4 | |||||
| Parliament | 102.6 | 100.0 | 98.2 | 98.6 | |||||
| Contingencies not allocated to departments(a) | 427.0 | 1 008.0 | 1 507.2 | 2 030.0 | |||||
| Regulatory bodies and other part budget funded agencies | 835.1 | 856.5 | 879.1 | 903.0 | |||||
| Total | 26 840.7 | 27 228.9 | 28 017.2 | 28 618.7 | |||||
| Less eliminations | (2 080.7 | ) | (2 120.3 | ) | (2 156.1 | ) | (2 158.1 | ) | |
| Total operating expenses | 24 760.0 | 25 108.6 | 25 861.1 | 26 460.6 | |||||
Source: Department of Treasury and Finance
- Note:
- (a)
- Departmental expenses will be supplemented for certain costs that are provided for in contingencies.
Table 1.1 details the total operating expenses for each department. General government non budget sector agencies, such as Parks Victoria, Country Fire Authority, Metropolitan Fire and Emergency Services Board, catchment management authorities and a range of occupational registration boards are included in total operating expenses in the category "Regulatory bodies and other part budget funded agencies".
Total operating expenses for each department (controlled and administered) shown in Table 1.1 are consistent with the financial estimates contained in Statement 2. The sum of these expenses differs from the operating expenses for whole-of-government as shown in Budget Paper No. 2, as the latter eliminates inter-sector transactions such as payroll tax paid by departments and other transactions between departments. As shown in Table 1.1, these inter-sector eliminations total $2.1 billion in 2002-03.
Table 1.2 details the purchase of fixed assets for each department. These estimates show the estimated purchases of fixed assets of departments.
Table 1.2: Purchase of fixed assets by department
| Department | 2002-03 Budget | 2003-04 Estimate | 2004-05 Estimate | 2005-06 Estimate | ||||
|---|---|---|---|---|---|---|---|---|
| | ($ million) | |||||||
| Education and Training | 475.0 | 394.8 | 240.3 | 236.3 | ||||
| Human Services | 412.8 | 391.4 | 206.8 | 81.2 | ||||
| Infrastructure | 530.4 | 624.4 | 549.7 | 588.9 | ||||
| Innovation, Industry and Regional Development | 59.0 | 64.7 | 38.5 | 18.1 | ||||
| Justice | 190.5 | 127.1 | 203.5 | 64.9 | ||||
| Natural Resources and Environment | 126.7 | 136.4 | 68.1 | 39.3 | ||||
| Premier and Cabinet | 92.9 | 34.4 | 22.1 | 24.0 | ||||
| Tourism, Sport and the Commonwealth Games | 2.0 | 0.8 | 1.3 | 0.8 | ||||
| Treasury and Finance | 92.8 | 35.2 | 30.3 | 30.3 | ||||
| Parliament | 7.0 | 3.3 | 3.3 | 3.3 | ||||
| Other general government sector agencies | 91.2 | 62.7 | 58.5 | 55.1 | ||||
| Not allocated to departments(a) | (153.0 | ) | 306.0 | 706.4 | 920.8 | |||
| Total | 1 927.3 | 2 181.3 | 2 128.9 | 2 063.1 | ||||
Source: Department of Treasury and Finance
- Note:
- (a)
- Amount available to be allocated to specific departments and projects in future budgets. Includes unallocated provision in respect of the Growing Victoria infrastructure reserve.
Parliamentary authority for resources
The departmental statements within Statement 2 provide details of the departmental expenses estimates in relation to the provision of outputs and payments on behalf of the State. However, under the Constitution Act 1975 it is necessary for the Parliament to provide authority to enable the Treasurer to provide revenue to government departments to meet their agreed output provision responsibilities.
Table 1.3 details the parliamentary authority for resources available to departments in aggregate. Details of the authority for each department are provided in Part Two of the individual departmental statements contained in Statement 2.
Table 1.3: Parliamentary authority for resources
| | 2001-02 Budget | 2001-02 Revised | 2002-03 Budget | Variation(a) % | |||||
|---|---|---|---|---|---|---|---|---|---|
| | ($ million) | ||||||||
| Annual appropriations | 18 100.4 | 18 239.9 | 19 654.7 | 8.6 | |||||
| Receipts credited to appropriations(b) | 1 368.0 | 1 400.4 | 1 443.7 | 5.5 | |||||
| Unapplied previous years appropriation(c) | 226.3 | 323.5 | 146.7 | (35.2 | ) | ||||
| Accumulated surplus—previously applied appropriation | 48.2 | 56.3 | 3.5 | (92.7 | ) | ||||
| Gross annual appropriations | 19 742.9 | 20 020.1 | 21 248.6 | 7.6 | |||||
| Special appropriations | 2 040.2 | 1 711.8 | 2 376.2 | 16.5 | |||||
| Trust funds | 1 946.2 | 2 058.0 | 2 099.0 | 7.8 | |||||
| Total Parliamentary authority | 23 729.3 | 23 789.9 | 25 723.8 | 8.4 | |||||
Source: Department of Treasury and Finance
- Notes:
- (a)
- Variation is between the 2001-02 Budget and the 2002-03 Budget.
- (b)
- For 2001-02 Revised this item is the actual receipts credited, while for 2001-02 Budget it is the estimate at the time of the 2001-02 Budget.
- (c)
- Estimates of carryover for 2002-03. Actual carryovers are subject to approval by the Treasurer prior to 30 June pursuant to Section 32 of the Financial Management Act 1994. For 2001-02 Revised the actual carryover from 2000-01 to 2001-02 is included, while for the Budget it reflects the departmental estimate at the time of the 2002-03 Budget.
MANAGEMENT REFORM AND GROWING VICTORIA TOGETHER
The Government is responsible for the performance of departments in achieving its overall priorities. Commitment to transparent and responsible leadership has resulted in the introduction of significant enhancements to the resource allocation and performance management frameworks.
In the 2001-02 Budget, the Government published for the first time a set of departmental objectives to support detailed budget and output planning by departments.
While outputs are the products and services delivered by departments, the rationale for delivering those outputs is provided by departmental objectives. In other words, departmental objectives establish strategic goals for departments and outputs are the means by which to achieve them.
By providing departments with a medium range focus for the delivery of outputs, departmental objectives directly support the achievement of Government outcomes.
The Growing Victoria Together framework, which was released in November 2001, outlines the Government's vision for Victoria over the next decade and identifies the important strategic issues (issues important to Victorians) that will guide resource allocation over the medium to longer-term. Importantly, it provides a triple bottom line framework to balance economic, social and environmental actions to guide budget and policy choices to build a fair, sustainable and prosperous Victoria.
Growing Victoria Together also provides a range of measures to demonstrate progress. The performance of the Government and individual departments can be assessed against these progress measures over the medium to longer-term.
The Growing Victoria Together framework covers the Government's key strategic issues, to be addressed across government. The issues identified by Growing Victoria Together and the small number of progress measures therefore relate to many, but not necessarily all, departmental objectives and outputs. Similarly, there may not always be a direct link between each departmental objective and each Growing Victoria Together strategic issue. Some departmental objectives may relate to the achievement of a number of Growing Victoria Together strategic issues.
The Growing Victoria Together framework, departmental objectives, outputs and output performance measures form an integrated framework for resource allocation and performance measurement which:
- •
- provides for alignment of departmental objectives and outputs with Government outcomes in the Growing Victoria Together vision; and
- •
- assists in the identification of linkages and synergies between outputs both within and between departments to support the achievement of outcomes across government.
Departments are continuing to work on, and improve, the alignment between the different elements of the Government's resource allocation and performance management framework.
While not comprehensive of all interactions between departmental objectives and Growing Victoria Together, the following indicates key linkages between departmental objectives supporting Growing Victoria Together.
DEPARTMENTAL OBJECTIVES SUPPORTING GROWING VICTORIA TOGETHER
Valuing and investing in lifelong education
Demonstrating progress
- •
- Victorian primary school children will be at or above national benchmark levels for reading, writing and numeracy by 2005.
- •
- 90% of young people in Victoria will successfully complete Year 12 or its equivalent by 2010.
- •
- The percentage of young people aged 15-19 in rural and regional Victoria engaged in education and training will rise by 6% by 2005.
- •
- The proportion of Victorians learning new skills will increase.
Supporting departmental objectives
- •
- Improve the standards of literacy and numeracy in primary schooling (Education and Training).
- •
- Increase the percentage of young people who successfully complete Year 12 or its equivalent (Education and Training).
- •
- Have more adults take up education and training, and so increase the overall level of educational attainment and literacy levels in Victoria (Education and Training).
- •
- Increase the level of participation and achievement in education and training in rural and regional Victoria, and among groups where it's presently low (Education and Training).
- •
- Make near-universal participation in post school education and training the norm in our society (Education and Training).
- •
- Develop and lead a whole of government initiatives to improve the outcomes for all young Victorians (Education and Training).
High quality, accessible health and community services
Demonstrating progress
Supporting departmental objectives
- •
- Waiting times for health, community care, disability and housing programs are at or below national benchmark levels (Human Services).
- •
- Quality of human services improves each year (Human Services).
- •
- Sustainable, well-managed and efficient Government and non-government service sectors (Human Services).
- •
- Reduce social dislocation and the need for secondary and tertiary service intervention through strengthening communities, family support, early intervention and health promotion measures (Human Services).
- •
- Increase the proportion of people needing the Department's funded services who remain in supportive families and communities (Human Services).
- •
- Reduce inequalities in health status and well-being and in access to services (Human Services).
Sound financial management
Demonstrating progress
- •
- An annual budget surplus.
- •
- Victoria's taxes will remain competitive with the Australian average.
- •
- Maintain a Triple A rating.
Supporting departmental objectives
- •
- Providing sound financial management of the State's fiscal resources with an emphasis on maintenance of a substantial budget surplus (Treasury and Finance).
- •
- Guiding Government actions to best increase living standards for all Victorians through the provision of innovative policy advice (Treasury and Finance).
- •
- Championing an integrated whole of government approach to ensure optimal service delivery and provision of world-class infrastructure to benefit all Victorians (Treasury and Finance).
Safe streets, homes and workplaces
Demonstrating progress
- •
- Violent crime and fear of violent crime will be reduced.
- •
- Road accidents and deaths will be reduced by 20 per cent over the next five years.
Supporting departmental objectives
- •
- Reduce the incidence of violent crime in target areas (Justice).
- •
- Maintain and enhance the confidence of Victorians in their personal safety and reduce their fear of crime (Justice).
- •
- Improve transport and marine safety and reduce the incidence, severity and costs of accidents and incidents (Infrastructure).
- •
- Reduce Victoria's road toll (Justice).
- •
- Reduce offending and re-offending rates and the number of prisoners returning to prison (Justice).
Growing and linking all of Victoria
Demonstrating progress
- •
- The proportion of freight transported to ports by rail will increase from 10 per cent to 30 per cent.
- •
- Rail travel times will be reduced to Ballarat, Geelong, Bendigo and the Latrobe Valley.
- •
- Travel in Melbourne taken on public transport will increase from 9 per cent to 20 per cent by the year 2020.
Supporting departmental objectives
- •
- Enhance the potential for regional development and access to services and markets (Infrastructure).
- •
- Facilitate the development of an integrated and seamless freight and logistics system that enhances global competitiveness and meets the needs of business (Infrastructure).
- •
- Deliver a sustainable transport system that meets people's changing access and mobility needs (Infrastructure).
- •
- Develop a stronger and more effective local government sector in Victoria that is responsive to community expectations and is best placed to meet the needs of the community (Infrastructure).
- •
- Deliver cost effective investment in and management of infrastructure development in Victoria (Infrastructure).
Promoting sustainable development
Demonstrating progress
- •
- Renewable energy efforts will increase.
- •
- Energy consumption in Government buildings will be reduced by 15 per cent and the use of electricity from Green Power by Government will be increased to 5 per cent by 2005.
- •
- Waste recycling efforts will increase and the use of landfill as a waste disposal method will be reduced.
- •
- Wastewater reuse in Melbourne will increase from 1 per cent to 20 per cent by 2010.
Supporting departmental objectives
- •
- Enhance the liveability of communities across Victoria (Infrastructure).
- •
- Contribute to sustainable economic growth of Victoria's land and resource based industries while balancing social, environmental and economic outcomes (Natural Resources and Environment).
- •
- Support the commitment, and capacity of Victorians to live and manage sustainably within the landscape (Natural Resources and Environment).
More jobs and thriving, innovative industries across Victoria
Demonstrating progress
- •
- Victoria's productivity and competitiveness will increase. We will see this through increasing GDP per worker.
- •
- There will be more and better jobs across Victoria.
- •
- The proportion of Victorians learning new skills will increase.
- •
- A greater share of innovative R&D activity will be in Victoria.
Supporting departmental objectives
- •
- Encourage and support the development of innovative, internationally integrated and competitive industries and businesses for Victoria (Innovation, Industry and Regional Development).
- •
- Work to create a competitive business environment and capabilities for the innovation economy (Innovation, Industry and Regional Development).
- •
- Strengthen Victoria's regional economies, infrastructure and communities (Innovation, Industry and Regional Development).
- •
- Support the development of high performing, cooperative and fair workplaces and a highly skilled workforce (Innovation, Industry and Regional Development).
- •
- To encourage and support the contribution of tourism, sport and recreation to economic and social development and to environmental responsibility (Tourism, Sport and Commonwealth Games).
- •
- To strengthen Victoria's sport, recreation, major events and tourism base (Tourism, Sport and Commonwealth Games).
- •
- Delivering services and programs to enhance the contribution of creative industries within the Victorian community (Premier and Cabinet).
Building cohesive communities and reducing inequalities
Demonstrating progress
- •
- The extent and diversity of participation in community, cultural and recreational organisations will increase.
- •
- In a crisis there will be more people Victorians can turn to for support.
- •
- Inequalities in health, education and well being between communities will be reduced.
Supporting departmental objectives
- •
- Increase the level of participation and achievement in education and training in rural and regional Victoria, and among groups where it's presently low (Education and Training).
- •
- Reduce social dislocation and the need for secondary and tertiary service intervention through strengthening communities, family support, early intervention and health promotion measures (Human Services).
- •
- Reduced inequalities in health status and well-being and in access to services (Human Services).
- •
- Strengthen Victoria's regional economies, infrastructure and communities (Innovation, Industry and Regional Development).
- •
- Develop and lead Whole of Government initiatives to ensure effective outcomes for all Victorians (Premier and Cabinet).
Protecting the environment for future generations
Demonstrating progress
- •
- The Snowy River will be returned to 21 per cent of its original flow within 10 years and over time to 28 per cent.
- •
- The quality of air and drinking water will improve.
- •
- The health of Victoria's catchments, rivers and bays will improve.
- •
- The area covered by native vegetation will increase.
- •
- There will be a real reduction in the environmental and economic impact of salinity by 2015.
Supporting departmental objectives
- •
- Reduce the impact of human activity in Victoria on the environment (Natural Resources and Environment).
- •
- Better understand biodiversity values and improve knowledge of the way ecosystems function to assist Victorians to live and work within the capacity of the environment (Natural Resources and Environment).
- •
- Provide a safe and ecologically sustainable living environment through protection and restoration of air, land and water quality and the control of unwanted noise (Natural Resources and Environment).
Promoting rights and respecting diversity
Demonstrating progress
- •
- The proportion of Victorians aware of their legal and civil rights will increase.
- •
- More Victorians from all backgrounds will have the opportunity to have a say on issues which matter to them.
Supporting departmental objectives
- •
- Reduce the time taken to dispose of matters in courts and tribunals (Justice).
- •
- Improve access to justice services particularly legal aid, victim support services and alternative dispute resolution (Justice).
- •
- Improve Victorian's confidence in the legal and courts system (Justice).
- •
- Improve access to consumer protection services, particularly for vulnerable groups (Justice).
- •
- Improve access to human rights protection services in targeted areas, reduce discrimination and promote human rights (Justice).
- •
- Support the development of high performing, cooperative and fair workplaces and a highly skilled workforce (Innovation, Industry and Regional Development).
Government that listens and leads
Demonstrating progress
- •
- More Victorians will be consulted on issues which matter to them.
- •
- There will be regular reports on progress in improving the quality of life for all Victorians and their communities.
Supporting departmental objectives
- •
- Provision of high quality policy advice to the Premier and Government (Premier and Cabinet).
- •
- Continuously improve the capability, integrity and independence of the Victorian public sector (Premier and Cabinet).
STATEMENT 2
DEPARTMENTAL STATEMENTS
DEPARTMENT OF EDUCATION AND TRAINING
PART 1: OUTLOOK AND OUTPUTS
Overview
The Department of Education & Training (DE&T) provides education and training services through schools, TAFE and Adult Education Institutes and other registered training organisations and adult community education (ACE) providers. These education and training services are available to Victorians of all ages. DE&T is responsible also for the development and coordination of whole of government advice on youth policy and the delivery of some youth programs.
The more specific responsibilities of DE&T include the provision of:
- •
- high quality primary and secondary education for Victorian children in the compulsory school years, including support for non-government schools;
- •
- education in the post compulsory years of education, including vocational education and training;
- •
- appropriate advice and counselling services for young people who leave school before completing year 12 (or its equivalent) to maximise their chances of a satisfactory transition from school to employment and/or vocational training;
- •
- apprenticeship and traineeship places to meet the needs of young people for entry level vocational education and training;
- •
- vocational education and training programs to meet the skill needs of individuals and of industry; and
- •
- policies and programs across government that address the needs of young people in Victoria.
In addition to these responsibilities, DE&T provides support and advisory services to the Minister for Education and Training and the Minister for Education Services and Youth Affairs.
Departmental objectives
To assist in achieving a close alignment with the Government's priorities, the DE&T objectives have been revised in 2002-03 to coincide with the Government's goals and targets for education and training announced in October 2000, and reflect DE&T's whole of government responsibilities for youth. These objectives are as follows:
- •
- improve the standards of literacy and numeracy in primary schooling;
- •
- increase the percentage of young people who successfully complete Year 12 or its equivalent;
- •
- have more adults take up education and training and so increase the overall level of educational attainment and literacy levels in Victoria;
- •
- increase the level of participation and achievement in education and training in rural and regional Victoria and among groups where it is presently low;
- •
- make near universal participation in post school education and training the norm in our society; and
- •
- develop and lead whole of government initiatives to improve the outcomes of all young Victorians.
Review of 2001-02
The Government's goals and targets for education and training continued to provide a focus for departmental programs in 2001-02. Accordingly, average class sizes in years Prep-2 were reduced from 23.3 in 2000 to 22.4 in 2001, and 21.8 in 2002, and overall teacher-student ratios at the primary school level were lowered to 1:16.6 in 2001. Some 93 per cent of students in year 3 reached the national benchmark in reading and 92.1 per cent reached the year 5 national benchmark. Apprenticeship and traineeship places were boosted further and in 2001 the total number in training exceeded 100 000 for the first time in Victoria. Funding was provided for nine "Learning Towns" and adult and community education programs delivered through more than 500 Neighbourhood Houses and Adult Community Learning Centres.
In September 2001, the Minister for Education released a discussion paper on achieving the Goals and Targets for Victoria's Education and Training System. The paper was intended to encourage discussion about the further steps to be taken to achieve the goals and targets and its release was followed by consultations with representative groups and individuals. The consultations have fed into DE&T's strategy for delivering the goals and targets.
As part of the 2001-02 budget, the Government announced the establishment of the Victorian Schools Innovation Commission (VSIC) with the Hon. Dr Barry Jones as its chair. The VSIC has been established to provide advice on creative strategies that foster innovation in schools and will help schools keep pace with constant changes in technology and new ways of learning. The Government also established the Victorian Institute of Teaching in 2001-02. The Institute is responsible for:
- •
- professional standards in teaching;
- •
- granting registration to teachers;
- •
- advising on professional learning needs of teachers;
- •
- conducting research into teaching and learning practice;
- •
- approving teacher education courses; and
- •
- investigating serious cases of teacher misconduct or incompetence.
Further progress was made during 2001-02 in establishing Local Learning and Employment Networks (LLENs), which are aimed at broadening education and training opportunities for young people. A total of 31 LLENs, which are local partnerships of schools, TAFE Institutes, ACE providers and other training providers, local employers, industry associations, and welfare and government agencies, are now in place giving full coverage across the State.
Significant changes to the School Global Budget funding model were introduced in the 2001 school year. The new model supports better self-management by schools and the implementation of a new teaching salary and career structure, which includes the classifications of Beginning Teacher, Experienced Teacher, Experienced Teacher With Responsibility and Leading Teacher. The new structure provides improved opportunities for teachers at all stages of their professional careers and is aimed at attracting highly qualified and dedicated people to government schools.
In relation to non-government schools, work has progressed on the definition and evaluation of funding model options for the allocation of State funds to non-government schools within the context of the Government's goals and targets for education and training. In keeping with the Government's commitment to improved educational outcomes for all students, a new quality assurance framework for non-government schools is also being developed. This will be in common with Government school accountability requirements where practicable.
In the Training and Further Education area, strong growth continued in apprenticeships and traineeships. There were over 76 800 apprentice and trainee commencements in 2001, an increase of 21% over 2000. Flexible delivery options within the TAFE and ACE were expanded, with the number of users accessing the TAFE Virtual Campus trebling, and a significant increase in workplace/enterprise delivery by TAFE Institutes. There were a number of specific initiatives to address particular industry skill shortages in 2001, including the provision of an additional 937 training places for Division 2 Nurses, and a commitment of $7.4 million to develop the Australian College of Wine.
In 2001 $3 million was provided for ACE infrastructure with over two thirds of funds being invested in projects where community/corporate investment matched Government expenditure.
In the Higher Education area, Government has concentrated on improving governance arrangements and accountability. The Government has provided 46 scholarships to support postgraduate research in priority areas of Information and Communications Technologies (ICT). This initiative will increase the breadth and quality of ICT research in Victoria
The Office for Youth has managed the delivery of a number of programs and services for young people aged between 12 and 25 years, including:
- •
- the Victorian Youth Development Program;
- •
- the Government youth website;
- •
- Victoria's participation in National Youth Week 2002; and
- •
- the FReeZA youth entertainment program.
Beginning with an extensive process of public consultation, the Government has been working on the development of a comprehensive whole of government youth strategy, to be finalised by mid-2002.
DE&T's aggregate financial and output performance is expected to be largely on track with the published budget forecasts. Increases in expenses reflect additional government funding received for additional secondary school teachers to support the trialing of the Victorian Certificate of Applied Learning (VCAL) and the Restart program, a ramping up of participant numbers in employment programs, additional expenditure on vocational education and training programs associated with increased ANTA funding, new industrial agreements for public and changes to the Education Maintenance Allowance arrangements. Output delivery targets were met and exceeded in a number of instances—specific information is provided in the output tables that follow. DE&T received funding for an extended capital program for 2001-02, which is being implemented.
Machinery of Government changes, which came into effect on 5 March 2002, transferred the Employment function from the former Department of Education, Employment and Training to the Department of Innovation, Industry and Regional Development. As a result, the Tertiary Education, Training and Employment outputs have been renamed as the Training and Tertiary Education outputs. The Employment output has been transferred to the Department of Innovation, Industry and Regional Development. There have been no other changes to DE&T's output structure since last year.
As part of DE&T's ongoing review of output performance measurement and monitoring, a number of output performance measures have been deleted, as they are no longer appropriate. They have been replaced with more relevant and more robust measures, which are in each case linked to the departmental objectives monitoring framework.
Outlook for 2002-03
DE&T's 2002-03 budget builds upon the achievements and substantial investment in education and training in previous years, including progress towards the Government's goals and targets in education and training. It reflects the Government's commitment to systemic reform of the whole education and training system, and to tackling the underlying issues in a collective, comprehensive and coordinated way through multiple policy and program initiatives.
A fundamental element of the Government's goals and targets for education is to reduce average class sizes in the years Prep-2 to 21 by the year 2003, to provide the basis for continuing improvements in early years literacy and numeracy. Accordingly, funding will be provided to ensure that the teachers needed to achieve this target may be recruited.
Resources will also be provided for the Early Years Numeracy Program, to ensure that effective support is provided for those students requiring additional assistance in the classroom. The initiative builds upon the achievements of the Early Years Literacy Program, which has resulted in improved reading ability of students in the Prep-2 years. The two initiatives recognise that good numeracy and literacy skills developed in the early years contribute immeasurably to success in later years.
The Middle Years Reform and Innovation Program provides a major boost to existing middle years programs through provision of grants for local clusters of schools to reform their middle years school curriculum and structures. This initiative recognises the critical need to keep students actively participating in education in the years 5-9. Interventions to date have concentrated on literacy and other targeted programs in the secondary years. However, broader reforms in curriculum and school structures, and improved relationships with the community, are also needed to sustain the interest and involvement of students in these years of schooling.
Building upon the Middle Years Program, the Government's Access to Excellence initiative will provide additional resources for approximately 100 secondary schools that have higher than average absentee rates and lower than average rates of Year 12 or equivalent completion. The additional resources will allow smaller class sizes, provide more intense teaching or broadened curriculum choice to ensure students remain engaged with their schooling.
Following the trial of the Victorian Certificate of Applied Learning at 22 sites in 2002, the program will move towards a major rollout in around 200 schools in 2003. Up to 300 schools and 19 TAFE Institutes will begin delivering the program, and full implementation will be achieved across the State in 2004. Further design work will also be undertaken.
Government will provide funding for the appointment of 15 additional Koori Educators and 6 Koori Home School Liaison Officers, who will broaden existing support for Koori children and address the goal of increasing the level of participation and achievement in education of young Koori people.
Additional funds will be provided for school transport services to implement important recommendations of a review panel under the chairmanship of the Parliamentary Secretary for Education. The additional funds will be used to assist students attending government and non-government schools in rural and regional Victoria, and to assist students with disabilities to attend specialist schools.
The Government will provide funds to allow the FReeZA program to continue. The program provides funding, in conjunction with local government and community organisations, for young people in local communities to implement drug and alcohol-free live band gigs and dance parties across metropolitan Melbourne and rural and regional Victoria.
Funds will also be provided for Melbourne to host the Pacific School Games in 2005. The Government sees this as an important event, in the lead up to the 2006 Commonwealth Games in Melbourne.
Output information
The following section provides details of the outputs to be provided to Government, including performance measures and costs for each output. The outputs and financial information provided include consolidated information relating to the following entities within the education and training portfolio:
- •
- Department of Education and Training;
- •
- Victorian Curriculum and Assessment Authority;
- •
- Victorian Qualifications Authority;
- •
- Victorian Learning, Employment and Skills Commission;
- •
- Adult, Community and Further Education Board;
- •
- Centre for Adult Education;
- •
- Adult Multicultural Education Services;
- •
- Driver Education Centre of Australia Ltd; and
- •
- 14 TAFE Institutes and 5 Universities with TAFE Divisions.
The table below summarises the total cost of outputs. The output costs shown in the table have been calculated on an accrual basis in accord with generally accepted accounting principles. Accordingly, they include corporate overheads and accrued expenses, such as depreciation and long service leave. This is in contrast to the majority of national cost benchmark data, which are based on cash payments and therefore exclude corporate overheads.
Table 2.1.1: Output summary
| | 2001-02 Budget(a) | 2001-02 Revised | 2002-03 Budget | Variation(b) | ||||
|---|---|---|---|---|---|---|---|---|
| | ($ million) | (%) | ||||||
| School Education | 4 681.9 | 4 710.4 | 4 824.3 | 3.0 | ||||
| Training and Tertiary Education(c) | 1 018.5 | 1 041.1 | 992.2 | -2.6 | ||||
| Youth | 5.7 | 6.0 | 10.9 | 90.6 | ||||
| Policy, Strategy and Information Services | 21.2 | 33.6 | 33.6 | 58.5 | ||||
| Total | 5 727.3 | 5 791.1 | 5 861.0 | 2.3 | ||||
Source: Department of Treasury and Finance
- Notes:
- (a)
- 2001-02 Output Budget incorporates changes to Output structure and organisational restructuring and therefore may differ from figures published in the 2001-02 Budget.
- (b)
- Variation between 2001-02 and 2002-03 Budget.
- (c)
- Variation between 2001-02 and 2002-03 Budget reflects the transfer of Employment programs to the Department of Industry, Innovation and Regional Development (DIIRD).
School Education
Key Government Outcomes:
These outputs make a significant contribution to the achievement of the following objectives:
- •
- Improve the standards of literacy and numeracy in primary schooling;
- •
- Increase the percentage of young people who successfully complete Year 12 or its equivalent; and
- •
- Increase the level of participation and achievement in education and training in rural and regional Victoria and among groups where it is presently low.
These outputs involve:
- •
- Policy development, regulation and management of the Victorian government school system, including: a safe and effective learning environment through the provision of appropriately trained and qualified teachers in a properly resourced and maintained physical environment;
- •
- high-quality curriculum delivery to prescribed content and performance standards in the eight Key Learning Areas in Years P-10 and in accordance with the requirements of the Victorian Certificate of Education (Years 11 and 12) and Victorian Certificate of Applied Learning (VCAL);
- •
- provision of a range of programs specifically designed to improve the quality of student learning and school management; and
- •
- provision of specialist services designed to improve the quality of student learning or social needs.
Financial support to and regulation of non-government schooling is also included in this output group.
| Major Outputs/Deliverables Performance Measures | Unit of measure | 2000-01 Actuals(a) | 2001-02 Target(b) | 2001-02 Expected Outcome(c) | 2002-03 Target(d) | |||||
|---|---|---|---|---|---|---|---|---|---|---|
| Primary Education—Delivery of education services in Victorian government schools for students in Years P-6. | ||||||||||
| Quantity | ||||||||||
| Average P-2 class size | number | 23.3 | 22.5 | 22.4 | 21.7(e) | |||||
| Average years 3-6 class size | number | na | 25.2 | 25.2 | 25 | |||||
| Teacher—student ratio (primary) | ratio | 1:16.9 | 1:16.8 | 1:16.6 | 1:16.6 | |||||
| Year 1 cohort accessing one-to-one literacy intervention programs such as Reading Recovery | per cent | 22.3 | 20 | 20 | 20 | |||||
| Schools with a 1:5 or better computer to student ratio (primary) | per cent | 69 | 90 | 92 | 95 | |||||
| Teachers and principals with a notebook computer (primary) | per cent | 80 | 95 | 86 | 95 | |||||
| Students accessing education through distance education (primary) | number | na | 300 | 357 | 365 | |||||
| New arrival students receiving intensive or targeted support (primary) | number | 806 | 745 | 794 | 825 | |||||
| Eligible students in regular schools receiving ESL support (primary) | per cent | 91.3 | 90.1 | 90.1 | 91.7 | |||||
| Quality | ||||||||||
| Student attainment at text level 1 at end Prep in reading (metropolitan and non-metropolitan students)(f) | per cent | 94.3 | 95.0 | 95.6 | 96.0 | |||||
| Students in non-metropolitan regions achieving at text level 1 at end of Prep in reading(f) | per cent | 94.5 | nm | 95.7 | 96.0 | |||||
| Student attainment at text level 5 at end Year 1 reading (metropolitan and non-metropolitan students)(f) | per cent | 99.1 | 100 | 99.3 | 100 | |||||
| Primary schools identified as performing at or above expected levels as identified in the triennial review process | per cent | 95.5 | 93 | 95.2 | 93.0 | |||||
| Parent satisfaction with primary schooling on a 100-point scale(h) | per cent | 80 | 85 | 80 | 85 | |||||
| Teachers reporting routine use of learning technologies in curriculum planning and delivery (primary) | per cent | na | 65 | 80 | 85 | |||||
| Cost | ||||||||||
| Total output cost | $ million | 2 016.3 | 2 100.1 | 2 098.9 | 2 149.9 | |||||
Junior Secondary Education—Delivery of education services in Victorian government schools for students in Years 7-10. | ||||||||||
| Quantity | ||||||||||
| Secondary teacher—student ratio (all secondary) | ratio | 1:12.5 | 1:12.4 | 1:12.4 | 1:12.4 | |||||
| Years 7-10 English class sizes less than 26 students | per cent | 78.9 | 79 | 83.2 | 84 | |||||
| Average rate of student attendance in Years 7-10(h) | per cent | 90.9 | 92 | 91.3 | 93 | |||||
| Schools with a 1:5 or better computer to student ratio (all secondary) | per cent | 69 | 90 | 92 | 95 | |||||
| Teachers and principals with a notebook computer (all secondary) | per cent | 80 | 95 | 86 | 95 | |||||
| Students accessing education through distance education (all secondary) | number | 2 323 | 3 000 | 3 464 | 3 500 | |||||
| New arrival students receiving intensive or targeted support (all secondary) | number | 742 | 800 | 741 | 755 | |||||
| Eligible students in regular schools receiving ESL support (all secondary) | per cent | 91.3 | 94.3 | 94.3 | 95.2 | |||||
| Quality | ||||||||||
| Percentage of Restart participants assessed by teachers as "consolidating" or above at CSF level 4 in English: Reading at end of Year 7 | per cent | nm | nm | nm | 75 | |||||
| Year 7 students reaching national benchmarks in English: Reading(i) (sample) | per cent | nm | nm | nm | 82 | |||||
| Year 7 students reaching national benchmarks in English: Writing(i) (sample) | per cent | nm | nm | nm | 76 | |||||
| Year 7 students reaching national benchmarks in Mathematics(i) (sample) | per cent | nm | nm | nm | 82 | |||||
| Percentage of Year 10 students assessed as meeting state standards for that year level in English: Reading(j) | per cent | 79 | nm | 80 | 81 | |||||
| Percentage of Year 10 students assessed as meeting state standards for that year level in Mathematics: Chance & Data(j) | per cent | 73 | nm | 72 | 74 | |||||
| Years 10-12 apparent retention rate (August census) | per cent | 74.4 | 75 | 76.8 | 77.5 | |||||
| Years 10-12 apparent retention rate in non-metropolitan regions (August census) | per cent | 69.1 | 70 | 72.8 | 74 | |||||
| Parent satisfaction with secondary schooling on a 100-point scale (all secondary)(h) | per cent | 71 | 75 | 71 | 75 | |||||
| Schools identified as performing at or above expected levels as identified in the triennial review process (all secondary) | per cent | 91.2 | 90 | 93.7 | 90 | |||||
| Teachers reporting routine use of learning technologies in curriculum planning and delivery (all secondary) | per cent | na | 65 | 81 | 85 | |||||
| Cost | ||||||||||
| Total output cost | $ million | 1 299.0 | 1 295.7 | 1 273.7 | 1 313.2 | |||||
Senior Secondary Education—Delivery of education services in Victorian government schools for students in Years 11 and 12. | ||||||||||
| Quantity | ||||||||||
| Students participating in VET in the VCE programs(i) | number | 21 171 | 24 000 | 24 686 | 27 000 | |||||
| Average number of VCE studies provided per school | number | 26.4 | 26.7 | 26.4 | 26.7 | |||||
| Annual student contact hours in VET in VCE programs(i) | number (million) | 5.096 | 6.384 | 6.219 | 6.800 | |||||
| Students accessing technology-enabled curriculum choices | number | na | 1 300 | 2 948 | 3 000 | |||||
| Quality | ||||||||||
| Students continuing past year 10 in Victorian Certificate in Applied Learning sites | per cent | nm | nm | nm | 90 | |||||
| Students satisfactorily completing Victorian Certificate in Applied Learning | per cent | nm | nm | nm | 50 | |||||
| VET in VCE students progressing to further education, training or work(j)(k) | per cent | na | 95 | 86.3 | 90 | |||||
| Median VCE Study Score | number | 28.8 | 29 | 29 | 29 | |||||
| VET in VCE students completing a qualification(j) | number | 6 642 | 6 000 | 9 023 | 10 100 | |||||
| Enrolments in VET in the VCE units as a proportion of total VCE unit enrolments(j) | per cent | na | 4 | 4.6 | 5 | |||||
| Average rate of student attendance in Years 11 and 12(i) | per cent | 91.1 | 93 | 91.3 | 93 | |||||
| Years 7-12 apparent retention rate (August census) | per cent | 71.1 | 72 | 73.7 | 75 | |||||
| Years 7-12 apparent retention rate in non metropolitan regions (August census) | per cent | na | 63 | 66.4 | 68 | |||||
| Proportion of government school students in Years 10, 11 and 12 with a Managed Individual Pathway Plan | per cent | na | 25 | 45 | 60 | |||||
| Proportion of students leaving government schools after Year 9 but before completing Year 12 who were tracked by a school 6 months after exiting | per cent | nm | nm | nm | 50 | |||||
| Cost | ||||||||||
| Total output cost | $ million | 604.9 | 611.7 | 630.6 | 657.1 | |||||
Non-Government School Education—Provision of services for non-government students including: | ||||||||||
| • payment of State Recurrent and specific purpose grants to non-government schools, including student support services; | ||||||||||
| • targeted assistance to needy non-government schools and students, including Supplementary funding and needs-based capital assistance; | ||||||||||
| • monitoring of non-government school accountability requirements; | ||||||||||
| • registration of non-government schools and non-government teachers; | ||||||||||
| • registration reviews of non-government schools; and | ||||||||||
| • endorsement of non-government schools to accept full fee-paying overseas students. | ||||||||||
| Quantity | ||||||||||
| Non-government teachers registered annually | number | 2 310 | 2 000 | 2 600 | 2 700 | |||||
| Non government students receiving Supplementary funding as percentage of all non government school students | per cent | nm | nm | nm | 79 | |||||
| Non government schools receiving Needs Based Capital Assistance as percentage of total eligible applicants | per cent | nm | nm | nm | 65 | |||||
| Quality | ||||||||||
| Recommendations of non-government school registration reviews approved by Registered Schools Board | per cent | 99 | 99 | 99 | 99 | |||||
| Cost | ||||||||||
| Total output cost | $ million | 270.2 | 273.4 | 285.6 | 283.0 | |||||
Student Welfare and Support—Provision of education services relating to: | ||||||||||
| • student welfare, including drug education and mental health issues; and | ||||||||||
| • student support services in the area of student wellbeing including speech pathology, visiting teacher services for hearing, visually, health and physically impaired students, curriculum services and alternative programs. | ||||||||||
| Quantity | ||||||||||
| Percentage of Victorian government schools meeting minimum requirements of the Framework for Student Support Services in Victorian Government Schools | per cent | 80 | 95 | 95.3 | 98 | |||||
| Quality | ||||||||||
| Government Schools who have completed an Individual School Drug Education Strategy or an Action Plan as part of the review process | per cent | nm | nm | nm | 100 | |||||
| Percentage of students who participated in an alternative program who, on completion of the program, are engaged in education, training or employment | per cent | nm | nm | nm | 90 | |||||
| School satisfaction with student support services | per cent | 80 | 82 | 79 | 82 | |||||
| Percentage of parents participating in Drug Education activities who believe they will be better able to address drug-related issues with their children | per cent | nm | nm | nm | 85 | |||||
| Cost | ||||||||||
| Total output cost | $ million | 70.9 | 73.8 | 76.7 | 76.1 | |||||
Services to Students with Disabilities and Impairments—Provision of educational services to Victorian students with disabilities and impairments in government regular and specialist schools. | ||||||||||
| Quantity | ||||||||||
| Students funded under the disabilities and impairments program in government schools as a proportion of the total student population | per cent | na | 3 | 3.05 | 3 | |||||
| Regular schools with students with disabilities and impairments | per cent | 85.2 | 89 | 85.4 | 89 | |||||
| Quality | ||||||||||
| Parent satisfaction with special education on a 100-point scale(h) | per cent | 91 | 88 | 90 | 92 | |||||
| Cost | ||||||||||
| Total output cost | $ million | 248.7 | 246.1 | 255.9 | 258.1 | |||||
Education Maintenance Allowance—Provision of the Education Maintenance Allowance (EMA) to eligible parents of school students up to the age of 16 years in government and non-government schools. | ||||||||||
| Quantity | ||||||||||
| School students receiving the EMA | number | 205 843 | 215 000 | 206 549 | 207 000 | |||||
| Timeliness | ||||||||||
| EMA payments processed according to published timelines | per cent | 100 | 100 | 100 | 100 | |||||
| Cost | ||||||||||
| Total output cost | $ million | 33.2 | 35.0 | 40.4 | 33.8 | |||||
Student Transport—Administration of student conveyance allowances and the transport services for government and non-government school students, including the transport of students attending special schools. | ||||||||||
| Quantity | ||||||||||
| School students (government) supported by conveyance allowance | number | nm | nm | 10 000 | 11 500 | |||||
| School students (non-government) supported by conveyance allowance | number | nm | nm | 27 500 | 28 000 | |||||
| Eligible special school students provided with appropriate travel | number | 5 600 | 5 600 | 5 700 | 5 800 | |||||
| Timeliness | ||||||||||
| Payments made according to published schedule | per cent | 100 | 100 | 100 | 100 | |||||
| Cost | ||||||||||
| Total output cost | $ million | 49.6 | 46.1 | 48.6 | 53.1 | |||||
Source: Department of Education and Training
- Notes:
- (a)
- Actual refers to 2000 calendar year unless otherwise indicated.
- (b)
- Target refers to 2001 calendar year unless otherwise indicated.
- (c)
- Expected outcome refers to 2001 calendar year unless otherwise indicated.
- (d)
- Target refers to 2002 calendar year unless otherwise indicated.
- (e)
- Target is based on data from February 2002 School Census.
- (f)
- Students deemed as capable read unseen text with 90 per cent accuracy at text level 1.
- (g)
- Students deemed as capable read unseen text with 90 per cent accuracy at text level 5.
- (h)
- Data refers to the previous calendar year (i.e. 1999 for 2000-01, 2000 for 2001-02 and 2001 for 2002-03).
- (i)
- Government and non-government schools.
- (j)
- Students assessed by teachers as "consolidating" or "established" at CSF Level 6.
- (k)
- Does not include former students who are undertaking part time work but are not engaged in further study, or are unemployed.
Training and Tertiary Education
Key Government Outcomes:
- •
- Valuing and investing in lifelong education;
- •
- Growing and linking all of Victoria;
- •
- More jobs and thriving, innovative industries across Victoria;
- •
- Building cohesive communities and reducing inequalities; and
- •
- Promoting rights and respecting diversity.
These outputs make a significant contribution to the achievement of the following objectives:
- •
- Increase the percentage of young people who successfully complete Year 12 or its equivalent;
- •
- Have more adults take up education and training and so increase the overall level of educational attainment and literacy levels in Victoria;
- •
- Increase the level of participation and achievement in education and training in rural and regional Victoria and among groups where it is presently low; and
- •
- Make near-universal participation in post-school education and training the norm in our society.
These outputs involve:
- •
- the provision of training and tertiary education services to the Victorian community. These services are provided through a number of programs and service providers. The role of DE&T varies from direct service provision to accreditation and monitoring.
| Major Outputs/Deliverables Performance Measures | Unit of measure | 2000-01 Actuals(a) | 2001-02 Target(b) | 2001-02 Expected Outcome(c) | 2002-03 Target(d) | ||||||
|---|---|---|---|---|---|---|---|---|---|---|---|
| Training and further education places—The provision of training and further education places by TAFE institutes and other registered training organisations in accordance with priorities set by Government, industry and the community. Also includes provision of a range of services to providers and the community to ensure and enhance the quality of the education and training places purchased. | |||||||||||
| Quantity | |||||||||||
| Annual Government funded Module Enrolments | number (million | ) | 2.51 | 2.59 | 2.59 | 2.63 | |||||
| Government funded student contact hours of training and further education provided | number (million | ) | 72.22 | 67.62 | 67.62 | 68.65 | |||||
| Change in apprenticeship/ traineeship commencements by new employees | per cent | 7.2 | 6.0 | 16.3 | 10.1 | ||||||
| School-based apprentices/trainees in training | number | nm | nm | nm | 1 550 | (e) | |||||
| Audit of contract compliance by registered training organisations and other State Training System organisations | number | 483 | 350 | (f) | 350 | 350 | |||||
| Quality | |||||||||||
| TAFE graduates in employment six months following graduation | per cent | 76.4 | 75 | 73.5 | 75 | ||||||
| Participation rate of 15 to 19 year-olds in training and further education in Victoria(g): | |||||||||||
| • All Victoria | per cent | nm | nm | nm | 24.5 | ||||||
| • Non-metropolitan Victoria | per cent | nm | nm | nm | 28.2 | ||||||
| Persons aged 15-64 participating in TAFE programs as proportion of population | per cent | 14.1 | 14.2 | 14.2 | 14.3 | ||||||
| Successful training completions as measured by module load pass rate | per cent | 75.4 | 75 | 75 | 75 | ||||||
| Employer satisfaction with training | per cent | 83 | (h) | 83 | 78 | na | (i) | ||||
| TAFE students funded through Youth Pathways Program (YPP) with a Managed Individual Pathway Plan | per cent | nm | nm | nm | 100 | ||||||
| TAFE students funded through Youth Pathways Program (YPP) leaving TAFE who are tracked by a provider 6 months after exiting | per cent | nm | nm | nm | 100 | ||||||
| Percentage of TAFE graduates who rate quality of training as 8 or more out of 10 | per cent | nm | nm | nm | 65 | ||||||
| Timeliness | |||||||||||
| Performance agreements with TAFE institutes in place according to agreed timelines | per cent | 100 | 100 | 100 | 100 | ||||||
| Cost | |||||||||||
| Total output cost | $ million | 856.0 | 861.1 | 939.3 | (j) | 955.3 | |||||
Adult and community education places and community support—The provision of education and training places, and support for education for adults in almost 500 community settings and in Adult Education Institutions (Adult Multicultural Education Services and Centre for Adult Education), in accordance with priorities established by government and regional demand. Also includes provision of a range of support services to providers, networks and the community to ensure and enhance the quality of the education and training places purchased. | |||||||||||
| Quantity | |||||||||||
| Government funded annual Module Enrolments—ACE organisations and Adult Education institutions | number | 120 670 | 129 000 | 129 000 | 129 000 | ||||||
| Total annual Module Enrolments—ACE organisations and Adult Education institutions (includes self funded courses) | number | 366 870 | 356 000 | 356 000 | 356 000 | ||||||
| Government funded student contact hours of vocational education and training activity provided through ACE providers and Adult Education institutions | number (million | ) | na | 3.68 | 3.68 | 3.68 | |||||
| Quality | |||||||||||
| Student satisfaction with ACE courses meeting overall needs | per cent | 82 | 80 | 80 | 80 | ||||||
| Persons aged 15 and over participating in ACE as a proportion of the population | per cent | 4.1 | 4.8 | 4.8 | 4.8 | ||||||
| Successful completions as measured by module load completion rate—ACE organisations and Adult Education Institutions | per cent | 78 | 80 | 80 | 80 | ||||||
| ACE students funded through Youth Pathways Program (YPP) with a Managed Individual Pathway Plan | per cent | nm | nm | nm | 100 | ||||||
| ACE students funded through Youth Pathways Program (YPP) leaving ACE who are tracked by a provider 6 months after exiting | per cent | nm | nm | nm | 100 | ||||||
| Timeliness | |||||||||||
| Performance Agreements with Regional Councils signed before 31 December | number | 9 | 9 | 1 | 9 | ||||||
| Cost | |||||||||||
| Total output cost | $ million | 82.0 | 90.1 | 33.6 | (k) | 34.5 | |||||
Employment services—Provision of: | |||||||||||
| • specialist advice and assistance on employment opportunities and the labour market; | |||||||||||
| • employment programs such as the Community Business Employment Program, Youth Employment Programs and Community Jobs Program; and | |||||||||||
| • measures to attract skilled migrants to settle in Victoria including assessments of professional qualifications gained overseas and employment/vocational advice to migrants. | |||||||||||
| Quanity | |||||||||||
| Government Youth Employment Scheme—apprenticeships and traineeship commenced | number | 653 | 650 | 650 | na | ||||||
| Private Sector Skills Development Program—apprenticeship and traineeship commencements | number | 1 718 | 1 500 | 4 282 | na | ||||||
| Go for IT—apprenticeship and traineeship commencements | number | 130 | 370 | 370 | na | ||||||
| Youth Employment Incentive Scheme—number of long term or disadvantaged unemployed young people assisted | number | 3 290 | 2 500 | 6 710 | na | ||||||
| Youth Employment Information Service—number of website hits and telephone enquiries | number | na | 30 000 | 200 000 | na | ||||||
| Community Jobs Program—commencements | number | 2 516 | 2 300 | 2 084 | na | ||||||
| Community Business Employment Program—placements made | number | 10 239 | 10 000 | 10 000 | na | ||||||
| Overseas Qualifications Unit—client services provided (by phone, in person or in writing) | number | 4 310 | 4 200 | 4 200 | na | ||||||
| Skilled Migration Unit—services provided to migrants and employers | number | 6 339 | 4 000 | 7 800 | na | ||||||
| Quality | |||||||||||
| Government Youth Employment Scheme—participants who complete and are in employment, education or training 3 months after completion | per cent | na | (l) | 80 | (l) | 80 | na | ||||
| Private Sector Skills Development Program and Go for IT—participants who complete and are in employment, education or training 3 months after completion | per cent | na | (l) | 80 | (l) | 80 | na | ||||
| Community Jobs Program—participants who are in employment, education or training 3 months after leaving program | per cent | na | (l) | 60 | (l) | 60 | na | ||||
| Community Business Employment Program — participants retained for 13 weeks | per cent | 74 | 80 | 80 | na | ||||||
| Overseas Qualifications Unit—client satisfaction with services provided | per cent | 99 | 90 | 90 | na | ||||||
| Skilled Migration Unit—client satisfaction with services provided | per cent | na | 80 | 80 | na | ||||||
| Timeliness | |||||||||||
| Labour market information reports (monthly) produced and distributed within three working days | per cent | 90 | 90 | 90 | na | ||||||
| Cost | |||||||||||
| Total output cost | $ million | 43.8 | 64.5 | 62.7 | na | (m) | |||||
| Higher education — Effective provision of a range of services to universities, higher education private providers and the public, including: | |||||||||||
| • liaison with Commonwealth Government departments regarding appropriate levels of Commonwealth resources for universities; | |||||||||||
| • approval of private providers to deliver higher education courses; | |||||||||||
| • monitoring the performance of higher education private providers; | |||||||||||
| • endorsement of Victorian higher education courses for placement on the Commonwealth Register of Institutions and Courses for Overseas Students (CRICOS); and | |||||||||||
| • provision of information to the public and liaison between the public and universities. | |||||||||||
| Quanity | |||||||||||
| Universities participating in cooperative arrangements in regional areas | number | na | 8 | 8 | 8 | ||||||
| Government funded post graduate ICT research scholarship commencements(n) | number | na | 25 | 40 | 35 | ||||||
| Teacher scholarships taken up | number | 43 | 220 | 165 | 220 | ||||||
| Quality | |||||||||||
| Private providers complying with quality standards | per cent | 100 | 100 | 100 | 100 | ||||||
| Direct costs of accrediting for-profit providers recovered through fees | per cent | 100 | 100 | 100 | 100 | ||||||
| Timeliness | |||||||||||
| Private provider applications assessed within six months | per cent | 55.5 | 70 | 70 | 75 | ||||||
| Cost | |||||||||||
| Total output cost | $ million | 4.4 | 2.8 | 5.5 | (o) | 2.4 | |||||
Source: Department of Education and Training
- Notes:
- (a)
- Actual refers to 2000 calendar year, except for Employment Services performance measures which refer to the financial year, or where otherwise indicated.
- (b)
- Target refers to 2001 calendar year, except for Employment Services performance measures which refer to the financial year, or where otherwise indicated.
- (c)
- Expected outcome refers to 2001 calendar year, except for Employment Services performance measures which refer to the financial year, or where otherwise indicated.
- (d)
- Target refers to 2002 calendar year, except for Employment Services performance measures which refer to the financial year, or where otherwise indicated.
- (e)
- At 30 June 2003.
- (f)
- More intensive but fewer audits were programmed for 2001-02.
- (g)
- Excludes participation undertaken through ACE organisations and Adult Education institutions.
- (h)
- Survey not conducted in 2000 — 83 per cent was national satisfaction level in 1999.
- (i)
- Next national survey to be undertaken in 2004.
- (j)
- Includes ANTA funding received in 2000-01 and additional base funding as part of the new ANTA Agreement for 2001 to 2003.
- (k)
- No longer includes AMES and CAE commercial activity.
- (l)
- Program commenced 1 July 2000. Data not availble until December quarter 2001.
- (m)
- Employment Services transferred to DIIRD from 2002-03 onwards.
- (n)
- Refers to financial year.
- (o)
- Includes "one-off" payment of $1 million to the Australian Catholic University for sale of old campus site, and transfer to DIIRD of ChipSkills program and associated expenses (-$3.4 million).
Youth
Key Government Outcomes:
These outputs make a significant contribution to the achievement of the following objectives:
- •
- Develop and lead whole of government initiatives to ensure effective outcomes for all young Victorians.
These outputs involve:
- •
- services to young people and the provision of policy and strategic advice to the Minister for Youth Affairs. Both the programs and policy advice are designed to maximise opportunities for the development and well-being of all young Victorians.
| Major Outputs/Deliverables Performance Measures | Unit of measure | 2000-01 Actuals(a) | 2001-02 Target(b) | 2001-02 Expected Outcome(c) | 2002-03 Target(d) | ||||||
|---|---|---|---|---|---|---|---|---|---|---|---|
| Youth Policy Coordination—The development and coordination of youth policy advice to the Minister for Youth Affairs and the Government. | |||||||||||
| Quanity | |||||||||||
| Regional Youth Committees | number | 15 | 15 | 15 | |||||||
| Ministerial Youth Round Tables | number | 4 | 4 | 4 | |||||||
| Quality | |||||||||||
| Executive satisfaction that services received meet relevant quality standards | per cent | nm | nm | nm | 90 | ||||||
| Cost | |||||||||||
| Total output cost | $ million | 1.4 | 1.5 | 1.7 | 1.7 | ||||||
Services to Youth—The development, management and/or funding of a small number of targeted programs and services for young people aged between 12 to 25 years, including the Victorian Youth Development Program (VYDP), FReeZA and Youth Services Program (YSP). | |||||||||||
| Quanity | |||||||||||
| Youth Services Program grants allocated | per cent | nm | nm | nm | 100 | ||||||
| Schools participating in the VYDP | number | na | 178 | 176 | 176 | ||||||
| Students participating in the VYDP | number | 4 700 | 5 850 | 5 775 | 5 775 | ||||||
| Youth websites total page impressions | number | 18 859 | (e) | 500 000 | (e) | 326 027 | 330 000 | ||||
| FReeZA: | |||||||||||
| • Funded agencies rural and regional | number | 33 | 33 | 33 | 33 | ||||||
| • Funded agencies metropolitan | number | 27 | 27 | 27 | 27 | ||||||
| • Event attendance | number | 46 900 | 130 000 | 97 000 | 130 000 | ||||||
| Quality | |||||||||||
| Use of Youth Services Program grants monitored | per cent | nm | nm | nm | 100 | ||||||
| Timeliness | |||||||||||
| Youth Services Program grants allocated by target date | per cent | nm | nm | nm | 100 | ||||||
| Cost | |||||||||||
| Total output cost | $ million | 3.9 | 4.2 | 4.3 | 9.1 | (e) | |||||
Source: Department of Education and Training
- Notes:
- (a)
- Actual refers to 2000 calendar year unless otherwise indicated.
- (b)
- Target refers to 2001 calendar year unless otherwise indicated.
- (c)
- Expected outcome refers to 2001 calendar year unless otherwise indicated.
- (d)
- Target refers to 2002 calendar year unless otherwise indicated
- (e)
- Prior to 2001-02, hits were measured instead of page impressions. Hits record a larger sample of web traffic.
- (f)
- Youth Services Program transferred from DHS (+$4.0 million).
Policy, Strategy and Information Services
Key Government Outcomes:
- •
- Valuing and investing in lifelong education;
- •
- Growing and linking all of Victoria;
- •
- Sound financial management;
- •
- More jobs and thriving, innovative industries across Victoria;
- •
- Building cohesive communities and reducing inequalities; and
- •
- Promoting rights and respecting diversity.
These outputs make a significant contribution to the achievement of the following objectives:
- •
- Improve the standards of literacy and numeracy in primary schooling;
- •
- Increase the percentage of young people who successfully complete Year 12 or its equivalent;
- •
- Have more adults take up education and training and so increase the overall level of educational attainment and literacy levels in Victoria;
- •
- Increase the level of participation and achievement in education and training in rural and regional Victoria and among groups where it is presently low;
- •
- Make near-universal participation in post-school education and training the norm in our society; and
- •
- Develop and lead whole of government initiatives to ensure effective outcomes for all young Victorians.
These outputs involve:
- •
- the provision of policy and strategy advice to the Ministers, and Ministerial and support services for the various statutory authorities and advisory bodies in the portfolio. Included also are services relating to public information and international education.
| Major Outputs/Deliverables Performance Measures | Unit of measure | 2000-01 Actuals(a) | 2001-02 Target(b) | 2001-02 Expected Outcome(c) | 2002-03 Target(d) | ||||||
|---|---|---|---|---|---|---|---|---|---|---|---|
| Policy, strategy and executive services—Provision of strategic policy advice and administrative support, including services relating to parliamentary and legislative responsibilities, to Ministers and Boards in the areas of: | |||||||||||
| • Department wide resource management, planning and budgeting; | |||||||||||
| • school education; | |||||||||||
| • training and further education; | |||||||||||
| • adult and community education; | |||||||||||
| • higher education; and | |||||||||||
| • youth affairs. | |||||||||||
| Quanity | |||||||||||
| Correspondence prepared for Ministers' and Executive Group's signature or responded to on behalf of Ministers | number | 10 105 | 10 000 | 8 600 | 9 000 | ||||||
| Briefings prepared for Ministers' and Executive Group's signature | number | 4 675 | 5 000 | 4 900 | 5 000 | ||||||
| Number of partnership agreements between education, training and employment providers and agencies lodged with LLENs during the year | number | nm | nm | nm | 155 | ||||||
| Proportion of LLENs with a membership of every government secondary school, TAFE institute and ACE provider present within their boundary | per cent | nm | nm | nm | 100 | ||||||
| LLEN strategic plans forwarded to and approved by VLESC | per cent | nm | nm | nm | 100 | ||||||
| Quality | |||||||||||
| Executive satisfaction that services received meet relevant quality standards | per cent | nm | nm | nm | 90 | ||||||
| Timeliness | |||||||||||
| Correspondence prepared for Ministers' signatures or responded to on behalf of Ministers within predetermined timelines | per cent | 95 | 95 | 95 | 95 | ||||||
| Cost | |||||||||||
| Total output cost | $ million | 17.1 | 14.6 | 21.6 | (e) | 21.9 | (e) | ||||
International education—Services in this output include: | |||||||||||
| • Marketing, recruitment, assessment and placement services for full fee paying overseas students in Victorian government schools and provision of generic marketing support for TAFE providers and the higher education sector; | |||||||||||
| • Marketing of the Department's capabilities, programs and services to national and international markets; | |||||||||||
| • Organisation of overseas delegations and study tours to visit DE&T and Victorian education and training institutions; and | |||||||||||
| • Organisation and implementation of teacher and principal exchange programs and study tours, registration of student exchange organisations and student study tours. | |||||||||||
| Quanity | |||||||||||
| Overseas student study tour days into Victoria | number | na | 15 000 | 15 000 | 15 000 | ||||||
| Overseas students recruited to study in Victorian government schools in the year | number | na | 800 | 800 | 800 | ||||||
| Proportion of costs met by revenue raised from delivery of adult international study tours into Victoria | per cent | na | 150 | 150 | 150 | ||||||
| Proportion of costs met by revenue raised from delivery of international projects and programs | per cent | na | 80 | 80 | 80 | ||||||
| Quality | |||||||||||
| Satisfaction of agents with overseas student programs/services offered | per cent | na | 80 | 80 | 80 | ||||||
| Satisfaction of clients with services provided in relation to projects and programs | per cent | na | 80 | 80 | 80 | ||||||
| Cost | |||||||||||
| Total output cost | $ million | 2.2 | 2.0 | 5.7 | (e) | 5.5 | (e) | ||||
Public information and promotion—Provision of education information services to the community. Services include: | |||||||||||
| • advertising services, newspaper supplements, Education Times and dissemination of information regarding Departmental policies and initiatives; | |||||||||||
| • telephone information services through the Education Line and TAFE Course lines; and | |||||||||||
| • public promotions such as Education Week and Adult Learners Week. | |||||||||||
| Quanity | |||||||||||
| Responses to telephone and email information queries | number | 61 292 | 60 000 | 60 000 | 60 000 | ||||||
| Percentage of publications published online | per cent | na | 50 | 50 | 50 | ||||||
| Quality | |||||||||||
| Reader satisfaction with news publications | per cent | 96 | (f) | 95 | 95 | 95 | |||||
| Customer satisfaction with quality of telephone information service | per cent | 84.1 | 95 | 95 | 95 | ||||||
| Cost | |||||||||||
| Total output cost | $ million | 5.3 | 4.6 | 6.3 | 6.3 | ||||||
Source: Department of Education and Training
- Notes:
- (a)
- Actual refers to 2000 calendar year unless otherwise indicated.
- (b)
- Target refers to 2001 calendar year unless otherwise indicated.
- (c)
- Expected outcome refers to 2001 calendar year unless otherwise indicated.
- (d)
- Target refers to 2002 calendar year unless otherwise indicated.
- (e)
- Following improvements to output costing methodologies, these outputs now include the costs of activities previously allocated to other outputs.
- (f)
- Based on teacher and principal focus group research—96 per cent of those surveyed said they read Education Times and were generally satisfied with the publication.
Part 2 provides the financial statements that support the Department's provision of outputs. The information provided includes the Statement of Financial Performance, Statement of Financial Position and Statement of Cash Flows for the Department as well as authority for resources.
The total resources made available to a department are applied to three uses:
- •
- the provision of outputs;
- •
- asset investment; or
- •
- payments on behalf of the State.
The following three financial statements are presented in the format consistent with the AAS29 accounting standard. However, for the purposes of this paper they have been divided into controlled and administered items.
Administered items refer to those resources over which the Department cannot exercise direct control. Authority is provided through an appropriation for payments made on behalf of the State. Under the AAS29 standard, these items would normally appear as notes to the financial statements.
Financial Statements
The following four tables can be used to assess the Department's financial performance and use of resources.
- •
- Table 2.1.2—Statement of Financial Performance—provides details of the Department's controlled revenue and expenses on an accrual basis reflecting the cost of providing its outputs;
- •
- Table 2.1.3—Statement of Financial Position—shows all controlled assets and liabilities of the Department. The difference between these represents the net assets position, which is an indicator of the State's equity in the Department;
- •
- Table 2.1.4—Statement of Cash Flows—shows all movements of cash (cash received and paid). The cash impact of financing and investing activities on Departmental resources is highlighted in this statement; and
- •
- Table 2.1.5—Administered Items Statement—provides details of the Department's administered revenue and expenses (on an accrual basis), and its administered assets and liabilities.
Table 2.1.2: Statement of Financial Performance
| | 2000-01 Actual | 2001-02 Budget | 2001-02 Revised | 2002-03 Budget | Variation(a) | ||||||
|---|---|---|---|---|---|---|---|---|---|---|---|
| | ($ million) | (%) | |||||||||
| Revenue from ordinary activities | |||||||||||
| Output appropriations | 5 074.1 | 5 183.8 | 5 269.4 | 5 368.5 | 3.6 | ||||||
| Special appropriations | 0.2 | 0.3 | 0.3 | 0.3 | — | ||||||
| Resources received free of charge or for nominal consideration | 0.9 | — | 13.5 | 14.2 | — | ||||||
| Sale of goods and services | 584.2 | 646.3 | 474.9 | 485.5 | (24.9 | ) | |||||
| Commonwealth Grants | 238.3 | 274.3 | 248.9 | 258.1 | (5.9 | ) | |||||
| Other revenue and revenue from other parties | 113.6 | 3.0 | 256.7 | 257.0 | na | ||||||
| 6 011.2 | 6 107.6 | 6 263.7 | 6 383.6 | 4.5 | |||||||
| Expenses from ordinary activities | |||||||||||
| Employee entitlements | 3 600.6 | 3 544.7 | 3 615.9 | 3 729.9 | 5.2 | ||||||
| Depreciation and amortisation | 244.1 | 254.4 | 261.2 | 265.1 | 4.2 | ||||||
| Resources provided free of charge or for nominal consideration | — | — | — | — | — | ||||||
| Grants and other payments | 489.0 | 554.0 | 603.9 | 576.1 | 4.0 | ||||||
| Capital asset charge | 478.4 | 547.7 | 551.1 | 565.3 | 3.2 | ||||||
| Supplies and services | 1 050.5 | 1 078.8 | 1 071.9 | 1 041.3 | (3.5 | ) | |||||
| Other expenses from ordinary activities | 1.7 | — | — | — | — | ||||||
| Borrowing costs | 1.0 | 0.6 | 1.3 | 1.3 | 109.7 | ||||||
| 5 865.4 | 5 980.3 | 6 105.2 | 6 179.0 | 3.3 | |||||||
| Result from ordinary activities | 145.8 | 127.3 | 158.4 | 204.6 | 60.7 | ||||||
| Loss from extraordinary items | — | — | — | — | — | ||||||
| Net result for the reporting period | 145.8 | 127.3 | 158.4 | 204.6 | 60.7 | ||||||
| Net increase in asset revaluation reserve | 332.5 | — | — | — | — | ||||||
| Total revenues, expenses and revaluation adjustments recognised directly in equity | 332.5 | — | — | — | — | ||||||
| Total changes in equity other than those resulting from transactions with Victorian State Government in its capacity as owner | 478.3 | 127.3 | 158.4 | 204.6 | 60.7 | ||||||
Source: Department of Treasury and Finance
- Note:
- (a)
- Variation between 2001-02 Budget and 2002-03 Budget.
Statement of Financial Performance
The Department of Education and Training (DE&T) is estimated to have an operating surplus of $204.6 million for 2002-03, an increase of $77 million from the 2001-02 Budget.
The increase in the operating surplus reflects some increases in schools' local fund raising activities but mainly reflects the increasing level of this funding schools' are devoting to the purchase of non-current assets (computers, equipment and improvements to school facilities).
The Statement of Financial Performance shows an increase in total operating revenue of $276 million (or 4.5 per cent) between the 2001-02 and the 2002-03 Budgets. This increase in revenue primarily reflects additional output revenue from State Government of $185 million in relation to:
- •
- supplementation to meet the cost of various enterprise bargaining outcomes (including the TAFE sector and Victorian Public Sector employees);
- •
- the flow through effect of initiatives approved in previous budgets (which will have a further impact in 2002-03);
- •
- a change in the accounting treatment of annotated revenue resulting in an increase in DE&T's output appropriation previously allocated as Commonwealth Grants; and
- •
- funding for new initiatives announced in the 2002-03 Budget which includes the following:
- —
- Literacy intervention and improved participation which involves the recruitment of additional teachers in 2002 to implement a middle years literacy intervention program;
- —
- Access to Excellence program which involves the appointment of 300 additional teachers to facilitate teacher release and flexibility to deliver a variety of teaching and learning outcomes;
- —
- implementation of key recommendations of the Government's 2001 Review of School Bus Services;
- —
- introduction of the Middle years reform and innovation program for years 5 to 9 students;
- —
- Youth (FReeZA) drug and alcohol free entertainment;
- —
- introduction of the Victorian Certificate of Applied Learning;
- —
- Early years numeracy program for the appointment of school based coordinators and regional infrastructure support;
- —
- Reduction of average class sizes in Prep to Year 2; and
- —
- Koori educators and Koori school liaison officers.
This is partially offset by the transfer of Employment services from DE&T to the Department of Innovation, Industry and Regional Development.
Total operating expenses for the Department are budgeted to increase by $199 million (or 3.3 per cent) from the 2001-02 Budget to the 2002-03 Budget reflecting the increased cost to the Department of providing the additional education and training services discussed above.
Table 2.1.3: Statement of Financial Position
| | Estimated as at 30 June | |||||||||||
|---|---|---|---|---|---|---|---|---|---|---|---|---|
| | 2001 Actual | 2002 Budget | 2002 Revised | 2003 Budget | Variation(a) | |||||||
| | ($ million) | (%) | ||||||||||
| Current assets | ||||||||||||
| Cash assets | 392.3 | 393.2 | 381.5 | 372.4 | (5.3 | ) | ||||||
| Other financial assets | 149.3 | 149.3 | 125.3 | 125.3 | (16.1 | ) | ||||||
| Receivables | 94.4 | 94.4 | 94.4 | 94.5 | 0.1 | |||||||
| Inventories | 17.4 | 17.4 | 17.4 | 17.4 | — | |||||||
| Prepayments | 6.0 | 6.1 | 6.0 | 6.1 | — | |||||||
| Other | 1.3 | 1.3 | 1.3 | 1.3 | — | |||||||
| Total current assets | 660.7 | 661.8 | 626.0 | 617.1 | (6.8 | ) | ||||||
Non-current assets | ||||||||||||
| Receivables | 418.8 | 427.1 | 459.9 | 535.8 | 25.4 | |||||||
| Inventories | — | — | — | — | — | |||||||
| Other financial assets | 2.2 | 2.2 | 2.2 | 2.2 | — | |||||||
| Property, plant and equipment | 7 156.2 | 7 335.4 | 7 369.4 | 7 568.1 | 3.2 | |||||||
| Intangible assets | 0.0 | (0.1 | ) | 0.0 | 0.0 | (114.2 | ) | |||||
| Other | 11.9 | 11.9 | 11.9 | 11.9 | — | |||||||
| Total non-current assets | 7 589.1 | 7 776.5 | 7 843.4 | 8 118.0 | 4.4 | |||||||
| Total assets | 8 249.7 | 8 438.3 | 8 469.4 | 8 735.1 | 3.5 | |||||||
| Current liabilities | ||||||||||||
| Payables | 190.4 | 192.0 | 192.0 | 193.3 | 0.7 | |||||||
| Interest bearing liabilities | 3.3 | 3.3 | 3.3 | 3.3 | — | |||||||
| Provisions(b) | 150.8 | 159.3 | 159.3 | 168.0 | 5.4 | |||||||
| Other | 57.0 | 57.0 | 57.0 | 57.0 | — | |||||||
| Total current liabilities | 401.4 | 411.6 | 411.6 | 421.6 | 2.4 | |||||||
| Non-current liabilities | ||||||||||||
| Interest bearing liabilities | 3.7 | 3.7 | 3.7 | 3.7 | — | |||||||
| Provisions(b) | 731.1 | 782.2 | 782.2 | 833.3 | 6.5 | |||||||
| Other | — | — | — | — | — | |||||||
| Amounts owing to other departments | 2.8 | 2.8 | 2.8 | 2.8 | — | |||||||
| Total non-current liabilities | 737.7 | 788.7 | 788.7 | 839.9 | 6.5 | |||||||
| Total liabilities | 1 139.1 | 1 200.3 | 1 200.3 | 1 261.4 | 5.1 | |||||||
| Net assets | 7 110.6 | 7 237.9 | 7 269.1 | 7 473.7 | 3.3 | |||||||
| Equity | ||||||||||||
| Contributed capital | 5 433.5 | 5 433.5 | 5 433.5 | 5 433.6 | 0.0 | |||||||
| Reserves | 1 055.5 | 1 055.5 | 1 055.5 | 1 055.5 | — | |||||||
| Accumulated surplus | 621.7 | 749.0 | 780.1 | 984.7 | 31.5 | |||||||
| Total equity | 7 110.6 | 7 237.9 | 7 269.1 | 7 473.7 | 3.3 | |||||||
Source: Department of Treasury and Finance
- Notes:
- (a)
- Variation between 2001-02 Budget and 2002-03 Budget.
- (b)
- Includes employee costs and superannuation.
Statement of Financial Position
The Department's net assets position is expected to improve by $236 million (3.3 per cent) from 30 June 2002 to 30 June 2003. This reflects a projected increase in total assets of $297 million and an increase in total liabilities of $61 million.
The increase in total assets is mainly attributable to an increase in non-current assets of $342 million reflecting:
- •
- The State Government's ongoing asset investment program in education and training including new initiatives in the 2002-03 Budget targeted at modernisation of school facilities, building new schools, reinstating school facilities, modernisation of TAFE institutes and construction of new facilities in TAFE institutes;
- •
- The purchase of non-current assets, mostly computers, equipment and improvements to school facilities by schools using locally raised funds; and
- •
- Commonwealth funded asset initiatives in schools and TAFE institutes.
The expected increase in total liabilities is the result of an increase in Long Service Leave entitlements reflecting recruitment of additional teachers, the impact of recently funded wage agreements as well as the underlying growth in years of service. Under the funding arrangement between DE&T and Government this growth is also reflected in non-current receivables.
Table 2.1.4: Statement of Cash Flows
| | 2000-01 Actual | 2001-02 Budget | 2001-02 Revised | 2002-03 Budget | Variation(a) | ||||||
|---|---|---|---|---|---|---|---|---|---|---|---|
| | ($ million) | (%) | |||||||||
| Cash flows from operating activities | |||||||||||
| Receipts from Government | 5 226.9 | 5 450.0 | 5 477.4 | 5 551.0 | 1.9 | ||||||
| Receipts from other entities | 558.3 | 647.2 | 475.9 | 488.8 | (24.5 | ) | |||||
| Payments for supplies, grants and employees | (4 964.9 | ) | (5 116.4 | ) | (5 230.4 | ) | (5 286.4 | ) | 3.3 | ||
| 820.2 | 980.8 | 722.8 | 753.4 | (23.2 | ) | ||||||
| Interest received | 33.8 | 0.3 | 19.4 | 19.7 | 7 623.5 | ||||||
| Other revenue | 43.7 | 1.7 | 248.4 | 246.7 | 14 417.4 | ||||||
| Capital asset charge | (478.4 | ) | (547.7 | ) | (551.1 | ) | (565.3 | ) | 3.2 | ||
| Borrowing costs expense | (1.0 | ) | (0.6 | ) | (1.3 | ) | (1.3 | ) | 109.7 | ||
| Net cash inflow from operating activities | 418.3 | 434.4 | 438.2 | 453.2 | 4.3 | ||||||
| Cash flows from investing activities | |||||||||||
| Payments for property, plant and equipment(b) | (407.5 | ) | (452.3 | ) | (493.3 | ) | (475.0 | ) | 5.0 | ||
| Proceeds from sale of property, plant and equipment | 16.8 | 18.9 | 1.4 | 1.5 | (92.2 | ) | |||||
| Payments for investments | — | — | — | — | — | ||||||
| Proceeds from sale of business assets | — | — | — | — | — | ||||||
| (Repayment of) loans by other entities | (6.1 | ) | — | 24.0 | — | — | |||||
| Net cash (outflow) from investing activities | (396.7 | ) | (433.5 | ) | (467.8 | ) | (473.5 | ) | 9.2 | ||
Cash flows from financing activities | |||||||||||
| Net Proceeds from capital contribution by State Government | 0.1 | — | 18.9 | 11.2 | — | ||||||
| Net proceeds of borrowings | (3.4 | ) | — | — | — | — | |||||
| Repayment of finance leases | — | — | — | — | — | ||||||
| Net cash inflow (outflow) from financing activities | (3.3 | ) | — | 18.9 | 11.2 | — | |||||
| Net increase (decrease) in cash held | 18.3 | 0.9 | (10.7 | ) | (9.1 | ) | (1 102.1 | ) | |||
| Cash at the beginning of the financial year | 374.0 | 392.3 | 392.3 | 381.5 | (2.7 | ) | |||||
| Cash at the end of the financial year | 392.3 | 393.2 | 381.5 | 372.4 | (5.3 | ) | |||||
Source: Department of Treasury and Finance
- Notes:
- (a)
- Variation between 2001-02 Budget and 2002-03 Budget.
- (b)
- Includes payments for land held for resale and research and development costs.
Statement of Cash Flows
The variations in the expected cash flows between the 2001-02 Budget and the 2002-03 Budget are reflected in the Controlled Statement of Cash Flows. Major changes are due to additional revenue from State Government for new asset and output initiatives, an increase in schools' locally raised funds used to purchase assets and changes in accounting classifications explained in more detail in the discussion of the Statement of Financial Performance and the Statement of Financial Position.
Administered Items Statement
Transactions administered by DE&T on behalf of the State are grants received from the Commonwealth for on-passing to non-government schools and annotated revenue.
Total administered revenue has increased by $96 million from the 2001-02 Budget to the 2002-03 Budget due to the forecast indexation of grants for government and non-government schools by the Commonwealth and a change in the accounting treatment of annotated revenue.
The above discussion also explains the equivalent increase in DE&T's administered expenses.
Table 2.1.5: Statement of Administered Items
| | 2000-01 Actual | 2001-02 Budget | 2001-02 Revised | 2002-03 Budget | Variation(a) | ||||||
|---|---|---|---|---|---|---|---|---|---|---|---|
| | ($ million) | (%) | |||||||||
| Administered revenue | |||||||||||
| Appropriations—Payments made on behalf of the State | — | — | — | — | — | ||||||
| Special appropriations | — | — | — | — | — | ||||||
| Resources received free of charge or for nominal consideration | — | 0.0 | 0.0 | 0.0 | — | ||||||
| Sale of goods and services | 1.8 | — | 1.7 | 1.7 | — | ||||||
| Commonwealth grants | 1 299.9 | 1 309.7 | 1 354.3 | 1 392.8 | 6.3 | ||||||
| Other grants | — | — | — | — | — | ||||||
| Taxes | — | — | — | — | — | ||||||
| Fines | — | — | — | — | — | ||||||
| Fees | — | 0.1 | — | — | (100.0 | ) | |||||
| Other | 15.1 | 0.6 | 0.6 | 0.6 | — | ||||||
| Total administered revenue | 1 316.9 | 1 310.3 | 1 356.6 | 1 395.1 | 6.5 | ||||||
Administered expenses | |||||||||||
| Expenses on behalf of the State | — | — | — | — | — | ||||||
| Grants and other payments | 920.8 | 933.3 | 933.3 | 961.0 | 3.0 | ||||||
| Payments into the Consolidated Fund | 395.7 | 377.0 | 442.1 | 445.3 | 18.1 | ||||||
| Total administered expenses | 1 316.5 | 1 310.3 | 1 375.4 | 1 406.3 | 7.3 | ||||||
| Revenue less expenses | 0.3 | (0.0 | ) | (18.9 | ) | (11.3 | ) | na | |||
| Administered assets | |||||||||||
| Cash assets | 1.1 | 1.1 | 1.1 | 1.2 | 4.4 | ||||||
| Receivables | 2.9 | 2.8 | 2.8 | 2.8 | (2.2 | ) | |||||
| Other financial assets | 0.1 | 0.1 | 0.1 | 0.1 | — | ||||||
| Inventories | — | — | — | — | — | ||||||
| Prepayments | 2.7 | 2.7 | 2.7 | 2.7 | — | ||||||
| Property, plant and equipment | — | — | — | — | — | ||||||
| Intangible assets | — | — | — | — | — | ||||||
| Other | — | — | — | — | — | ||||||
| Total administered assets | 6.8 | 6.8 | 6.8 | 6.8 | (0.2 | ) | |||||
| Administered liabilities | |||||||||||
| Payables | 2.6 | 2.6 | 2.6 | 2.6 | — | ||||||
| Interest bearing liabilities | — | — | — | — | — | ||||||
| Provisions | — | — | — | — | — | ||||||
| Amounts owing to other departments | — | — | — | — | — | ||||||
| Other | 2.7 | 2.7 | 2.7 | 2.7 | — | ||||||
| Total administered liabilities | 5.3 | 5.3 | 5.3 | 5.3 | — | ||||||
Source: Department of Treasury and Finance
Authority for Resources
This section provides a summary of the sources of Parliamentary Authority available to the Department to fund the provision of outputs, payments on behalf of State, and additions to the net asset base.
Table 2.1.6: Parliamentary Authority for Resources
| | 2001-02 Budget | 2001-02 Revised | 2002-03 Budget | Variation(a) | |||||
|---|---|---|---|---|---|---|---|---|---|
| | ($ million) | (%) | |||||||
| Annual appropriations(b) | 5 183.8 | 5 217.0 | 5 322.2 | 2.7 | |||||
| Receipts credited to appropriations | 65.2 | 65.2 | 57.6 | (11.7 | ) | ||||
| Unapplied previous years appropriation | — | 6.1 | — | — | |||||
| Accumulated surplus—previously applied appropriation | — | — | — | — | |||||
| Gross annual appropriation | 5 249.0 | 5 288.2 | 5 379.8 | 2.5 | |||||
| Special appropriations | 0.3 | 0.3 | 0.3 | — | |||||
| Trust funds | 1 209.9 | 1 255.1 | 1 291.5 | 6.7 | |||||
| Total Parliamentary authority | 6 459.2 | 6 543.6 | 6 671.5 | 3.3 | |||||
Source: Department of Treasury and Finance
- Notes:
- (a)
- Variation between 2001-02 Budget and 2002-03 Budget.
- (b)
- 2001-02 Revised includes the impact of approved Treasurer's Advances.
PART 1: OUTLOOK AND OUTPUTS
Overview
The Department of Human Services (DHS) covers the responsibilities of the Ministers for Health, Community Services and Housing, and Senior Victorians. The Department purchases or directly delivers a diverse range of services within these broad portfolios.
Most services are provided by agencies under service agreements with the Department. These include Government-related agencies such as metropolitan and rural health services, public nursing homes, local government, community health centres, ambulance services and a range of non-government organisations providing mainly welfare services. The Department also provides some services directly. These include public rental housing, disability services, child protection and juvenile justice services.
For the purposes of the Budget, the financial information for DHS includes appropriations for the Office of Housing as well as consolidated financial information for the following portfolio entities:
- •
- metropolitan and rural health services;
- •
- ambulance services;
- •
- Victorian Health Promotion Foundation; and
- •
- public nursing homes.
The Office of Housing is classified as a non-budget sector entity and only the net amount transferred to it from the budget sector is reported in these financial statements.
Principal responsibilities
The principal responsibilities of DHS include:
- •
- provision of high quality and efficient health care services through the public hospital system, community health centres and ambulance services;
- •
- residential and rehabilitation care for older and disabled persons as well as support and assistance to enable them to continue to live at home as long as possible;
- •
- provision of a range of accommodation and support services aimed at enhancing the quality of life of people with disabilities;
- •
- accommodation and assistance support for homeless people;
- •
- provision of a wide range of health and community services for Victorian families, such as preschool, early intervention and family support services;
- •
- promoting and protecting the health of Victorians through emergency management, public health, preventive services, education and regulation;
- •
- provision of a range of alcohol and drug prevention and treatment services;
- •
- meeting the State's statutory responsibilities for vulnerable children and young people in relation to child protection and juvenile justice;
- •
- provision of secure, affordable and appropriate housing to low income Victorians; and
- •
- provision of Government concessions to low income groups to improve the affordability of key essential services.
Review of 2001-02
The Department's financial and output performance is broadly in line with the 2001-02 Budget forecasts. During the year additional funds were provided to meet approved wages and conditions negotiated under Enterprise Bargaining Agreements and a range of new initiatives, as detailed in Appendix A of Budget Paper No 2.
Major achievements during 2001-02 have included:
- •
- Implementation of a Hospital Demand Management Strategy which addresses growth in emergency admissions, elective surgery waiting lists and access blockages in the major metropolitan public hospitals. 2001-02 was the first year of a three-year funding commitment for innovation, substitution and prevention programs which divert demand away from hospitals, and invest in productivity improvement.
- •
- Disability Services expansion with the establishment of additional supported and transitional accommodation places, assistance to young people making the transition from school and expanded home and community based support, to help people with a disability to maximise their independence and participate actively in their communities.
- •
- Improvement in the quality of care for young people in residential care and expansion of kinship and permanent care and after hours child protection services in rural regions.
- •
- Commencement of new asset investment expenditure totalling over $500 million. This program will enable the rebuilding of the Austin Repatriation Hospital, relocation of the Mercy Hospital for Women and major redevelopment of four metropolitan hospitals as well as construction of a new purpose built community health facility. It also addresses expansion of rural ambulance services, significant upgrade to a number of aged care facilities through the continuation of the Residential Aged Care Strategy, major redevelopment of a further three rural health facilities, the refurbishment and replacement of placement and support residential facilities, and the building of basic information and communication infrastructure to link health services across Victoria.
2002-03 Outlook
The 2002-03 Budget initiatives continue to build on the substantial increases to the State's spending on health and the social support system undertaken since the Government came to office. Consistent with the Growing Victoria Together objective of building high quality, accessible health and community services, further funding has been provided to enable human services programs to meet and better manage the increasing demand from population growth, ageing and other factors.
In aggregate, the DHS output budget for 2002-03 is $8 538 million, an increase of $604 million (7.6 per cent) over the 2001-02 Budget ($7 934 million).
The most significant increase to output funding is in Acute Health Services, which will increase by $337 million (8.2 per cent). Other significant increases include Mental Health that will increase by $61.2 million (11.6 per cent), Disability Services by $55.9 million (7.9 per cent), Community Care by $43.5 million (8.2 per cent), Aged and Home Care by $42.9 million (6.7 per cent) and Ambulance Services by $23.6 million (10.5 per cent).
Asset investment funding for new human services projects in 2002-03 is $79.8 million, for projects with a total investment of $217.1 million. This includes funding to continue the redevelopment and upgrade of rural health and residential aged care facilities, redevelop juvenile justice custodial facilities and undertake a number of important hospital redevelopments, including improvements at the Royal Melbourne, Dandenong and Angliss hospitals. Funding has also been directed to hospital redevelopments at Lorne and Stawell as well as to metropolitan and rural ambulance services facilities development and co-location of rural ambulance stations with health services.
In addition, from its total available funds, the Office of Housing (a non budget sector entity), will spend $210 million on the acquisition and construction of public and community housing, including joint ventures, redevelopments and leasings, with a further $170 million allocated for physical improvements. This investment will expand the supply of public and community housing and improve its quality.
Office of Housing expenditure is funded from several sources. Budget sector funding in 2002-03 comprises an appropriation of $323 million through the Commonwealth-State Housing Agreement (including GST compensation), $47 million to further expand social and community housing, $5 million to transform and renew public housing in the Latrobe Valley with additional funding for training and community jobs programs and $66 million for the Supported Accommodation Assistance Program. An additional $401 million is generated from Office of Housing rental operations, asset sales, and other internal sources.
Details of 2002-03 DHS output and asset initiatives are included in Budget Paper No.2.
Strategic directions
The 2002-03 Budget provides an additional $1.2 billion over four years ($319.1 million in 2002-03) to implement new service initiatives across the portfolio, and to respond to increased demand for services associated with annual population growth and demographic change. This is in addition to new funding provided to the portfolio for cost increases, including agreed wage outcomes. The new service initiatives will contribute to meeting the key objectives for the Department in 2002-03, which are outlined below.
Waiting times for health, community care, disability and housing programs are at or below national benchmark levels:
- •
- Continue the Hospital Demand Management Strategy to improve the quality, accessibility and efficiency of hospital services. This includes creating extra capacity to treat more emergency and elective patients, improve patient management processes and prevent the avoidable use of hospitals by providing more community and home based services
- •
- Addressing pressure on ambulance response times by allocating additional resources to areas with high demand and introducing a telephone triage service to refer non-urgent cases to more appropriate facilities.
Quality of human services programs improves each year:
- •
- Improving services for public housing tenants including the upgrade of housing estates in metropolitan and regional areas.
- •
- Redeveloping ageing and outdated facilities including Kew Residential Services, Juvenile Justice facilities and rural health and residential aged care facilities.
- •
- Undertaking a number of hospital redevelopments to expand services and to provide facilities consistent with community expectations.
Sustainable, well managed and efficient Government and non-government service sectors:
- •
- Preparing a Metropolitan Health Services Strategy and Rural Human Services Strategy to ensure the delivery of sustainable and high quality services into the future.
- •
- Strengthening partnerships with funded agencies to reflect a collaborative approach to the provision and development of services.
- •
- Improving service viability and service delivery models, in particular through the use of technology to increase information sharing capabilities.
Reduced social dislocation and need for secondary and tertiary service intervention through strengthening communities, family support, early intervention and health promotion activities:
- •
- Preventing avoidable admissions to hospitals through the better coordination of hospital, allied health, community nursing, general practice, health promotion, early intervention and screening services.
- •
- Improving the health, development, learning and wellbeing of children by improving access to effective child and family support, health and early education services.
- •
- Developing a strategy for Senior Victorians that promotes and values their contribution in the community.
- •
- Strengthening disadvantaged communities through community building and neighbourhood renewal initiatives, including the renewal of public housing in the Latrobe Valley.
Increase the proportion of people needing the Department's funded services who remain in supportive families and communities:
- •
- Enhancing social inclusion for people with disabilities, focusing on expanding opportunities for people to remain living in the local community or a family environment.
- •
- Reducing the demand for statutory child protection and placement services by improving the availability and capacity of prevention, diversion and support services.
- •
- Expanding support for services that assist senior Victorians to maintain active lives such as home help, delivered meals and respite for carers.
Reduced inequalities in health status and well-being, and improved access to services:
- •
- Expanding mental health services by providing more inpatient beds, extra community based services, enhanced support for clinical staff in rural mental health services and new diversion, prevention and early intervention services.
- •
- Enhancing preschool services by improving administration and infrastructure and increasing participation of children from vulnerable and marginalised groups.
- •
- Investing in social housing including the acquisition and construction of new properties.
- •
- Expanding services for people who are homeless.
- •
- Expanding access to public dental services.
- •
- Containing the harm caused by drugs through better Government-wide coordination and delivery of services.
Output Information
The following section provides details of the outputs to be provided to Government, including their performance measures and the costs of each output. The Department is committed to continuously refining and improving its performance measure information. For this purpose, a number of measures have been discontinued and new performance measures have been introduced in 2002-03. In particular, Mental Health was reviewed during 2001-02 and a suite of new performance measures, which better reflect the services provided, has been introduced.
The table below summarises the total output costs.
Table 2.2.1: Output summary
| | 2001-02 Budget(a) | 2001-02 Revised | 2002-03 Budget | Variation(b) | |||||
|---|---|---|---|---|---|---|---|---|---|
| | ($ million) | (%) | |||||||
| Acute Health Services | 4 130.2 | 4 249.6 | 4 467.3 | 8.2 | |||||
| Ambulance Services | 225.3 | 249.8 | 248.9 | 10.5 | |||||
| Aged and Home Care | 636.5 | 645.0 | 679.4 | 6.7 | |||||
| Primary Health | 133.7 | 153.0 | 148.3 | 11.0 | |||||
| Dental Health | 83.1 | 82.0 | 84.0 | 1.1 | |||||
| Mental Health | 527.3 | 563.4 | 588.5 | 11.6 | |||||
| Public Health and Drugs | 237.3 | 241.1 | 253.4 | 6.8 | |||||
| Disability Services | 710.7 | 731.1 | 766.6 | 7.9 | |||||
| Community Care | 532.7 | 555.4 | 576.2 | 8.2 | |||||
| Concessions to Pensioners and Beneficiaries(c) | 286.3 | 267.4 | 284.7 | (0.6 | ) | ||||
| Housing Assistance | 430.9 | 435.4 | 440.7 | 2.3 | |||||
| Total | 7 934.0 | 8 173.1 | 8 538.0 | 7.6 | |||||
Source: Department of Treasury and Finance
- Notes:
- (a)
- 2001-02 Output Budget incorporates changes to Output structure and organisational restructuring and therefore may differ from figures published in the 2001-02 Budget.
- (b)
- Variation between 2001-02 and 2002-03 Budget.
- (c)
- The 2001-02 revised budget reflects a reduction due to the 2001-02 published Budget provision being higher than required.
Acute Health Services
Acute Health Services include a range of acute hospital inpatient, ambulatory, emergency, community based services and specialist services.
The Acute Health Services outputs below make a significant contribution to the achievement of the following objectives:
- •
- Waiting times for health, community care, disability and housing programs are at or below national benchmark levels;
- •
- Quality of Human Services improves each year;
- •
- Sustainable, well managed and efficient Government and non-government service sectors; and
- •
- Reduce inequalities in health status and well-being, and in access to services.
| Major Outputs/Deliverables Performance Measures | Unit of measure | 2000-01 Actuals | 2001-02 Target | 2001-02 Expected Outcome | 2002-03 Target | |||||
|---|---|---|---|---|---|---|---|---|---|---|
| Admitted Services—Same and multiday inpatient services (elective and non-elective) provided at metropolitan and rural hospitals. | ||||||||||
| Quantity | ||||||||||
| Separations | number ('000) | 1 006.0 | 1 020.8 | 1 036.0 | 1 066.0 | |||||
| Weighted Inlier Equivalent Separations (WIES) (multi- and same-day services)(WIES 8) | number ('000) | 788.8 | 803.7 | 803.7 | 820.9 | |||||
| Hospital in the home bed days | number | 110 100 | 101 000 | 132 000 | 135 000 | |||||
| Quality | ||||||||||
| Beds accredited | per cent | 98.2 | 100 | 100 | 100 | |||||
| Timeliness | ||||||||||
| Urgent (Category 1) patients admitted within 30 days | per cent | 100 | 100 | 100 | 100 | |||||
| Semi-urgent (Category 2) patients admitted within 90 days | per cent | 78 | 80 | 78 | 80 | |||||
| Emergency patients admitted within the recommended period (<12 hours) | per cent | 83 | 95 | 86 | 95 | |||||
| % time on Ambulance bypass | per cent | 6.7 | 6.7 | 3.0 | 3.0 | |||||
| Cost | ||||||||||
| Total output cost | $ million | 2 849.6 | 2 900.3(a) | 2 995.1 | 3 152.8 | |||||
Non-Admitted Services—Same day non-admitted services provided at metropolitan and rural hospitals. | ||||||||||
| Quantity | ||||||||||
| Victorian Ambulatory Classification System (VACS) Group A outpatient encounters | number ('000) | 2 030 | 1 986 | 2 155 | 2 186 | |||||
| Quality | ||||||||||
| Maternity service enhancement—women receiving postnatal domiciliary visits | per cent | 81 | 80 | 83 | 83 | |||||
| Cost | ||||||||||
| Total output cost | $ million | 457.0 | 450.2 | 465.0 | 475.0 | |||||
Emergency Services—Emergency admissions to major metropolitan hospitals with emergency departments. | ||||||||||
| Quantity | ||||||||||
| Emergency department presentations | number | nm | 855 000 | 855 000 | 889 000 | |||||
| Emergency admission | number | nm | 214 000 | 214 000 | 228 000 | |||||
| Quality | ||||||||||
| 24 hour emergency departments | number | 33 | 34 | 34 | 34 | |||||
| Timeliness | ||||||||||
| Emergency Category 1 treated immediately | per cent | 100 | 100 | 100 | 100 | |||||
| Emergency Category 2 treated in 10 minutes | per cent | 79 | 75 | 75 | 75 | |||||
| Emergency Category 3 treated in 30 minutes | per cent | 70 | 70 | 70 | 70 | |||||
| Cost | ||||||||||
| Total output cost | $ million | 167.0 | 164.5 | 170.0 | 182.0 | |||||
Sub-Acute Care Services—Services provided across Victoria for people discharged from acute hospitals on the basis of need. | ||||||||||
| Quantity | ||||||||||
| Sub-Acute bed days | number | 604 203 | 681 600 | 681 600 | 704 180 | |||||
| Palliative Care bed days | number | 69 011 | 70 000 | 70 000 | 74 500 | |||||
| Community Rehabilitation Clinics places | number | 127 298 | 96 265 | 96 265 | (b) | 99 000 | ||||
| Completed post acute episodes | number | 22 680 | 28 000 | 28 000 | 29 500 | |||||
| Quality | ||||||||||
| Sub-Acute Beds accredited | per cent | nm | 100 | 100 | 100 | |||||
| Community Rehabilitation Clinics designated | per cent | 100 | 100 | 100 | 100 | |||||
| Post acute clients not readmitted to acute hospital | per cent | nm | 80 | 80 | 80 | |||||
| Timeliness | ||||||||||
| Patients contacted within 3 days of referral | per cent | nm | 70 | 70 | 70 | |||||
| Cost | ||||||||||
| Total output cost(c) | $ million | 373.5 | 394.3 | 395.5 | 424.5 | |||||
Acute Training and Development—Provision of grants to hospitals for training and accreditation of nurses and hospital registrars. | ||||||||||
| Quantity | ||||||||||
| First year graduate nurses places utilised | number | 1 088 | 1 200 | 1 124 | (d) | 1 200 | ||||
| Post Graduate places at Diploma and Certificate level | number | nm | nm | nm | 954 | |||||
| Cost | ||||||||||
| Total output cost | $ million | 154.0 | 157.5 | 160.0 | 163.0 | |||||
Blood Services—To provide adequate and safe supplies of blood and blood products for therapeutic use in Victoria. | ||||||||||
| Quantity | ||||||||||
| Blood Collections | number | 239 841 | 248 000 | 248 000 | 250 000 | |||||
| Quality | ||||||||||
| Compliance of blood production and supply activities with Therapeutic Goods Administration requirements | per cent | 100 | 100 | 100 | 100 | |||||
| Cost | ||||||||||
| Total output cost | $ million | 57.0 | 63.5 | 64.0 | 70.0 | |||||
Source: Department of Human Services
- Notes:
- (a)
- The private hospital regulation output has been subsumed into the total output cost ($1 million), consequently the output cost differs from the published target in the 2001-02 Budget papers.
- (b)
- This performance measure measures actual admissions rather than booked admissions, which were reported in 2000-01.
- (c)
- 2000-01 actual and 2001-02 published budget figures have been adjusted to reflect the transfer of Palliative Care services from Aged and Home Care to Acute Health.
- (d)
- Reflects higher than expected proportion of part time students.
Ambulance Services
Ambulance Services include emergency and non-emergency ambulance services and clinical training of ambulance paramedics.
The Ambulance Services outputs below make a significant contribution to the achievement of the following objectives:
- •
- Waiting times for health, community care, disability and housing programs are at of below national benchmark levels;
- •
- Quality of Human Services improves each year;
- •
- Sustainable, well managed and efficient Government and non-Government service sectors; and
- •
- Reduce inequalities in health status and well-being, and in access to services.
| Major Outputs/Deliverables Performance Measures | Unit of measure | 2000-01 Actuals | 2001-02 Target | 2001-02 Expected Outcome | 2002-03 Target | ||||||
|---|---|---|---|---|---|---|---|---|---|---|---|
| Ambulance Emergency Services—Emergency road, rotary and fixed air wing patient treatment and transport services. | |||||||||||
| Quantity(a) | |||||||||||
| Metropolitan road cases | number | 221 859 | 236 000 | 231 000 | 245 000 | ||||||
| Country road cases | number | 75 984 | 77 000 | 80 000 | 81 000 | ||||||
| Rotary wing cases | number | 1 632 | 2 000 | 2 000 | 2 100 | ||||||
| Fixed wing cases | number | 827 | 800 | 800 | 850 | ||||||
| Quality | |||||||||||
| Audited cases meeting clinical practice standards | per cent | 95 | 92 | 92 | 92 | ||||||
| Timeliness | |||||||||||
| Emergency response time (code 1) in 50 per cent of cases—metro | minutes | 8 | 8 | 8 | 8 | ||||||
| Emergency response time (code 1) in 90 per cent of cases—metro | minutes | 14 | 13 | 13 | 13 | ||||||
| Cost | |||||||||||
| Total output cost | $ million | 184.2 | 193.9 | 217.7(b) | 216.8 | ||||||
Ambulance Non-emergency Services—Non-emergency road and fixed air wing patient transport services. | |||||||||||
| Quantity(a) | |||||||||||
| Metropolitan road cases | number | 142 263 | 148 000 | 156 000 | 169 000 | ||||||
| Country road cases | number | 39 103 | 41 000 | 42 000 | 42 500 | ||||||
| Fixed wing cases | number | 3 638 | 3 000 | 3 800 | 4 100 | ||||||
| Quality | |||||||||||
| Audited cases meeting clinical practice standards | per cent | 80 | 90 | 90 | 90 | ||||||
| Cost | |||||||||||
| Total output cost | $ million | 31.1 | 27.8 | 28.1 | 28.0 | ||||||
Ambulance Services Training and Development—Provision of clinical training for ambulance paramedics by external organisations. | |||||||||||
| Quantity | |||||||||||
| Ambulance student hours | number | 114 536 | 135 000 | 125 000 | 120 000 | ||||||
| Quality | |||||||||||
| Ambulance students successfully completing courses | per cent | 95 | 95 | 95 | 95 | ||||||
| Cost | |||||||||||
| Total output cost | $ million | 2.2 | 2.1 | 2.1 | 2.1 | ||||||
Basic Life Support Program—Provision of pre-ambulance life support care | |||||||||||
| Quantity | |||||||||||
| Participants in CPR training | number | nm | 30 000 | 30 000 | 20 000 | (a) | |||||
| Quality | |||||||||||
| Participants successfully completing courses | per cent | nm | 97 | 97 | 97 | ||||||
| Cost | |||||||||||
| Total output cost | $ million | 1.7 | 1.5 | 1.9 | 2.0 | ||||||
Source: Department of Human Services
- Notes:
- (a)
- Target reflects the estimated caseload for ambulance services.
- (b)
- Variance from 2001-02 target reflects additional funding for enterprise bargaining award variations (including one off arrears in 2001-02) and new policy initiatives.
- (c)
- Other basic Life Support initiatives will be implemented in addition to CPR during 2002-03, which are not included in this performance measure.
Mental Health
Mental Health Services include a range of acute, residential and community based services to support people with a mental illness.
The Mental Health Services outputs below make a significant contribution to the achievement of the following objectives:
- •
- Waiting times for health, community care, disability and housing programs are at or below national benchmark levels;
- •
- Quality of Human Services improves each year;
- •
- Sustainable, well managed and efficient Government and non-Government service sectors;
- •
- Reduce social dislocation and the need for secondary and tertiary service intervention through strengthening communities, family support, early intervention and health promotion measures;
- •
- Increase the proportion of people needing the Department's funded services who remain in supportive families and communities; and
- •
- Reduce inequalities in health status and well-being, and in access to services.
| Major Outputs/Deliverables Performance Measures | Unit of measure | 2000-01 Actuals | 2001-02 Target | 2001-02 Expected Outcome | 2002-03 Target | |||||
|---|---|---|---|---|---|---|---|---|---|---|
| Clinical Inpatient Care—A range of hospital inpatient treatment programs provided to people with mental illness. | ||||||||||
| Quantity | ||||||||||
| Separations | number | nm | nm | nm | 17 400 | |||||
| Quality | ||||||||||
| Clients readmitted (unplanned) within 28 days | per cent | nm | nm | nm | 15 | |||||
| Cost | ||||||||||
| Total output cost | $ million | 227.7 | 209.6 | 236.7 | 251.4 | |||||
Clinical Community Care—A range of community based and residential programs and support services provided to people with mental illness. | ||||||||||
| Quantity | ||||||||||
| Continuing clients | number | nm | nm | nm | 55 000 | |||||
| Quality | ||||||||||
| Clinical inpatient clients who have contact with clinical community care service providers during the 7 days prior to admission | per cent | nm | nm | nm | 71 | |||||
| Clinical inpatient clients who have contact with clinical community care service providers within 7 days of post-discharge | per cent | nm | nm | nm | 61 | |||||
| Cost | ||||||||||
| Total output cost | $ million | 235.2 | 240.5 | 244.6 | 252.4 | |||||
Psychiatric Disability Support Services—A range of support and rehabilitation services provided to people who have disabilities resulting from mental illness. | ||||||||||
| Quantity | ||||||||||
| Clients receiving Psychiatric Disability Support Services | number | nm | 9 000 | 9 000 | 9 124 | |||||
| Quality | ||||||||||
| Individual Program Plans completed within 2 months | per cent | nm | 75 | 75 | 75 | |||||
| Cost | ||||||||||
| Total output cost | $ million | 58.3 | 59.5 | 60.6 | 62.5 | |||||
Mental Health Service System Capacity Development—A range of activities, including research, training and education, designed to increase the capacity of the mental health service system. | ||||||||||
| Quantity | ||||||||||
| Number of clinical staff training hours | number | nm | nm | nm | 19 521 | |||||
| Quality | ||||||||||
| Clinical staff successfully completing courses | per cent | nm | nm | nm | 95 | |||||
| Cost | ||||||||||
| Total output cost | $ million | 20.7 | 17.7 | 21.5 | 22.2 | |||||
Source: Department of Human Services
Aged and Home Care
Aged and Home Care includes a range of in-home, community-based, specialist geriatric and residential care services for older people. Includes Home and Community Care (HACC) services that are designed to provide basic maintenance and support services for frail older people, people with a disability and their carers.
The Aged and Home Care outputs below make a significant contribution to the achievement of the following objectives:
- •
- Waiting times for health, community care, disability and housing programs are at or below national benchmark levels;
- •
- Quality of Human Services improves each year;
- •
- Sustainable, well managed and efficient Government and non-Government service sectors;
- •
- Reduce social dislocation and the need for secondary and tertiary service intervention through strengthening communities, family support, early intervention and health promotion measures;
- •
- Increase the proportion of people needing the Department's funded services who remain in supportive families and communities; and
- •
- Reduce inequalities in health status and well-being, and in access to services.
| Major Outputs/Deliverables Performance Measures | Unit of measure | 2000-01 Actuals | 2001-02 Target | 2001-02 Expected Outcome | 2002-03 Target | |||||
|---|---|---|---|---|---|---|---|---|---|---|
| Positive Ageing—Community-based information and activities to promote health and well being for older Victorians. | ||||||||||
| Quantity | ||||||||||
| Attendances at Victorian Seniors' Festival | number | 430 262 | 400 000 | 400 000 | 400 000 | |||||
| Quality | ||||||||||
| Eligible seniors with a senior's card | per cent | nm | nm | nm | 95 | |||||
| Funded projects for which satisfactory reports have been received | per cent | nm | nm | nm | 100 | |||||
| Cost | ||||||||||
| Total output cost | $ million | 4.0 | 1.6 | (a) | 3.9 | 4.0 | ||||
Aged Care Assessment—Comprehensive assessment of people's requirements for treatment and residential aged care services. | ||||||||||
| Quantity | ||||||||||
| Aged care service delivery (aged care units) | number | nm | nm | nm | 308 000 | |||||
| Aged Care Assessments | number | 54 202 | 53 600 | 53 600 | 53 600 | |||||
| Timeliness | ||||||||||
| Average wait (days) between client registration and ACAS assessment—hospital based assessment | number | nm | nm | nm | 2.5 | |||||
| Average wait (days) between client registration and ACAS assessment—community based assessment | number | nm | nm | nm | 15 | |||||
| Cost | ||||||||||
| Total output cost | $ million | 23.0 | 20.2 | 23.8 | (b) | 24.9 | ||||
Aged Support Services—A range of community services that support older Victorians and their carers. | ||||||||||
| Quantity | ||||||||||
| Aged care service delivery (aged care units) | number | nm | nm | nm | 791 000 | |||||
| Individuals provided with respite services | number | 20 294 | 20 000 | 20 000 | 20 450 | |||||
| Personal alert units allocated | number | nm | nm | nm | 14 100 | |||||
| Cost | ||||||||||
| Total output cost(c) | $ million | 72.1 | 62.5 | 69.8 | (d) | 72.1 | ||||
Aged Residential Care—Services for people requiring ongoing care and support in a residential aged care setting. | ||||||||||
| Quantity | ||||||||||
| Aged care service delivery (aged care units) | number | nm | nm | nm | 963 700 | |||||
| Nursing home bed days | number | 1 226 367 | 1 200 000 | 1 200 000 | 1 245 000 | |||||
| Quality | ||||||||||
| Residential care services certified and accredited | per cent | 100 | 100 | 100 | 100 | |||||
| Cost | ||||||||||
| Total output cost | $ million | 210.4 | 194.4 | 224.4 | (d) | 240.3 | ||||
Aged Care Service System Development and Resourcing—Workforce, community and service development projects that support the aged care sector and improve the quality and targeting of aged care services. | ||||||||||
| Quantity | ||||||||||
| Aged care service system development & resourcing (aged care service system resourcing units) | number | nm | nm | nm | 102 000 | |||||
| Quality | ||||||||||
| Funded research and service development projects for which satisfactory reports have been received | per cent | nm | nm | nm | 100 | |||||
| Cost | ||||||||||
| Total output cost | $ million | 24.1 | 20.7 | 11.2 | (d) | 8.9 | ||||
| HACC Primary Health, Community Care and Support—A range of community based nursing, allied health and support services enabling frail older people and younger people with disabilities to maintain their independence in the community. | ||||||||||
| Quantity | ||||||||||
| Home and Community Care service delivery (including case management packages) (HACC community service units) | number ('000) | nm | 4 500 | 4 500 | 4 700 | |||||
| Quality | ||||||||||
| Target population receiving Home and Community Care services | per cent | nm | nm | nm | 60 | |||||
| Cost | ||||||||||
| Total output cost | $ million | 256.5 | 327.8 | (d) | 287.4 | 309.5 | ||||
HACC Service System Development and Resourcing—Workforce, community, service and minor capital development projects that support the aged care sector and improve the quality and targeting of HACC services. | ||||||||||
| Quantity | ||||||||||
| Home and Community Care service system development and resourcing (HACC service system resourcing units) | number | nm | 200 000 | 300 000 | 333 000 | |||||
| Cost | ||||||||||
| Total output cost | $ million | 17.2 | 9.3 | 24.4 | (d) | 19.7 | ||||
Source: Department of Human Services
- Notes:
- (a)
- Funding for Seniors Festival, Seniors Card and Office of Senior Victorians is included in the 2001-02 expected outcome and 2002-03 target.
- (b)
- Increase reflects additional funds from the Commonwealth in recognition of price increases.
- (c)
- 2000-01 Actuals and 2001-02 Target and Expected Outcome figures have been adjusted to reflect the transfer of Palliative Care services and Cognitive Dementia and Memory Services Clinics from Aged and Home Care to Acute Health Services.
- (d)
- Adjustments to output costs are due to internal funding transfers.
Primary Health
Primary Health Services include a range of in-home, community based, community and primary health services designed to promote health and well-being and prevent the onset of more serious illness.
The Primary Health Services outputs below make a significant contribution to the achievement of the following objectives:
- •
- Waiting times for health, community care, disability and housing programs are at or below national benchmark levels;
- •
- Quality of Human Services improves each year;
- •
- Sustainable, well managed and efficient Government and non-Government service sectors;
- •
- Reduce social dislocation and the need for secondary and tertiary service intervention through strengthening communities, family support, early intervention and health promotion measures;
- •
- Increase the proportion of people needing the Department's funded services who remain in supportive families and communities; and
- •
- Reduce inequalities in health status and well-being, and in access to services.
| Major Outputs/Deliverables Performance Measures | Unit of measure | 2000-01 Actuals | 2001-02 Target | 2001-02 Expected Outcome | 2002-03 Target | |||||
|---|---|---|---|---|---|---|---|---|---|---|
Community Health Care—A range of community care and support services, including allied and women's health that enable people to continue to live independently in the community. | ||||||||||
| Quantity | ||||||||||
| Community and primary health care service hours | number | nm | 850 000 | 850 000 | 879 850 | |||||
| Cost | ||||||||||
| Total output cost | $ million | 98.9 | 107.1 | 107.5 | 113.6 | |||||
School Nursing—Provision of appropriate health promotion and individual health care and support to young people. | ||||||||||
| Quantity | ||||||||||
| Prep aged students assessed by school nurses | number | nm | 57 800 | 57 600 | 57 600 | |||||
| Designated schools receiving secondary school nursing services | number | nm | nm | nm | 199 | |||||
| Quality | ||||||||||
| Proportion of prep aged students assessed by school nurses | per cent | nm | nm | nm | 90 | |||||
| Primary school aged students with completed care plans receiving follow-up care | per cent | 100 | 100 | 100 | 100 | |||||
| Secondary school annual action plans completed | per cent | nm | nm | nm | 100 | |||||
| Cost | ||||||||||
| Total output cost | $ million | 8.3 | 8.6 | 13.3 | 13.3 | |||||
Primary Health Service System Development and Resourcing—Workforce, community and service development projects that support the community and primary health service sector and improve the quality and targeting of services. | ||||||||||
| Quantity | ||||||||||
| Primary Care Partnerships with reviewed and updated Community Health Plans | per cent | nm | 100 | 100 | 100 | |||||
| Better Health Channel internet sessions (visits) | number ('000) | nm | nm | nm | 1 440 | |||||
| Better Health Channel internet enquiries (page views) | number ("000) | 2 808 | 2 800 | 3 500 | 5 000 | |||||
| Quality | ||||||||||
| Number of Better Health Channel articles | number | 700 | 1 000 | 1 000 | 1 250 | |||||
| Timeliness | ||||||||||
| Better Health Channel accessible 24 hours a day | per cent | 100 | 100 | 100 | 100 | |||||
| Cost | ||||||||||
| Total output cost(a) | $ million | 20.6 | 18.0 | 32.2 | (b) | 21.4 | ||||
Source: Department of Human Services
- Notes:
- (a)
- All amounts have been adjusted to reflect the transfer of Better Health Channel funding from Acute Health.
- (b)
- 2001-02 Expected Outcome includes non-recurrent funding of $9.0 million from National Health Development Fund.
Dental Health
Dental Health Services include a range of specialist, community, school and preschool dental services for eligible Victorians.
The Dental Health Services outputs below make a significant contribution to the achievement of the following objectives:
- •
- Waiting times for health, community care, disability and housing programs are at or below national benchmark levels;
- •
- Quality of Human Services improves each year;
- •
- Sustainable, well managed and efficient Government and non-Government service sectors;
- •
- Reduce social dislocation and the need for secondary and tertiary service intervention through strengthening communities, family support, early intervention and health promotion measures; and
- •
- Reduce inequalities in health status and well-being, and in access to services.
| Major Outputs/Deliverables ,cfnPerformance Measures | Unit of measure | 2000-01 Actuals | 2001-02 Target | 2001-02 Expected Outcome | 2002-03 Target | |||||
|---|---|---|---|---|---|---|---|---|---|---|
| Dental Services—A range of dental health services to support health and well-being in the community. | ||||||||||
| Quantity | ||||||||||
| Community, school, preschool and specialist services (dental service units) | number | nm | 606 400 | 606 400 | 624 300 | |||||
| Quality | ||||||||||
| Ratio of emergency to general courses of dental care | ratio | 52:48 | 48:52 | 53:47 | 49:51 | |||||
| Disadvantaged students accessing School Dental Care | per cent | 80 | 80 | 80 | 80 | |||||
| Timeliness | ||||||||||
| Waiting time for restorative dental care | months | 20 | 20 | 22 | 22 | |||||
| Waiting time for dentures | months | 21 | 23 | 24 | 24 | |||||
| Cost | ||||||||||
| Total output cost | $ million | 71.0 | 81.2 | 71.5 | (a) | 74.0 | ||||
Dental Service System Development and Resourcing—Workforce, community and service development projects that support the Dental Health service sector and improve the quality and targeting of dental health services. | ||||||||||
| Quantity | ||||||||||
| Dental service system development and resourcing (dental service system resourcing units) | number | nm | 14 300 | 14 300 | 14 300 | |||||
| Cost | ||||||||||
| Total output cost | $ million | 3.1 | 1.9 | 10.5 | (a) | 10.0 | ||||
Source: Department of Human Services
- Note:
- (a)
- 2001-02 Expected Outcome reflects transfer of Service Support funding from Dental Services Output to Dental Service System Development and Resourcing Output.
Public Health and Drugs includes the provision of leadership, support and services that promote and protect the health and well-being of all Victorians in partnership with key stakeholders and communities.
The Public Health and Drugs outputs below make a significant contribution to the achievement of the following objectives:
- •
- Waiting times for health, community care, disability and housing programs are at or below national benchmark levels;
- •
- Quality of Human Services improves each year;
- •
- Sustainable, well managed and efficient Government and non-Government service sectors;
- •
- Reduce social dislocation and the need for secondary and tertiary service intervention through strengthening communities, family support, early intervention and health promotion measures;
- •
- Increase the proportion of people needing the Department's funded services who remain in supportive families and communities; and
- •
- Reduce inequalities in health status and well-being and in access to services.
| Major Outputs/Deliverables Performance Measures | Unit of measure | 2000-01 Actuals | 2001-02 Target | 2001-02 Expected Outcome | 2002-03 Target | ||||||
|---|---|---|---|---|---|---|---|---|---|---|---|
| Disease Prevention, Control and Surveillance—Reduce the impact and spread of disease amongst Victorians by prevention and early intervention through population-wide health strategies including immunisation, disease surveillance and response, monitoring, screening and control, sexual health and clinical services, supported accommodation, home-based care and needle and syringe programs. | |||||||||||
| Quantity | |||||||||||
| Screens for preventable illness (cancer screening, genetic screenings and TB undertakings) | number | 982 331 | 997 400 | 988 900 | 995 900 | ||||||
| Needles provided through the Needle and Syringe Program | number | ('000) | 6 445.5 | 6 600 | 4 410 | (a) | 4 000 | ||||
| Quality | |||||||||||
| Immunisation coverage: | |||||||||||
| • At 2 years of age | per cent | 87 | 88 | 88 | 90 | ||||||
| • At school entry | per cent | 86 | 85 | 85 | 87 | ||||||
| • Pre-adolescent (year 7) students fully immunised for Hepatitis B | per cent | 79 | 80 | 80 | 82 | ||||||
| • At 65+ years of age (influenza) | per cent | nm | 78 | 78 | 80 | ||||||
| Timeliness | |||||||||||
| Target population screened within specified timeframe for breast cancer | per cent | 58 | 56 | 58 | 58 | ||||||
| Target population screened within specified timeframe for cervical cancer | per cent | 67 | 70 | 70 | 70 | ||||||
| Cost | |||||||||||
| Total output cost | $ million | 96.6 | 99.0 | 105.3 | 106.9 | ||||||
Drug Prevention and Control—Encourage all Victorians to minimise the harmful effects of illicit and licit drugs including tobacco and alcohol, by providing a comprehensive range of strategies which focus on enhanced community and professional education, targeted prevention and early intervention, and the use of effective regulation. | |||||||||||
| Quantity | |||||||||||
| GPs trained to prescribe methadone | number | nm | 46 | 46 | 60 | ||||||
| Participants in peer education programs for injecting drug users | number | nm | 350 | 300 | 300 | (a) | |||||
| Contacts through Family Drug Help | number | nm | 3 000 | 3 000 | 3 000 | ||||||
| Licences and permits for supply or use of drugs and poisons | number | nm | nm | nm | 1 590 | ||||||
| Inspected restaurants, cafes and dining areas complying with smoke free dining | per cent | nm | 75 | 75 | 75 | ||||||
| Quality | |||||||||||
| Local councils trained in tobacco reforms | per cent | nm | 75 | 75 | 85 | ||||||
| Cost | �� | ||||||||||
| Total output cost(b) | $ million | 10.2 | 10.4 | 11.8 | 12.3 | ||||||
Drug Treatment and Rehabilitation—Assist the community and individuals to control and reduce the harmful effects of illicit and licit drugs including alcohol in Victoria through the provision of residential and community based services which include withdrawal services, rehabilitation, supported accommodation, education and training, counselling and support. | |||||||||||
| Quantity | |||||||||||
| Episodes of care—Residential based drug treatment services | number | 4 965 | 6 000 | 6 000 | 6 700 | ||||||
| Episodes of care—Community based drug treatment services | number | 30 288 | 33 000 | 33 000 | 35 800 | ||||||
| Episodes of care—Drug counselling, consulting and continuing care | number | nm | 12 000 | 12 000 | 13 600 | ||||||
| Clients on the pharmacotherapy program | number | 8 026 | 8 800 | 8 800 | 7 000 | (a) | |||||
| Quality | |||||||||||
| Successful courses of treatment | per cent | nm | 85 | 85 | 85 | ||||||
| Timeliness | |||||||||||
| Average working days between screening of client and commencement of residential based drug treatment | number | 8 | 12 | 6 | 9 | ||||||
| Average working days between screening of client and commencement of community based drug treatment | number | 4 | 5 | 3 | 5 | ||||||
| Cost | |||||||||||
| Total output cost | $ million | 50.9 | 52.0 | 45.9 | (c) | 52.8 | |||||
Health and Social Development—Develop the capacity of the community, organisations and systems to improve the health and well-being of Victorians through strengthening communities. Programs focus on the needs of children and youth, and tackling health inequalities by forming strategic partnerships to deliver health promotion strategies, professional education and support, public information and advocacy. | |||||||||||
| Quantity | |||||||||||
| Local agencies and Primary Care Partnerships supported to develop the health promotion component of Community Health plans | number | 50 | 32 | 32 | 32 | ||||||
| People who have undertaken funded health promotion training or a professional development program | number | nm | 200 | 400 | 450 | ||||||
| Quality | |||||||||||
| Parents receiving Child Health Records | per cent | nm | 97 | 97 | 98 | ||||||
| Funded health development initiatives for which evaluation reports are required and have been received | per cent | nm | 100 | 100 | 100 | ||||||
| Cost | |||||||||||
| Total output cost | $ million | 33.5 | 34.1 | 34.7 | 34.7 | ||||||
Environmental Health and Safety—Reduce and manage the public health risks associated with air, land, water, chemicals and other aspects of the environment in Victoria through risk assessment approaches, emergency response, information and advice, education and training, regulation and the provision of statutory services. | |||||||||||
| Quantity | |||||||||||
| Environmental health inspections and investigations undertaken(d) | number | nm | 2 800 | 2 850 | 2 900 | ||||||
| Quality | |||||||||||
| Public Health emergency response calls dealt with within designated plans and procedure timelines | per cent | 100 | 100 | 100 | 100 | ||||||
| Cost | |||||||||||
| Total output cost | $ million | 5.1 | 5.2 | 5.3 | 5.2 | ||||||
Food and Activity—Promote and support healthy eating, food safety, regular activity and healthy weight in Victoria through community education, development initiatives, training, regulation and services. | |||||||||||
| Quantity | |||||||||||
| Food Safety Program Templates registered | number | nm | 10 | 10 | 10 | ||||||
| Quality | |||||||||||
| Level of participant satisfaction with Food Safety Training Programs | per cent | nm | 75 | 75 | 80 | ||||||
| Timeliness | |||||||||||
| Average time taken from notification to commencement of enforcement action | hours | nm | 24 | 24 | 24 | ||||||
| Cost | |||||||||||
| Total output cost | $ million | 3.0 | 3.0 | 3.2 | 3.0 | ||||||
Biomedical Research, Ethics and Safety—Enhance high quality biomedical research to improve health outcomes and economic prosperity in Victoria whilst ensuring high standards of ethics, safety and community confidence in biotechnology through consultation and contribution to the national regulatory framework. | |||||||||||
| Quantity | |||||||||||
| National Health and Medical Research grant funding received by research institutes in Victoria | per cent | nm | 15 | 15 | 15 | ||||||
| Quality | |||||||||||
| Supported grants that are peer reviewed | per cent | nm | 100 | 100 | 100 | ||||||
| Cost | |||||||||||
| Total output cost | $ million | 30.2 | 30.8 | 31.0 | 35.8 | ||||||
Public Health Research, Information and Training—Assess population health needs and risks in Victoria and identify the causes of and solutions to health problems in the community, and provide public health information, education and training, to the relevant stakeholders. | |||||||||||
| Quantity | |||||||||||
| Visits to the Public Health internet web site(e) | number | nm | nm | nm | 600 000 | ||||||
| DHS funded Public Health training positions | number | nm | 12 | 12 | 12 | ||||||
| Quality | |||||||||||
| Funded Public Health projects for which satisfactory reports have been received | per cent | nm | 90 | 90 | 90 | ||||||
| Cost | |||||||||||
| Total output cost | $ million | 2.8 | 2.8 | 3.8 | 2.7 | ||||||
Source: Department of Human Services
- Notes:
- (a)
- 2001-02 expected outcome and 2002-03 target reflects reduction in demand for services due to reduction in current availability of heroin.
- (b)
- Funding is also provided for drug policy and services through the Community Support Fund (CSF). The amounts therefore do not represent the total funding provided for drug policy and services. CSF funding is shown under the budget allocation for the Department of Premier and Cabinet.
- (c)
- 2001-02 expected outcome reflects movements including transfer to Mental Health for Dual Diagnosis Services and a lower than expected carry-forward of output costs from 2000-01.
- (d)
- 2001-02 target and expected outcome have been recalculated to include routine inspections connected with Legionnaires' disease, which were previously counted separately.
- (e)
- Updated software has enabled the previous measure of internet enquiries to be replaced by a new measure that better reflects usage of the Public Health internet site.
Disability Services
Disability Services include provision of continuing care and support services for people with disabilities, their carers and their families.
The Disability Services outputs below make a significant contribution to the achievement of the following objectives:
- •
- Waiting times for health, community care, disability and housing programs are at or below national benchmark levels;
- •
- Quality of human services programs improves each year;
- •
- Sustainable, well managed, and efficient Government and non-Government service sectors;
- •
- Reduce social dislocation and the need for secondary and tertiary service intervention through strengthening communities, family support, early intervention, and health promotion measures;
- •
- Increase the proportion of people needing the Department's funded services who remain in supportive families and communities; and
- •
- Reduce inequalities in health status and well-being, and in access to services.
| Major Outputs/Deliverables Performance Measures. | Unit of measure | 2000-01 Actuals | 2001-02 Target | 2001-02 Expected Outcome | 2002-03 Target | ||||||
|---|---|---|---|---|---|---|---|---|---|---|---|
| Intake Assessment—Assessment of eligibility, referrals and provision of advice regarding availability of services and service options. | |||||||||||
| Quantity | |||||||||||
| Eligibility assessments completed per annum | number | nm | 970 | 1 000 | 1 000 | ||||||
| Timeliness | |||||||||||
| Eligibility assessments undertaken within 30 days | per cent | nm | 70 | 75 | 75 | ||||||
| Cost | |||||||||||
| Total output cost | $ million | 12.9 | 9.8 | 14.6 | (a) | 15.4 | |||||
Planning and Coordination—Services to people who require assistance with the co-ordination of services and accessing necessary resources to maximise their independence and participation in the community. Includes assessment of needs, development of plans, implementation and monitoring of goals. | |||||||||||
| Quantity | |||||||||||
| Clients receiving case management services | number | 4 919 | 4 950 | 5 500 | 4 950 | ||||||
| General Service Plans completed per annum | number | nm | 2 000 | 2 300 | 2 300 | ||||||
| Quality | |||||||||||
| Case Management outlets reporting a minimum of two planned Quality improvement activities in the forthcoming year | per cent | 97 | 90 | 90 | 90 | ||||||
| Timeliness | |||||||||||
| Average case management waiting time | days | nm | 70 | 60 | 60 | ||||||
| General Service Plans reviewed within timelines | per cent | nm | 83 | 83 | 83 | ||||||
| Cost | |||||||||||
| Total output cost | $ million | 19.3 | 19.3 | 20.8 | 21.6 | ||||||
Primary Support—a range of programs and services aimed at maintaining and increasing the functional independence of people with disabilities and supporting primary caregiving relationships by providing respite for families and carers. | |||||||||||
| Quantity | |||||||||||
| Clients accessing aids and equipment | number | 32 000 | 23 040 | 23 040 | 23 040 | ||||||
| Carer households provided with a respite service | number | 10 634 | 10 250 | 10 850 | 10 250 | ||||||
| Quality | |||||||||||
| Clients satisfied with the aids and equipment services system | per cent | 87 | 85 | 85 | 85 | ||||||
| Carer households satisfied with Quality of respite service provided | per cent | 85 | 80 | 80 | 80 | ||||||
| Timeliness | |||||||||||
| Clients either in receipt of equipment or sent written acknowledgment of Aids and Equipment applications within 10 working days. | per cent | nm | nm | nm | 90 | ||||||
| Cost | |||||||||||
| Total output cost | $ million | 66.8 | 70.6 | 71.9 | 73.4 | ||||||
Community Participation—Provision of a range of day program activities delivered in group settings to address individual needs and enhance independence, community participation and Quality of life; and/or provision of packages of support to enhance transition from the school system to the community. | |||||||||||
| Quantity | |||||||||||
| Clients with day activities | number | 7 417 | 7 600 | 7 600 | 7 700 | ||||||
| Futures for Young Adults (FFYA) clients | number | 4 262 | 5 000 | 5 000 | 5 160 | ||||||
| Timeliness | |||||||||||
| Day activity clients program plans reviewed within 60 days of the end of each 12 month service period | per cent | 95 | 90 | 90 | 90 | ||||||
| Cost | |||||||||||
| Total output cost | $ million | 125.4 | 138.7 | 134.9 | 138.5 | ||||||
Flexible Support Packages—Flexible support for families and unpaid carers, including case management, aimed at preventing future long-term residential placement. | |||||||||||
| Quantity | |||||||||||
| Clients receiving flexible care packages | number | 2 945 | 2 700 | 3 300 | 3 300 | ||||||
| Quality | |||||||||||
| Outlets reporting a minimum of two planned Quality improvement activities in the forthcoming year | per cent | 97 | 90 | 90 | 90 | ||||||
| Cost | |||||||||||
| Total output cost | $ million | 13.0 | 17.4 | 15.5 | 17.5 | ||||||
Community and Home Based Support—Individually tailored and case managed packages of home-based services, support and equipment to clients of assessed high needs. | |||||||||||
| Quantity | |||||||||||
| Clients receiving Community and Home Based Support | number | nm | 2 230 | 2 320 | 2 390 | ||||||
| Quality | |||||||||||
| Outlets reporting a minimum of two planned Quality improvement activities in the forthcoming year | per cent | nm | 90 | 90 | 90 | ||||||
| Cost | |||||||||||
| Total output cost | $ million | 46.8 | 57.2 | 52.6 | 60.0 | ||||||
Shared Supported Accommodation—Accommodation support services provided to groups of clients in community-based settings. | |||||||||||
| Quantity | |||||||||||
| Clients in Shared Supported Accommodation | number | nm | 4 250 | 4 250 | 4 375 | ||||||
| Quality | |||||||||||
| Outlets reporting a minimum of two planned Quality improvement activities in the forthcoming year | per cent | 96 | 90 | 90 | 90 | ||||||
| Timeliness | |||||||||||
| Shared Supported Accommodation client program plans reviewed within 60 days of the end of each 12 month service period | per cent | 96 | 90 | 90 | 90 | ||||||
| Cost | |||||||||||
| Total output cost | $ million | 297.3 | 302.2 | 317.9 | 332.1 | ||||||
Specialist Services—Assessment, consultation and intervention services for people with highly complex and challenging behaviours. | |||||||||||
| Quantity | |||||||||||
| Clients receiving Specialist Services | number | 1 112 | 1 300 | 1 300 | 1 900 | (b) | |||||
| Quality | |||||||||||
| Clients referred to the same service type more than once in an 18 month period | per cent | 10 | 10 | 10 | 10 | ||||||
| Timeliness | |||||||||||
| Clients waiting less than 1 month for specialist services | per cent | 83 | 75 | 65 | 75 | ||||||
| Cost | |||||||||||
| Total output cost | $ million | 11.3 | 11.0 | 11.4 | 11.6 | ||||||
Congregate Care—Centre-based residential accommodation and training services. | |||||||||||
| Quantity | |||||||||||
| Clients in Training Centres | number | 811 | 795 | 795 | 695 | ||||||
| Quality | |||||||||||
| Training Centre Clients with appropriate day activities | per cent | 99 | 90 | 95 | 95 | ||||||
| Total accommodation and support clients in Training Centres | per cent | 11 | 11 | 11 | 10 | ||||||
| Cost | |||||||||||
| Total output cost | $ million | 72.9 | 70.1 | 75.4 | 78.4 | ||||||
Training, Development and Innovation—Provision of competency-based induction and in-service training; and research aimed at enhancing service delivery. | |||||||||||
| Quantity | |||||||||||
| Staff Undertaking Certificate 4 in Community Services (Disability Work) | number | nm | nm | nm | 900 | ||||||
| Timeliness | |||||||||||
| Staff obtaining induction training within 3 months of commencing employment | per cent | nm | 100 | 80 | 100 | ||||||
| Cost | |||||||||||
| Total output cost | $ million | 2.9 | 4.0 | 4.7 | 4.5 | ||||||
Quality and Accreditation—Quality improvement and assurance activities including assessments against service standards and performance reviews | |||||||||||
| Quantity | |||||||||||
| Number of service reviews/performance audits | number | nm | 310 | 310 | 340 | ||||||
| Quality | |||||||||||
| Eligible providers participating in a Quality self assessment process | per cent | 84 | 100 | 85 | 100 | ||||||
| Cost | |||||||||||
| Total output cost | $ million | 2.4 | 3.3 | 3.8 | 4.9 | ||||||
Strengthening Communities—Community planning and development activities aimed at enhancing the capacity of communities to support people with disabilities. | |||||||||||
| Quantity | |||||||||||
| Number of community forums and training programs conducted(c) | number | nm | 100 | 200 | 200 | ||||||
| Cost | |||||||||||
| Total output cost | $ million | 1.5 | 2.0 | 2.4 | 3.4 | ||||||
Information and Advocacy Services—Information, assistance and advocacy support to people with disabilities. | |||||||||||
| Quantity | |||||||||||
| Clients receiving advocacy support | number | 1 023 | 910 | 1 050 | 910 | ||||||
| Quality | |||||||||||
| Websites compliant with appropriate guidelines for accessibility | per cent | 100 | 100 | 100 | 100 | ||||||
| Cost | |||||||||||
| Total output cost | $ million | 6.6 | 5.1 | 5.2 | 5.2 | ||||||
Source: Department of Human Services
- Notes:
- (a)
- 2001-02 expenditure variance results from a different allocation of overhead costs to that used for the 2001-02 budget target.
- (b)
- This target has been revised in 2002-03 to incorporate a broader range of services provided under this output.
- (c)
- The measure has been altered for 2002-03. The scope of the measure now better reflects the intent of the output.
Community Care
Community Care includes purchase or provision of preschool and child care services, a range of primary and secondary services which support the role of families as primary carers, early intervention services for individuals and families facing personal or financial crisis, protective services for children at risk, and juvenile justice services.
The Community Care outputs below make a significant contribution to the achievement of the following objectives:
- •
- Waiting times for health, community care, disability and housing programs are at or below national benchmark levels;
- •
- Quality of human services programs improves each year;
- •
- Sustainable, well managed and efficient Government and non-government service sectors;
- •
- Reduce social dislocation and the need for secondary and tertiary service intervention through strengthening communities, family support, early intervention, and promotion measures;
- •
- Increase the proportion of people needing the Department's funded services who remain in supportive families and communities; and
- •
- Reduce inequalities in health status and well-being, and in access to services.
| Major Outputs/Deliverables Performance Measures. | Unit of measure | 2000-01 Actuals | 2001-02 Target | 2001-02 Expected Outcome | 2002-03 Target | ||||||
|---|---|---|---|---|---|---|---|---|---|---|---|
| Early Childhood Services—A range of services providing support to children in the early years including preschool and child care, maternal and child health and early intervention services for children with a disability. These services include the licensing and monitoring of centre-based children's services. | |||||||||||
| Quantity | |||||||||||
| Total number of clients | number | 136 892 | 135 500 | 135 500 | 134 000 | (a) | |||||
| Number of Maternal and Child Health Line calls | number | 36 450 | 34 400 | 50 000 | (b) | 52 800 | |||||
| Preschool Participation rate | per cent | 96 | 95.4 | 96 | 96 | ||||||
| Quality | |||||||||||
| Proportion of maternal and child health clients with children aged 0-1 years receiving enhanced maternal and child health services | per cent | 5 | 5 | 7 | 7 | ||||||
| Funded preschool services with a Quality assurance process | per cent | 94 | 90 | 94 | 94 | ||||||
| Timeliness | |||||||||||
| Children 0-1 month enrolled at Maternal and Child Health services from birth notifications | per cent | 98 | 98 | 98 | 98 | ||||||
| Cost | |||||||||||
| Total output cost | $ million | 152.5 | 162.6 | 158.5 | 171.5 | ||||||
Family and Community Support—A range of services providing support to families, individuals and the community comprising support services for families, a range of counselling services, and neighbourhood houses and networks. | |||||||||||
| Quantity | |||||||||||
| Total number of clients | number | 93 181 | 78 500 | 96 000 | 55 000 | (c) | |||||
| Total number of calls/contacts/occasions of service | number | 289 312 | 237 000 | 301 000 | 249 700 | (c) | |||||
| Funded hours of neighbourhood house co-ordination | number | 314 100 | 314 100 | 314 100 | 314 100 | ||||||
| Quality | |||||||||||
| Families expressing satisfaction with Parentline | per cent | nm | 85 | 98 | 98 | ||||||
| Timeliness | |||||||||||
| Financial Counselling Clients receiving initial response within 5 working days | per cent | nm | nm | nm | 95 | ||||||
| Cost | |||||||||||
| Total output cost | $ million | 68.8 | 78.2 | 85.4 | 86.6 | ||||||
Child Protection and Placement—Child protection services, placement support services and adoption and permanent care services, to ensure the safety and well-being of adolescents and children at risk of harm, abuse and neglect. | |||||||||||
| Quantity | |||||||||||
| Notifications to child protection services | number | 37 009 | 36 500 | 39 100 | 39 530 | ||||||
| Daily average number of placements | number | 3 906 | 3 525 | 3 900 | 3 745 | ||||||
| Quality | |||||||||||
| Protective cases re-substantiated within 12 months of case closure | per cent | 18 | <20 | 20 | <20 | ||||||
| Daily average number of clients receiving a specialist support service | number | 994 | 1 000 | 1 070 | 1 000 | ||||||
| Children and young people who were the subject of an investigation which led to a decision not to substantiate, who were subsequently the subject of a substantiation within three months of case closure | per cent | nm | nm | nm | <7 | ||||||
| Children and young people in out of home care who have had three or more placements in the last 12 months (not including placements at home) | per cent | nm | nm | nm | <15 | ||||||
| Proportion of placements that are Home Based Care | per cent | 88 | >85 | 88 | >85 | ||||||
| Timeliness | |||||||||||
| Investigations commencing within 14 calendar days of notification | per cent | nm | nm | nm | >95 | ||||||
| Protective intervention cases closed within 90 days | per cent | 68 | 80 | 70 | 80 | ||||||
| Cost | |||||||||||
| Total output cost | $ million | 239.2 | 237.5 | 253.0 | 259.1 | ||||||
Juvenile Justice Services—A range of services including the provision of advice to court, community-based and custodial supervision, as well as support services that promote community connection and minimise the likelihood of re-offending. | |||||||||||
| Quantity | |||||||||||
| Juvenile Justice custodial facilities occupancy rate | per cent | 85.4 | 85 | 84 | 85 | ||||||
| Male Senior Youth Training Centre custodial capacity | number | 124 | 90 | 125 | 125 | ||||||
| Male Junior YTC and Female YTC custodial capacity | number | nm | nm | nm | 91 | ||||||
| Quality | |||||||||||
| Juvenile Justice clients on community based orders | per cent | 79.8 | >80 | 81.6 | >80 | ||||||
| Juvenile Justice clients participating in community integration (pre-release partnership) program | per cent | 10.9 | 12.5 | 11 | 12.5 | ||||||
| Juvenile Justice clients participating in post release support services | per cent | 90.7 | >80 | 90 | >80 | ||||||
| Timeliness | |||||||||||
| Young people on supervised orders who have a client service plan completed within six weeks of commencement of the order | per cent | 91.1 | 95 | 94 | 95 | ||||||
| Cost | |||||||||||
| Total output cost | $ million | 57.5 | 54.6 | 58.6 | 59.0 | ||||||
Source: Department of Human Services
- Notes:
- (a)
- Reflects projected demographic decline in 2002-03 in number of infants attending for Maternal and Child Health Service.
- (b)
- There has been continuing demand growth for 24 hour phone service that commenced on 31 October 2000.
- (c)
- Decline results from the transfer of Youth Services program to Department of Education and Training from 1 July 2002.
Concessions to Pensioners and Beneficiaries
Concessions to Pensioners and Beneficiaries include development and co-ordination of the delivery of concessions and relief grants to eligible consumers and concession card holders.
The Concessions to Pensioners and Beneficiaries outputs below make a significant contribution to the achievement of the following objectives:
- •
- Reduce inequalities in health status and well-being, and in access to services.
| Major Outputs/Deliverables Performance Measures. | Unit of measure | 2000-01 Actuals | 2001-02 Target | 2001-02 Expected Outcome | 2002-03 Target | |||||
|---|---|---|---|---|---|---|---|---|---|---|
| Energy Concessions—Provides a 17.5 per cent rebate off winter energy bills for eligible mains energy users and a $66 rebate for eligible non-mains users. | ||||||||||
| Quantity | ||||||||||
| Households receiving mains electricity concessions | number | 719 565 | 725 930 | 726 000 | 733 000 | |||||
| Households receiving mains gas concessions | number | 512 893 | 517 812 | 518 000 | 523 000 | |||||
| Households receiving non-mains energy concessions | number | 21 718 | 23 100 | 22 000 | 23 300 | |||||
| Cost | ||||||||||
| Total output cost | $ million | 83.1 | 93.0 | 85.4 | 89.8 | |||||
Water and Sewerage Concessions—Provides 50 per cent off water and sewerage charges up to a maximum of $135 for eligible householders. | ||||||||||
| Quantity | ||||||||||
| Households receiving water and sewerage concessions | number | 516 000 | 525 200 | 521 000 | 530 000 | |||||
| Cost | ||||||||||
| Total output cost | $ million | 63.9 | 69.5 | 64.3 | 72.2 | |||||
Municipal Rates Concessions—Provides 50 per cent off rates and charges up to a value of $135 for pensioner home owners. | ||||||||||
| Quantity | ||||||||||
| Households receiving pensioner concessions for municipal rates and charges | number | 391 567 | 388 749 | 395 000 | 399 000 | |||||
| Cost | ||||||||||
| Total output cost | $ million | 48.7 | 56.8 | 51.2 | 53.6 | |||||
Trustee Services—Financial administration services for low income people or those who are subject to an order by the Victorian Civil and Administrative Tribunal. | ||||||||||
| Quantity | ||||||||||
| Number of services provided to State Trustee clients | number | 12 300 | 11 615 | 12 500 | 13 000 | |||||
| Quality | ||||||||||
| Compliance with standards | per cent | 90 | 90 | 90 | 90 | |||||
| Timeliness | ||||||||||
| Responses and ongoing management within agreed product specific service level | per cent | 90 | 90 | 90 | 90 | |||||
| Cost | ||||||||||
| Total output cost | $ million | 5.2 | 5.2 | 4.9 | 4.9 |
Source: Department of Human Services
Housing Assistance
Housing Assistance includes provision of homelessness services, crisis and transitional accommodation and long term adequate, affordable and accessible housing assistance, co-ordinated with support services where required, and home renovation assistance and management of home loan portfolio.
The Housing Assistance outputs below make a significant contribution to the achievement of the following objectives:
- •
- Waiting times for health, community care, disability and housing programs are at or below national benchmark levels;
- •
- Quality of Human Services improves each year;
- •
- Sustainable, well managed and efficient Government and non-Government sectors;
- •
- Reduce social dislocation and the need for secondary and tertiary service intervention through strengthening communities, family support, early intervention, and health promotion measures; and
- •
- Reduce inequalities in health status and well-being, and in access to services.
| Major Outputs/Deliverables Performance Measures. | Unit of measure | 2000-01 Actuals | 2001-02 Target | 2001-02 Expected Outcome | 2002-03 Target | ||||||
|---|---|---|---|---|---|---|---|---|---|---|---|
| Homelessness Assistance—Supported Accommodation Assistance Program (SAAP) Services to people who are homeless or at risk of homelessness and who are in crisis. Short-term crisis housing in emergency or crisis situations. Medium term accommodation, linked to support services (particularly SAAP). | |||||||||||
| Quantity | |||||||||||
| Total SAAP support periods during year | number | nm | 44 280 | 44 280 | 45 000 | ||||||
| Households assisted with Crisis/ Transitional Housing during year | number | 14 840 | 15 700 | 15 800 | 16 500 | ||||||
| Households assisted with Housing Establishment assistance during year | number | nm | 33 500 | 30 000 | 30 500 | ||||||
| Crisis Supported and Transitional Housing properties acquired during year | number | nm | 300 | 330 | 235 | (a) | |||||
| Quality | |||||||||||
| SAAP support periods for which a case plan was required and developed | per cent | nm | 85 | 85 | 85 | ||||||
| Timeliness | |||||||||||
| SAAP closed support periods during which a housing/accommodation need was unable to be met | per cent | nm | 19 | 19 | 18 | ||||||
| Cost | |||||||||||
| Total output cost | $ million | 99.2 | 127.0 | 127.0 | 114.8 | ||||||
Long Term Housing Assistance—Long-term rental accommodation assistance for low-income families, older persons, singles, youth and other households, co-ordinated with support services where required. | |||||||||||
| Appropriate and secure housing to meet the social, cultural and economic aspirations of the Victorian Aboriginal community, managed by the Aboriginal Housing Board Victoria (AHBV). | |||||||||||
| Quantity | |||||||||||
| Households assisted with public rental housing (tenancies) at end of year | number | 62 526 | 62 500 | 62 500 | 62 500 | ||||||
| Households assisted with long term community housing (tenancies) at end of year | number | 5 506 | 5 800 | 5 800 | 6 000 | ||||||
| Koori Households assisted (tenancies) at end of year (AHBV) | number | 1 032 | 1 050 | 1 050 | 1 080 | ||||||
| Properties acquired during year for long term housing, including leases and joint ventures | number | nm | 1 420 | 1 350 | 1 300 | (b) | |||||
| Joint venture units delivered during year | number | nm | 140 | 100 | (b) | 215 | |||||
| Bonds issued during year | number | nm | 13 600 | 13 600 | 13 600 | ||||||
| Quality | |||||||||||
| Number of dwellings with major upgrade during year | number | nm | 2 500 | 2 500 | 2 700 | (c) | |||||
| Tenants satisfied or very satisfied (measured by national customer satisfaction surveys) | per cent of national average | 89 | 95 | 94.25 | 95 | ||||||
| Timeliness | |||||||||||
| Average waiting time for those who have received early housing allocation | months | 2.7 | 4 | 4 | 4 | ||||||
| Cost | |||||||||||
| Total output cost | $ million | 311.0 | 303.5 | 308.2 | 325.9 | ||||||
Home Ownership and Renovation Assistance—Home Finance assistance and home renovation advice to aged or disabled home owners, to enable them to make their home safe and secure and continue independent living in their own homes. | |||||||||||
| Quantity | |||||||||||
| Home renovation inspection reports during year | number | 4 252 | 3 800 | 3 800 | 3 800 | ||||||
| Quality | |||||||||||
| Clients satisfied with home renovation advice and service | per cent | nm | nm | nm | 90 | ||||||
| Loans in arrears by more than 30 days | per cent | 6 | 5 | 5.3 | 5 | ||||||
| Timeliness | |||||||||||
| Time from request to receipt of home renovation advice | days | 20 | 20 | 20 | 20 | ||||||
| Cost | |||||||||||
| Total output cost | $ million | 0.4 | 0.4 | 0.2 | 0 | (e) | |||||
Source: Department of Human Services
- Notes:
- (a)
- The target in 2002-03 is consistent with the Victorian Homelessness Strategy's directions for change, which emphasise service improvement rather than stock growth in this sector.
- (b)
- The target for 2002-03 reflects the lower number of additional leases in the year.
- (c)
- Expected outcome for 2001-02 reflects the timing of joint venture projects, with more completions in 2002-03.
- (d)
- The target for 2002-03 reflects increased work on high-rise buildings and services, which is not included in the number of units.
- (e)
- In 2002-03 and future years this output will be funded from Office of Housing internal revenue.
Part 2 provides the financial statements that support the Department's provision of outputs. The information provided includes the Statement of Financial Performance, Statement of Financial Position and Statement of Cash Flows for the Department as well as authority for resources.
The total resources made available to a department are applied to three uses:
- •
- the provision of outputs;
- •
- asset investment; or
- •
- payments on behalf of the State.
The following three financial statements are presented in the format consistent with the AAS29 accounting standard. However, for the purposes of this paper they have been divided into controlled and administered items.
Administered items refer to those resources over which the Department cannot exercise direct control. Authority is provided through an appropriation for payments made on behalf of the State. Under the AAS29 standard, these items would normally appear as notes to the financial statements.
Financial Statements
The following four tables can be used to assess the Department's financial performance and use of resources.
- •
- Table 2.2.2—Statement of Financial Performance—provides details of the Department's controlled revenue and expenses on an accrual basis reflecting the cost of providing its outputs;
- •
- Table 2.2.3—Statement of Financial Position—shows all controlled assets and liabilities of the Department. The difference between these represents the net assets position, which is an indicator of the State's equity in the Department; and
- •
- Table 2.2.4—Statement of Cash Flows—shows all movements of cash (cash received and paid). The cash impact of financing and investing activities on Departmental resources is highlighted in this statement; and
- •
- Table 2.2.5: Administered Items Statement—provides details of the Department's administered revenue and expenses (on an accrual basis), and its administered assets and liabilities.
Table 2.2.2: Statement of Financial Performance
| | 2000-01 Actual | 2001-02 Budget | 2001-02 Revised | 2002-03 Budget | Variation(a) | ||||||
|---|---|---|---|---|---|---|---|---|---|---|---|
| | ($ million) | (%) | |||||||||
| Revenue from ordinary activities | |||||||||||
| Output appropriations | 6 118.6 | 6 290.8 | 6 551.9 | 6 879.0 | 9.3 | ||||||
| Special appropriations | 1 018.3 | 1 102.0 | 1 091.9 | 1 146.1 | 4.0 | ||||||
| Resources received free of charge or for nominal consideration | 61.0 | 30.0 | 30.0 | 30.0 | — | ||||||
| Sale of goods and services | 606.9 | 775.2 | 777.6 | 787.6 | 1.6 | ||||||
| Commonwealth Grants | 81.2 | 0.0 | — | — | na | ||||||
| Fines and Fees | 0.0 | 1.2 | — | — | na | ||||||
| Other revenue and revenue from other parties | 138.7 | 66.6 | 77.8 | 83.4 | 25.1 | ||||||
| 8 024.7 | 8 265.8 | 8 529.2 | 8 926.0 | 8.0 | |||||||
| Expenses from ordinary activities | |||||||||||
| Employee entitlements | 3 673.4 | 3 867.6 | 3 988.4 | 4 148.7 | 7.3 | ||||||
| Depreciation and amortisation | 209.7 | 229.7 | 229.7 | 238.9 | 4.0 | ||||||
| Resources provided free of charge or for nominal consideration | 7.4 | — | — | — | — | ||||||
| Grants and other payments | 721.0 | 667.8 | 723.1 | 740.6 | 10.9 | ||||||
| Capital asset charge | 297.9 | 325.4 | 325.4 | 346.3 | 6.4 | ||||||
| Supplies and services | 3 131.2 | 3 196.0 | 3 274.1 | 3 431.0 | 7.4 | ||||||
| Other expenses from ordinary activities | 67.3 | — | — | — | — | ||||||
| Borrowing costs | 3.4 | — | — | — | — | ||||||
| 8 111.3 | 8 286.5 | 8 540.6 | 8 905.5 | 7.5 | |||||||
| Result from ordinary activities | (86.7 | ) | (20.7 | ) | (11.4 | ) | 20.5 | (199.2 | ) | ||
| Loss from extraordinary items | — | — | — | — | — | ||||||
| Net result for the reporting period | (86.7 | ) | (20.7 | ) | (11.4 | ) | 20.5 | (199.2 | ) | ||
| Net increase in asset revaluation reserve | 67.7 | — | — | — | — | ||||||
| Total revenues, expenses and revaluation adjustments recognised directly in equity | 67.7 | — | — | — | — | ||||||
| Total changes in equity other than those resulting from transactions with Victorian State Government in its capacity as owner | (19.0 | ) | (20.7 | ) | (11.4 | ) | 20.5 | (199.2 | ) | ||
Source: Department of Treasury and Finance
- Note:
- (a)
- Variation between 2001-02 Budget and 2002-03 Budget.
Statement of Financial Performance
The Statement of Financial Performance shows an increase in revenue of $660 million between the 2001-02 Budget and the 2002-03 Budget and a corresponding increase of $619 million in expenses.
The $660 million increase in controlled revenue is largely due to the following:
- •
- Increased appropriation revenue of $632 million due to:
- •
- new funding for initiatives reflecting the Government's commitment to high quality and accessible health care. This includes funding for the hospital demand management strategy and other demand management approaches for child protection and placement services and mental health services;
- •
- an increase in the price of services taking account of the flow-on impact of wage agreements including hospital nurses, psychiatric nurses, Victorian public servants, preschool teachers, ambulance paramedics and disability sector workers enterprise bargaining agreements; and
- •
- increased receipts of Specific Purpose Payments from the Commonwealth Government ($39 million, including programs for the Home and Community Care and the Highly Specialised Drugs Program) and fees for services ($21 million largely for hospital services to veterans).
- •
- Increased Other Revenue ($17 million) associated with commercial business activities of hospitals.
Operating Expenses are budgeted to increase by $619 million reflecting the impact of new funding initiatives and the increased cost of providing services as outlined above.
Statement of Financial Position
The Department's Net Asset position is expected to improve by $205 million from 2001-02 to 2002-03 reflecting a projected increase in total assets of $291 million and an increase in liabilities of $86 million.
The forecast increase in net assets is mainly attributed to:
- •
- An increase in Fixed Assets ($190 million), reflecting the impact of increased investment in the asset program for the Department and hospitals. This includes funding for new asset initiatives largely relating to the upgrade of infrastructure to meet continued service needs and regulatory requirements. These include infrastructure renewal ($20 million), equipment upgrade ($45 million), residential aged care facilities upgrade ($40 million) and fire risk management strategy ($10 million). In addition provision is made for further stages of development at the Royal Melbourne, Stawell, Angliss and Dandenong Hospitals.
- •
- An increase in receivables of $101 million is largely due to increased employee entitlements. This is partly offset by the change in the provision for employee entitlements of $86 million. The increase in employee entitlements reflects movements in employee numbers and long service leave entitlements and increases due to recent wage agreements.
Table 2.2.3: Statement of Financial Position
| | Estimated as at 30 June | ||||||||||
|---|---|---|---|---|---|---|---|---|---|---|---|
| | 2001 Actual | 2002 Budget | 2002 Revised | 2003 Budget | Variation(a) | ||||||
| | ($ million) | (%) | |||||||||
| Current assets | |||||||||||
| Cash assets | 246.3 | 246.3 | 246.3 | 246.3 | — | ||||||
| Other financial assets | 464.6 | 464.6 | 464.6 | 464.6 | — | ||||||
| Receivables | 211.6 | 211.6 | 211.6 | 211.6 | — | ||||||
| Inventories | 49.0 | 49.0 | 49.0 | 49.0 | — | ||||||
| Prepayments | 23.0 | 23.0 | 23.0 | 23.0 | — | ||||||
| Other | 0.1 | 0.1 | 0.1 | 0.1 | — | ||||||
| Total current assets | 994.6 | 994.6 | 994.6 | 994.6 | 0.0 | ||||||
| Non-current assets | |||||||||||
| Receivables | 199.1 | 227.8 | 253.4 | 328.6 | 44.3 | ||||||
| Inventories | — | — | — | — | — | ||||||
| Other financial assets | 61.9 | 61.9 | 61.9 | 61.9 | — | ||||||
| Property, plant and equipment | 4 106.0 | 4 203.8 | 4 223.4 | 4 393.9 | 4.5 | ||||||
| Intangible assets | 12.5 | 12.5 | 12.5 | 12.5 | — | ||||||
| Other | 9.9 | 9.9 | 9.9 | 9.9 | — | ||||||
| Total non-current assets | 4 389.4 | 4 515.8 | 4 561.1 | 4 806.8 | 6.4 | ||||||
| Total assets | 5 384.0 | 5 510.4 | 5 555.6 | 5 801.4 | 5.3 | ||||||
| Current liabilities | |||||||||||
| Payables | 342.6 | 342.6 | 342.6 | 342.6 | — | ||||||
| Interest bearing liabilities | 10.6 | 10.6 | 10.6 | 10.6 | — | ||||||
| Provisions(b) | 447.6 | 444.0 | 453.2 | 458.9 | 3.4 | ||||||
| Other | 124.1 | 124.1 | 124.1 | 124.1 | — | ||||||
| Total current liabilities | 924.8 | 921.2 | 930.4 | 936.1 | 1.6 | ||||||
| Non-current liabilities | |||||||||||
| Interest bearing liabilities | 38.5 | 38.5 | 38.5 | 38.5 | — | ||||||
| Provisions(b) | 409.6 | 479.9 | 481.1 | 550.6 | 14.7 | ||||||
| Other | 87.3 | 87.3 | 87.3 | 87.3 | — | ||||||
| Amounts owing to other departments | 0.2 | 0.2 | 0.2 | 0.2 | — | ||||||
| Total non-current liabilities | 535.5 | 605.8 | 607.1 | 676.5 | 11.7 | ||||||
| Total liabilities | 1 460.3 | 1 527.0 | 1 537.5 | 1 612.7 | 5.6 | ||||||
| Net assets | 3 923.7 | 3 983.4 | 4 018.2 | 4 188.8 | 5.2 | ||||||
| Equity | |||||||||||
| Contributed capital | 2 786.5 | 2 866.9 | 2 892.3 | 3 042.4 | 6.1 | ||||||
| Reserves | 597.7 | 597.7 | 597.7 | 597.7 | — | ||||||
| Accumulated surplus | 539.5 | 518.9 | 528.1 | 548.7 | 5.7 | ||||||
| Total equity | 3 923.7 | 3 983.4 | 4 018.2 | 4 188.8 | 5.2 | ||||||
Source: Department of Treasury and Finance
- Note:
- (a)
- Variation between 2001-02 Budget and 2002-03 Budget.
- (b)
- Includes employee costs and superannuation
Table 2.2.4: Statement of Cash Flows
| | 2000-01 Actual | 2001-02 Budget | 2001-02 Revised | 2002-03 Budget | Variation(a) | |||||
|---|---|---|---|---|---|---|---|---|---|---|
| | ($ million) | (%) | ||||||||
| Cash flows from operating activities | ||||||||||
| Receipts from Government | 7 194.6 | 7 361.0 | 7 589.6 | 7 949.9 | 8.0 | |||||
| Receipts from other entities | 658.7 | 779.6 | 777.6 | 787.6 | 1.0 | |||||
| Payments for supplies, grants and employees | (7 289.3 | ) | (7 664.7 | ) | (7 908.3 | ) | (8 245.1 | ) | 7.6 | |
| 564.0 | 475.9 | 458.9 | 492.4 | 3.5 | ||||||
| Interest received | 37.7 | 25.0 | 35.0 | 35.0 | 40.0 | |||||
| Other revenue | 28.9 | 80.6 | 85.0 | 81.6 | 1.2 | |||||
| Capital asset charge | (297.9 | ) | (325.4 | ) | (325.4 | ) | (346.3 | ) | 6.4 | |
| Borrowing costs expense | (3.4 | ) | — | — | — | — | ||||
| Net cash inflow from operating activities | 329.2 | 256.1 | 253.5 | 262.7 | 2.6 | |||||
| Cash flows from investing activities | ||||||||||
| Payments for property, plant and equipment(b) | (571.6 | ) | (339.7 | ) | (359.3 | ) | (412.8 | ) | 21.5 | |
| Proceeds from sale of property, plant and equipment | 28.0 | 3.3 | — | — | na | |||||
| Payments for investments | — | — | — | — | — | |||||
| Proceeds from sale of business assets | — | — | — | — | — | |||||
| (Repayment of) loans by other entities | (52.3 | ) | — | — | — | — | ||||
| Net cash (outflow) from investing activities | (595.9 | ) | (336.5 | ) | (359.3 | ) | (412.8 | ) | 22.7 | |
| Cash flows from financing activities | ||||||||||
| Net Proceeds from capital contribution by State Government(b) | 359.9 | 80.4 | 105.9 | 150.1 | 86.7 | |||||
| Net proceeds of borrowings | (12.9 | ) | — | — | — | — | ||||
| Repayment of finance leases | — | — | — | — | — | |||||
| Net cash inflow (outflow) from financing activities | 347.0 | 80.4 | 105.9 | 150.1 | 86.7 | |||||
| Net increase (decrease) in cash held | 80.4 | 0.0 | 0.0 | 0.0 | — | |||||
| Cash at the beginning of the financial year | 165.9 | 246.3 | 246.3 | 246.3 | — | |||||
| Cash at the end of the financial year | 246.3 | 246.3 | 246.3 | 246.3 | 0.0 | |||||
Source: Department of Treasury and Finance
- Notes:
- (a)
- Variation between 2001-02 Budget and 2002-03 Budget.
- (b)
- 2000-01 actual includes one-off impact of the wind-up of hospital networks and the creation of new health services.
Statement of Cash Flows
Cash Flows from operating activities are consistent with the trends discussed for the Statement of Financial Performance.
Increases in payments for property, plant and equipment reflect the continued asset investment in the Department and hospitals and includes new initiatives relating to growth, infrastructure and regulatory requirements. In addition, the capital contribution by Government has increased from $80 million to $150 million reflecting this asset investment.
Administered Items Statement
Items included in the Administered Items Statement primarily comprise funding from the Commonwealth Government and fees credited to the Department. Increases relate to:
- •
- Additional funding from the Commonwealth under the Australian Health Care Agreement ($101 million) for population growth and ageing, demand growth and cost indexation.
- •
- The Fringe Benefit Tax Transitional Allowance provided by the Commonwealth Government for the transitional costs of hospitals for the revised Fringe Benefits Tax (FBT) arrangements. Under the New Tax System, the Commonwealth removed the FBT exemptions for employees of Public Benevolent Institutions. For employees of public hospitals, an FBT-free threshold replaced the exemption. An amount of $40.5 million will be received in 2002-03 as part of the Commonwealth Government's contribution over a three-year period.
Table 2.2.5: Administered Items Statement
| | 2000-01 Actual | 2001-02 Budget | 2001-02 Revised | 2002-03 Budget | Variation(a) | ||||||
|---|---|---|---|---|---|---|---|---|---|---|---|
| | ($ million) | (%) | |||||||||
| Administered revenue | |||||||||||
| Appropriations—Payments made on behalf of the State | — | — | — | — | — | ||||||
| Special appropriations | — | — | — | — | — | ||||||
| Resources received free of charge or for nominal consideration | — | — | — | — | — | ||||||
| Sale of goods and services | 167.3 | 165.4 | 180.6 | 181.9 | 10.0 | ||||||
| Commonwealth grants | 2 304.3 | 2 387.8 | 2 460.9 | 2 569.2 | 7.6 | ||||||
| Other grants | 5.8 | — | — | — | — | ||||||
| Taxes | — | — | — | — | — | ||||||
| Fines | 0.0 | — | — | — | — | ||||||
| Fees | 2.2 | 3.1 | 2.2 | 2.3 | (27.7 | ) | |||||
| Other | 5.2 | 9.0 | 12.3 | 3.3 | (63.9 | ) | |||||
| Total administered revenue | 2 484.8 | 2 565.4 | 2 655.9 | 2 756.6 | 7.5 | ||||||
| Administered expenses | |||||||||||
| Expenses on behalf of the State | 0.7 | — | — | — | — | ||||||
| Grants and other payments | — | — | — | — | — | ||||||
| Payments into the Consolidated Fund | 2 476.3 | 2 565.4 | 2 655.9 | 2 756.6 | 7.5 | ||||||
| Total administered expenses | 2 476.9 | 2 565.4 | 2 655.9 | 2 756.6 | 7.5 | ||||||
| Revenue less expenses | 7.9 | — | — | — | — | ||||||
| Administered assets | |||||||||||
| Cash assets | 1.3 | 1.3 | 1.3 | 1.3 | — | ||||||
| Receivables | 12.8 | 12.8 | 12.8 | 12.8 | — | ||||||
| Other financial assets | — | — | — | — | — | ||||||
| Inventories | — | — | — | — | — | ||||||
| Prepayments | — | — | — | — | — | ||||||
| Property, plant and equipment | — | — | — | — | — | ||||||
| Intangible assets | — | — | — | — | — | ||||||
| Other | 118.0 | 118.0 | 118.0 | 118.0 | — | ||||||
| Total administered assets | 132.0 | 132.0 | 132.0 | 132.0 | — | ||||||
| Administered liabilities | |||||||||||
| Payables | — | — | — | — | — | ||||||
| Interest bearing liabilities | 118.0 | 118.0 | 118.0 | 118.0 | — | ||||||
| Provisions | — | — | — | — | — | ||||||
| Amounts owing to other departments | — | — | — | — | — | ||||||
| Other | 3.9 | 3.9 | 3.9 | 3.9 | .. | ||||||
| Total administered liabilities | 121.9 | 121.9 | 121.9 | 121.9 | — | ||||||
Source: Department of Treasury and Finance
Authority for Resources
This section provides a summary of the sources of Parliamentary Authority available to the Department to fund the provision of outputs, payments on behalf of State and additions to the net asset base.
Table 2.2.6: Parliamentary Authority for Resources
| | 2001-02 Budget | 2001-02 Revised | 2002-03 Budget | Variation(a) | |||||
|---|---|---|---|---|---|---|---|---|---|
| | ($ million) | (%) | |||||||
| Annual appropriations(b) | 5 466.5 | 5 696.5 | 6 073.9 | 11.1 | |||||
| Receipts credited to appropriations | 884.1 | 921.1 | 944.0 | 6.8 | |||||
| Unapplied previous years appropriation | 23.2 | 40.2 | 11.1 | (52.1 | ) | ||||
| Accumulated surplus—previously applied appropriation | 38.1 | 22.9 | — | na | |||||
| Gross annual appropriation | 6 412.0 | 6 680.7 | 7 029.1 | 9.6 | |||||
| Special appropriations | 1 102.0 | 1 091.9 | 1 146.1 | 4.0 | |||||
| Trust funds | 31.8 | 30.0 | 26.6 | (16.3 | ) | ||||
| Total Parliamentary authority | 7 545.8 | 7 802.6 | 8 201.8 | 8.7 | |||||
Source: Department of Treasury and Finance
- Notes:
- (a)
- Variation between 2001-02 Budget and 2002-03 Budget.
- (b)
- 2001-02 Revised includes the impact of approved Treasurer's Advances.
PART 1: OUTLOOK AND OUTPUTS
Overview
The Department of Infrastructure (DOI) is the Government's primary agency for the strategic planning and delivery of Victoria's major infrastructure investments.
DOI supports the Ministerial portfolios of Transport, Planning, Local Government, Ports and Major Projects. The Department and its associated agencies are responsible for improving and maintaining Victoria's road and rail transport infrastructure; managing land-use planning, urban design and development and heritage protection to achieve balanced outcomes; building local government's capacity for improved governance and service delivery; growing the State's important ports and marine sectors; and effectively managing the delivery of large scale development and construction projects for the Victorian Government.
DOI aims to be a leader in policy, planning and the development of integrated infrastructure that contributes to enhancing sustainable environmental, economic and social development across the whole of Victoria.
Departmental Objectives
DOI has established the following organisational objectives, which form the basis of its Corporate Plan. These objectives, together with associated performance indicators, provide a framework for the development of each annual DOI Business Plan:
- •
- Public safety—improve transport and marine safety and reduce the incidence, severity and cost of accidents and incidents.
- •
- Regional development—enhance the potential for regional development and access to services and markets.
- •
- Seamless freight and logistics system—facilitate the development of an integrated and seamless freight and logistics system that enhances global competitiveness and meets the needs of business.
- •
- Travel mobility and access—deliver a sustainable transport system that meets people's changing access and mobility needs.
- •
- Liveable communities—enhance the liveability of communities across Victoria.
- •
- Local governance—develop a stronger and more effective local government sector in Victoria that is responsive to community expectations and provides leadership at the local level.
- •
- Infrastructure delivery and management—deliver cost effective investment in and management of infrastructure development in Victoria.
DOI has a lead role in delivering against two priority actions in the Government's Growing Victoria Together framework, including:
- •
- building faster, better, more accessible transport and communication links; and
- •
- better linking Melbourne and regional ports to industry and agricultural centres across Victoria.
The Department is also working with other agencies on joint initiatives to improve road and workplace safety, as outlined in the Growing Victoria Together framework.
2001-02 Review
The year was one of achievement and consolidation, as the Department completed the planning stages of major infrastructure projects, provided leadership in the areas of strategic planning and community consultation to inform the development of long-term strategies, and delivered a wide range of new and ongoing services within the Government's policy agenda. Key elements of this agenda include:
Linking Victoria
A forward program to upgrade Victoria's road, rail and port network in partnership with the private sector.
State Planning Agenda
Aimed at achieving a balance between economic development, social growth and cohesion and sustainability of Victoria's environment.
Best Value Victoria Framework
Aimed at assisting local government and the community to effectively interpret and implement the "Best Value' principles.
Ports Agenda 2001
Aimed at developing Victoria as the principal national centre for distribution and value-adding our international and domestic trades.
Significant achievements during 2001-02 included:
- •
- Regional Fast Rail and Spencer Street Station Redevelopment—tenders were received for the country works components of fast rail links between Melbourne and the Ballarat, Bendigo, Geelong and Latrobe Valley corridors. Orders were placed with a Melbourne company for the supply of 29 new high-speed diesel trains. Proposals for the redevelopment of Spencer Street Station—a Partnerships Victoria project—were received in early 2002.
- •
- Scoresby Integrated Transport Corridor—work commenced on the Scoresby Integrated Transport Corridor, with development of the project to enable tenders to be called. The Victorian Government secured the agreement of the Commonwealth government to provide $445 million towards the construction of the Scoresby Freeway as a Road of National Importance. The Victorian Government committed to also providing $445 million in addition to $110 million in land purchases already made.
- •
- Calder Highway Upgrade to Bendigo—the $85 million Woodend Bypass opened in December 2001 and work commenced on the Carlsruhe section.
- •
- Sydenham Rail Electrification—the $44 million project to extend the St Albans electrified train line to Sydenham was successfully completed. The new Sydenham line service features two new stations: Keilor Plains and Watergardens.
- •
- Statewide Blackspot Program—treatment works were completed on over 380 identified accident blackspots across the road network, more than half of which were in rural and regional Victoria.
- •
- Melbourne Airport Transit Link—a comprehensive patronage study and financial analysis was completed for a proposed transit link to Melbourne Airport. The results indicated that such a link would not be commercially viable for at least 10 years. The Government resolved to reserve
land for future use and not to proceed with construction at this stage. In addition, the Government proceeded with an examination of enhancement of the existing bus service.
- •
- Tram 109—work began on a series of initiatives to upgrade services along the Tram 109 route from Station Pier in Port Melbourne to Box Hill, including the construction of a tram line extension between Mont Albert and Box Hill. The first super-stops were created, with raised platforms and ramps to improve passenger access, and the first of 36 low floor trams were introduced by Yarra Trams.
- •
- ResCode—the new ResCode provisions for residential development were introduced across Victoria in August 2001, and have been well received by key stakeholders.
- •
- Pride of Place Program—25 projects, aimed at revitalising selected rural and urban centres, were initiated during the year.
- •
- Rural and Regional Mayors Summit—the 2nd annual Summit was held in September 2001 to discuss issues of importance to rural and regional Victoria.
- •
- Review of Port Reform—this independent review examined the results of earlier port reforms and the effectiveness of current institutional and governance arrangements in the Victorian ports sector. It was completed on schedule and work commenced on the staged implementation of agreed Port Reform directions.
- •
- Recreational Boat Operator Licensing—the new boat operator licensing system became law in February 2002 for powered recreational boat operators under the age of 21, and all jetski riders. Boat operators over 21 years of age have until February 2003 to obtain licences.
During 2001-02 DOI prepared several major strategies that will direct infrastructure planning and investment decisions in the long-term. These include:
Metropolitan Strategy
The Draft Metropolitan Strategy was prepared after two rounds of consultation with over 2000 people at public and stakeholder forums, and will be released for public comment later in 2002. The Strategy represents a 30-year action plan to guide the development of Melbourne and its relationship with regional Victoria.
Freight and Logistics Strategy
The Draft Strategy is due for release later in 2002 and identifies initiatives to enhance the efficiency and competitiveness of Victoria's freight and logistics sector.
Rural and Regional Strategies
A systematic approach to the development of principles for a framework for range of rural and regional land use and transport strategies throughout Victoria has resulted in: Great Ocean Road Region Strategy, North West Freight Study, Portland Access Study, Geelong Transport Strategies and the Bendigo Regional Land Use and Transport Strategy.
2002-03 Outlook
With the recent incorporation of Major Projects Victoria, DOI is currently managing approximately $5 billion worth of State Government asset investment initiatives.
In 2002-03, DOI will move into the delivery phases of key Linking Victoria projects, including:
- •
- Regional Fast Rail—successful tenders for country line works on the four regional corridors contracts will be announced in mid-2002. All work is scheduled for completion by mid-2005.
- •
- Spencer Street Station Redevelopment—construction is scheduled to begin later in 2002, and the new-look Southern Cross Station will be complete in 2005.
- •
- Rail Gauge Standardisation—the Mildura corridor will be completed by June 2003.
- •
- Country Passenger Rail Service—the Ballarat-Ararat and the Sale-Bairnsdale services will be restored by end of June 2003.
The priorities for the Major Projects portfolio in the coming year include project planning for the Melbourne 2006 Commonwealth Games Athletes' Village, the Melbourne Sports and Aquatic Centre Stage 2, the Australian Synchrotron, the Royal Melbourne Agricultural Showgrounds Redevelopment and an historical interpretation centre for the former Bonegilla Migrant Settlement Camp. These are in addition to existing projects, such as the State Library Stage 3 and the redevelopment of the National Gallery of Victoria.
A joint focus of the Transport and Planning portfolios will be the release of the Draft Metropolitan Strategy for public discussion and consultation. Funding is also provided to commence work on the Transit Cities program. The program aims to locate new land use development, particularly housing, around key public transport interchanges in selected metropolitan areas.
The Planning portfolio will continue to deliver high quality and efficient land use management practices through the State Planning Agenda. Another round of grants for the successful Pride of Place program will be released and the program to preserve Victoria's heritage assets will continue.
Continuing to improve the governance and infrastructure management capability of municipalities will underpin the activities of the Local Government portfolio, in line with the now well-established Best Value principles. Grant monies will be allocated for upgrading public library services and regular local government discussion and strategic planning forums will be conducted.
In addition to delivering committed projects such as Regional Fast Rail and the Spencer Street Station redevelopment, the Transport portfolio will focus on providing new and improved rail and road transport services into Melbourne's growth corridors. New metropolitan bus services have been funded to keep pace with the demands of rapid urban growth, and existing metropolitan bus, tram and train services will be upgraded as part of the Linking the Suburbs Strategy.
Work will commence on the extension of the electrified metropolitan rail service from Broadmeadows to Craigieburn, the extension of the tram service from Burwood East to Vermont South, and the operation of enhanced bus services to the Knox Activity Centre. Implementation of Scoresby Integrated Transport Corridor initiatives will progress to the call for tenders. Improvements have also been funded for a number of outer suburban roads in Melbourne's growth corridors
The upgrade of the Calder Freeway will continue with the Carlsruhe section in progress, and work will commence on the Kyneton to Faraday section subject to matching funding from the Commonwealth Government for this Road of National Importance. Additional funding has been allocated from the Better Roads Victoria Trust Fund to upgrade sections of Bayside Road, Geelong, the Maroondah Highway between Healesville and Narbethong, Wallan Overpass, Wallan and the Henty Highway near Heywood and Cherrypool so as to significantly improve freight access to the Port of Portland.
Funding has also been provided for a major upgrade of the railway line between Melbourne and Warrnambool, to improve travel times and ride quality for passengers travelling on this important intercity rail service.
A number of road and motorcycle safety initiatives have been funded in line with the Government's arrive alive! campaign, including the installation of red light/speed detection cameras at selected intersections, and the erection of median barriers on the Monash Freeway.
Improving the efficiency and competitiveness of Victoria's freight and logistics sector and achieving a greater mode share for port-related rail freight, will continue to be key priorities for the Ports portfolio. These priorities underpin the Draft Freight and Logistics Strategy which will be released for stakeholder comment during 2002.
Work will commence on the provision of a dual gauge rail connection to Lascelles Wharf in Geelong, and detailed investigations will be undertaken into the environmental, economic and technical aspects of deepening shipping channels into the Port of Melbourne.
Output Information
The new output, Major Public Construction and Land Development, has been added into the renamed Metropolitan Transport Infrastructure and Public Development Projects section. This follows the transfer of Major Projects Victoria from the former Department of State and Regional Development to DOI. Also, the output Research and Forecasting Information has been removed from this section. Funds previously allocated to this output have been redistributed among other output areas of the Department.
This year, the two outputs relating to the maintenance of rural, regional, and metropolitan road networks feature new road maintenance categories, performance measures and targets. These changes are an improvement on the previous measures, and reflect the Department's commitment to reviewing and improving its performance reporting practice.
The following section provides details of the outputs to be provided to Government, including their performance measures and the costs for each output. The table below summarises the total cost for outputs.
Table 2.3.1: Output summary
| | 2001-02 Budget(a) | 2001-02 Revised | 2002-03 Budget | Variation(b) | |||||
|---|---|---|---|---|---|---|---|---|---|
| | ($ million) | (%) | |||||||
| Strategic Land Use and Infrastructure Planning(c) | 8.5 | 8.9 | 9.4 | 10.9 | |||||
| Balanced Planning and Environmental Systems | 50.8 | 50.8 | 47.8 | (5.9 | ) | ||||
| Supporting Local Government | 40.5 | 42.4 | 40.5 | (0.1 | ) | ||||
| Ports and Intermodal Gateways | 20.8 | 17.6 | 24.8 | 19.2 | |||||
| Regional and Rural Transport Services | 288.7 | 294.4 | 301.6 | 4.5 | |||||
| Regional and Rural Transport Infrastructure | 380.8 | 382.1 | 394.8 | 3.7 | |||||
| Metropolitan Transport Services | 1 009.2 | 1 138.8 | 1 106.1 | 9.6 | |||||
| Metropolitan Transport Infrastructure and Public Development Projects | 424.6 | 428.7 | 424.3 | (0.1 | ) | ||||
| Transport Safety and Accessibility | 298.2 | 308.5 | 329.5 | 10.5 | |||||
| Total | 2 522.2 | 2 672.0 | 2 678.8 | 6.2 | |||||
Source: Department of Treasury and Finance
Notes:
- (a)
- 2001-02 Output Budget incorporates changes to Output structure and organisational restructuring and therefore may differ from figures published in the 2001-02 Budget.
- (b)
- Variation between 2001-02 and 2002-03 Budget.
- (c)
- 2001-02 includes the Research and Forecasting Information output.
Strategic Land Use and Infrastructure Planning
These outputs involve the planned delivery of land use and infrastructure strategies aimed to improve the economic and social capacity of Victoria. Key elements include integrated transport planning linked to regional land use development, integrated metropolitan land use and transport planning, strategies for metropolitan and rural sub-regions and development of a forward infrastructure investment strategy. They also include support and advice to the Infrastructure Planning Council.
These outputs make a significant contribution to the achievement of the following objectives:
- •
- Public Safety: Improve transport and marine safety and reduce the incidence, severity and cost of accidents and incidents;
- •
- Regional Development: Enhance the potential for regional development and access to services and markets;
- •
- Seamless Freight and Logistics Systems: Deliver an integrated and seamless freight and logistics system that enhances global competitiveness and meets the needs of business;
- •
- Travel Mobility and Access: Deliver a sustainable transport system that meets people's changing access and mobility needs;
- •
- Liveable Communities: Enhance the liveability of communities across Victoria; and
- •
- Infrastructure Delivery and Management: Deliver cost effective investment in and management of infrastructure development in Victoria.
| Major Outputs/Deliverables Performance Measures | Unit of measure | 2000-01 Actual | 2001-02 Target | 2001-02 Expected Outcome | 2002-03 Target | |||||
|---|---|---|---|---|---|---|---|---|---|---|
| Regional and Rural Strategies—Produce land use and transport strategies for regional and rural Victoria by working collaboratively across government with other development agencies and consultatively with the community to develop planning frameworks, infrastructure priorities and implementation processes. | ||||||||||
| Quantity | ||||||||||
| Regional land use and transport strategies | number | — | (a) | 1 | 1 | 3 | ||||
| Quality | ||||||||||
| Projects completed against agreed plans and timeframes | per cent | 100 | 100 | 100 | 100 | |||||
| Timeliness | ||||||||||
| Regional transport and land use strategies commenced | date | Jul 2001 | Jul 2001 | Jul 2001 | Dec 2002 | |||||
| Cost | ||||||||||
| Total output cost | $ million | 2.1 | 1.8 | 2.1 | 2.8 | |||||
Metropolitan Development Strategies—Produce land use and transport strategies for the Melbourne metropolitan area by working collaboratively across government with other development agencies and consultatively with the community to develop planning frameworks, infrastructure priorities and implementation processes. | ||||||||||
| Quantity | ||||||||||
| Long term metropolitan land use and transport strategy(b) | number | nm | nm | nm | 1 | |||||
| TravelSmart Pilot Program | number | nm | 1 | 1 | 1 | |||||
| Metropolitan sub-regional land use and transport strategies commenced | number | 2 | 2 | 2 | 2 | |||||
| Quality | ||||||||||
| Projects completed against agreed plans and timeframes | per cent | 100 | 100 | 90 | 100 | |||||
| Timeliness | ||||||||||
| Long term metropolitan land use and transport strategy draft released(b) | date | nm | nm | nm | Sept 2002 | |||||
| Metropolitan sub-regional land use and transport strategies commenced | date | nm | nm | nm | Dec 2002 | |||||
| Cost | ||||||||||
| Total output cost | $ million | 4.8 | 4.5 | 4.6 | 4.7 | |||||
Port Development Strategies—Develop, manage and monitor implementation of strategies and initiatives created to deliver government's port policy goals. These services aim to improve the policy/regulatory framework for efficient and safe operation of ports and effective medium and long term transport logistics. In addition, land use planning ensures ongoing competitiveness of these critical trade gateways. | ||||||||||
| Quantity | ||||||||||
| Port Reform(c) | per cent complete | nm | nm | nm | 50 | |||||
| Channel Deepening—detailed investigations | per cent complete | nm | nm | nm | 60 | |||||
| Quality | ||||||||||
| Projects completed against agreed plans and timeframes | per cent | 100 | 100 | 100 | 100 | |||||
| Timeliness | ||||||||||
| Channel Deepening—detailed investigations progressed to agreed stage | date | nm | nm | nm | Jun 2003 | |||||
| Cost | ||||||||||
| Total output cost | $ million | 1.9 | 1.6 | 1.6 | 1.9 | |||||
Source: Department of Infrastructure
Notes:
- (a)
- Development of the regional land use and transport strategy for the Bendigo area was delayed due to the focus on the development of integrated transport strategies (North West Freight, Portland Access Study and Geelong Transport Strategies). The Bendigo strategy, previously targeted to commence in March 2001, commenced in July 2001.
- (b)
- Draft Metropolitan Strategy: a 30-year action plan to guide the development of Melbourne and its relationship with regional Victoria.
- (c)
- Port Reform represents the implementation of agreed directions of the Port Reform Review, which was completed during 2001-02.
Balanced Planning and Environmental System
These outputs involve the provision of a world class planning system that supports development across the State in accordance with triple bottom line principles, and which is fair, transparent, accountable, cost effective and provides certainty to users. Partnerships between community, local government and business will also characterise the system.
They also involve facilitation of residential, commercial and industrial developments, and the provision of urban design, heritage, environmental assessment services and programs.
These outputs make a significant contribution to the achievement of the following objectives:
| Major Outputs/Deliverables Performance Measures | Unit of measure | 2000-01 Actual | 2001-02 Target | 2001-02 Expected Outcome | 2002-03 Target | ||||||
|---|---|---|---|---|---|---|---|---|---|---|---|
| Planning System Development—Enhance Victoria's land use, through the development of the planning system, including appropriate legislative, policy and statutory instruments. Provide approved development facilitation services. Provide reliable and authoritative advisory and support services to the Minister and users of the land use planning system. | |||||||||||
| Quantity | |||||||||||
| Major development approvals facilitated | number | nm | 5 | 6 | 5 | ||||||
| Planning practice notes prepared | number | nm | 4 | 9 | (a) | 4 | |||||
| Quality | |||||||||||
| User satisfaction with training and development under the PLANET program | per cent | 75 | 75 | 75 | 75 | ||||||
| Timeliness | |||||||||||
| Approved amendments gazetted within eight working days of approval | per cent | 100 | 80 | 100 | 100 | ||||||
| Review of Rural Zones completed | nm | nm | nm | Dec 2002 | |||||||
| Cost | |||||||||||
| Total output cost | $ million | 5.3 | 4.2 | 4.4 | 4.3 | ||||||
Planning Operations and Environmental Assessment—Provision of policy and strategic advice on the planning system. Administrative services to the Minister in his role as the responsible authority under the Planning and Environment Act 1987. Support services to State and Local Government for statutory planning functions. Provision of forecasting and monitoring information to the market on residential and industrial land supplies. | |||||||||||
| Quantity | |||||||||||
| Planning Permits issued | number | nm | 60 | 120 | 100 | ||||||
| Amendments determined | number | nm | 300 | 360 | 350 | ||||||
| Property transactions assessed | number | 882 | 700 | 750 | (b) | 700 | |||||
| Planning certificates issued | number | 55 348 | 55 000 | 60 000 | (b) | 60 000 | |||||
| Briefings, assessments and issues | number | 1 798 | 1 000 | 1 200 | 1 200 | ||||||
| Environment Effects assessments | number | 3 | 4 | 10 | (c) | 6 | |||||
| Quality | |||||||||||
| Property transactions comply with Government policy guidelines | per cent | 100 | 100 | 100 | 100 | ||||||
| Accuracy of planning certificates | per cent | nm | 100 | 100 | 100 | ||||||
| Timeliness | |||||||||||
| Permits issued within statutory timelines | per cent | nm | 98 | 98 | 98 | ||||||
| Planning certificates issued within three days | per cent | 99.6 | 98 | 98 | 98 | ||||||
| Cost | |||||||||||
| Total output cost | $ million | 18.1 | 15.8 | 15.5 | 17.2 | ||||||
Heritage Conservation—Provision of heritage policy advice to Government and its agencies and delivery of statutory obligations as defined in the Heritage Act 1995, including collection and management of heritage data and its efficient delivery to the community. Establishment of strategic partnerships with local government to assist them to meet statutory heritage obligations, and promotion of good heritage asset management. | |||||||||||
| Quality | |||||||||||
| Heritage places assessed for Heritage Register | number | 170 | 200 | 200 | 200 | ||||||
| Heritage Certificates issued | number | 3 708 | 4 000 | 4 250 | 4 500 | ||||||
| Heritage permits and consents issued | number | 508 | 550 | 550 | 575 | ||||||
| Quality | |||||||||||
| Non-contested heritage place listings | per cent | 95 | 90 | 95 | 90 | ||||||
| Appeals against permits and consents | per cent | nil | <5 | <5 | <5 | ||||||
| Timeliness | |||||||||||
| Public owned heritage restoration projects completed against agreed budgets and timeframes | per cent | 100 | 100 | 100 | 100 | ||||||
| Cost | |||||||||||
| Total output cost | $ million | 17.3 | 12.6 | 12.5 | 10.9 | ||||||
Regional and Urban Amenity Initiatives—Facilitate transit orientated developments, Pride of Place and major civic projects. Provide urban design support for planning policy implementation, local government project initiatives, area improvement programs to deliver improvements in rural townships, and the property development industry through the enhancement of tools, processes, and practices. | |||||||||||
| Quantity | |||||||||||
| Area improvement projects | number | nm | 5 | 2 | 3 | ||||||
| Transit orientated development projects facilitated | number | nm | 5 | 8 | 5 | ||||||
| Pride of Place projects facilitated | number | 37 | 25 | 25 | 25 | ||||||
| Quality | |||||||||||
| Stakeholder satisfaction with Pride of Place projects | per cent | 85 | 80 | 90 | — | (d) | |||||
| Timeliness | |||||||||||
| Area improvement (five) projects proposed | date | nm | May 2002 | May 2002 | Jun 2003 | ||||||
| Pride of Place projects completed against agreed budgets and timeframes | per cent | 100 | 95 | 95 | 95 | ||||||
| Cost | |||||||||||
| Total output cost | $ million | 15.4 | 12.6 | 12.7 | 9.6 | ||||||
Environmental Strategies and Initiatives—Provide advice and support services on environmental assessment policies and processes and review related legislation and regulations. It delivers a statewide information service for local government, State agencies, industry and private sector users of the environmental and land use planning system. Also covered under this service is the marine pollution response capacity of Victoria for oil spills. | |||||||||||
| Quantity | |||||||||||
| Production of guidelines for environmental assessment under the Planning and Environment Act 1987 and Environment Effects Act 1978 | number | — | 1 | 1 | 1 | ||||||
| Oil pollution response capability to react within 4 hours of reporting for small spills | per cent coastal coverage | 100 | 100 | 100 | 100 | ||||||
| Noise barriers retro-fitted | km | 4.8 | 1.5 | 1.5 | — | ||||||
| Quality | |||||||||||
| Guidelines completed within agreed plans and timeframes | date | nm | Jan 2002 | Apr 2002 | Jun 2003 | ||||||
| Reported oil pollution incidents responded to and resolved | per cent | 100 | 100 | 100 | 100 | ||||||
| Projects delivered in accordance with agreed scope and standards | per cent | nm | 100 | 100 | 100 | ||||||
| Timeliness | |||||||||||
| Environment Effects Act 1978 guidelines issued | date | nm | Jan 2002 | Apr 2002 | (e) | Jun 2003 | |||||
| Programmed works completed within agreed timeframes | per cent | nm | 100 | 100 | 100 | ||||||
| Cost | |||||||||||
| Total output cost | $ million | 4.8 | 5.6 | 5.7 | 5.8 | ||||||
Source: Department of Infrastructure
Notes:
- (a)
- Increase due to the release of ResCode.
- (b)
- The number of planning certificates issued from year to year is influenced by the economy and the state of the housing industry.
- (c)
- The unusually high number of Environment Effects Statements related to energy pipeline projects.
- (d)
- This measure is not applicable for 2002-2003. Satisfaction surveys are conducted at the conclusion of each Pride of Place Program cycle.
- (e)
- A delay has occurred in the execution of this timeliness measure due to additional time taken to consult with stakeholders and progress the project through the necessary bodies outside the Department.
Supporting Local Government
These outputs ensure that there is an effective and accountable system of local government, which is based on good governance, quality services, effective infrastructure, management and community accountability. Delivery of outputs requires constructive intra-government relations and co-ordination to deliver on common outcomes.
These outputs make a significant contribution to the achievement of the following objectives:
- •
- Local Governance: Develop a stronger and more effective local government sector in Victoria that is responsive to community expectations and provides leadership at the local level.
- •
- Liveable Communities: Enhance the liveability of communities across Victoria; and
- •
- Infrastructure Delivery and Management: Deliver cost effective investment in and management of infrastructure development in Victoria.
| Major Outputs/Deliverables Performance Measures | Unit of measure | 2000-01 Actual | 2001-02 Target | 2001-02 Expected Outcome | 2002-03 Target | |||||
|---|---|---|---|---|---|---|---|---|---|---|
| Local Government Sector Development—Provide support for enhancing the performance of local government by building and sustaining an effective partnership between State and local government. Develop in consultation with the local government sector, initiatives aimed at ensuring best value and continuous improvement in service delivery, sustainability of infrastructure support, community accountability, performance measurement, and the ongoing monitoring of compliance with National Competition Policy (NCP) requirements. | ||||||||||
| Quantity | ||||||||||
| Review Councils' compliance with National Competition Policy | number | nm | 78 | 78 | 78 | |||||
| Best Value principles implementation | ||||||||||
| • Councils meet established requirements | per cent | 100 | 100 | 100 | 100 | |||||
| Quality | ||||||||||
| Councils meet Performance Measurement and Management Reporting System requirements | per cent | nm | 100 | 100 | 100 | |||||
| Councils complying with National Competition Policy requirements | per cent | 100 | 100 | 100 | 100 | |||||
| Meetings held by Best Value Commission with Councils | number | nm | 6 | 4 | 4 | |||||
| Cost | ||||||||||
| Total output cost | $ million | 2.1 | 2.5 | 3.0 | 2.3 | |||||
Governance Support—Provide support for monitoring and advice on good governance practices, electoral boundaries, institutional frameworks and legislation, including the effective administration of the Local Government Act 1989. Assist Local Government's financial performance to ensure sound fiscal management. | ||||||||||
| Quantity | ||||||||||
| Councils with properly structured and functioning audit committees | per cent | 96 | 100 | 100 | 100 | |||||
| Quality | ||||||||||
| Legislative framework for the Local Government Act 1989 to agreed standards | per cent | 75 | 100 | 100 | 100 | |||||
| Timeliness | ||||||||||
| Council annual reports lodged within statutory timeframes | per cent | 94 | 100 | 100 | 100 | |||||
| Cost | ||||||||||
| Total output cost | $ million | 2.2 | 2.0 | 2.0 | 2.2 | |||||
Grants Funding for Public Libraries and Other Local Government Services—Deliver support services to the Victoria Grants Commission to facilitate the allocation of general-purpose grants and local road grants to Victorian councils and administer allocations from the Better Roads Victoria Trust for local road projects. Independently of the Commission administer the grants made for specialist programs delivering public library services, beach cleaning, interpreting and translation services. | ||||||||||
| Quantity | ||||||||||
| Funding and service agreements for public library services reviewed and updated | number | 44 | 44 | 44 | 44 | |||||
| Funding administered for library construction or refurbishment: | ||||||||||
| • Projects funding completed | number | 10 | 10 | 10 | ||||||
| Road assistance grants announced | number | 27 | 25 | 25 | 34 | |||||
| Quality | ||||||||||
| Stakeholder satisfaction with grants administration | per cent | 80 | 85 | 85 | 85 | |||||
| Timeliness | ||||||||||
| Projects delivered in accordance with agreed scope and timelines | per cent | nm | 100 | 100 | 100 | |||||
| Cost | ||||||||||
| Total output cost | $ million | 33.6 | 36.0 | 37.4 | 36.0 |
Source: Department of Infrastructure
Ports and Intermodal Gateways
These outputs involve initiatives to improve the efficiency of the transport system by addressing the interfaces of different components of this multi-facetted system. They cover the connections between ports, rail and road transport and airports in metropolitan, regional and rural Victoria.
These outputs make a significant contribution to the achievement of the following objectives:
- •
- Seamless Freight and Logistics Systems: Deliver an integrated and seamless freight and logistics system that enhances global competitiveness and meets the needs of business;
- •
- Travel Mobility and Access: Deliver a sustainable transport system that meets people's changing access and mobility needs;
- •
- Liveable Communities: Enhance the liveability of communities across Victoria; and
- •
- Infrastructure Delivery and Management: Deliver cost effective investment in and management of infrastructure development in Victoria.
| Major Outputs/Deliverables Performance Measures | Unit of measure | 2000-01 Actual | 2001-02 Target | 2001-02 Expected Outcome | 2002-03 Target | ||||||
|---|---|---|---|---|---|---|---|---|---|---|---|
| Ports and Intermodal Freight—Supply services to initiate, develop, manage and monitor a range of infrastructure strategies and projects designed to promote efficient seamless transfers between road, rail and sea modes and to reduce costs to shippers. | |||||||||||
| Quantity | |||||||||||
| Geelong Port Rail Access (Lascelles Wharf) | per cent | nm | nm | nm | 100 | ||||||
| Freight and Logistics Strategy completed | per cent | nm | nm | nm | 100 | ||||||
| Melbourne Freight Hub Masterplan completed | per cent | nm | nm | nm | 100 | ||||||
| Quality | |||||||||||
| Projects completed in accordance with agreed project specification | per cent | 97.5 | 100 | 100 | 100 | ||||||
| Timeliness | |||||||||||
| Projects completed within agreed timeframes | per cent | nm | nm | nm | 100 | ||||||
| Cost | |||||||||||
| Total output cost | $ million | 2.4 | 2.0 | 2.1 | 2.2 | ||||||
Passenger Interchange Development—Deliver improved accessibility and ease of use of road, rail, sea passengers, and air travel interchange facilities for the community that will encourage mobility and sustained growth in the utilisation of the State's transport infrastructure by domestic and international travellers. This output is delivered through a combination of government and private operator resources. | |||||||||||
| Quantity | |||||||||||
| Cruise ship visits | number | 19 | 23 | 31 | 25 | (a) | |||||
| Cruise ship days in port | number | nm | nm | 35 | 28 | ||||||
| Cruise ship visitor days | number | nm | 38 700 | 55 000 | 39 200 | ||||||
| Redevelopment of Spencer Street Station (Partnership Victoria) | per cent complete | nm | nm | nm | 25 | ||||||
| Rural modal interchange upgrade program implementation | per cent complete | 25 | 60 | 60 | 80 | ||||||
| Metropolitan modal interchange upgrade program implementation | per cent complete | 25 | 60 | 60 | 100 | ||||||
| Quality | |||||||||||
| Projects completed against agreed plans and timeframes | per cent | 50 | 100 | 100 | 100 | ||||||
| Timeliness | |||||||||||
| Redevelopment of Spencer Street Station: | |||||||||||
| • Construction commenced | date | nm | nm | nm | Sept 2002 | ||||||
| Cost | |||||||||||
| Total output cost | $ million | 14.4 | 18.8 | 15.5 | 22.6 |
Source: Department of Infrastructure
Note:
- (a)
- An extra eight cruise ships called in Melbourne during the 2001-02 season than forecast at the beginning of the season. The 2002-03 target is based on current forecasts for the new season.
Regional and Rural Transport Services
These outputs involve the delivery of quality public transport services to regional and rural areas of Victoria through contractual arrangements with private operators. These services include intrastate and interstate rail services, route and school bus services. Contracts with private operators are managed to ensure that service provision is in accordance with contractually agreed standards and that committed investment levels for rolling stock and new buses are delivered.
These outputs make a significant contribution to the achievement of the following objectives:
- •
- Regional Development: Enhance the potential for regional development and access to services and markets;
- •
- Travel Mobility and Access: Deliver a sustainable transport system that meets people's changing access and mobility needs;
- •
- Liveable Communities: Enhance the liveability of communities across Victoria; and
- •
- Infrastructure Delivery and Management: Deliver cost effective investment in and management of infrastructure development in Victoria.
| Major Outputs/Deliverables Performance Measures | Unit of measure | 2000-01 Actuals | 2001-02 Target | 2001-02 Expected Outcome | 2002-03 Target | ||||||
|---|---|---|---|---|---|---|---|---|---|---|---|
| Country/Interstate Rail Services—Manage the contractual arrangements with private operators for the delivery of quality rail passenger and associated road coach services to regional and rural areas of Victoria. Contractual performance standards are reflected in the performance measures for the delivery of the output. | |||||||||||
| Quantity | |||||||||||
| Total kilometres timetabled | million | 11.2 | 11.0 | 11.4 | 11.2 | ||||||
| Services delivered | per cent | 99.7 | 99.5 | 99.6 | 99.6 | ||||||
| Maintain freight gates for the provision of Fast Track and Charity Services | number of locations | 30 | 30 | 28 | 28 | ||||||
| Quality | |||||||||||
| Customer satisfaction threshold | score | 80.2 | 75.0 | 75.0 | 76.0 | ||||||
| Services arriving at destination no more than 59 seconds before and less than 5 minutes 59 seconds after timetable | per cent | 92.7 | 92.0 | 93.5 | 93.5 | ||||||
| Passengers carried | million | 8.5 | 8.7 | 8.5 | (a) | 8.2 | (a) | ||||
| Rolling stock plans provided and agreed | per cent | 100 | 100 | 100 | 100 | ||||||
| Number of claims against total Fast Track consignments | per cent | 0.3 | 0.4 | 0.4 | 0.4 | ||||||
| Cost | |||||||||||
| Total output cost | $ million | 113.8 | 122.3 | 127.7 | 117.3 | ||||||
Country Bus Services—Manage the contractual arrangements with private operators for the delivery of bus services in accordance with the contractual service standards and implement initiatives for new rural bus services, air conditioning and lowering rural student fares to a statewide standard of 50 per cent of the adult fare. | |||||||||||
| Quantity | |||||||||||
| Total kilometres timetabled | million | 17 | 17 | 17 | 17.3 | (b) | |||||
| Timetabled Bus Services delivered | per cent | 99.9 | 99 | 99 | 99 | ||||||
| Quality | |||||||||||
| Passengers carried | million | 11.5 | 11.5 | 11.5 | 11.7 | ||||||
| Air conditioned buses in service | per cent | 4.9 | 16 | 11.5 | 17 | ||||||
| Timeliness | |||||||||||
| Services within 5 minutes of timetable | per cent | 99.2 | 95 | 95 | 95 | ||||||
| Cost | |||||||||||
| Total output cost | $ million | 38.5 | 41.5 | 41.5 | 48.2 | ||||||
School Bus Services—Manage the contractual arrangements with private operators for the delivery of bus services in accordance with the contract service standards and implement approved initiatives for School Bus Services including two-way emergency communication, air conditioning on bus replacements, flashing lights, and first aid kits and training. | |||||||||||
| Quantity | |||||||||||
| Kilometres scheduled | million | 33.4 | 33.4 | 33.4 | 33.4 | ||||||
| Timetabled bus services delivered | per cent | 100 | 99 | 99 | 99 | ||||||
| Quality | |||||||||||
| Air-conditioned school buses in service | per cent | 6.3 | 10.6 | 11.9 | 17.5 | ||||||
| School bus safety program delivered—interchange upgrade | per cent | 48 | 60 | 60 | 80 | ||||||
| Safety Program—communications/flashing lights | per cent | nm | 90 | 90 | 98 | ||||||
| Timeliness | |||||||||||
| Services within 5 minutes of timetable | 100 | 99 | 99 | 99 | |||||||
| Cost | |||||||||||
| Total output cost | $ million | 120.5 | 125.0 | 125.2 | 136.1 | ||||||
Source: Department of Infrastructure
Notes:
- (a)
- Extension of electrified metropolitan train network to Sydenham results in a transfer of passengers from this output to the Metropolitan Train Service output.
- (b)
- The target provided is an estimate, as the specification of kilometres associated with new country bus services have yet to be determined.
Regional and Rural Transport Infrastructure
These outputs involve the development and maintenance of regional and rural transport networks by implementing major road projects, regional and rural rail projects and monitoring the quality of rail infrastructure as defined in the contracts with private operators. They facilitate the movement of goods and passengers in an efficient and timely manner.
These outputs make a significant contribution to the achievement of the following objectives:
- •
- Public Safety: Improve transport and marine safety and reduce the incidence, severity and cost of accidents and incidents;
- •
- Regional Development: Enhance the potential for regional development and access to services and markets;
- •
- Seamless Freight and Logistics Systems: Deliver an integrated and seamless freight and logistics system that enhances global competitiveness and meets the needs of business;
- •
- Travel Mobility and Access: Deliver a sustainable transport system that meets people's changing access and mobility needs;
- •
- Liveable Communities: Enhance the liveability of communities across Victoria; and
- •
- Infrastructure Delivery and Management: Deliver cost effective investment in and management of infrastructure development in Victoria.
| Major Outputs/Deliverables Performance Measures | Unit of measure | 2000-01 Actuals | 2001-02 Target | 2001-02 Expected Outcome | 2002-03 Targets | |||||
|---|---|---|---|---|---|---|---|---|---|---|
| Regional Public Transport Passenger and Freight Development—Ensure delivery of the Government's commitment to regional and rural transport infrastructure development and monitor the quality of rail infrastructure as set out in the contracts with the private operators. | ||||||||||
| Quantity | ||||||||||
| Projects continuing in 2002-2003: | number | nm | nm | nm | 4 | |||||
| • Re-opening of Mildura, Bairnsdale, Ararat and Leongatha Country rail lines | ||||||||||
| • Regional Fast Rail Infrastructure | ||||||||||
| • Wodonga Rail Bypass | ||||||||||
| • Rail Gauge Standardisation | ||||||||||
| Quality | ||||||||||
| Ensure that Freight Australia measure Track Ride Quality Index (passenger lines only) | number times per year | 4 | 4 | 4 | 4 | |||||
| Ensure that Freight Australia meet Ride Quality specification on all passenger lines | per cent compliance | 100 | 100 | 100 | 100 | |||||
| Timeliness | ||||||||||
| Projects provided within agreed budget and timeframes (where Government funded) | per cent | 100 | 100 | 100 | 100 | |||||
| Cost | ||||||||||
| Total output cost | $ million | 19.0 | 32.3 | 25.3 | 38.5 | |||||
Major Regional Road Projects—Reduce travel time, lower transport operating costs, and upgrade the quality of roads with respect to safety and increased access through improved road transport links and the completion of major highway projects to regional centres. | ||||||||||
| Quantity | ||||||||||
| Projects commencing: | number | nm | 1 | 1 | (a) | 1 | ||||
| • Calder Highway (Kyneton-Faraday section) | ||||||||||
| Projects continuing: | number | 5 | 4 | 4 | 3 | |||||
| • Calder Highway (Carlsruhe) | ||||||||||
| • Calder Highway (Kyneton-Faraday) | ||||||||||
| • Hume Highway (Albury-Wodonga Bypass) | ||||||||||
| Projects to be completed: | number | nm | 1 | 1 | 2 | |||||
| • Geelong Road | ||||||||||
| • Goulburn Valley Highway (Murchison East) | ||||||||||
| Timeliness | ||||||||||
| Programmed works >$5m completed on time | per cent | 100 | 100 | 100 | 100 | |||||
| Cost | ||||||||||
| Total output cost | $ million | 71.1 | 65.0 | 65.0 | 64.2 | |||||
Regional Arterial Road Links—Reduce travel time, lower transport operating costs, and upgrade the quality of roads with respect to safety, and increased access by adding new roads and paving, strengthening bridges, and intersection improvements and road realignment, completing regional arterial road projects and improving road transport links to regional and rural centres. | ||||||||||
| Quantity | ||||||||||
| Road projects covering duplications and overtaking lanes | ||||||||||
| • Projects completed | km | 17.1 | 12.1 | 10.8 | 6.4 | |||||
| • Projects in progress | km | 2.8 | — | 6.4 | — | |||||
| • Projects commencing | km | 3.3 | 6.4 | 9.1 | — | |||||
| Bridge strengthening and replacement | ||||||||||
| • Projects completed | number | 40 | 27 | 25 | 21 | |||||
| • Projects in progress | number | 8 | 5 | 4 | 5 | |||||
| • Projects commencing | number | 25 | 3 | 21 | 22 | |||||
| Pavement widening (including shoulders) | ||||||||||
| • Projects completed | km | 76.4 | 43.3 | 54.4 | — | |||||
| • Projects in progress | km | 86.5 | 15 | — | — | |||||
| Road improvements (including intersections and realignments) | ||||||||||
| • Projects completed | number | 12 | — | 32 | 30 | |||||
| • Projects in progress | number | 8 | 6 | 8 | 4 | |||||
| • Projects commencing | number | 1 | 22 | 32 | 26 | |||||
| Quality | ||||||||||
| Projects delivered in accordance with the agreed scope and standards | per cent | 100 | 100 | 100 | 100 | |||||
| Timeliness | ||||||||||
| Projects delivered in accordance with Government approved program | per cent | nm | 100 | 100 | 100 | |||||
| Cost | ||||||||||
| Total output cost | $ million | 57.9 | 132.2 | 139.6 | 135.8 | |||||
Regional Road Network Maintenance(b)—Provision of maintenance for declared rural arterial roads, including pavement, bridges, roadside, and traffic facilitation components, covering routine and periodic maintenance, rehabilitation, and operational supervision of tasks/projects. | ||||||||||
| Quantity | ||||||||||
| Lane—km of network maintained | km | nm | nm | 40 160 | 40 200 | |||||
| Sq metres resurfaced | (000m2) | nm | nm | 14 070 | 11 700 | |||||
| Bridges treated (Periodic Maintenance and Rehabilitation) | number | nm | nm | 245 | 275 | |||||
| Quality | ||||||||||
| Network to intervention levels | per cent | nm | nm | 90 | 90 | |||||
| Network >4.2 IRI | per cent | nm | nm | 10.7 | 10.6 | |||||
| Network >5.3 IRI | per cent | nm | nm | 2.8 | 2.7 | |||||
| Smooth travel exposure | per cent | nm | nm | 92 | 92 | |||||
| Bridges mass limited | per cent | nm | nm | 4 | 3 | |||||
| Bridges with level 4 defects | per cent | nm | nm | 3.5 | 3.4 | |||||
| Timeliness | ||||||||||
| Annual program completed | per cent | nm | nm | 100 | 100 | |||||
| Cost | ||||||||||
| Total output cost | $ million | 134.8 | 151.3 | 152.1 | 156.3 | |||||
Source: Department of Infrastructure
Notes:
- (a)
- Planning study complete. Construction anticipated to commence in 2002-03 subject to Commonwealth matching funding.
- (b)
- The total area to be resurfaced will reduce in 2002-03, due to a change in emphasis from periodic surface treatments to more intensive, longer-lasting rehabilitation works.
- (c)
- Percentage of travel undertaken each year on roads with a roughness level condition > 4.2 IRI ("IRI' is the International Roughness Index. A roughness level that is less than 4.2 IRI will normally provide acceptable travel conditions; a roughness level that is greater than 5.3 IRI would provide less desirable conditions in most circumstances.
Metropolitan Transport Services
These outputs involve the delivery of a quality public transport service to the metropolitan area through contractual arrangements with private operators. These services include rail, tram and routed buses. Contracts with private operators are managed to ensure that service provision is in accordance with contractually agreed standards and that the committed investment levels for rolling stock and new buses is delivered.
These outputs make a significant contribution to the achievement of the following objectives:
- •
- Public Safety: Improve transport and marine safety and reduce the incidence, severity and cost of accidents and incidents;
- •
- Travel Mobility and Access: Deliver a sustainable transport system that meets people's changing access and mobility needs;
- •
- Liveable Communities: Enhance the liveability of communities across Victoria; and
- •
- Infrastructure Delivery and Management: Deliver cost effective investment in and management of infrastructure development in Victoria.
| Major Outputs/Deliverables Performance Measures | Unit of measure | 2000-01 Actuals | 2001-02 Target | 2001-02 Expected Outcome | 2002-03 Target | ||||||
|---|---|---|---|---|---|---|---|---|---|---|---|
| Metropolitan Train Services—Manage the contractual arrangements with private operators for the delivery of quality metropolitan train services. Contractual performance standards are reflected in the performance measures for the delivery of outputs. | |||||||||||
| Quantity | |||||||||||
| Total kilometres timetabled | million | 16.3 | 16.6 | 16.6 | (a) | 16.8 | (a) | ||||
| Services delivered | per cent | 99.4 | 99.2 | 99.4 | 99.4 | ||||||
| Quality | |||||||||||
| Customer satisfaction index(b) | score | 69.4 | 70.6 | 71.0 | 71.0 | ||||||
| Passengers carried | million | 127.9 | 131.8 | 131.9 | (a) | 133.5 | (a) | ||||
| Services arriving at destination no more than 59 seconds before and less than 5 minutes 59 seconds after timetable | per cent | 96.6 | 96.2 | 97.0 | 96.5 | ||||||
| Rolling stock plans provided and agreed | per cent | 100 | 100 | 100 | 100 | ||||||
| Cost | |||||||||||
| Total output cost | $ million | 543.5 | 506.6 | 584.1 | 560.8 | ||||||
Metropolitan Tram Services—Manage the contractual arrangements with private operators for the delivery of quality metropolitan tram services. Contractual performance standards are reflected in the performance measures for the delivery of outputs. | |||||||||||
| Quantity | |||||||||||
| Total kilometres timetabled | million | 21.3 | 22.5 | 21.4 | 22.0 | ||||||
| Service delivery | per cent | 99.3 | 98.9 | 99 | 99 | ||||||
| Quality | |||||||||||
| Customer satisfaction index(b) | score | 69.9 | 70.1 | 71.0 | 71.0 | ||||||
| Passengers carried | million | 129.4 | 134.7 | 130.6 | (c) | 132.0 | (c) | ||||
| Services completing journey | per cent | 98.5 | 97.4 | 97.1 | 97.4 | ||||||
| Services departing a monitoring point no more than 59 seconds before and less than 5 minutes 59 seconds after timetable: | |||||||||||
| • 2nd monitoring point | per cent | 92.0 | 93.8 | 95.0 | 95.0 | ||||||
| • 2nd last monitoring point | per cent | 72.7 | 74.7 | 71.0 | 72.0 | ||||||
| Rolling stock plans provided and agreed | per cent | 100 | 100 | 100 | 100 | ||||||
| Cost | |||||||||||
| Total output cost | $ million | 261.4 | 261.4 | 308.6 | 275.2 | ||||||
Metropolitan Bus Services—Manage the contractual arrangements with private operators for the delivery of quality metropolitan bus services in accordance with the contractual service standards and implementation of approved initiatives for new bus services, including new weekday evening and weekend Metropolitan bus services and air conditioning on bus replacements. | |||||||||||
| Quantity | |||||||||||
| Kilometres scheduled | million | 69.2 | 70.4 | 70.5 | 72.4 | (d) | |||||
| Timetabled bus services delivered | per cent | 99.9 | 99 | 99 | 99 | ||||||
| Quality | |||||||||||
| Customer satisfaction index(b) | score | na | 68 | 68 | 69 | ||||||
| Passengers carried | million | 92 | 92.2 | 92.2 | 92.5 | ||||||
| Air-conditioned and low floor route buses in service | per cent | 8.5 | 12.1 | 12.1 | 17.1 | ||||||
| Timeliness | |||||||||||
| Services within 5 minutes of timetable | per cent | 93.6 | 95 | 95 | 95 | ||||||
| Cost | |||||||||||
| Total output cost | $ million | 237.9 | 241.2 | 246.1 | 270.1 |
Source: Department of Infrastructure
Notes:
- (a)
- Extension of electrified metropolitan train network to Sydenham results in an increase in kilometres timetabled in this output and a transfer of passengers previously carried in the Country/Interstate Rail Services output.
- (b)
- The Director of Public Transport commissions monthly surveys of both users and non-users of public transport to measure satisfaction with services.
- (c)
- Based on 2000-01 actual patronage as supplied by franchise operators, plus 1 per cent growth.
- (d)
- The target provided is an estimate, as the specification of kilometres associated with new metropolitan bus services have yet to be determined.
Metropolitan Transport Infrastructure and Public Development Projects
These outputs involve the development and maintenance of metropolitan road networks and implementation of major civic and road projects, the management and delivery of major public construction and land development projects and development of metropolitan rail and tram infrastructure as set out in the contracts with the private operators. They provide major parts of the transport network in the metropolitan area and are aimed at facilitating the movement of goods and passengers in an efficient, timely and safe manner to their destinations.
These outputs make a significant contribution to the achievement of the following objectives:
- •
- Public Safety: Improve transport and marine safety and reduce the incidence, severity and cost of accidents and incidents;
- •
- Seamless Freight and Logistics Systems: Deliver an integrated and seamless freight and logistics system that enhances global competitiveness and meets the needs of business;
- •
- Travel Mobility and Access: Deliver a sustainable transport system that meets people's changing access and mobility needs;
- •
- Liveable Communities: Enhance the liveability of communities across Victoria; and
- •
- Infrastructure Delivery and Management: Deliver cost effective investment in and management of infrastructure development in Victoria.
| Major Outputs/Deliverables Performance Measures | Unit of measure | 2000-01 Actuals | 2001-02 Target | 2001-02 Expected Outcome | 2002-03 Target | |||||
|---|---|---|---|---|---|---|---|---|---|---|
| Metropolitan Public Transport Development—Provide enhanced transport networks planning capacity to ensure delivery of the Government's commitment for metropolitan public transport infrastructure development and to monitor the quality of rail infrastructure as set out in the contracts with the private operators. | ||||||||||
| Quantity | ||||||||||
| Franchise maintenance account funds fully allocated to defined maintenance and renewal works | per cent | 100 | 100 | 100 | 100 | |||||
| Quality | ||||||||||
| Ensure franchisees asset management plans are provided | number | 4 | 4 | 4 | 4 | |||||
| Ensure franchisee asset management reports are provided | number | 4 | 4 | 4 | 4 | |||||
| Temporary speed restrictions due to track condition in the metropolitan area no more extensive than that which existed at franchise commencement | number | 4 | 4 | 4 | 4 | |||||
| Timeliness | ||||||||||
| Feasibility studies for proposed works within agreed timeframes and budgets | per cent | 100 | 100 | 100 | 100 | |||||
| Cost | ||||||||||
| Total output cost | $ million | 24.7 | 6.4 | 10.5 | 10.3 | |||||
Major Metropolitan Road Projects—Deliver projects to improve the performance of Melbourne's arterial road network by carrying out large-scale projects addressing network discontinuities and bottlenecks aimed to improve access, decrease travel time, and reduce transport costs. | ||||||||||
| Quantity | ||||||||||
| Projects to commence: | number | — | 1 | 2 | 1 | |||||
| • Scoresby Freeway | ||||||||||
| Projects continuing: | number | 4 | 4 | 5 | 4 | |||||
| • Craigieburn Bypass | ||||||||||
| • Hallam Bypass | ||||||||||
| • Eastern Freeway extension | ||||||||||
| • Scoresby Freeway | ||||||||||
| Projects to be completed: | number | 2 | — | — | 2 | |||||
| • Geelong Road | ||||||||||
| • Eastern Freeway (park and ride) | ||||||||||
| Quality | ||||||||||
| Projects delivered in accordance with agreed scope and standards | per cent | 100 | 100 | 100 | 100 | |||||
| Timeliness | ||||||||||
| Projects delivered in accordance with Government approved program | per cent | 100 | 100 | 100 | 100 | |||||
| Cost | ||||||||||
| Total output cost | $ million | 155.7 | 105.9 | 108.7 | 108.8 | |||||
Metropolitan Arterial Road Links—Deliver projects to improve the performance of Melbourne's arterial road network by carrying out projects addressing deficiencies and bottlenecks through the provision of new link roads and intersection improvements aimed at improving access, decreasing travel time, increasing residential amenity and reducing transport costs particularly in the outer suburbs. | ||||||||||
| Quantity | ||||||||||
| Road projects covering duplications and overtaking lanes: | ||||||||||
| • Projects completed | lane km | 13.6 | 31 | 28 | 25 | |||||
| • Projects in progress | lane km | 73.4 | 45 | 47 | 26 | |||||
| • Projects commencing(a) | lane km | 12 | — | — | 3 | |||||
| Bridge Strengthening and replacement: | ||||||||||
| • Projects completed | number | 2 | 1 | 1 | 4 | |||||
| • Projects in progress | number | — | — | 2 | — | |||||
| • Projects commencing | number | 1 | 1 | 1 | 2 | |||||
| Pavement widening (including shoulders): | ||||||||||
| • Projects completed | lane km | 1.7 | — | — | — | |||||
| • Projects in progress | km | nm | 9.5 | — | — | |||||
| Road improvements (including intersections and realignments): | ||||||||||
| • Projects completed | number | 2 | 1 | 1 | 2 | |||||
| • Projects in progress | number | 2 | — | 2 | 1 | |||||
| • Projects commencing | number | 3 | — | 1 | 1 | |||||
| Quality | ||||||||||
| Projects delivered in accordance with speed scope and standards | per cent | 100 | 100 | 100 | 100 | |||||
| Timeliness | ||||||||||
| Projects delivered in accordance with Government approved program | per cent | nm | 100 | 100 | 100 | |||||
| Cost | ||||||||||
| Total output cost | $ million | 100.9 | 161.9 | 159.0 | 148.0 | |||||
Metropolitan Road Network Maintenance(a)—Provision of the annual maintenance program for declared metropolitan arterial roads, including pavement, bridges, roadside and traffic facility components, covering routine and periodic maintenance, rehabilitation and operational management tasks. | ||||||||||
| Quantity | ||||||||||
| Lane—km of network maintained | km | nm | nm | 10 460 | 10 520 | |||||
| Sq metres resurfaced | m2 ('000) | nm | nm | 2 954 | 2 500 | |||||
| Bridges treated (Periodic Maintenance and Rehabilitation) | number | nm | nm | 81 | 86 | |||||
| Quality | ||||||||||
| Network to intervention levels | per cent | nm | nm | 90 | 90 | |||||
| Network >4.2 IRI | per cent | nm | nm | 13.0 | 12.9 | |||||
| Network >5.3 IRI | per cent | nm | nm | 4.7 | 4.6 | |||||
| Smooth travel exposure(c) | per cent | nm | nm | 90 | 91 | |||||
| Bridges mass limited | per cent | nm | nm | 4.2 | 3.0 | |||||
| Bridges with level 4 defects | per cent | nm | nm | 1.4 | 1.4 | |||||
| Timeliness | ||||||||||
| Annual program completed | per cent | nm | nm | 100 | 100 | |||||
| Cost | ||||||||||
| Total output cost | $ million | 136.7 | 150.5 | 150.4 | 154.2 | |||||
Major Public Construction and Land Development—Management and delivery of nominated public construction and land development projects, the coordination of development projects and associated feasibility studies. | ||||||||||
| Quantity | ||||||||||
| Project management: | ||||||||||
| • Beacon Cove (ongoing) | number | 1 | 1 | 1 | 1 | |||||
| • Parkville (ongoing) | number | nm | nm | nm | 1 | |||||
| • Congress Centre (ongoing) | number | nm | nm | nm | 1 | |||||
| Project feasibility studies conducted | number | 8 | 5-10 | 14 | 5-10 | |||||
| Quality | ||||||||||
| Projects delivered comply with agreed plans | per cent | nm | nm | nm | 100 | |||||
| Timeliness | ||||||||||
| Hazardous Waste Siting: | ||||||||||
| • Stage 2 public consultation process commenced for soil recycling facility | date | nm | nm | nm | Jun 2003 | |||||
| • Facilitate establishment of soil recycling facility | date | nm | Jun 2002 | Dec 2002 | (c) | Dec 2002 | ||||
| Commonwealth Games Athletes' Village | ||||||||||
| • Evaluation of proposals | number | nm | nm | nm | Sept 2002 | |||||
| Bundoora Land Development: | ||||||||||
| • Opening of Stage 2 display village | date | nm | nm | nm | Dec 2002 | |||||
| Jolimont/Eastside Rationalisation Program: | ||||||||||
| • Settlement of outstanding land sales | date | nm | nm | nm | Dec 2002 | |||||
| Kensington Banks Residential Program: | ||||||||||
| • Sale of final land parcels | date | nm | nm | nm | Dec 2002 | |||||
| Cost | ||||||||||
| Total output cost(d) | $ million | na | na | na | 3.0 | |||||
Source: Department of Infrastructure
- (a)
- The total area to be resurfaced will reduce in 2002-03, due to a change in emphasis from periodic surface treatments to more intensive, longer-lasting rehabilitation works.
- (b)
- Percentage of travel undertaken each year on roads with a roughness level condition >,4.2 IRI ("IRI" is the International Roughness Index. A roughness level that is less than 4.2 IRI will normally provide acceptable travel conditions; a roughness level that is greater than 5.3 IRI would provide less desirable conditions in most circumstances).
- (c)
- Due to a lengthy public consultation process, the timeframe for reaching a decision on the preferred site/s for a soil recycling facility has been extended.
- (d)
- Major Projects Victoria has been transferred from the former Department of State and Regional Development to the Department of Infrastructure.
Transport Safety and Accessibility
These outputs involve safety initiatives for road, public transport and waterway users. This is provided through the application of performance based standards to regulate transport providers, and to reduce cost of regulations on business, while raising safety and access levels for the community through improved transport regulation reform, education and prevention programs. It includes services to improve accessibility and subsidised taxi travel for the disabled.
These outputs make a significant contribution to the achievement of the following objectives:
- •
- Public Safety: Improve transport and marine safety and reduce the incidence, severity and cost of accidents and incidents;
- •
- Travel Mobility and Access: Deliver a sustainable transport system that meets people's changing access and mobility needs; and
- •
- Infrastructure Delivery and Management: Deliver cost effective investment in and management of infrastructure development in Victoria.
| Major Outputs/Deliverables Performance Measures | Unit of measure | 2000-01 Actuals | 2001-02 Target | 2001-02 Expected Outcome | 2002-03 Target | ||||||
|---|---|---|---|---|---|---|---|---|---|---|---|
| Taxi, Hire Car and Tow Truck Regulation—Administer, regulate and monitor taxi, hire car, special purpose vehicle, restricted hire cars, tow trucks and the driving instructor industry and ensure public transport safety standards are maintained and advanced through the implementation of new initiatives. | |||||||||||
| Quantity | |||||||||||
| Taxis audited | number | 12 641 | 13 000 | 13 000 | 13 000 | ||||||
| Tow truck licence transactions | number | 429 | 500 | 420 | 420 | ||||||
| Tow truck driver authorities issued | number | 1 085 | 1 200 | 1 100 | 1 100 | ||||||
| Commercial passenger vehicle licence applications processed: | |||||||||||
| • Taxis | number | na | na | na | 1 200 | ||||||
| • Others | number | 337 | 350 | 308 | 350 | ||||||
| Commercial passenger vehicle drivers certificates issued | number | 12 966 | 14 000 | 14 000 | 14 000 | ||||||
| Driver certificates, authorities and instructor applications: suspensions, revocations and refusals | number | nm | nm | nm | 180 | ||||||
| Driver instructor authorities processed | number | 420 | 450 | 450 | 450 | ||||||
| Quality | |||||||||||
| Taxis and tow trucks conform to quality standards | per cent | >92.5 | >94 | >94 | >94 | ||||||
| Taxi service complaints investigated | number | 332 | 320 | 600 | (a) | 600 | |||||
| Tow Truck Allocation Centre calls answered within 45 seconds | per cent | 95.35 | 96 | 96 | 96 | ||||||
| Successful criminal prosecutions | per cent | nm | nm | nm | 96 | ||||||
| Appeals dismissed: driver certificates, authorities and instructor applications | per cent | nm | nm | nm | 94 | ||||||
| Timeliness | |||||||||||
| Preliminary investigation of serious taxi service complaints completed within 10 working days | per cent | 86.75 | 88 | 87 | 88 | ||||||
| Cost | |||||||||||
| Total output cost | $ million | 3.0 | 2.4 | 2.4 | 4.0 | ||||||
Accessible Transport Initiatives—Provide access for the disabled to transport facilities by monitoring obligations under the Disability Discrimination Act 1992 (Cwth), programs of the private operators and implementation of direct government funded initiatives. This includes the Multi Purpose Taxi Program of subsidised taxi services for the disabled. | |||||||||||
| Quantity | |||||||||||
| Taxi trips | |||||||||||
| • Passenger only | number ('000) | 5 257 | 5 372 | 5 400 | 5 400 | ||||||
| • With wheelchair | number ('000) | 405 | 400 | 500 | 500 | ||||||
| Applications assessed | number | 29 908 | 26 000 | 26 000 | 26 500 | ||||||
| Customer phone enquires | number ('000) | nm | 75 | 50 | (b) | 50 | |||||
| Number of transport access sites treated | number | nm | 260 | 260 | 300 | ||||||
| Quality | |||||||||||
| Projects delivered to agreed scope or standard | per cent | 100 | 100 | 100 | 100 | ||||||
| Timeliness | |||||||||||
| Applications completed within 10 working days | per cent | 95.5 | 96 | 96 | 96 | ||||||
| Works completed within agreed timeframes | per cent | nm | 100 | 100 | 100 | ||||||
| Cost | |||||||||||
| Total output cost | $ million | 48.8 | 43.8 | 51.3 | 51.8 | ||||||
Accident Blackspots—Deliver an agreed program of remedial actions to upgrade identified high accident black spot and black length areas of roads to reduce the cause of regular severe road accidents that have high social costs to the community. | |||||||||||
| Quantity | |||||||||||
| Projects to be completed | number | 312 | 460 | 460 | 454 | ||||||
| Quality | |||||||||||
| Projects completed to agreed scope and standard | per cent | 100 | 100 | 100 | 100 | ||||||
| Timeliness | |||||||||||
| Programmed work to be completed in accordance with agreed timeframes | per cent | 100 | 100 | 100 | 100 | ||||||
| Cost | |||||||||||
| Total output cost | $ million | 32.7 | 91.8 | 92.1 | 104.0 | ||||||
Traffic and Road Use Management Improvements—To provide and undertake low cost traffic improvement projects and services including traffic priority signalling and information services, incident management, and the administration of road freight regulatory reform for greater efficiency of freight movement. | |||||||||||
| Quantity | |||||||||||
| Traffic management projects | number | 19 | 15 | 15 | 15 | ||||||
| Road user improvement projects | number | 103 | 80 | 85 | 145 | ||||||
| Quality | |||||||||||
| Projects delivered in accordance with agreed scope and standards | per cent | 100 | 100 | 100 | 100 | ||||||
| Timeliness | |||||||||||
| Program works completed with agreed timeframes | per cent | 100 | 100 | 100 | 100 | ||||||
| Cost | |||||||||||
| Total output cost | $ million | 25.9 | 23.0 | 25.3 | 22.7 | ||||||
Vehicle and Driver Regulation—Provision of a vehicle registration and driver licensing service to provide a framework covering the integrity of the road user environment, ensuring the registration of trained drivers, road worthy vehicles, and the ability to easily trace missing vehicles. | |||||||||||
| Quantity | |||||||||||
| New driver licences issued | number ('000) | 101 | 103.3 | 100 | 103 | ||||||
| Driver licences renewed | number ('000) | 299 | 473 | 473 | 485 | ||||||
| New vehicle registrations issued | number ('000) | 449 | 425 | 445 | 451 | ||||||
| Vehicle registrations renewed | number ('000) | 3 665 | 3 853 | 3 860 | 3 905 | ||||||
| Vehicle registration transfers | number ('000) | 822 | 849 | 872 | 873 | ||||||
| Vehicle and driver information requests processed | number ('000) | 1 441 | 1 541 | 1 555 | 1 555 | ||||||
| Quality | |||||||||||
| User satisfaction with registration and licensing | per cent | 95 | >90 | >90 | >90 | ||||||
| Currency of registration and licensing records | per cent | 99 | >99 | 99 | 99 | ||||||
| Timeliness | |||||||||||
| Customers served within 10 minutes in licensing and registration offices | per cent | 83 | >80 | 84 | >80 | ||||||
| Average time to answer central calls | seconds | 28 | <30 | 28 | <30 | ||||||
| Total output cost | $ million | 77.8 | 77.9 | 77.9 | 87.6 | ||||||
Road Safety Initiatives and Regulation—Provision of a safety program that embraces two main areas, road user education and the upgrading of aspects of the road infrastructure system that have proved dangerous. | |||||||||||
| Quantity | |||||||||||
| Road Safety Projects | number | 131 | 132 | 132 | 66 | (c) | |||||
| Quality | |||||||||||
| Projects completed within specified scope and standards | per cent | 100 | 100 | 100 | 100 | ||||||
| Timeliness | |||||||||||
| Programmed works completed within agreed timeframes | per cent | 100 | 100 | 100 | 100 | ||||||
| Cost | |||||||||||
| Total output cost | $ million | 40.6 | 46.4 | 46.4 | 45.8 | ||||||
Public Transport Safety Initiatives and Regulation—Maintain and advance public transport safety standards through the implementation of new initiatives and operator accreditation systems. | |||||||||||
| Quantity | |||||||||||
| Safety initiatives: | |||||||||||
| • Unannounced audits | number | nm | 120 | 120 | 120 | ||||||
| • Bus mechanical inspections | number | nm | 50 | 50 | 50 | ||||||
| Quality | |||||||||||
| Audit observations closed out by next compliance audit | per cent | nm | 90 | 100 | 100 | ||||||
| Non conformances/compliances closed out within 2 months | per cent | nm | 100 | 100 | 100 | ||||||
| Material changes to accreditation responded with feedback within 2 weeks | per cent | nm | 100 | 100 | 100 | ||||||
| Timeliness | |||||||||||
| Audits carried out: | |||||||||||
| • Rail (within 12 months) | per cent | nm | 100 | 100 | 100 | ||||||
| • Bus (within 24 months) | per cent | nm | 100 | 100 | 100 | ||||||
| Follow up of critical defect notices within 5 days | per cent | nm | 90 | 90 | 90 | ||||||
| Review of responses of inquiry within 6 weeks | per cent | nm | 90 | 90 | 90 | ||||||
| Cost | |||||||||||
| Total output cost | $ million | 3.9 | 4.6 | 4.7 | 3.8 | ||||||
Marine Safety Initiatives and Regulation—Develop and administer the policy/regulatory framework for the safe and efficient operation of commercial and recreational vessels in Victorian waters and implement a range of programs and initiatives designed to achieve the Government's marine safety objectives. Facilitate the marine pollution response system and ballast water and hull fouling regime to prevent pests entering coastal waters. | |||||||||||
| Quantity | |||||||||||
| Vessel compliance with registration requirements | per cent | nm | 100 | 100 | 100 | ||||||
| All personal water craft operators and operators under 21 years licensed | per cent | nm | 100 | 100 | 100 | ||||||
| Audit compliance with Recreational Boating Regulations: | |||||||||||
| • Boats Audited | per cent | nm | 5 | 5 | 5 | ||||||
| • Waterways audited | per cent | nm | 10 | 10 | 10 | ||||||
| Commercial vessels surveyed | number | 1 226 | 1 500 | 1 500 | 1 500 | ||||||
| Marine operators certificates issued | number | 285 | 300 | 300 | 300 | ||||||
| Safety audits performed on commercial vessels | number | nm | 165 | 50 | (d) | 150 | |||||
| Quality | |||||||||||
| Projects completed against statutory requirements and specifications | per cent | 75 | 95 | 95 | 95 | ||||||
| Timeliness | |||||||||||
| Fully accessible system for Recreational Boat Operator licensing in place (all operators aged 21 years and over) | date | nm | nm | nm | 1 Feb 2003 | ||||||
| Capital grant for Boating Safety Fund Program | per cent | na | 100 | 100 | 100 | ||||||
| Cost | |||||||||||
| Total output cost | $ million | 7.8 | 8.4 | 8.4 | 9.8 |
Source: Department of Infrastructure
Notes:
- (a)
- An increase in the expected 2001-02 outcome for Taxi Service complaints against the original target is due to the implementation of a more comprehensive recording and monitoring system, set up by the Enforcement Division of the Victorian Taxi and Tow Truck Directorate.
- (b)
- A new telephone system incorporating call counting capacity was introduced in July 2001. Call numbers show that the initial estimate of 75,000 calls per annum was too high.
- (c)
- The 2002-03 target reflects the direction of funds to fewer, but larger, projects. These projects are categorised separately to projects funded under the Accident Blackspot Program.
- (d)
- Resources were redirected to the priority area of introducing a new, improved annual survey system to cover all commercial vessels during 2001-02. Safety audit levels will return to usual levels in 2002-2003.
Part 2 provides the financial statements that support the Department's provision of outputs. The information provided includes the Statement of Financial Performance, Statement of Financial Position and Statement of Cash Flows for the Department as well as authority for resources.
The total resources made available to a department are applied to three uses:
- •
- the provision of outputs;
- •
- asset investment; or
- •
- payments on behalf of the State.
The following three financial statements are presented in the format consistent with the AAS29 accounting standard. However, for the purposes of this paper they have been divided into controlled and administered items.
Administered items refer to those resources over which the Department cannot exercise direct control. Authority is provided through an appropriation for payments made on behalf of the State. Under the AAS29 standard, these items would normally appear as notes to the financial statements.
Financial Statements
The following four tables can be used to assess the Department's financial performance and use of resources.
- •
- Table 2.3.2—Statement of Financial Performance—provides details of the Department's controlled revenue and expenses on an accrual basis reflecting the cost of providing its outputs;
- •
- Table 2.3.3—Statement of Financial Position—shows all controlled assets and liabilities of the Department. The difference between these represents the net assets position, which is an indicator of the State's equity in the Department;
- •
- Table 2.3.4—Statement of Cash Flows—shows all movements of cash (cash received and paid). The cash impact of financing and investing activities on Departmental resources is highlighted in this statement; and
- •
- Table 2.3.5—Administered Items Statement—provides details of the Department's administered revenue and expenses (on an accrual basis), and its administered assets and liabilities.
Table 2.3.2: Statement of Financial Performance
| | 2000-01 Actual | 2001-02 Budget | 2001-02 Revised | 2002-03 Budget | Variation | ||||||
|---|---|---|---|---|---|---|---|---|---|---|---|
| | ($ million) | (%) | |||||||||
| Revenue from ordinary activities | |||||||||||
| Output appropriations | 2 180.6 | 2 110.8 | 2 391.2 | 2 550.1 | 20.8 | ||||||
| Special appropriations | — | — | — | — | — | ||||||
| Resources received free of charge or for nominal consideration | 5.4 | — | — | — | — | ||||||
| Sale of goods and services | 115.2 | 99.6 | 104.5 | 101.1 | 1.4 | ||||||
| Commonwealth Grants | — | 245.0 | — | — | (100.0 | ) | |||||
| Taxes (b) | 54.2 | 45.0 | 54.5 | 61.9 | 37.7 | ||||||
| Fines and Fees | 1.9 | 4.6 | 2.0 | 2.0 | (56.4 | ) | |||||
| Other revenue and revenue from other parties | 132.2 | 125.2 | 189.2 | 138.9 | 11.0 | ||||||
| 2 489.5 | 2 630.2 | 2 741.3 | 2 854.0 | 8.5 | |||||||
| Expenses from ordinary activities | |||||||||||
| Employee entitlements | 136.0 | 219.9 | 267.0 | 225.5 | 2.5 | ||||||
| Depreciation and amortisation | 228.4 | 236.2 | 232.4 | 240.1 | 1.6 | ||||||
| Resources provided free of charge or for nominal consideration | 38.9 | — | — | — | — | ||||||
| Grants and other payments | 578.1 | 573.1 | 592.0 | 581.4 | 1.4 | ||||||
| Capital asset charge | 67.4 | 84.0 | 84.0 | 104.0 | 23.8 | ||||||
| Supplies and services | 1 271.9 | 1 400.8 | 1 488.4 | 1 519.5 | 8.5 | ||||||
| Other expenses from ordinary activities | 77.1 | — | — | — | — | ||||||
| Borrowing costs(c) | 5.1 | 8.2 | 8.2 | 8.3 | 1.4 | ||||||
| 2 402.9 | 2 522.2 | 2 672.0 | 2 678.8 | 6.2 | |||||||
| Result from ordinary activities | 86.5 | 107.9 | 69.3 | 175.3 | 62.4 | ||||||
| Loss from extraordinary items | — | — | — | — | — | ||||||
| Net result for the reporting period | 86.5 | 107.9 | 69.3 | 175.3 | 62.4 | ||||||
| Net increase in asset revaluation reserve | 73.8 | — | — | — | — | ||||||
| Total revenues, expenses and revaluation adjustments recognised directly in equity | 73.8 | — | — | — | — | ||||||
| Total changes in equity other than those resulting from transactions with Victorian State Government in its capacity as owner | 160.3 | 107.9 | 69.3 | 175.3 | 62.4 | ||||||
Source: Department of Treasury and Finance
Notes:
- (a)
- Variation between 2001-02 Budget and 2002-03 Budget.
- (b)
- Taxes include Concession Fees relating to the Melbourne City Link and user charges levied by VicRoads.
- (c)
- Borrowing costs represent merchant fees payable on credit card transactions.
Statement of Financial Performance
The Department's Statement of Financial Performance for 2002-03 indicates an expected operating surplus of $175.3 million. In comparison, the 2001-02 Budget had a surplus of $107.9 million. The reasons for the higher surplus are explained below.
Total operating revenue forecast for 2002-03 exceeds the previous year's budget by $223.8 million. Commonwealth Grants, reported separately in 2001-02, are now included as part of output appropriation revenue. The increase in total output revenue is due to an increase in the contributions from the Commonwealth Government, mainly for road construction activities (including the Scoresby Freeway) together with the impact of initiatives approved in prior years and an increase in revenue to fund output initiatives in 2002-03. Major new initiatives for 2002-03 include additional bus services to meet demand pressures, additional funding for train and tram extensions under Linking the Suburbs and to address bus revenue shortfalls distributed from public transport farebox collections.
Increased operating expenditure of $156 million between budget periods is due to these expanded output initiatives and higher capital asset charges totalling $20 million in line with the increase in projected asset values.
The 2001-02 revised budget indicates a $69.3 million surplus as against an original budgeted surplus of $107.9 million. This movement is mainly explained by increased VicRoads superannuation staff entitlements expense due to a revaluation of the superannuation liability based on actuarial advice.
Statement of Financial Position
The Department's net assets increased by $191 million, or 1.2 per cent, from the 2001-01 Budget to the 2002-03 Budget. Major areas of change are:
- •
- Increased Property, Plant and Equipment and other non current financial assets of $235 million, or 1.5 per cent, mainly attributable to the construction of new roads and other infrastructure;
- •
- Liabilities associated with the provisions for staff increased by $55 million due to a revaluation of the superannuation liability for VicRoads employees based on current actuarial advice; and
- •
- An increase in non current receivables of $12.5 million mainly associated with Concession Fees relating to the City Link, which was offset by an increase in interest bearing liabilities.
Table 2.3.3: Statement of Financial Position
| | Estimated as at 30 June | ||||||||||
|---|---|---|---|---|---|---|---|---|---|---|---|
| | 2001 Actual | 2002 Budget | 2002 Revised | 2003 Budget | Variation(a) | ||||||
| | ($ million) | (%) | |||||||||
| Current assets | |||||||||||
| Cash assets | 180.3 | 181.8 | 167.1 | 172.0 | (5.4 | ) | |||||
| Other financial assets | 37.2 | 37.2 | 37.2 | 37.2 | — | ||||||
| Receivables | 54.0 | 54.0 | 64.0 | 64.0 | 18.5 | ||||||
| Inventories | 6.5 | 6.5 | 5.0 | 5.0 | (23.2 | ) | |||||
| Prepayments | 2.9 | 2.9 | 2.7 | 2.7 | (8.6 | ) | |||||
| Other | — | — | — | — | — | ||||||
| Total current assets | 280.9 | 282.4 | 276.0 | 280.9 | (0.5 | ) | |||||
| Non-current assets | |||||||||||
| Receivables | 154.7 | 167.3 | 167.3 | 179.8 | 7.5 | ||||||
| Inventories | — | — | — | — | — | ||||||
| Other financial assets | 3 249.5 | 3 422.6 | 3 321.9 | 3 396.2 | (0.8 | ) | |||||
| Property, plant and equipment | 12 307.1 | 12 462.0 | 12 507.7 | 12 723.8 | 2.1 | ||||||
| Intangible assets | 8.0 | 8.0 | 8.0 | 8.0 | — | ||||||
| Other | 0.3 | 0.3 | 0.3 | 0.3 | — | ||||||
| Total non-current assets | 15 719.7 | 16 060.3 | 16 005.2 | 16 308.2 | 1.5 | ||||||
| Total assets | 16 000.5 | 16 342.7 | 16 281.2 | 16 589.0 | 1.5 | ||||||
| Current liabilities | |||||||||||
| Payables | 272.0 | 278.3 | 263.5 | 269.5 | (3.2 | ) | |||||
| Interest bearing liabilities | — | — | — | — | — | ||||||
| Provisions(b) | 55.8 | 58.9 | 103.7 | 105.9 | 79.8 | ||||||
| Other | 22.3 | 22.3 | 22.3 | 22.4 | 0.2 | ||||||
| Total current liabilities | 350.1 | 359.5 | 389.6 | 397.8 | 10.6 | ||||||
| Non-current liabilities | |||||||||||
| Interest bearing liabilities | 53.4 | 66.1 | 66.1 | 80.0 | 20.9 | ||||||
| Provisions(b) | 468.2 | 466.5 | 471.6 | 470.3 | 0.8 | ||||||
| Other | 1.4 | 0.5 | 0.5 | (0.3 | ) | (160.0 | ) | ||||
| Amounts owing to other departments | — | — | — | — | — | ||||||
| Total non-current liabilities | 523.0 | 533.2 | 538.2 | 549.9 | 3.1 | ||||||
| Total liabilities | 873.1 | 892.7 | 927.8 | 947.7 | 6.2 | ||||||
| Net assets | 15 127.4 | 15 450.0 | 15 353.3 | 15 641.3 | 1.2 | ||||||
| Equity | |||||||||||
| Contributed capital | 14 346.8 | 14 561.4 | 14 503.4 | 14 616.1 | 0.4 | ||||||
| Reserves | 1 238.4 | 1 238.4 | 1 238.4 | 1 238.4 | — | ||||||
| Accumulated surplus | (457.8 | ) | (349.8 | ) | (388.5 | ) | (213.2 | ) | (39.1 | ) | |
| Total equity | 15 127.4 | 15 450.0 | 15 353.3 | 15 641.3 | 1.2 | ||||||
Source: Department of Treasury and Finance
Notes:
- (a)
- Variation between 2001-02 Budget and 2002-03 Budget.
- (b)
- Includes employee costs and superannuation.
Table 2.3.4: Statement of Cash Flows
| | 2000-01 Actual | 2001-02 Budget | 2001-02 Revised | 2002-03 Budget | Variation(a) | ||||||
|---|---|---|---|---|---|---|---|---|---|---|---|
| | ($ million) | (%) | |||||||||
| Cash flows from operating activities | |||||||||||
| Receipts from Government | 2 141.3 | 2 356.0 | 2 391.3 | 2 551.4 | 8.3 | ||||||
| Receipts from other entities | 212.5 | 210.1 | 241.5 | 216.3 | 3.0 | ||||||
| Payments for supplies, grants and employees | (1 943.4 | ) | (2 173.4 | ) | (2 245.5 | ) | (2 305.7 | ) | 6.1 | ||
| 410.4 | 392.6 | 387.2 | 462.1 | 17.7 | |||||||
| Interest received | 2.7 | 0.5 | 0.4 | 0.4 | (30.0 | ) | |||||
| Other revenue | 6.5 | 50.2 | 30.1 | 62.5 | 24.4 | ||||||
| Capital asset charge | (67.4 | ) | (84.0 | ) | (84.0 | ) | (104.0 | ) | 23.8 | ||
| Borrowing costs expense | (5.1 | ) | (8.2 | ) | (8.2 | ) | (8.3 | ) | 1.4 | ||
| Net cash inflow from operating activities | 347.1 | 351.2 | 325.5 | 412.6 | 17.5 | ||||||
| Cash flows from investing activities | |||||||||||
| Payments for property, plant and equipment(b) | (356.2 | ) | (564.3 | ) | (505.3 | ) | (530.5 | ) | (6.0 | ) | |
| Proceeds from sale of property, plant and equipment | 12.7 | — | 10.1 | 10.1 | — | ||||||
| Payments for investments | — | — | — | — | — | ||||||
| Proceeds from sale of business assets(c) | — | — | — | — | — | ||||||
| (Repayment of) loans by other entities | (30.2 | ) | — | — | — | — | |||||
| Net cash (outflow) from investing activities | (373.7 | ) | (564.3 | ) | (495.2 | ) | (520.4 | ) | (7.8 | ) | |
| Cash flows from financing activities | |||||||||||
| Net Proceeds from capital contribution by State Government | 87.8 | 214.6 | 156.6 | 112.7 | (47.5 | ) | |||||
| Net proceeds of borrowings | — | — | — | — | — | ||||||
| Repayment of finance leases | — | — | — | — | — | ||||||
| Net cash inflow (outflow) from financing activities | 87.8 | 214.6 | 156.6 | 112.7 | (47.5 | ) | |||||
| Net increase (decrease) in cash held | 61.2 | 1.5 | (13.2 | ) | 4.9 | 226.7 | |||||
| Cash at the beginning of the financial year | 119.1 | 180.3 | 180.3 | 167.1 | (7.3 | ) | |||||
| Cash at the end of the financial year | 180.3 | 181.8 | 167.1 | 172.0 | (5.4 | ) | |||||
Source: Department of Treasury and Finance
Notes:
- (a)
- Variation between 2001-02 Budget and 2002-03 Budget.
- (b)
- Includes payments for land held for resale and research & development costs.
- (c)
- Only included where there are significant sales items
Statement of Cash Flows
The variations in the expected cash flows between the 2001-02 Budget and the 2002-03 Budget are reflected in the Statement of Cash Flows. Major variations are due to movements in net cash inflows from operating activities which increased by $61 million between the two budget periods. This is broadly in line with the expected increase in operating surplus in the Statement of Financial Performance (Table 2.3.2) of $67 million. In addition, cash flows from controlled financing activities reduced by $102 million mainly due to a change in the accounting treatment for new assets invested between the two years that incorporated a transfer of responsibilities to administered items.
Administered Items Statement
Major variations in the administered items between the 2001-02 and 2002-03 budget relate to changes in accounting policies:
- •
- taxes received increased by $190 million, the majority of this relates to a decision for VicRoads to collect all motor vehicle stamp duty, where in the past this was collected by the State Revenue Office; and
- •
- Commonwealth Grants increased by $280 million as revenue required for National Highway and Roads of National Importance construction is now paid directly to the Department of Infrastructure administered entity. Previously it was received initially by the DOI controlled entity
Table 2.3.5: Administered Items Statement
| | 2000-01 Actual | 2001-02 Budget | 2001-02 Revised | 2002-03 Budget | Variation(a) | ||||||
|---|---|---|---|---|---|---|---|---|---|---|---|
| | ($ million) | (%) | |||||||||
| Administered revenue | |||||||||||
| Appropriations—Payments made on behalf of the State | 9.7 | 11.4 | 11.4 | 16.7 | 46.9 | ||||||
| Output Appropriation | — | — | — | — | — | ||||||
| Special appropriations | — | — | — | — | — | ||||||
| Resources received free of charge or for nominal consideration | — | — | — | — | — | ||||||
| Sale of goods and services | 1.9 | 3.3 | 3.6 | 3.7 | 12.5 | ||||||
| Commonwealth grants | 422.3 | 321.9 | 570.8 | 602.4 | 87.1 | ||||||
| Other grants | — | — | — | — | — | ||||||
| Taxes | 794.2 | 819.8 | 836.0 | 1 009.7 | 23.2 | ||||||
| Fines | 4.7 | 3.5 | 3.5 | 3.5 | — | ||||||
| Fees | 8.2 | 10.7 | 10.8 | 26.6 | 149.5 | ||||||
| Other | 20.8 | 2.5 | 14.5 | 2.8 | 10.4 | ||||||
| Total administered revenue | 1 261.9 | 1 173.1 | 1 450.5 | 1 665.4 | 42.0 | ||||||
| Administered expenses | |||||||||||
| Expenses on behalf of the State | 25.2 | 1.4 | 1.4 | 1.4 | — | ||||||
| Grants and other payments | 322.7 | 332.0 | 378.7 | 350.7 | 5.6 | ||||||
| Payments into the Consolidated Fund | 944.3 | 840.1 | 1 105.8 | 1 313.7 | 56.4 | ||||||
| Total administered expenses | 1 292.3 | 1 173.5 | 1 485.9 | 1 665.8 | 42.0 | ||||||
| Revenue less expenses | (30.4 | ) | (0.3 | ) | (35.4 | ) | (0.3 | ) | — | ||
| Administered assets | |||||||||||
| Cash assets | 6.5 | 6.5 | 6.5 | 6.5 | (0.1 | ) | |||||
| Receivables | 4.1 | 3.9 | 3.9 | 3.7 | (5.2 | ) | |||||
| Other financial assets | 35.1 | 35.1 | — | — | (100.0 | ) | |||||
| Inventories | — | — | — | — | — | ||||||
| Prepayments | — | — | — | — | — | ||||||
| Property, plant and equipment | — | (0.1 | ) | (0.1 | ) | (0.3 | ) | 100.0 | |||
| Intangible assets | — | — | — | — | — | ||||||
| Other | — | — | — | — | — | ||||||
| Total administered assets | 45.6 | 45.3 | 10.2 | 9.8 | (78.3 | ) | |||||
| Administered liabilities | |||||||||||
| Payables | 5.3 | 5.3 | 5.3 | 5.3 | — | ||||||
| Interest bearing liabilities | — | — | — | — | — | ||||||
| Provisions | — | — | — | — | — | ||||||
| Amounts owing to other departments | — | — | — | — | — | ||||||
| Other | 93.1 | 93.1 | 93.1 | 93.1 | — | ||||||
| Total administered liabilities | 98.3 | 98.3 | 98.3 | 98.3 | — | ||||||
Source: Department of Treasury and Finance
Note:
Authority for Resources
This section provides a summary of the sources of Parliamentary Authority available to the Department to fund the provision of outputs, payments on behalf of State, and additions to the net asset base.
Table 2.3.6: Parliamentary Authority for Resources
| | 2001-02 Budget | 2001-02 Revised | 2002-03 Budget | Variation(a) | ||||
|---|---|---|---|---|---|---|---|---|
| | ($ million) | (%) | ||||||
| Annual appropriations(b) | 2 321.6 | 2 300.5 | 2 593.1 | 11.7 | ||||
| Receipts credited to appropriations | 247.3 | 249.2 | 269.3 | 8.9 | ||||
| Unapplied previous years appropriation | 15.2 | 20.8 | 21.1 | 38.8 | ||||
| Accumulated surplus—previously applied appropriation | — | — | — | — | ||||
| Gross annual appropriation | 2 584.1 | 2 570.5 | 2 883.5 | 11.6 | ||||
| Special appropriations | — | — | — | — | ||||
| Trust funds | 456.5 | 492.1 | 504.2 | 10.4 | ||||
| Total Parliamentary authority | 3 040.6 | 3 062.6 | 3 387.7 | 11.4 | ||||
Source: Department of Treasury and Finance
Notes:
- (a)
- Variation between 2001-02 Budget and 2002-03 Budget.
- (b)
- 2001-02 Revised includes the impact of approved Treasurer's Advances.
Payments on behalf of State
Payments on behalf of the State are payments made by the Department on behalf of the State Government as a whole and do not directly reflect the operations of the Department. They are usually on-passed or administered by the State.
Table 2.3.7: Payments made on behalf of the State
| Accounts | 2001-02 Budget | 2001-02 Revised | 2002-03 Budget | Variation(a) | ||||
|---|---|---|---|---|---|---|---|---|
| | ($ million) | (%) | ||||||
| Employer Contribution to Superannuation | 1.3 | 1.3 | 1.3 | — | ||||
| National competition payments for distribution to local government | 10.1 | 10.1 | 15.4 | 0.0 | ||||
| Total | 11.4 | 11.4 | 16.7 | 0.0 | ||||
Source: Department of Treasury and Finance
Note:
- (a)
- Variation between 2001-02 Budget and 2002-03 Budget.
DEPARTMENT OF INNOVATION, INDUSTRY AND REGIONAL DEVELOPMENT
PART 1: OUTLOOK AND OUTPUTS
Overview
The Department of Innovation, Industry and Regional Development is the Victorian Government's lead agency for economic and regional development and for delivering on the Government's commitment to build a creative, innovative and enterprising State with thriving businesses.
The Department of Innovation, Industry and Regional Development was created in March 2002 to reflect the increasing emphasis that the Government places on innovation as a key driver of future economic success. A clear focus for the Department is delivering on the Government's commitment in Growing Victoria Together to 'more jobs and thriving, innovative industries across Victoria'.
The Department supports seven Ministerial portfolios—State and Regional Development, Innovation, Industrial Relations, Information and Communication Technology, Small Business, Manufacturing and Employment.
The Department's primary functions include:
- •
- driving the Government's innovation agenda;
- •
- providing policy direction and program delivery for industry;
- •
- rebuilding rural and regional economic communities;
- •
- investment attraction—development of Victoria's as a global business and manufacturing centre of excellence;
- •
- driving further development of Victoria's science and technology capabilities, especially in biotechnology—
development and use of information and communication technologies across the State; - •
- industrial relations; and
- •
- small business development; design and delivery of employment policy and programs for Victoria.
Departmental Objectives
The Department has redeveloped a range of performance objectives that accord with the Government's Growing Victoria Together vision for the future of Victoria. These objectives are related to the departmental outputs and reflect the focus of the new Department of Innovation, Industry and Regional Development. These objectives are:
- •
- To encourage and support the development of innovative, internationally integrated and competitive industries and businesses for Victoria;
- •
- Work to create a competitive business environment and capabilities for the innovation economy;
- •
- Strengthen Victoria's regional economies, infrastructure and communities; and
- •
- Support the development of high performing, cooperative and fair workplaces and a highly skilled workforce.
Review of 2001-02
The Machinery of Government changes had a significant impact on the structure of the Department. The Department of State and Regional Development operated until the creation of two new Departments of Innovation, Industry and Regional Development (DIIRD) and Tourism, Sport and the Commonwealth Games (DTSCG) on 5 March 2002. With these changes Major Projects Victoria moved to the Department of Infrastructure and the Employment Programs Division of the (former) Department of Education, Employment and Training joined DIIRD.
The Department performed well against its planned targets during 2001-02. Key achievements include:
Investment Attraction
New investment attracted in 2001-02 is likely to total $1.8 billion resulting in the expected creation of nearly 4 500 direct jobs by investing companies. This is in spite of an increasingly competitive investment environment. The major contributions to facilitated investment came from the automotive, food, retail, resource and ICT sectors.
Regional Development
A comprehensive suite of regional development programs aimed at enhancing economic development was delivered including the approval of 13 grants under the Regional Infrastructure Development Fund and the Council and Regional Development Body Program. Since October 1999, the Government has facilitated new investment projects into Victoria valued at over $4.8 billion of which around 29 per cent has been in rural and regional Victoria. The delivery of Rural Leaders and Community Events program provided support to 113 events and leadership projects in rural communities. Under the joint DIIRD-DNRE Community Capacity Building Initiative, a number of community groups were formed to prepare action plans on projects and initiatives that would contribute to further development of their communities. The second Annual Summit of Rural and Regional Mayors was successfully held in Parliament House in September 2001.
Manufacturing
Manufacturing investment facilitated during the year exceeded $1.1 billion. This included major investments by Automotive Components, Paperlinx and Murray Goulburn Co-op, creating more than 3 200 jobs. The Government's Rail Strategy delivered more than $400 million in new orders of local supplies, 240 jobs in rail vehicle manufacture and over 2 000 new jobs in the supply chain. The Office of Manufacturing, in collaboration with the Manufacturing Industry Consultative Council and with input from the Strategic Audit of Victorian Industry, developed a comprehensive industry growth strategy, Agenda for New Manufacturing.
Connecting Victoria
Implementation of the Government's Connecting Victoria program continued with the launch of the 10 year vision for the development of the ICT industry sector (Growing Tomorrow's Industries Today) and the Regional Communication Infrastructure Strategy (Regional Connections). Support was extended for the computer game industry (Game Plan: The Next Level), and support for the take-up of e-commerce (Victoria's E-Commerce Advantage) was continued through a range of initiatives including access for Small/Medium Enterprises (SMEs) and regional suppliers to Government purchasing arrangements, and ICT skills development, through the ICT Achievers and ICT Fellowship programs.
The 2001-02 financial year also saw the successful completion of the Government On Line program with the Government On Line Report Card, the launch of a new E-Government strategy (Putting People at the Centre), and finalisation of the Telecommunications Purchasing and Management Strategy (TPAMS), a strategy covering the acquisition and management of the telecommunications and networking requirements for the Victorian Government sector over the next five years. In addition the Government provided approval for the development of a film and television studio facility at Docklands (together with an interim facility at St Albans).
Government Business Statement
The Government's Building Tomorrow's Business Today business statement was released in April 2002. The statement builds on the Government's current business, infrastructure, regional development, training and RandD initiatives to harness Victoria's strengths for strong and sustainable business growth across the whole State.
Strategic Audit of Victorian Industry
The strategic overview of Victorian industry was released in February 2002. It examined the strengths and weaknesses of the Victorian economy relative to international jurisdiction and Australian States. A number of industry audits have been completed and released this financial year including environmental management, transport, distribution and logistics. In addition, plans for the automotive and ICT sectors were released and an audit of the financial services industry is underway.
Science, Technology and Innovation
Management of the first round of competitive Science, Technology and Innovation infrastructure grants continued during 2001-02. The second round of competitive STI grants was advertised, processed and short-listed for approval. Planning for the National Synchrotron Facility at Monash commenced. International and national advisory committees have been appointed to guide the synchrotron's development, and the facility is expected to be ready for use in 2007.
In June 2001, the Government released the Biotechnology Strategic Development Plan for Victoria. The aim of the Plan is for Victoria by 2010 to be one of the top five locations in the world for biotechnology research and development, commercialisation, production and marketing. Initiatives include support for Victorian companies attending international events such as BIO2001, held in San Diego, USA.
Commercialisation 2001, comprising a series of workshops and an early-stage Venture Capital Fair was staged from 26 October to 1 November 2001. A framework for intellectual property management in government was developed. The Centre for Innovation, Technology and Commercialisation was opened in August 2001.
Small Business
Vic Export received a gold award at the 2002 Government Technology Productivity Awards. Vic Export was designed to help small businesses evaluate their potential for success in the international market place and to conduct appropriate market research for the development of export strategy. The range of business development and associated support programs aimed at SMEs continued to be based on ensuring that at least 50 per cent of the available funds were directed to small businesses. The Business Access Group has continued to expand the range of information, advisory and referral services provided to SME's via the Victorian Business Line, through the Internet and through the Victorian Business Centres located throughout the State.
Some 1 500 students throughout Victoria participated in the Young Achievement Australia (YAA) program to experience all the aspects of establishing and running a small business. The Department sponsored ten YAA programs in rural Victoria including two programs specifically for Koori youth.
In collaboration with Austrade the Koori Business Network undertook delivery of an export seminar for Koori small businesses with the potential to export.
Industrial Relations
The Partners at Work Program was launched to assist organisations to strengthen business performance and to improve employee quality of life through organisational change strategies. The Regional High Performance Networks program for regionally based public sector organisations was launched and 25 workshops have been conducted. An information and advice service has been established to provide assistance to all relevant stakeholders. Investment attraction and industry specific activities have been achieved through the delivery of services and information on industrial relations issues, industry roundtables, the Building Industry Consultative Committee and the monitoring of major disputes. Representation was undertaken in major test cases in the AIRC including the living wage and state wage cases. A submission to the AIRC on the reasonable hours test case was coordinated on behalf of a number of states. Additional powers were given to the BLF Custodian to enable a distribution of property held by the Custodian.
Major Projects
The refurbishment of the Sidney Myer Music Bowl was completed and opened, as were the Malthouse Plaza and State Hockey and Netball Centre. The land development projects at Mont Park and Kensington Banks have progressed with construction about to commence in Mont Park. Significant progress has been made on the State Library Stage 3 and the National Gallery of Victoria. Project planning is well advanced on the Melbourne Sports and Aquatic Centre Redevelopment, the Commonwealth Games Athletes' Village, the Bonegilla Immigration Camp and the Australian Synchrotron.
Variations from previous year
The Department of State and Regional Development operated until 4 March 2002. As a result of machinery of government changes DIIRD and DTSCG were created on 5 March 2002. Activities undertaken by Tourism Victoria, Sport, Recreation and Racing and the Commonwealth Games were part of the former Department of State and Regional Development until that time.
2002-03 Outlook
During 2002-03 the Department will accelerate the delivery of the Government's innovation economy objectives. Initiatives include:
- •
- An industry growth strategy that targets exports, innovation and industry collaboration. This will entail implementation through industry wide initiatives, and it will deliver assistance to industries at firm and sectoral levels. The goal is to improve innovation and technology uptake, export marketing and knowledge sharing.
- •
- The Government will commence implementation of the Agenda for New Manufacturing, a comprehensive strategy to move the manufacturing industry to a higher growth path. The Agenda builds Government and industry partnerships through initiatives on innovation, exports, training, the image of the industry and high performance workplaces.
- •
- Management of the first and second round of competitive Science, Technology and Innovation infrastructure grants and other grants will continue during 2002-03.
- •
- The National Synchrotron Facility will enter the project delivery phase. Planning, resourcing, and stakeholder arrangements are to be finalised. Design work on the foundations, storage ring, booster and injector, transfer line, beam lines, instrumentation and safety systems will commence. Community consultation and implementation of the communication plan will be underway.
- •
- The Centre for Energy and Greenhouse Technologies will be established.
- •
- Full implementation of the Biotechnology Strategic Development Plan for Victoria with initiatives in the areas of skills development, research, commercialisation, building the corporate base and Government leadership and support.
- •
- Continued management of the Technology Commercialisation Program partners (with additional technology diffusion co-ordinators) and the Centre for Innovation, Technology and Commercialisation.
- •
- A comprehensive strategy to position Victoria as an investment destination will commence in 2002-03. The International Investment Positioning Strategy is expected to increase opportunities for foreign direct investment in key sectors and markets, particularly from North America and Europe. A new Victorian Government Business Office will open in San Francisco.
- •
- Finalise the implementation of the Connecting Communities and Skills × Knowledge = Growth programs; continue the implementation of Growing Tomorrow's Industries Today, Victoria's E-Commerce Advantage, Regional Connections; commence the implementation of TPAMS, a strategy covering the acquisition and management of the telecommunications and networking requirements for the Victorian Government sector over the next five years, as well as a suite of programs under the E-Government strategy.
- •
- Deliver the Government's employment programs, which assist designated groups in the community to secure and retain employment; develop new strategic initiatives to address employers' needs for a skilled and adaptable labour force in communities across the state.
- •
- Further development of an industrial relations strategy in relation to the delivery of services for the Commonwealth Games and further integration of the Government's industrial relations policies and objectives with business and other stakeholders. An extension of the Partners at Work and Regional High Performance Networks programs and the completion of the Victorian Workplace survey on high performance practices in key industries will be undertaken. The public review of child employment regulation will be finalised.
- •
- Development of a multilingual capacity for the Department's business support websites, the linkage of the Victorian Business Channel to the Victorian Business Line call centre utilising Voice over Internet protocols (VoIP) and the extension of hours of operation for the call centre to facilitate small business access.
Output Information
The following section provides details of the outputs to be provided to Government, including their performance measures and the costs for each output. The table below summaries the total cost for outputs.
Table 2.4.1: Output summary
| | 2001-02 Budget(a) | 2001-02 Revised | 2002-03 Budget | Variation(b) | |||||
|---|---|---|---|---|---|---|---|---|---|
| | ($ million) | (%) | |||||||
| Innovation and Policy | 94.8 | 94.0 | 124.7 | 31.5 | |||||
| Business | 190.6 | 161.5 | 249.0 | 30.6 | |||||
| Industrial Relations | 12.1 | 12.6 | 11.9 | (1.6 | ) | ||||
| Employment Programs(c) | — | — | 46.3 | — | |||||
| Major Projects(d) | 6.1 | 4.9 | — | (100.0 | ) | ||||
| Total | 303.5 | 273.0 | 431.9 | 42.3 | |||||
Source: Department of Treasury and Finance
- Notes:
- (a)
- 2001-02 Output Budget incorporates changes to Output structure and organisational restructuring and therefore may differ from figures published in the 2001-02 Budget.
- (b)
- Variation between 2001-02 and 2002-03 Budget.
- (c)
- Employment Services has been transferred from the (former) Department of Education, Employment and Training for the 2002-03 Budget.
- (d)
- Major Projects has been transferred to Department of Infrastructure for the 2002-03 Budget.
Innovation and Policy
Description:
Brings together the strategic leadership responsibilities for economic and regional development policies with the key areas of science, technology and innovation and information and communication technologies. Together these responsibilities largely define the future direction for the Victorian economy both in themselves and as influences on existing industries. In addition to the strong policy and strategy development role there is also a number of strategic programs delivered, including in the areas of biotechnology, STI and ICT infrastructure, e-commerce and e-government.
Departmental Objectives to which services contribute:
- •
- To encourage and support the development of innovative, internationally integrated and competitive industries and businesses for Victoria;
- •
- Work to create a competitive business environment and capabilities for the innovation economy;
- •
- To strengthen Victoria's regional economies, infrastructure and communities; and
- •
- Support the development of high performing, cooperative and fair workplaces and a highly skilled workforce.
| Major Outputs/Deliverables Performance Measures | Unit of Measure | 2000-01 Actuals | 2001-02 Targets | 2001-02 Expected Outcome | 2002-03 Targets | |||||
|---|---|---|---|---|---|---|---|---|---|---|
| Strategic Policy—Identification of issues of key importance to the development of Victoria and shaping strategies to address them and delivery of advice to government on portfolio related issues, including policy papers, submissions and briefings and provision of Ministerial support for Parliament and Cabinet. | ||||||||||
| Quantity | ||||||||||
| Strategic Audit of Victorian Industry | ||||||||||
| • Sectoral analyses | number | 4 | 2 | 6 | (a) | na | ||||
| Quality | ||||||||||
| Policy advice which meets quality standards | per cent | nm | 100 | 100 | 100 | |||||
| Sectoral analyses identify strategic directions for sectoral plans—reports accepted by government | number | 2 | 2 | 6 | na | |||||
| Timeliness | ||||||||||
| Completion of Strategic Audit projects within agreed timelines | per cent | 50 | 100 | 100 | na | |||||
| Agreed timelines or milestones met | per cent | >95 | >95 | >95 | >95 | |||||
| Victoria's Design Capabilities (DIIRD Deliverables): | ||||||||||
| • Centres of Excellence proposals funded | number | nm | nm | nm | 2 | |||||
| • Policy and planning for the design capability completed | percent | nm | nm | nm | 100 | |||||
| • Planning for Design Showcase and Premier's Award completed | percent | nm | nm | nm | 100 | |||||
| Victoria's Design Capabilities (DET Deliverables): | ||||||||||
| • Number of qualifications developed and accredited | number | nm | nm | nm | 1 | |||||
| • Number of students enrolled in courses leading to new design qualifications | number | nm | nm | nm | 60 | |||||
| • Number of TAFE/manager and secondary teachers participants in design and innovative thinking activities | number | nm | nm | nm | 300 | |||||
| • Range of industry training areas receiving specialist input and adopting modified delivery practice | number | nm | nm | nm | 5-10 | |||||
| • Range of curriculum areas with online support materials provided | number | nm | nm | nm | 2-5 | |||||
| • Number of pilot design education programs scoped, developed and evaluated | number | nm | nm | nm | 6 | |||||
| • Number of industry sectors with discernible design pathways | number | nm | nm | nm | 4 | |||||
| Cost | ||||||||||
| Total output cost | $ million | 7.8 | 7.3 | 6.6 | 8.8 | |||||
STI Policy, Awareness and Biotechnology—Provides strategic advice and support for the Government's strategy to grow Victoria's STI capabilities, provides strategic policy coordination with the Federal Government and advocacy on national STI issues and promotes public awareness of STI and education activities. Implement the Biotechnology Strategic Development Implementation Plan for Victoria. | ||||||||||
| Quantity | ||||||||||
| Policy submissions on National International and State issues | number | 6 | 4 | 4 | 4 | |||||
| Support for KISE Council meetings | number | 4 | 16 | 16 | 4 | |||||
| Awareness activities | number | 13 | 12 | 12 | 12 | |||||
| Coordination meetings with DEET | number | 14 | na | na | na | |||||
| Infrastructure proposals submitted | number | 5 | na | na | na | |||||
| Biotechnology strategic development plan implementation: | ||||||||||
| • support Platform Technology Steering group (meetings) | number | nm | nm | nm | 4 | |||||
| • Biotechnology e-bulletin (edits) | number | nm | nm | nm | 12 | |||||
| Quality | ||||||||||
| Policy advice meets quality standards | per cent | 100 | 100 | 100 | 100 | |||||
| Timeliness | ||||||||||
| Awareness sponsorships—2 competitive rounds | date | na | na | na | 2nd and 4th quarter | |||||
| Victoria Prize and Fellowships awarded | date | 1st quarter | 1st quarter | 2nd quarter | 1st quarter | |||||
| Great Australian Science Show and Science Week | date | 1st quarter | 1st quarter | 1st quarter | na | |||||
| BIO 2003 delegation | date | na | na | na | Qtr 1 | |||||
| Biotechnology Strategy announcement | date | 1st quarter | na | na | na | |||||
| Biotechnology Strategy (Plan-issue) implementation | date | 4th quarter | na | na | na | |||||
| Support for STARS | date | delayed by NASA | 2nd quarter | na | na | |||||
| Cost | ||||||||||
| Total output cost | $ million | 3.6 | 3.4 | 3.6 | 6.6 | |||||
STI Initiative Management—Allocation of the contestable funding on a whole of government basis, for the development of infrastructure support and STI expenditure, including priority setting, monitoring and review. | ||||||||||
| Quantity | ||||||||||
| Contestable Funding Rounds | number | 1 | 1 | 1 | 0 | |||||
| Management of 1999-00 grants to agencies | number | 20 | 20 | 20 | 20 | |||||
| Management of (external) grants from Round 1 | number | 17 | 17 | 17 | 17 | |||||
| Management of external grants for Round 2 and other grants | number | nm | nm | nm | 22 | |||||
| National Synchrotron Project: | ||||||||||
| • beam line user meetings | number | nm | nm | nm | 6 | |||||
| • community consultation Forums | number | nm | nm | nm | 4 | |||||
| STI strategic projects facilitated | number | nm | 2 | 2 | na | |||||
| Timeliness | ||||||||||
| STI grants evaluation and review | date | nm | nm | nm | Qtr 4 | |||||
| National Synchrotron—Client Management: | ||||||||||
| • Completion of finance, business and communication plan | date | nm | nm | nm | Qtr 1 | |||||
| National Synchrotron Project: | ||||||||||
| • Project management plan | date | nm | nm | nm | Qtr 1 | |||||
| • Site works started | date | nm | nm | nm | Qtr 2 | |||||
| Centre for Energy and Greenhouse Technologies: | ||||||||||
| • Business plan completed | date | nm | nm | nm | Qtr 2 | |||||
| • Centre established | date | nm | nm | nm | Qtr 2 | |||||
| Management of Round 2 process: | ||||||||||
| • Round 2 advertised | date | nm | 2nd quarter | 2nd quarter | na | |||||
| • Grants awarded | date | nm | 4th quarter | 4th quarter | na | |||||
| Development of priorities framework updated with new areas identified | date | nm | 4th quarter | 1st quarter | na | |||||
| Cost | ||||||||||
| Total output cost | $ million | 7.1 | 48.1 | 46.8 | 66.7 | |||||
Technology Commercialisation Program—Aims to reduce barriers to commercialisation, develop innovative intellectual property management strategies, increase support for innovative enterprises and expand the availability of venture capital. The majority of outputs will be achieved through service delivery agencies. This output also includes CRC projects. | ||||||||||
| Quantity | ||||||||||
| Management of existing TCP Service contract Providers | number | nm | 13 | 12 | 10 | |||||
| Management of new TCP Diffusion providers | number | nm | nm | nm | 2 | |||||
| Management of TCP grant | number | mm | 1 | 1 | 1 | |||||
| Technology Commercialisation events organised and supported | number | nm | 14 | 12 | 12 | |||||
| Commercialisation Policy—Papers/ Frameworks | number | nm | 4 | 4 | 2 | |||||
| Centre for Innovation and Technology Commercialisation: | ||||||||||
| • Management reports | number | nm | nm | nm | 4 | |||||
| CRC Support program (grants) | number | 6 | na | 15 | na | |||||
| CRC memberships | number | na | na | na | 4 | |||||
| Opportunities assessed | number | 144 | na | na | na | |||||
| Opportunities selected | number | 43 | na | na | na | |||||
| Commercialisation Audits | number | 7 | na | na | na | |||||
| Businesses assisted | number | 196 | na | na | na | |||||
| Business Plans developed | number | 75 | na | na | na | |||||
| Businesses graduated from Incubators | number | 7 | na | na | na | |||||
| Commercial Negotiations | number | 9 | na | na | na | |||||
| Incorporated Businesses established | number | 14 | na | na | na | |||||
| Meetings/Workshops | number | 11 | na | na | na | |||||
| Cost | ||||||||||
| Total output cost | $ million | 6.3 | 5.2 | 8.7 | 7.3 | |||||
ICT Industry Development and E-Commerce—Delivers projects to grow a global ICT industry in Victoria, as well as projects to promote the uptake of electronic commerce in both business and the community. | ||||||||||
| Quantity | ||||||||||
| Investment recruitment projects | number | 103 | 100 | 100 | 100 | |||||
| Export Development projects | number | 38 | 30 | 30 | 30 | |||||
| ICT skills projects | number | 4 | 6 | 6 | 6 | |||||
| Policy review completed | number | 1 | 1 | 1 | na | |||||
| Projects to increase business use of IT and electronic commerce | number | 8 | 16 | 16 | 8 | |||||
| Policy review completed and report delivered to Minister | number | 1 | na | na | na | |||||
| Post implementation review completed | number | 1 | na | na | 1 | |||||
| Implementation progress review completed | number | nm | 1 | 1 | na | |||||
| Cost | ||||||||||
| Total output cost | $ million | 6.6 | 8.4 | 10.6 | 11.9 | |||||
E-Government and ICT policy—Delivers project management, contract management, research and policy development to implement E- Government strategies and initiatives, plus projects designed to provide policy advice on ICT issues, particularly in relation to regional access to ICT. | ||||||||||
| Quantity | ||||||||||
| Projects relating to E-Government underway or completed | number | 8 | 9 | 9 | 9 | |||||
| Post implementation review completed | number | 2 | na | na | na | |||||
| Regional ICT projects assessed | number | nm | 30 | 30 | 5 | |||||
| Minimum regional access projects underway or completed | number | nm | nm | nm | 5 | |||||
| Policy reviews conducted | number | nm | 1 | 1 | 1 | |||||
| Quality | ||||||||||
| Advice meets quality standards | per cent | nm | 100 | 100 | 100 | |||||
| Cost | ||||||||||
| Total output cost | $ million | 6.7 | 7.5 | 6.8 | 11.0 | |||||
ICT Community Development—The output involves the development, contract management and monitoring of ICT community development projects designed to promote effective use of information and communication technologies in the community. | ||||||||||
| Quantity | ||||||||||
| Minimum ICT community development projects underway or completed | number | 7 | 9 | 9 | 7 | |||||
| Projects underway or completed in relation to cultural and research institutions | number | 1 | na | na | na | |||||
| Policy review completed and report delivered to Minister | number | 1 | na | na | na | |||||
| Post implementation review completed | number | 1 | na | na | na | |||||
| Quality | ||||||||||
| Assessment of quarterly monitoring reports of relevant agreements undertaken | per cent | nm | nm | nm | 100 | |||||
| Timeliness | ||||||||||
| Payments made according to contracts, provided grant recipients meet contract terms | per cent | nm | nm | nm | 100 | |||||
| Cost | ||||||||||
| Total output cost | $ million | 5.2 | 5.9 | 4.8 | 5.1 | |||||
E-Government Infrastructure—Whole-of-government management of key shared information and communications technology services, particularly VicOne, and the management of telecommunications contracts and telecommunications infrastructure. | ||||||||||
| Quantity | ||||||||||
| Projects underway or implemented | number | 8 | 8 | 8 | 8 | |||||
| VicOne rollouts to Departments | number | 20 | na | na | na | |||||
| Policy reviews completed | number | incomplete | 2 | 2 | 1 | |||||
| Timeliness | ||||||||||
| Completion of VicOne rollout to all planned government sites | date | 1st quarter | na | na | na | |||||
| Cost | ||||||||||
| Total output cost | $ million | 6.1 | 8.9 | 6.1 | 7.3 |
Source: Department of Innovation, Industry and Regional Development
- Note:
- (a)
- Strategic Audit of Victorian Industry: apart from 2 targeted reports, there are 4 carried forward from 2000-01 and an overview report that will also be completed in 2001-02.
Business
Description:
Provision of an integrated business development model to deliver broadcast information services and business development programs to support industry development, manufacturing, regional development and small business growth. Key activities include:
- •
- Attract and facilitate new investment into the State and improve the capacity of Victorian industry to compete internationally;
- •
- Business improvement and export assistance services directed primarily at business in Victoria's manufacturing and trade services sectors and small and medium enterprises generally;
- •
- Fund regional, community and business infrastructure;
- •
- Increase the capacity of local industries to compete, grow and employ; and
- •
- Development of online business services, liquor and trade measurement licensing and educational services.
Departmental Objectives to which services contribute:
- •
- To encourage and support the development of innovative, internationally integrated and competitive industries and businesses for Victoria;
- •
- Work to create a competitive business environment and capabilities for the innovation economy; and
- •
- Strengthen Victoria's regional economies, infrastructure and communities.
| Major Outputs/Deliverables Performance Measures | Unit of Measure | 2000-01 Actuals | 2001-02 Targets | 2001-02 Expected Outcome | 2002-03 Targets | |||||
|---|---|---|---|---|---|---|---|---|---|---|
Investment Facilitation and Attraction—Incentives and facilitation services are offered to attract new international investment and encourage additional investment by companies already operating in Victoria. | ||||||||||
| Quantity | ||||||||||
| New investments facilitated and announced | $ million | 1 689 | 1 200 | 1 800 | 1 200 | |||||
| Investment attracted in rural Victoria | $ million | 645.6 | 300 | 400 | 300 | |||||
| Investment Projects under Investigation | $ million | 4 592 | 5 000 | 4 500 | 5 000 | |||||
| Jobs derived from investments facilitated | number | nm | 4 000 | 4 000 | 4 000 | |||||
| Inbound investor visits supported | number | nm | 120 | 120 | 120 | |||||
| Overseas companies and other organisations visited | number | nm | 800 | 800 | 800 | |||||
| Overseas public presentations | number | nm | 80 | 80 | 80 | |||||
| Site packages prepared for potential investors | number | nm | 80 | 80 | 80 | |||||
| New leads generated | number | nm | 100 | 100 | 100 | |||||
| Number of interagency project facilitation meetings | number | nm | 100 | 100 | 100 | |||||
| Cost | ||||||||||
| Total output cost | $ million | 38.9 | 41.2 | 45.0 | 44.4 | |||||
Business Development—Industry growth strategy targeting, exports, innovation and industry collaboration is implemented through industry wide initiatives, catalysed by assistance delivered at firm and sectoral levels to improve innovation and technology uptake, export marketing and knowledge sharing. | ||||||||||
| Quantity | ||||||||||
| Exports Facilitated | $ million | 830 | 600 | 600 | 600 | |||||
| Trade fairs and missions supported | number | nm | 25 | 25 | 25 | |||||
| Industrial Supplies Office Import Replacement | $ million | 91.3 | 88 | 88 | 88 | |||||
| Enterprise Improvement Services directed to clients in rural Victoria | per cent | na | 25 | 25 | 25 | |||||
| Enterprise Improvement Services directed to small and medium enterprises | per cent | nm | 50 | 50 | 50 | |||||
| Business Events assisted | number | 6 | 5 | 5 | 5 | |||||
| Visitations/Delegations to the Investment Centre | number | 14 557 | 12 000 | 12 000 | 12 000 | |||||
| Visits by overseas companies to Investment Centre | number | 2 614 | 2 000 | 2 000 | 2 000 | |||||
| Expand Export Base: | ||||||||||
| • Engagements in Export Community networks | number | nm | nm | nm | 1 500 | |||||
| Building Momentum of Innovation: | ||||||||||
| • Companies participating in Innovation Insights Visits program | number | nm | nm | nm | 200 | |||||
| Victorian Transport and logistics: | ||||||||||
| • Companies participating in survey | number | nm | nm | nm | 5 | |||||
| • Groups participating | number | nm | nm | nm | 3 | |||||
| Quality | ||||||||||
| Client satisfaction rating by rural businesses and small and medium enterprises (to be confirmed) | per cent | nm | nm | nm | 90 | |||||
| Timeliness | ||||||||||
| Governor's Export Award Presentation | date | Oct 2000 | 2nd quarter | 2nd quarter | na | |||||
| Business Improvement Services—program fully contracted | date | Apr 2001 | Apr 2001 | Apr 2001 | na | |||||
| Administration of business event funding— average response time/turnaround time | weeks | 9 | na | na | na | |||||
| Cost | ||||||||||
| Total output cost | $ million | 25.6 | 24.9 | 28.1 | 37.0 | |||||
Regional Strategic Leadership—Program development, economic intelligence and policy development services that build the Department's capacity to take a leadership role in regional development. | ||||||||||
| Quantity | ||||||||||
| Programs delivered to groups of local councils and regional development bodies | number | nm | 12 | 12 | 12 | |||||
| Support for Local Government Summit | number | nm | 1 | 1 | 1 | |||||
| Regional economic development non-infrastructure projects funded | number | nm | nm | nm | 20 | |||||
| Timeliness | ||||||||||
| Regional Development funding guidelines available electronically | date | nm | Dec 2001 | Dec 2001 | na | |||||
| Establishment of selection, management, performance monitoring and administrative systems for: | ||||||||||
| • Regional economic development program | date | Jul 2000 | na | na | na | |||||
| • Local economic development initiatives | date | Jul 2000 | na | na | na | |||||
| • Regional grants for local government and regional development boards | date | Jul 2000 | na | na | na | |||||
| • Establish and launch Regional Development web site | date | Mar 2001 | na | na | na | |||||
| Cost | ||||||||||
| Total output cost | $ million | 2.2 | 3.0 | 2.6 | 2.4 | |||||
Rural Community Development—A service to rural communities to understand their needs and concerns, ensure their input to the policy, program and service development process, assist their access to government and enhance their social, economic and commercial growth and development. | ||||||||||
| Quantity | ||||||||||
| Ministerial meetings supported | number | 13 | 10 | 10 | 10 | |||||
| Rural leadership and community events organised and supported | number | 22 | 25 | 120 | 120 | |||||
| Rural Taskforce meeting in regional Victoria | number | 1 | na | na | na | |||||
| Community capacity building initiative-implementation of action plans | nm | nm | nm | 11 | ||||||
| Rural Community Development Networks established and maintained | number | na | 20 | 20 | na | |||||
| Quality | ||||||||||
| Satisfaction of Community Cabinet Meetings supported | per cent | 90 | 90 | 90 | na(a) | |||||
| Timeliness | ||||||||||
| Agreed timelines for briefings for Community Cabinet Meetings met | per cent | 100 | 100 | 100 | na(b) | |||||
| Establish Rural Community Development Network | date | Sept 2000 | na | na | na | |||||
| Briefs for Rural Ministerial Visits provided to agreed timelines | per cent | 100 | na | na | na | |||||
| Cost | ||||||||||
| Total output cost | $ million | 3.5 | 10.7 | 6.5 | 12.2 | |||||
Regional Infrastructure Development—Capital works funds for infrastructure development projects in regional Victoria. | ||||||||||
| Quantity | ||||||||||
| Regional Infrastructure Development Fund—projects funded | number | 29 | 20 | 20 | 20 | |||||
| Rural Community Development Program—projects funded | number | 141 | 100 | na | na | |||||
| Council and regional development projects assisted | number | na | 30 | 30 | na | |||||
| Regional economic development—infrastructure projects funded | number | na | nm | nm | 10 | |||||
| Priority Projects funded | number | 51 | na | na | na | |||||
| Quality | ||||||||||
| RIDF Committee recommendations accepted by Ministers | per cent | nm | 90 | 90 | 90 | |||||
| Timeliness | ||||||||||
| Advice to RIDF applicants—after receipt of applications | days | 120 | 120 | 90 | 90 | |||||
| Cost | ||||||||||
| Total output cost | $ million | 6.9 | 91.2 | 61.7 | 132.1 | |||||
Regional Economic Development—Facilitation of new investment in regional Victoria and support of business development across key regional industry sectors through the Victorian Business Centre Network. | ||||||||||
| Quantity | ||||||||||
| Living Regions, Living Suburbs Support fund: | ||||||||||
| • Projects supported | number | nm | 30 | 30 | 30 | |||||
| • Implement one stop shops pilots | number | deferred | 4 | 0 | 4 | |||||
| • Tourism Promotion—Major Events assisted | number | 11 | na | na | na | |||||
| Timeliness | ||||||||||
| Regional Economic Development program launched | date | Sept 2000 | na | na | na | |||||
| Cost | ||||||||||
| Total output cost | $ million | 3.3 | 6.5 | 4.1 | 6.5 | |||||
Regulation Reform—Initiate and coordinate implementation of reforms that will enhance Victoria's business climate. | ||||||||||
| Quantity | ||||||||||
| Industry sector reviews | number | 8 | 8 | 8 | 8 | |||||
| Industry sector review implementation coordination | number | 4 | na | na | na | |||||
| Regulatory Impact Statements assessed | number | 20 | na | na | na | |||||
| Quality | ||||||||||
| Regulatory Impact Statements assessed according to requirements | per cent | 90 | na | na | na | |||||
| Client satisfaction with regulation reform advice/processes | per cent | 90 | >90 | 90 | 90 | |||||
| Timeliness | ||||||||||
| Industry sector review implementation coordination within agreed timelines | per cent | 66 | 100 | 100 | 100 | |||||
| Regulatory Impact Statements assessed within 5 days of receipt | per cent | 100 | 100 | 100 | 100 | |||||
| Cost | ||||||||||
| Total output cost | $ million | 1.8 | 1.4 | 1.4 | 1.7 | |||||
Small Business Support and Online Business Services—Development and delivery of business information, advisory and referral services through the Victorian Business Line (VBL), Business Channel and regional offices operating across rural and metropolitan Victoria, including managing the delivery of initiatives and events to assist and promote small business. | ||||||||||
| Quantity | ||||||||||
| General enquiries: | ||||||||||
| • General Business Enquiries | number | 32 533 | 36 000 | 36 000 | 43 000 | |||||
| • Business Channel | number | 110 719 | 60 000 | 80 000 | 96 000 | |||||
| • Business Access Website | number | nm | 60 000 | 80 000 | 96 000 | |||||
| BLIS enquires: | ||||||||||
| • Victorian Business Line | number | 22 295 | 16 500 | 10 000 | 12 000 | |||||
| • Business Channel | number | nm | 10 000 | 10 000 | 12 000 | |||||
| Business referrals | number | 32 114 | 33 000 | 33 000 | 39 000 | |||||
| Initiative/events commenced or completed | number | 47 | 10 | 25 | 25 | |||||
| Vic Export client visits | number | nm | 3000 | 5 000 | 6 000 | |||||
| Maintain BLIS information resource (licences) | number | nm | 6 000 | 6 000 | na | |||||
| Maintain Business Channel information resource (documents) | number | nm | 1 000 | 1 000 | na | |||||
| Quality | ||||||||||
| Small business information enquiries responded to within 2 days | per cent | 95 | 95 | 95 | na | |||||
| StreetLife contracts signed | per cent | nm | 100 | 100 | na | |||||
| StreetLife KPIs completed | per cent | nm | 90 | 90 | 90 | |||||
| Inclusion of local government information on Business Channel | date | nm | 1st quarter | 1st quarter | na | |||||
| Client satisfaction on small business information and referral services (survey) | per cent | 88 | >80 | 80 | 80 | |||||
| Timeliness | ||||||||||
| Initiative/events met appropriate timelines | per cent | 100 | na | na | na | |||||
| Small Business State and Regional Awards presented | date | nm | 4th quarter | 4th quarter | 4th quarter | |||||
| BLIS Level 3 internet service launch | date | nm | 1st quarter | 1st quarter | na | |||||
| Vic Export Stage 3 launch | date | nm | 1st quarter | 1st quarter | 2nd quarter | |||||
| Cost | ||||||||||
| Total output cost | $ million | 4.6 | 4.0 | 4.6 | 5.1 | |||||
Trade Measurement Development and Services—Manage the delivery of services throughout rural and metropolitan Victoria under the Trade Measurement Act 1995 including effecting improvement to service delivery standard and further development of monitoring procedures on service licensees' performance. | ||||||||||
| Quantity | ||||||||||
| Traders' instruments inspected | number | 30 434 | na | na | na | |||||
| Traders' premises inspected | number | 7 461 | 5 000 | 5 000 | 5 000 | |||||
| Servicing licensees assessed | number | nm | 110 | 110 | 110 | |||||
| Inspectorial and laboratory contracts renewed | per cent | 100 | na | |||||||
| Inspectorial and laboratory contracts managed | number | nm | 15 | 15 | 15 | |||||
| Quality | ||||||||||
| Contractors complying with performance specifications in Trade Measurement contracts | per cent | 100 | 100 | 100 | 100 | |||||
| Timeliness | ||||||||||
| Trade Measurement contracts prepared and delivered with agreed timelines | per cent | 100 | na | na | na | |||||
| Correspondence/complaints responded to within 7 days | per cent | nm | 95 | 95 | 95 | |||||
| Quality assurance/licence applications responded to within 2 weeks | per cent | nm | 95 | 95 | 95 | |||||
| Cost | ||||||||||
| Total output cost | $ million | 2.2 | 2.1 | 2.5 | 2.5 | |||||
Effective Management of the Sale of Liquor—Provides controls and management arrangements which ensure the community has confidence that liquor is supplied, and the liquor industry is developed, in a responsible manner that contributes to minimising harm arising from the abuse and misuse of liquor. | ||||||||||
| Quantity | ||||||||||
| Liquor licensing enquiries | number | 52 718 | 55 000 | 55 000 | 55 000 | |||||
| Applications for new licence, transfer and variation to licence determined | number | 13 629 | 13 000 | 13 000 | 14 500 | |||||
| Liquor licences and permits renewed and managed | number | 13 001 | na | na | na | |||||
| Responsible Serving of Alcohol training courses | number | 1 694 | na | na | na | |||||
| Responsible Service of Alcohol trainees | number | 24 112 | 20 000 | 20 000 | 25 000 | |||||
| Proof of Age Cards Issued | number | 11 577 | 10 000 | 10 000 | 5 000 | |||||
| Complaints against licensees processed | number | 274 | na | na | na | |||||
| Industry assistance, training and support initiatives | number | 3 821 | na | na | na | |||||
| Quality | ||||||||||
| Client satisfaction with Liquor Licensing Victoria (LLV) service | per cent | 90 | >90 | 90 | 90 | |||||
| Satisfaction levels among participants of RSA training (survey) | per cent | 95 | na | na | na | |||||
| Complaints resolved | per cent | 90 | na | na | na | |||||
| Satisfaction regarding LLV's contributions to and performance at forums, trade shows, seminars, etc (survey) | per cent | 95 | na | na | na | |||||
| Timeliness | ||||||||||
| Applications determined within 3 working days of lodgement of final document/Panel recommendation | per cent | 92 | 90 | 90 | 90 | |||||
| Waiting time for RSA training—within 10 working days | per cent | 100 | na | na | na | |||||
| Complaints referred to responsible enforcement agency within 5 days | per cent | 95 | 90 | 90 | 90 | |||||
| Cost | ||||||||||
| Total output cost | $ million | 5.3 | 5.5 | 5.0 | 5.1 |
Source: Department of Innovation, Industry and Regional Development
- Notes:
- (a)
- Responsibility transferred to the Department of Premier and Cabinet.
- (b)
- Program incorporated into the Rural Leadership and Event Program in the Department of Premier and Cabinet.
Industrial Relations
Description:
Aims to develop and implement an industrial relations policy and legislative climate which promotes job growth and enhanced employment opportunities and assists in the development of co-operative relations between employers and employees and their representatives.
Departmental Objectives to which services contribute:
- •
- Support the development of high performing, cooperative and fair workplaces and a highly skilled workforce;
- •
- To encourage and support the development of innovative, internationally integrated and competitive industries and businesses for Victoria;
- •
- Work to create a competitive business environment and capabilities for the innovation economy; and
- •
- To strengthen Victoria's regional economies, infrastructure and communities.
| Major Outputs/Deliverables Performance Measures | Unit of Measure | 2000-01 Actuals | 2001-02 Targets | 2001-02 Expected Outcome | 2002-03 Targets | |||||
|---|---|---|---|---|---|---|---|---|---|---|
Industrial Relations Services—Aims to provide accessible and meaningful information, advice and assistance to all relevant stakeholders within Victoria. | ||||||||||
| Quantity | ||||||||||
| Industrial Roundtables | number | nm | 2 | 4 | 3 | |||||
| Delivery of private sector industrial relations services to Government and client organisation | yes/no | yes | na | na | na | |||||
| Delivery of Partnership at Work Programs | number | nm | nm | nm | 40 | |||||
| Quality | ||||||||||
| Ministerial satisfaction with the quality of advice and services | per cent | 90 | na | na | na | |||||
| Ministerial satisfaction with the timely delivery of advice and services | per cent | 90 | na | na | na | |||||
| Timeliness | ||||||||||
| Cooperative workplace relations advice provided within agreed timeframes | per cent | nm | 100 | 100 | 100 | |||||
| Investment facilitation services to investors provided within agreed timeframes | per cent | nm | 100 | 100 | 100 | |||||
| Advice on public sector employment conditions and partnership arrangements provided within agreed timeframes | per cent | nm | 100 | 100 | 100 | |||||
| Strategic Industrial Relations reports delivered on time | per cent | nm | 100 | 100 | 100 | |||||
| Education and communication strategies deployed within agreed timeframes | per cent | nm | 100 | 100 | 100 | |||||
| Industry conspectus—system operational | date | nm | 4th quarter | 4th quarter | na | |||||
| Cost | ||||||||||
| Total output cost | $ million | 4.5 | 6.7 | 7.1 | 6.6 | |||||
Industrial Relations Policy—Aims to develop a fair system of industrial relations for all Victorians, create an environment in Victoria where cooperative workplace practices are the norm and that contributes to the State's economic development. | ||||||||||
| Quantity | ||||||||||
| Victoria represented in major industrial relations cases | per cent | nm | 100 | 100 | 100 | |||||
| Delivery of public sector employee relation services to Government and client organisations | yes/no | yes | na | na | na | |||||
| Quality | ||||||||||
| Ministerial satisfaction with quality and timeliness of policy and advice provided | per cent | nm | 100 | 100 | 100 | |||||
| Ministerial satisfaction with the quality of advice and services | per cent | 90 | na | na | na | |||||
| Ministerial satisfaction with the timely delivery of advice and services | per cent | 90 | na | na | na | |||||
| Timeliness | ||||||||||
| Industrial relations briefings provided within agreed timeframes | per cent | nm | 100 | 100 | 100 | |||||
| Public sector industrial relations policy advice provided within agreed timeframes | per cent | nm | 100 | 100 | 100 | |||||
| Mediation services—fully operational | date | nm | 4th quarter | 4th quarter | na | |||||
| Cost | ||||||||||
| Total output cost | $ million | 3.6 | 5.4 | 5.5 | 5.3 | |||||
Source: Department of Innovation, Industry and Regional Development
Employment Programs(a)
Description:
Provision of:
- •
- Services that foster a positive business environment, attracting and maintaining business and jobs;
- •
- Services that identify gaps, needs and opportunities in the labour market and developing and delivering appropriate employment strategies. Hard hit communities are to receive particular priority;
- •
- Specialist research, advice and assistance on employment opportunities and the labour market;
- •
- Development and contract management of employment programs such as the Community Business Employment Program, Youth Employment Programs and Community Jobs Program; and
- •
- Measures to attract skilled migrants to settle in Victoria including assessments of professional qualifications gained overseas and employment/vocational advice to migrants.
Departmental Objectives to which services contribute:
- •
- Support the development of high performing, cooperative and fair workplaces and a highly skilled workforce;
- •
- Work to create a competitive business environment and capabilities for the innovation economy; and
- •
- Strengthen Victoria's regional economies, infrastructure and communities.
| Major Outputs/Deliverables Performance Measures | Unit of Measure | 2000-01 Actuals | 2001-02 Targets | 2001-02 Expected Outcome | 2002-03 Targets | |||||
|---|---|---|---|---|---|---|---|---|---|---|
Policy and Labour Market Advice—Provision of a specialist labour market advice and information to the Government, and also industry and information services to targeted community groups and individuals. | ||||||||||
| Quantity | ||||||||||
| Youth Employment Link (YEL )—number of website hits and telephone enquiries | number | na | na | na | 150 000 | |||||
| Quality | ||||||||||
| Stakeholder satisfaction on policy and labour market advice | per cent | nm | nm | nm | >90 | |||||
| Timeliness | ||||||||||
| Labour market information reports (monthly) produced and distributed within three working days | per cent | na | 90 | na | >90 | |||||
| Labour market information requests responded to within specified timeframes | per cent | nm | nm | nm | >90 | |||||
| Cost | ||||||||||
| Total output cost | $ million | 2.9 | ||||||||
Community Employment Programs—Administration of contracted employment placement services, services to government agencies and community organisations to employ local job-seekers on community projects, and youth employment information services. | ||||||||||
| Quantity | ||||||||||
| Community Jobs Program—commencements | number | na | na | na | 2 300 | |||||
| Community Business Employment Program—placements made | number | na | na | na | 10 000 | |||||
| Quality | ||||||||||
| Community Jobs Program—participants who are in employment, education or training 3 months after leaving program | per cent | na | na | na | 60 | |||||
| Community Business Employment Program—participants retained for 13 weeks | per cent | na | na | na | 80 | |||||
| Cost | ||||||||||
| Total output cost | $ million | 27.9 | ||||||||
Business Employment Programs—Provision of services to employers and individuals, to encourage increased take-up of apprentices and trainees in areas of skill shortage. | ||||||||||
| Quantity | ||||||||||
| Government Youth Employment Scheme—apprenticeships and traineeship commenced | number | na | na | na | 650 | |||||
| Go for IT—apprenticeship and traineeship commencements | number | na | na | na | 370 | |||||
| Youth Employment Incentive Scheme—number of long term or disadvantaged unemployed young people assisted | number | na | na | na | na(b) | |||||
| Private Sector Skills Development Program—apprenticeship and traineeship commencements | number | na | na | na | na(c) | |||||
| Quality | ||||||||||
| Government Youth Employment Scheme—participants who complete and are in employment, education or training 3 months after completion | per cent | na | na | na | 80 | |||||
| Private Sector Skills Development Program and Go for IT—participants who complete and are in employment, education or training 3 months after completion | per cent | na | na | na | 80 | |||||
| Cost | ||||||||||
| Total output cost | $ million | 13.3 | ||||||||
Migrant Employment Services—Delivers initiatives to attract skilled migrants to Victoria, services to assess overseas qualifications and provision of information to migrants about job opportunities including those in regional Victoria. | ||||||||||
| Quantity | ||||||||||
| Overseas Qualifications Unit—client services provided (by phone, in person or in writing) | number | na | na | na | 4 200 | |||||
| Skilled Migration Unit—services provided to migrants and employers | number | na | na | na | 5 000 | |||||
| Quality | ||||||||||
| Overseas Qualifications Unit—client satisfaction with services provided | per cent | na | na | na | 90 | |||||
| Skilled Migration Unit—client satisfaction with services provided | per cent | na | na | na | 80 | |||||
| Cost | ||||||||||
| Total output cost | $ million | 2.2 | ||||||||
Source: Department of Innovation, Industry and Regional Development
- Notes:
- (a)
- Output costs and performance measures prior to 2002-03 are reported with Department of Education and Training.
- (b)
- YES program targets and budget have already been reached in 2001-02.
- (c)
- PSSDP program targets and budget have already been reached in 2001-02.
Part 2 provides the financial statements that support the Department's provision of outputs. The information provided includes the Statement of Financial Performance, Statement of Financial Position and Statement of Cash Flows for the Department as well as authority for resources.
The total resources made available to a department are applied to three uses:
- •
- the provision of outputs;
- •
- asset investment; or
- •
- payments on behalf of the State.
The following three financial statements are presented in the format consistent with the AAS29 accounting standard. However, for the purposes of this paper they have been divided into controlled and administered items.
Administered items refer to those resources over which the Department cannot exercise direct control. Authority is provided through an appropriation for payments made on behalf of the State. Under the AAS29 standard, these items would normally appear as notes to the financial statements.
Financial Statements
The following four tables can be used to assess the Department's financial performance and use of resources.
- •
- Table 2.4.2—Statement of Financial Performance—provides details of the Department's controlled revenue and expenses on an accrual basis reflecting the cost of providing its outputs;
- •
- Table 2.4.3—Statement of Financial Position—shows all controlled assets and liabilities of the Department. The difference between these represents the net assets position, which is an indicator of the State's equity in the Department;
- •
- Table 2.4.4—Statement of Cash Flows—shows all movements of cash (cash received and paid). The cash impact of financing and investing activities on Departmental resources is highlighted in this statement; and
- •
- Table 2.4.5—Administered Items Statement—provides details of the Department's administered revenue and expenses (on an accrual basis), and its administered assets and liabilities.
On 5 March 2002, the Department of State and Regional Development was split in two, creating the Department of Innovation, Industry and Regional Development and the Department of Tourism, Sport and the Commonwealth Games. The financial information provided for 2000-01 and 2001-02 is therefore indicative only.
Table 2.4.2: Statement of Financial Performance
| | 2000-01 Actual | 2001-02 Budget | 2001-02 Revised | 2002-03 Budget | Variation(a) | |||||
|---|---|---|---|---|---|---|---|---|---|---|
| | ($ million) | (%) | ||||||||
| Revenue from ordinary activities | ||||||||||
| Output appropriations | 154.3 | 303.3 | 260.8 | 431.6 | 42.3 | |||||
| Payments on behalf of state | — | — | — | — | — | |||||
| Special appropriations | — | — | — | — | — | |||||
| Resources received free of charge or for nominal consideration | 19.0 | — | — | — | — | |||||
| Sale of goods and services | — | 0.3 | 0.3 | 0.3 | — | |||||
| Commonwealth Grants | — | — | — | — | — | |||||
| Taxes | — | — | — | — | — | |||||
| Fines and Fees | — | — | — | — | — | |||||
| Other revenue and revenue from other parties | — | — | 12.0 | — | — | |||||
| 173.3 | 303.5 | 273.0 | 431.9 | 42.3 | ||||||
| Expenses from ordinary activities | ||||||||||
| Employee entitlements | 45.9 | 47.7 | 51.3 | 58.2 | 22.0 | |||||
| Depreciation and amortisation | 3.2 | 3.4 | 2.6 | 6.5 | 91.7 | |||||
| Resources provided free of charge or for nominal consideration | — | — | — | — | — | |||||
| Grants and other payments | 59.5 | 207.6 | 171.8 | 305.8 | 47.3 | |||||
| Capital asset charge | 0.8 | 2.1 | 1.7 | 4.0 | 92.5 | |||||
| Supplies and services | 49.8 | 42.7 | 45.7 | 57.3 | 34.2 | |||||
| Other expenses from ordinary activities | — | — | — | — | — | |||||
| Borrowing costs | — | — | — | — | — | |||||
| 159.3 | 303.5 | 273.0 | 431.9 | 42.3 | ||||||
| Result from ordinary activities | 14.0 | — | — | — | — | |||||
| Loss from extraordinary items | — | — | — | — | — | |||||
| Net result for the reporting period | 14.0 | — | — | — | — | |||||
| Net increase in asset revaluation reserve | — | — | — | — | — | |||||
| Total revenues, expenses and revaluation adjustments recognised directly in equity | — | — | — | — | — | |||||
| Total changes in equity other than those resulting from transactions with Victorian State Government in its capacity as owner | 14.0 | — | — | — | — | |||||
Source: Department of Treasury and Finance
Note:
Statement of Financial Performance
For controlled items, both operating revenue and expenses are expected to total $431.9 million in 2002-03, an increase of 42 per cent over the 2001-02 Budget estimate. The price of outputs for DIIRD has increased to reflect a number of changes:
- •
- an increase of $28.1 million in 2002-03 for new spending initiatives, outlined in Appendix A of Budget Paper 2;
- •
- an increase of $84 million as the result of unspent funds being carried forward from the 2001-02 allocation. The largest component of this amount is attributable to the Regional Infrastructure Development Fund (RIDF). While RIDF has been fully committed, revised timing of grants under the program has resulted in the need for the carry forward;
- •
- the transfer of the employment services division of the former Department of Education, Employment and Training to the Department of Innovation, Industry and Regional Development; and
- •
- an increase in costs relating to the public sector employees wages supplementation, and capital assets charge and depreciation costs associated with new asset investment.
The Department is anticipating lower than expected operating expenses for 2001-02 compared to the published Budget, largely due to the carry forward of the RIDF funding, as noted above.
Statement of Financial Position
The level of controlled net assets for the department is expected to grow by $52 million from 2001-02 to 2002-03. This reflects the new asset investment initiatives to be undertaken by DIIRD, which include the synchrotron, telecommunications purchasing and management strategy and the film and television studio at Docklands.
Table 2.4.3: Statement of Financial Position
| | Estimated as at 30 June | |||||||||
|---|---|---|---|---|---|---|---|---|---|---|
| | 2001 Actual | 2002 Budget | 2002 Revised | 2003 Budget | Variation (a) | |||||
| | ($ million) | (%) | ||||||||
| Current assets | ||||||||||
| Cash assets | (0.8 | ) | (0.8 | ) | (0.8 | ) | (0.8 | ) | — | |
| Other financial assets | — | — | — | — | — | |||||
| Receivables | 3.6 | 3.6 | 3.6 | 3.6 | — | |||||
| Inventories | — | — | — | — | — | |||||
| Prepayments | 0.6 | 0.6 | 0.6 | 0.6 | — | |||||
| Other | — | — | — | — | — | |||||
| Total current assets | 3.4 | 3.4 | 3.4 | 3.4 | — | |||||
| Non-current assets | — | |||||||||
| Receivables | 3.4 | 3.4 | 3.4 | 3.9 | 14.7 | |||||
| Inventories | — | — | — | — | — | |||||
| Other financial assets | — | — | — | — | — | |||||
| Property, plant and equipment | 9.3 | 12.9 | 36.3 | 88.8 | 587.8 | |||||
| Intangible assets | — | — | — | — | — | |||||
| Other | — | — | — | — | — | |||||
| Total non-current assets | 12.7 | 16.3 | 39.8 | 92.7 | 467.2 | |||||
| Total assets | 16.1 | 19.8 | 43.2 | 96.1 | 386.6 | |||||
| Current liabilities | — | |||||||||
| Payables | 3.2 | 3.2 | 3.2 | 3.6 | 10.8 | |||||
| Interest bearing liabilities | — | — | — | — | — | |||||
| Provisions(b) | 3.9 | 3.9 | 3.9 | 3.9 | — | |||||
| Other | 0.1 | 0.1 | 0.1 | 0.1 | — | |||||
| Total current liabilities | 7.2 | 7.2 | 7.2 | 7.6 | 4.8 | |||||
| Non-current liabilities | — | |||||||||
| Interest bearing liabilities | — | — | — | — | — | |||||
| Provisions(b) | 6.3 | 6.3 | 6.3 | 6.6 | 4.5 | |||||
| Other | — | — | — | — | — | |||||
| Amounts owing to other departments | — | — | — | — | — | |||||
| Total non-current liabilities | 6.3 | 6.3 | 6.3 | 6.6 | 4.5 | |||||
| Total liabilities | 13.6 | 13.6 | 13.6 | 14.2 | 4.7 | |||||
| Net assets | 2.5 | 6.2 | 29.6 | 81.9 | 1 226.2 | |||||
| Equity | — | |||||||||
| Contributed capital | — | 3.7 | 27.1 | 79.4 | 2 074.9 | |||||
| Reserves | — | — | — | — | — | |||||
| Accumulated surplus | 2.5 | 2.5 | 2.5 | 2.5 | — | |||||
| Total equity | 2.5 | 6.1 | 29.6 | 81.9 | 1 232.8 | |||||
Source: Department of Treasury and Finance
Notes:
- (a)
- Variation between 2001-02 Budget and 2002-03 Budget.
- (b)
- Includes employee costs and superannuation
Table 2.4.4: Statement of Cash Flows
| | 2000-01 Actual | 2001-02 Budget | 2001-02 Revised | 2002-03 Budget | Variation(a) | |||||
|---|---|---|---|---|---|---|---|---|---|---|
| | ($ million) | (%) | ||||||||
| Cash flows from operating activities | ||||||||||
| Receipts from Government | 154.3 | 303.3 | 260.8 | 431.1 | 42.2 | |||||
| Receipts from other entities | 1.5 | 0.3 | 12.2 | 0.3 | — | |||||
| Payments for supplies, grants and employees | (156.6 | ) | (298.0 | ) | (268.7 | ) | (420.7 | ) | 41.2 | |
| (0.8 | ) | 5.5 | 4.3 | 10.7 | 94.4 | |||||
| Interest received | — | — | — | — | — | |||||
| Other revenue | 2.6 | — | — | — | — | |||||
| Capital asset charge | (0.8 | ) | (2.1 | ) | (1.7 | ) | (4.0 | ) | 92.5 | |
| Borrowing costs expense | — | — | — | — | — | |||||
| Net cash inflow from operating activities | 1.0 | 3.4 | 2.6 | 6.7 | 95.6 | |||||
| Cash flows from investing activities | ||||||||||
| Payments for property, plant and equipment(b) | (2.9 | ) | (7.1 | ) | (29.7 | ) | (59.0 | ) | 735.0 | |
| Proceeds from sale of property, plant and equipment | — | — | — | — | — | |||||
| Payments for investments | — | — | — | — | — | |||||
| Proceeds from sale of business assets | — | — | — | — | — | |||||
| (Repayment of) loans by other entities | — | — | — | — | — | |||||
| Net cash (outflow) from investing activities | (2.9 | ) | (7.1 | ) | (29.7 | ) | (59.0 | ) | 735.0 | |
| Cash flows from financing activities | ||||||||||
| Net Proceeds from capital contribution by State Government | 5.0 | 3.7 | 27.1 | 52.3 | 1 333.4 | |||||
| Net proceeds of borrowings | — | — | — | — | — | |||||
| Repayment of finance leases | — | — | — | — | — | |||||
| Net cash inflow (outflow) from financing activities | 5.0 | 3.7 | 27.1 | 52.3 | 1 333.4 | |||||
| Net increase (decrease) in cash held | 3.1 | — | — | — | — | |||||
| Cash at the beginning of the financial year | (3.9 | ) | (0.8 | ) | (0.8 | ) | (0.8 | ) | — | |
| Cash at the end of the financial year | (0.8 | ) | (0.8 | ) | (0.8 | ) | (0.8 | ) | — | |
Source: Department of Treasury and Finance
Notes:
- (a)
- Variation between 2001-02 Budget and 2002-03 Budget.
- (b)
- Includes payments for land held for resale and research and development costs.
Table 2.4.5: Administered Items Statement
| | 2000-01 Actual | 2001-02 Budget | 2001-02 Revised | 2002-03 Budget | Variation(a) | ||||||
|---|---|---|---|---|---|---|---|---|---|---|---|
| | ($ million) | (%) | |||||||||
| Administered revenue | |||||||||||
| Appropriations—Payments made on behalf of the State | — | — | — | — | — | ||||||
| Output Appropriation | — | — | — | — | — | ||||||
| Special appropriations | — | — | — | — | — | ||||||
| Resources received free of charge or for nominal consideration | — | — | — | — | — | ||||||
| Sale of goods and services | — | — | — | — | — | ||||||
| Commonwealth grants | 1.2 | — | 0.2 | 0.2 | — | ||||||
| Other grants | — | — | — | — | — | ||||||
| Taxes | — | — | — | — | — | ||||||
| Fines | — | 0.2 | 0.2 | 0.2 | — | ||||||
| Fees | — | 2.2 | 2.2 | 2.2 | — | ||||||
| Other | 1.0 | 12.6 | 12.6 | 7.1 | (43.6 | ) | |||||
| Total administered revenue | 2.2 | 14.9 | 15.1 | 9.6 | (35.5 | ) | |||||
| Administered expenses | |||||||||||
| Expenses on behalf of the State | — | — | — | — | — | ||||||
| Grants and other payments | — | — | — | — | — | ||||||
| Payments into the Consolidated Fund | 2.5 | 14.9 | 15.1 | 9.6 | (35.5 | ) | |||||
| Total administered expenses | 2.5 | 14.9 | 15.1 | 9.6 | (35.5 | ) | |||||
| Revenue less expenses | (0.4 | ) | — | — | — | — | |||||
| Administered assets | |||||||||||
| Cash assets | (0.0 | ) | (0.0 | ) | (0.0 | ) | (0.0 | ) | — | ||
| Receivables | 39.5 | 39.5 | 39.5 | 39.5 | — | ||||||
| Other financial assets | — | — | — | — | — | ||||||
| Inventories | — | — | — | — | — | ||||||
| Prepayments | — | — | — | — | — | ||||||
| Property, plant and equipment | — | — | — | — | — | ||||||
| Intangible assets | — | — | — | — | — | ||||||
| Other | — | — | — | — | — | ||||||
| Total administered assets | 39.5 | 39.5 | 39.5 | 39.5 | — | ||||||
| Administered liabilities | |||||||||||
| Payables | — | — | — | — | — | ||||||
| Interest bearing liabilities | — | (0.0 | ) | (0.0 | ) | (0.0 | ) | — | |||
| Provisions | — | — | — | — | — | ||||||
| Amounts owing to other departments | — | — | — | — | — | ||||||
| Other | — | — | — | — | — | ||||||
| Total administered liabilities | — | (0.0 | ) | (0.0 | ) | (0.0 | ) | — | |||
Source: Department of Treasury and Finance
Notes:
Statement of Cash Flows
The significant movement relates to the cash flows from investing activities, which reflects the increase in the department's asset investment program, as noted in the commentary for the Statement of Financial Position.
Authority for Resources
This section provides a summary of the sources of Parliamentary Authority available to the Department to fund the provision of outputs, payments on behalf of State, and additions to the net asset base.
Table 2.4.6: Parliamentary Authority for Resources
| | 2001-02 Budget | 2001-02 Revised | 2002-03 Budget | Variation(a) | |||||
|---|---|---|---|---|---|---|---|---|---|
| | ($ million) | (%) | |||||||
| Annual appropriations(b) | 252.2 | 189.4 | 423.8 | 68.0 | |||||
| Receipts credited to appropriations | 0.3 | — | — | (100.0 | ) | ||||
| Unapplied previous years appropriation | 54.7 | 98.4 | 60.2 | 10.1 | |||||
| Accumulated surplus—previously applied appropriation | — | — | — | — | |||||
| Gross annual appropriation | 307.2 | 287.8 | 484.0 | 57.5 | |||||
| Special appropriations | — | — | — | — | |||||
| Trust funds | — | — | — | — | |||||
| Total Parliamentary authority | 307.2 | 287.8 | 484.0 | 57.5 | |||||
Source: Department of Treasury and Finance
Notes:
- (a)
- Variation between 2001-02 Budget and 2002-03 Budget.
- (b)
- 2001-02 Revised includes the impact of approved Treasurer's Advances.
PART 1: OUTLOOK AND OUTPUTS
Overview
The Department of Justice provides the primary organisational, policy and management focus for the four separate Ministerial responsibilities within the Justice Portfolio as follows:
Attorney-General
- •
- Providing Legal Support for Government with a focus on law reform, legal services to government in the operation of courts and tribunals, advice on native title issues, and privacy regulation. Support is also provided for state electoral services and the maintenance of an effective system for the registration of births, deaths and marriages.
- •
- Dispensing Justice including the provision of prosecutorial services on behalf of the government, administrative support for case processing in the jurisdictions of the various State courts, statutory tribunals and alternative civil dispute resolution processes, and also administering support services for victims of crime.
- •
- Enforcing Court Orders including judicial fines, orders and warrants, the management of asset confiscations and the processing of traffic fines.
- •
- Achieving Equal Opportunity through the provision of equity and human rights information, discrimination complaint resolution services and advocacy and guardianship services for people with disabilities.
Minister for Corrections
- •
- Enforcing Correctional Orders through management of the State's correctional system and the supervision and support of convicted and remanded prisoners as well as offenders under supervision in the community.
Minister for Police and Emergency Services
- •
- Enhancing Public Safety Policy, including legislative and program development advice concerning crime prevention, and planning and management of arrangements to prevent and respond to fire and other emergencies affecting public safety.
- •
- Maintaining Emergency Prevention and Response capabilities through oversight of the State's Emergency Services Organisations.
- •
- Overall responsibility for policing through the key activities of crime prevention, crime identification and investigation, police prosecution and management of persons in custody, road traffic law enforcement and the management of incidents, events and emergencies.
Minister for Consumer Affairs
Protecting Consumers through the development and enforcement of fair trading laws, the licensing of certain business classes and the provision of information and education to reduce marketplace disputes.
Corporate Services
The Department's cross portfolio policy responsibilities and obligations include:
- •
- securing cooperation, coordination and cohesion amongst Portfolio agencies to enhance service delivery capabilities;
- •
- promoting increased efficiency, effectiveness and accountability of service delivery and resource management in all organisations associated with the Justice Portfolio; and
- •
- providing executive services to Ministers.
Review of 2001-02
The Department expects to meet its overall budget and output performance targets. All major service initiatives for which provisions were made in the 2001-02 Budget and subsequent budget reviews concerning the early implementation of the Government's priority election commitments will be either successfully implemented or substantially progressed.
2002-03 Outlook
The Government's Growing Victoria Together policy framework provides a new vision for building a fair, sustainable and prosperous Victoria. The Justice Portfolio has an important contribution to make to the focus on 'safe streets, homes and workplaces' and 'promoting rights and diversity' through public safety, crime and violence prevention strategies and the development of a more integrated justice system that improves access to justice and better protects the rights of Victorians, especially those who are most disadvantaged.
Targeted outcomes from policy implementation and output and asset investment initiatives for 2002-03 can be summarised under the nine strategic objectives for the Department of Justice that have been endorsed by the Expenditure Review Committee of Cabinet as being consistent with Growing Victoria Together outcomes. They are as follows:
A reduction in the incidence of violent crime in targeted areas
- •
- Partnerships between Crime Prevention Victoria, Victoria Police and the community are utilising the latest available evidence of what works, together with detailed analysis of local crime trends in order to build customised crime reduction strategies around specific target zones and target groups.
Maintain and enhance the confidence of Victorians in their personal safety and reduce their fear of crime
- •
- Victoria Police are recruiting an additional 800 operational police as part of the Government's commitment to maintaining an effective community safety presence.
- •
- The Department is developing a State-wide Integrated Public Safety Communications Strategy which will progressively enhance the operational capabilities of the State's Emergency Service Organisations.
Reduce Victoria's road toll
Reduce the time taken to dispose of matters in courts and tribunals
- •
- The Criminal Justice Enhancement Program will continue to facilitate reforms to administrative processes, primarily through the development of sophisticated information technology applications, which will result in the more efficient and timely disposition of court and tribunal matters.
Improve access to justice services particularly to legal aid, victim support services and alternative dispute resolution
- •
- Interactive on-line dispute resolution will be developed and piloted in Consumer and Business Affairs Victoria and the Dispute Settlement Centre of Victoria as a mediation option for resolving neighbourhood or community disputes, with a potentially wide application across other state government departments, local government and community agencies.
- •
- Victims of crime will benefit from a cross-governmental Review of Victims Services that seeks to better align the level and nature of assistance provided by the Government with client needs and agency service capacity.
Improve Victorians' confidence in the legal and courts system
- •
- Key principles and objectives that will lay the foundations for building a justice system that is fair, accessible and understandable will be articulated through a 'Justice Statement' together with the development of a five year strategy plan for the courts which will be used to underpin more effective resource planning, operational enhancements and the further application of IT based system improvements in a five year strategy plan for courts, tribunals and related agencies.
- •
- The independent and community based Law Reform Commission will continue to promote progressive and innovative changes to the laws and justice system in Victoria. The advice provided by the Commission will assist the Government to develop, and the Department of Justice to administer, appropriate state laws that reflect underlying societal values and community standards.
Reduce offending and re-offending rates and the number of prisoners returning to prison
- •
- The implementation of a revitalised whole-of-government strategy to reduce re-offending will include available alternatives to divert low risk offenders from custodial sentences to appropriate and effective community supervision and treatment orders, an enhancement of prison based prisoner support programs and the expansion of pre and post release supports to reduce the likelihood of released prisoners returning to the correctional system.
- •
- Existing prison facilities will be expanded to meet projected growth in prison numbers alongside the Government's Reducing Offending Strategy to ensure that the Victorian prison system provides safe, secure and humane correctional facilities and an environment conducive to rehabilitation.
Improve access to consumer protection services, particularly for vulnerable groups
- •
- The Consumer Justice Strategy, in both metropolitan and rural and regional Victoria, will involve targeted education and information campaigns so that the most vulnerable consumers are aware of their rights and responsibilities and are assisted in asserting these rights. In support of this initiative a vigorous campaign will target those traders who act to flout the law and take advantage of consumers who may be unaware of their rights to ensure they comply with the law and act responsibly in their dealings with consumers.
Improve access to human rights protection services in targeted areas
- •
- Community awareness of equal opportunity rights and responsibilities will be improved through initiatives of the Equal Opportunity Commissioner to target examples of systemic discrimination. Legislation that provides for all Victorians to be protected from discrimination and abuse will be clarified and actively administered.
- •
- The Office of the Public Advocate will continue to promote the rights and dignity of people with disabilities and to provide advocacy and guardianship services where necessary.
- •
- The Aboriginal Justice Agreement, entering its third year of implementation, is providing a dynamic whole-of-government framework for agencies and the Aboriginal community to work together to address the complex issues that underpin overrepresentation of Aboriginals in the criminal justice system and the disproportionately high level of indigenous disadvantage.
Output Information
The following section provides details of the outputs to be provided to Government, including their performance measures and the costs for each output. The table below summaries the total cost for outputs.
Table 2.5.1: Output summary
| | 2001-02 Budget(a) | 2001-02 Revised | 2002-03 Budget | Variation(b) | ||||
|---|---|---|---|---|---|---|---|---|
| | ($ million) | (%) | ||||||
| Public Safety Policy | 12.4 | 12.3 | 12.7 | 2.9 | ||||
| Emergency Prevention and Response | 65.6 | 93.3 | 83.0 | 26.6 | ||||
| Crime Prevention | 344.7 | 359.5 | 384.4 | 11.5 | ||||
| Incident, Emergency and Event Management | 115.2 | 119.0 | 127.5 | 10.7 | ||||
| Crime Identification and Investigation | 306.8 | 324.1 | 345.8 | 12.7 | ||||
| Road Safety | 86.9 | 90.4 | 96.7 | 11.3 | ||||
| Supporting the Judicial Process | 177.4 | 185.7 | 197.6 | 11.4 | ||||
| Legal Support for Government | 44.1 | 45.7 | 71.2 | 61.5 | ||||
| Dispensing Justice | 264.4 | 267.8 | 289.4 | 9.5 | ||||
| Enforcing Court Orders | 59.6 | 54.9 | 88.3 | 48.1 | ||||
| Enforcing Correctional Orders | 252.7 | 266.4 | 288.3 | 14.1 | ||||
| Achieving Equal Opportunity | 9.2 | 10.1 | 10.4 | 12.7 | ||||
| Protecting Consumers | 40.1 | 42.5 | 45.3 | 13.1 | ||||
| Total | 1 779.2 | 1 871.7 | 2 040.6 | 14.7 | ||||
Source: Department of Treasury and Finance
Notes:
- (a)
- 2001-02 Output Budget incorporates changes to Output structure and organisational restructuring and therefore may differ from figures published in the 2001-02 Budget.
- (b)
- Variation between 2001-02 and 2002-03 Budget.
Public Safety Policy
These outputs involve:
Providing a focus for public safety policy development and advice to the Minister, new policy implementation, coordination and effectiveness evaluation, including implementation of 'Safer Streets and Homes', the Crime and Violence Prevention Strategy for Victoria
These outputs make a significant contribution to the achievement of the following Departmental Objective:
- •
- Maintain and enhance the confidence of Victorians in their personal safety and reduce their fear of crime.
These outputs contribute to the following Key Government Outcomes:
Victorian communities are safe and people feel confident about their safety.
Linked to the following Growing Victoria Together Priorities:
- •
- Safe streets, homes and workplaces;
- •
- Building cohesive communities and reducing inequalities: support for new community building initiatives;
- •
- High quality, accessible health and community services: support for older people to live an active life in the community; and
- •
- More jobs and thriving, innovative industries across Victoria: attracting business investment and improving business confidence.
| Major Outputs/Deliverables Performance Measures | Unit of Measure | 2000-01 Actual | 2001-02 Target | 2001-02 Expected Outcome | 2002-03 Target | |||||
|---|---|---|---|---|---|---|---|---|---|---|
| Crime and Violence Prevention—coordinates Government's initiatives and undertakes targeted research and community projects to prevent violence and crime. | ||||||||||
| Quantity | ||||||||||
| Service capacity | hours | nm | 9 600 | 10 320 | 10 080 | |||||
| Quality | ||||||||||
| Advice meets internal benchmarks | per cent | nm | 95 | 95 | 95 | |||||
| Timeliness | ||||||||||
| Achievement of milestone targets for grant processing | per cent | 100 | 100 | 100 | 100 | |||||
| Cost | ||||||||||
| Total output cost | $ million | 4.3 | 7.1 | 5.9 | 6.2 | |||||
Emergency Readiness Support—establishes and monitors performance standards for fire and emergency services and provides the Minister with high level emergency management advice. | ||||||||||
| Quantity | ||||||||||
| Service capacity | hours | nm | 8 041 | 8 280 | 10 572 | |||||
| Quality | ||||||||||
| Advice meets internal benchmarks | per cent | nm | 95 | 95 | 95 | |||||
| Timeliness | ||||||||||
| Agreed time-lines met | per cent | nm | 95 | 95 | 95 | |||||
| Cost | ||||||||||
| Total output cost | $ million | 4.7 | 5.3 | 6.4 | 6.5 | |||||
Source: Department of Justice
Emergency Prevention and Response
These outputs:
Support emergency prevention and response services provided by the Metropolitan Fire and Emergency Services Board, Country Fire Authority and Victoria State Emergency Services.
These outputs make a significant contribution to the achievement of the following Departmental Objectives:
- •
- Maintain and enhance the confidence of Victorians in their personal safety; and
- •
- Reduce Victoria's road toll.
These outputs contribute to the following Key Government Outcome:
Victorian communities are safe and people feel confident about their safety.
Linked to the following Growing Victoria Together Priorities:
- •
- Safe streets, homes and workplaces;
- •
- More jobs and thriving, innovative industries across Victoria: attracting business investment and improving business confidence; and
- •
- Promoting sustainable development: improving the sustainability of natural resource industries.
| Major Outputs/Deliverables Performance Measures | Unit of Measure | 2000-01 Actual | 2001-02 Target | 2001-02 Expected Outcome | 2002-03 Target | |||||
|---|---|---|---|---|---|---|---|---|---|---|
| Metropolitan Fire and Emergency Services—provide for fire suppression, fire prevention, emergency prevention and response services in the metropolitan fire district. | ||||||||||
| Quantity | ||||||||||
| Firefighters on duty 24 hours a day | number | nm | >248 | >248 | >248 | |||||
| Quality | ||||||||||
| Structural fire contained to room of origin | per cent | nm | 85 | 85 | 90 | |||||
| Timeliness | ||||||||||
| Response time at the 90th Percentile | minutes | nm | 7.7 | 7.7 | 7.7 | |||||
| Cost | ||||||||||
| Total output cost | $ million | 17.9 | 17.8 | 18.6 | 18.8 | |||||
Rural and Regional Fire Services—provide for fire suppression and fire prevention services in the country areas of Victoria and some designated outer Melbourne metropolitan fire districts. | ||||||||||
| Quantity | ||||||||||
| Service delivery points | number | nm | 1 259 | 1 259 | 1 258 | |||||
| Timeliness | ||||||||||
| Response to road accident rescue calls meeting benchmark times | per cent | 90 | 90 | 90 | 90 | |||||
| Cost | ||||||||||
| Total output cost | $ million | 54.7 | 36.4 | 39.5 | 35.6 | |||||
State-wide Emergency Services—provides for the management of major natural disasters, provision of road accident rescue and support of local government and communities in disaster prevention and mitigation. | ||||||||||
| Quantity | ||||||||||
| Volunteer Units | number | nm | 145 | 149 | 149 | |||||
| Quality | ||||||||||
| Audited municipal emergency management plans meeting Ministerial guidelines after 12 month rectification period | per cent | 100 | 100 | 100 | 100 | |||||
| Timeliness | ||||||||||
| Response to road accident rescue calls meeting benchmark times | per cent | 95 | 90 | 90 | 90 | |||||
| Cost | ||||||||||
| Total output cost | $ million | 22.8 | 11.4 | 35.2 | 28.6 | |||||
Crime Prevention
These outputs:
Establish a visible and accessible police presence in the community and provide public safety programs which enhance community confidence and reduce the fear of crime
These outputs make a significant contribution to the achievement of the following Departmental Objective:
- •
- Maintain and enhance the confidence of Victorians in their personal safety and reduce their fear of crime.
These outputs contribute to the following Key Government Outcome:
Victorian communities are safe and people feel confident about their safety.
Linked to the following Growing Victoria Together Priorities:
- •
- Safe streets, homes and workplaces; and
- •
- Building cohesive communities and reducing inequalities: support for new community building initiatives.
| Major Outputs/Deliverables Performance Measures | Unit of Measure | 2000-01 Actual | 2001-02 Target | 2001-02 Expected Outcome | 2002-03 Target | |||||
|---|---|---|---|---|---|---|---|---|---|---|
| Police Presence in the Community—establishes and promotes a high level of visible presence in the community through general and targeted police patrols (vehicle, foot and bicycle), public relations events and accessible operational service locations. | ||||||||||
| Quantity | ||||||||||
| Total number of patrol hours | hours ('000) | 2 223 | 2 500 | 3 120 | 3 120 | |||||
| Total hours of assistance to the community at police stations/work areas | ('000) hours | 1 164 | 1 250 | 2 100 | 2 000 | |||||
| Quality/Timeliness | ||||||||||
| Proportion of people who are satisfied with services provided by Police | per cent | nm | nm | nm | 78 | |||||
| Proportion of people who have confidence in the Police | per cent | nm | nm | nm | 82 | |||||
| Cost | ||||||||||
| Total output cost | $ million | na | 309.9 | 322.7 | 340.1 | |||||
Community Safety Programs—establishes and promotes police involvement in community and inter-agency partnerships aimed at preventing or addressing local crime, reducing the fear of crime and enhancing awareness of public safety issues. | ||||||||||
| Quantity | ||||||||||
| Total hours of police service | hours ('000) | 578 | 650 | 706 | 705 | |||||
| Quality/Timeliness | ||||||||||
| Proportion of people who are satisfied with police support for community programs | per cent | 74 | 75 | 76.3 | 75 | |||||
| Cost | ||||||||||
| Total output cost | $ million | na | 34.8 | 36.8 | 44.3 | |||||
Incident, Emergency and Event Management
These outputs:
Provide timely response by police to calls for assistance in matters of personal and public safety, manages and polices public events and demonstrations, provides VIP and protective security and provides a planned and co-ordinated response to major emergencies and disasters.
These outputs make a significant contribution to the achievement of the following Departmental Objective:
- •
- Maintain and enhance the confidence of Victorians in their personal safety and reduce their fear of crime.
These outputs contribute to the following Key Government Outcomes:
Victorian communities are safe and people feel confident about their safety.
Linked to the following Growing Victoria Together Priorities:
- •
- Safe streets, homes and workplaces; and
- •
- Building cohesive communities and reducing inequalities: support for new community building initiatives.
| Major Outputs/Deliverables Performance Measures | Unit of Measure | 2000-01 Actual | 2001-02 Target | 2001-02 Expected Outcome | 2002-03 Target | |||||
|---|---|---|---|---|---|---|---|---|---|---|
| Response Readiness—establishes and promotes police participation in planned and co-ordinated responses to major emergencies and disasters. | ||||||||||
| Quantity | ||||||||||
| Total number of joint emergency response exercises conducted | number | 123 | 150 | 98 | 150 | |||||
| Number of divisional and municipal emergency response exercises participated in: | number | |||||||||
| • Divisional | 105 | 92 | 108 | 100 | ||||||
| • Municipal | 369 | 234 | 260 | 250 | ||||||
| Quality | ||||||||||
| Proportion of Divisional Emergency Response Planning Committees that conduct a minimum of two meeting per year | per cent | 100 | 100 | 100 | 100 | |||||
| Timeliness | ||||||||||
| Proportion of Divisional Emergency Response Planning Committee debriefs conducted within 6 weeks of a major incident occurring in the Region | per cent | 100 | 100 | 100 | 100 | |||||
| Cost | ||||||||||
| Total output cost | $ million | na | 5.1 | 5.3 | 5.6 | |||||
Response to Incidents—provides police response to calls for assistance, including emergencies, serious incidents, offence attendance and routine response to calls for emergency assistance. | ||||||||||
| Quantity | ||||||||||
| Number of calls for assistance to which a response is dispatched | number ('000) | 798.69 | 800 | 808 | 810 | |||||
| Quality | ||||||||||
| Proportion of the community who report being satisfied with the service received from Police (during most recent contact) | per cent | nm | nm | nm | 85 | |||||
| Cost | ||||||||||
| Total output cost | $ million | 69.6 | 70.2 | 72.1 | 77.7 | |||||
Event Management—provides management and policing of public events and demonstrations, and the management and provision of VIP and protective security. | ||||||||||
| Quantity | ||||||||||
| Number of managed events | number | 2 266 | 1 600 | 1 830 | 1 700 | |||||
| Quality | ||||||||||
| Proportion of crowd controlled major events and demonstrations which do not result in major incidents | per cent | 99.5 | 98.0 | 98.0 | 98.0 | |||||
| Timeliness | ||||||||||
| Police attendance is in accord with time-lines specified in Event Management Plans/Operational Orders | per cent | 99.5 | 98.0 | 98.0 | 98.0 | |||||
| Cost | ||||||||||
| Total output cost | $ million | 39.5 | 39.9 | 41.6 | 44.2 |
Source: Department of Justice
Crime Identification and Investigation
These outputs involve:
Police investigating reported and detected crime and providing an appropriate and effective response to reported crime.
These outputs make a significant contribution to the achievement of the following Departmental Objectives:
- •
- Maintain and enhance the confidence of Victorians in their personal safety and reduce their fear of crime; and
- •
- Reduce the incidence of violent crime in targeted areas
These outputs contribute to the following Key Government Outcome:
Victorian communities are safe and people feel confident about their safety.
Linked to the following Growing Victoria Together Priorities:
- •
- Safe streets, homes and workplaces; and
- •
- Building cohesive communities and reducing inequalities: support for new community building initiatives.
| Major Outputs/Deliverables Performance Measures | Unit of Measure | 2000-01 Actual | 2001-02 Target | 2001-02 Expected Outcome | 2002-03 Target | |||||
|---|---|---|---|---|---|---|---|---|---|---|
| Investigation of Crimes against the Person—provides for the investigation of reported and detected crimes against the person (including murder, sexual assault, armed robbery and physical assault). | ||||||||||
| Quantity | ||||||||||
| Total hours of investigation | hours ('000) | 834 | 1 442 | 1 600 | 1 650 | |||||
| Quality | ||||||||||
| Proportion of all recorded offences against the person resolved | per cent | 71 | 68 | 67 | 68 | |||||
| Timeliness | ||||||||||
| Proportion of all reported offences resolved within 90 days | per cent | 59.6 | 64 | 61 | 61 | |||||
| Cost | ||||||||||
| Total output cost | $ million | 107.9 | 107.7 | 114.6 | 120.6 | |||||
Investigation of Crimes against Property—provides for the investigation of reported and detected property crimes (including burglary, theft, arson and deception). | ||||||||||
| Quantity | ||||||||||
| Total hours of investigation | hours ('000) | 1 196 | 1 740 | 2 000 | 2 000 | |||||
| Quality | ||||||||||
| Proportion of all recorded property offences resolved | per cent | 25.8 | 26 | 24.3 | 24 | |||||
| Timeliness | ||||||||||
| Proportion of all recorded offences resolved within 90 days | number | 23.7 | 24 | 22 | 24 | |||||
| Cost | ||||||||||
| Total output cost | $ million | 137.7 | 137.4 | 144.0 | 156.3 | |||||
Investigation of Illegal Drug Activity—provides for the investigation of reported and detected illegal drug activity (including cultivation, manufacture and trafficking). | ||||||||||
| Quantity | ||||||||||
| Total hours of investigation | hours ('000) | 557.55 | 600 | 560 | 600 | |||||
| Quality | ||||||||||
| Proportion of all recorded drug offences resolved | per cent | 98.7 | 98 | 98 | 98 | |||||
| Timeliness | ||||||||||
| Proportion of all reported offences resolved within 90 days | per cent | 90 | 91 | 91 | 91 | |||||
| Cost | ||||||||||
| Total output cost | $ million | 61.8 | 61.7 | 65.5 | 68.9 | |||||
Source: Department of Justice
Road Safety
These outputs involve:
Reducing the incidence of impaired driving and other traffic offences and police attendance at and investigation of major collisions and other road traffic incidents.
These outputs make a significant contribution to the achievement of the following Departmental Objective:
- •
- Reduce Victoria's Road Toll.
These outputs contribute to the following Key Government Outcome:
Victorian communities are safe and people feel confident about their safety.
Linked to the following Growing Victoria Together Priority:
- •
- Safe streets, homes and workplaces.
| Major Outputs/Deliverables Performance Measures | Unit of Measure | 2000-01 Actual | 2001-02 Target | 2001-02 Expected Outcome | 2002-03 Target | |||||
|---|---|---|---|---|---|---|---|---|---|---|
| Road Safety Strategies and Awareness—provides police road safety programs and collision and traffic enforcement research. | ||||||||||
| Quantity | ||||||||||
| Total hours committed to road safety strategies and awareness programs | hours ('000) | nm | 36 | 35.4 | 36 | |||||
| Number of road safety programs delivered to community groups and schools | number | nm | 2 500 | 2 230 | 2 600 | |||||
| Cost | ||||||||||
| Total output cost | $ million | na | 3.2 | 3.4 | 3.6 | |||||
Road Traffic Law Enforcement—provides targeted police services to reduce the incidence of impaired driving and other traffic offences. | ||||||||||
| Quantity | ||||||||||
| Total hours of operation | hours ('000) | 829.62 | 850 | 1 200 | 1 200 | |||||
| Quality | ||||||||||
| Targeting of operations is in line with priorities identified in the State-wide Traffic Calendar. | per cent | 99.24 | 100 | 100 | 100 | |||||
| Timeliness | ||||||||||
| Proportion of operations which comply with timelines contained in the Road Safety Priority Program | per cent | 98 | 100 | 100 | 100 | |||||
| Cost | ||||||||||
| Total output cost | $ million | na | 68.0 | 70.4 | 75.6 | |||||
Road Traffic Incident/Collision Management—provides for police attendance at major collisions and road traffic accidents and the investigation of major collisions. | ||||||||||
| Quantity | ||||||||||
| Number of traffic incidents attended | number | 31 727 | 31 000 | 32 300 | 32 000 | |||||
| Cost | ||||||||||
| Total output cost | $ million | 15.6 | 15.7 | 16.6 | 17.5 | |||||
Source: Department of Justice
Supporting the Justice System
These outputs involve:
Provision of efficient and effective court case management, judicial processing, and court security and ensure the safe, fair and expeditious handling of all persons involved in the judicial process. Safe streets, homes and workplaces.
These outputs make a significant contribution to the achievement of the following Departmental Objective:
- •
- Maintain and enhance the confidence of Victorian's in their personal safety and reduce their fear of crime.
These outputs contribute to the following Key Government Outcome:
Victorian communities are safe and people feel confident about their safety.
Linked to the following Growing Victoria Together Priority:
- •
- Safe streets, homes and workplaces.
| Major Outputs/Deliverables Performance Measures | Unit of Measure | 2000-01 Actual | 2001-02 Target | 2001-02 Expected Outcome | 2002-03 Target | |||||
|---|---|---|---|---|---|---|---|---|---|---|
| Providing Justice Services—provides prosecution services, court case presentation, bail processing and reporting, offender and suspect processing, support to and attendance at coronial inquiries and court security. | ||||||||||
| Quantity | ||||||||||
| Total hours of service | hours ('000) | 2 001.73 | 1 900 | 2 600 | 2 500 | |||||
| Quality | ||||||||||
| Proportion of cases that result in a plea of guilty | per cent | 83.5 | 82.0 | 83.5 | 83.0 | |||||
| Proportion of cases that result in costs being awarded against police | per cent | 0.4 | <1.0 | 0.5 | <1.0 | |||||
| Timeliness | ||||||||||
| Time elapsed between date charges are laid and final disposition of cases prosecuted in the Magistrates' and Children's Courts | days | 98.8 | 93.0 | 103.0 | 93.0 | |||||
| Cost | ||||||||||
| Total output cost | $ million | 149.5 | 149.9 | 156.6 | 166.9 | |||||
Managing People in Police Custody—provides for safe custody and transportation for persons in police custody. | ||||||||||
| Quantity | ||||||||||
| Total hours of prisoner supervision | hours ('000) | 339.72 | 330 | 480 | 400 | |||||
| Quality/Timeliness | ||||||||||
| Ratio of serious incidents to persons in police custody | per cent | 0.095 | <1 | 0.9 | <1.0 | |||||
| Achievement of quality and timeliness standards specified in outsourced service contracts: | per cent | 100 | 100 | 100 | 100 | |||||
| • prisoner transport | ||||||||||
| • custody management | ||||||||||
| Cost | ||||||||||
| Total output cost | $ million | 27.4 | 27.5 | 29.1 | 30.7 | |||||
Source: Department of Justice
These outputs:
Provide the Department's primary focus for state law reform, the development of justice policy and procedures, administrative reviews of justice agencies and the implementation of new or amending legislation. It also provides advice to government on legal matters and solicitor services, and manages a range of legal frameworks on behalf of government including native title issues, protection of privacy, and the conduct of state elections.
The Victorian Law Reform Commission is now accommodated by its own output—law reform. The legal policy output is a new output. In 2001-02, law reform and legal policy were combined in the one output.
These outputs make a significant contribution to the achievement of the following Departmental Objectives:
- •
- Improve access to justice services, particularly legal aid, victim support services and alternative dispute resolution;
- •
- Reduce the time taken to dispose of matters in courts and tribunals; and
- •
- Improve Victorians' confidence in the legal and courts system.
These outputs contribute to the following Key Government Outcomes:
The legal rights of all persons are protected through a just, responsive and accessible legal system in which the community has confidence.
Linked to the following Growing Victoria Together Priority:
- •
- Promoting rights and diversity.
Offenders in Victoria are treated in a just and humane manner and encouraged to adopt law abiding lifestyles.
Linked to the following Growing Victoria Together Priority:
- •
- High quality, accessible health and community services: reduce drug abuse and harm.
Victorian communities are safe and people feel confident about their safety.
Linked to the following Growing Victoria Together Priorities:
- •
- Safe streets, homes and workplaces; and
- •
- Building cohesive communities and reducing inequalities: support for new community building initiatives.
| Major Outputs/Deliverables Performance Measures | Unit of Measure | 2000-01 Actual | 2001-02 Target | 2001-02 Expected Outcome | 2002-03 Target | |||||
|---|---|---|---|---|---|---|---|---|---|---|
| Legal Policy—Provides support to the Attorney-General through the coordination of research, consultation and advice on legal policy and law reform proposals intended for implementation through new or amending legislation and administrative reforms, and attention to pre and post parliamentary matters, assistance with executive matters including correspondence, administration of legislation, administrative reviews of agencies and support for Department of Justice advisory councils, committees and task forces. | ||||||||||
| Quantity | ||||||||||
| Law Reform Projects (including Legislative program matters) | number | nm | 27-30 | 27-30 | 27-30 | |||||
| Capacity to provide advice, Briefings and consultations | hours | nm | 19 000 | 19 000 | 19 000 | |||||
| Quantity | ||||||||||
| Advice meets internal Quality standards | per cent | nm | 95 | 95 | 95 | |||||
| Timeliness | ||||||||||
| Agreed timeliness, milestones or schedules met | per cent | nm | 95 | 70 | 80 | |||||
| Cost | ||||||||||
| Total output cost | $ million | nm | 3.9 | 4.9 | 4.7 | |||||
Law Reform—Undertakes legal and empirical research and provides policy advice to Government on law reform issues referred to the Commission by the Attorney-General, undertakes research and makes recommendations on minor law reform issues raised in community consultations or suggested by the judiciary, the legal profession or by Community Legal Centres, implements proposals through new or amending legislation and administrative reforms. | ||||||||||
| Quantity | ||||||||||
| References and Community Law Reform Projects | number | nm | 3-5 | 3-5 | 6 | |||||
| Community Law Reform Activities | number | nm | 6 | 6 | 6 | |||||
| Quality | ||||||||||
| Projects meet internal quality standards | per cent | nm | 95 | 95 | 95 | |||||
| Timeliness | ||||||||||
| Agreed timelines, milestones or schedules met | per cent | nm | 95 | 95 | 95 | |||||
| Cost | ||||||||||
| Total output cost | $ million | nm | 2.3 | 2.1 | 2.1 | |||||
Legal Advice to Government | ||||||||||
| Quantity | ||||||||||
| Capacity to provide client legal services | hours | 32 160 | 35 000 | 32 500 | 45 000 | |||||
| Quality | ||||||||||
| Client satisfaction with quality of legal advice provided | level | high | high | high | high | |||||
| Timeliness | ||||||||||
| Client satisfaction with timeliness of legal advice provided | level | high | high | high | high | |||||
| Cost | ||||||||||
| Total output cost | $ million | 7.6 | 8.0 | 8.7 | 8.9 | |||||
Privacy Regulation—supports the Office of the Victorian Privacy Commission which is responsible for establishing, implementing and managing a privacy compliance regime within the Victorian public sector as per the Information Privacy Act 2000. | ||||||||||
| Quantity | ||||||||||
| Major promotional activities completed | number | nm | nm | nm | 8 | |||||
| Complaints received | number | nm | nm | nm | 500 | |||||
| Requests for advice/briefing/code | number | nm | nm | nm | 1 000 | |||||
| Quality | ||||||||||
| Client satisfaction with process | per cent | nm | nm | nm | 80 | |||||
| Timeliness | ||||||||||
| Complaints processed within fixed time-lines | per cent | nm | nm | nm | 80 | |||||
| Cost | ||||||||||
| Total output cost | $ million | 0.5 | 5.2 | 3.5 | 3.8 | |||||
Native Title Framework—manages native title claims on behalf of the State; provides leadership on whole-of-government native title policy; coordinates research mediation and negotiation on all claims. | ||||||||||
| Quantity | ||||||||||
| Native title claims for which evidence has been assessed | number | nm | nm | nm | (4) | 4 | ||||
| Quality | ||||||||||
| Claims resolved | per cent | nm | 100 | 100 | 100 | |||||
| Timeliness | ||||||||||
| Achievement of strategic project milestone targets | per cent | nm | 100 | 100 | 100 | |||||
| Cost | ||||||||||
| Total output cost | $ million | 1.3 | 2.0 | 2.1 | 2.1 | |||||
State Electoral Roll and Elections | ||||||||||
| Quantity | ||||||||||
| Elections and by-elections and polls | number | 0 | 1 | 0 | 2 | |||||
| Municipal | number | 3 | 22 | 37 | 53 | |||||
| Non—Government | number | 26 | 13 | 35 | 40 | |||||
| Elector enrolment changes | number | 558 570 | 520 000 | 520 000 | 600 000 | |||||
| Training programs conducted for election officials | number | 2 | 4 | 25 | 34 | |||||
| Quality | ||||||||||
| Election results contested in the Court | number | 0 | 0 | 0 | 0 | |||||
| Timeliness | ||||||||||
| Post election implementation review reports provided | per cent | 100 | 100 | 100 | 100 | |||||
| Cost | ||||||||||
| Total output cost(a) | $ million | 14.9 | 16.6 | 18.5 | 43.4 | |||||
Registration of Births, Deaths and Marriages—Creates and maintains a database of Victorian births, deaths and marriages, name changes and adoptions pursuant to the Births Deaths and Marriages Act 1996 and Commonwealth/State agreements; provides certificates for official use and a range of other products and services to business, government and individuals. | ||||||||||
| Quantity | ||||||||||
| Number of registration transactions | number ('000) | 127.21 | 126 | 128 | 127 | |||||
| Official transactions | number ('000) | 345.19 | 225 | 225 | 225 | |||||
| Discretionary revenue | $'000 | 2 749 | 1 930 | 2 900 | 2 400 | |||||
| Quality | ||||||||||
| Registration transaction error rate | per cent | 0.8 | 0.8 | 0.9 | 0.9 | |||||
| Timeliness | ||||||||||
| Certificate by mail (same day) | per cent | 71.7 | 70 | 90 | 80 | |||||
| Certificate over Counter (1.5 minutes) | per cent | 83.2 | 85 | 85 | 85 | |||||
| Cost | ||||||||||
| Total output cost | $ million | 6.9 | 6.1 | 6.0 | 6.2 | |||||
Source: Department of Justice
Note:
- (a)
- 2002-03 target includes additional special appropriation funding due to the expectation that an election will be held during the financial year. The Victorian Electoral Commission must be prepared at any time within the statutory timeframe to conduct a State election.
Dispensing Justice
These outputs involve:
Supporting the State's judiciary in their dispensation of criminal and civil matters, maintaining the administrative operations of the system of courts and statutory tribunals and providing alternative civil dispute resolution mechanisms. It also manages criminal prosecutions on behalf of the State; provides legal aid for system users and support to victims of crime.
These outputs make a significant contribution to the achievement of the following Departmental Objectives:
- •
- Reduce the time taken to dispose of matters in courts and tribunals;
- •
- Improve access to justice services, particularly legal aid, victim support services and alternative dispute resolution; reduce the time taken to dispose of matters in courts and tribunals;
- •
- Improve Victorians' confidence in the legal and courts system; and
- •
- Reduce offending and re-offending rates and the number of prisoners returning to prison.
These outputs contribute to the following Key Government Outcomes:
The legal rights of all persons are protected through a just, responsive and accessible legal system in which the community has confidence.
Linked to the following Growing Victoria Together Priority:
- •
- Promoting rights and diversity;
Offenders in Victoria are treated in a just and humane manner and encouraged to adopt law abiding lifestyles.
Linked to the following Growing Victoria Together Priority:
- •
- High quality, accessible health and community services: reduce drug abuse and harm.
Victorian communities are safe and people feel confident about their safety.
Linked to the following Growing Victoria Together Priorities:
- •
- Safe streets, homes and workplaces; and
- •
- Building cohesive communities and reducing inequalities: support for new community building initiatives.
| Major Outputs/Deliverables Performance Measures | Unit of Measure | 2000-01 Actual | 2001-02 Target | 2001-02 Expected Outcome | 2002-03 Target | |||||
|---|---|---|---|---|---|---|---|---|---|---|
| Public Prosecutions—Supports the Office of Public Prosecutions to prepare and conduct proceedings in the High Court, Supreme Court, County Court and Magistrates' Court on behalf of the Director of Public Prosecutions in an effective, economical and efficient manner. | ||||||||||
| Quantity | ||||||||||
| Matters prepared for proceedings and attendance at court | number ('000) | 50.097 | 39.7 | 49.5 | 49.5 | |||||
| Quality | ||||||||||
| Client satisfaction with quality of preparation for and conduct of proceedings | per cent | nm | 95 | 95 | 95 | |||||
| Timeliness | ||||||||||
| Matters prepared within statutory time limits | per cent | 95 | 95 | 95 | 95 | |||||
| Cost | ||||||||||
| Total output cost | $ million | 23.5 | 24.9 | 24.2 | 24.8 | |||||
Forensic Evidence—Provides forensic pathology and scientific services through the Victorian Institute of Forensic Medicine, which is responsible for the production of reports to the Coroner as part of death investigations. | ||||||||||
| Quantity | ||||||||||
| Bodies Admitted | Number | nm | 3 200 | 3 020 | 3 000 | |||||
| Quality | ||||||||||
| VIFM Quality Audit | per cent | nm | nm | nm | 95 | |||||
| Timeliness | ||||||||||
| Autopsies completed within 18 working hours of being ordered | per cent | nm | nm | nm | 70 | |||||
| Post mortem reports issued within agreed period | per cent | nm | nm | nm | 70 | |||||
| Cost | ||||||||||
| Total output cost | $ million | 9.9 | 9.2 | 10.7 | 10.8 | |||||
Matters in the Supreme Court—The Supreme Court is the superior court of Victoria and can deal with all manner of cases, both criminal and civil, except those expressly excluded by statute. In the main, it deals with such cases as murder, manslaughter and other serious criminal matters, civil actions involving large claims and appeals against decisions of lower courts. | ||||||||||
| Quantity | ||||||||||
| Matters disposed | number | 19 028 | 17 000-18 000 | 19 000 | 18 000-19 000 | |||||
| Quality | ||||||||||
| User survey rating the registries, Juries Division or Court amenities | level | high | high | high | high | |||||
| Timeliness | ||||||||||
| Criminal Cases disposed of within 12 months of commencement | per cent | 80 | 80 | 80 | 80 | |||||
| Civil cases disposed of within 24 months of commencement | per cent | 85 | 85 | 80 | 80 | |||||
| Cost | ||||||||||
| Total output cost | $ million | 35.0 | 33.6 | 33.9 | 39.0 | |||||
Matters in the County Court—the County Court has jurisdiction in relation to indictable offences, with the exception of murder and treason. The Court also has jurisdiction in civil matters, adoption proceedings and it can hear and determine change of name applications. The Court is a Court of Appeal from Magistrates' Court decisions. | ||||||||||
| Quantity | ||||||||||
| Matters disposed | number | 10 493 | 11 020 | 11 020 | 11 250 | |||||
| Quality | ||||||||||
| Respondents to user survey rating the registry service as good or very good | per cent | 90 | 90 | 90 | 90 | |||||
| Timeliness | ||||||||||
| Criminal Cases disposed of within 12 months of commencement | per cent | 78 | 90 | 75 | 80 | |||||
| Civil cases disposed of within 12 months of commencement | per cent | 57 | 46 | 57 | 50 | |||||
| Cost | ||||||||||
| Total output cost | $ million | 35.5 | 53.1 | 53.1 | 53.3 | |||||
Matters in the Magistrates' Court—The Magistrates' Court of Victoria is responsible for dispensing justice in a wide range of criminal and civil matters of dispute. Registrars perform quasi-judicial functions and together with Court staff, are responsible for the non-judicial operations of the Court and the provision of logistical and administrative support to the judiciary. | ||||||||||
| Quantity | ||||||||||
| Matters disposed | number | 240 733 | 221 100 | 219 300 | 219 000 | |||||
| Quality | ||||||||||
| User survey rating of the registry service | level | high | high | high | high | |||||
| Timeliness | ||||||||||
| Matters finalised within target elapsed time benchmarks | per cent | 95 | 96 | 96 | 96 | |||||
| Cost | ||||||||||
| Total output cost | $ million | 65.0 | 69.6 | 68.1 | 77.4 | |||||
Matters in the Children's Court—The Children's Court of Victoria has criminal and family divisions which hear and determine matters concerning children and young persons under the age of 17 years pursuant to the legislation. | ||||||||||
| Quantity | ||||||||||
| Matters disposed | number | nm | 12 000 | 12 500 | 12 000 | |||||
| Quality | �� | |||||||||
| User survey rating of the registry service | level | nm | high | high | high | |||||
| Timeliness | ||||||||||
| Matters finalised within target elapsed time benchmarks | per cent | nm | 96 | 96 | 96 | |||||
| Cost | ||||||||||
| Total output cost(a) | $ million | 2.5 | 2.3 | 4.5 | 4.7 | |||||
Matters in Coroner's Court—The Coroner's Court is responsible for investigating reportable deaths and fires. The Court ensures that all reportable deaths are investigated appropriately and efficiently and that inquest hearings are held in accordance with legislation and at the request of the State Coroner. Emphasis is placed on Coroner's recommendations relating to injury/death prevention and public health and safety. | ||||||||||
| Quantity | ||||||||||
| Matters disposed | number | nm | 3 100 | 3 800 | 3 100 | |||||
| Quality | ||||||||||
| User survey rating of the registry service | level | nm | high | high | high | |||||
| Timeliness | ||||||||||
| Matters finalised within target elapsed time benchmarks | per cent | nm | 96 | 90 | 90 | |||||
| Cost | ||||||||||
| Total output cost | $ million | 5.1 | 4.6 | 6.2 | 6.5 | |||||
Matters in the Civil and Administrative Tribunal—The Tribunal provides dispute resolution services in civil matters (relating to equal opportunity, discrimination, guardianship, residential and retail tenancies, domestic buildings, credit and small claims), hears administrative appeals (in regard to planning, taxation, traffic accident compensation, land valuation, occupational and business regulation and other general matters) and provides advisory services through various boards. | ||||||||||
| Quantity | ||||||||||
| Matters finalised | number | 95 664 | 89 600 | 90 650 | 92 500 | |||||
| Quality | ||||||||||
| Tribunal user satisfaction | level | high | high | high | high | |||||
| Timeliness | ||||||||||
| Matters finalised within target elapsed time benchmarks | per cent | 90 | 90 | 90 | 90 | |||||
| Cost | ||||||||||
| Total output cost | $ million | 31.1 | 28.6 | 26.9 | 28.4 | |||||
Alternative Dispute Resolution—Provides a low cost, accessible and expeditious civil dispute resolution service for people referred to the Dispute Settlement Centre of Victoria by the courts, government prosecuting and registering agencies, local government and other community agencies. | ||||||||||
| Quantity | ||||||||||
| Responses to general and dispute resolution advisory service inquiries | number | 12 761 | 12 000 | 12 000 | 12 000 | |||||
| Disputes received for resolution | number | 1 756 | 1 500 | 1 500 | 1 500 | |||||
| Public education activities conducted | number | 303 | 300 | 300 | 300 | |||||
| Quality | ||||||||||
| Resolution of mediation options that are activated/conducted | per cent | 32 | 32 | 32 | 32 | |||||
| Clients satisfied with the equity of the outcome of mediation processes | per cent | 91 | 82 | 82 | 82 | |||||
| Timeliness | ||||||||||
| Matters finalised within target elapsed time benchmarks | per cent | 88 | 82 | 82 | 82 | |||||
| Cost | ||||||||||
| Total output cost | $ million | 1.7 | 1.6 | 1.6 | 2.5 | |||||
Legal Aid—Supports Victoria Legal Aid to provide legal assistance and representation to members of the community in legal cases arising under State law. | ||||||||||
| Quantity | ||||||||||
| New applications approved | number | 27 296 | 24 700 | 28 000 | 25 000 | |||||
| Duty lawyer services | number | 32 205 | 37 250 | 37 250 | 37 500 | |||||
| Legal advice | number | 28 491 | 22 600 | 30 000 | 25 000 | |||||
| Telephone information services | number | 41 157 | 42 000 | 42 500 | 42 500 | |||||
| Publications distributed | number | 181 733 | 150 000 | 155 000 | 155 000 | |||||
| Quality/Timeliness | ||||||||||
| Applications processed: | ||||||||||
| • Within 1 day | per cent | 85.53 | 85 | 85 | 85 | |||||
| • within 15 days | per cent | 97.43 | 98 | 98 | 98 | |||||
| Cost | ||||||||||
| Total output cost | $ million | 28.9 | 29.3 | 31.4 | 32.5 | |||||
Victims Support—Provides referral to appropriate support agencies for victims of crime, administers a Victims Counselling Scheme and community program funding to establish victim support networks and specialist state-wide victim support services. | ||||||||||
| Quantity | ||||||||||
| Calls for assistance received | number | 62 475 | 75 000 | 44 000 | 50 000 | |||||
| Clients completing course of counselling | number | 17 250 | 8 000 | 7 500 | 8 000 | |||||
| Public education activities conducted | number | 400 | 250 | 250 | 250 | |||||
| Quality | ||||||||||
| Client Satisfaction Rate | per cent | 85 | 85 | 85 | 85 | |||||
| Timeliness | ||||||||||
| Help-line calls responded to and follow up material provided within benchmarks | per cent | 95 | 95 | 95 | 95 | |||||
| Cost | ||||||||||
| Total output cost | $ million | 11.7 | 7.6 | 7.3 | 9.7 | |||||
Source: Department of Justice
Note:
- (a)
- 2002-03 output cost increased due to the re-allocation of some Magistrates' salaries to the Children's Court.
Enforcing Court Orders
These outputs involve:
Enforcing judicial fines, court orders and warrants and processing traffic infringement notices. Unpaid fines are also followed up on behalf of local government on a fee for service basis.
These outputs make a significant contribution to the achievement of the following Departmental Objective:
Improve Victorians' confidence in the legal and courts system.
These outputs contribute to the following Key Government Outcome:
The legal rights of all persons are protected through a just, responsive and accessible legal system in which the community has confidence.
Linked to the following Growing Victoria Together Priority:
- •
- Promoting rights and diversity.
| Major Outputs/Deliverables Performance Measures | Unit of Measure | 2000-01 Actual | 2001-02 Target | 2001-02 Expected Outcome | 2002-03 Target | |||||
|---|---|---|---|---|---|---|---|---|---|---|
| Traffic Fines Processing—administers the processing of traffic infringement notices, penalty payments and referral for enforcement action where required. | ||||||||||
| Quantity | ||||||||||
| Traffic infringement notices processed | number ('000) | nm (1 178 | ) | nm (903.2 | ) | nm | 1 700 | |||
| CityLink infringement notices processed | number | nm | nm | nm | 540 | |||||
| Quality | ||||||||||
| Prosecutable images | per cent | nm | 75 | 75 | 75 | |||||
| Timeliness | ||||||||||
| Clearance of infringements within 60 days | per cent | nm | 75 | 75 | 72 | |||||
| Cost | ||||||||||
| Total output cost | $ million | 34.5 | 38.7 | 35.2 | 55.1 | |||||
Enforcement of Court Orders and Warrants—supports enforcement action by the Office of the Sheriff as and where necessary to ensure judicial fines, court orders and warrants are discharged and provides fines enforcement services to other state and local government agencies(a). | ||||||||||
| Quantity | ||||||||||
| Total number of infringements processed by PERIN | number ('000) | nm | 597 382 | 609 970 | 875 000 | |||||
| Total number of warrants actioned | number ('000) | nm | 215 580 | 231 802 | 405 000 | |||||
| Quality/Timeliness | ||||||||||
| Clearance of court orders and warrants within 1 year | per cent | nm | 49 | 38 | 41 | |||||
| Cost | ||||||||||
| Total output cost | $ million | 15.1 | 19.0 | 17.8 | 31.2 | |||||
Asset Confiscation Order Processing—provides for the coordination of confiscations and the management or conversion of assets tainted through criminal activity. | ||||||||||
| Quantity | ||||||||||
| Property management cases processed | number | nm | 150 | 150 | 185 | |||||
| Forfeiture orders processed | number | 3 087 | 3 000 | 2 300 | 3 000 | |||||
| Quality | ||||||||||
| Pecuniary penalty orders collections within 2 years from the date of order | per cent | nm | 25 | 25 | 25 | |||||
| Timeliness | ||||||||||
| Property conversion cycle time of 90 days | per cent | 80 | 80 | 80 | 80 | |||||
| Cost | ||||||||||
| Total output cost | $ million | 1.6 | 1.9 | 1.9 | 2.0 | |||||
Source: Department of Justice
Note:
- (a)
- Increase in performance targets and output cost resulting from Road Safety Strategy initiatives.
Enforcing Correctional Orders
These outputs involve:
Ensuring that correctional dispositions of the courts and orders of the Adult Parole Board are implemented through the management of the state's system of correctional facilities and programs for the containment and rehabilitation of prisoners and the community based supervision of offenders.
These outputs make a significant contribution to the achievement of the following Departmental Objective:
- •
- Reduce offending and re-offending rates and the number of prisoners returning to prison.
These outputs contribute to the following Key Government Outcome:
Offenders in Victoria are treated in a just and humane manner and encouraged to adopt law abiding lifestyles.
Linked to the following Growing Victoria Together Priority:
- •
- High quality, accessible health and community services: reduce drug abuse and harm.
| Major Outputs/Deliverables Performance Measures | Unit of Measure | 2000-01 Actual | 2001-02 Target | 2001-02 Expected Outcome | 2002-03 Target | |||||
|---|---|---|---|---|---|---|---|---|---|---|
| Correctional System Management—Provides for the management of the state's system of correctional facilities and programs. Policy and program development advice and information is provided to the Minister for Corrections as well as policy implementation, service redevelopment and the monitoring of service providers to ensure compliance against agreed performance standards. | ||||||||||
| Quantity | ||||||||||
| Service capacity to provide advice, briefings and consultations | hours | nm | 33 000 | 33 000 | 43 300 | |||||
| Quality/Timeliness | ||||||||||
| Advice meets internal quality and timeliness standards | per cent | nm | 95 | 95 | 95 | |||||
| Cost | ||||||||||
| Total output cost | $ million | 12.6 | 24.7 | 17.7 | 33.3 | |||||
Prisoner Supervision and Support—Provides constructive containment of prisoners(a). | ||||||||||
| Quantity | ||||||||||
| Total annual daily average numbers of prisoners | number | 3 276 | 3 650-3 750 | 3 650-3 750 | 3 600-3 800 | |||||
| Average daily prison design capacity utilisation rate | per cent | 113.9 | 120 | 120 | 117 | |||||
| Average daily prison utilisation rate of all permanent and temporary prison capacity | nm | 94-97 | 94-97 | 92-97 | ||||||
| Quality/Timeliness | ||||||||||
| Proportion of benchmark measures in prison services agreement achieved | per cent | 83.7 | 90 | 90 | 90 | |||||
| Cost | ||||||||||
| Total output cost | $ million | 190.7 | 206.6 | 219.3 | 229.9 | |||||
Community Based Offender Supervision—provides for the supervision in the community of offenders on court orders(a). | ||||||||||
| Quantity | ||||||||||
| Community supervision orders registered | number | 17 466 | 17 700 | 17 300 | 17 850 | |||||
| Average daily offenders under community based supervision | number | 6 422 | 6 650-7 050 | 6 600 | 6 650-7 150 | |||||
| Quality | ||||||||||
| Community supervision orders successfully completed | per cent | 70 | 73 | 75 | 75 | |||||
| Offenders with a treatment or personal development program condition who have been appropriately referred to a program | per cent | 86.3 | 85-90 | 87 | 85-90 | |||||
| Timeliness | ||||||||||
| Orders registered within five working days of the order's commencement | per cent | 93.3 | 95 | 95 | 95 | |||||
| Offenders inducted within seven working days of the commencement of the order | per cent | 94.5 | 95 | 95 | 95 | |||||
| Cost | ||||||||||
| Total output cost | $ million | 21.5 | 21.4 | 29.4 | 25.1 |
Source: Department of Justice
Note:
- (a)
- The increase targets reflect increased capacity as a result of CCS Redevelopment over the expected outcome for 2001-02.
Protecting Consumers
These outputs involve:
Developing and administering consumer protection legislation. They, inform people of their rights and responsibilities in the market place, and provide assistance to those seeking redress. Business registers and licences are maintained to ensure minimum standards of transparency and competence and where necessary to influence and regulate trading behaviour.
These outputs make a significant contribution to the achievement of the following Departmental Objective:
- •
- Improve access to consumer protection services, particularly for vulnerable groups.
These outputs contribute to the following Key Government Outcome:
A confident and informed market place where consumers are protected and traders are responsible.
Linked to the following Growing Victoria Together Priority:
- •
- Promoting rights and diversity.
| Major Outputs/Deliverables Performance Measures | Unit of Measure | 2000-01 Actual | 2001-02 Target | 2001-02 Expected Outcome | 2002-03 Target | |||||
|---|---|---|---|---|---|---|---|---|---|---|
| Consumer Awareness and Protection—Provides consumers with information about their rights and responsibilities and access to assistance and redress services to help them to determine and assert their rights. | ||||||||||
| Quantity | ||||||||||
| Preventative and remedial advices provided and residential tenancy bond transactions completed(a) | number | nm | 810 000 | 845 000 | 647 000 | |||||
| Compliance monitoring and enforcement matters | number | 3 539 | 3 300 | 3 300 | 3 400 | |||||
| Quality | ||||||||||
| Clients who are satisfied with the quality of services provided | per cent | nm | 75 | 80 | 80 | |||||
| Timeliness | ||||||||||
| Services provided within elapsed-time standards | per cent | nm | 85 | 85 | 85 | |||||
| Cost | ||||||||||
| Total output cost | $ million | 33.0 | 30.7 | 27.0 | 29.6 | |||||
Business Licensing and Registration—Registers or licenses certain occupations, business names, community organisations and reviews fund raising appeals notifications. | ||||||||||
| Quantity | ||||||||||
| Business licensing and registration transactions and advices provided | number | nm | 355 000 | 355 000 | 355 000 | |||||
| Quality | ||||||||||
| Business clients who are satisfied with the quality of service provided | per cent | nm | 70 | 75 | 75 | |||||
| Timeliness | ||||||||||
| Services delivered within elapsed-time standards | per cent | 90 | 90 | 90 | 90 | |||||
| Cost | ||||||||||
| Total output cost(b) | $ million | 3.9 | 9.4 | 15.5 | 15.7 |
Source: Department of Justice
Notes:
- (a)
- Reduction in the 2002-03 target is due to consumer and residential tenancies telephone enquiry calls satisfied by recorded telephone messages no longer being counted in this measure.
- (b)
- Increase in 2001-02 expected outcome and 2002-03 output cost is due to reallocation of some costs from the Consumer Protection and Awareness output.
Achieving Equal Opportunity
These outputs involve:
Supporting the administration of equal opportunity legislation and the provision of advocacy and guardianship services for adults with disabilities.
These outputs make a significant contribution to the achievement of the following Departmental objective:
- •
- Improve access to human rights protection services in targeted areas.
These outputs contribute to the following Key Government Outcome:
Victorians value diversity and have equality of opportunity.
Linked to the following Growing Victoria Together Priorities:
- •
- Promoting rights and diversity;
- •
- Building cohesive communities and reducing inequalities: better work life balance and enhance participation and engagement in cultural activities; and
- •
- More jobs and thriving innovative industries across Victoria: improvements to the business environment.
| Major Outputs/Deliverables Performance Measures | Unit of Measure | 2000-01 Actual | 2001-02 Target | 2001-02 Expected Outcome | 2002-03 Target | |||||
|---|---|---|---|---|---|---|---|---|---|---|
| Discrimination Prevention and Redress—supports the Equal Opportunity Commission to provide an impartial complaint resolution service for complaints lodged by any member of the Victorian public under State legislation, inform people of their rights and responsibilities and educate the community to promote equality of opportunity and to prevent discrimination, undertake research on discrimination and advise the Government on discriminatory legislation. | ||||||||||
| Quantity | ||||||||||
| Complaint files finalised | number | 1 154 | 1 150 | 1 150 | 1 150 | |||||
| Public enquiries responded to | number | 40 874 | 38 000 | 50 000 | 60 000 | |||||
| Persons who receive anti-discrimination training services | number | 10 652 | 10 000 | 10 000 | 10 000 | |||||
| Quality | ||||||||||
| Customer satisfaction rating | level | 75 | 75 | 75 | 75 | |||||
| Timeliness | ||||||||||
| Complaints determined within statutory timelines | per cent | 100 | 100 | 100 | 100 | |||||
| Conciliations completed to internal standards | per cent | nm | 90 | 90 | 90 | |||||
| Cost | ||||||||||
| Total output cost | $ million | 4.8 | 4.9 | 5.1 | 5.4 | |||||
Advocacy and Guardianship—Supports the Public Advocate in role as the statutory guardian of last resort for adults with disabilities. Services include: advice and reports on independent investigations and enquiries to the Guardianship List of the Victorian Civil and Administrative Tribunal (VCAT); professional and administrative support and training for volunteer Community Visitors, community Guardians and Independent Third Persons; and monitoring of proposals to provide medical treatment in the absence or refusal of "personal responsible". | ||||||||||
| Quantity | ||||||||||
| Public information services provided | number | 16 424 | 15 000 | 17 000 | 16 500 | |||||
| Volunteers supported and trained | number | 655 | 720 | 700 | 710 | |||||
| Advocacy interventions and investigations undertaken | number | 1 613 | 1 810 | 1 810 | 1 705 | |||||
| Guardianship services—total case load | number | 784 | <720 | 800 | <870 | |||||
| Quality | ||||||||||
| User satisfaction rating | per cent | 80 | 80 | 85 | 80 | |||||
| Timeliness | ||||||||||
| Enquiries resolved within internal standards | per cent | 95 | 95 | 95 | 95 | |||||
| Cost | ||||||||||
| Total output cost | $ million | 4.7 | 4.3 | 5.0 | 5.0 | |||||
Source: Department of Justice
Part 2 provides the financial statements that support the Department's provision of outputs. The information provided includes the Statement of Financial Performance, Statement of Financial Position and Statement of Cash Flows for the Department as well as authority for resources.
The total resources made available to a department are applied to three uses:
- •
- the provision of outputs;
- •
- asset investment; or
- •
- payments on behalf of the State.
The following three financial statements are presented in the format consistent with the AAS29 accounting standard. However, for the purposes of this paper they have been divided into controlled and administered items.
Administered items refer to those resources over which the Department cannot exercise direct control. Authority is provided through an appropriation for payments made on behalf of the State. Under the AAS29 standard, these items would normally appear as notes to the financial statements.
Financial Statements
The following four tables can be used to assess the Department's financial performance and use of resources.
- •
- Table 2.5.2—Statement of Financial Performance—provides details of the Department's controlled revenue and expenses on an accrual basis reflecting the cost of providing its outputs;
- •
- Table 2.5.3—Statement of Financial Position—shows all controlled assets and liabilities of the Department. The difference between these represents the net assets position, which is an indicator of the State's equity in the Department;
- •
- Table 2.5.4—Statement of Cash Flows—shows all movements of cash (cash received and paid). The cash impact of financing and investing activities on Departmental resources is highlighted in this statement; and
- •
- Table 2.5.5—Administered Items Statement—provides details of the Department's administered revenue and expenses (on an accrual basis), and its administered assets and liabilities.
Table 2.5.2: Statement of Financial Performance
| | 2000-01 Actual | 2001-02 Budget | 2001-02 Revised | 2002-03 Budget | Variation(a) | ||||||
|---|---|---|---|---|---|---|---|---|---|---|---|
| | ($ million) | (%) | |||||||||
| Revenue from ordinary activities | |||||||||||
| Output appropriations | 1 617.3 | 1 606.4 | 1 761.2 | 1 901.4 | 18.4 | ||||||
| Special appropriations | 53.3 | 58.9 | 60.6 | 87.8 | 49.2 | ||||||
| Resources received free of charge or for nominal consideration | 6.4 | 2.3 | 5.6 | 2.2 | (4.3 | ) | |||||
| Sale of goods and services | — | 76.8 | — | — | (100.0 | ) | |||||
| Commonwealth Grants | 0.0 | 0.8 | 0.0 | — | (100.0 | ) | |||||
| Taxes | — | — | — | — | — | ||||||
| Fines and Fees | 4.9 | 5.3 | 5.0 | 5.4 | 2.7 | ||||||
| Other revenue and revenue from other parties | 52.1 | 46.6 | 51.1 | 53.0 | 13.9 | ||||||
| 1 734.0 | 1 797.1 | 1 883.4 | 2 049.8 | 14.1 | |||||||
| Expenses from ordinary activities | |||||||||||
| Employee entitlements | 1 010.9 | 1 005.5 | 1 080.3 | 1 179.9 | 17.3 | ||||||
| Depreciation and amortisation | 33.6 | 39.8 | 44.3 | 51.2 | 28.6 | ||||||
| Resources provided free of charge or for nominal consideration | 0.5 | — | — | — | — | ||||||
| Grants and other payments | 110.8 | 101.8 | 105.2 | 110.2 | 8.3 | ||||||
| Capital asset charge | 55.5 | 68.5 | 68.5 | 80.2 | 17.0 | ||||||
| Supplies and services | 512.2 | 563.0 | 572.8 | 618.6 | 9.9 | ||||||
| Other expenses from ordinary activities | 1.3 | 0.2 | 0.2 | 0.2 | 13.7 | ||||||
| Borrowing costs | 3.7 | 0.3 | 0.4 | 0.4 | 7.6 | ||||||
| 1 728.5 | 1 779.2 | 1 871.7 | 2 040.6 | 14.7 | |||||||
| Result from ordinary activities | 5.5 | 17.9 | 11.8 | 9.3 | (48.3 | ) | |||||
| Loss from extraordinary items | — | — | — | — | — | ||||||
| Net result for the reporting period | 5.5 | 17.9 | 11.8 | 9.3 | (48.3 | ) | |||||
| Net increase in asset revaluation reserve | 40.2 | — | — | — | — | ||||||
| Total revenues, expenses and revaluation adjustments recognised directly in equity | 40.2 | — | — | — | — | ||||||
| Total changes in equity other than those resulting from transactions with Victorian State Government in its capacity as owner | 45.7 | 17.9 | 11.8 | 9.3 | (48.3 | ) | |||||
Notes:
- (a)
- Variation between 2001-02 Budget and 2002-03 Budget.
Statement of Financial Performance
The Department's controlled operating surplus is estimated to decrease from $17.9 million projected in 2001-02 Budget to $9.3 million in 2002-03. This decrease in operating surplus is in part due to the first time recognition of depreciation expense of $4.4 million in the Victorian State Emergency Service (VicSES) Volunteer Trust Account. In addition there are some reductions to the operating surplus of other controlled entities within the department.
Total revenue from ordinary operating activities is estimated to increase by $253 million. The majority of this increase reflects the $295 million increase in output appropriations revenue to fund new and existing output initiatives as well as supplementation for approved wage increases.
Increased funding includes:
- •
- Supplementation for wage increases of $122 million as a result of the renegotiation of the Victoria Police Enterprise Bargaining Agreement and various other Public Sector Enterprise Bargaining Agreements;
- •
- The continued implementation of the Government's commitment of 800 additional operational police officers costing approximately $9 million;
- •
- Approximately $38.1 million towards the delivery of existing initiatives, including the correctional strategy; and
- •
- A change in the accounting treatment of revenue from sales of good and services of $77 million, which was reported separately in 2001-02 Budget.
New initiatives approved for 2002-03 include:
- •
- The provision of $5 million towards the Statewide Personnel Alerting System project for Emergency Services;
- •
- A Road Safety Initiatives Package of $31.9 million for the implementation of the Government's Road Safety objective of reducing fatalities and serious injuries by 20 per cent by 2007; and
- •
- Additional funding of $5.6 million for initiatives including Strengthening Alternative Dispute Resolution Processes, Justice Statement Project and the Victorian Legal Aid Information Technology Upgrade.
Other revenue increases relate to a movement in special appropriations of $29 million mainly for the Victorian Electoral Commission to conduct various municipal elections and prepare for the next State election, which will occur sometime between 30 November 2002 and 3 January 2004.
Table 2.5.3: Statement of Financial Position
| | Estimated as at 30 June | |||||||||||
|---|---|---|---|---|---|---|---|---|---|---|---|---|
| | 2001 Actual | 2002 Budget | 2002 Revised | 2003 Budget | Variation(a) | |||||||
| | ($ million) | (%) | ||||||||||
| Current assets | ||||||||||||
| Cash assets | 17.7 | 32.6 | 12.9 | 11.1 | (66.1 | ) | ||||||
| Other financial assets | 148.6 | 148.6 | 164.5 | 178.6 | 20.1 | |||||||
| Receivables | 21.9 | 24.2 | 22.1 | 22.1 | (9.0 | ) | ||||||
| Inventories | 8.4 | 8.4 | 8.4 | 8.4 | — | |||||||
| Prepayments | 4.0 | 4.0 | 4.0 | 4.0 | — | |||||||
| Other | — | — | — | — | — | |||||||
| Total current assets | 200.6 | 217.9 | 211.8 | 224.1 | 2.9 | |||||||
| Non-current assets | ||||||||||||
| Receivables | 122.9 | 118.2 | 126.8 | 144.2 | 22.0 | |||||||
| Inventories | — | — | — | — | — | |||||||
| Other financial assets | — | — | — | 3.4 | — | |||||||
| Property, plant and equipment | 732.7 | 868.2 | 837.9 | 973.6 | 12.1 | |||||||
| Intangible assets | — | — | — | — | — | |||||||
| Other | 3.4 | 3.4 | 3.4 | 3.4 | — | |||||||
| Total non-current assets | 859.0 | 989.8 | 968.2 | 1 124.6 | 13.6 | |||||||
| Total assets | 1 059.7 | 1 207.8 | 1 180.0 | 1 348.7 | 11.7 | |||||||
| Current liabilities | ||||||||||||
| Payables | 69.1 | 69.1 | 69.1 | 69.1 | 0.0 | |||||||
| Interest bearing liabilities | 1.8 | 1.8 | 1.8 | 1.8 | — | |||||||
| Provisions(b) | 57.3 | 57.0 | 74.2 | 93.3 | 63.9 | |||||||
| Other | 17.6 | 17.6 | 17.6 | 17.6 | (0.1 | ) | ||||||
| Total current liabilities | 145.7 | 145.3 | 162.5 | 181.7 | 25.0 | |||||||
| Non-current liabilities | ||||||||||||
| Interest bearing liabilities | 10.7 | 10.7 | 8.9 | 7.2 | (32.9 | ) | ||||||
| Provisions(b) | 241.6 | 239.6 | 241.7 | 241.8 | 0.9 | |||||||
| Other | — | — | — | — | — | |||||||
| Amounts owing to other departments | — | — | — | — | — | |||||||
| Total non-current liabilities | 252.3 | 250.3 | 250.6 | 249.0 | (0.6 | ) | ||||||
| Total liabilities | 398.0 | 395.7 | 413.2 | 430.7 | 8.8 | |||||||
| Net assets | 661.6 | 812.1 | 766.8 | 918.0 | 13.0 | |||||||
| Equity | ||||||||||||
| Contributed capital | — | 132.5 | 93.4 | 235.4 | 77.6 | |||||||
| Reserves | 88.6 | 88.6 | 88.6 | 88.6 | — | |||||||
| Accumulated surplus | 573.0 | 590.9 | 584.8 | 594.0 | 0.5 | |||||||
| Total equity | 661.6 | 812.1 | 766.8 | 918.0 | 13.0 | |||||||
Source: Department of Treasury and Finance
Notes:
- (a)
- Variation between 2001-02 Budget and 2002-03 Budget.
- (b)
- Includes employee costs and superannuation.
Statement of Financial Position
The Controlled Statement of Financial Position estimates a net asset increase of $106 million from the 2001-02 Budget position of which $9.3 million is attributable to the estimated 2002-03 operating surplus. The increased net asset position is reflected in an estimated increase in total assets of $140.9 million that is offset by the estimated increase in total liabilities of $35 million.
Total assets are expected to increase by $140.9 million from 2001-02 to $1 349 million in 2002-03. This increase mainly reflects:
- •
- An increase in the departmental inter-entity balance of approximately $26 million. This reflects the funding for non-cash items such as employee entitlements that have not been drawn down; and
- •
- Increases in property, plant and equipment of $105 million, which includes $42 million for newly approved asset investment initiatives and a further $63 million for previously approved investments.
New initiatives approved for 2002-03 include:
- •
- Funding of $21.8 million for projects relating to Emergency Services;
- •
- Additional funding of $2 million for the prison capacity expansion program;
- •
- The construction of new police stations and the upgrade of existing police stations in metropolitan and regional areas of $6.2 million;
- •
- The upgrade of court facilities in metropolitan and regional areas of $2 million;
- •
- The refurbishment of the Office of Public Prosecutions of $1.34 million;
- •
- The implementation of the Prisoner Information Management System of $3.4 million;
- •
- Funding for the Consolidated Logistics Facility of $2.2 million; and
- •
- A Road Safety Initiatives Package of $3 million for the purchase and installation of digital and red light speed cameras.
The increase in total liabilities mainly reflects Victoria Police's increasing provision of employee entitlements, primarily long-service leave provision.
Table 2.5.4: Statement of Cash Flows
| | 2000-01 Actual | 2001-02 Budget | 2001-02 Revised | 2002-03 Budget | Variation(a) | ||||||
|---|---|---|---|---|---|---|---|---|---|---|---|
| | ($ million) | (%) | |||||||||
| Cash flows from operating activities | |||||||||||
| Receipts from Government | 1 675.3 | 1 668.5 | 1 817.9 | 1 971.8 | 18.2 | ||||||
| Receipts from other entities | 8.7 | 87.9 | 13.0 | 12.4 | (85.9 | ) | |||||
| Payments for supplies, grants and employees | (1 606.7 | ) | (1 672.9 | ) | (1 743.3 | ) | (1 891.4 | ) | 13.1 | ||
| 77.4 | 83.4 | 87.6 | 92.9 | 11.3 | |||||||
| Interest received | 46.2 | 38.9 | 42.3 | 39.9 | 2.3 | ||||||
| Other revenue | 0.6 | 1.7 | 4.3 | 8.5 | 406.9 | ||||||
| Capital asset charge | (55.5 | ) | (68.5 | ) | (68.5 | ) | (80.2 | ) | 17.0 | ||
| Borrowing costs expense | (3.7 | ) | (0.3 | ) | (0.4 | ) | (0.4 | ) | 7.6 | ||
| Net cash inflow from operating activities | 65.0 | 55.2 | 65.2 | 60.6 | 9.9 | ||||||
| Cash flows from investing activities | |||||||||||
| Payments for property, plant and equipment(b) | (67.3 | ) | (175.6 | ) | (147.8 | ) | (190.5 | ) | 8.5 | ||
| Proceeds from sale of property, plant and equipment | — | 0.5 | 0.2 | 0.2 | (60.0 | ) | |||||
| Payments for investments | — | — | — | — | — | ||||||
| Proceeds from sale of business assets | — | — | — | — | — | ||||||
| (Repayment of) loans by other entities | (30.6 | ) | — | (15.9 | ) | (14.1 | ) | — | |||
| Net cash (outflow) from investing activities | (97.9 | ) | (175.1 | ) | (163.4 | ) | (204.4 | ) | 16.7 | ||
| Cash flows from financing activities | |||||||||||
| Net Proceeds from capital contribution by State Government | 40.2 | 134.8 | 93.4 | 141.9 | 5.2 | ||||||
| Net proceeds of borrowings | — | — | — | — | — | ||||||
| Repayment of finance leases | — | — | — | — | — | ||||||
| Net cash inflow (outflow) from financing activities | 40.2 | 134.8 | 93.4 | 141.9 | 5.2 | ||||||
| Net increase (decrease) in cash held | 7.3 | 15.0 | (4.8 | ) | (1.8 | ) | (112.1 | ) | |||
| Cash at the beginning of the financial year | 10.4 | 17.7 | 17.7 | 12.9 | (27.0 | ) | |||||
| Cash at the end of the financial year | 17.7 | 32.6 | 12.9 | 11.1 | (66.1 | ) | |||||
Source: Department of Treasury and Finance
Notes:
- (a)
- Variation between 2001-02 Budget and 2002-03 Budget.
- (b)
- includes payments for land held for resale and research and development costs.
Table 2.5.5: Administered Items Statement
| | 2000-01 Actual | 2001-02 Budget | 2001-02 Revised | 2002-03 Budget | Variation(a) | ||||||
|---|---|---|---|---|---|---|---|---|---|---|---|
| | ($ million) | (%) | |||||||||
| Administered revenue | |||||||||||
| Appropriations—Payments made on behalf of the State | — | — | — | — | — | ||||||
| Output Appropriation | — | — | — | — | — | ||||||
| Special appropriations | 19.0 | 38.8 | 35.8 | 42.8 | 10.3 | ||||||
| Resources received free of charge or for nominal consideration | — | — | — | — | — | ||||||
| Sale of goods and services | 77.0 | 0.7 | 76.2 | 76.8 | 10 343.0 | ||||||
| Commonwealth grants | 42.4 | 42.4 | 44.5 | 45.8 | 7.9 | ||||||
| Other grants | 2.7 | 4.2 | 4.2 | 1.5 | (64.1 | ) | |||||
| Taxes | — | — | — | — | — | ||||||
| Fines | 194.7 | 238.1 | 230.2 | 385.9 | 62.1 | ||||||
| Fees | 58.1 | 49.4 | 62.5 | 65.9 | 33.4 | ||||||
| Other | 58.0 | 25.0 | 45.4 | 49.6 | 98.2 | ||||||
| Total administered revenue | 452.0 | 398.7 | 498.7 | 668.2 | 67.6 | ||||||
| Administered expenses | |||||||||||
| Expenses on behalf of the State | 171.9 | 66.1 | 107.1 | 150.9 | 128.2 | ||||||
| Grants and other payments | 3.3 | 34.8 | 1.7 | 1.7 | (95.1 | ) | |||||
| Payments into the Consolidated Fund | 292.9 | 257.5 | 328.8 | 449.5 | 74.6 | ||||||
| Total administered expenses | 468.2 | 358.4 | 437.6 | 602.1 | 68.0 | ||||||
| Revenue less expenses | (16.2 | ) | 40.3 | 61.2 | 66.1 | 64.0 | |||||
| Administered assets | |||||||||||
| Cash assets | 103.8 | 104.6 | 104.5 | 105.7 | 1.0 | ||||||
| Receivables | 97.0 | 136.6 | 157.0 | 222.0 | 62.6 | ||||||
| Other financial assets | — | — | — | — | — | ||||||
| Inventories | — | — | — | — | — | ||||||
| Prepayments | 0.0 | 0.0 | 0.0 | 0.0 | — | ||||||
| Property, plant and equipment | 1.1 | 1.1 | 1.1 | 1.1 | 2.8 | ||||||
| Intangible assets | — | — | — | — | — | ||||||
| Other | — | — | — | — | — | ||||||
| Total administered assets | 202.0 | 242.3 | 262.7 | 328.8 | 35.7 | ||||||
| Administered liabilities | |||||||||||
| Payables | 99.8 | 99.8 | 99.4 | 99.4 | (0.4 | ) | |||||
| Interest bearing liabilities | — | — | — | — | — | ||||||
| Provisions | 0.4 | 0.4 | 0.4 | 0.4 | 5.6 | ||||||
| Amounts owing to other departments | — | — | — | — | — | ||||||
| Other | 25.2 | 25.2 | 25.2 | 25.2 | — | ||||||
| Total administered liabilities | 125.4 | 125.4 | 125.0 | 125.0 | (0.3 | ) | |||||
Source: Department of Treasury and Finance
Note:
Statement of Cash Flows
The Statement of Cash Flows reflects the cash impact of those changes previously discussed in the Statement of Financial Performance and Statement of Financial Position.
Administered Items Statement
The Department's administered operating surplus is expected to increase by $26 million from 2001-02 to $66 million in 2002-03. This surplus reflects fines revenue recognised but not yet transferred to Consolidated Fund as it has not been received. This amount is reflected in the Statement of Financial Position as an amount receivable.
The increase in total administered revenue of $270 million is mainly due to:
- •
- The increase in fine and fees revenue of approximately $164 million associated with the implementation of road safety initiatives, subsequent increase in fines enforcement activity by the Sheriff's Office and the current trend in fines imposed by courts;
- •
- The first time recognition in administered entities of revenue from sales of goods and services of $77 million; and
- •
- The first time reporting of trust fund activities through the operating statement of $24.6 million, which mainly relates to the Victorian Government Solicitor's trust fund.
The increase in total operating expenses mainly reflects increased transfers of revenue to the Consolidated Fund as a result of the road safety initiatives.
Authority for Resources
This section provides a summary of the sources of Parliamentary Authority available to the Department to fund the provision of outputs, payments on behalf of State, and additions to the net asset base.
Table 2.5.6: Parliamentary Authority for Resources
| | 2001-02 Budget | 2001-02 Revised | 2002-03 Budget | Variation(a) | |||||
|---|---|---|---|---|---|---|---|---|---|
| | ($ million) | (%) | |||||||
| Annual appropriations(b) | 1 716.4 | 1 755.9 | 1 961.7 | 14.3 | |||||
| Receipts credited to appropriations | 77.9 | 76.7 | 76.2 | (2.2 | ) | ||||
| Unapplied previous years appropriation | 22.6 | 22.1 | 5.3 | (76.3 | ) | ||||
| Accumulated surplus—previously applied appropriation | — | — | — | — | |||||
| Gross annual appropriation | 1 816.9 | 1 854.7 | 2 043.3 | 12.5 | |||||
| Special appropriations | 97.7 | 96.4 | 130.6 | 33.8 | |||||
| Trust funds | 86.8 | 105.5 | 107.2 | 23.5 | |||||
| Total Parliamentary authority | 2 001.4 | 2 056.6 | 2 281.1 | 14.0 | |||||
Source: Department of Treasury and Finance
Notes:
- (a)
- Variation between 2001-02 Budget and 2002-03 Budget.
- (b)
- 2001-02 Revised includes the impact of approved Treasurer's Advances.
DEPARTMENT OF NATURAL RESOURCES AND ENVIRONMENT
PART 1: OUTLOOK AND OUTPUTS
Overview
The Department of Natural Resources and Environment (DNRE) encompasses the portfolios of Environment and Conservation, Energy and Resources, Agriculture and Aboriginal Affairs. DNRE is charged with generating wealth through the sustainable development of Victoria's natural resources. It achieves this while protecting and delivering improvements to the quality of the environment and the well being of the Victorian Community.
The Department's role is to:
- •
- develop sustainable resource based industries;
- •
- protect the natural resources and environment;
- •
- help Victorians use their environment wisely; and
- •
- improve Aboriginal wellbeing.
Departmental Objectives
DNRE's objectives are strategic and long term in nature and provide the direction and guiding focus for the organisation. The objectives align with the Government's economic, social and environmental outcomes for the Victorian Community, as outlined in Growing Victoria Together.
The following objectives aim to realise long-term benefits, while taking account of dynamic and complex environmental systems. These objectives can only be achieved in partnership with the community and industry groups.
DNRE's objectives are to:
- •
- contribute to the sustainable economic growth of Victoria's land and resource based industries while balancing social, environmental and economic outcomes;
- •
- reduce the impact of human activity in Victoria on the environment;
- •
- support the commitment and capability of Victorians to live and manage sustainably within the landscape;
- •
- better understand biodiversity values and improve knowledge of the way ecosystems function to assist Victorians to live and work within the capacity of the environment; and
- •
- provide a safe and ecologically sustainable living environment through protection and restoration of air, land and water quality and the control of unwanted noise.
The Department promotes sustainable development of Victoria's diverse natural resources through industry development, community partnerships, environment protection and conservation of our natural and cultural heritage. Its provides services to all Victorians and in particular rural and regional Victorians.
Major responsibilities related to the pursuit of the Department's objectives include:
- •
- encouraging sustainable management practices and responsible resource use for the long term benefit of all Victorians by preventing the degradation of soil and water, providing access to affordable energy and water services, leading the Government's approach to reducing Victoria's Greenhouse gas emissions, regulating access to fisheries and protecting native flora and fauna;
- •
- facilitating productivity improvements and market-focused ecologically sustainable production in primary industries (including agriculture, forestry, fishing, minerals, petroleum and water supply) to encourage industry development and generate wealth;
- •
- managing most of Victoria's public land including coastal land, parks, reserves and forests, to provide opportunities for conservation, tourism, recreation, education and research;
- •
- providing certainty of title and accurate geographic, survey and valuation information to support land tenure and transactions and natural resource management;
- •
- protecting the Victorian community from the adverse impacts of unwanted noise and air, water and land pollution; and
- •
- promoting the social, economic and cultural development of Victoria's Aboriginal communities and improving the coordination and monitoring of the development of government policy relating to the delivery of programs and services to Victoria's Aboriginal people.
Review of 2001-02
DNRE is estimating an operating deficit for 2001-02 reflecting the use of prior year surpluses from Commonwealth and Industry revenue, and the application of other surplus funds to priority areas in Forests and Fire Management and the Land Titles Office.
Net assets are expected to increase significantly due to the incorporation of the former Melbourne Parks and Waterways assets into DNRE. In addition, projects to modernise facilities at a number of Agricultural Research Institutes will result in increased asset levels across the Department.
DNRE is progressing towards the delivery of its outputs and the achievement of the 2001-02 published performance measures however a number of factors may impact on the final result for 2001-02. These include:
- •
- delays in the establishment of the Joint Government Enterprise to manage the restoration of environmental flows to the Snowy River may significantly impact on the achievement of some targets under the Catchment and Water Resource Allocation and Access Output;
- •
- complications associated with the final payments for Industry Development Assistance under the Forest Industry Structural Adjustment Program could result in funds being held over to 2002-03; and
- •
- the review of options for the establishment and implementation of Marine Parks in Victoria is impacting on the progress against a number of targets within the Fisheries Industry and Community Compliance Services Output.
2002-03 Outlook
Key output and asset investment initiatives to be commenced in 2002-03 include:
New Directions for Sustainable Forestry
- •
- Significant changes for forestry in Victoria were announced with the release of Our Forests Our Future policy. These changes reflect the strong Government commitment to manage forests in the best interest of all Victorians and to achieve a responsible balance of competing uses between community, jobs and the environment. The initiative will focus on the timber licensing system, timber industry development and forest management.
Achieving Reconciliation with Indigenous Victorian Communities
- •
- DNRE will implement a range of programs in 2002-03 that specifically target areas of indigenous disadvantage identified by both the Government and the Indigenous community. The programs include the implementation of a Victorian Indigenous Family Violence Strategy, establishment of a Stolen Generations organisation and an Indigenous Community Capacity Building Program.
Piping the System—Wimmera-Mallee
- •
- Subject to Commonwealth matching funding and confirmation of its feasibility during the detailed design stage, this initiative will replace the existing 17 500 kilometres of open channels with a new pipeline system in the Wimmera-Mallee region. This system will provide a more secure and higher quality water supply for domestic and stock use. Water saved by curtailing the current massive losses of over 70 per cent from evaporation and seepage will be allocated to stressed river systems and new agricultural and other developments in the Wimmera-Mallee region.
Showgrounds Redevelopment
- •
- The Government has committed to the full redevelopment of the Showgrounds in Ascot Vale to provide an appropriate venue to maintain the Royal Melbourne Show and other activities of the Royal Agricultural Society of Victoria on a sustainable basis. The works to be undertaken over the next 3 years will modernise the facilities and address Health and Safety compliance issues. It will also provide the opportunity to promote industry development and Government objectives on Agribusiness and regional Victoria.
Bendigo Consolidation and Bairnsdale Replacement
- •
- The Department will consolidate four separate DNRE locations onto one existing site in Bairnsdale and consolidate two locations and extend the existing office facility in Bendigo. Emergency response infrastructure will be upgraded in Bairnsdale as well as providing a 'One Stop Shop' and addressing Occupational Health and Safety issues. The Bendigo consolidation will provide facilities for staff to improve the management of existing and new programs.
The Land Exchange
- •
- This initiative will provide business with a single point of access to State and Local Government land information and transactions through a comprehensive commercial on-line market place. The Land Exchange will also include an electronic conveyancing system for transferring ownership in land, a digital vendor certificate system and an on-line applications/planning permit process.
CBD Accommodation Consolidation
- •
- DNRE will fitout new CBD accommodation to consolidate its Melbourne activities (excluding Land Victoria and the Environment Protection Authority) into one CBD location. This consolidation will take advantage of the completion of current leasing arrangements to address accommodation Occupational Health and Safety issues and improve the Department's operational effectiveness. Land Victoria was recently consolidated from seven to a single CBD location at Marland House.
Major Impacts Expected to Affect Performance in the Forthcoming Period
A comprehensive Risk Management program is maintained by DNRE to identify and minimise potential risks that may impact on its performance. The Department's performance in the coming year may be affected by:
- •
- the success of the revised Marine Parks legislation;
- •
- establishment of the joint Government entity to manage the restoration of environmental flows to the Snowy River; and
- •
- the implementation of the Our Forests Our Future strategy, particularly the public consultation process.
Changes to DNRE Outputs
DNRE has a rolling program of internal reviews of its output structure designed to enable the Department to refine how it describes and aligns its business to achieve Government outcomes and to better reflect and report its business activities. The major changes in output structure and performance measures for 2002-03 relate to the output clusters Aboriginal Reconciliation and Respect, Conservation and Recreation and Land Management and Information.
Aboriginal Reconciliation and Respect has defined its services into three new outputs together with new performance measures. These have been developed to better reflect its role and responsibilities.
A full review of the Conservation and Recreation outputs and performance measures was undertaken during 2001-02. The existing outputs were renamed and most of the associated performance measures are new, with a few retained or revised.
Land Management and Information has also undertaken a review of its outputs and performance measures. The major change has been the absorption of the Land Definition output into the remaining two outputs. The performance measures were reviewed but most are retained with an adjustment to targets to incorporate the absorbed output.
A number of other refinements have been made to performance measures for several outputs. These changes have been made as part of a continual improvement process to enhance the transparency and accuracy of DNRE's output performance reporting. The changes incorporate recommendations from the 2001 round of Output Reviews, the Auditor-General's 2001 Report on Departmental Performance Management and Reporting and the Public Accounts and Estimates Committee Report on the 2001-02 Budget Estimates.
Output Information
The following section provides details of the outputs to be provided to Government, including their performance measures and the costs for each output. The table below summaries the total cost for outputs.
Table 2.6.1: Output summary
| | 2001-02 Budget(a) | 2001-02 Revised | 2002-03 Budget | Variation(b) | ||||
|---|---|---|---|---|---|---|---|---|
| | ($ million) | (%) | ||||||
| Aboriginal Reconciliation and Respect | 9.5 | 9.9 | 13.6 | 44.2 | ||||
| Agriculture | 182.2 | 196.5 | 205.6 | 12.8 | ||||
| Catchment and Water | 217.1 | 223.8 | 247.8 | 14.1 | ||||
| Conservation and Recreation | 179.5 | 194.0 | 186.3 | 3.8 | ||||
| Energy and Greenhouse Policy Advice | 34.2 | 34.6 | 39.2 | 14.6 | ||||
| Environment Protection | 54.3 | 55.3 | 54.3 | 0.0 | ||||
| Fisheries | 37.2 | 35.1 | 40.5 | 9.1 | ||||
| Forests and Fire Management | 194.4 | 203.8 | 208.2 | 7.1 | ||||
| Land Management and Information | 87.5 | 103.5 | 106.6 | 21.8 | ||||
| Minerals and Petroleum | 15.6 | 16.9 | 17.3 | 11.1 | ||||
| Total | 1 011.5 | 1 073.3 | 1 119.4 | 10.7 | ||||
Source: Department of Treasury and Finance
Notes:
- (a)
- 2001-02 Output Budget incorporates changes to Output structure and organisational restructuring and therefore may differ from figures published in the 2001-02 Budget.
- (b)
- Variation between 2001-02 and 2002-03 Budget.
Aboriginal Reconciliation and Respect
These outputs make a contribution to the achievement of the following Key Government Outcomes:
- •
- Growing and linking all of Victoria;
- •
- Promoting sustainable development;
- •
- More jobs and thriving, innovative industries across Victoria; and
- •
- Building cohesive communities and reducing inequalities.
These outputs make a significant contribution to the achievement of the following Departmental Objective:
- •
- Support the commitment and capability of Victorians to live and manage sustainably within the landscape.
These outputs involve consolidation of partnerships with the Aboriginal peoples of Victoria to develop strategies and provide programs that:
| Major Outputs/Deliverables Performance Measures | Unit of Measure | 2000-01 Actuals | 2001-02 Target | 2001-02 Expected Outcome | 2002-03 Target | |||||
|---|---|---|---|---|---|---|---|---|---|---|
| Indigenous Community Building—Work in partnership with Victorian Aboriginal communities and their organisations to increase participation in partnerships with Government and build their capacity to deliver programs and services which meet the needs of Indigenous Victorians. | ||||||||||
| Quantity | ||||||||||
| Aboriginal community organisations receiving grant funding for community building(a) | number | nm | nm | nm | 28 | |||||
| Koori community fund grants approved | number | nm | nm | nm | 10 | |||||
| Heritage training activities addressing community identified priority issues | number | nm | nm | nm | 8 | |||||
| Formal consultations with Aboriginal communities concerning community building activities(a) | number | nm | nm | nm | 65 | |||||
| Quality | ||||||||||
| Maximum proportion of Ministerial briefs returned for clarification | per cent | nm | nm | nm | 5 | |||||
| Proportion of Indigenous Family Violence Community Initiatives Fund grants endorsed by Indigenous Family Violence Task Force | per cent | nm | nm | nm | 90 | |||||
| Timeliness | ||||||||||
| Ministerial briefs provided within specified timelines | per cent | nm | nm | nm | 95 | |||||
| High priority cyclical building maintenance works completed within stipulated time frames | per cent | nm | nm | nm | 100 | |||||
| Proportion of Community Infrastructure feasibility studies completed within agreed time | per cent | nm | nm | nm | 75 | |||||
| Cost | $ million | na | na | na | 7.3 | |||||
Reconciliation Through Partnerships of Government and Aboriginal Communities—Improve outcomes for the Aboriginal peoples of Victoria through the development of whole of Victorian government policy promoting community led partnerships of Aboriginal communities and government agencies. | ||||||||||
| Quanity | ||||||||||
| Whole of government related policies developed | number | nm | nm | nm | 3 | |||||
| Annual Aboriginal Affairs report tabled in Parliament | number | nm | nm | nm | 1 | |||||
| Meetings of the Premier's Aboriginal Advisory Council and the Victorian Aborginal Affairs Coordinating Committee supported | number | nm | nm | nm | 10 | |||||
| Formal consultations with Aboriginal communities on whole of government issues | number | nm | nm | nm | 4 | |||||
| Quality | ||||||||||
| Maximum proportion of Ministerial briefs returned for clarification | per cent | nm | nm | nm | 5 | |||||
| Timeliness | ||||||||||
| Ministerial briefs completed within stipulated time frames | per cent | nm | nm | nm | 95 | |||||
| Cost | $ million | na | na | na | 2.4 | |||||
Address Dispossession of Aboriginal Land and Culture—Develop and deliver policy, programs and services that address Aboriginal aspirations for land and cultural resources, increase understanding and respect for Aboriginal culture within the broader community and promote Aboriginal community control of the protection and management of Aboriginal heritage and cultural property. | ||||||||||
| Quanity | ||||||||||
| Heritage projects jointly developed and carried out with Aboriginal communities | number | nm | nm | nm | 10 | |||||
| Verified records added to heritage data base | number | nm | nm | nm | 600 | |||||
| Community managed organisations funded to provide cultural heritage services | number | nm | nm | nm | 6 | |||||
| Formal consultations with Aboriginal communities on Aboriginal land and cultural heritage management issues | number | nm | nm | nm | 10 | |||||
| Quality | ||||||||||
| Maximum proportion of Ministerial briefs returned for clarification | per cent | nm | nm | nm | 5 | |||||
| Timeliness | ||||||||||
| Ministerial briefs completed within stipulated time frames | per cent | nm | nm | nm | 95 | |||||
| Cost | $ million | na | na | na | 3.9 |
Source: Department of Natural Resources and Environment
Note:
- (a)
- Includes Community Building and Bringing Them Home (Stolen Generation) Initiatives.
Agriculture
These outputs make a contribution to the achievement of the following Key Government Outcomes:
- •
- growing and linking all of Victoria;
- •
- promoting sustainable development;
- •
- more jobs and thriving, innovative industries across Victoria;
- •
- protecting the environment for future generations;
- •
- sound financial management;
- •
- government that listens and leads;
- •
- building cohesive communities and reducing inequalities; and
- •
- promoting rights and respecting diversity.
These outputs make a significant contribution to the achievement of the following Departmental Objectives:
- •
- contribute to sustainable economic growth of Victoria's land and resource based industries while balancing social, environmental, and economic outcomes;
- •
- reduce the impact of human activity in Victoria on the environment;
- •
- support the commitment and capability of Victorians to live and manage sustainably within the landscape; and
- •
- better understand biodiversity values and improve knowledge of the way ecosystems function to assist Victorians to live and work within the capacity of the environment.
These outputs involve delivering strategic services to the food and agriculture sector and the wider community to continue strong economic growth (especially in exports), improve natural resources and enhance social well being.
The services provided under the three Outputs include:
- •
- the development of sustainable farming systems that are productive and protect the environment and biodiversity;
- •
- enhanced biosecurity, pest, disease and disaster management;
- •
- product integrity, food safety and quality assurance;
- •
- chemical residue risk management;
- •
- animal welfare protection;
- •
- market and trade development;
- •
- business and value chain facilitation;
- •
- land and natural resource management information;
- •
- research and development (enabling technologies and products); and
- •
- on-farm management and social capability building programs, industry training and skills development and information services.
These services address key growth, environmental and social challenges across the agriculture value-chain from natural resource management, farm production, food processing through to food safety for consumers.
| Major Outputs/Deliverables Performance Measures | Unit of Measure | 2000-01 Actuals | 2001-02 Target | 2001-02 Expected Outcome | 2002-03 Target | ||||||
|---|---|---|---|---|---|---|---|---|---|---|---|
| Services to Improve Market Access, Market Development and Consumer Confidence in Food and Agricultural Products—Systems, standards and services for Victoria's food and agriculture sector that enhance market access, market development and consumer confidence and protect the environment and biodiversity. The services include: improved product integrity, food safety and quality assurance; business and value chain facilitation; enhanced biosecurity, pest, disease and disaster management; minimisation of the risk of chemical residues; protection of the welfare of animals; development of the agrifood industry; market and trade development and enhanced policy environment for achieving Government, industry and community objectives. | |||||||||||
| Quanity | |||||||||||
| Strategic pest, disease and residue control initiatives developed to assist industry to maintain and expand markets | number | 4 | 6 | 6 | 7 | ||||||
| International buyers of Victorian produce contacted in Victoria and Asia(a) | number | nm | nm | nm | 110 | ||||||
| Agribusiness export deals directly facilitated | number | 39 | 30 | 48 | 45 | ||||||
| Major reforms that address Government policy objectives for internationally competitive industries, agri-food industry development, food safety and product integrity developed and implemented | number | 2 | 4 | 4 | 4 | ||||||
| Quality | |||||||||||
| Compliance with international and national quality assurance standards by meeting certification authorities' required performance audits | number | nm | 3 | 3 | 3 | ||||||
| Compliance with relevant industry standards for animal welfare | per cent | 100 | >95 | >95 | >95 | ||||||
| Timeliness | |||||||||||
| Proportion of strategic quality assurance and animal welfare initiatives implemented within required timelines | per cent | nm | 100 | 100 | 95 | ||||||
| Response time to all pest, disease and disaster incidents | hours | <24 | <24 | <24 | <48 | (b) | |||||
| Cost | $ million | 51.9 | 43.7 | 52.6 | 51.3 | ||||||
Development of Next Generation Technologies for Sustainable Agriculture—The development of knowledge, technologies, land management practices and agriculture practices to build integrated farm and processing systems required for sustainable growth and efficient use of natural resources. The services include research and development required to support food and agriculture industries and the agriculture-environment interactions including strategic, basic and applied research (enabling technologies), product development, land and natural resource management systems, laboratory and field monitoring and information services. The services also include provision of knowledge and information to support policy development and industry strategic planning. | |||||||||||
| Quanity | |||||||||||
| Research and development projects in progress (average) | number | 220 | 220 | 220 | 220 | ||||||
| Value of external investment by industry in research and development projects | $ million | 16.7 | 14.5 | 14.5 | 14.5 | ||||||
| Commercial technology research and development agreements finalised | number | 60 | 50 | 90 | 50 | ||||||
| New/improved products or systems available for application | number | 5 | 5 | 5 | 5 | ||||||
| Quality | |||||||||||
| Technical publications in international and peer review journals | number | 283 | 160 | 260 | 260 | ||||||
| Proportion of national agriculture industry investment funds | per cent | 9 | 9 | 9 | 9 | ||||||
| Number of applications for publicly owned and protected Intellectual Property | number | 14 | 5 | 8 | 4 | ||||||
| Timeliness | |||||||||||
| Project progress reports to funding organisations accepted on first submission | per cent | >90 | >90 | >90 | >90 | ||||||
| Cost | $ million | 110.3 | 117.0 | 121.1 | 122.8 | ||||||
Community, Farm and Industry Development services—Increased implementation of best practice systems that underpin sustainable and productive food and agriculture industries at both the farm and regional level. This will be achieved by encouraging a learning culture in the community and by developing the capacity to anticipate and manage productive change. The services, which are developed and delivered in partnership with people in the food and agriculture sector, include community consultation, on-farm management programs, industry training and skills development, extension, and communication and information services. | |||||||||||
| Quanity | |||||||||||
| Number of projects in progress | number | 50 | 50 | 50 | 50 | ||||||
| Value of external investment by industry in delivery of best practice systems | $ million | 3.2 | 2.5 | 2.5 | 2.5 | ||||||
| Increase in the proportion of farmers involved in best practice | per cent | 7.3 | 6 | 6 | 6 | ||||||
| Quality | |||||||||||
| Proportion of national agriculture industry investment funds | per cent | 5 | 5 | 5 | 5 | ||||||
| Proportion of strategic plans and priorities developed in consultation with industry/community stakeholders | per cent | >95 | >95 | >95 | >95 | ||||||
| Timeliness | |||||||||||
| Project progress reports to Funding organisations accepted on first submission | per cent | nm | >90 | >90 | >90 | ||||||
| Cost | $ million | 17.7 | 21.5 | 22.8 | 31.5 | ||||||
Source: Department of Natural Resources and Environment
- Notes:
- (a)
- Proposed new measure in response to PAEC (2000), Report on the 2000-01 Budget Estimates, page 417, recommendations.
- (b)
- The targets have been revised in light of increasing global biosecurity risks facing Australia e.g. FMD (Foot and mouth disease), BSE (Bovine spongiform encephalopathy i.e. mad cow disease), fire ants, wildlife health.
Catchment and Water
These outputs make a contribution to the achievement of the following Key Government Outcomes:
These outputs make a significant contribution to the achievement of the following Departmental Objectives:
- •
- contribute to sustainable economic growth of Victoria's land and resource based industries while balancing social, environmental, and economic outcomes;
- •
- reduce the impact of human activity in Victoria on the environment; and
- •
- support the commitment and capability of Victorians to live and manage sustainably within the landscape.
These outputs use a strong partnership approach involving communities, statutory authorities and government to achieve healthy rivers and catchments which protect and enhance the environment while supporting sustainable and more productive resource industries and regional communities.
| Major Outputs/Deliverables Performance Measures | Unit of Measure | 2000-01 Actuals | 2001-02 Target | 2001-02 Expected Outcome | 2002-03 Target | |||||
|---|---|---|---|---|---|---|---|---|---|---|
| Catchment Information Services—Collecting, analysing and disseminating information about catchment and water management to assist landholders, industries, catchment communities and decision makers to manage and protect these resources to optimise environmental, economic and social outcomes. | ||||||||||
| Quanity | ||||||||||
| Sites monitored for water quality | number | 109 | 131 | 131 | 131 | |||||
| Number of people accessing Government sponsored catchment and water related web sites | number | nm | 12 000 | 12 000 | 12 000 | |||||
| Councils adopting on-line systems to record remnant native vegetation clearance permits | number | nm | 5 | 5 | 5 | |||||
| Customised, managed datasets provided to Catchment Management Authorities (CMAs) | number | nm | 10 | 10 | 10 | |||||
| Timeliness | ||||||||||
| Catchment Condition Indicators available on-line with current trend data | number | nm | 20 | 20 | 20 | |||||
| Completion of on-line system to record native vegetation clearance permits | date | nm | nm | nm | Dec 2002 | |||||
| Cost | $ million | 14.3 | 10.9 | 11.0 | 8.5 | |||||
Community Land and Water Management—Developing community and industry engagement in catchment and water issues by working with Landcare groups, community and farmer networks and relevant authorities. Communities are involved in planning, decision making and implementation of changes in land and water management to achieve long-term resource protection and enhancement. Community-based and Government endorsed management plans form the basis of cooperative management of issues such as salinity, river health, native vegetation and pest management. | ||||||||||
| Quanity | ||||||||||
| Community based catchment and water management plans—New plans drafted for approval this financial year | number | 29 | 18 | 18 | 9 | |||||
| Community based catchment and water management plans—Total number of plans being implemented | number | 103 | 82 | 82 | 52 | |||||
| CMA Regional Management Plans developed to implement Regional Catchment Strategies | number | 10 | 10 | 10 | 10 | |||||
| Second Generation Salinity Management Plans for integrated land and water management completed and endorsed | per cent | nm | nm | nm | 100 | |||||
| Additional area protected from salinity by surface drainage: Horticulture | ha | nm | 80 | 80 | 80 | |||||
| Additional area protected from salinity by surface drainage: Dairy | ha | nm | 8 300 | 8 300 | 8 300 | |||||
| Additional area protected from salinity by surface drainage: Remnant vegetation/wetlands | ha | nm | 850 | 850 | 850 | |||||
| Additional area protected from salinity by sub-surface drainage: Horticulture | ha | nm | 100 | 100 | 100 | |||||
| Additional area protected from salinity by sub-surface drainage: Dairy | ha | nm | 4 550 | 4 550 | 4 550 | |||||
| Additional area protected from salinity by sub-surface drainage: Remnant vegetation/wetlands | ha | nm | 1 370 | 1 370 | 1 370 | |||||
| Identify the establishment of additional areas of private forestry | ha | nm | nm | nm | 20 000 | |||||
| Number of rivers with programs being implemented to improve environmental flow regimes | number | nm | nm | nm | 2 | |||||
| Additional length of river accessible to native fish | kilometres | nm | nm | nm | 300 | |||||
| Additional riparian restoration | kilometres | nm | nm | nm | 50 | |||||
| Number of regional landcare plans submitted to the Minister for endorsement | number | nm | nm | nm | 10 | |||||
| Participation rate of land managers in integrated fox management within specified project areas | per cent | nm | nm | nm | 70 | |||||
| Quality | ||||||||||
| Landholders complying with pest plant and animal control requirements under the Catchment and Land Protection Act within agreed timeframes and in targeted areas | per cent | 92 | 93 | 93 | 93 | |||||
| Proportion of State: External investment in implementation of land and water management plans | ratio | 4.8:2 | >5:2 | >5:2 | >5:2 | |||||
| Additional area of State area covered by flood maps incorporated into municipal planning schemes to reflect flood risk | per cent | nm | 30 | 30 | 30 | |||||
| 2002-03 Investment Plans prepared by CMAs and accredited under the National Action Plan | number | nm | nm | nm | 6 | |||||
| Review and renewal of Regional Catchment Management Strategies for each CMA by September 2002 | number | nm | nm | nm | 10 | |||||
| Victorian Landcare groups operating with an action plan | per cent | nm | nm | nm | 50 | |||||
| Timeliness | ||||||||||
| Corporate Plans of Water Authorities and CMAs compliant within guidelines and submitted to the Minister within agreed timeframes | per cent | nm | 100 | 100 | 100 | |||||
| Regional Catchment Strategies completed and accredited under National Action Plan for the six NAP funded CMAs | date | nm | nm | nm | Oct 2002 | |||||
| Review and renewal of Regional Catchment Management Strategies for each of 10 CMAs | date | nm | nm | nm | Sept 2002 | |||||
| Landcare census report completed | date | nm | nm | nm | Mar 2003 | |||||
| Development and implementation of statewide landcare support training package | date | nm | nm | nm | Mar 2003 | |||||
| Measurable increase in biodiversity at specific sites as a result of reduced fox predation | date | nm | nm | nm | Jun 2003 | |||||
| Development of benchmark levels of foxes and biodiversity at specific monitoring sites | date | nm | nm | nm | Jun 2003 |
| Assessment of the Gippsland Lakes Rescue Package (GLRP)—Phase 1 and the implementation of nutrient management activity and works in the Macalister Irrigation District. | date | nm | nm | nm | Mar 2003 | |||||
| Establish targets for nutrient reduction within the GLRP priority catchments | date | nm | nm | nm | Dec 2002 | |||||
| Cost | $ million | 118.8 | 140.3 | 144.2 | 158.1 | |||||
Catchment and Water Resource Allocation and Access—Development of resource allocation mechanisms and legislation to guide, facilitate and regulate land and water managers and users. New and innovative market-based measures are examined to encourage adoption of sustainable land and water management systems. | ||||||||||
| Quanity | ||||||||||
| Volume of the State's water resources covered by tradeable Bulk Water Entitlement orders granted by the Minister | million megalitres | 4.63 | 5.3 | 4.8 | 4.8 | |||||
| River Basins for which surface water allocations have been determined | number | 20 | 24 | 20 | 20 | |||||
| Volume of water permanently traded on water markets | megalitres | 27 000 | 20 000 | 35 000 | 20 000 | |||||
| New waste-water management improvement projects (New Town Sewerage Schemes) supported | number | 32 | 15 | 15 | 13 | |||||
| Number of water savings projects under implementation | number | nm | 4 | 4 | 4 | |||||
| Volume of water savings under implementation | GL | nm | 27 | 27 | 27 | |||||
| Additional annual release of environment flow to Snowy River | GL | nm | <38 | <38 | <38 | |||||
| Quality | ||||||||||
| Water entitlements and allocations determined within agreed timeframes and in accordance with national competition policy | per cent | 85 | 85 | 85 | 85 | |||||
| Bulk water entitlements being complied with to ensure security of supply and environmental flows | number | 100 | 99 | 99 | 99 | |||||
| Water supply systems where environmental flows have been met or improved | per cent | nm | nm | nm | 95 | |||||
| Water supplies meeting agreed water quality standards | per cent | 85 | 85 | 85 | 85 | |||||
| Victorian water diversions complying with Murray Darling Basin Ministerial Compliance Cap | per cent | nm | 100 | 100 | 100 | |||||
| New projects commenced incorporating water use efficiency, and key environmental outcomes | number | nm | 25 | 25 | 25 | |||||
| Timeliness | ||||||||||
| Snowy Joint Government Enterprise operationalised to permit Victoria to make its annual funding contribution | date | nm | nm | nm | Dec 2002 | |||||
| Implementation of new drinking water quality framework | date | nm | Jun 2002 | Jun 2003 | Jun 2003 | |||||
| Submission of Final Water Industry Regulatory Proposals for Cabinet endorsement | date | nm | nm | nm | Sept 2002 | |||||
| Transfer of responsibility for economic regulation of water to Essential Services Commission | date | nm | nm | nm | Jan 2003 | |||||
| Develop Water Resource Strategy recommendations for Melbourne area (in co-operation with Water Authorities) | date | nm | nm | nm | Sep 2002 | |||||
| Develop Draft Victorian Water Recycling Strategy | date | nm | nm | nm | Nov 2002 | |||||
| Develop Final Victorian Water Recycling Strategy | date | nm | nm | nm | Jun 2003 | |||||
| Allocate Bulk Water Entitlement for Yarra River Basin | date | nm | nm | nm | Jun 2003 | |||||
| Develop financial and performance framework for Rural and Non-Metropolitan Urban Water Authorities | date | nm | nm | nm | Dec 2002 | |||||
| Develop infrastructure policy framework for Water Authorities | date | nm | nm | nm | Dec 2002 | |||||
| Cost | $ million | 47.1 | 65.9 | 68.6 | 81.2 |
Source: Department of Natural Resources and Environment
Conservation and Recreation
These outputs make a contribution to the achievement of the following Key Government Outcomes:
- •
- promoting sustainable development;
- •
- protecting the environment for future generations;
- •
- sound financial management;
- •
- government that listens and leads;
- •
- growing and linking all of Victoria;
- •
- more jobs and thriving, innovative industries across Victoria; and
- •
- building cohesive communities and reducing inequalities.
These outputs make a significant contribution to the achievement of the following Departmental Objectives:
- •
- reduce the impact of human activity in Victoria on the environment;
- •
- support the commitment and capability of Victorians to live and manage sustainably within the landscape; and
- •
- better understand biodiversity values and improve knowledge of the way ecosystems function to assist Victorians to live and work within the capacity of the environment.
These outputs involve integrated services that deliver key aspects of the Government's conservation and recreation policy agenda to ensure Victoria's natural assets are enjoyed by both current and future generations. In particular, assisting land managers to maintain and improve biodiversity conservation, management of the parks and reserves system, local ports, coastal reserves and the Alpine Resorts, and provisions of opportunities for recreation, tourism and environmental education and research.
| Major Outputs/Deliverables Performance Measures | Unit of Measure | 2000-01 Actuals | 2001-02 Target | 2001-02 Expected Outcome | 2002-03 Target | |||||
|---|---|---|---|---|---|---|---|---|---|---|
| Services for Management and Governance of Victoria's Parks—This output provides for the management of Victoria's State-run parks, including both national and metropolitan parks, for their long-term protection, enjoyment and sustainable use. | ||||||||||
| Quanity | ||||||||||
| Visitor numbers: Parks Victoria estate | number million | 29.9 | 30 | 30 | 31.2 | |||||
| Threatened native species and communities for which specifically targeted conservation measures are in place—throughout Parks Victoria network of parks and reserves | number | nm | nm | nm | 20 | |||||
| Threatened native species and communities for which specifically targeted conservation measures are in place—at Royal Botanic Gardens | number | nm | nm | nm | 6 | |||||
| Threatened native species and communities for which specifically targeted conservation measures are in place—at Zoo | number | nm | nm | nm | 13 | |||||
| Quality | ||||||||||
| Visitor satisfaction with Parks Victoria services | 100 point index | 66 | 70-75 | 70-75 | 70-75 | |||||
| Community perception of Parks Victoria in providing adequate recreational opportunities in the metropolitan area and country Victoria | per cent | nm | nm | nm | 85-90 | |||||
| Community perception of Parks Victoria in managing: the protected area estate | per cent | nm | nm | nm | 80-85 | |||||
| Community perception of Parks Victoria in managing: Melbourne's major metropolitan parks | per cent | nm | nm | nm | 70-75 | |||||
| Community perception of Parks Victoria in managing: cultural heritage assets | per cent | nm | nm | nm | 65-70 | |||||
| Timeliness | ||||||||||
| Proportion of priority actions as defined in Parks Victoria Corporate Plan 2001/02-2003/04 delivered within agreed time frame | per cent | nm | nm | nm | 95 | |||||
| Cost | $ million | na | na | na | 140.4 | |||||
Biodiversity Conservation, Utilisation and Ecosystem Services—This output produces the tools and information critical for the wise use and management of Victoria's natural resources by agencies, industries and individuals such that biodiversity is protected and conserved and ecosystem services are maintained and improved. | ||||||||||
| Quanity | ||||||||||
| Regional Catchment Management Strategies incorporating bioregional biodiversity plans | per cent | nm | nm | nm | 100 | |||||
| Proportion of Victoria covered by Ecological Vegetation Class (EVC) mapping at a scale of at least 1:100 000 | per cent | nm | nm | nm | 90 | |||||
| Land for Wildlife Properties which include habitat under-represented in the reserve system | per cent | nm | nm | nm | 45 | |||||
| Items listed under the Flora and Fauna Guarantee Act with Action Statements prepared | number | 35 | 30 | 30 | 40 | |||||
| Quality | ||||||||||
| Major threats to biodiversity with management strategy and effectiveness monitoring program | number | nm | nm | nm | 2 | |||||
| Presentations made and scientific publications in peer reviewed journals | number | nm | nm | nm | 50 | |||||
| Timeliness | ||||||||||
| Game and Wildlife Licence applications assessed within 15 working days | per cent | nm | nm | nm | 100 | |||||
| Input to planning approvals process provided within statutory time frames | per cent | 100 | 100 | 100 | 100 | |||||
| Cost | $ million | na | na | na | 18.5 | |||||
Nature and Heritage Recreation and Tourism Services—This output produces the information and tools critical for the sustainable use of public land, historic places and coastal waters for recreation and tourism while maximising public benefit and community enjoyment and minimising environmental and public risk. | ||||||||||
| Quanity | ||||||||||
| New tourism/recreation development proposals on public land | number | nm | nm | nm | 1 | |||||
| Participants in Coast Action/ Coastcare activities | number ('000) | nm | nm | nm | 18-20 | |||||
| Quality | ||||||||||
| Statewide Risk Management Projects completed to NRE satisfaction | per cent | nm | nm | nm | 100 | |||||
| Implementation of annually agreed actions of major strategies | per cent | nm | nm | nm | 100 | |||||
| Community perception of Parks Victoria in managing bays, piers and selected waterways | per cent | nm | nm | nm | 55-60 | |||||
| Timeliness | ||||||||||
| Coastal Management Act consents completed within statutory timeframes | per cent | nm | nm | nm | 100 | |||||
| Alpine leasing approvals signed within 8 weeks | per cent | nm | nm | nm | 80 | |||||
| Cost | $ million | na | na | na | 27.4 |
Source: Department of Natural Resources and Environment
Energy and Greenhouse Policy Advice
These outputs make a contribution to the achievement of the following Key Government Outcomes:
- •
- growing and linking all of Victoria;
- •
- promoting sustainable development;
- •
- more jobs and thriving, innovative industries across Victoria; and
- •
- protecting the environment for future generations.
These outputs make a significant contribution to the achievement of the following Departmental Objectives:
- •
- contribute to sustainable economic growth of Victoria's land and resource based industries while balancing social, environmental, and economic outcomes; and
- •
- reduce the impact of human activity in Victoria on the environment.
These outputs involve the development and implementation of policy in relation to the Government's Greenhouse response and to deliver a secure and cost effective energy supply.
| Major Outputs/Deliverables Performance Measures | Unit of Measure | 2000-01 Actuals | 2001-02 Target | 2001-02 Expected Outcome | 2002-03 Target | |||||
|---|---|---|---|---|---|---|---|---|---|---|
| Greenhouse Policy Services—Leading the development and implementation of a strategic, whole of Government greenhouse response. | ||||||||||
| Quanity | ||||||||||
| Major policy papers, strategy reviews or research papers completed | number | nm | 4 | 4 | 5 | |||||
| Ministerial correspondence and general or specific Ministerial briefings | number | nm | 220 | 100 | 220 | |||||
| Response to public enquiries | number | nm | 100 | 350 | 180 | |||||
| Quality | ||||||||||
| Ministerial endorsement and support of key stages for the ongoing development, review and implementation of Victorian Greenhouse Strategy | per cent | nm | 95 | 95 | 95 | |||||
| Timeliness | ||||||||||
| Responses to Ministerial correspondence delivered within agreed timelines | per cent | nm | 80 | 80 | 80 | |||||
| Ad hoc policy advice delivered as required with initial advice and estimated date of completion within 2 working days | per cent | nm | 95 | 95 | 95 | |||||
| Other key deliverables and projects managed on time—in line with planned and agreed project timetables | per cent | nm | 85 | 85 | 90 | |||||
| Cost | $ million | na | 26.8 | 27.5 | 32.3 | |||||
Energy Policy Services—Provision of policy advice to deliver Government objectives for a secure and cost effective energy supply to the State. | ||||||||||
| Quanity | ||||||||||
| Major strategic policy advice to Government | number | nm | 3 | 3 | 4 | |||||
| Strategic policy briefings to Portfolio Minister | number | nm | 150 | 100 | 200 | |||||
| Exercise strategies for electricity and gas supply emergencies | number | nm | nm | nm | 2 | |||||
| Quality | ||||||||||
| Powerline relocation grants approved | per cent | nm | nm | nm | 20 | |||||
| Ministerial satisfaction with policy advice received from the Division | per cent | nm | 80 | 80 | 85 | |||||
| Compliance with criteria for approval of powerline relocation grants | per cent | nm | nm | nm | 100 | |||||
| Responses to Ministerial correspondence delivered within agreed timelines | number | nm | nm | nm | 80 | |||||
| Timeliness | ||||||||||
| Key deliverables and projects managed on time—in line with planned and agreed project timetable | per cent | nm | 90 | 90 | 95 | |||||
| Cost | $ million | na | 7.4 | 7.1 | 6.9 | |||||
Source: Department of Natural Resources and Environment
These outputs make a contribution to the achievement of the following Key Government Outcomes:
- •
- protecting the environment for future generations; and
- •
- government that listens and leads.
These outputs make a significant contribution to the achievement of the following Departmental Objective:
- •
- provide a safe and ecologically sustainable living environment through protection and restoration of air, land and water quality and the control of unwanted noise.
These outputs involve providing the framework for sustainable improvements in environmental quality through:
- •
- statutory policy, legislation and regulations;
- •
- measuring and reporting environmental quality;
- •
- promoting adoption of best practice environmental management in industry; and
- •
- increasing public awareness of and access to the wide range of information generated by EPA.
| Major Outputs/Deliverables Performance Measures | Unit of measure | 2000-01 Actual | 2001-02 Target | 2001-02 Expected Outcome | 2002-03 Target | |||||
|---|---|---|---|---|---|---|---|---|---|---|
| Policy Frameworks, Regulations and Services to Enhance Air Quality—Protection of the health of the community by setting and enforcing goals and standards, undertaking monitoring and research, promoting better management of air quality, addressing global air quality issues and through communication and information programs. | ||||||||||
| Quantity | ||||||||||
| State of environment and research reports issued | number | 10 | 10 | 10 | 10 | |||||
| Improvement tools, guidelines, policies, systems and plans completed | number | 6 | 6 | 6 | 6 | |||||
| Quality | ||||||||||
| Compliance with air quality standards, as proportion of samples collected | per cent | 99 | 99 | 99 | 99 | |||||
| Compliance with statutory requirements, as proportion of assessments | per cent | 90 | 85 | 85 | 85 | |||||
| Improvement tools, guidelines, policies, systems and plans adopted or accepted by Government and stakeholders | per cent | 80 | 80 | 80 | 80 | |||||
| Timeliness | ||||||||||
| Improvement tools, guidelines, policies, systems and plans meet Corporate Plan targets | per cent | 100 | 100 | 100 | 100 | |||||
| Statutory actions completed within required timelines | per cent | 87 | 95 | 95 | 95 | |||||
| Pollution incident reports acted on within 3 days | per cent | 93 | 85 | 85 | 85 | |||||
| Cost | $ million | 9.7 | 10.5 | 10.8 | 10.9 | |||||
Policy Frameworks, Regulations and Services to Enhance Water Quality—To ensure that beneficial uses of water are protected by setting and enforcing goals and standards, establishing environment protection programs and undertaking monitoring and research. | ||||||||||
| Quantity | ||||||||||
| State of Environment and research reports issued | number | 10 | 10 | 10 | 10 | |||||
| Improvement tools, guidelines, policies, systems and plans completed | number | 5 | 5 | 5 | 5 | |||||
| Quality | ||||||||||
| Improved compliance with water quality standards (based on samples collected) | per cent | nm | 5 | 5 | 5 | |||||
| Compliance with statutory requirements, as proportion of assessments | per cent | 90 | 85 | 85 | 85 | |||||
| Improvement tools, guidelines, policies, systems and plans adopted or accepted by government or stakeholders | per cent | 80 | 80 | 80 | 80 | |||||
| Timeliness | ||||||||||
| Improvement tools, guidelines, policies, systems and plans meet Corporate Plan targets | per cent | 100 | 100 | 100 | 100 | |||||
| Statutory actions completed within required timelines | per cent | 87 | 95 | 95 | 95 | |||||
| Pollution incident reports acted on within 3 days | per cent | 93 | 85 | 85 | 85 | |||||
| Cost | $ million | 14.6 | 15.5 | 15.8 | 18.3 | |||||
Policy Frameworks, Regulations and Services to Protect Groundwater and the Land Environment from Pollution—To ensure prevention of contamination of land and groundwater and, where contamination has occurred, that it is managed to maximise the current and future usefulness of the resource. | ||||||||||
| Quantity | ||||||||||
| Improvement tools, policies, systems and plans completed | number | 4 | 4 | 4 | 4 | |||||
| Quality | ||||||||||
| Compliance with statutory requirements as a percentage of assessments | per cent | 87 | 85 | 85 | 85 | |||||
| Land audits complying with statutory requirements and system guidelines | per cent | 100 | 90 | 90 | 90 | |||||
| Improvement tools, policies, systems and plans, adopted or accepted by government or stakeholders | per cent | 80 | 80 | 80 | 80 | |||||
| Timeliness | ||||||||||
| Improvement tools, policies, systems and plans meet Corporate Plan targets | per cent | 100 | 100 | 100 | 100 | |||||
| Statutory actions completed within required timelines | per cent | 87 | 95 | 95 | 95 | |||||
| Pollution incident reports acted on within 3 days | per cent | 93 | 85 | 85 | 85 | |||||
| Cost | $ million | 3.1 | 2.6 | 2.7 | 2.7 | |||||
Services to Control noise in the community—Legislation, policies, strategies, statutory processes or other services for prevention and control of noise in the community through controls on industrial and commercial sources, motor vehicles and traffic, and domestic sources to prevent and control noise. | ||||||||||
| Quantity | ||||||||||
| Strategies completed | number | 2 | 2 | 2 | 2 | |||||
| Quality | ||||||||||
| Compliance with statutory requirements as a proportion of assessments | per cent | 90 | 85 | 85 | 85 | |||||
| Strategies adopted or accepted by government or stakeholders | per cent | 80 | 80 | 80 | 80 | |||||
| Timeliness | ||||||||||
| Strategies meet Corporate Plan targets | per cent | 100 | 100 | 100 | 100 | |||||
| Statutory actions completed within required timelines | per cent | 87 | 95 | 95 | 95 | |||||
| Pollution incident reports acted on within 3 days | per cent | 93 | 85 | 85 | 85 | |||||
| Cost | $ million | 1.9 | 1.6 | 1.6 | 1.6 | |||||
Policies, Regulations and Services to Reduce and Manage Waste—Legislation, policies, statutory and non-statutory processes and other services to ensure beneficial uses of the environment are protected by setting and enforcing goals and standards, developing regulatory and non-regulatory programs and undertaking monitoring and research which drive waste reduction recycling and improved management of residual waste. | ||||||||||
| Quantity | ||||||||||
| Waste analysis and research reports issued | number | 5 | 5 | 5 | 5 | |||||
| Improvement tools, guidelines, policies, systems and plans completed | number | 5 | 5 | 5 | 5 | |||||
| Funding EcoRecycle Victoria and Regional Waste Management Groups | $ million | 9.2 | 13.2 | 13.2 | 13.2 | |||||
| Quality | ||||||||||
| Compliance with statutory requirements as a proportion of assessments | per cent | 90 | 85 | 85 | 85 | |||||
| Improvement tools, policies, systems and plans, adopted or accepted by government or stakeholders | per cent | 80 | 80 | 80 | 80 | |||||
| Timeliness | ||||||||||
| Improvement tools, policies, systems and plans meet Corporate Plan targets | per cent | 100 | 100 | 100 | 100 | |||||
| Statutory actions completed within required timelines | per cent | 87 | 95 | 95 | 95 | |||||
| Pollution incident reports acted on within 3 days | per cent | 93 | 85 | 85 | 85 | |||||
| Cost | $ million | 17.6 | 23.1 | 23.4 | 19.8 | |||||
Neighbourhood Environment Improvement—Promoting greater community involvement and ownership of environmental issues. | ||||||||||
| Quantity | ||||||||||
| Pilot Neighbourhood Environment Improvement Plans (NEIP) developed | number | nm | 3 | 3 | 5 | |||||
| Quality | ||||||||||
| NEIPs developed and adopted by local Government and stakeholders | per cent | nm | 100 | 100 | 100 | |||||
| Timeliness | ||||||||||
| NEIPs delivered progressively over financial year | date | nm | Jun 2002 | Jun 2002 | Jun 2003 | |||||
| Cost | $ million | 0.5 | 1.0 | 1.0 | 1.0 | |||||
Source: Department of Natural Resources and Environment
Fisheries
These outputs make a contribution to the achievement of the following Key Government Outcomes:
- •
- growing and linking all of Victoria;
- •
- promoting sustainable development;
- •
- more jobs and thriving, innovative industries across Victoria;
- •
- protecting the environment for future generations;
- •
- building cohesive communities and reducing inequalities; and
- •
- promoting rights and respecting diversity.
These outputs make a significant contribution to the achievement of the following Departmental Objectives:
These outputs provide sustainable development of Victoria's regional, commercial, recreational and aquaculture fishing industries and management of Victoria's marine and freshwater fish resources.
| Major Outputs/Deliverables Performance Measures | Unit of measure | 2000-01 Actuals | 2001-02 Target | 2001-02 Expected Outcome | 2002-03 Target | |||||
|---|---|---|---|---|---|---|---|---|---|---|
| Sustainable Fisheries Utilisation Services—Management of fisheries resources in partnership with stakeholders as the framework for sustainable utilisation of commercial and recreational fisheries. | ||||||||||
| Quantity | ||||||||||
| Additional management plans completed | number | 0 | 3 | 3 | 1 | |||||
| Assessment reports of the status of Victoria's key fisheries and fish habitats completed | number | 10 | 8 | 8 | 8 | |||||
| Number of fisheries where ESD-based sustainability indicators have been developed | number | nm | 2 | 2 | 2 | |||||
| Number of fish produced for recreational stocking purposes | number ('000) | nm | 1 000 | 1 700 | 1 500 | |||||
| Quality | ||||||||||
| Presentations made and scientific publications in peer review journals | number | nm | 15 | 19 | 20 | |||||
| Proportion of research funding achieved from external sources | per cent | nm | 35 | 55 | >40 | |||||
| Proportion of commercial fishing catch and effort returns received by due date | per cent | nm | >80 | >80 | >90 | |||||
| Proportion of licence renewals and quota transfers completed within set period: Quota transfers | per cent | nm | 90 | 90 | >90 | |||||
| Proportion of licence renewals and quota transfers completed within set period: Licence renewals | per cent | nm | 90 | 90 | >90 | |||||
| Proportion of RFL revenue used to administer the licencing system compared to total revenue raised | per cent | nm | <10 | <10 | <10 | |||||
| Survey of under-exploited areas for harvesting abalone | number | nm | 1 | 0 | 1 | |||||
| Timeliness | ||||||||||
| Assessment reports, plans and indicators completed | date | Jun 2001 | Jun 2002 | Jun 2002 | Jun 2003 | |||||
| Surveys of stakeholders completed | date | Jun 2001 | Jun 2002 | Jun 2002 | Jun 2003 | |||||
| Establishment of the Compensation Assessment Panel and Compensation Appeals Tribunal(a) | date | nm | nm | nm | Apr 2003 | |||||
| Cost | $ million | 16.4 | 21.5 | 22.2 | 18.4 | |||||
Industry and Community Compliance Services—Education, inspection and enforcement services to ensure industry and community compliance with legislation/regulations and management plans and the sustainable use of fisheries resources. | ||||||||||
| Quantity | ||||||||||
| Compliance with legislation and regulations | per cent | 93 | 90 | 90 | 90 | |||||
| Inspections conducted in the commercial sector | number | 1 610 | 2 050 | 1 300 | 2 050 | |||||
| Recreational sector contacts made | number | 33 817 | 28 000 | 25 000 | 28 000 | |||||
| Aquaculture operations checked | number | 221 | 100 | 100 | 100 | |||||
| Successful court prosecutions | per cent | 99.5 | 90 | 90 | 95 | |||||
| Investigations and planned operations targeting illegal fishing | number | 6 | 22 | 22 | 22 | |||||
| Number of extension contacts with stakeholder groups | number | nm | 165 | 165 | 165 | |||||
| Compliance with Marine Park legislation and regulations | per cent | nm | >70 | 0 | >70 | |||||
| Patrol Hours by fisheries officers in Marine Parks | number | nm | 3 750 | 0 | 3 750 | |||||
| Planned operations targeting illegal activity in Marine Parks | number | nm | 3 | 0 | 3 | |||||
| Quality | ||||||||||
| Level of stakeholder understanding of fisheries regulations | per cent | nm | >60 | >60 | >60 | |||||
| Customer satisfaction with fisheries in the recreational, commercial or aquaculture sectors | per cent | nm | >65 | >65 | >65 | |||||
| Proportion of fishing community that has seen fisheries educational material in the last 6 months | per cent | nm | >65 | >65 | >65 | |||||
| Timeliness | ||||||||||
| Survey of stakeholders completed by | date | May 2001 | May 2002 | May 2002 | Jun 2003 | |||||
| Cost | $ million | 7.8 | 12.0 | 10.3 | 18.7 | |||||
Aquaculture and Fishing Industry Development—Provision of information and advisory services to facilitate the development of profitable, diverse, ecologically sustainable and well-managed industries. | ||||||||||
| Quantity | ||||||||||
| Number of aquaculture scientific publications produced | number | nm | 6 | 6 | 6 | |||||
| Number of business and industry development and assistance contacts with commercial fishing and aquaculture sectors | number | 1 348 | 1 000 | 1 200 | 1 200 | |||||
| Number of workshops held and technical publications produced | number | nm | 10 | 10 | 10 | |||||
| Fish Health Accreditation Surveillance Program—farmed and wild fish sector inspections | number | nm | 25 | 25 | 25 | |||||
| Development of aquaculture zone management plans and associated baseline environmental information(b) | number | nm | 4 | 0 | 1 | |||||
| Quality | ||||||||||
| Proportion of aquaculture licences approved within specified period | per cent | nm | nm | nm | >75 | |||||
| Timeliness | ||||||||||
| Plans and strategies and strategic advice delivered within agreed timelines | per cent | nm | nm | nm | 100 | |||||
| Provision of strategic economic advice on commercial fisheries and aquaculture within agreed timelines | per cent | nm | nm | nm | 100 | |||||
| Cost | $ million | 2.8 | 3.7 | 2.6 | 3.4 | |||||
Source: Department of Natural Resources and Environment
Notes:
- (a)
- Establishment of the panel and tribunal are required under proposed amendments to the Fisheries Act 1995 by the National Parks (Marine National Parks and Marine Sanctuaries) Act 2002.
- (b)
- One aquaculture management plan to be prepared for all of Port Phillip Bay, rather than individual plans for each of the four aquaculture zones proposed to have plans developed.
Forest and Fire Management
These outputs make a contribution to the achievement of the following Key Government Outcomes:
- •
- growing and linking all of Victoria;
- •
- promoting sustainable development;
- •
- more jobs and thriving, innovative industries across Victoria;
- •
- protecting the environment for future generations;
- •
- growing and linking all of Victoria;
- •
- building cohesive communities and reducing inequalities; and
- •
- promoting rights and respecting diversity.
These outputs make a significant contribution to the achievement of the following Departmental Objectives:
- •
- contribute to sustainable economic growth of Victoria's land and resource based industries while balancing social, environmental, and economic outcomes;
- •
- reduce the impact of human activity in Victoria on the environment;
- •
- support the commitment and capability of Victorians to live and manage sustainably within the landscape; and
- •
- better understand biodiversity values and improve knowledge of the way ecosystems function to assist Victorians to live and work within the capacity of the environment.
These outputs involve sustainable management of State forests for a range of productive, conservation and recreation uses and to ensure integrated management of fire and fire-related activities on public land for the purpose of protecting human life, property, assets and environmental values, and for sustaining biological diversity.
| Major Outputs/Deliverables Performance Measures | Unit of measure | 2000-01 Actuals | 2001-02 Target | 2001-02 Expected Outcome | 2002-03 Target | |||||
|---|---|---|---|---|---|---|---|---|---|---|
| Fire Prevention and Planning—Preparation of plans, codes, prescriptions and guidelines which establish the framework for effective fire management on public land; activities for the prevention of wildfire (community education, regulation); and non seasonally variable activities that minimise the adverse impact of wildfire (training, fixed infrastructure, radio communications, information systems, and fire fighting equipment). | ||||||||||
| Quantity | ||||||||||
| Readiness and Response Plans completed | number | 5 | 5 | 5 | 5 | |||||
| Incident Channel sites maintained as part of NRE's radio communication network | number | nm | 51 | 51 | 51 | |||||
| Personnel with accreditation in a fire role | number | nm | 1 100 | 1 100 | 1 100 | |||||
| Quality | ||||||||||
| Proportion of personnel accredited in a fire role who have level 2 or 3 accreditation | per cent | nm | 10 | 10 | 10 | |||||
| Timeliness | ||||||||||
| Readiness and Response Plans completed prior to fire season | date | Nov 2000 | Dec 2001 | Dec 2001 | Dec 2002 | |||||
| Assessments of Standards of Cover completed prior to fire season | date | Nov 2000 | Nov 2001 | Nov 2001 | Nov 2002 | |||||
| Cost | $ million | 14.3 | 19.9 | 23.3 | 23.3 | |||||
Fire Operations—Seasonally variable activities that minimise the adverse impact of wildfire (hazard management, access, detection, stand-by, seasonal firefighters, aircraft, and equipment), response and recovery activities. | ||||||||||
| Quantity | ||||||||||
| Fuel reduction burning completed | ha ('000) | 65.8 | 100 | 100 | 100 | |||||
| Quality | ||||||||||
| Fire controlled at less than 5 ha | per cent | 86.75 | 75 | 75 | 75 | |||||
| Timeliness | ||||||||||
| Fires controlled at First Attack | per cent | 94.5 | 75 | 75 | 75 | |||||
| Cost | $ million | 50.2 | 37.3 | 41.6 | 32.9 | |||||
Sustainable Forest Management Services—Sustainable and transparent management of Victoria's State forests to strike a community supported balance between: the use of the forest estate by forest-based industries; meeting community needs; contributing to regional and State economic activity and protecting environmental, cultural and water values.(a) | ||||||||||
| Quantity | ||||||||||
| Forest Management Areas (FMA) subject to Code of Forest Practices audit | number | 4 | 4 | 4 | 4 | |||||
| Gross area of State forest with current management plans | per cent | nm | 75 | 75 | 80 | |||||
| Quality | ||||||||||
| Gross area of State forest where forest resource inventory is complete(b) | per cent | nm | 55 | 55 | 68 | |||||
| Improved opportunities for community involvement in forest planning, management and education(c) | per cent | nm | nm | nm | 50 | |||||
| Asset management maintenance program developed and implemented | per cent | nm | nm | nm | 60 | |||||
| Improved Timber Resource estimates completed within harvestable areas of State forest(c) | per cent | nm | nm | nm | 30 | |||||
| Timeliness | ||||||||||
| Regional Forest Agreement milestones due in the reporting year that are achieved | per cent | nm | 80 | 80 | 80 | |||||
| Cost | $ million | na | 71.2 | 35.4 | 69.8 | |||||
Sustainable Forest Production and Industry Development—Generating a fair return to the State for resources supplied to the timber industry wealth through a transparent and commercially efficient licensing and allocation system which also promotes a competitive, efficient and sustainable timber industry with enhanced efficiency in the utilisation of forest produce(a). | ||||||||||
| Quantity | ||||||||||
| Sale of higher quality grade sawlogs (D+)(d) | m3 ('000) | 742.7 | 750.0 | 729.0 | 735.0 | |||||
| Sale of lower quality and small sawlogs (below D grade)(d) | m3 ('000) | 138.4 | 120.0 | 120.0 | 120.0 | |||||
| Sale of pulpwood—Legislative supply agreements(d) | m3 ('000) | 1 422.5 | 1 446.0 | 1 240.0 | 1 122.0 | |||||
| Sale of thinnings(d) | m3 ('000) | 18.0 | 100.0 | 100.0 | 200.0 | |||||
| Area of regrowth forest thinned | ha | 4 300 | 5 500 | 5 500 | 5 500 | |||||
| Quality | ||||||||||
| Area regenerated successfully at first attempt | per cent | 90 | 90 | 90 | 90 | |||||
| Industry restructure targets achieved(c) | per cent | nm | nm | nm | 75 | |||||
| Timeliness | ||||||||||
| Wood Utilisation Plans provided to customers | date | Mar 2001 | Mar 2002 | Mar 2002 | Mar 2003 | |||||
| Cost | $ million | na | 66.0 | 103.4 | 82.2 | |||||
Source: Department of Natural Resources and Environment
Notes:
- (a)
- Includes revised wording to reflect the Government's 'Our Forests Our Future' Statement. The performance measures included in these outputs have been adjusted, where possible, to reflect the initiatives under the 'Our Forests Our Future' Statement.
- (b)
- To simplify terminology, replacing 'SFRI' with 'forest resource'.
- (c)
- To identify a key area of Government's Our Forests Our Future Statement.
- (d)
- Identification of specific products and targets as highlighted in the Government's 'Our Forests Our Future' Statement.
Land Management and Information
These outputs make a contribution to the achievement of the following Key Government Outcomes:
- •
- growing and linking all of Victoria;
- •
- promoting sustainable development;
- •
- more jobs and thriving, innovative industries across Victoria;
- •
- building cohesive communities and reducing inequalities;
- •
- promoting rights and respecting diversity;
- •
- sound financial management;
- •
- government that listens and leads; and
- •
- protecting the environment for future generations.
These outputs make a significant contribution to the achievement of the following Departmental Objectives:
- •
- contribute to sustainable economic growth of Victoria's land and resource based industries while balancing social, environmental, and economic outcomes; and
- •
- support the commitment and capability of Victorians to live and manage sustainably within the landscape.
These outputs involve the promotion of sustainable economic growth and community confidence through land administration and land management systems (for both Crown and freehold land) that are integrated, accessible, authoritative and coordinated to facilitate land related transactions, and to ensure good management of the State's interest in Crown Land.
| Major Outputs/Deliverables Performance Measures | Unit of measure | 2000-01 Actuals | 2001-02 Target | 2001-02 Expected Outcome | 2002-03 Target | |||||
|---|---|---|---|---|---|---|---|---|---|---|
| Public Land Management—Optimising the active management of Crown Land to ensure a balance between protection and development of natural and cultural assets. This output includes the direct management of Crown Land, the reservation and appointment of appropriate managers over Crown land, leasing and licensing, purchasing and sale of Crown Land and the coordination of native title issues and land use planning. It includes the preparation of policies, strategies, guidelines and plans for the use and management of Crown Land and the maintenance of the Crown Land database. | ||||||||||
| Quantity | ||||||||||
| Land within the Public Land Management (Land Victoria) portfolio actively managed | per cent | nm | 70 | 70 | 60 | |||||
| Quality | ||||||||||
| Parcels of Crown Land actively managed that had a formal complaint to the Minister | per cent | nm | <5 | <5 | <1 | |||||
| Timeliness | ||||||||||
| Dealings regarding land management responded within Statute or Service Agreement timeframes | per cent | nm | 95 | 95 | 85 | |||||
| Cost | $ million | na | na | na | 24.4 | |||||
Land Information—The provision of accurate, reliable and authoritative information on boundaries, interests, valuations and other land-related data about public and privately owned land and transactions in the land market by monitoring, recording and updating records related to the definition of land. This output includes the number of land dealings registered, new titles created, proposed and approved plans of subdivision added to the cadastre, maintenance and improvement of the State's Geospatial Information Infrastructure and Land Channel information requests. | ||||||||||
| Quantity | ||||||||||
| Key information requests, registrations and updates (over the counter and on-line) per year | average ('000) | nm | nm | nm | 6 570 | |||||
| Quality | ||||||||||
| Accuracy of requests for information supplied | per cent | nm | nm | nm | >99 | |||||
| Audited Vicmap digital map base not requiring corrections | per cent | 92.5 | 95 | 95 | 95 | |||||
| Timeliness | ||||||||||
| Titles and instruments search requests available within 24 hours | per cent | 95 | 95 | 95 | 95 | |||||
| Land dealings registered within 3 weeks | per cent | 82.75 | 70 | 70 | 70 | |||||
| New titles (subdivisions) created within 4 weeks | per cent | 83.25 | 70 | 70 | 70 | |||||
| Update transactions for the Vicmap digital map base processed within the required timeframes | per cent | 97 | 95 | 95 | 95 | |||||
| Cost | $ million | na | na | na | 82.2 |
Source: Department of Natural Resources and Environment
Minerals and Petroleum
These outputs make a contribution to the achievement of the following Key Government Outcomes:
- •
- growing and linking all of Victoria;
- •
- promoting sustainable development;
- •
- more jobs and thriving, innovative industries across Victoria; and
- •
- protecting the environment for future generations.
These outputs make a significant contribution to the achievement of the following Departmental Objective:
- •
- contribute to sustainable economic growth of Victoria's land and resource based industries while balancing social, environmental, and economic outcomes.
These outputs involve the stimulation of the generation of wealth through the sustainable development of Victoria's earth resources by regulating and promoting the exploration and development of Victoria's extractive, mineral and petroleum resources leading to:
- •
- the establishment of new producing operations;
- •
- safe and environmentally responsible operations;
- •
- secure and competitive sources of gas supply; and
- •
- extractive industry products.
| Major Outputs/Deliverables Performance Measures | Unit of measure | 2000-01 Actuals | 2001-02 Target | 2001-02 Expected Outcome | 2002-03 Target | |||||
|---|---|---|---|---|---|---|---|---|---|---|
| Minerals and Petroleum Regulation Services—Provide a consistent and transparent tenement management regime together with health, safety and environmental standards, monitoring and enforcement that ensure industry operations meet community expectations. | ||||||||||
| Quantity | ||||||||||
| Licences, Permits and Authorities under administration | number | nm | 1 658 | 1 658 | 1 650 | |||||
| Audits of high or critical sites completed | number | 188 | 164 | 107 | 107 | |||||
| Quality | ||||||||||
| Exploration and mining licences which are not active | per cent | 31 | 20 | 20 | 20 | |||||
| Timeliness | ||||||||||
| Mining industry work-plans not processed in one month | per cent | 6.25 | 20 | 20 | 10 | |||||
| Mining licence applications not determined after four months | per cent | 0 | 20 | 20 | 10 | |||||
| Exploration license applications not determined after three months | per cent | 0 | 10 | 20 | 10 | |||||
| Cost | $ million | 6.4 | 7.3 | 7.2 | 7.3 | |||||
Minerals and Petroleum Industry Development and Information—Promote the development of extractive, mineral and petroleum industries in Victoria by facilitating significant projects and maintaining, updating, developing and distributing relevant information. | ||||||||||
| Quantity | ||||||||||
| Strategic areas of the State in which semi-regional gravity surveys have been completed | per cent | nm | nm | nm | 98 | |||||
| Targeted industry information packages released | number | 15 | 15 | 15 | 15 | |||||
| Strategic areas of the State in which planned new generation mapping has been completed(a) | per cent | nm | 70 | 70 | 74 | |||||
| Quality | ||||||||||
| Proportion of publications and packages requiring post-release correction or recall | per cent | nm | 5 | 5 | 5 | |||||
| Timeliness | ||||||||||
| Input to Environment Effects Statements (EES) completed according to EES panel timelines | per cent | 100 | 100 | 100 | 100 | |||||
| Victorian Initiatives for Minerals and Petroleum (VIMP) data releases meeting timetable | per cent | 90 | 90 | 90 | 90 | |||||
| Cost | $ million | 7.7 | 8.3 | 9.7 | 10.0 | |||||
Source: Department of Natural Resources and Environment
Note:
- (a)
- Incorporates recommendation made by PAEC, Report on the 2001-02 Budget Estimates, Page 394.
Part 2 provides the financial statements that support the Department's provision of outputs. The information provided includes the Statement of Financial Performance, Statement of Financial Position and Statement of Cash Flows for the Department as well as authority for resources.
The total resources made available to a department are applied to three uses:
- •
- the provision of outputs;
- •
- asset investment; or
- •
- payments on behalf of the State.
The following three financial statements are presented in the format consistent with the AAS29 accounting standard. However, for the purposes of this paper they have been divided into controlled and administered items.
Administered items refer to those resources over which the Department cannot exercise direct control. Authority is provided through an appropriation for payments made on behalf of the State. Under the AAS29 standard, these items would normally appear as notes to the financial statements.
Financial Statements
The following four tables can be used to assess the Department's financial performance and use of resources.
- •
- Table 2.6.2—Statement of Financial Performance—provides details of the Department's controlled revenue and expenses on an accrual basis reflecting the cost of providing its outputs;
- •
- Table 2.6.3—Statement of Financial Position—shows all controlled assets and liabilities of the Department. The difference between these represents the net assets position, which is an indicator of the State's equity in the Department;
- •
- Table 2.6.4—Statement of Cash Flows—shows all movements of cash (cash received and paid). The cash impact of financing and investing activities on Departmental resources is highlighted in this statement; and
- •
- Table 2.6.5—Administered Items Statement—provides details of the Department's administered revenue and expenses (on an accrual basis), and its administered assets and liabilities.
Table 2.6.2: Statement of Financial Performance
| | 2000-01 Actual | 2001-02 Budget | 2001-02 Revised | 2002-03 Budget | Variation(a) | ||||||
|---|---|---|---|---|---|---|---|---|---|---|---|
| | ($ million) | % | |||||||||
| Revenue from ordinary activities | |||||||||||
| Output appropriations | 814.9 | 772.5 | 910.0 | 978.4 | 26.7 | ||||||
| Special appropriations | — | — | — | — | — | ||||||
| Resources received free of charge or for nominal consideration | 4.3 | — | — | — | — | ||||||
| Sale of goods and services | 37.1 | 66.1 | 36.0 | 35.9 | (45.7 | ) | |||||
| Commonwealth Grants | — | 56.0 | — | — | (100.0 | ) | |||||
| Taxes | 87.0 | 87.0 | 88.5 | 90.8 | 4.4 | ||||||
| Fines and Fees | 11.1 | 8.8 | 12.6 | 8.2 | (7.5 | ) | |||||
| Other revenue and revenue from other parties | 27.1 | 0.6 | 4.7 | 1.1 | 91.3 | ||||||
| 981.5 | 990.9 | 1 051.8 | 1 114.4 | 12.5 | |||||||
| Expenses from ordinary activities | |||||||||||
| Employee entitlements | 281.3 | 255.3 | 296.0 | 299.7 | 17.4 | ||||||
| Depreciation and amortisation | 28.4 | 33.5 | 33.5 | 41.9 | 25.2 | ||||||
| Resources provided free of charge or for nominal consideration | 9.8 | — | — | — | — | ||||||
| Grants and other payments | 253.3 | 287.8 | 317.7 | 358.6 | 24.6 | ||||||
| Capital asset charge | 67.0 | 75.6 | 75.6 | 82.3 | 8.9 | ||||||
| Supplies and services | 321.0 | 359.3 | 350.6 | 336.9 | (6.2 | ) | |||||
| Other expenses from ordinary activities | 15.6 | — | — | — | — | ||||||
| Borrowing costs | 0.5 | — | — | — | — | ||||||
| 976.8 | 1 011.5 | 1 073.3 | 1 119.4 | 10.7 | |||||||
| Result from ordinary activities | 4.7 | (20.6 | ) | (21.5 | ) | (5.1 | ) | (75.4 | ) | ||
| Loss from extraordinary items | — | — | — | — | — | ||||||
| Net result for the reporting period | 4.7 | (20.6 | ) | (21.5 | ) | (5.1 | ) | (75.4 | ) | ||
| Net increase in asset revaluation reserve | (0.6 | ) | — | — | — | — | |||||
| Total revenues, expenses and revaluation adjustments recognised directly in equity | (0.6 | ) | — | — | — | — | |||||
| Total changes in equity other than those resulting from transactions with Victorian State Government in its capacity as owner | 4.1 | (20.6 | ) | (21.5 | ) | (5.1 | ) | (75.4 | ) | ||
Source: Department of Treasury and Finance
- Note:
- (a)
- Variation between 2001-02 Budget and 2002-03 Budget.
Statement of Financial Performance
DNRE is projecting an operating deficit of $5.1 million in 2002-03 compared to a budgeted and revised 2001-02 deficit of $20.6 million and $21.5 million respectively.
The largest part of DNRE operating revenue is provided by the State Government to fund the provision of services and a range of grants to external organisations. A further component of DNRE revenue is generated from activities such as taxes (mainly the Metropolitan Parks Charge and the Landfill Levy), grants from the Commonwealth Government and payments to DNRE's agricultural research institutes for research and other services provided to bodies outside the department.
The projected $123.5 million increase in DNRE operating revenue is mainly due to:
- •
- funding for new initiatives such as Our Forests Our Future and Achieving Reconciliation with Indigenous Communities; and
- •
- accounting classification changes resulting from the adoption of the Model Financial Report for Victorian Government Departments.
The projected $107.9 million increase in DNRE operating expenses is predominantly due to:
- •
- expenses related to new government initiatives and asset investment (including depreciation expense and capital asset charge);
- •
- grants to bodies outside the budget sector to fund initiatives including Our Forests Our Future; FarmBis and other agricultural assistance programs; and implementation of the National Action Plan for Salinity and Water Quality which will address the problem of salinity in rural areas.
Table 2.6.3: Statement of Financial Position
| | Estimated as at 30 June | |||||||||||
|---|---|---|---|---|---|---|---|---|---|---|---|---|
| | 2001 Actual | 2002 Budget | 2002 Revised | 2003 Budget | Variation(a) | |||||||
| | ($ million) | % | ||||||||||
| Current assets | ||||||||||||
| Cash assets | 60.4 | 50.0 | 53.8 | 48.4 | (3.3 | ) | ||||||
| Other financial assets | 27.1 | 27.1 | 27.1 | 24.1 | (11.1 | ) | ||||||
| Receivables | 28.7 | 28.7 | 28.7 | 28.5 | (0.7 | ) | ||||||
| Inventories | 13.6 | 13.6 | 13.6 | 13.6 | — | |||||||
| Prepayments | 1.6 | 1.6 | 1.6 | 1.6 | 1.0 | |||||||
| Other | — | — | — | — | — | |||||||
| Total current assets | 131.4 | 120.9 | 124.7 | 116.1 | (4.0 | ) | ||||||
| Non-current assets | ||||||||||||
| Receivables | 56.9 | 50.8 | 39.8 | 40.7 | (20.0 | ) | ||||||
| Inventories | 6.3 | 6.3 | 6.3 | 6.3 | — | |||||||
| Other financial assets | 236.9 | 256.1 | 245.8 | 257.1 | 0.4 | |||||||
| Property, plant and equipment | 2 264.6 | 2 270.9 | 2 929.0 | 2 988.7 | 31.6 | |||||||
| Intangible assets | 44.0 | 62.2 | 55.7 | 65.5 | 5.3 | |||||||
| Other(c) | 310.5 | 310.5 | 310.5 | 310.5 | — | |||||||
| Total non-current assets | 2 919.2 | 2 956.8 | 3 587.1 | 3 668.8 | 24.1 | |||||||
| Total assets | 3 050.6 | 3 077.7 | 3 711.8 | 3 784.9 | 23.0 | |||||||
| Current liabilities | ||||||||||||
| Payables | 26.9 | 26.9 | 27.6 | 27.6 | 2.7 | |||||||
| Interest bearing liabilities | — | — | — | — | — | |||||||
| Provisions(b) | 25.6 | 26.4 | 26.2 | 27.2 | 2.8 | |||||||
| Other | 2.6 | 2.6 | 2.6 | 2.6 | — | |||||||
| Total current liabilities | 55.1 | 56.0 | 56.5 | 57.4 | 2.6 | |||||||
| Non-current liabilities | ||||||||||||
| Interest bearing liabilities | 2.0 | 2.0 | 1.9 | 1.9 | (6.1 | ) | ||||||
| Provisions(b) | 68.1 | 70.8 | 70.8 | 73.6 | 4.0 | |||||||
| Other | — | — | — | — | — | |||||||
| Amounts owing to other departments | 8.2 | 8.2 | 8.2 | 8.2 | — | |||||||
| Total non-current liabilities | 78.2 | 81.0 | 80.9 | 83.7 | 3.4 | |||||||
| Total liabilities | 133.4 | 136.9 | 137.4 | 141.1 | 3.1 | |||||||
| Net assets | 2 917.2 | 2 940.8 | 3 574.4 | 3 643.8 | 23.9 | |||||||
| Equity | ||||||||||||
| Contributed capital | — | 44.1 | 678.7 | 753.1 | 1 606.8 | |||||||
| Reserves | 943.4 | 943.4 | 943.4 | 943.4 | — | |||||||
| Accumulated surplus | 1 973.8 | 1 953.2 | 1 952.3 | 1 947.2 | (0.3 | ) | ||||||
| Total equity | 2 917.2 | 2 940.8 | 3 574.4 | 3 643.8 | 23.9 | |||||||
Source: Department of Treasury and Finance
- Notes:
- (a)
- Variation between 2001-02 Budget and 2002-03 Budget.
- (b)
- Includes employee costs and superannuation.
- (c)
- Includes natural resources, forest, livestock.
Table 2.6.4: Statement of Cash Flows
| | 2000-01 Actual | 2001-02 Budget | 2001-02 Revised | 2002-03 Budget | Variation(a) | ||||||
|---|---|---|---|---|---|---|---|---|---|---|---|
| | ($ million) | % | |||||||||
| Cash flows from operating activities | |||||||||||
| Receipts from Government | 818.8 | 834.6 | 927.2 | 977.6 | 17.1 | ||||||
| Receipts from other entities | 134.5 | 161.9 | 137.1 | 134.9 | (16.7 | ) | |||||
| Payments for supplies, grants and employees | (861.8 | ) | (898.8 | ) | (960.2 | ) | (991.4 | ) | 10.3 | ||
| 91.5 | 97.7 | 104.1 | 121.0 | 23.9 | |||||||
| Interest received | 2.4 | 0.8 | 0.6 | 0.7 | (18.3 | ) | |||||
| Other revenue | 15.4 | 3.8 | 8.2 | 4.6 | 21.8 | ||||||
| Capital asset charge | (67.0 | ) | (75.6 | ) | (75.6 | ) | (82.3 | ) | 8.9 | ||
| Borrowing costs expense | (0.5 | ) | — | — | — | — | |||||
| Net cash inflow from operating activities | 41.8 | 26.7 | 37.3 | 43.9 | 64.6 | ||||||
| Cash flows from investing activities | |||||||||||
| Payments for property, plant and equipment(b) | (54.9 | ) | (81.2 | ) | (69.6 | ) | (126.7 | ) | 56.0 | ||
| Proceeds from sale of property, plant and equipment | 1.0 | — | — | — | — | ||||||
| Payments for investments | — | — | — | — | — | ||||||
| Proceeds from sale of business assets | — | — | — | — | — | ||||||
| (Repayment of) loans by other entities | (0.4 | ) | — | — | 3.0 | — | |||||
| Net cash (outflow) from investing activities | (54.3 | ) | (81.2 | ) | (69.6 | ) | (123.7 | ) | 52.3 | ||
| Cash flows from financing activities | |||||||||||
| Net Proceeds from capital contribution by State Government | 10.0 | 44.1 | 25.7 | 74.4 | 68.6 | ||||||
| Net proceeds of borrowings | — | — | — | — | — | ||||||
| Repayment of finance leases | — | — | — | — | — | ||||||
| Net cash inflow (outflow) from financing activities | 10.0 | 44.1 | 25.7 | 74.4 | 68.6 | ||||||
| Net increase (decrease) in cash held | (2.5 | ) | (10.4 | ) | (6.7 | ) | (5.4 | ) | (48.3 | ) | |
| Cash at the beginning of the financial year | 62.9 | 60.4 | 60.4 | 53.8 | (11.0 | ) | |||||
| Cash at the end of the financial year | 60.4 | 50.0 | 53.8 | 48.4 | (3.3 | ) | |||||
Source: Department of Treasury and Finance
- Notes:
- (a)
- Variation between 2001-02 Budget and 2002-03 Budget.
- (b)
- Includes payments for land held for resale and research and development costs.
Statement of Cash Flows
DNRE's cash position is projected to decrease from 2001-02. This is due to the timing of cash reimbursements from the Public Account to the Department's bank accounts to honour cheque presentations.
The Statement of Cash Flows is also affected by changes in accounting policy through the implementation of the Model Financial Report that included the reclassification of annotated receipts from controlled to administered.
Administered Items Statement
Administered Revenue is projected to increase by $75.7 million in 2002-03 compared to the 2001-02 Budget. The majority of DNRE administered revenue is generated from activities related to the Land Titles Office and funds received from the Commonwealth and industry for research and development programs.
The increase in operating revenue is due to:
- •
- continuing strong activity in the property market impacting on Land Titles Office revenue;
- •
- accounting classification changes resulting from the adoption of the Model Financial Report for Victorian Government Departments; and
- •
- partially offset by a projected reduction in revenue from forest resulting from the implementation of the Our Forests Our Future initiative which aims to reduce harvesting of timber from State forests to a sustainable level.
Table 2.6.5: Administered Items Statement
| | 2000-01 Actual | 2001-02 Budget | 2001-02 Revised | 2002-03 Budget | Variation(a) | ||||||
|---|---|---|---|---|---|---|---|---|---|---|---|
| | ($ million) | % | |||||||||
| Administered revenue | |||||||||||
| Appropriations—Payments made on behalf of the State | 18.9 | 19.2 | 137.2 | 22.8 | 18.8 | ||||||
| Output Appropriation | — | — | — | — | — | ||||||
| Special appropriations | — | — | — | — | — | ||||||
| Resources received free of charge or for nominal consideration | — | — | — | — | — | ||||||
| Sale of goods and services | 220.4 | 173.6 | 226.3 | 200.2 | 15.3 | ||||||
| Commonwealth grants | 47.1 | 0.5 | 59.3 | 52.9 | — | ||||||
| Other grants | — | — | — | — | — | ||||||
| Taxes | — | — | — | — | — | ||||||
| Fines | 1.0 | 0.5 | 0.5 | 0.5 | — | ||||||
| Fees | 27.6 | 25.7 | 21.2 | 22.7 | (11.7 | ) | |||||
| Other | 68.4 | 61.5 | 59.8 | 57.6 | (6.4 | ) | |||||
| Total administered revenue | 383.5 | 281.0 | 504.3 | 356.7 | 26.9 | ||||||
| Administered expenses | |||||||||||
| Expenses on behalf of the State | 3.9 | 18.7 | 1.3 | 1.5 | (92.0 | ) | |||||
| Grants and other payments | 18.3 | 0.7 | 135.9 | 21.5 | — | ||||||
| Payments into the Consolidated Fund | 353.5 | 261.7 | 368.1 | 340.8 | 30.2 | ||||||
| Total administered expenses | 375.7 | 281.0 | 505.3 | 363.8 | 29.4 | ||||||
| Revenue less expenses | 7.8 | 0.0 | (0.9 | ) | (7.1 | ) | — | ||||
| Administered assets | |||||||||||
| Cash assets | 5.3 | 5.4 | 5.6 | 5.7 | 4.8 | ||||||
| Receivables | 43.9 | 43.7 | 42.6 | 35.4 | (19.0 | ) | |||||
| Other financial assets | — | — | — | — | — | ||||||
| Inventories | — | — | — | — | — | ||||||
| Prepayments | — | — | — | — | — | ||||||
| Property, plant and equipment | — | — | — | — | — | ||||||
| Intangible assets | — | — | — | — | — | ||||||
| Other | — | — | — | — | — | ||||||
| Total administered assets | 49.2 | 49.1 | 48.2 | 41.1 | (16.3 | ) | |||||
| Administered liabilities | |||||||||||
| Payables | 0.3 | 0.3 | 0.3 | 0.3 | — | ||||||
| Interest bearing liabilities | 0.5 | 0.5 | 0.5 | 0.5 | (1.0 | ) | |||||
| Provisions | — | — | — | — | — | ||||||
| Amounts owing to other departments | — | — | — | — | — | ||||||
| Other | 20.7 | 20.7 | 20.7 | 20.7 | — | ||||||
| Total administered liabilities | 21.4 | 21.4 | 21.4 | 21.4 | (0.0 | ) | |||||
Source: Department of Treasury and Finance
Authority for Resources
This section provides a summary of the sources of Parliamentary Authority available to the Department to fund the provision of outputs, payments on behalf of State, and additions to the net asset base.
Table 2.6.6: Parliamentary Authority for Resources
| | 2001-02 Budget | 2001-02 Revised | 2002-03 Budget | Variation(a) | |||||
|---|---|---|---|---|---|---|---|---|---|
| | ($ million) | % | |||||||
| Annual appropriations(b) | 817.3 | 920.2 | 964.0 | 17.9 | |||||
| Receipts credited to appropriations | 89.9 | 84.9 | 93.3 | 3.8 | |||||
| Unapplied previous years appropriation | 18.4 | 67.7 | 18.3 | (0.6 | ) | ||||
| Accumulated surplus—previously applied appropriation | 10.1 | 20.5 | 3.5 | (65.3 | ) | ||||
| Gross annual appropriation | 935.8 | 1 093.4 | 1 079.1 | 15.3 | |||||
| Special appropriations | — | — | — | — | |||||
| Trust funds | 132.8 | 146.1 | 140.2 | 5.6 | |||||
| Total Parliamentary authority | 1 068.6 | 1 239.5 | 1 219.4 | 14.1 | |||||
Source: Department of Treasury and Finance
- Notes:
- (a)
- Variation between 2001-02 Budget and 2002-03 Budget.
- (b)
- 2001-02 Revised includes the impact of approved Treasurer's Advances.
Payments on behalf of the State
Payments on behalf of the State are payments made by the Department on behalf of the State Government as a whole and do not directly reflect the operations of the Department. They are usually on-passed or administered by the State.
Table 2.6.7: Payments made on behalf of the State
| | Accounts | |||||||
|---|---|---|---|---|---|---|---|---|
| | 2001-02 Budget | 2001-02 Revised | 2002-03 Budget | Variation(a) % | ||||
| | ($ million) | % | ||||||
| Murray Darling Basin Contribution | 17.9 | 17.9 | 21.5 | 20.2 | ||||
| Timber Promotion Council Trust Fund | 1.3 | 1.3 | 1.3 | — | ||||
| Special Power payment | — | 118.0 | — | — | ||||
| Total | 19.2 | 137.2 | 22.8 | 18.8 | ||||
Source: Department of Treasury and Finance
- Note:
- (a)
- Variation between 2001-02 Budget and 2002-03 Budget.
DEPARTMENT OF PREMIER AND CABINET
PART 1: OUTLOOK AND OUTPUTS
Overview
The information contained in this statement covers the Department of Premier and Cabinet (including the Victorian Office of Multicultural Affairs, Arts Victoria and the Office of Women's Policy) and five portfolio agencies:
- •
- the Office of the Governor;
- •
- the Office of Public Employment;
- •
- the Office of the Ombudsman;
- •
- the Office of the Chief Parliamentary Counsel; and
- •
- the Victorian Multicultural Commission.
The Department's primary contribution to the strategic direction of Government is through the provision of independent, rigorous, soundly based policy advice for the Premier and Cabinet directed towards the effective and efficient implementation of the Government's policies and programs.
The Department has four main roles:
- •
- supporting the Premier as head of Government and Cabinet;
- •
- providing strategic policy leadership;
- •
- developing Whole of Government initiatives; and
- •
- delivering services and programs in relation to Government Information and Communication and Arts Victoria.
Departmental Objectives
The Departmental objectives were reviewed to ensure a greater alignment to the Department's role and to develop a more focused approach to the achievement of Government outcomes. These objectives are:
- •
- Provision of high quality policy advice to the Premier and Government;
- •
- Continuously improving the capability, integrity and independence of the Victorian public sector;
- •
- Develop and lead Whole of Government initiatives to ensure effective outcomes for all Victorians; and
- •
- Delivering services and programs to enhance the contribution of creative industries within the Victorian community.
Review of 2001-02
In line with the Department's four main roles, the following activities were undertaken:
Supporting the Premier as head of Government and Cabinet
- •
- Redesign and development of the core business software applications that support the business flows for the development and management of Cabinet papers (CABNET) and the drafting and publication of legislation.
Providing strategic policy leadership
- •
- Development of the Growing Victoria Together framework—a ten year strategic plan that expresses the Government's broad vision for the future;
- •
- Consolidation of the social, economic and environmental outcomes frameworks;
- •
- Co-ordination of the release for public discussion of the Infrastructure Planning Council's interim report in August 2001;
- •
- Provision of policy advice and co-ordination of advice from relevant departments in regard to the corporatisation of the Snowy Mountains Hydro-electric Authority and the establishment of the Joint Government Enterprise—a key feature of the Snowy agreement.
Developing Whole of Government initiatives
- •
- Implementation of Whole of Government community building strategy to promote integrated services in local communities;
- •
- Finalisation of the Women's Safety Strategy—a Whole of Government approach to violence against women;
- •
- Release of the Forward Plan for Women Second Update Report on current status, performance measures, key achievements and new initiatives.
Delivering services and programs in relation to Government Information and Communication and Arts Victoria
- •
- Progression of the development of new cultural facilities including the Australian Centre for the Moving Image and The Ian Potter Centre—NGV: Australian Art at Federation Square and the Malthouse Development; and
- •
- Commencement of the development of a ten-year policy for the Arts.
2002-03 Outlook
In 2002-03, key aims of the Department in relation to the roles include:
Supporting the Premier as head of Government and Cabinet
- •
- Further develop the economic aspects of the Growing Victoria Together statement taking into account social and environmental considerations; and
- •
- Further assess likely social capital trends and provide policy choices to the Government that better integrates economic, social and environmental directions.
Providing strategic policy leadership
- •
- Implementation of the Australian Graduate School of Government to strengthen the capacity of employees within the public sector to provide high quality and efficient services;
- •
- Development of a range of initiatives and approaches to improve workforce planning, training and management performance across public sector.
Developing Whole of Government initiatives
- •
- Development of Language Services to improve access to services and satisfy demands for language services within rural and regional Victoria;
- •
- Support for newly emerging multi-cultural communities and expand the multi-cultural affairs consultative process across outer-metro and regional Victoria;
- •
- Implementation of a range of issues resulting from the Women's Safety Strategy aimed at preventing violence against women.
Delivering services and programs in relation to Government Information and Communication and Arts Victoria
- •
- Development and implementation of an Electronic Records Centre of Excellence in line with the Victorian Electronic Records Strategy to ensure the appropriate storage and management of digital information;
- •
- Implementation of initiatives designed to enhance cultural facilities and programs at Museum Victoria, State Library of Victoria and the new contemporary arts precinct in Sturt Street Southbank.
Output Information
The following section provides details of the outputs to be provided to Government, including their performance measures and the costs for each output. The table below summaries the total cost for outputs.
Table 2.7.1: Output summary
| | 2001-02 Budget(a) | 2001-02 Revised | 2002-03 Budget | Variation(b) | |||||
|---|---|---|---|---|---|---|---|---|---|
| | ($ million) | (%) | |||||||
| Strategic Policy Advice and Projects | 33.7 | 35.8 | 39.0 | 15.9 | |||||
| Community Engagement and Government Information | 33.4 | 32.1 | 31.5 | (5.6 | ) | ||||
| Arts and Cultural Development | 302.5 | 289.5 | 310.9 | 2.8 | |||||
| Public Sector Management and Governance | 16.0 | 16.9 | 15.6 | (2.8 | ) | ||||
| Total | 385.6 | 374.3 | 397.1 | 3.0 | |||||
Source: Department of Treasury and Finance
Notes:
- (a)
- 2001-02 Output Budget incorporates changes to Output structure and organisational restructuring and therefore may differ from figures published in the 2001-02 Budget.
- (b)
- Variation between 2001-02 and 2002-03 Budget.
Strategic Policy Advice and Projects
These outputs contribute to the Growing Victoria Together (GVT) initiative through providing quality policy advice that contributes to all GVT strategies and also acts as a conjoint to link policy initiatives that span more that one GVT strategy. The outputs also make significant contributions to the "provision of high quality policy advice to the Premier and Government" Departmental Objective.
The outputs involve the provision of advice to the Premier and Cabinet on all aspects of policy including the Government's medium term strategic directions. This involves advice on issues as they arise, policy co-ordination and analysis, consultation with key internal and external stakeholders and leadership in long-term policy development and research.
| Major Outputs/Deliverables Performance Measures | Unit of Measure | 2000-01 Actual | 2001-02 Target | 2001-02 Expected Outcome | 2002-03 Target | |||||
|---|---|---|---|---|---|---|---|---|---|---|
| Strategic Policy Advice—Provides strategic policy analysis and advice to the Premier on all matters affecting his role as Head of Government and administrative support for the operation of the Cabinet, Cabinet Committees and Executive Council and for the Government's relationship with Parliament; and assists the Premier in identifying emerging issues, carrying out practical forward planning, reviewing policy and assessing the impact Government decisions and actions. | ||||||||||
| Quantity | ||||||||||
| Number of briefs | number | nm | 2 000 | 2 000 | 2 000 | |||||
| Quality | ||||||||||
| Client satisfaction with brief provided | per cent | nm | 100 | 100 | 100 | |||||
| Timeliness | ||||||||||
| Cabinet submission and briefing requests met by due-by date | per cent | 100 | 100 | 100 | 100 | |||||
| Planned policy briefings completed within agreed timelines | per cent | nm | nm | nm | 95 | |||||
| Cost | $ million | na | na | na | 29.0 | |||||
Policy Leadership Projects—On behalf of the Premier lead and participate in policy projects including development and coordination of new initiatives; and manage the implementation of the Growing Victoria Together strategy and other strategic policy initiatives. | ||||||||||
| Quantity | ||||||||||
| Number of policy leadership projects | number | nm | nm | nm | 30 | |||||
| Development of the GVT outcomes report for the public | number | nm | nm | nm | 1 | |||||
| Minimum student numbers for the Masters of Public Administration program from Victoria | number | nm | nm | nm | 58 | |||||
| Minimum student numbers for the Executive Fellows Program from Victoria | number | nm | nm | nm | 30 | |||||
| Number of strategic people management unit briefs | number | nm | nm | nm | 90 | |||||
| Number of strategic people management projects | number | nm | nm | nm | 13 | |||||
| Quality | ||||||||||
| Per cent of policy leadership projects managed within approved framework | per cent | nm | nm | nm | 100 | |||||
| Satisfaction with policy leadership project outcomes | per cent | nm | nm | nm | 95 | |||||
| Satisfaction with strategic people management briefs | per cent | nm | nm | nm | 90 | |||||
| Timeliness | ||||||||||
| Policy leadership projects completed within required timelines | per cent | nm | nm | nm | 90 | |||||
| Development of the Growing Victoria Together (GVT) outcomes report within required timeframe | per cent | nm | nm | nm | 100 | |||||
| Advice in relation to strategic people management Cabinet submissions and briefing requests met by due by date | per cent | nm | nm | nm | 100 | |||||
| Cost | $ million | na | na | na | 10.0 | |||||
Source: Department of Premier and Cabinet
Community Engagement and Government Information
These outputs contribute to the Growing Victoria Together (GVT) initiative through the majority of the GVT strategies including:
- •
- government that listens and leads;
- •
- growing and linking all of Victoria;
- •
- safe streets, homes and workplaces;
- •
- promoting rights and respecting diversity;
- •
- building cohesive communities and reducing inequalities;
- •
- more jobs and thriving innovative industries;
- •
- high quality, accessible health and community services; and
- •
- valuing and investing in lifelong education.
The outputs also make significant contributions to the 'develop and lead whole of government initiatives to ensure effective outcomes for all Victorians' Departmental Objective. The individual outputs involve the provision of policies, services and information to the community that emphasises a joined-up approach to Government service provision in areas such as Multicultural Affairs, Women's Policy, Community Support Fund, Government Information, and Protocol and Special Events.
| Major Outputs/Deliverables Performance Measures | Unit of Measure | 2000-01 Actual | 2001-02 Target | 2001-02 Expected Outcome | 2002-03 Target | |||||
|---|---|---|---|---|---|---|---|---|---|---|
| Multicultural Affairs—Through the Victorian Office of Multicultural Affairs, coordinate whole of government approach to Multicultural Affairs by monitoring government departments' responsiveness to Victorians from non-English speaking backgrounds and through the provisions of policy advice; and through the Victorian Multicultural Commission, coordinate a whole of government approach to multicultural issues and provide independent advice to Government on multicultural affairs. | ||||||||||
| Quantity | ||||||||||
| Number of briefs | number | 608 | 420 | 600 | 600 | |||||
| Number of language services projects implemented | number | nm | nm | nm | 4 | |||||
| VMC grants funds allocated | per cent | 100 | 100 | 100 | 100 | |||||
| Consultations and forums with community groups | number | 45 | 35 | 55 | 45 | |||||
| Quality | ||||||||||
| Client satisfaction with briefs provided | per cent | 100 | 100 | 100 | 100 | |||||
| ECCV funds allocated according to agreed priorities | per cent | 100 | 100 | 100 | 100 | |||||
| Use of grants monitored | per cent | 100 | 100 | 100 | 100 | |||||
| Timeliness | ||||||||||
| Cabinet submissions and briefing requests met by due-by date | per cent | 95 | 95 | 95 | 95 | |||||
| Grants allocated by target date | per cent | 100 | 100 | 100 | 100 | |||||
| Cost | $ million | na | na | na | 5.3 | |||||
Women's Policy—Provide strategic policy advice on key issues of concern to women, by working across government to inform policies, practices, programs and services available to women. | ||||||||||
| Quantity | ||||||||||
| Number of briefs and responses to correspondence | number | nm | 250 | 250 | 250 | |||||
| Women attending consultation forums/summit | number | 290 | 400 | 400 | 400 | |||||
| Quality | ||||||||||
| Client satisfaction with advice provided | per cent | nm | 100 | 100 | 100 | |||||
| Participant satisfaction with consultation forums | per cent | 0 | 85 | 85 | 85 | |||||
| Timeliness | ||||||||||
| Cabinet submissions and briefing requests met by due-by date | per cent | nm | 100 | 100 | 100 | |||||
| Cost | $ million | 1.6 | 1.6 | 1.6 | 1.8 | |||||
Community Support Fund—Manage the Community Support Fund and Office of Community Building through the provision of advice to the Government. | ||||||||||
| Quantity | ||||||||||
| Number of applications received | number | 182 | 210 | 210 | 210 | |||||
| Proportion of applications approved | per cent | 25 | 35 | 35 | 35 | |||||
| Projects monitored and evaluated against performance agreements | per cent | 100 | 100 | 100 | 100 | |||||
| Quality | ||||||||||
| Projects delivered against performance benchmarks | per cent | 95 | 100 | 100 | 100 | |||||
| Timeliness | ||||||||||
| Satisfactory acquittals obtained for all projects | per cent | 95 | 100 | 100 | 100 | |||||
| Grant reimbursement requests processed within seven working days | per cent | 100 | 100 | 100 | 100 | |||||
| Cost | $ million | 0.1 | 0.1 | 0.1 | 0.1 | |||||
Government Information Services and Support—Continuously improve communications and information about government policies, programs and services with the Victorian public and across government. | ||||||||||
| Quantity | ||||||||||
| Number of briefs | number | nm | 30 | 30 | 30 | |||||
| Develop communications resource products, standards and guidelines in response to identified Government requirements | per cent | 75 | 85 | 85 | 85 | |||||
| Public contact per contact officer per day | number | nm | nm | nm | 30 | |||||
| Quality | ||||||||||
| Client satisfaction of advice provided | per cent | 85 | 90 | 90 | 90 | |||||
| Departmental client/stakeholder satisfaction | per cent | 85 | 85 | 85 | 85 | |||||
| Public client satisfaction | per cent | 85 | 85 | 85 | 85 | |||||
| Communications products as required | per cent | nm | nm | nm | 85 | |||||
| Timeliness | ||||||||||
| Products developed within identified timeframes | per cent | 70 | 85 | 85 | 85 | |||||
| Timely provision of public information | per cent | 90 | 90 | 90 | ||||||
| Cabinet submissions and briefs met by due date | per cent | nm | nm | nm | 90 | |||||
| Cost | $ million | na | na | na | 22.3 | |||||
Protocol and Special Events—Initiate, plan and implement diplomatic and business visits, hospitality events and special projects including government sponsored programs and activities and provision of advice in relation to these matters. | ||||||||||
| Quantity | ||||||||||
| Number of official visitors to Victoria | number | nm | 20 | 20 | 35 | |||||
| Number of annual special events | number | nm | 4 | 4 | 4 | |||||
| High Quality nominations to be available for the bi-annual meeting of the Public Service Medal Committee | number | 25 | 25 | 25 | 25 | |||||
| Number of hospitality events | number | nm | nm | nm | 40 | |||||
| Quality | ||||||||||
| Sensitive visitor dignity security achieved | per cent | 100 | 100 | 100 | 100 | |||||
| Level of support from the public for all special events which are a departmental responsibility | per cent | 95 | 95 | 95 | 95 | |||||
| Congratulatory messages and promotional material are relevant and accurate | per cent | 100 | 100 | 100 | 100 | |||||
| Timeliness | ||||||||||
| Timely delivery of events, functions and visit arrangements | per cent | 100 | 100 | 100 | 100 | |||||
| Congratulatory messages and promotional material are delivered on time | per cent | 100 | 100 | 100 | 100 | |||||
| Cost | $ million | 2.1 | 2.1 | 2.1 | 2.1 |
Source: Department of Premier and Cabinet
Note:
- (a)
- Annual Conference not held in 2000-01 due to Parliamentary Commitments. It was held on 27 July 2001.
Public Sector Management and Governance
These outputs contribute to the Growing Victoria Together (GVT) initiative through the following GVT strategies:
- •
- government that listens and leads;
- •
- promoting rights and respecting diversity; and
- •
- growing and linking all of Victoria.
The outputs also make significant contributions to the "improve the capability, integrity and independence of the Victorian Public Sector" Departmental Objective. The individual outputs involve the provision of independent services that aim to ensure the effective management of governance of the public sector.
| Major Outputs/Deliverables Performance Measures | Unit of Measure | 2000-01 Actual | 2001-02 Target | 2001-02 Expected Outcome | 2002-03 Target | |||||
|---|---|---|---|---|---|---|---|---|---|---|
Advice and Support to the Governor—Provision of advice and support to the Governor, and maintenance of Government House and its collections as a heritage asset of national importance. | ||||||||||
| Quantity | ||||||||||
| Events and services arranged in response to requests by the Governor and the Premier | per cent | 100 | 100 | 100 | 100 | |||||
| Quality | ||||||||||
| Maintenance of assets in accordance with asset management strategy | per cent | 100 | 100 | 100 | 100 | |||||
| Management of the program of events and services meets the expectations of the Governor | per cent | 95 | 95 | 95 | 95 | |||||
| Standard, physical appearance and security of Government House, the gardens and grounds meet appropriate standards as per the asset management strategy | per cent | 95 | 95 | 95 | 95 | |||||
| Timeliness | ||||||||||
| Timely arrangement of events and services | per cent | 100 | 100 | 100 | 100 | |||||
| Contract milestones are met | per cent | 95 | 95 | 95 | 95 | |||||
| Cost | $ million | 6.9 | 6.4 | 6.4 | 6.6 | |||||
Public Sector Employment and Conduct Services—Promotion of the principles of public sector employment and conduct, and monitoring and reporting to Parliament on their application. | ||||||||||
| Quantity | ||||||||||
| Site visits to organisations (validation of inspections and consultancies) | number | nm | nm | nm | 50 | |||||
| Quality | ||||||||||
| Overall organisations' satisfaction with activities/programs | per cent | nm | nm | nm | 80 | |||||
| Overall participant satisfaction with activities/programs | per cent | nm | nm | nm | 80 | |||||
| Proportion of organisations complying with significant elements of executive remuneration policy | per cent | nm | nm | nm | 90 | |||||
| Timeliness | ||||||||||
| Parliamentary reporting date met | per cent | nm | nm | nm | 100 | |||||
| Report and publication dates met | per cent | nm | nm | nm | 100 | |||||
| Cost | $ million | 3.5 | 3.5 | 3.5 | 2.7 | |||||
Ombudsman services—Independent investigation of complaints concerning administrative actions taken in Government departments, statutory bodies, or by officer and employees of municipal councils; complaints against members of the Police Force, and overseeing the investigation by police of certain complaints. | ||||||||||
| Quantity | ||||||||||
| Finalise consideration of complaints | number | 4 320 | 4 600 | 4 600 | 4 600 | |||||
| Issues monitored under legislative requirements | number | 650 | 700 | 700 | 700 | |||||
| Quality | ||||||||||
| Satisfaction of Ombudsman with complaints resolution process | per cent | 100 | 100 | 100 | 100 | |||||
| Satisfaction of Ombudsman with the inspections and monitoring process | per cent | 100 | 100 | 100 | 100 | |||||
| Timeliness | ||||||||||
| Complaints resolved within required Timeliness | per cent | 90 | 93 | 93 | 93 | |||||
| Inspections completed within legislated timelines | per cent | 100 | 100 | 100 | 100 | |||||
| Cost | $ million | 3.0 | 2.7 | 2.7 | 2.8 | |||||
Chief Parliamentary Counsel Services—Preparation of Bills for introduction in Parliament, provision of advice on proposed statutory rules and other subordinate legislation, publishing and reprinting of Acts and statutory rules and maintenance of a database of Victorian legislation. | ||||||||||
| Quantity | ||||||||||
| Statutory Rules made and bills prepared and introduced into Parliament | number | 251 | 255 | 255 | 245 | |||||
| Advice given on legislation in response to written requests | number | 406 | 300 | 300 | 400 | |||||
| Versions of Acts and Statutory Rules published electronically | number | 1 412 | 1 050 | 1 050 | 1 050 | |||||
| Quality | ||||||||||
| Bills drafted, Statutory Rules drafted or settled, and advice provided is to the required standard | per cent | 95 | 95 | 95 | 95 | |||||
| Accuracy levels maintained in terms of document management, printing and publishing | per cent | 95 | 95 | 95 | 95 | |||||
| Timeliness | ||||||||||
| Bills drafted, Statutory Rules drafted or settled, and advice provided within required timelines | per cent | 95 | 95 | 95 | 95 | |||||
| Electronic versions published within required timelines | per cent | 95 | 95 | 95 | 95 | |||||
| Cost | $ million | 3.6 | 3.4 | 3.4 | 3.5 | |||||
Source: Department of Premier and Cabinet
Arts and Cultural Development
These outputs contribute to the Growing Victoria Together (GVT) initiative through the following GVT strategies:
- •
- Building cohesive communities and reducing inequalities
- •
- Valuing and investing in lifelong education
- •
- More jobs and thriving, innovative industries across Victoria
- •
- Promoting rights and respecting diversity
- •
- Growing and linking all of Victoria
The outputs also make significant contributions to the "deliver services and programs to enhance the contribution of creative industries within the Victorian community" Departmental Objective. The individual outputs relate to the development of the Victorian arts and cultural sector through the provision of industry assistance programs, infrastructure development and policy advice.
| Major Outputs/Deliverables Performance Measures | Unit of Measure | 2000-01 Actual | 2001-02 Target | 2001-02 Expected Outcome | 2002-03 Target | |||||
|---|---|---|---|---|---|---|---|---|---|---|
| Arts Development and Access—Support for the creation and presentation of arts product and for the development of artists and arts organisations and for the expansion of access to a diverse range of arts experiences. | ||||||||||
| Quantity | ||||||||||
| Diverse range of product, producers and cultural venues supported: | ||||||||||
| • Organisations recurrently funded | number | nm | nm | nm | 99 | |||||
| • Regionally-based organisations recurrently funded | number | nm | nm | nm | 38 | |||||
| • Project companies and artists funded | number | nm | nm | nm | 320 | |||||
| • Proportion of project companies and artists funded which are regionally based | per cent | nm | nm | nm | 20 | |||||
| Access to a diverse range of supported projects: | ||||||||||
| • Local festivals funded | number | nm | nm | nm | 23 | |||||
| • Regional Touring Victoria destinations | number | 76 | 50 | 53 | 55 | |||||
| • Artist residences in schools | number | nm | nm | nm | 28 | |||||
| Attendances at Major Performing Arts Organisations | number | nm | 700 000 | 825 000 | 880 000 | |||||
| Attendances at Major Festivals | number | nm | nm | nm | 1 950 000 | |||||
| International markets accessed | number | nm | nm | nm | 12 | |||||
| Quality | ||||||||||
| Grant recipients who met or exceeded agreed outcomes | per cent | nm | nm | nm | 85 | |||||
| Timeliness | ||||||||||
| Arts Development applications processed for Ministerial consideration | days | 63 | <60 | 59 | 60 | |||||
| All other applications processed for Ministerial consideration | days | 41 | <40 | 43 | 40 | |||||
| Performance and grant agreements acquitted within 90 days of project completion | per cent | 90 | 80 | 80 | 80 | |||||
| Cost | $ million | na | na | na | 24.6 | |||||
Infrastructure and Cultural Facilities—Support for Victorian cultural venues and state-owned facilities. | ||||||||||
| Quantity | ||||||||||
| Major projects managed | number | 7 | 5 | 5 | 5 | |||||
| Risk Management Programs in place | number | 4 | 3 | 3 | 3 | |||||
| Infrastructure Development Programs | number | 8 | 5 | 5 | 5 | |||||
| Agency Building Asset Management Plans | number | 2 | 3 | 1 | 3 | |||||
| Infrastructure and cultural facilities funding programs | number | nm | 2 | 2 | 2 | |||||
| Quality | ||||||||||
| Success measures of projects achieved | per cent | nm | 90 | 90 | 90 | |||||
| Timeliness | ||||||||||
| Performance and grant agreements completed within agreed timeframes | per cent | 100 | 90 | 90 | 90 | |||||
| Cost | $ million | 81.3 | 92.6 | 92.6 | 80.8 | |||||
Portfolio Services and Policy—Provision of agencies governance, policy implementation and advice, research, planning and communications services across the portfolio. | ||||||||||
| Quantity | ||||||||||
| Agencies governance projects | number | 7 | 5 | 5 | 5 | |||||
| Planning and research projects | number | 10 | 10 | 16 | 11 | |||||
| Ministerial briefs | number | nm | 650 | 750 | 700 | |||||
| Quality | ||||||||||
| Level of satisfaction with policy advice | per cent | nm | 95 | 97 | 95 | |||||
| Public information rated Informative or Very Informative | per cent | 91 | 90 | 90 | 90 | |||||
| Timeliness | ||||||||||
| Annual Reports submitted to Parliament | by date | Oct 2000 | Oct 2001 | Oct 2001 | Oct 2002 | |||||
| Cost | $ million | 3.1 | 2.4 | 2.4 | 2.5 | |||||
Arts Portfolio Agencies—Promotion, presentation and preservation of our heritage and the arts through Victoria's cultural agencies: Australian Centre for the Moving Image, Film Victoria, Geelong Performing Arts Centre, Museum Victoria, National Gallery of Victoria, Public Record Office Victoria, State Library of Victoria and the Victorian Arts Centre. | ||||||||||
| Quantity | ||||||||||
| Visitors/users to all Agencies | numbers | 6 861 000 | 8 445 000 | 7 300 000 | 8 545 000 | |||||
| Visitors to Museum Victoria | number | 1 628 000 | 1 895 000 | 1 650 000 | 1 135 000 | |||||
| Visitors to the Australian Centre for the Moving Image at Federation Square | number | nm | 150 000 | 0 | 800 000 | |||||
| Online access to Agency websites | number of user sessions | nm | nm | nm | 4 210 000 | |||||
| State Library of Victoria online access | number of user sessions | nm | 1 080 000 | 1 100 000 | 1 200 000 | |||||
| Members, Friends and volunteers at all Agencies | number | nm | nm | nm | 22 000 | |||||
| Education, Outreach or Regional Audience Development Programs | number | nm | nm | nm | 240 | |||||
| Education, Outreach or Regional Audience Development programs at the Geelong Performing Arts Centre | number | nm | nm | nm | 14 | |||||
| Performances at the Victorian Arts Centre | number | 1 417 | 1 450 | 1 450 | 1 450 | |||||
| Value of film, television and new media production supported by Film Victoria programs | $ million | nm | nm | nm | 70 | |||||
| Additional employment from production supported by Film Victoria | number of FTEs | nm | nm | nm | 1 960 | |||||
| Quality | ||||||||||
| Museum Victoria—Customer satisfaction with public programs and services—satisfied or above | per cent | 96 | 95 | 95 | 95 | |||||
| National Gallery of Victoria—Customer satisfaction with public programs and services | per cent | 80 | 95 | 95 | 95 | |||||
| State Library of Victoria—Customer satisfaction with services and programs—good to excellent | per cent | 90 | 90 | 86 | 90 | |||||
| Public Record Office Victoria—Electronic records maintained in accordance with PROV standards | per cent | nm | nm | nm | 13 | |||||
| Timeliness | ||||||||||
| Agency service delivery time benchmarks met: | ||||||||||
| • Australian Centre for the Moving Image—Video bookings processed within 48 hours | per cent | 100 | 100 | 100 | 100 | |||||
| • Public Record Office Victoria—Information requests serviced within published timeframes | per cent | 95 | 95 | 95 | 95 | |||||
| Cost | $ million | 163.8 | 180.7 | 180.7 | 203.0 | |||||
Source: Department of Premier and Cabinet
Part 2 provides the financial statements that support the Department's provision of outputs. The information provided includes the Statement of Financial Performance, Statement of Financial Position and Statement of Cash Flows for the Department as well as authority for resources.
The total resources made available to a department are applied to three uses:
- •
- the provision of outputs;
- •
- asset investment; or
- •
- payments on behalf of the State.
The following three financial statements are presented in the format consistent with the AAS29 accounting standard. However, for the purposes of this paper they have been divided into controlled and administered items.
Administered items refer to those resources over which the Department cannot exercise direct control. Authority is provided through an appropriation for payments made on behalf of the State. Under the AAS29 standard, these items would normally appear as notes to the financial statements.
Financial Statements
The following four tables can be used to assess the Department's financial performance and use of resources.
- •
- Table 2.7.2—Statement of Financial Performance—provides details of the Department's controlled revenue and expenses on an accrual basis reflecting the cost of providing its outputs;
- •
- Table 2.7.3—Statement of Financial Position—shows all controlled assets and liabilities of the Department. The difference between these represents the net assets position, which is an indicator of the State's equity in the Department;
- •
- Table 2.7.4—Statement of Cash Flows—shows all movements of cash (cash received and paid). The cash impact of financing and investing activities on Departmental resources is highlighted in this statement; and
- •
- Table 2.7.5—Administered Items Statement—provides details of the Department's administered revenue and expenses (on an accrual basis), and its administered assets and liabilities.
Table 2.7.2: Statement of Financial Performance
| | 2000-01 Actual | 2001-02 Budget | 2001-02 Revised | 2002-03 Budget | Variation(a) | ||||||
|---|---|---|---|---|---|---|---|---|---|---|---|
| | ($ million) | (%) | |||||||||
| Revenue from ordinary activities | |||||||||||
| Output appropriations | 297.6 | 321.1 | 326.4 | 335.0 | 4.3 | ||||||
| Special appropriations | 108.8 | 119.2 | 118.3 | 131.0 | 9.9 | ||||||
| Resources received free of charge or for nominal consideration | 21.6 | 14.8 | 14.5 | 14.0 | (5.3 | ) | |||||
| Sale of goods and services | 15.8 | 33.4 | 27.5 | 40.7 | 21.8 | ||||||
| Commonwealth Grants | 48.2 | 21.0 | 21.0 | 5.0 | (76.2 | ) | |||||
| Taxes | — | — | — | — | — | ||||||
| Fines and Fees | — | — | — | — | — | ||||||
| Other revenue and revenue from other parties | 32.2 | 12.7 | 14.5 | 11.3 | (10.9 | ) | |||||
| 524.1 | 522.2 | 522.0 | 537.0 | 2.8 | |||||||
| Expenses from ordinary activities | |||||||||||
| Employee entitlements | 97.6 | 105.2 | 109.6 | 110.4 | 4.9 | ||||||
| Depreciation and amortisation | 21.0 | 33.3 | 33.3 | 39.7 | 19.3 | ||||||
| Resources provided free of charge or for nominal consideration | (0.8 | ) | — | — | — | — | |||||
| Grants and other payments | 164.2 | 158.5 | 143.8 | 162.1 | 2.3 | ||||||
| Capital asset charge | 61.7 | 83.6 | 84.5 | 78.9 | (5.5 | ) | |||||
| Supplies and services | 94.2 | 103.3 | 103.4 | 116.7 | 12.9 | ||||||
| Other expenses from ordinary activities | 0.2 | 0.1 | 0.9 | 0.9 | na | ||||||
| Borrowing costs | 0.1 | 0.0 | 0.0 | 0.1 | 308.7 | ||||||
| 438.1 | 484.0 | 475.6 | 508.9 | 5.1 | |||||||
| Result from ordinary activities | 86.0 | 38.2 | 46.5 | 28.1 | (26.4 | ) | |||||
| Loss from extraordinary items | — | — | — | — | — | ||||||
| Net result for the reporting period | 86.0 | 38.2 | 46.5 | 28.1 | (26.4 | ) | |||||
| Net increase in asset revaluation reserve | 10.2 | — | 4.5 | — | — | ||||||
| Total revenues, expenses and revaluation adjustments recognised directly in equity | 10.2 | — | 4.5 | — | — | ||||||
| Total changes in equity other than those resulting from transactions with Victorian State Government in its capacity as owner | 96.2 | 38.2 | 51.0 | 28.1 | (26.4 | ) | |||||
Source: Department of Treasury and Finance
- Note:
- (a)
- Variation between 2001-02 Budget and 2002-03 Budget.
Statement of Financial Performance
The Department's operating revenue is estimated to increase by $15 million offset by an estimated $25 million increase in operating expenses.
The increase in estimated operating revenue of $15 million is mainly due to a number of initiatives funded by the State Government, announced as part of this Budget; including:
- •
- the Centre of Excellence for Victorian Electronic Records Strategy ($1.5 million) at the Public Records Office;
- •
- the development of the Australian Graduate School of Government ($2.5 million);
- •
- support for Museum Victoria and for the Malthouse Plaza and Museum of Modern Art at Heide to enhance programming and to support operational costs, research and visitor experiences in expanded spaces ($5.1 million); and
- •
- Improve delivery of language services ($0.5 million).
Other increases relate to an increase in estimates from gaming revenue for the Community Support Fund and the increase in sales revenue.
The Department has also received $3 million in additional revenue for award-related salary increases.
However, the increase in revenue is offset by a decrease in Commonwealth grants by $16 million due to the lower level of revenue for Federation Square and revenue associated with the redevelopment of the National Gallery of Victoria on St Kilda Road in 2002-03 compared to 2001-02.
Additional depreciation expense has been incurred by the Department due to the additional asset investments to be conducted in 2002-03, for example, the development of the Recital Hall and MTC Theatre as part of the Yarra Arts Precinct.
Table 2.7.3: Statement of Financial Position
| | Estimated as at 30 June | |||||||||||
|---|---|---|---|---|---|---|---|---|---|---|---|---|
| | 2001 Actual | 2002 Budget | 2002 Revised | 2003 Budget | Variation(a) | |||||||
| | ($ million) | (%) | ||||||||||
| Current assets | ||||||||||||
| Cash assets | 28.2 | 30.5 | 30.7 | 52.3 | 71.2 | |||||||
| Other financial assets | 170.5 | 188.0 | 189.2 | 205.6 | 9.4 | |||||||
| Receivables | 8.5 | 10.4 | 10.7 | 10.6 | 1.7 | |||||||
| Inventories | 2.4 | 2.4 | 2.4 | 2.4 | — | |||||||
| Prepayments | 1.1 | 1.1 | 1.3 | 1.1 | (3.7 | ) | ||||||
| Other | — | — | — | — | — | |||||||
| Total current assets | 210.8 | 232.5 | 234.2 | 272.0 | 17.0 | |||||||
| Non-current assets | ||||||||||||
| Receivables | 32.8 | 40.1 | 37.6 | 65.8 | 63.9 | |||||||
| Inventories | — | — | — | — | — | |||||||
| Other financial assets | 18.3 | 25.9 | 25.8 | 13.8 | (46.5 | ) | ||||||
| Property, plant and equipment | 835.6 | 936.9 | 898.8 | 946.9 | 1.1 | |||||||
| Intangible assets | 0.4 | 0.4 | 0.4 | 0.4 | — | |||||||
| Other(c) | 1 170.1 | 1 185.3 | 1 190.8 | 1 195.8 | 0.9 | |||||||
| Total non-current assets | 2 057.2 | 2 188.7 | 2 153.5 | 2 222.7 | 1.6 | |||||||
| Total assets | 2 268.0 | 2 421.2 | 2 387.7 | 2 494.8 | 3.0 | |||||||
| Current liabilities | ||||||||||||
| Payables | 19.0 | 19.1 | 19.0 | 19.3 | 1.2 | |||||||
| Interest bearing liabilities | 0.3 | 0.3 | 0.6 | 0.7 | 107.2 | |||||||
| Provisions(b) | 9.5 | 9.5 | 9.6 | 10.0 | 5.2 | |||||||
| Other | 10.3 | 10.4 | 9.0 | 7.0 | (32.4 | ) | ||||||
| Total current liabilities | 39.2 | 39.3 | 38.2 | 37.0 | (5.7 | ) | ||||||
| Non-current liabilities | ||||||||||||
| Interest bearing liabilities | — | — | — | — | — | |||||||
| Provisions(b) | 9.8 | 10.7 | 10.6 | 11.5 | 7.3 | |||||||
| Other | — | — | — | — | — | |||||||
| Amounts owing to other departments | — | — | — | — | — | |||||||
| Total non-current liabilities | 9.8 | 10.7 | 10.6 | 11.5 | 7.3 | |||||||
| Total liabilities | 49.0 | 50.0 | 48.9 | 48.5 | (2.9 | ) | ||||||
| Net assets | 2 219.0 | 2 371.2 | 2 338.9 | 2 446.3 | 3.2 | |||||||
| Equity | ||||||||||||
| Contributed capital | 1 049.9 | 1 163.9 | 1 118.7 | 1 198.0 | 2.9 | |||||||
| Reserves | 641.2 | 641.2 | 645.7 | 645.7 | 0.7 | |||||||
| Accumulated surplus | 527.9 | 566.2 | 574.4 | 602.5 | 6.4 | |||||||
| Total equity | 2 219.0 | 2 371.2 | 2 338.9 | 2 446.3 | 3.2 | |||||||
Source: Department of Treasury and Finance
- Notes:
- (a)
- Variation between 2001-02 Budget and 2002-03 Budget.
- (b)
- Includes employee entitlements.
- (c)
- Includes cultural heritage assets.
Statement of Financial Position
The Department's overall asset position has increased by $74 million, liabilities has experienced little change from the 2001-02 Budget. Current assets have increased by $39 million mainly related to an increase in investments principally due to timing of payments from the Community Support Fund.
Non current assets has increased by $34.0 million, with $8.4 million relating to additional capital projects that have been approved by the Government for this Budget. These initiatives include:
- •
- Implementation of the Centre of Excellence for Victorian Electronic Records Strategy ($2.5 million) at the Public Records Office of Victoria;
- •
- Implementation of the asset management strategy at the Victorian Arts Centre ($2.1million);
- •
- Exhibition redevelopment at the Scienceworks campus of Museum Victoria ($1.3 million); and
- •
- Development of the Southbank Arts Precinct ($2.5 million).
The remainder ($25.6 million) relates to the National Gallery of Victoria re-development project and the State Library re-development project.
Statement of Cash Flows
The Statement of Cash Flows reflects the movements in the Statements of Financial Performance and Financial Position. Budgeted expenditure of property, plant and equipment is down due to a number of capital projects nearing completion. They include:
- •
- The National Gallery of Victoria redevelopment of their St Kilda gallery;
- •
- Federation Square; and
- •
- Australian Centre for Moving Image.
Budgeted capital contributions are also down.
Table 2.7.4: Statement of Cash Flows
| | 2000-01 Actual | 2001-02 Budget | 2001-02 Revised | 2002-03 Budget | Variation(a) | ||||||
|---|---|---|---|---|---|---|---|---|---|---|---|
| | ($ million) | (%) | |||||||||
| Cash flows from operating activities | |||||||||||
| Receipts from Government | 433.2 | 454.0 | 460.8 | 442.9 | (2.5 | ) | |||||
| Receipts from other entities | 29.8 | 23.5 | 16.8 | 29.9 | 27.5 | ||||||
| Payments for supplies, grants and employees | (348.3 | ) | (366.1 | ) | (356.6 | ) | (388.2 | ) | 6.1 | ||
| 114.7 | 111.4 | 121.0 | 84.5 | (24.1 | ) | ||||||
| Interest received | 12.8 | 7.2 | 7.5 | 7.1 | (2.5 | ) | |||||
| Other revenue | 15.8 | 28.3 | 28.7 | 27.1 | (4.0 | ) | |||||
| Capital asset charge | (61.7 | ) | (83.6 | ) | (84.5 | ) | (78.9 | ) | (5.5 | ) | |
| Borrowing costs expense | (0.1 | ) | (0.0 | ) | (0.0 | ) | (0.1 | ) | 308.7 | ||
| Net cash inflow from operating activities | 81.5 | 63.3 | 72.7 | 39.7 | (37.3 | ) | |||||
| Cash flows from investing activities | |||||||||||
| Payments for property, plant and equipment(b) | (132.3 | ) | (149.9 | ) | (112.8 | ) | (92.9 | ) | (38.0 | ) | |
| Proceeds from sale of property, plant and equipment | 2.3 | — | — | — | — | ||||||
| Payments for investments | — | — | — | — | — | ||||||
| Proceeds from sale of business assets | — | — | — | — | — | ||||||
| (Repayment of) loans by other entities | 3.5 | (25.1 | ) | (26.3 | ) | (4.5 | ) | (82.1 | ) | ||
| Net cash (outflow) from investing activities | (126.5 | ) | (175.0 | ) | (139.1 | ) | (97.3 | ) | (44.4 | ) | |
| Cash flows from financing activities | |||||||||||
| Net Proceeds from capital contribution by State Government | 18.4 | 114.0 | 68.9 | 79.3 | (30.5 | ) | |||||
| Net proceeds of borrowings | (0.1 | ) | — | — | — | — | |||||
| Repayment of finance leases | — | — | — | — | — | ||||||
| Net cash inflow (outflow) from financing activities | 18.3 | 114.0 | 68.9 | 79.3 | (30.5 | ) | |||||
| Net increase (decrease) in cash held | (26.7 | ) | 2.3 | 2.5 | 21.6 | 835.5 | |||||
| Cash at the beginning of the financial year | 54.9 | 28.2 | 28.2 | 30.7 | 8.7 | ||||||
| Cash at the end of the financial year | 28.2 | 30.5 | 30.7 | 52.3 | 71.2 | ||||||
Notes:
- (a)
- Variation between 2001-02 Budget and 2002-03 Budget.
- (b)
- Includes payments for land held for resale and research & development costs.
Table 2.7.5: Administered Items Statement
| | 2000-01 Actual | 2001-02 Budget | 2001-02 Revised | 2002-03 Budget | Variation(a) | ||||||
|---|---|---|---|---|---|---|---|---|---|---|---|
| | ($ million) | (%) | |||||||||
| Administered revenue | |||||||||||
| Appropriations—Payments made on behalf of the State | — | — | — | — | — | ||||||
| Output Appropriation | — | — | — | — | — | ||||||
| Special appropriations | — | — | — | — | — | ||||||
| Resources received free of charge or for nominal consideration | — | — | — | — | — | ||||||
| Sale of goods and services | 1.9 | 1.9 | 2.3 | 2.4 | 26.2 | ||||||
| Commonwealth grants | — | — | — | — | — | ||||||
| Other grants | — | — | — | — | — | ||||||
| Taxes | — | — | — | — | — | ||||||
| Fines | — | — | — | — | — | ||||||
| Fees | — | — | — | — | — | ||||||
| Other | 1.5 | 0.4 | 0.3 | 0.3 | (14.4 | ) | |||||
| Total administered revenue | 3.4 | 2.3 | 2.6 | 2.7 | 19.7 | ||||||
| Administered expenses | |||||||||||
| Expenses on behalf of the State | 9.9 | — | — | — | — | ||||||
| Grants and other payments | — | — | — | — | — | ||||||
| Payments into the Consolidated Fund | 2.1 | 2.3 | 2.6 | 2.7 | 19.7 | ||||||
| Total administered expenses | 12.0 | 2.3 | 2.6 | 2.7 | 19.7 | ||||||
| Revenue less expenses | (8.7 | ) | — | — | — | — | |||||
| Administered assets | |||||||||||
| Cash assets | (0.0 | ) | (0.0 | ) | (0.0 | ) | (0.0 | ) | — | ||
| Receivables | (16.3 | ) | (16.3 | ) | (16.3 | ) | (16.3 | ) | — | ||
| Other financial assets | — | — | — | — | — | ||||||
| Inventories | — | — | — | — | — | ||||||
| Prepayments | — | — | — | — | — | ||||||
| Property, plant and equipment | 0.2 | 0.2 | 0.2 | 0.2 | — | ||||||
| Intangible assets | — | — | — | — | — | ||||||
| Other | — | — | — | — | — | ||||||
| Total administered assets | (16.1 | ) | (16.1 | ) | (16.1 | ) | (16.1 | ) | — | ||
| Administered liabilities | |||||||||||
| Payables | 0.2 | 0.2 | 0.2 | 0.2 | — | ||||||
| Interest bearing liabilities | — | — | — | — | — | ||||||
| Provisions | 0.0 | 0.0 | 0.0 | 0.0 | — | ||||||
| Amounts owing to other departments | — | — | — | — | — | ||||||
| Other | (0.0 | ) | (0.0 | ) | (0.0 | ) | (0.0 | ) | — | ||
| Total administered liabilities | 0.2 | 0.2 | 0.2 | 0.2 | — | ||||||
Source: Department of Treasury and Finance
Authority for Resources
This section provides a summary of the sources of Parliamentary Authority available to the Department to fund the provision of outputs, payments on behalf of State, and additions to the net asset base.
Table 2.7.6: Parliamentary Authority for Resources
| | 2001-02 Budget | 2001-02 Revised | 2002-03 Budget | Variation(a) | |||||
|---|---|---|---|---|---|---|---|---|---|
| | ($ million) | (%) | |||||||
| Annual appropriations(b) | 402.1 | 408.4 | 408.1 | 1.5 | |||||
| Receipts credited to appropriations | 0.5 | 0.7 | 0.7 | 37.3 | |||||
| Unapplied previous years appropriation | 44.0 | 47.7 | 12.4 | (71.7 | ) | ||||
| Accumulated surplus—previously applied appropriation | — | — | — | — | |||||
| Gross annual appropriation | 446.6 | 456.8 | 421.3 | (5.7 | ) | ||||
| Special appropriations | 119.2 | 118.3 | 131.0 | 9.9 | |||||
| Trust funds | 6.8 | 7.2 | 5.3 | (21.8 | ) | ||||
| Total Parliamentary authority | 572.7 | 582.4 | 557.6 | (2.6 | ) | ||||
Source: Department of Treasury and Finance
- Notes:
- (a)
- Variation between 2001-02 Budget and 2002-03 Budget.
- (b)
- 2001-02 Revised includes the impact of approved Treasurer's Advances.
DEPARTMENT OF TOURISM, SPORT AND THE COMMONWEALTH GAMES
PART 1: OUTLOOK AND OUTPUTS
Overview
The Department of Tourism, Sport and the Commonwealth Games (DTSCG) was created on 5 March 2002 with responsibility for Victorian Government activities in the Tourism, Sport, Recreation, Racing, Major Events and Commonwealth Games areas.
DTSCG supports the four Ministerial portfolios—Tourism, Sport and Recreation, Commonwealth Games, and Racing.
The Department has responsibility for advising the Government on matters in these Ministerial portfolios and for delivering on the Government's policy and service delivery commitments in these areas. Accordingly DTSCG is the primary vehicle for delivering on the Government's commitments to:
- •
- smoothly implement the 2006 Commonwealth Games, and maximise the benefits to the State of hosting the Games;
- •
- enhance the opportunities presented by sport, recreation and racing and major events for individuals, communities and business; and
- •
- promote domestic and international tourism.
Departmental Objectives
The Department has a range of performance objectives that accord with the Government's Growing Victoria Together vision for the future of Victoria. The objectives and related indicators are directly linked to departmental outputs. These objectives are to:
- •
- encourage and support the contribution of tourism, sport and recreation to economic and social development, and to environmental responsibility;
- •
- maximise the benefits for all Victorians of a successful 2006 Commonwealth Games; and
- •
- strengthen Victoria's sport, recreation, major events and tourism base.
Review of 2001-02(1)
- (1)
- DTSCG activities reviewed were undertaken by departmental divisions that were located within the former DSRD for the most part of 2001-2
Tourism
Tourism Victoria continued its solid performance in marketing the State as a domestic and international tourism destination, despite the significant impacts of the collapse of Ansett and the events in the United States in September 2001. In response to these events, the State Government immediately announced a $10 million rescue package to address the short-term negative impacts on the tourism industry. The rescue package included the extension of existing marketing campaigns and the creation of specific tactical campaigns.
The Victorian Tourism Industry's Strategic Plan 2002-2006 and the Victorian Tourism Online project were completed.
Sport, Recreation and Racing
The 2001-02 financial year saw extensive community facility provision in partnership with local government and detailed planning for the MCG and Melbourne Sports and Aquatic Centre redevelopments. A new governance structure was put in place for the thoroughbred racing industry and further reforms to the bookmaking profession were developed and legislated.
Major sporting events successfully presented included the 2001 World Cup Soccer Qualifier, Formula One and Motorcycle Grands Prix, Superbikes, Rip Curl Pro and the Heineken Golf Classic. The highly successful water safety campaign 'Play it Safe by the Water' contributed to a significant reduction in the number of drownings.
Commonwealth Games
Planning for the 2006 Commonwealth Games continued with the development proposals for the Athletes Village being sought and the athletics track at the MCG being tendered as part of the Northern Stand re-development.
2002-03 Outlook
August 2002 will see responsibility for organisation of the next Commonwealth games handed over to Melbourne. Milestones during the year include:
- •
- commencement or continued progress on activities or projects already identified and accepted by the Government as necessary for the successful staging of the Commonwealth Games;
- •
- commencement of construction of the Commonwealth Games Athletes Village; and
- •
- continued planning of facilities and the 'public domain' for the Commonwealth Games;
Tourism Victoria will oversee:
- •
- Melbourne hosting the 2003 Australian Tourism Exchange;
- •
- the next phase of the highly successful Jigsaw campaign, with an emphasis on regional Victoria being launched in 2003;
- •
- continued marketing in targeted overseas markets;
- •
- an awareness program in relation to the 'significance of tourism';
- •
- implementation of strategies outlined in the Victoria's Tourism Industry Strategic Plan 2002-2006;
- •
- stimulation of regional tourism through the marketing of key destinations and other indicators for travel;
- •
- continued negotiations on direct plane services from key source markets; and
- •
- maximisation of operator participation in accredited programs.
Sport and Recreation Victoria will oversee:
- •
- successful staging of the World Masters Games;
- •
- continued upgrading of community level sport and recreation facilities and financial support for peak sporting bodies, regional sports assemblies and organisations promoting sport and recreation access and opportunities for people with a disability;
- •
- continuation of the Government's safer and improved aquatic recreation initiatives including the toddler drowning prevention program;
- •
- increased commitment to the development of sporting excellence in the lead up to the Commonwealth Games, through the Victorian Institute of Sport;
- •
- continued upgrading of sport and recreation camps;
- •
- continued securing and facilitating major events;
- •
- implementation of reforms to the bookmaking profession identified in the 2001-02 review;
- •
- ongoing promotion of specific target areas within the racing industry including country racing, thoroughbred breeding, equine disease management, welfare of jockeys and participation by women and young people;
- •
- commencement of the Melbourne Sports and Aquatic Centre redevelopment; and
- •
- commencement of construction of the MCG redevelopment.
Output Information
The following section provides details of the outputs to be provided to Government, including their performance measures and the costs for each output. The table below summaries the total cost for outputs.
Table 2.8.1: Output summary
| | 2001-02 Budget(a) | 2001-02 Revised | 2002-03 Budget | Variation(b) | |||||
|---|---|---|---|---|---|---|---|---|---|
| | ($ million) | (%) | |||||||
| Sport Recreation and Racing | 57.4 | 65.4 | 48.4 | (15.6 | ) | ||||
| Tourism | 39.6 | 52.2 | 38.4 | (3.0 | ) | ||||
| Melbourne 2006 Commonwealth Games | 13.2 | 35.6 | 13.8 | 4.5 | |||||
| Total | 110.2 | 153.2 | 100.6 | (8.7 | ) | ||||
Source: Department of Treasury and Finance
Notes:
- (a)
- 2001-02 Output Budget incorporates changes to Output structure and organisational restructuring and therefore may differ from figures published in the 2001-02 Budget.
- (b)
- Variation between 2001-02 and 2002-03 Budget.
Sport, Recreation and Racing
Description:
Seeks to develop all facets of the sport, recreation and racing industries in accordance with identified priorities including facilitating sport and recreation opportunities for all within the community and maintaining quality sport and recreation infrastructure to support participation and events at all levels.
Departmental Objective to which services contribute:
- •
- To strengthen Victoria's sport, recreation, major event and tourism base.
- •
- To maximise the benefits for all Victorians of a successful 2006 Commonwealth Games.
- •
- To encourage and support the contribution of tourism, sport and recreation to economic and social development; and to promote environmental responsibility.
| Major Outputs/Deliverables Performance Measures | Unit of Measure | 2000-01 Actuals | 2001-02 Targets | 2001-02 Expected Outcome | 2002-03 Targets | |||||
|---|---|---|---|---|---|---|---|---|---|---|
| Sport and Major Event Facilitation—The focus is on maintaining recognition of Victoria as the premier sporting State. This includes the attraction, planning and retention of major national and international sporting and other events that raise the profile of Victoria. | ||||||||||
| Quantity | ||||||||||
| International teams/sports: | ||||||||||
| • Sports Visitations facilitated | number | nm | 180 | 180 | 200 | |||||
| • Inspecting facilities | number | 15 | na | na | na | |||||
| • Undertaking training/competition | number | 101 | na | na | na | |||||
| • Athletes and official pre-Olympic training | number | 1 500 | na | na | na | |||||
| World Masters Games 2002—participants: | ||||||||||
| • Expressions of interest received | number | 20 100 | 25 000 | 25 000 | na | |||||
| • Registration secured by June 2002 | number | nm | 2 500 | 2 500 | na | |||||
| • Event participants | number | nm | nm | nm | 16 000 | |||||
| Major Events facilitated | number | nm | 10 | 10 | 8-10 | |||||
| Quality | ||||||||||
| Delivery of an approved business plan for each event incorporating appropriate operational, marketing plan and financial information | per cent | nm | nm | nm | 100 | |||||
| Completion of ongoing operational and budget reports for each event | per cent | nm | nm | nm | 100 | |||||
| Government branding and promotion requirements undertaken at each event | per cent | nm | nm | nm | 100 | |||||
| Timeliness | ||||||||||
| Completion of appropriate post event reports and formal economic impact assessment (where required) at the completion of each event | per cent | nm | nm | nm | 100 | |||||
| Project Management and Evaluation: | ||||||||||
| • 2006 Commonwealth Games Budget plans completed | date | deferred | na | na | na | |||||
| • Olympic football tournament completed | date | Sept 2000 | na | na | na | |||||
| Events Facilitated by Target Dates: | ||||||||||
| • National Schools Volleyball Cup | date | Dec 2000 | na | na | na | |||||
| • Rip Curl offshore festival (Bells Beach) | date | Apr 2001 | na | na | na | |||||
| • Sail Melbourne (World Championships) | date | Jan 2001 | na | na | na | |||||
| • Superbikes | date | Apr 2001 | na | na | na | |||||
| Cost | ||||||||||
| Total output cost | $ million | 34.9 | 19.0 | 29.8 | 17.4 | |||||
Sport and Recreation Industry Development—Provides strategic leadership and facilitates for the development of the sport and recreation industry. There is also a key focus on industry regulation and probity in the horse racing, professional boxing and martial arts sectors. | ||||||||||
| Quantity | ||||||||||
| Racing and Bookmakers Licences, permits, appeals and registrations processed | number | 1 303 | 450 | 550 | 450 | |||||
| Key industry organisations providing strategic advice to Government/ DTSCG | number | 6 | 5 | 5 | 4 | |||||
| Combat sports licences and permits issued | number | nm | nm | nm | 250 | |||||
| Community Based Organisations undertaking organisational development activities | number | 44 | na | na | na | |||||
| Organisational development projects/activities undertaken | number | nm | 76 | 76 | 60 | |||||
| Athletes on Victorian Institute of Sport scholarships | number | 450 | >400 | 420 | >450 | |||||
| Percentage of Victorian Institute of Sport scholarship holders on national teams/squads | per cent | 28 | >55 | 58 | >55 | |||||
| Quality | ||||||||||
| Outdoor Recreation Camps contract management KPIs met | per cent | 90 | >75 | 75 | >75 | |||||
| Meet Government's Racing legislation program timeframes | per cent | nm | nm | nm | 100 | |||||
| Complete 2002-03 Racing Program funding commitments | per cent | nm | nm | nm | 100 | |||||
| Timeliness | ||||||||||
| Awards conducted | date | Sept 2000 | Sept 2001 | Aug 2001 | Sept 2002 | |||||
| Sport injury Prevention Programme evaluation | date | Sept 2000 | na | na | na | |||||
| Revised Sport injury Prevention Programme implemented | nm | Jan 2002 | Jan 2002 | na | ||||||
| Active Australia National Participation Framework Operational Plan developed and agreed | date | Mar 2001 | na | na | na | |||||
| Country Action funding announced | date | May 2001 | na | na | na | |||||
| Victalent funding announced | date | May 2001 | na | na | na | |||||
| Cost | ||||||||||
| Total output cost | $ million | 14.0 | 19.5 | 20.4 | 19.6 | |||||
Sport and Recreation Facility Development—Provides funding, coordination and facilitation services that generate investment in developing, improving and extending sport and recreation facilities throughout Victoria ranging from community to State and international level. | ||||||||||
| Quantity | ||||||||||
| State level facilities: | ||||||||||
| • Investigated | number | 4 | 2 | 3 | 2 | |||||
| • Funded | number | 2 | na | na | na | |||||
| • Under Construction | number | 4 | na | na | na | |||||
| • Being designed or constructed | number | nm | 3 | 3 | 3 | |||||
| • Constructed Community Facilities Funded (part CSF funded) | number | nm | 1 | 1 | na | |||||
| Minor works facilities funded (CSF) | number | 179 | >100 | 173 | 160 | |||||
| Major planning projects funded | number | 56 | 20-40 | 46 | 20-40 | |||||
| Major capital work projects funded | number | 10 | >5 | 16 | >5 | |||||
| Aquatic facility projects funded (CSF) | number | 23 | >10 | 16 | 10 | |||||
| Estimated value added expenditure on regional and community facilities above the State Government contribution | $ million | 32 | na | na | na | |||||
| Timeliness | ||||||||||
| Major Facilities planned and designed within agreed timeframes: | ||||||||||
| • Netball and Hockey (Royal Park Sports Precinct) commissioned | date | Jan 2001 | na | na | na | |||||
| • Water Sports Study—Completed | date | Apr 2001 | na | na | na | |||||
| Expansion of Melbourne Sports and Aquatic Centre/Sports House (MSAC): | ||||||||||
| • MSAC Masterplan completed | date | Sept 2000 | na | na | na | |||||
| • design completed | date | nm | Jun 2002 | Jun 2002 | na | |||||
| • Construction commenced | date | nm | nm | nm | Feb 2003 | |||||
| Melbourne and Olympic Park: | ||||||||||
| • Masterplan completed | date | Sept 2000 | na | na | na | |||||
| • first phase under construction | date | nm | Jun 2002 | Jun 2002 | na | |||||
| • first phase completed | date | nm | nm | nm | May 2003 | |||||
| • Training velodrome construction commenced | date | nm | Jun 2002 | Jun 2002 | na | |||||
| • Training velodrome construction completed | date | nm | nm | nm | Jun 2003 | |||||
| International Lawn Bowls Centre: | ||||||||||
| • works commenced | date | nm | Mar 2002 | Jun 2002 | na | |||||
| • under construction | date | nm | nm | nm | Jun 2003 | |||||
| Local Government Authority capital works completed within agreed timeframe | per cent | 60 | na | na | na | |||||
| Cost | ||||||||||
| Total output cost | $ million | 12.0 | 18.9 | 15.2 | 11.4 |
Source: Department of Tourism, Sport and the Commonwealth Games
Tourism
Description:
Aims to maximise employment and the longer term economic benefits of tourism to Victoria by developing and marketing the State as a competitive tourist destination for both domestic and international tourists as well as product development, leadership and coordination.
Departmental Objectives to which services contribute:
- •
- To encourage and support the contribution of tourism, sport and recreation to economic and social development and to promote environmental responsibility.
- •
- To strengthen Victoria's sport, recreation, major events and tourism base.
| Major Outputs/Deliverables Performance Measures | Unit of Measure | 2000-01 Actuals | 2001-02 Targets | 2001-02 Expected Outcome | 2002-03 Targets | |||||
|---|---|---|---|---|---|---|---|---|---|---|
| Tourism Marketing and Event Facilitation—Conduct marketing campaigns to further increase visitation and yield, assist in developing tourism product which appeals to international and domestic visitors, maximise cooperative marketing opportunities and capitalise on the tourism benefits flowing from major events. | ||||||||||
| Quantity | ||||||||||
| Visitor nights (Domestic) | number (million | ) | 52-54 | 52-54 | 52-54 | 52-54 | ||||
| Visitor Expenditure (Domestic) | number $(billion | ) | na | na | na | 5.8-6.0 | ||||
| Visitor nights (International) | number (million | ) | 20-22 | 20-22 | 20-22 | 20-22 | ||||
| Number of visitors (International) | number (million | ) | 1.0-1.3 | 1.0-1.3 | 1.0-1.3 | 1.0-1.3 | ||||
| Visitor Expenditure (International) | number $(billion | ) | na | na | na | 1.55-1.65 | ||||
| Visitor nights to Regional Victoria (Domestic) | number (million | ) | na | na | na | 35-37 | ||||
| Enquiries and phone responses handled by Victorian Tourism Information Service | number | 177 000 | na | na | na | |||||
| Domestic familiarisation participants: | ||||||||||
| • Trade | number | 146 | 250-350 | 250-350 | na | |||||
| • Media | number | 250 | 130-150 | 130-150 | na | |||||
| International familiarisation participants: | ||||||||||
| • Trade | number | 1 066 | 300-400 | 300-400 | na | |||||
| • Media | number | 463 | 300-400 | 300-400 | na | |||||
| Wholesale packages sold | number | 119 000 | na | na | na | |||||
| Visitvictoria.com monthly visitors delivered | number ('000 | ) | na | na | na | 45-50 | ||||
| Visitvictoria.com monthly page impressions delivered | number ('000 | ) | na | na | na | 600-650 | ||||
| International tactical marketing campaigns delivered | number | na | na | na | 70-90 | |||||
| Melbourne Great Indoors tactical marketing campaign: | ||||||||||
| • website page impressions ('000) | number | na | na | na | 14-16 | |||||
| • Room nights sold | number | na | na | na | 18 000 | |||||
| SKI tactical marketing campaign: | ||||||||||
| • Website page impressions ('000) | number | na | na | na | 40-50 | |||||
| Destinational Marketing Campaigns delivered | number | na | 12 | 12 | na | |||||
| Domestic and international trade shows participated in | number | na | 12-15 | 12-15 | na | |||||
| Domestic and international trade missions organised | number | na | 10-12 | 10-12 | na | |||||
| Major events assisted | number | 19 | 30-35 | 30-35 | 30-35 | |||||
| Hallmark and special events assisted | number | na | 22 | 22 | 22 | |||||
| Quality | ||||||||||
| Awareness of advertising on Victoria: | ||||||||||
| • New South Wales | per cent | 19 | 18-22 | 18-22 | 18-22 | |||||
| • South Australia | per cent | 16 | 10-16 | 10-16 | 10-16 | |||||
| • Queensland | per cent | 19 | 18-22 | 18-22 | 18-22 | |||||
| • Victoria | per cent | 14 | 8-12 | 8-12 | 8-12 | |||||
| Value of free ink generated: | ||||||||||
| • Domestic | $ million | 67.11 | 20-25 | 25-35 | 25-35 | |||||
| • International | $ million | 362.71 | 150-200 | 200-225 | 200-225 | |||||
| Tourism Victoria international marketing expenditure as proportion of total campaign expenditure | ratio | na | na | na | 1:3 | |||||
| Grants managed in accordance with published guidelines | per cent | 90 | % | na | na | na | ||||
| Timeliness | ||||||||||
| Marketing programs delivered according to milestones | per cent | 95 | % | 90 | na | na | ||||
| Grant and cooperative programs delivered according to milestones | per cent | 90 | % | na | na | na | ||||
| Cost | ||||||||||
| Total output cost | $ million | 37.1 | 36.2 | 48.9 | 35.0 | |||||
Tourism Industry and Infrastructure Development—Facilitate private sector tourism investment, provide leadership and direction in line with the Tourism Victoria Strategic Business Plan and the Tourism Development Plans for each of Victoria's product regions and attract new carriers and air services to Melbourne. | ||||||||||
| Quantity | ||||||||||
| Number of consultative industry forums, seminars/workshops conducted | number | 49 | 20-25 | 20-25 | 20-25 | |||||
| Investment projects facilitated | number | 16 | 15-20 | 15-20 | na | |||||
| Investment projects facilitated | $ million | na | na | na | 200-250m | |||||
| Quality | ||||||||||
| Service Level Agreements with major industry partners acquitted within agreed guidelines | per cent | 100 | 100 | 100 | 100 | |||||
| Cost | ||||||||||
| Total output cost | $ million | 7.8 | 3.4 | 3.3 | 3.4 | |||||
Source: Department of Tourism, Sport and the Commonwealth Games
Melbourne 2006 Commonwealth Games
Description:
Provision of planning, development, coordination and management services to ensure the successful preparation and staging of the 2006 Commonwealth Games in Melbourne.
Departmental Objectives to which services contribute:
- •
- To maximise the benefits for all Victorians of a successful 2006 Commonwealth Games.
- •
- To encourage and support the contribution of tourism, sport and recreation to economic and social development and to promote environmental responsibility.
- •
- To strengthen Victoria's sport, recreation, major events and tourism base.
| Major Outputs/Deliverables Performance Measures | Unit of Measure | 2000-01 Actuals | 2001-02 Targets | 2001-02 Expected Outcome | 2002-03 Targets | |||||
|---|---|---|---|---|---|---|---|---|---|---|
| Melbourne 2006 Commonwealth Games—Coordination of planning for the Commonwealth Games with the Melbourne 2006 Commonwealth Games Pty Ltd. | ||||||||||
| Timeliness | ||||||||||
| Budget/Business Plan | ||||||||||
| • Review of M2006 Business Plan and Budget completed | date | nm | Dec 2001 | Draft Jun 2002 | na | |||||
| • Submission of M2006 operational budget 2002-03 | date | nm | Jan 2002 | Dec 2001 | na | |||||
| • Quarterly progress reports submitted | number | nm | nm | nm | 4 | |||||
| Strategic Plan | ||||||||||
| • Finalisation of Government Service requirements for the Games | date | nm | Apr 2002 | Apr 2002 | na | |||||
| Facility Development | ||||||||||
| • Finalisation of scope of infrastructure requirements for the Games | date | nm | Jun 2002 | Dec 2001 | na | |||||
| • Approval of site of the athletics track | date | nm | Feb 2002 | Nov 2001 | na | |||||
| Games Village | ||||||||||
| • Finalisation of scope and development strategy | date | nm | Jun 2002 | Feb 2002 | na | |||||
| Legislation | ||||||||||
| • Commence drafting of legislation for the Games | date | nm | Oct 2001 | Aug 2001 | na | |||||
| Cost | ||||||||||
| Total output cost | $ million | 13.2 | 35.6 | 10.4 | ||||||
Commonwealth Games Coordination—Provision of planning, development, coordination and management services to ensure the successful preparation and staging of the 2006 Commonwealth Games in Melbourne. | ||||||||||
| Timeliness | ||||||||||
| Manchester Commonwealth Games observed | date | nm | nm | nm | Aug 2002 | |||||
| Athlete Village contract negotiated | date | nm | nm | nm | Oct 2002 | |||||
| Commonwealth Games budget developed | date | nm | nm | nm | Dec 2002 | |||||
| International tourism promotion commenced | date | nm | nm | nm | Jan 2003 | |||||
| Athlete Village construction commenced | date | nm | nm | nm | Feb 2003 | |||||
| Legislative amendment drafted | date | nm | nm | nm | May 2003 | |||||
| Cost | ||||||||||
| Total output cost | $ million | — | — | — | 3.4 |
Source: Department of Tourism, Sport and the Commonwealth Games
- Note:
- (a)
- This output cluster was an output under the Sport, Recreation and Racing output cluster for 2001-02.
Part 2 provides the financial statements that support the Department's provision of outputs. The information provided includes the Statement of Financial Performance, Statement of Financial Position and Statement of Cash Flows for the Department as well as authority for resources.
The total resources made available to a department are applied to three uses:
- •
- the provision of outputs;
- •
- asset investment; or
- •
- payments on behalf of the State.
The following three financial statements are presented in the format consistent with the AAS29 accounting standard. However, for the purposes of this paper they have been divided into controlled and administered items.
Administered items refer to those resources over which the Department cannot exercise direct control. Authority is provided through an appropriation for payments made on behalf of the State. Under the AAS29 standard, these items would normally appear as notes to the financial statements.
Financial Statements
The following four tables can be used to assess the Department's financial performance and use of resources.
- •
- Table 2.8.2—Statement of Financial Performance—provides details of the Department's controlled revenue and expenses on an accrual basis reflecting the cost of providing its outputs;
- •
- Table 2.8.3—Statement of Financial Position—shows all controlled assets and liabilities of the Department. The difference between these represents the net assets position, which is an indicator of the State's equity in the Department;
- •
- Table 2.8.4—Statement of Cash Flows—shows all movements of cash (cash received and paid). The cash impact of financing and investing activities on Departmental resources is highlighted in this statement; and
- •
- Table 2.8.5—Administered Items Statement—provides details of the Department's administered revenue and expenses (on an accrual basis), and its administered assets and liabilities.
On 5 March 2002, the Department of State and Regional Development was split in two, creating the Department of Innovation, Industry and Regional Development and the Department of Tourism, Sport and the Commonwealth Games. The financial information provided for 2000-01 and 2001-02 is therefore indicative only.
Table 2.8.2: Statement of Financial Performance
| | 2000-01 Actual | 2001-02 Budget | 2001-02 Revised | 2002-03 Budget | Variation(a) | ||||||
|---|---|---|---|---|---|---|---|---|---|---|---|
| | ($ million) | (%) | |||||||||
| Revenue from ordinary activities | |||||||||||
| Output appropriations | 102.9 | 105.2 | 148.7 | 96.7 | (8.1 | ) | |||||
| Special appropriations | — | — | — | — | — | ||||||
| Resources received free of charge or for nominal consideration | — | — | — | — | — | ||||||
| Sale of goods and services | — | 1.8 | 1.8 | 1.7 | (3.6 | ) | |||||
| Commonwealth Grants | — | 0.9 | — | — | (100.0 | ) | |||||
| Taxes | — | — | — | — | — | ||||||
| Fines and Fees | — | — | — | — | — | ||||||
| Other revenue and revenue from other parties | 8.0 | 2.2 | 2.7 | 2.2 | — | ||||||
| 110.9 | 110.1 | 153.2 | 100.6 | (8.6 | ) | ||||||
| Expenses from ordinary activities | |||||||||||
| Employee entitlements | 15.6 | 16.4 | 19.3 | 21.7 | 32.7 | ||||||
| Depreciation and amortisation | 0.6 | 0.6 | 0.8 | 0.8 | 24.9 | ||||||
| Resources provided free of charge or for nominal consideration | — | — | — | — | — | ||||||
| Grants and other payments | 49.0 | 60.5 | 78.8 | 39.8 | (34.2 | ) | |||||
| Capital asset charge | 1.0 | 1.4 | 1.1 | 1.1 | (15.2 | ) | |||||
| Supplies and services | 39.5 | 31.3 | 53.2 | 37.2 | 19.0 | ||||||
| Other expenses from ordinary activities | (0.0 | ) | — | — | — | — | |||||
| Borrowing costs | 0.0 | — | — | — | — | ||||||
| 105.8 | 110.1 | 153.2 | 100.6 | (8.6 | ) | ||||||
| Result from ordinary activities | 5.1 | — | — | — | — | ||||||
| Loss from extraordinary items | — | — | — | — | — | ||||||
| Net result for the reporting period | 5.1 | — | — | — | — | ||||||
| Net increase in asset revaluation reserve | — | — | — | — | — | ||||||
| Total revenues, expenses and revaluation adjustments recognised directly in equity | — | — | — | — | — | ||||||
| Total changes in equity other than those resulting from transactions with Victorian State Government in its capacity as owner | 5.1 | — | — | — | — | ||||||
Source: Department of Teasury and Finance
- Notes:
- (a)
- Variation between 2001-02 Budget and 2002-03 Budget.
Statement of Financial Performance
For controlled items, both operating revenue and expenses are expected to total $100.6 million in 2002-03, a decrease of 9 per cent over the indicative 2001-02 Budget estimate. While new initiatives totalling $17 million have been agreed for 2002-03 and the Department will experience higher costs relating to public sector employees wages supplementation, this has been offset by the completion of a number of existing programs.
The estimated Budget outcome for 2001-02 is expected to be $153.2 million, 39 per cent higher than the published Budget. This increase is due to assistance to the tourism industry in response to the Ansett collapse and the events in the United States in September 2001, increased payments for major events and for up front payment licensing payments related to the 2006 Melbourne Commonwealth Games.
Statement of Financial Position
The level of assets controlled by DTSCG has increased by $1.2 million from the 2001-02 revised Budget. This is principally due to additional capital works on the sport and recreation camps ($0.8 million in 2002-03).
Table 2.8.3: Statement of Financial Position
| | Estimated as at 30 June | ||||||||||
|---|---|---|---|---|---|---|---|---|---|---|---|
| | 2001 Actual | 2002 Budget | 2002 Revised | 2003 Budget | Variation(a) | ||||||
| | ($ million) | (%) | |||||||||
| Current assets | |||||||||||
| Cash assets | 0.2 | 0.2 | 0.2 | 0.2 | — | ||||||
| Other financial assets | — | — | — | — | — | ||||||
| Receivables | 2.3 | 2.3 | 2.3 | 2.3 | — | ||||||
| Inventories | — | — | — | — | — | ||||||
| Prepayments | 2.2 | 2.2 | 2.2 | 2.2 | — | ||||||
| Other | — | — | — | — | — | ||||||
| Total current assets | 4.7 | 4.7 | 4.7 | 4.7 | — | ||||||
| Non-current assets | |||||||||||
| Receivables | 1.1 | 0.6 | 0.6 | 0.6 | — | ||||||
| Inventories | — | — | — | — | — | ||||||
| Other financial assets | — | — | — | — | — | ||||||
| Property, plant and equipment | 13.2 | 14.2 | 14.2 | 15.5 | 8.8 | ||||||
| Intangible assets | — | — | — | — | — | ||||||
| Other | — | — | — | — | — | ||||||
| Total non-current assets | 14.4 | 14.9 | 14.9 | 16.1 | 8.4 | ||||||
| Total assets | 19.1 | 19.6 | 19.6 | 20.8 | 6.4 | ||||||
| Current liabilities | |||||||||||
| Payables | 3.0 | 3.0 | 3.0 | 3.0 | — | ||||||
| Interest bearing liabilities | — | — | — | — | — | ||||||
| Provisions(b) | 1.9 | 1.9 | 1.9 | 1.9 | — | ||||||
| Other | 2.0 | 2.0 | 2.0 | 2.0 | — | ||||||
| Total current liabilities | 7.0 | 7.0 | 7.0 | 7.0 | — | ||||||
| Non-current liabilities | |||||||||||
| Interest bearing liabilities | — | — | — | — | — | ||||||
| Provisions(b) | 2.9 | 2.9 | 2.9 | 2.9 | — | ||||||
| Other | — | — | — | — | — | ||||||
| Amounts owing to other departments | — | — | — | — | — | ||||||
| Total non-current liabilities | 2.9 | 2.9 | 2.9 | 2.9 | — | ||||||
| Total liabilities | 9.9 | 9.9 | 9.9 | 9.9 | — | ||||||
| Net assets | 9.2 | 9.7 | 9.7 | 11.0 | 12.8 | ||||||
| Equity | |||||||||||
| Contributed capital | — | 0.5 | 0.5 | 1.8 | 250.0 | ||||||
| Reserves | 4.1 | 4.1 | 4.1 | 4.1 | — | ||||||
| Accumulated surplus | 5.1 | 5.1 | 5.1 | 5.1 | — | ||||||
| Total equity | 9.3 | 9.8 | 9.8 | 11.0 | 12.8 | ||||||
Source: Department of Treasury and Finance
- Note:
- (a)
- Variation between 2001-02 Budget and 2002-03 Budget.
- (b)
- Includes employee costs and superannuation.
Table 2.8.4: Statement of Cash Flows
| | 2000-01 Actual | 2001-02 Budget | 2001-02 Revised | 2002-03 Budget | Variation(a) | ||||||
|---|---|---|---|---|---|---|---|---|---|---|---|
| | ($ million) | (%) | |||||||||
| Cash flows from operating activities | |||||||||||
| Receipts from Government | 102.8 | 106.6 | 149.2 | 96.7 | (9.3 | ) | |||||
| Receipts from other entities | 1.9 | 4.0 | 4.5 | 3.9 | (1.6 | ) | |||||
| Payments for supplies, grants and employees | (104.6 | ) | (108.1 | ) | (151.3 | ) | (98.7 | ) | (8.7 | ) | |
| 0.1 | 2.5 | 2.4 | 1.9 | (22.4 | ) | ||||||
| Interest received | 0.4 | — | — | — | — | ||||||
| Other revenue | 6.3 | — | — | — | — | ||||||
| Capital asset charge | (1.0 | ) | (1.4 | ) | (1.1 | ) | (1.1 | ) | (15.2 | ) | |
| Borrowing costs expense | (0.0 | ) | — | — | — | — | |||||
| Net cash inflow from operating activities | 5.7 | 1.1 | 1.3 | 0.8 | (31.1 | ) | |||||
| Cash flows from investing activities | |||||||||||
| Payments for property, plant and equipment(b) | (0.7 | ) | (1.6 | ) | (1.8 | ) | (2.0 | ) | 25.0 | ||
| Proceeds from sale of property, plant and equipment | 0.0 | — | — | — | — | ||||||
| Payments for investments | — | — | — | — | — | ||||||
| Proceeds from sale of business assets | — | — | — | — | — | ||||||
| (Repayment of) loans by other entities | — | — | — | — | — | ||||||
| Net cash (outflow) from investing activities | (0.7 | ) | (1.6 | ) | (1.8 | ) | (2.0 | ) | 25.0 | ||
| Cash flows from financing activities | |||||||||||
| Net Proceeds from capital contribution by State Government | — | 0.5 | 0.5 | 1.3 | 150.0 | ||||||
| Net proceeds of borrowings | — | — | — | — | — | ||||||
| Repayment of finance leases | — | — | — | — | — | ||||||
| Net cash inflow (outflow) from financing activities | — | 0.5 | 0.5 | 1.3 | 150.0 | ||||||
| Net increase (decrease) in cash held | 5.1 | — | — | — | — | ||||||
| Cash at the beginning of the financial year | (4.9 | ) | 0.2 | 0.2 | 0.2 | — | |||||
| Cash at the end of the financial year | 0.2 | 0.2 | 0.2 | 0.2 | — | ||||||
Source: Department of Treasury and Finance
- Notes:
- (a)
- Variation between 2001-02 Budget and 2002-03 Budget.
- (b)
- Includes payments for land held for resale and research & development costs.
Statement of Cash Flows
Movements in cash flows for the department are consistent with changes highlighted for the Statement of Financial Performance and Statement of Financial Position.
Table 2.8.5: Administered Items Statement
| | 2001-02 Budget | 2001-02 Revised | 2002-03 Budget | Variation(a) | |||||
|---|---|---|---|---|---|---|---|---|---|
| | ($ million) | (%) | |||||||
| Administered revenue | |||||||||
| Appropriations—Payments made on behalf of the State | 4.4 | 4.4 | 4.4 | — | |||||
| Output Appropriation | — | — | — | — | |||||
| Special appropriations | — | — | — | — | |||||
| Resources received free of charge or for nominal consideration | — | — | — | — | |||||
| Sale of goods and services | 0.4 | 0.4 | 0.4 | — | |||||
| Commonwealth grants | — | 0.2 | 0.2 | — | |||||
| Other grants | — | — | 2.8 | — | |||||
| Taxes | — | — | — | — | |||||
| Fines | — | — | — | — | |||||
| Fees | — | — | — | — | |||||
| Other | 0.0 | 0.0 | 0.0 | — | |||||
| Total administered revenue | 4.8 | 5.0 | 7.8 | 64.4 | |||||
| Administered expenses | |||||||||
| Expenses on behalf of the State | — | — | — | — | |||||
| Grants and other payments | 4.4 | 4.4 | 4.4 | — | |||||
| Payments into the Consolidated Fund | 3.0 | 3.4 | 3.4 | 13.7 | |||||
| Total administered expenses | 7.4 | 7.8 | 7.8 | 5.6 | |||||
| Revenue less expenses | (2.7 | ) | (2.8 | ) | — | (100.0 | ) | ||
| Administered assets | |||||||||
| Cash assets | 0.0 | 0.0 | 0.0 | — | |||||
| Receivables | 0.0 | 0.0 | 0.0 | — | |||||
| Other financial assets | — | — | — | — | |||||
| Inventories | — | — | — | — | |||||
| Prepayments | — | — | — | — | |||||
| Property, plant and equipment | — | — | — | — | |||||
| Intangible assets | — | — | — | — | |||||
| Other | — | — | — | — | |||||
| Total administered assets | 0.1 | 0.1 | 0.1 | — | |||||
| Administered liabilities | — | ||||||||
| Payables | — | — | — | — | |||||
| Interest bearing liabilities | — | — | — | — | |||||
| Provisions | — | — | — | — | |||||
| Amounts owing to other departments | — | — | — | — | |||||
| Other | — | — | — | — | |||||
| Total administered liabilities | — | — | — | — | |||||
Source: Department of Treasury and Finance
Authority for Resources
This section provides a summary of the sources of Parliamentary Authority available to the Department to fund the provision of outputs, payments on behalf of State, and additions to the net asset base.
Table 2.8.6: Parliamentary Authority for Resources
| | 2001-02 Budget | 2001-02 Revised | 2002-03 Budget | Variation(a) | |||||
|---|---|---|---|---|---|---|---|---|---|
| | ($ million) | (%) | |||||||
| Annual appropriations(b) | 110.1 | 153.6 | 109.4 | (0.7 | ) | ||||
| Receipts credited to appropriations | — | — | — | — | |||||
| Unapplied previous years appropriation | — | — | — | — | |||||
| Accumulated surplus—previously applied appropriation | — | — | — | — | |||||
| Gross annual appropriation | 110.1 | 153.6 | 109.4 | (0.7 | ) | ||||
| Special appropriations | — | — | — | — | |||||
| Trust funds | 2.5 | 2.5 | 2.5 | (2.6 | ) | ||||
| Total Parliamentary authority | 112.6 | 156.1 | 111.8 | (0.7 | ) | ||||
Source: Department of Treasury and Finance
- Notes:
- (a)
- Variation between 2001-02 Budget and 2002-03 Budget.
- (b)
- 2001-02 Revised includes the impact of approved Treasurer's Advances.
Payments on behalf of State
Payments on behalf of the State are payments made by the Department on behalf of the State Government as a whole and do not directly reflect the operations of the Department. They are usually on-passed or administered by the State.
Table 2.8.7: Payments made on behalf of the State
| Accounts | 2001-02 Budget | 2001-02 Revised | 2002-03 Budget | Variation(a) | ||||
|---|---|---|---|---|---|---|---|---|
| | ($ million) | (%) | ||||||
| Health Benefit Levy transitional payment to Racing Clubs | 4.0 | 4.0 | 4.0 | — | ||||
| Anzac Day administered trust | 0.4 | 0.4 | 0.4 | — | ||||
| Total | 4.4 | 4.4 | 4.4 | — | ||||
Source: Department of Treasury and Finance
Note:
- (a)
- Variation between 2001-02 Budget and 2002-03 Budget.
DEPARTMENT OF TREASURY AND FINANCE
PART 1: OUTLOOK AND OUTPUTS
Overview
In 2002-03 the Department of Treasury and Finance (DTF) will continue to pursue its mission of providing leadership in economic, financial and resource management. This leadership focus is reflected in the Department's three to five year operational objectives of:
- •
- providing sound financial management of the State's fiscal resources with an emphasis on maintenance of a substantial budget surplus;
- •
- guiding Government actions to best increase living standards for all Victorians through the provision of innovative policy advice; and
- •
- championing an integrated whole-of-government approach to ensure optimal service delivery and provision of world class infrastructure to benefit all Victorians.
The cost to Government of outputs provided by DTF is budgeted to fall from $239 million in 2001-02 to $221 million in 2002-03. DTF has been able to deliver its quality outputs at a significantly reduced cost by increasing productivity and efficiency. Internal flexibility in resource management has meant that DTF was able to direct effort from non-policy to policy areas, reflecting the priorities of the Government and the Department's commitment to providing innovative policy advice to Government.
Scope and Coverage
Financial information for DTF includes consolidated information for the following portfolio entities:
- •
- Department of Treasury and Finance and its service agency, the State Revenue Office;
- •
- Essential Services Commission; and
- •
- Office of Gambling Regulation.
Collectively, these entities form the "Department" for the purposes of budget appropriations.
In addition, there are a number of statutory authorities and Government Business Enterprises which, while not directly budget funded and therefore not included in the following financial information, are nevertheless accountable to the Department's four portfolio Ministers; the Treasurer, Minister for Finance, Minister for Gaming and Minister for WorkCover.
Review of 2001-02
In 2001-02, the Department's focus was on the development and implementation of Government policies centred on responsible financial management, promoting growth across the whole State, delivering improved services and restoring democracy.
Key achievements for the year included:
- •
- establishment of the Essential Services Commission;
- •
- relocation of 200 State Revenue Office employees to a new purpose built facility in Ballarat;
- •
- major e-business systems upgrade at the State Revenue Office;
- •
- supporting Government in budget and financial management;
- •
- leading major infrastructure project development across Victoria under Partnerships Victoria, the Government's public private partnerships policy;
- •
- taking a lead role in the three State review of Commonwealth-State financial relations; and
- •
- continuing to provide innovative and accurate policy advice on a range of economic, social and environmental issues including gaming, regulatory, financial and economic policy.
2002-03 Outlook
In 2002-03, DTF will undertake a range of new initiatives and build on key projects and initiatives already underway. In order to achieve its operational objectives, DTF will continue to concentrate its efforts on:
- •
- sound financial management of the State's fiscal resources;
- •
- overseeing the delivery of quality public infrastructure projects;
- •
- driving improvements to financial management practices and compliance across the VPS;
- •
- delivering innovative policy options to Government on a range of economic, financial and social issues;
- •
- preparation for a contestable gas market; and
- •
- leading debate nationally on issues such as Commonwealth-State relations, utilities regulation, insurance policy and regulatory review and refinement.
The Department will continue to deliver its core outputs, including budget development and production, provision of economic and financial policy advice, management of government lands and property, revenue collection and regulation of gaming and the gas and electricity markets in Victoria. Particular attention will be paid to the active management of risks arising from core and other business.
Output Information
The Department has made only one minor change to the output structure for 2002-03 Budget. To reflect changes to the structure of taxation; in particular GST implementation, the output Taxation Compliance Services under Financial Management Services has been deleted. Ongoing compliance activities have been absorbed into the Financial Management, Regulation and Compliance output, within Strategic Policy Advice.
Table 2.9.1: Output summary
| | 2001-02 Budget | 2001-02 Revised | 2002-03 Budget | Variation(a) | |||||
|---|---|---|---|---|---|---|---|---|---|
| | ($ million) | (%) | |||||||
| Strategic Policy Advice | 25.3 | 25.9 | 26.9 | 6.3 | |||||
| Financial Management Services | 21.7 | 22.7 | 18.8 | (13.2 | ) | ||||
| Risk Management Services | 10.0 | 10.5 | 9.7 | (3.6 | ) | ||||
| Reform Services | 1.9 | 2.5 | 2.2 | 15.4 | |||||
| Resource Management Services | 78.9 | 114.5 | 64.2 | (18.6 | ) | ||||
| Regulatory Services | 37.9 | 35.0 | 36.1 | (4.8 | ) | ||||
| Revenue Management Services | 63.3 | 72.9 | 62.8 | (0.8 | ) | ||||
| Total | 239.1 | 284.2 | 220.8 | (7.7 | ) | ||||
Source: Department of Treasury and Finance
Note:
Strategic Policy Advice
These outputs make significant contributions to the three Departmental Objectives of DTF:
- •
- providing sound financial management of the State's fiscal resources with an emphasis on maintenance of a substantial Budget surplus;
- •
- guiding Government actions to best increase living standards for all Victorians through the provision of innovative policy advice; and
- •
- championing an integrated whole of government approach to ensure optimal service delivery and provision of world class infrastructure to benefit all Victorians.
The individual outputs involve the provision of strategic policy advice to Ministers on all aspects of Government activity.
| Major Outputs/Deliverables Performance Measures | Unit of measure | 2000-01 Actuals | 2001-02 Target | 2001-02 Expected Outcome | 2002-03 Target | ||||||
|---|---|---|---|---|---|---|---|---|---|---|---|
| Financial Management Regulation and Compliance—Encourage, promote and enhance sound financial management practices and compliance with legislative and authoritative requirements in the Victorian Public Sector through the maintenance of a cohesive financial management and compliance assurance framework. Provision of advice on whole-of-government financial policy and reporting and Federal taxation issues. | |||||||||||
| Quantity | |||||||||||
| Annual review of Whole-of-Government compliance framework | number | nm | nm | 1—tax framework | 1 | ||||||
| Conduct compliance assurance reviews of portfolios and agencies | number | 20 | nm | 33—tax reviews | 30 | ||||||
| Preparation of quarterly compliance assurance reports | number | nm | nm | 4 | 4 | ||||||
| Conducting awareness programs (eg. Training, briefings) | number | 8 | nm | 8 | 10 | ||||||
| Review and update of knowledge management facility | number | 200 | nm | 250 | 250 | ||||||
| Delivery of updates, guides and newsletters | number | 15 | nm | 20 | 13 | ||||||
| Coordinating external reporting requirements | number | 6 | nm | 6 | 5 | ||||||
| Updates to financial management package | number | 4 | nm | 5 | 8 | ||||||
| Provision of advice on whole-of-government financial policy and reporting and Federal taxation issues | number | 180 | nm | 200 | 180 | ||||||
| Quality | |||||||||||
| Material and adverse whole-of-government issues identified by VAGO and ATO requiring rectification are addressed | yes/no | yes | nm | yes | yes | ||||||
| Service Provision Rating (Ministerial survey data) | per cent | 85 | 80 | 80 | 80 | ||||||
| Monitor and influence the timeliness of departments' statutory lodgement obligations | yes/no | yes | nm | yes | yes | ||||||
| Timeliness | |||||||||||
| Quarterly compliance assurance report delivered | dates | nm | nm | Oct 01 Feb 02 Apr 02 June 02 | 30/09/02 31/12/02 31/03/03 30/06/03 | ||||||
| Cost | |||||||||||
| Total output cost | $ million | 3.8 | 2.9 | 2.6 | 3.1 | ||||||
Strategic Policy and Research—Management and coordination of economic, social and environmental research focusing on developing greater understanding of factors affecting future living standards for Victorians. | |||||||||||
| Quantity | |||||||||||
| Development and implementation of a program of long-term strategic research and policy projects | number | 1 | nm | 7 | 4 | ||||||
| Quality | |||||||||||
| Service Provision Rating (Ministerial survey data) | per cent | 85 | 80 | 80 | 80 | ||||||
| Timeliness | |||||||||||
| Key deliverables and projects managed on time—in line with planned and project timetables agreed by Minister | per cent | 70 | 100 | 90 | 100 | ||||||
| Cost | |||||||||||
| Total output cost | $ million | 0.5 | 1.4 | 1.7 | 2.5 | ||||||
Financial and Risk Management Policy Advice—Provision of financial and risk management advice to government to ensure responsible financial management associated with Public Sector superannuation and investments. | |||||||||||
| Quantity | |||||||||||
| Letters of correspondence prepared | number | nm | nm | 40 | 40 | ||||||
| For superannuation schemes impacted by family law changes: | number | nm | nm | nm | 4 | ||||||
| • Enact state laws to ensure consistency with Commonwealth laws; and | |||||||||||
| • Ensure operational compliance | |||||||||||
| Review of funds in accordance with new Prudential statement for Public Sector Investments | number | nm | nm | nm | 8 | ||||||
| Superannuation liability/expense revisions | number | 5 | nm | 5 | 5 | ||||||
| Quality | |||||||||||
| Service Provision Rating (Ministerial survey data) | per cent | 83 | 80 | 80 | 80 | ||||||
| Timeliness | |||||||||||
| Delivery of: | |||||||||||
| • Prudential Statement operational changes | date | nm | nm | nm | Sept 2002 | ||||||
| • Family law operational changes | date | nm | nm | nm | Oct 2002 | ||||||
| • Review of Family Law effectiveness | date | nm | nm | nm | Mar 2003 | ||||||
| Cost | |||||||||||
| Total output cost | $ million | 16.9 | (a) | 1.1 | 1.3 | 1.6 | |||||
Economic, Regulatory, Environmental and Social Policy Advice—Economic, social and environmental analysis, ad-hoc and policy advice, and monitoring for Treasurer and Ministers. | |||||||||||
| Quantity | |||||||||||
| Ministerial briefs on economic, regulatory, social and environmental issues | number | nm | nm | 220 | 180 | ||||||
| Victorian Economic News | number | 4 | 4 | 4 | 4 | ||||||
| Macroeconomic forecast updates | number | 5 | 4 | 4 | 4 | ||||||
| Economic policy briefings on Cabinet submissions | number | 532 | 250 | 160 | 160 | ||||||
| Ministerial correspondence on economic, regulatory, environmental and social policy issues | number | 14 | 60 | 60 | 60 | ||||||
| Quarterly Investment Cabinet Submission | number | nm | nm | 3 | 4 | ||||||
| NCP Third Tranche Assessment | number | nm | nm | 1 | 1 | ||||||
| Quality | |||||||||||
| Service Provision Rating (Ministerial survey data) | per cent | 82 | 80 | 80 | 80 | ||||||
| Timeliness | |||||||||||
| Briefings on key ABS economic data on day of release | per cent | nm | nm | 99 | 98 | ||||||
| Publication of Victorian Economic News according to timetable | number of working days | nm | nm | within 15 working days of qtr end | within 15 working days of qtr end | ||||||
| Briefing on Cabinet submission before meetings | per cent | nm | nm | 98 | 95 | ||||||
| Cost | |||||||||||
| Total output cost | $ million | 4.9 | (b) | 3.8 | 3.6 | 4.3 | |||||
Inter Government Financial Relations Policy Advice—Inter-government financial analysis and advice to Ministers in relation to sharing of Commonwealth funding with other States and Territories. | |||||||||||
| Quantity | |||||||||||
| Completion of government response to 3 State HFE Review Report | number | nm | nm | nm | 1 | ||||||
| Support Ministerial Council Meetings | number | 1 | 2 | 1 | 1 | ||||||
| Support Heads of Treasuries meetings | number | 3 | 4 | 3 | 3 | ||||||
| Input to Commonwealth Grants Commission 2004 Review (papers and CGC visit to Victoria) | number | nm | nm | 1 | 1 | ||||||
| SPP and other intergovernmental issues briefs | number | 12 | 12 | 16 | 16 | ||||||
| Quality | |||||||||||
| Service Provision Rating (Ministerial survey data) | per cent | 90 | 85 | 85 | 80 | ||||||
| Informed dialogue with CGC—acceptance of arguments put forward by Victoria | yes/no | nm | nm | nm | yes | ||||||
| Timeliness | |||||||||||
| Briefings for interstate meetings completed in time and CGC submissions provided according to CGC schedule | yes/no | nm | nm | yes | yes | ||||||
| Cost | |||||||||||
| Total output cost | $ million | 1.4 | 1.7 | 2.0 | 1.5 | ||||||
Taxation (State Revenue) Policy Advice—Taxation policy advice to Ministers on the composition and performance of all the State's taxes and on opportunities to improve the State's tax mix. | |||||||||||
| Quantity | |||||||||||
| Provision of Ministerial Briefs on taxation policy | number | 18 | 30 | 30 | 30 | ||||||
| Compilation of revenue initiatives proposal for 2003-4 budget consideration (ERC 1 and ERC 2 submissions) | number | nm | nm | 2 | 2 | ||||||
| Quality | |||||||||||
| Service Provision Rating (Ministerial survey data) | per cent | 92 | 80 | 80 | 80 | ||||||
| Brief recommendations accepted by Treasurer | per cent | nm | nm | 80 | 80 | ||||||
| Comment provided on SRO Ministerial briefs | per cent | nm | nm | 95 | 95 | ||||||
| Timeliness | |||||||||||
| Budget submissions meet ERC deadlines | yes/no | nm | nm | yes | yes | ||||||
| PPQs on taxation issues provided according to schedule | per cent | nm | nm | 95 | 95 | ||||||
| Cost | |||||||||||
| Total output cost | $ million | 3.1 | 1.3 | 1.3 | 1.0 | ||||||
Budget Formulation Advice—Advice to Ministers and the ERC with respect to the allocation of resources in the annual State Budget, including the alignment of its outputs purchases, investment decisions and payments on behalf of the State. | |||||||||||
| Quantity | |||||||||||
| Expenditure Review Committee briefs | number | 81 | 100 | 120 | 100 | ||||||
| Delivery of budget formulation advice through Cabinet and Sub-Committee briefs | number | 445 | 600 | 500 | 600 | ||||||
| Delivery of budget formulation advice through Ministerial briefs (related to Budget issues) | number | 206 | 200 | 200 | 200 | ||||||
| Quality | |||||||||||
| Service Provision Rating (Ministerial survey data) | per cent | 90 | 80 | 80 | 80 | ||||||
| Portfolio Ministers' satisfaction with Expenditure Review Committee briefs | per cent | nm | nm | 80 | 80 | ||||||
| Timeliness | |||||||||||
| Delivery of briefs in accordance with to agreed timelines | per cent | 100 | 100 | 100 | 100 | ||||||
| Cost | |||||||||||
| Total output cost | $ million | 3 | 2.9 | 3.4 | 3.2 | ||||||
Gaming Policy Advice—The provision of innovative and strategic policy advice to the Minister for Gaming on all aspects of gaming with a focus on developing responsible gaming policies and practices. | |||||||||||
| Quantity | |||||||||||
| Briefings on gambling policy issues | number | 68 | 30 | 55 | 33 | ||||||
| Ministerial correspondence on Gaming Policy | number | 124 | 200 | 170 | 200 | ||||||
| Ministerial Council of Gaming Ministers (Meetings) | number | 2 | 2 | 1 | 2 | ||||||
| Briefings for the Australian Gambling Research Secretariat | number | nm | nm | 8 | 20 | ||||||
| Consultation meetings with key stakeholders including industry and community groups | number | nm | nm | 10 | 10 | ||||||
| Quality | |||||||||||
| Service Provision Rating (Ministerial survey data) | per cent | 70 | 80 | 80 | 80 | ||||||
| Timeliness | |||||||||||
| Key Cabinet submissions are provided to Minister within agreed timeframes. | per cent | 80 | 100 | 100 | 100 | ||||||
| Cost | |||||||||||
| Total output cost | $ million | 4 | 1.6 | 1.1 | 1.5 | ||||||
Statutory Insurance Advice—Involves the provision of strategic advice to Government on the State's insurance schemes with a particular emphasis on securing the long-term viability of WorkCover and the Transport Accident Commission; advice and management support for Government responses to current general insurance issues impacting on the Victorian community. It also includes ensuring financial responsibility by developing and monitoring the prudential and reporting frameworks to contribute to the management of State owned insurance and compensation institutions as well as trustee companies and cooperative societies. | |||||||||||
| Quantity | |||||||||||
| Quarterly reviews of financial and performance reports of the Victorian WorkCover Authority, the Transport Accident Commission and the Victorian Managed Insurance Authority (agencies) | number | 4 | 4 | 4 | 12 | (c) | |||||
| Annual review of returns and prudential framework for trustee companies and co-operative housing societies | number | nm | nm | 1 | 1 | ||||||
| DTF participation in working groups with agencies affecting each of the statutory insurance schemes' viability and product delivery | number | nm | nm | 5 | 5 | ||||||
| Briefings on insurance policy matters | number | nm | nm | 55 | 48 | ||||||
| Funding agreement established for VWA's public safety inspection and prevention activities | number | nm | 1 | 1 | 1 | ||||||
| Quality | |||||||||||
| Service Provision Rating (Ministerial survey data) | per cent | 100 | 80 | 85 | 80 | ||||||
| Service Provision Rating (Agency (VWA, TAC, VMIA) survey data) | per cent | nm | nm | 75 | 75 | ||||||
| Timeliness | |||||||||||
| Delivery of quarterly reviews to Ministers within 6 weeks of end quarter | per cent | nm | nm | 100 | 100 | ||||||
| Response to briefing requests and correspondence within 10 days of request | per cent | nm | nm | 80 | 80 | ||||||
| Cost | |||||||||||
| Total output cost | $ million | 0.8 | 8.6 | 8.9 | 8.2 | ||||||
Source: Department of Treasury and Finance
Notes:
- (a)
- Includes Superannuation Reform cost of $15.9 million.
- (b)
- Only briefings on economic policy are now counted whereas comments were also counted in previous years.
- (c)
- Three reports (one for each agency) completed per quarter.
Financial Management Services
These outputs make significant contributions to the following Departmental Objectives:
- •
- providing sound financial management of the State's fiscal resources with an emphasis on maintenance of a substantial Budget surplus; and
- •
- championing an integrated whole of government approach to ensure optimal service delivery and provision of world-class infrastructure to benefit all Victorians.
The individual outputs involve the provision of financial management services to government departments, agencies and Government Business Enterprises including—financial accounting and reporting; managing and forecasting cash balances and central Government cash transactions; assessing and processing unclaimed moneys claims; managing Government liabilities with the objective of reducing State debt; managing various State-based taxes; and reviewing and analysing performance of departments with a focus on delivering value for money services to the community.
| Major Outputs/Deliverables Performance Measures | Unit of measure | 2000-01 Actuals | 2001-02 Target | 2001-02 Expected Outcome | 2002-03 Target | ||||||
|---|---|---|---|---|---|---|---|---|---|---|---|
| Financial Reporting and Control—Reporting and monitoring of financial performance in the Victorian Public Sector, management of the daily cash requirements including investments and borrowings of Public Account and administration of the Unclaimed Moneys Act 1962 including the assessment and processing of unclaimed moneys claims. | |||||||||||
| Quantity | |||||||||||
| Weekly monitoring of the daily and monthly Public Account cash forecasts from departments against actual revenue and expenditure flows. Reporting the accuracy of those forecasts back to departments on a monthly basis | weeks | 52 | 52 | 52 | 52 | ||||||
| Annual Financial Report (AFR) | number | 1 | 1 | 1 | 1 | ||||||
| Mid Year Financial Report | number | 1 | 1 | 1 | 1 | ||||||
| Quarterly Financial Reports | number | 4 | 4 | 4 | 4 | ||||||
| Unclaimed Moneys claims: ensuring projected number of processed per year is met | number | 5 182 | 6 300 | 5 800 | 5 800 | ||||||
| Quality | |||||||||||
| Manage the Public Account set-off pool average daily balances to be <$8m per annum | $ million | 4.7 | <10 | 6.9 | <8 | ||||||
| Unclaimed Moneys: Customer satisfaction with services delivery | per cent | 95 | 95 | 95 | 95 | ||||||
| Acceptable (no material weaknesses in financial systems and reporting) Annual Financial Report audit opinion by the Auditor-General | number yes/no | yes | Yes | yes | yes | ||||||
| Unclaimed Moneys: Compliance with procedures for processing and assessing unclaimed money claims | per cent | 100 | Nm | 100 | 100 | ||||||
| Timeliness | |||||||||||
| Daily management of the Public Account bank account and set-off pool balances. | daily | daily | Daily | daily | daily | ||||||
| Mid Year Financial Report | date | 15/03/01 | 15/03/02 | 15/03/02 | 15/03/03 | ||||||
| Annual Financial Report | date | 27/10/00 | 27/10/01 | 27/10/01 | 27/10/02 | ||||||
| Unclaimed Moneys: Verified claims processed within a target period | working days | 3-5 | 3-5 | 3-5 | 3-5 | ||||||
| Quarterly Financial Reports | date | 24/11/01 15/3/01 15/3/01 | 27/10/01 30/11/01 15/03/02 31/05/02 | 27/10/01 15/11/01 15/03/02 15/05/02 | 27/10/02 15/11/02 15/03/03 15/05/03 | ||||||
| Cost | |||||||||||
| Total output cost | $ million | 4.9 | 7 | 8.3 | 7.5 | ||||||
Financial Assets and Liabilities Management Services—Management of the State's financial assets and liabilities (debt) and the development of asset-liability management principles and initiatives, with the objective of maintaining the State's liabilities at prudent levels and the retention of a triple-A credit rating. In addition, the management of the whole-of-government banking contract promotes cost efficiencies in transactional banking and improves returns on financial assets. | |||||||||||
| Quantity | |||||||||||
| Manage the review process for the State's credit rating | number | 2 | nm | 2 | 2 | ||||||
| Monitor and review the Budget Sector Debt Portfolio | number | nm | nm | 11 | 11 | ||||||
| Monitor and review the investment performance of the Budget Sector Long Term Fund (BSLTF) | number | nm | nm | 22 | 22 | ||||||
| Review investment mandate for the BSLTF | number | nm | nm | 2 | 2 | ||||||
| Review of Cash and Banking contract performance | number | nm | nm | 16 | 16 | ||||||
| Loan Council reporting requirements | number | 4 | 4 | 4 | 4 | ||||||
| Quality | |||||||||||
| Stakeholder satisfaction with the whole-of-government Cash and Banking Contract | per cent | nm | nm | 70 | 70 | ||||||
| Timeliness | |||||||||||
| Preparation and delivery of required information to rating agencies to meet their timelines | yes/no | yes | nm | yes | yes | ||||||
| Review of BSLTF investment mandate within eight weeks of release of Budget and Mid Year Budget Update | yes/no | nm | nm | yes | yes | ||||||
| Cost | |||||||||||
| Total output cost | $ million | 1.1 | 1.7 | 2.2 | 0.9 | ||||||
Taxation (State Revenue) Monitoring and Forecasting Services—Monitoring and forecasting of the various state-based taxes which provide revenue to the State. | |||||||||||
| Quantity | |||||||||||
| State taxes monitored and forecast | number | 24 | 26 | 26 | 26 | ||||||
| State Treasuries Tax Forecasting Group meeting | number | 1 | 1 | 1 | 1 | ||||||
| Ministerial briefings | number | nm | nm | 4 | 4 | ||||||
| Quality | |||||||||||
| Service Provision Rating (Ministerial survey data) | per cent | 80 | 85 | 80 | 80 | ||||||
| Significant weaknesses in tax monitoring and forecasting reported by AG and Internal Auditors | number | nil | nil | nil | nil | ||||||
| Accuracy of estimating quarterly taxation revenue | per cent | nm | within 10 | % | +4 | % | within 10 | % | |||
| Accuracy of estimating state taxation revenue (budget to AFR) | per cent | 6.9 | within 5 | % | +9 | % | within 5 | % | |||
| Timeliness | |||||||||||
| Meet FES update deadlines | per cent | nm | nm | 100 | 100 | ||||||
| Coordinate State Treasuries Tax Forecasting Group Meeting according to timetable | date | May 2001 | Sept 2001 | Oct 2001 | Oct 2002 | ||||||
| Cost | |||||||||||
| Total output cost | $ million | 0.6 | 0.7 | 0.7 | 0.6 | ||||||
Budget Development and Production—Provision of advice to Ministers and the Expenditure Review Committee on the State's financial strategy, including development and co-ordination of the Budget decision making framework. Production and publication of the State Budget and budget related documents. | |||||||||||
| Quantity | |||||||||||
| Budget | number | 1 | 1 | 1 | 1 | ||||||
| Budget update | number | 1 | 1 | 1 | 1 | ||||||
| Quality | |||||||||||
| Service Provision Rating (Ministerial survey data) | per cent | 88 | 80 | 80 | 80 | ||||||
| Positive review by Auditor-General under s16(b) of Audit Act | yes/no | yes | yes | yes | yes | ||||||
| Timeliness | |||||||||||
| Annual Budget published by date agreed by Treasurer | yes/no | yes | yes | yes | yes | ||||||
| Budget Update published by 15 January | yes/no | yes | yes | yes | yes | ||||||
| Cost | |||||||||||
| Total output cost | $ million | 4.7 | 4.9 | 4.7 | 4.5 | ||||||
Portfolio Performance Review—Advice to Ministers and the Expenditure Review Committee on departmental financial, output and asset investment performance, the revenue to be paid for the provision of outputs and information and advice on budget risks, service delivery and strategic issues. | |||||||||||
| Quantity | |||||||||||
| Quarterly Output Performance and Certification report per portfolio. | number | 35 | 36 | 36 | 40 | ||||||
| Output Evaluation and Price Reviews | number | nm | nm | 11 | 11 | ||||||
| Quality | |||||||||||
| Service Provision Rating (Ministerial survey data) | per cent | 93 | 80 | 80 | 80 | ||||||
| Portfolio Ministers' satisfaction with Expenditure Review Committee briefs and reports | per cent | 93 | 90 | 90 | 80 | ||||||
| Timeliness | |||||||||||
| Quarterly certifications provided to the Minister 20 working days after the quarter | per cent | 94 | 100 | 100 | 100 | ||||||
| Output Evaluation and Price Reviews completed by agreed dates | per cent | nm | nm | 100 | 100 | ||||||
| Cost | |||||||||||
| Total output cost | $ million | 2.4 | 3.5 | 4.2 | 4.0 | ||||||
GBE Performance Monitoring Services—Provide advice and undertake monitoring and governance activities to ensure GBEs (and PFIs where appropriate) are operating at service standards sufficient to improve the satisfaction levels of all of their customers within financial risk parameters acceptable to the Government, and providing an adequate return to Government for the capital invested in them. | |||||||||||
| Quantity | |||||||||||
| GBE corporate plans reviewed and assessed | number | 18 | 16 | 16 | 19 | ||||||
| Analysis of GBE quarterly performance reports | number | 18 | 16 | 16 | 72 | (a) | |||||
| GBE Annual Reports tabled | number | 13 | 9 | 9 | 9 | ||||||
| Board appointments to relevant GBEs | number | 31 | 31 | 31 | 10 | (b) | |||||
| GBE policy advice (including Cabinet Submissions) provided as required | number | nm | nm | 30 | 30 | ||||||
| GBE dividends negotiated | number | 26 | 26 | 26 | 26 | ||||||
| Monitoring and Assessing Public Authority Income | number | 10 | 10 | 10 | 10 | ||||||
| Monthly cash flow and receivables forecasting | number | 12 | 12 | 12 | 12 | ||||||
| Quality | |||||||||||
| Service Provision Rating (Ministerial survey data) | per cent | 90 | 80 | 80 | 80 | ||||||
| Timeliness | |||||||||||
| Analysis and review of corporate plans, quarterly performance reports and GBE policy advice provided to agreed schedule | per cent | 90 | 90 | 90 | 90 | ||||||
| Target dates met for GBE dividend payments | per cent | 100 | 100 | 100 | 100 | ||||||
| Cost | |||||||||||
| Total output cost | $ million | 1.6 | 1.3 | 1.4 | 1.3 | ||||||
Source: Department of Treasury and Finance
- (a)
- Eighteen reports (one for each GBE) completed per quarter.
- (b)
- This is down compared to 31 in 2001-02 due to the cyclic timing of board appointments and retirement of board members.
Risk Management Services
These outputs make significant contributions to the following Departmental Objectives:
- •
- providing sound financial management of the State's fiscal resources with an emphasis on maintenance of a substantial Budget surplus; and
- •
- championing an integrated whole of government approach to ensure optimal service delivery and provision of world-class infrastructure to benefit all Victorians.
The individual outputs involve the development and monitoring of prudential frameworks to contribute to the management of the State's financial institutions as well as trustee companies and cooperative societies as well as provision of project risk advice on infrastructure and other partnership models.
| Major Outputs/Deliverables Performance Measures | Unit of measure | 2000-01 Actuals | 2001-02 Target | 2001-02 Expected Outcome | 2002-03 Target | |||||
|---|---|---|---|---|---|---|---|---|---|---|
| Infrastructure Project Management—Provision of policy, risk and project management advice on public infrastructure and other partnership projects where there is "private sector investment". | ||||||||||
| Quantity | ||||||||||
| Develop new and revise existing Partnerships Victoria guidelines | number | nm | nm | 2 | 6 | |||||
| Provision of commercial and risk management advice on public private partnership (and other) projects to facilitate new infrastructure and minimise government's exposure to risk(a) | number of milestones | 24 | 65 | 72 | 150 | |||||
| Education of officers responsible for infrastructure projects through delivery of training forums | number | nm | nm | nm | 8 | |||||
| Regular review of existing public private partnership (and other) contracts for both service performance and fiscal management | number | nm | nm | nm | 20 | |||||
| Provision of commercial risk management advice on privately initiated projects or business strategies | number of milestones | nm | nm | nm | 8 | |||||
| Quality | ||||||||||
| Service Provision Rating (Ministerial survey data) | per cent | 87 | 80 | 80 | 80 | |||||
| Department and Agency satisfaction | per cent | nm | nm | nm | 85 | |||||
| Timeliness | ||||||||||
| Provision of initial advice within two working days | per cent | nm | 80 | 80 | 90 | |||||
| Provision of detailed advice within 10 working days | per cent | nm | 80 | 80 | 90 | |||||
| Cost | ||||||||||
| Total output cost | $ million | 3.8 | 5.5 | 7.0 | 6.6 | |||||
Commercial Project and Risk Management—Management of the State's post-reform residual entities, its direct contractual obligations, and contingent liabilities to protect its financial and commercial advantage, and to minimise its attendant risks. | ||||||||||
| Quantity | ||||||||||
| Undertake additional unforeseen projects as requested by Ministers during the year | number | nm | nm | 2 | 2 | |||||
| Resolution of residual gas interests | number | nm | nm | 1 | 1 | |||||
| Deliver on DTF responsibilities in wind-up of PTC | number | nm | nm | nm | 1 | |||||
| Termination of Structured Finance transactions, removing or minimising contingent liabilities of the State in a cost effective manner | number completed | nm | nm | 2 | 1 | |||||
| Processing of financial accommodation requests | number | nm | nm | 12 | 12 | |||||
| Advice on, and promulgation of, commercial and financial principles and expertise | number of reviews completed | nm | nm | 1 | 1 | |||||
| Advice to Treasurer and DNRE to assist with the implementation of the Government Forest strategy | strategy completed | nm | nm | nm | 1 | |||||
| Quality | ||||||||||
| Service Provision Rating (Ministerial survey data) | per cent | 83 | 80 | 80 | 80 | |||||
| Timeliness | ||||||||||
| Delivery of projects to agreed deadlines (or renegotiated deadlines where impacted by external factors) | per cent | 85 | 90 | 90 | 90 | |||||
| Timely completion of financial accommodation requests | per cent | nm | nm | 75 | 75 | |||||
| Cost | ||||||||||
| Total output cost | $ million | 4.7 | 3.7 | 2.5 | 1.9 | |||||
Prudential Supervision—Management of the State's exposure to the financial risks arising from the activities of the State's public financial institutions (PFIs) through the implementation of a prudential supervision framework around the activities of the PFIs. | ||||||||||
| Quantity | ||||||||||
| Reports on the prudential compliance and performance of Public Financial Institutions to the Balance Sheet Management Committee | number | 16 | nm | 16 | 16 | |||||
| Key meetings held with the Prudential Auditor and Prudential Supervisor | number | 8 | nm | 8 | 8 | |||||
| Review of prudential supervision frameworks | number | nm | nm | nm | 1 | |||||
| Review of corporate plans of the Public Financial Institutions | number | 3 | nm | 3 | 3 | |||||
| Quality | ||||||||||
| Service Provision Rating (Ministerial survey data) | per cent | 100 | 80 | 80 | 80 | |||||
| Timeliness | ||||||||||
| Prepare Treasurer's response to the Public Financial Institutions on their corporate plans | date | Nov | nm | 31 July | 31 July | |||||
| Key meetings held with Prudential Auditor and Prudential Supervisor within 45 days of the end of the quarter | yes/no | nm | nm | yes | yes | |||||
| Cost | ||||||||||
| Total output cost | $ million | 8.4 | 0.8 | 1.0 | 1.2 | |||||
Source: Department of Treasury and Finance
Note:
- (a)
- There is a direct correlation between project milestones and the quality and quantity of advice provided. Advice to Government drives the progression of projects which in turn is tracked by the achievement of key milestones.
Reform Services
This output contributes to the following Departmental Objectives:
| Major Outputs/Deliverables Performance Measures | Unit of measure | 2000-01 Actuals | 2001-02 Target | 2001-02 Expected Outcome | 2002-03 Target | |||||
|---|---|---|---|---|---|---|---|---|---|---|
| Resource Management Reform—Advice to the Minister for Finance and the Treasurer regarding ongoing improvements in the resource management of the Victorian Public Sector. Implementation of endorsed management reforms. | ||||||||||
| Quantity | ||||||||||
| Major policy reviews and refinements | number | 4 | 4 | 3 | 3 | |||||
| ERC reports on progress against departmental and whole-of-government Management Reform Program (MRP) improvement strategies | number | 0 | 4 | 4 | 4 | |||||
| Documented case studies on MRP principles/practices applied | number | 0 | 6 | 4 | 4 | |||||
| Updates of Budget and Financial Management Guide | number | 0 | nm | 4 | 4 | |||||
| Quality | ||||||||||
| Stakeholder satisfaction with Guidance material (intranet site) as per evaluation rating | per cent | nm | nm | >75 | >75 | |||||
| Measurable improvements in knowledge/understanding of the reform framework by all stakeholders (over June 2000 benchmark) | per cent | 25 | >50 | >50 | >55 | |||||
| Timeliness | ||||||||||
| Delivery of policy advice in accordance with agreed timelines | per cent | nm | nm | >66 | >70 | |||||
| ERC reports on progress against departmental and whole-of-government improvement strategies | date | nm | end of mth after quarter | end of mth after quarter | end of mth after quarter | |||||
| Documented case studies on MRP principles/practices completed and launched | date | nm | nm | May 2002 and Jun 2002 | Jun 2003 | |||||
| Cost | ||||||||||
| Total output cost | $ million | 2.6 | 1.9 | 2.5 | 2.2 | |||||
Source: Department of Treasury and Finance
Resource Management Services
These outputs contribute to the "providing sound financial management of the State's fiscal resources with an emphasis on maintenance of a substantial Budget surplus" Departmental Objectives:
The individual outputs involve the administration and coordination of government lands and property; accommodation for government departments; procurement and purchasing procedures with department and agencies with the Victorian Government Purchasing Board; and the management of leased buildings and motor vehicles for government departments.
| Major Outputs/Deliverables Performance Measures | Unit of measure | 2000-01 Actuals | 2001-02 Target | 2001-02 Expected Outcome | 2002-03 Target | ||||||
|---|---|---|---|---|---|---|---|---|---|---|---|
| Procurement Services—Management, development and co-ordination of Victorian procurement and contracting procedures in collaboration with the VGPB, departments and agencies. | |||||||||||
| Quantity | |||||||||||
| Establishment or renewal of whole of government contracts | number | 3 | nm | 6 | 3 | ||||||
| Analysis of purchasing recommendations for VGPB | number | nm | nm | 150 | 100 | ||||||
| VGPB meetings supported | number | nm | nm | 11 | 11 | ||||||
| Hits on Procurement websites (eg VGPB, contracts publishing and tenders) | number | 512 000 | nm | 500 000 | 500 000 | ||||||
| Completion of coordination of EC4P project | number | nm | nm | nm | 1 | ||||||
| Ministerial briefings on emerging issues | number | nm | nm | nm | 5 | ||||||
| Participants attending procurement and contracting training | number | 466 | nm | 599 | 650 | ||||||
| Quality | |||||||||||
| Service Provision Rating (Ministerial survey data) | per cent | 75 | 85 | 80 | 80 | ||||||
| VGPB satisfaction with secretariat, process analysis and policy support services | per cent | nm | nm | nm | 80 | ||||||
| APU satisfaction with services provided | per cent | nm | nm | nm | 75 | ||||||
| Participants satisfaction with training programs | per cent | nm | nm | 84 | 80 | ||||||
| Timeliness | |||||||||||
| VGPB papers distributed 4 business days prior to meeting | per cent | nm | nm | nm | 100 | ||||||
| Completion of coordination of EC4P project | date | nm | nm | nm | Sept 2002 | ||||||
| Cost | |||||||||||
| Total output cost | $ million | 3.9 | 4.3 | 5.0 | 4.4 | ||||||
Government Accommodation Services—Administration, coordination and management of accommodation for government departments. | |||||||||||
| Quantity | |||||||||||
| Total office area managed | square metres | 420 000 | 420 000 | 449 000 | 449 000 | ||||||
| Workspace ratio | Square metre per FTE | 16.8 | nm | 15.5 | 15 | ||||||
| Total accommodation cost | $ per square metre per annum | nm | nm | 280 | 280 | ||||||
| Quality | |||||||||||
| Client department's satisfaction with office accommodation services | per cent | 78 | 70 | 70 | 80 | ||||||
| Service Provision Rating (Ministerial survey data) | per cent | nm | nm | 85 | 80 | ||||||
| Office accommodation occupancy | per cent | 97 | 95 | 95 | 95 | ||||||
| Timeliness | |||||||||||
| Delivery of office approved Government accommodation projects to agreed timeframes | per cent | 100 | 90 | 90 | 100 | ||||||
| Cost | |||||||||||
| Total output cost | $ million | 31.3 | 38.7 | 33.0 | 35.2 | ||||||
Government Land and Property Services—Administration, coordination and management of government lands and property including disposal of surplus government land/property and acquisition of lands to be held in Crown ownership or freehold title on behalf of other agencies. | |||||||||||
| Quantity | |||||||||||
| Implementation of Government policy on land and property management | per cent | 100 | 90 | 90 | 90 | ||||||
| Revenue from sale of surplus Government land including Crown land (DTF Portfolio) | $ million | 54.4 | 40 | 40 | 50 | (a) | |||||
| Properties estimated to be acquired on behalf of Government | number | 23 | nm | 21 | 12 | ||||||
| Quality | |||||||||||
| Service Provision Rating (Ministerial survey data) | per cent | 88 | 90 | 80 | 80 | ||||||
| Timeliness | |||||||||||
| The delivery of property facilitation and acquisition projects on time | per cent | nm | nm | 80 | 100 | ||||||
| Cost | |||||||||||
| Total output cost | $ million | 6.2 | 5.8 | 5.7 | 6.0 | ||||||
Management of Motor Vehicle Leases—Coordination and management of leased motor vehicles for government departments. | |||||||||||
| Quantity | |||||||||||
| Number of government motor vehicles financed under a central management | number | 7 891 | 8 000 | 8,200 | 8 000 | ||||||
| Environmental initiatives implemented in the Government motor vehicle fleet | number | 2 | 2 | 2 | 2 | ||||||
| Quality | |||||||||||
| Departmental clients satisfied with fleet financing arrangements. | per cent | 25 | 75 | 70 | 75 | ||||||
| Service Provision Rating (Ministerial survey data) | per cent | nm | nm | nm | 80 | ||||||
| Benchmarks in fleet financing and management met or exceeded(b) | per cent | nm | nm | nm | 70 | ||||||
| Timeliness | |||||||||||
| Fleet invoicing completed within 3 days of the due date each month | per cent | 100 | 100 | 90 | 90 | ||||||
| Cost | |||||||||||
| Total output cost | $ million | 117.4 | (c) | 30 | 71.6 | 18.6 | (d) | ||||
Source: Department of Treasury and Finance
Notes:
- (a)
- $30 million sold on behalf of DTF and an additional $20 million of surplus land to be sold on behalf of agencies.
- (b)
- Benchmarks to be developed in first quarter.
- (c)
- Includes $90.8 million of one off expenses incurred because of the introduction of GST and removal of wholesale sales tax.
- (d)
- The cost has been revised to remove motor vehicle leasing expenses already allocated to all Departments outputs.
Regulatory Services
These outputs contribute to the following two Departmental Objectives:
- •
- guiding Government actions to best increase living standards for all Victorians through the provision of innovative policy advice; and
- •
- championing an integrated whole of government approach to ensure optimal service delivery and provision of world class infrastructure to benefit all Victorians.
The individual outputs involve the regulation of gaming and utilities in Victoria.
| Major Outputs/Deliverables Performance Measures | Unit of measure | 2000-01 Actuals | 2001-02 Target | 2001-02 Expected Outcome | 2002-03 Target | |||||
|---|---|---|---|---|---|---|---|---|---|---|
| Regulation of Gambling—Monitoring and regulation of gaming activities in Victoria. | ||||||||||
| Quantity | ||||||||||
| Licences | number | 17 412 | 22 173 | 15 840 | 17 505 | |||||
| Compliance Services (audits, inspections, investigation, revenue verification, operator procedures and rule approvals) | number | 9 748 | 7 745 | 11 600 | 7 649 | |||||
| Quality | ||||||||||
| Licences—licences cancelled following disciplinary action as a proportion of active licences | per cent | <0.1 | <0.1 | <0.1 | <0.1 | |||||
| Compliance Services—accuracy of compliance activities | per cent | 100 | 100 | 100 | 100 | |||||
| Timeliness | ||||||||||
| Licences—processed within target time | per cent | 95 | 80 | 90 | 80 | |||||
| Compliance services—performed within target time | per cent | nm | 95 | 100 | 90 | |||||
| Cost | ||||||||||
| Total output cost | $ million | 14.6 | 17.3 | 17.9 | 17.7 | |||||
Economic Regulatory Services—Regulation of utilities in Victoria. | ||||||||||
| Quantity | ||||||||||
| Preparation for a contestable gas market | number | 1 | 1—electricity | 1—electricity | 1 | |||||
| Company performance reviews and audits | number | 14 | 26 | 26 | 28 | |||||
| New or revised Regulatory Guidelines | number | 6 | 6 | 6 | 4 | |||||
| Industry Performance Reports | number | nm | nm | 3 | 6 | |||||
| Price Approvals/Reviews | number | 4 | 22 | 19 | 19 | |||||
| New/Amended Licences | number | nm | 10 | 10 | 5 | |||||
| Ministerial and regulatory responses | number | nm | nm | 4 | 3 | |||||
| Quality | ||||||||||
| Regulatory decisions upheld | per cent | 98 | 80 | 80 | 80 | |||||
| Timeliness | ||||||||||
| Deadlines met for major milestones | per cent | 100 | 95 | 95 | 95 | |||||
| Cost | ||||||||||
| Total output cost | $ million | 13.9 | 20.6 | 17.2 | 18.4 | |||||
Source: Department of Treasury and Finance
Revenue Management Services
This output contributes to the "providing sound financial management of the State's fiscal resources with an emphasis on maintenance of a substantial Budget surplus" Departmental Objectives.
| Major Outputs/Deliverables Performance Measures | Unit of measure | 2000-01 Actuals | 2001-02 Target | 2001-02 Expected Outcome | 2002-03 Target | |||||
|---|---|---|---|---|---|---|---|---|---|---|
| Revenue Management Services to Government—The provision of revenue management services across the various State based taxes in a fair and efficient manner for the benefit of all Victorians. | ||||||||||
| Quantity | ||||||||||
| Revenue collected between agreed budget target | per cent | +7.46 | +/- 5 | +13 | (a) | +/- 5 | ||||
| Refunds and Rebates issued within KPI | per cent | nm | nm | >95 | >95 | |||||
| Revenue banked on day of receipt | per cent | 99 | 99 | >99 | >99 | |||||
| Investigation completed of identified high risks according to plan | per cent | nm | nm | nm | >90 | |||||
| Quality | ||||||||||
| Risk moderation strategy implemented against identified risk | per cent | nm | nm | nm | >90 | |||||
| Customer satisfaction level | per cent | 98.3 | >75 | >75 | >75 | |||||
| Maintain ISO 9001 Certification | yes/no | yes | yes | yes | yes | |||||
| Ratio of outstanding debt to total revenue | per cent | 1.45 | <2 | <2 | <2 | |||||
| Timeliness | ||||||||||
| Revenue received within three business days of due date | per cent | 97 | >90 | >90 | >90 | |||||
| Meet Cabinet and Parliamentary time lines | per cent | 100 | 100 | 100 | 100 | |||||
| Timely handling of objections within 90 days | per cent | 94.5 | >90 | >80 | >80 | |||||
| Court time lines met | per cent | nm | nm | 100 | 100 | |||||
| Cost | ||||||||||
| Total output cost | $ million | 51.5 | 63.3 | 72.9 | 62.8 |
Source: Department of Treasury and Finance
Note:
- (a)
- The SRO is expecting to collect 13% more revenue than forecast. This increase in revenue collection is mainly due to the stamp duty collected as a result of Land Transfer.
Part 2 provides the financial statements that support the Department's provision of outputs. The information provided includes the Statement of Financial Performance, Statement of Financial Position and Statement of Cash Flows for the Department as well as authority for resources.
The total resources made available to a department are applied to three uses:
- •
- the provision of outputs;
- •
- asset investment; or
- •
- payments on behalf of the State.
The following three financial statements are presented in the format consistent with the AAS29 accounting standard. However, for the purposes of this paper they have been divided into controlled and administered items.
Administered items refer to those resources over which the Department cannot exercise direct control. Authority is provided through an appropriation for payments made on behalf of the State. Under the AAS29 standard, these items would normally appear as notes to the financial statements.
Financial Statements
The following four tables can be used to assess the Department's financial performance and use of resources.
- •
- Table 2.9.2—Statement of Financial Performance—provides details of the Department's controlled revenue and expenses on an accrual basis reflecting the cost of providing its outputs;
- •
- Table 2.9.3—Statement of Financial Position—shows all controlled assets and liabilities of the Department. The difference between these represents the net assets position, which is an indicator of the State's equity in the Department;
- •
- Table 2.9.4—Statement of Cash Flows—shows all movements of cash (cash received and paid). The cash impact of financing and investing activities on Departmental resources is highlighted in this statement; and
- •
- Table 2.9.5—Administered Items Statement—provides details of the Department's administered revenue and expenses (on an accrual basis), and its administered assets and liabilities.
Table 2.9.2: Statement of Financial Performance
| | 2000-01 Actual | 2001-02 Budget | 2001-02 Revised | 2002-03 Budget | Variation(a) | ||||||
|---|---|---|---|---|---|---|---|---|---|---|---|
| | ($ million) | (%) | |||||||||
| Revenue from ordinary activities | |||||||||||
| Output appropriations | 219.5 | 201.8 | 201.0 | 194.4 | (3.7 | ) | |||||
| Special appropriations | 17.0 | 17.6 | 18.0 | 18.2 | 3.6 | ||||||
| Resources received free of charge or for nominal consideration | 0.3 | — | — | — | — | ||||||
| Sale of goods and services | — | 2.7 | — | — | (100.0 | ) | |||||
| Commonwealth Grants | — | — | — | — | — | ||||||
| Taxes | — | — | — | — | — | ||||||
| Fines and Fees | — | — | — | — | — | ||||||
| Other revenue and revenue from other parties | (57.0 | ) | (10.6 | ) | 33.2 | 53.2 | (601.3 | ) | |||
| 179.8 | 211.4 | 252.2 | 265.8 | 25.7 | |||||||
| Expenses from ordinary activities | |||||||||||
| Employee entitlements | 73.5 | 72.6 | 82.4 | 80.0 | 10.2 | ||||||
| Depreciation and amortisation | 24.3 | 31.6 | 63.9 | 75.1 | 137.5 | ||||||
| Resources provided free of charge or for nominal consideration | 0.7 | — | — | — | — | ||||||
| Grants and other payments | 6.8 | 7.2 | 6.9 | 7.5 | 4.3 | ||||||
| Capital asset charge | 32.9 | 34.3 | 34.7 | 34.1 | (0.3 | ) | |||||
| Supplies and services | 96.3 | 81.2 | 79.0 | 72.0 | (11.4 | ) | |||||
| Other expenses from ordinary activities | 13.1 | — | 0.0 | — | — | ||||||
| Borrowing costs | 100.7 | 12.3 | 17.2 | 13.4 | 9.6 | ||||||
| 348.3 | 239.1 | 284.2 | 282.1 | 18.0 | |||||||
| Result from ordinary activities | (168.4 | ) | (27.7 | ) | (31.9 | ) | (16.2 | ) | (41.4 | ) | |
| Loss from extraordinary items | — | — | — | — | — | ||||||
| Net result for the reporting period | (168.4 | ) | (27.7 | ) | (31.9 | ) | (16.2 | ) | (41.4 | ) | |
| Net increase in asset revaluation reserve | 29.5 | — | — | — | — | ||||||
| Total revenues, expenses and revaluation adjustments recognised directly in equity | 29.5 | — | — | — | — | ||||||
| Total changes in equity other than those resulting from transactions with Victorian State Government in its capacity as owner | (139.0 | ) | (27.7 | ) | (31.9 | ) | (16.2 | ) | (41.4 | ) | |
Source: Department of Treasury and Finance
Note:
- (a)
- Variation between 2001-02 Budget and 2002-03 Budget.
Statement of Financial Performance
The Department's revenue from output appropriations will decrease from 2001-02 to 2002-03 mainly due to the cessation of one-off funding related to the establishment of the Essential Services Commission, the partial relocation of the State Revenue Office to Ballarat and the purchase of land valuations from Councils.
These reductions in revenue have been partially offset by an additional $4.3 million in funding for the on-going operational activities of the Essential Services Commission and an additional $3 million to ensure the Departments service capability in areas of policy advice and risk management.
The Department's revenue from other sources and corresponding expenses, will increase due to a requirement for the Department to recognise the full value of the centrally managed motor vehicle facility. This reflects the expenses incurred by other departments and agencies participating in the leasing facility and enables the Department to recognise the vehicle lease facility as a finance lease. This recognition does not result in any additional revenue flowing to the Department.
The Department traditionally runs an operating deficit in this statement as sales of Crown Land are recorded as an expense, with the offsetting revenue recorded as Administered Revenue in Statement 2.9.5. The deficit falls to $16.2 million in 2002-03 due to a lower level of land sales.
Statement of Financial Position
Controlled net assets are budgeted to fall by $11.3 million. This is mainly brought about by expected property sales that reduce non-current assets by $26 million the proceeds of which are recorded in the Department's Administered Items Statement.
Table 2.9.3: Statement of Financial Position
| | Estimated as at 30 June | ||||||||||
|---|---|---|---|---|---|---|---|---|---|---|---|
| | 2001 Actual | 2002 Budget | 2002 Revised | 2003 Budget | Variation(a) | ||||||
| | ($ million) | (%) | |||||||||
| Current assets | |||||||||||
| Cash assets | 4.3 | 3.3 | 15.4 | 27.7 | 739.0 | ||||||
| Other financial assets | 0.2 | 0.2 | 0.2 | 0.2 | — | ||||||
| Receivables | 5.1 | 5.1 | 5.1 | 5.1 | — | ||||||
| Inventories | 21.9 | 21.9 | 21.9 | 21.9 | — | ||||||
| Prepayments | 1.5 | 1.5 | 1.5 | 1.5 | — | ||||||
| Other | — | — | — | — | — | ||||||
| Total current assets | 33.0 | 32.0 | 44.1 | 56.3 | 76.2 | ||||||
| Non-current assets | |||||||||||
| Receivables | 64.1 | 73.0 | 64.1 | 58.8 | (19.4 | ) | |||||
| Inventories | 27.5 | 27.5 | 27.5 | 27.5 | — | ||||||
| Other financial assets | — | — | — | — | — | ||||||
| Property, plant and equipment | 387.0 | 358.4 | 378.7 | 331.8 | (7.4 | ) | |||||
| Intangible assets | 10.7 | 3.2 | (0.1 | ) | 5.0 | 55.4 | |||||
| Other | 21.1 | 20.5 | 19.9 | 18.9 | (7.8 | ) | |||||
| Total non-current assets | 510.3 | 482.5 | 490.1 | 442.0 | (8.4 | ) | |||||
| Total assets | 543.3 | 514.5 | 534.2 | 498.3 | (3.1 | ) | |||||
| Current liabilities | |||||||||||
| Payables | 22.1 | 22.1 | 22.1 | 22.1 | — | ||||||
| Interest bearing liabilities | 92.5 | 1.7 | 23.7 | 23.7 | 1 325.9 | ||||||
| Provisions(b) | 9.0 | 7.9 | 7.4 | 5.7 | (26.8 | ) | |||||
| Other | 16.7 | 15.7 | 15.7 | 15.7 | — | ||||||
| Total current liabilities | 140.3 | 47.4 | 69.0 | 67.3 | 42.1 | ||||||
| Non-current liabilities | |||||||||||
| Interest bearing liabilities | 147.9 | 143.7 | 139.3 | 116.7 | (18.8 | ) | |||||
| Provisions(b) | 11.0 | 12.1 | 12.6 | 14.2 | 17.4 | ||||||
| Other | 0.0 | 0.0 | 0.0 | 0.0 | — | ||||||
| Amounts owing to other departments | — | — | — | — | — | ||||||
| Total non-current liabilities | 159.0 | 155.8 | 151.9 | 131.0 | (16.0 | ) | |||||
| Total liabilities | 299.3 | 203.2 | 220.9 | 198.3 | (2.4 | ) | |||||
| Net assets | 243.9 | 311.3 | 313.3 | 300.0 | (3.6 | ) | |||||
| Equity | |||||||||||
| Contributed capital | 3.0 | 108.8 | 104.3 | 107.3 | (1.4 | ) | |||||
| Reserves | 54.1 | 54.1 | 54.1 | 54.1 | — | ||||||
| Accumulated surplus | 186.8 | 148.4 | 154.9 | 138.7 | (6.5 | ) | |||||
| Total equity | 243.9 | 311.3 | 313.3 | 300.0 | (3.6 | ) | |||||
Source: Department of Treasury and Finance
Notes:
- (a)
- Variation between 2001-02 Budget and 2002-03 Budget.
- (b)
- Includes employee costs and superannuation.
Table 2.9.4: Statement of Cash Flows
| | 2000-01 Actual | 2001-02 Budget | 2001-02 Revised | 2002-03 Budget | Variation(a) | ||||||
|---|---|---|---|---|---|---|---|---|---|---|---|
| | ($ million) | (%) | |||||||||
| Cash flows from operating activities | |||||||||||
| Receipts from Government | 201.5 | 210.5 | 219.0 | 217.9 | 3.5 | ||||||
| Receipts from other entities | (1.6 | ) | 2.7 | (0.0 | ) | — | (100.0 | ) | |||
| Payments for supplies, grants and employees | (295.7 | ) | (177.1 | ) | (177.9 | ) | (182.1 | ) | 2.8 | ||
| (95.7 | ) | 36.1 | 41.0 | 35.8 | (0.8 | ) | |||||
| Interest received | 0.1 | — | — | — | — | ||||||
| Other revenue | 79.8 | 29.4 | 69.2 | 83.2 | 183.4 | ||||||
| Capital asset charge | (32.9 | ) | (34.3 | ) | (34.7 | ) | (34.1 | ) | (0.3 | ) | |
| Borrowing costs expense | (31.9 | ) | (103.1 | ) | (86.0 | ) | (13.4 | ) | (87.0 | ) | |
| Net cash inflow from operating activities | (80.6 | ) | (71.9 | ) | (10.5 | ) | 71.5 | (199.4 | ) | ||
| Cash flows from investing activities | |||||||||||
| Payments for property, plant and equipment(b) | 54.1 | (34.9 | ) | (79.7 | ) | (62.2 | ) | 78.0 | |||
| Proceeds from sale of property, plant and equipment | 0.0 | — | — | — | — | ||||||
| Payments for investments | — | — | — | — | — | ||||||
| Proceeds from sale of business assets | — | — | — | — | — | ||||||
| (Repayment of) loans by other entities | 3.5 | — | — | — | — | ||||||
| Net cash (outflow) from investing activities | 57.5 | (34.9 | ) | (79.7 | ) | (62.2 | ) | 78.0 | |||
| Cash flows from financing activities | |||||||||||
| Net Proceeds from capital contribution by State Government | 27.7 | 105.8 | 101.3 | 3.0 | (97.2 | ) | |||||
| Net proceeds of borrowings | — | — | — | — | — | ||||||
| Repayment of finance leases | — | — | — | — | — | ||||||
| Net cash inflow (outflow) from financing activities | 27.7 | 105.8 | 101.3 | 3.0 | (97.2 | ) | |||||
| Net increase (decrease) in cash held | 4.6 | (1.0 | ) | 11.1 | 12.2 | (1 322.9 | ) | ||||
| Cash at the beginning of the financial year | (0.3 | ) | 4.3 | 4.3 | 15.4 | 259.1 | |||||
| Cash at the end of the financial year | 4.3 | 3.3 | 15.4 | 27.7 | 0.0 | ||||||
Source: Department of Treasury and Finance
Notes:
- (a)
- Variation between 2001-02 Budget and 2002-03 Budget.
- (b)
- Includes payments for land held for resale and research & development costs.
Statement of Cash Flows
The Department's 2001-02 budgeted cash flow was heavily impacted by a one-off payment to reduce the Government's motor vehicle lease liability. This liability arose as a result of the GST related decline in used car markets. This pushed up borrowing costs expense by $90.8 million and was financed by an equivalent capital contribution by Government.
In 2002-03, the Department's other revenue will increase to $83.2 million. This relates to the requirement for the Department to recognise the full value of the centrally managed motor vehicle facility. This revenue offsets the expenses incurred by other departments and agencies participating in the leasing facility and enables the Department to recognise the vehicle lease facility as a finance lease.
Administered Items Statement
The Department conducts a large number of transactions on behalf of the State for which it cannot exercise direct control, for example, the collection of State taxation revenue and administration of the State's superannuation schemes.
Table 2.9.5 shows that administered operating revenue is estimated to increase by $1 165 million between the 2001-02 and 2002-03 Budgets. Increases in State taxation revenue and Commonwealth Grants account for $788.9 million of this increase with a further $249.5 million due to the increase in Special Appropriations to cover higher superannuation expenses. The balance of the increase is due to higher appropriations for payments made on behalf of the State and other revenue.
Administered operating expenses also show a large increase of $925.8 million between budgets. The majority of the increase reflects increased taxation revenue and Commonwealth Grants revenue that is transferred to the Consolidated Fund.
The estimated increase in administered assets of $121.8 million between the 2001-02 Budget and the 2002-03 Budget largely reflects the increase in works in progress of $90 million associated with Federation Square. However, estimated administered liabilities have increased by $770.3 million, largely associated with an increase in the unfunded superannuation liability ($760.4 million) due to a revision in the earnings assumption on superannuation fund assets in 2001-02 from 7 per cent to 1 per cent, and changes to actuarial assumptions with regard to rates of resignation and retirement for members of the State Superannuation Fund.
Table 2.9.5: Administered Items Statement
| | 2000-01 Actual | 2001-02 Budget | 2001-02 Revised | 2002-03 Budget | Variation(a) | ||||||
|---|---|---|---|---|---|---|---|---|---|---|---|
| | ($ million) | (%) | |||||||||
| Administered revenue | |||||||||||
| Appropriations—Payments made on behalf of the State | 1 284.8 | 1 494.7 | 1 245.4 | 1 541.8 | 3.2 | ||||||
| Output Appropriation | — | — | — | — | — | ||||||
| Special appropriations | 1 277.9 | 676.7 | 359.1 | 926.2 | 36.9 | ||||||
| Resources received free of charge or for nominal consideration | 70.7 | — | — | — | — | ||||||
| Sale of goods and services | 4.4 | 1.7 | 4.3 | 5.6 | 239.2 | ||||||
| Commonwealth grants | 5 890.0 | 6 615.4 | 6 898.0 | 6 778.1 | 2.5 | ||||||
| Other grants | 12.7 | 14.7 | 14.7 | 14.3 | (2.7 | ) | |||||
| Taxes | 7 740.6 | 7 077.9 | 7 845.1 | 7 704.1 | 8.8 | ||||||
| Fines | — | 0.0 | 0.0 | 0.0 | — | ||||||
| Fees | 51.3 | 20.9 | 20.9 | 15.3 | (26.8 | ) | |||||
| Other | 3 015.9 | 2 579.6 | 2 560.2 | 2 650.8 | 2.8 | ||||||
| Total administered revenue | 19 348 | 18 481 | 18 948 | 19 636 | 6.2 | ||||||
| Administered expenses | |||||||||||
| Expenses on behalf of the State | 1 644.4 | 1 810.2 | 1 821.4 | 2 041.9 | 12.8 | ||||||
| Grants and other payments | 529.0 | 385.7 | 557.4 | 316.9 | (17.8 | ) | |||||
| Payments into the Consolidated Fund | 16 863.3 | 16 433.5 | 17 501.0 | 17 185.6 | 4.6 | ||||||
| Total administered expenses | 19 036.7 | 18 629.5 | 19 879.7 | 19 544.5 | 4.9 | ||||||
| Revenue less expenses | 311.6 | (148.0 | ) | (932.0 | ) | 91.7 | (162.0 | ) | |||
| Administered assets | |||||||||||
| Cash assets | 24.4 | 21.9 | 12.1 | 10.6 | (51.7 | ) | |||||
| Receivables | (1 252.0 | ) | (1 135.9 | ) | (2 146.9 | ) | (1 570.5 | ) | 38.3 | ||
| Other financial assets | 2 140.1 | 1 986.3 | 2 775.1 | 2 240.2 | 12.8 | ||||||
| Inventories | 7.4 | 7.4 | 7.4 | 7.4 | — | ||||||
| Prepayments | 0.0 | 0.0 | 0.0 | 0.0 | — | ||||||
| Property, plant and equipment | 0.0 | 75.3 | 358.6 | 389.2 | 416.7 | ||||||
| Intangible assets | — | — | — | — | — | ||||||
| Other | — | — | — | — | — | ||||||
| Total administered assets | 920.0 | 955.1 | 1 006.4 | 1 076.9 | 12.8 | ||||||
| Administered liabilities | |||||||||||
| Payables | 33.9 | 34.9 | 34.9 | 35.9 | 2.9 | ||||||
| Interest bearing liabilities | 5 802.7 | 5 813.1 | 5 825.5 | 5 839.7 | 0.5 | ||||||
| Provisions | 11 357.1 | 11 526.5 | 12 297.7 | 12 284.5 | 6.6 | ||||||
| Amounts owing to other departments | — | (2.8 | ) | (1.0 | ) | (2.0 | ) | (28.8 | ) | ||
| Other | 184.9 | 178.9 | 185.0 | 162.9 | (9.0 | ) | |||||
| Total administered liabilities | 17 378.6 | 17 550.7 | 18 342.2 | 18 321.0 | 4.4 | ||||||
Source: Department of Treasury and Finance
Note:
Authority for Resources
This section provides a summary of the sources of Parliamentary Authority available to the Department to fund the provision of outputs, payments on behalf of State, and additions to the net asset base.
Table 2.9.6: Parliamentary Authority for Resources
| | 2001-02 Budget | 2001-02 Revised | 2002-03 Budget | Variation(a) | |||||
|---|---|---|---|---|---|---|---|---|---|
| | ($ million) | (%) | |||||||
| Annual appropriations(b) | 1 759.2 | 1 528.9 | 1 721.2 | (2.2 | ) | ||||
| Receipts credited to appropriations | 2.7 | 2.7 | 2.5 | (7.6 | ) | ||||
| Unapplied previous years appropriation | 43.1 | 16.1 | 15.5 | (64.0 | ) | ||||
| Accumulated surplus—previously applied appropriation | — | 12.9 | — | — | |||||
| Gross annual appropriation | 1 805.0 | 1 560.5 | 1 739.2 | (3.6 | ) | ||||
| Special appropriations | 694.3 | 377.1 | 944.4 | 36.0 | |||||
| Trust funds | 19.0 | 19.4 | 21.5 | 13.0 | |||||
| Total Parliamentary authority | 2 518.2 | 1 957.1 | 2 705.0 | 7.4 | |||||
Source: Department of Treasury and Finance
Notes:
- (a)
- Variation between 2001-02 Budget and 2002-03 Budget.
- (b)
- 2001-02 Revised includes the impact of approved Treasurer's Advances.
Payments on behalf of State
Payments on behalf of the State are payments made by the Department on behalf of the State Government as a whole and do not directly reflect the operations of the Department. They are usually on-passed or administered by the State.
Table 2.9.7: Payments made on behalf of the State
| Accounts | 2001-02 Budget | 2001-02 Revised | 2002-03 Budget | Variation(a) | ||||
|---|---|---|---|---|---|---|---|---|
| | ($ million) | (%) | ||||||
| Tattersalls duty payments to other jurisdictions | 39.4 | 40.3 | 40.1 | 1.8 | ||||
| Superannuation and pension payments | 33.8 | 16.3 | 29.9 | -11.6 | ||||
| Interest | 429.6 | 420.3 | 431.0 | 0.3 | ||||
| Current and capital grants | 334.1 | 502.9 | 258.5 | -22.6 | ||||
| Operating supplies and consumables | 345.3 | 138.9 | 470.8 | 36.3 | ||||
| Buildings | 70.4 | 114.2 | 20.6 | -70.7 | ||||
| Other | 242.1 | 12.5 | 290.9 | 20.2 | ||||
| Total | 1 494.7 | 1 245.4 | 1 541.8 | 3.2 | ||||
Source: Department of Treasury and Finance
Note:
- (a)
- Variation between 2001-02 Budget and 2002-03 Budget.
PART 1: OUTLOOK AND OUTPUTS
Overview
Parliament is the law-making body of the State and provides the base from which the government is formed. Parliament's functions may be broadly described as legislative, financial and representational. It authorises expenditure, debates Government policy and scrutinises Government administration. The Parliament is composed of the Crown (represented by the Governor), the Legislative Council and the Legislative Assembly, which collectively form the legislature.
The Legislative Council comprises 44 Members representing 22 provinces. The Legislative Assembly comprises 88 Members, each representing one electoral district.
The powers of the two Houses are derived from the Constitution Act 1975, which imposes limitations on the Council in respect of 'Money Bills', the Assembly being the primary authority for authorising Government expenditure.
A fundamental principle is the independent and separate nature of the two Houses and the need for organisational and structural arrangements to reflect this separation.
The Parliamentary departments operate in an environment where the sitting patterns of the Parliament are unpredictable and where Members of Parliament seek ongoing improvement in the facilities, which they rely upon to service their electorates. The provision of administrative and support services to the Parliament of Victoria is therefore a complex and challenging management task.
The administrative support services for the two Houses are provided by five parliamentary departments—the Legislative Council, the Legislative Assembly, Parliamentary Debates (Hansard), the Parliamentary Library and Joint Services Department. Their primary function is to service the two Houses and the Committees, as well as to provide administrative support for Members and electorate offices. The departments endeavour to continually improve their services by reviewing and implementing improved practices.
The scrutiny and deliberative roles of the Parliament are enhanced by the system of Investigatory Committees. Their role is to inquire, investigate and report upon proposals or matter referred to them by either House or by the Governor-in-Council or, in certain circumstances, upon a self initiated reference.
The Auditor-General's Office
The Auditor-General has complete discretion over the management and contracting of all external audits of public bodies and is independent from the executive.
Review of 2001-02
During 2001-02, the Parliament conducted two regional sittings in Ballarat and Bendigo. The Legislative Council and the Parliamentary Library celebrated their sesquicentenary anniversaries. The Parliament also hosted the Australasian seminars for Society of Clerks at the Table and Parliamentary Librarians.
The Victorian Parliament in conjunction with the Federal Parliament played a significant role hosting the 47th Commonwealth Parliamentary Conference.
Throughout 2001-02, the focus of the Parliament was on improving the security and facilities of the Parliament and electorate offices in order to assist the parliamentary departments and members of Parliament to efficiently carry out their duties. The Parliament also developed an Information Technology Strategic Plan that will be implemented progressively in the next few financial years.
The parliamentary departments spent considerable time negotiating enterprise bargain agreements for electorate office staff and parliamentary officers. The parliamentary departments also reviewed and rewrote the Parliament's Corporate Plan.
The Legislative Council successfully completed its construction of additional office space. The Department of Parliamentary Debates in partnership with the Legislative Council installed sound equipment in the Legislative Council chamber. The Department of Parliamentary Services was reorganised and retitled Joint Services Department (JSD). JSD was relocated and occupied the building at 157 Spring St and the Parliament temporary accommodation building (Annex) was converted into additional office space for Members.
The first two phases of the project to improve the air quality in Parliament have been completed.
2002-03 Outlook
During 2002-03, Parliament will continue to focus on improving the facilities of the Parliament buildings. Of special concern will be improving the security in and around the parliamentary buildings. A Strategic Security Study of Parliament will be undertaken and a facilities management development plan will be written.
The first stages of the IT Strategic Plan will be implemented which will result in an upgrade to Members' IT equipment including new leased hardware and software upgrades to Microsoft Windows 2000 and Lotus Notes 5. Implementation of a Parliamentary Portal and Content Management System have been delayed to future years while improvements to the broadband network will remain dependent on the timeline for the whole of government broadband improvements.
The Legislative Assembly will finalise plans for the refurbishment of its chamber that will occur this financial year. Improvements to the Parliamentary Library's Electronic News Service will also occur in the next 12 months.
Output Information
The following section provides details of the outputs to be provided to Government, including their performance measures and output costs. The table below summarises the total cost for outputs.
Table 2.10.1: Output summary
| | 2001-02 Budget(a) | 2001-02 Revised | 2002-03 Budget | Variation(b) | |||||
|---|---|---|---|---|---|---|---|---|---|
| | ($ million) | (%) | |||||||
| Legislative Council | 11.9 | 12.7 | 9.6 | (19.2 | ) | ||||
| Legislative Assembly | 21.1 | 21.6 | 20.2 | (4.2 | ) | ||||
| Parliamentary Library | 1.8 | 1.9 | 2.0 | 10.4 | |||||
| Parliamentary Debates | 2.3 | 2.2 | 2.4 | 5.2 | |||||
| Parliamentary Investigatory Committees(c) | — | — | 3.9 | — | |||||
| Joint Services Department | 38.9 | 36.7 | 40.6 | 4.2 | |||||
| Auditor General's Office | 22.5 | 22.2 | 24.0 | 6.9 | |||||
| Total | 98.5 | 97.3 | 102.6 | 4.2 | |||||
Source: Department of Treasury and Finance
- (a)
- 2001-02 Output Budget incorporates changes to Output structure and organisational restructuring and therefore may differ from figures published in the 2001-02 Budget.
- (b)
- Variation between 2001-02 and 2002-03 Budget.
- (c)
- In 2001-02 the Committees were not separately identified and their costs were funded through Special Appropriation.
Legislative Council
This output involves the provision of procedural advice to Members of the Legislative Council, processing of legislation, preparation of the records of the proceedings and documentation required for the sittings of the Council, provision of assistance to parliamentary committees, provision of information relating to the proceedings of the Council and enhancement of public awareness of Parliament.
The output makes a significant contribution to the achievement of the following objectives of the Parliament:
- •
- to provide quality advice, support and information services to Members and other clients;
- •
- to improve information management and parliamentary operations through innovative and practical technology based solutions; and
- •
- to ensure optimal use of our physical resources.
| Major Outputs/Deliverables Performance Measures | Unit of measure | 2000-01 Actual | 2001-02 Target | 2001-02 Expected Outcome | 2002-03 Target | |||||
|---|---|---|---|---|---|---|---|---|---|---|
| Procedural Support, Documentation Preparation and Provision of Information | ||||||||||
| Quantity | ||||||||||
| House related documents produced | number | 191 | 130 | 300 | na | |||||
| Papers tabled | number | 958 | 1 000 | 1 000 | na | |||||
| Questions processed | number | 1 263 | 1 500 | 1 600 | na | |||||
| Bills and amendments processed | number | 126 | 120 | 130 | na | |||||
| Visitors received | number | 85 000 | 90 000 | 90 000 | na | |||||
| Committee meetings serviced | number | 142 | 130 | 135 | na | |||||
| Security audit requirements met a year | number | nm | nm | nm | 2 | |||||
| Procedural References updated biannually | number | nm | nm | nm | 2 | |||||
| Quality | ||||||||||
| Constitutional, parliamentary and statutory requirements met | per cent | 100 | 100 | 100 | 100 | |||||
| Accuracy of records of the Council prepared | per cent | 100 | 100 | 100 | na | |||||
| Accuracy of procedural advice provided | per cent | 100 | 100 | 100 | na | |||||
| Members' satisfaction with the quality of services provided in relation to the provision of information and documentation | level | high | high | high | na | |||||
| Committee inquiries completed within budget | per cent | 100 | 100 | 98 | na | |||||
| Bills and amendments processed accurately through all relevant stages | per cent | nm | nm | nm | 100 | |||||
| Member satisfaction with accuracy and timeliness of advice | per cent | nm | nm | nm | 80 | |||||
| Visitors satisfaction with service quality in relation to tours of Parliament | per cent | nm | nm | nm | 80 | |||||
| Timeliness | ||||||||||
| Statutory and parliamentary deadlines met | per cent | 100 | 100 | 100 | na | |||||
| Minutes and Notice Papers produced and made available within deadlines | per cent | 100 | 100 | 100 | na | |||||
| Clients requests responded to within acceptable deadlines | per cent | 100 | 100 | 100 | na | |||||
| Committee inquiries completed within deadlines | per cent | 100 | 100 | 100 | na | |||||
| Parliamentary documents available one day after sitting day | per cent | nm | nm | nm | 98 | |||||
| House documents tabled within time guidelines | per cent | nm | nm | nm | 90 | |||||
| Cost | ||||||||||
| Total output cost | $ million | 10.8 | 11.8 | 11.8 | 9.6 |
Source: Parliament of Victoria
Legislative Assembly
This output involves the provision of procedural advice to Members of the Legislative Assembly, preparation of the records of the proceedings and documentation required for the sittings of the Legislative Assembly and provision of assistance to parliamentary committees, provision of information relating to the proceedings of the Assembly and the promotion of public awareness of Parliament.
The output makes a significant contribution to the achievement of the following objectives of the Parliament:
- •
- to provide quality advice, support and information services to Members and other clients;
- •
- to improve information management and parliamentary operations through innovative and practical technology based solutions; and
- •
- to ensure optimal use of our physical resources.
| Major Outputs/Deliverables Performance Measures | Unit of measure | 2000-01 Actual | 2001-02 Target | 2001-02 Expected Outcome | 2002-03 Target | |||||
|---|---|---|---|---|---|---|---|---|---|---|
| Procedural Support, Documentation Preparation and Provision of Information | ||||||||||
| Quantity | ||||||||||
| House related documents produced | number | 199 | 210 | 215 | na | |||||
| Papers tabled | number | 1 595 | 1 600 | 1 490 | na | |||||
| Questions processed | number | 796 | 200 | 520 | na | |||||
| Bills and amendments processed | number | 180 | 180 | 170 | na | |||||
| Visitors received | number | 85 000 | 90 000 | 90 000 | na | |||||
| Committee meetings serviced | number | 190 | 200 | 195 | na | |||||
| Security audit requirements met a year | number | nm | nm | nm | 2 | |||||
| Procedural References updated biannually | number | nm | nm | nm | 2 | |||||
| Quality | ||||||||||
| Constitutional, parliamentary and statutory requirements met | per cent | 100 | 100 | 100 | 100 | |||||
| Accuracy of records of the Assembly prepared | per cent | 100 | 100 | 100 | na | |||||
| Accuracy of procedural advice provided | per cent | 100 | 100 | 100 | na | |||||
| Members' satisfaction with the quality of services provided in relation to the provision of information and documentation | level | high | high | high | na | |||||
| Committee inquiries completed within budget | per cent | 100 | 100 | 100 | na | |||||
| Bills and amendments processed accurately through all relevant stages | per cent | nm | nm | nm | 100 | |||||
| Member satisfaction with accuracy and timeliness of advice | per cent | nm | nm | nm | 80 | |||||
| Visitors satisfaction with service quality in relation to tours of Parliament | per cent | nm | nm | nm | 80 | |||||
| Timeliness | ||||||||||
| Statutory and parliamentary deadlines met | per cent | 100 | 100 | 100 | na | |||||
| Votes and Notice Papers produced and made available within deadlines | per cent | 100 | 100 | 100 | na | |||||
| Clients requests responded to within acceptable deadlines | per cent | 100 | 100 | 100 | na | |||||
| Committee inquiries completed within deadlines | per cent | 100 | 100 | 100 | na | |||||
| Parliamentary documents available one day after sitting day | per cent | nm | nm | nm | 98 | |||||
| House documents tabled within time guidelines | per cent | nm | nm | nm | 90 | |||||
| Cost | ||||||||||
| Total output cost | $ million | 19.9 | 21.1 | 21.1 | 20.2 |
Source: Parliament of Victoria
Parliamentary Library
These outputs involve the provision of information, resources and research services to Members of Parliament, Parliamentary Officers and committees and the promotion of public awareness of the Parliament of Victoria and the education of citizens in the democratic processes of Westminster style government.
The outputs make significant contribution to the achievement of the following objectives of the Parliament:
- •
- to provide quality advice, support and information services to Members and other clients;
- •
- to improve information management and parliamentary operations through innovative and practical technology based solutions; an
- •
- to ensure optimal use of our physical resources.
| Major Outputs/Deliverables Performance Measures | Unit of measure | 2000-01 Actual | 2001-02 Target | 2001-02 Expected Outcome | 2002-03 Target | |||||
|---|---|---|---|---|---|---|---|---|---|---|
| Information Provision—Delivery of services whereby information is collated for a client in response to a specific request. | ||||||||||
| Quantity | ||||||||||
| Service requests satisfied | number | >10 000 | 10 000 | 9 000 | 9 800 | |||||
| Pages of information delivered | number | >45 000 | 45 000 | 100 000 | na | |||||
| Quality | ||||||||||
| Clients rating service as expected level or above | per cent | >85 | 85 | 85 | na | |||||
| Questions successfully answered | per cent | >95 | 95 | 93 | 90 | |||||
| MP users of library service as proportion of all MP's | per cent | nm | nm | nm | 80 | |||||
| Timeliness | ||||||||||
| Jobs completed within agreed client timeframes | per cent | >92 | 92 | 92 | 90 | |||||
| Cost | ||||||||||
| Total output cost | $ million | 0.3 | 0.3 | 0.3 | 0.3 | |||||
Information Access—Creation of services to enable clients to access information themselves. | ||||||||||
| Quantity | ||||||||||
| Items processed for retrieval | number | >45 000 | 45 000 | 39 000 | 27 000 | |||||
| In person Library visits | number | >50 000 | 30 000 | 83 000 | 73 000 | |||||
| Searches on databases | number | >10 100 | 10 100 | 12 300 | na | |||||
| Electronic Hansard records processed | number | >60 000 | 60 000 | 63 000 | na | |||||
| Visitor sessions on Library Intranet site | number | nm | nm | nm | 28 000 | |||||
| Quality | ||||||||||
| Availability of databases | per cent | >90 | 90 | 90 | na | |||||
| Intranet clients who are repeat customers | per cent | nm | nm | nm | 80 | |||||
| Timeliness | ||||||||||
| Availability of Daily Hansard by 10am following day of sitting | per cent | >85 | 85 | 85 | na | |||||
| Cost | ||||||||||
| Total output cost | $ million | 1.1 | 1.2 | 1.2 | 1.2 | |||||
Research—Provision of statistical, analytical and research briefings and publications in support or anticipation of Members' parliamentary responsibilities. | ||||||||||
| Quantity | ||||||||||
| Briefings provided | number | >70 | 70 | 150 | 140 | |||||
| Quality | ||||||||||
| Clients rating service at expected level or above | per cent | >80 | 80 | 80 | 80 | |||||
| Timeliness | ||||||||||
| Requests completed within agreed timeframe | per cent | >90 | 90 | 90 | 90 | |||||
| Cost | ||||||||||
| Total output cost | $ million | 0.2 | 0.2 | 0.2 | 0.2 | |||||
Public Relations and Education—Enabling citizen access to parliamentary processes through publishing key information online; involving young people in democratic system. | ||||||||||
| Quantity | ||||||||||
| PR brochures distributed | number | >37 500 | 37 000 | 47 000 | na | |||||
| Student visitors to Parliament | number | >23 000 | 23 000 | 23 000 | na | |||||
| Teachers provided with in-service training | number | >210 | 220 | 320 | 220 | |||||
| Teacher consultancies provided | number | >600 | 600 | 350 | 600 | |||||
| Eligible interns placed with Members | per cent | 95 | 95 | 95 | na | |||||
| PR events hosted/facilitated | number | >15 | 15 | 15 | na | |||||
| Members' guest visitors received | number | >250 | 250 | 400 | na | |||||
| Visitor sessions on Parliament website | number | nm | nm | nm | 475 000 | |||||
| Uptake of Student visitors places | per cent | nm | nm | nm | 80 | |||||
| Quality | ||||||||||
| Clients rating education service as satisfactory | per cent | >90 | 90 | 90 | 80 | |||||
| Cost | ||||||||||
| Total output cost | $ million | 0.1 | 0.1 | 0.1 | 0.3 | |||||
Source: Parliament of Victoria
Parliamentary Debates (Hansard)
Hansard is a reporting and editing function producing Daily Hansard, an edited proof transcript of each day's parliamentary proceedings; weekly Hansard, the revised compilation of a week's proceedings of the Parliament; sessional volumes, a compilation of the proceedings of a sessional period; sessional indexes, a reference to be used in conjunction with both weekly and bound editions of Hansard; and committee transcripts, edited transcripts of the proceedings of parliamentary committees.
The output makes a significant contribution to the achievement of the following objectives of the Parliament:
- •
- to provide quality advice, support and information services to Members and other clients;
- •
- to improve information management and parliamentary operations through innovative and practical technology based solutions; and
- •
- To ensure optimal use of our physical resources.
| Major Outputs/Deliverables Performance Measures | Unit of Measure | 2000-01 Actual | 2001-02 Target | 2001-02 Expected Outcome | 2002-03 Target | |||||
|---|---|---|---|---|---|---|---|---|---|---|
| Hansard, Sessional Indexes and Committee Transcripts | ||||||||||
| Quantity | ||||||||||
| Total number of printed pages | number | 21 982 | 16 000 | 17 000 | na | |||||
| Parliamentary audio transmission up time | per cent | nm | nm | nm | 98 | |||||
| Quality | ||||||||||
| Accuracy and legibility of printed pages and appropriately edited transcript. | per cent | 100 | 100 | 100 | na | |||||
| Accuracy of Hansard record | per cent | nm | nm | nm | 99 | |||||
| Accuracy of Committee transcripts | per cent | nm | nm | nm | 99 | |||||
| Accuracy of indexes to records of proceedings | per cent | nm | nm | nm | 99 | |||||
| Audibility of parliamentary audio transmission | per cent | nm | nm | nm | 98 | |||||
| Accuracy of extracts of speeches | per cent | nm | nm | nm | 99 | |||||
| Timeliness | ||||||||||
| Pages produced within agreed timeframe | per cent | 100 | 100 | 100 | na | |||||
| PDF version of daily and weekly Hansard available on intranet and internet within agreed timeframe | per cent | na | 100 | 100 | na | |||||
| Hansard record produced within specified time frame in hard, soft, internet and intranet formats | per cent | nm | nm | nm | 98 | |||||
| Committee transcripts produced within specified timeframe | per cent | nm | nm | nm | 98 | |||||
| Indexes to records of proceedings produced within specified timeframe | per cent | nm | nm | nm | 98 | |||||
| Extracts of speeches produced within specified timeframe | per cent | nm | nm | nm | 98 | |||||
| Cost | ||||||||||
| Total output cost | $ million | 2.2 | 2.3 | 2.3 | 2.4 |
Source: Parliament of Victoria
Parliamentary Investigatory Committees
Committees are appointed pursuant to the Parliamentary Committees Act 1968 to inquire into matters either referred by the Governor-in-Council or the Parliament, or which may be self-generated by a Committee. Committees can be joint investigatory, specific purpose or select.
The output makes a significant contribution to the achievement of the objective of the Parliament:
- •
- to provide quality advice, support and information services to Members and other clients.
| Major Outputs/Deliverables Performance Measures | Unit of measure | 2000-01 Actual | 2001-02 Target | 2001-02 Expected Outcome | 2002-03 Target | |||||
|---|---|---|---|---|---|---|---|---|---|---|
| Reports tabled and papers published | ||||||||||
| Quantity | ||||||||||
| Inquiry reports tabled per annum | number | nm | nm | nm | 8 | |||||
| Discussion/Issues Papers published per annum | number | nm | nm | nm | 4 | |||||
| Quality | ||||||||||
| Committee Members satisfied with accuracy and timeliness of procedural and administrative advice | per cent | nm | nm | nm | 80 | |||||
| Inquiry and Statutory Reports produced in compliance with statutory and legislative requirements | per cent | nm | nm | nm | 100 | |||||
| Timeliness | ||||||||||
| Statutory Reports tabled within statutory deadlines | per cent | nm | nm | nm | 100 | |||||
| Cost | ||||||||||
| Total output cost | $ million | na | na | na | 3.9 | |||||
Source: Parliament of Victoria
Joint Services Department
These outputs involve the provision of ancillary services, including human resource management, training services, information technology services, financial management, accounting services and property and facilities management to the Parliament of Victoria and electorate offices.
The outputs make significant contribution to the achievement of the following objectives of the Parliament:
- •
- to provide quality advice, support and information services to Members and other clients;
- •
- to improve information management and parliamentary operations through innovative and practical technology based solutions; and
- •
- To ensure optimal use of our physical resources.
| Major Outputs/Deliverables Performance Measures | Unit of Measure | 2000-01 Actual | 2001-02 Target | 2001-02 Expected Outcome | 2002-03 Target | |||||
|---|---|---|---|---|---|---|---|---|---|---|
| Financial Management—Provision of financial management and accounting services. | ||||||||||
| Quantity | ||||||||||
| Accounts processed | number | 35 000 | 30 000 | >30 000 | na | |||||
| Financial reports produced | number | 3 100 | 2 600 | >2 600 | na | |||||
| Quality | ||||||||||
| Accounts paid within credit terms | per cent | >98 | 98 | 98 | na | |||||
| Timeliness | ||||||||||
| Reports prepared within required timelines | per cent | 98 | 95 | 95 | na | |||||
| Cost | ||||||||||
| Total output cost | $ million | 15.3 | 16.4 | 16.4 | na | |||||
Property Management—Management of the property and service related issues of the State Electorate Offices. | ||||||||||
| Quantity | ||||||||||
| Leases current | number | 97 | 95 | 120 | na | |||||
| Quality | ||||||||||
| Electorate Offices property and infrastructure requests satisfactorily resolved | per cent | >90 | 88 | >88 | na | |||||
| Timeliness | ||||||||||
| Electorate Office fitouts completed on time and within budget | per cent | >95 | 90 | >90 | na | |||||
| Cost | ||||||||||
| Total output cost | $ million | 10.9 | 11.7 | 11.7 | na | |||||
Grounds and Facilities Maintenance—Maintenance of the grounds and facilities of Parliament of Victoria. | ||||||||||
| Quantity | ||||||||||
| Users rating grounds and facilities as excellent | per cent | >85 | 90 | >90 | na | |||||
| Timeliness | ||||||||||
| Users requests satisfied on time | per cent | >85 | 90 | >90 | na | |||||
| Cost | ||||||||||
| Total output cost | $ million | 5.0 | 5.4 | 5.4 | na | |||||
Personnel Services—Provision of personnel services to the Parliament of Victoria and State Electorate Offices. | ||||||||||
| Quantity | ||||||||||
| Payroll adjustments processed | number | >6 000 | 7 000 | >7 000 | na | |||||
| Quality | ||||||||||
| Corrections required to salaries payments | number | <60 | <60 | <60 | na | |||||
| Timeliness | ||||||||||
| Information requests satisfied within agreed timeframe | per cent | >95 | 95 | 95 | na | |||||
| Cost | �� | |||||||||
| Total output cost | $ million | 4.8 | 5.1 | 5.1 | na | |||||
Joint Services Department—Provision of Human Resources, Finance, Information Technology, Maintenance, Ground and Facility, consultancy, advisory and support service. | ||||||||||
| Quantity | ||||||||||
| IT system up time | per cent | nm | nm | nm | 99 | |||||
| Provision of fully resourced electorate offices outside of the parliamentary precinct | number | nm | nm | nm | 132 | |||||
| Quality | ||||||||||
| Members, staff and officers satisfied or better with the services provide | per cent | nm | nm | nm | 70 | |||||
| Payroll entries processed without error | per cent | nm | nm | nm | 95 | |||||
| Requirements of conservation and heritage plans met | per cent | nm | nm | nm | 100 | |||||
| Timeliness | ||||||||||
| Reports prepared within required timelines | per cent | nm | nm | nm | 94 | |||||
| Financial accounts paid within credit terms | per cent | nm | nm | nm | 98 | |||||
| Cost | ||||||||||
| Total output cost | $ million | na | na | na | 40.6 | |||||
Source: Parliament of Victoria
Auditor-General's Office
The outputs of the Auditor-General's Office can be categorised under the following headings:
- •
- Parliamentary reports and services
These outputs comprise reports to Parliament arising from the conduct of audits, providing advice to a range of parties on accounting and public accountability matters, responding to enquiries by members of Parliament and the public, and assistance to Parliament and international bodies; and - •
- Audit reports on financial statements
These outputs relate to the Auditor-General's statutory responsibility to undertake, on behalf of Parliament, an annual examination of the financial statements of departments and public bodies, and to express an audit opinion of the fair presentation of those financial statements.
The outputs make significant contribution to the achievement of the following objectives of the Auditor-General's Office:
- •
- deliver value-adding reports and services to the Parliament;
- •
- undertake high quality independent audit activities; and
- •
- meet the needs and expectations of our stakeholders.
| Major Outputs/Deliverables Performance Measures | Unit of measure | 2000-01 Actual | 2001-02 Target | 2001-02 Expected Outcome | 2002-03 Target | |||||
|---|---|---|---|---|---|---|---|---|---|---|
| Output Reports to be tabled in Parliament | ||||||||||
| Quantity | ||||||||||
| Major audit reports | number | 7 | 12 | 13 | 14 | |||||
| Quality | ||||||||||
| Overall level of external satisfaction with audits | per cent | 81 | 75 | 80 | 80 | |||||
| Timeliness | ||||||||||
| Reports completed on time | per cent | 100 | 100 | 100 | 100 | |||||
| Cost | ||||||||||
| Total output cost | $ million | 5.4 | 9.8 | 9.8 | 10.1 | |||||
Audit reports on Financial Statements | ||||||||||
| Quantity | ||||||||||
| Audit opinions issued | number | 553 | 526 | 551 | 562 | |||||
| Quality | ||||||||||
| Overall level of external satisfaction with audits | per cent | 71 | 70 | 75 | 75 | |||||
| Timeliness | ||||||||||
| Audit opinions issued within statutory deadlines | per cent | 88 | 95 | 100 | 100 | |||||
| Management letters and reports to Ministers issued within established timeframes | per cent | nm | 100 | 100 | 100 | |||||
| Cost | ||||||||||
| Total output cost | $ million | 14.9 | 12.7 | 12.7 | 13.9 | |||||
Source: Parliament of Victoria
Part 2 provides the financial statements that support the Department's provision of outputs. The information provided includes the Statement of Financial Performance, Statement of Financial Position and Statement of Cash Flows for the Department as well as authority for resources.
The total resources made available to a department are applied to three uses:
- •
- the provision of outputs;
- •
- asset investment; or
- •
- payments on behalf of the State.
The following three financial statements are presented in the format consistent with the AAS29 accounting standard. However, for the purposes of this paper they have been divided into controlled and administered items.
Administered items refer to those resources over which the Department cannot exercise direct control. Authority is provided through an appropriation for payments made on behalf of the State. Under the AAS29 standard, these items would normally appear as notes to the financial statements.
Financial Statements
The following four tables can be used to assess the Department's financial performance and use of resources.
- •
- Table 2.10.2—Statement of Financial Performance—provides details of the Department's controlled revenue and expenses on an accrual basis reflecting the cost of providing its outputs;
- •
- Table 2.10.3—Statement of Financial Position—shows all controlled assets and liabilities of the Department. The difference between these represents the net assets position, which is an indicator of the State's equity in the Department;
- •
- Table 2.10.4—Statement of Cash Flows—shows all movements of cash (cash received and paid). The cash impact of financing and investing activities on Departmental resources is highlighted in this statement; and
- •
- Table 2.10.5—Administered Items Statement—provides details of the Department's administered revenue and expenses (on an accrual basis), and its administered assets and liabilities.
Table 2.10.2: Statement of Financial Performance
| | 2000-01 Actual | 2001-02 Budget | 2001-02 Revised | 2002-03 Budget | Variation(a) | ||||||
|---|---|---|---|---|---|---|---|---|---|---|---|
| | ($ million) | (%) | |||||||||
| Revenue from ordinary activities | |||||||||||
| Output appropriations | 67.5 | 71.6 | 69.4 | 78.8 | 10.0 | ||||||
| Special appropriations | 24.2 | 26.8 | 27.8 | 23.8 | (11.2 | ) | |||||
| Resources received free of charge or for nominal consideration | 0.0 | — | — | — | — | ||||||
| Sale of goods and services | 1.1 | — | — | — | — | ||||||
| Commonwealth Grants | — | — | — | — | — | ||||||
| Taxes | — | — | — | — | — | ||||||
| Fines and Fees | — | — | — | — | — | ||||||
| Other revenue and revenue from other parties | (0.1 | ) | — | — | — | — | |||||
| 92.7 | 98.5 | 97.3 | 102.6 | 4.2 | |||||||
| Expenses from ordinary activities | |||||||||||
| Employee entitlements | 55.0 | 63.4 | 57.9 | 56.7 | (10.7 | ) | |||||
| Depreciation and amortisation | 3.5 | 3.8 | 3.8 | 6.1 | 61.7 | ||||||
| Resources provided free of charge or for nominal consideration | — | — | — | — | — | ||||||
| Grants and other payments | 0.8 | 0.5 | 0.4 | 0.5 | 5.3 | ||||||
| Capital asset charge | 0.8 | 0.8 | 0.8 | 0.8 | 1.8 | ||||||
| Supplies and services | 30.5 | 29.9 | 34.3 | 38.5 | 28.8 | ||||||
| Other expenses from ordinary activities | — | — | — | — | — | ||||||
| Borrowing costs | — | — | — | — | — | ||||||
| 90.5 | 98.5 | 97.3 | 102.6 | 4.2 | |||||||
| Result from ordinary activities | �� | 2.2 | — | 0.0 | — | — | |||||
| Loss from extraordinary items | — | — | — | — | — | ||||||
| Net result for the reporting period | 2.2 | — | 0.0 | — | — | ||||||
| Net increase in asset revaluation reserve | 38.4 | — | — | — | — | ||||||
| Total revenues, expenses and revaluation adjustments recognised directly in equity | 38.4 | — | — | — | — | ||||||
| Total changes in equity other than those resulting from transactions with Victorian State Government in its capacity as owner | 40.5 | — | 0.0 | — | — | ||||||
Source: Department of Treasury and Finance
- Note:
- (a)
- Variation between 2001-02 Budget and 2002-03 Budget.
Statement of Financial Performance
Parliament is expected to continue to maintain a balanced operating result for the 2002-03 Budget.
Operating revenue has decreased as a result of the completion of substantial maintenance work at 157 Spring Street, the run-down of additional IT operating funds approved for 2001-02 and savings flowing from the changed administrative and operational arrangements for motor vehicle leases. This has been partially offset by award related salary increases, increased depreciation expense associated with the completion of various asset investment projects including the air-conditioning project, increased remuneration for Members of Parliament and electorate offices.
Additional revenue of $3 million has been received by the Parliament for the following initiatives announced as part of this Budget:
- •
- provision of human resource management system for Parliament;
- •
- maintenance costs for the Parliamentary Chambers audio system; and
- •
- costs associated with the upgrade of Parliament's IT system standard operating environment.
Details of these initiatives are outlined in Budget Paper No. 2, Appendix A.
The movement in operating expenses from employee related expenses to the purchase of supplies and services reflects a decision by the Victorian Auditor-General's Office to contract out a portion of its audit work program.
Statement of Financial Position
Parliament's net asset position has remained stable from the 2002 Budget to the 2003 Budget. There has been an increase in non-current assets (receivables) due to Parliament receiving more depreciation than is required to fund the Parliament's current asset investment program. This has been partially offset by an increase in current liabilities resulting from movements in the provision for employee entitlements flowing from award related salary increases.
Table 2.10.3: Statement of Financial Position
| | Estimated as at 30 June | |||||||||||
|---|---|---|---|---|---|---|---|---|---|---|---|---|
| | 2001 Actual | 2002 Budget | 2002 Revised | 2003 Budget | Variation(a) | |||||||
| | ($ million) | (%) | ||||||||||
| Current assets | ||||||||||||
| Cash assets | (0.5 | ) | (0.5 | ) | (1.0 | ) | (1.0 | ) | 78.4 | |||
| Other financial assets | — | — | — | — | — | |||||||
| Receivables | 0.8 | 0.9 | 0.9 | 0.9 | — | |||||||
| Inventories | 0.1 | 0.1 | 0.1 | 0.1 | — | |||||||
| Prepayments | 0.8 | 0.8 | 0.9 | 0.9 | 6.8 | |||||||
| Other | — | — | — | — | — | |||||||
| Total current assets | 1.1 | 1.3 | 0.9 | 0.9 | (29.2 | ) | ||||||
| Non-current assets | ||||||||||||
| Receivables | 10.9 | 13.0 | 11.9 | 12.4 | (4.3 | ) | ||||||
| Inventories | — | — | — | — | — | |||||||
| Other financial assets | — | — | — | — | — | |||||||
| Property, plant and equipment | 172.6 | 175.2 | 175.6 | 176.5 | 0.7 | |||||||
| Intangible assets | — | — | — | — | — | |||||||
| Other | 9.2 | 9.2 | 9.2 | 9.2 | — | |||||||
| Total non-current assets | 192.7 | 197.5 | 196.7 | 198.2 | 0.4 | |||||||
| Total assets | 193.9 | 198.8 | 197.6 | 199.1 | 0.2 | |||||||
| Current liabilities | ||||||||||||
| Payables | 1.8 | 1.8 | 0.4 | 0.4 | (77.7 | ) | ||||||
| Interest bearing liabilities | — | — | — | — | — | |||||||
| Provisions(b) | 3.2 | 3.2 | 3.4 | 3.5 | 11.4 | |||||||
| Other | 0.4 | 0.4 | 0.4 | 0.4 | (1.9 | ) | ||||||
| Total current liabilities | 5.3 | 5.3 | 4.2 | 4.3 | (19.4 | ) | ||||||
| Non-current liabilities | ||||||||||||
| Interest bearing liabilities | — | — | — | — | — | |||||||
| Provisions(b) | 3.5 | 3.8 | 4.0 | 4.1 | 7.6 | |||||||
| Other | — | — | — | — | — | |||||||
| Amounts owing to other departments | — | — | — | — | — | |||||||
| Total non-current liabilities | 3.5 | 3.8 | 4.0 | 4.1 | 7.6 | |||||||
| Total liabilities | 8.8 | 9.1 | 8.2 | 8.4 | (8.1 | ) | ||||||
| Net assets | 185.1 | 189.7 | 189.5 | 190.7 | 0.6 | |||||||
| Equity | ||||||||||||
| Contributed capital | 4.9 | 9.5 | 9.3 | 10.5 | 11.4 | |||||||
| Reserves | 38.4 | 38.4 | 38.4 | 38.4 | — | |||||||
| Accumulated surplus | 141.8 | 141.8 | 141.8 | 141.8 | 0.0 | |||||||
| Total equity | 185.1 | 189.7 | 189.5 | 190.7 | 0.6 | |||||||
Source: Department of Treasury and Finance
- Note:
- (a)
- Variation between 2001-02 Budget and 2002-03 Budget.
- (b)
- Includes employee costs and superannuation.
Table 2.10.4: Statement of Cash Flows
| | 2000-01 Actual | 2001-02 Budget | 2001-02 Revised | 2002-03 Budget | Variation(a) | ||||||
|---|---|---|---|---|---|---|---|---|---|---|---|
| | ($ million) | (%) | |||||||||
| Cash flows from operating activities | |||||||||||
| Receipts from Government | 87.3 | 96.2 | 96.2 | 102.1 | 6.1 | ||||||
| Receipts from other entities | 1.0 | — | — | — | — | ||||||
| Payments for supplies, grants and employees | (86.2 | ) | (93.6 | ) | (93.3 | ) | (95.5 | ) | 2.1 | ||
| 2.1 | 2.7 | 2.8 | 6.6 | 145.5 | |||||||
| Interest received | 0.0 | — | — | — | — | ||||||
| Other revenue | (0.5 | ) | (0.1 | ) | (0.1 | ) | — | (100.0 | ) | ||
| Capital asset charge | (0.8 | ) | (0.8 | ) | (0.8 | ) | (0.8 | ) | 1.8 | ||
| Borrowing costs expense | — | — | — | — | — | ||||||
| Net cash inflow from operating activities | 0.8 | 1.7 | 1.9 | 5.7 | 231.9 | ||||||
| Cash flows from investing activities | |||||||||||
| Payments for property, plant and equipment(b) | (1.6 | ) | (6.4 | ) | (6.8 | ) | (7.0 | ) | 9.0 | ||
| Proceeds from sale of property, plant and equipment | — | — | — | — | — | ||||||
| Payments for investments | — | — | — | — | — | ||||||
| Proceeds from sale of business assets | — | — | — | — | — | ||||||
| (Repayment of) loans by other entities | — | — | — | — | — | ||||||
| Net cash (outflow) from investing activities | (1.6 | ) | (6.4 | ) | (6.8 | ) | (7.0 | ) | 9.0 | ||
| Cash flows from financing activities | |||||||||||
| Net Proceeds from capital contribution by State Government | 0.4 | 4.7 | 4.5 | 1.3 | (72.9 | ) | |||||
| Net proceeds of borrowings | — | — | — | — | — | ||||||
| Repayment of finance leases | — | — | — | — | — | ||||||
| Net cash inflow (outflow) from financing activities | 0.4 | 4.7 | 4.5 | 1.3 | (72.9 | ) | |||||
| Net increase (decrease) in cash held | (0.5 | ) | — | (0.4 | ) | — | — | ||||
| Cash at the beginning of the financial year | (0.1 | ) | (0.5 | ) | (0.5 | ) | (1.0 | ) | 78.4 | ||
| Cash at the end of the financial year | (0.5 | ) | (0.5 | ) | (1.0 | ) | (1.0 | ) | 78.4 | ||
Source: Department of Treasury and Finance
- Notes:
- (a)
- Variation between 2001-02 Budget and 2002-03 Budget.
- (b)
- Includes payments for land held for resale and research & development costs.
Statement of Cash Flows
Parliament's Statement of Cash Flows shows the that net cash flows from operating activities has increased by $4 million in 2002-03. This is the result of increased operating receipts primarily due to additional output and asset funding for budget initiatives. It has been partially offset by the completion of many of the projects in the 2001-02 asset investment program including Stage 1 of the air-conditioning upgrade, refurbishment of the Auditor-General's office, PARLYNET Stage 2 and improved Legislative Council office space.
Table 2.10.5: Administered Items Statement
| | 2000-01 Actual | 2001-02 Budget | 2001-02 Revised | 2002-03 Budget | Variation(a) | ||||||
|---|---|---|---|---|---|---|---|---|---|---|---|
| | ($ million) | (%) | |||||||||
| Administered revenue | |||||||||||
| Appropriations—Payments made on behalf of the State | — | — | — | — | — | ||||||
| Output Appropriation | — | — | — | — | — | ||||||
| Special appropriations | — | — | — | — | — | ||||||
| Resources received free of charge or for nominal consideration | — | — | — | — | — | ||||||
| Sale of goods and services | 11.6 | 14.4 | 8.5 | 9.5 | (34.1 | ) | |||||
| Commonwealth grants | — | — | — | — | — | ||||||
| Other grants | — | — | — | — | — | ||||||
| Taxes | — | — | — | — | — | ||||||
| Fines | — | — | — | — | — | ||||||
| Fees | — | — | — | — | — | ||||||
| Other | 0.1 | — | — | — | — | ||||||
| Total administered revenue | 12 | 14 | 9 | 9 | (34.1 | ) | |||||
| Administered expenses | |||||||||||
| Expenses on behalf of the State | 0.0 | — | — | — | — | ||||||
| Grants and other payments | — | — | — | — | — | ||||||
| Payments into the Consolidated Fund | 12.6 | 14.4 | 5.5 | 6.5 | (54.9 | ) | |||||
| Total administered expenses | 12.6 | 14.4 | 5.5 | 6.5 | (54.9 | ) | |||||
| Revenue less expenses | (0.9 | ) | — | 3.0 | 3.0 | — | |||||
| Administered assets | |||||||||||
| Cash assets | 0.0 | 0.0 | 0.0 | 0.0 | — | ||||||
| Receivables | 3.2 | 3.2 | 6.2 | 9.2 | 190.2 | ||||||
| Other financial assets | — | — | — | — | — | ||||||
| Inventories | — | — | — | — | — | ||||||
| Prepayments | — | — | — | — | — | ||||||
| Property, plant and equipment | — | — | — | — | — | ||||||
| Intangible assets | — | — | — | — | — | ||||||
| Other | — | — | — | — | — | ||||||
| Total administered assets | 3.2 | 3.2 | 6.2 | 9.2 | 189.9 | ||||||
| Administered liabilities | |||||||||||
| Payables | — | — | — | — | — | ||||||
| Interest bearing liabilities | — | — | — | — | — | ||||||
| Provisions | — | — | — | — | — | ||||||
| Amounts owing to other departments | — | — | — | — | — | ||||||
| Other | — | — | — | — | — | ||||||
| Total administered liabilities | — | — | — | — | — | ||||||
Source: Department of Treasury and Finance
Authority for Resources
This section provides a summary of the sources of Parliamentary Authority available to the Department to fund the provision of outputs, payments on behalf of State, and additions to the net asset base.
Table 2.10.6: Parliamentary Authority for Resources
| | 2001-02 Budget | 2001-02 Revised | 2002-03 Budget | Variation(a) | |||||
|---|---|---|---|---|---|---|---|---|---|
| | ($ million) | (%) | |||||||
| Annual appropriations(b) | 71.0 | 69.4 | 77.4 | 9.0 | |||||
| Receipts credited to appropriations | — | — | — | — | |||||
| Unapplied previous years appropriation | 5.2 | 4.4 | 2.7 | (48.5 | ) | ||||
| Accumulated surplus—previously applied appropriation | — | — | — | — | |||||
| Gross annual appropriation | 76.2 | 73.8 | 80.1 | 5.1 | |||||
| Special appropriations | 26.8 | 27.8 | 23.8 | (11.2 | ) | ||||
| Trust funds | — | — | — | — | |||||
| Total Parliamentary authority | 103.0 | 101.6 | 103.9 | 0.9 | |||||
Source: Department of Treasury and Finance
- Note:
- (a)
- Variation between 2001-02 Budget and 2002-03 Budget.
- (b)
- 2001-02 Revised includes the impact of approved Treasurer's Advances.
SUMMARY OF GENERAL GOVERNMENT SECTOR STATE REVENUE
In this statement, state revenue includes both state-sourced revenue and Commonwealth grants. The point of comparison adopted in this statement is the 2002-03 budget estimate against the revised estimate for 2001-02.
As shown in Table 3.1, general government sector revenue and grants received are expected to increase by 1.1 per cent to $25 282 million in 2002-03.
Table 3.1: General government sector revenue and grants received
| | 2001-02 Budget | 2001-02 Revised | 2002-03 Budget | Change(a) | ||||
|---|---|---|---|---|---|---|---|---|
| | ($ million) | (%) | ||||||
| Taxation | 7 976.5 | 8 758.0 | 8 802.7 | 0.5 | ||||
| Regulatory fees and fines | 374.2 | 386.6 | 554.0 | 43.3 | ||||
| Sale of goods and services | 2 111.6 | 2 037.7 | 2 049.9 | 0.6 | ||||
| Investment income | 938.2 | 1 049.4 | 1 061.6 | 1.2 | ||||
| Other revenue | 753.2 | 1 019.9 | 1 060.0 | 3.9 | ||||
| Grants received | 11 311.7 | 11 755.3 | 11 753.5 | -0.0 | ||||
| Total | 23 465.5 | 25 006.8 | 25 281.7 | 1.1 | ||||
Source: Department of Treasury and Finance
- Note:
- (a)
- Change between 2001-02 Revised and 2002-03 Budget.
Taxation revenue is projected to increase by 0.5 per cent in 2002-03 relative to the revised estimate for 2001-02, which is lower than the expected growth in nominal gross state product (GSP) (Table 3.2). The low growth in taxation revenue in 2002-03 is due mainly to moderation in property market activity, tax cuts announced in both Building Tomorrow's Businesses Today and this budget and the full year effect of taxes abolished under the Intergovernmental Agreement.
Commonwealth grants are expected to largely remain unchanged in 2002-03 compared to 2001-02. Victorian general purpose grants will decrease in 2002-03, despite a strong increase in GST revenue, because of a reduction in Victoria's share of the grant pool, a reduction in first home owner grant payments and the Commonwealth decision to unilaterally withdraw $134 million of funding in 2002-03 from the States and Territories under the pretence that it was collecting less petrol excise following its decision to cease the indexation of petroleum excise. The decrease has been largely offset by increases in specific purpose and other grants.
Regulatory fees and fines are expected to rise by 43.3 per cent in 2002-03 which largely reflects the introduction of road safety initiatives as part of an effort to reduce Victoria's road toll.
Investment revenue is expected to increase by 1.2 per cent to $1 062 million in 2002-03. The increase is primarily in interest received which is largely the consequence of rising yields and interest rates together with the 2001-02 surplus available for investment.
Proceeds from the sale of goods and services are expected to grow by only 0.6 per cent to $2 050 million, while other revenue is expected to increase by 3.9 per cent to $1 060 million.
STATE SOURCED REVENUE
Taxation
This section describes the structure of the most significant items of taxation.
Payroll tax
Payroll taxis levied on taxable wages, which are defined to include salaries and wages, commissions, bonuses, allowances, remunerations, employer superannuation contributions, relevant contracts and other benefits.
At present, payroll tax of 5.45 per cent is applicable to the annual payments of payroll in excess of a tax-free threshold of $515 000. In the April 2001 Better Business Taxes package, the Government announced a reduction in the payroll tax rate to 5.35 per cent from 1 July 2003. This announced reduction has now been brought forward in the Building Tomorrow's Businesses Today package by one year to 1 July 2002. In addition, the Government will further reduce the payroll tax rate to 5.25 per cent from 1 July 2003 as part of its commitment to improve the tax environment for business.
The Better Business Taxes package also announced that the payroll tax threshold would be increased from $515 000 to $550 000 from 1 July 2003. The increase in the threshold has also been brought forward by one year to 1 July 2002. This measure will also reduce tax compliance costs for small businesses that will move below the payroll tax threshold.
Table 3.2: Taxation estimates
| | 2001-02 Budget | 2001-02 Revised | 2002-03 Budget | Change(a) | |||||
|---|---|---|---|---|---|---|---|---|---|
| | ($ million) | (%) | |||||||
| Payroll tax | 2 607.2 | 2 608.5 | 2 710.1 | 3.9 | |||||
| Taxes on property | |||||||||
| Land tax | 567.0 | 519.3 | 611.4 | 17.7 | |||||
| Land transfer stamp duty | 1 150.0 | 1 850.0 | 1 590.0 | -14.1 | |||||
| Marketable securities duty | 12.1 | 20.0 | — | -100.0 | |||||
| Other property stamp duty | 169.1 | 230.0 | 209.8 | -8.8 | |||||
| Financial institutions duty | 32.8 | 36.0 | — | -100.0 | |||||
| Debits tax | 250.0 | 250.5 | 249.3 | -0.5 | |||||
| Metropolitan improvement levy | 72.7 | 74.1 | 74.8 | 1.0 | |||||
| Property owners contribution to fire brigades | 20.1 | 21.0 | 23.7 | 12.8 | |||||
| Financial accommodation levy | 4.1 | 4.5 | 5.2 | 14.9 | |||||
| Gambling taxes | |||||||||
| Private lotteries | 287.3 | 263.1 | 270.8 | 2.9 | |||||
| Electronic gaming machines | 894.9 | 906.3 | 972.7 | 7.3 | |||||
| Casino | 93.1 | 105.3 | 111.0 | 5.4 | |||||
| Racing | 96.0 | 95.9 | 97.5 | 1.7 | |||||
| Other | 2.8 | 2.8 | 3.0 | 7.1 | |||||
| Taxes on insurance | |||||||||
| Non-life insurance | 363.3 | 387.8 | 433.5 | 11.8 | |||||
| Life insurance | 11.0 | 13.8 | 14.0 | 1.4 | |||||
| Compulsory third party | 91.0 | 91.0 | 95.0 | 4.4 | |||||
| Insurance contributions to fire brigades | 230.5 | 232.9 | 247.3 | 6.2 | |||||
| Motor vehicle taxes | |||||||||
| Vehicle registration fees | 468.5 | 475.8 | 483.7 | 1.7 | |||||
| Stamp duty on vehicle transfers | 438.6 | 446.1 | 465.6 | 4.4 | |||||
| Other motor vehicle taxes | 82.8 | 91.5 | 101.5 | 10.9 | |||||
| Other taxes, licences and levies | 31.7 | 31.7 | 32.8 | 3.5 | |||||
| Total | 7 976.5 | 8 758.0 | 8 802.7 | 0.5 | |||||
Source: Department of Treasury and Finance
- Note:
- (a)
- Change between 2001-02 Revised and 2002-03 Budget.
The 3.9 per cent increase in payroll tax revenue between 2001-02 and 2002-03 reflects forecast employment and wages growth and an allowance for the rise in the superannuation guarantee contribution from 8 per cent to 9 per cent of wages from 1 July 2002. The effect of these increases has been significantly offset by the announced reduction in the tax rate and increase in the threshold. In addition, the Government has provided additional funding to the State Revenue Office for compliance staff which will further protect the revenue base by reducing the level of evasion.
Taxes on property
Land tax
Land tax is an annual tax assessed on the aggregated unimproved site value of taxable land owned by a landowner. Significant exemptions include for land that is used for primary production and land that is used as the landowner's principal place of residence.
In previous years, taxable site values were established by the use of an equalisation factor determined by the Valuer-General. The factor represented the average movement in land values within a municipality between the last valuation date and the prescribed date for land tax assessment. Equalisation factors were necessary as municipal valuations were taken at different times from the prescribed date.
The 2002 land tax assessments were based on the actual site value of land as at 1 January 2000 as determined by individual councils. For the 2003 land tax assessment the 1 January 2000 valuations will be adjusted by the Valuer-General's estimate of half the average movement in valuations for the municipality in which it is located between the January 2000 and January 2002 general valuations.
For the 2003 land tax assessments, the Government will increase the land tax threshold from $125 000 to $150 000. This measure is estimated to exempt 21 000 taxpayers (around 15 per cent of total taxpayers), or the equivalent of over 30 000 properties, from land tax in the 2003 land tax year.
Table 3.3 shows the rates which will apply to the year 2003 land tax assessments. These rates incorporate the increase in the tax-free threshold from $125 000 to $150 000.
Land tax revenue is expected to rise by 17.7 per cent to $611 million in 2002-03. Continued strong growth in unimproved site values, particularly in the residential sector, between 1 January 2000 and 1 January 2002 has driven this increase in revenues. The increase offsets reductions due to the Government's decision to increase the land tax threshold.
Table 3.3: Land tax rates
| Unimproved value ($) | 2003 Land tax payable | |
|---|---|---|
| up to $149 999 | Nil | |
| $150 000—$199 999 | $150 plus 0.1% for each dollar over $150 000 | |
| $200 000—$539 999 | $200 plus 0.2% for each dollar over $200 000 | |
| $540 000—$674 999 | $880 plus 0.5% for each dollar over $540 000 | |
| $675 000—$809 999 | $1 555 plus 1.0% for each dollar over $675 000 | |
| $810 000—$1 079 999 | $2 905 plus 1.75% for each dollar over $810 000 | |
| $1 080 000—$1 619 999 | $7 630 plus 2.75% for each dollar over $1 080 000 | |
| $1 620 000—$2 699 999 | $22 480 plus 3.0% for each dollar over $1 620 000 | |
| $2 700 000 and over | $54 880 plus 5.0% for each dollar over $2 700 000 |
Source: Land Tax Act 1958.
Stamp duty on financial transactions
Duty on land transfers
Stamp duty is payable on instruments of transfer involved in the change of ownership of land. The rates of stamp duty are shown in Table 3.4.
Table 3.4: Stamp duty on land transfers
| Value of property transferred | Stamp duty payable | |
|---|---|---|
| Up to $20 000 | 1.4% of the value of the property | |
| $20 001—$115 000 | $280 plus 2.4% of the value in excess of $20 000 | |
| $115 001—$870 000 | $2 560 plus 6.0% of the value in excess of $115 000 | |
| $870 001 and over | 5.5% of the value of the property |
In 2001-02 separate concession schemes apply for families purchasing their first home and concession card holders. Families buying their first home who satisfy specified income criteria, benefit from a full concession on homes valued up to $115 000, and a partial concession applies to homes valued between $115 000 and $165 000. To be eligible for relief, the combined annual taxable income of homebuyers with one child must also be under $39 000 and for a family with two or more children it must be under $40 000. For concession card holders, a full concession applies on homes valued up to $100 000, and a partial concession on homes valued between $100 000 and $130 000.
From 1 July 2002 a single concession scheme will apply to families purchasing their first home and concession card holders. A full concession will be provided for the purchase of homes valued up to $150 000 and a partial concession on homes valued between $150 000 and $200 000. The income test will also be dropped for family first home buyers.
For purchases 'off the plan', stamp duty is based on the value of work completed at the time of entering into the contract, as opposed to the total value of the project at the time of occupation. This concession is unique to Victoria.
The estimates forecast a moderation in property market activity in 2002-03, resulting in a return towards more normal levels of stamp duty on land transfers from the current peak in activity. Revenue is consequently expected to decrease by 14.1 per cent to $1 590 million in 2002-03.
Duty on marketable securities
In accordance with the Intergovernmental Agreement, duty on marketable securities listed on the Australian Stock Exchange or a recognised stock exchange ceased to apply from 1 July 2001.
The Government announced in the April 2001 Better Business Taxes package that duty on unlisted marketable securities would be abolished from 1 July 2003. The Government has determined that the abolition will now be brought forward to 1 July 2002. Until then the rate of duty is 60 cents for every $100 or part thereof.
No duty is payable on the transfer of corporate securities and mortgage-backed certificates traded in the secondary mortgage market.
Other property stamp duty
Stamp duty on other property is detailed in Table 3.5.
Table 3.5: Taxes on property—other property stamp duty
| | 2001-02 Budget | 2001-02 Revised | 2002-03 Budget | Change(a) | ||||
|---|---|---|---|---|---|---|---|---|
| | ($ million) | (%) | ||||||
| Duty on mortgages/debentures | 116.5 | 175.8 | 152.0 | -13.5 | ||||
| Duty on rental business | 47.0 | 48.9 | 51.4 | 5.1 | ||||
| Other miscellaneous stamp duty | 5.6 | 5.3 | 6.4 | 21.9 | ||||
| Total | 169.1 | 230.0 | 209.8 | -8.8 | ||||
Source: Department of Treasury and Finance
Duty on mortgages/debentures
Duty is payable on the issue of all mortgages, which are secured against real or personal property, and other generally unsecured bonds, debentures and covenants. There is an exemption for loan refinancing.
The duty payable depends on the amount secured by the document. A flat $4 is paid when the amount secured on an initial mortgage is between $200 and $10 000. When an initial mortgage exceeds $10 000, or the amount secured under an existing mortgage is increased, an additional 80 cents is payable for every additional $200 or part thereof secured under the mortgage.
Mortgage duty revenue is expected to decline by 13.5 per cent in 2002-03 relative to the revised estimate for 2001-02 reflecting moderation in property market activity in 2002-03, resulting in a return towards more normal levels of mortgage duty.
The Government announced in the April 2001 Better Business Taxes package that duty on mortgages will be abolished from 1 July 2004.
Duty on rental business
Any rental business that receives rental income in excess of $6 000 in any month must register and pay rental business duty. The rate of duty is 0.75 per cent of gross rental income. Hire purchase agreements are also subject to rental business duty with exemptions for some categories of commercial vehicles and farm machinery.
Other miscellaneous stamp duties
This category includes receipts from minor stamp duties such as duty on instruments of settlement, which is currently set at $200, and residual stamp duty on non-residential leases which was abolished on leases effected on or after 26 April 2001. The growth in revenue between 2001-02 and 2002-03 reflects a change in accounting procedures.
Financial institutions duty
Under the Intergovernmental Agreement, financial institutions duty ceased to apply from 1 July 2001.
Debits tax
Debits tax is levied on debits to cheque accounts or to bank accounts with cheque drawing facilities. Table 3.6 below outlines the rate structure.
Table 3.6: Debits tax duty rates
| Debit Range $ | Duty $ | |
|---|---|---|
| 1.00—99.99 | 0.30 | |
| 100.00—499.99 | 0.70 | |
| 500.00—4 999.99 | 1.50 | |
| 5 000.00—9 999.99 | 3.00 | |
| 10 000.00—or more | 4.00 |
Source: Debits Tax Act 1990.
Under the Intergovernmental Agreement, debits tax will cease to apply by 1 July 2005, subject to review by the Ministerial Council on Commonwealth-State Financial Relations.
Metropolitan improvement levy
The revenue is earmarked for expenditure on metropolitan parks and gardens by the Department of Natural Resources and Environment. The rate of the levy is set each year with regard to expected disbursements from the Trust and also with regard to the inflation rate, hence revenue growth is lower than underlying growth in the value of land.
Property owners contribution to fire brigades
Municipal councils whose districts are within or partly within the metropolitan area serviced by the metropolitan fire brigade are required, pursuant to section 37 of the Metropolitan Fire Brigades Act 1958, to contribute 12.5 per cent of the operating expenses of metropolitan fire brigade.
Revenue is expected to increase by 12.8 per cent in 2002-03.
Financial accommodation levy
The financial accommodation levy applies to Government owned entities declared by the Governor in Council to be leviable authorities for the purposes of the Financial Management Act 1994. Financial accommodation includes borrowings which entities undertake through the Treasury Corporation of Victoria (TCV). These TCV borrowings are usually at a lower interest rate than an entity would incur if it borrowed in its own right, rather than as a Government owned entity. The levy is determined using a credit rating approach to assess the competitive advantage a government business enterprise (GBE) receives in interest cost savings due to Government ownership. The levy is consistent with the competitive neutrality principles as prescribed by the National Competition Policy framework.
Gambling taxes
Gambling taxes are imposed on lotteries, electronic gaming machines, the casino, the racing industry, and some other minor forms of gambling.
More than 85 per cent of the Government's tax revenues from these forms of gambling are transferred by standing appropriation to the Hospitals and Charities Fund, the Mental Health Fund and the Community Support Fund.
Gambling taxes are expected to grow by 5.9 per cent in 2002-03, generally in line with household consumption together with a marginal increase in gambling as a share of consumption expenditure.
Private lotteries
Lotteries in Victoria are conducted by Tattersalls, a private sector organisation, operating under a licence issued pursuant to the Public Lotteries Act 2000.
The Public Lotteries Act 2000, which came into effect from 1 July 2001, replaced the Tattersall Consultations Act 1958. Under the Act the tax rates which now apply include 58.41 per cent of player loss in respect of the Tipstar AFL footy tipping competition, 57.52 per cent of player loss on soccer pools and 79.40 per cent of player loss on all other public lotteries. The 10 cent ticket levy was abolished from 1 July 2001.
Tattersalls also operates lotteries in Tasmania, the Northern Territory, the Australian Capital Territory and various foreign countries as part of the Victorian lottery pool. The Victorian Government collects and remits taxes on behalf of these jurisdictions.
Electronic gaming machines
Tattersalls and TABCORP are licensed to operate up to 27 500 electronic gaming machines in hotels and clubs throughout Victoria. This excludes the 2 500 gaming machines located in Crown Casino.
Under the Gaming Machine Control Act 1991, not less than 87 per cent of turnover must be returned to players as prizes. Tax is assessed on the net cash balance of the operators, the difference between the amounts bet and the amounts paid out in prizes. The net cash balance is split between the venue operator, the gaming operator and the Government. In the case of clubs, the gaming operators and the venues each receive 33.33 per cent. Of the balance, the GST accounts for 9.09 per cent with the State Government receiving the remaining 24.24 per cent. In the case of hotels, the net cash balance is similarly divided up except that the venue operator's share is 25 per cent, with 8.33 per cent being directed to the Community Support Fund.
Under a licence fee agreement, Tattersalls pays an additional 7 per cent of its net cash balance to the Government in tax in place of the previous arrangement.
A levy of $1 533 applies to each of the 30 000 electronic gambling machines operating in Victoria. The levy is payable by the three gaming operators and raises $10 million per year for spending on drug and alcohol programs with the remaining $36 million directed to the Hospitals and Charities Fund.
Casino
The total tax rate on ordinary players in Crown Casino is 22.25 per cent and on commission-based players it is 10 per cent. This includes a levy of 1 per cent of gross gaming revenue payable by the casino operator. This levy, known as the Community Benefit Levy, is used to finance public health services through a standing appropriation to the Hospitals and Charities Fund.
At least 87 per cent of amounts wagered by players on electronic gaming machines in the casino is required to be paid out as winnings to players. Amounts paid out as winnings on casino table games are determined by the rules of the individual games.
Racing taxes
TABCORP has been granted the exclusive licence to run off-course totalisators in Victoria, and is also authorised to run on-course totalisators at racecourses.
Under the Gaming and Betting Act 1994, a minimum of 80 per cent of the investments in any one totalisator must be returned to punters as prizes. The average payout from investments in all totalisators in any financial year cannot be less than 84 per cent. The tax rate is 19.11 per cent of the amount of commission deducted. The Government also receives 19.11 per cent of fractions, whereby fractions of 10 cents in a dividend calculation are rounded down to the nearest five cents.
Other gambling
Other gambling taxes consist principally of:
- •
- club keno, where gross gaming revenue is split equally between the Government (with the GST accounting for 9.09 per cent and the State Government receiving 24.24 per cent), the venues and the operators. The payout rate to players is 75 per cent;
- •
- permit fees for raffles, bingo and trade promotions; and
- •
- a tax payable on approved betting competitions (sports betting) at a rate of 10.91 per cent of net investments.
Taxes on insurance
Non-life insurance
Duty is payable on the value of premiums including GST at a rate of 10 per cent on general insurance business conducted in or outside Victoria which relates to any property, risk, contingency or event in the State. Exemptions from payment of this duty relate to policies against damage by hail to cereal and fruit crops, workers' compensation premiums, commercial marine hull insurance, private guarantee fidelity insurance schemes, insurance businesses carried on by organisations registered under Part VI of the Commonwealth National Health Act 1953 and transport insurance policies. Reinsurance policies are not dutiable.
Revenue from non-life insurance is expected to increase by 11.8 per cent to $434 million in 2002-03. Insurance premiums for some risk categories (for example, public liability and professional indemnity) have risen substantially over the past two years while household and motor vehicle insurance premiums have shown more moderate growth.
The reasons for the strong growth in premiums include balance sheet improvements by insurers, cyclical price movements, world events during 2001 and issues under investigation by the HIH Royal Commission. Insurance industry expectations are that premium growth will moderate after 2002.
Life insurance
Duty is also payable on life insurance policies for the sum insured. Revenue is expected to increase by only 1.4 per cent to $14 million in 2002-03. The low growth is consistent with trends away from life-insurance business in recent years.
Stamp duty on compulsory third party premiums
Duty is also payable on the value of compulsory third party insurance premiums at a rate of 10 per cent. Revenue grows in line with both population and CPI growth and is expected to increase by 4.4 per cent to $95 million in 2002-03.
Insurance contributions to fire brigades
Insurance companies are required to make contributions towards the availability of the two fire services in Victoria. Currently Victoria, like New South Wales, is on an insurance based funding model with no direct contributions from either landowners or ratepayers. However, both insurance companies and local government authorities can recover the required contributions as part of their premiums from both property owners and ratepayers.
The level of required contributions to the operating expenses of the Victorian fire services is prescribed under section 37 of the Metropolitan Fire Brigades Act 1958 (87.5 per cent) and section 76 of the Country Fire Authority Act 1958 (77.5 per cent). The remainder of the operating expenses is met through state government and municipal council contributions and direct charges by the brigades for attending fires on behalf of property owners who elect to not insure their properties.
Revenue is expected to increase by 6.2 per cent in 2002-03.
Motor vehicle taxes
Motor vehicle tax revenue is expected to rise by 3.7 per cent in 2002-03 reflecting the population driven growth in motor vehicle registration fees and the general demand and price driven growth in stamp duty revenue on motor vehicle transfers.
Motor vehicle registration fees
Motor vehicle registration fees are paid on:
- •
- heavy vehicles (over 4.5 tonnes in gross vehicle mass): there are uniform national registration charges to reflect high road wear caused by heavy vehicles;
- •
- light vehicles (under 4.5 tonnes in gross vehicle mass): there is an annual registration fee of $140, except where exemptions or concessions (for example, for pensioners) apply; and
- •
- motor cycles and private trailers (under 4.5 tonnes in gross vehicle mass): there is an annual registration fee of $28.
Motor vehicle stamp duty
Stamp duty is levied on the transfer and initial registration of motor vehicles, motor cycles or trailers in Victoria. The duty is levied on the market value or purchase price (whichever is greater) of the vehicle, at a progressive rate on new passenger vehicles, and at a flat rate for other vehicles. The rate scale is shown in Table 3.7.
Table 3.7: Stamp duty on motor vehicles
| Market value of vehicle $ | Stamp duty payable | |
|---|---|---|
| For a passenger car not previously registered: | ||
| 0—35 000 | $5.00 per $200 or part thereof on entire price | |
| 35 001—45 000 | $8.00 per $200 or part thereof on entire price | |
| 45 001 or more | $10.00 per $200 or part thereof on entire price | |
| For all other vehicles, not previously registered | $5.00 per $200 or part thereof on entire price | |
| For a vehicle which has been previously registered, regardless of where | $8.00 per $200 or part thereof on entire price | |
Source: Duties Act 2000
Under current arrangements, liability for payment of stamp duty is placed on the acquirer of a registered vehicle when the disposer is a registered used car dealer. The acquirer has a choice as to how to discharge the stamp duty liability—the duty may be paid directly to VicRoads within 14 days of the acquisition or alternatively a payment is made directly to the dealer who then transmits the stamp duty to the State Revenue Office.
Following extensive industry consultation the Government has decided to replace the current system, which is administratively inefficient and confusing, with a system whereby duty is payable to VicRoads on the application of transfer of registration. If the seller is a licensed motor car trader the acquirer pays the duty to the trader who must then send the duty with the application for transfer to VicRoads within 14 days.
Other motor vehicle taxes
Drivers' licence fees
The fee for a ten-year licence to drive on Victorian roads is $133. Applicants who suffer financial hardship can obtain a driver's licence for three-year periods at a fee of $39.
Road transport and maintenance taxes
This item consists of miscellaneous fees and charges administered by VicRoads, including driver licence testing fees, vehicle permit fees, registration related fees, taxi and tow truck fees, special vehicle licences, registration plate issues and other minor charges.
Other taxes on the use of goods and services
The items in this category are the landfill levy, which is aimed at reducing the volume of non-recyclable waste disposed of at Victorian landfills, concession fees payable by Transurban in respect of City Link and minor liquor licence fees.
Regulatory fees and fines
Revenue from regulatory fees and fines is expected to rise by $167 million (43.3 per cent) to $554 million in 2002-03 reflecting mainly an increase in traffic penalties and enforcement (see Table 3.8).
Table 3.8: Regulatory fees and fines
| | 2001-02 Budget | 2001-02 Revised | 2002-03 Budget | Change'(a) | ||||
|---|---|---|---|---|---|---|---|---|
| | ($ million) | (%) | ||||||
| Regulatory fees | ||||||||
| Wildlife licences | 6.3 | 6.3 | 6.8 | 8.7 | ||||
| Environment protection fees | 16.9 | 16.9 | 13.5 | -20.1 | ||||
| Business name and associated searches | 8.4 | 7.3 | 7.3 | 0.0 | ||||
| Occupational based licence fees | 10.4 | 17.9 | 19.5 | 9.3 | ||||
| Other regulatory fees | 84.1 | 101.8 | 114.7 | 12.7 | ||||
| Total regulatory fees | 126.1 | 150.0 | 161.8 | 7.8 | ||||
Fines | ||||||||
| Police fines | 206.1 | 182.1 | 336.6 | 84.8 | ||||
| Court and other fines | 42.0 | 54.4 | 55.6 | 2.2 | ||||
| Total fines | 248.1 | 236.5 | 392.3 | 65.8 | ||||
| Total regulatory fees and fines | 374.2 | 386.6 | 554.0 | 43.3 | ||||
Source: Department of Treasury and Finance
- Note:
- (a)
- Change between 2001-02 Revised and 2002-03 Budget.
Fees
Fees from regulatory services are levies, which are associated with the granting of a permit to engage in a particular activity, or to regulate that activity.
Regulatory fees in aggregate are forecast to increase by $12 million (7.8 per cent) in 2002-03 which reflects changed activity and fee structures over a large number of individual fees.
Fines
Revenue from fines, which is expected to increase by $156 million in 2002-03, is mainly derived from receipts related to traffic offences. This includes revenue from traffic infringement notices, the operations of the Traffic Camera Office and from payment of penalties imposed by the courts.
The Government is resolutely committed to improving road safety for all Victorians and reducing the annual toll from death and serious injury by 20 per cent over the next five years. In developing its core strategy, arrive alive!, the Government has drawn upon best practice and leading-edge research from both Australia and abroad. Enforcement measures will also be strengthened through the introduction of new detection technology including red light speed cameras which will detect both speeding and red light 'running' at high-risk intersections. In addition, the operation of existing cameras has been extended to maximise their potential impact on driver behaviour.
Sale of goods and services
Revenue from this source reflects those activities of departments where goods and services are sold to other parties. Examples of these activities include fees paid to TAFE institutes for courses that they give, car parking fees received by hospitals, visitor fees at parks collected by the Department of Natural Resources and Environment, and fees collected by courts and tribunals for processing legal documents.
As reported in Table 3.1, revenue from the sale of goods and services is estimated to be only $12 million (0.6 per cent) higher in 2002-03 than the revised estimate of $2 038 million for 2001-02. The low growth rate between 2001-02 and 2002-03 is partly the consequence of expected reductions in:
- •
- the level of external works which will be undertaken by VicRoads during 2002-03 (-$10 million);
- •
- revenue from forest activities resulting from the Our Forests Our Future policy statement (-$20 million); and
- •
- Titles Office revenue associated with land transactions reflecting an expected moderation in property market activity during 2002-03 (-$7 million).
Investment income
Investment income includes interest, royalties, dividends and other investment income. Dividends and other investment income consists primarily of the dividends and tax and rate equivalent payments made to the State by government business enterprises (GBEs).
Table 3.9 contains information on the estimates of investment income in 2002-03 and the change in revenue compared to the 2001-02 revised estimate.
The $12 million (1.2 per cent) increase in 2002-03 largely reflects an increase in interest revenue, which is largely due to expected rising yields and interest rates together with the 2001-02 cash surplus that will be available for investment.
Table 3.9: Investment income
| | 2001-02 Budget | 2001-02 Revised | 2002-03 Budget | Change(a) | ||||
|---|---|---|---|---|---|---|---|---|
| | ($ million) | (%) | ||||||
| Dividends and other investment income | ||||||||
| Gas industry | 110.0 | 120.5 | 0.4 | -99.7 | ||||
| Water industry | 265.9 | 303.8 | 279.2 | -8.1 | ||||
| Port authorities | 24.6 | 14.5 | 20.3 | 39.9 | ||||
| Public financial institutions | 191.1 | 80.9 | 171.6 | 112.1 | ||||
| Other | 27.6 | 37.9 | 41.4 | 9.4 | ||||
| 619.2 | 557.5 | 512.9 | -8.0 | |||||
| Interest received | 206.7 | 318.1 | 338.1 | 6.3 | ||||
| Investment gain/loss | — | 9.4 | -0.1 | -100.7 | ||||
| Brown coal royalties | 14.6 | 14.7 | 15.4 | 4.8 | ||||
| Other royalties | 27.4 | 26.6 | 26.0 | -2.3 | ||||
| Property rents | 70.3 | 123.1 | 169.3 | 37.5 | ||||
| Total | 938.2 | 1 049.4 | 1 061.6 | 1.2 | ||||
Source: Department of Treasury and Finance.
- Note:
- (a)
- Change between 2001-02 Revised and 2002-03 Budget.
Overall investment income from dividends and other investment income is expected to decrease by $45 million or 8.0 per cent with increases in some items offsetting decreases in others. In particular, distributions from the Transport Accident Commission are anticipated to increase based on investment market returns equivalent to a long-term average real return of 5 per cent per annum, while distributions from the gas industry are forecast to decrease with the proposed introduction of full retail contestability in September 2002. Distributions from the water industry are also forecast to decrease in line with a more subdued level of land development activity.
Dividends
The payment of dividends by GBEs recognises that equity capital has alternative uses and therefore an appropriate return should be paid to the State for its investment in the GBEs. Because of the absence of contestable capital and equity market disciplines for GBEs compared with those faced by private sector firms, a commercial dividend policy with two broad benchmarks is applied. For GBEs under the tax equivalent regime, the relevant benchmark dividend payout rate is 50 per cent of after-tax profit (where tax payable is not significantly different from tax expense). For other GBEs, including those not under the tax equivalent regime, a secondary benchmark payout rate of total distributions to the Government of 65 per cent of pre-tax profit is applicable.
Dividends are set each year with reference to the relevant benchmark and to other commercial considerations, including retained earnings, gearing, interest cover and cash flow projections. The views of the GBE Board and the budgetary requirements of the State are also taken into account. Prior to formal determination by the Treasurer, all dividend estimates are provisional.
For 2002-03, the dividend payments are expected to be $406 million.
Tax and rate equivalents
Income tax equivalent regimes, currently covering thirty five GBEs, ensure competitive neutrality of GBEs with competing private sector firms and strengthen the financial discipline of GBEs by factoring income tax equivalent payments into their business decisions. In 2002-03, income tax equivalent payments are expected to be $103 million. Significant land-holding GBEs (including the Melbourne Water Corporation and Urban and Regional Land Corporation) are also subject to a local government rate equivalent system. In 2002-03, local government rate equivalent payments are expected to be $3 million.
Under the Intergovernmental Agreement, Heads of Government indicated their intention to introduce a National Tax Equivalent Regime (NTER) for income tax for State and Territory GBEs. The NTER arrangements were endorsed by Ministerial Council in March 2001 and commenced operation on 1 July 2001. The NTER, administered by the ATO, will over time replace the existing Victorian Income Tax Equivalent Regime. Fifteen Victorian GBEs commenced under the NTER on 1 July 2001 and a further twenty will commence on 1 July 2002.
Property rents
Rental income from all property rentals is forecast to increase by $46 million (37.5 per cent) to $169 million in 2002-03. The main reason for the increase relates to income associated with the redevelopment of Spencer Street Station.
Other revenue
The 2002-03 Budget estimate of other revenue is $40 million (3.9 per cent) higher than the 2001-02 revised estimate (Table 3.10).
Table 3.10: Other revenue
| | 2001-02 Budget | 2001-02 Revised | 2002-03 Budget | Change(a) | ||||
|---|---|---|---|---|---|---|---|---|
| | ($ million) | (%) | ||||||
| Disposal of physical assets | 13.2 | 24.0 | 19.6 | -18.6 | ||||
| Assets received free of charge | — | 4.5 | 1.1 | -75.0 | ||||
| Capital asset charge | 489.0 | 489.0 | 501.0 | 2.5 | ||||
| Other | 251.0 | 502.4 | 538.3 | 7.2 | ||||
| Total | 753.2 | 1 019.9 | 1 060.0 | 3.9 | ||||
Source: Department of Treasury and Finance.
- Note:
- (a)
- Change between 2001-02 Revised and 2002-03 Budget.
The major reasons for the increase in 2002-03 are:
- •
- asset recoveries associated with the winding down of Tri-Continental which is expected to be deregistered by 2003 ($28 million);
- •
- payments by the Office of Housing as consideration for debt foregiveness associated with its rental operation ($17 million); and
- •
- capital assets charges revenue received from VicTrack ($12 million).
GRANTS RECEIVED
Summary information on the amounts budgeted to be received under these categories in 2001-02 and 2002-03 is set out in Table 3.11.
Table 3.11: Grants
| | 2001-02 Budget | 2001-02 Revised | 2002-03 Budget | Change(a) | ||||
|---|---|---|---|---|---|---|---|---|
| | ($ million) | (%) | ||||||
| Current grants | ||||||||
| GST grants | 5 933.1 | 5 689.0 | 6 154.2 | 8.2 | ||||
| GST transitional grants | 472.9 | 930.7 | 436.2 | -53.1 | ||||
| National competition policy | 177.7 | 179.6 | 182.0 | 1.3 | ||||
| General purpose grants | 6 583.7 | 6 799.3 | 6 772.4 | -0.4 | ||||
| Commonwealth specific purpose grants | 2 939.4 | 3 105.4 | 3 134.0 | 0.9 | ||||
| Specific purpose grants for onpassing | 1 146.1 | 1 143.9 | 1 179.4 | 3.1 | ||||
| Other current grants | 10.2 | 61.4 | 12.1 | -80.2 | ||||
| Total current grants | 10 679.4 | 11 110.0 | 11 097.9 | -0.1 | ||||
Capital grants | ||||||||
| Commonwealth specific purpose grants | 521.6 | 522.7 | 529.1 | 1.2 | ||||
| Specific purpose grants for onpassing | 110.7 | 113.3 | 116.9 | 3.2 | ||||
| Other capital grants | 9.3 | 9.6 | 3.9 | |||||
| Total capital grants | 632.3 | 645.3 | 655.6 | 1.6 | ||||
| Total grants | 11 311.7 | 11 755.3 | 11 753.5 | -0.0 | ||||
Source: Department of Treasury and Finance.
- Note:
- (a)
- Variation between 2001-02 Revised and 2002-03 Budget.
General purpose grants
General purpose grants are made up of GST grants, GST transitional grants and national competition policy payments. Victorian general purpose grants will decrease in 2002-03, despite a strong increase in GST revenue, because of a reduction in Victoria's share of the grant pool, a reduction in first home owner grant payments and the Commonwealth decision to unilaterally withdraw $134 million of funding in 2002-03 from the States and Territories under the pretence that it was collecting less petrol excise following its decision to cease the indexation of petroleum excise.
GST grants
In accordance with the Intergovernmental Agreement, which was signed by the previous Government in mid-1999, the States and Territories receive all GST revenue. The increases in GST grants for all States and Territories are due to forecast consumption growth in nominal terms and increased GST collections as a result of additional compliance effort by the ATO.
The GST revenue, which is distributed to the States in the form of GST grants, is centrally pooled and distributed on the basis of horizontal fiscal equalisation principles that applied to the distribution of financial assistance grants (FAGs) prior to 1 July 2000. The GST grant distributions between the States and Territories are determined by the GST relativities which are recommended by the Commonwealth Grants Commission (CGC) to the Commonwealth Government.
The CGC recommends two sets of relativities to the Commonwealth each year: one relating to GST revenue, and one relating to forgone FAGs. It is the latter set of relativities which are important, as forgone FAGs comprise an important component of each State and Territory's Guaranteed Minimum Amount.
Forgone FAGs are the most significant component of the GMA and are distributed based on the FAG relativities. It is estimated that the relativities recommended by the CGC in its February 2002 Update report will result in the following differences compared with an equal per capita distribution in 2002-03:
- •
- New South Wales:—$1 242 million;
- •
- Victoria:—$1 096 million;
- •
- Queensland: $207 million
- •
- Western Australia:—$185 million
- •
- South Australia: $596 million;
- •
- Tasmania: $480 million;
- •
- Australian Capital Territory: $90 million; and
- •
- Northern Territory: $1 150 million.
Following the introduction of the GST, the States and Territories no longer receive FAGs and revenue replacement payments from the Commonwealth. The States and Territories have also been required to adjust their gambling taxes to take into account the impact of the GST and to remove subsidies for off-road use of diesel. In addition, the States and Territories have to compensate the Commonwealth for the cost of the GST administration by the Australian Taxation Office, and to pay for the First Home Owner Grant scheme.
The Commonwealth has guaranteed in the Intergovernmental Agreement that the States and Territories will receive a Guaranteed Minimum Amount (GMA) to ensure that they are not worse off under the GST. To achieve this, the Commonwealth will make transitional assistance payments to each State and Territory to ensure that each receives a GMA during the transitional period.
The GMA is determined by the revenues and payments forgone by the States and Territories and the net impact of the new expenditures on the States and Territories from the introduction of the GST.
Victoria is likely to require budget balancing assistance until 2006-07 and will not gain from the Intergovernmental Agreement until at least 2007-08. The amount of budget balancing assistance expected in 2002-03 is around $436 million, compared with around $931 million in 2001-02.
The actual level of budget balancing assistance that Victoria will receive in 2002-03 will be $30 million lower than the estimate of budget balancing assistance consistent with the Intergovernmental Agreement. The agreed methodology for calculating the GMA broke the nexus between the amount of petroleum excise collected and the payments to the States and Territories. The Commonwealth has unilaterally withdrawn $134 million of funding in 2002-03 from the States and Territories under the pretence that it was collecting less petrol excise following its decision to cease the indexation of petroleum excise. The States and Territories consider the Commonwealth's action to be a clear breach of the Intergovernmental Agreement.
National Competition Policy payments
The Agreement to Implement National Competition Policy and Related Reforms 1995 provides for a series of competition payments to States and Territories from the Commonwealth. The competition payments are in exchange for implementation of reform commitments contained in this and other agreements that are collectively known as the National Competition Policy (NCP) Agreements. The criteria for receipt of the full amount of competition payments by the States and Territories relate to satisfactory progress in implementing these commitments.
The competition payments are designed to return to States and Territories the benefits of their reforms that are disproportionately realised by the Commonwealth though revenue and expenditure effects on the Commonwealth Budget.
In December 2001, the Commonwealth agreed to make the full allocation of competition payments to Victoria. Victoria's 2002-03 competition payments are estimated at $182 million with this figure to be updated for changes in both CPI and population growth estimates. Further third tranche payments in later years will be contingent on Victoria meeting all of its commitments. Since the commencement of competition payments in July 1996, Victoria has received the full amount of competition payments.
The Commonwealth Treasurer allocates competition payments on the basis of advice from the National Competition Council (NCC) following an assessment of progress made by the States and Territories. The NCC may recommend that the Treasurer reduce the competition payments where a State or Territory has not met the criteria contained in the Agreement.
On 3 November 2000, the Council of Australian Governments provided guidance to the NCC on the assessment of State and Territory entitlements. In making a recommendation that a reduction or suspension be applied to a particular State or Territory, the NCC must take into account:
- •
- the extent of overall commitment to the implementation of NCP by the relevant jurisdiction;
- •
- the effect of one jurisdiction's reform efforts on other jurisdictions; and
- •
- the impact of failure to undertake a particular reform.
The NCP—Third Tranche Assessment Framework, 5 February 2001, sets out the NCC's intended approach to the third tranche assessment. The NCC has indicated that it will recommend reductions in competition payments only as a last resort, that is, where no satisfactory path to dealing with implementation issues can be agreed.
Specific purpose grants
The Commonwealth gives grants to the States for a large number of specific purposes (such as programs or projects) under Section 96 of the Commonwealth Constitution. Such grants are usually made where the Commonwealth wishes to have some involvement in the direction of expenditure. However, the extent of such involvement varies significantly from one program to another. At one extreme there are programs, such as assistance for higher education, for which the Commonwealth provides the bulk of the funding. At the other, there are programs such as current funding for schools for which the States provide most of the funding.
Table 3.12 shows a breakdown by agency of the specific purpose grants, excluding those for on-passing received by Victoria. A brief description of the major grants is provided in the text that follows.
Commonwealth specific purpose grants are also paid to assist the functioning of legal aid schemes in every State. The Commonwealth provides funding for a share of the operating costs of State Legal Aid Commissions and for referrals to private practitioners on Commonwealth matters.
The grant provided to Victoria for the operating cost of Victoria Legal Aid in 2002-03 ($28.0 million) is paid directly to Victoria Legal Aid. Funds for Community Legal Centres are paid as a separate grant for distribution to the relevant centres.
Table 3.12: Commonwealth specific purpose grants by Department
| | 2001-02 Budget | 2001-02 Revised | 2002-03 Budget | Change(a) | ||||
|---|---|---|---|---|---|---|---|---|
| | ($ million) | (%) | ||||||
| Current grants | ||||||||
| Education and Training | 553.5 | 574.4 | 593.3 | 3.3 | ||||
| Human Services | 2 215.1 | 2 288.8 | 2 401.1 | 4.9 | ||||
| Infrastructure | 2.8 | 2.8 | 2.8 | — | ||||
| Innovation, Industry and Regional Development | — | 0.2 | 0.2 | — | ||||
| Justice | 42.1 | 44.0 | 45.3 | 2.9 | ||||
| Natural Resources and Environment | 56.0 | 58.8 | 52.4 | -10.8 | ||||
| Premier and Cabinet | 10.0 | 10.0 | 5.0 | -50.0 | ||||
| Tourism, Sport and Commonwealth Games | 0.9 | 0.2 | 0.2 | — | ||||
| Treasury and Finance | 31.7 | 98.7 | 5.7 | -94.2 | ||||
| Non budget—Legal Aid | 27.5 | 27.5 | 28.0 | 1.8 | ||||
| Total current grants | 2 939.4 | 3 105.4 | 3 134.0 | 0.9 | ||||
| Capital grants | ||||||||
| Education and Training | 95.6 | 95.6 | 96.7 | 1.1 | ||||
| Human Services | 172.8 | 172.1 | 168.1 | -2.3 | ||||
| Infrastructure | 242.2 | 244.0 | 264.3 | 8.3 | ||||
| Premier and Cabinet | 11.0 | 11.0 | — | -100.0 | ||||
| Total capital grants | 521.6 | 522.7 | 529.1 | 1.2 | ||||
| Total specific purpose grants | 3 461.0 | 3 628.1 | 3 663.1 | 1.0 | ||||
Source: Department of Treasury and Finance
- Note:
- (a)
- Change between 2001-02 Revised and 2002-03 Budget.
The detailed estimates included in the following tables represent the latest information available to state government departments. However, the Commonwealth budget is not due to be brought down until 14 May 2002 and, as a result, there may be variations to some of the information published in this Statement.
Education and Training
Commonwealth funding is provided for a range of Commonwealth and state programs for government and non-government schools and also vocational education and training. Funds are also provided to support Victoria's participation in national priority programs.
For school programs, the Commonwealth legislates funding allocations quadrennially without predicting likely cost movements over time. Supplementary funding is then provided retrospectively by amending legislation to meet any changes in costs that have occurred in the period.
Current funding is supplemented according to changes in actual per student costs in government schools (this is known as the Average Government School Recurrent Cost Index). Capital funding is supplemented in accordance with movements in the Building Price Index.
Commonwealth funds aimed at improving the delivery of national priority programs for Australian schools, including the States Grants (Primary and Secondary Education Assistance) Act 2000, flow to government and non-government schools via a number of programs including the Strategic Assistance for Improving Student Outcomes (SAISO) program which addresses literacy and numeracy and special learning needs.
Table 3.13: Department of Education and Training—Commonwealth specific purpose grants
| | 2001-02 Budget | 2001-02 Revised | 2002-03 Budget | Change(a) | ||||
|---|---|---|---|---|---|---|---|---|
| | ($ million) | (%) | ||||||
| Current grants | ||||||||
| General recurrent—assistance to government schools | 310.3 | 310.3 | 319.6 | 3.0 | ||||
| Commonwealth TAFE | 177.0 | 197.9 | 207.1 | 4.7 | ||||
| Literacy and numeracy program for government schools | 33.6 | 33.6 | — | -100.0 | ||||
| Special learning needs—special education | 15.8 | 15.8 | — | -100.0 | ||||
| Strategic assistance for improving student outcomes (SAISO)(b) | — | — | 49.8 | — | ||||
| Special learning needs—ESL new arrivals | 8.9 | 8.9 | 8.9 | 0.0 | ||||
| Special Commonwealth projects | 5.8 | 5.8 | 5.8 | 0.0 | ||||
| Indigenous education—strategic initiatives for government schools | 2.1 | 2.1 | 2.1 | 0.0 | ||||
| Total current grants | 553.5 | 574.4 | 593.3 | 3.3 | ||||
| Capital grants | ||||||||
| Government schools | 53.1 | 53.1 | 54.2 | 2.0 | ||||
| Commonwealth TAFE | 42.5 | 42.5 | 42.5 | 0.0 | ||||
| Total capital grants | 95.6 | 95.6 | 96.7 | 1.1 | ||||
| Total specific purpose grants | 649.1 | 670.0 | 690.0 | 3.0 | ||||
Source: Department of Treasury and Finance
- Note:
- (a)
- Change between 2001-02 Revised and 2002-03 Budget.
- (b)
- The new 2001-2004 Commonwealth-State Quadrennial Agreement for Schools funding has combined the Literacy and numeracy program for government schools, and Special Learning Needs—Special Education programs under the Commonwealth's SAISO initiative.
General recurrent—Assistance to government schools
This program provides funds under the State Grants (Primary and Secondary Education Assistance) Act 2000 to help government schools with the recurrent costs of school education.
Since 1997 (calendar year), this program has been subject to a Commonwealth initiative known as the Enrolment Benchmark Adjustment (EBA). Consequent to any fall in the proportion of students attending government schools compared to the 1996 school census, the Commonwealth will adjust the general recurrent grant for government schools. The formula underlying this adjustment will take a half share of notional savings accruing to the State through not having to provide educational services to new students in non-government schools. The Commonwealth has now offered to return this money to States, however not through the abolition of the EBA. Instead the Commonwealth has proposed the money be returned as a special purpose payment for use on public education within Commonwealth priority criteria.
The new Quadrennial Agreement for 2001 to 2004 which relates to the funding allocations for Commonwealth programs for schools was renegotiated in 2001 by the Victorian and Commonwealth Governments.
Commonwealth TAFE current and capital—Vocational education and training
Commonwealth funding for TAFE institutes is received under the Australian National Training Authority Act 1992 as amended and is subject to an annual agreement with the Australian National Training Authority (ANTA). It encompasses funding for recurrent programs, literacy, national projects, capital works and equipment funding.
From 1 January 1994, ANTA payments to Victoria have been made directly to the State Training Agency (currently the Learning and Employment Skills Commission) rather than passing through the Consolidated Fund. Funds are also provided directly to TAFE institutes under service contracts for the conduct of courses and training in respect of the Commonwealth Department of Education, Training and Youth Affairs programs.
A new Australian National Training (ANTA) Agreement was renegotiated for 2001 to 2003.
Strategic Assistance for Improving Student Outcomes (SAISO)
This Commonwealth program commencing in 2001 combines funding provided under the former Literacy and Numeracy Program—grants to schools and the Special Learning Needs—Special Education grants. The Victorian Government uses the resources provided through the program to improve learning outcomes of educationally disadvantaged students, particularly in literacy and numeracy and the educational participation and outcomes of students with disabilities. The program is available for school students from prep to year 12 who are educationally disadvantaged due to a range of factors including disability, a language background other than English, Aboriginal and Torres Strait Islander background, low socio-economic background and learning difficulties. Funding is also available for children with disabilities within Government special education centres.
Special Learning Needs—English Second Language (ESL) New Arrivals
Victoria receives resources through the Commonwealth to improve the educational opportunities and outcomes of newly arrived students of non-English speaking backgrounds by developing their English language competence and facilitating their participation in mainstream education activities. The program is targeted to students whose first language is not English or whose language commonly spoken in the home is not English, and whose proficiency in the English language is determined to require intensive assistance to enable those students to participate fully in mainstream classroom activities.
Special Commonwealth projects
The program area incorporates the National Asian Languages and Studies in Australian Schools (NALSAS), Languages other than English (LOTE) and the Country Areas Program. The NALSAS Strategy involves the provision of Commonwealth resources to foster the learning of Asian languages and studies. The LOTE program brings together the former Commonwealth Priority Languages and Community Languages programs. The new LOTE program provides assistance for students undertaking a study of a language other than English. The Commonwealth resources the educational participation, learning outcomes and personal development of rural and isolated students through the Country Areas program. Victoria uses these resources to improve the educational opportunities and outcomes of students who are educationally disadvantaged by geographic isolation.
Indigenous Education Strategic Initiatives for Government Schools
Victoria receives funding from the Commonwealth Government to provide assistance to Aboriginal people through various programs. These grants are provided to the Department of Education and Training, which then has the responsibility for the implementation of the National Aboriginal and Torres Strait Islander Educational Policy in Victoria. The funding is through a separate Agreement and Guidelines. The Department of Education is involved in separate negotiations with the Commonwealth over the Indigenous Education Strategic Initiatives Program (IESIP) Agreement.
Capital grants program—Government schools
This program is funded under the State Grants (Primary and Secondary Education Assistance) Act 2000. It seeks to improve educational outcomes by assisting in the provision of school facilities, particularly in ways that contribute most to raising the overall level of educational achievement of Australian school students.
Human Services
The Department receives a large number of specific purpose payments from the Commonwealth for various programs (see Table 3.14).
Table 3.14: Department of Human Services—Commonwealth specific purpose grants
| | 2001-02 Budget | 2001-02 Revised | 2002-03 Budget | Change(a) | ||||
|---|---|---|---|---|---|---|---|---|
| | ($ million) | (%) | ||||||
| Current grants | ||||||||
| Health care grant | 1 619.0 | 1 623.4 | 1 719.7 | 5.9 | ||||
| Home and community care | 166.7 | 167.3 | 177.4 | 6.0 | ||||
| Disability services | 112.1 | 113.0 | 115.6 | 2.3 | ||||
| Highly specialised drugs program | 67.0 | 78.0 | 80.0 | 2.6 | ||||
| Housing grant—other public housing | 55.1 | 56.0 | 57.5 | 2.6 | ||||
| Public health outcomes funding agreement | 38.6 | 43.3 | 44.2 | 2.0 | ||||
| Compensation for extension of pensioner benefits | 42.2 | 42.5 | 43.8 | 3.0 | ||||
| FBT transitional allowance | — | 46.1 | 40.5 | -12.2 | ||||
| Supported accommodation assistance | 33.7 | 34.0 | 34.7 | 1.9 | ||||
| National health development fund | 19.3 | 19.3 | 19.3 | — | ||||
| Blood transfusion services | 18.7 | 18.1 | 18.6 | 3.0 | ||||
| COAG drug diversion initiative | 8.5 | 9.1 | 13.5 | 47.3 | ||||
| Aged care assessment services | 10.5 | 11.0 | 11.3 | 2.5 | ||||
| Immunisation program | 6.1 | 6.0 | 6.1 | 1.5 | ||||
| Special education program | 4.7 | 8.3 | 6.0 | -28.0 | ||||
| National mental health information development plan | — | 3.8 | 5.4 | 39.1 | ||||
| All other current grants | 12.9 | 9.5 | 7.8 | -17.8 | ||||
| Total current grants | 2 215.1 | 2 288.8 | 2 401.1 | 4.9 | ||||
| Capital grants | ||||||||
| Housing—untied capital grants | 156.9 | 156.3 | 152.2 | -2.6 | ||||
| Housing—crisis accommodation | 9.9 | 9.9 | 9.9 | -0.1 | ||||
| All other capital grants | 6.0 | 6.0 | 6.1 | 1.2 | ||||
| Total capital grants | 172.8 | 172.1 | 168.1 | -2.3 | ||||
| Total specific purpose grants | 2 387.8 | 2 460.9 | 2 569.2 | 4.4 | ||||
Source: Department of Treasury and Finance
- Note:
- (a)
- Change between 2001-02 Revised and 2002-03 Budget.
Health Care Grant
The Australian Health Care Agreement (AHCA) commenced in 1998-99 and runs for five years. Renegotiations for the next five-year agreement are commencing this year.
The Commonwealth payments under the AHCA assist Victoria to meet the cost of providing public hospital services to eligible persons including inpatients, outpatients and emergency care.
Key features of the funding arrangements under AHCA include:
- •
- indexation of the base grant for population growth and ageing and the impact of additional demand growth and cost inflation as measured by the Commonwealth index (WCI-1); and
- •
- funding identified for quality improvement, mental health reform and palliative care.
Home and Community Care (HACC)
The agreement commenced in 1985 and has been revised from time to time. Victoria entered into the most recent agreement in 1998. There is no end date for the Agreement.
The aim of this program is to develop and deliver a range of integrated home and community care services to frail older people, people with disabilities and their carers. Services funded by the program include home care, respite, nursing, allied health, personal care, social support and meals. Local governments, district nursing services, community health centres and non-government organisations deliver these services either in the home or in community centres.
Under the Commonwealth-State HACC Agreement, the availability of additional Commonwealth funding requires the State to maintain existing levels of expenditure. Funds for expansion are provided by the Commonwealth on the basis that the State will provide matching funds based on an agreed ratio of approximately 60 per cent for the Commonwealth and 40 per cent for the State.
Disability Services
The Commonwealth-State Disability Agreement (CSDA) is the main agreement to fund specialist disability services and for measuring and reporting progress on the national framework for people with a disability. The objective of the national framework is to enhance the quality of life experienced by people with a disability through assisting them to live as valued and participating members of the community. From 1 July 1992, the State Government assumed administrative responsibility for accommodation and support services, while the Commonwealth Government assumed administrative responsibility for employment-related services for people with disabilities.
The current CSDA is due to expire on 30 June 2002. A National Disability Administrators CSDA Working Party has been established to progress a new agreement.
Highly Specialised Drugs Program
The Commonwealth provides funds to the State to meet the cost of specialised medicines with a high unit cost that have a significant role in maintaining patients in a community setting. Medicines for chronic conditions, because of their clinical use or special features, are restricted to supply through hospitals that have access to appropriate specialist facilities.
The Commonwealth is responsible for meeting the cost of medicines approved for the program in accordance with the Pharmaceutical Benefits Advisory Committee criteria in the community setting. Hospitals fund the use of medicines that do not meet the Committee's criteria.
Public housing—Untied grants
The States receive financial assistance from the Commonwealth to provide housing and other assistance with home ownership. Specific purpose payments are subject to the provisions of successive Commonwealth State Housing Agreements (CSHA), with requirements for the States to match certain Commonwealth assistance.
The CSHA establishes the framework for the provision of housing assistance across Australia for the period from 1 July 1999 to 30 June 2003. A multilateral four-year agreement was signed in July 1999. A bilateral agreement for this period was signed in May 2000. In addition, a core set of nationally consistent indicators and data for benchmarking purposes has been established by the National Housing Data Agreement.
The multilateral component outlined funding arrangements, guiding principles, allowable uses of assets and funds, and reporting requirements agreed between the States and Territories and the Commonwealth.
New Commonwealth-State arrangements for the period commencing July 2003 have yet to be negotiated.
Public Health Outcomes Funding Agreement
A new Public Health Outcomes Funding Agreement came into operation on July 1999 and will remain in force for five years. The agreement specifies performance indicators in a range of public health areas including AIDS education, women's health, breast screening, cervical cancer screening, and national drug strategy and immunisation programs. It aims to provide enhanced delivery of public health activities within nationally agreed policies and strategies. This grant now includes the Cytology and Gynaecological Services program.
Compensation for extension of pensioner benefits
The Commonwealth provides partial compensation to the States for the increased cost they incur in extending State concessions to cardholders eligible under broadened Commonwealth guidelines since 1993-94.
Fringe benefits tax transitional allowance
As part of its New Tax System in 2000-01, the Commonwealth Government removed the fringe benefits tax (FBT) exemption for employees of public benevolent institutions (PBIs). For employees of public hospitals, the exemption was replaced by a (grossed-up) $17 000 per employee FBT-free threshold from 1 July 2000. This meant that a large number of these employees faced the real potential of a reduction in their take-home pay. However, wage increases paid by the State Government to public hospital staff since then have specifically included compensation for the adverse financial impact of the loss of complete exemption from FBT.
As a result of negotiations between the Commonwealth Government and the Australian Democrats, the Commonwealth Government agreed to pay a fringe benefits tax transitional allowance (FBTTA) for hospitals that are PBIs as partial compensation for the increased costs for hospitals for the first three years (from 2000-01 to 2002-03) of the new tax regime.
The FBTTA in respect of employees of public hospitals is paid to state health authorities, which are required to pass it on to affected public hospitals. In Victoria, wage increases granted to workers in public hospitals since the introduction of the new FBT tax regime have included compensation for the reduction in value of their salary packages, and far exceed the FBTTA received in each year.
The total FBTTA to be paid to the Victorian State Health Authority over the three-year period is $135 million, including $46 million in 2001-02 and $41 million in 2002-03.
Supported Accommodation Assistance (SAAP)
The joint Commonwealth-State funded program provides funding for support services to homeless people and those affected by family violence to assist them in transition from a crisis accommodation situation to more appropriate longer term housing options.
Victoria signed a new SAAP multilateral framework in December 1999. Victoria signed a bilateral agreement in October 2000 that took effect on 1 July 2000 and will conclude on 30 June 2005.
The new agreement represents a significant attempt to streamline and simplify program management and ensure that the program performs better administratively. Features include increased attention to outcomes through an accountability framework, a commitment to improved and sustainable data, more clearly defined roles for each level of government including the ability of the Minister to approve funding to agencies without Commonwealth approval and more flexible funding arrangements.
National Health Development Fund
Under the Australian Health Care Agreement separate funds are allocated to enable health system reform. Funds are provided according to a plan jointly agreed between the Commonwealth and State Ministers. Projects supported under the plan are designed to improve patient outcomes, to improve efficiency and effectiveness, or reduce demand for the delivery of public hospital services, or improve integration of care between public hospital services and broader health and community care services.
The Victorian projects are designed around reform themes of strengthening health communications technology, re-engineering structural reform and developing a skilled workforce.
Blood Transfusion Services
Under the Blood Transfusion Services program funds are provided to ensure an adequate and safe supply of blood and blood products for therapeutic use in Victoria. This includes the collection, production and distribution of blood components for the hospital and health care system and plasma sent to CSL Ltd for the manufacture of a range of blood products. This is done in partnership between both Commonwealth and state governments and the Australian Red Cross Blood Service. Of the recurrent funds, the Commonwealth provides 40 per cent and the State 60 per cent, while capital funds are shared 50:50.
COAG Drug Diversion Initiative
The National Framework for Drug Diversion provides for a range of drug diversion initiatives. Programs cover education, drug diversion from the criminal system, support for families, strengthening needle and syringe exchange and prevention activities.
Aged Care Assessment Services (ACAS)
The Victorian ACAS is a joint Commonwealth and state funded program within the National Aged Care Assessment Program. The service assesses frail older people's care needs and refers them to community based support services, such as HACC, or to residential aged care. A recommendation from an ACAS is an essential prerequisite to entry to a Commonwealth funded residential aged care service. ACAS provides information and assists frail older people, and in some circumstances, younger people with disabilities to gain access to services they need, whether community support or residential care.
Immunisation Program
Immunisation expenditure includes:
- •
- the purchase of vaccines and the provision of immunisation services to pre-school and school children (through the Australian Childhood Immunisation Register) and adults according to the National Health & Medical Research Council schedule, issuing school entry immunisation certificates, provision of Hepatitis B immunisation to eligible Human Services staff and clients, and the provision of funding for several pilot projects including data cleaning and child record retrieval processes;
- •
- costs associated with the purchase of influenza vaccines. This program is a national program for older persons over 65 years of age and for indigenous people aged over 50 years, those aged 15-49 at high risk, and direct care staff and patients under 65 years at risk in public hospitals; and
- •
- the purchase of pneumococcal vaccine for pneumonia immunisation of persons aged 65 and over and for indigenous people aged over 50 years, and those aged 15-49 at high risk. Victoria is the only State in Australia that provides this immunisation to people aged 65 and over.
Special Education Program
The Commonwealth provides supplementary funding to improve educational participation and outcomes for children and young people with disabilities accessing support from non-government centres. Funding is provided via a quadrennial agreement expiring in 2004.
These funds are targeted to:
- •
- children with severe disabilities below school age level, to prepare them for integration into regular preschools or schools;
- •
- school aged children with severe disabilities, aimed at improving their access to educational programs; and
- •
- children and young people with disabilities in residential care.
National Mental Health Information Development Plan
This plan is a key component of the National Information Priorities and Strategies under the Second National Mental Health Plan (1998-2003). Victoria has entered into an agreement where the Commonwealth will provide total funding for the period 15 October 2001 to 30 June 2003.
The purpose of this agreement is to establish a basis for coordination of Victorian information development initiatives and priorities with the Commonwealth mental health information development proposals. Issues relating to principles, implementation processes, progressive funding through agreed milestones and preparation of detailed project plans are covered by this agreement.
Public Housing—Assistance for People in Crisis
These grants are targeted to provide housing for people in crisis.
Infrastructure
Table 3.15: Department of Infrastructure—Commonwealth specific purpose grants
| | 2001-02 Budget | 2001-02 Revised | 2002-03 Budget | Change(a) | ||||
|---|---|---|---|---|---|---|---|---|
| | ($ million) | (%) | ||||||
| Current grants | ||||||||
| Interstate road transport | 2.8 | 2.8 | 2.8 | — | ||||
| Capital grants | ||||||||
| Roads | 242.2 | 244.0 | 264.3 | 8.3 | ||||
| Total specific purpose grants | 245.0 | 246.8 | 267.1 | 8.2 | ||||
Source: Department of Treasury and Finance
- Note:
- (a)
- Change between 2001-02 Revised and 2002-03 Budget.
Interstate Road Transport
The Interstate Road Transport Act 1985 provides for the registration of vehicles and licensing of operators engaged in interstate trade and commerce under the Federal Interstate Registration Scheme (FIRS). The registration charge is designed to ensure that owners of vehicles solely engaged in interstate trade and commerce make a reasonable contribution to the maintenance costs of interstate roads. An agreed share of the revenue collected by the Commonwealth is paid to each State and Territory.
The Act was amended in 1995 to implement the national heavy vehicle charges developed by the National Road Transport Commission (NRTC) and approved by the Ministerial Council for Road Transport.
Australian Land Transport Development Program
Commonwealth grants for land transport are made through the Australian Land Transport Development (ALTD) Program. Grants from this program are used to construct and maintain National Highways and contribute to projects on declared Roads of National Importance (RONIs). These allocations are generally project specific and are made to foster economic development by improving road infrastructure.
National Highways in Victoria comprise the Hume, Sturt, Goulburn Valley and Western Highways and the section of the Ring Road between the Hume and Western Highways. The Calder Highway, Scoresby Freeway and Geelong Road are declared RONIs.
Innovation, Industry and Regional Development
Table 3.16: Department of Innovation, Industry and Regional Development—Commonwealth specific purpose grants
| | 2001-02 Budget | 2001-02 Revised | 2002-03 Budget | Change(a) | ||||
|---|---|---|---|---|---|---|---|---|
| | ($ million) | (%) | ||||||
| Specific purpose grants | — | 0.2 | 0.2 | -18.5 | ||||
Source: Department of Treasury and Finance
Justice
Table 3.17: Department of Justice—Commonwealth specific purpose grants
| | 2001-02 Budget | 2001-02 Revised | 2002-03 Budget | Change(a) | ||||
|---|---|---|---|---|---|---|---|---|
| | ($ million) | (%) | ||||||
| Current | ||||||||
| Compensation for transfer of corporate regulatory functions | 41.2 | 42.9 | 44.1 | 2.8 | ||||
| Other current grants | 0.9 | 1.1 | 1.2 | 6.9 | ||||
| Total specific purpose grants | 42.1 | 44.0 | 45.3 | 2.9 | ||||
Source: Department of Treasury and Finance
- Note:
- (a)
- Change between 2001-02 Revised and 2002-03 Budget.
Compensation for transfer of corporate regulatory functions
Until 31 December 1990, all States in Australia regulated their own corporate sector. The National Companies and Securities Commission (NCSC), a Commonwealth body, provided a cooperative national framework for corporate regulation.
On 1 January 1991, the NCSC was replaced by the Australian Securities Commission (ASC), now the Australian Securities and Investments Commission (ASIC). To ensure uniformity and efficiency in company and securities regulation, the States agreed to hand over their regulatory functions to the Commonwealth. Accordingly, since 1 January 1991, fees for the corporate regulatory function have been paid directly to the Commonwealth, but so that the States would not be financially disadvantaged by this new arrangement, it was agreed that they would be compensated by the Commonwealth for the resulting loss of revenues. This payment is recorded as a grant from the Commonwealth.
Natural Resources and Environment
Table 3.18: Department of Natural Resources and Environment—Commonwealth specific purpose grants
| | 2001-02 Budget | 2001-02 Revised | 2002-03 Budget | Change(a) | ||||
|---|---|---|---|---|---|---|---|---|
| | ($ million) | (%) | ||||||
| Current grants | ||||||||
| Natural heritage trust | 37.3 | 37.8 | 19.3 | -48.9 | ||||
| National action plan for salinity and water quality | 10.0 | 10.0 | 22.4 | 124.0 | ||||
| Forest industry structural adjustment program | 6.3 | 9.2 | 5.0 | -45.2 | ||||
| All other current grants | 2.3 | 1.8 | 5.6 | 215.7 | ||||
| Total specific purpose grants | 56.0 | 58.8 | 52.4 | -10.8 | ||||
Source: Department of Treasury and Finance
Natural Heritage Trust (NHT 2)
The NHT is the Commonwealth Government's natural resources and environmental management program. Stage 2 of the Trust commences in 2002-03. The main objective is to accelerate Australia's move to environmental sustainability and is designed to increase on-ground activities that address the causes of natural resource and environmental degradation. The NHT is jointly administered by Environment Australia and Agriculture, Fisheries and Forestry Australia. The NHT program is based on approved investments including those developed through accredited Regional Catchment Strategies for each of the Catchment Management Authorities (plus the Port Phillip CALP Board). A brief description of the objectives of the current program themes is provided below.
- •
- Landcare: reversing land degradation and promoting sustainable agriculture.
- •
- Bushcare: conserving and restoring habitat for our unique native flora and fauna which underpins the health of our landscapes.
- •
- Rivercare: improving water quality and environmental flows in our river systems and wetlands.
- •
- Endangered Species Program: an initiative to accelerate the protection and conservation of Australia's native species and ecological communities in the wild.
- •
- Fisheries Action Program: a program that aims to rebuild Australia's fisheries to more productive and sustainable levels through restoration and protection of fish habitat, encouragement of community participation in activities to improve fisheries ecosystems, control of aquatic pests, and encouragement of sustainable and responsible commercial and recreational fishing.
- •
- National Wetlands Program: an initiative to promote the conservation, repair and wise use of wetlands across Australia.
- •
- Coastal Action Program: this program aims to ensure that coastal zone resources optimise long term benefits to the community. Specifically, the program aims to maintain coastal ecological and physical values, including the biological diversity and productivity of marine and terrestrial ecosystems.
- •
- Australia's Oceans Policy: this program aims to assist the development of an environmentally safe alternative to tributyltin (TBT) and promote the implementation of the Commonwealth Government's ban on harmful TBT used in anti-foulants. The program aims to do this by supporting research into suitable anti-foulant alternatives and hull-cleaning systems, monitoring the environmental impact of TBT alternatives, and educating the community about the proposed ban and the use of suitable anti-foulants.
National Action Plan for Salinity and Water Quality
Under the Action Plan, the Commonwealth will match state funding over seven years (2001-02 to 2008-09) to prevent, stabilise and reverse trends in salinity, particularly dryland salinity, conserve biological diversity and improve water quality. Implementation of the plan will also secure reliable water allocations for human uses, industry and the environment.
Forest Industry Structural Adjustment Program
The program aims to help the forest industry adjust to impacts resulting from the Regional Forest Agreement (RFA) process and support development initiatives which enhance the responsible, sustainable and productive use of our hardwood forest resources. The RFA process will provide industry with greater resource security and provide a response to the challenges of changing markets and community interests in native forest production. Financial assistance is available for initiatives that will support priority areas for industry development.
Premier and Cabinet
Table 3.19: Department of Premier and Cabinet—Commonwealth specific purpose grants
| | 2001-02 Budget | 2001-02 Revised | 2002-03 Budget | Change(a) | ||||
|---|---|---|---|---|---|---|---|---|
| | ($ million) | (%) | ||||||
| Current grants | ||||||||
| National Gallery of Victoria—Federation funding | 10.0 | 10.0 | 5.0 | -50.0 | ||||
| Capital grants | ||||||||
| Federation Square—Australian Centre for Moving Image | 11.0 | 11.0 | — | -100.0 | ||||
| Total specific purpose grants | 21.0 | 21.0 | 5.0 | -76.2 | ||||
Source: Department of Treasury and Finance
- Note:
- (a)
- Change between 2001-02 Revised and 2002-03 Budget.
National Gallery of Victoria—Federation Funding
The Commonwealth is providing a grant from the Centenary of Federation Fund to the National Gallery of Victoria to assist their building redevelopment project.
Federation Square—Australian Centre for Moving Image
The Commonwealth contributed $50 million towards the Federation Square project, for the development of the Australian Centre for Moving Image. Funding totalling $39 million was provided in 2000-01 and the remaining $11 million was provided in 2001-02.
Tourism, Sport and the Commonwealth Games
Table 3.20: Department of Tourism, Sport and the Commonwealth Games—Commonwealth specific purpose grants
| | 2001-02 Budget | 2001-02 Revised | 2002-03 Budget | Change(a) | ||||
|---|---|---|---|---|---|---|---|---|
| | ($ million) | (%) | ||||||
| Current specific purpose grants | 0.9 | 0.2 | 0.2 | — | ||||
Source: Department of Treasury and Finance
- Note:
- (a)
- Change between 2001-02 Revised and 2002-03 Budget.
Current specific purpose grants administered through the Department of Tourism, Sport and the Commonwealth Games include those under the Australian Sports Commission organisation development program, the indigenous sports program and the Young persons sport and recreation development program.
Treasury and Finance
Table 3.21: Department of Treasury and Finance—Commonwealth specific purpose grants
| | 2001-02 Budget | 2001-02 Revised | 2002-03 Budget | Change(a) | ||||
|---|---|---|---|---|---|---|---|---|
| | ($ million) | (%) | ||||||
| Current | ||||||||
| Debt redemption assistance | 5.2 | 5.2 | 5.2 | — | ||||
| Commonwealth new home grant | 26.0 | 93.0 | — | -100.0 | ||||
| Other current grants | 0.4 | 0.4 | 0.4 | — | ||||
| Total specific purpose grants | 31.7 | 98.7 | 5.7 | -94.2 | ||||
Source: Department of Treasury and Finance
- Note:
- (a)
- Change between 2001-02 Revised and 2002-03 Budget.
Debt redemption assistance
At the June 1990 Premiers' Conference and Loan Council Meeting, it was agreed that the States would progressively assume the management of debt raised by the Commonwealth on behalf of the States under the Financial Agreement. As a result, the States are required to issue securities through their respective borrowing authorities to fund the redemption of maturing Financial Agreement debt. Because the cost at which state borrowing authorities can raise funds exceeds that of the Commonwealth and so that the States are not disadvantaged, the Commonwealth will compensate them for the additional borrowing costs through a grant. The amount of compensation provided to the States is based on the average interest rate margins between Commonwealth and State debt over the period 1 January 1990 to 30 June 1990. The debt redemption assistance grant is scheduled to cease at the end of the financial year 2003-04.
Commonwealth New First Home Owners Grant
These payments are to first home buyers of new homes who met the Commonwealth specifications of a 'new' home. An additional grant of $7 000 applied to the purchase or construction of 'new' homes between 9 March 2001 and 31 December 2001. The additional grant was extended but reduced to $3 000 for the period of 1 January 2002 until 30 June 2002.
Specific purpose grants for on-passing
Not all specific purpose grants are for state budget programs. A substantial proportion of these are for 'on-passing' to various bodies such as non-government schools and local government authorities. In such cases, the State simply acts as the vehicle for distributing the Commonwealth funds.
Education and Training
Current Grants Program—Assistance to Non Government schools
General recurrent grants
The Commonwealth's Grants for non-government Schools Program provides funds to help non-government schools and systems with the recurrent and capital costs of school education. It is a major revenue source for a large proportion of non-government schools. In the 2001-2004 quadrennium, the Commonwealth has abolished the Education Resources Index as its basis for the needs-based recurrent funding of non-government schools and replaced it with a purpose-built model based on the relative socio-economic status (SES) of school communities. Under the new SES model, the minimum funding entitlement on a per student basis is set at 13.7 per cent of the Average Government School Recurrent Costs (AGSRC) and payable to schools with an SES score of 130 or more. The maximum payment is set at 70 per cent of the AGSRC and payable to schools with SES scores of 85 or below.
Targeted programs
The Commonwealth's Grants for Commonwealth Targeted Programs provide assistance to both government and non-government schools and systems. For the 2001-2004 quadrennium, the two priorities for targeted assistance are:
- •
- improving learning outcomes for educationally disadvantaged students; and
- •
- improving outcomes in specific targeted teaching and learning areas.
The program includes support in areas including English as a Second Language, National Asian Languages and Studies in Australian Schools, disability, geographic disadvantage (country areas), human services and other strategic assistance.
Capital Grants Program—Assistance to Non Government Schools
Commonwealth grants for capital expenditure for non-government schools are provided under the Non-Government component of the General Element of the Capital Grants Program. The assistance is provided in the form of block grants which aim to improve educational outcomes by assisting in the provision of school facilities.
Table 3.22: Commonwealth grants for on-passing
| | 2001-02 Budget | 2001-02 Revised | 2002-03 Budget | Change(a) | ||||
|---|---|---|---|---|---|---|---|---|
| | ($ million) | (%) | ||||||
| Current grants | ||||||||
| Education and Training - | ||||||||
| Assistance to non government schools | 854.4 | 854.4 | 880.0 | 3.0 | ||||
| Targeted program for non government schools | 52.6 | 52.6 | 54.1 | 3.0 | ||||
| Advanced English for migrants | 1.6 | — | — | — | ||||
| Infrastructure - | ||||||||
| Financial assistance grants to local government | 237.5 | 236.9 | 245.2 | 3.5 | ||||
| Total current grants | 1 146.1 | 1 143.9 | 1 179.4 | 3.1 | ||||
| Capital grants Education and Training - | ||||||||
| Non government schools | 26.2 | 26.2 | 26.8 | 2.0 | ||||
| Infrastructure - | ||||||||
| Identified road grants to local government | 84.5 | 87.1 | 90.1 | 3.5 | ||||
| Total capital grants | 110.7 | 113.3 | 116.9 | 3.2 | ||||
| Total specific purpose grants | 1 256.8 | 1 257.2 | 1 296.3 | 3.1 | ||||
Source: Department of Treasury and Finance
- Notes:
- (a)
- Variation between 2001-02 Revised and 2002-03 Budget.
- (b)
- The Commonwealth's Advanced English for migrants program is no longer administered by state governments.
Infrastructure
General purpose financial assistance to local government
General purpose financial assistance to local government has been in existence since 1974-75. An equal per capita basis of distributing total assistance to the States and Territories was phased in and has been in operation from 1989-90. This occurs pursuant to the Local Government (Financial Assistance) Act 1995.
Local government roads funding was part of specific purpose grants in 1990-91. From 1991-92 local roads funding was included in, but separately identified from, general purpose grants. This funding is paid under the Local Government (Financial Assistance) Act 1995 and distributed through the Victoria Grants Commission.
The Public Account is the Government's official bank account. The Account holds the balances of the Consolidated Fund and the Trust Fund.
The Public Account is maintained at one or more banks, as required by the Financial Management Act 1994 (FMA). The State's financial transactions on the Public Account are recorded in a Public Ledger.
The Act also provides for:
- •
- temporary advances from the Public Account for a number of purposes related to the needs of the Government;
- •
- investment of the Public Account in trustee securities; and
- •
- temporary borrowings should the balance in the Consolidated Fund be insufficient to meet commitments during a financial year.
Consolidated Fund
The Consolidated Fund is the Government's primary financial account, established by the FMA, and receives all Consolidated Revenue under the Constitution Act 1975 from which payments appropriated by Parliament are made.
The Trust Fund
Within the Public Account, the Trust Fund embraces a range of special purpose accounts established for funds that are not necessarily subject to State appropriation. Examples of this include specific purpose payments from the Commonwealth on-passed by the State to third parties; holding balances in suspense accounts for accounting purposes; working accounts for commercial and departmental service units and facilitating the receipt and disbursement of private funds held by the State in trust. Additional funds may also be established within the Trust Fund to receive State revenues hypothecated to particular purposes (e.g. lotteries revenue for hospitals and charities).
Table 4.1: The Consolidated Fund
Estimated receipts and payments for the year ended 30 June 2002 and for the year ended 30 June 2003
| | 2001-02 Budget | 2002-03 Budget | Variation | |||
|---|---|---|---|---|---|---|
| | ($ million) | (%) | ||||
| Receipts | ||||||
| Taxation | 7 936 | 8 753 | 10.3 | |||
| Fines and regulatory fees | 274 | 394 | 43.5 | |||
| Grants received | 8 698 | 10 149 | 16.7 | |||
| Sales of goods and services (including S.29 FMA annotated) | 204 | 485 | 137.9 | |||
| Interest received | 127 | 190 | 50.0 | |||
| Public authority income | 636 | 519 | -18.4 | |||
| Other receipts | 1 893 | 2 012 | 6.3 | |||
| Total operating activities | 19 768 | 22 502 | 13.8 | |||
Total cash inflows from investing and financing | 118 | 12 | - -89.8 | |||
| Total receipts | 19 886 | 22 514 | 13.2 | |||
| Payments | ||||||
| Special Appropriations | 2 088 | 2 380 | 13.9 | |||
| Appropriations | ||||||
| Provision of Outputs | 16 372 | 17 331 | 5.9 | |||
| Additions to Net Asset Base | 714 | 831 | 16.3 | |||
| Payments made on behalf of State | 1 534 | 1 586 | 3.4 | |||
| Receipts credited to appropriation | ||||||
| Provision of Outputs | 1 345 | 1 429 | 6.2 | |||
| Additions to Net Asset Base | 22 | 15 | -35.0 | |||
| Payments made on behalf of State | 23 | 10 | -56.7 | |||
| Sub total | 22 100 | 23 581 | 6.7 | |||
| Total payments | 22 100 | 23 581 | 6.7 | |||
Source: Department of Treasury and Finance
Table 4.2: Consolidated Fund Receipts
| | 2001-02 Budget | 2002-03 Budget | Variation | |||
|---|---|---|---|---|---|---|
| | ($ million) | (%) | ||||
| Operating receipts | ||||||
Taxation | ||||||
| Payroll tax | 2 906 969 | 3 037 793 | 4.5 | |||
| Property tax | 567 500 | 611 541 | 7.8 | |||
| Stamp duty | ||||||
| Financial and capital transactions | 1 162 100 | 1 590 000 | 36.8 | |||
| Stamp duties | 166 700 | 205 800 | 23.5 | |||
| Financial accommodation levy | 4 089 | 5 176 | 26.6 | |||
| Financial transaction taxes | 282 800 | 249 300 | -11.8 | |||
| Other property taxes | — | — | — | |||
| Gambling | ||||||
| Private lotteries | 326 700 | 310 900 | -4.8 | |||
| Electronic gaming machines | 894 900 | 972 700 | 8.7 | |||
| Casino taxes | 92 393 | 110 149 | 19.2 | |||
| Racing | 96 000 | 97 500 | 1.6 | |||
| Other gambling | 2 800 | 3 000 | 7.1 | |||
| Insurance | 465 300 | 542 500 | 16.6 | |||
| Motor Vehicle | ||||||
| Road Safety Act (Registration Fees) | 470 100 | 482 930 | 2.7 | |||
| Stamp duty on vehicle transfers | 438 600 | 465 600 | 6.2 | |||
| Other drivers licences | 52 380 | 61 121 | 16.7 | |||
| Franchise Fees | ||||||
| Petroleum | — | — | — | |||
| Tobacco | — | — | — | |||
| Liquor | 7 000 | 7 000 | 0.0 | |||
| Energy (Electricity) | — | — | — | |||
| Total | 7 936 331 | 8 753 010 | 10.3 | |||
Fines and regulatory fees | ||||||
| Fines | 192 363 | 319 282 | 66.0 | |||
| Regulatory fees | 82 043 | 74 413 | -9.3 | |||
| Total | 274 406 | 393 695 | 43.5 | |||
Grants received | ||||||
| Grants received | ||||||
| Grants received by department | ||||||
| Education, Employment and Training | 376 446 | 431 854 | 14.7 | |||
| Human Services | 1 661 156 | 2 569 219 | 54.7 | |||
| Infrastructure | — | 267 100 | — | |||
| Innovation, Industry, and Regional Development | — | 194 | — | |||
| Justice | 42 776 | 46 539 | 8.8 | |||
| Natural Resources and Environment | 500 | 52 887 | na | |||
| State and Regional Development | — | — | — | |||
| Tourism, Sport, and the Commonwealth Games | — | 3 073 | — | |||
| Treasury and Finance | 6 616 943 | 6 778 143 | 2.4 | |||
| Premier and Cabinet | — | — | — | |||
| Parliament | — | — | — | |||
| Total | 8 697 821 | 10 149 009 | 16.7 | |||
Sales of goods and services | 203 903 | 485 122 | 137.9 | |||
Interest received | 126 891 | 190 280 | 50.0 | |||
Public authority income | ||||||
| Public authority dividends | 498 228 | 406 148 | -18.5 | |||
| Public authorities income tax equivalent receipts | 135 626 | 109 659 | -19.1 | |||
| Public authorities local government tax equivalent receipts | 2 200 | 3 000 | 36.4 | |||
| Total | 636 054 | 518 807 | -18.4 | |||
Other receipts | ||||||
| Land rent received | 16 281 | 15 962 | -2.0 | |||
| Royalties received | 41 659 | 41 104 | -1.3 | |||
| Other | 1 834 813 | 1 954 897 | 6.5 | |||
| Total | 1 892 753 | 2 011 963 | 6.3 | |||
| Total operating activities | 19 768 159 | 22 501 886 | 13.8 | |||
Cash inflows from investing and financing | ||||||
| Loans to GBE's | 84 816 | 1 807 | -97.9 | |||
| Proceeds from sale of investments | — | — | — | |||
| Other loans | 3 013 | 2 082 | -30.9 | |||
| Other | 29 719 | 8 115 | -72.7 | |||
| Total cash inflows from investing and financing | 117 548 | 12 004 | -89.8 | |||
| Total Consolidated Funds Receipts | 19 885 707 | 22 513 890 | 13.2 |
Source: Department of Treasury and Finance
Table 4.3: Consolidated Fund payments: summary
| | 2001-02 Budget | 2002-03 Budget | Variation | |||
|---|---|---|---|---|---|---|
| | ($ million) | (%) | ||||
| Education and Training | ||||||
| Special Appropriations(a) | 250 | 250 | — | |||
| Annual Appropriations(b) | 5 248 983 | 5 379 756 | 2.5 | |||
| Total | 5 249 233 | 5 380 006 | 2.5 | |||
Human Services | ||||||
| Special Appropriations (a) | 1 140 100 | 1 146 100 | 0.5 | |||
| Annual Appropriations(b) | 6 373 864 | 7 029 060 | 10.3 | |||
| Total | 7 513 964 | 8 175 160 | 8.8 | |||
Infrastructure | ||||||
| Special Appropriations | — | — | — | |||
| Annual Appropriations(b) | 2 584 140 | 2 883 518 | 11.6 | |||
| Total | 2 584 140 | 2 883 518 | 11.6 | |||
Innovation, Industry and Regional Development | ||||||
| Special Appropriations | — | — | — | |||
| Annual Appropriations(b) | 384 048 | 430 577 | 12.1 | |||
| Total | 384 048 | 430 577 | 12.1 | |||
Justice | ||||||
| Special Appropriations | 97 668 | 130 632 | 33.8 | |||
| Annual Appropriations(b) | 1 816 900 | 2 042 977 | 12.4 | |||
| Total | 1 914 568 | 2 173 609 | 13.5 | |||
Natural Resources And Environment | ||||||
| Special Appropriations (a) | 10 100 | 3 500 | -65.3 | |||
| Annual Appropriations(b) | 925 712 | 1 075 634 | 16.2 | |||
| Total | 935 812 | 1 079 134 | 15.3 | |||
Premier And Cabinet | ||||||
| Special Appropriations | 119 214 | 131 024 | 9.9 | |||
| Annual Appropriations(b) | 446 644 | 421 267 | -5.7 | |||
| Total | 565 858 | 552 291 | -2.4 | |||
State and Regional Development | ||||||
| Special Appropriations | — | — | — | |||
| Annual Appropriations(b) | 326 508 | — | -100.0 | |||
| Total | 326 508 | — | -100.0 | |||
Tourism, Sport and the Commonwealth Games | ||||||
| Special Appropriations | — | — | — | |||
| Annual Appropriations(b) | — | 96 702 | — | |||
| Total | — | 96 702 | — | |||
Treasury And Finance | ||||||
| Special Appropriations | 694 250 | 944 368 | 36.0 | |||
| Annual Appropriations(b) | 1 804 989 | 1 739 181 | -3.6 | |||
| Total | 2 499 239 | 2 683 549 | 7.4 | |||
Parliament | ||||||
| Special Appropriations | 26 824 | 23 822 | -11.2 | |||
| Annual Appropriations(b) | 76 211 | 80 094 | 5.1 | |||
| Total | 103 035 | 103 916 | 0.9 | |||
| Total Special Appropriations | 2 088 406 | 2 379 696 | 13.9 | |||
| Total Annual Appropriations | 19 603 951 | 20 651 487 | 5.3 | |||
| Total Appropriations | 21 692 357 | 23 031 183 | 6.2 | |||
Source: Department of Treasury and Finance
Notes:
- (a)
- Includes accumulated departmental surplus (previously applied appropriation under S.33 of Financial Management Act 1994).
- (b)
- Includes receipts credited to appropriation and unapplied previous year appropriation carried over.
Table 4.4: Consolidated Fund payments: Special Appropriations
| | 2001-02 Budget | 2002-03 Budget | Variation | |||
|---|---|---|---|---|---|---|
| | ($ million) | (%) | ||||
| Education and Training | ||||||
| Education Act No. 6240, Section 34—Volunteer Workers Compensation | 250 | 250 | na | |||
| 250 | 250 | na | ||||
Human Services | ||||||
| Gaming and Betting Act No. 37 of 1994 Section 80—Hospitals and Charities Fund | 96 700 | 98 300 | 1.7 | |||
| Casino Control Act No. 47 of 1991, Section 114—Hospitals and Charities Fund | 8 600 | 10 400 | 20.9 | |||
| Casino Control Act No. 47 of 1991, Section 114B—Hospitals and Charities Fund | 3 800 | 3 800 | — | |||
| Gaming Machine Control Act No. 53 of 1991, Sections 137 & 138—Hospitals and Charities Fund | 622 300 | 678 700 | 9.1 | |||
| Gaming Machine Control Act No. 53 of 1991, Sec 135B -Hospitals and Charities Fund | 42 200 | 42 200 | — | |||
| Club Keno Act No. 56 of 1993, Section 7(5)—Hospitals and Charities Fund | 1 700 | 1 800 | 5.9 | |||
| Tattersall Consultations—Act No. 6390 | 326 700 | 310 900 | -4.8 | |||
| Financial Management Act No.18/1994, Section 33 | 38 100 | — | na | |||
| 1 140 100 | 1 146 100 | 0.5 | ||||
| Justice | ||||||
| Magistrates Court—Act No. 51 of 1989 | 17 361 | 19 342 | 11.4 | |||
| Constitution Act No. 8750—Judges of the Court of Appeal | 2 760 | 2 871 | 4.0 | |||
| Victims of Crime Assistance Act No. 81 of 1996, Section 69 Expenses | 1 344 | 1 515 | 12.7 | |||
| Constitution Act No. 8750—President of the Court of Appeal | 257 | 281 | 9.3 | |||
| Defence Reserves Re-Employment Act No. 1 of 1995 | 46 | 50 | 8.7 | |||
| Patriotic Funds Act No. 6331 | 182 | 186 | 2.2 | |||
| Melbourne City Link, Act No. 107 of 1995, Section 14(4) | 1 700 | 1 700 | — | |||
| Compensation to Jurors—Act No. 7651 | 17 | 17 | — | |||
| Crown Proceedings—Act No. 6232 | 4 000 | 4 000 | — | |||
| The Constitution Act Amendment Act No. 6224, Section 315—Electoral Expenses | 17 994 | 43 665 | 142.7 | |||
| Victims of Crime Assistance Act No. 81 of 1996, Section 69 Awards | 33 100 | 37 100 | 12.1 | |||
| Victorian State Emergency Service Act No. 57 of 1987—Volunteer Workers Compensation | 300 | 305 | 1.7 | |||
| Constitution Act No. 8750—Chief Justice | 293 | 308 | 5.1 | |||
| County Court Act No. 6230—Judges | 12 539 | 12 882 | 2.7 | |||
| Constitution Act No. 8750—Puisine Judges | 5 775 | 6 410 | 11.0 | |||
| 97 668 | 130 632 | 33.8 | ||||
Natural Resources and Environment | ||||||
| Financial Management Act No.18/1994, Section 33 | 10 100 | 3 500 | -65.3 | |||
| 10 100 | 3 500 | na | ||||
Premier and Cabinet | ||||||
| Gaming Machine Control Act No. 53 of 1991, Sec.137 & 138—Community Support Fund | 114 700 | 126 400 | 10.2 | |||
| Constitution Act No. 8750—Executive Council | 50 | 50 | — | |||
| Constitution Act No. 8750—Governor's Salary | 113 | 116 | 2.7 | |||
| Ombudsman—Act No. 8414 | 205 | 210 | 2.4 | |||
| Parliamentary Salaries and Superannuation—Act No 7723 | 4 146 | 4 248 | 2.5 | |||
| 119 214 | 131 024 | 9.9 | ||||
Treasury and Finance | ||||||
| Constitution Act No. 8750—Judges of the Supreme Court | 3 432 | 2 825 | -17.7 | |||
| County Court Act No. 6230—Judges | 4 456 | 3 724 | -16.4 | |||
| Constitution Act No. 8750—Governor's Pension | 460 | 599 | 30.2 | |||
| Gaming & Betting Act No. 37 of 1994, Section 94—Expenses of the Victorian Casino and Gaming Authority | 17 575 | 18 211 | 3.6 | |||
| Co-Operative Housing Societies Act No. 6226, Section 77(2)—Indemnities | 1 900 | 2 000 | 5.3 | |||
| Business Franchise (Petroleum Products) Act No. 9272, Section 17(2) | 33 600 | 34 000 | 1.2 | |||
| Liquor Control Reform Act No. 94 of 1998, Section 177(2) | 24 000 | 22 200 | -7.5 | |||
| Magistrates Court Act No. 51 of 1989—Chairman, General Sessions | 42 | — | -100.0 |
| State Superannuation Act No. 50 of 1988, Section 90(2)—contributions | 603 000 | 855 000 | 41.8 | |||
| Financial Management Act No.18 of 1994, Section 39—Interest on advances | 4 000 | 4 000 | — | |||
| Taxation (Interest on Overpayments) Act No. 35 of 1986, Section 11 | 1 000 | 1 000 | — | |||
| Treasury Corporation of Victoria Act No. 80 of 1992, Section 38—Debt Retirement | 695 | 695 | — | |||
| The Mint—Act No. 6323, Section 3 | 90 | 114 | 26.7 | |||
| 694 250 | 944 368 | 36.0 | ||||
Parliament | ||||||
| Audit Act No. 2 of 1994, Part 4—Audit of the Auditor-General's Office | 10 | 10 | — | |||
| Auditor General—Act No. 2 of 1994 | 226 | 231 | 2.2 | |||
| Constitution Act No. 8750—Clerk of the Parliaments | 1 | 1 | — | |||
| Constitution Act No. 8750—Legislative Assembly | 275 | 275 | — | |||
| Constitution Act No. 8750—Legislative Council | 100 | 100 | — | |||
| Parliamentary Committees—Act No. 7727 | 3 890 | — | -100.0 | |||
| Parliamentary Salaries and Superannuation Act No 7723, Section 13 (1)(c)—contributions | 6 000 | 6 000 | — | |||
| Parliamentary Salaries and Superannuation Act No 7723—salaries and allowances | 16 322 | 17 205 | 5.4 | |||
| 26 824 | 23 822 | -11.2 | ||||
| Total Special Appropriations | 2 088 406 | 2 379 696 | 13.9 | |||
Source: Department of Treasury and Finance
Table 4.5: Consolidated Fund payments—Total Annual Appropriations
Details of total annual appropriations for 2002-03, including amounts of estimates of unspent 2001-02 appropriation carried forward pursuant to Section 32 of the Financial Management Act 1994 and receipts credited to appropriations pursuant to Section 29 of the Financial Management Act 1994. Estimate for 2002-03 Budget, Black figures; Estimates for 2001-02 Budget, italic figures.
| | Provision of Outputs | Additions to Net Asset Base | Payments made on behalf of State | Total(a) | ||||
|---|---|---|---|---|---|---|---|---|
| | ($ thousand) | |||||||
| Education and Training | ||||||||
| Appropriation(a) | 5 322 157 | — | — | 5 322 157 | ||||
| 5 183 788 | — | — | 5 183 788 | |||||
| Receipts credited to appropriation(b) | 46 359 | 11 240 | — | 57 599 | ||||
| 46 345 | 18 850 | — | 65 195 | |||||
| Unspent previous year appropriation carried over(b) | — | — | — | — | ||||
| — | — | — | — | |||||
| Total Appropriation | 5 368 516 | 11 240 | — | 5 379 756 | ||||
| 5 230 133 | 18 850 | — | 5 248 983 | |||||
Human Services | ||||||||
| Appropriation(a) | 5 931 084 | 142 818 | — | 6 073 902 | ||||
| 5 405 206 | 61 337 | 5 466 543 | ||||||
| Receipts credited to appropriation(b) | 940 791 | 3 250 | — | 944 041 | ||||
| 880 871 | 3 250 | 884 121 | ||||||
| Unspent previous year appropriation carried over(b) | 7 096 | 4 021 | — | 11 117 | ||||
| 1 500 | 21 700 | — | 23 200 | |||||
| Total Appropriation | 6 878 971 | 150 089 | — | 7 029 060 | ||||
| 6 287 577 | 86 287 | — | 6 373 864 | |||||
| Innovation, Industry and Regional Development | ||||||||
| Appropriation(a) | 216 192 | 52 320 | — | 268 512 | ||||
| 64 690 | 3 650 | 68 340 | ||||||
| Receipts credited to appropriation(b) | — | — | — | — | ||||
| — | — | — | — | |||||
| Unspent previous year appropriation carried over(b) | 6 820 | — | — | 6 820 | ||||
| 21 700 | — | — | 21 700 | |||||
| Total Appropriation | 223 012 | 52 320 | — | 275 332 | ||||
| 86 390 | 3 650 | — | 90 040 | |||||
Infrastructure | ||||||||
| Appropriation(a) | 2 276 491 | 299 883 | 16 720 | 2 593 094 | ||||
| 2 101 532 | 208 701 | 11 383 | 2 321 616 | |||||
| Receipts credited to appropriation(b) | 269 344 | — | — | 269 344 | ||||
| 247 337 | — | — | 247 337 | |||||
| Unspent previous year appropriation carried over(b) | 4 280 | 16 800 | — | 21 080 | ||||
| 9 287 | 5 900 | — | 15 187 | |||||
| Total Appropriation | 2 550 115 | 316 683 | 16 720 | 2 883 518 | ||||
| 2 358 156 | 214 601 | 11 383 | 2 584 140 | |||||
Justice | ||||||||
| Appropriation(a) | 1 819 815 | 141 609 | — | 1 961 424 | ||||
| 1 590 749 | 125 654 | — | 1 716 403 | |||||
| Receipts credited to appropriation(b) | 76 204 | — | — | 76 204 | ||||
| 77 616 | 300 | — | 77 916 | |||||
| Unspent previous year appropriation carried over(b) | 5 349 | — | — | 5 349 | ||||
| 15 700 | 6 881 | — | 22 581 | |||||
| Total Appropriation | 1 901 368 | 141 609 | — | 2 042 977 | ||||
| 1 684 065 | 132 835 | — | 1 816 900 | |||||
Natural Resources and Environment | ||||||||
| Appropriation(a) | 872 643 | 68 554 | 22 800 | 963 997 | ||||
| 758 703 | 39 457 | 19 188 | 817 348 | |||||
| Receipts credited to appropriation(b) | 93 305 | — | — | 93 305 | ||||
| 89 928 | — | — | 89 928 | |||||
| Unspent previous year appropriation carried over(b) | 12 500 | 5 832 | — | 18 332 | ||||
| 13 770 | 4 666 | — | 18 436 | |||||
| Total Appropriation | 978 448 | 74 386 | 22 800 | 1 075 634 |
| 862 401 | 44 123 | 19 188 | 925 712 | |||||
Premier and Cabinet | ||||||||
| Appropriation(a) | 332 268 | 75 827 | — | 408 095 | ||||
| 318 131 | 83 981 | — | 402 112 | |||||
| Receipts credited to appropriation(b) | 732 | 86 252 | — | 86 984 | ||||
| 533 | — | — | 533 | |||||
| Unspent previous year appropriation carried over(b) | 2 015 | 10 425 | — | 12 440 | ||||
| 3 005 | 40 994 | — | 43 999 | |||||
| Total Appropriation | 335 015 | 172 504 | — | 507 519 | ||||
| 321 669 | 124 975 | — | 446 644 | |||||
Tourism, Sport and the Commonwealth Games | ||||||||
| Appropriation(a) | 305 337 | 8 250 | — | 313 587 | ||||
| — | 500 | — | 500 | |||||
| Receipts credited to appropriation(b) | — | — | — | — | ||||
| — | — | — | — | |||||
| Unspent previous year appropriation carried over(b) | — | — | — | — | ||||
| — | — | — | — | |||||
| Total Appropriation | 305 337 | 8 250 | — | 313 587 | ||||
| — | 500 | — | 500 | |||||
Treasury and Finance | ||||||||
| Appropriation(a) | 186 455 | 2 900 | 1 491 730 | 1 681 085 | ||||
| 196 818 | 90 839 | 1 471 587 | 1 759 244 | |||||
| Receipts credited to appropriation(b) | 2 412 | 72 | — | 2 484 | ||||
| 2 687 | — | — | 2 687 | |||||
| Unspent previous year appropriation carried over(b) | 5 512 | — | 10 000 | 15 512 | ||||
| 4 964 | 14 994 | 23 100 | 43 058 | |||||
| Total Appropriation | 194 379 | 2 972 | 1 501 730 | 1 699 081 | ||||
| 204 469 | 105 833 | 1 494 687 | 1 804 989 | |||||
| Parliament | ||||||||
| Appropriation(a) | 76 354 | 1 075 | — | 77 429 | ||||
| 69 184 | 1 857 | — | 71 041 | |||||
| Receipts credited to appropriation(b) | — | — | — | — | ||||
| — | — | — | — | |||||
| Unspent previous year appropriation carried over(b) | 2 465 | 200 | — | 2 665 | ||||
| 2 450 | 2 720 | — | 5 170 | |||||
| Total Appropriation | 78 819 | 1 275 | — | 80 094 | ||||
| 71 634 | 4 577 | — | 76 211 | |||||
Source: Department of Treasury and Finance
Notes:
- (a)
- Appropriation (2002/2003) Act.
- (b)
- Financial Management Act, 1994 Section 29.
- (c)
- Financial Management Act, 1994 Section 32.
- (d)
- Appropriation (Parliament 2002/2003) Act.
Table 4.6: The Trust Fund
| | 2001-02 Budget | 2001-02 Revised | 2002-03 Budget | Variation | ||||
|---|---|---|---|---|---|---|---|---|
| | ($ million) | (%) | ||||||
| CASH FLOWS FROM OPERATING ACTIVITIES | ||||||||
| Receipts | ||||||||
| Taxation | 87 016 | 88 450 | 90 822 | 4.4 | ||||
| Regulatory Fees and Fines | 25 679 | 24 480 | 20 493 | -20.2 | ||||
| Grants Received | 2 192 880 | 2 326 876 | 2 359 821 | 7.6 | ||||
| Sale of Goods and Services | 138 523 | 128 810 | 135 407 | -2.2 | ||||
| Interest Received | 44 090 | 47 336 | 44 955 | 2.0 | ||||
| Other Receipts | 79 280 | 126 375 | 159 909 | 101.7 | ||||
| 2 567 468 | 2 742 327 | 2 811 407 | 9.5 | |||||
Payments | ||||||||
| Employee Entitlements | -47 037 | -59 466 | -58 375 | 24.1 | ||||
| Superannuation | -3 148 | -4 035 | -4 173 | 32.6 | ||||
| Interest Paid | -44 | -104 | -119 | 170.5 | ||||
| Grants Paid | -5 927 361 | -6 129 262 | -6 497 634 | 9.6 | ||||
| Supplies and Consumables | -1 610 628 | -1 780 280 | -1 766 300 | 9.7 | ||||
| Other Payments | 5 084 814 | 5 250 636 | 5 637 532 | 10.9 | ||||
| NET CASH FLOWS FROM OPERATING ACTIVITIES | 64 064 | 19 816 | 122 338 | 91.0 | ||||
| CASH FLOWS FROM INVESTING ACTIVITIES | ||||||||
| Net Proceeds from/(Purchases of) Investments | — | — | — | — | ||||
| Proceeds from Sale of Property, Plant & Equipment | 200 | 200 | 200 | — | ||||
| Purchases of Property, Plant & Equipment | -99 606 | -75 270 | -68 308 | -31.4 | ||||
| Other Investing Activities | -7 010 | 4 292 | -25 716 | 266.8 | ||||
| NET CASH FLOWS FROM INVESTING ACTIVITIES | -106 416 | -70 778 | -93 824 | -11.8 | ||||
| CASH FLOWS FROM FINANCING ACTIVITIES | ||||||||
| Net Proceeds from/(Repayment of) Borrowings | — | — | — | na | ||||
| Other | 52 731 | 53 431 | -14 273 | -127.1 | ||||
| NET CASH FLOW FROM FINANCING ACTIVITIES | 52 731 | 53 431 | -14 273 | na | ||||
| NET CASH INFLOW/(OUTFLOW) | 10 379 | 2 469 | 14 241 | 37.2 | ||||
| Represented By: | ||||||||
| Cash and Deposits Held at Beginning of Reporting Period | 865 705 | 865 705 | 868 174 | na | ||||
| Cash and Deposits Held at End | 876 084 | 868 174 | 882 415 | 0.7 | ||||
Source: Department of Treasury and Finance
| AAS | Australian Accounting Standard | |
| AAV | Aboriginal Affairs Victoria | |
| ACAS | Aged Care Assessment Services | |
| ACE | Adult and Community Education | |
| ACMI | Australian Centre for the Moving Image | |
| AEIP | Adult Employment Incentive Program | |
| AFR | Annual Financial Report | |
| AGSRC | Average Government School Recurrent Costs | |
| AHBV | Aboriginal Housing Board Victoria | |
| AHCA | Australian Health Care Agreement | |
| ALTD | Australian Land Transport Development Program | |
| AMES | Adult Multicultural and Education Services | |
| ANTA | Australian National Training Authority | |
| ASC | Australian Securities Commission | |
| ASIC | Australian Securities and Investments Commission | |
| ASX | Australian Stock Exchange | |
| ATO | Australian Taxation Office | |
BBA | Budget Balancing Assistance | |
| BLIS | Business Licence Information Service | |
CAC | Capital Asset Charge | |
| CBD | Central Business District | |
| CFA | Country Fire Authority | |
| CGC | Commonwealth Grants Commission | |
| CMA | Catchment Management Authority | |
| CNCU | Competitive Neutrality Complaints Unit | |
| COAG | Council of Australian Governments | |
| CRICOS | Commonwealth Register of Institutions and Courses for Overseas Students | |
| CSDA | Commonwealth-State Disability Agreement | |
| CSF | Community Support Fund | |
| CSHA | Commonwealth State Housing Agreement | |
DEET | Department of Education, Employment and Training | |
| DHS | Department of Human Services | |
| DIIRD | Department of Innovation, Industry and Regional Development | |
| DNRE | Department of Natural Resources and Environment | |
| DOI | Department of Infrastructure | |
| DOJ | Department of Justice | |
| DPC | Department of Premier and Cabinet | |
| DPEC | Drug Policy Expert Committee | |
| DTF | Department of Treasury and Finance | |
| DTSCG | Department of Tourism, Sport and the Commonwealth Games | |
EBA | Enrolment Benchmark Adjustment | |
| EC4P | Electronic Commence for Procurement | |
| ECC | Environment Conservation Council | |
| EGMs | Electronic Gaming Machines | |
| EMA | Emergency Management Australia |
| EPA | Environment Protection Authority | |
| ERC | Expenditure Review Committee | |
| ESL | English as a Second Language | |
FAGs | Financial Assistance Grants | |
| FFYA | Futures for Young Adults | |
| FHOG | First Home Owner Grant | |
| FID | Financial Institutions Duty | |
| FIRS | Federal Interstate Registration Scheme | |
| FMA | Financial Management Act 1994 | |
| FMA | Forest Management Areas | |
| FoI | Freedom of Information | |
| FreeZA | Drug and Alcohol Free Zone | |
| FTE | Full-Time Equivalent | |
GBE | Government Business Enterprise | |
| GMA | Guaranteed Minimum Amount | |
| GSERP | Government Sector Executive Remuneration Panel | |
| GSP | Gross State Product | |
| GST | Goods and Services Tax | |
HACC | Home and Community Care | |
ICT | Information, Communications and Technology | |
| IESIP | Indigenous Education Strategic Initiatives Program | |
| ILUA | Indigenous Land Use Agreements | |
| IT | Information Technology | |
KISE | Knowledge, Innovation, Science and Engineering | |
LLENS | Local Learning and Employment Networks | |
| LLV | Liquor Licensing Victoria | |
| LM | Land Management | |
| LOTE | Languages other than English | |
MCLA | Melbourne City Link Authority | |
| MDBC | Murray Darling Basin Agreement | |
| MFESB | Metropolitan Fire and Emergency Services Board | |
| MoU | Memorandum of Understanding | |
| MSAC | Melbourne Sports and Aquatic Centre | |
NALSAS | National Asian Languages and Studies in Australian Schools | |
| NCC | National Competition Council | |
| NCP | National Competition Policy | |
| NCSC | National Companies and Securities Commission | |
| NDRA | Natural Disaster Relief | |
| NDRMS | Natural Disaster Risk Management Studies Program | |
| NEIP | Environment Improvement Plans | |
| NHT | Natural Heritage Trust | |
| NRTC | National Road Transport Commission | |
| NTER | National Tax Equivalent Regime | |
OMP | Office of Major Projects | |
| OWP | Office of Women's Policy | |
PHOFA | Public Health Outcome Funding Agreement |
ResCode | Residential Development | |
| RFA | Regional Forest Agreement | |
| RFC | Rural Finance Corporation | |
| RIDF | Regional Infrastructure Development Fund | |
| RINA | Revenue for Increase in Net Assets | |
| RONI | Roads of National Importance | |
| RRPs | Revenue Replacement Payments | |
| SAAP | Supported Accommodation Assistance Program | |
| SDQMS | Stamp Duty on Quoted Marketable Securities | |
| SES | Socio-Economic Status | |
| STI | Science Technology Innovation | |
TAFE | Technical and Further Education (post-secondary colleges) | |
| TCP | Technology Commercialisation Program | |
| TCV | Treasury Corporation of Victoria | |
| TEC | Total Estimated Cost | |
VACS | Victorian Ambulatory Classification System | |
| AGO | Victorian Auditor-General's Office | |
| VAIP | Victorian Accelerated Infrastructure Program | |
| VBL | Victorian Business Line | |
| VCAA | Victorian Curriculum and Assessment Authority | |
| VCAT | Victorian Civil and Administrative Tribunal | |
| VCE | Victorian Certificate of Education | |
| VET | Vocational Education and Training | |
| VFMC | Victorian Funds Management Corporation | |
| VGSO | Victorian Government Solicitor's Office | |
| VicRoads | Roads Corporation | |
| VicSES | Victorian State Emergency Services | |
| VicTrack | Victorian Rail Track Corporation | |
| VIMP | Victorian Initiative for Minerals and Petroleum | |
| VIPP | Victorian Industry Participation Policy | |
| VLA | Victorian Legal Aid | |
| VLESC | Victorian Learning and Employment Skills Commission | |
| VPS | Victorian Public Service | |
| VPSN | Victorian Public Service Notices | |
| VQA | Victorian Qualifications Authority | |
| VSFIC | Victorian Sea Freight Industry Council | |
| VYDP | Victorian Youth Development Program | |
WCI | Wage Cost Index | |
| WIES | Weighted Inlier Equivalent Separations |
Figures in the tables and in the text have been rounded. Discrepancies in tables between totals and sums of components reflect rounding. Percentage variations in all tables are based on the underlying unrounded amounts.
The notation used in the tables is as follows:
| na | not available or not applicable | |
nm | new measure | |
— | zero, or rounded to zero | |
tbd | to be determined | |
ongoing | continuing output, program, project etc |
A
Aboriginal Housing Board Victoria, 92
Aboriginal Justice Agreement, 189
ACAS, 70
Adult community education, 19, 21, 22, 36, 39, 43
Agriculture
Agricultural Research Institute, 235
Appropriation (2002/2003) Act, 4, 445
Appropriation (Parliament 2002/2003) Act, 4, 445
Appropriation Bills, 1
Auditor-General, 238, 362
Australian Accounting Standard
AAS29, 3, 4, 45, 94, 140, 177, 223, 273, 298, 320, 352, 378
AAS31, 3, 4
UIG38, 2
Australian Bureau of Statistics, 3
Australian Centre for Moving Image, 302, 426
Australian Childhood Immunisation Register, 420
Australian Graduate School of Government, 283, 300
Australian Land Transport Development Program, 422
Australian National Training Authority, 22, 39, 413
Australian National Training Authority Act 1992, 413
Australian Securities and Investments Commission, 423
B
Births Deaths and Marriages Act 1996, 208
Bushcare. See Natural Heritage Trust
C
Capital grants program. See Commonwealth grants
Child protection, 87
Coastal Action Program. See Natural Heritage Trust
Commonwealth Games, 24, 107, 133, 154, 155, 308, 309, 322, 410, 427
Athletes' Village, 154, 309
Commonwealth grants
Capital grants program, 415
Debt Redemption Assistance, 427
First Home Owners Grant, 427
General purpose grants, 407
National Competition Policy payments, 408
Transitional assistance, 408
Guaranteed Minimum Amount, 407, 408
Indigenous Education Strategic Initiatives for Government Schools, 414
Road transport, 422
Special Commonwealth Projects, 414
Special Learning Needs—English Second Language, 414
Specific purpose grants, 411-15
TAFE, 413
Commonwealth Grants Commission, 407
Commonwealth-State Disability Agreement, 416
Commonwealth-State Housing Agreement, 58
Community Capacity Building Initiative, 151
Community Support Fund, 28, 33, 80, 287, 288, 300, 302, 397
Connecting Victoria, 151
Consolidated Fund, 2, 229, 230, 357, 413, 433, 434
Receipts, 435
Special Appropriations, 439
Summary, 437
Total Annual Appropriations, 442
Constitution Act 1975, 8, 361, 433
Country Fire Authority, 3, 7, 193
Country Fire Authority Act 1958, 400
Criminal Justice Enhancement Program, 188
Crown Casino, 397
D
Debits tax. See Taxation, Debits tax
Debt Redemption Assistance.
See Commonwealth grants
Departmental objectives, 10
Departmental resources, 223
Disability Discrimination Act 1992, 135
E
Early Years Literacy Program, 23
Early Years Numeracy Program, 23
Education
Specific purpose grants, 411-15
Education and Training
Authority for Resources, 53
Departmental Objectives, 20
Financial Statements, 45-52
Outlook for 2002-03, 23-24
Output information, 24-25
Overview, 19
Policy, Strategy and Information Services, 42-44
International education, 43
Policy, strategy and executive services, 42
Public information and promotion, 44
Review of 2001-02, 20-23
School Education, 26-33
Education Maintenance Allowance, 32
Junior Secondary Education, 27
Non-Government School Education, 30
Primary Education, 26
Senior Secondary Education, 29
Services to Students with Disabilities and Impairments, 32
Student Transport, 32
Student Welfare and Support, 31
Training and Tertiary Education, 34-39
Adult and Community Education Places and Community Support, 36
Employment services, 37
Higher education, 38
Training and further education places, 34
Youth, 40-41
Services to Youth, 40
Youth Policy Coordination, 40
Endangered Species Program. See
Natural Heritage Trust
Enrolment Benchmark Adjustment, 412
Environment Effects Act 1978, 115, 116
Equal Opportunity Commissioner, 189
Essential Services Commission, 250, 327, 328, 354
F
Federal Interstate Registration Scheme, 422
Federation Square, 283, 296, 300, 302, 357, 426
Fees. See Regulatory fees and fines
Financial assistance grants, 407, 429
Financial institutions duty. See Taxation, Financial institutions duty
Financial Management Act 1994, 1, 4, 8, 396, 433, 442
Fines. See Regulatory fees and fines
First Home Owners Grant. See Commonwealth grants
Fisheries Act 1995, 265
Fisheries Action Program. See Natural Heritage Trust
Forest Industry, 425
Forests and Fire Management, 235, 238
G
Gambling taxes. See Taxation, Gambling taxes
Gaming and Betting Act 1994, 398
Growing Tomorrow's Industries Today, 151, 155
Growing Victoria Together, 9, 10, 57, 104, 149, 150, 186, 233, 282, 283, 307
H
Hansard, 370
Health, 11
Heritage Act 1995, 114
Home and Community Care, 69, 71, 416, 420
Hospital Demand Management Strategy, 56, 58
Hospitals and Charities Fund, 397, 398
Housing
Office of Housing, 55, 58, 93, 406
Human Services
Acute Health Services, 62-64
Acute Training and Development, 64
Admitted Services, 62
Blood Services, 64
Emergency Services, 63
Non-Admitted Services, 62
Sub-Acute Care Services, 63
Aged and Home Care, 69-71
Aged Care Assessment, 69
Aged Care Service System Development and Resourcing, 70
Aged Residential Care, 70
Aged Support Services, 70
HACC Primary Health, Community Care and Support, 71
HACC Service System Development and Resourcing, 71
Positive Ageing, 69
Ambulance Services, 65-66
Ambulance Emergency Services, 65
ambulance Non-emergency Services, 65
Ambulance Services Training and Development, 66
Basic Life Support Program, 66
Authority for Resources, 101
Community Care, 86-88
Child Protection and Placement, 87
Early Childhood Services, 86
Family and Community Support, 87
Juvenile Justice Services, 88
Concessions to Pensioners and Beneficiaries, 89-90
Energy Concessions, 89
Municipal Rates Concessions, 89
Trustee Services, 89
Water and Sewerage Concessions, 89
Dental Health, 74-75
Dental Service System Development and Resourcing, 74
Dental Services, 74
Disability Services, 81-85
Community and Home Based Support, 83
Community Participation, 82
Congregate Care, 84
Flexible Support Packages, 83
Information and Advocacy Services, 85
Intake Assessment, 81
Planning and Coordination, 81
Primary Support, 82
Quality and Accreditation, 85
Shared Supported Accommodation, 83
Specialist Services, 84
Strengthening Communities, 85
Training, Development and Innovation, 84
Financial Statements, 94-100
Housing Assistance, 91-93
Home Ownership and Renovation Assistance, 92
Homelessness Assistance, 91
Long Term Housing Assistance, 92
Mental Health, 67-68
Clinical Community Care, 67
Clinical Inpatient Care, 67
Mental Health Service System Capacity Development, 68
Psychiatric Disability Support Services, 68
Overview, 55-56
Primary Health, 72-73
Community Health Care, 72
Primary Health Service System Development and Resourcing, 73
School Nursing, 72
Public Health and Drugs, 76-80
Biomedical Research, Ethics and Safety, 79
Disease Prevention, Control and Surveillance, 76
Drug Prevention and Control, 77
Drug Treatment and Rehabilitation, 77
Environmental Health and Safety, 78
Food and Activitiy, 79
Health and Social Development, 78
Public Health Research, Information and Training, 79
Review of 2001-02, 56-60
I
Indigenous Community Capacity Building Program, 236
Indigenous Education Strategic Initiatives for Government Schools. See Commonwealth grants
Industry Development Assistance, 235
Information Communications Technology, 22, 39, 150, 151, 152, 157, 161, 162
Information Privacy Act 2000, 207
Infrastructure
2001-02 Review, 104-6
2002-03 Outlook, 107-8
Authority for Resources, 147
Balanced Planning and Environmental System, 113-16
Environmental Strategies and Initiatives, 115
Heritage Conservation, 114
Planning Operations and Environmental Assessment, 113
Planning System Development, 113
Regional and Urban Amenity Initiatives, 115
Departmental Objectives, 103-4
Financial Statements, 140
Metropolitan Transport Infrastructure and Public Development Projects, 129-33
Major Metropolitan Road Projects, 130
Major Public Construction and Land Development, 132
Metropolitan Arterial Road Links, 131
Metropolitan Public Transport Development, 129
Metropolitan Road Network Maintenance, 132
Metropolitan Transport Services, 127-28
Metropolitan Bus Services, 128
Metropolitan Train Services, 127
Metropolitan Tram Services, 127
Output Information, 109
Overview, 103
Payments on behalf of State, 147
Ports and Intermodal Gateways, 119-20
Passenger Interchange Development, 120
Ports and Intermodal Freight, 119
Regional and Rural Transport Infrastructure, 123-26
Major Regional Road Projects, 124
Regional Arterial Road Links, 124
Regional Public Transport Passenger and Freight Development, 123
Regional Road Network Maintenance, 125
Regional and Rural Transport Services, 121-22
Country Bus Services, 122
Country/Interstate Rail Services, 121
School Bus Services, 122
Strategic Land Use and Infrastructure Planning, 110-12
Metropolitan Development Strategies, 111
Port Development Strategies, 111
Regional and Rural Strategies, 110
Supporting Local Government, 117-18
Governance Support, 118
Grants Funding for Public Libraries and Other Local Government Services, 118
Local Government Sector Development, 117
Transport Safety and Accessibility, 134-39
Accessible Transport Initiatives, 135
Accident Blackspots, 135
Marine Safety Initiatives and Regulation, 138
Public Transport Safety Initiatives and Regulation, 137
Road Safety Initiatives and Regulation, 137
Taxi, Hire Car and Tow Truck Regulation, 134
Traffic and Road Use Management Improvements, 136
Vehicle and Driver Regulation, 136
Innovation, 21, 23, 25, 47, 84, 422
Innovation, Industry and Regional Development
2002-03 Outlook, 154-55
Authority for Resources, 183
Business, 164-71
Business Development, 165
Effective Management of the Sale of Liquor, 170
Investment Facilitation and Attraction, 164
Regional Economic Development, 168
Regional Infrastructure Development, 167
Regional Strategic Leadership, 166
Regulation Reform, 168
Rural Community Development, 166
Small Business Support and Online Business Services, 169
Trade Measurement Development and Services, 170
Departmental objectives, 150
Employment Programs, 174-76
Business Employment Program, 175
Community Employment Program, 175
Migrant Employment Services, 176
Policy and Labour Market Advice, 174
Financial Statements, 177
Industrial Relations, 172-73
Industrial Relations Policy, 173
Industrial Relations Services, 172
Innovation and Policy, 157-63
E-Government and ICT policy, 162
E-Government Infrastructure, 163
ICT Community Development, 162
ICT Industry Development and E-Commerce, 161
STI Initiative Management, 159
STI Policy, Awareness and Biotechnology, 158
Strategic Policy, 157
Technology Commercialisation Program, 160
Output Information, 155-56
Overview, 149
Review of 2001-02, 150-54
Integrated Public Safety Communications Strategy, 187
Intergovernmental Agreement on the Reform of Commonwealth-State Financial Relations, 394, 395, 396
International Investment Positioning Strategy, 155
International Roughness Index, 125, 126, 132, 133
Interstate Road Transport Act 1985, 422
Investment Income, 403-4
Dividends, 403, 404
Property rents, 405
Tax and rate equivalents, 405
J
Justice
2001-02 Outlook, 186-89
Achieving Equal Opportunity, 221-22
Advocacy and Guardianship, 222
Discrimination Prevention and Redress, 221
Authority for Resources, 230
Crime Idnetification and Investigation, 199-200
Investigation of Crimes against Property, 199
Investigation of Crimes against the Person, 199
Investigation of Illegal Drug Activity, 200
Crime Prevention, 195-96
Community Safety Programs, 195
Police Presence in the Community, 195
Dispensing Justice, 209-14
Alternative Dispute Resolution, 213
Forensic Evidence, 210
Legal Aid, 213
Matters in the Children's Court, 211
Matters in the Civil and Administrative Tribunal, 212
Matters in the Coroner's Court, 212
Matters in the County Court, 211
Matters in the Magistrates' Court, 211
Matters in the Supreme Court, 210
Public Prosecutions, 209
Victims Support, 213
Emergency Prevention and Response, 193-94
Metropolitan Fire and Emergency Services, 193
Rural and Regional Fire Services, 193
State-wide Emergency Services, 194
Enforcing Correctional Orders, 217-18
Community Based Offender Supervision, 218
Correctional System Management, 217
Prisoner Supervision and Support, 217
Enforcing Court Orders, 215-16
Asset Confiscation Order Processing, 216
Enforcement of Court Orders and Warrants, 215
Traffic Fines Processing, 215
Financial Statements, 223-30
Incident, Emergency and Event Management, 197-98
Event Management, 198
Response Readiness, 197
Response to Incidents, 198
Legal Support for Government, 205-8
Law Reform, 206
Legal Advice to Government, 206
Legal Policy, 205
Native Title Framework, 207
Privacy Regulation, 207
Registration of Births, Deaths and Marriages, 208
State Electoral Roll and Elections, 207
Output Information, 190
Overview, 185-86
Protecting Consumers, 219-20
Business Licensing and Registration, 219
Consumer Awareness and Protection, 219
Public Safety Policy, 191-92
Crime and Violence Prevention, 191
Emergency Readiness Support, 191
Review of 2000-01, 186
Road Safety, 201-2
Road Safety Strategies and Awareness, 201
Road Traffic Incident/Collision Management, 202
Road Traffic Law Enforcement, 201
Supporting the Justice System, 203-4
Managing People in Police Custody, 203
Providing Justice Services, 203
Justice Statement, 188, 225
L
Land Exchange, 236
Land Titles Office, 235, 278
Land Victoria, 237, 269
Lascelles Wharf, 108, 119
Learning and Employment Skills Commission, 413
Legal aid, 410
Legislative Assembly, 361, 363
Legislative Council, 361, 362, 383
Linking the Suburbs Strategy, 108
Linking Victoria
Country Passenger Rail Service, 107
Rail Gauge Standardisation, 107, 123
Regional Fast Rail, 105, 107, 108, 123
Spencer Street Station Redevelopment, 105, 107
Local government—Commonwealth funding, 429
Local Government Act 1989, 118
Local Learning and Employment Networks, 21, 43
M
Machinery of Government changes, 23
Major Projects Victoria, 107, 109, 133, 150
Marine Parks, 235, 237, 263
Melbourne Sports and Aquatic Centre, 107, 154, 308, 310
Mental Health Fund, 397
Metropolitan Bus Services, 128
Metropolitan Fire and Emergency Services Board, 7, 193
Metropolitan Fire Brigades Act 1958, 396, 400
Metropolitan improvement levy.
See Taxation, Property owners contribution to fire brigades.
See Taxation, Metropolitan improvement levy
Metropolitan Strategy, 106, 107, 112
Middle Years Program, 24
Middle Years Reform, 23
Model Financial Report, 2, 275, 278
Museum, 284, 296, 297, 300, 302
N
National Competition Council, 409
National Competition Policy, 117, 332, 396, 408, 409
National Gallery, 107, 154, 296, 297, 300, 302
National Gallery of Victoria, 426
National Landcare Program. See Natural Heritage Trust
National Parks (Marine National Parks and Marine Sanctuaries) Act 2002, 265
National Road Transport Commission, 422
National Wetlands Program. See Natural Heritage Trust
Natural Heritage Trust, 424
Bushcare, 424
Coastal Action Program, 425
Endangered Species Program, 424
Fisheries Action Program, 425
Landcare, 247, 248, 249
National Landcare Program, 424
National Wetlands Program, 425
Rivercare, 424
Natural Resources and Environment
2001-02 Outlook, 235-38
Aboriginal Reconciliation and Respect, 239-41
Address Dispossession of Aboriginal Land and Culture, 240
Indigenous Community Building, 239
Reconciliation Through Partnerships of Government and Aboriginal Communities, 240
Agriculture, 242-45
Community, Farm and Industry Development Services, 245
Development of Next Generation Technologies for Sustainable Agriculture, 244
Services to Improve Market Access, Market Development and Consumer Confidence in Food and Agricultural
Products, 243
Authority for Resources, 280
Catchment and Water, 246-51
Catchment and Water Resource Allocation and Access, 249
Catchment Information Services, 246
Community Land and Water Management, 247
Conservation and Recreation, 252-54
Biodiversity Conservation, Utilisation and Ecosystem Services, 253
Nature and Heritage Recreation and Tourism Services, 254
Services for Management and Governance of Victoria's Parks, 252
Departmental objectives, 233-34
Energy and Greenhouse Policy Advice, 255-56
Energy Policy Services, 256
Greenhouse Policy Services, 255
Environment Protection, 257-61
Neighbourhood Environment Improvement, 261
Policy Frameworks, Regulations and Services to Enhance Air Quality, 257
Policy Frameworks, Regulations and Services to Enhance Water Quality, 258
Policy Frameworks, Regulations and Services to Protect Groundwater and the Land Environment from Pollution, 259
Policy, Regulations and Services to Reduce and Manage Waste, 260
Financial Statements, 273-79
Fisheries, 262-65
Aquaculture and Fishing Industry Development, 264
Industry and Community Compliance Services, 263
Sustainable Fisheries Utilisation Services, 262
Forest and Fire Management, 266-68
Fire Operations, 267
Fire Prevention and Planning, 266
Sustainable Forest Management Services, 267
Sustainable Forest Production and Industry Development, 268
Land Management and Information, 269-70
Land Information, 270
Public Land Management, 269
Minerals and Petroleum, 271-72
Minerals and Petroleum Industry Development and Information, 272
Minerals and Petroleum Regulation Services, 271
Overview, 235
Payments on behalf of the State, 280
Review of 2000-01, 235
O
Office of Fair Trading and Business Affairs, 423
Office of the Public Advocate, 189
Our Forests Our Future, 235, 237, 268, 275, 278, 403
P
Parks Victoria, 3, 7, 252, 253, 254
Parliament
2002-03 Outlook, 363
Auditor-General's Office, 376-77
Audit reports on Financial Statements, 376
Output Reports to be tabled in Parliament, 376
Authority for Resources, 385
Financial Statements, 378-84
Joint Services Department, 373-75
Financial Management, 373
Grounds and Facilities Maintenance, 374
Joint Services Department, 374
Personnel Services, 374
Property Management, 373
Legislative Assembly, 366-67
Procedural Support, Documentation Preparation and Provision of Information, 366
Legislative Council, 364-65
Procedural Support, Documentation Preparation and Provision of Information, 364
Output Information, 363
Overview, 361-62
Parliamentary Debates (Hansard), 370-71
Parliamentary Investigatory Committees, 372
Reports tabled and papers published, 372
Parliamentary Libary, 368-69
Information Access, 368
Information Provision, 368
Public Relations and Education, 369
Research, 369
Review of 2001-02, 362
ParlyNet, 383
Partners at Work Program, 153
Partnerships Victoria, 105, 328
Planning and Environment Act 1987, 113, 115
Premier and Cabinet
2002-03 Outlook, 283-84
Arts and Cultural Development, 294-97
Arts Development and Access, 294
Infrastructure and Cultural Facilities, 295
Portfolio Services and Policy, 295
Arts and Cultural DevelopmentArts Portfolio Agencies, 296
Authority for Resources, 305
Community Engagement and Government Information, 287-90
Community Support Fund, 288
Government Information Services and Support, 288
Multicultural Affairs, 287
Protocol and Special Events, 289
Women's Policy, 288
Departmental Objectives, 281-82
Financial Statements, 298-304
Output Information, 284
Overview, 281
Public Sector Management and Governance, 291-93
Advice and Support to the Governor, 291
Chief Parliamentary Counsel Services, 292
Ombudsman services, 292
Public Sector Employment and Conduct Services, 291
Review of 2001-02, 282-83
Strategic Policy Advice and Projects, 285-86
Policy Leadership Projects, 285
Strategic Policy Advice, 285
Private lotteries. See Taxation, Private lotteries
Public Account, 2, 433
Public Benevolent Institutions, 99, 418
Public Records Office, 300, 302
Purchase of fixed assets, 7
R
Reducing Offending Strategy, 189
Regional Connections, 151, 155
Regional Infrastructure Development Fund, 150, 167, 179
Regulatory fees and fines, 402-3
Fees, 224, 229, 402
Fines, 215, 224, 229, 402, 403
ResCode, 106, 116
Revenue, 224, 229, 278, 351, 394, 399
Revenue, Other, 405
Review of Victims Services, 188
Rivercare. See Natural Heritage Trust
Road transport—Commonwealth grants. See Commonwealth grants
Roads of National Importance, 145, 422
Rounding convention, 4
Royal Botanical Gardens, 3
Royal Melbourne Show, 236
Rural Leaders and Community Events, 151
S
Sale of goods and services, 403
Salinity and Water Quality, 425
School Global Budget, 21
School Innovation Commission, 21
Second National Mental Health Plan (1998-2003), 421
Showgrounds, 107, 236
Special Appropriations, 225, 357
Special Commonwealth Projects—Commonwealth grants. See Commonwealth grants
Special Learning Needs—English Second Language—Commonwealth grants. See Commonwealth grants
Specific purpose grants, 409-27, 422, 428
Aged Care Assessment Services, 420
Australian Land Transport Development Program, 422
Blood Transfusion Services, 419
COAG Drug Diversion Initiative, 420
Commonwealth New First Home Owners Grant, 427
Compensation for extension of pensioner benefits, 418
Compensation for transfer of corporate regulatory functions, 423
Disability Services, 56, 57, 61, 81, 416
Education, 411-15
Federation Square—Australian Centre for Moving Image, 426
Forest Industry Structural Adjustment Program, 235, 425
Fringe benefits tax transitional allowance, 418
Health Care Grant, 416
Highly Specialised Drugs Program, 417
Home and Community Care, 69, 71, 96, 416
Human Services, 415-21
Immunisation Program, 420
Indigenous Education Strategic Initiatives for Government Schools, 414
Infrastructure, 421-22
Innovation, Industry and Regional Development, 422
Interstate Road Transport, 422
Justice, 423
National Action Plan for Salinity and Water Quality, 275, 425
National Gallery of Victoria—Federation Funding, 426
National Health Development Fund, 73, 419
Natural Resources and Environment, 423-25
Premier and Cabinet, 425-26
Public Health Outcomes Funding Agreement, 418
Public Housing—Assistance for People in Crisis, 421
Public housing—Untied grants, 417
Special Education Program, 420
Special Learning Needs—English Second Language New Arrivals, 414
Strategic Assistance for Improving Student Outcomes, 411, 413
Tourism, Sport and the Commonwealth Games, 426-27
Treasury and Finance, 427
Specific purpose grants for on-passing
Capital Grants Program—Assistance to Non Government Schools, 428
General purpose financial assistance to local government, 429
Stamp duty
Duty on marketable securities, 394
Land Transfers, 393
Mortgages and Debentures, 394
Other miscellaneous duties, 395
other property stamp duty, 394
Rental Business, 395
Stamp duty on financial transactions. See also Taxation, Stamp duty
State Emergency Service, 193, 225
State Grants (Primary and Secondary Education Assistance) Act 2000, 415
State Library of Victoria, 284, 296, 297
State Revenue Office, 145, 327, 328, 354, 391, 401
States Grants (Primary and Secondary Education Assistance) Act 2000, 411
Statewide Personnel Alerting System, 225
Strategic Security Study, 363
Supported Accommodation Assistance Program, 58, 91, 419
Synchrotron, 107, 152, 154, 160
T
TAFE—Commonwealth grants. See Commonwealth grants
TAFE Institutes, 21, 22, 24, 25
Taxation, 390-91, 392-96, 408
Casino, 397, 398
Debits tax, 395
Electronic gaming machines, 397
Financial accommodation levy, 396
Financial institutions duty, 395
Fringe Benefits Tax, 99, 418
Fringe Benefits Tax Transitional Allowance, 418
Gambling taxes, 397-98
Electronic gaming machines, 397
Other gambling, 398
Private Lotteries, 397
Racing, 398
Insurance contributions to fire brigades, 399
Land tax, 392-93
Landfill Levy, 275
Life insurance, 399
Metropolitan improvement levy, 396
Metropolitan Parks Charge, 275
Motor vehicle registration fees, 400
Motor vehicle stamp duty, 400
Motor vehicle taxes, 400-401
Non-life insurance, 399
Other gambling, 398
Other motor vehicle taxes, 401
Drivers' licence fees, 401
Road transport and maintenance taxes, 401
Other taxes on the use of goods and services, 402
Private lotteries, 397
Property owners contribution to fire brigades, 396
Racing taxes, 398
Regulatory fees and fines, 390, 402
Stamp duty on compulsory third party premiums, 399
Stamp duty on financial transactions, 393-95
Taxes on insurance, 399-400
Taxes, 145, 224, 229
Telecommunications Purchasing and Management Strategy, 151, 155
Tourism, Sport and the Commonwealth Games
2002-03 Outlook, 308-10
Authority for Resources, 326
Departmental Objectives, 307
Financial Statements, 320-25
Melbourne 2006 Commonwealth Games, 318-19
Commonwealth Games Coordination, 319
Melbourne 2006 Commonwealth Games, 318
Output Information, 310
Overview, 307
Payments on behalf of State, 326
Review of 2001-02, 308
Sport, Recreation and Racing, 311-14
Sport and Major Event Facilitation, 311
Sport and Recreation Industry Development, 312
Tourism, 315-17
Tourism Industry and Infrastructure Development, 317
Tourism Marketing and Event Facilitation, 315
Transport
Australian Land Transport Development Program, 422
Melbourne Airport, 105
Scoresby Freeway, 105, 130, 142, 422
Scoresby Integrated Transport Corridor, 105, 108
Tram 109, 105
Transport Strategies, 106
Bendigo Regional Land Use and Transport Strategy, 106
Geelong Transport Strategies, 106, 112
Great Ocean Road Region Strategy, 106
North West Freight Study, 106
Portland Access Study, 106, 112
Treasury and Finance
2002-03 Outlook, 328-29
Authority for Resources, 359
Financial Management Services, 337-41
Budget Development and Production, 339
Financial Assets and Liabilities Management Services, 338
Financial Reporting and Control, 337
GBE Performance Monitoring Services, 341
Portfolio Performance Review, 340
Taxation (State Revenue)
Monitoring and Forecasting Services, 339
Financial Statements, 352-58
Output Information, 329
Overview, 327
Payments on behalf of State, 359
Reform Services, 345
Resource Management Reform, 345
Regulatory Services, 349-50
Economic Regulatory Services, 349
Regulation of Gambling, 349
Resource Management Services, 346-48
Government Accommodation Services, 347
Government Land and Property Services, 347
Management of Motor Vehicle Leases, 348
Procurement Services, 346
Revenue Management Services, 351
Revenue Management Services to Government, 351
Review of 2001-02, 328
Risk Management Services, 342-44
Commercial Project and Risk Management, 343
Infrastructure Project Management, 342
Prudential Supervision, 344
Scope and Coverage, 327-28
Strategic Policy Advice, 330-36
Budget Formulation Advice, 334
Economic, Regulatory, Environmental and Social Policy Advice, 332
Financial and Risk Management Policy Advice, 331
Financial Management Regulation and Compliance, 330
Gaming Policy Advice, 335
Inter Government Financial Relations Policy Advice, 333
Statutory Insurance Advice, 335
Strategic Policy and Research, 331
Taxation (State Revenue) Policy Advice, 333
Trust Fund, The, 433, 446
V
Victorian Ambulatory Classification System, 62
Victorian Arts Centre, 296, 302
Victorian Certificate of Applied Learning, 22, 24, 26, 47
Victorian Indigenous Family Violence Strategy, 236
Victorian Institute of Sport, 309
Victorian Tourism Industry's Strategic Plan 2002-2006, 308
Victorian Tourism Online, 308
Victorian Youth Development Program, 22, 40
W
World Masters Games, 309
Y
Young Achievement Australia, 153
Youth Pathways Program, 35, 36
Youth Services Program, 40, 41
2002–2003 BUDGET PAPERS
VICTORIA BUDGET SPEECH
Budget Statement 2002-03
TABLE OF CONTENTS
2002-03 BUDGET HIGHLIGHTS
CHAPTER 1: FINANCIAL POLICY OBJECTIVES AND STRATEGIES
CHAPTER 2: BUDGET POSITION AND OUTLOOK
CHAPTER 3: ECONOMIC CONDITIONS AND OUTLOOK
CHAPTER 4: BUDGET INITIATIVES
CHAPTER 5: BALANCE SHEET MANAGEMENT AND OUTLOOK
CHAPTER 6: STATEMENT OF RISKS
CHAPTER 7: ESTIMATED FINANCIAL STATEMENTS AND NOTES
APPENDIX A: SPECIFIC POLICY INITIATIVES AFFECTING THE BUDGET POSITION
APPENDIX B: GROWING VICTORIA INFRASTRUCTURE RESERVE
APPENDIX C: REVISED 2001-02 BUDGET OUTCOME
APPENDIX D: HISTORICAL AND FORWARD ESTIMATES TABLES
APPENDIX E: UNIFORM PRESENTATION OF GOVERNMENT FINANCE STATISTICS
APPENDIX F: TAX EXPENDITURES
APPENDIX G: COMMONWEALTH-STATE FINANCIAL RELATIONS
APPENDIX H: REQUIREMENTS OF THE FINANCIAL MANAGEMENT (FINANCIAL RESPONSIBILITY) ACT 2000
STYLE CONVENTIONS
INDEX
Budget Estimates 2002-03
TABLE OF CONTENTS
INTRODUCTION
STATEMENT 1 DEPARTMENTAL OVERVIEW
DEPARTMENTAL OVERVIEW
STATEMENT 2 DEPARTMENTAL STATEMENTS
DEPARTMENT OF EDUCATION AND TRAINING
DEPARTMENT OF HUMAN SERVICES
DEPARTMENT OF INFRASTRUCTURE
DEPARTMENT OF INNOVATION, INDUSTRY AND REGIONAL DEVELOPMENT
DEPARTMENT OF JUSTICE
DEPARTMENT OF NATURAL RESOURCES AND ENVIRONMENT
DEPARTMENT OF PREMIER AND CABINET
DEPARTMENT OF TOURISM, SPORT AND THE COMMONWEALTH GAMES
DEPARTMENT OF TREASURY AND FINANCE
PARLIAMENT
STATEMENT 3 STATE REVENUE
STATE REVENUE
STATEMENT 4 PUBLIC ACCOUNT
PUBLIC ACCOUNT
ABBREVIATIONS AND ACRONYMS
STYLE CONVENTIONS
INDEX