Exhibit (c)(2)
| Presentation to the Special Committee
Project Rising Sun
February 22, 2007
|

| This presentation has been prepared solely for the use of the Special Committee of the Board of Directors (the “Special Committee”) of Rising Sun (“Rising Sun” or the “Company”) in connection with the fairness opinion being provided by Bear, Stearns & Co. Inc. (“Bear Stearns”) with respect to Project Rising Sun. This presentation should only be used by the Special Committee in its evaluation of the specific transaction referred to herein (the “Transaction”) and should not be used, considered or relied upon for any other purpose or in connection with any other matter. This presentation and the conclusions presented herein are qualified in their entirety by Bear Stearns’ written opinion letter regarding the Transaction and the assumptions, qualifications and other limitations stated therein. This presentation is confidential and may not be reproduced, disseminated, quoted from or referred to at any time, in any manner or for any purpose without the prior written consent of Bear Stearns.
The financial and other information contained in this presentation was obtained solely from Rising Sun and from public sources. Bear Stearns has relied upon and assumed, without independent verification, the accuracy and completeness of such information. Bear Stearns has assumed that the projections referred to herein have been reasonably prepared on bases reflecting the best currently available estimates and judgments of the senior management of Rising Sun as to the Company’s expected future performance. Bear Stearns has not assumed responsibility for independent verification of any such information, including, without limitation, the projections, and Bear Stearns has further relied upon assurances of senior management of Rising Sun that they are unaware of any facts that would make any such information or projections incomplete or misleading. This presentation has been prepared as of February 22, 2007 and reflects information made available to us as of or prior to such date.
Bear Stearns has acted as a financial advisor to the Special Committee in connection with the Transaction and will receive a customary fee for such services, a substantial portion of which is contingent on successful consummation of the Transaction. In addition, Rising Sun has agreed to reimburse us for certain expenses and to indemnify us against certain liabilities arising out of our engagement. Bear Stearns may seek to provide Rising Sun and their respective affiliates certain investment banking and other services unrelated to the Transaction in the future.
Bear Stearns and/or certain of its personnel and affiliates may have passive minority investments in certain investment funds managed directly or indirectly by Colony Capital, LLC and/or its affiliates, and in portfolio companies of such funds.
Consistent with applicable legal and regulatory requirements, Bear Stearns has adopted policies and procedures to establish and maintain the independence of Bear Stearns’ research departments and personnel. As a result, Bear Stearns’ research analysts may hold views, make statements or investment recommendations and/or publish research reports with respect to Rising Sun and the Transaction and other participants in the Transaction that differ from the views of Bear Stearns’ investment banking personnel. In the ordinary course of business, Bear Stearns and its affiliates may actively trade for its own account and for the accounts of its customers equity and debt securities, bank debt and/or other financial instruments issued by Rising Sun, as well as derivatives thereof, and, accordingly, may at any time hold long or short positions in such securities, bank debt, financial instruments and derivatives.
CONFIDENTIAL 10097210, v2
|
| Table of Contents
Section
1 Transaction Overview
2 Historical Stock Performance
3 Review of Management Projections
4 Valuation Analysis
Appendices
A Discounted Cash Flow Analysis Support B Weighted Average Cost of Capital Analysis C Leveraged Buyout Illustration D Cash Transaction Premiums Paid Analysis E Other Precedent Gaming M&A Transactions
CONFIDENTIAL 10097210, v2
|

| Section 1
Transaction Overview |

| Project Rising Sun
Summary Deal Parameters
Draft of the Merger Agreement dated February 20, 2007
Fertitta Colony Partners LLC (“FCP”), whose principals include Frank Fertitta III, current Chairman and CEO of the Acquiror Company) and Lorenzo Fertitta, current Vice Chairman and President of the Company, (the “Fertittas”), and Blake and Delise Sartini (the “Sartinis,” collectively, the Fertittas and Sartinis will be referred to as the “Contributing Shareholders”) and affiliates of Colony Capital, LLC (“Colony”)
Holders of common stock will be entitled to receive $90.00 in cash, without interest, for each share of common stock Merger issued and outstanding, except for those shares contributed by the Contributing Shareholders. Holders of options will be Consideration entitled to receive the excess of the purchase price over the exercise price per share for each option outstanding.
Equity Financing Commitments(1) • Approximately $836 million rollover equity provided by the Contributing Shareholders • Remainder provided by Colony Financing Debt Financing Commitments(1) • Collateralized Mortgage-Backed Security (“CMBS”) loan structured such that Rising Sun’s existing public debt (approximately $2,300 million) would remain outstanding • $500 million revolving credit facility, of which $350 million will be drawn at closing “Go-Shop” Begins on the date of the signing of the Agreement and Plan of Merger and ends on the 30th business day thereafter
Transaction must be approved by: Requisite • 66 2/3% of the outstanding shares entitled to vote and Stockholder Vote • A majority of the outstanding shares, excluding all of the shares currently held by Contributing Shareholders (“Majority of the Public Majority Vote”)
2% of the aggregate Merger Consideration if the Transaction is terminated during the Go-Shop period [3%] of the aggregate Merger Consideration if the Transaction is terminated subsequent to the Go-Shop period Termination Fee [3%] termination fees payable by the Acquiror in the event it fails to perform upon certain obligations (limited guarantee by Colony’s funds) 2% fee to the Company if the Acquiror fails to obtain regulatory approval
The Contributing Shareholders are not required to support a superior proposal Other Permission for the Company to continue to pay its regular quarterly dividends, not to exceed $0.2875 per share, between signing and closing
Source: Draft of the Agreement and Plan of Merger dated February 20, 2007 and Schedule 13D filing dated December 4, 2006. (1) We have reviewed equity and debt commitment papers dated December 2, 2006 at a purchase price of $82.00 per share.
CONFIDENTIAL 1
|

| Project Rising Sun
Proposed LBO Sources & Uses [Subject to Update]
Assumed Transaction Close: June 30, 2007 ($ in millions) Sources Amount % Uses Amount % New Revolver(1) $350.0 3.8% Purchase Price of Equity(7) $4,487.7 48.4% New CMBS(2) 2,725.0 29.4 Rollover Equity(5) 836.3 9.0 Rollover Public Debt(3) 2,300.0 24.8 Rollover Public Debt(3) 2,300.0 24.8 Rollover JV Debt(4) 432.5 4.7 Rollover JV Debt(4) 432.5 4.7 Rollover Equity(5) 836.3 9.0 Pay Existing Bank Debt(8) 1,104.5 11.9 Sponsor Equity(6) 2,623.4 28.3 Transaction Fees(9) 70.1 0.8 Financing Fees(9) 36.0 0.4
Total $9,267.2 100.0% Total $9,267.2 100.0%
(1) Represents the drawn portion of the $500 million revolver commitment from Deutsche Bank Securities, Inc. and Deutsche Bank Trust Company Americas. Source: Schedule 13D filing dated 12/4/06. (2) Represents the $2.725 billion CMBS commitment provided by German American Capital Corporation and Deutsche Bank AG. Source: Schedule 13D filing dated 12/4/06. (3) Per the Schedule 13D filing dated 12/4/06, Rising Sun’s existing public debt will remain outstanding. Rollover public debt figure represents face value of the outstanding public bonds. (4) Represents 50% of Green Valley’s and 50% of Aliante’s 12/31/06 net debt balance of $282.5 million and $150.0 million, respectively. Aliante’s 12/31/06 debt balance represents the present value of the 1/1/09 debt balance discounted at its cost of debt of 8%. (5) Please refer to the next page for detail of insider rollover equity. (6) Represents estimated equity commitment from Colony Capital LLC. (7) Based on $90.00 purchase price per share. (8) Projected 6/30/07 existing bank debt balance per Rising Sun management model. (9) Source: Rising Sun management model.
CONFIDENTIAL 2
|

| Project Rising Sun
Pro Forma Ownership
Pre-Transaction—12/1/06(1) Estimated Pro Forma Ownership(2)
Fertitta Brothers Fertitta Brothers 20.4% 19.8%
Sartinis 3.7% Sartinis 7.0%
Public Holders 67.7% Other Insiders 5.5% Colony Capital 75.8%
Fully Diluted Shares: 59.067 million(3)
Insider Ownership Analysis(4) ($ and shares in millions)
Current Rollover $90.00/Share Shares Shares Sold % of Holdings Holdings Shares Rollover Value Sold Value Sold Frank Fertitta 5.719 3.899 $350.9 1.820 $163.8 31.8 % Lorenzo Fertitta 5.735 3.957 356.1 1.778 160.0 31.0 Blake & Delise Sartini 4.123 1.436 129.3 2.687 241.8 65.2 Total 15.577 9.292 $836.3 6.285 $565.7 40.3 %
(1) Source: Proxy 4/18/06, management, Schedule 13D 12/4/06 and Lionshares. (2) Based on estimated pro forma equity commitments based on the $90.00 purchase price per share. (3) Ownership percentages based on fully diluted shares calculated under the treasury method based on $69.10 price per share as of 12/1/06. (4) Source: Schedule 13D filing dated 12/4/06.
CONFIDENTIAL 3
|

| Project Rising Sun
Rising Sun—Price / Volume & Premium
The Transaction price of $90.00 represents a 30.2% premium to the unaffected price of $69.10.
December 5, 2005 through February 16, 2007
10,000,000 $95.00 Transaction Price: $90.00 9,000,000
8,000,000 85.00 7,000,000
6,000,000 Initial Bid (12/4/06): $82.00 75.00 2/21/07 Closing Price: 5,000,000 $83.65 Price Volume 4,000,000 65.00 3,000,000 2,000,000 55.00 1,000,000
0 45.00 12/05 2/06 5/06 7/06 9/06 12/06 2/07 Volume Price
Period % Premium at Before Average $90.00 Announcement Price Transaction Price: 1-Day 69.10 30.2% 10-Day 69.39 29.7 1-Month 66.82 34.7 3-Month 61.94 45.3 6-Month 62.25 44.6 1-Year 66.88 34.6 2-Year 65.91 36.6
Source: Thomson Financial and Rising Sun press release.
CONFIDENTIAL 4
|

| Section 2
Historical Stock Performance and Financial Overview
|

| Project Rising Sun
Two Year Annotated Price / Volume Chart
10,000,000 $100.00 12/04/06: Rising Sun announced that it 01/25/07: CTW Investment Group 9,000,000 had received a bid from Fertitta Colony announces opposition to the buyout 95.00 3/15/05: Rising Sun increased EPS Partners for $82 a share. offer. guidance from $0.56–$0.62 to 8,000,000 $0.62–$0.68. 90.00
11/02/06: Reported Q3 2006 3/15/05: Stock hit 52-week high 7,000,000 EPS of $0.38, missing Wall 85.00 after Merrill Lynch analyst Street expectations of $0.51. increased price target from $72.00 11/08/06: Stock price rises 6,000,000 to $82.00. to $65.23, or 7.8%, after 80.00 analysts report that Rising 03/08/06: Received approval 5,000,000 Sun could become the next 75.00 from Gaming Control Board buyout target in gaming. Price Volume for Red Rock. 4,000,000 70.00
3,000,000 65.00 07/25/06: Missed Wall Street Q2 EPS expecations. 2,000,000 60.00
1,000,000 55.00
0 50.00 2/05 6/05 10/05 2/06 6/06 10/06 2/07
Volume Price
Source: Thomson Financial, Factiva and Company press releases.
CONFIDENTIAL 5
|

| Project Rising Sun
Comparative Historical Stock Price Performance
From 12/5/2005— Present
190% 190% 170 170 150 150 130 130 110 110
90 90
70 70 12/05 2/06 5/06 7/06 9/06 12/06 2/07
From 12/6/2004— Present
180% 180% 160 160 140 140 120 120 100 100
80 80 12/04 4/05 9/05 1/06 5/06 10/06 2/07
(1) (2) (3) STN Large Cap Index Adjusted Large Cap Index Mid Cap Index S&P 500
(1) The Large Cap Index includes the Las Vegas Sands, MGM Mirage, Harrah’s Entertainment, Wynn Resorts, Boyd Gaming and Penn National Gaming. (2) The Adjusted Large Cap Index includes Boyd Gaming and Penn National Gaming but excludes (i) Wynn Resorts and Las Vegas Sands, which have affected stock prices due to their Macau developments, (ii) Harrah’s Entertainment, which has an affected stock price due to its proposed buyout and (iii) MGM Mirage, which has an affected stock price due to Tracinda Corporation’s tender offer to purchase approximately 450 million shares. (3) The Mid Cap Index includes Ameristar Casinos, Pinnacle Entertainment, Isle of Capris Casinos, Trump Entertainment and Great Canadian Gaming.
CONFIDENTIAL 6
|

| Project Rising Sun
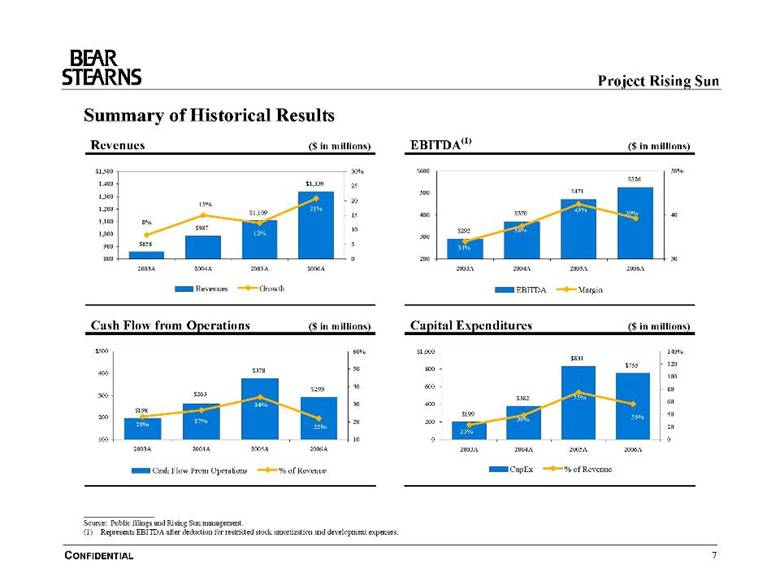
Summary of Historical Results
Revenues ($ in millions) EBITDA(1) ($ in millions)
$1,500 30% $600 50% $526 1,400 $1,339 25 500 $471 1,300 20 15% 1,200 21% 43% $1,109 15 400 $370 39% 40 1,100 8% $987 10 38% 12% $292 1,000 300 900 $858 5 34% 800 0 200 30 2003A 2004A 2005A 2006A 2003A 2004A 2005A 2006A
Revenues Growth EBITDA Margin
Cash Flow from Operations ($ in millions) Capital Expenditures ($ in millions)
$500 60% $1,000 140% $831 $755 120 $378 50 800 400 100 $293 40 600 80 300 $263 $382 75% 30 400 60 34% $198 $199 56% 40 200 39% 27% 20 200 23% 22% 20 23% 100 10 0 0 2003A 2004A 2005A 2006A 2003A 2004A 2005A 2006A
Cash Flow From Operations % of Revenue CapEx % of Revenue
Source: Public filings and Rising Sun management. (1) Represents EBITDA after deduction for restricted stock amortization and development expenses.
CONFIDENTIAL 7
|
| Section 3
Review of Management Projections
|

| Project Rising Sun
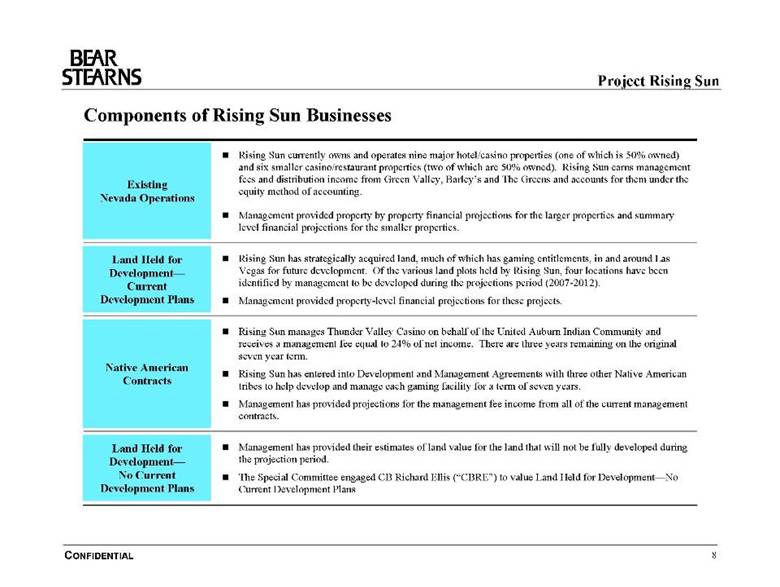
Components of Rising Sun Businesses
Rising Sun currently owns and operates nine major hotel/casino properties (one of which is 50% owned) and six smaller casino/restaurant properties (two of which are 50% owned). Rising Sun earns management fees and distribution income from Green Valley, Barley’s and The Greens and accounts for them under the Existing equity method of accounting. Nevada Operations
Management provided property by property financial projections for the larger properties and summary level financial projections for the smaller properties.
Land Held for Rising Sun has strategically acquired land, much of which has gaming entitlements, in and around Las Development— Vegas for future development. Of the various land plots held by Rising Sun, four locations have been Current identified by management to be developed during the projections period (2007-2012). Development Plans Management provided property-level financial projections for these projects.
Rising Sun manages Thunder Valley Casino on behalf of the United Auburn Indian Community and receives a management fee equal to 24% of net income. There are three years remaining on the original seven year term. Native American Rising Sun has entered into Development and Management Agreements with three other Native American Contracts tribes to help develop and manage each gaming facility for a term of seven years.
Management has provided projections for the management fee income from all of the current management contracts.
Land Held for Management has provided their estimates of land value for the land that will not be fully developed during Development— the projection period. No Current The Special Committee engaged CB Richard Ellis (“CBRE”) to value Land Held for Development—No Development Plans Current Development Plans
CONFIDENTIAL 8
|
| Project Rising Sun
Valuation Methodology for the Components of Rising Sun Businesses
Valuation Methodology Rationale
Comparable trading analysis • Detailed management forecasts available Precedent M&A transactions analysis Existing • Properties exist today Nevada Operations Discounted cash flow analysis • Market-based metrics are observable Sum-of-the-parts analysis
Land Held for Discounted cash flow analysis • Detailed management forecasts available Development— 3rd party appraisal (CBRE) • Development occurs over time Current Development Plans Management valuation • Capture value of future ongoing operations
• Detailed management forecasts available Native American Discounted cash flow analysis with no terminal • Contract terms defined Contracts value
• Finite life and unclear renewal terms
Land Held for 3rd party appraisal (CBRE) • No cash flows from land Development— No Current Management Valuation • Utilize management’s expertise in the market Development Plans
CONFIDENTIAL 9
|

| Project Rising Sun
Summary of Rising Sun Properties Owned, Managed and Held for Development
($ in millions)
Land Held for Development— Existing Operations Planned Operations No Current Development Plans Year Anticipated Ownership Opened/ Cost 2006A Owned Ownership Opening Owned Properties % Acquired Basis(1) EBITDA(2) Properties % Year Location Acres Palace Station 100.0 % 1976 $202.0 $52.7 Aliante 50.0 % 2009 Potential Development Opportunities: Boulder Station 100.0 1994 234.1 88.3 Castaways 100.0 2009 Wild Wild West 69.3 Texas Station 100.0 1995 303.5 40.0 Durango 100.0 2010 Cactus 60.7 Sunset Station 100.0 1997 377.9 85.0 Reno Bayer 100.0 2012 Flamingo 49.0 Santa Fe Station 100.0 2000 374.8 82.0 Sunset/Lindell 12.0 Red Rock Resort 100.0 2006 885.0 60.1 Reno Convention Center 7.7 Fiesta Rancho 100.0 2001 218.0 17.4 Fisher Brothers JV / Palace Station 52.0 Fiesta Henderson 100.0 2001 117.0 17.6 Wild Wild West 100.0 1998 NA 4.1 Excess Land at Existing Owned or Managed Properties: Green Valley 50.0 2001 450.9 49.0 Fiesta Henderson 15.0 Other Properties(3) NA 8.8 Boulder Station 8.0 Red Rock Resort 8.2 Contract 2006A Mgmt. Managed Anticipated Sunset Station 5.0 Managed Properties Date Mgmt Fee(4) Fee Income(2)Properties Mgmt Fee(4) Contract Life Thunder Valley 188.0 Thunder Valley 2003-2010 24.0 % $87.0 Gun Lake 21.0-22.0 % 2009-2016 Graton 23.0 Chico 24.0 2010-2016 Graton 24.0 2010-2017 Excess Land at Properties to be Developed: Aliante / Losee 54.0 Castaways 15.0 Durango 5.0 Reno Bayer 35.0
(1) As of 9/30/06. Source: Management. (2) Source: Management. (3) Includes Wildfire, Gold Rush, Magic Star, Lake Mead, Barley’s (50.0%), The Green’s (50.0%) and Palms (6.7%). (4) Represents percent of property net income.
CONFIDENTIAL 10
|

| Project Rising Sun
Consolidated Management Projections
Management has provided us with their detailed projections, and the following is a summary of their financial plan.
Revenue ($ in millions) $4,000 $4,000 2012 CAGR = 10.8% 2006– 3,000 $2,477.2 3,000 $2,082.5 $2,175.2 2,000 $1,543.3 $1,655.2 $1,789.0 2,000 $1,339.0 $986.7 $1,108.8 1,000 1,000
0 0 2004A 2005A 2006A 2007E 2008E 2009E 2010E 2011E 2012E
Actual Revenue Projected Revenue
EBITDA(1) ($ in millions) $2,000 $2,000 CAGR = 14.8% 2006–2012 1,500 $1,202.0 1,500 $987.0 $1,055.9 1,000 $837.2 1,000 $725.3 $525.9 $641.0 $370.2 $471.3 500 500
0 0 2004A 2005A 2006A 2007E 2008E 2009E 2010E 2011E 2012E
Actual EBITDA Projected EBITDA
(1) Represents EBITDA after deductions for restricted stock amortization and development expenses.
CONFIDENTIAL 11
|

| Project Rising Sun
EBITDA Breakdown
($ in millions)
$1,400.0 $1,400.0 $1,202.0 1,200.0 1,200.0 $1,055.9 $173.5 $987.0 1,000.0 $160.7 1,000.0 $837.2 $144.7 $244.3 $725.3 $144.1 800.0 $116.2 $123.3 800.0 $641.0 $93.0 $35.9 600.0 $525.9 $92.0 600.0 $87.0 400.0 $751.1 $784.2 400.0 $685.1 $719.0 $632.3 $549.0 200.0 $438.8 200.0
0.0 0.0 2006 2007 2008 2009 2010 2011 2012
(1) (2) Existing Nevada Operations Development Opportunities Native American Contracts
(1) Represents EBITDA after deductions for corporate expenses, development expenses and restricted stock amortization and includes Rising Sun’s 50% share of Green Valley Ranch’s and Aliante’s operating income. (2) Represents EBITDA generated by future projects built on Land Held for Development—Current Development Plans.
CONFIDENTIAL 12
|

| Project Rising Sun
Summary of Wall Street Research
Estimates and Price Targets ($ in millions, except per share data)
Price Target 12/4/06 Announcement EBITDA EPS Firm Name Date Analyst Recommendation Prior To After CY 2006 CY 2007 CY 2008 CY 2006 CY 2007 CY 2008 Buckingham 02/12/07 John Grassano Neutral NA NA $522.9 $628.0 NA $2.17 $2.29 NA Bear Stearns 02/02/07 Joseph Greff Peer Perform NA NA 586.0 628.0 $693.0 2.23 2.24 $3.09 CIBC 12/22/06 David Katz Sector Perform $77.00 NA 526.4 639.7 NA 2.27 2.45 NA Citigroup 12/19/06 Geoffrey Davis Hold 78.00 NA NA NA NA 2.13 2.06 2.55 UBS 12/08/06 Robin Farley Neutral 2 63.00 $87.00 532.6 634.2 NA 2.17 2.21 NA Credit Suisse 12/06/06 Scott Barry Neutral 64.00 85.00 532.4 615.3 NA 2.25 2.21 NA Morgan Stanley 12/04/06 Celeste Brown Equal Weight 80.00 NA 531.3 613.1 700.5 2.21 2.02 2.49 Merrill Lynch 12/04/06 David Andrews Buy 72.00 NA NA NA NA 2.25 2.15 NA Goldman Sachs 12/04/06 Steven Kent Buy/Neutral 70.00 82.00 481.2 586.4 636.9 2.12 2.16 2.66 JPMorgan 12/04/06 Harry Curtis Neutral NA NA NA NA NA 2.24 2.00 NA Lehman 11/09/06 Felicia Hendrix Equal Weight 81.00 NA 530.3 624.0 NA 2.24 2.15 NA Argus 11/06/06 John Staszak Sell NA NA NA NA NA 2.02 2.43 NA Keybanc 11/06/06 Dennis Forst Hold NA NA NA NA NA 2.24 2.03 NA Susquehanna 11/03/06 Robert Lafleur Neutral NA NA 526.5 612.6 NA 2.23 2.03 NA Nollenberger 11/03/06 David Barteld Buy 100.00 NA NA 657.0 NA 2.15 2.62 NA BMO 11/03/06 Jeffery Logsdon Market Perform 86.00 NA 524.0 603.2 645.0 2.20 2.09 2.49 Guzman 11/03/06 Jake Balzer Under Perform 82.00 NA 460.2 594.1 707.5 2.28 2.44 3.30 Banc of America 11/03/06 Jeremy Cogan Neutral 82.00 NA 556.0 650.0 784.0 2.24 2.07 2.43 Sterne, Agee 11/03/06 Nicholas Danna Hold 77.00 NA 529.4 625.1 NA 2.21 2.19 NA Wachovia 11/03/06 Brian McGill Market Perform NA NA 528.6 614.1 NA 2.16 2.04 NA Calyon 07/26/06 Smedes Rose Add 63.00 NA 560.0 660.0 NA 2.55 2.85 NA
Consensus Estimate $526.6 $622.3 $676.6 $2.21 $2.19 $2.65 Management Estimate 527.6 641.0 725.3 2.35 2.22 NA $ Variance 1.0 18.7 48.7 0.14 0.02 NA % Variance 0.2% 3.0% 7.2% 6.2% 1.0% NA
(1) Source: Wall Street research, First Call and management.
CONFIDENTIAL 13
|

| Project Rising Sun
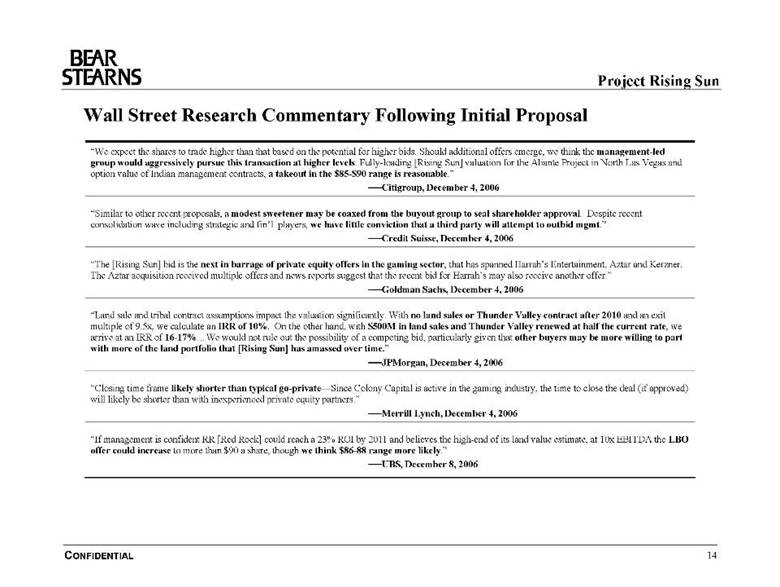
Wall Street Research Commentary Following Initial Proposal
“We expect the shares to trade higher than that based on the potential for higher bids. Should additional offers emerge, we think the management-led group would aggressively pursue this transaction at higher levels. Fully-loading [Rising Sun] valuation for the Aliante Project in North Las Vegas and option value of Indian management contracts, a takeout in the $85-$90 range is reasonable.” — Citigroup, December 4, 2006
“Similar to other recent proposals, a modest sweetener may be coaxed from the buyout group to seal shareholder approval. Despite recent consolidation wave including strategic and fin’l players, we have little conviction that a third party will attempt to outbid mgmt.” -- Credit Suisse, December 4, 2006
“The [Rising Sun] bid is the next in barrage of private equity offers in the gaming sector, that has spanned Harrah’s Entertainment, Aztar and Kerzner. The Aztar acquisition received multiple offers and news reports suggest that the recent bid for Harrah’s may also receive another offer.” — Goldman Sachs, December 4, 2006
“Land sale and tribal contract assumptions impact the valuation significantly. With no land sales or Thunder Valley contract after 2010 and an exit multiple of 9.5x, we calculate an IRR of 10%. On the other hand, with $500M in land sales and Thunder Valley renewed at half the current rate, we arrive at an IRR of 16-17%…We would not rule out the possibility of a competing bid, particularly given that other buyers may be more willing to part with more of the land portfolio that [Rising Sun] has amassed over time.” — JPMorgan, December 4, 2006
“Closing time frame likely shorter than typical go-private—Since Colony Capital is active in the gaming industry, the time to close the deal (if approved) will likely be shorter than with inexperienced private equity partners.” — Merrill Lynch, December 4, 2006
“If management is confident RR [Red Rock] could reach a 23% ROI by 2011 and believes the high-end of its land value estimate, at 10x EBITDA the LBO offer could increase to more than $90 a share, though we think $86-88 range more likely.” — UBS, December 8, 2006
CONFIDENTIAL 14
|
| Section 4
Valuation Analysis
|

| Project Rising Sun
Rising Sun Valuation – Current EBITDA
($ in millions, except per share data)
12/01/06 Day Prior to Announcement Transaction Price Price $69.10 $90.00 Fully Diluted Shares(1) 59.067 59.155 Equity Value / Purchase Price $4,081.5 $5,324.0 (+) Debt(2) 3,897.5 3,897.5 (-) Cash(3) (116.9 ) (116.9 ) Transaction Value (TV)(4) $7,862.1 $9,104.6
No Midpoint Estimate High Estimate No Midpoint Estimate �� High Estimate Less Adjustments: Adjustment Management CBRE Management CBRE Adjustment Management CBRE Management CBRE Land Held for Dvlp.—No Current Dvlp Plans(5) $- $(1,464.8 ) $(1,020.9 ) $(1,730.4 ) $(1,183.5 ) $- $(1,464.8 ) $(1,020.9 ) $(1,730.4 ) $(1,183.5 ) Land Held for Dvlp.—Current Dvlp Plans(6) - (532.1 ) (285.4 ) (640.8 ) (311.4 ) - (532.1 ) (285.4 ) (640.8 ) (311.4 ) Advances to Tribes(7) - (178.0 ) (178.0 ) (178.0 ) (178.0 ) - (178.0 ) (178.0 ) (178.0 ) (178.0 ) TV excl. Land (TVL) $7,862.1 $5,687.3 $6,377.8 $5,313.0 $6,189.2 $9,104.6 $6,929.8 $7,620.3 $6,555.4 $7,431.7 Native American Contracts(8) - $(619.4 ) $(619.4 ) $(634.4 ) $(634.4 ) $(619.4 ) $(619.4 ) $(634.4 ) $(634.4 ) TV excl. Land & Native American (TVLNA) $7,862.1 $5,067.9 $5,758.4 $4,678.5 $5,554.8 $9,104.6 $6,310.4 $7,000.9 $5,921.0 $6,797.2
Metric No Adj. Multiples excluding All Land No Adj. Multiples excluding All Land TVL / 2006A Mgmt EBITDA $525.9 15.0 x 10.8 x 12.1 x 10.1 x 11.8 x 17.3 x 13.2 x 14.5 x 12.5 x 14.1 x TVL / 2007E Mgmt EBITDA 641.0 12.3 8.9 9.9 8.3 9.7 14.2 10.8 11.9 10.2 11.6 TVL / 2008E Mgmt EBITDA 725.3 10.8 7.8 8.8 7.3 8.5 12.6 9.6 10.5 9.0 10.2
Metric(9) Multiples excluding All Land & Native American Contracts Multiples excluding All Land & Native American Contracts TVLNA / 2006A Mgmt EBITDA $438.8 11.5 x 13.1 x 10.7 x 12.7 x 14.4 x 16.0 x 13.5 x 15.5 x TVLNA / 2007E Mgmt EBITDA 549.0 9.2 10.5 8.5 10.1 11.5 12.8 10.8 12.4 TVLNA / 2008E Mgmt EBITDA 632.3 8.0 9.1 7.4 8.8 10.0 11.1&n bsp; 9.4 10.8
(1) Based on 57.262 million basic shares outstanding and 2.187 million in-the-money options with a weighted average exercise price of $12.07 and calculated using the treasury method. (2) Sum of the 12/31/06 debt balance (face value excluding discounts and premiums) per management and 50% of Green Valley’s and 50% of Aliante’s 12/31/06 net debt balance of $282.5 and $150.0 million, respectively. Aliante’s 12/31/06 debt balance represents the present value of the 1/1/09 debt balance discounted at its cost of debt of 8%. (3) 12/31/06 cash balance per management. (4) Transaction value excludes transaction fees and expenses. (5) Please refer to the following page for details. (6) Please refer to page 17 for details. (7) Source: Management. (8) Please refer to page 35 for details. (9) EBITDA figures exclude management fees from Native American contracts.
CONFIDENTIAL 15
|

| Project Rising Sun
Schedule of Land Held for Development—No Current Development Plans
($ in millions) Location Acres Internal Management Estimates(1) CBRE Estimates(2) Low High Low High Potential Development Opportunities: Wild Wild West 69.3 $692.9 $1,039.4 $346.5 $485.1 Cactus 60.7 151.8 212.5 151.8 182.1 Flamingo 49.0 122.5 196.0 122.5 196.0 Sunset/Lindell 12.0 12.0 12.0 12.0 12.0 Reno Convention Center 7.7 16.0 16.0 8.6 9.3 Fisher Brothers JV / Palace Station 52.0 40.0 40.0 70.0 122.0
Excess Land at Existing Owned or Managed Properties: Fiesta Henderson 15.0 7.8 10.5 8.5 9.8 Boulder Station 8.0 4.2 4.2 5.2 5.6 Red Rock Resort 8.2 20.5 32.8 21.4 26.8 Sunset Station 5.0 8.7 11.9 8.7 9.1 Thunder Valley 188.0 40.0 60.0 31.6 40.9 Graton 23.0 20.0 30.0 13.6 15.5
Excess Land at Properties to be Developed: Reno Bayer(3) 35.0 15.0 15.0 19.4 20.2 Durango(3) 5.0 12.5 15.0 12.5 15.0 Castaways(3) 15.0 11.3 11.3 11.3 18.8 Aliante / Losee 54.0 24.0 24.0 14.7 15.3
Total $1,199.1 $1,730.4 $858.3 $1,183.5
Note: Land where management expects to develop properties prior to year end 2012 are excluded from this analysis. The values above are before any debt allocation related to joint ventures, except for the Fisher Brothers JV / Palace Station. Rising Sun’s allocation of debt in these properties is included in our consolidated debt. (1) Based on discussions with management as to what they believe the land is worth. Their estimation is based on cost of land, the CB Richard Ellis report commissioned by management in September 2006 and comparable transactions as well as their overall feel for the Las Vegas land market. (2) Based on CB Richard Ellis report dated January 2007. (3) CBRE valued each site at the Reno Bayer, Durango and Castaways projects in their entirety. The CBRE estimates above represent the proportional value of excess land based on acreage that will not be used in developing the aforementioned projects, a methodology that was approved by CBRE.
CONFIDENTIAL 16
|

| Project Rising Sun
Schedule of Land Held for Development—Current Development Plans
The following four properties are expected to be developed by the Company during the projections period and are therefore not included in Land Held for Development—No Current Development Plans
Valuation Approach 1: Land Value Estimates ($ in millions)
Acres(1) Completion Date CBRE Low Value CBRE High Value Mgmt Low Value Mgmt High Value Reno Bayer 57.7 2012 $32.0 $33.3 $38.0 $38.0 Durango 66.0 2010 165.0 198.0 165.0 197.9 Castaways 15.3 2009 11.5 19.1 11.5 11.5 Aliante(2) 40.7 2009 50.9 61.0 25.0 25.0
Total Land Value Estimates(3) $259.3 $311.4 $239.4 $272.4
Alternatively, a discounted cash flow of management’s projected cash flows for the Land Held for Development—Current Development Plans utilizing a WACC range of 8.5% to 9.5% and an EBITDA exit multiple range of 9.5x to 10.5x produces an implied land present value range of $428.7 to $640.8 million.
Valuation Approach 2: DCF Estimates ($ in millions)
2012E Revenue 2012E EBITDA Reno Bayer $211.6 $80.2 Durango 247.5 110.1 Castaways 34.2 16.7 Aliante 50% EBITDA NA 27.9 Aliante Management Fee 9.4 9.4
Total $502.7 $244.3 DCF Low Value DCF High Value Total Land Value DCF Estimates(3) $428.7 $640.8
(1) Where appropriate, excess land at these properties (acreage the Company does not intend to develop during the projection period) is included on the previous page. (2) Represents Rising Sun’s 50% interest in the joint venture. (3) The values above are before any debt allocation related to joint ventures. Rising Sun’s allocation of debt at Aliante is included in the Company’s consolidated debt.
CONFIDENTIAL 17
|

| Project Rising Sun
Summary of Valuation Reference Ranges and Research Analyst Price Targets (Per share data)(8)
12/4/06 Initial Bid: Transaction Price: 2007 Comparable $82.00 $90.00 (1) $60.25 $92.00 Trading Analysis
2008 Comparable (2) $62.25 $96.75 Trading Analysis
Precedent M&A (3) $69.75 $101.25 Transactions
(4) DCF $74.75 $100.75
Sum-of-the-Parts (5) $63.75 $95.50
Post-Offer (6) $82.00 $87.00 Research Price Targets
Pre-Offer (7) $63.00 $81.00 $100.00 Research Price Targets
$30.00 $60.00 $90.00 $120.00
(1) Please see Comparable Trading Valuation Analysis — 2007 on page 21. (2) Please see Comparable Trading Valuation Analysis — 2008 on page 22. (3) Please see Precedent M&A Valuation Analysis on page 26. (4) Please see DCF Analysis on page 27. (5) Please see Sum-of-the-Parts Analysis on page 28. (6) Based on range of First Call Research price targets for research issued after the announcement of the 12/4/06 Fertitta Colony bid. (7) Based on range of First Call Research price targets for research issued before the announcement of the 12/4/06 Fertitta Colony bid. Note: High estimate of $100/share based on Nollenberger Capital research – next highest price target was $81.00/share per Lehman Brothers. (8) Based on 59.155 million fully diluted shares.
CONFIDENTIAL 18
|

| Project Rising Sun
US Comparable Gaming Company Analysis ($ in millions, except per share data)
Senior % of Market Current Debt/ Implied Price 52 Wk Dividend Value of Enterprise EV/EBITDA(1) Price/Earnings(1) EBITDA Ticker Ratings 2/21/07 High Yield Equity Value 2006E 2007E 2008E 2006E 2007E 2008E 2006E Large-Cap Operators &nb sp; LasVegas Sands LVS Ba3/BB- $91.93 84.7% 0.0% $32,800.3 $36,337.0 33.3x 19.8x 14.5x NM 32.2x 24.2x 3.7x MGM Mirage(2)(3) MGM Ba2/BB 69.75 93.8 0.5 21,235.7 33,418.6 13.0 12.0 11.4 29.5 x 25.5 21.8 5.1 Harrah’s Entertainment HET WR/BB+ 85.21 99.6 2.4 16,815.0 27,483.3 11.0 10.1 9.3 23.9 20.5 18.1 4.3 Wynn Resorts WYNN NA/BB- 102.19 89.6 0.0 11,726.2 12,478.9 37.5 20.6 18.4 NM 43.3 37.8 6.5 Rising Sun N/A Ba2/BB 83.65 98.5 2.0 4,946.5 8,727.1 16.6 14.1 13.0 37.8 38.2 32.0 7.4 Boyd Gaming(2) BYD Ba2/BB 48.90 90.5 1.4 4,338.0 7,025.7 11.2 10.3 9.3 24.1 21.0 18.6 4.6 Penn National Gaming PENN Ba2/BB 46.63 98.2 0.0 4,171.2 7,037.1 10.7 9.4 8.5 24.5 20.2 16.2 4.6 HarmonicMean 15.0x 12.6x 11.3x 27.1x 26.4x 22.2x 4.9x Adjusted Harmonic Mean(4) 10.9x 9.8x 8.9x 24.3x 20.6x 17.4x 4.6x Mid-Cap Operators Ameristar Casinos ASCA Ba3/BB $32.86 99.6% 1.2% $1,941.4 $2,685.6 9.5x 8.8x 8.2x 22.9x 21.2x 18.8x 3.1x Pinnacle Entertainment(3) PNK B2/B+ 34.12 94.8 0.0 1,762.1 2,372.3 11.4 12.2 9.0 29.4 45.6 32.7�� 3.1 Isle Of Capris Casinos ISLE Ba3/BB- 29.07 85.7 0.0 922.8 2,099.9 9.9 8.2 NM NM 43.2 NM 5.9 Trump Entertainment TRMP NA 18.95 81.2 0.0 594.8 1,974.9 9.2 8.2 7.3 NM 36.7 18.2 6.6 Great Canadian Gaming GCD BBBL 10.96 88.3 0.0 955.1 1,236.2 15.3 13.4 11.0 NM 37.4 24.8 4.4 HarmonicMean 10.7x 9.7x 8.7x 25.8x 34.2x 22.3x 4.2x Small-Cap Operators MTR GamingGroup MNTG B1/B+ $12.91 99.7% 0.0% $362.9 $551.3 11.8x 7.5x 5.8x NM 33.1x 23.1x 5.6x Riviera Holdings RIV B2/B 21.30 84.8 0.0 272.9 456.5 11.4 10.8 NM NM NM NM 5.4 Dover Downs DDE NA 12.55 61.8 1.4 412.2 443.1 7.5 6.8 NM 14.8 x 13.8 13.8 0.9 Monarch Casino & Resorts MCRI NA 24.36 74.9 0.0 476.7 448.1 8.8 8.8 NM 18.8 17.2 17.2 NM Empire Resorts NYNY NA 12.38 98.0 0.0 380.0 450.2 NA NA NM NA NA NM NM Century Casinos CNTY NA 11.37 95.8 0.0 272.8 308.0 21.4 9.3 8.1 36.0 19.7 16.5 4.3 Lakes Entertainment LACO NA 8.86 68.2 0.0 219.2 264.7 NM NM NM 26.1 NM NM NM Nevada Gold & Casinos UWN NA 2.52 24.7 0.0 32.6 92.8 7.2 9.5 NM NM NM NM 4.8 HarmonicMean 9.9x 8.6x 6.7x 21.4x 18.9x 17.0x 2.6x Overall HarmonicMean 11.7x 10.2x 9.4x 24.5x 25.7x 20.6x 3.7x
Note: Balance Sheet Data as of latest 10-K or 10-Q filing; All companies have December fiscal years, except Isle of Capri Casinos and Nevada Gold & Casinos, whose estimates are calendarized. (1) Based on First Call consensus estimates. (2) Includes share of EBITDA and debt attributable to Borgata. (3) Pro-forma for recent and pending acquisitions and divestitures. (4) Excludes (i) Wynn Resorts and Las Vegas Sands, which have high multiples due to their Macau developments, (ii) Rising Sun and Harrah’s, which have affected multiples due to their proposed buyouts and (iii) MGM Mirage, which has an affected multiple due to Tracinda Corporation’s tender offer to purchase approximately 450 million shares.
CONFIDENTIAL 19
|

| Project Rising Sun
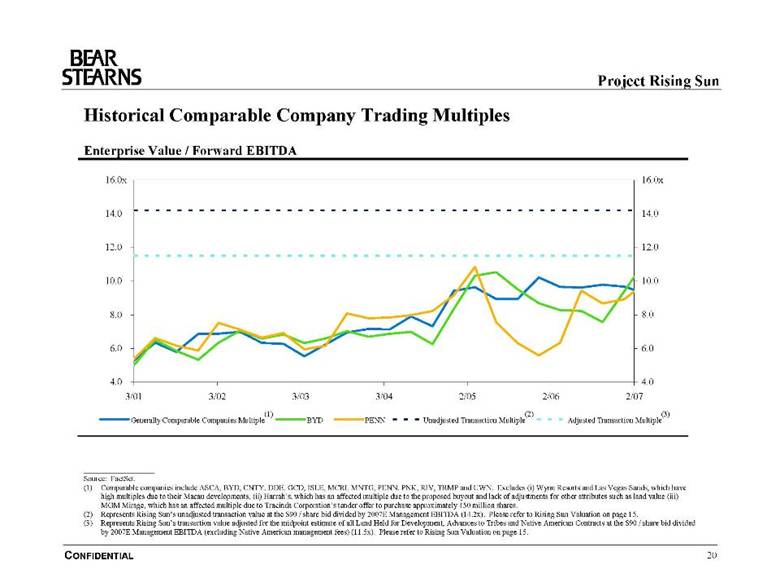
Historical Comparable Company Trading Multiples
Enterprise Value / Forward EBITDA
16.0x 16.0x 14.0 14.0 12.0 12.0 10.0 10.0 8.0 8.0 6.0 6.0
4.0 4.0 3/01 3/02 3/03 3/04 2/05 2/06 2/07 (1) (2) (3) Generally Comparable Companies Multiple BYD PENN Unadjusted Transaction Multiple Adjusted Transaction Multiple
Source: FactSet. (1) Comparable companies include ASCA, BYD, CNTY, DDE, GCD, ISLE, MCRI, MNTG, PENN, PNK, RIV, TRMP and UWN. Excludes (i) Wynn Resorts and Las Vegas Sands, which have high multiples due to their Macau developments, (ii) Harrah’s, which has an affected multiple due to the proposed buyout and lack of adjustments for other attributes such as land value (iii) MGM Mirage, which has an affected multiple due to Tracinda Corporation’s tender offer to purchase approximately 450 million shares. (2) Represents Rising Sun’s unadjusted transaction value at the $90 / share bid divided by 2007E Management EBITDA (14.2x). Please refer to Rising Sun Valuation on page 15. (3) Represents Rising Sun’s transaction value adjusted for the midpoint estimate of all Land Held for Development, Advances to Tribes and Native American Contracts at the $90 / share bid divided by 2007E Management EBITDA (excluding Native American management fees) (11.5x). Please refer to Rising Sun Valuation on page 15.
CONFIDENTIAL 20
|
| Project Rising Sun
Comparable Trading Valuation Analysis—2007 ($ in millions, except per share data) 2007E Illustrative EBITDA Multiple(1) Implied Enterprise Value Rising Sun Properties EBITDA Low Mid High Low Mid High Existing NevadaOperations $549.0 9.0x 10.0x 11.0x $4,941.2 $5,490.2 $6,039.2 Nevada Development Opportunities(2) 428.7 532.1 640.8 Total Nevada Operations $5,369.8 $6,022.3 $6,680.0
Native American Contracts(3) $604.9 $619.4 $634.4 Advances to Tribes(4) 178.0 178.0 178.0 Total NA Contracts and Advances to Tribes $782.9 $797.4 $812.4 Company Estimates Low Mid High Total Value of Land Held for Development—No Current Development Plans(4) $1,199.1 $1,464.8 $1,730.4 Implied Total Enterprise Value $7,351.9 $8,284.4 $9,222.8 Implied 2007E EBITDA Multiple(5) 11.5x 12.9x 14.4x -Excluding All Land Held for Development, Advances to Tribes and Native American Contracts(6) 9.0 10.0 11.0 Implied 2007E EBITDA Multiple – Transaction Price(5) 14.2 14.2 14.2 -Excluding All Land Held for Development, Advances to Tribes and Native American Contracts(6) 12.2 11.5 10.8
Less: Net Debt (As of 12/31/2006)(7) ($3,780.6 ) ($3,780.6 ) ($3,780.6 ) Implied Total Equity Value $3,571.2 $4,503.8 $5,442.2 Fully Diluted Shares 59.155 59.155 59.155 Implied Price Per Share $60.37 $76.14 $92.00
Note: Analysis based on management projections. (1) Based on comparable gaming trading multiples. (2) Represents value of Land Held for Development—Current Development Plans based on the present value of discounted cash flows. Please refer to Appendix A for detailed calculation. (3) Based on present value of discounted cash flows of fees to Rising Sun over the term of the contracts. Please refer to Appendix A for detailed calculation. (4) Based on management estimates. (5) Based on 2007E EBITDA of $641.0 million from the management model. (6) Based on 2007E EBITDA (excluding Native American management fees) of $549.0 million from the management model. (7) Includes 50% of Green Valley’s and Aliante’s 12/31/06 net debt balances of $282.5 million and $150.0 million, respectively, in total net debt as Rising Sun’s 50% share of Green Valley’s and Aliante’s operating income is valued in Existing Nevada Operations and Nevada Development Opportunities, respectively. Aliante’s 12/31/06 debt balance represents the present value of the 1/1/09 debt balance discounted at its cost of debt of 8%.
CONFIDENTIAL 21
|

| Project Rising Sun
Comparable Trading Valuation Analysis—2008 ($ in millions, except per share data) 2008E Illustrative EBITDA Multiple(1) Implied Enterprise Value Rising Sun Properties EBITDA Low Mid High Low Mid High Existing NevadaOperations $632.3 8.0x 9.0x 10.0x $5,058.4 $5,690.7 $6,323.0 Nevada Development Opportunities(2) 428.7 532.1 640.8 Total Nevada Operations $5,487.1 $6,222.8 $6,963.8
Native American Contracts(3) $604.9 $619.4 $634.4 Advances to Tribes(4) 178.0 178.0 178.0 Total NA Contracts and Advances to Tribes $782.9 $797.4 $812.4 Company Estimates Low Mid High Total Value of Land Held for Development—No Current Development Plans(4) $1,199.1 $1,464.8 $1,730.4 Implied Total Enterprise Value $7,469.1 $8,485.0 $9,506.6 Implied 2008E EBITDA Multiple(5) 10.3x 11.7x 13.1x -Excluding All Land Held for Development, Advances to Tribes and Native American Contracts(6) 8.0 9.0 10.0 Implied 2008E EBITDA Multiple – Transaction Price(5) 12.6 12.6 12.6 -Excluding All Land Held for Development, Advances to Tribes and Native American Contracts(6) 10.6 10.0 9.4
Less: Net Debt (As of 12/31/2006)(7) ($3,780.6 ) ($3,780.6 ) ($3,780.6 ) Implied Total Equity Value $3,688.5 $4,704.3 $5,726.0 Fully Diluted Shares 59.155 59.155 59.155 Implied Price Per Share $62.35 $79.52 $96.80
Note: Analysis based on management projections. (1) Based on comparable gaming trading multiples. (2) Represents value of Land Held for Development—Current Development Plans based on the present value of discounted cash flows. Please refer to Appendix A for detailed calculation. (3) Based on present value of discounted cash flows of fees to Rising Sun over the term of the contracts. Please refer to Appendix A for detailed calculation. (4) Based on management estimates. (5) Based on 2008E EBITDA of $725.3 million from the management model. (6) Based on 2008E EBITDA (excluding Native American management fees) of $632.3 million from the management model. (7) Includes 50% of Green Valley’s and Aliante’s 12/31/06 net debt balances of $282.5 million and $150.0 million, respectively, in total net debt as Rising Sun’s 50% share of Green Valley’s and Aliante’s operating income is valued in Existing Nevada Operations and Nevada Development Opportunities, respectively. Aliante’s 12/31/06 debt balance represents the present value of the 1/1/09 debt balance discounted at its cost of debt of 8%.
CONFIDENTIAL 22
|

| Project Rising Sun
Precedent M&A Transactions
Unadjusted Deal Value / Forward EBITDA
14.0x 14.0x Investor Consortium / Kerzner: 12.7x
12.0 MGM Grand / Mirage Resorts: 10.0x Columbia Sussex / Aztar: 11.0x 12.0 TPG and Apollo / Harrah's: 10.4x 10.0 10.0
MGM Mirage / Mandalay 8.0 Resort: 9.5x 8.0
6.0 6.0 Harrah's / Caesars: 8.2x
4.0 Harrah's / Horseshoe Gaming: 7.2x 4.0 Coast Casinos / Boyd Gaming: 7.4x
2.0 2.0
0.0 0.0 10/1994 10/1996 11/1998 11/2000 12/2002 01/2005 01/2007
Median Multiple
1994 1995 1996 1997 1998 1999 2000 2001 2002 2003 2004 2005 2006 7.0x NA 6.8x 9.0x 6.7x 6.3x 7.7x 6.0x 5.7x 5.7x �� 8.0x 9.6x 10.4x
Note: Please see detail list of annotated transactions on the following page. Please see Appendix C for detailed list of other precedent M&A transactions.
CONFIDENTIAL 23
|

| Project Rising Sun
Key Precedent Gaming M&A Transactions
($ in millions, except per share data)
Implied Total Date: Implied Aggregate Announced Unadjusted Enterprise Value as a Multiple of: Announced Target Equity Purchase Equity Purchase Transaction LTM CFY CFY + 1 Effective Acquiror Price/Share Price(1) Value(2) EBITDA EBITDA EBITDA 12/19/06 Harrah’s Entertainment(3)(4) $90.00 $17,209.2 $29,071.0 11.4 x 11.6 x 10.4 x Pending Texas Pacific Group/Apollo Management 05/19/06 Aztar Corporation(4) 54.40 2,096.0 2,686.7 12.7 11.7 11.0 01/03/07 Columbia Sussex Corp. 05/01/06 Kerzner International(4) 81.00 3,090.9 3,689.9 17.4 16.3 12.7 09/01/06 Investor Consortium 07/15/04 Caesars Entertainment(4) 17.75 5,480.0 9,858.7 8.7 8.5 8.2 06/14/05 Harrah’s Entertainment, Inc. 06/16/04 Mandalay Resort Group(4) 71.00 4,861.4 7,961.4 10.8 9.9 9.5 04/25/05 MGM Mirage 02/09/04 Boyd Gaming 19.21 820.0 1,280.0 8.9 8.3 7.4 06/30/04 Coast Casinos 09/11/03 Horseshoe Gaming Holding Company NA 916.2 1,450.0 8.2 7.7 7.2 07/01/04 Harrah’s Entertainment, Inc. 03/06/00 Mirage Resorts, Inc.(4) 21.00 4,406.3 6,477.1 11.7 10.3 10.0 05/31/00 MGM Grand, Inc.
High 17.4 x 16.3 x 12.7 x Harmonic Mean 10.6 10.0 9.2 Low 8.2 7.7 &nb sp; 7.2
Note: Please refer to Appendix E for detail of other single-property and smaller corporate transactions. (1) Represents implied equity value per share multiplied by fully diluted shares outstanding less proceeds from exercised stock options and warrants. (2) Equity purchase price plus debt plus minority interest plus preferred stock less cash and cash equivalents. (3) Texas Pacific Group/Apollo Management initially bid $81.00/share. On October 11, 2006, they raised their bid to $83.50/share. On December 18, 2006, Harrah’s board accepted a bid at $90.00/share. (4) Target company held significant non-income producing assets such as land.
CONFIDENTIAL 24
|

| Project Rising Sun
Historical M&A Transaction Multiples
Enterprise Value / Forward EBITDA
15.0x 15.0x 14.0 14.0 13.0 13.0 12.0 12.0 11.0 11.0 10.0 10.0 9.0 9.0 8.0 8.0
7.0 7.0 NA 6.0 6.0
5.0 5.0 1994 1995 1996 1997 1998 1999 2000 2001 2002 2003 2004 2005 2006 (1) (2) Historical M&A Multiples Unadjusted Transaction Multiple Adjusted Transaction Multiple
Note: For detailed transaction list, please refer to Appendix E. (1) Represents Rising Sun’s unadjusted transaction value at the $90 / share bid divided by 2007E Management EBITDA (14.2x). Please refer to Rising Sun Valuation on page 15. (2) Represents Rising Sun’s transaction value adjusted for the midpoint estimate of all Land Held for Development, Advances to Tribes and Native American Contracts at the $90 / share bid divided by 2007E Management EBITDA (excluding Native American management fees) (11.5x). Please refer to Rising Sun Valuation on page 15.
CONFIDENTIAL 25
|

| Project Rising Sun
Precedent M&A Valuation Analysis ($ in millions, except per share data) 2007E Illustrative EBITDA Multiple(1) Implied Enterprise Value Rising Sun Properties EBITDA Low Mid High Low Mid High Existing Nevada Operations $549.0 10.0 x 11.0 x 12.0 x $5,490.2 $6,039.2 $6,588.2 Nevada Development Opportunities(2) 428.7 532.1 640.8 Total Nevada Operations $5,918.9 $6,571.3 $7,229.0
Native American Contracts(3) $604.9 $619.4 $634.4 Advances to Tribes(4) 178.0 178.0 178.0 Total NA Contracts and Advances to Tribes $782.9 $797.4 $812.4 Company Estimates Low Mid High Total Value of Land Held for Development—No Current Development Plans(4) $1,199.1 $1,464.8 $1,730.4 Implied Total Enterprise Value $7,900.9 $8,833.5 $9,771.8 Implied 2007E EBITDA Multiple(5) 12.3x 13.8x 15.2x -Excluding All Land Held for Development, Advances to Tribes and Native American Contracts(6) 10.0 11.0 12.0 Implied 2007E EBITDA Multiple – Transaction Price(5) 14.2 14.2 14.2 -Excluding All Land Held for Development, Advances to Tribes and Native American Contracts(6) 12.2 11.5 10.8
Less: Net Debt (As of 12/31/2006)(7) ($3,780.6 ) ($3,780.6 ) ($3,780.6 ) Implied Total Equity Value $4,120.3 $5,052.8 $5,991.2 Fully Diluted Shares 59.155 59.155 59.155 Implied Price Per Share $69.65 $85.42 $101.28
Note: Analysis based on management projections. (1) Based on range of comparable gaming M&A transactions. (2) Represents value of Land Held for Development—Current Development Plans based on the present value of discounted cash flows. Please refer to Appendix A for detailed calculation. (3) Based on present value of discounted cash flows of fees to Rising Sun over the term of the contracts. Please refer to Appendix A for detailed calculation. (4) Based on management estimates. (5) Based on 2007E EBITDA of $641.0 million from the management model. (6) Based on 2007E EBITDA (excluding Native American management fees) of $549.0 million from the management model. (7) Includes 50% of Green Valley’s and Aliante’s 12/31/06 net debt balances of $282.5 million and $150.0 million, respectively, in total net debt as Rising Sun’s 50% share of Green Valley’s and Aliante’s operating income is valued in Existing Nevada Operations and Nevada Development Opportunities, respectively. Aliante’s 12/31/06 debt balance represents the present value of the 1/1/09 debt balance discounted at its cost of debt of 8%.
CONFIDENTIAL 26
|

| Project Rising Sun
Discounted Cash Flow Analysis
($ in millions, except per share data) Implied Enterprise Value Rising Sun Properties Low Mid High Existing Nevada Operations(1) $5,798.8 $6,171.4 $6,561.4 Nevada Development Opportunities(2) 428.7 532.1 640.8 Total Nevada Operations $6,227.5 $6,703.5 $7,202.2
Native American Contracts(3) $604.9 $619.4 $634.4 Advances to Tribes(4) 178.0 178.0 178.0 Total NA Contracts and Advances to Tribes $782.9 $797.4 $812.4 Company Estimates Low Mid High Total Value of Land Held for Development—No Current Development Plans(4) $1,199.1 $1,464.8 $1,730.4
Implied Total Enterprise Value $8,209.5 $8,965.7 $9,745.0 Implied 2007E EBITDA Multiple(5) 12.8 x 14.0 x 15.2 x -Excluding All Land Held for Dvlp, Advances to Tribes and NA Contracts(6) 10.6 11.2 12.0 Implied 2007E EBITDA Multiple – Transaction Price(5) 14.2 14.2 14.2 -Excluding All Land Held for Dvlp, Advances to Tribes and NA Contracts(6) 12.2 11.5 10.8
Less: Net Debt (As of 12/31/2006)(7) ($3,780.6 ) ($3,780.6 ) ($3,780.6 ) Implied Total Equity Value $4,428.9 $5,185.1 $5,964.4 Pro Forma Fully Diluted Shares 59.155 59.155 59.155 Implied Price Per Share $74.87 $87.65 $100.83
Note: Analysis based on management projections. (1) Based on the present value of discounted cash flows of Rising Sun’s Existing Nevada Operations. Please refer to Appendix A for detailed calculation. (2) Represents value of Land Held for Development—Current Development Plans based on the present value of discounted cash flows. Please refer to Appendix A for detailed calculation. (3) Based on present value of discounted cash flows of fees to Rising Sun’s over the term of the contracts. Please refer to Appendix A for detailed calculation. (4) Based on management estimates. (5) Based on 2007E EBITDA of $641.0 million from the management model. (6) Based on 2007E EBITDA (excluding Native American management fees) of $549.0 million from the management model. (7) Includes 50% of Green Valley’s and Aliante’s 12/31/06 net debt balances of $282.5 million and $150.0 million, respectively, in total net debt as Rising Sun’s 50% share of Green Valley’s and Aliante’s operating income is valued in Existing Nevada Operations and Nevada Development Opportunities, respectively. Aliante’s 12/31/06 debt balance represents the present value of the 1/1/09 debt balance discounted at its cost of debt of 8%.
CONFIDENTIAL 27
|

| Project Rising Sun
Sum of the Parts Analysis ($ in millions, except per share data) 2007E Illustrative EBITDA Multiple Implied Enterprise Value Rising Sun Properties EBITDA Low Mid High Low Mid High Palace Station $50.0 8.0 x 9.0 x 10.0 x $399.7 $449.6 $499.6 Boulder Station 90.3 9.0 10.0 11.0 812.9 903.2 993.5 Texas Station 43.0 8.0 9.0 10.0 343.9 386.9& nbsp; 429.9 Sunset Station 88.8 10.0 11.0 12.0 888.2 977.1 1,065.9 Santa Fe Station 105.1 10.0 11.0 12.0 1,051.1 1,156.2 1,261.3 Red Rock Resort 113.2 10.0 11.0 12.0 1,131.7 1,244.9 1,358.1 Fiesta Rancho 18.9 7.0 8.0 9.0 132.3 151.2 170.1 Fiesta Henderson 33.3 ; 9.0 10.0 11.0 299.6 332.9 366.2 Green Valley Ranch (Mgmt Fee & 50% EBITDA) 58.3 10.0 11.0 12.0 583.5 641.8 700.2 Other Small Properties(1) 16.1 7.0 8.0 9.0 112.7 128.8 144.9 Corporate & Development Expense (68.0 ) 9.0 10.0 11.0 (612.0 ) (680.0 ) (748.0 ) Total Existing Nevada Operations $549.0 9.4x 10.4x 11.4x $5,143.7 $5,692.7 $6,241.7 Nevada Development Opportunities(2) 428.7 532.1 640.8 Total Nevada Operations $5,572.3 $6,224.8 $6,882.5 Native American Contracts(3) $604.9 $619.4 $634.4 Advances to Tribes(4) 178.0 178.0 178.0 Total NA Contracts and Advances to Tribes $782.9 $797.4 $812.4 Company Estimates Total Value of Land Held for Development—No Current Development Plans(4) $1,199.1 $1,464.8 $1,730.4 Implied Total Enterprise Value $7,554.4 $8,486.9 $9,425.3 Implied 2007E EBITDA Multiple(5) 11.8 x 13.2 x 14.7 x -Excluding All Land Held for Dvlp, Advances to Tribes and NA Contracts(6) 9.4 10.4 11.4 Implied 2007E EBITDA Multiple – Transaction Price(5) 14.2 14.2 14.2 -Excluding All Land Held for Dvlp, Advances to Tribes and NA Contracts(6) 12.2 11.5 10.8 Less: Net Debt (As of 12/31/2006)(7) ($3,780.6 ) ($3,780.6 ) ($3,780.6 ) Implied Total Equity Value $3,773.7 $4,706.3 $5,644.7 Pro Forma Fully Diluted Shares 59.155 59.155 59.155 Implied Price Per Share $63.79 $79.56 $95.42
Note: Analysis based on management projections. (1) Other small properties include Wild Wild West, Wildfire, Magic Star, Gold Rush, Lake Mead and the Palms (6.7% interest). (2) Represents value of Land Held for Development—Current Development Plans based on the present value of discounted cash flows. Please refer to Appendix A for detailed calculation. (3) Based on present value of discounted cash flows of fees to Rising Sun over the term of the contracts. Please refer to Appendix A for detailed calculation. (4) Based on management estimates. (5) Based on 2007E EBITDA of $641.0 million from the management model. (6) Based on 2007E EBITDA (excluding Native American management fees) of $549.0 million from the management model. (7) Includes 50% of Green Valley’s and Aliante’s 12/31/06 net debt balances of $282.5 million and $150.0 million, respectively, in total net debt as Rising Sun’s 50% share of Green Valley’s and Aliante’s operating income is valued in Existing Nevada Operations and Nevada Development Opportunities, respectively. Aliante’s 12/31/06 debt balance represents the present value of the 1/1/09 debt balance discounted at its cost of debt of 8%.
CONFIDENTIAL 28
|

| Appendices
|

| Appendix A
Discounted Cash Flow Analysis Support
|

| Project Rising Sun
Existing Nevada Operations
($ in millions) Revenues EBITDA ‘03-’05 ‘05-’06 ‘06-’12 % % % 2006A 2007E 2012E CAGR CAGR CAGR 2006A Margin 2007E Margin 2012E Margin Wholly-owned: Palace Station $157.2 $157.6 $174.6 7.6 % 0.0 % 1.8 % $52.8 33.6 % $50.0 31.7 % $60.8 34.8% Boulder Station 190.6 196.1 241.6 14.5 0.9 4.0 88.3 46.3 90.3 46.1 120.0 49.7 Texas Station 125.5 130.1 143.6 7.8 (4.2 ) 2.3 40.0 31.9 43.0 33.0 47.8 33.3 Sunset Station 198.0 203.9 243.2 9.8 0.4 3.5 85.0 42.9 88.8 43.6 115.1 47.3 Santa Fe Station 163.5 207.1 263.9 25.2 0.8 8.3 82.0 50.1 105.1 50.8 141.4 53.6 Red Rock(1) 299.1 331.2 452.6 NA NA 7.1 94.6 31.6 113.2 34.2 200.0 44.2 Fiesta Rancho 64.1 66.5 73.4 0.6 (1.0 ) 2.3 17.4 27.1 18.9 28.4 21.7 29.6 Fiesta Henderson 70.1 87.4 117.9 7.8 5.1 9.1 17.6 25.1 33.3 38.1 53.0 44.9 Green Valley - 50% Oper Inc. -- -- -- NA NA NA 37.3 NA 44.6 NA 60.0 NA Other Small Properties(2) 47.5 54.2 70.4 NA NA 6.8 10.0 21.0 13.2 24.4 18.7 26.6 Management Fees: Green Valley 11.7 13.7 16.6 NA NA 6.1 11.7 100.0 13.7 100.0 16.6 100.0 Barley’s/Greens 3.7 2.9 3.3 NA NA (2.0 ) 3.7 100.0 2.9 100.0 3.3 100.0 Corporate/Development -- -- -- (67.0 ) (68.0 ) (74.1 )
Total $1,331.0 $1,450.6 $1,801.0 13.7 % 0.9 %(3) 5.2 %(4) $473.4 35.6 % $549.0 30.5 % $784.2 43.5%
(1) 2006 metrics for Red Rock (opened April 2006) represent annualized amounts provided by management. (2) Other small properties include Wild Wild West, Wildfire, Magic Star, Gold Rush, Lake Mead and the Palms (6.7% interest). (3) Excludes revenues of Red Rock in 2006. (4) Includes revenues of Red Rock in 2006 and 2012.
CONFIDENTIAL 29
|

| Project Rising Sun
DCF Analysis—Existing Nevada Operations
Free Cash Flow to the Unlevered Firm ($ in millions)
Projected Fiscal Year Ended December 31, ‘06E–’12E 2006E 2007E 2008E 2009E 2010E 2011E 2012E CAGR Net Revenue $1,331.0 $1,450.6 $1,562.2 $1,638.5 $1,692.3 $1,747.1 $1,801.0 5.2 % % Growth NA 9.0 % 7.7 % 4.9 % 3.3 % 3.2 % 3.1 %
EBITDA(1) $460.4 $527.7 $607.3 $657.4 $688.6 $717.8 $744.2 8.3 % %Growth 14.6% 15.1% 8.2% 4.8% 4.2% 3.7% % Margin 34.6 % 36.4 % 38.9 % 40.1 % 40.7 % 41.1 % 41.3 % EBIT $322.6 $358.8 $426.4 $461.6 $492.8 $521.9 $548.4 9.2 % % Margin 24.2 % 24.7 % 27.3 % 28.2 % 29.1 % 29.9 % 30.4 % Less: Income Taxes at 38.0% (122.6 ) (136.3 ) (162.0 ) (175.4 ) (187.3 ) (198.3 ) (208.4 ) Unlevered Net Income $200.0 $222.4 $264.4 $286.2 $305.5 $323.6 $340.0 9.2 % %Growth 11.2% 18.8% 8.3% 6.8% 5.9% 5.1% % Margin 15.3 % 16.9 % 17.4 % 18.0 % 18.5 % 18.8 %
Plus: Depreciation and Amortization 168.9 180.9 195.9 195.9 195.9 195.9 Less:CapitalExpenditures (214.5) (129.0) (66.8) (58.7) (58.7) (54.9) Plus: (Increase)/Decrease in Working Capital -- -- -- -- -- -- Add: Green Valley Distributions 25.0 40.0 45.0 48.0 53.0 58.0 ‘07E–’12E Unlevered Free Cash Flow $201.8 $356.3 $460.3 $490.7 $513.8 $539.0 21.7 % %Growth 76.5% 29.2% 6.6% 4.7% 4.9%
Discount Periods (years) 0.5 1.5 2.5 3.5 4.5 5.5
PV of FCF @ Illustrative 9.0% Discount Rate $193.3 $313.1 $371.1 $362.9 $348.6 $335.5
Terminal Multiple Methodology Perpetual Growth Rate Methodology
2012E EBITDA(2) $791.4 2012E Normalized Unlevered FCF $398.0 2012E EBITDA Exit Multiple 9.0 x Terminal Free Cash Flow Illustrative Perpetual Growth Rate 3.0 % Terminal Value $7,122.4 Terminal Value $6,832.2 Weighted Average Cost of Capital 9.0 % Weighted Average Cost of Capital 9.0 % Present Value of Terminal Value (Discounted 6.0 yrs) $4,246.9 Present Value of Terminal Value (Discounted 6.0 yrs) $4,073.8 Present Value of Projected Cash Flows 1,924.6 Present Value of Projected Cash Flows $1,924.6 Implied Enterprise Value $6,171.4 Enterprise Value $5,998.4 Implied Perpetual Growth Rate 3.2 % Implied Terminal EBITDA Multiple 8.6 x
Source: Management model. (1) Includes Green Valley Ranch, Barley’s and The Greens management fees and does not include Rising Sun’s share of their respective EBITDA. Represents EBITDA before deduction for restricted stock amortization, but after deduction for development expenses. (2) Represents 2012E EBITDA less 2012 Green Valley Ranch management fees of $16.6 million plus $83.8 million, which is 50% of 2012E Green Valley Ranch EBITDA. Represents EBITDA after deduction for restricted stock amortization and development expenses.
CONFIDENTIAL 30
|

| Project Rising Sun
DCF Analysis—Existing Nevada Operations (cont.)
Enterprise Value— Enterprise Value— Terminal Multiple ($ in millions) Perpetual Growth Rate(1) ($ in millions)
Discount 2012E EBITDA Exit Multiple Discount Perpetual Growth Rate Rate 8.5x 9.0x 9.5x Rate 2.5% 3.0% 3.5% 8.5 % $6,076.4 $6,318.9 $6,561.4 8.5 % $6,120.7 $6,521.7 $7,003.0 9.0 5,935.5 6,171.4 6,407.4 9.0 5,666.8 5,998.4 6,390.3 9.5 5,798.8 6,028.4 6,257.9 9.5 5,277.3 5,555.2 5,879.3
(1) Assumes an LTM EBITDA exit multiple of 9.0x.
CONFIDENTIAL 31
|

| Project Rising Sun
Land Held for Development — Current Development Plans
Revenue Summary ($ in millions)
2007E 2008E 2009E 2010E 2011E 2012E CAGR Wholly-owned: Castaways $-- $-- $27.0 $30.2 $32.3 $34.2 8.2 % Durango -- -- -- 207.1 226.4 247.5 9.3 Reno Bayer -- -- -- -- -- 211.6 NA Aliante -- -- 7.3 8.1 8.8 9.4 8.8
Total $-- $-- $34.3 $245.4 $267.4 $502.7
EBITDA Summary ($ in millions)
2007E 2008E 2009E 2010E 2011E 2012E CAGR Wholly-owned: Castaways $-- $-- $12.1 $14.0 $15.5 $16.7 11.5 % % Margin 44.6 % 46.3 % 47.9 % 48.9 % Durango -- -- -- 80.0 95.0 110.1 17.3 % Margin 38.6 % 42.0 % 44.5 % Reno Bayer -- -- -- -- -- 80.2 NM % Margin 37.9 % Aliante: 50% of Operating Income -- -- 16.6 21.2 24.8 27.9 19.1 Management Fee -- -- 7.3 8.1 8.8 9.4 8.8
Total $-- $-- $35.9 $123.3 $144.1 $244.3 % Margin NM 50.2 % 53.9 % 48.6 %
Other: Aliante Distribution Income $-- $-- $-- $-- $25.0 $29.0 16.0
Source: Management model. Note: Nevada Development Opportunities represent Land Held for Development—Current Development Plans.
CONFIDENTIAL 32
|

| Project Rising Sun
DCF Analysis—Land Held for Development— Current Development Plans
Free Cash Flow to the Unlevered Firm ($ in millions)
Projected Fiscal Year Ended December 31, ‘09E–’12E 2007E 2008E 2009E 2010E 2011E 2012E CAGR Net Revenue $-- $-- $34.3 $245.4 $267.4 $502.7 NM %Growth NA 615.5% 9.0% 88.0%
EBITDA(1) $-- $-- $19.4 $102.1 $119.3 $216.4 NM % Margin 56.4 % 41.6 % 44.6 % 43.0 % EBIT $-- $-- $15.5 $64.3 $81.5 $144.6 NM % Margin 45.2 % 26.2 % 30.5 % 28.8 % Less: Income Taxes at 38.0% -- -- (5.9 ) (24.4 ) (31.0 ) (54.9 ) Unlevered Net Income $-- $-- $9.6 $39.8 $50.5 $89.6 NM %Growth NA 314.4% 26.8% 77.4% % Margin 28.0 % 16.2 % 18.9 % 17.8 %
Plus: Depreciation and Amortization -- -- 3.8 37.8 37.8 71.8 Less: Capital Expenditures (152.4 ) (138.2) (543.2 ) (149.3 ) (541.3 ) (105.1 ) Plus: (Increase)/Decrease in Working Capital -- -- -- -- -- -- Add: Aliante Distributions -- -- -- -- 25.0 29.0 Unlevered Free Cash Flow ($152.4) ($138.2) ($529.8) ($71.6) ($428.0 ) $85.3 NM % Growth
Discount Periods (years) 0.5 1.5 2.5 3.5 4.5 5.5
PV of FCF @ Illustrative 9.0% Discount Rate ($146.0) ($121.4 ) ($427.1 ) ($53.0) ($290.4) $53.1
Terminal Multiple Methodology Perpetual Growth Rate Methodology
2012E EBITDA(2) $254.4 2012E Normalized Unlevered FCF $118.6 2012E EBITDA Exit Multiple 10.0 x Terminal Free Cash Flow Illustrative Perpetual Growth Rate 4.0 % Terminal Value $2,544.0 Terminal Value $2,467.4 Weighted Average Cost of Capital 9.0 % Weighted Average Cost of Capital 9.0 % Present Value of Terminal Value (Discounted 6.0 yrs) $1,516.9 Present Value of Terminal Value (Discounted 6.0 yrs) $1,471.3 Present Value of Projected Cash Flows (984.8 ) Present Value of Projected Cash Flows ($984.8 ) Implied Enterprise Value $532.1 Enterprise Value $486.4 Implied Perpetual Growth Rate 4.1 % Implied Terminal EBITDA Multiple 9.7 x
Source: Management model. (1) Includes Aliante management fees and does not include Rising Sun’s share of Aliante EBITDA. (2) Represents 2012E EBITDA less Aliante management fees of $9.4 million plus $47.4 million, which is 50% of 2012E Aliante EBITDA.
CONFIDENTIAL 33
|

| Project Rising Sun
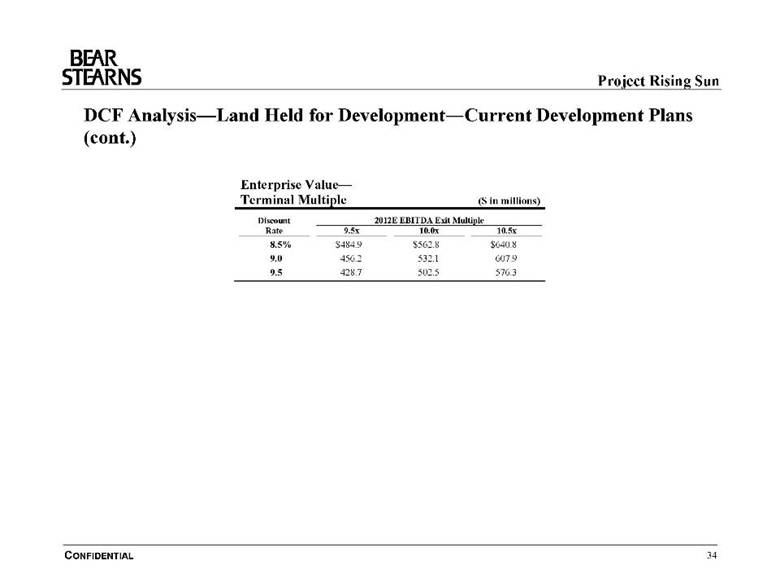
DCF Analysis—Land Held for Development— Current Development Plans (cont.)
Enterprise Value— Terminal Multiple ($ in millions)
Discount 2012E EBITDA Exit Multiple Rate 9.5x 10.0x 10.5x 8.5 % $484.9 $562.8 $640.8 9.0 456.2 532.1 607.9 9.5 428.7 502.5 576.3
CONFIDENTIAL 34
|
| Project Rising Sun
DCF Analysis—Native American Contracts
By Native American Contract ($ in millions)
Projected Fiscal Year Ended December 31, 2007E 2008E 2009E 2010E 2011E 2012E 2013E 2014E 2015E 2016E 2017E Total Management Fees: Thunder Valley $92.0 $93.0 $94.0 $49.4 $-- $-- $-- $-- $-- $-- $-- $328.4 Gun Lake -- -- 22.2 38.1 43.1 45.1 47.1 49.0 52.2 27.2 -- 324.0 Graton -- -- -- 50.2 110.1 120.3 126.1 132.3 139.1 146.3 76.2 900.7 Chico -- -- -- 7.0 7.5 8.1 8.4 8.8 9.3 9.7 -- 58.8 Total $92.0 $93.0 $116.2 $144.7 $160.7 $173.5 $181.7 $190.2 $200.6 $183.2 $76.2 $1,611.9 After Ta x (38 %) Free Cash Flows: Thunder Valley $57.0 $57.7 $58.3 $30.6 $-- $-- $-- $-- $-- $-- $-- $203.6 Gun Lake -- -- 13.8 23.6 26.7 27.9 29.2 30.4 32.4 16.8 -- 200.9 Graton -- -- -- 31.1 68.3 74.6 78.2 82.0 86.2 90.7 47.2 558.4 Chico -- -- -- 4.4 4.7 5.0 5.2 5.5 5.7 6.0 -- 36.5 Total $57.0 $57.7 $72.0 $89.7 $99.6 $107.6 $112.6 $117.9 $124.4 $113.6 $47.2 $999.4
Discount Periods (years) 0.5 1.5 2.5 3.5 4.5 5.5 6.5 7.5 8.5 9.5 10.5
Present Value of FCF (9 % Discount Rate): Thunder Valley $54.6 $50.7 $47.0 $22.7 $-- $-- $-- $-- $-- $-- $-- $174.9 Gun Lake -- -- 11.1 17.5 18.1 17.4 16.7 15.9 15.6 7.4 -- 119.7 Graton -- -- -- 23.0 46.3 46.4 44.7 43.0 41.5 40.0 19.1 304.0 Chico -- -- -- 3.2 3.2 3.1 3.0 2.9 2.8 2.7 -- 20.8 Total $54.6 $50.7 $58.1 $66.4 $67.6 $67.0 $64.3 $61.8 $59.8 $50.1 $19.1 $619.4
Implied Present Value Sensitivity
WACC 8.5% 9.0% 9.5% Thunder Valley $176.3 $174.9 $173.6 Gun Lake 122.9 119.7 116.5 Graton 313.8 304.0 294.6 Chico 21.4 20.8 20.2 Total $634.4 $619.4 $604.9
Source: Management model.
CONFIDENTIAL 35
|

| Project Rising Sun
Discounted Cash Flow Sensitivity Analysis
In order to determine how sensitive our DCF analysis would be to potential changes in the Company’s projections, we analyzed the change to the Company’s projected share price based on the following variables:
Annual EBITDA Growth in Existing Nevada Operations from 2006(1)
Nevada Operations - EBITDA CAGR 6.0% 7.0% 8.3%(2) 9.0% 10.0% Implied 2012 Existing Nevada Operations EBITDA ($M) $653.0 $690.9 $744.2 $772.1 $815.6
Change in Share Price from Theoretical Value(3) ($12.97) ($8.22) $0.00 $1.92 $7.33
Value of Land Held for Development—Current Development Plans(4)
Discount Rate 15% 12.0% 9.0%(5)
Change in Share Price from Theoretical Value (3) $4.94 $2.74 $0.00
Value of Native American Contracts(6)
Native American Contract Assumptions Excluding No Renewal Renew All for 7 Renew All for 7 Graton, Gun Lake & Chico Graton & Gun Lake Graton (Status Quo)(7) Years at ½ Fee Years at Same Fee
Change in Share Price from Theoretical Value (3) ($7.51) ($7.16) ($5.14) $0.00 $4.89 $9.77 4
Value of Land Held for Development—No Current Development Plans(8)
Land Held for Dvlp —No Current Dvlp Plans ($M) $1,000.0 $1,250.0 $1,464.8(9) $1,750.0 $2,000.0
Change in Share Price from Theoretical Value (3) ($7.86) ($3.63) $0.00 $4.82 $9.05
(1) Analysis sensitizes annual EBITDA growth rate of Existing Nevada Operations. (2) Represents the implied EBITDA CAGR of the Company’s management projections for Existing Nevada Operations. (3) Theoretical value represents the midpoint value per share in our Discount Cash Flow Analysis. (4) Analysis sensitizes the discount rate used to discount future cash flows from Land Held for Development—Current Development Plans. (5) Represents the midpoint discount rate used in our analysis to discount future cash flows from Land Held for Development—Current Development Plans. (6) Analysis sensitizes the value of Native American Contracts based on development success, renewal and fee assumptions. (7) Represents the present value of discounted cash flows of fees to Rising Sun assuming no renewals of Native American Contracts. (8) Analysis sensitizes the value of the Company’s Land Held for Development—No Current Development Plans. Includes only the land the Company does not intend to develop during the projection period. (9) Represents the midpoint of management’s estimated value of Land Held for Development—No Current Development Plans.
CONFIDENTIAL 36
|

| Appendix B
Weighted Average Cost of Capital Analysis
|
| Project Rising Sun
Illustrative Weighted Average Cost of Capital Calculations—Rising Sun
Illustrative WACC Calculation Beta Determination ($ in millions)
Equity Risk Premium Total Unlevered Beta(7) Low High Historical Predicted Market Debt Historical Predicted 5.00 %(1) 7.08 %(2) Adjusted Levered Value of and Pfd. Leverage Ratios Adjusted Levered Equity Risk Premium (Rm - Rf) Multiply by: Rising Sun Levered Beta 0.908 0.908 Company Beta(4) Beta(5) Equity(6) Stock D/E D/(D+E) Beta Beta Adjusted Equity Risk Premium 4.54 % 6.43 % Rising Sun 0.960 1.147 $4,946 $3,898 78.8 % 44.1 % 0.652 0.779 Add: Risk-Free Rate of Return (Rf) 4.75 % 4.75 % Size Premium 0.85 % 0.85 % Large Cap Cost of Equity—Rising Sun 10.14 % 12.03 % Las Vegas Sands 1.750 1.745 $32,800 $4,030 12.3 % 10.9 % 1.630 1.625 Multiply by: Comps Average E/(D+E) 69.7 % 69.7 % MGM Mirage Inc. 1.280 1.525 21,236 13,127 61.8 38.2 0.934 1.112 Cost of Equity Portion 7.07 % 8.38 % Harrah’s Ent. 0.970 1.116 16,815 10,719 63.7 38.9 0.702 0.807 7.00 % 7.00 % Wynn Resorts 1.250 1.420 11,726 2,155 18.4 15.5 1.126 1.279 Cost of Debt (Kd)—Rising Sun After-Tax Cost of Debt 4.34 % 4.34 % Boyd Gaming. 1.180 1.262 4,338 2,858 65.9 39.7 0.846 0.904 Multiply by: Comps Average D/(D+E) 30.3 % 30.3 % Penn National 0.960 1.142 4,171 3,002 72.0 41.9 0.670 0.798 Cost of Debt Portion 1.32 % 1.32 % Mid Cap WACC—Rising Sun 8.38 % 9.70 % Ameristar Casinos 1.320 1.292 1,941 859 44.2 30.7 1.043 1.021 Pinnacle Ent. 1.480 1.525 1,762 637 36.2 26.6 1.216 1.253 Key Assumptions
5.00–7.08%(1)(2) Rising Sun Unlevered Beta (Average of Historical and Predicted) 0.715 Equity Risk Premium (Rm - Rf) (3) 4.75 Comps Avg. Debt/Equity Ratio (Translates to Debt/Total Capital Ratio of 30.3%) 43.5% Risk-Free Rate of Return (Rf) Assumed Cost of Debt (Kd) 7.00 Rising Sun Levered Beta(8) 0.908 Assumed Tax Rate for Rising Sun 38.0 Assumed Tax Rate for Comp. Companies 40.0
(1) Reflects Bear Stearns’ judgmental synthesis of various academic views and financial and market perspectives, including (a) the current supply-side model expected equity risk premium (i.e., 6.28%) and the current long-term historical geometric average equity risk premium (i.e., 5.05%) per Ibbotson Associates’ Stock, Bonds, Bills and Inflation, Valuation Edition 2006 Yearbook, (b) the recommended prospective long-term arithmetic average equity risk premium (i.e., 4.50%–5.00%) per Dimson, Marsh and Staunton’s “The Worldwide Equity Premium: A Smaller Puzzle” and Triumph of the Optimists, (c) the recommended expected arithmetic equity risk premium (i.e., 3.50%–7.00%, as adjusted) per Brealey, Myers and Allen’s Principles of Corporate Finance (Eighth Edition), (d) the recommended expected arithmetic equity risk premium (i.e., 5.00%, with a range of 3.50%–6.00%) per Brigham and Ehrhardt’s Financial Management: Theory and Practice (Eleventh Edition) and (e) a survey of the current practices of our competitors as well as other academic and practitioner points of view. (2) Represents current long-term historical arithmetic average equity risk premium per Ibbotson Associates’ Stock, Bonds, Bills and Inflation, Valuation Edition 2006 Yearbook. (3) Source: Bloomberg. Equal to the interpolated yield on the 20-year US Treasury bond as of February 21, 2007. (4) Source: Based on Bloomberg adjusted beta for the past two years on a weekly basis as of February 16 2007. (5) Source: Barra betas as of January 2007. (6) Equity values based on closing prices as of February 21, 2007. (7) Unlevered Beta = Levered Beta/[ 1 + ((D/E) * (1-T))]. (8) Levered Beta = Unlevered Beta * [ 1 + ((D/E) * (1-T))]. (9) Calculated in the same manner as that of Rising Sun using the midpoint of the levered and unlevered Historical Adjusted Beta and Predicted Beta and the midpoint of the Equity Risk Premium.
CONFIDENTIAL 37
|

| Project Rising Sun
Illustrative WACC Sensitivity Analysis—Rising Sun
WACC Sensitivity Analysis—5.00% Equity Risk Premium(1)
WACC Debt-to-Total Assumed Cost Assumed Unlevered Beta Capital Ratio of Debt 0.600 0.650 0.700 0.750 0.800 25.0% 6.75% 8.0% 8.2% 8.4% 8.6% 8.9% 25.0 6.88 8.0 8.2 8.4 8.7 8.9 30.0 7.00 7.9 8.1 8.3 8.5 8.8 35.0 7.13 7.8 8.0 8.2 8.4 8.7 40.0 7.25 7.7 7.9 8.1 8.3 8.5
WACC Sensitivity Analysis—7.08% Equity Risk Premium(2)
WACC Debt-to-Total Assumed Cost Assumed Unlevered Beta Capital Ratio of Debt 0.600 0.650 0.700 0.750 0.800 20.0% 6.75% 9.2% 9.6% 9.9% 10.2% 10.5% 25.0 6.88 9.1 9.4 9.7 10.1 10.4 30.0 7.00 9.0 9.3 9.6 9.9 10.2 35.0 7.13 8.9 9.2 9.5 9.8 10.1 40.0 7.25 8.8 9.1 9.4 9.7 10.0
Bear Stearns’ WACC Range for Rising Sun: 8.5%–9.5%
(1) Reflects Bear Stearns’ judgmental synthesis of various academic views and financial and market perspectives, including (a) the current supply-side model expected equity risk premium (i.e., 6.28%) and the current long-term historical geometric average equity risk premium (i.e., 5.05%) per Ibbotson Associates’ Stock, Bonds, Bills and Inflation, Valuation Edition 2006 Yearbook, (b) the recommended prospective long-term arithmetic average equity risk premium (i.e., 4.50%–5.00%) per Dimson, Marsh and Staunton’s “The Worldwide Equity Premium: A Smaller Puzzle” and Triumph of the Optimists, (c) the recommended expected arithmetic equity risk premium (i.e., 3.50%–7.00%, as adjusted) per Brealey, Myers and Allen’s Principles of Corporate Finance (Eighth Edition), (d) the recommended expected arithmetic equity risk premium (i.e., 5.00%, with a range of 3.50%–6.00%) per Brigham and Ehrhardt’s Financial Management: Theory and Practice (Eleventh Edition) and (e) a survey of the current practices of our competitors as well as other academic and practitioner points of view. (2) Represents current long-term historical arithmetic average equity risk premium per Ibbotson Associates’ Stock, Bonds, Bills and Inflation, Valuation Edition 2006 Yearbook.
CONFIDENTIAL 38
|

| Appendix C
Leveraged Buyout Illustration
|

| Project Rising Sun
Leveraged Buyout Illustration
To illustrate the potential returns to the Acquiror, we modeled a leveraged buyout analysis based on Rising Sun’s financial projections.
Based on the analysis on the indicative financing commitments received by Rising Sun:
•$500 million revolving credit facility of which $350 million will be drawn at closing and $2,725 million CMBS loan structured such that Rising Sun’s existing public debt would remain outstanding
Assumed “exit” LTM multiples of 2012 EBITDA of Existing Nevada Operations and Land Held for Development— Current Development Plans that matched those we used in our DCF analysis
Performed a discounted cash flow analysis on the remaining Native American contracts as of December 31, 2012 using a discount rate of 9.0%
Due to the difficulty in estimating the future value of Land Held for Development— No Current Development Plans, we assumed it was sold at transaction close for the 1) the midpoint management estimate value and 2) the high management estimate value:
Illustrative Sponsor IRR
LTM EBITDA Exit Multiple— Nevada Operations(1) 8.5x 9.0x 9.5x 10.0x 10.5x Sale of Land at Midpoint Estimate 16.1% 18.5% 20.7% 22.8% 24.7% Sale of Land at High Estimate 19.3% 21.8% 24.1% 26.2% 28.1%
(1) Includes existing and planned Nevada operations.
CONFIDENTIAL 39
|

| Appendix D
Cash Transaction Premiums Paid Analysis
|

| Project Rising Sun
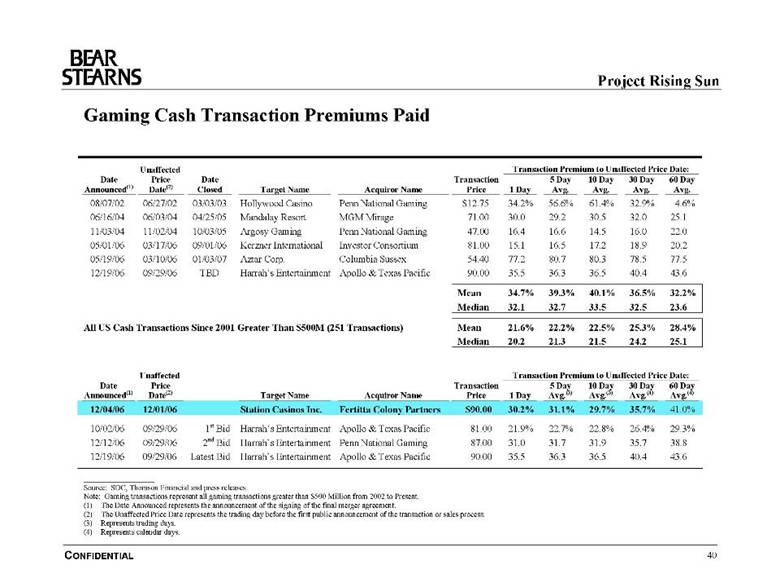
Gaming Cash Transaction Premiums Paid
Unaffected Transaction Premium to Unaffected Price Date: Date Price Date Transaction 5 Day 10 Day 30 Day 60 Day Announced(1) Date(2) Closed Target Name Acquiror Name Price 1 Day Avg. Avg. Avg. Avg. 08/07/02 06/27/02 03/03/03 Hollywood Casino Penn National Gaming $12.75 34.2% 56.6% 61.4% 32.9% 4.6% 06/16/04 06/03/04 04/25/05 Mandalay Resort MGM Mirage 71.00 30.0 29.2 30.5 32.0 25.1 11/03/04 11/02/04 10/03/05 Argosy Gaming Penn National Gaming 47.00 16.4 16.6 14.5 16.0 22.0 05/01/06 03/17/06 09/01/06 Kerzner International Investor Consortium 81.00 15.1 16.5 17.2 18.9 20.2 05/19/06 03/10/06 01/03/07 Aztar Corp. Columbia Sussex 54.40 77.2 80.7 80.3 78.5 77.5 12/19/06 09/29/06 TBD Harrah’s Entertainment Apollo & Texas Pacific 90.00 35.5 36.3 36.5 40.4 43.6
Mean 34.7% 39.3% 40.1% 36.5% 32.2% Median 32.1 32.7 33.5 32.5 23.6
All US Cash Transactions Since 2001 Greater Than $500M (251 Transactions) Mean 21.6% 22.2% 22.5% 25.3% 28.4% Median 20.2 21.3 21.5 24.2 25.1
Unaffected Transaction Premium to Unaffected Price Date: Date Price Transaction 5 Day 10 Day 30 Day 60 Day Announced(1) Date(2) Target Name Acquiror Name Price 1 Day Avg.(3) Avg.(3) Avg.(4) Avg.(4) 12/04/06 12/01/06 Station Casinos Inc. Fertitta Colony Partners $90.00 30.2% 31.1% 29.7% 35.7% 41.0% 10/02/06 09/29/06 1st Bid Harrah’s Entertainment Apollo & Texas Pacific 81.00 21.9% 22.7% 22.8% 26.4% 29.3% 12/12/06 09/29/06 2nd Bid Harrah’s Entertainment Penn National Gaming 87.00 31.0 31.7 31.9 35.7 38.8 12/19/06 09/29/06 Latest Bid Harrah’s Entertainment Apollo & Texas Pacific 90.00 35.5 36.3 36.5 40.4 43.6
Source: SDC, Thomson Financial and press releases. Note: Gaming transactions represent all gaming transactions greater than $500 Million from 2002 to Present. (1) The Date Announced represents the announcement of the signing of the final merger agreement. (2) The Unaffected Price Date represents the trading day before the first public announcement of the transaction or sales process. (3) Represents trading days. (4) Represents calendar days.
CONFIDENTIAL 40
|
| Appendix E
Other Precedent Gaming M&A Transactions
|

| Project Rising Sun
Selected Precedent Gaming M&A Transactions
($ in millions, except per share data)
Implied Total Date: Implied Aggregate Announced Enterprise Value as a Multiple of: Announced Target Equity Purchase Equity Purchase Transaction LTM CFY CFY + 1 Effective Acquiror Price/Share Price(1) Value(2) EBITDA EBITDA EBITDA
12/07/06 Hard Rock (Rank Group) NA $965.0 $965.0 10.2 x 9.6 x 9.0 x Pending Seminole Hard Rock Entertainment 11/01/06 Buffalo Bill’s, Primm Valley, & Whiskey Pete’s (MGM) NA 400.0 400.0 NA 14.4 10.5 Pending Herbst Gaming 10/17/06 PREZQ’s Admiral Riverboat NA 45.7 45.7 4.4 NA NA 12/21/06 Pinnacle Entertainment 10/16/06 Colorado Belle & Edgewater Casinos (MGM) NA 200.0 200.0 NA 11.7 10.0 Pending Investor Partnership (CEO of M Resorts) 10/02/06 Barbary Coast Hotel—Boyd Gaming NA 365.0 365.0 NA 24.3 NA Pending Echelon Development Site (24 Acres)—Harrah’s Entertainment 09/11/06 Stanley Leisure 16.35 1,214.9 1,214.9 16.2 13.0 11.2 11/14/06 Genting 09/05/06 Sands Casino and Hotel/Traymore NA 270.0 270.0 21.5 18.0 NA 11/17/06 Pinnacle Entertainment 08/31/06 London Clubs International 2.49 550.8 550.8 19.1 20.3 18.4 11/09/06 Harrah’s Entertainment 08/24/06 Clermont Club (Rank Group) NA 58.9 58.9 NA NA NA 12/01/06 BIL International 08/17/06 Casino Aztar Caruthersville NA NA NA NA NA NA Terminated Fortunes Entertainment 05/31/06 Dania Jai Alai NA 152.5 152.5 NA NA NA Pending Boyd Gaming
(1) Represents implied equity value per share multiplied by fully diluted shares outstanding less proceeds from exercised stock options and warrants. (2) Equity purchase price plus debt plus minority interest plus preferred stock less cash and cash equivalents.
CONFIDENTIAL 41
|

| Project Rising Sun
Selected Precedent Gaming M&A Transactions (cont.)
($ in millions, except per share data)
Implied Total Date: Implied Aggregate Announced Enterprise Value as a Multiple of: Announced Target Equity Purchase Equity Purchase Transaction LTM CFY CFY + 1 Effective Acquiror Price/Share Price(1) Value(2) EBITDA EBITDA EBITDA
05/17/06 The Sands Regent $15.00 $115.4 $138.6 9.2 x 7.9 x 7.0 x Pending Herbst Gaming 05/11/06 Hard Rock Hotel & Casino—Las Vegas NA 770.0 770.0 12.8 10.3 10.3 Pending Morgans Hotel Group 04/17/06 Harrah’s Lake Charles (2 Casino Boats & Hotel) NA 70.0 70.0 3.5 NA NA 11/09/06 Pinnacle Entertainment 04/17/06 Casino Magic Biloxi (Pinnacle) NA 45.0 45.0 7.8 NA NA 11/09/06 Harrah’s Entertainment 04/06/06 Riviera Holdings Corporation(3) 17.00 211.5 426.5 9.7 10.6 10.1 Pending Riv Acquisition Holdings, Inc. 03/09/06 Victor Chandler (41 Retail Shops) NA NA NA NA NA NA 03/09/06 Gala Group Holdings Ltd. 02/15/06 PBL/Melco Macau Subconcession NA 400.0 900.0 NA NA NA 07/31/06 Wynn Resorts 02/15/06 Isle of Capri (Bossier City & Vicksburg) NA 240.0 240.0 NA 6.9 NA 07/31/06 Legends Gaming LLC 02/13/06 Leo Casino NA 25.3 25.3 NA NA NA 02/14/06 Gala Group Holdings Ltd. 01/09/06 County Properties & Development NA NA NA NA NA NA 01/09/06 Gala Group Holdings Ltd. 12/10/05 Grand Casino Gulfport (Harrah’s) NA 250.0 250.0 NA NA NA 03/15/06 Gulfside Casinos Inc. 11/29/05 Flamingo Laughlin & Undeveloped AC Parcel (Harrah’s) NA 170.0 170.0 8.0 NA NA 05/19/06 American Real Estate Partners 11/15/05 Casino Nova Scotia Hotel (Harrah’s) NA 44.0 44.0 NA NA NA 11/15/05 Westerkirk Capital Inc.
(1) Represents implied equity value per share multiplied by fully diluted shares outstanding less proceeds from exercised stock options and warrants. (2) Equity purchase price plus debt plus minority interest plus preferred stock less cash and cash equivalents. (3) On November 13, 2006, D.E. Shaw made a $21.00/share offer for Riviera Holdings Corporation representing an implied equity purchase price of $262.5 million.
CONFIDENTIAL 42
|

| Project Rising Sun
Selected Precedent Gaming M&A Transactions (cont.)
($ in millions, except per share data)
Implied Total Date: Implied Aggregate Announced Enterprise Value as a Multiple of: Announced Target Equity Purchase Equity Purchase Transaction LTM CFY CFY + 1 Effective Acquiror Price/Share Price(1) Value(2) EBITDA EBITDA EBITDA
11/09/05 Meadow’s Harness Racetrack (Magna Entertainment) NA $225.0 $225.0 NA NA NA 07/26/06 Millennium Gaming/Oaktree Capital Management 11/04/05 Trump Indiana NA 253.0 253.0 8.1 x 8.0 x 7.7 x 12/21/05 Majestic Star Casino 08/22/05 Imperial Palace, Inc. (18.5 Acres) NA 370.0 370.0 NA NA NA 12/23/05 Harrah’s Entertainment, Inc. 08/19/05 Gala Group Holdings Ltd. NA 3,914.2 3,914.2 11.9 NA NA 08/19/05 Coral Eurobet 08/19/05 Gala Group Holdings Ltd. NA 3,411.5 3,411.5 11.9 NA NA 08/19/05 Permira Advisers Ltd.(3) 06/22/05 Hollywood Casino Shreveport NA 191.1 351.1 12.6 NA NA 07/19/05 Eldorado Resorts LLC 06/20/05 Argosy Casino-Baton Rouge NA 150.0 150.0 7.4 NA NA 10/03/05 Columbia Sussex Corporation 05/11/05 Reno Hilton NA 150.0 150.0 13.6 NA NA 06/23/06 Grand Sierra Resort Group 01/20/05 President Casinos Broadwater Resort (Biloxi) NA 82.0 82.0 NA NA NA 04/15/05 Broadwater Development LLC 03/23/05 MotorCity Detroit Casino (53.5%) NA 525.0 525.0 7.2 NA NA 04/25/05 Marian Illitch 02/07/05 Wembley plc(4) NA 455.0 455.0 7.7 NA NA 07/18/05 BLB Investors LLC 02/04/05 Golden Nugget Las Vegas (Poster Financial Group, Inc.) NA 140.0 318.0 13.1 13.5 11.4 09/27/05 Landry’s Restaurants, Inc. 11/19/04 Caesars Tahoe NA 45.0 45.0 NA NA NA 06/10/05 Columbia Sussex Corporation
(1) Represents implied equity value per share multiplied by fully diluted shares outstanding less proceeds from exercised stock options and warrants. (2) Equity purchase price plus debt plus minority interest plus preferred stock less cash and cash equivalents. (3) Permira acquired a 33% stake in Gala from Candover Partners and Cinven. (4) Purchase price made up of $339 million paid to Wembley plc in cash at completion of the transaction and a promissory note in the sum of $116 million.
CONFIDENTIAL 43
|

| Project Rising Sun
Selected Precedent Gaming M&A Transactions (cont.)
($ in millions, except per share data)
Implied Total Date: Implied Aggregate Announced Enterprise Value as a Multiple of: Announced Target Equity Purchase Equity Purchase Transaction LTM CFY CFY + 1 Effective Acquiror Price/Share Price(1) Value(2) EBITDA EBITDA EBITDA
11/03/04 Argosy Gaming Corporation(3) $47.00 $1,410.4 $2,211.9 8.5 x 8.1 x 7.6 x 10/03/05 Penn National Gaming 10/22/04 Bally’s Casino New Orleans (Caesars Asset) NA 24.0 24.0 NM NM NM 06/07/05 Columbia Sussex Corporation 10/15/04 Pocono Downs (The Downs Racing Company)(4) NA 505.0 505.0 7.2 NA NA 01/25/05 Mohegan Tribal Gaming Authority (MTGA) 10/07/04 President Casinos (Admiral/St. Louis Riverfront) NA 57.0 57.0 5.4 NA NA Terminated Columbia Sussex Corporation 09/28/04 Harrah’s/Caesars Assets(5) NA 1,239.0 1,239.0 8.6 NA NA 04/26/05 Colony Capital 09/01/04 Aladdin Gaming LLC NA 653.0 653.0 NA NA NA 09/01/04 Starwood Hotels & Resorts Worldwide 07/20/04 Grace Entertainment Inc. NA 267.0 267.0 6.4 NA NA 02/02/05 Herbst Gaming 06/01/04 Mountain High Casino (Black Hawk) 43.20 115.0 117.4 11.7 NA NA 12/22/04 Ameristar Casinos, Inc. 01/20/04 Harrah’s Entertainment, Inc. (Shreveport) NA 197.0 197.0 4.5 NA NA 05/19/04 Boyd Gaming 01/05/04 Arizona Charlie’s Decatur & Boulder NA $125.9 $125.9 NA NA NA 05/27/04 American Real Estate Partners LP 12/24/03 Las Vegas Hilton NA 290.0 505.0 16.2 x NA NA 06/19/04 Colony Capital 06/26/03 Golden Nugget Properties NA 215.0 215.0 7.1 6.3 5.7 01/26/04 Poster Financial Group
(1) Represents implied equity value per share multiplied by fully diluted shares outstanding less proceeds from exercised stock options and warrants. (2) Equity purchase price plus debt plus minority interest plus preferred stock less cash and cash equivalents. (3) Net debt excludes cage cash of $60 million. (4) Transaction multiple based on $280 million purchase price and illustrative Bear Stearns assumptions of $175 million in construction costs, $50 million license fees and $70 million in normalized EBITDA. (5) Includes Resorts (Harrah’s) East Chicago, Resorts (Harrah’s) Tunica, Bally’s Casino Tunica and Atlantic City Hilton.
CONFIDENTIAL 44
|

| Project Rising Sun
Selected Precedent Gaming M&A Transactions (cont.)
($ in millions, except per share data)
Implied Total Date: Implied Aggregate Announced Enterprise Value as a Multiple of: Announced Target Equity Purchase Equity Purchase Transaction LTM CFY CFY + 1 Effective Acquiror Price/Share Price(1) Value(2) EBITDA EBITDA EBITDA
07/31/02 JCC Holding Interest $10.54 $85.7 $160.3 3.5 x NA NA 12/01/02 Harrah’s Entertainment, Inc. 08/07/02 Hollywood Casino Corp 12.75 347.5 780.5 6.8 6.7 x 5.7 x 03/03/03 Penn National Gaming 04/24/01 Harveys Casino Resorts NA 286.0 633.5 5.8 5.8 5.8 07/31/01 Harrah’s Entertainment, Inc. 04/16/01 Empress Joliet NA NA 465.0 6.5 6.2 6.0 07/20/01 Argosy Gaming 12/19/00 Argosy Casino & Hotel in Lawrenceburg(3) NA NA 858.8 6.5 6.8 6.6 03/08/01 Argosy Gaming 12/05/00 Fitzgerald’s Gaming Corp 18.63 149.0 146.0 5.0 NA NA 12/06/01 Majestic Star Casino LLC 10/30/00 Resorts International Hotel & Casino NA 127.0 144.5 NA NA NA 06/25/01 Colony Capital 10/17/00 The Reserve Casino and Hotel NA NA 71.8 13.5 NA NA 01/29/01 Station Casinos 10/17/00 Station Missouri Assets NA NA 488.0 5.5 NA NA 12/20/00 Ameristar Casinos 07/20/00 Fiesta Hotel Corporation NA 185.0 185.0 NA NA NA 01/04/01 Station Casinos 12/10/99 Hollywood Park Mississippi Casinos NA 195.0 195.0 NA NA NA 08/08/00 Penn National Gaming 10/06/99 Lady Luck Gaming Corp. 12.00 58.6 236.5 6.2 NA NA 03/02/00 Isle of Capri Casinos Inc. 09/01/99 Iowa West Racing Association NA 170.0 170.0 4.9 NA NA 10/23/99 Harveys Casino Resorts
(1) Represents implied equity value per share multiplied by fully diluted shares outstanding less proceeds from exercised stock options and warrants. (2) Equity purchase price plus debt plus minority interest plus preferred stock less cash and cash equivalents. (3) Assumes implied value for 100% of Lawrenceburg.
CONFIDENTIAL 45
|

| Project Rising Sun
Selected Precedent Gaming M&A Transactions (cont.)
($ in millions, except per share data)
Implied Total Date: Implied Aggregate Announced Enterprise Value as a Multiple of: Announced Target Equity Purchase Equity Purchase Transaction LTM CFY CFY + 1 Effective Acquiror Price/Share Price(1) Value(2) EBITDA EBITDA EBITDA
08/19/99 Players International $8.50 $267.0 $428.3 6.3 x 5.5 x 5.3 x 03/22/00 Harrah’s Entertainment 06/28/99 Blue Chip Casino NA 273.6 273.6 NA NA NA 11/10/99 Boyd Gaming 04/27/99 Caesars World Inc. NA NA 3,000.0 8.7 7.5 7.3 12/30/99 Park Place Entertainment 11/09/98 Primadonna Resorts Inc. 9.28 250.4 475.0 5.2 NA NA 03/01/99 MGM Grand Inc. 09/02/98 Empress Entertainment Inc NA 493.0 603.7 7.1 NA 6.4 12/01/99 Horseshoe Gaming LLC 08/09/98 Rio Hotel & Casino, Inc. 19.83 510.5 796.3 9.2 7.9 6.7 01/01/99 Harrah’s Entertainment 06/30/98 Grand Casinos, Inc. 13.25 650.0 1,200.0 6.2 7.3 8.0 12/31/98 Hilton Hotels Corp. 02/19/98 Casino Magic Corp. 2.27 81.1 340.0 7.2 6.2 NA 10/15/98 Hollywood Park Inc. 02/01/98 Harveys Casino Resorts 28.73 289.5 420.0 6.6 6.8 6.6 02/02/99 Colony Capital 12/20/97 Boardwalk Casino Inc. 5.00 39.0 137.0 18.3 NA NA 01/30/98 Mirage Resorts Inc. 12/18/97 Showboat Inc. 30.75 512.0 1,147.0 12.4 11.1 9.0 06/01/98 Harrah’s Entertainment 09/30/97 WHG Resorts & Casinos Inc. NA 132.8 282.8 NA NA NA 01/16/98 Patriot American Hospitality 07/11/97 Treasure Chest Casino LLC NA 128.5 132.9 3.9 NA NA 10/30/97 Boyd Gaming Corporation
(1) Represents implied equity value per share multiplied by fully diluted shares outstanding less proceeds from exercised stock options and warrants. (2) Equity purchase price plus debt plus minority interest plus preferred stock less cash and cash equivalents.
CONFIDENTIAL 46
|

| Project Rising Sun
Selected Precedent Gaming M&A Transactions (cont.)
($ in millions, except per share data)
Implied Total Date: Implied Aggregate Announced Enterprise Value as a Multiple of: Announced Target Equity Purchase Equity Purchase Transaction LTM CFY CFY + 1 Effective Acquiror Price/Share Price(1) Value(2) EBITDA EBITDA EBITDA
08/19/96 Griffin Gaming & Entertainment Inc. $22.43 $202.5 $273.8 5.6 x 6.8 x 6.8 x 12/16/96 Sun International Hotels Ltd. 06/25/96 Trump Castle Casino Resort NA NA 528.0 NA NA NA 10/01/96 Trump Hotels & Casino Resorts Inc. 06/06/96 Bally EntertainmentCorp. 26.43 1,933.4 2,979.3 10.5 9.6 8.8 12/18/96 Hilton Hotels Corp. 04/29/96 Par-a-Dice Gaming Corporation 16.99 162.6 174.0 5.0 NA NA 12/05/96 Boyd Gaming Corporation 03/20/96 Boomtown, Inc. 9.14 83.5 175.2 7.7 5.8 5.7 06/30/97 Hollywood Park, Inc. 05/31/95 Sahara Gaming Corporation NA 128.0 150.0 NA NA NA 10/02/95 Investor Group (William Bennett) 03/20/95 Gold Strike Resorts NA 443.5 590.4 15.2 8.3 NA 06/01/95 Circus Circus Enterprises Inc. 12/19/94 Caesars World Inc. 67.50 1,754.0 1,824.5 9.6 7.7 7.0 03/02/95 ITT Corp.
High 21.5 x 24.3 x 18.4 x Harmonic Mean 7.4 x 8.4 x 7.5 x Low 3.5 x & nbsp; 5.5 x 5.3 x
(1) Represents implied equity value per share multiplied by fully diluted shares outstanding less proceeds from exercised stock options and warrants. (2) Equity purchase price plus debt plus minority interest plus preferred stock less cash and cash equivalents.
CONFIDENTIAL 47
|