
Undeveloped Land Holdings Valuation
January 2007
![]()
Table of Contents
|
| |
|
|
|
|
| |
|
|
|
|
| |
|
|
|
|
| |
|
|
|
|
| |
|
|
|
|
| |
|
|
|
|
| |
|
|
|
|
| |
|
|
|
|
| |
|
|
|
|
| |
|
|
|
|
| |
|
|
|
|
| |
|
|
|
|
| |
|
|
|
|
| |
|
|
|
|
| |
|
|
|
|
| |
|
|
|
|
| |
|
|
|
|
| |
|
|
|
|
| |
|
|
|
|
| |
|
|
|
![]()
STATION CASINOS
CB Richard Ellis (“CBRE”) has been retained to provide valuation services to the Special Committee of the Station Casinos, Inc. Board of Directors. The Special Committee was formed to evaluate an offer presented to Station Casinos, Inc (the “Company”) from Fertitta Colony Partners, LLC. To assist in evaluating the offer, the Special Committee asked CBRE to assess the undeveloped land holdings owned by the Company and its affiliates.
This report evaluates and provides a range of values for the undeveloped land holdings of the Company as provided by the Special Committee. The values provided should not be considered appraised value as this is not a formal appraisal prepared by a licensed appraiser. In evaluating the land holdings CBRE has taken into consideration current market trends, sales comparables and proprietary market knowledge to place a range of values on each individual site. The range of values that have been provided are based on what the Company would likely expect to receive should they decide to market and sell the properties in today’s real estate market. While the ranges of values provided are considered to be accurate, there is no guarantee that the values would be achieved. In some instances higher values could be achieved depending on the number of qualified investors looking to purchase property at the time a site is actively marketed for sale. The timing involved in realizing the estimated value range of each property would vary based on location and the overall site characteristics. For the purposes of this report we have estimated an overall 12 month time frame to market and complete a transaction.
CBRE’s evaluation and all advice (written or oral) given by CBRE in connection with CBRE’s engagement are intended solely for the benefit and use of the SB, and to the extent of Bear Stearns’ services being rendered to the SB, Bear Stearns, and neither the evaluation nor such advice shall be used for any other purpose or be reproduced, disseminated, quoted from or referred to at any time, in any manner or for any purpose, nor shall any public references to CBRE be made by the SB without the prior written consent of CBRE (not to be unreasonably withheld). Notwithstanding the foregoing, to the extent required by applicable law or regulation, the evaluation may be included in its entirety in any proxy statement or other document distributed to stockholders of the Company or other document required to be filed with the U.S. Securities and Exchange Commission in connection with the proposed transaction. However, no summary of or excerpt from the evaluation may be used, and no public reference to the evaluation or disclosure to any third party may be made (other than as provided in the preceding sentence), except with CBRE’s prior written consent (not to be unreasonably withheld).
1
Area Analysis
This section of the analysis provides a broad overview of metropolitan Las Vegas and Clark County, including information regarding the economy, utilities, population, transportation, schools, community services, recreational areas, taxes, government, etc. The following information has been taken from the 2005 Las Vegas Perspective, CB Richard Ellis sources, publications by the Center for Business at the University of Nevada at Las Vegas, the Economic Research of the University of Nevada at Las Vegas and various other publications and sources.
Population
Historical and projected population statistics for Las Vegas are summarized below. Population statistics for the Las Vegas metropolitan area were obtained from Claritas. The population estimates noted in the following table may differ slightly from those reported by the U.S. Census Bureau, but represent a consistent series of data from which to demonstrate trends and base future projections:
Table 1 — Area Population Statistics
Area |
| 1990 |
| 2000 |
| Annual |
| 2006 |
| Annual |
| 2011 |
| Annual |
|
City of Las Vegas |
| 261,729 |
| 477,765 |
| 6.20 | % | 553,868 |
| 2.49 | % | 630,220 |
| 2.62 | % |
|
|
|
|
|
|
|
|
|
|
|
|
|
|
|
|
Clark County |
| 741,459 |
| 1,375,765 |
| 6.38 | % | 1,752,385 |
| 4.12 | % | 2,083,252 |
| 3.52 | % |
|
|
|
|
|
|
|
|
|
|
|
|
|
|
|
|
Las Vegas MSA |
| 852,737 |
| 1,563,282 |
| 6.25 | % | 1,980,242 |
| 4.02 | % | 2,345,386 |
| 3.44 | % |
Source: Claritas; CBRE
The state of Nevada has been leading the nation in the rate of population growth. The 1990 Census estimate placed the Clark County (including metropolitan Las Vegas) population base at 741,459. By 2006, the estimated population has increased to 1,752,385, an increase of 136% over this 16-year period.
The population of the Las Vegas, NV-AZ MSA, which includes Mojave County, Arizona, was reported at 852,737 in 1990 and 1,752,385 in 2006, an increase of 132%. The majority of Nevada and Las Vegas’ growth is a direct result of in-migration. Clark County represents approximately 71% of Nevada’s population.
Demographics are evaluated based on the degree to which they reflected a specific socioeconomic dimension. Some of the demographics are positively correlated with a given dimension, while others are negatively correlated with that dimension. For example, the income dimension includes an affluence indicator, the percent of households earning $50,000 or more, as well as a poverty indicator, the percent of households earning $7,500 or less.
2
Table 2 — Selected Demographics for City of Las Vegas, Clark County, and Las Vegas MSA
|
| City of Las Vegas |
| Clark County |
| Las Vegas MSA |
| |||
Population: |
|
|
|
|
|
|
| |||
2006 Estimated Population |
| 553,868 |
| 1,980,242 |
| 1,752,385 |
| |||
2011 Projected Population |
| 630,220 |
| 2,345,386 |
| 2,083,252 |
| |||
2000 Census Population |
| 477,765 |
| 1,563,282 |
| 1,375,765 |
| |||
1990 Census Population |
| 261,729 |
| 852,737 |
| 741,459 |
| |||
Growth 2000-2006 |
| 15.93 | % | 26.67 | % | 27.38 | % | |||
Growth 2006-2011 |
| 13.79 | % | 18.44 | % | 18.88 | % | |||
2006 Estimated Median Age |
| 34.7 |
| 35.47 |
| 34.8 |
| |||
2006 Estimated Average Age |
| 35.78 |
| 36.48 |
| 35.8 |
| |||
Households: |
|
|
|
|
|
|
| |||
2006 Estimated Households |
| 201,851 |
| 737,072 |
| 643,950 |
| |||
2011 Projected Households |
| 227,796 |
| 868,028 |
| 760,497 |
| |||
2000 Census Households |
| 176,305 |
| 588,371 |
| 512,253 |
| |||
1990 Census Households |
| 100,855 |
| 330,490 |
| 287,025 |
| |||
Growth 2000-2006 |
| 14.49 | % | 25.27 | % | 25.71 | % | |||
Growth 2006-2011 |
| 12.85 | % | 17.77 | % | 18.10 | % | |||
2006 Est. Average Household Size |
| 2.72 |
| 2.66 |
| 2.69 |
| |||
Income: |
|
|
|
|
|
|
| |||
2006 Est. Median Household Income |
| $ | 48,811 |
| $ | 48,699 |
| $ | 50,834 |
|
2011 Prj. Median Household Income |
| $ | 52,621 |
| $ | 53,183 |
| $ | 55,559 |
|
2000 Cen. Median Household Income |
| $ | 44,498 |
| $ | 43,020 |
| $ | 44,884 |
|
1990 Cen. Median Household Income |
| $ | 30,815 |
| $ | 29,848 |
| $ | 30,680 |
|
2006 Est. Average Household Income |
| $ | 65,109 |
| $ | 63,769 |
| $ | 66,118 |
|
2006 Estimated Per Capita Income |
| $ | 23,900 |
| $ | 23,959 |
| $ | 24,531 |
|
Housing: |
|
|
|
|
|
|
| |||
2006 Estimated Housing Units |
| 218,120 |
| 823,381 |
| 709,453 |
| |||
2006 Estimated Occupied Units |
| 201,851 (92.5%) |
| 737,072 (89.5%) |
| 643,950 (90.8%) |
| |||
2006 Estimated Vacant Units |
| 16,268 (7.5%) |
| 86,309 (10.5%) |
| 65,503 (9.2%) |
| |||
2006 Est. Owner Occupied Units |
| 125,740 (57.6%) |
| 477,984 (58.1%) |
| 408,312 (57.6%) |
| |||
2006 Est. Renter Occupied Units |
| 76,112 (34.9%) |
| 259,088 (31.5%) |
| 235,638 (33.2%) |
| |||
2006 Est. Median Housing Value |
| $ | 241,625 |
| $ | 229,176 |
| $ | 244,601 |
|
2006 Est. Average Housing Value |
| $ | 284,253 |
| $ | 262,653 |
| $ | 283,141 |
|
Source: Claritas; CBRE
3
Transportation
Las Vegas has excellent transportation linkages with other large cities in the western United States and across the nation. The city is served by four major highways that connect other metropolitan areas including Los Angeles, California (289 miles southwest via Interstate 15); Salt Lake City, Utah (432 miles northeast via Interstate 15); Phoenix, Arizona (291 miles southeast via U.S. Highway 95); and Reno, Nevada (448 miles northwest via U.S. Highway 95). Las Vegas is ideally positioned at the hub of an 11-state region having a population base of over 42 million residents.
One of the most significant new transportation projects is the Las Vegas Beltway, which encircles the entire metropolitan area. Initially, a plan was conceived to build the 53-mile long beltway in an “ultimate” full freeway configuration, section by section as it progressed around a major portion of the Las Vegas Valley. Under this original concept, a highway facility was expected to be in place sometime during the year 2020. However, in 1996 the continued influx of new residents into southern Nevada coupled with the escalating development and associated traffic demands of the valley’s rapidly growing northwest communities, prompted local officials to reevaluate how the beltway’s construction should be executed. From this reevaluation, an accelerated beltway design and construction plan was conceived, developed and approved. As a result of implementing the “accelerated” plan, the beltway’s initial facilities have already been completed. The county’s design engineers are set to continue on a pace to complete the full freeway configuration by the end of 2013.
The southern segment extending from Tropicana Avenue (west of I-15) to Gibson Road (in Henderson) has been operational for several years. While a full freeway is in place from Decatur Boulevard to Stephanie Street, a temporary frontage road network was constructed between Tropicana and Decatur. Also available to motorists is the four-lane stretch of the western beltway from Tropicana to Summerlin Parkway. Under a recent contract, Summerlin Parkway’s connection to the beltway was also completed. The segment of the beltway between Summerlin Parkway and Cheyenne Avenue opened in the fall of 2001. The northernmost segment between US Highway 95 (North) to Interstate15 was completed in November 2002. The northwest curve from Cheyenne to Ann Road was completed in 2003. The beltway’s southwest segment from Decatur Boulevard to Buffalo Drive was the most recently completed part in December 2004; with the opening of four mainline travel lanes (two in each direction). As such, the entire length of Beltway 215 is now open to traffic, although less than ½ of the project has completed freeway lanes.
4
Figure 1 — Bruce Woodbury Beltway (I-215) Map and Completion Schedule
Source: Clark County Website

5
Air service from Las Vegas is provided to most major population centers in the nation. McCarran International Airport has grown significantly since 1981 with the implementation of the McCarran 2000 Program. This growth has resulted in continuous design and construction. To date, over $2 billion has been expended on a diversity of projects. Some of the improvements include new runways and taxiways, extensions on existing runways, as well as new lighting, navaid/visaid and sign systems. McCarran 2000 has also included significant terminal building construction including the Central Terminal and Parking Structure, both a north and a south expansion of the Ticketing building and creation of three satellite buildings with 60 gates which are connected to the Central Terminal Building by automated transit systems. The development of a satellite building with 26 gates, which opened in June 1998 with the anticipation of an additional 26 gates at full build out, is also included in this development. Also constructed is a six-story, 6,500-space contiguous parking garage and a separate 8-gate Charter International Terminal.
McCarran is the sixth busiest airport in North America, and the eleventh busiest in the world with over 41 million passengers annually, according to Airports Counsel International Headquarters of Geneva Switzerland. In 2004, nearly half of all Las Vegas visitors arrive by air via McCarran International Airport, making it a major driving force in the Southern Nevada economy and one of the top ten busiest airports in the world. Income derived from aviation activity generates significant economic benefits estimated at $25 billion a year.
Table 3 — McCarran International Airport Statistics 1980 - 2006
Year |
| Total Number of |
| Year over Year |
|
1980 |
| 10,302,000 |
| (2.60 | )% |
1981 |
| 9,470,000 |
| (8.20 | )% |
1982 |
| 9,439,000 |
| (0.30 | )% |
1983 |
| 10,313,000 |
| 9.30 | % |
1984 |
| 10,142,000 |
| (1.70 | )% |
1985 |
| 10,924,000 |
| 7.90 | % |
1986 |
| 12,429,000 |
| 13.80 | % |
1987 |
| 15,582,000 |
| 25.40 | % |
1988 |
| 16,231,000 |
| 4.20 | % |
1989 |
| 16,693,000 |
| 2.80 | % |
1990 |
| 18,619,000 |
| 11.50 | % |
1991 |
| 20,172,000 |
| 8.30 | % |
1992 |
| 20,914,000 |
| 3.70 | % |
1993 |
| 22,492,000 |
| 7.50 | % |
1994 |
| 26,850,000 |
| 19.40 | % |
1995 |
| 28,027,000 |
| 4.40 | % |
1996 |
| 30,460,000 |
| 8.70 | % |
1997 |
| 30,315,000 |
| (0.50 | )% |
1998 |
| 30,227,000 |
| (0.30 | )% |
1999 |
| 33,715,000 |
| 11.54 | % |
6
2000 |
| 36,866,000 |
| 9.35 | % |
2001 |
| 35,180,000 |
| (4.60 | )% |
2002 |
| 35,009,000 |
| (0.50 | )% |
2003 |
| 36,266,000 |
| 3.59 | % |
2004 |
| 41,441,531 |
| 14.27 | % |
2005 |
| 44,267,362 |
| 6.82 | % |
2005 (Jan - Oct) |
| 31,727,083 |
|
|
|
2006 (Jan - Oct) |
| 38,509,614 |
| 3.70 | % |
Source: McCarran International Website; CBRE
Figure 2 — McCarran International Airport Passengers Trend 1990 - 2006

January 2001 began with McCarran International Airport’s monthly total of arriving and departing passenger’s monthly total up 7.0% over January of 2000. February showed an increase of 3.2% for an average yearly increase of 5.1%. March’s increase was 7.9% and yearly numbers were up 6.1%. March followed with a positive increase of 4.7% for the month with the yearly increase of 5.8%. May was 3.7% and 5.4% respectively followed by June at 3.5% and 5.0%. July’s totals were again up a modest 2.7% with the yearly increase up 2.5%. August reported a 5.2% monthly increase with the year to date percentage change of 2.9%. As is evident from the preceding figures, the first eight months of 2001 were superior to the same time period over 2000. Then came the tragic events of September 11, 2001. Consequently, the Federal government closed down the entire National Airspace System. The resulting after effect produced a negative 28.3% change for the month of September (from September 2000) in arriving and departing passengers. The months of October (-16.3%), November (-17.9%) and December (-14.3%) showed improving trends from the September level, with the year-end figures down -4.6% from the 2000 total. The end of year 2002 figures remained relatively
7
consistent with the 2001 figure. However, the 2003 total passengers reflect the first increase since 2000, with a 3.59% increase of the 2002 total. There was a dramatic increase from 2003 to 2004, based on a regained passenger confidence, with a 14.27% increase. This is the largest percent annual change since 1994. Similar favorable trends were exhibited in 2005, with a 6.82% increase over the 2004 level. 2006 Year-to-date (January to October) figures also showed a 3.70% increase over the previous year level of 31.7 million passengers.
Economic Base
The economic base of metropolitan Las Vegas consists primarily of the tourism and service industries, military bases, the Nevada Test Site, governmental and municipal agencies, mining and manufacturing.
Tourism
The greatest economic emphasis is on the tourism and the convention industry. There are currently over 131,503 hotel/motel rooms in the Las Vegas market and additional new development will likely increase this total by at least 2,974 rooms by the end of 2006. Las Vegas now claims 13 of the 15 largest hotels in the nation and has more hotel and motel rooms than any city in the United States. Six new hotel/casinos opened in 1997, adding more than 7,438 new rooms. In 1998, over 837,000 square feet of convention space was added as well as 4,500 new hotel rooms. In 1999, over 1,100,000 square feet of convention space was added as well as 11,927 new hotel rooms. Additionally, the 2000 construction figures were 109,116 square feet of convention space and 4,219 rooms. While the 2000 new construction figures appear excessive at first glance, hotel/motel occupancy averaged 89.1% in 2000, an increase of 1.1% over the 1999 average occupancy of 88.0%.
Construction of the Bellagio (3,005 rooms) was completed in October 1998, followed by Mandalay Bay with 3,276 rooms in March 1999. The newest mega-resorts included the Venetian with 3,036 rooms and Paris with 2,916, both of which opened in 1999. In 2000, The New Aladdin opened with 2,567 rooms and 100,000 square feet of convention space. The overall hotel construction for the year of 2000 was 4,219 rooms and 109,116 square feet of convention space. This includes the closure of the Desert Inn Hotel and Casino with 715 rooms removed from service. In 2001, two new hotel-casinos opened for business and added 655 rooms and 9,000 square feet of convention space. The Green Valley Ranch Hotel and Casino opened in December of 2001 with 200 rooms and 9,000 square feet of convention space with a total construction cost of $270 million. The Palms Hotel and Casino opened in November of 2001 and added 455 more rooms to the total inventory at a cost of $265 million. The total room inventory increased by 3,107 rooms and includes casino and non-casino properties. This is impressive considering that within this year there were two hotel-casinos that closed, removing 1,105 rooms from the inventory.
By the end of year 2001, a total of 3,107 new rooms were added to the existing inventory to bring the total room inventory to 127,377. More than 35.8 million visitors experienced Las Vegas in 2000. However, due to the downturn in the national economy and the slowdown in air travel nationwide after September 11th, the total visitors in 2001 decreased 2.3% from the 2000 level.
8
By the end of year 2002, a total of 1,127 new rooms were added to the existing inventory to bring the total room inventory to approximately 128,946. More than 35.0 million visitors experienced Las Vegas in 2002, a 0.2% increase over the 2001 figure.
By the end of year 2003, a total of 1,536 new rooms were added to the existing inventory to bring the total room inventory to approximately 130,482. More than 35.0 million visitors experienced Las Vegas in 2003, a 1.3% increase over the 2002 figure.
By the end of year 2004, a total of 2,974 new rooms were added to the existing inventory to bring the total room inventory to approximately 131,503. More than 37.0 million visitors experienced Las Vegas in 2004, a 5.2% increase over the 2003 figure. By the end of year 2004, there were four hotels closed consisting of 1,161 rooms. In December 2004, the Bellagio had begun an expansion project for 925 new rooms and 60,000 additional square feet of convention space with the construction cost being $375 million. The Green Valley Ranch Station Casino has begun a project for 296 new rooms and 25,500 additional square feet of convention space with the construction cost being $110 million.
In late April 2005, Wynn Las Vegas opened with some of the largest guest rooms on the strip. The $2.7 billion, 217-acre resort includes an 18-hole championship golf course, 22 dining outlets, 110,000 square feet of gaming, 223,000 square feet of meeting space, 76,000 square feet of retail, an art gallery and automobile dealership. The development has added 2,716 guest rooms and more 9,000 new jobs to the area’s total. Wynn Las Vegas and Country Club began its construction in 2005 on an adjacent site. Meanwhile, the completion of the Caesars’ Palace $376 million expansion occurred in the third quarter 2005 including approximately 949 guest rooms and 86,000 square feet of convention space. Overall, the Las Vegas hotel market saw approximately 3,810 new guest rooms in 2005.
By 2010, it is estimated that a proposed 23,841 hotel guest rooms and over 1.4 million square feet of convention space will be added to the Las Vegas market. The existing and proposed number of hotel rooms demonstrates the size of the Las Vegas tourist industry. This is further demonstrated by the growth in the tourist attendance and tourist revenues generated as shown in the following table.
Table 4 — Tourism Attendance and Revenue Trend 1980 - 2006
Year |
| Visitor Volume |
| Year over Year |
| Visitor Dollar |
| Year over Year |
| |
1980 |
| 11,941,524 |
|
|
| $ | 4,775,879,064 |
|
|
|
1981 |
| 11,820,788 |
| (1.01 | %) | $ | 4,798,027,273 |
| 0.46 | % |
1982 |
| 11,633,728 |
| (1.58 | %) | $ | 5,184,774,011 |
| 8.06 | % |
1983 |
| 12,348,270 |
| 6.14 | % | $ | 5,935,050,380 |
| 14.47 | % |
1984 |
| 12,843,433 |
| 4.01 | % | $ | 6,308,817,877 |
| 6.30 | % |
1985 |
| 14,194,189 |
| 10.52 | % | $ | 6,901,178,440 |
| 9.39 | % |
1986 |
| 15,196,284 |
| 7.06 | % | $ | 7,461,375,444 |
| 8.12 | % |
1987 |
| 16,216,102 |
| 6.71 | % | $ | 8,602,965,887 |
| 15.30 | % |
1988 |
| 17,199,808 |
| 6.07 | % | $ | 10,039,448,236 |
| 16.70 | % |
9
1989 |
| 18,129,684 |
| 5.41 | % | $ | 11,912,941,021 |
| 18.66 | % |
1990 |
| 20,954,420 |
| 15.58 | % | $ | 14,320,745,600 |
| 20.21 | % |
1991 |
| 21,315,116 |
| 1.72 | % | $ | 14,326,553,719 |
| 0.04 | % |
1992 |
| 21,886,865 |
| 2.68 | % | $ | 14,686,644,065 |
| 2.51 | % |
1993 |
| 23,522,593 |
| 7.47 | % | $ | 15,127,266,781 |
| 3.00 | % |
1994 |
| 28,214,362 |
| 19.95 | % | $ | 19,163,212,044 |
| 26.68 | % |
1995 |
| 29,002,122 |
| 2.79 | % | $ | 20,686,800,160 |
| 7.95 | % |
1996 |
| 29,636,361 |
| 2.19 | % | $ | 22,533,257,750 |
| 8.93 | % |
1997 |
| 30,464,635 |
| 2.79 | % | $ | 24,952,188,808 |
| 10.73 | % |
1998 |
| 30,605,128 |
| 0.46 | % | $ | 24,577,469,254 |
| (1.50 | )% |
1999 |
| 33,809,134 |
| 10.47 | % | $ | 28,695,178,460 |
| 16.75 | % |
2000 |
| 35,849,691 |
| 6.04 | % | $ | 31,462,337,364 |
| 9.64 | % |
2001 |
| 35,017,317 |
| (2.32 | )% | $ | 31,907,491,818 |
| 1.41 | % |
2002 |
| 35,071,504 |
| 0.15 | % | $ | 31,613,937,641 |
| (0.92 | )% |
2003 |
| 35,540,126 |
| 1.34 | % | $ | 32,777,906,318 |
| 3.68 | % |
2004 |
| 37,388,781 |
| 5.20 | % | $ | 33,724,467,453 |
| 2.89 | % |
2005 |
| 38,566,717 |
| 3.15 | % | $ | 36,725,853,851 |
| 8.90 | % |
2005 (Jan - Oct) |
| 32,395,217 |
|
|
|
|
|
|
| |
2006 (Jan - Oct) |
| 32,736,229 |
| 1.05 | % |
|
|
|
| |
Source: Las Vegas Convention and Visitors Authority
Figure 3 — Tourism Attendance and Revenue Trend 1990 - 2006

Source: Las Vegas Convention and Visitors Authority
10
Convention business has a significant impact on the Las Vegas economy. The Las Vegas Convention and Visitors Authority estimated that there were 6.166 million convention attendees through December 2005 as compared to 5.725 million convention attendees in 2004, a 7.7% increase. There were 5.725 million convention attendees through December 2004 as compared to 5.658 million convention attendees in 2003, an 11.8% increase. There were 5.658 million convention attendees through December 2003 as compared to 5.1 million convention attendees in 2002, a 9.8% increase. And, the 2001 attendees reflected a 5.1% increase over the 2000 total; while the 2000 attendees reflected a 3.4% increase over the 1999 total. This increase in attendees is even more impressive considering the 1999 figure represents a 14.3% increase over the 1998 total.
The Las Vegas Convention Center, the primary convention facility, is the largest single story convention complex in the United States. In 2001, a $150 million expansion project added 918,000 square feet of exhibit and 90,000 square feet of meeting space bringing the total square footage to 3.2 million. The Las Vegas Convention Center now features approximately 2 million square feet of net exhibit space and 380,000 square feet of net meeting room space, accommodating 170 meeting rooms with seating capacities from 20 to 7,500. The Sands Hotel Expo and Convention Center has an additional 1,200,000 square feet of exhibition space, bringing Las Vegas’ total meeting and exhibition space to more than 6,000,000 square feet, more than any other city in the nation. Las Vegas is also the ideal location for smaller meetings; of the 3,700+ meetings and conventions that came to Las Vegas in 2003, 36% had less than 500 attendees. It is apparent the economic base of Las Vegas will continue to be driven by gaming and tourism.
Sports
The Las Vegas Motor Speedway (“LVMS”), located in the northern corridor, is one of many sporting attractions available in the Las Vegas metro area. This 14-track facility is situated on 1,600 acres and hosts many nationwide sanctioned participants, such as NASCAR and NHRA. In addition to LVMS, Las Vegas is home to the Las Vegas “51s” (affiliate of the Major League Baseball’s Los Angeles Dodgers), Las Vegas Wranglers (affiliate of the National Hockey League’s Calgary Flames) and the Las Vegas Gladiators (Arena Football).
In June of 2005, the area hosted the “Arena Bowl”. This event offered many attractions around the Las Vegas area associated with the championship of the Arena Football League, which had a substantial contribution to the Las Vegas tourism industry. Past area-wide events have included the 2004 Las Vegas Bowl, which hosted NCAA football post-season play and the Wrangler National Finals Rodeo (“NFR”). The NFR has been held annually since 1985. This December event and its various activities are held throughout the community drawing over 175,000 attendees (90 percent from out of town). The sporting events and attractions in Las Vegas are further testimony to the diversity of the area and its increasing base of tourism.
Employment
In addition to the Hotel/Gaming/Resorts sub-sector, it is significant to note that Las Vegas continues to attract business from outside the state due to its “business friendly” environment and low overall cost structure. According to the Las Vegas Perspective, the Nevada
11
Commission on Economic Development reported that in 1992, 63% of inquiries from out-of-state business came from California companies. However, as California’s economy was recovering, that percentage dropped to only 24% of inquiries in 1996. Based on data published in the 2005 Las Vegas Perspective, 60 new businesses relocated to Clark County in 2004 from 16 states. Of these, 32 were from California, 2 from elsewhere in Nevada, 3 per state from Arizona, New York and Pennsylvania, and 2 per state from Georgia, North Carolina, Ohio and Washington. The remainder relocated from 7 other states and 2 from foreign countries.
Nevada’s job total employment growth rate has increased at a rate of 17.5% between January 2003 and March 2005. From April 2004 to April 2005 the total labor force in the state had increased by 6.4%, while the Las Vegas area exhibited growth of 7.4%. The Las Vegas metropolitan area annually captures approximately 75% to 85% of the state’s new jobs. Diversification supports resistance to sharp economic recessions and allows quick responsiveness in periods of expansion.
The overall composition of the employment base in the Las Vegas MSA continues to be dominated by the Service Industries in the Las Vegas job market.
The strongest areas of recent employment gains in the Las Vegas MSA between 1998 and 2003 were in retail trade, transportation/communications/utilities, government and services. With the current and proposed growth in casino construction and the growth in the industrial sector, it is reasonable to project continued employment growth within the construction, manufacturing and service sectors. Between April 2004 and April 2005, the hospitality industry reported 16,200 new jobs, while professional and business services employment increased by 11,800 new jobs. Because of the full time residency increases over the past decade, continued professional and business services job growth is expected to continue in the Las Vegas area. In addition, based solely on the high population growth and economic conditions, retail trade has exhibited favorable growth trends over the past few years. Considering historic growth in the governmental sector, it is also reasonable to project continued growth within that sector. Some older shopping centers are undergoing renovations as new ones are being built.
In 1999, 39 new companies relocated to Southern Nevada, contributed almost $300 million to the economy and provided more than 4,000 new jobs. Two of these new companies were involved with manufacturing and nine of these companies were originally located in California. 2001 saw 62 new companies relocate to Southern Nevada with 15 of these companies originating in California. Of the 62 new companies that relocated here, 11 are involved in manufacturing. Tourism and convention visitors are increasing as well. In 2002, 50 new companies relocated to the Las Vegas area, directly adding approximately 2,547 new jobs. In 2003, 53 new companies relocated to the Las Vegas area, directly adding approximately 2,481 new jobs, while 792 new jobs were created from company expansions. In 2004, 60 new companies relocated to the Las Vegas area, directly adding approximately 1,877 new jobs, while 625 new jobs were created from company expansions. Additional employment has resulted with the recent expansions of the McCarran International Airport. And, teachers are in great demand as the Clark County School District is opening new schools to meet the increasing student population. The following table details the unemployment rate for the past 14 years for the Las Vegas MSA, the State of Nevada and the United States.
12
Table 5 — Unemployment Comparison
Year |
| Clark County |
| Nevada |
| United States |
|
1990 |
| 4.9 |
| 5.1 |
|
|
|
1991 |
| 6.4 |
| 6.3 |
| 5.6 |
|
1992 |
| 6.9 |
| 6.9 |
| 6.8 |
|
1993 |
| 6.8 |
| 6.8 |
| 7.5 |
|
1994 |
| 6.1 |
| 6.1 |
| 6.9 |
|
1995 |
| 5.6 |
| 5.6 |
| 6.1 |
|
1996 |
| 5.1 |
| 5.2 |
| 5.6 |
|
1997 |
| 4.4 |
| 4.5 |
| 5.4 |
|
1998 |
| 4.3 |
| 4.4 |
| 4.9 |
|
1999 |
| 4.2 |
| 4.3 |
| 4.5 |
|
2000 |
| 4.6 |
| 4.5 |
| 4.2 |
|
2001 |
| 5.5 |
| 5.3 |
| 4.0 |
|
2002 |
| 5.9 |
| 5.7 |
| 4.7 |
|
2003 |
| 5.4 |
| 5.3 |
| 5.8 |
|
2004 |
| 4.6 |
| 4.6 |
| 6.0 |
|
2005 |
| 4.0 |
| 4.1 |
| 5.5 |
|
2006 |
| 4.0 |
| 4.1 |
| 5.1 |
|
Source: Nevada Department of Employment, Training & Rehabilitation
Figure 4 — Unemployment Rate 16-Year Trend Comparison

Source: Nevada Department of Employment, Training & Rehabilitation; CBRE
13
Top ten largest employers in Clark County are as follows:
Table 6 — Ten Largest Employers in Clark County (as of 2006 2nd Quarter)
Rank |
| Employer |
| Number of Employees |
|
1 |
| Clark County School District |
| >30,000 |
|
2 |
| Clark County |
| 9,500 to 9,999 |
|
3 |
| Bellagio LLC |
| 8,500 to 8,999 |
|
4 |
| Wynn Las Vegas LLC |
| 8,500 to 8,999 |
|
5 |
| MGM Grand Hotel & Casino |
| 8,500 to 8,999 |
|
6 |
| Mandalay Bay Resort & Casino |
| 7,500 to 7,999 |
|
7 |
| Venetian Casino Resorts LLC |
| 5,500 to 5,999 |
|
8 |
| Mirage Casino-Hotel |
| 5,500 to 5,999 |
|
9 |
| Caesars Palace |
| 5,500 to 5,999 |
|
10 |
| University of Nevada, Las Vegas |
| 4,500 to 4,999 |
|
Source: Nevada Department of Employment, Training & Rehabilitation; CBRE
Government
Clark County operates as an independent political entity and is administered by a County Manager who is supervised by a seven-member Board of Commissioners. The Las Vegas City administration consists of a Mayor, four-member city council, City Manager and appropriate departments.
Utilities
Residential electric rates rank among the lowest in the nation among investor-owned utilities. The Nevada Power Company provides electric power. Las Vegas Valley Water District is the primary water supplier, along with the cities of Boulder City, Henderson, Las Vegas and North Las Vegas. The Southwest Gas Corporation supplies natural gas. Sewers are typically municipally owned. Overall, the availability and/or cost of utilities do not appear to be a significant factor that could limit the growth of the region. However, due to below-average snowfalls in the Rocky Mountains for the past five years, the water level in Lake Mead has continued to decline. As such, some water conservation methods have been implemented throughout Clark County. Alternative water sources are being investigated, but these possible sources will not have an impact on the area for two to three more years.
Health Care
The Las Vegas area is served by over 14 full-service hospitals and six specialty hospitals totaling over 3,900 beds. The continued growth in population and households in the community has spurred new hospital construction in the community. In August 2006, St. Rose
14
Dominican Hospital — San Martin, an additional full service hospital with approximately 110 private rooms and the capacity to expand to 200 private rooms will open in the south corridor of Las Vegas. Furthermore, 150 beds will be added to the full service hospital supply in the northwest corridor between 2006 and 2007 with the construction of the Centennial Hills Hospital Medical Center. Four other proposed full service and specialty hospitals have been proposed to open between 2006- and 2007 in the southern corridor. However, these proposed developments’ attributes, financing, approvals and timing have yet to be finalized.
Schools
Clark County School District (CCSD) is one of the largest in the nation and continues to expand. The school district now has 301 schools, which includes 13 new facilities open for the 2004-2005 school year. Encompassing all of Clark County, the CCSD employs more than 32,000 and continues to add more staff members to accommodate the increasing number of students. The CCSD official school enrollment for 2006 is projected to be 315,105 students and is expected to grow to a projected 389,336 students by 2010. Area residents demonstrated their commitment to education in 1998 when they approved a $2.8 billion ballot question for school financing. Combined with other sources, the CCSD had $3.5 billion in 1998 to finance the area’s education needs through the year 2008. The general operating fund final budget is funded as follows: 41.3% local sales tax, 23.0% property tax, 27.9% state support and 7.8% federal aid and other sources.
The University of Nevada, Las Vegas (UNLV) situated on a 337-acre campus, is located just north of McCarran International Airport with a 2004 enrollment of over 27,000 students. UNLV’s faculty of over 800 members teaches the 195 undergraduate, masters and doctoral degree programs. UNLV houses the only law school in Nevada and a variety of nationally ranked programs. Community College of Southern Nevada (CCSN), America’s third-largest single college, offers 200 degree and technical programs in over 75 career fields. Two-thirds of Nevada’s population is served by CCSN’s three main campuses and over 50 academic centers located in four counties.
Recreation Areas
Las Vegas is located approximately 35 miles southeast of the Mt. Charleston ski and recreation area, 17 miles northeast of the Red Rock recreation area and 23 miles northwest of the Lake Mead recreation area. Also within driving distance of the city are Valley of Fire, Zion, Grand Canyon and Death Valley National Parks. All recreational areas are used on a year-round basis and offer a variety of state-supervised facilities.
In addition to the national and state parks in the region, further recreation is available to residents and tourists at the various community and municipal parks and the 60 public, semiprivate and private golf clubs in the Las Vegas area.
Taxes
The tax structure of Nevada is favorable and contributes to attract new businesses to the state. There is no personal income, corporate income, inventory, inheritance, estate, or gift taxes.
15
The sales tax is 7.75% in Clark County and there is no sales tax on food used for home consumption or for medicines, services or rentals. According to a study by the Government of the District of Columbia, Nevada has the fifth lowest major tax burden in the country. An abatement of all but 2% of the sales tax is available to new or expanding companies for eligible capital equipment that meets specific criteria. Deferral for up to five years is available to a company making major capital purchases. And, Nevada provides an exemption of all but 2% of the sales tax for companies that purchase aircraft or components for aircraft.
The Nevada Freeport law exempts all personal property from state taxation that is in transit through the state, including storage, assembly and/or processing for ultimate use in another state. This law has created a great deal of interest in warehousing within the state of Nevada.
Nevada’s constitutional limit on property tax is $5.00 per $100 of assessed valuation, while the statutory limit is $3.64 per $100 of assessed value. In the Las Vegas area, the tax rate varies depending on location. All classifications of property are assessed at 35% of the statutorily defined taxable value of the property.
Growth and Trends
Significant corridors of growth in metropolitan Las Vegas include the Green Valley/Henderson area to the south and southeast (along Interstate 515 / U.S. Highway 95 and east of Interstate 15) and the areas to the southwest (along Interstate 15), the west and the northwest (along U.S. Highway 95). The region is actually growing outward in all directions; however, the northwest, southwest and south sectors are experiencing the greatest amount of sustained growth. As this growth, which is population-based, continues, it is probable that the primary growth area will shift over time due to constraints of land, access, and available amenities. Over the long-term, growth may shift toward the north area, which is currently controlled to a great extent by the Bureau of Land Management.
According to several sources, Las Vegas, Nevada is the fastest growing metropolitan area in the United States. Because of the magnitude and duration of the population growth, it is highly probable that this trend will continue for the foreseeable future. In addition, as of January 1, 2000, Henderson surpassed Reno as Nevada’s second largest city.
Conclusion
The Las Vegas metropolitan area has undergone a transformation during the last decade from a gambling destination to a mainstream medium-size city. The tremendous historical growth has primarily resulted from a single economic sector’s (gaming/tourism) need for service employees; by the frustration of out-of-state households in finding affordable starter and retirement homes (i.e., within the state of California) and by the “quality of life” features typically attributed to most western states. New employment in the non-service sectors has also created additional population growth, which adds to the stability of the local economy, lessening the long historical reliance on jobs within the service sector for stability and growth. The 1990s reflected a shift in the economics fueling the explosive growth. While the addition of new casino-hotels remains the primary factor creating new jobs, the industrial sector has become a major factor in the accelerating growth. Because of Nevada’s tax structure and Las
16
Vegas’ proximity to large metropolitan areas in the southwest, it has become a center for distribution and manufacturing. This diversity has a positive impact on the local economy as it contributes to job growth and adds stability to an economy dominated by gaming. While the historical growth was phenomenal, governments did not anticipate its magnitude and are now struggling with the process of implementing local and regional land planning necessary for a maturing regional area. Based on the current trends, it appears that the Las Vegas Valley will continue its growth trend into the foreseeable future.
Significant attributes, which have attracted and will facilitate future growth, are:
· A favorable tax structure;
· A strong, skilled employment market;
· The expansion of McCarran International Airport;
· Ongoing long-range planning and construction projects, including a beltway around the metropolitan area;
· The strategic location of Las Vegas places it as an excellent transportation hub;
· The local government is accessible and is pro growth;
· Area residents demonstrated their commitment to education in 1998 when they approved a $2.8 billion ballot question for school financing. Combined with other sources, the CCSD had $3.5 billion in 1998 to finance the area’s education needs through the year 2008.
Issues that are considered to have the potential to negatively impact the long-term development of the metropolitan area include:
· Water availability: about 80% of the domestic water comes from the Colorado River, with the balance from ground water, resulting in “overdraft” conditions over the past decade;
· Deteriorating air quality resulting from increasing number of vehicles, residential fireplaces and general industrial and commercial uses;
· Congested transportation conditions in many areas of the community (which should improve with the extensive road programs around the valley in addition to the new Beltway, the IH-15/US 95 interchange, and the US 95 North widening); and
· The potential for real estate market sectors to become overbuilt if demand characteristics change suddenly and the current development wave continues to gain momentum.
Metropolitan Las Vegas is growing very rapidly with approximately 5,000 to 6,000 people moving in each month. This creates increased demand for all sectors of the real estate market and is a positive factor for the subject property. The economy of Las Vegas is quite strong and should remain robust into the foreseeable future, based on current trends. This economic strength has created a relatively high wage structure and stability of employment.
17
Southern Nevada Index of Leading Economic Indicators
The following is an excerpt from The Center for Business and Economic Research (University of Nevada — Las Vegas). “The Southern Nevada Index of Leading Indicators showed little movement for April, another source of information pointing to modest performance during the early months of 2005. A modest 1.23 percentage increase in visitor volume and a 1.14 percentage increase in gasoline sales best describe the series showing ‘steady as she goes’ conditions. Some indicators, for example, permitting and taxable sales, continue to post impressive growth from year-ago levels, however. All in all, the six-month forecast remains positive, but not likely to post extraordinary double-digit growth rates that were experienced in 2004.” The following graph displays these trends in leading economic indicators since January 1990.
Figure 5 — Southern Nevada and U.S. Indices of Leading Economic Indicators

18
The Southern Nevada Index of Leading Indicators is composed of 10 economic series based on criteria used to build the National Index of Leading Indicators. The series and their respective weights are as follows:
· Residential building units permitted 1.0
· Residential building valuation 1.0
· Commercial building permits 1.0
· Commercial building valuation 1.0
· Taxable sales 1.1
· Air passengers enplaned and deplaned 1.0
· Sales of gasoline (gallons) 1.0
· Gross gaming revenues 1.1
· Visitor volume 1.1
· Conventions held attendance 1.0
19
Tax and Assessment Data
There have been substantial increases in real estate assessed values for the upcoming 2006 - 2007 tax year. However, the new tax laws implemented in 2005 stipulate that an increase in annual taxes of 8% per year is the maximum allowable for commercial properties. Based on conversations with the Clark County Assessor’s office, their reasoning for the increase in property values for the 2006 - 2007 tax year was an attempt to lessen the gap between market value and assessed value, which had been quite substantial in the past. The total re-assessed value does not affect taxes, even if sold, over and above the 8% increase. If the property is subdivided, the assessed value at that time becomes the new base year value for taxes. The Assessor’s Office has reported that this substantial increase in property values is going to be done on a limited basis and they cannot predict when the next one will occur.
It should be mentioned that the Clark County Tax Assessor’s office utilizes only the replacement cost method in establishing market value for commercial properties. Improved sales of similar facilities are not utilized. In addition, even if the subject property were to sell in the open market, the subsequent sales price would not have an affect on the tax assessor’s market value estimate. In addition, the Tax Assessor’s office analyzes commercial real estate on a mass appraisal system. As such, the Assessor’s indication of value by the Cost Approach may not correlate accurately with the Cost Approach calculations presented in an appraisal report. In our experience, the Tax Assessor’s estimate of market value for most commercial property types has been less than the true market value based on comparisons of an appraiser’s value estimates or by comparing market transactions of improved properties in the open market.
Therefore, the best estimate of an appropriate taxable value for the subject property is a comparison of competing facilities in the immediate area, which will be discussed in the later section. For purposes of this analysis, we are assuming any outstanding property tax liability is paid. No deduction for outstanding property tax delinquency has been made. CBRE assumes that all taxes are current.
20

SITE SUMMARY
Physical Description |
|
Gross Site Area | 60.7 Acres 2,644,092 Sq. Ft. |
Primary Road Frontage | Las Vegas Boulevard |
Secondary Road Frontage | Cactus |
Zoning District | H-1 |
Flood Map Panel No. | 32003C2568E |
Flood Zone | Zone X |
Estimated Value | $151,750,000 to $182,100,000 |
Source: Various sources compiled by CBRE
23
LOCATION
The subject is located on the west side of Las Vegas Blvd. and is bordered on the east by Interstate 15.
ASSESSOR’S PARCEL NUMBER
The Clark County Tax Assessor’s parcel numbers for the property are:
16220303001 |
| 16220410003 |
| 16220411002 |
16220303002 |
| 16220410006 |
| 16220411001 |
16220303003 |
| 16220410012 |
| 16220411004 |
16220303010 |
| 16220410007 |
| 16220403004 |
16220303011 |
| 16220410008 |
| 16220403006 |
16220303009 |
| 16220410009 |
| 16220403001 |
16220303007 |
| 16220410010 |
| 16220402008 |
16220303008 |
| 16220410011 |
| 16220402003 |
16220302010 |
| 16220411010 |
| 16220402006 |
16220302012 |
| 16220411009 |
| 16220402005 |
16220302013 |
| 16220411008 |
| 16220401006 |
16220402001 |
| 16220411011 |
| 16220401005 |
16220402002 |
| 16220411005 |
|
|
16220410002 |
| 16220411003 |
|
|
SHAPE AND FRONTAGE
The shape is generally rectangular and has adequate frontage along two primary thoroughfares within the neighborhood.
INGRESS/EGRESS
Ingress and Egress is available to the current site via Las Vegas Blvd. The site will benefit from a proposed Interstate 15 off ramp, which is scheduled to be built on Cactus Blvd. on the southern end of the property.
24
SOILS
A soil analysis for the site has not been provided for the preparation of this valuation. In the absence of a soil report, it is a specific assumption that the site has adequate soils to support the highest and best use.
EASEMENTS AND ENCROACHMENTS
A title policy for the property has not been provided for the preparation of this valuation. It is recommended that the client/reader obtain a current title policy outlining all easements and encroachments on the property, if any, prior to making a business decision.
UTILITIES AND SERVICES
The site is within the jurisdiction of Clark County and is provided all municipal services, including police, fire and refuse garbage collection. All utilities are available to the site in adequate quality and quantity to service the highest and best use as if vacant and as improved.
FLOOD ZONE
According to flood hazard maps published by the Federal Emergency Management Agency (FEMA), the site is within Zone X, as indicated on Community Map Panel No. 98798798797E.
FEMA Zone X: Area determined to be outside the 500-year flood plain.
ADJACENT PROPERTIES
The adjacent land uses are as follows:
North: Frias Rd. / Undeveloped Land
South: Cactus Blvd. / Undeveloped Land
East: Las Vegas Blvd. / Undeveloped Land
West: Interstate 15
25
Neighborhood Map

The subject property is located on S. Las Vegas Blvd. on what is commonly referred to as the South Strip. The neighborhood surrounding the site currently consists of undeveloped land to the north and south of the property and Interstate 15 to the west of the site. Land along Las Vegas Blvd. is included in the County’s Gaming Enterprise District, which allows gaming uses to be developed within 1500 feet from the center of Las Vegas Blvd. The South Strip is seen as an alternative to developing a gaming property on Las Vegas Blvd. without having to pay strip prices. Values along the South Strip have appreciated over the previous two years as residential developers have sought out locations to build mid and high-rise condominium developments. With the slowdown in the residential market there has been a corresponding slowdown in the appreciation of land values along the South Strip. The South Point Casino to the North of the site did not perform to levels acceptable to Boyd Gaming, prompting them
26
to sell the casino to Michael Guaghan (who was the original developer). The land to the South of the subject site is owned by Gary Goett, who has plans to develop a large mixed-use development incorporating two casinos and a large retail component. This development project is still in the conceptual phase and it is unknown if and when a project will be built there. The subject site benefits from its frontage on Interstate 15 and the future off-ramp that is scheduled to be constructed on Cactus Ave. Development of a full scale casino resort on the site is currently premature until the surrounding area is developed beyond its current state.
27
COMPS
ID |
| Parcel |
| Owner |
| Zoning |
| Sale Price |
| Sale Date |
| Acres |
| Price per |
|
1 |
| 17721101008 |
| Sedona on the Boulevard LLC |
| H-1 |
| 67,200,000 |
| 1 / 2006 |
| 26.06 |
| 2,577,675 |
|
2 |
| 19109101001 |
| GM Kim LLC |
| H-1 |
| 12,500,000 |
| 9 / 2005 |
| 5 |
| 2,500,000 |
|
3 |
| 17729701011 |
| Urban Village Development, LLC |
| H-1 |
| 35,053,454 |
| 11 / 2005 |
| 50 |
| 701,069 |
|
4 |
| 17708701014 |
| BDV 2 Associates |
| H-1 |
| 103,000,000 |
| 11 / 2006 |
| 31.57 |
| 3,262,591 |
|

Sales comparables for properties along the South Strip range from $700,000 per acre to approximately $3.2 million per acre. The most relevant comparable is the recent purchase of 31.57 acres by an east coast development group for $3.2 million per acre. It is not known what the group intends on developing on the site. Based on the sales comparables and current market conditions for South Strip land, the Cactus site has a value of $2,500,000 to $3,000,000 per acre. ($151,750,000 to $182,100,000)
28
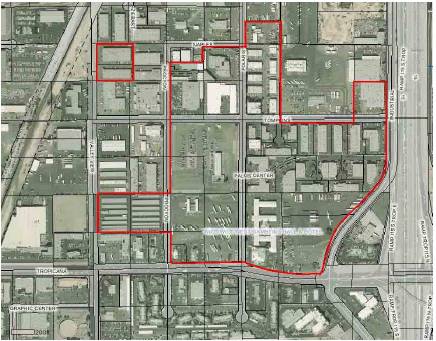
Castaways

SITE SUMMARY
Physical Description |
|
Gross Site Area | 25.86 Acres 1,126,461 Sq. Ft. |
Primary Road Frontage | Fremont Street |
Secondary Road Frontage | Oakey |
Zoning District | H-1 |
Flood Map Panel No. | 32003C2186E |
Flood Zone | Zone X |
Estimated Value | $19,395,000 to $32,325,000 |
Source: Various sources compiled by CBRE
30
LOCATION
The subject is located on the NWC of Oakey and Fremont Street. Atlantic Avenue borders the property to the west.
ASSESSOR’S PARCEL NUMBER
The Clark County Tax Assessor’s parcel numbers for the property are:
162-01-201-001
162-01-201-002
SHAPE AND FRONTAGE
The shape is generally triangular and has adequate frontage along two primary thoroughfares within the neighborhood.
INGRESS/EGRESS
Ingress and Egress is available to the current site via Fremont Street to the NE. Access to the site is also available via Oakey to the south and Atlantic to the west.
SOILS
A soil analysis for the site has not been provided for the preparation of this valuation. In the absence of a soil report, it is a specific assumption that the site has adequate soils to support the highest and best use.
EASEMENTS AND ENCROACHMENTS
A title policy for the property has not been provided for the preparation of this valuation. It is recommended that the client/reader obtain a current title policy outlining all easements and encroachments on the property, if any, prior to making a business decision.
UTILITIES AND SERVICES
The site is within the jurisdiction of Clark County and is provided all municipal services, including police, fire and refuse garbage collection. All utilities are available to the site in adequate quality and quantity to service the highest and best use as if vacant and as improved.
31
FLOOD ZONE
According to flood hazard maps published by the Federal Emergency Management Agency (FEMA), the site is within Zone X, as indicated on Community Map Panel No. 32003C2186E
FEMA Zone X: Area determined to be outside the 500-year flood plain.
ADJACENT PROPERTIES
The adjacent land uses are as follows:
North: Fremont Street / Commercial Uses
South: Oakey / Single Family Residential
East: Atlantic / Single Family Residential
West: Fremont Street / Commercial Uses
32
Neighborhood Map

The subject property is located on Fremont Street on the southern edge of Downtown Las Vegas. The site was the former location of the Castaways Hotel Casino. The Company purchased the Castaways out of bankruptcy and proceeded to demolish and excavate the site. The neighborhood surrounding the Castaways has deteriorated through the years, making the development of a full scale casino resort challenging to develop. A smaller development catering to the surrounding demographics incorporating retail and gaming uses make the most sense for the site.
33
COMPS
ID |
| Parcel |
| Owner |
| Zoning |
| Sale Price |
| Sale Date |
| Acres |
| Price per |
|
1 |
| 16215602009 |
| Maryland Square LLC |
| C-2 |
| 5,222,840 |
| 9 / 2005 |
| 6.5 |
| 794,952 |
|
2 |
| 16210502024 |
| May Gerrard |
| C-2 |
| 5,000,000 |
| 10 / 2006 |
| 2.2 |
| 2,232,142 |
|
3 |
| 14030701009 |
| Las Vegas Development Assoc. |
| C-1 |
| 2,200,000 |
| 1 / 2006 |
| 2.5 |
| 859,375 |
|
4 |
| 16210803007 |
| Corrina Professional Plaza |
| C-1 |
| 1,800,000 |
| 5 / 2006 |
| 1.2 |
| 1,451,612 |
|

The are a limited number of sales comparables for the Castaways site because of its location in a mature neighborhood without the availability of large development sites. The sales comparables listed above are for general commercial zoned parcels in areas similar to the Castaways. Based on the size of the Castaways site and its zoning allowing a gaming use the property has a value of $750,000 to $1,250,000 per acre. ($19,395,000 to $32,325,000)
34
Durango

SITE SUMMARY
Physical Description |
|
Gross Site Area | 70.98 Acres 3,091,889 Sq. Ft. |
Primary Road Frontage | Durango |
Secondary Road Frontage | Maule |
Zoning District | H-1 |
Flood Map Panel No. | 320003C2535E |
Flood Zone | Zone X |
Estimated Value | $167,500,000 to $201,000,000 |
Source: Various sources compiled by CBRE
36
LOCATION
The subject is located on the SWC of Interstate 215 and Durango.
ASSESSOR’S PARCEL NUMBER
The Clark County Tax Assessor’s parcel numbers for the property is: 176-05-601-028
SHAPE AND FRONTAGE
The shape is generally rectangular and has adequate frontage along two primary thoroughfares within the neighborhood.
INGRESS/EGRESS
Ingress and Egress is available to the current site via Durango Blvd. Durango has an on and off ramp on Interstate 215 providing the site with direct Interstate access.
SOILS
A soil analysis for the site has not been provided for the preparation of this valuation. In the absence of a soil report, it is a specific assumption that the site has adequate soils to support the highest and best use.
EASEMENTS AND ENCROACHMENTS
A title policy for the property has not been provided for the preparation of this valuation. It is recommended that the client/reader obtain a current title policy outlining all easements and encroachments on the property, if any, prior to making a business decision.
UTILITIES AND SERVICES
The site is within the jurisdiction of Clark County and is provided all municipal services, including police, fire and refuse garbage collection. All utilities are available to the site in adequate quality and quantity to service the highest and best use as if vacant and as improved.
FLOOD ZONE
According to flood hazard maps published by the Federal Emergency Management Agency (FEMA), the site is within Zone X, as indicated on Community Map Panel No. 320003C2535E.
FEMA Zone X: Area determined to be outside the 500-year flood plain.
37
ADJACENT PROPERTIES
The adjacent land uses are as follows:
North: Interstate 215
South: Maule / Multifamily Residential
East: Undeveloped Land
West: Durango / Undeveloped Land
Neighborhood Map

38
The subject property is located on the SWC of S. Durango and Interstate 215 in the southwest potion of the Las Vegas Valley. This neighborhood is currently in its infancy stage with many new residential and commercial developments under construction in the immediate area. The Company purchased this site from developer Jim Rhodes who is responsible for a majority of the residential development located to the south of the site, including Rhodes Ranch, which is a large gated golf course community. The subject site is an excellent location for a neighborhood casino because of its frontage and access along Interstate 215 and the above average demographics of the surrounding area.
COMPS
There are no sales comparables for this property in its immediate neighborhood because of SB 208 which limited the location of neighborhood casinos within the Las Vegas Valley. The Durango site is one of a small number of remaining neighborhood casino sites within the Valley. The other neighborhood sites controlled by the Company include its Flamingo and Aliante site. Placing values on these sites using sales comparables is challenging because there have been no trades in the previous three years of true neighborhood casino sites. The South Strip has the closest characteristics to the Durango, Flamingo and Aliante sites. For purposes of this report South Strip comps will be used to provide the estimated values. This places a value on the Durango Site of $2,500,000 to $3,000,000 per acre ($167,500,000 to $201,000,000) The comps are listed below for reference.
ID |
| Parcel |
| Owner |
| Zoning |
| Sale Price |
| Sale Date |
| Acres |
| Price per |
|
1 |
| 17721101008 |
| Sedona on theBoulevard LLC |
| H-1 |
| 67,200,000 |
| 1 / 2006 |
| 26.06 |
| 2,577,675 |
|
2 |
| 19109101001 |
| GM Kim LLC |
| H-1 |
| 12,500,000 |
| 9 / 2005 |
| 5 |
| 2,500,000 |
|
3 |
| 17729701011 |
| Urban Village Development, LLC |
| H-1 |
| 35,053,454 |
| 11 / 2005 |
| 50 |
| 701,069 |
|
4 |
| 17708701014 |
| BDV 2 Associates |
| H-1 |
| 103,000,000 |
| 11 / 2006 |
| 31.57 |
| 3,262,591 |
|
39
Flamingo

SITE SUMMARY
Physical Description |
|
Gross Site Area | 42 Acres 1,829,520 Sq. Ft. |
Primary Road Frontage | Town Center |
Secondary Road Frontage | Flamingo |
Zoning District | H-1 |
Flood Map Panel No. | 32003C2550E |
Flood Zone | Zone X |
Estimated Value | $122,500,000 to $196,000,000 |
Source: Various sources compiled by CBRE
41
LOCATION
The subject is located on the NWC of Flamingo and Town Center.
ASSESSOR’S PARCEL NUMBER
The Clark County Tax Assessor’s parcel numbers for the property is:
164-13-301-002
SHAPE AND FRONTAGE
The shape is generally rectangular and has adequate frontage along two primary thoroughfares within the neighborhood.
INGRESS/EGRESS
Ingress and Egress is available to the current site via Town Center and Flamingo. Town Center is an exit ramp for Interstate 215 providing the site with direct freeway access.
SOILS
A soil analysis for the site has not been provided for the preparation of this valuation. In the absence of a soil report, it is a specific assumption that the site has adequate soils to support the highest and best use.
EASEMENTS AND ENCROACHMENTS
A title policy for the property has not been provided for the preparation of this valuation. It is recommended that the client/reader obtain a current title policy outlining all easements and encroachments on the property, if any, prior to making a business decision.
UTILITIES AND SERVICES
The site is within the jurisdiction of Clark County and is provided all municipal services, including police, fire and refuse garbage collection. All utilities are available to the site in adequate quality and quantity to service the highest and best use as if vacant and as improved.
FLOOD ZONE
According to flood hazard maps published by the Federal Emergency Management Agency (FEMA), the site is within Zone X, as indicated on Community Map Panel No. 98798798797E.
FEMA Zone X: Area determined to be outside the 500-year flood plain.
42
ADJACENT PROPERTIES
The adjacent land uses are as follows:
North: Interstate 215 / Single Family Residential
South: Flamingo / Undeveloped Land
East: Town Center / Undeveloped Land / Retail
West: Single Family Residential
Neighborhood Map

43
The subject property is located on the NWC of Flamingo and Town Center within the community of Summerlin. Summerlin is a 22,500 acre master planned community that has been recognized as one of the best master planned communities in America. Summerlin sits on the western rim of the Las Vegas Valley and encompasses 36 square miles. The neighborhood surrounding the site consists of a range of residential developments ranging from entry-level homes to large custom-built estates. Bear’s Best Golf Course is located immediately to the west of the site. The Summerlin area is home to some of the highest demographics in the Las Vegas Valley. This site is considered absolutely prime. Future development on the site will probably have a large mixed-use component incorporating retail and residential uses. Future development of gaming on the site will need to be carefully analyzed as not to cannibalize business from the Company’s Red Rock Resort located less than 5 miles away.
COMPS
There are no sales comparables for this property in its immediate neighborhood because of SB 208 which limited the location of neighborhood casinos within the Las Vegas Valley. The Flamingo site is one of a small number of remaining neighborhood casino sites within the Valley. The other neighborhood sites controlled by the Company include its Durango and Aliante sites. Placing values on these sites using sales comparables is challenging because there have been no trades in the previous three years of true neighborhood casino sites. The South Strip has the closest characteristics to the Durango, Flamingo and Aliante sites. For purposes of this report South Strip comps were used to provide the estimated values. This site receives a small premium on the upper level of its value because of its superior location in the neighborhood of Summerlin. This places a value on the Flamingo Site of $2,500,000 to $4,000,000 per acre ($122,500,000 to $196,000,000)
44
Losee

SITE SUMMARY
Physical Description |
|
Gross Site Area | 54.0 Acres 2,352,240 Sq. Ft. |
Primary Road Frontage | Interstate 215 |
Secondary Road Frontage | Severance Lane |
Zoning District | R-E (Residential), O-L (Open Land) |
Flood Map Panel No. | 2150 |
Flood Zone | This Parcel is not in a 100-year flood zone |
Estimated Value | $29,403,000 to $30,579,120 |
Source: Various sources compiled by CBRE
46
LOCATION
The subject is on the north side of Interstate 215 and in close proximity to Losee Road.
ASSESSOR’S PARCEL NUMBER
The Clark County Tax Assessor’s parcel numbers for the property are:
124-13-401-001, 124-13-401-002, 124-13-401-005, 124-13-401-006, 124-13-401-007, 124-13-401-008
SHAPE AND FRONTAGE
The shape is generally rectangular and has adequate frontage along one primary thoroughfare within the neighborhood.
INGRESS/EGRESS
Ingress and Egress is currently only available by unimproved right of way roads along the Losee Road alignment.
SOILS
A soil analysis for the site has not been provided for the preparation of this valuation. In the absence of a soil report, it is a specific assumption that the site has adequate soils to support the highest and best use.
EASEMENTS AND ENCROACHMENTS
A title policy for the property has not been provided for the preparation of this valuation. It is recommended that the client/reader obtain a current title policy outlining all easements and encroachments on the property, if any, prior to making a business decision.
UTILITIES AND SERVICES
The site is within the jurisdiction of North Las Vegas and is currently approximately 3500 feet from existing services, which are located on the south side of I-215, and is adjacent to Bureau of Land Management land on 3 sides. Services are likely to become available as private land is developed west of the site.
FLOOD ZONE
According to flood hazard maps published by the Federal Emergency Management Agency (FEMA), the site is not in a 100-year flood zone, as indicated on Community Map Panel No. 2150.
47
ADJACENT PROPERTIES
The adjacent land uses are as follows:
North: Vacant Land / BLM Land
South: Interstate 215
East: BLM Land
West: Future Master Planned Community/Vacant Land
SUMMARY AND NEIGHBORHOOD OVERVIEW
This site is within the City of North Las Vegas’ future master planned community, north of I-215 and east of the recently purchased site for the Olympia Group’s future community. Losee Road is proposed as a major services corridor for the rapidly growing residential areas south of the subject location, with an interchange on I-215. A large flood detention facility has been built west of the subject area and will somewhat segregate the Olympia community from the subject site. Due to the size of the site, an the limited services currently available the site’s current value is estimated to be $12.50 to $13.00 per square foot ($29,403,000 to $30,579,120) with residential uses anticipated and possible premiums available if assembled with adjacent property allowing more intensive uses due to direct access to Losee Road and exposure to I-215.
48
Neighborhood Map

49
Comparables
ID |
| Parcel |
| Owner |
| Zoning |
| Sale Price |
| Sale Date |
| Acres |
| PSF |
| ||
1 |
| 12414000001 |
| NOVEMBER 2005 LAND INVESTORS LLC |
| PUD |
| $ | 639,000,000 |
| 200605 | * | 642.26 |
| $ | 5.48 |
|
2 |
| 12426501007 |
| A V NEVADA 2 LLC |
| R-E |
| $ | 2,452,640 |
| 200509 | * | 2.53 |
| $ | 7.06 |
|
3 |
| 12423501002 |
| PJ & CB LLC |
| O-L |
| $ | 11,775,000 |
| 200608 |
| 20.42 |
| $ | 13.24 |
|
* Multiple parcel transaction. PSF calculated based on total acreage of transaction

50
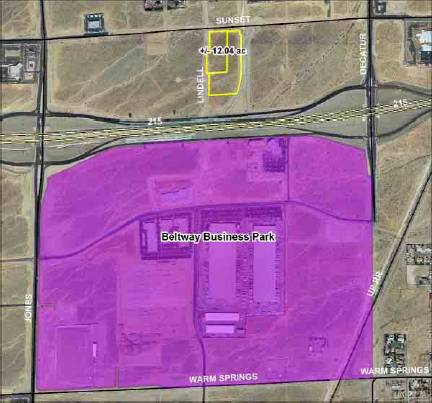
Sunset/Lindell

SITE SUMMARY
Physical Description |
|
Gross Site Area | 12.04 Acres 524,462 Sq. Ft. |
Primary Road Frontage | Sunset Road |
Secondary Road Frontage | Lindell Road |
Zoning District | C-2 (Commercial Retail) |
Flood Map Panel No. | 2150 |
Flood Zone | This Parcel is not in a 100-year flood zone |
Estimated Value | $12,000,000 |
Source: Various sources compiled by CBRE
52
LOCATION
The subject is on the south side of Sunset Road and along the eastern side of Lindell Road.
ASSESSOR’S PARCEL NUMBER
The Clark County Tax Assessor’s parcel numbers for the property are: 176-01-501-001, 176-01-501-002, 176-01-501-005
SHAPE AND FRONTAGE
The shape is generally rectangular and has adequate frontage along one primary thoroughfare within the neighborhood.
INGRESS/EGRESS
Ingress and Egress is available to the current site via Sunset Road on the north end of the property, and the future alignment of Lindell Road on the west side of the site.
SOILS
A soil analysis for the site has not been provided for the preparation of this valuation. In the absence of a soil report, it is a specific assumption that the site has adequate soils to support the highest and best use.
EASEMENTS AND ENCROACHMENTS
A title policy for the property has not been provided for the preparation of this valuation. It is recommended that the client/reader obtain a current title policy outlining all easements and encroachments on the property, if any, prior to making a business decision.
UTILITIES AND SERVICES
The site is within the jurisdiction of Clark County and is provided all municipal services, including police, fire and refuse garbage collection. All utilities are available to the site in adequate quality and quantity to service the highest and best use as if vacant and as improved.
FLOOD ZONE
According to flood hazard maps published by the Federal Emergency Management Agency (FEMA), the site is not in a 100-year flood zone, as indicated on Community Map Panel No. 2554.
53
ADJACENT PROPERTIES
The adjacent land uses are as follows:
North: Sunset Road/Vacant Land and Rural Estates
South: Vacant land
East: Drainage Channel/Vacant Land
West: Lindell Road/Vacant Land
SUMMARY AND NEIGHBORHOOD OVERVIEW
The subject property is located within the Clark County unincorporated Township of “Enterprise” and is proposed for Business and Design Research Park uses which allows the C-2 zoning for retail development, which the subject is currently zoned. The majority of the site is deed restricted to prevent residential uses (7.76 acres) and will likely be developed as retail or service center due to the convenient access to I-215 via Decatur and Jones Blvd. interchanges. The site currently lacks frontage along I-215, which may or may not be necessary for the eventual development of the site, depending upon the final use. The market value of this site is currently $12,000,000.00 or $22.88 per square foot due to the projected uses and the lack of a prominent corner location, where greater values are available.
54
Neighborhood Map
55
Comparables
ID |
| Parcel |
| Owner |
| Zoning |
| Sale Price |
| Sale Date |
| Acres |
| PSF |
| ||
1 |
| 16336401028 |
| PETERSEN 1994 TRUST |
| C-2 |
| $ | 2,100,000 |
| 200609 |
| 2.50 |
| $ | 19.28 |
|
2 |
| 17612101006 |
| PARK PLAZA PROF BLDG PTNRSHP |
| C-2 |
| $ | 2,750,000 |
| 200605 |
| 2.02 |
| $ | 31.25 |
|
3 |
| 17612101025 |
| WARM SPRINGS JONES 25 INVEST LLC |
| C-2 |
| $ | 4,000,000 |
| 200609 |
| 4.40 |
| $ | 20.87 |
|
4 |
| 17601102011 |
| KENNEDY FAMILY TRUST |
| R-E |
| $ | 450,000 |
| 200605 |
| 1.25 |
| $ | 8.26 |
|
5 |
| 16336801008 |
| REBEL OIL COMPANY INC |
| C-2 |
| $ | 2,250,000 |
| 200607 |
| 1.81 |
| $ | 28.54 |
|

56
Wild Wild West
SITE SUMMARY
Physical Description |
|
Gross Site Area | 69.27 Acres 3,017,401 Sq. Ft. |
Primary Road Frontage | Tropicana Avenue |
Secondary Road Frontage | Dean Martin Drive |
Zoning District | H-1, M-1 |
Flood Map Panel No. | 32003C2556E |
Flood Zone | Zone A |
Estimated Value | $346,500,000 to $485,100,000 |
Source: Various sources compiled by CBRE
58
LOCATION
The subject is on the north side of W. Tropicana Avenue and along the west side of Industrial Road. Interstate 15 is situated adjacent to Industrial Road giving the property I-15 frontage.
ASSESSOR’S PARCEL NUMBER
The Clark County Tax Assessor’s parcel numbers for the property are:
16220303001 |
| 16220410003 |
| 16220411002 |
16220303002 |
| 16220410006 |
| 16220411001 |
16220303003 |
| 16220410012 |
| 16220411004 |
16220303010 |
| 16220410007 |
| 16220403004 |
16220303011 |
| 16220410008 |
| 16220403006 |
16220303009 |
| 16220410009 |
| 16220403001 |
16220303007 |
| 16220410010 |
| 16220402008 |
16220303008 |
| 16220410011 |
| 16220402003 |
16220302010 |
| 16220411010 |
| 16220402006 |
16220302012 |
| 16220411009 |
| 16220402005 |
16220302013 |
| 16220411008 |
| 16220401006 |
16220402001 |
| 16220411011 |
| 16220401005 |
16220402002 |
| 16220411005 |
|
|
16220410002 |
| 16220411003 |
|
|
SHAPE AND FRONTAGE
The site is currently a collection of industrial properties adjacent to the existing Wild Wild West Casino. The Company has spent the previous couple of years assembling properties to create the future development site. It is believed that the company will vacate existing roads that currently run between the sites. There will be adequate frontage along Tropicana Avenue and Dean Martin Drive when the site is completely assembled.
INGRESS/EGRESS
Ingress and Egress is available to the current site via many streets that surround the property. Access is available from Tropicana Avenue on the south end of the property.
59
SOILS
A soil analysis for the site has not been provided for the preparation of this valuation. In the absence of a soil report, it is a specific assumption that the site has adequate soils to support the highest and best use.
EASEMENTS AND ENCROACHMENTS
A title policy for the property has not been provided for the preparation of this valuation. It is recommended that the client/reader obtain a current title policy outlining all easements and encroachments on the property, if any, prior to making a business decision.
UTILITIES AND SERVICES
The site is within the jurisdiction of Clark County and is provided all municipal services, including police, fire and refuse garbage collection. All utilities are available to the site in adequate quality and quantity to service the highest and best use as if vacant and as improved.
FLOOD ZONE
According to flood hazard maps published by the Federal Emergency Management Agency (FEMA), the site is within Zone A, as indicated on Community Map Panel No. 32003C2556E.
FEMA Zone A: Area subject to inundation by the 1% annual chance flood event.
ADJACENT PROPERTIES
The adjacent land uses are as follows:
North: Industrial Buildings
South: Tropicana Avenue/Commercial Buildings
East: Industrial Buildings
West: Industrial Road/Interstate 15
60
Neighborhood Map
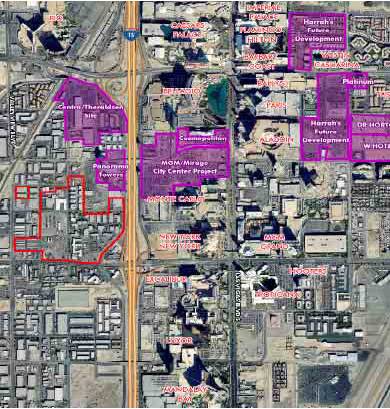
The subject property is located on the West side of Interstate 15 and is bordered by Tropicana Avenue on the South. The site consists of the current Wild Wild West Casino and adjacent industrial buildings that the Company has assembled over a 3-year period. The west side of Interstate 15 has traditionally been populated with industrial buildings serving as homes to the many businesses who supply goods and services to the mega resorts located on the Las Vegas Strip. The recent rise of Las Vegas real estate prices and the limited supply of developable land in the resort corridor have pushed developers and land speculators to begin purchasing development sites adjacent to the Strip and resort corridor. Values for sites west of Interstate 15 have risen in value as developers look for locations with easy access and visibility to and from the Strip. This neighborhood will undertake a significant change in the years to come as condominium and resort development begins to replace the industrial buildings currently on the site.
61
COMPS
ID |
| Parcel |
| Owner |
| Zoning |
| Sale Price |
| Sale Date |
| Acres |
| Price per |
|
1 |
| 16220302012 |
| Panorama Towers South LLC |
| U-V |
| 11,000,000 |
| 11 / 2006 |
| 2.06 |
| 5,339,806 |
|
2 |
| 16220103020 |
| Tharaldson Lodging Group |
| M-1 |
| 68,464,000 |
| 10 / 2006 |
| 14.65 |
| 9,346,621 |
|
3 |
| 16229401017 |
| Weststate Land Partners LLC |
| H-1 |
| 201,783,464 |
| 5 / 2006 |
| 62.58 |
| 3,224,408 |
|

62
The three most relevant sales comparables occurred in the immediate neighborhood of the Wild Wild West site. Just to the north of the site a private investor purchased the Southtech Industrial park for approximately $9.3M per acre. The developer stated that his actual basis in the site was closer to $6M per acre once factors such as street vacations were accounted for. To the south of the Wild Wild West site a 63 acre parcel traded for $3.2M per acre. This parcel is currently on the market and the values being discussed are in the $5M to $6M pear acre range. We believe this is an accurate indication of where real estate values are on the west side of Interstate 15. This puts the range of values on the Wild Wild West site at $5M to $7M per acre ($346,500,000 to $485,100,000)
63
Reno Bayer

SITE SUMMARY
Physical Description |
|
|
Gross Site Area | 92.607 Acres 4,033,960.92 Sq. Ft. |
|
Primary Road Frontage | Mount Rose Highway (SR 431) |
|
Secondary Road Frontage | South Virginia St |
|
Zoning District | Land Use Tourist Commercial |
|
Flood Map Panel No. | 32031C3188E |
|
Flood Zone | X |
|
Estimated Value | $51,433,001 to $53,449,982 |
|
Source: Various sources compiled by CBRE
65
LOCATION
The subject property is primarily located on the south side of the Mt. Rose Highway (State Route 431) and along the western side of South Virginia St. One small parcel assumed part of the same assemblage is located directly across South Virginia St.
ASSESSOR’S PARCEL NUMBER
The Washoe County Tax Assessor’s parcel numbers for the property are:
049-392-11 — 49.511 acres
049-392-12 — 19.621 acres
049-392-13 — 11.571 acres
049-385-03 — 7.934 acres
017-011-05 — 3.97 acres
SHAPE AND FRONTAGE
The shape is generally rectangular and has prime frontage along two primary thoroughfares that service the entire region. The Mt. Rose Highway is Reno’s gateway to the Mt. Rose Ski Resort, Incline Village, and Lake Tahoe generally. South Virginia St feeds traffic to and from Carson City.
INGRESS/EGRESS
Ingress and Egress does not appear readily available to the current site, but given the significant frontage on both South Virginia St and the Mt. Rose Highway, the subject property is assumed accessible for purposes of this valuation.
SOILS
A soil analysis for the site has not been provided for the preparation of this valuation. In the absence of a soil report, it is a specific assumption that the site has adequate soils to support the highest and best use.
EASEMENTS AND ENCROACHMENTS
A title policy for the property has not been provided for the preparation of this valuation. It is recommended that the client/reader obtain a current title policy outlining all easements and encroachments on the property, if any, prior to making a business decision.
66
UTILITIES AND SERVICES
The site is within the jurisdiction of the City of Reno and is provided all municipal services, including police, fire and refuse garbage collection. All utilities are available to the site in adequate quality and quantity to service the highest and best use as if vacant and as improved.
FLOOD ZONE
According to flood hazard maps published by the Federal Emergency Management Agency (FEMA), the site is within Zone X, as indicated on Community Map Panel No. 32031C3188E.
FEMA Zone X: Area determined to be outside the 500-year flood plain.
ADJACENT PROPERTIES
The adjacent land uses are as follows:
North: Summit Sierra Shopping Center
South: Geothermal/Vacant/Open Space
East: Vacant
West: Vacant
SUMMARY
The subject property is included within the recently adopted Redfield Regional Center Plan, which has designated the property as Tourist Commercial allowing for unrestricted gaming. The location, accessibility, and surrounding uses render the subject property one of the more viable commercial sites in Northern Nevada.
67
Neighborhood Map

South Reno has quickly become one of the fastest growing areas of Reno. National homebuilders continue to add rooftops to two of Reno’s largest master planned communities, Double Diamond and Damonte Ranch, within a three-mile radius of the subject property. These projects are located northeast of the subject parcels. To the west of the subject parcels are higher end communities such as Saddlehorn, Arrowcreek, and Montreux, host of the annual Reno Tahoe Open PGA tour stop.
Population within a five mile radius of the subject property is currently estimated at 33,390 and is expect to grow more than 17% by 2011 to 39,150. Estimated average household income within a five mile radius of the subject property is one of the highest of the region at $92,808.
The 2,200-acre South Meadows Business Park is 88% built out at present and has attracted major national and international distribution, light manufacturing, and office tenants creating a major concentration of jobs only minutes from the subject property. Current tenants include IGT, Pfizer, and Apple.
With this proliferation of jobs and rooftops, retail has followed. Aside from a number of the typical big box anchored centers (Wal-Mart, Home Depot, etc), the area is beginning to see a growth in high-end boutique retail. Last year’s opening of the Summit Sierra mall has brought a plethora of new retail to Northern Nevada and will one day have over 550,000 sf of shopping, dining, and movie theater space.
At the intersection of the Mt. Rose Highway and South Virginia St, the subject property is located at a major confluence of regional traffic. This intersection leads traffic north in to Reno, south to Carson City, east to Virginia City, and west to Lake Tahoe. With the draw of Summit Sierra’s lifestyle center, it is expected that this area will become a regional draw, beyond even Northern Nevada.
68
The subject property is located within the recently adopted Redfield Regional Center Plan. Within the Redfield Plan, the subject property has been assigned a land use designation of Tourist Commercial, which, most importantly, allows unrestricted gaming as a matter of right. There is no more appropriate zoning for a hotel casino development.
Comparables
While non-residential take-downs of large parcels are quite rare in this market, there are a few comparable sales of property in the marketplace. Bayer Properties originally purchased the subject property for roughly $4.86/sf and Station Casinos is currently in contract to purchase the 84.673 acres of the property for approximately $12.93/sf.
Summit Sierra
Bayer Properties began acquiring property for its project in 2002/03 and closed on various assemblages in 2004. In May of 2004, the initial seventy-three (73.43) acres were purchased for $4.92/sf. Later, eighty-five (84.95) acres were purchased in September of 2004 for $4.86/sf and another twenty-eight (28.745) acres were purchased in December of 2004 for $5.99/sf. This yields a blended rate of $5.26/sf for their property at the corner of South Virginia St and the Mount Rose Highway. At the time of purchase, the Redfield Regional Center Plan had not been adopted and the property was purchased raw with no entitlements.
APN |
| Size |
| Price |
| Price/SF |
| Date |
| ||
049-230-33 et al |
| 73.428 |
| $ | 15,766,300 |
| $ | 4.93 |
| 5/10/2004 |
|
49-392-11 et al |
| 84.951 |
| $ | 18,000,000 |
| $ | 4.86 |
| 9/28/2004 |
|
049-384-01 |
| 28.745 |
| $ | 7,503,640 |
| $ | 5.99 |
| 12/2/2004 |
|
|
|
|
|
|
|
|
|
|
| ||
|
|
|
| Average |
| $ | 5.26 |
|
|
| |
RED Development
More recently, in August of 2006, RED Development out of Kansas City paid a blended rate of $9.83/sf for just over 117 acres in the Marina District of Sparks along I-80. RED Development is currently planning a mixed use dining, shopping, and entertainment complex. The initial ninety-six (96.52) acres were purchased in June of 2006 for $7.17/sf in a sale that included 43.11 acre-feet of water. The second purchase was of roughly twenty-one (21.24) acres in August of 2006 for $12.48/sf. This $12.48/sf price should be seen as most comparable to the subject property since it is zoned Tourist Commercial.
APN |
| Size |
| Price |
| Price/SF |
| Date |
| ||
037-030-18 |
| 96.52 |
| $ | 30,150,000 |
| $ | 7.17 |
| 6/28/2006 |
|
037-020-47 et al |
| 21.24 |
| $ | 11,548,845 |
| $ | 12.48 |
| 8/16/2006 |
|
|
|
|
|
|
|
|
|
|
| ||
|
|
|
| Average |
| $ | 9.83 |
|
|
| |
69
VALUES
RED’s purchase of 21 acres of TC zoned land this year for $12.48/sf is likely the most comparable purchase of 2006. The property has high visibility along a major thoroughfare (I-80), is zoned TC, and will be part of a critical mass of new development. Station Casinos’ current option price of $47.7MM for 84.673 acres (approximately $12.93/sf) can be viewed as an appropriate price for the property. The property is arguably more valuable than RED’s property given the significant amount of development by Bayer Properties in the immediate area while the Sparks Marina District is still in the early stages of development.
We have no reason to believe that market conditions have changed dramatically over the past year such that the property would be valued at any more (or less) than the current option price. While the housing market has experienced a slow down and some home builders are suffering with excess land holdings that were purchased for prices that cannot be sustained given current market conditions, there has not been an apparent residual impact on retail land in the market.
It must be noted that the status of water rights associated with this parcel or the underlying transaction is unavailable. Water is currently being offered by the Truckee Meadows Water Authority at just less than $30,000 per acre foot. Even without evidence of water being associated with the property, it can be concluded that the current contract price is reasonable.
As such, we conclude that the property is fairly valued between $12.75/sf - $13.25/sf or roughly $51.5MM to $53.5MM. Any water included with the purchase of the property would make the property worth potentially more.
70
Reno Convention Center
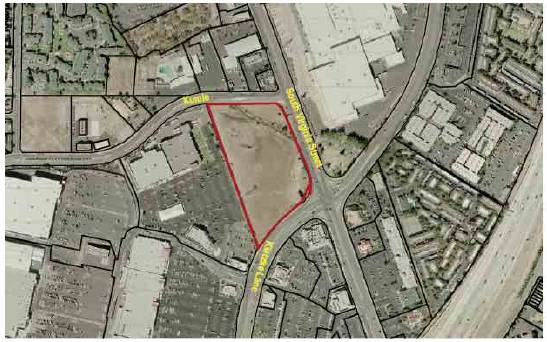
SITE SUMMARY
Physical Description |
|
Gross Site Area | 7.934 Acres 345,605 Sq. Ft. |
Primary Road Frontage | South Virginia St |
Secondary Road Frontage | Redfield Pkwy and Kietzke Ln |
Zoning District | Land Use Tourist Commercial |
Flood Map Panel No. | 32031C3156E |
Flood Zone | X |
Estimated Value | $8,640,125 to $9,331,335 |
Source: Various sources compiled by CBRE
72
LOCATION
The subject property is primarily located on the west side of the South Virginia St. It is bounded on the south by Kietzke Lane and on the north by Redfield Pkwy.
ASSESSOR’S PARCEL NUMBER
The Washoe County Tax Assessor’s parcel number for the property is: 049-385-03 — 7.934 acres
SHAPE AND FRONTAGE
The shape is generally rectangular and has prime frontage along two primary arteries in central Reno.
INGRESS/EGRESS
Ingress and Egress does not appear readily available to the current site, but given the significant frontage on South Virginia, Kietzke, and Redfield, the subject property is assumed accessible for purposes of this valuation.
SOILS
A soil analysis for the site has not been provided for the preparation of this valuation. In the absence of a soil report, it is a specific assumption that the site has adequate soils to support the highest and best use.
EASEMENTS AND ENCROACHMENTS
A title policy for the property has not been provided for the preparation of this valuation. It is recommended that the client/reader obtain a current title policy outlining all easements and encroachments on the property, if any, prior to making a business decision.
UTILITIES AND SERVICES
The site is within the jurisdiction of the City of Reno and is provided all municipal services, including police, fire and refuse garbage collection. All utilities are available to the site, although there is some question as to the capacity of services such as sewer. Nonetheless, without further information, it is assumed that all utilities are available in adequate quality and quantity to service the highest and best use as if vacant and as improved.
73
FLOOD ZONE
According to flood hazard maps published by the Federal Emergency Management Agency (FEMA), the site is within Zone X, as indicated on Community Map Panel No. 32031C3156E. However, the parcel appears to be located in two types of Zone X:
Unshaded FEMA Zone X: Areas determined to be outside the 500-year flood plain.
Shaded FEMA Zone X: Areas of 500-year flood; areas of 100-year flood with average depths less than 1 foot or with drainage areas less than 1 square mile; and areas protected by levees from 100-year flood.
ADJACENT PROPERTIES
The adjacent land uses are as follows:
North: Retail: Miscellaneous
South: Retail: Redfield Promenade
East: Reno-Sparks Convention Center
West: Retail: Firecreek Crossing
SUMMARY
The subject property is included within the proposed Convention/Meadowood Regional Center Plan and the Virginia Street TOD Corridor. This Regional Center Plan is currently in the process of being redrafted, yet the policies underlying the plan will be for high intensity development and it is anticipated that the plan area will be zoned Mixed Use (MU). Station Casinos has received approval from the Reno and Regional Planning Commissions for a hotel casino development on the site. The location, accessibility, entitlements, and surrounding uses render the subject property a very viable commercial site in the marketplace.
74
NEIGHBORHOOD OVERVIEW
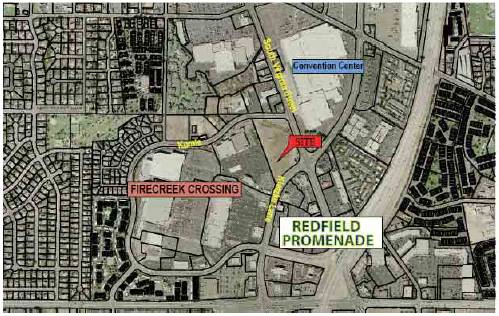
The subject property is located in one of the most active locations in central Reno. The Reno-Sparks Convention Center to the east of the property has 500,000 sf of meeting and exhibition space and hosts a variety of conventions and meetings throughout the year. West and south of the property are the Firecreek Crossing and Redfield Promenade shopping centers with a combined approved commercial floor area of nearly 1,000,000 sf. Retailers include Office Depot, Sam’s Club, Circuit City, Border’s, Chevy’s, Claim Jumper, Bed Bath and Beyond, and many more. Traffic counts on South Virginia adjacent the property are estimated at approximately 30,000 vehicles per day.
Population within a five-mile radius of the subject property is currently estimated at 189,584 and is expect to grow more than 200,000 by 2011. Total retail spending in 2006 within a one mile radius of the subject property is estimated at $241MM and will grow to nearly $300MM by 2011.
The subject property is located within the proposed Convention/Meadowood Regional Center Plan and the Virginia St TOD Corridor. These plans in draft form promote very intensive and dense development. The Reno and Regional Planning Commissions have already approved gaming and hotel uses on the subject parcel, but exact requirements (design and architectural) are pending completion of these draft plans.
Comparables
Virginia Lake Crossing
Silver Star Development of Reno, NV is currently developing a thirty-four (33.94) acre mixed use project in the heart of Reno along South Virginia St, just south of Plumb Ln, only a mile north of the subject parcel. The project will include dense residential, office, and retail uses.
75
The developer paid $11.89/sf for the land in March of 2005. This site has great frontage, is readily buildable, and has a mixed use zoning designation.
APN |
| Size |
| Price |
| Price/SF |
| Date |
| ||
019-110-12 et al |
| 7.286 |
| $ | 3,630,210 |
| $ | 11.44 |
| 3/28/2005 |
|
019-052-11 et al |
| 6.956 |
| $ | 4,398,649 |
| $ | 14.52 |
| 3/28/2005 |
|
019-110-15 |
| 5.459 |
| $ | 2,171,141 |
| $ | 9.13 |
| 3/28/2005 |
|
|
|
|
|
|
|
|
|
|
| ||
|
|
|
| Average |
| $ | 11.70 |
|
|
| |
Redfield and Baker
Immediately west of the subject parcel, a developer purchased 2.7 acres of land at Redfield and Baker for $1,800,000. The developer is currently offering the parcel for sale at $3,100,000 with a tentative map (which is in review) for 31 residential units.
APN |
| Size |
| Price |
| Price/SF |
| Date |
| ||
024-055-31 |
| 2.646 |
| $ | 1,800,000 |
| $ | 15.62 |
| 5/31/2006 |
|
024-055-31 |
| 2.646 |
| $ | 3,100,000 |
| $ | 26.90 |
| Listed |
|
Miscellaneous Comparables
In analyzing additional comps, a wide range of properties were examined. The subject parcel is unique — it is quite large to still be undeveloped while in central Reno and its entitlements allow for a highly dense development that could not be duplicated anywhere else. As such, its likely value cannot be supported by existing comps or listings. Since a land residual analysis is beyond the scope of this report, however, the following comps were analyzed to achieve a supportable value for the subject parcel. These parcels will be or are currently being developed with high density residential or retail projects.
APN |
| Address |
| Size |
| Price |
| Price/SF |
| Date |
| ||
011-232-13 et al |
| S Virginia St |
| 1.286 |
| $ | 1,350,000 |
| $ | 24.10 |
| 6/21/2005 |
|
011-226-07 |
| S Virginia St |
| 0.907 |
| $ | 600,000 |
| $ | 15.19 |
| 7/15/2005 |
|
012-111-32 et al |
| Museum Dr/2nd St |
| 4.87 |
| $ | 5,700,000 |
| $ | 26.87 |
| 12/2/2005 |
|
039-162-01 |
| W Interstate 80 |
| 12.298 |
| $ | 8,100,000 |
| $ | 15.12 |
| Listed |
|
160-070-01 |
| 11395 Old Virginia Rd |
| 15.02 |
| $ | 9,931,680 |
| $ | 15.18 |
| Listed |
|
|
|
|
|
|
|
|
|
|
|
|
| ||
|
|
|
|
|
| Average |
| $ | 19.29 |
|
|
| |
76
VALUES
The subject parcel is located in central Reno adjacent the Reno-Sparks Convention Center and two big box retail centers. The current owner has received approvals for a hotel casino on the site with densities that cannot be duplicated except in the rarest of cases. As such, the true value of the parcel likely cannot be supported by current comps. High density residential projects throughout Reno have commanded land prices in excess of $25/sf as outlined above.
It is reasonable to conclude that the parcel could be valued from $25 to $27 per square foot ($8,640,125 to $9,331,335), but the value could be much higher depending upon the results of a land residual analysis and a buyer’s particular intended use.
77
Graton
Graton Property

SITE SUMMARY
Physical Description |
|
Gross Site Area | 23.00 Acres 1,001,880 Sq. Ft. |
Primary Road Frontage | Dowdell Avenue |
Secondary Road Frontage | Business Park Dr. |
Current Zoning District | Sonoma County Diverse Agriculture |
Potential Zoning District | Rohnert Park City — Regional Commercial |
Flood Map Panel Nos. | 060375855 855 & 060375 860 |
Estimated Value | $13,605,530 to $15,529,140 |
Source: Various sources compiled by CBRE & Orion Partners, Ltd
79
LOCATION
The subject property is located to the west of Highway 101 and is bounded on the north by Wilfred Avenue, on the east by Dowdell Avenue and on the south by Business Park Drive. The western boundary abuts an as-yet undeveloped parcel of land.
ASSESSOR’S PARCEL NUMBER
The Sonoma County Tax Assessor’s parcel number for the property is: 045-074-009 — 25.24 acres (according to Metroscan)
SHAPE AND FRONTAGE
The shape is generally rectangular with frontage on two east/west thoroughfares which provide access to and from Highway 101 — the area’s primary transportation artery.
INGRESS/EGRESS
Ingress and egress do not appear to pose any significant problems for the subject property as it is bordered on three sides by city streets and is assumed accessible for the purposes of this valuation.
SOILS
A soil analysis for the site has not been provided for the preparation of this valuation. In the absence of a soil report, it is a specific assumption that the site has adequate soils to support the highest and best use.
EASEMENTS AND ENCROACHMENTS
A title policy for the property has not been provided for the preparation of this valuation. It is recommended that the client/reader obtain a current title policy outlining all easements and encroachments on the property, if any, prior to making a business decision.
80
UTILITIES AND SERVICES
The site is undeveloped and within the jurisdiction of the County of Sonoma. It is unlikely that services and utilities are available beyond what is reasonable for undeveloped pasture land. However, given the proximity to the subject property, services could likely be brought to the site from Business Park Dr or Redwood Drive.
FLOOD ZONE
According to flood hazard maps published by the Federal Emergency Management Agency (FEMA), the site is not within the 100-year or 500-year flood plains, as indicated on Community Map Panel No. 060375855 855 & 060375 860 (see Exhibit A attached).
ADJACENT PROPERTIES
The adjacent land uses are as follows:
North: Vacant
South: Vacant
East: Vacant
West: Vacant
SUMMARY
Although currently designated as County of Sonoma land, the subject property is within the City of Rohnert Park’s Sphere of Influence and Urban Growth Boundary. As such, the property is included in the City of Rohnert Park’s “Northwest Specific Plan Area” (see Exhibit B attached) — a master plan document to ensure that the phasing and ultimate development of the property is consistent with Rohnert Park’s General Plan. Any future development on the subject property will likely require approval from both the County of Sonoma and the City of Rohnert Park.
81
NEIGHBORHOOD OVERVIEW

Located in the county’s southern central plain, Rohnert Park is the county’s third largest city with 43,000 residents. It is exactly halfway between the vintage river town of Petaluma and the county seat of Santa Rosa. This location places the city in the middle of Sonoma County’s 16-mile business corridor known around the world as Telecom Valley, one of the world’s fastest growing telecommunications areas. Rohnert Park is also the location of Sonoma State University.
Rohnert Park’s business base is made up of high tech companies such as Lemos, Parker Hannifin Corporation and Rheodyne. Service companies such as State Farm Insurance, SBC and CrossCheck, Inc have major regional service centers or are headquartered in the city.
Rohnert Park has experienced an influx of new commercial development within the past 5 years from neighborhood commercial to Big Box retail. Small retail centers are integrated into residential neighborhoods. Major retail centers are located on the western border of the city. Major national retail tenants including Home Depot, COSTCO, Ashley Furniture, Levitz, Wal-Mart, Office Depot, Applebee’s and Lowe’s all call Rohnert Park home.
82
Although lacking a downtown in the traditional sense, the city is developing a civic center which includes a new state-of-the-art public library, public safety buildings, retail and office buildings and in the future a new City Hall.
COMPS
While sales of large commercial parcels are limited in this region, there are a few comparable sales of property in the marketplace.

Comps 1 & 2 — Sebastopol Co-Op LLC
Within the past 18 months a local investment group has purchased four commercial or residential development sites in Sonoma County, including these two sites in Rohnert Park. In March of 2006, the initial five point zero six (5.06) acres were purchased for $13.61/sf. Within two weeks, they closed on the adjacent five point zero eight (5.08) acre site for $13.56/sf. This yields a blended rate of $13.58/sf for their property which is immediately adjacent to the subject property. Similar to the subject property, both of these parcels fall within the City of Rohnert Park’s Sphere of Influence and Urban Growth Boundary. According to the Seller at the time of transfer, the City of Rohnert Park has an annexation proposal in place for these parcels with plans for a shopping center.
83
APN |
| Size |
| Price |
| Price/SF |
| Date |
| ||
045-075-005 |
| 5.06 |
| $ | 3,000,000 |
| $ | 13.61 |
| 03/01/2006 |
|
045-075-006 |
| 5.08 |
| $ | 3,000,000 |
| $ | 13.56 |
| 03/15/2006 |
|
|
|
|
|
|
|
|
|
|
| ||
|
|
|
| Average |
| $ | 13.58 |
|
|
| |
Comp 3 — Spirit Management Company
Just prior to the sale and transfer of Comps 1 & 2, Spirit Management Company purchased this three point six five (3.65) acre site, which is a combination of two parcels. This site lies within the City of Rohnert Park, has access to city services and is directly across the street from a COSTCO Wholesale location. Since the purchase, the site has been developed and is home to a large furniture store. The site was purchased in February of 2006 for $18.55/sf.
APN |
| Size |
| Price |
| Price/SF |
| Date |
| ||
143-040-094, |
|
|
|
|
|
|
|
|
| ||
143-040-108 |
| 3.65 |
| $ | 2,949,500 |
| $ | 18.55 |
| 02/22/2006 |
|
|
|
|
|
|
|
|
|
|
| ||
|
|
|
| Average |
| $ | 18.55 |
|
|
| |
VALUES
The subject property is currently zoned “Diverse Agriculture” by the County of Sonoma and has not been annexed or re-zoned by the City of Rohnert Park. In its current state, the land value is likely comparable to its purchase price as “Pasture” in 1997.
The true value for the land at it’s “highest and best use” requires annexation by the City of Rohnert Park. With a General Plan Amendment designating the subject property’s use to be “Commercial”, the land use would be comparable to that of the parcels across from the subject property on the east side of Dowdell Ave.
Sebastopol Co-Op’s purchase of the two parcels totaling 10.14 acres at an average of $13.58/sf would then be the most likely comparable purchases to use in determining the value for the subject property.
84
Spirit Management Company’s purchase illustrates the potential value of commercial development land in Rohnert Park. However, as it lies within the city limits, has services to the property and is located on a high-traffic frontage road, it does not accurately reflect a comparable value for the subject property in its current condition.
We have no reason to believe that market conditions have changed dramatically over the past year such that the subject property would be valued at any more (or less) than the comparable sales of a year ago.
It must be noted that the status of the subject property’s zoning, annexation and access to services are in question. However, as the subject property does lie within the City of Rohnert Park’s Sphere of Influence and Urban Growth Boundary, future annexation and resolution to these questions is likely.
As such, we conclude that the property is fairly valued at $13.58/sf to $15.50 or roughly $13,605,530 to $15,529,140
85
Boulder
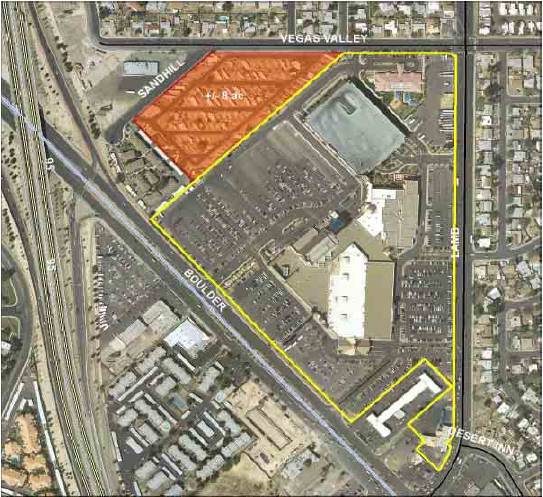
SITE SUMMARY
Physical Description |
|
Gross Site Area | 8 Acres 348,480 Sq. Ft. |
Primary Road Frontage | Vegas Valley Drive |
Secondary Road Frontage | Sandhill Road |
Zoning District | R-E (Residential) |
Flood Map Panel No. | 2150 |
Flood Zone | This Parcel is not in a 100-year flood zone |
Estimated Value | $5,227,200 to $5,575,680 |
Source: Various sources compiled by CBRE
88
LOCATION
The subject is on the south side of Vegas Valley Drive and along the eastern side of Sandhill Road.
ASSESSOR’S PARCEL NUMBER
The Clark County Tax Assessor’s parcel number for the property is: 161-07-702-001
SHAPE AND FRONTAGE
The shape is generally rectangular and has adequate frontage along one primary thoroughfare within the neighborhood.
INGRESS/EGRESS
Ingress and Egress is available to the current site via Vegas Valley Drive and Sandhill Road.
SOILS
A soil analysis for the site has not been provided for the preparation of this valuation. In the absence of a soil report, it is a specific assumption that the site has adequate soils to support the highest and best use.
EASEMENTS AND ENCROACHMENTS
A title policy for the property has not been provided for the preparation of this valuation. It is recommended that the client/reader obtain a current title policy outlining all easements and encroachments on the property, if any, prior to making a business decision.
UTILITIES AND SERVICES
The site is within the jurisdiction of Clark County and is provided all municipal services, including police, fire and refuse garbage collection. All utilities are available to the site in adequate quality and quantity to service the highest and best use as if vacant and as improved.
FLOOD ZONE
According to flood hazard maps published by the Federal Emergency Management Agency (FEMA), the site is not in a 100-year flood zone, as indicated on Community Map Panel No. 2190.
89
ADJACENT PROPERTIES
The adjacent land uses are as follows:
North: Vegas Valley Drive/Residential Subdivision
South: Resort Casino/Apartments
East: Resort Casino
West: Sandhill Road/Tavern
SUMMARY AND NEIGHBORHOOD OVERVIEW
The site is within Clark County’s unincorporated township of “Sunrise Manor” and is designated for Commercial Tourist land use, or H-1 zoning, allowing limited resort or apartment development. This location provides convenient access to the I515/Boulder Highway Interchange and therefore is an excellent choice for multifamily residential development. Based upon the limited frontage or access on a high traffic street the retail potential of the site is minimal. This is an older section of the market with limited new development and therefore more likely to appeal to rental or entry-level residential condominiums. The current value of the site ranges from $15 to $16 per square foot or $5,227,200 to $5,575,680 based upon multifamily residential use.
90
Neighborhood Map

91
Comparables
ID |
| Parcel |
| Owner |
| Zoning |
| Sale Price |
| Sale Date |
| Acres |
| PSF |
| ||
1 |
| 16107801010 |
| BOULDER DESERT INN LLC |
| H-1 |
| $ | 3,300,000 |
| 200501 | * | 1.57 |
| $ | 14.83 |
|
2 |
| 16105201003 |
| SPRAVNY LLC |
| C-2 |
| $ | 605,000 |
| 200506 |
| 2.69 |
| $ | 5.16 |
|
3 |
| 16109217005 |
| G R B SGG LLC |
| C-2 |
| $ | 2,021,619 |
| 200505 |
| 5.46 |
| $ | 8.50 |
|
4 |
| 16108810063 |
| Q & C PROPERTIES LLC |
| C-1 |
| $ | 730,000 |
| 200510 |
| 1.01 |
| $ | 16.59 |
|
5 |
| 16109401006 |
| DESERT INN CROSSING LLC |
| C-1 |
| $ | 3,000,000 |
| 200602 |
| 4.27 |
| $ | 16.13 |
|
6 |
| 16201601020 |
| ASOOLINE DEVELOPMENT GROUP LLC |
| M-1 |
| $ | 599,000 |
| 200604 |
| 1.14 |
| $ | 12.06 |
|
7 |
| 16201601013 |
| GOUGH JOHN C & ANGELA M ETAL |
| H-1 |
| $ | 615,540 |
| 200608 | * | 1.84 |
| $ | 5.94 |
|

92
Fiesta Henderson

SITE SUMMARY
Physical Description |
|
Gross Site Area | +/- 15 Acres 653,400 Sq. Ft. |
Primary Road Frontage | Fiesta Henderson |
Secondary Road Frontage | US-95/93 |
Zoning District | C-T (Commercial Tourist) |
Flood Map Panel No. | 2595 |
Flood Zone | This Parcel is not in a 100-year flood zone |
Estimated Value | $8,494,000 to $9,801,000 |
Source: Various sources compiled by CBRE
94
LOCATION
The subject is on the south side of Fiesta Henderson Resort & Casino and along the eastern side of Interstate 515/US Highway 95/93.
ASSESSOR’S PARCEL NUMBER
The Clark County Tax Assessor’s parcel for the property is: 178-13-301-014
SHAPE AND FRONTAGE
The shape is generally rectangular and has adequate frontage along one primary thoroughfare within the neighborhood.
INGRESS/EGRESS
Ingress and Egress is available to the current site via Fiesta Henderson Boulevard.
SOILS
A soil analysis for the site has not been provided for the preparation of this valuation. In the absence of a soil report, it is a specific assumption that the site has adequate soils to support the highest and best use.
EASEMENTS AND ENCROACHMENTS
A title policy for the property has not been provided for the preparation of this valuation. It is recommended that the client/reader obtain a current title policy outlining all easements and encroachments on the property, if any, prior to making a business decision.
UTILITIES AND SERVICES
The site is within the jurisdiction of the City of Henderson and is provided all municipal services, including police, fire and refuse garbage collection. All utilities are available to the site in adequate quality and quantity to service the highest and best use as if vacant and as improved.
FLOOD ZONE
According to flood hazard maps published by the Federal Emergency Management Agency (FEMA), the site is not in a 100-year flood zone.
95
ADJACENT PROPERTIES
The adjacent land uses are as follows:
North: Interstate 215/Landwell property
South: Union Pacific Railroad/Residential Subdivision
East: Residential Subdivision
West: Interstate 515/US Highway 93/95
SUMMARY AND NEIGHBORHOOD OVERVIEW
This site is located within the City of Henderson’s downtown redevelopment area and is designated for tourist commercial use. The exposure to the site is good with the west border of the site, the I-515, and the Lake Mead Drive arterial to the north. There are new retail super-centers proposed within the historical industrial area next to the intersection of the US-93/95 and the Lake Mead arterial. The likely use of this site will be some higher density residential use, similar to the proposed use of a +/-9.19 acre site identified as comparable #1 (to follow), which has frontage along Lake Mead Drive. The access to the subject will be from Fiesta Henderson Blvd. and will possibly meet some resistance from existing residents to the south of the site. The current value of the site is $13 to $16 per square foot ($8,494,200 to $10,454,400), which will likely be developed as rental or entry-level residential.
96
Neighborhood Map

97
Comparables
ID |
| Parcel |
| Owner |
| Zoning |
| Sale Price |
| Sale Date |
| Acres |
| PSF |
| ||
1 |
| 17813301012 |
| SOUTHLAND-RDS LLC |
| CC |
| $ | 7,600,000 |
| 200604 |
| 9.19 |
| $ | 18.98 |
|
2 |
| 17813717011 |
| BRAELYNN LAND L L C |
| CH |
| $ | 1,571,494 |
| 200606 |
| 1.89 |
| $ | 19.09 |
|
3 |
| 17815310004 |
| STEPHANIE215 L L C |
| CC |
| $ | 1,900,000 |
| 200606 |
| 1.75 |
| $ | 24.92 |
|
4 |
| 17815310005 |
| L V M B BABCOCK & BROWN HOLDINGS |
| CM |
| $ | 11,500,000 |
| 200610 |
| 10.31 |
| $ | 25.61 |
|
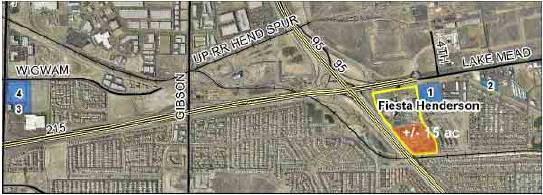
98
Red Rock

SITE SUMMARY
Physical Description |
|
Gross Site Area | 8.2 Acres 357,192 Sq. Ft. |
Primary Road Frontage | Summerlin Centre |
Secondary Road Frontage | Pavilion Center |
Zoning District | H-1 (Limited Resort and Apartment) |
Flood Map Panel No. | 2150 |
Flood Zone | This Parcel is not in a 100-year flood zone |
Estimated Value | $21,431,520 to $26,789,400 |
Source: Various sources compiled by CBRE
100
LOCATION
The subject is on the north side of Summerlin Centre and along the western side of Pavilion Center.
ASSESSOR’S PARCEL NUMBER
The Clark County Tax Assessor’s parcel numbers for the property are: 164-01-111-008 & 164-01-210-003
SHAPE AND FRONTAGE
The property has an irregular shape and fronts two streets that will provide prominent exposure to the future “Shoppes at Summerlin” to be developed by General Growth.
INGRESS/EGRESS
Ingress and Egress is available to the current site via Summerlin Center on the south side and Pavilion Centre on the east side.
SOILS
A soil analysis for the site has not been provided for the preparation of this valuation. In the absence of a soil report, it is a specific assumption that the site has adequate soils to support the highest and best use.
EASEMENTS AND ENCROACHMENTS
A title policy for the property has not been provided for the preparation of this valuation. It is recommended that the client/reader obtain a current title policy outlining all easements and encroachments on the property, if any, prior to making a business decision.
UTILITIES AND SERVICES
The site is within the jurisdiction of Clark County and is provided all municipal services, including police, fire and refuse garbage collection. All utilities are available to the site in adequate quality and quantity to service the highest and best use as if vacant and as improved.
FLOOD ZONE
According to flood hazard maps published by the Federal Emergency Management Agency (FEMA), the site is not in a 100-year flood zone, as indicated on Community Map Panel No. 2150.
101
ADJACENT PROPERTIES
The adjacent land uses are as follows:
North: Resort Casino/West Charleston Blvd
South: Summerlin Centre/Vacant land
East: Pavilion Centre/Vacant Land
West: Interstate 215
SUMMARY AND NEIGHBORHOOD OVERVIEW
The subject property is located at the southeast corner of the Red Rock Station Casino Resort in the master planned community of “Summerlin,” originally developed by Howard Hughes Properties and most recently purchased by General Growth. This location is at the heart of what will be a regional retail mall and professional business center. The neighborhood is accessed by I-215 on the west and by Charleston Boulevard to the north which is the direct access to the Red Rock Conservation Area, internationally recognized for its natural and cultural resources a well as a variety of outdoor activities including hiking, mountain biking, and rock climbing.
Summerlin has an extremely successful track record as America’s best selling master-planned community during ten of the past eleven years.
Due to the cache of the neighborhood and the potential for a mixed-use development at this site, the current value of this property is estimated to be $60 to $75 per square foot ($21,431,520 to $26,789,400). There is a possible premium due to the unique area, although currently this is a segment of the local market that has decelerated over the past year.
102
Neighborhood Map

103
Comparables
ID |
| Parcel |
| Owner |
| Zoning |
| Sale Price |
| Sale Date |
| Acres |
| PSF |
| ||
1 |
| 16413212006 |
| HOG CREEK INC NEVADA C V S |
| C-2 |
| $ | 899,652 |
| 200505 |
| 0.57 |
| $ | 36.23 |
|
2 |
| 16318101037 |
| PARMACY LLC |
| C-2 |
| $ | 1,750,000 |
| 200606 |
| 1.76 |
| $ | 22.83 |
|
3 |
| 16402510003 |
| WEST CHARLESTON LOFTS III LLC |
| C-2 |
| $ | 14,468,890 |
| 200610 |
| 13.84 |
| $ | 24.00 |
|
4 |
| 16402611003 |
| PN II INC |
| C-2 |
| $ | 25,460,000 |
| 200605 |
| 18.40 |
| $ | 31.77 |
|
5 |
| 16413212010 |
| G M D T C D LLC |
| C-2 |
| $ | 540,960 |
| 200508 |
| 0.41 |
| $ | 30.29 |
|
6 |
| 16413212015 |
| ADAMAR LLC |
| C-2 |
| $ | 780,040 |
| 200607 |
| 0.61 |
| $ | 29.36 |
|

104
Sunset

SITE SUMMARY
Physical Description |
|
Gross Site Area | 5.0 Acres 217,800 Sq. Ft. |
Primary Road Frontage | Stephanie Street |
Secondary Road Frontage | Sunset Road |
Zoning District | CT (Commercial Tourist) |
Flood Map Panel No. | 2583, 2595 |
Flood Zone | This Parcel is not in a 100-year flood zone |
Estimated Value | $8,712,000 to $9,147,600 |
Source: Various sources compiled by CBRE
106
LOCATION
The subject is on the north side of Interstate 215 and in close proximity to Losee Road.
ASSESSOR’S PARCEL NUMBER
The Clark County Tax Assessor’s parcel number for the property is: 178-03-310-021
SHAPE AND FRONTAGE
The shape is generally rectangular and minimal frontage along one primary thoroughfare within the neighborhood.
INGRESS/EGRESS
Ingress and Egress is available to the current site via many streets that surround the property, due to cross-easements between retail and office improvements and the Sunset Station casino Resort. Primary access is available from Stephanie Street and Sunset Road.
SOILS
A soil analysis for the site has not been provided for the preparation of this valuation. In the absence of a soil report, it is a specific assumption that the site has adequate soils to support the highest and best use.
EASEMENTS AND ENCROACHMENTS
A title policy for the property has not been provided for the preparation of this valuation. It is recommended that the client/reader obtain a current title policy outlining all easements and encroachments on the property, if any, prior to making a business decision.
UTILITIES AND SERVICES
The site is within the jurisdiction of the City of Henderson and is provided all municipal services, including police, fire and refuse garbage collection. All utilities are available to the site in adequate quality and quantity to service the highest and best use as if vacant and as improved.
FLOOD ZONE
According to flood hazard maps published by the Federal Emergency Management Agency (FEMA), the site is not in a 100-year flood zone, as indicated on Community Map Panel Nos. 2583 and 2595.
107
ADJACENT PROPERTIES
The adjacent land uses are as follows:
North: Galleria Mall (Retail)
South: Galleria Commons (Retail)
East: Crossroads at Sunset (Retail)
West: Sunset Station Casino Resort
SUMMARY AND NEIGHBORHOOD OVERVIEW
The subject property is located within the master planned community of Green Valley — Henderson, near the regional retail super-center area associated with the Galleria Mall and the Sunset Station Casino Resort. Although the site lacks substantial frontage along the major arterials of Sunset Road and Stephanie Street, it benefits from good access and visibility, and existing improvements including paving, curb, utilities, and landscaping. With the existing improvement, the site is currently valued at $40 to $42 per square foot or $8,712,000 to $9,147,600 due to the prominent location within the neighborhood. There is also a possibility that a premium may be achieved by a mixed-use of retail and residential uses, however this is currently a less aggressive buyer in the local market.
108
Neighborhood Map

109
Comparables
ID |
| Parcel |
| Owner |
| Zoning |
| Sale Price |
| Sale Date |
| Acres |
| PSF |
| ||
1 |
| 16128401003 |
| CHUBBS LLC |
| R-E |
| $ | 1,988,500 |
| 200608 |
| 2.43 |
| $ | 18.79 |
|
2 |
| 16128401012 |
| CENTRA RUSSELL LLC |
| C-2 |
| $ | 3,950,000 |
| 200607 |
| 6.79 |
| $ | 13.35 |
|
3 |
| 17803411008 |
| MARKS/SANDHURST LLC |
| CC |
| $ | 4,125,000 |
| 200602 |
| 3.50 |
| $ | 27.06 |
|
4 |
| 17816511007 |
| C F T DEVELOPMENTS LLC |
| CC |
| $ | 1,675,000 |
| 200512 |
| 1.38 |
| $ | 27.86 |
|
5 |
| 17815310004 |
| STEPHANIE 215 LLC |
| CC |
| $ | 1,900,000 |
| 200606 |
| 1.75 |
| $ | 24.92 |
|
6 |
| 17815310005 |
| L V M B BABCOCK & BROWN HOLDINGS |
| CM |
| $ | 11,500,000 |
| 200610 |
| 10.31 |
| $ | 25.61 |
|
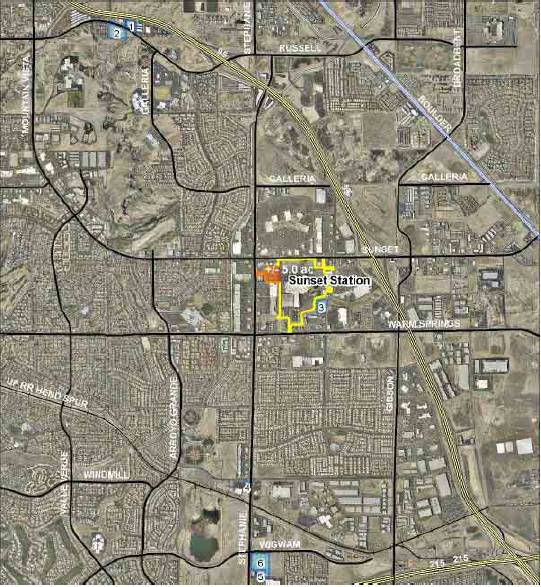
110
Thunder Valley
Thunder Valley

SITE SUMMARY
Physical Description |
|
Gross Site Area | ±188 Acres (8 Parcels) |
Primary Road Frontage | Athens Avenue |
Secondary Road Frontage | Sparta Court |
Zoning District | INP-DC (Industrial Park) |
Flood Map Panel No. | 0602390411F dated 6/8/98 |
Flood Zone | X |
Estimated Value | $31,602,780 to $40,946,400 |
Source: Various sources compiled by CBRE
112
LOCATION
The subject is on the south side of Athens Avenue, west of Industrial Avenue and west of Hwy 65.
ASSESSOR’S PARCEL NUMBER
The Placer County Tax Assessor’s parcel numbers for the property are:
017-061-038 (±50.0 Acres) 017-061-084 (±5.7 Acres)
017-061-085 (±6.3 Acres) 017-061-086 (±6.3 Acres)
017-061-087 (±5.5 Acres) 017-061-089 (±11.9 Acres)
017-061-088 (±12.3 Acres)
SHAPE AND FRONTAGE
The shape of APN #’s 017-061-084 thru 089 are rectangular, bound by Union Pacific Rail to the east, Ultra Power to the south, Athens Avenue to the north and Sparta Court to the west. The shape of APN #017-061-038 is rectangular, bound by Ultra Power and Pasquetti Asphalt to the south, Sparta Court to the east, Athens Avenue to the north and vacant land to the west. The shape of APN #017-061-072 is highly irregular, bound by Formica Corporation to the south, Ultra Power and Pasquetti Asphalt to the north and east, and vacant land to the west.
INGRESS/EGRESS
Ingress and egress is available to the current site via:
· Hwy 65/Twelve Bridges Interchange
· Hwy 65/Sunset Boulevard Interchange
· Industrial Avenue to Athens Avenue and the new “Foothills Boulevard” extension. Current, primary access requires crossing the Union Pacific Rail Line.
SOILS
A soil analysis for the site has not been provided for the preparation of this valuation. In the absence of a soil report, it is a specific assumption that the site has adequate soils to support the highest and best use.
113
EASEMENTS AND ENCROACHMENTS
A title policy for the property has not been provided for the preparation of this valuation. It is recommended that the client/reader obtain a current title policy outlining all easements and encroachments on the property, if any, prior to making a business decision. It is anticipated that the future Placer Parkway Expressway will significantly impact the southern portion of APN #017-061-072.
UTILITIES AND SERVICES
The site is within the jurisdiction of Placer County. The area is deficient specific to current utilities, greatly limiting new development in the area. Short and long term infrastructure plans by Placer County and the City of Lincoln should bring appropriate sewer, water, and power within the next five years to develop the property to its highest and best use.
FLOOD ZONE
According to flood hazard maps published by the Federal Emergency Management Agency (FEMA), the site is within Zone X, as indicated on Community Map Panel No. 0602390411F dated June 8, 1998.
FEMA Zone X: Area determined to be outside the 500-year flood plain.
ADJACENT PROPERTIES
The adjacent land uses are as follows:
North: Athens Avenue and Thunder Valley Casino
South: Ultra Power, Pasquetti Asphalt and Formica Corporation
East: Union Pacific Railroad/Industrial Avenue
West: Vacant Land
SUMMARY
The property is located within an area of transition. Most of the land to the south is built out. Future development in South Placer will most certainly favor the property area, subject to the installation of utility services. The ±2,200 acre Placer Ranch project will have the greatest impact on the surrounding area. Placer County envisions the area as its primary opportunity to create job growth and employment.
114
Neighborhood Analysis

NEIGHBORHOOD OVERVIEW
The surrounding area is primarily industrial. To the south is Placer County’s Sunset Industrial Area, which is South Placer’s primary employment base for manufacturing and light industrial business.
To the southwest sits a ±2,200 acre site (Placer Ranch) earmarked as a master-planned community that will include industrial, office, retail, and single-family housing uses. Placer Ranch is also expected to provide a site for a new California State University Campus. Also in the immediate area exists an active landfill and multiple concrete batch plants.
The City of Lincoln, with a newer Del Webb Retirement Community, is immediately north of the subject property, while the cities of Roseville & Rocklin to the south are driving the newest development.
115
COMPS
Location |
| Size |
| Total Sales Price |
| PSF Price |
| Sale Date |
| ||
Athens Road, Placer County, APN #017-061-072 |
| ±90.0 Acres |
| $ | 4,000,000 |
| $ | 1.02 |
| Sept-03 |
|
Athens Avenue, Lincoln, CA, Parcel A |
| ±50.0 Acres |
| $ | 2,200,000 |
| $ | 1.01 |
| Oct-02 |
|
Athens Avenue, Lincoln, CA, Parcel B |
| ±48.0 Acres |
| $ | 2,500,000 |
| $ | 1.20 |
| Oct-02 |
|
2121 Athens Avenue, Lincoln, CA |
| ±79.0 Acres |
| $ | 2,750,000 |
| $ | 0.80 |
| Oct-02 |
|
Athens Avenue, Placer County, Parcel 2 |
| ±328.2 Acres |
| $ | 2,380,000 |
| $ | 0.16 |
| Jun-02 |
|
Athens Avenue, Rocklin |
| ±33.8 Acres |
| $ | 1,840,410 |
| $ | 1.25 |
| Dec-01 |
|
017-210-039 Nichols Drive, Sunset Industrial Park |
| ±1.80 acres |
| $ | 271,292 |
| ±$3.46 |
| Jan-01 |
| |
017-210-040 Nichols Drive, Sunset Industrial Park |
| ±1.90 acres |
| $ | 286,363 |
| ±$3.46 |
| Jan-01 |
| |
1575 Nichols Drive, Rocklin, APN 017-210-036 |
| ±1.70 acres |
| $ | 500,000 |
| ±$6.75 |
| Sep-04 |
| |
4100 Cincinnati Avenue, Rocklin, APNs 017-210-002 |
| ±7.50 acres |
| $ | 1,062,000 |
| $ | 3.25 |
| Mar-04 |
|
Cincinnati Avenue, Rocklin, APN 017- 070-052 |
| ±2.00 acres |
| $ | 575,000 |
| $ | 6.60 |
| Dec-04 |
|
Cincinnati Avenue, Rocklin, APN 017- 200-010 |
| ±5.00 acres |
| $ | 1,060,000 |
| ±$4.87 |
| Dec-04 |
| |
Cincinnati Avenue, Rocklin, APNs 017-210-029 & 030 |
| ±15.00 acres |
| $ | 1,940,000 |
| $ | 2.97 |
| Jan-04 |
|
Nichols Drive, Rocklin, A portion of APN #017-061-060 |
| ±35.00 acres |
| $ | 4,200,000 |
| $ | 2.75 |
| May-05 |
|
116
Land Valuation Summary
Estimated Value of Land Held for Development
|
| Date |
| Original |
|
|
| CBRE ESTIMATES ($ in millions) |
| ||||
Location |
| Purchased |
| Cost |
| Acres |
| Low |
| High |
| ||
Potential Development Opportunities/Excess Land |
|
|
|
|
|
|
|
|
|
|
| ||
1) Aliante (1) |
| 06/2005 |
| 13.7 |
| 40.68 |
| $ | 50,850,000 |
| $ | 61,020,000 |
|
2) Cactus |
| 05/2004 |
| 45.7 |
| 60.7 |
| $ | 151,750,000 |
| $ | 182,100,000 |
|
3) Castaways |
| 10/2004 |
| 33.7 |
| 25.9 |
| $ | 19,395,000 |
| $ | 32,325,000 |
|
4) Durango |
| 04/2003 |
| 30.8 |
| 67.0 |
| $ | 167,500,000 |
| $ | 201,000,000 |
|
5) Flamingo |
| 11/2000 |
| 42.0 |
| 49.0 |
| $ | 122,500,000 |
| $ | 196,000,000 |
|
6) Losee (1) |
| 10/2005 |
| 47.3 |
| 54.0 |
| $ | 14,701,500 |
| $ | 15,289,560 |
|
7) Sunset/Lindell |
| 07/2006 |
| 12.1 |
| 12.0 |
| $ | 12,000,000 |
| $ | 12,000,000 |
|
8) Wild Wild West (2) |
| various |
| 150.4 |
| 69.3 |
| $ | 346,500,000 |
| $ | 485,100,000 |
|
9) Reno Bayer (3) |
| 09/2007 |
| 47.7 |
| 92.7 |
| $ | 51,433,001 |
| $ | 53,449,982 |
|
10) Reno Convention Center (3) |
| 02/2007 |
| 14.0 |
| 7.8 |
| $ | 8,640,125 |
| $ | 9,331,335 |
|
11) Graton |
| 08/2005 |
|
|
| 23.0 |
| $ | 13,605,530 |
| $ | 15,529,140 |
|
|
|
|
|
|
|
|
|
|
|
|
| ||
Excess Land at Existing Properties |
|
|
|
|
|
|
|
|
|
|
| ||
12) Boulder |
| 03/2005 |
| 4.2 |
| 8.0 |
| $ | 5,227,200 |
| $ | 5,575,680 |
|
13) Fiesta Henderson |
| 01/2001 |
| 3.0 |
| 15.0 |
| $ | 8,494,200 |
| $ | 9,801,000 |
|
14) Palace Station (4) |
| various |
|
|
| 52.0 |
| $ | 130,000,000 |
| $ | 182,000,000 |
|
15) Red Rock |
| 04/2003 |
| 7.9 |
| 8.2 |
| $ | 21,431,520 |
| $ | 26,789,400 |
|
16) Sunset |
| 09/1995 |
| 1.7 |
| 5.0 |
| $ | 8,712,000 |
| $ | 9,147,600 |
|
17) Thunder Valley |
| 09/2003 |
| 8.9 |
| 188.0 |
| $ | 31,602,780 |
| $ | 40,946,400 |
|
|
|
|
|
|
|
|
|
|
|
|
| ||
Total |
|
|
|
|
|
|
| $ | 1,113,492,856.0 |
| $ | 1,476,385,097.0 |
|
(1) Land included in Aliante JV of which Station owns 50%. Values listed are 50% of the overall site value
(2) Cost includes $36 million to be spent to purchase the 19 acres currently leased.
(3) Parcels to be purchased in the future based on current option agreements.
(4) Land included in Rancho Road LLC of which Station owns 50%. Values listed are 50% of the overall site value
CONFIDENTIAL
118