As filed with the Securities and Exchange Commission on February 18, 2009.
| | Registration No. 333-________ |
| U.S. SECURITIES AND EXCHANGE COMMISSION |
| WASHINGTON, D.C. 20549 |
| |
| FORM N-14 |
| |
| REGISTRATION STATEMENT UNDER THE SECURITIES ACT OF 1933 [X] |
| |
| [ ] Pre-Effective Amendment No. |
| [ ] Post-Effective Amendment No. |
| |
| PRINCIPAL FUNDS, INC. |
| f/k/a Principal Investors Fund, Inc. |
| (Exact name of Registrant as specified in charter) |
| |
| 680 8th Street, Des Moines, Iowa 50392-2080 |
| (Address of Registrant's Principal Executive Offices) |
| |
| 515-248-3842 |
| (Registrant's Telephone Number, Including Area Code) |
| |
| Michael D. Roughton |
| Counsel, Principal Funds, Inc. |
| 711 High Street, Suite 405 West |
| Des Moines, Iowa 50392-2080 |
| (Name and Address of Agent for Service) |
| |
| Copies of all communications to: |
| | John W. Blouch |
| Dykema Gossett PLLC |
| | 1300 I Street, N.W. |
| | Washington, D.C. 20005-3353 |
| | 202-906-8714; 202-906-8669 (Fax) |
| Approximate date of proposed public offering: As soon as practicable after this Registration Statement |
| becomes effective. |
| |
| Title of Securities Being Registered: Class R-1, Class R-2, Class R-3, Class R-4, Class R-5 and Institutional |
| Class Shares common stock, par value $.01 per share. |
| |
| No filing fee is due because an indefinite number of shares have been registered in reliance on Section 24(f) |
| under the Investment Company Act of 1940, as amended. |
| |
| It is proposed that this filing will become effective on March 20, 2009, pursuant to Rule 488. |
| PRINCIPAL FUNDS, INC. |
| 680 8th Street |
| Des Moines, Iowa 50392-2080 |
Dear Shareholder:
A Special Meeting of Shareholders of Principal Funds, Inc. (“PFI”) will be held at 680 8th Street, Des Moines, Iowa 50392-2080, on April 27, 2009 at 10 a.m., Central Time.
At the meeting, shareholders of the MidCap Growth Fund II (the “Acquired Fund”) will be asked to consider and approve a Plan of Acquisition (the “Plan”) providing for the reorganization of the MidCap Growth Fund II into the MidCap Growth Fund III (the “Acquiring Fund”). Each of these Funds is a separate series or fund of PFI.
Under the Plan: (i) the Acquiring Fund will acquire all the assets, subject to all the liabilities, of the Acquired Fund in exchange for shares of the Acquiring Fund; (ii) the Acquiring Fund shares will be distributed to the shareholders of the Acquired Fund; and (iii) the Acquired Fund will liquidate and terminate (the “Reorganization”). As a result of the Reorganization, each shareholder of the Acquired Fund will become a shareholder of the Acquiring Fund. The total value of all shares of the Acquiring Fund issued in the Reorganization will equal the total value of the net assets of the Acquired Fund. The number of full and fractional shares of the Acquiring Fund received by a shareholder of the Acquired Fund will be equal in value to the value of that shareholder’s shares of the Acquired Fund as of the close of regularly scheduled trading on the New York Stock Exchange (“NYSE”) on the closing date of the Reorganization. Holders of Class R-1, Class R-2, Class R-3, Class R-4, Class R-5 and Institutional Class shares of the Acquired Fund will receive, respectively, Class R-1, Class R-2, Class R-3, Class R-4, Class R-5 and Institutional Class shares of the Acquiring Fund. The Reorganization is expected to occur as of the close of regularly scheduled trading on the NYSE on May 1, 2009. All share classes of the Acquired Fund will vote in the aggregate and not by class with respect to the Reorganization.
The Board of Directors of PFI believes that the Reorganization will serve the best interests of shareholders of both the Acquired and Acquiring Funds. The Funds have the same investment objectives in that both Funds seek to provide long-term growth of capital. The Funds also have substantially the same principal policies and risks in that both invest in midcap growth securities. The Acquiring Fund has lower advisory fee rates on assets over $500 million and lower overall expense ratios than the Acquired Fund. Further, the Acquiring Fund has outperformed the Acquired Fund for each of the last two calendar years. Moreover, because the Acquiring Fund is much
larger than the Acquired Fund, the Reorganization may be expected to afford shareholders of the Acquired Fund on an ongoing basis greater prospects for growth and efficient management. Combining the Funds will not result in any dilution of the interests of existing shareholders of the Funds.
The value of your investment will not be affected by the Reorganization. Furthermore, in the opinion of legal counsel, no gain or loss will be recognized by any shareholder for federal income tax purposes as a result of the Reorganization.
Enclosed you will find a Notice of Special Meeting of Shareholders, a Proxy Statement/Prospectus, and a proxy card for shares of the Acquired Fund you owned as of February 27, 2009, the record date for the Meeting. The Proxy Statement/Prospectus provides background information and describes in detail the matters to be voted on at the Meeting.
The Board of Directors has unanimously voted in favor of the proposed Reorganization and recommends that you vote FOR the Proposal.
In order for shares to be voted at the Meeting, we urge you to read the Proxy Statement/Prospectus and then complete and mail your proxy card(s) in the enclosed postage-paid envelope, allowing sufficient time for receipt by us by April 26, 2009. As a convenience, we offer three options by which to vote your shares:
By Internet: Follow the instructions located on your proxy card.
By Phone: The phone number is located on your proxy card. Be sure you have your control number, as printed on your proxy card, available at the time you call.
By Mail: Sign your proxy card and enclose it in the postage-paid envelope provided in this proxy package.
We appreciate your taking the time to respond to this important matter. Your vote is important. If you have any questions regarding the Reorganization, please call our shareholder services department toll free at 1-800-222-5852.

| PRINCIPAL FUNDS, INC. |
| 680 8th Street |
| Des Moines, Iowa 50392-2080 |
|
| NOTICE OF SPECIAL MEETING OF SHAREHOLDERS |
To the Shareholders of the MidCap Growth Fund II:
Notice is hereby given that a Special Meeting of Shareholders (the “Meeting”) of the MidCap Growth Fund II, a separate series of Principal Funds, Inc. (“PFI”), will be held at 680 8th Street, Des Moines, Iowa 50392-2080, on April 27, 2009 at 10 a.m., Central Time. A Proxy Statement/ Prospectus providing information about the following proposal to be voted on at the Meeting is included with this notice. The Meeting is being held to consider and vote on such proposal as well as any other business that may properly come before the Meeting or any adjournment thereof:
| Proposal: | Approval of a Plan of Acquisition providing for the |
| | reorganization of the MidCap Growth Fund II (the “Fund”) |
| | into the MidCap Growth Fund III. |
The Board of Directors of PFI recommends that shareholders of the Fund vote FOR the Proposal.
Approval of the Proposal will require the affirmative vote of the holders of at least a “Majority of the Outstanding Voting Securities” (as defined in the accompanying Proxy Statement/Prospectus) of the Fund.
Each shareholder of record at the close of business on February 27, 2009 is entitled to receive notice of and to vote at the Meeting.
Please read the attached Proxy Statement/Prospectus.
| By order of the Board of Directors |
| |
| Nora M. Everett |
| President |
__________, 2009
Des Moines, Iowa |
| PRINCIPAL FUNDS, INC. |
| 680 8th Street |
| Des Moines, Iowa 50392-2080 |
| ————————— |
| PROXY STATEMENT/PROSPECTUS |
| SPECIAL MEETING OF SHAREHOLDERS |
| TO BE HELD APRIL 27, 2009 |
| RELATING TO THE REORGANIZATION OF: |
| THE MIDCAP GROWTH FUND II INTO |
| THE MIDCAP GROWTH FUND III |
This Proxy Statement/Prospectus is furnished in connection with the solicitation by the Board of Directors (the “Board” or “Directors”) of Principal Funds, Inc. (“PFI”) of proxies to be used at a Special Meeting of Shareholders of PFI to be held at 680 8th Street, Des Moines, Iowa 50392-2080, on April 27, 2009, at 10 a.m., Central Time (the “Meeting”).
At the Meeting, shareholders of the MidCap Growth Fund II (the “Acquired Fund”) will be asked to consider and approve a proposed Plan of Acquisition (the “Plan”) providing for the reorganization of the Acquired Fund into the MidCap Growth Fund III (the “Acquiring Fund”).
Under the Plan: (i) the Acquiring Fund will acquire all the assets, subject to all the liabilities of the Acquired Fund in exchange for shares of the Acquiring Fund; (ii) the Acquiring Fund shares will be distributed to the Shareholders of the Acquired Fund; and (iii) the Acquired Fund will liquidate and terminate (the “Reorganization”). As a result of the Reorganization, each shareholder of the Acquired Fund will become a shareholder of the Acquiring Fund. The total value of all shares of the Acquiring Fund issued in the Reorganization will equal the total value of the net assets of the Acquired Fund. The number of full and fractional shares of the Acquiring Fund received by a shareholder of the Acquired Fund will be equal in value to the value of that shareholder’s shares of the Acquired Fund as of the close of regularly scheduled trading on the New York Stock Exchange (“NYSE”) on the closing date of the Reorganization. Holders of Class R-1, Class R-2, Class R-3, Class R-4, Class R-5 and Institutional Class shares will receive, respectively, Class R-1, Class R-2, Class R-3, Class R-4, Class R-5 and Institutional Class shares of the Acquiring Fund. If approved by shareholders of the Acquired Fund, the Reorganization is expected to occur immediately after the close of regularly scheduled trading on the NYSE on May 1, 2009 (the “Effective Time”). All share classes of the Acquired Fund will vote in the aggregate and not by class. The terms and conditions of the Reorganization are more fully described below in this Proxy Statement/Prospectus and the Form of Plan of Acquisition which is attached hereto as Appendix A.
This Proxy Statement/Prospectus contains information shareholders should know before voting on the Reorganization. Please read it carefully and retain it for future reference. The Annual and Semi-Annual Reports to
Shareholders of PFI contain additional information about the investments of the Acquired and Acquiring Funds, and the Annual Report contains discussions of the market conditions and investment strategies that significantly affected these Funds during the fiscal year ended October 31, 2008. Copies of these reports may be obtained at no charge by calling our shareholder services department toll free at 1-800-247-4123.
A Statement of Additional Information dated March 1, 2009 (the “Statement of Additional Information”) relating to this Proxy Statement/ Prospectus has been filed with the Securities and Exchange Commission (“SEC”) and is incorporated by reference into this Proxy Statement/ Prospectus. PFI’s Prospectus, dated March 1, 2009 and as supplemented (“PFI Prospectus”), and the Statement of Additional Information for PFI, dated March 1, 2009 and as supplemented (“PFI SAI”), have been filed with the SEC and, insofar as they relate to the MidCap Growth Fund II, are incorporated by reference into this Proxy Statement/Prospectus. Copies of these documents may be obtained without charge by writing to PFI at the address noted above or by calling our shareholder services department toll free at 1-800-222-5852. You may also call our shareholder services department toll fee at 1-800-222-5852 if you have any questions regarding the Reorganization.
PFI is subject to the informational requirements of the Securities Exchange Act of 1934 and the Investment Company Act of 1940 (the “1940 Act”) and files reports, proxy materials and other information with the SEC. Such reports, proxy materials and other information may be inspected and copied at the Public Reference Room of the SEC at 100 F Street, N.E., Washington, D.C. 20549 (information on the operation of the Public Reference Room may be obtained by calling the SEC at 1-202-551-5850). Such materials are also available on the SEC’s EDGAR Database on its Internet site at www.sec.gov, and copies may be obtained, after paying a duplicating fee, by email request addressed to publicinfo@sec.gov or by writing to the SEC’s Public Reference Room.
The SEC has not approved or disapproved these securities or passed upon the accuracy or adequacy of this Proxy Statement/Prospectus. Any representation to the contrary is a criminal offense.
The date of this Proxy Statement/Prospectus is __________, 2009.
2
| TABLE OF CONTENTS |
| | Page |
| |
| INTRODUCTION | 4 |
| THE REORGANIZATION | 5 |
| PROPOSAL: APPROVAL OF A PLAN OF ACQUISITION | |
| PROVIDING FOR THE REORGANIZATION OF | |
| THE MIDCAP GROWTH FUND II | |
| INTO THE MIDCAP GROWTH FUND III | 7 |
| Comparison of Acquired and Acquiring Funds | 7 |
| Comparison of Investment Objectives and Strategies | 13 |
| Fees and Expenses of the Funds | 13 |
| Comparison of Principal Investment Risks | 16 |
| Performance | 20 |
| INFORMATION ABOUT THE REORGANIZATION | 23 |
| Plan of Acquisition | 23 |
| Reasons for the Reorganization | 24 |
| Board Consideration of the Reorganization | 24 |
| Description of the Securities to Be Issued | 26 |
| Federal Income Tax Consequences | 26 |
| CAPITALIZATION | 28 |
| ADDITIONAL INFORMATION ABOUT THE FUNDS | 29 |
| Certain Investment Strategies and Related Risks of the Funds | 29 |
| Multiple Classes of Shares | 38 |
| Costs of Investing in the Funds | 38 |
| Distribution Plans and Additional Information Regarding | |
| Intermediary Compensation | 40 |
| Dividends and Distributions | 44 |
| Pricing of Fund Shares | 45 |
| Purchases, Redemptions, and Exchanges of Shares | 47 |
| Frequent Purchases and Redemptions | 49 |
| Tax Considerations | 50 |
| Portfolio Holdings Information | 51 |
| VOTING INFORMATION | 51 |
| OUTSTANDING SHARES AND SHARE OWNERSHIP | 53 |
| FINANCIAL HIGHLIGHTS | 54 |
| FINANCIAL STATEMENTS | 63 |
| LEGAL MATTERS | 63 |
| OTHER INFORMATION | 63 |
| APPENDIX A Form of Plan of Acquisition | A-1 |
| APPENDIX B Description of Indices | B-1 |
3
This Proxy Statement/Prospectus is being furnished to shareholders of the Acquired Fund to provide information regarding the Plan and the Reorganization.
Principal Funds, Inc. PFI is a Maryland corporation and an open-end management investment company registered with the SEC under the 1940 Act. PFI currently offers 72 separate series or funds (the “PFI Funds”), including the Acquired and Acquiring Funds. The sponsor of PFI is Principal Life Insurance Company (“Principal Life”), and the investment advisor to the PFI Funds is Principal Management Corporation (“PMC”). PFI has two underwriters: Principal Funds Distributor, Inc. (the “Distributor” or “PFD”) for all share classes, and Princor Financial Services Corporation (“Princor”), a co-distributor with PFD for Class R-1, Class R-2, Class R-3, Class R-4, Class R-5 (sometimes collectively referred to as the “Retirement Class”), Class J, and Institutional Class shares. Principal Life, an insurance company organized in 1879 under the laws of Iowa, PMC, PFD, and Princor are indirect, wholly-owned subsidiaries of Principal Financial Group, Inc. (“PFG”). Their address is the Principal Financial Group, Des Moines, Iowa 50392-2080.
Investment Management. Pursuant to an investment advisory agreement with PFI with respect to the Acquired and Acquiring Funds, PMC provides investment advisory services and certain corporate administrative services to the Funds. As permitted by the investment advisory agreement, PMC has entered into sub-advisory agreements with respect to the Acquired and Acquiring Funds as follows:
| Acquired Fund | Sub-Advisors |
| MidCap Growth Fund II | Jacobs Levy Equity Management, Inc. |
| (“Jacobs Levy”) |
| | MacKay Shields LLC. (“MacKay Shields”) |
| Acquiring Fund | Sub-Advisors |
| MidCap Growth Fund III | Mellon Capital Management Corporation |
| | (“Mellon Capital”) |
| | Turner Investment Partners, Inc. (“Turner”) |
PMC and each sub-advisor are registered with the SEC as investment advisors under the Investment Advisers Act of 1940.
Jacobs Levy is located at 100 Campus Drive, Florham Park, NJ 07932-0650.
MacKay Shields is located at 9 West 57th Street, New York, NY 10019. Mellon Capital is located at 500 Grant Street, Suite 4200, Pittsburgh, PA 15258. Mellon Capital is a wholly owned subsidiary of Mellon Financial Corporation.
Turner is located at 1205 Westlakes Drive, Suite 100, Berwyn, PA 19312.
4
At its meeting held on December 19, 2008, the Board, including all the Directors who are not “interested persons” (as defined in the 1940 Act) of PFI (the “Independent Directors”), approved the Reorganization pursuant to the Plan providing for the combination of the Acquired Fund into the Acquiring Fund. The Board concluded that the Reorganization is in the best interests of the Acquired Fund and the Acquiring Fund and that the interests of existing shareholders of the Funds will not be diluted as a result of the Reorganization. The factors that the Board considered in deciding to approve the Reorganization are discussed below under “Information About the Reorganization – Board Consideration of the Reorganization.”
The Reorganization contemplates: (i) the transfer of all the assets, subject to all of the liabilities, of the Acquired Fund to the Acquiring Fund in exchange for shares of the Acquiring Fund; (ii) the distribution to Acquired Fund shareholders of the Acquiring Fund shares; and (iii) the liquidation and termination of the Acquired Fund. As a result of the Reorganization, each shareholder of the Acquired Fund will become a shareholder of the Acquiring Fund. In the Reorganization, the Acquiring Fund will issue a number of shares with a total value equal to the total value of the net assets of the Acquired Fund, and each shareholder of the Acquired Fund will receive a number of full and fractional shares of the Acquiring Fund with a value equal to the value of that shareholder’s shares of the Acquired Fund, as of the close of regularly scheduled trading on the NYSE on the closing date of the Reorganization (the “Effective Time”). The closing date of the Reorganization is expected to be May 1, 2009. Holders of Class R-1, Class R-2, Class R-3, Class R-4, Class R-5 and Institutional Class shares of the Acquired Fund will receive, respectively, Class R-1, Class R-2, Class R-3, Class R-4, Class R-5 and Institutional Class shares of the Acquiring Fund. The terms and conditions of the Reorganization are more fully described below in this Proxy Statement/Prospectus and in the Form of Plan of Acquisition, which is attached hereto as Appendix A.
The Board of Directors of PFI believes that the Reorganization will serve the best interests of shareholders of both the Acquired and Acquiring Funds. The Funds have the same investment objectives in that both Funds seek to provide long-term growth of capital. The Funds also have substantially the same principal policies and risks in that both invest in midcap growth securities. The Acquiring Fund has lower advisory fee rates on assets over $500 million and lower overall expense ratios than the Acquired Fund. Further, the Acquiring Fund has outperformed the Acquired Fund for each of the last two calendar years. Moreover, because the Acquiring Fund is much larger than the Acquired Fund, the Reorganization may be expected to afford
5
shareholders of the Acquired Fund on an ongoing basis greater prospects for growth and efficient management. Combining the Funds will not result in any dilution of the interests of existing shareholders of the Funds.
In the opinion of legal counsel, the Reorganization will qualify as a tax-free reorganization and, for federal income tax purposes, no gain or loss will be recognized as a result of the Reorganization by the Acquired or Acquiring Fund shareholders. See “Information About the Reorganization – Federal Income Tax Consequences.”
The Reorganization will not result in any material change in the purchase and redemption procedures followed with respect to the distribution of shares. See “Additional Information About the Funds – Purchases, Redemptions and Exchanges of Shares.”
The Acquired Fund will pay all expenses and out-of-pocket fees incurred in connection with the Reorganization, including printing, mailing, and legal fees. These expenses and fees are expected to total $45,000.
6
PROPOSAL:
APPROVAL OF A PLAN OF ACQUISITION PROVIDING FOR THE REORGANIZATION OF THE
MIDCAP GROWTH FUND II
INTO THE MIDCAP GROWTH FUND III.
Shareholders of the MidCap Growth Fund II (the “Acquired Fund”) are being asked to approve the reorganization of the Acquired Fund into the MidCap Growth Fund III (the “Acquiring Fund.)
Comparison of Acquired and Acquiring Funds
The following table provides comparative information with respect to the Acquired and Acquiring Funds. The description below of the Acquiring Fund reflects of the appointment of Jacobs Levy as an additional sub-advisor to the Acquiring Fund and changes to its investment strategies to reflect Jacob Levy’s management style and the allocation of the Acquiring Fund’s assets between two sub-advisors. The appointment of Jacobs Levy as an additional sub-advisor and these changes in investment strategies will become effective at the Effective Time of the Reorganization.
| MidCap Growth Fund II | | | MidCap Growth Fund III |
| (Acquired Fund) | | | (Acquiring Fund) |
| |
| Approximate Net Assets as of October 31, 2008: |
| $205,666,000 | | | $529,818,000 |
| |
| Investment Advisor: PMC |
| Sub-Advisors and Portfolio Managers: |
Jacobs Levy Bruce Jacobs, Ph.D. Dr. Jacobs | Mellon Capital Adam T. Logan, CFA. Joining the |
| serves as co-chief investment officer, | company in 1998, Mr. Logan is a |
| portfolio manager, and co-director of | portfolio manager and Vice President |
| research. Prior to co-founding Jacobs | of Mellon Capital. Previously, he |
| Levy in 1986, Dr. Jacobs was Senior | performed duties as a financial analyst |
| Managing Director of a quantitative | in Mellon Financial Corporation’s |
| equity management affiliate of the | corporate finance department. He is |
| Prudential Insurance Company of | currently responsible for the |
| America. Dr. Jacobs earned a BA from | management of client portfolios with a |
| Columbia College, an MS in | specific focus on mid and small |
| Operations Research and Computer | capitalization securities. He earned a |
| Science from Columbia University, an | BA in Finance from Westminster |
| MSIA from Carnegie Mellon | College and an MBA from the Katz |
| University, and an MA in Applied | Graduate School of Business at the |
7
Economics and a Ph.D. in Finance from the University of Pennsylvania’s Wharton School. Ken Levy, CFA. Mr. Levy serves as co-chief investment officer, portfolio manager, and co-director of research. Prior to co-founding Jacobs Levy in 1986, Mr. Levy was Managing Director of a quantitative equity management affiliate of the Prudential Insurance Company of America. He earned a BA in Economics from Cornell University and an MBA and an MA in Business Economics from the University of Pennsylvania’s Wharton School. He has earned the right to use the Chartered Financial Analyst designation.
MacKay Shields Robert J. Centrella, CFA. Mr. Centrella is a Managing Director Portfolio Manager/Research Analyst Equity Division and joined MacKay Shields in 1996 as a Portfolio Manager/Research Analyst in the Equity Division. He received a BS in Accounting from the University of Scranton and an MBA in Finance from George Mason University. He has earned the right to use the Chartered Financial Analyst designation. Edmund C. Spelman. Mr. Spelman Senior Managing Director and Head of the Growth Equity Division; he leads the Partners MidCap Growth Fund II investment team. Mr. Spelman has worked for MacKay Shields since 1991. Mr. Spelman earned a BA and an MS from the University of Pennsylvania. | | University of Pittsburgh. He has earned the right to use the Chartered Financial Analyst designation. John O’Toole, CFA. Joining the company in 1990, Mr. O’Toole is a Senior Vice President and a principal of Mellon Capital. Mr. O’Toole holds an MBA in Finance from the University of Chicago and a BA in Economics from the University of Pennsylvania. He has earned the right to use the Chartered Financial Analyst designation. Turner Tara R. Hedlund, CFA, CPA. Ms. Hedlund joined Turner in 2000. Previously, she was an audit engagement senior at Arthur Andersen LLP. She has been in investment management since 1995. She earned a BBS in Accountancy from Villanova University. She has earned the right to use the Chartered Financial Analyst designation. Christopher K. McHugh. Mr. McHugh, Vice President and Senior Portfolio Manager, joined Turner in 1990. Prior to joining Turner, he was a performance specialist at Provident Capital Management. He earned a BS in Accounting from Philadelphia University and an MBA in Finance from St. Joseph’s University. Jason D. Schrotberger, CFA. Mr. Schrotberger joined Turner in 2001. Previously, he was an investment analyst at BlackRock Financial Management. He has been in investment management since 1994. He earned a BA in Economics from Denison University and an MBA in Finance from the University of Illinois. He has earned the right to use the Chartered Financial Analyst designation. |
| |
8
| | Jacobs Levy (will become an additional sub-advisor as of the Effective Time.) Bruce Jacobs, Ph.D. Ken Levy, CFA. (See portfolio manager biographical profiles under Acquired Fund above.) |
Investment Objective:
Both Funds seek long-term growth of capital.
Principal Investment Strategies: Under normal market conditions, the Fund invests at least 80% of its assets in common stocks of companies with medium market capitalizations (those with market capitalizations similar to companies in the Russell Midcap Growth Index) (as of December 31, 2008, this range was between approximately $0.02 billion and $14.9 billion at the time of purchase). Market capitalization is defined as total current market value of a company’s outstanding common stock Companies may range from the well- established and well-known to the new and unseasoned. Jacobs Levy selects stocks using a growth oriented investment approach based on proprietary research that attempts to detect and take advantage of market inefficiencies. Its approach combines human insight and intuition, finance and behavioral theory, and quantitative and statistical methods in a proprietary process it refers to as “disentangling.” The disentangling process evaluates various market inefficiencies simultaneously, isolating each potential source of return. Jacobs Levy believes that disentangling provides more reliable predictions of future stock price behavior than simple single-factor | | The Fund invests primarily in common stocks and other equity securities of U.S. companies with strong earningsgrowth potential. Under normal market conditions, the Fund invests at least 80% of its net assets (plus any borrowings for investment purposes) in common stocks of companies with medium market capitalizations (those with market capitalizations similar to companies in the Russell Midcap Growth Index (as of December 31, 2008, this range was between approximately $0.02 billion and $14.9 billion). Market capitalization is defined as total current market value of a company’s outstanding common stock. The Fund may purchase securities issued as part of, or a short period after, companies’ initial public offerings (“IPOs”) and may at times dispose of those shares shortly after their acquisition. The Fund may invest up to 25% of its net assets in securities of foreign companies, including securities of issuers in emerging countries and securities quoted in foreign currencies. Turner invests the assets allocated to it in securities of companies that are diversified across economic sectors. It |
9
analyses. Security valuation entails sophisticated modeling of large numbers of stocks and proprietary factors based on reasonable, intuitive relationships. The firm examines a wide range of data, including balance sheets and income statements, analyst forecasts, corporate management signals, economic releases, and security prices. MacKay Shields invests in growth stocks by utilizing a bottom-up approach that combines time-tested fundamental multi-factor screens with hands-on fundamental research. MacKay Shields looks to capitalize on evolving growth trends while adhering to risk controls. As a result of its process, MacKay Shields seeks to invest primarily in companies with a history of increasing earnings and sales at a rate that is generally higher than that of average companies. MacKay Shields process leads to a diversified portfolio. The Fund may engage in the lending of portfolio securities and may invest in securities of foreign issuers. The Fund may also use various techniques, such as buying and selling exchange traded funds, to increase or decrease exposure to changing security prices or other factors that affect security value. MacKay Shields maintains a flexible approach toward investing in various types of companies as well as multiple types of securities, including common stocks, preferred stocks, warrants and other equity securities, depending upon the economic environment and the relative attractiveness of the various securities markets. MacKay Shields may invest in any securities that, in its judgment, are ready for a rise in price, or are expected to | | attempts to maintain sector concentrations that approximate those of its current benchmark, the Russell Midcap Growth Index. The Fund is not an index fund and does not limit its investment to the securities of issuers in the Russell Midcap Growth Index. Turner selects stocks that it believes have strong earnings growth potential. Turner invests assets allocated to it in companies with strong earnings dynamics, and sells those with deteriorating earnings prospects. Turner believes forecasts for market timing and sector rotation are unreliable and introduce an unacceptable level of risk. As a result, under normal market conditions, Turner’s portion of the Fund is fully invested. In the view of Mellon Capital, many medium-sized companies: • are in fast growing industries, • offer superior earnings growth potential, and • are characterized by strong balance sheets and high returns on equity.Mellon Capital may also hold assets allocated to it in investments in large and small capitalization companies,including emerging and cyclical growth companies. Mellon Capital uses valuation models designed to identify common stocks of companies that have demonstrated consistent earnings momentum and delivered superior results relative to market analyst expectations. Other considerations include profit margins, growth in cash flow and other standard balance sheet measures. Mellon Capital holds securities generally characterized by strong earnings momentum measures and higher expected earnings pershare growth. |
| |
| |
10
undergo an acceleration in growth of earnings. The latter could occur because of special factors, such as new management, new products, changes in consumer demand, and changes in the economy. MacKay Shields may sell a stock if the stock’s earnings growth rate decelerates, if its valuation is deemed too high in relation to its growth rate or to its peer group or if, in general, MacKay Shields does not believe that the security will help the Fund meet its investment objective. | | Mellon Capital’s valuation model incorporates information about the relevant criteria as of the most recent period for which data are available. Once ranked, the securities are categorized under the headings “buy,” “sell,” or “hold.” The decision to buy, sell or hold is made by Mellon Capital based primarily on output of the valuation model. However, that decision may be modified due to subsequently available or other specific relevant information about the security. In addition, Mellon Capital manages risk by diversifying across companies and industries, limiting the potential adverseimpact from any one stock or industry. Jacobs Levy selects stocks using a growth oriented investment approach based on proprietary research that attempts to detect and take advantage of market inefficiencies. Its approach combines human insight and intuition, finance and behavioral theory, and quantitative and statistical methods in a proprietary process it refers to as “disentangling.” The disentangling process evaluates various market inefficiencies simultaneously, isolating each potential source of return. Jacobs Levy believes that disentangling provides more reliable predictions of future stock price behavior than simple single-factor analyses. Security valuation entails sophisticated modeling of large numbers of stocks and proprietary factors based on reasonable, intuitive relationships. The firm examines a wide range of data, including balance sheets and income statements, analyst forecasts, corporate management signals, economic releases, and security prices. |
11
In July 2009, PMC will begin investing approximately 25% of the Acquiring Fund’s assets in common stocks in an attempt to match or exceed the performance of the Russell MidCap 2000 Growth Index. PMC’s strategy is an active quantitative approach to asset management which PMC refers to as “structured equity.” PMC’s structured equity strategy applies a risk-controlled investment process that slightly over/underweights individual stocks relative to their weight in the Russell 2000 Growth Index. Through the structured equity strategy, PMC expects the Fund to achieve returns in excess of those of the Russell 2000 Growth Index for performance with lower risk and improved predictability of returns for the entire Fund compared to the Russell 2000 Growth Index.
Cash Management Program
PMC has implemented a cash management program for Acquiring Fund. The Acquiring Fund has cash available in its portfolio to meet redemption requests and to pay expenses. Additionally, the Acquiring Fund receives cash flows when shareholders purchase shares. PMC will invest the cash, which comprises a very small portion of the funds’ portfolios, in money market investments and in stock index futures contracts based on the Fund’s market cap to gain exposure to the market. Stock index futures provide returns similar to those of common stocks. PMC believes that, over the long term, this strategy will enhance the investment performance of the Acquiring Fund.
Hedging and Other Strategies:
Each of the Funds may invest in inverse floating rate obligations, may engage in hedging transactions through the use of financial futures and options thereon and may also purchase and sell securities on a when-issued or forward commitment basis, invest in mortgage-backed securities, enter into repurchase agreements, invest in stand-by commitments, engage in swap agreements, and lend portfolio securities. Each of the Funds may invest in floating rate and variable rate obligations, including participation interests therein.
Temporary Defensive Investing:
For temporary defensive purposes in times of unusual or adverse market, economic, or political conditions, each Fund may invest up to 100% of its assets in cash and cash equivalents. In taking such defensive measures, either Fund may fail to achieve its investment objective.
Fundamental Investment Restrictions:
Each of the Funds is subject to the same fundamental investment restrictions which may not be changed without the approval of the shareholders of the Fund. These fundamental restrictions deal with such matters as the issuance of senior securities, purchasing or selling real estate or commodities, borrowing money, making loans, underwriting securities of
12
other issuers, diversification or concentration of investments, and short sales of securities. The fundamental investment restrictions of the Funds are described in the Statement of Additional Information.
Comparison of Investment Objectives and Strategies
The Funds have the same investment objectives in that both Funds seeks to provide long-term growth of capital. They also have substantially the same principal policies and risks in that both invest primarily in midcap growth securities. The Funds differ in that the Acquiring Fund but not the Acquired Fund participates in PMC’s cash management program, the Acquiring Fund gives greater emphasis to investing in initial public offerings and its investments in foreign securities may include those of emerging market issuers. Finally, as described above and beginning in July 2009, PMC is expected to begin to invest approximately 25% of the Acquiring Fund’s assets pursuant to its structured equity strategy.
The investment objective of each of the Funds may be changed by the Board without shareholder approval.
Additional information about the investment strategies and the types of securities in which the Funds may invest is discussed below under “Certain Investment Strategies and Related Risks of the Funds” as well as in the Statement of Additional Information.
The Statement of Additional Information provides further information about the portfolio manager(s) for each Fund, including information about compensation, other accounts managed and ownership of Fund shares.
| | Fees and Expenses of the Funds |
The tables below compare the fees and expenses of the shares of the Acquired and Acquiring Funds. In the Reorganization, the holders of Class R-1, Class R-2, Class R-3, Class R-4, Class R-5, and Institutional Class shares of the Acquired Fund will receive, respectively, Class R-1, Class R-2, Class R-3, Class R-4, Class R-5, and Institutional Class shares of the Acquiring Fund.
Fees and Expenses as a % of average daily net assets
The following table shows: (a) the ratios of expenses to average net assets of the Acquired Fund for the fiscal year ended October 31, 2008; (b) the ratios of expenses to average net assets of the Acquiring Fund for the fiscal year ended October 31, 2008; and (c) the pro forma expense ratios of the Acquiring fund for the fiscal year ending October 31, 2008 assuming that the Reorganization had taken place at the commencement of the fiscal year ended October 31, 2008.
13
| Annual Fund Operating Expenses |
| |
| | | | | Total |
| | Management | 12b-1 | Other | Operating |
| Class | Fees | Fees | Expenses | Expenses |
| (a) MidCap Growth Fund II (Acquired Fund) | | |
| R-1 | 1.00% | 0.35% | 0.54% | 1.89% |
| R-2 | 1.00% | 0.30% | 0.46% | 1.76% |
| R-3 | 1.00% | 0.25% | 0.33% | 1.58% |
| R-4 | 1.00% | 0.10% | 0.29% | 1.39% |
| R-5 | 1.00% | N/A | 0.27% | 1.27% |
| Institutional | 1.00% | N/A | 0.04% | 1.04%(1) |
| |
| (b) MidCap Growth Fund III (Acquiring Fund) | | |
| R-1 | 0.99% | 0.35% | 0.54% | 1.88% |
| R-2 | 0.99% | 0.30% | 0.46% | 1.75% |
| R-3 | 0.99% | 0.25% | 0.33% | 1.57% |
| R-4 | 0.99% | 0.10% | 0.29% | 1.38% |
| R-5 | 0.99% | N/A | 0.27% | 1.26% |
| Institutional | 0.99% | N/A | 0.02% | 1.01%(1) |
| |
| (c) MidCap Growth Fund III (Acquiring Fund) | | |
| (Pro forma assuming Reorganization)(2) | | |
| R-1 | 0.99% | 0.35% | 0.54% | 1.88% |
| R-2 | 0.99% | 0.30% | 0.46% | 1.75% |
| R-3 | 0.99% | 0.25% | 0.33% | 1.57% |
| R-4 | 0.99% | 0.10% | 0.29% | 1.38% |
| R-5 | 0.99% | N/A | 0.27% | 1.26% |
| Institutional | 0.99% | N/A | 0.01% | 1.00% |
| (1) | Expense information has been restated to reflect current fees. Certain other operating expenses of the Funds have been increased effective March 1, 2009. |
| (2) | The pro forma figures do not reflect the costs associated with the Reorganization. |
14
Examples: The following examples are intended to help you compare the costs of investing in shares of the Acquired and Acquiring Funds. The examples assume that fund expenses continue at the rates shown in the table above, that you invest $10,000 in the particular fund for the time periods indicated, regardless of whether you redeem or continue to hold the shares at the end of the period, and that all dividends and distributions are reinvested. The examples also assume that your investment has a 5% return each year. The examples should not be considered a representation of future expenses of the Acquired or Acquiring fund. Actual expenses may be greater or less than those shown.
| | Number of Years You Own Your Shares |
| Share Class | 1 Year | 3 Years | 5 Years | 10 Years |
| MidCap Growth Fund II (Acquired Fund) | | |
| R-1 | $192 | $594 | $1,021 | $2,212 |
| R-2 | 179 | 554 | 954 | 2,073 |
| R-3 | 161 | 499 | 860 | 1,878 |
| R-4 | 142 | 440 | 761 | 1,669 |
| R-5 | 129 | 403 | 697 | 1,534 |
| Institutional | 106 | 331 | 574 | 1,271 |
| |
| MidCap Growth Fund III (Acquiring Fund) | | |
| R-1 | $191 | $591 | $1,016 | $2,201 |
| R-2 | 178 | 551 | 949 | 2,062 |
| R-3 | 160 | 496 | 855 | 1,867 |
| R-4 | 140 | 437 | 755 | 1,657 |
| R-5 | 128 | 400 | 692 | 1,523 |
| Institutional | 103 | 322 | 558 | 1,236 |
| |
| MidCap Growth Fund III (Acquiring Fund) | | |
| (Pro forma assuming Reorganization) | | |
| R-1 | $191 | $591 | $1,016 | $2,201 |
| R-2 | 178 | 551 | 949 | 2,062 |
| R-3 | 160 | 496 | 855 | 1,867 |
| R-4 | 140 | 437 | 755 | 1,657 |
| R-5 | 128 | 400 | 692 | 1,523 |
| Institutional | 102 | 318 | 552 | 1,225 |
15
Investment Management Fees/Sub-Advisory Arrangements
The Funds each pay their investment advisor, PMC, an advisory fee which for each Fund is calculated as a percentage of the Fund’s average daily net assets pursuant to the following fee schedules:
MidCap Growth Fund II (Acquired Fund)
1.00% for the first $500 million, .98% for the next $500 million, .96% for the next $500 million, and .95% on all assets over $1.5 billion.
MidCap Growth Fund III (Acquiring Fund)
1.00% for the first $500 million, .96% for the next $500 million, .94% for the next $500 million, and .92% on all assets over $1.5 billion.
As sub-advisors to the Funds, Jacobs Levy, MacKay Shields, Mellon Capital, and Turner are paid sub-advisory fees. These sub-advisory fees are paid by PMC, not by the Funds.
A discussion of the basis of the Board’s approval of the advisory and sub-advisory agreements with respect to the Acquired and Acquiring Funds is available in PFI’s Annual Report to Shareholders for the fiscal year ended October 31, 2008.
Comparison of Principal Investment Risks
In deciding whether to approve the Reorganization, shareholders should consider the amount and character of investment risk involved in the respective investment objectives and strategies of the Acquired and Acquiring Funds. Because the Funds have the same investment objectives and substantially the same principal policies, the Funds’ risks are substantially similar. As described below, the Funds also have some different risks.
Risks Applicable to both Funds:
Credit and Counterparty Risk. Each of the Funds is subject to the risk that the issuer or guarantor of a fixed-income security or other obligation, the counterparty to a derivatives contract or repurchase agreement, or the borrower of a portfolio’s securities will be unable or unwilling to make timely principal, interest, or settlement payments, or otherwise to honor its obligations.
Liquidity Risk. The Funds are exposed to liquidity risk when trading volume, lack of a market maker, or legal restrictions impair the Funds’ ability to sell particular securities or close derivative positions at an advantageous price.
Market Risk. The value of the Funds’ portfolio securities may go down in response to overall stock or bond market movements. Markets tend to move in cycles, with periods of rising prices and periods of falling prices. Stocks tend to go up and down in value more than bonds. If the Funds’
16
investments are concentrated in certain sectors, its performance could be worse than the overall market. It is possible to lose money when investing in the fund.
Active Trading Risk. The Funds may actively trades portfolio securities in an attempt to achieve their investment objective and, therefore, may have high portfolio turnover rates that may increase the fund’s brokerage costs, accelerate the realization of taxable gains, and adversely impact fund performance.
Management Risk. The Funds are actively managed by their investment advisor or sub-advisor(s). The performance of the Funds will reflect in part the ability of the advisor or sub-advisor(s) to make investment decisions that are suited to achieving the Funds’ investment objectives. If the advisor’s or sub-advisor(s)’ strategies do not perform as expected, the Funds could underperform other mutual funds with similar investment objectives or lose money.
Securities Lending Risk. To earn additional income, the Funds may lend portfolio securities to approved financial institutions. Risks of such a practice include the possibility that a financial institution becomes insolvent, increasing the likelihood that the Funds will be unable to recover the loaned security or its value. Further, the cash collateral received by the Funds in connection with such a loan may be invested in a security that subsequently loses value.
Equity Securities Risk. Equity securities include common, preferred, and convertible preferred stocks and securities the values of which are tied to the price of stocks, such as rights, warrants, and convertible debt securities. Common and preferred stocks represent equity ownership in a company. Stock markets are volatile, and the price of equity securities (and their equivalents) will fluctuate. The value of equity securities purchased by the Funds could decline if the financial condition of the companies in which the fund invests decline or if overall market and economic conditions deteriorate.
Foreign Securities Risk. Foreign securities carry risks that are not generally found in securities of U.S. companies. These risks include the loss of value as a result of political instability and financial and economic events in foreign countries. In addition, nationalization, expropriation or confiscatory taxation, and foreign exchange restrictions could adversely affect the Fund’s investments in a foreign country. Foreign securities may be subject to less stringent reporting, accounting, and disclosure standards than are required of U.S. companies, and foreign countries may also have problems associated with and causing delays in the settlement of sales.
17
Market Segment Risk. The Funds are subject to the risk that their principal market segment, mid capitalization, may underperform compared to other market segments or to the equity markets as a whole. The Funds’ strategy of investing in mid cap stocks carries the risk that in certain markets mid cap stocks will underperform small cap or large cap stocks.
Exchange Rate Risk. Because foreign securities are generally denominated in foreign currencies, the value of the net assets of a fund as measured in U.S. dollars will be affected by changes in exchange rates. To protect against future uncertainties in foreign currency exchange rates, the Funds are authorized to enter into certain foreign currency exchange transactions. In addition, the Funds’ foreign investments may be less liquid and their price more volatile than comparable investments in U.S. securities. Settlement periods may be longer for foreign securities and portfolio liquidity may be affected.
Growth Stock Risk. Growth stocks typically trade at higher multiples of current earnings than other securities. Growth stocks are often more sensitive to market fluctuations than other securities because their market prices are highly sensitive to future earnings expectations. Similarly, because growth securities typically do not make dividend payments to shareholders, investment returns are based on capital appreciation, making returns more dependent on market increases and decreases. Growth stocks may therefore be more volatile than non-growth stocks. The Funds’ strategy of investing in growth stocks also carries the risk that in certain markets growth stocks will underperform value stocks.
Mid Cap Stock Risk. Medium capitalization companies may be more vulnerable to adverse business or economic events than larger, more established companies. In particular, mid-size companies may pose greater risk due to narrow product lines, limited financial resources, less depth in management, or a limited trading market for their securities.
Risks Applicable to the Acquired Fund:
Exchange-Traded Funds (“ETFs”) Risk. To the extent that the Acquired Fund invests in ETFs, the Fund will be subject to substantially the same risks as those associated with the direct ownership of the securities comprising the index on which the ETF is based, and the value of the Fund’s investment will fluctuate in response to the performance of the underlying index. ETFs typically incur fees that are separate from those of the Fund. Accordingly, the Fund’s investments in ETFs will result in the layering of expenses such that shareholders will indirectly bear a proportionate share of the ETFs’ operating expenses, in addition to paying Fund expenses.
18
Risks Applicable to the Acquiring Fund:
Underlying Fund Risk. The Principal LifeTime Funds and the Strategic Asset Management (“SAM”) Portfolios operate as funds of funds and invest principally in other PFI Funds (“Underlying Funds”). From time to time, an Underlying Fund may experience relatively large investments or redemptions by a fund of funds due to the reallocation or rebalancing of its assets. These transactions may have adverse effects on Underlying Fund performance to the extent an Underlying Fund is required to sell portfolio securities to meet such redemptions, or to invest cash from such investments, at times it would not otherwise do so. This may be particularly important when a fund of funds owns a significant portion of an underlying fund. These transactions may also accelerate the realization of taxable income if sales of portfolio securities result in gains, and could increase transaction costs. In addition, when a fund of funds reallocates or redeems significant assets away from an Underlying Fund, the loss of assets to the Underlying Fund could result in increased expense ratios for that fund.
PMC is the advisor to the Principal LifeTime Funds and each of the Underlying Funds. Principal Global Investors, Inc. (“PGI”), an affiliate of PMC, is Sub-Advisor to these funds.The Acquiring Fund is among the Underlying Funds owned by the Principal LifeTime Funds. Principal and PGI are committed to minimizing the potential impact of underlying fund risk on Underlying Funds to the extent consistent with pursuing the investment objectives of the funds of funds which it manages. Each may face conflicts of interest in fulfilling its responsibilities to all such funds. The following table shows the percentage of the outstanding shares of the Acquiring Fund owned by the Principal LifeTime Funds as of October 31, 2008.
| Principal LifeTime Funds | MidCap Growth Fund III Acquiring Fund |
| Principal LifeTime 2010 | | 0.55% |
| Principal LifeTime 2015 | | 0.14% |
| Principal LifeTime 2020 | | 7.51% |
| Principal LifeTime 2025 | | 0.19% |
| Principal LifeTime 2030 | | 8.00% |
| Principal LifeTime 2035 | | 0.14% |
| Principal LifeTime 2040 | | 4.81% |
| Principal LifeTime 2045 | | 0.06% |
| Principal LifeTime 2050 | | 2.08% |
| Principal LifeTime 2055 | | 0.01% |
| Principal LifeTime Strategic Income | | 0.26% |
| Total | 23.75% |
19
Emerging Market Risk. Investments in emerging market countries involve special risks. Certain emerging market countries have historically experienced, and may continue to experience, certain economic problems. These may include: high rates of inflation, high interest rates, exchange rate fluctuations, large amounts of debt, balance of payments and trade difficulties, and extreme poverty and unemployment.
Initial Public Offerings (“IPOs”) Risk. There are risks associated with the purchase of shares issued in IPOs by companies that have little operating history as public companies, as well as risks inherent in those sectors of the market where these new issuers operate. The market for IPO issuers has been volatile and share prices of certain newly-public companies have fluctuated in significant amounts over short periods of time. The Acquiring Fund cannot guarantee continued access to IPO offerings and may at times dispose of IPO shares shortly after their acquisition.
The bar charts below show how each Fund’s total return has varied year-by-year, while the tables below show each Fund’s performance over time (along with the returns of a broad-based market index and an index of funds with similar investment objectives for reference). A Fund’s past performance is not necessarily an indication of how the Fund will perform in the future.
Year-By-Year Total Returns (%) as of 12/31 Each Year (Institutional Class)
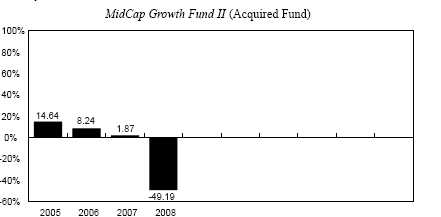
| Highest return for a quarter during | | |
| the period of the bar chart above: | Q1 ’06 | 10.87% |
| Lowest return for a quarter during | | |
| the period of the bar chart above: | Q4 ’08 | -29.05% |
The year-to-date return as of December 31, 2008 is -49.19% .
20
Year-By-Year Total Returns (%) as of 12/31 Each Year (Institutional Class)
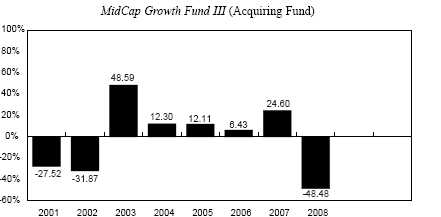
| Highest return for a quarter during | | |
| the period of the bar chart above: | Q4 ’01 | 24.96% |
| Lowest return for a quarter during | | |
| the period of the bar chart above: | Q3 ’01 | -31.34% |
The year-to-date return as of December 31, 2008 is -48.48% .
Average Annual Total Returns (%) for periods ended December 31, 2008
| | | Life of |
| | 1 Year | Fund(1) |
| MidCap Growth Fund II | | |
| (Acquired Fund) | | |
| —Institutional Class (before taxes) | -49.19 | -10.48 |
| (after taxes on distributions)(2) | -49.19 | -11.70 |
| (after taxes on distributions and sale of shares) (2) | -31.97 | -8.82 |
| —R-1 Class | -49.60 | -11.35 |
| —R-2 Class | -49.55 | -11.24 |
| —R-3 Class | -49.46 | -11.08 |
| —R-4 Class | -49.36 | -10.93 |
| —R-5 Class | -49.32 | -10.82 |
| Russell Midcap Growth Index(3) | -44.32 | -2.19 |
| Morningstar Mid-Cap Growth Category Average | -43.77 | -3.23 |
21
| | | | Life of |
| | 1 Year | 5 Years | Fund(4) |
| MidCap Growth Fund III | | | |
| (Acquiring Fund) | | | |
| —Institutional Class (before taxes) (5) | -48.48 | -2.97 | -6.08 |
| (after taxes on distributions)(2) (5) | -48.48 | -3.26 | -6.25 |
| (after taxes on distributions and sale of shares)(2) (5) | -31.51 | -2.30 | -4.87 |
| —R-1 Class(6) | -48.84 | -3.82 | -6.73 |
| —R-2 Class | -48.81 | -3.71 | -6.77 |
| —R-3 Class | -48.67 | -3.50 | -6.43 |
| —R-4 Class | -48.62 | -3.35 | -6.42 |
| —R-5 Class | -48.56 | -3.20 | -6.26 |
| Russell Midcap Growth Index(3) | -44.32 | -2.33 | -3.77 |
| Morningstar Mid-Cap Growth Category Average | -43.77 | -2.44 | -4.64 |
| (1) | Lifetime results are measured from December 29, 2004. |
| |
| (2) | After-tax returns are calculated using the historical highest individual federal marginal income-tax rates and do not reflect the impact of state and local taxes. Actual after-tax returns depend on the investor’s tax situation and may differ from those shown. The after-tax returns shown are not relevant to investors who hold their Fund shares through tax-deferred arrangements such as 401(k) plans or individual retirement accounts. |
| |
| (3) | Index performance does not reflect deductions for fees, expenses or taxes. For a description of the indices, see Appendix B to this Proxy Statement/ Prospectus. |
| |
| (4) | Lifetime results are measured from the date the R-3 Class shares were first sold (December 6, 2000). |
| |
| (5) | Institutional Class shares were first sold on March 1, 2001. The returns for the periods prior to that date are based on the performance of the R-3 Class shares adjusted to reflect the fees and expenses of Institutional Class shares. |
| |
| | The adjustments result in performance for such periods that is no higher than the historical performance of the R-3 Class shares. R-3 shares were first sold on December 6, 2000. |
| |
| (6) | The R-1 Class shares were first sold on November 1, 2004. For periods prior to the date on which the R-1 Class began operations, its returns are based on the performance of the Fund’s R-3 Class shares adjusted to reflect the fees and expenses of the R-1 Class. The adjustments result in performance (for the periods prior to the date the R-1 began operations) that is no higher than the historical performance of the R-3 Class shares. The Institutional Class shares were first sold on December 6, 2000. |
22
INFORMATION ABOUT THE REORGANIZATION
Plan of Acquisition
The terms of the Plan are summarized below. The summary is qualified in its entirety by reference to the Form of the Plan which is attached as Appendix A to this Proxy Statement/Prospectus.
Under the Plan, the Acquiring Fund will acquire all the assets and assume all the liabilities of the Acquired Fund. We expect that the closing date will be May 1, 2009, or such earlier or later date as PMC may determine, and that the Effective Time of the Reorganization will be as of the close of regularly scheduled trading on the NYSE (normally 3:00 p.m., Central Time) on that date. Each Fund will determine its net asset values as of the close of trading on the NYSE using the procedures described in its then current prospectus (the procedures applicable to the Acquired Fund and the Acquiring Fund are identical). The Acquiring Fund will issue to the Acquired Fund a number of shares of each share class with a total value equal to the total value of the net assets of the corresponding share class of the Acquired Fund outstanding at the Effective Time.
Immediately after the Effective Time, the Acquired Fund will distribute to its shareholders Acquiring Fund shares of the same class as the Acquired Fund shares each shareholder owns in exchange for all Acquired Fund shares of that class. Acquired Fund shareholders will receive a number of full and fractional shares of the Acquiring Fund that are equal in value to the value of the shares of the Acquired Fund that are surrendered in the exchange. In connection with the exchange, the Acquiring Fund will credit on its books an appropriate number of its shares to the account of each Acquired Fund shareholder, and the Acquired Fund will cancel on its books all its shares registered to the account of that shareholder. After the Effective Time, the Acquired Fund will be dissolved in accordance with applicable law.
The Plan may be amended, but no amendment may be made which in the opinion of the Board would materially adversely affect the interests of the shareholders of the Acquired Fund. The Board may abandon and terminate the Plan at any time before the Effective Time if it believes that consummation of the transactions contemplated by the Plan would not be in the best interests of the shareholders of either of the Funds.
Under the Plan, the Acquired Fund will pay all expenses and out-of-pocket fees incurred in connection with the Reorganization.
If the Plan is not consummated for any reason, the Board will consider other possible courses of action.
23
Reasons for the Reorganization
The Board of Directors of PFI believes that the Reorganization will serve the best interests of shareholders of both the Acquired and Acquiring Funds. The Funds have the same investment objectives in that both Funds seek to provide long-term growth of capital. The Funds also have substantially the same principal policies and risks in that both invest in midcap growth securities. The Acquiring Fund has lower advisory fee rates on assets over $500 million and lower overall expense ratios than the Acquired Fund. Further, the Acquiring Fund has outperformed the Acquired Fund for each of the last two calendar years. Moreover, because the Acquiring Fund is much larger than the Acquired Fund, the Reorganization may be expected to afford shareholders of the Acquired Fund on an ongoing basis greater prospects for growth and efficient management. Combining the Funds will not result in any dilution of the interests of existing shareholders of the Funds.
Board Consideration of the Reorganization
The Board, including the Independent Directors, considered the Reorganization pursuant to the Plan at its meeting on December 19, 2008. The Board considered information presented by PMC, and the Independent Directors were assisted by independent legal counsel. The Board requested and evaluated such information as it deemed necessary to consider the Reorganization. At the meeting, the Board unanimously approved the Reorganization after concluding that participation in the Reorganization is in the best interests of the Acquired Fund and the Acquiring Fund and that the interests of existing shareholders of the Funds will not be diluted as a result of the Reorganization.
In determining whether to approve the Reorganization, the Board made inquiry into a number of matters and considered, among others, the following factors, in no order of priority:
(1) the same investment objectives and substantially the same principal investment strategies shared by the Funds;
(2) the absence of any substantial differences in the Funds’ fundamental investment restrictions;
(3) estimated trading costs associated with disposing of any portfolio securities of the Acquired Fund and reinvesting the proceeds in connection with the Reorganization;
(4) expense ratios and available information regarding the fees and expenses of the Funds;
(5) comparative investment performance of and other information pertaining to the Funds;
24
(6) the potential effect on the Acquired Fund’s shareholders of investing in a larger fund and the potential effect on the portfolio management of the Acquiring Fund of a larger asset base following the Reorganization;
(7) the prospects for growth of and for achieving economies of scale by the Acquired Fund in combination with the Acquiring Fund;
(8) the absence of any material differences in the rights of shareholders of the Funds;
(9) the financial strength, investment experience and resources of Mellon Capital and Turner, which currently serve as the sub-advisors to the Acquiring Fund, and Jacobs Levy which will become an additional sub-advisor to the Acquiring Fund at the Effective Time of the Reorganization;
(10)any direct or indirect benefits expected to be derived by PMC and its affiliates from the Reorganization;
(11) the direct or indirect federal income tax consequences of the Reorganization, including the expected tax-free nature of the Reorganization and the impact of any federal income tax loss carry forwards and the estimated capital gain or loss expected to be incurred in connection with disposing of any portfolio securities that would not be compatible with the investment objectives and strategies of the Acquiring Fund;
(12)the fact that the Reorganization will not result in any dilution of Acquired or Acquiring Fund shareholder values;
(13)the terms and conditions of the Plan; and
(14)possible alternatives to the Reorganization.
The Board’s decision to recommend approval of the Reorganization was based on a number of factors, including the following:
(1) it should be reasonable for shareholders of the Acquired Fund to have similar investment expectations after the Reorganization because the Funds have the same investment objectives and substantially similar principal investment strategies and risks;
(2) Mellon Capital, Turner, and Jacobs Levy as sub-advisors responsible for managing the assets of the Acquiring Fund may be expected to continue to provide high quality investment advisory services and personnel for the foreseeable future;
(3) lower advisory fees and overall expense ratios of the Acquiring Fund; and
(4) the combination of the Acquired Fund into the much larger Acquiring Fund may be expected to afford shareholders of the Acquired Fund on an ongoing basis greater prospects for growth and efficient management.
25
Description of the Securities to Be Issued
PFI is a Maryland corporation that is authorized to issue its shares of common stock in separate series and separate classes of series. Each of the Acquired and Acquiring Funds is a separate series of PFI, and the Class R-1, Class R-2, Class R-3, Class R-4, Class R-5 and Institutional Class shares of common stock of the Acquiring Fund to be issued in connection with the Reorganization represent interests in the assets belonging to that series and have identical dividend, liquidation and other rights, except that expenses allocated to a particular series or class are borne solely by that series or class and may cause differences in rights as described herein. Expenses related to the distribution of, and other identified expenses properly allocated to, the shares of a particular series or class are charged to, and borne solely by, that series or class, and the bearing of expenses by a particular series or class may be appropriately reflected in the net asset value attributable to, and the dividend and liquidation rights of, that series or class.
All shares of PFI have equal voting rights and are voted in the aggregate and not by separate series or class of shares except that shares are voted by series or class: (i) when expressly required by Maryland law or the 1940 Act and (ii) on any matter submitted to shareholders which the Board has determined affects the interests of only a particular series or class.
The share classes of the Acquired Fund have the same rights with respect to the Acquired Fund that the share classes of the Acquiring Fund have with respect to the Acquiring Fund.
Shares of both Funds, when issued, have no cumulative voting rights, are fully paid and non-assessable, have no preemptive or conversion rights and are freely transferable. Each fractional share has proportionately the same rights as are provided for a full share.
| | Federal Income Tax Consequences |
To be considered a tax-free “reorganization” under Section 368 of the Internal Revenue Code of 1986, as amended (the “Code”), a reorganization must exhibit a continuity of business enterprise. Because the Acquiring Fund will use a portion of the Acquired Fund’s assets in its business and will continue the Acquired Fund’s historic business, the combination of the Acquired Fund into the Acquiring Fund will exhibit a continuity of business enterprise. Therefore, the combination will be considered a tax-free “reorganization” under applicable provisions of the Code. In the opinion of tax counsel to PFI, no gain or loss will be recognized by either of the Funds or their shareholders in connection with the combination, the tax cost basis of the Acquiring Fund shares received by shareholders of the Acquired Fund will equal the tax cost basis of their shares in the Acquired Fund, and their holding periods for the Acquiring Fund shares will include their holding periods for the Acquired Fund shares.
26
Capital Loss Carryforward. As of October 31, 2008, the Acquired Fund had an accumulated capital loss carryforward of approximately $66,116,000 expiring in 2016. After the Reorganization, these losses will be available to the Acquiring Fund to offset its capital gains, although the amount of offsetting losses in any given year may be limited. As a result of this limitation, it is possible that the Acquiring Fund may not be able to use these losses as rapidly as the Acquired Fund might have, and part of these losses may not be useable at all. The ability of the Acquiring Fund to utilize the accumulated capital loss carryforward in the future depends upon a variety of factors that cannot be known in advance, including the existence of capital gains against which these losses may be offset. In addition, the benefits of any capital loss carryforward currently are available only to shareholders of the Acquired Fund. After the Reorganization, however, these benefits will inure to the benefit of all shareholders of the Acquiring Fund.
Distribution of Income and Gains. Prior to the Reorganization, the Acquired Fund, whose taxable year will end as a result of the Reorganization, will declare to its shareholders of record one or more distributions of all of its previously undistributed net investment income and net realized capital gain, including capital gains on any securities disposed of in connection with the Reorganization. Such distributions will be made to shareholders before the Reorganization. An Acquired Fund shareholder will be required to include any such distributions in such shareholder’s taxable income. This may result in the recognition of income that could have been deferred or might never have been realized had the Reorganization not occurred.
The foregoing is only a summary of the principal federal income tax consequences of the Reorganization and should not be considered to be tax advice. There can be no assurance that the Internal Revenue Service will concur on all or any of the issues discussed above. You may wish to consult with your own tax advisors regarding the federal, state, and local tax consequences with respect to the foregoing matters and any other considerations which may apply in your particular circumstances.
27
CAPITALIZATION
The following tables show as of October 31, 2008: (i) the capitalization of the Acquired Fund; (ii) the capitalization of the Acquiring Fund; and (iii), the pro forma combined capitalization of the Acquiring Fund, adjusted to reflect the estimated expenses of the Reorganization, as if the Reorganization had occurred as of that date. As of October 31, 2008, the Acquired Fund had outstanding six classes of shares: Institutional, R-1, R-2, R-3, R-4, and R-5. As of October 31, 2008, the Acquiring Fund had outstanding ten classes of shares: Class A, Class B, Class C, Class J, Institutional, R-1, R-2, R-3, R-4, and R-5.
The Acquired Fund will pay all expenses and out-of-pocket fees incurred in connection with the Reorganization including printing, mailing, and legal fees. The expenses and fees the Acquired Fund will pay are expected to total $45,000.
| | Net Asset | Shares |
| Share | Net Assets | Value | Outstanding |
Class | (000s) | Per Share | (000s) |
| MidCap Growth Fund II | | | |
| (Acquired Fund) | | | |
| Institutional | $191,051 | $5.71 | 33,454 |
| R-1 | 1,454 | 5.47 | 266 |
| R-2 | 1,150 | 5.50 | 209 |
| R-3 | 4,701 | 5.54 | 849 |
| R-4 | 5,183 | 5.58 | 929 |
| R-5 | 2,127 | 5.62 | 379 |
| | $205,666 | | 36,086 |
| MidCap Growth Fund III | | | |
| (Acquiring Fund) | | | |
| Class A | $ 21,252 | $6.20 | 3,425 |
| Class B | 5,477 | 6.04 | 907 |
| Class C | 778 | 6.15 | 126 |
| Class J | 20,178 | 5.94 | 3,399 |
| Institutional | 423,812 | 6.37 | 66,503 |
| R-1 | 775 | 6.13 | 126 |
| R-2 | 7,120 | 6.21 | 1,146 |
| R-3 | 23,848 | 6.41 | 3,719 |
| R-4 | 17,117 | 6.42 | 2,667 |
| R-5 | 9,461 | 6.51 | 1,453 |
| | $529,818 | | 83,471 |
28
| | | Net Asset | Shares |
| Share | Net Assets | Value | Outstanding |
| Class | (000s) | Per Share | (000s) |
| Reduction in net assets and decrease in | | |
| net asset values per share of the Acquired | | |
| Fund to reflect the estimated expenses | | |
| of the Reorganization. | | | |
| Institutional | $(42) | $0.00 | (7) |
| R-1 | * | ** | *** |
| R-2 | * | ** | *** |
| R-3 | (1) | 0.00 | *** |
| R-4 | (1) | 0.00 | *** |
| R-5 | (1) | 0.00 | *** |
| Decrease in shares outstanding of the | | |
| Acquired Fund to reflect the exchange | | |
| for shares of the Acquiring Fund. | | |
| Institutional | | | (3,461) |
| R-1 | | | (29) |
| R-2 | | | (24) |
| R-3 | | | (116) |
| R-4 | | | (122) |
| R-5 | | | (52) |
| * | Less than $500. |
| ** | Per share amount is less than $.005. |
| *** | Less than 500 shares. |
ADDITIONAL INFORMATION ABOUT THE FUNDS
Certain Investment Strategies and Related Risks of the Funds
This section provides information about certain investment strategies and related risks of the Funds. The Statement of Additional Information contains additional information about investment strategies and their related risks.
Some of the principal investment risks vary between the Funds and the variations are described above. The value of each Fund’s securities may fluctuate on a daily basis. As with all mutual funds, as the values of each Fund’s assets rise or fall, the Fund’s share price changes. If an investor sells Fund shares when their value is less than the price the investor paid, the investor will lose money. As with any security, the securities in which the Funds invest have associated risk.
Market Volatility
Equity securities include common stocks, preferred stocks, convertible securities, depositary receipts, rights, and warrants. Common stocks, the most familiar type, represent an equity (ownership) interest in a corporation. The value of a company’s stock may fall as a result of factors directly relating to
29
that company, such as decisions made by its management or lower demand for the company’s products or services. A stock’s value may also fall because of factors affecting not just the company, but also companies in the same industry or in a number of different industries, such as increases in production costs. The value of a company’s stock may also be affected by changes in financial markets that are relatively unrelated to the company or its industry, such as changes in interest rates or currency exchange rates. In addition, a company’s stock generally pays dividends only after the company invests in its own business and makes required payments to holders of its bonds and other debt. For this reason, the value of a company’s stock will usually react more strongly than its bonds and other debt to actual or perceived changes in the company’s financial condition or prospects. Stocks of smaller companies may be more vulnerable to adverse developments than those of larger companies.
Fixed-income securities include bonds and other debt instruments that are used by issuers to borrow money from investors. The issuer generally pays the investor a fixed, variable or floating rate of interest. The amount borrowed must be repaid at maturity. Some debt securities, such as zero coupon bonds, do not pay current interest, but are sold at a discount from their face values.
Fixed-income securities are sensitive to changes in interest rates. In general, fixed-income security prices rise when interest rates fall and fall when interest rates rise. Longer term bonds and zero coupon bonds are generally more sensitive to interest rate changes.
Fixed-income security prices are also affected by the credit quality of the issuer. Investment grade debt securities are medium and high quality securities. Some bonds, such as lower grade or “junk” bonds, may have speculative characteristics and may be particularly sensitive to economic conditions and the financial condition of the issuers.
Repurchase Agreements and Loaned Securities
The Funds may invest a portion of their assets in repurchase agreements, although this is not a principal investment strategy. Repurchase agreements typically involve the purchase of debt securities from a financial institution such as a bank, savings and loan association, or broker-dealer. A repurchase agreement provides that the Fund sells back to the seller and that the seller repurchases the underlying securities at a specified price on a specific date. Repurchase agreements may be viewed as loans by the Fund collateralized by the underlying securities. This arrangement results in a fixed rate of return that is not subject to market fluctuation while the Fund holds the security. In the event of a default or bankruptcy by a selling financial institution, the affected Fund bears a risk of loss. To minimize such risks, the Funds enter
30
into repurchase agreements only with large, well-capitalized and well-established financial institutions. In addition, the value of the securities collateralizing the repurchase agreement is, and during the entire term of the repurchase agreement remains, at least equal to the repurchase price, including accrued interest.
The Funds may lend their portfolio securities to unaffiliated broker-dealers and other unaffiliated qualified financial institutions. These transactions involve risk of loss to a fund if the counterparty should fail to return such securities to the fund upon demand or if the counterparty’s collateral invested by the fund declines in value as a result of investment losses.
Currency Contracts
The Funds may enter into currency contracts, currency futures contracts and options, and options on currencies for hedging and other purposes. A forward currency contract involves a privately negotiated obligation to purchase or sell a specific currency at a future date at a price set in the contract. A Fund will not hedge currency exposure to an extent greater than the aggregate market value of the securities held or to be purchased by the Fund (denominated or generally quoted or currently convertible into the currency).
Hedging is a technique used in an attempt to reduce risk. If a Fund’s Sub-Advisor hedges market conditions incorrectly or employs a strategy that does not correlate well with the Fund’s investment, these techniques could result in a loss. These techniques may increase the volatility of a Fund and may involve a small investment of cash relative to the magnitude of the risk assumed. In addition, these techniques could result in a loss if the other party to the transaction does not perform as promised. There is also a risk of government action through exchange controls that would restrict the ability of the Fund to deliver or receive currency.
Forward Commitments
The Funds may enter into forward commitment agreements, although this is not a principal investment strategy. These agreements call for a fund to purchase or sell a security on a future date at a fixed price. The Funds may also enter into contracts to sell their investments either on demand or at a specific interval.
Temporary Defensive Measures
From time to time, as part of its investment strategy, each Fund may invest without limit in cash and cash equivalents for temporary defensive purposes in response to adverse market, economic or political conditions. To the extent that the Fund is in a defensive position, it may lose the benefit of
31
upswings and limit its ability to meet its investment objective. For this purpose, cash equivalents include: bank notes, bank certificates of deposit, bankers’ acceptances, repurchase agreements, commercial paper, and commercial paper master notes which are floating rate debt instruments without a fixed maturity. In addition, each Fund may purchase U.S. government securities, preferred stocks and debt securities, whether or not convertible into or carrying rights for common stock.
There is no limit on the extent to which the Funds may take temporary defensive measures. In taking such measures, the Funds may fail to achieve their investment objectives.
Warrants
Each of the Funds may invest in warrants though none of the Funds use such investments as a principal investment strategy. A warrant is a certificate granting its owner the right to purchase securities from the issuer at a specified price, normally higher than the current market price.
Initial Public Offerings (“IPOs”)
The Funds may invest in IPOs. An IPO is a company’s first offering of stock to the public. IPO risk is that the market value of IPO shares will fluctuate considerably due to factors such as the absence of a prior public market, unseasoned trading, the small number of shares available for trading and limited information about the issuer. The purchase of IPO shares may involve high transaction costs. IPO shares are subject to market risk and liquidity risk. In addition, the market for IPO shares can be speculative and/or inactive for extended periods of time. The limited number of shares available for trading in some IPOs may make it more difficult for a Fund to buy or sell significant amounts of shares without an unfavorable impact on prevailing prices. Investors in IPO shares can be affected by substantial dilution in the value of their shares by sales of additional shares and by concentration of control in existing management and principal shareholders.
When a Fund’s asset base is small, a significant portion of the Fund’s performance could be attributable to investments in IPOs because such investments would have a magnified impact on the Fund. As the Fund’s assets grow, the effect of the Fund’s investments in IPOs on the Fund’s performance probably will decline, which could reduce the Fund’s performance. Because of the price volatility of IPO shares, a Fund may choose to hold IPO shares for a very short period of time. This may increase the turnover of the Fund’s portfolio and lead to increased expenses to the Fund, such as commissions and transaction costs. By selling IPO shares, the Fund may realize taxable gains it will subsequently distribute to shareholders.
32
Convertible Securities
Convertible securities are fixed-income securities that a Fund has the right to exchange for equity securities at a specified conversion price. The option allows the Fund to realize additional returns if the market price of the equity securities exceeds the conversion price. For example, the Fund may hold fixed-income securities that are convertible into shares of common stock at a conversion price of $10 per share. If the market value of the shares of common stock reached $12, the Fund could realize an additional $2 per share by converting its fixed-income securities.
Convertible securities have lower yields than comparable fixed-income securities. In addition, at the time a convertible security is issued the conversion price exceeds the market value of the underlying equity securities. Thus, convertible securities may provide lower returns than non-convertible fixed-income securities or equity securities depending upon changes in the price of the underlying equity securities. However, convertible securities permit the Fund to realize some of the potential appreciation of the underlying equity securities with less risk of losing its initial investment.
The Funds treat convertible securities as both fixed-income and equity securities for purposes of investment policies and limitations because of their unique characteristics. The Funds may invest in convertible securities without regard to their ratings.
Foreign Investing
The Funds may invest in securities of foreign companies but not as a principal investment strategy. For the purpose of this restriction, foreign companies are:
- companies with their principal place of business or principal office outside the U.S. or
- companies for which the principal securities trading market is outside the U.S.
Foreign companies may not be subject to the same uniform accounting, auditing, and financial reporting practices as are required of U.S. companies. In addition, there may be less publicly available information about a foreign company than about a U.S. company. Securities of many foreign companies are less liquid and more volatile than securities of comparable U.S. companies. Commissions on foreign securities exchanges may be generally higher than those on U.S. exchanges.
33
Foreign markets also have different clearance and settlement procedures than those in U.S. markets. In certain markets there have been times when settlements have been unable to keep pace with the volume of securities transactions, making it difficult to conduct these transactions. Delays in settlement could result in temporary periods when a portion of Fund assets is not invested and earning no return. If a Fund is unable to make intended security purchases due to settlement problems, the Fund may miss attractive investment opportunities. In addition, a Fund may incur a loss as a result of a decline in the value of its portfolio if it is unable to sell a security.
With respect to certain foreign countries, there is the possibility of expropriation or confiscatory taxation, political or social instability, or diplomatic developments that could affect a Fund’s investments in those countries. In addition, a Fund may also suffer losses due to nationalization, expropriation, or differing accounting practices and treatments. Investments in foreign securities are subject to laws of the foreign country that may limit the amount and types of foreign investments. Changes of governments or of economic or monetary policies, in the U.S. or abroad, changes in dealings between nations, currency convertibility or exchange rates could result in investment losses for a Fund. Finally, even though certain currencies may be convertible into U.S. dollars, the conversion rates may be artificial relative to the actual market values and may be unfavorable to Fund investors.
Foreign securities are often traded with less frequency and volume, and therefore may have greater price volatility, than is the case with many U.S. securities. Brokerage commissions, custodial services, and other costs relating to investment in foreign countries are generally more expensive than in the U.S. Though the Funds intend to acquire the securities of foreign issuers where there are public trading markets, economic or political turmoil in a country in which a Fund has a significant portion of its assets or deterioration of the relationship between the U.S. and a foreign country may negatively impact the liquidity of a Fund’s portfolio. A Fund may have difficulty meeting a large number of redemption requests. Furthermore, there may be difficulties in obtaining or enforcing judgments against foreign issuers.
A Fund may choose to invest in a foreign company by purchasing depositary receipts. Depositary receipts are certificates of ownership of shares in a foreign-based issuer held by a bank or other financial institution. They are alternatives to purchasing the underlying security but are subject to the foreign securities to which they relate.
34
Investments in companies of developing (also called “emerging”) countries are subject to higher risks than investments in companies in more developed countries. These risks include:
- increased social, political, and economic instability;
- a smaller market for these securities and low or nonexistent volume of trading that results in a lack of liquidity and in greater price volatility;
- lack of publicly available information, including reports of payments of dividends or interest on outstanding securities;
- foreign government policies that may restrict opportunities, including restrictions on investment in issuers or industries deemed sensitive to national interests;
- relatively new capital market structure or market-oriented economy;
- the possibility that recent favorable economic developments may be slowed or reversed by unanticipated political or social events in these countries;
- restrictions that may make it difficult or impossible for the Fund to vote proxies, exercise shareholder rights, pursue legal remedies, and obtain judgments in foreign courts; and
- possible losses through the holding of securities in domestic and foreign custodial banks and depositories.
In addition, many developing countries have experienced substantial and, in some periods, extremely high rates of inflation for many years. Inflation and rapid fluctuations in inflation rates have had and may continue to have negative effects on the economies and securities markets of those countries.
Repatriation of investment income, capital, and proceeds of sales by foreign investors may require governmental registration and/or approval in some developing countries. A Fund could be adversely affected by delays in or a refusal to grant any required governmental registration or approval for repatriation.
Further, the economies of developing countries generally are heavily dependent upon international trade and, accordingly, have been and may continue to be adversely affected by trade barriers, exchange controls, managed adjustments in relative currency values and other protectionist measures imposed or negotiated by the countries with which they trade.
Small and Medium Capitalization Companies
The Funds may invest in securities of companies with small- or mid-sized market capitalizations. Market capitalization is defined as total current market value of a company’s outstanding common stock. Investments in companies with smaller market capitalizations may involve greater risks and price volatility (wide, rapid fluctuations) than investments in larger, more mature
35
companies. Small companies may be less significant within their industries and may be at a competitive disadvantage relative to their larger competitors. While smaller companies may be subject to these additional risks, they may also realize more substantial growth than larger or more established companies.
Smaller companies may be less mature than larger companies. At this earlier stage of development, the companies may have limited product lines, reduced market liquidity for their shares, limited financial resources, or less depth in management than larger or more established companies. Unseasoned issuers are companies with a record of less than three years continuous operation, including the operation of predecessors and parents. Unseasoned issuers by their nature have only a limited operating history that can be used for evaluating the company’s growth prospects. As a result, investment decisions for these securities may place a greater emphasis on current or planned product lines and the reputation and experience of the company’s management and less emphasis on fundamental valuation factors than would be the case for more mature growth companies.
Temporary Defensive Measures
From time to time, as part of its investment strategy, each Fund (other than the Money Market Fund which may invest in high-quality money market securities at any time) may invest without limit in cash and cash equivalents for temporary defensive purposes in response to adverse market, economic, or political conditions. To the extent that the Fund is in a defensive position, it may lose the benefit of upswings and limit its ability to meet its investment objective. For this purpose, cash equivalents include: bank notes, bank certificates of deposit, bankers’ acceptances, repurchase agreements, commercial paper, and commercial paper master notes which are floating rate debt instruments without a fixed maturity. In addition, a Fund may purchase U.S. government securities, preferred stocks, and debt securities, whether or not convertible into or carrying rights for common stock.
There is no limit on the extent to which the Funds may take temporary defensive measures. In taking such measures, the Fund may fail to achieve its investment objective.
Portfolio Turnover
“Portfolio Turnover” is the term used in the industry for measuring the amount of trading that occurs in a Fund’s portfolio during the year. For example, a 100% turnover rate means that on average every security in the portfolio has been replaced once during the year. Funds that engage in active trading may have higher portfolio turnover rates. Funds with high turnover rates (more than 100%) often have higher transaction costs (which are paid by the Fund) and may have an adverse impact on the Fund’s performance.
36
Turnover rates for each of the Funds may be found in the Fund’s Financial Highlights table. It is recommended that all the factors are considered when the turnover rates of different funds are compared. A fund with consistently higher total returns and higher turnover rates than another fund may actually be achieving better performance precisely because the managers are active traders. An investor should also be aware that the “total return” line in the Financial Highlights section already includes portfolio turnover costs.
Derivatives
To the extent permitted by its investment objectives and policies, the Funds may invest in securities that are commonly referred to as derivative securities. Generally, a derivative is a financial arrangement, the value of which is derived from, or based on, a security, asset, or market index. Certain derivative securities are described more accurately as index/structured securities. Index/structured securities are derivative securities whose value or performance is linked to other equity securities (such as depositary receipts), currencies, interest rates, indices or other financial indicators (reference indices).
Some derivatives, such as mortgage-related and other asset-backed securities, are in many respects like any other investment, although they may be more volatile or less liquid than more traditional debt securities.
There are many different types of derivatives and many different ways to use them. Futures and options are commonly used for traditional hedging purposes to attempt to protect a fund from exposure to changing interest rates, securities prices, or currency exchange rates and for cash management purposes as a low-cost method of gaining exposure to a particular securities market without investing directly in those securities. A fund may enter into put or call options, future contracts, options on futures contracts and over-the-counter swap contracts (e.g., interest rate swaps, total return swaps and credit default swaps) for both hedging and non-hedging purposes.
Generally, the Fund may not invest in a derivative security unless the reference index or the instrument to which it relates is an eligible investment for the particular Fund. The return on a derivative security may increase or decrease, depending upon changes in the reference index or instrument to which it relates. The risks associated with derivative investments include: • the risk that the underlying security, interest rate, market index or other financial asset will not move in the direction the sub-advisor anticipated; • the possibility that there may be no liquid secondary market which may make it difficult or impossible to close out a position when desired; • the risk that adverse price movements in an instrument can result in a loss substantially greater than a fund’s initial investment; and • the counterparty may fail to perform its obligations.
37
| | Multiple Classes of Shares |
The Board of Directors of PFI has adopted an 18f-3 Plan for each of the Funds. Under these plans, each of the Funds currently offers the following shares: Class R-1, Class R-2, Class R-3, Class R-4, Class R-5 (sometimes collectively referred to as the “Retirement Class Shares”), and Institutional Class shares. The Acquiring Fund also offers certain other share classes as described under “Capitalization.” The shares are the same except for differences in class expenses, including any Rule 12b-1 fees and any applicable sales charges, excessive trading and other fees. Additional share classes may be offered in the future by the Acquiring Fund.
| | Costs of Investing in the Funds |
Fees and Expenses of the Funds
The fees and expenses of the Funds are described below. Depending on the class of your shares, you may incur one-time or ongoing fees or both. One-time fees include sales or redemption fees. Ongoing fees are the operating expenses of a Fund and include fees paid to the Fund’s manager, underwriter and others who provide ongoing services to the Fund.
Fees and expenses are important because they lower your earnings. However, lower costs do not guarantee higher earnings. For example, a fund with no front-end sales charge may have higher ongoing expenses than a fund with such a sales charge.
One-time fees
Institutional and Retirement Class Shares are sold without a front-end sales charge and do not have a contingent deferred sales charge. There is no sales charge on Institutional and Retirement Class shares of the Funds purchased with reinvested dividends or other distributions.
Ongoing fees
Ongoing Fees reduce the value of each share. Because they are ongoing, they increase the cost of investing in the Funds.
Each Fund pays ongoing fees to PMC and others who provide services to the Fund. These fees include:
- Management Fee – Through the Management Agreement with the Fund, PMC has agreed to provide investment advisory services and administrative services to the Fund.
- Other Expenses – A portion of expenses that are allocated to all classes of the Fund.
38
- Transfer Agent Fee. Principal Shareholder Services, Inc. (“PSS”) has entered into a Transfer Agency Agreement with the Fund under which PSS provides transfer agent services to the Institutional Class shares at cost.
| | Retirement Class Shares Only |
- Service Fee – PMC has entered into a Services Agreement with PFI under which PMC performs personal services for shareholders.
- Administrative Service Fee – PMC has entered into an Administrative Services Agreement with PFI under which PMC provides transfer agent and corporate administrative services to the Fund. In addition, PMC has assumed the responsibility for communications with and recordkeeping services for beneficial owners of Fund shares.
- Distribution Fee — Each of the Funds has adopted a distribution plan under Rule 12b-1 of the Investment Company Act of 1940. Under the plan, the R-2, R-1, R-3, and R-4 classes of each Fund pay a distribution fee based on the average daily net asset value (NAV) of the Fund. These fees pay distribution and other expenses for the sale of Fund shares and for services provided to shareholders. Over time, these fees may exceed other types of sales charges.
Princor and PFD are the Funds’ principal underwriters for Institutional Class and Retirement Class shares. They may, from time-to-time, at their expense, pay a bonus or other consideration or incentive to dealers who have sold or may sell significant amounts of shares. Any such bonus or incentive program will not change the price paid by investors for the purchase of the Funds’ shares or the amount that any particular Fund receives as the proceeds from such sales. In addition, Princor, PFD, or their affiliates may provide financial support to dealers that sell shares of the Funds. This support is based primarily on the amount of sales of fund shares and/or total assets in the Funds. The amount of support may be affected by: total sales; net sales; levels of redemptions; the dealers’ support of, and participation in, Princor’s and PFD’s marketing programs and the extent of a dealer’s marketing programs relating to the Funds. Financial support to dealers may be made from payments from Princor’s and PFD’s resources and from their retention of underwriting concessions.
39
Distribution Plans and Additional Information
Regarding Intermediary Compensation
Institutional Class Shares
Neither Fund has adopted a 12b-1 Plan for Institutional Class shares.
Retirement Class Shares
PFI has adopted a distribution plan pursuant to Rule 12b-1 under the Investment Company Act for each of the Class R-1, R-2, R-3 and R-4 shares of PFI. Under the 12b-1 Plans, each Fund makes payments from its assets attributable to the particular share class to the Fund’s Distributor for distribution-related expenses and for providing services to shareholders of that share class. Payments under the 12b-1 plans are made by the Funds to the Distributor pursuant to the 12b-1 plans regardless of the expenses incurred by the Distributor. When the Distributor receives Rule 12b-1 fees, it may pay some or all of them to intermediaries whose customers are shareholders of the funds for sales support services and for providing services to shareholders of that share class. Intermediaries may include, among others, broker-dealers, registered investment advisors, banks, trust companies, pension plan consultants, retirement plan administrators, and insurance companies. Because Rule 12b-1 fees are paid out of Fund assets and are ongoing fees, over time they will increase the cost of your investment in the Funds and may cost you more than other types of sales charges.
The Distributors for the Retirement share classes of Principal Funds described in this prospectus are Princor and PFD, both wholly owned subsidiaries of PFG. The term “Distributors” as used in this section refers to both Princor and PFD.
The maximum annual Rule 12b-1 distribution and/or service fee (as a percentage of average daily net assets) for each of the above classes of the Funds are set forth below:
| Share Class | 12b-1 Fee |
| R-1 | 0.35% |
| R-2 | 0.30% |
| R-3 | 0.25% |
| R-4 | 0.10% |
Retirement Plan Services. Each Fund pays a Service Fee and Administrative Services Fee to PMC for providing services to retirement plan shareholders. PMC typically pays some or all of these fees to Principal Life Insurance Company, which has entered into an agreement to provide these services to the retirement plan shareholders. PMC may also enter into agreements with other intermediaries to provide these services, and pay some or all of the Fees to such intermediaries.
40
Plan recordkeepers, who may have affiliated financial intermediaries that sell shares of the funds, may be paid additional amounts. In addition, financial intermediaries may be affiliates of entities that receive compensation from the Distributor for maintaining retirement plan “platforms” that facilitate trading by affiliated and non-affiliated financial intermediaries and recordkeeping for retirement plans.
The amounts paid to plan recordkeepers for recordkeeping services, and their related service requirements may vary across fund groups and share classes. This may create an incentive for financial intermediaries and their Investment Representatives to recommend one fund complex over another or one class of shares over another.
Transfer Agency and Retirement Plan Services. PSS acts as the transfer agent for the Funds. As such, it registers the transfer, issuance, and redemption of fund shares and disburses dividends and other distributions to fund shareholders.
Many Fund shares are owned by financial intermediaries for the benefit of their customers. In those cases, the Funds often do not maintain an account for these investors. Thus, some or all of the transfer agency functions for these accounts are performed by the financial intermediaries. The transfer agent may pay these financial intermediaries fees for sub-transfer agency and/ or related recordkeeping services.
The amounts paid to financial intermediaries and plan record-keepers for sub-transfer agency and/or related recordkeeping services, and their related service requirements may vary across fund groups and share classes. This may create an incentive for financial intermediaries and their Investment Representatives to recommend one fund complex over another or one class of shares over another.
Other Payments to Financial Intermediaries
In addition to, rather than in lieu of, payments for distribution-related expenses and for providing services to shareholders pursuant to 12b-1 plans, the transfer agent or one of its affiliates may enter into agreements with intermediaries pursuant to which the intermediary will be paid for administrative, networking, recordkeeping, subtransfer agency and shareholder services. Such compensation is generally paid out of the Service Fees and Administrative Service Fees that are disclosed in this prospectus. Such compensation is generally based on the average asset value of fund shares for the relevant share class held by clients of the intermediary. Principal Life Insurance Company is one such intermediary that provides services to retirement plans, and it is typically paid some or all of the Service Fees and Administrative Service Fees pertaining to such plans.
41
In addition, Principal or its affiliates may pay compensation, from their own resources, to certain intermediaries that support the distribution or sale of shares of the Fund or provide services to Fund shareholders.
Plan recordkeepers, who may have affiliated financial intermediaries that sell shares of the funds, may be paid additional amounts. In addition, financial intermediaries may be affiliates of entities that receive compensation from the Distributor for maintaining retirement plan “platforms” that facilitate trading by affiliated and non-affiliated financialintermediaries and recordkeeping for retirement plans.
A number of factors may be considered in determining the amount of these additional payments, including each financial intermediary’s Fund sales and assets, as well as the willingness and ability of the financial intermediary to give the Distributor access to its Financial Professionals for educational and marketing purposes. In some cases, intermediaries will include the Funds on a “preferred list.” The Distributor’s goals include making the Financial Professionals who interact with current and prospective investors and shareholders more knowledgeable about the Funds so that they can provide suitable information and advice about the Funds and related investor services.
Expense Reimbursement
Additionally, the Distributor will, in some cases, provide payments to reimburse directly or indirectly the costs incurred by intermediaries and their associated Financial Professionals in connection with educational seminars and training and marketing efforts related to the Funds for the intermediaries’ employees and representatives and/or their clients and potential clients. The costs and expenses associated with these efforts may include travel, lodging, entertainment, and meals. The Distributor will also, in some cases, provide payment or reimbursement for expenses associated with qualifying dealers’ conferences, transactions (“ticket”) charges, and general marketing expenses.
Additional Information
Financial Professionals may receive some or all of the amounts paid to the intermediary with which he or she is associated. If one mutual fund sponsor pays more compensation than another, your Financial Professional and his or her intermediary may have an incentive to recommend one fund complex over another. Similarly, if your Financial Professional or his or her intermediary receives more compensation for one share class versus another, then they may have an incentive to recommend that share class.
42
As of January 1, 2009, the Distributor anticipates that intermediaries that will receive additional payments as described in the Additional Payments to Intermediaries section above (other than: Rule 12b-1 fees; and Expense Reimbursement) include, but are not limited to, the following:
| Acsensus | Merrill Lynch |
| Advantage Capital Corporation | MidAtlantic Capital |
| AG Edwards & Sons | Morgan Keegan |
| AIG Financial Advisors | Morgan Stanley |
| AIG SunAmerica | MSCS Financial Services |
| Alerus Retirement Solutions | Mutual Service Corp |
| American Century Investments | National Financial Services |
| American General Life Insurance | National Planning Corp. |
| Ameriprise | Nationwide |
| Associated Financial Group | Newport Retirement Plan Services |
| Associated Securities | Next Financial |
| AST Trust Company | NFP Securities |
| Bank of America Securities | North Ridge Securities |
| Bear Stearns | Northeast Retirement Services |
| Benefit Plan Administrators | Northwestern Mutual |
| Cadaret Grant | NRP Financial |
| Charles Schwab & Co. | Pershing |
| Charles Schwab Trust Company | Plan Administrators, Inc. |
| Citigroup Global Markets | Principal Global Investors |
| Citigroup/Smith Barney | Principal Life Insurance Company |
| Commonwealth Financial Network | Principal Life Trust Company |
| CompuSys | ProEquities |
| CPI | Prudential |
| Daily Access Corporation | Raymond James |
| Digitial Retirement Solutions | RBC Capital Markets |
| Edward Jones | RBC Dain Rauscher |
| ePlan Services | Reliance Trust Company |
| Expert Plan | Robert W. Baird & Co. |
| Farmers Financial | Royal Alliance Associates |
| Fidelity Brokerage Services | Saxony Securities |
| Financial Network Investment Corp | Scottrade |
| First Allied Securities | Securian Financial Services |
| First American Bank | Securities America |
| First Clearing | SII Investments |
| Foothill Securities | Southwest Securities |
| FSC Securities | Standard Retirement Services |
| G.A. Repple | Stifel Nicolaus & Company |
| Geneos Wealth Management | TD Ameritrade |
| Genesis Employee Benefit | Texas Pension Consultants |
| GPC Securities, Inc. | The Investment Center |
| Gunn Allen Financial | Thrivent Financial |
| GWFS Equities | Thrivent Investment Management |
43
| H. Beck, Inc. | TransAm Securities |
| Howe Barnes Investment | Triad Advisors |
| ICMA-Retirement Corp. | TruSource |
| ING Financial Partners | U.S. Wealth Advisors |
| Investacorp | UBS Financial Services |
| J.W. Cole Financial | Unison |
| James T. Borello & Co. | VSR Financial Services |
| Janney Montgomery Scott | Wachovia |
| JP Morgan | WaMu Investments |
| July Business Services | Waterstone Financial Group |
| Key Investments | Wedbush Morgan Securities |
| Lincoln Financial | Wells Fargo |
| Lincoln Investment Planning | Willmington Trust Company |
| LPL | Workman Securities |
| Mercer HR Services | WRP Investments |
To obtain a current list of such firms, call 1-800-547-7754.
Please speak with your Financial Professional to learn more about the total amounts paid to your Financial Professional and his or her intermediary by the Funds, the Distributor and its affiliates, and by sponsors of other mutual funds he or she may recommend to you. You should also carefully review disclosures made by your Financial Professional at the time of purchase. Although a Fund may use brokers who sell shares of the Funds to effect portfolio transactions, the sale of shares is not considered as a factor by the Fund’s Sub-Advisors when selecting brokers to effect portfolio transactions.
Your intermediary may charge fees and commissions, including processing fees, in addition to those described in this prospectus. The amount and applicability of any such fee is determined and disclosed separately by the intermediary. You should ask your Financial Professional for information about any fees and/or commissions that are charged.
| | Dividends and Distributions |
The Acquired and Acquiring Funds pay their net investment income on an annual basis. Payments are made to shareholders of record on the business day prior to the payment date. You may ask to have your dividends paid to you in cash. If you do not request cash payments, your dividend payment will be reinvested back into additional shares of the Funds.
Net realized capital gains, if any, are distributed annually. Generally the distribution is made on the eighth business day of December. Payments are made to shareholders of record on the business day prior to the payable date. Capital gains may be taxable at different rates, depending on the length of time that a Fund holds it assets.
44
NOTES:
• A Fund’s declaration of income dividends and capital gains has the effect of reducing the share price by the amount of the dividend or capital gain declared.
• Distributions from a Fund, whether received in cash or reinvested in additional shares, may be subject to federal (and state) income tax.
• For these reasons, buying shares of a Fund shortly before it makes a distribution may be disadvantageous to you.
• Special tax rules apply to dividends and distributions paid to retirement plans.
The shares of the Acquired and Acquiring Funds are bought and sold at the current share price. The share price of each class of each Fund is calculated each day the NYSE is open (shares are not priced on the days on which the NYSE is closed for trading, generally New Year’s Day, Martin Luther King, Jr. Day, Washington’s Birthday/Presidents’ Day, Good Friday, Memorial Day, Independence Day, Labor Day, Thanksgiving Day, and Christmas). The share price is determined as of the close of business of the NYSE (normally 3:00 p.m. Central Time). When an order to buy or sell shares is received, the share price used to fill the order is the next price calculated after the order is received in good order by us at our transaction processing center. In order for us to process your purchase order on the day it is received, we must receive the order (with complete information): • on a day that the NYSE is open and • prior to the close of trading on the NYSE (normally 3 p.m. Central Time).
Orders received after the close of the NYSE or on days that the NYSE is not open will be processed on the next day that the NYSE is open for normal trading. If we receive an application or purchase request for a new mutual fund account or subsequent purchase into an existing account that is accompanied by a check and the application or purchase request does not contain complete information, we may hold the application (and check) for up to two business days while we attempt to obtain the necessary information. If we receive the necessary information within two business days, we will process the order using the next share price calculated. If we do not receive the information within two business days, the application and check will be returned to you.
45
For each of the Funds, the share price is calculated by:
- taking the current market value of the total assets of the Fund
- subtracting liabilities of the Fund
- dividing the remainder proportionately into the classes of the Fund
- subtracting the liability of each class
- dividing the remainder by the total number of shares owned in that class.
- If market quotations are not readily available for a security owned by a Fund, its fair value is determined using a policy adopted by the Directors. Fair valuation pricing is subjective and creates the possibility that the fair value determined for a security may differ materially from the value that could be realized upon the sale of the security.
- A Fund’s securities may be traded on foreign securities markets that generally complete trading at various times during the day prior to the close of the NYSE. Generally, the values of foreign securities used in computing a Fund’s NAV are the market quotations as of the close of the foreign market. Foreign securities and currencies are also converted to U.S. dollars using the exchange rate in effect at the close of the NYSE. Occasionally, events affecting the value of foreign securities occur when the foreign market is closed and the NYSE is open. PFI has adopted policies and procedures to “fair value” some or all securities held by a Fund if significant events occur after the close of the market on which the foreign securities are traded but before the Fund’s NAV is calculated.
Significant events can be specific to a single security or can include events that affect a particular foreign market or markets. A significant event can also include a general market movement in the U.S. securities markets. If PMC believes that the market value of any or all of the foreign securities is materially affected by such an event, the securities will be valued, and the Fund’s NAV will be calculated, using the policy adopted by PFI. These fair valuation procedures are intended to discourage shareholders from investing in the Funds for the purpose of engaging in market timing or arbitrage transactions.
The trading of foreign securities generally or in a particular country or countries may not take place on all days the NYSE is open, or may trade on days the NYSE is closed. Thus, the value of the foreign securities held by the Fund may change on days when shareholders are unable to purchase or redeem shares.
46
- Certain securities issued by companies in emerging market countries may have more than one quoted valuation at any point in time. These may be referred to as local price and premium price. The premium price is often a negotiated price that may not consistently represent a price at which a specific transaction can be effected. PFI has a policy to value such securities at a price at which the Sub-Advisor expects the securities may be sold.
Purchases, Redemptions, and Exchanges of Shares
The purchase, redemption and exchange procedures with respect to shares of the Acquired and Acquiring Funds are the same. These procedures vary based on the class of shares owned.
Purchases of Shares
Institutional Class shares may be purchased from Princor or PFD, the principal underwriters for this class. There are no sales charges on Institutional Class shares. There are no restrictions on amounts to be invested in Institutional Class shares.
Shareholder accounts for the Fund are maintained under an open account system. Under this system, an account is opened and maintained for each investor. Each investment is confirmed by sending the investor a statement of account showing the current purchase or sale and the total number of shares owned. The statement of account is treated by the Fund as evidence of ownership of Fund shares. Share certificates are not issued.
The Fund may reject or cancel any purchase orders for any reason. For example, the Fund does not permit market timing because short-term or other excessive trading into and out of the Funds may harm performance by disrupting portfolio management strategies and by increasing expenses. Accordingly, the Fund may reject any purchase orders from market timers or investors that, in PMC’s opinion, may be disruptive to the Fund. For these purposes, PMC may consider an investor’s trading history in the Fund or other Funds sponsored by Principal Life and accounts under common ownership or control. PMC may recommend to the Board, and the Board may elect, to close certain funds to new and existing investors.
Retirement Class Shares may be purchased:
• via the internet
• standard method of accepting data for plans with fewer than 1,000 current and terminated (within the last five years) members
• available 7 days a week (7 a.m. to 9 p.m. Central Time)
• using a modem
• plan contributions transferred electronically
• standard method of accepting data for plans with more than 1,000 current and terminated (within the last five years) members
• available 24 hours a day, 7 days a week
47
To eliminate the need for safekeeping, the Funds will not issue certificates for shares. The Funds may periodically close to new purchases of shares or refuse any order to buy shares if PMC determines that doing so would be in the best interests of the Fund and its shareholders.
Redemptions of Shares
Institutional Class shares of the Funds may be redeemed upon request. There is no charge for the redemption. Shares are redeemed at the NAV per share next computed after the request is received by a Fund in proper and complete form. The Funds generally send payment for shares sold the business day after the sell order is received. Under unusual circumstances, the Funds may suspend redemptions, or postpone payment for more than seven days, as permitted by federal securities law.
Retirement Class Shares may be sold back to the Funds any day the NYSE is open, subject to any restrictions imposed by a plan. For more information about how to sell shares of the Funds, including any charges that a plan may impose, please consult the plan. The Funds generally send payment for shares sold the business day after the sell order is received. Under unusual circumstances, the Funds may suspend redemptions, or postpone payment for more than seven days, as permitted by federal securities law.
Payment for shares of the Funds tendered for redemption is ordinarily made by check. However, the Funds may determine that it would be detrimental to the remaining shareholders of a Fund to make the payment of a redemption order wholly or partly in cash. Under certain circumstances, therefore, each of the Funds may pay redemption proceeds in whole or in part by a distribution “in kind” of securities from the Fund’s portfolio in lieu of cash. If a Fund pays the redemption proceeds in kind, the redeeming shareholder might incur brokerage or other costs in selling the securities for cash. Each Fund will value securities used to pay redemptions in kind using the same method the Fund uses to value its portfolio securities as described in this proxy statement/prospectus.
The Board of Directors of the Acquiring and Acquired Funds has determined that it is not necessary to impose a fee upon the redemption of Retirement and Institutional Class shares because both Funds have adopted transfer restrictions as described in “Exchange of Fund Shares.”
Exchanges
An exchange between Funds is a redemption of shares of one Fund and a concurrent purchase of shares in another Fund with the redemption proceeds. A shareholder, including a beneficial owner of shares held in nominee name or a participant in a participant-directed employee benefit plan, may exchange Fund shares under certain circumstances. In addition to any restrictions an
48
intermediary or an employee benefit plan imposes, Fund shares may be exchanged, without charge, for shares of any other Fund of PFI, provided that:
• the shareholder has not exchanged shares of the Fund within 30 days preceding the exchange, unless the shareholder is exchanging into the Money Market Fund,
• the share class of such other Fund is available through the plan, and
• the share class of such other Fund is available in the shareholder’s state of residence.
All exchanges completed on the same day are considered a single exchange for purposes of this exchange limitation. In addition, the Fund will reject an order to purchase shares of any Fund, except shares of the Money Market Fund, if the shareholder redeemed shares from that Fund within the preceding 30-day period. The 30-day exchange or purchase restriction does not apply to exchanges or purchases made on a scheduled basis such as scheduled periodic portfolio rebalancing transactions.
If Fund shares are purchased through an intermediary that is unable or unwilling to impose the 30-day exchange restriction described above, Fund management may waive this restriction in lieu of the exchange limitation that the intermediary is able to impose if, in management’s judgment, such limitation is reasonably likely to prevent excessive trading in Fund shares. In order to prevent excessive exchanges, and under other circumstances where the Fund Board of Directors or PMC believes it is in the best interests of the Fund, the Fund reserves the right to revise or terminate this exchange privilege, limit the amount or further limit the number of exchanges, reject any exchange or close an account.
Frequent Purchases and Redemptions
The PFI Funds are not designed for, and do not knowingly accommodate, frequent purchases and redemptions of fund shares by investors. If you intend to trade frequently and/or use market timing investment strategies, you should not purchase these Funds.
Frequent purchases and redemptions pose a risk to the PFI Funds because they may:
• Disrupt the management of the PFI Funds by:
• forcing the PFI Funds to hold short-term (liquid) assets rather than investing for long term growth, which results in lost investment opportunities for the Fund; and
• causing unplanned portfolio turnover;
• Hurt the portfolio performance of the Funds; and
• Increase expenses of the PFI Funds due to:
• increased broker-dealer commissions and
• increased recordkeeping and related costs.
49
Certain PFI Funds may be at greater risk of harm due to frequent purchases and redemptions. For example, those Funds that invest in foreign securities, may appeal to investors attempting to take advantage of time-zone arbitrage. It is necessary to identify such abusive trading practices because the abuses described above will negatively impact the Fund.
The PFI Funds have adopted procedures to “fair value” foreign securities under certain circumstances, which are intended, in part, to discourage excessive trading of shares of the Funds. The Board of Directors of the Funds has also adopted policies and procedures with respect to frequent purchases and redemptions of shares of the Funds. The Funds monitor trading activity to identify and take action against abuses. While the policies and procedures are designed to identify and protect against abusive trading practices, there can be no certainty that all instances of abusive trading will be identified and prevented and the Funds may be negatively impacted and may cause investors to suffer the harms described. When abusive trading is identified, the policies and procedures will be applied in a fair and uniform manner. The following actions may include, but not limited to:
• Rejecting exchange instructions from shareholder or other person authorized by the shareholder to direct exchanges;
• Restricting submission of exchange requests by, for example, allowing exchange requests to be submitted by 1st class U.S. mail only and disallowing requests made by facsimile, overnight courier, telephone or via the internet;
• Limiting the number of exchanges during a year;
• Requiring a holding period of a minimum of 30 days before permitting exchanges among the Funds where there is evidence of at least one round-trip exchange (exchange or redemption of shares that were purchased within 30 days of the exchange/redemption); and
• Taking such other action as directed by the Fund.
The Funds have reserved the right to accept or reject, without prior written notice, any exchange requests. In some instances, an exchange may be completed prior to a determination of abusive trading. In those instances, we will reverse the exchange and return the account holdings to the positions held prior to the exchange. We will give the shareholder that requested the exchange notice in writing in this instance.
Shareholders are responsible for federal income tax (and any other taxes, including state and local income taxes, if applicable) on dividends and capital gains distributions whether such dividends or distributions are paid in cash or reinvested in additional shares.
50
Generally, dividends paid by the Funds from net short-term capital gains will be taxed as ordinary income. Distributions properly designated by a Fund as deriving from net gains on securities held for more than one year are taxable as such (generally at a 15% tax rate), regardless of how long you have held your shares.
A dividend or distribution made shortly after the purchase of shares of a PFI Fund by a shareholder, although in effect a return of capital to that shareholder, would be taxable to that shareholder as described above.
The information contained in this Proxy Statement/Prospectus is not a complete description of the federal, state, local, or foreign tax consequences of investing in the Fund. You should consult your tax advisor before investing in the Fund.
| | Portfolio Holdings Information |
A description of the PFI’s policies and procedures with respect to disclosure of the Funds’ portfolio securities is available in the Statement of Additional Information.
Voting procedures. If you complete and return the enclosed proxy ballot, the persons named as proxies will vote your shares as you indicate or for approval of each matter for which there is no indication. You may revoke your proxy at any time prior to the proxy’s exercise by: (i) sending written notice to the Secretary of Principal Funds, Inc. at Principal Financial Group, Des Moines, Iowa 50392-2080, prior to the Meeting; (ii) subsequent execution and return of another proxy prior to the Meeting; or (iii) being present and voting in person at the Meeting after giving oral notice of the revocation to the Chairman of the Meeting.
Voting rights. Only shareholders of record at the close of business on February 27, 2009 (the “Record Date”), are entitled to vote. The shareholders of each class of shares of the Acquired Fund will vote together on the proposed Reorganization relating to that Fund and on any other matter submitted to such shareholders. You are entitled to one vote on each matter submitted to the shareholders of the Acquired Fund for each share of the Fund that you hold, and fractional votes for fractional shares held. The Proposal requires for approval the affirmative vote of a “Majority of the Outstanding Voting Securities,” which is a term defined in the 1940 Act to mean, with respect to the Acquired Fund, the affirmative vote of the lesser of (1) 67% or more of the voting securities of the Fund present at the meeting of the Fund, if the holders of more than 50% of the outstanding voting securities of the Fund are present in person or by proxy, or (2) more than 50% of the outstanding voting securities of the Fund.
51
The number of votes eligible to be cast at the meeting as of the Record Date and other share ownership information are set forth below under the heading “Outstanding Shares and Share Ownership” in this Proxy Statement/ Prospectus.
Quorum requirements. A quorum must be present at the Meeting for the transaction of business. The presence in person or by proxy of one-third of the shares of the Acquired Fund outstanding at the close of business on the Record Date constitutes a quorum for a meeting of that Fund. Abstentions and broker non-votes (proxies from brokers or nominees indicating that they have not received instructions from the beneficial owners on an item for which the broker or nominee does not have discretionary power) are counted toward a quorum but do not represent votes cast for any issue. Under the 1940 Act, the affirmative vote necessary to approve a Proposal may be determined with reference to a percentage of votes present at the Meeting, which would have the effect of counting abstentions as if they were votes against a Proposal.
In the event the necessary quorum to transact business or the vote required to approve a Proposal is not obtained at the Meeting, the persons named as proxies or any shareholder present at the Meeting may propose one or more adjournments of the Meeting in accordance with applicable law to permit further solicitation of proxies. Any such adjournment as to the Proposal or any other matter will require the affirmative vote of the holders of a majority of the shares of the Acquired Fund cast at the Meeting. The persons named as proxies and any shareholder present at the Meeting will vote for or against any adjournment in their discretion.
Solicitation procedures. PFI intends to solicit proxies by mail. Officers or employees of PFI, PMC or their affiliates may make additional solicitations by telephone, internet, facsimile or personal contact. They will not be specially compensated for these services. Brokerage houses, banks and other fiduciaries may be requested to forward soliciting materials to their principals and to obtain authorization for the execution of proxies. For those services, they will be reimbursed by PMC for their out-of-pocket expenses.
Expenses of the Meeting. The expenses of the Meeting for the Acquired Fund will be treated as an expense related to the Reorganization and will be paid by the Acquired Fund.
52
OUTSTANDING SHARES AND SHARE OWNERSHIP
The following table shows as of February 27, 2009, the Record Date, the number of shares outstanding for each class of shares of the Acquired and Acquiring Funds:
| MidCap Growth Fund II | MidCap Growth Fund III |
| (Acquired Fund) | (Acquiring Fund) |
| | Shares | | Shares |
| Share Class | Outstanding | Share Class | Outstanding |
| Institutional | | Institutional | |
| R-1 | | R-1 | |
| R-2 | | R-2 | |
| R-3 | | R-3 | |
| R-4 | | R-4 | |
| R-5 | | R-5 | |
As of the ______________________, the Record Date, the Directors and Officers of PFI together owned less than 1% of the outstanding shares of any class of shares of the Acquired or Acquiring Funds.
As of the ______________________, the Record Date, the following persons owned of record, or were known by PFI to own beneficially, 5% or more of the outstanding shares of any class of shares of the Acquired Fund:
| | | Percentage |
| Share | | of |
| Class | Name/Address of Shareholder | Ownership |
| | Acquired Fund 5% owners here | |
As of the ______________________, the Record Date, the following persons owned of record, or were known by PFI to own beneficially, 5% or more of the outstanding shares of any class of shares of the Acquiring Fund:
| | | Percentage |
| Share | | of |
| Class | Name/Address of Shareholder | Ownership |
| | Acquiring Fund 5% owners here | |
53
FINANCIAL HIGHLIGHTS
The financial highlights table for each of the Acquired Fund and the Acquiring Fund is intended to help investors understand the financial performance of each Fund for the past five fiscal years (or since inception in the case of a Fund in operation for less than five years). Certain information reflects financial results for a single share of a Fund. The total returns in the tables represent the rate that an investor would have earned (or lost) on an investment in a particular Fund (assuming reinvestment of all dividends and distributions). Information for the fiscal years ended October 31, 2004 through October 31, 2008 has been audited by Ernst & Young LLP, Independent Registered Public Accounting Firm, whose report, along with each Fund’s financial statements, is included in PFI’s Annual Report to Shareholders for the fiscal year ended October 31, 2008. Copies of this report are available on request as described above.
54
| FINANCIAL HIGHLIGHTS (Continued) |
| PRINCIPAL FUNDS, INC. |
Selected data for a share of Capital Stock outstanding throughout each year ended October 31 (except as noted):
| MIDCAP GROWTH FUND II(b) | | 2008 | 2007 | 2006 | 2005(a) |
| Institutional shares | | | | | |
| Net Asset Value, Beginning of Period | $ 11.99 | $ 11.90 | $ 10.80 | $ 10.00 |
| Income from Investment Operations: | | | | | |
| Net Investment Income (Operating Loss)(c) | | (0.03) | (0.04) | (0.02) | (0.03) |
| Net Realized and Unrealized Gain (Loss) | | | |
| on Investments | | (5.26) | 1.32 | 1.16 | 0.83 |
| Total From Investment Operations | (5.29) | 1.28 | 1.14 | 0.80 |
| Less Dividends and Distributions: | | | | | |
| Distributions from Realized Gains | (0.99) | (1.19) | (0.04) | – |
| Total Dividends and Distributions | (0.99) | (1.19) | (0.04) | – |
| Net Asset Value, End of Period | | $ 5.71 | $ 11.99 | $ 11.90 | $ 10.80 |
| Total Return | | (47.95)% | 11.20% | 10.60% | 8.00%(d) |
| Ratio/Supplemental Data: | | | | | |
| Net Assets, End of Period | | | | | |
| (in thousands) | $ 191,051 | $ 540,371 | $ 538,894 | $ 445,559 |
| Ratio of Expenses to Average | | | | | |
| Net Assets | | 1.01% | 1.00% | 1.00% | 1.00%(e) |
| Ratio of Net Investment Income to | | | | |
| Average Net Assets | | (0.33)% | (0.34)% | (0.14)% | (0.29)%(e) |
| Portfolio Turnover Rate | | 224.7% | 194.8% | 160.5% | 126.4%(e) |
| |
| MIDCAP GROWTH FUND II(b) | | 2008 | 2007 | 2006 | 2005(a) |
| R-1 shares | | | | | |
| Net Asset Value, Beginning of Period | $ 11.62 | $ 11.66 | $ 10.68 | $ 10.00 |
| Income from Investment Operations: | | | | | |
| Net Investment Income (Operating Loss)(c) | | (0.11) | (0.14) | (0.14) | (0.11) |
| Net Realized and Unrealized Gain (Loss) | | | |
| on Investments | | (5.05) | 1.29 | 1.16 | 0.79 |
| Total From Investment Operations | (5.16) | 1.15 | 1.02 | 0.68 |
| Less Dividends and Distributions: | | | | | |
| Distributions from Realized Gains | (0.99) | (1.19) | (0.04) | – |
| Total Dividends and Distributions | (0.99) | (1.19) | (0.04) | – |
| Net Asset Value, End of Period | | $ 5.47 | $ 11.62 | $ 11.66 | $ 10.68 |
| Total Return | | (48.39)% | 10.24% | 9.59% | 6.80%(d) |
| Ratio/Supplemental Data: | | | | | |
| Net Assets, End of Period | | | | | |
| (in thousands) | | $ 1,454 | $ 3,131 | $ 1,958 | $ 47 |
| Ratio of Expenses to Average | | | | | |
| Net Assets | | 1.89% | 1.88% | 1.88% | 1.88%(e) |
| Ratio of Net Investment Income to | | | | |
| Average Net Assets | | (1.22)% | (1.22)% | (1.20)% | (1.28)%(e) |
| Portfolio Turnover Rate | | 224.7% | 194.8% | 160.5% | 126.4%(e) |
55
| FINANCIAL HIGHLIGHTS (Continued) |
| PRINCIPAL FUNDS, INC. |
| |
| MIDCAP GROWTH FUND II(b) | 2008 | 2007 | 2006 | 2005(a) |
| R-2 shares | | | | |
| Net Asset Value, Beginning of Period | $ 11.67 | $ 11.68 | $ 10.69 | $ 10.00 |
| Income from Investment Operations: | | | | |
| Net Investment Income (Operating Loss)(c) | (0.10) | (0.12) | (0.10) | (0.10) |
| Net Realized and Unrealized Gain (Loss) | | | |
| on Investments | (5.08) | 1.30 | 1.13 | 0.79 |
| Total From Investment Operations | (5.18) | 1.18 | 1.03 | 0.69 |
| Less Dividends and Distributions: | | | | |
| Distributions from Realized Gains | (0.99) | (1.19) | (0.04) | – |
| Total Dividends and Distributions | (0.99) | (1.19) | (0.04) | – |
| Net Asset Value, End of Period | $ 5.50 | $ 11.67 | $ 11.68 | $ 10.69 |
| Total Return | (48.35)% | 10.49% | 9.67% | 6.90%(d) |
| Ratio/Supplemental Data: | | | | |
| Net Assets, End of Period | | | | |
| (in thousands) | $ 1,150 | $ 2,641 | $ 1,707 | $ 210 |
| Ratio of Expenses to Average | | | | |
| Net Assets | 1.76% | 1.75% | 1.75% | 1.75%(e) |
| Ratio of Net Investment Income to | | | | |
| Average Net Assets | (1.09)% | (1.09)% | (0.89)% | (1.15)%(e) |
| Portfolio Turnover Rate | 224.7% | 194.8% | 160.5% | 126.4%(e) |
| |
| MIDCAP GROWTH FUND II(b) | 2008 | 2007 | 2006 | 2005(a) |
| R-3 shares | | | | |
| Net Asset Value, Beginning of Period | $ 11.73 | $ 11.72 | $ 10.70 | $ 10.00 |
| Income from Investment Operations: | | | | |
| Net Investment Income (Operating Loss)(c) | (0.08) | (0.10) | (0.10) | (0.08) |
| Net Realized and Unrealized Gain (Loss) | | | |
| on Investments | (5.12) | 1.30 | 1.16 | 0.78 |
| Total From Investment Operations | (5.20) | 1.20 | 1.06 | 0.70 |
| Less Dividends and Distributions: | | | | |
| Distributions from Realized Gains | (0.99) | (1.19) | (0.04) | – |
| Total Dividends and Distributions | (0.99) | (1.19) | (0.04) | – |
| Net Asset Value, End of Period | $ 5.54 | $ 11.73 | $ 11.72 | $ 10.70 |
| Total Return | (48.27)% | 10.64% | 9.95% | 7.00%(d) |
| Ratio/Supplemental Data: | | | | |
| Net Assets, End of Period | | | | |
| (in thousands) | $ 4,701 | $ 11,328 | $ 9,831 | $ 1,289 |
| Ratio of Expenses to Average | | | | |
| Net Assets | 1.58% | 1.57% | 1.57% | 1.57%(e) |
| Ratio of Net Investment Income to | | | | |
| Average Net Assets | (0.91)% | (0.91)% | (0.88)% | (0.95)%(e) |
| Portfolio Turnover Rate | 224.7% | 194.8% | 160.5% | 126.4%(e) |
56
| FINANCIAL HIGHLIGHTS (Continued) |
| PRINCIPAL FUNDS, INC. |
| |
| MIDCAP GROWTH FUND II(b) | 2008 | 2007 | 2006 | 2005(a) |
| R-4 shares | | | | |
| Net Asset Value, Beginning of Period | $ 11.78 | $ 11.75 | $ 10.71 | $ 10.00 |
| Income from Investment Operations: | | | | |
| Net Investment Income (Operating Loss)(c) | (0.06) | (0.08) | (0.08) | (0.08) |
| Net Realized and Unrealized Gain (Loss) | | | |
| on Investments | (5.15) | 1.30 | 1.16 | 0.79 |
| Total From Investment Operations | (5.21) | 1.22 | 1.08 | 0.71 |
| Less Dividends and Distributions: | | | | |
| Distributions from Realized Gains | (0.99) | (1.19) | (0.04) | – |
| Total Dividends and Distributions | (0.99) | (1.19) | (0.04) | – |
| Net Asset Value, End of Period | $ 5.58 | $ 11.78 | $ 11.75 | $ 10.71 |
| Total Return | (48.14)% | 10.79% | 10.12% | 7.10%(d) |
| Ratio/Supplemental Data: | | | | |
| Net Assets, End of Period | | | | |
| (in thousands) | $ 5,183 | $ 11,097 | $ 7,179 | $ 808 |
| Ratio of Expenses to Average | | | | |
| Net Assets | 1.39% | 1.38% | 1.38% | 1.38%(e) |
| Ratio of Net Investment Income to | | | | |
| Average Net Assets | (0.71)% | (0.72)% | (0.66)% | (0.88)%(e) |
| Portfolio Turnover Rate | 224.7% | 194.8% | 160.5% | 126.4%(e) |
| |
| MIDCAP GROWTH FUND II(b) | 2008 | 2007 | 2006 | 2005(a) |
| R-5 shares | | | | |
| Net Asset Value, Beginning of Period | $ 11.84 | $ 11.79 | $ 10.73 | $ 10.00 |
| Income from Investment Operations: | | | | |
| Net Investment Income (Operating Loss)(c) | (0.06) | (0.07) | (0.06) | (0.05) |
| Net Realized and Unrealized Gain (Loss) | | | |
| on Investments | (5.17) | 1.31 | 1.16 | 0.78 |
| Total From Investment Operations | (5.23) | 1.24 | 1.10 | 0.73 |
| Less Dividends and Distributions: | | | | |
| Distributions from Realized Gains | (0.99) | (1.19) | (0.04) | – |
| Total Dividends and Distributions | (0.99) | (1.19) | (0.04) | – |
| Net Asset Value, End of Period | $ 5.62 | $ 11.84 | $ 11.79 | $ 10.73 |
| Total Return | (48.06)% | 10.94% | 10.29% | 7.30%(d) |
| Ratio/Supplemental Data: | | | | |
| Net Assets, End of Period | | | | |
| (in thousands) | $ 2,127 | $ 8,786 | $ 5,270 | $ 1,000 |
| Ratio of Expenses to Average | | | | |
| Net Assets | 1.27% | 1.26% | 1.26% | 1.26%(e) |
| Ratio of Net Investment Income to | | | | |
| Average Net Assets | (0.60)% | (0.60)% | (0.48)% | (0.55)%(e) |
| Portfolio Turnover Rate | 224.7% | 194.8% | 160.5% | 126.4%(e) |
| (a) | Period from December 29, 2004, date operations commenced, through October 31, 2005. |
| |
| (b) | Effective June 13, 2008, Partners MidCap Growth Fund II changed its name to MidCap Growth Fund II. |
| |
| (c) | Calculated based on average shares outstanding during the period. |
| |
| (d) | Total return amounts have not been annualized. |
| |
| (e) | Computed on an annualized basis. |
| |
57
| | FINANCIAL HIGHLIGHTS (Continued)
PRINCIPAL FUNDS, INC. |
Selected data for a share of Capital Stock outstanding throughout each year ended October 31 (except as noted):
| MIDCAP GROWTH FUND III(b) | 2008 | 2007 | 2006 | 2005(a) |
| Class A shares | | | | |
| Net Asset Value, Beginning of Period | $ 11.99 | $ 9.46 | $ 8.77 | $ 8.40 |
| Income from Investment Operations: | | | | |
| Net Investment Income (Operating Loss)(c) | (0.10) | (0.12) | (0.09) | (0.04) |
| Net Realized and Unrealized Gain (Loss) | | | |
| on Investments | (4.92) | 2.93 | 0.85 | 0.41 |
| Total From Investment Operations | (5.02) | 2.81 | 0.76 | 0.37 |
| Less Dividends and Distributions: | | | | |
| Distributions from Realized Gains | (0.77) | (0.28) | (0.07) | – |
| Total Dividends and Distributions | (0.77) | (0.28) | (0.07) | – |
| Net Asset Value, End of Period | $ 6.20 | $ 11.99 | $ 9.46 | $ 8.77 |
| Total Return(d) | (44.68)% | 30.43% | 8.64% | 4.40%(e) |
| Ratio/Supplemental Data: | | | | |
| Net Assets, End of Period | | | | |
| (in thousands) | $ 21,252 | $ 39,400 | $ 27,926 | $ 25,628 |
| Ratio of Expenses to Average | | | | |
| Net Assets(f) | 1.73% | 1.75% | 1.75% | 1.75%(g) |
| Ratio of Net Investment Income to | | | | |
| Average Net Assets | (1.05)% | (1.17)% | (0.97)% | (1.40)%(g) |
| Portfolio Turnover Rate | 167.3% | 144.9% | 145.8% | 185.7%(h) |
| |
| MIDCAP GROWTH FUND III(b) | 2008 | 2007 | 2006 | 2005(a) |
| Class B shares | | | | |
| Net Asset Value, Beginning of Period | $ 11.78 | $ 9.36 | $ 8.75 | $ 8.40 |
| Income from Investment Operations: | | | | |
| Net Investment Income (Operating Loss)(c) | (0.17) | (0.20) | (0.16) | (0.06) |
| Net Realized and Unrealized Gain (Loss) | | | |
| on Investments | (4.80) | 2.90 | 0.84 | 0.41 |
| Total From Investment Operations | (4.97) | 2.70 | 0.68 | 0.35 |
| Less Dividends and Distributions: | | | | |
| Distributions from Realized Gains | (0.77) | (0.28) | (0.07) | – |
| Total Dividends and Distributions | (0.77) | (0.28) | (0.07) | – |
| Net Asset Value, End of Period | $ 6.04 | $ 11.78 | $ 9.36 | $ 8.75 |
| Total Return(d) | (45.07)% | 29.55% | 7.74% | 4.17%(e) |
| Ratio/Supplemental Data: | | | | |
| Net Assets, End of Period | | | | |
| (in thousands) | $ 5,477 | $ 12,895 | $ 10,516 | $ 10,436 |
| Ratio of Expenses to | | | | |
| Average Net Assets(f) | 2.50% | 2.50% | 2.50% | 2.50%(g) |
| Ratio of Net Investment Income to | | | | |
| Average Net Assets | (1.81)% | (1.91)% | (1.71)% | (2.14)%(g) |
| Portfolio Turnover Rate | 167.3% | 144.9% | 145.8% | 185.7%(h) |
58
| FINANCIAL HIGHLIGHTS (Continued) |
| PRINCIPAL FUNDS, INC. |
| |
| MIDCAP GROWTH FUND III(b) | 2008 | 2007(i) | | | |
| Class C shares | | | | | |
| Net Asset Value, Beginning of Period | $ 11.99 | $ 9.79 | | | |
| Income from Investment Operations: | | | | | |
| Net Investment Income (Operating Loss)(c) | (0.17) | (0.17) | | | |
| Net Realized and Unrealized Gain (Loss) | | | | |
| on Investments | (4.90) | 2.37 | | | |
| Total From Investment Operations | (5.07) | 2.20 | | | |
| Less Dividends and Distributions: | | | | | |
| Distributions from Realized Gains | (0.77) | – | | | |
| Total Dividends and Distributions | (0.77) | – | | | |
| Net Asset Value, End of Period | $ 6.15 | $ 11.99 | | | |
| |
| Total Return(d) | (45.12)% | 22.47%(e) | | | |
| Ratio/Supplemental Data: | | | | | |
| Net Assets, End of Period | | | | | |
| (in thousands) | $ 778 | $ 1,070 | | | |
| Ratio of Expenses to Average | | | | | |
| Net Assets(f) | 2.50% | 2.50%(g) | | | |
| Ratio of Net Investment Income to | | | | | |
| Average Net Assets | (1.82)% | (1.94)%(g) | | | |
| Portfolio Turnover Rate | 167.3% | 144.9% | | | |
| |
| MIDCAP GROWTH FUND III(b) | 2008 | 2007 | 2006 | 2005 | 2004 |
| Class J shares | | | | | |
| Net Asset Value, Beginning of Period | $ 11.50 | $ 9.08 | $ 8.43 | $ 7.20 | $ 7.03 |
| Income from Investment Operations: | | | | | |
| Net Investment Income (Operating Loss)(c) | (0.09) | (0.11) | (0.09) | (0.12) | (0.12) |
| Net Realized and Unrealized Gain (Loss) | | | | |
| on Investments | (4.70) | 2.81 | 0.81 | 1.35 | 0.29 |
| Total From Investment Operations | (4.79) | 2.70 | 0.72 | 1.23 | 0.17 |
| Less Dividends and Distributions: | | | | | |
| Distributions from Realized Gains | (0.77) | (0.28) | (0.07) | – | – |
| Total Dividends and Distributions | (0.77) | (0.28) | (0.07) | – | – |
| Net Asset Value, End of Period | $ 5.94 | $ 11.50 | $ 9.08 | $ 8.43 | $ 7.20 |
| Total Return(d) | (44.57)% | 30.49% | 8.51% | 17.08% | 2.42% |
| Ratio/Supplemental Data: | | | | | |
| Net Assets, End of Period | | | | | |
| (in thousands) | $ 20,178 | $ 38,498 | $ 27,963 | $ 22,011 | $ 15,436 |
| Ratio of Expenses to | | | | | |
| Average Net Assets | 1.67% | 1.72% | 1.78% | 1.89% | 1.92% |
| Ratio of Gross Expenses to | | | | | |
| Average Net Assets(j) | – | – | 1.78% | 1.89% | 2.02%(k) |
| Ratio of Net Investment Income to | | | | | |
| Average Net Assets | (0.99)% | (1.13)% | (1.02)% | (1.51)% | (1.63)% |
| Portfolio Turnover Rate | 167.3% | 144.9% | 145.8% | 185.7%(h) | 163.7% |
59
| FINANCIAL HIGHLIGHTS (Continued) |
| PRINCIPAL FUNDS, INC. |
| |
| MIDCAP GROWTH FUND III(b) | | 2008 | 2007 | 2006 | 2005 | 2004 |
| Institutional shares | | | | | | |
| Net Asset Value, Beginning of Period | $ 12.21 | $ 9.56 | $ 8.80 | $ 7.45 | $ 7.20 |
| Income from Investment Operations: | | | | | | |
| Net Investment Income (Operating Loss)(c) | (0.03) | (0.04) | (0.02) | (0.06) | (0.04) |
| Net Realized and Unrealized Gain (Loss) | | | | |
| on Investments | | (5.04) | 2.97 | 0.85 | 1.41 | 0.29 |
| Total From Investment Operations | (5.07) | 2.93 | 0.83 | 1.35 | 0.25 |
| Less Dividends and Distributions: | | | | | | |
| Distributions from Realized Gains | (0.77) | (0.28) | (0.07) | – | – |
| Total Dividends and Distributions | (0.77) | (0.28) | (0.07) | – | – |
| Net Asset Value, End of Period | | $ 6.37 | $ 12.21 | $ 9.56 | $ 8.80 | $ 7.45 |
| Total Return | | (44.26)% | 31.39% | 9.41% | 18.12% | 3.47% |
| Ratio/Supplemental Data: | | | | | | |
| Net Assets, End of Period | | | | | | |
| (in thousands) | | $ 423,812 | $ 536,957 | $ 324,293 | $ 275,439 | $ 9 |
| Ratio of Expenses to | | | | | | |
| Average Net Assets | | 1.00% | 1.00% | 1.00% | 1.00% | 0.89% |
| Ratio of Gross Expenses to | | | | | | |
| Average Net Assets | | – | – | – | – | 1.00%(k) |
| Ratio of Net Investment Income | | | | | | |
| to Average Net Assets | | (0.32)% | (0.42)% | (0.22)% | (0.65)% | (0.60)% |
| Portfolio Turnover Rate | | 167.3% | 144.9% | 145.8% | 185.7%(h) | 163.7% |
| |
| MIDCAP GROWTH FUND III(b) | | 2008 | 2007 | 2006 | 2005 | |
| R-1 shares | | | | | | |
| Net Asset Value, Beginning of Period | $ 11.88 | $ 9.39 | $ 8.72 | $ 7.44 | |
| Income from Investment Operations: | | | | | | |
| Net Investment Income (Operating Loss)(c) | (0.11) | (0.13) | (0.11) | (0.13) | |
| Net Realized and Unrealized Gain (Loss) | | | | |
| on Investments | | (4.87) | 2.90 | 0.85 | 1.41 | |
| Total From Investment Operations | (4.98) | 2.77 | 0.74 | 1.28 | |
| Less Dividends and Distributions: | | | | | | |
| Distributions from Realized Gains | (0.77) | (0.28) | (0.07) | – | |
| Total Dividends and Distributions | (0.77) | (0.28) | (0.07) | – | |
| Net Asset Value, End of Period | | $ 6.13 | $ 11.88 | $ 9.39 | $ 8.72 | |
| |
| Total Return | | (44.75)% | 30.22% | 8.46% | 17.20% | |
| Ratio/Supplemental Data: | | | | | | |
| Net Assets, End of Period | | | | | | |
| (in thousands) | | $ 775 | $ 871 | $ 528 | $ 156 | |
| Ratio of Expenses to | | | | | | |
| Average Net Assets | | 1.88% | 1.88% | 1.88% | 1.88% | |
| Ratio of Net Investment Income to | | | | | |
| Average Net Assets | | (1.21)% | (1.30)% | (1.18)% | (1.60)% | |
| Portfolio Turnover Rate | | 167.3% | 144.9% | 145.8% | 185.7%(h) | |
60
| FINANCIAL HIGHLIGHTS (Continued) |
| PRINCIPAL FUNDS, INC. |
| |
| MIDCAP GROWTH FUND III(b) | 2008 | 2007 | 2006 | 2005 | 2004 |
| R-2 shares | | | | | |
| Net Asset Value, Beginning of Period | $ 12.01 | $ 9.47 | $ 8.78 | $ 7.49 | $ 7.30 |
| Income from Investment Operations: | | | | | |
| Net Investment Income (Operating Loss)(c) | (0.10) | (0.12) | (0.09) | (0.11) | (0.10) |
| Net Realized and Unrealized Gain (Loss) | | | | |
| on Investments | (4.93) | 2.94 | 0.85 | 1.40 | 0.29 |
| Total From Investment Operations | (5.03) | 2.82 | 0.76 | 1.29 | 0.19 |
| Less Dividends and Distributions: | | | | | |
| Distributions from Realized Gains | (0.77) | (0.28) | (0.07) | – | – |
| Total Dividends and Distributions | (0.77) | (0.28) | (0.07) | – | – |
| Net Asset Value, End of Period | $ 6.21 | $ 12.01 | $ 9.47 | $ 8.78 | $ 7.49 |
| Total Return | (44.68)% | 30.50% | 8.63% | 17.22% | 2.60% |
| Ratio/Supplemental Data: | | | | | |
| Net Assets, End of Period | | | | | |
| (in thousands) | $ 7,120 | $ 14,941 | $ 11,823 | $ 9,866 | $ 6,991 |
| Ratio of Expenses to | | | | | |
| Average Net Assets | 1.75% | 1.75% | 1.75% | 1.75% | 1.65% |
| Ratio of Gross Expenses to | | | | | |
| Average Net Assets | – | – | – | – | 1.75%(k) |
| Ratio of Net Investment Income to | | | | | |
| Average Net Assets | (1.06)% | (1.16)% | (0.98)% | (1.37)% | (1.35)% |
| Portfolio Turnover Rate | 167.3% | 144.9% | 145.8% | 185.7%(h) | 163.7% |
| |
| MIDCAP GROWTH FUND III(b) | 2008 | 2007 | 2006 | 2005 | 2004 |
| R-3 shares | | | | | |
| Net Asset Value, Beginning of Period | $ 12.35 | $ 9.72 | $ 8.99 | $ 7.66 | $ 7.45 |
| Income from Investment Operations: | | | | | |
| Net Investment Income (Operating Loss)(c) | (0.09) | (0.10) | (0.08) | (0.10) | (0.09) |
| Net Realized and Unrealized Gain (Loss) | | | | |
| on Investments | (5.08) | 3.01 | 0.88 | 1.43 | 0.30 |
| Total From Investment Operations | (5.17) | 2.91 | 0.80 | 1.33 | 0.21 |
| Less Dividends and Distributions: | | | | | |
| Distributions from Realized Gains | (0.77) | (0.28) | (0.07) | – | – |
| Total Dividends and Distributions | (0.77) | (0.28) | (0.07) | – | – |
| Net Asset Value, End of Period | $ 6.41 | $ 12.35 | $ 9.72 | $ 8.99 | $ 7.66 |
| Total Return | (44.58)% | 30.65% | 8.87% | 17.36% | 2.82% |
| Ratio/Supplemental Data: | | | | | |
| Net Assets, End of Period | | | | | |
| (in thousands) | $ 23,848 | $ 32,810 | $ 29,290 | $ 17,158 | $ 13,413 |
| Ratio of Expenses to | | | | | |
| Average Net Assets | 1.57% | 1.57% | 1.57% | 1.57% | 1.47% |
| Ratio of Gross Expenses to | | | | | |
| Average Net Assets | – | – | – | – | 1.57%(k) |
| Ratio of Net Investment Income to | | | | | |
| Average Net Assets | (0.89)% | (0.98)% | (0.85)% | (1.19)% | (1.17)% |
| Portfolio Turnover Rate | 167.3% | 144.9% | 145.8% | 185.7%(h) | 163.7% |
61
| FINANCIAL HIGHLIGHTS (Continued) |
| PRINCIPAL FUNDS, INC. |
| |
| MIDCAP GROWTH FUND III(b) | 2008 | 2007 | 2006 | 2005 | 2004 |
| R-4 shares | | | | | |
| Net Asset Value, Beginning of Period | $ 12.34 | $ 9.69 | $ 8.95 | $ 7.61 | $ 7.38 |
| Income from Investment Operations: | | | | | |
| Net Investment Income (Operating Loss)(c) | (0.07) | (0.09) | (0.08) | (0.09) | (0.08) |
| Net Realized and Unrealized Gain (Loss) | | | | |
| on Investments | (5.08) | 3.02 | 0.89 | 1.43 | 0.31 |
| Total From Investment Operations | (5.15) | 2.93 | 0.81 | 1.34 | 0.23 |
| Less Dividends and Distributions: | | | | | |
| Distributions from Realized Gains | (0.77) | (0.28) | (0.07) | – | – |
| Total Dividends and Distributions | (0.77) | (0.28) | (0.07) | – | – |
| Net Asset Value, End of Period | $ 6.42 | $ 12.34 | $ 9.69 | $ 8.95 | $ 7.61 |
| Total Return | (44.45)% | 30.96% | 9.03% | 17.61% | 3.12% |
| Ratio/Supplemental Data: | | | | | |
| Net Assets, End of Period | | | | | |
| (in thousands) | $ 17,117 | $ 27,327 | $ 17,680 | $ 226 | $ 124 |
| Ratio of Expenses to | | | | | |
| Average Net Assets | 1.38% | 1.38% | 1.38% | 1.38% | 1.24% |
| Ratio of Gross Expenses to | | | | | |
| Average Net Assets | – | – | – | – | 1.38%(k) |
| Ratio of Net Investment Income to | | | | | |
| Average Net Assets | (0.70)% | (0.80)% | (0.77)% | (1.01)% | (0.99)% |
| Portfolio Turnover Rate | 167.3% | 144.9% | 145.8% | 185.7%(h) | 163.7% |
| |
| MIDCAP GROWTH FUND III(b) | 2008 | 2007 | 2006 | 2005 | 2004 |
| R-5 shares | | | | | |
| Net Asset Value, Beginning of Period | $ 12.49 | $ 9.79 | $ 9.04 | $ 7.67 | $ 7.43 |
| Income from Investment Operations: | | | | | |
| Net Investment Income (Operating Loss)(c) | (0.06) | (0.07) | (0.05) | (0.07) | (0.07) |
| Net Realized and Unrealized Gain (Loss) | | | | |
| on Investments | (5.15) | 3.05 | 0.87 | 1.44 | 0.31 |
| Total From Investment Operations | (5.21) | 2.98 | 0.82 | 1.37 | 0.24 |
| Less Dividends and Distributions: | | | | | |
| Distributions from Realized Gains | (0.77) | (0.28) | (0.07) | – | – |
| Total Dividends and Distributions | (0.77) | (0.28) | (0.07) | – | – |
| Net Asset Value, End of Period | $ 6.51 | $ 12.49 | $ 9.79 | $ 9.04 | $ 7.67 |
| Total Return | (44.39)% | 31.16% | 9.05% | 17.86% | 3.23% |
| Ratio/Supplemental Data: | | | | | |
| Net Assets, End of Period | | | | | |
| (in thousands) | $ 9,461 | $ 20,495 | $ 27,099 | $ 10,711 | $ 8,533 |
| Ratio of Expenses to | | | | | |
| Average Net Assets | 1.26% | 1.26% | 1.26% | 1.26% | 1.15% |
| Ratio of Gross Expenses to | | | | | |
| Average Net Assets | – | – | – | – | 1.26%(k) |
| Ratio of Net Investment Income to | | | | | |
| Average Net Assets | (0.57)% | (0.67)% | (0.48)% | (0.88)% | (0.86)% |
| Portfolio Turnover Rate | 167.3% | 144.9% | 145.8% | 185.7%(h) | 163.7% |
62
| (a) | Period from June 28, 2005, date shares first offered, through October 31, 2005. |
| |
| (b) | Effective June 13, 2008, Partners MidCap Growth Fund changed its name to MidCap Growth Fund III. |
| |
| (c) | Calculated based on average shares outstanding during the period. |
| |
| (d) | Total return is calculated without the front-end sales charge or contingent deferred sales charge. |
| |
| (e) | Total return amounts have not been annualized. |
| |
| (f) | Reflects Manager’s contractual expense limit. |
| |
| (g) | Computed on an annualized basis. |
| |
| (h) | Portfolio turnover rate excludes approximately $34,689,000 of securities from the acquisition of Principal Partners MidCap Growth Fund, Inc. and $23,000 from portfolio realignment. |
| |
| (i) | Period from January 17, 2007 through October 31, 2007. Class C shares incurred a net realized and unrealized gain of $.17 per share from January 10, 2007, through January 16, 2007. |
| |
| (j) | Excludes expense reimbursement from Manager. |
| |
| (k) | Expense ratio without commission rebates. |
The financial statements of the Acquiring Fund and the Acquired Fund included in PFI’s Annual Report to Shareholders for the fiscal year ended October 31, 2008 are incorporated by reference into the Statement of Additional Information and have been so incorporated by reference in reliance on the report of Ernst & Young LLP, Independent Registered Public Accounting Firm. Copies of the Annual Report are available upon request as described above.
Certain matters concerning the issuance of shares of the Acquiring Fund will be passed upon by Michael D. Roughton, Esq., Counsel to PFI. Certain tax consequences of the Reorganization will be passed upon for the Acquiring Fund by Randy Lee Bergstrom, Esq., Assistant Tax Counsel to PFI, and for the Acquired Fund by Carolyn F. Kolks, Esq., Assistant Tax Counsel to PFI.
PFI is not required to hold annual meetings of shareholders and, therefore, it cannot be determined when the next meeting of shareholders will be held. Shareholder proposals to be presented at any future meeting of shareholders of any PFI Fund must be received by PFI a reasonable time before its solicitation of proxies for that meeting in order for such proposals to be considered for inclusion in the proxy materials related to that meeting.
BY ORDER OF THE BOARD OF DIRECTORS
| _______________, 2009 |
| Des Moines, Iowa |
63
| PLAN OF ACQUISITION |
|
| MidCap Growth Fund II and |
| MidCap Growth Fund III |
The Board of Directors of Principal Funds, Inc., a Maryland corporation (the “Fund”), deems it advisable that MidCap Growth Fund III series of the Fund (“MidCap Growth III”) acquire all of the assets of MidCap Growth Fund II series of the Fund (“MidCap Growth II”) in exchange for the assumption by MidCap Growth III of all of the liabilities of MidCap Growth II and shares issued by MidCap Growth III which are thereafter to be distributed by MidCap Growth II pro rata to its shareholders in complete liquidation and termination of MidCap Growth II and in exchange for all of MidCap Growth II’s outstanding shares.
MidCap Growth II will transfer to MidCap Growth III, and MidCap Growth III will acquire from MidCap Growth II, all of the assets of MidCap Growth II on the Closing Date and will assume from MidCap Growth II all of the liabilities of MidCap Growth II in exchange for the issuance of the number of shares of MidCap Growth III determined as provided in the following paragraphs, which shares will be subsequently distributed pro rata to the shareholders of MidCap Growth II in complete liquidation and termination of MidCap Growth II and in exchange for all of MidCap Growth II’s outstanding shares. MidCap Growth II will not issue, sell or transfer any of its shares after the Closing Date, and only redemption requests received by MidCap Growth II in proper form prior to the Closing Date shall be fulfilled by MidCap Growth II. Redemption requests received by MidCap Growth II thereafter will be treated as requests for redemption of those shares of MidCap Growth III allocable to the shareholder in question.
MidCap Growth II will declare, and MidCap Growth III may declare, to its shareholders of record on or prior to the Closing Date a dividend or dividends which, together with all previous such dividends, shall have the effect of distributing to its shareholders all of its income (computed without regard to any deduction for dividends paid) and all of its net realized capital gains, if any, as of the Closing Date.
On the Closing Date, MidCap Growth III will issue to MidCap Growth II a number of full and fractional shares of MidCap Growth III, taken at their then net asset value, having an aggregate net asset value equal to the aggregate value of the net assets of MidCap Growth II. The aggregate value of the net assets of MidCap Growth II and MidCap Growth III shall be determined in accordance with the then current Prospectus of MidCap Growth III as of close of regularly scheduled trading on the New York Stock Exchange on the Closing Date.
64
The closing of the transactions contemplated in this Plan (the “Closing”) shall be held at the offices of Principal Management Corporation, 680 8th Street, Des Moines, Iowa 50392 at 3:00 p.m. Central Time on ________, 2008, or on such earlier or later date as fund management may determine. The date on which the Closing is to be held as provided in this Plan shall be known as the “Closing Date.”
In the event that on the Closing Date (a) the New York Stock Exchange is closed for other than customary weekend and holiday closings or (b) trading on said Exchange is restricted or (c) an emergency exists as a result of which it is not reasonably practicable for MidCap Growth III or MidCap Growth II to fairly determine the value of its assets, the Closing Date shall be postponed until the first business day after the day on which trading shall have been fully resumed.
As soon as practicable after the Closing, MidCap Growth II shall (a) distribute on a pro rata basis to the shareholders of record of MidCap Growth II at the close of business on the Closing Date the shares of MidCap Growth III received by MidCap Growth II at the Closing in exchange for all of MidCap Growth II’s outstanding shares, and (b) be liquidated in accordance with applicable law and the Fund’s Articles of Incorporation.
For purposes of the distribution of shares of MidCap Growth III to shareholders of MidCap Growth II, MidCap Growth III shall credit its books an appropriate number its shares to the account of each shareholder of MidCap Growth II. No certificates will be issued for shares of MidCap Growth III. After the Closing Date and until surrendered, each outstanding certificate, if any, which, prior to the Closing Date, represented shares of MidCap Growth II, shall be deemed for all purposes of the Fund’s Articles of Incorporation and Bylaws to evidence the appropriate number of shares of MidCap Growth III to be credited on the books of MidCap Growth III in respect of such shares of MidCap Growth II as provided above.
Prior to the Closing Date, MidCap Growth II shall deliver to MidCap Growth III a list setting forth the assets to be assigned, delivered and transferred to MidCap Growth III, including the securities then owned by MidCap Growth II and the respective federal income tax bases (on an identified cost basis) thereof, and the liabilities to be assumed by MidCap Growth III pursuant to this Plan.
All of MidCap Growth II’s portfolio securities shall be delivered by MidCap Growth II’s custodian on the Closing Date to MidCap Growth III or its custodian, either endorsed in proper form for transfer in such condition as to constitute good delivery thereof in accordance with the practice of brokers or, if such securities are held in a securities depository within the meaning of Rule 17f-4 under the Investment Company Act of 1940, transferred to an
65
account in the name of MidCap Growth III or its custodian with said depository. All cash to be delivered pursuant to this Plan shall be transferred from MidCap Growth II’s account at its custodian to MidCap Growth III’s account at its custodian. If on the Closing Date MidCap Growth II is unable to make good delivery to MidCap Growth III’s custodian of any of MidCap Growth II’s portfolio securities because such securities have not yet been delivered to MidCap Growth II’s custodian by its brokers or by the transfer agent for such securities, then the delivery requirement with respect to such securities shall be waived, and MidCap Growth II shall deliver to MidCap Growth III’s custodian on or by said Closing Date with respect to said undelivered securities executed copies of an agreement of assignment in a form satisfactory to MidCap Growth III, and a due bill or due bills in form and substance satisfactory to the custodian, together with such other documents including brokers’ confirmations, as may be reasonably required by MidCap Growth III.
This Plan may be abandoned and terminated, whether before or after action thereon by the shareholders of MidCap Growth II and notwithstanding favorable action by such shareholders, if the Board of Directors believe that the consummation of the transactions contemplated hereunder would not be in the best interests of the shareholders of either Fund. This Plan may be amended by the Board of Directors at any time, except that after approval by the shareholders of MidCap Growth II no amendment may be made with respect to the Plan which in the opinion of the Board of Directors materially adversely affects the interests of the shareholders of MidCap Growth II.
IN WITNESS WHEREOF, each of the parties hereto has caused this Plan to be executed by its Chairman and Chief Executive Officer or its Executive Vice President as of the _______th day of __________, 2008.
| PRINCIPAL FUNDS, INC. |
| on behalf of the following Acquired Fund: |
| MidCap Growth Fund II |
| |
| By: |
| Ralph C. Eucher, Chairman and |
| Chief Executive Officer |
| |
| PRINCIPAL FUNDS, INC. |
| on behalf of the following Acquiring Fund: |
| MidCap Growth Fund III |
| |
| By: |
| Michael J. Beer, Executive Vice President |
66
The performance tables included in this Information Statement/Prospectus provide performance information of various indices. These indices are described in this Appendix. An investment cannot be made directly in the indices and the indices’ performance figures do not include any commissions or sales charges that would be paid by investors purchasing the securities represented by the indices.
Morningstar Mid-Cap Growth Category Average is an average of net asset value (NAV) returns of mutual funds that typically focus on mid-size companies that are projected to grow faster than average. Many of these mutual funds focus on companies in rapidly-expanding industries.
Russell Midcap Growth Index is an unmanaged index that measures the investment returns of stocks in the Russell Midcap Index with higher price-to-book ratios and higher forecasted growth rates.
67
| PRINCIPAL FUNDS, INC. – MIDCAP GROWTH FUND II |
| Des Moines, Iowa 50392-2080 |
| PROXY FOR A SPECIAL MEETING OF SHAREHOLDERS |
| April 27, 2009 |
This proxy is solicited on behalf of the Board of Directors of the Fund. The undersigned shareholder appoints Michael J. Beer, Michael D. Roughton, and Ernest H. Gillum, and each of them separately, Proxies, with power of substitution, and authorizes them to represent and to vote as designated on this ballot, at the meeting of shareholders of the Fund to be held on April 27, 2009 at 10:00 a.m., Central Time, and at any adjournments thereof, all the shares of the Fund that the undersigned shareholder would be entitled to vote if personally present.
Check the appropriate boxes below on this ballot, date and sign exactly as your name appears. Your signature acknowledges receipt of Notice of the Special Meeting of Shareholders and Proxy Statement dated March 23, 2009. Shares will be voted as you instruct. If no direction is made, the proxy will be voted FOR the proposals listed below. In their discretion the Proxies will also be authorized to vote upon such other matters that may properly come before the meeting.
NOTE: PLEASE SIGN EXACTLY AS YOUR NAME APPEARS ON THIS BALLOT. PLEASE MARK, SIGN, DATE AND MAIL YOUR PROXY BALLOT IN THE ENCLOSED
POSTAGE-PAID ENVELOPE. If shares are held jointly, either party may sign. If executed by a corporation, an authorized officer must sign. Executors, administrators and trustees should so indicate when signing.
The Board of Directors recommends that shareholders vote FOR the following proposals. Please make your choice below in blue or black ink. Example: [X]
Sign this proxy ballot and return it as soon as possible in the enclosed envelope.
| Approval of a Plan of Acquisition providing for the reorganization of the MidCap Growth Fund |
| II into the MidCap Growth Fund III. | | | |
| |
| FOR [ ] | AGAINST | [ ] | ABSTAIN | [ ] |
| | | _____________, 2009 |
| Signature | Signature (if held jointly) | Date |
| PART B |
| |
| INFORMATION REQUIRED IN |
| A STATEMENT OF ADDITIONAL INFORMATION |
| |
| PRINCIPAL FUNDS, INC. |
| 680 8th Street |
| Des Moines, Iowa 50392-2080 |
| |
| STATEMENT OF ADDITIONAL INFORMATION |
| |
| Dated: March 23, 2009 |
This Statement of Additional Information is available to the shareholders of the MidCap Growth Fund II (the "Acquired Fund"), in connection with the proposed reorganization of the Acquired Fund into the MidCap Growth Fund III (the "Acquiring Fund") (the "Reorganization"). Each of the Acquired and Acquiring Funds is a separate series of Principal Funds, Inc. ("PFI").
This Statement of Additional Information is not a prospectus and should be read in conjunction with the Proxy Statement/Prospectus dated March 23, 2009, relating to the Special Meeting of Shareholders of the Acquired Fund to be held on April 27, 2009. The Proxy Statement/Prospectus, which describes the proposed Reorganization, may be obtained without charge by writing to Principal Management Corporation, 680 8th Street, Des Moines, Iowa 50392-2080, or by calling toll free at 1-800-222-5852.
| (1) | Statement of Additional Information of PFI dated March 23, 2009. |
| |
| (2) | Audited Financial Statements of PFI for the fiscal year ended October 31, 2008, related to the Acquired Fund and the Acquiring Fund. |
| |
| (3) | Pro Forma Financial Information for the combination of the Acquired Fund into the Acquiring Fund. |
INFORMATION INCORPORATED BY REFERENCE
This Statement of Additional Information incorporates by reference the following documents (or designated portions thereof) that have been filed with the Securities and Exchange Commission (File Nos. 33-59474; and 811-07572):
| (1) | The Statement of Additional Information of PFI dated March 1, 2009. |
| |
| (2) | The financial statements of the Acquired Fund and the Acquiring Fund included in PFI's Annual Report to Shareholders for the fiscal year ended October 31, 2008, which have been audited by Ernst & Young LLP, Independent Registered Public Accounting Firm, as filed on Form N-CSR on January 8, 2009; and |
The Annual Report to Shareholders of PFI is available upon request and without charge by calling toll-free at 1-800-222-5852.
PRO FORMA FINANCIAL STATEMENTS
On December 19, 2008, the Board of Directors of PFI approved a Plan of Acquisition whereby, the MidCap Growth Fund III (the "Acquiring Fund") will acquire all the assets of the MidCap Growth Fund II (the "Acquired Fund"), subject to the liabilities of the Acquired Fund, in exchange for a number of shares equal in value to the pro rata net assets of shares of the Acquired Fund (the "Reorganization").
Shown below are unaudited pro forma financial statements for the combined Acquiring Fund, assuming the Reorganization had been consummated as of October 31, 2008. The first table presents pro forma Statements of Assets and Liabilities for the combined Acquiring Fund. The second table presents pro forma Statements of Operations for the combined Acquiring Fund. The third table presents a pro forma Schedule of Investments for the combined Acquiring Fund.
Please see the accompanying notes for additional information about the pro forma financial statements. The pro forma schedules of investments and statements of assets and liabilities and operations should be read in conjunction with the historical financial statements of the Acquired Fund and the Acquiring Fund incorporated by reference in the Statement of Additional Information.
| Statements of Assets and Liabilities |
| Principal Funds, Inc. |
| October 31, 2008 (unaudited) |
| Amounts in thousands |
| MidCap | MidCap | Pro Forma | | Pro Forma MidCap | |
| Growth Fund II | Growth Fund III | Adjustments | | Growth Fund III | |
| Investment in securities--at cost | $ 315,694 | $ 669,023 | $ - | | $ 984,717 | |
| Assets | | | | | | | |
| Investment in securities--at value | $ 201,100 | $ 523,907 | $ - | | $ 725,007 | |
| Cash | 4,813 | 2,179 | | - | | 6,992 | |
| Receivables: | | | | | | | |
| Capital Shares sold | 17 | 605 | | - | | 622 | |
| Dividends and interest | 116 | 252 | | - | | 368 | |
| Expense reimbursement from Manager | - | 1 | | - | | 1 | |
| Expense reimbursement from Underwriter | - | 3 | | - | | 3 | |
| Investment securities sold | 1,446 | 7,765 | | - | | 9,211 | |
| Variation margin on futures contracts | - | 207 | | - | | 207 | |
| Total Assets | 207,492 | 534,919 | | - | | 742,411 | |
| |
| Liabilities | | | | | | | |
| Accrued management and investment advisory fees | 181 | 452 | | - | | 633 | |
| Accrued administrative service fees | 2 | 7 | | - | | 9 | |
| Accrued distribution fees | 2 | 28 | | - | | 30 | |
| Accrued service fees | 2 | 9 | | - | | 11 | |
| Accrued transfer agent fees | - | 59 | | - | | 59 | |
| Accrued directors' fees | 1 | - | | | | 1 | |
| Accrued other expenses | 19 | 43 | | - | | 62 | |
| Payables: | | | | | | | |
| Capital Shares reacquired | 239 | 340 | | - | | 579 | |
| Investment securities purchased | 1,380 | 4,163 | | - | | 5,543 | |
| Reorganization costs | - | - | | 45 | (d) | 45 | |
| Total Liabilities | 1,826 | 5,101 | | 45 | | 6,972 | |
| Net Assets Applicable to Outstanding Shares | $ 205,666 | $ 529,818 | $ (45) | | $ 735,439 | |
| |
| Net Assets Consist of: | | | | | | | |
| Capital Shares and additional paid-in-capital | $ 389,913 | $ 777,950 | $ - | | $ 1,167,863 | |
| Accumulated undistributed (overdistributed) net investment income (operating loss) | - | - | | (45) | (d) | (45) | |
| Accumulated undistributed (overdistributed) net realized gain (loss) | (69,653) | (104,310) | | - | | (173,963) | |
| Net unrealized appreciation (depreciation) of investments | (114,594) | (143,822) | | - | | (258,416) | |
| Total Net Assets | $ 205,666 | $ 529,818 | $ (45) | | $ 735,439 | |
| |
| Capital Stock (par value: $.01 a share): | | | | | | | |
| Shares authorized | 705,000 | 455,000 | | - | | 455,000 | |
| Net Asset Value Per Share: | | | | | | | |
| Class A: Net Assets | N/A | $ 21,252 | $ - | | $ 21,252 | |
| Shares issued and outstanding | | 3,425 | | - | | 3,425 | |
| Net asset value per share | | $ 6.20 | | | | $ 6.20 | |
| Maximum offering price per share | | $ 6.56 | (a) | | | $ 6.56 | (a) |
| |
| Class B: Net Assets | N/A | $ 5,477 | $ - | | $ 5,477 | |
| Shares issued and outstanding | | 907 | | - | | 907 | |
| Net asset value per share (b) | | $ 6.04 | (b) | | | $ 6.04 | (b) |
| |
| Class C: Net Assets | N/A | $ 778 | $ - | | $ 778 | |
| Shares issued and outstanding | | 126 | | - | | 126 | |
| Net asset value per share | | $ 6.15 | (b) | | | $ 6.15 | (b) |
| |
| Class J: Net Assets | N/A | $ 20,178 | $ - | | $ 20,178 | |
| Shares issued and outstanding | | 3,399 | | - | | 3,399 | |
| Net asset value per share | | $ 5.94 | (b) | | | $ 5.94 | (b) |
| |
| Institutional: Net Assets | $ 191,051 | $ 423,812 | $ (42) | (d) | $ 614,821 | |
| Shares issued and outstanding | 33,454 | 66,503 | | (3,468) | (c) | 96,489 | |
| Net asset value per share | $ 5.71 | $ 6.37 | | | | $ 6.37 | |
| |
| R-1: Net Assets | $ 1,454 | $ 775 | $ - | | $ 2,229 | |
| Shares issued and outstanding | 266 | 126 | | (29) | (c) | 363 | |
| Net asset value per share | $ 5.47 | $ 6.13 | | | | $ 6.13 | |
| |
| R-2: Net Assets | $ 1,150 | $ 7,120 | $ - | | $ 8,270 | |
| Shares issued and outstanding | 209 | 1,146 | | (24) | (c) | 1,331 | |
| Net asset value per share | $ 5.50 | $ 6.21 | | | | $ 6.21 | |
| |
| R-3: Net Assets | $ 4,701 | $ 23,848 | $ (1) | (d) | $ 28,548 | |
| Shares issued and outstanding | 849 | 3,719 | | (116) | (c) | 4,452 | |
| Net asset value per share | $ 5.54 | $ 6.41 | | | | $ 6.41 | |
| |
| R-4: Net Assets | $ 5,183 | $ 17,117 | $ (1) | (d) | $ 22,299 | |
| Shares issued and outstanding | 929 | 2,667 | | (122) | (c) | 3,474 | |
| Net asset value per share | $ 5.58 | $ 6.42 | | | | $ 6.42 | |
| |
| R-5: Net Assets | $ 2,127 | $ 9,461 | $ (1) | (d) | $ 11,587 | |
| Shares issued and outstanding | 379 | 1,453 | | (52) | (c) | 1,780 | |
| Net asset value per share | $ 5.62 | $ 6.51 | | | | $ 6.51 | |
| (a) | Maximum offering price is equal to net asset value plus a front-end sales charge of 5.50% of the offering price or 5.82% of the net asset value. |
| (b) | Redemption price per share is equal to net asset value less any applicable contingent deferred sales charge. |
| (c) | Reflects new shares issued, net of retired shares of MidCap Growth Fund II. |
| (d) | Reduction in net assets to reflect the estimated expenses of the Reorganization. |
| STATEMENT OF OPERATIONS |
| Principal Funds, Inc. |
| Twelve Months Ended October 31, 2008 (unaudited) |
| MidCap Growth | MidCap Growth | Pro Forma | | Pro Forma MidCap |
| Amounts in thousands | Fund II | Fund III | Adjustments | | Growth Fund III |
| Net Investment Income (Operating Loss) | | | | | |
| Income: | | | | | |
| Dividends | $ 2,392 | $ 4,171 | $ - | | $ 6,563 |
| Interest | 65 | 229 | - | | 294 |
| Securities lending | 252 | 578 | - | | 830 |
| Total Income | 2,709 | 4,978 | - | | 7,687 |
| Expenses: | | | | | |
| Management and investment advisory fees | 4,001 | 7,315 | (211) (b) | 11,105 |
| Distribution Fees - Class A | N/A | 86 | - | | 86 |
| Distribution Fees - Class B | N/A | 99 | - | | 99 |
| Distribution Fees - Class C | N/A | 14 | - | | 14 |
| Distribution Fees - Class J | N/A | 150 | - | | 150 |
| Distribution Fees - R-1 | 8 | 4 | - | | 12 |
| Distribution Fees - R-2 | 6 | 37 | - | | 43 |
| Distribution Fees - R-3 | 22 | 80 | - | | 102 |
| Distribution Fees - R-4 | 9 | 25 | - | | 34 |
| Administrative service fees - R-1 | 7 | 3 | - | | 10 |
| Administrative service fees - R-2 | 4 | 25 | - | | 29 |
| Administrative service fees - R-3 | 13 | 48 | - | | 61 |
| Administrative service fees - R-4 | 11 | 33 | - | | 44 |
| Administrative service fees - R-5 | 6 | 19 | - | | 25 |
| Registration fees - Class A | N/A | 14 | - | | 14 |
| Registration fees - Class B | N/A | 13 | - | | 13 |
| Registration fees - Class C | N/A | 15 | - | | 15 |
| Registration fees - Class J | N/A | 17 | - | | 17 |
| Service Fees - R-1 | 6 | 3 | - | | 9 |
| Service Fees - R-2 | 5 | 31 | - | | 36 |
| Service Fees - R-3 | 15 | 54 | - | | 69 |
| Service Fees - R-4 | 13 | 38 | - | | 51 |
| Service Fees - R-5 | 9 | 26 | - | | 35 |
| Shareholder reports - Class A | N/A | 19 | - | | 19 |
| Shareholder reports - Class B | N/A | 6 | - | | 6 |
| Shareholder reports - Class C | N/A | 1 | - | | 1 |
| Shareholder reports - Class J | N/A | 6 | - | | 6 |
| Transfer agent fees - Class A | N/A | 131 | - | | 131 |
| Transfer agent fees - Class B | N/A | 41 | - | | 41 |
| Transfer agent fees - Class C | N/A | 9 | - | | 9 |
| Transfer agent fees - Class J | N/A | 64 | - | | 64 |
| Custodian fees | 5 | 5 | (4) | (a) | 6 |
| Directors' expenses | 11 | 15 | - | | 26 |
| Professional fees | 14 | 17 | (14) (a) | 17 |
| Other expenses | 13 | 11 | (2) | (a) | 22 |
| Total Gross Expenses | 4,178 | 8,474 | (231) | | 12,421 |
| |
| Less: Reimbursement from Manager - Class B | N/A | 11 | - | | 11 |
| Less: Reimbursement from Manager - Class C | N/A | 18 | - | | 18 |
| Less: Reimbursement from Underwriter - Class J | N/A | 16 | - | | 16 |
| Total Net Expenses | 4,178 | 8,429 | (231) | | 12,376 |
| Net Investment Income (Operating Loss) | (1,469) | (3,451) | 231 | | (4,689) |
| |
| Net Realized and Unrealized Gain (Loss) on Investments and Foreign Currencies | | | | | |
| Net realized gain (loss) from: | | | | | |
| Investment transactions | (66,575) | (93,964) | - | | (160,539) |
| Futures contracts | - | (8,458) | - | | (8,458) |
| Change in unrealized appreciation/depreciation of: | | | | | |
| Investments | - | (300,825) | - | | (300,825) |
| Futures contracts | (149,703) | 1,294 | - | | (148,409) |
| Net Realized and Unrealized Gain (Loss) on Investments and Foreign Currencies | (216,278) | (401,953) | - | | (618,231) |
| Net Increase (Decrease) in Net Assets Resulting from Operations | $ (217,747) | $ (405,404) | $ 231 | | $ (622,920) |
| (a) | To adjust expenses to reflect the Combined Fund's estimated fees and expenses, based on elimination of duplicate services. |
| (b) | Management and investment advisory fees decreased to reflect annual percentage rate of Acquiring Fund. |
See accompanying notes
| | | | Schedule of Investments | | | |
| MidCap Growth | MidCap Growth Fund | Combined MidCap | | | MidCap Growth Fund | Combined MidCap |
| Fund II | III | Growth Fund III | October 31, 2008 | MidCap Growth Fund II | III | Growth Fund III |
| Shares Held (000's) | | Value (000's) |
| | | 0.13% Advertising Agencies | | | |
| 185,000 | - | 185,000 | Interpublic Group of Cos Inc (a) | $ 960 | $ - | $ 960 |
| | | 0.02% Advertising Sales | | | |
| 23,900 | - | 23,900 | Clear Channel Outdoor Holdings Inc (a) | 149 | - | 149 |
| | | 0.53% Aerospace & Defense Equipment | | | |
| 28,600 | - | 28,600 | Alliant Techsystems Inc (a) | 2,356 | - | 2,356 |
| 42,200 | - | 42,200 | Goodrich Corp | 1,543 | - | 1,543 |
| | | 0.19% Agricultural Chemicals | | | |
| 17,200 | - | 17,200 | CF Industries Holdings Inc | 1,104 | - | 1,104 |
| 6,800 | - | 6,800 | Mosaic Co/The | 268 | - | 268 |
| | | 0.37% Airlines | | | |
| - | 141,910 | 141,910 | Continental Airlines Inc (a) | - | 2,685 | 2,685 |
| | | 0.29% Apparel Manufacturers | | | |
| 71,500 | - | 71,500 | Coach Inc (a) | 1,473 | - | 1,473 |
| 39,600 | - | 39,600 | Hanesbrands Inc (a) | 692 | - | 692 |
| | | 0.09% Applications Software | | | |
| 29,000 | - | 29,000 | Progress Software Corp (a) | 665 | - | 665 |
| | | 0.10% Audio & Video Products | | | |
| 40,500 | - | 40,500 | Harman International Industries Inc | 744 | - | 744 |
| | | 0.07% Auto - Medium & Heavy Duty Trucks | | | |
| 71,300 | - | 71,300 | Oshkosh Corp | 546 | - | 546 |
| | | 0.05% Batteries & Battery Systems | | | |
| 7,700 | - | 7,700 | Energizer Holdings Inc (a) | 376 | - | 376 |
| | | 0.33% Beverages - Non-Alcoholic | | | |
| 12,700 | 81,840 | 94,540 | Hansen Natural Corp (a) | 322 | 2,072 | 2,394 |
| | | 0.02% Building - Heavy Construction | | | |
| 7,300 | - | 7,300 | Perini Corp (a) | 139 | - | 139 |
| | | 0.07% Building - Mobile Home & Manufactured Housing | | | |
| 30,400 | - | 30,400 | Thor Industries Inc | 544 | - | 544 |
| | | 2.10% Building - Residential & Commercial | | | |
| 1,600 | - | 1,600 | NVR Inc (a) | 784 | - | 784 |
| - | 644,960 | 644,960 | Pulte Homes Inc | - | 7,185 | 7,185 |
| - | 323,160 | 323,160 | Toll Brothers Inc (a) | - | 7,471 | 7,471 |
| | | 0.17% Building Products - Air & Heating | | | |
| 42,300 | - | 42,300 | Lennox International Inc | 1,261 | - | 1,261 |
| | | 0.62% Cable TV | | | |
| - | 194,610 | 194,610 | Cablevision Systems Corp | - | 3,451 | 3,451 |
| 70,700 | - | 70,700 | DISH Network Corp (a) | 1,113 | - | 1,113 |
| | | 0.86% Casino Hotels | | | |
| 55,100 | - | 55,100 | Boyd Gaming Corp | 375 | - | 375 |
| - | 98,640 | 98,640 | Wynn Resorts Ltd | - | 5,958 | 5,958 |
| | | 0.53% Cellular Telecommunications | | | |
| - | 261,840 | 261,840 | MetroPCS Communications (a) | - | 3,598 | 3,598 |
| 7,000 | - | 7,000 | US Cellular Corp (a) | 268 | - | 268 |
| | | 0.06% Chemicals - Diversified | | | |
| 30,900 | - | 30,900 | Celanese Corp | 428 | - | 428 |
| | | 1.21% Chemicals - Specialty | | | |
| - | 102,890 | 102,890 | Ecolab Inc | - | 3,834 | 3,834 |
| 22,800 | - | 22,800 | International Flavors & Fragrances Inc | 727 | - | 727 |
| - | 98,476 | 98,476 | Sigma-Aldrich Corp | - | 4,319 | 4,319 |
| | | 1.70% Coal | | | |
| - | 63,990 | 63,990 | Alpha Natural Resources Inc (a) | - | 2,289 | 2,289 |
| - | 163,280 | 163,280 | Consol Energy Inc | - | 5,125 | 5,125 |
| 29,300 | - | 29,300 | Peabody Energy Corp | 1,011 | - | 1,011 |
| - | 105,550 | 105,550 | Walter Industries Inc | - | 4,090 | 4,090 |
| | | 0.73% Coatings & Paint | | | |
| - | 94,690 | 94,690 | Sherwin-Williams Co/The | - | 5,389 | 5,389 |
| | | 1.31% Commercial Services | | | |
| 22,400 | - | 22,400 | Alliance Data Systems Corp (a) | 1,124 | - | 1,124 |
| 46,300 | - | 46,300 | Iron Mountain Inc (a) | 1,124 | - | 1,124 |
| 73,400 | 297,140 | 370,540 | Quanta Services Inc (a) | 1,451 | 5,872 | 7,323 |
| 9,000 | - | 9,000 | TeleTech Holdings Inc (a) | 81 | - | 81 |
| | | 0.36% Commercial Services - Finance | | | |
| 27,400 | - | 27,400 | Deluxe Corp | 333 | - | 333 |
| 73,800 | - | 73,800 | H&R Block Inc | 1,455 | - | 1,455 |
| 60,297 | - | 60,297 | Total System Services Inc | 829 | - | 829 |
| | | 0.14% Computer Aided Design | | | |
| 47,700 | - | 47,700 | Autodesk Inc (a) | 1,016 | - | 1,016 |
| | | 0.18% Computer Services | | | |
| 32,300 | - | 32,300 | Affiliated Computer Services Inc (a) | 1,324 | - | 1,324 |
| | | 0.36% Computer Software | | | |
| - | 230,695 | 230,695 | Omniture Inc (a) | - | 2,653 | 2,653 |
| | | 0.32% Computers - Integrated Systems | | | |
| 74,200 | - | 74,200 | Brocade Communications Systems Inc (a) | 280 | - | 280 |
| 47,900 | - | 47,900 | Micros Systems Inc (a) | 816 | - | 816 |
| 68,500 | - | 68,500 | NCR Corp (a) | 1,252 | - | 1,252 |
| | | 0.51% Computers - Memory Devices | | | |
| - | 180,630 | 180,630 | SanDisk Corp (a) | - | 1,606 | 1,606 |
| 121,500 | - | 121,500 | Seagate Technology | 822 | - | 822 |
| 80,600 | - | 80,600 | Western Digital Corp (a) | 1,330 | - | 1,330 |
| | | 0.03% Computers - Peripheral Equipment | | | |
| 14,200 | - | 14,200 | Logitech International SA (a) | 210 | - | 210 |
| | | 1.42% Consulting Services | | | |
| - | 154,270 | 154,270 | FTI Consulting Inc (a) | - | 8,986 | 8,986 |
| 78,600 | - | 78,600 | SAIC Inc (a) | 1,452 | - | 1,452 |
| | | 1.03% Consumer Products - Miscellaneous | | | |
| - | 100,610 | 100,610 | Clorox Co | - | 6,118 | 6,118 |
| 55,300 | - | 55,300 | Scotts Miracle-Gro Co/The | 1,444 | - | 1,444 |
| | | 0.32% Containers - Metal & Glass | | | |
| 98,600 | - | 98,600 | Crown Holdings Inc (a) | 1,990 | - | 1,990 |
| 14,600 | - | 14,600 | Owens-Illinois Inc (a) | 334 | - | 334 |
| | | 0.67% Containers - Paper & Plastic | | | |
| - | 210,520 | 210,520 | Pactiv Corp (a) | - | 4,960 | 4,960 |
| | | 1.58% Cosmetics & Toiletries | | | |
| - | 228,590 | 228,590 | Alberto-Culver Co | - | 5,882 | 5,882 |
| 82,400 | - | 82,400 | Avon Products Inc | 2,046 | - | 2,046 |
| 32,500 | - | 32,500 | Chattem Inc (a) | 2,459 | - | 2,459 |
| 33,900 | - | 33,900 | Estee Lauder Cos Inc/The | 1,222 | - | 1,222 |
| | | 0.43% Data Processing & Management | | | |
| 82,000 | - | 82,000 | Broadridge Financial Solutions Inc | 992 | - | 992 |
| 29,100 | - | 29,100 | Fiserv Inc (a) | 971 | - | 971 |
| 67,100 | - | 67,100 | SEI Investments Co | 1,186 | - | 1,186 |
| | | 0.78% Dental Supplies & Equipment | | | |
| - | 144,230 | 144,230 | Dentsply International Inc | - | 4,382 | 4,382 |
| 54,000 | - | 54,000 | Patterson Cos Inc (a) | 1,368 | - | 1,368 |
| | | 0.08% Diagnostic Kits | | | |
| 16,500 | - | 16,500 | Idexx Laboratories Inc (a) | 581 | - | 581 |
| | | 0.22% Disposable Medical Products | | | |
| 18,100 | - | 18,100 | CR Bard Inc | 1,597 | - | 1,597 |
| | | 0.39% Distribution & Wholesale | | | |
| 19,100 | - | 19,100 | Fossil Inc (a) | 347 | - | 347 |
| 125,800 | - | 125,800 | LKQ Corp (a) | 1,439 | - | 1,439 |
| 13,500 | - | 13,500 | Scansource Inc (a) | 268 | - | 268 |
| 1,400 | - | 1,400 | Tech Data Corp (a) | 30 | - | 30 |
| 39,700 | - | 39,700 | WESCO International Inc (a) | 789 | - | 789 |
| | | 1.50% Diversified Manufacturing Operations | | | |
| 53,300 | - | 53,300 | Actuant Corp | 956 | - | 956 |
| - | 97,310 | 97,310 | ESCO Technologies Inc (a) | - | 3,357 | 3,357 |
| 20,600 | - | 20,600 | Ingersoll-Rand Co Ltd | 380 | - | 380 |
| - | 128,834 | 128,834 | Pentair Inc | - | 3,561 | 3,561 |
| 24,200 | 47,060 | 71,260 | SPX Corp | 937 | 1,823 | 2,760 |
| | | 0.87% Electric - Integrated | | | |
| 48,100 | - | 48,100 | Allegheny Energy Inc | 1,450 | - | 1,450 |
| - | 150,030 | 150,030 | PPL Corp | - | 4,924 | 4,924 |
| | | 0.92% Electric Products - Miscellaneous | | | |
| - | 172,430 | 172,430 | Ametek Inc | - | 5,733 | 5,733 |
| 71,900 | - | 71,900 | Molex Inc | 1,036 | - | 1,036 |
| | | 0.21% Electronic Components - Miscellaneous | | | |
| 10,800 | - | 10,800 | Benchmark Electronics Inc (a) | 130 | - | 130 |
| 121,100 | - | 121,100 | Jabil Circuit Inc | 1,018 | - | 1,018 |
| 11,000 | - | 11,000 | Plexus Corp (a) | 205 | - | 205 |
| 228,171 | - | 228,171 | Sanmina-SCI Corp (a) | 171 | - | 171 |
| | | 4.54% Electronic Components - Semiconductors | | | |
| - | 486,310 | 486,310 | Altera Corp | - | 8,438 | 8,438 |
| 32,100 | - | 32,100 | Amkor Technology Inc (a) | 130 | - | 130 |
| - | 487,960 | 487,960 | Broadcom Corp (a) | - | 8,334 | 8,334 |
| - | 249,598 | 249,598 | Cavium Networks Inc (a) | - | 3,180 | 3,180 |
| 37,300 | - | 37,300 | Cree Inc (a) | 732 | - | 732 |
| 49,900 | - | 49,900 | Intersil Corp | 683 | - | 683 |
| 278,600 | - | 278,600 | LSI Corp (a) | 1,073 | - | 1,073 |
| 43,300 | - | 43,300 | MEMC Electronic Materials Inc (a) | 796 | - | 796 |
| - | 1,132,579 | 1,132,579 | Micron Technology Inc (a) | - | 5,334 | 5,334 |
| - | 1,002,030 | 1,002,030 | PMC - Sierra Inc (a) | - | 4,690 | 4,690 |
| | | 0.22% Electronic Connectors | | | |
| 57,100 | - | 57,100 | Amphenol Corp | 1,636 | - | 1,636 |
| | | 0.50% Electronic Forms | | | |
| - | 138,410 | 138,410 | Adobe Systems Inc (a) | - | 3,687 | 3,687 |
| | | 0.17% Electronic Measurement Instruments | | | |
| 55,500 | - | 55,500 | Agilent Technologies Inc (a) | 1,232 | - | 1,232 |
| | | 0.34% Electronic Parts Distribution | | | |
| 35,200 | - | 35,200 | Arrow Electronics Inc (a) | 614 | - | 614 |
| 111,000 | - | 111,000 | Avnet Inc (a) | 1,858 | - | 1,858 |
| | | 0.31% Electronics - Military | | | |
| 27,900 | - | 27,900 | L-3 Communications Holdings Inc | 2,265 | - | 2,265 |
| | | 1.28% Energy - Alternate Sources | | | |
| - | 266,170 | 266,170 | Covanta Holding Corp (a) | - | 5,739 | 5,739 |
| - | 25,800 | 25,800 | First Solar Inc (a) | - | 3,707 | 3,707 |
| | | Engineering - Research & Development Services | | | |
| | | 1.60% | | | |
| 40,900 | 149,400 | 190,300 | Fluor Corp | 1,633 | 5,966 | 7,599 |
| 46,500 | - | 46,500 | Foster Wheeler Ltd (a) | 1,274 | - | 1,274 |
| 74,700 | - | 74,700 | KBR Inc | 1,108 | - | 1,108 |
| 27,900 | - | 27,900 | Shaw Group Inc/The (a) | 499 | - | 499 |
| 45,000 | - | 45,000 | URS Corp (a) | 1,323 | - | 1,323 |
| | | 0.46% Engines - Internal Combustion | | | |
| - | 129,840 | 129,840 | Cummins Inc | - | 3,356 | 3,356 |
| | | 0.25% Enterprise Software & Services | | | |
| - | 73,060 | 73,060 | Concur Technologies Inc (a) | - | 1,843 | 1,843 |
| | | | 1.06% Entertainment Software | | | |
| - | 618,150 | 618,150 | Activision Blizzard Inc (a) | - | 7,702 | 7,702 |
| 10,900 | - | 10,900 | Take-Two Interactive Software Inc (a) | 129 | - | 129 |
| | | 1.22% Fiduciary Banks | | | |
| 9,200 | 150,730 | 159,930 | Northern Trust Corp | 518 | 8,488 | 9,006 |
| | | 0.83% Finance - Investment Banker & Broker | | | |
| 52,100 | - | 52,100 | Investment Technology Group Inc (a) | 1,063 | - | 1,063 |
| - | 168,200 | 168,200 | Lazard Ltd | - | 5,075 | 5,075 |
| | | 0.08% Finance - Other Services | | | |
| 54,700 | - | 54,700 | MF Global Ltd (a) | 213 | - | 213 |
| 11,000 | - | 11,000 | Nasdaq OMX Group, Inc (a) | 357 | - | 357 |
| | | 0.09% Food - Meat Products | | | |
| 79,700 | - | 79,700 | Tyson Foods Inc | 697 | - | 697 |
| | | 1.07% Food - Miscellaneous/Diversified | | | |
| - | 75,250 | 75,250 | Campbell Soup Co | - | 2,856 | 2,856 |
| - | 148,490 | 148,490 | McCormick & Co Inc/MD | - | 4,998 | 4,998 |
| | | 0.64% Footwear & Related Apparel | | | |
| - | 55,330 | 55,330 | Deckers Outdoor Corp (a) | - | 4,695 | 4,695 |
| | | 0.16% Garden Products | | | |
| 34,200 | - | 34,200 | Toro Co | 1,150 | - | 1,150 |
| | | 1.87% Hazardous Waste Disposal | | | |
| - | 81,930 | 81,930 | Clean Harbors Inc (a) | - | 5,372 | 5,372 |
| - | 143,607 | 143,607 | Stericycle Inc (a) | - | 8,391 | 8,391 |
| | | 0.11% Hospital Beds & Equipment | | | |
| 33,800 | - | 33,800 | Kinetic Concepts Inc (a) | 818 | - | 818 |
| | | 0.37% Hotels & Motels | | | |
| 27,300 | - | 27,300 | Choice Hotels International Inc | 747 | - | 747 |
| 69,100 | - | 69,100 | Marriott International Inc/DE | 1,442 | - | 1,442 |
| 41,300 | - | 41,300 | Orient-Express Hotels Ltd | 508 | - | 508 |
| | | 1.31% Human Resources | | | |
| 42,900 | - | 42,900 | Hewitt Associates Inc (a) | 1,197 | - | 1,197 |
| 33,800 | - | 33,800 | Manpower Inc | 1,052 | - | 1,052 |
| 83,500 | - | 83,500 | Monster Worldwide Inc (a) | 1,189 | - | 1,189 |
| 51,500 | 277,890 | 329,390 | Robert Half International Inc | 972 | 5,244 | 6,216 |
| | | 0.28% Independent Power Producer | | | |
| 69,700 | - | 69,700 | Mirant Corp (a) | 1,221 | - | 1,221 |
| 35,400 | - | 35,400 | NRG Energy Inc (a) | 823 | - | 823 |
| | | 0.07% Industrial Audio & Video Products | | | |
| 15,700 | - | 15,700 | Dolby Laboratories Inc (a) | 496 | - | 496 |
| | | 0.80% Industrial Gases | | | |
| - | 153,290 | 153,290 | Airgas Inc | - | 5,880 | 5,880 |
| | | 0.25% Instruments - Scientific | | | |
| 45,900 | - | 45,900 | Thermo Fisher Scientific Inc (a) | 1,864 | - | 1,864 |
| | | 1.06% Insurance Brokers | | | |
| - | 160,840 | 160,840 | Aon Corp | - | 6,804 | 6,804 |
| 47,600 | - | 47,600 | Brown & Brown Inc | 977 | - | 977 |
| | | 0.58% Internet Content - Information & News | | | |
| - | 20,730 | 20,730 | Baidu.com ADR (a) | - | 4,270 | 4,270 |
| | | 1.51% Internet Infrastructure Software | | | |
| 58,400 | - | 58,400 | Akamai Technologies Inc (a) | 840 | - | 840 |
| - | 412,941 | 412,941 | F5 Networks Inc (a) | - | 10,249 | 10,249 |
| | | 1.31% Internet Security | | | |
| - | 295,896 | 295,896 | McAfee Inc (a) | - | 9,631 | 9,631 |
| | | 1.73% Investment Management & Advisory Services | | | |
| 40,600 | - | 40,600 | Affiliated Managers Group Inc (a) | 1,883 | - | 1,883 |
| 28,300 | - | 28,300 | Ameriprise Financial Inc | 611 | - | 611 |
| 64,900 | - | 64,900 | GLG Partners Inc | 208 | - | 208 |
| - | 253,540 | 253,540 | T Rowe Price Group Inc | | 10,025 | 10,025 |
| | | | 0.99% Leisure & Recreation Products | | | |
| 28,000 | 263,310 | 291,310 | WMS Industries Inc (a) | 700 | 6,583 | 7,283 |
| | | 0.16% Machinery - Construction & Mining | | | |
| 41,500 | - | 41,500 | Joy Global Inc | 1,203 | - | 1,203 |
| | | 0.01% Machinery - Farm | | | |
| 3,400 | - | 3,400 | AGCO Corp (a) | 107 | - | 107 |
| | | 0.35% Machinery - General Industry | | | |
| 78,100 | - | 78,100 | Manitowoc Co Inc/The | 768 | - | 768 |
| 39,200 | - | 39,200 | Roper Industries Inc | 1,778 | - | 1,778 |
| | | 0.51% Machinery - Pumps | | | |
| - | 59,930 | 59,930 | Flowserve Corp | - | 3,411 | 3,411 |
| 15,200 | - | 15,200 | Graco Inc | 376 | - | 376 |
| | | 0.06% Machinery Tools & Related Products | | | |
| 22,100 | - | 22,100 | Kennametal Inc | 469 | - | 469 |
| | | 4.39% Medical - Biomedical/Gene | | | |
| - | 209,980 | 209,980 | Alexion Pharmaceuticals Inc (a) | - | 8,557 | 8,557 |
| - | 86,720 | 86,720 | Charles River Laboratories International Inc (a) | - | 3,107 | 3,107 |
| - | 191,780 | 191,780 | Illumina Inc (a) | - | 5,912 | 5,912 |
| 48,300 | - | 48,300 | Millipore Corp (a) | 2,507 | - | 2,507 |
| - | 55,207 | 55,207 | Myriad Genetics Inc (a) | - | 3,483 | 3,483 |
| 6,400 | 93,350 | 99,750 | United Therapeutics Corp (a) | 558 | 8,143 | 8,701 |
| | | 1.00% Medical - Drugs | | | |
| - | 96,240 | 96,240 | Allergan Inc/United States | - | 3,818 | 3,818 |
| 30,400 | - | 30,400 | Cephalon Inc (a) | 2,180 | - | 2,180 |
| 72,900 | - | 72,900 | Endo Pharmaceuticals Holdings Inc (a) | 1,349 | - | 1,349 |
| | | 0.19% Medical - Generic Drugs | | | |
| 52,200 | - | 52,200 | Watson Pharmaceuticals Inc (a) | 1,366 | - | 1,366 |
| | | 0.58% Medical - HMO | | | |
| 15,100 | - | 15,100 | Centene Corp (a) | 284 | - | 284 |
| 41,600 | - | 41,600 | Cigna Corp | 678 | - | 678 |
| 65,500 | - | 65,500 | Health Net Inc (a) | 844 | - | 844 |
| 50,200 | - | 50,200 | Humana Inc (a) | 1,485 | - | 1,485 |
| 40,200 | - | 40,200 | WellCare Health Plans Inc (a) | 972 | - | 972 |
| | | 0.05% Medical - Hospitals | | | |
| 168,500 | - | 168,500 | Health Management Associates Inc (a) | 354 | - | 354 |
| | | 0.19% Medical - Wholesale Drug Distribution | | | |
| 45,500 | - | 45,500 | AmerisourceBergen Corp | 1,423 | - | 1,423 |
| | | 1.83% Medical Instruments | | | |
| - | 63,290 | 63,290 | Beckman Coulter Inc | - | 3,159 | 3,159 |
| - | 37,460 | 37,460 | Intuitive Surgical Inc (a) | - | 6,473 | 6,473 |
| 101,500 | - | 101,500 | St Jude Medical Inc (a) | 3,860 | - | 3,860 |
| | | 0.49% Medical Laboratory & Testing Service | | | |
| - | 64,858 | 64,858 | Covance Inc (a) | - | 3,243 | 3,243 |
| 12,800 | - | 12,800 | Icon PLC ADR (a) | 325 | - | 325 |
| | | 1.55% Medical Products | | | |
| 31,600 | - | 31,600 | Becton Dickinson & Co | 2,193 | - | 2,193 |
| 45,200 | 117,843 | 163,043 | Henry Schein Inc (a) | 2,116 | 5,516 | 7,632 |
| 50,400 | - | 50,400 | Hospira Inc (a) | 1,402 | - | 1,402 |
| 4,500 | - | 4,500 | Varian Medical Systems Inc (a) | 205 | - | 205 |
| | | 0.04% Metal - Aluminum | | | |
| 23,900 | - | 23,900 | Century Aluminum Co (a) | 300 | - | 300 |
| | | 0.87% Metal Processors & Fabrication | | | |
| 22,900 | 76,380 | 99,280 | Precision Castparts Corp | 1,484 | 4,950 | 6,434 |
| | | 0.09% Motion Pictures & Services | | | |
| 24,400 | - | 24,400 | DreamWorks Animation SKG Inc (a) | 686 | - | 686 |
| | | 0.32% Motorcycle/Motor Scooter | | | |
| - | 94,650 | 94,650 | Harley-Davidson Inc | - | 2,317 | 2,317 |
| | | 0.19% Multimedia | | | |
| 35,300 | - | 35,300 | Factset Research Systems Inc | 1,369 | - | 1,369 |
| | | 2.52% Networking Products | | | |
| 27,600 | - | 27,600 | Anixter International Inc (a) | 928 | - | 928 |
| - | 230,832 | 230,832 | Atheros Communications Inc (a) | - | 4,148 | 4,148 |
| - | 491,980 | 491,980 | Juniper Networks Inc (a) | - | 9,220 | 9,220 |
| - | 202,640 | 202,640 | Polycom Inc (a) | - | 4,257 | 4,257 |
| | | 0.12% Office Furnishings - Original | | | |
| 27,700 | - | 27,700 | Herman Miller Inc | 610 | - | 610 |
| 13,600 | - | 13,600 | HNI Corp | 249 | - | 249 |
| 859 | - | 859 | | | | |
| | | 1.44% Oil - Field Services | | | |
| 21,400 | - | 21,400 | Helix Energy Solutions Group Inc (a) | 226 | - | 226 |
| 29,500 | - | 29,500 | Oceaneering International Inc (a) | 831 | - | 831 |
| 30,300 | - | 30,300 | Oil States International Inc (a) | 701 | - | 701 |
| - | 220,160 | 220,160 | Smith International Inc | - | 7,591 | 7,591 |
| 10,400 | - | 10,400 | Superior Energy Services Inc (a) | 222 | - | 222 |
| 62,300 | - | 62,300 | Weatherford International Ltd (a) | 1,051 | - | 1,051 |
| 3,031 | - | 3,031 | | | | |
| | | 1.62% Oil & Gas Drilling | | | |
| 85,800 | - | 85,800 | Atwood Oceanics Inc (a) | 2,358 | - | 2,358 |
| 14,600 | 60,910 | 75,510 | Diamond Offshore Drilling Inc | 1,297 | 5,409 | 6,706 |
| 35,900 | - | 35,900 | ENSCO International Inc | 1,365 | - | 1,365 |
| 6,500 | - | 6,500 | Noble Corp | 209 | - | 209 |
| 19,700 | - | 19,700 | Patterson-UTI Energy Inc | 261 | - | 261 |
| 26,300 | - | 26,300 | Unit Corp (a) | 987 | - | 987 |
| 6,477 | - | 6,477 | | | | |
| | | 3.89% Oil Company - Exploration & Production | | | |
| - | 123,790 | 123,790 | Continental Resources Inc/OK (a) | - | 4,010 | 4,010 |
| 17,500 | - | 17,500 | Encore Acquisition Co (a) | 545 | - | 545 |
| 60,200 | - | 60,200 | Mariner Energy Inc (a) | 867 | - | 867 |
| 40,600 | - | 40,600 | Newfield Exploration Co (a) | 933 | - | 933 |
| 53,900 | - | 53,900 | Plains Exploration & Production Co (a) | 1,520 | - | 1,520 |
| - | 147,620 | 147,620 | Questar Corp | - | 5,087 | 5,087 |
| - | 146,925 | 146,925 | Range Resources Corp | - | 6,203 | 6,203 |
| 22,300 | - | 22,300 | St Mary Land & Exploration Co | 555 | - | 555 |
| - | 215,760 | 215,760 | Southwestern Energy Co (a) | - | 7,685 | 7,685 |
| 9,500 | - | 9,500 | Stone Energy Corp (a) | 288 | - | 288 |
| 39,600 | - | 39,600 | W&T Offshore Inc | 759 | - | 759 |
| 3,100 | - | 3,100 | Whiting Petroleum Corp (a) | 161 | - | 161 |
| | | 0.18% Oil Company - Integrated | | | |
| 25,700 | - | 25,700 | Murphy Oil Corp | 1,301 | - | 1,301 |
| | | 1.71% Oil Field Machinery & Equipment | | | |
| 41,500 | 234,090 | 275,590 | Cameron International Corp (a) | 1,007 | 5,679 | 6,686 |
| - | 183,820 | 183,820 | Dresser-Rand Group Inc (a) | - | 4,118 | 4,118 |
| 23,100 | - | 23,100 | FMC Technologies Inc (a) | 808 | - | 808 |
| 33,200 | - | 33,200 | National Oilwell Varco Inc (a) | 992 | - | 992 |
| | | 0.14% Oil Refining & Marketing | | | |
| 33,800 | - | 33,800 | Sunoco Inc | 1,031 | - | 1,031 |
| | | 0.03% Optical Supplies | | | |
| 38,200 | - | 38,200 | Advanced Medical Optics Inc (a) | 236 | - | 236 |
| | | 2.02% Pharmacy Services | | | |
| - | 200,700 | 200,700 | Express Scripts Inc (a) | - | 12,164 | 12,164 |
| 47,600 | - | 47,600 | Medco Health Solutions Inc (a) | 1,806 | - | 1,806 |
| 31,300 | - | 31,300 | Omnicare Inc | 863 | - | 863 |
| | | 0.61% Power Converter & Supply Equipment | | | |
| 26,100 | - | 26,100 | Hubbell Inc | 936 | - | 936 |
| - | 90,684 | 90,684 | Sunpower Corp - Class A (a) | - | 3,542 | 3,542 |
| | | 0.21% Property & Casualty Insurance | | | |
| 59,500 | - | 59,500 | WR Berkley Corp | 1,563 | - | 1,563 |
| | | 0.36% Printing - Commercial | | | |
| - | 153,215 | 153,215 | VistaPrint Ltd (a) | - | 2,615 | 2,615 |
| | | 0.04% Publishing - Books | | | |
| 8,100 | - | 8,100 | John Wiley & Sons Inc | 282 | - | 282 |
| | | 0.13% Racetracks | | | |
| 49,600 | - | 49,600 | Penn National Gaming Inc (a) | 955 | - | 955 |
| | | 0.03% Reinsurance | | | |
| 5,000 | - | 5,000 | Transatlantic Holdings Inc | 214 | - | 214 |
| | | 0.07% REITS - Apartments | | | |
| 34,900 | - | 34,900 | Apartment Investment & Management Co | 511 | - | 511 |
| | | 1.09% REITS - Storage | | | |
| - | 98,550 | 98,550 | Public Storage | - | 8,032 | 8,032 |
| | | 0.02% Rental - Auto & Equipment | | | |
| 21,400 | - | 21,400 | Hertz Global Holdings Inc (a) | 154 | - | 154 |
| | | 0.07% Research & Development | | | |
| 15,700 | - | 15,700 | Pharmaceutical Product Development Inc | 486 | - | 486 |
| | | 2.79% Retail - Apparel & Shoe | | | |
| 40,200 | - | 40,200 | Abercrombie & Fitch Co | 1,164 | - | 1,164 |
| 94,900 | - | 94,900 | American Eagle Outfitters Inc | 1,055 | - | 1,055 |
| 52,200 | - | 52,200 | AnnTaylor Stores Corp (a) | 656 | - | 656 |
| 36,700 | - | 36,700 | Chico's FAS Inc (a) | 125 | - | 125 |
| - | 304,320 | 304,320 | Foot Locker Inc | - | 4,449 | 4,449 |
| 54,000 | 283,300 | 337,300 | Guess ? Inc | 1,176 | 6,168 | 7,344 |
| 8,100 | - | 8,100 | Men's Wearhouse Inc | 124 | - | 124 |
| 24,000 | - | 24,000 | Phillips-Van Heusen Corp | 588 | - | 588 |
| - | 230,960 | 230,960 | Urban Outfitters Inc (a) | - | 5,021 | 5,021 |
| | | 0.17% Retail - Auto Parts | | | |
| 40,100 | - | 40,100 | Advance Auto Parts Inc | 1,251 | - | 1,251 |
| | | 0.21% Retail - Automobile | | | |
| 106,200 | - | 106,200 | Carmax Inc (a) | 1,128 | - | 1,128 |
| 11,100 | - | 11,100 | Copart Inc (a) | 387 | - | 387 |
| | | 0.65% Retail - Computer Equipment | | | |
| 25,200 | 150,380 | 175,580 | GameStop Corp (a) | 690 | 4,119 | 4,809 |
| | | 0.40% Retail - Discount | | | |
| - | 76,890 | 76,890 | Dollar Tree Inc (a) | - | 2,923 | 2,923 |
| | | 0.07% Retail - Gardening Products | | | |
| 13,200 | - | 13,200 | Tractor Supply Co (a) | 549 | - | 549 |
| | | 0.03% Retail - Mail Order | | | |
| 27,200 | - | 27,200 | Williams-Sonoma Inc | 225 | - | 225 |
| | | 0.64% Retail - Office Supplies | | | |
| - | 242,430 | 242,430 | Staples Inc | - | 4,710 | 4,710 |
| | | | 0.17% Retail - Pawn Shops | | | |
| 35,000 | - | 35,000 | Cash America International Inc | 1,238 | - | 1,238 |
| | | 0.11% Retail - Pet Food & Supplies | | | |
| 39,700 | - | 39,700 | PetSmart Inc | 782 | - | 782 |
| | | 1.39% Retail - Regional Department Store | | | |
| 17,200 | 272,810 | 290,010 | Kohl's Corp (a) | 604 | 9,584 | 10,188 |
| | | 0.62% Retail - Restaurants | | | |
| 78,800 | - | 78,800 | Brinker International Inc | 733 | - | 733 |
| 18,300 | - | 18,300 | Chipotle Mexican Grill Inc (a) | 929 | - | 929 |
| 58,300 | - | 58,300 | Darden Restaurants Inc | 1,292 | - | 1,292 |
| 16,100 | - | 16,100 | Jack in the Box Inc (a) | 324 | - | 324 |
| 29,100 | - | 29,100 | Panera Bread Co (a) | 1,313 | - | 1,313 |
| | | 0.05% Retail - Sporting Goods | | | |
| 22,500 | - | 22,500 | Dick's Sporting Goods Inc (a) | 345 | - | 345 |
| | | 0.13% Rubber - Tires | | | |
| 106,600 | - | 106,600 | Goodyear Tire & Rubber Co/The (a) | 951 | - | 951 |
| | | 1.62% Savings & Loans - Thrifts | | | |
| - | 476,180 | 476,180 | Hudson City Bancorp Inc | - | 8,957 | 8,957 |
| 27,000 | - | 27,000 | New York Community Bancorp Inc | 423 | - | 423 |
| - | 147,860 | 147,860 | People's United Financial Inc | - | 2,588 | 2,588 |
| | | 1.89% Schools | | | |
| 6,400 | 133,190 | 139,590 | Apollo Group Inc (a) | 445 | 9,258 | 9,703 |
| 13,500 | - | 13,500 | Capella Education Co (a) | 640 | - | 640 |
| - | 40,510 | 40,510 | ITT Educational Services Inc (a) | - | 3,551 | 3,551 |
| | | 1.64% Semiconductor Equipment | | | |
| - | 294,460 | 294,460 | Lam Research Corp (a) | - | 6,584 | 6,584 |
| | | Varian Semiconductor Equipment Associates Inc (a) | | | |
| - | 280,226 | 280,226 | | - | 5,498 | 5,498 |
| | | 0.10% Soap & Cleaning Products | | | |
| 12,200 | - | 12,200 | Church & Dwight Co Inc | 721 | - | 721 |
| | | 0.21% Steel - Producers | | | |
| 60,000 | - | 60,000 | AK Steel Holding Corp | 835 | - | 835 |
| 5,900 | - | 5,900 | Schnitzer Steel Industries Inc | 159 | - | 159 |
| 46,000 | - | 46,000 | Steel Dynamics Inc | 548 | - | 548 |
| | | 0.19% Steel - Specialty | | | |
| 53,100 | - | 53,100 | Allegheny Technologies Inc | 1,409 | - | 1,409 |
| | | 0.24% Telecommunication Equipment | | | |
| 49,000 | - | 49,000 | Harris Corp | 1,762 | - | 1,762 |
| | | 0.21% Telecommunication Equipment - Fiber Optics | | | |
| 96,300 | - | 96,300 | Ciena Corp (a) | 925 | - | 925 |
| 113,000 | - | 113,000 | JDS Uniphase Corp (a) | 617 | - | 617 |
| | | 0.31% Telecommunication Services | | | |
| 28,000 | - | 28,000 | Embarq Corp | 840 | - | 840 |
| 55,600 | - | 55,600 | NTELOS Holdings Corp | 1,446 | - | 1,446 |
| | | 0.14% Therapeutics | | | |
| 56,800 | - | 56,800 | BioMarin Pharmaceutical Inc (a) | 1,041 | - | 1,041 |
| | | 0.10% Transport - Marine | | | |
| 10,900 | - | 10,900 | Frontline Ltd | 347 | - | 347 |
| 10,900 | - | 10,900 | Kirby Corp (a) | 374 | - | 374 |
| | | 0.55% Transport - Rail | | | |
| - | 131,870 | 131,870 | Kansas City Southern (a) | - | 4,071 | 4,071 |
| | | 0.22% Transport - Services | | | |
| 23,200 | - | 23,200 | Ryder System Inc | 919 | - | 919 |
| 59,800 | - | 59,800 | UTI Worldwide Inc | 703 | - | 703 |
| | | 0.96% Transport - Truck | | | |
| 27,900 | - | 27,900 | Con-way Inc | 950 | - | 950 |
| - | 168,090 | 168,090 | JB Hunt Transport Services Inc | - | 4,779 | 4,779 |
| 34,300 | - | 34,300 | Landstar System Inc | 1,323 | - | 1,323 |
| | | 0.25% Web Hosting & Design | | | |
| 29,200 | - | 29,200 | Equinix Inc (a) | 1,823 | - | 1,823 |
| | | 0.16% Web Portals | | | |
| 141,300 | - | 141,300 | Earthlink Inc (a) | 975 | - | 975 |
| 3,300 | - | 3,300 | Sohu.com Inc (a) | 181 | - | 181 |
| | | 0.13% Wire & Cable Products | | | |
| 56,200 | - | 56,200 | General Cable Corp (a) | 960 | - | 960 |
| | | 0.45% Wireless Equipment | | | |
| 48,300 | - | 48,300 | American Tower Corp (a) | 1,561 | - | 1,561 |
| 84,100 | - | 84,100 | SBA Communications Corp (a) | 1,765 | - | 1,765 |
| | | 0.06% X-Ray Equipment | | | |
| 36,400 | - | 36,400 | Hologic Inc (a) | 446 | - | 446 |
| | | TOTAL COMMON STOCKS | 201,100 | 511,969 | 713,069 |
| Principal | | | | | | |
| Amount (000's) | | Value (000's) |
| | | | 1.62% SHORT TERM INVESTMENTS | | | | | |
| | | | Commercial Paper | | | | | |
| | | Investment in Joint Trading Account, HSBC Funding | | | | | |
| - | $5,969 | $5,969 | 0.25%, 11/3/2008 | - | $ 5,969 | $ 5,969 |
| | | Investment in Joint Trading Account, Prudential Funding | | | | | |
| - | 5,969 | 5,969 | 0.30%, 11/3/2008 | - | | 5,969 | $ 5,969 |
| | | TOTAL SHORT TERM INVESTMENTS | - | | 11,938 | | 11,938 |
| | | Total Investments | 201,100 | $ 523,907 | $ 725,007 |
| | | 1.42% Other Assets in Excess of Liabilities, Net | 4,566 | | 5,911 | $ 10,477 |
| | | Pro Forma Adjustment | | | | $ (45) |
| | | 100.00% TOTAL NET ASSETS | 205,666 | $ 529,818 | $ 735,439 |
| | | | (a)Non-Income Producing Security | | | | | |
| |
| |
| | | | Unrealized Appreciation (Depreciation) | | | | | |
| | | | Unrealized Appreciation | 1,565 | $ 19,585 | $ 21,150 |
| | | | Unrealized Depreciation | (119,696) | | (170,790) | $ (290,486) |
| | | | Net Unrealized Appreciation (Depreciation) | (118,131) | | (151,205) | | (269,336) |
| | | | Cost for federal income tax purposes | $ 319,231 | $ 675,112 | $ 994,343 |
| | | | All dollar amounts are shown in thousands (000's) | | | | | |
| | | | Portfolio Summary (unaudited) | | | | | |
| | | | Sector | | | | Percent |
| | | | Consumer, Non-cyclical | | | | | 24.64% |
| | | | Consumer, Cyclical | | | | | 14.50% |
| | | | Industrial | | | | | 14.22% |
| | | | Energy | | | | | 11.96% |
| | | | Technology | | | | | 10.05% |
| | | | Financial | | | | | 9.57% |
| | | | Communications | | | | | 9.06% |
| | | | Basic Materials | | | | | 3.43% |
| | | | Utilities | | | | | 1.15% |
| | | | Liabilities in Excess of Other Assets, Net | | | | | 1.42% |
| | | | TOTAL NET ASSETS | | | | | 100.00% |
| |
| | | | Other Assets Summary (unaudited) | | | | | |
| | | | Asset Type | | | | Percent |
| | | | Futures | | | | | 1.86% |
| |
| |
| | | | Futures Contracts | | | | | |
| | | | Buy: S&P Mid 400 eMini; December 2008 | | | | | |
| | | | Number of Contracts | - | | 241 | | 241 |
| | | | Original Value | - | $ 12,405 | $ 12,405 |
| | | | Current Market Value | - | $ 13,699 | $ 13,699 |
| | | | Unrealized Appreciation/(Depreciation) | - | $ 1,294 | $ 1,294 |
| | | | All dollar amounts are shown in thousands (000's) | | | | | |
As of October 31, 2008, all securities held by MidCap Growth Fund II would comply with the investment restrictions of MidCap Growth Fund III.
| Pro Forma Notes to Financial Statements |
| October 31, 2008 |
| (unaudited) |
1. Description of the Funds
MidCap Growth Fund II and MidCap Growth Fund III are series of Principal Funds, Inc. (the “Fund”). The Fund is registered under the Investment Company Act of 1940, as amended, as an open-end management investment company.
2. Basis of Combination
On December 19, 2008, the Board of Directors of Principal Funds, Inc., MidCap Growth Fund II approved an Agreement and Plan of Reorganization (the “Reorganization”) whereby, MidCap Growth Fund III will acquire all the assets of MidCap Growth Fund II subject to the liabilities of such fund, in exchange for a number of shares equal to the pro rata net assets of MidCap Growth Fund III.
The Reorganization will be accounted for as a tax-free reorganization of investment companies. The pro forma combined financial statements are presented for the information of the reader and may not necessarily be representative of what the actual combined financial statements would have been had the Reorganization occurred at October 31, 2008. The unaudited pro forma schedules of investments and statements of assets and liabilities reflect the financial position of MidCap Growth Fund II and MidCap Growth Fund III at October 31, 2008. The unaudited pro forma statements of operations reflect the results of operations of MidCap Growth Fund II and MidCap Growth Fund III for the twelve months ended October 31, 2008. The statements have been derived from the Funds’ respective books and records utilized in calculating daily net asset value at the dates indicated above for MidCap Growth Fund II and MidCap Growth Fund III under U.S. generally accepted accounting principles. The historical cost of investment securities will be carried forward to the surviving entity and results of operations of MidCap Growth Fund III for pre-combination periods will not be restated.
The pro forma schedules of investments and statements of assets and liabilities and operations should be read in conjunction with the historical financial statements of the Funds incorporated by reference in the Statements of Additional Information.
3. Significant Accounting Policies
The preparation of financial statements in conformity with U.S. generally accepted accounting principles requires management to make estimates and assumptions that affect the reported amounts of assets and liabilities and disclosure of contingent assets and liabilities at the date of the financial statements and the reported amounts of revenues and expenses during the reporting period. Actual results could differ from those estimates.
4. Security Valuation
MidCap Growth Fund II and MidCap Growth Fund III value securities for which market quotations are readily available at market value, which is determined using the last reported sale price. If no sales are reported, as is regularly the case for some securities traded over-the-counter, securities are valued using the last reported bid price or an evaluated bid price provided by a pricing service. Pricing services use electronic modeling techniques that incorporate security characteristics, market conditions and dealer-supplied valuations to determine an evaluated bid price. When reliable market quotations are not considered to be readily available, which may be the case, for example, with respect to restricted securities, certain debt securities, preferred stocks, and foreign securities, the investments are valued at their fair value as determined in good faith by Principal Management Corporation (the “Manager”) under procedures established and periodically reviewed by the Fund’s Board of Directors.
Short-term securities are valued at amortized cost, which approximates market. Under the amortized cost method, a security is valued by applying a constant yield to maturity of the difference between the principal amount due at maturity and the cost of the security to the Funds.
5. Futures Contracts
The Funds may enter into futures contracts for both hedging and non-hedging purposes. Initial margin deposits are made by cash deposits or segregation of specific securities as may be required by the exchange on which the transaction was conducted. Pursuant to the contracts, the Funds agree to receive from or pay to the broker, an amount of cash equal to the daily fluctuation in the value of the contract. Such receipts or payments are known as “variation margin” and are recorded by the Funds as a variation margin receivable or payable on futures contracts. During the period the futures contracts are open, daily changes in the value of the contracts are recognized as unrealized gains or losses. These unrealized gains or losses are included as a component of net unrealized appreciation (depreciation) of investments on the statements of assets and liabilities. When the contracts are closed, the Funds recognize a realized gain or loss equal to the difference between the proceeds from, or cost of, the closing transaction and the Funds’ cost basis in the contract.
| Pro Forma Notes to Financial Statements |
| October 31, 2008 |
| (unaudited) |
6. Capital Shares
The pro forma net asset value per share assumes issuance of shares of MidCap Growth Fund III that would have been issued at October 31, 2008, in connection with the Reorganization. The number of shares assumed to be issued is equal to the net assets of MidCap Growth Fund II, as of October 31, 2008, divided by the net asset value per share of the MidCap Growth Fund III as of October 31, 2008. The pro forma number of shares outstanding, by class, for the combined fund can be found on the statement of assets and liabilities.
7. Pro Forma Adjustments
The accompanying pro forma financial statements reflect changes in fund shares as if the Reorganization had taken place on October 31, 2008. The expenses of the MidCap Growth Fund II were adjusted assuming the fee structure of the MidCap Growth Fund III was in effect for the twelve months ended October 31, 2008.
8. Distributions
No provision for federal income taxes is considered necessary because each fund is qualified as a “regulated investment company” under the Internal Revenue Code and intends to distribute each year substantially all of its net investment income and realized capital gains to shareholders.
Item 15. Indemnification
Under Section 2-418 of the Maryland General Corporation Law, with respect to any proceedings against a present or former director, officer, agent or employee (a "corporate representative") of the Registrant, the Registrant may indemnify the corporate representative against judgments, fines, penalties, and amounts paid in settlement, and against expenses, including attorneys' fees, if such expenses were actually incurred by the corporate representative in connection with the proceeding, unless it is established that:
(i) The act or omission of the corporate representative was material to the matter giving rise to the proceeding; and
| 1. | Was committed in bad faith; or |
| |
| 2. | Was the result of active and deliberate dishonesty; or |
(ii) The corporate representative actually received an improper personal benefit in money, property, or services; or
(iii) In the case of any criminal proceeding, the corporate representative had reasonable cause to believe that the act or omission was unlawful.
If a proceeding is brought by or on behalf of the Registrant, however, the Registrant may not indemnify a corporate representative who has been adjudged to be liable to the Registrant. Under the Registrant's Articles of Incorporation and Bylaws, directors and officers of the Registrant are entitled to indemnification by the Registrant to the fullest extent permitted under Maryland law and the Investment Company Act of 1940. Reference is made to Article VI, Section 7 of the Registrant's Articles of Incorporation, Article 12 of the Registrant's Bylaws and Section 2-418 of the Maryland General Corporation Law.
The Registrant has agreed to indemnify, defend and hold the Distributor, its officers and directors, and any person who controls the Distributor within the meaning of Section 15 of the Securities Act of 1933, free and harmless from and against any and all claims, demands, liabilities and expenses (including the cost of investigating or defending such claims, demands or liabilities and any counsel fees incurred in connection therewith) which the Distributor, its officers, directors or any such controlling person may incur under the Securities Act of 1933, or under common law or otherwise, arising out of or based upon any untrue statement of a material fact contained in the Registrant's registration statement or prospectus or arising out of or based upon any alleged omission to state a material fact required to be stated in either thereof or necessary to make the statements in either thereof not misleading, except insofar as such claims, demands, liabilities or expenses arise out of or are based upon any such untrue statement or omission made in conformity with information furnished in writing by the Distributor to the Registrant for use in the Registrant's registration statement or prospectus: provided, however, that this indemnity agreement, to the extent that it might require indemnity of any person who is also an officer or director of the Registrant or who controls the Registrant within the meaning of Section 15 of the Securities Act of 1933, shall not inure to the benefit of such officer, director or controlling person unless a court of competent jurisdiction shall determine, or it shall have been determined by controlling precedent that such result would not be against public policy as expressed in the Securities Act of 1933, and further provided, that in no event shall anything contained herein be so construed as to protect the Distributor against any liability to the Registrant or to its security holders to which the Distributor would otherwise be subject by reason of willful misfeasance, bad faith, or gross negligence, in the performance of its duties, or by reason of its reckless disregard
of its obligations under this Agreement. The Registrant's agreement to indemnify the Distributor, its officers and directors and any such controlling person as aforesaid is expressly conditioned upon the Registrant being promptly notified of any action brought against the Distributor, its officers or directors, or any such controlling person, such notification to be given by letter or telegram addressed to the Registrant.
Item 16. Exhibits.
Unless otherwise stated, all filing references are to File No. 33-59474
| (1) | a. | Articles of Amendment and Restatement (filed 4/12/96) |
| |
| | b. | Articles of Amendment and Restatement (filed 9/22/00) |
| |
| | c. | Articles of Amendment and Restatement dated 6/14/02 (filed 12/30/02) |
| |
| | d. | Articles of Amendment dated 5/23/05 (filed 9/8/05) |
| |
| | e. | Articles of Amendment dated 9/30/05 (filed 11/22/05) |
| |
| | f. | Articles of Amendment dated 7/7/06 (Incorporated by reference from exhibit #1(2)b to registration statement No. 333-137477 filed on Form N-14 on 9/20/06) |
| |
| | g. | Articles of Amendment dated 06/04/08 (filed 07/17/08) |
| |
| | h. | Articles of Amendment (filed 9/12/97) |
| |
| | i. | Certificate of Correction dated 9/14/00 (filed 9/22/00) |
| |
| | j. | Certificate of Correction dated 12/13/00 (filed 10/12/01) |
| |
| | k. | Articles Supplementary dated 12/11/00 (filed 10/12/01) |
| |
| | l. | Articles Supplementary dated 3/12/01 (filed 10/12/01) |
| |
| | m. | Articles Supplementary dated 4/16/02 (filed 12/30/02) |
| |
| | n. | Articles Supplementary dated 9/25/02 (filed 12/30/02) |
| |
| | o. | Articles Supplementary dated 2/5/03 (filed 02/26/03) |
| |
| | p. | Articles Supplementary dated 4/30/03 (filed 9/11/03) |
| |
| | q. | Articles Supplementary dated 6/10/03 (filed 9/11/03) |
| |
| | r. | Articles Supplementary dated 9/9/03 (filed 9/11/03) |
| |
| | s. | Articles Supplementary dated 11/6/03 (filed 12/15/03) |
| |
| | t. | Articles Supplementary dated 1/29/04 (filed 2/26/04) |
| |
| | u. | Articles Supplementary dated 3/8/04 (filed 7/27/04) |
| |
| | v. | Articles Supplementary dated 6/14/04 (filed 9/27/04) |
| |
| | w. | Articles Supplementary dated 9/13/04 (filed 12/13/04) |
| |
| | x. | Articles Supplementary dated 10/1/04 (filed 12/13/04) |
| |
| | y. | Articles Supplementary dated 12/13/04 (filed 2/28/05) |
| |
| | z. | Articles Supplementary dated 2/4/05 (filed 5/16/05) |
| |
| | aa. | Articles Supplementary dated 2/24/05 (filed 5/16/05) |
| |
| | bb. | Articles Supplementary dated 5/6/05 (filed 9/8/05) |
| |
| | cc. | Articles Supplementary dated 12/20/05 (filed 2/28/06) |
| |
| | dd. | Articles Supplementary dated 9/20/06 (Incorporated by reference from exhibit #1(4)t to registration statement No. 333-137477 filed on Form N-14 on 9/20/06) |
| |
| | ee. | Articles Supplementary dated 1/12/07 (filed 1/16/07) |
| |
| | ff. | Articles Supplementary dated 1/22/07 (filed 07/18/07 |
| |
| | gg. | Articles Supplementary dated 7/24/07 (filed 9/28/07) |
| |
| | hh. | Articles Supplementary dated 09/13/07 (filed 12/14/07) |
| |
| | ii. | Articles Supplementary dated 1/3/08 (filed 03/05/08) |
| |
| | jj. | Articles Supplementary dated 3/13/08 (filed 05/01/08) |
| |
| | kk. | Articles Supplementary dated 06/23/08 (filed 07/17/08) |
| |
| | ll. | Articles Supplementary dated 09/10/08 (filed 12/12/08) |
| |
| | mm. | Articles Supplementary dated 10/31/08 (filed 12/12/08) |
| |
| (2) | By-laws (filed 12/29/05) |
| |
| (3) | N/A | | |
| |
| (4) | Forms of Plans of Reorganization (filed herewith as Appendix A to the Proxy |
| | Statement/Prospectus) |
| |
| (5) | Included in Exhibits 1 and 2 hereto. |
| |
| (6) | (1) | a. | Management Agreement (filed 9/12/97) |
| | | b. | 1st Amendment to the Management Agreement (filed 9/22/00) |
| | | c. | Management Agreement (filed 12/5/00) |
| | | d. | Amendment to Management Agreement dated 9/9/02(filed 12/30/02) |
| | | e. | Amendment to Management Agreement dated 3/11/02 (filed 02/26/03) |
| | | f. | Amendment to Management Agreement dated 12/10/02 (filed 02/26/03) |
| | | g. | Amendment to Management Agreement dated 10/22/03 (filed 12/15/03) |
| | | h. | Amendment to Management Agreement dated 3/8/04 (filed 6/1/04) |
| | | i. | Amendment to Management Agreement dated 6/14/04 (filed 9/27/04) |
| | | j. | Amendment to Management Agreement dated 7/29/04 (filed 9/27/04) |
| | | k. | Amendment to Management Agreement dated 9/13/04 (filed 9/27/04) |
| | | l. | Amendment to Management Agreement dated 12/13/04 (filed 2/28/05) |
| | | m. | Amendment to Management Agreement dated 1/1/05 (filed 2/28/05) |
| | | n. | Amendment to Management Agreement dated 9/30/05 (filed 11/22/05) |
| | | o. | Amendment to Management Agreement dated 1/12/07 (filed 1/16/07) |
| | | p. | Amendment to Management Agreement dated 9/12/07 (filed 9/28/07) |
| | | q. | Amendment to Management Agreement dated 10/01/07 (filed 12/14/07) |
| | | r. | Amendment to Management Agreement dated 10/31/07 (filed 12/14/07) |
| | | s. | Amendment to Management Agreement dated 2/7/08 (filed 05/01/08) |
| | | t. | Amendment to Management Agreement dated 06/24/08 (filed 09/30/08) |
| |
| | (2) | a. | Jacobs Levy Equity Management, Inc. Sub-Advisory Agreement dated |
| | | | 6/15/06 (filed 10/20/06) |
| | | b. | Amended & Restated Sub-Advisory Agreement with Jacobs Levy dated |
| | | | 1/2/08 (filed 03/05/08) |
| |
| | (3) | a. | MacKay Shields LLC Sub-Advisory Agreement dated 1/2/08 (filed 03/05/08) |
| |
| | (4) | a. | Mellon Equity Associates LLP Sub-Advisory Agreement dtd 12/21/04 (filed |
| | | | 2/28/05) |
| | | b. | Amended & Restated Sub-Adv Agreement with Mellon Equity dated 8/8/05 |
| | | | (filed 11/22/05) |
| | | c. | Amended & Restated Sub-Adv Agreement with Mellon Capital dated 1/1/08 |
| | | | (filed 3/28/08) |
| |
| | (5) | a. | Turner Sub-Advisory Agreement (filed 12/5/00) |
| | | b. | Amended & Restated Sub-Adv Agreement with Turner dated 10/31/07. (filed |
| | | | 12/14/07) |
| |
| (7) | (1) | a. | Distribution Agreement (Class A, B, C, J, Institutional, Advisors Preferred, |
| | | | Preferred, Advisors Select, Select, Advisors Signature Classes) dtd 3/11/08 |
| | | | (filed 05/01/08) |
| |
| (8) | Not Applicable | |
| |
| (9) | (1) | a. | Domestic Portfolio Custodian Agreement with Bank of New York (filed |
| | | | 4/12/96) |
| | | b. | Domestic Funds Custodian Agreement with Bank of New York (filed 12/5/00) |
| | | c. | Domestic and Global Custodian Agreement with Bank of New York (filed |
| | | | 11/22/05) |
| (10) | Rule 12b-1 Plan |
| | (1) | R-3 f/k/a Advisors Preferred Plan (filed 9/22/2000) |
| | | a. | Amended & Restated dtd 3/11/08 (filed 05/01/08) |
| | (2) | R-2 f/k/a Advisors Select Plan (filed 9/22/2000) |
| | | a. | Amended & Restated dtd 3/11/08 (filed 05/01/08) |
| | (3) | R-4 f/k/a Select Plan (filed 12/30/02) |
| | | a. | Amended & Restated dtd 3/11/08 (filed 05/01/08) |
| | (4) | R-1 f/k/a Advisors Signature Plan (filed 12/13/04) |
| | | a. | Amended & Restated dtd 3/11/08 (filed 5/01/08) |
| (11) | Opinion and Consent of counsel, regarding legality of issuance of shares and other matters * |
| (12) | Forms of Opinions and Consent of Counsel on Tax Matters ** |
| (13) | Not Applicable |
| (14) | Consent of Independent Registered Public Accountants |
| | (a) | Consent of Ernst & Young LLP * |
| (15) | Not Applicable |
| (16) | (a) | Powers of Attorney* |
| (17) | (a) | Prospectuses of Principal Funds, Inc. dated March 1, 2008, as supplemented (filed |
| | | January 29, 2009) |
| | (b) | Statement of Additional Information of Principal Funds, Inc. dated December 15, |
| | | 2008, (filed January 6, 2009) |
| | (c) | Annual Report of Principal Funds, Inc. for the fiscal year ended October 31, 2008 |
| | | (filed January 8, 2009) |
| * | Filed herein. |
| ** | To be filed by amendment. |
Item 17. Undertakings
(1) The undersigned Registrant agrees that prior to any public reoffering of the securities registered through the use of a prospectus which is a part of this Registration Statement by any person or party who is deemed to be an underwriter within the meaning of Rule 145(c) of the Securities Act of 1933, the reoffering prospectus will contain the information called for by the applicable registration form for re-offerings by persons who may be deemed underwriters, in addition to the information called for by the other items of the applicable form.
(2) The undersigned Registrant agrees that every prospectus that is filed under paragraph (1) above will be filed as part of an amendment to the Registration Statement and will not be used until the amendment is effective, and that, in determining any liability under the Securities Act of 1933, each post-effective amendment shall be deemed to be a new registration statement for the securities offered therein, and the offering of the securities at that time shall be deemed to be the initial bona fide offering of them.
(3) The undersigned Registrant agrees to file a post-effective amendment to this Registration Statement which will include an opinion of counsel regarding the tax consequences of the proposed reorganization.
Pursuant to the requirements of the Securities Act of 1933, the Registrant, Principal Funds, Inc., has duly caused this Registration Statement to be signed on its behalf by the undersigned, thereunto duly authorized, in the City of Des Moines and State of Iowa, on the 18th day of February 2009.
| | Principal Funds, Inc.
(Registrant) |
| | /s/ R. C. Eucher
______________________________________
R. C. Eucher
Chairman of the Board and
Chief Executive Officer |
Attest:
/s/ Beth Wilson
______________________________________
Beth Wilson
Vice President and Secretary |
Pursuant to the requirements of the Securities Act of 1933, this Registration Statement has been signed below by the following persons in the capacities and on the dates indicated.
| Signature | Title | Date |
| |
| /s/ R. C. Eucher | | |
| | Chairman of the Board | February 18, 2009 |
| R. C. Eucher | and Chief Executive Officer | |
| | (Principal Executive Officer) | |
| |
| /s/ L. A. Rasmussen | | |
| | Vice President, | February 18, 2009 |
| L. A. Rasmussen | Controller and Chief Financial Officer | |
| | (Principal Financial Officer and Controller) | |
| |
| (N. Everett)* | | |
| | President and Director | February 18, 2009 |
| N. M. Everett | | |
| |
| |
| /s/ M. J. Beer | | |
| | Executive Vice President | February 18, 2009 |
| M. J. Beer | | |
| |
| (E. Ballantine)* | | |
| | Director | February 18, 2009 |
| E. Ballantine | | |
| |
| (K. Blake)* | | |
| | Director | February 18, 2009 |
| K. Blake | | |
| |
| (C. Damos)* | | |
| | Director | February 18, 2009 |
| C. Damos | | |
| |
| (R. W. Gilbert)* | | |
| | Director | February 18, 2009 |
| R. W. Gilbert | | |
| |
| (M. A. Grimmett)* | | |
| | Director | February 18, 2009 |
| M. A. Grimmett | | |
| |
| (F. S. Hirsch)* | | |
| | Director | February 18, 2009 |
| F. S. Hirsch | | |
| (W. C. Kimball)* | | | |
| | Director | | February 18, 2009 |
| W. C. Kimball | | | |
| |
| (B. A. Lukavsky)* | | | |
| | Director | | February 18, 2009 |
| B. A. Lukavsky | | | |
| |
| (W. G. Papesh)* | | | |
| | Director | | February 18, 2009 |
| W. G. Papesh | | | |
| |
| (D. Pavelich)* | | | |
| | Director | | February 18, 2009 |
| D. Pavelich | | | |
| |
| | | | /s/ M. J. Beer |
| | | *By | |
| | | | M. J. Beer |
| | | | Executive Vice President |
| |
| | | | Pursuant to Powers of Attorney filed herewith. |
| | EXHIBIT INDEX |
| Exhibit No. | Description |
| 4 | Form of Plan of Reorganization (filed herewith as Appendix A to the Proxy |
| | Statement/Prospectus) |
| 11 | Opinion and Consent of counsel regarding legality of issuance of shares and other matters |
| 14(a) | Consent of Ernst & Young LLP, Independent Registered Public Accountants |
| 16(a) | Powers of Attorney |