MARCH 31, 2008
RYDEX SERIES FUNDS ANNUAL REPORT
DOMESTIC EQUITY FUNDS
MULTI-CAP CORE EQUITY FUND
SECTOR ROTATION FUND
ALTERNATIVE INVESTMENT FUNDS
ABSOLUTE RETURN STRATEGIES FUND
ALTERNATIVE STRATEGIES ALLOCATION FUND
COMMODITIES STRATEGY FUND
(Formerly, Commodities Fund)
HEDGED EQUITY FUND
INTERNATIONAL ROTATION FUND
MANAGED FUTURES STRATEGY FUND
(Formerly, Managed Futures Fund)
REAL ESTATE FUND
STRENGTHENING DOLLAR 2x STRATEGY FUND
(Formerly, Dynamic Strengthening Dollar Fund)
WEAKENING DOLLAR 2x STRATEGY FUND
(Formerly, Dynamic Weakening Dollar Fund)
GO GREEN!
ELIMINATE MAILBOX CLUTTER
Go paperless with Rydex eDelivery—a service giving you full
online access to account information and documents. Save time,
cut down on mailbox clutter and be a friend to the environment
with eDelivery.
With Rydex eDelivery you can:
•
View online confirmations and statements at your
convenience.
•
Receive email notifications when your most recent
confirmations, statements and other account documents
are available for review.
•
Access prospectuses, annual reports and semiannual
reports online.
It’s easy to enroll:
1/ Visit www.rydexinvestments.com
e
RYDEX
DELIVERY
2/ Click on the Rydex eDelivery logo
3/ Follow the simple enrollment instructions
If you have questions about Rydex eDelivery services,
contact one of our Shareholder Service Representatives
at 800.820.0888.
This report and the financial statements contained herein are submitted for the general information of our shareholders. The
report is not authorized for distribution to prospective investors unless preceded or accompanied by an effective prospectus.
Distributed by Rydex Distributors, Inc.
TABLE OF CONTENTS
LETTER TO OUR SHAREHOLDERS
. . . . . . . . . . . . . . . . . . . . . . . . . . . . . . . . . . . . . . . . . . . . . . . . . . . . . . . . . .
2
A BRIEF NOTE ON THE COMPOUNDING OF RETURNS
. . . . . . . . . . . . . . . . . . . . . . . . . . . . . . . . . . . . . . . . .
3
ABOUT SHAREHOLDERS’ FUND EXPENSES
. . . . . . . . . . . . . . . . . . . . . . . . . . . . . . . . . . . . . . . . . . . . . . . . . .
4
PERFORMANCE REPORTS AND FUND PROFILES
. . . . . . . . . . . . . . . . . . . . . . . . . . . . . . . . . . . . . . . . . . . . . .
8
SCHEDULES OF INVESTMENTS
. . . . . . . . . . . . . . . . . . . . . . . . . . . . . . . . . . . . . . . . . . . . . . . . . . . . . . . . . . . .
30
STATEMENTS OF ASSETS AND LIABILITIES
. . . . . . . . . . . . . . . . . . . . . . . . . . . . . . . . . . . . . . . . . . . . . . . . . . .
66
STATEMENTS OF OPERATIONS
. . . . . . . . . . . . . . . . . . . . . . . . . . . . . . . . . . . . . . . . . . . . . . . . . . . . . . . . . . . .
68
STATEMENTS OF CHANGES IN NET ASSETS
. . . . . . . . . . . . . . . . . . . . . . . . . . . . . . . . . . . . . . . . . . . . . . . . .
70
FINANCIAL HIGHLIGHTS
. . . . . . . . . . . . . . . . . . . . . . . . . . . . . . . . . . . . . . . . . . . . . . . . . . . . . . . . . . . . . . . . .
74
NOTES TO FINANCIAL STATEMENTS
. . . . . . . . . . . . . . . . . . . . . . . . . . . . . . . . . . . . . . . . . . . . . . . . . . . . . . .
78
REPORT OF INDEPENDENT REGISTERED PUBLIC ACCOUNTING FIRM
. . . . . . . . . . . . . . . . . . . . . . . . . . . .
92
OTHER INFORMATION
. . . . . . . . . . . . . . . . . . . . . . . . . . . . . . . . . . . . . . . . . . . . . . . . . . . . . . . . . . . . . . . . . . .
93
INFORMATION ON BOARD OF TRUSTEES AND OFFICERS
. . . . . . . . . . . . . . . . . . . . . . . . . . . . . . . . . . . . . .
95
THE RYDEX SERIES FUNDS ANNUAL REPORT
|
1
LETTER TO OUR SHAREHOLDERS
DEAR SHAREHOLDER:
The year ended March 31, 2008 was a momentous one in many respects. The U.S. financial system teetered on
the brink of collapse as the ongoing crisis in the nation’s credit markets seemed to threaten the solvency of many
major Wall Street institutions. Indeed, financial market turmoil, the magnitude of which had not been seen in
decades, lead to the dramatic collapse of Bear Stearns, a powerhouse investment bank that traced its origins
back to the 1920’s and had successfully weathered the Great Depression. At the tail end of the period, stocks
soared in a classic relief rally once it was clear that other major financial institutions did not face solvency issues
that threatened their very existence and the overall health of the U.S. financial system.
During this tumultuous period, the Dow Jones Industrial AverageSM actually managed to eke out a 1.59% gain
despite losing more than 1,000 points in the first three months of 2008, the largest quarterly point decline in
the Index’s long history. The S&P 500® Index found the going a bit tougher, falling 5.08%. With the avoidance
of risk the dominant theme over the past year, more aggressive exposures such as small-cap and mid-cap
stocks suffered. The S&P 400® MidCap Index fell 6.97%, while the Russell 2000® Index of small-cap stocks lost
13.00% of its value. Financial stocks were at the epicenter of the crisis that began to unfold during the summer
(the S&P 500 Financials Index fell an astounding 27.78% during the period). The S&P SmallCap 600/Citigroup
Pure Value Index was the worst performing sector in the traditional style-box series, falling 22.23%.
International stocks were the clear winners for the year ended March 31, 2008. Developed market stocks
performed in-line with their U.S. counterparts (the benchmark MSCI EAFE Index declined 2.10%), aided by local
currency appreciation as the U.S. dollar fell over 13.42%. Emerging market stocks, however, continued their multi-
year run as the MSCI EM Index soared over 21.00% on the back of huge rallies in the BRIC markets.
Not surprisingly, investors ran to the safety of U.S. Treasury securities, pulling long-term interest rates down to
five-year lows. Short-term interest rates plummeted, with the yield on the 2-year Treasury note falling in excess
of three percentage points to 1.59%. Longer-term interest rates were a little stickier as the yield on the 10-year
Note fell a more modest 1.2 points to 3.42%. As a result, the yield curve resumed its traditional positive slope
after having been flat for an extended period.
The impetus for the dramatic shift in the term structure of interest rates was a series of emergency rate cuts by
the Federal Reserve (the “Fed”). In six sweeping moves, the Fed slashed the widely watched Fed Funds target
rate from 5.25% to 2.25%. In this crisis environment, the Fed, in conjunction with other central banks,
continuously pumped hundreds of billions of dollars of liquidity into the global financial system. With all the
ingredients for a recession firmly in place – depressed consumer sentiment, shrinking payrolls, declining retail
sales, curtailed capital spending plans and falling wealth levels - government at all levels went into crisis
prevention mode. Despite all the bad news, it is unlikely that the U.S. economy actually shrank during this
period. The cheap U.S. dollar fueled a boom in exports which kept economic growth in the black. Low short-
term interest rates and a cheap dollar also fueled a boom in commodities markets, as the prices of oil, industrial
metals and agricultural products skyrocketed. Oil, in particular, rose 54%, breaching the psychologically
significant $100 per barrel mark by the end of the period.
Although write downs will continue to dribble out of the banking system, the worst of the financial crisis seems
to be behind us at this point. Recent earnings reports from the likes of Lehman Brothers, Goldman Sachs, and
Morgan Stanley indicate that the U.S. financial system is sufficiently capitalized to weather the credit crisis
unless estimates of mortgage debt write offs are substantially off the mark. This leaves us cautiously optimistic
about the direction of stock prices as we move into the new year. There is little doubt that the economy will
continue to flirt with recession and interest rates are poised to rise. Yet there has been an important and
discernable shift in market sentiment indicating, to us at least, that more bad news from the housing front will
be taken in stride.
We appreciate the trust you have placed in our firm’s quality and integrity by investing with us.
Sincerely,
David Reilly, CFA
Director of Portfolio Strategy
2
|
THE RYDEX SERIES FUNDS ANNUAL REPORT
A BRIEF NOTE ON THE COMPOUNDING OF RETURNS (Unaudited)
Many of the Rydex Funds described in this report are benchmarked daily to leveraged or inverse
leveraged versions of published indices. To properly evaluate the performance of these funds, it is
essential to understand the effect of mathematical compounding on their respective returns.
Because of the nonlinear effects of leverage applied over time, it is possible for a fund to perform in line
with its benchmark for several individual periods in a row, yet seem to trail the benchmark over the entire
period. It is also possible that a fund that performs in-line with its benchmark on a daily basis may seem to
outperform its benchmark over longer periods.
An Example of Compounding
For example, consider a hypothetical fund that is designed to produce returns that correspond to 150%
of an index. On the first day of a period, the index rises from a level of 100 to a level of 106, producing a
6.0% gain and an expectation that the fund will rise by 9.0%. On the same day, the fund’s net asset value
(“NAV”) increases from $10.00 to $10.90 for a gain of 9.0%–in line with its benchmark.
On day two, assume the index falls from 106 to 99 for a loss of about 6.6%. The fund, as expected, falls
9.9% to a price of $9.82. On each day, the fund performed exactly in line with its benchmark, but for the
two-day period, the fund was down 1.8%, while the index was down only 1.0%. Without taking into
account the daily compounding of returns, one would expect the fund to lose 1.5% and would see the
fund as trailing by 0.3% when in fact it had performed perfectly. This example is summarized in the table
below.
Index
Index
Fund
Fund
Level
Performance
Expectation
Fund NAV
Performance
Assessment
Start
100
$10.00
Day 1
106
6.0%
9.0%
$10.90
9.0%
In line
Day 2
99
-6.6%
-9.9%
$ 9.82
-9.9%
In line
Cumulative
-1.0%
-1.5%
-1.8%
-0.3%
As illustrated by this simple example, the effect of leverage can make it difficult to form expectations or
judgments about fund performance given only the returns of the unleveraged index.
In general, any change in direction in an index will produce compounding that seems to work against an
investor. Were the index to move in the same direction (either up or down) for two or more periods in a
row, the compounding of those returns would work in an investor’s favor, causing the fund to seemingly
beat its benchmark.
As a general rule of thumb, more leverage in a fund will magnify the compounding effect, while less
leverage will generally produce results that are more in line with expectations. In addition, periods of high
volatility in an underlying index will also cause the effects of compounding to be more pronounced, while
lower volatility will produce a more muted effect.
THE RYDEX SERIES FUNDS ANNUAL REPORT
|
3
ABOUT SHAREHOLDERS’ FUND EXPENSES (Unaudited)
All mutual funds have operating expenses and it is important for our shareholders to understand the
impact of costs on their investments. Shareholders of a Fund incur two types of costs: (i) transaction costs,
including sales charges (loads) on purchase payments, reinvested dividends, or other distributions;
redemption fees; and exchange fees; and (ii) ongoing costs, including management fees, administrative
services, and shareholder reports, among others. These ongoing costs, or operating expenses, are
deducted from a fund’s gross income and reduce the investment return of the fund.
A fund’s expenses are expressed as a percentage of its average net assets, which is known as the expense
ratio. The following examples are intended to help investors understand the ongoing costs (in dollars) of
investing in a Fund and to compare these costs with the ongoing costs of investing in other mutual funds.
The examples are based on an investment of $1,000 made at the beginning of the period and held for the
entire six-month period beginning September 30, 2007 and ending March 31, 2008.
The following tables illustrate a Fund’s costs in two ways:
Table 1. Based on actual Fund return. This section helps investors estimate the actual expenses paid over
the period. The “Ending Account Value” shown is derived from the Fund’s actual return, and the fourth
column shows the dollar amount that would have been paid by an investor who started with $1,000 in
the Fund. Investors may use the information here, together with the amount invested, to estimate the
expenses paid over the period. Simply divide the Fund’s account value by $1,000 (for example, an
$8,600 account value divided by $1,000 = 8.6), then multiply the result by the number provided under
the heading “Expenses Paid During Period.”
Table 2. Based on hypothetical 5% return. This section is intended to help investors compare a Fund’s
cost with those of other mutual funds. The table provides information about hypothetical account val-
ues and hypothetical expenses based on the Fund’s actual expense ratio and an assumed rate of return
of 5% per year before expenses, which is not the Fund’s actual return. The hypothetical account values
and expenses may not be used to estimate the actual ending account balance or expenses paid during
the period. The example is useful in making comparisons because the U.S. Securities and Exchange
Commission (the “SEC”) requires all mutual funds to calculate expenses based on the 5% return.
Investors can assess a Fund’s costs by comparing this hypothetical example with the hypothetical exam-
ples that appear in shareholder reports of other funds.
Certain retirement plans such as IRA, SEP, Roth IRA and 403(b) accounts are charged an annual $15
maintenance fee. Upon liquidating a retirement account, a $15 account-closing fee will be taken from the
proceeds of the redemption.
The calculations illustrated above assume no shares were bought or sold during the period. Actual costs
may have been higher or lower, depending on the amount of investment and the timing of any purchases
or redemptions.
Note that the expenses shown in the table are meant to highlight and help compare ongoing costs only
and do not reflect any transactional costs which may be incurred by a Fund.
More information about a Fund’s expenses, including annual expense ratios for the past five years, can be
found in the Financial Highlights section of this report. For additional information on operating expenses
and other shareholder costs, please refer to the appropriate Fund prospectus.
4
|
THE RYDEX SERIES FUNDS ANNUAL REPORT
ABOUT SHAREHOLDERS’ FUND EXPENSES (Unaudited) (continued)
Beginning
Ending
Expenses
Expense
Account Value
Account Value
Paid During
Ratio†
September 30, 2007
March 31, 2008
Period*
Table 1. Based on actual Fund return
Multi-Cap Core Equity Fund
A-Class
1.13%
$1,000.00
$
842.65
$
5.21
C-Class
1.90%
1,000.00
839.69
8.74
H-Class
1.16%
1,000.00
843.15
5.35
Sector Rotation Fund
A-Class
1.65%
1,000.00
864.03
7.69
C-Class
2.40%
1,000.00
861.51
11.17
H-Class
1.65%
1,000.00
864.37
7.69
Absolute Return Strategies Fund
A-Class
2.11%
1,000.00
940.09
10.23
C-Class
2.87%
1,000.00
936.11
13.89
H-Class
2.11%
1,000.00
940.14
10.23
Alternative Strategies Allocation Fund**
A-Class
0.00%
1,000.00
993.60
—
C-Class
0.68%
1,000.00
993.20
3.39
H-Class
0.00%
1,000.00
993.60
—
Commodities Strategy Fund
A-Class
1.19%
1,000.00
1,217.59
6.60
C-Class
1.94%
1,000.00
1,213.36
10.73
H-Class
1.19%
1,000.00
1,217.75
6.60
Hedged Equity Fund
A-Class
2.19%
1,000.00
892.88
10.36
C-Class
2.94%
1,000.00
889.65
13.89
H-Class
2.15%
1,000.00
892.94
10.17
International Rotation Fund
A-Class
1.75%
1,000.00
885.48
8.25
C-Class
2.50%
1,000.00
882.03
11.76
H-Class
1.76%
1,000.00
885.52
8.30
Managed Futures Strategy Fund
A-Class
1.76%
1,000.00
1,122.02
9.34
C-Class
2.52%
1,000.00
1,118.16
13.34
H-Class
1.76%
1,000.00
1,122.02
9.34
Real Estate Fund
A-Class
1.63%
1,000.00
858.60
7.57
C-Class
2.38%
1,000.00
855.30
11.04
H-Class
1.64%
1,000.00
858.52
7.62
Strengthening Dollar 2x Strategy Fund
A-Class
1.66%
1,000.00
863.04
7.73
C-Class
2.41%
1,000.00
859.67
11.20
H-Class
1.66%
1,000.00
862.92
7.73
Weakening Dollar 2x Strategy Fund
A-Class
1.67%
1,000.00
1,167.11
9.05
C-Class
2.42%
1,000.00
1,162.49
13.08
H-Class
1.66%
1,000.00
1,166.78
8.99
THE RYDEX SERIES FUNDS ANNUAL REPORT
|
5
ABOUT SHAREHOLDERS’ FUND EXPENSES (Unaudited) (concluded)
Beginning
Ending
Expenses
Expense
Account Value
Account Value
Paid During
Ratio†
September 30, 2007
March 31, 2008
Period*
Table 2. Based on hypothetical 5% return (before expenses)
Multi-Cap Core Equity Fund
A-Class
1.13%
$1,000.00
$1,019.35
$
5.70
C-Class
1.90%
1,000.00
1,015.50
9.57
H-Class
1.16%
1,000.00
1,019.20
5.86
Sector Rotation Fund
A-Class
1.65%
1,000.00
1,016.75
8.32
C-Class
2.40%
1,000.00
1,013.00
12.08
H-Class
1.65%
1,000.00
1,016.75
8.32
Absolute Return Strategies Fund
A-Class
2.11%
1,000.00
1,014.45
10.63
C-Class
2.87%
1,000.00
1,010.65
14.43
H-Class
2.11%
1,000.00
1,014.45
10.63
Alternative Strategies Allocation Fund**
A-Class
0.00%
1,000.00
1,025.00
—
C-Class
0.68%
1,000.00
1,021.60
3.44
H-Class
0.00%
1,000.00
1,025.00
—
Commodities Strategy Fund
A-Class
1.19%
1,000.00
1,019.05
6.01
C-Class
1.94%
1,000.00
1,015.30
9.77
H-Class
1.19%
1,000.00
1,019.05
6.01
Hedged Equity Fund
A-Class
2.19%
1,000.00
1,014.05
11.03
C-Class
2.94%
1,000.00
1,010.30
14.78
H-Class
2.15%
1,000.00
1,014.25
10.83
International Rotation Fund
A-Class
1.75%
1,000.00
1,016.25
8.82
C-Class
2.50%
1,000.00
1,012.50
12.58
H-Class
1.76%
1,000.00
1,016.20
8.87
Managed Futures Strategy Fund
A-Class
1.76%
1,000.00
1,016.20
8.87
C-Class
2.52%
1,000.00
1,012.40
12.68
H-Class
1.76%
1,000.00
1,016.20
8.87
Real Estate Fund
A-Class
1.63%
1,000.00
1,016.85
8.22
C-Class
2.38%
1,000.00
1,013.10
11.98
H-Class
1.64%
1,000.00
1,016.80
8.27
Strengthening Dollar 2x Strategy Fund
A-Class
1.66%
1,000.00
1,016.70
8.37
C-Class
2.41%
1,000.00
1,012.95
12.13
H-Class
1.66%
1,000.00
1,016.70
8.37
Weakening Dollar 2x Strategy Fund
A-Class
1.67%
1,000.00
1,016.65
8.42
C-Class
2.42%
1,000.00
1,012.90
12.18
H-Class
1.66%
1,000.00
1,016.70
8.37
* Expenses are equal to the Fund's annualized expense ratio, multiplied by the average account value over the period, multiplied by
the number of days in the most recent fiscal half-year, then divided by 366.
** Since the commencement of operations: March 7, 2008. Due to the limited length of Fund operations, current expense ratios may
not be indicative of future expense ratios.
† This ratio represents annualized Total Expenses, which include dividend expense from securities sold short. Excluding short dividend
expense, the operating expense ratio would be 0.56%, 0.63%, and 0.03% lower in each class of the Absolute Return Strategies
Fund, Hedged Equity Fund, and Managed Futures Strategy Fund, respectively.
6
|
THE RYDEX SERIES FUNDS ANNUAL REPORT
This page intentionally left blank.
PERFORMANCE REPORTS AND FUND PROFILES (Unaudited)
MULTI-CAP CORE EQUITY FUND
OBJECTIVE: Seeks long-term capital appreciation.
Inception: September 23, 2002
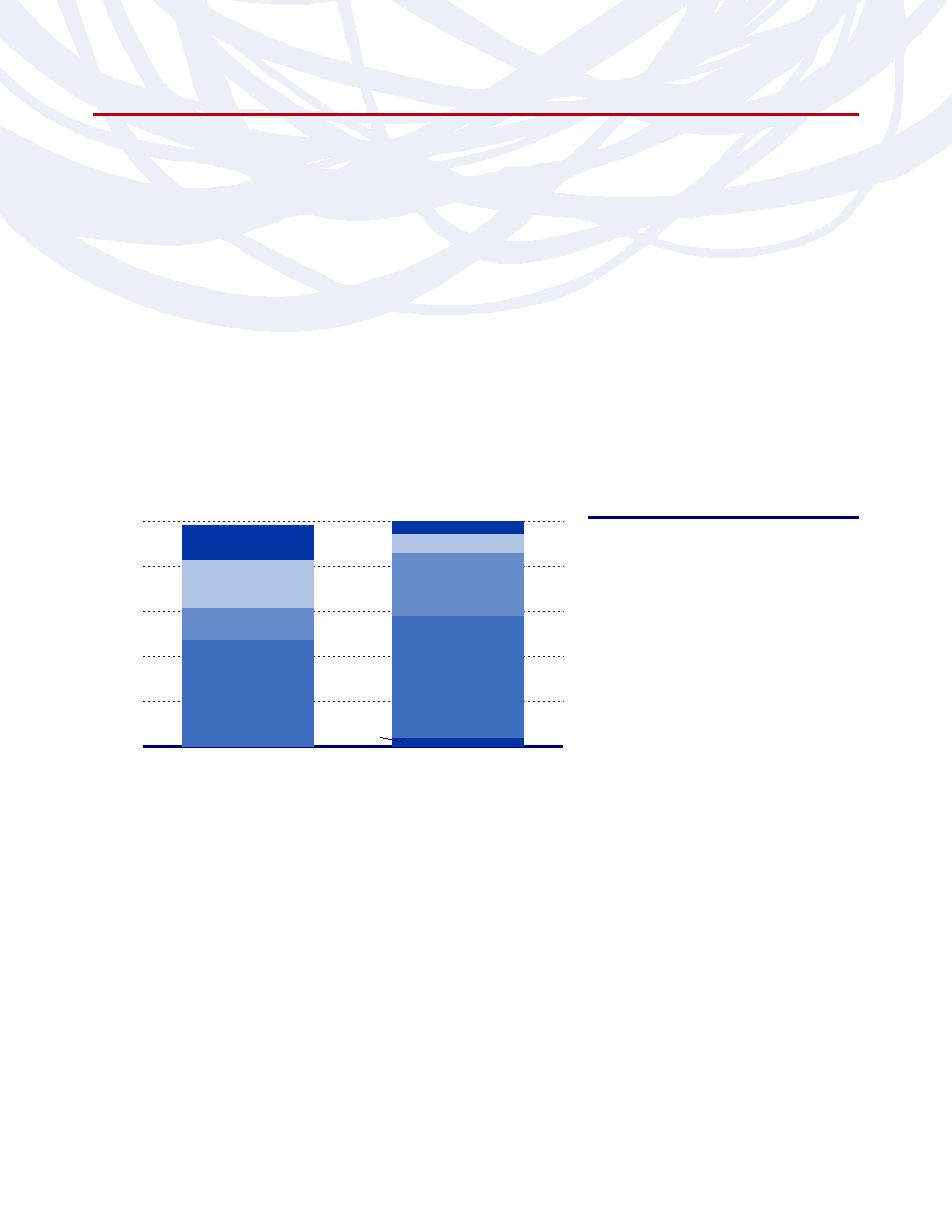
Rydex Multi-Cap Core Equity Fund allocates its assets generally in equal proportions to the large-, mid- and small-
cap size groups. Large-cap stocks outperformed mid- and small-cap names during the one-year period ending March
31, 2008, and so the Fund’s somewhat smaller size bias detracted from performance.
The Fund uses a quantitative stock ranking model as part of the investment process. While growth factors came back
in vogue and exposure to momentum benefited performance, weakness in value more than offset the positive. The
stock selection model was particularly weak in the financial services and consumer discretionary sectors.
Rydex Multi-Cap Core Equity Fund H-Class returned -15.73% during the period.
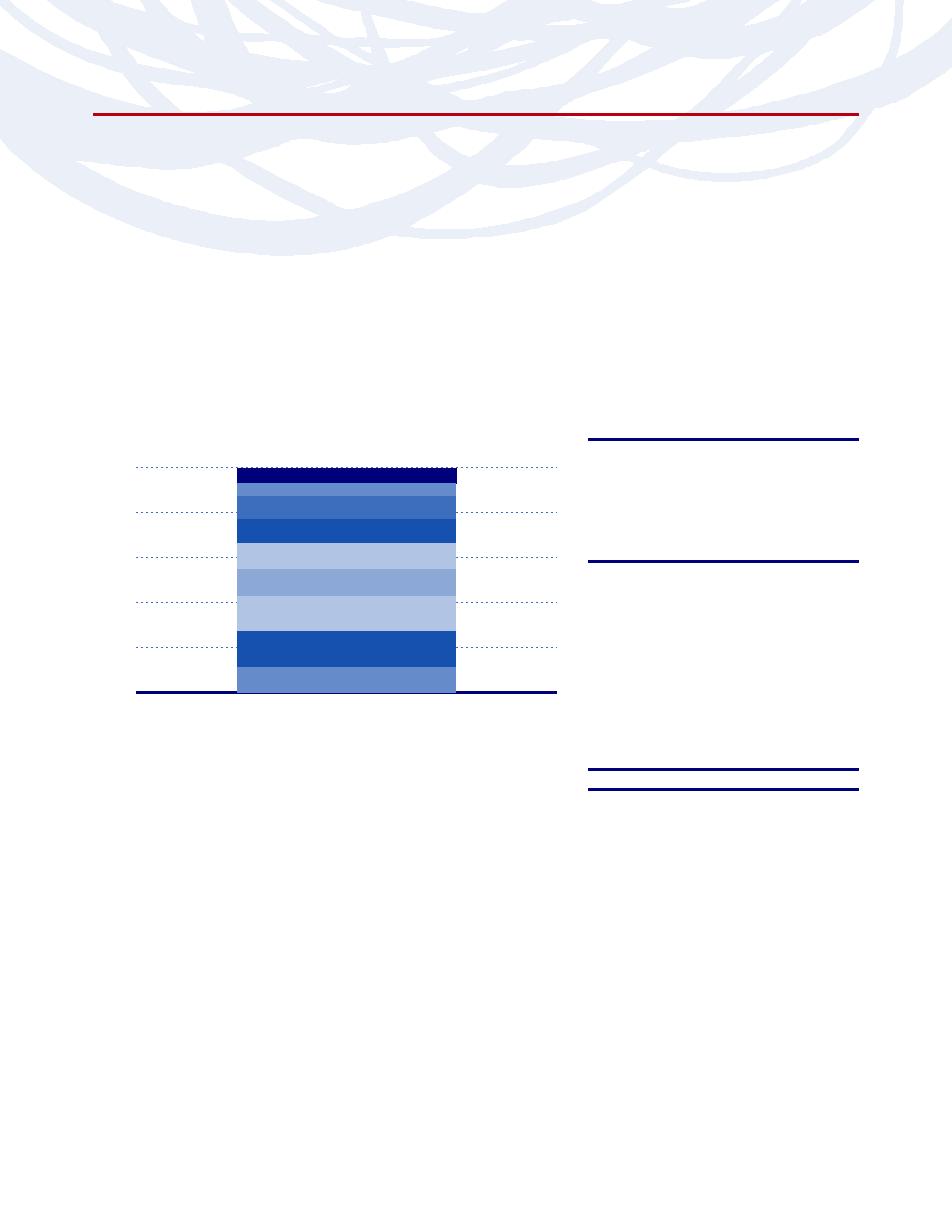
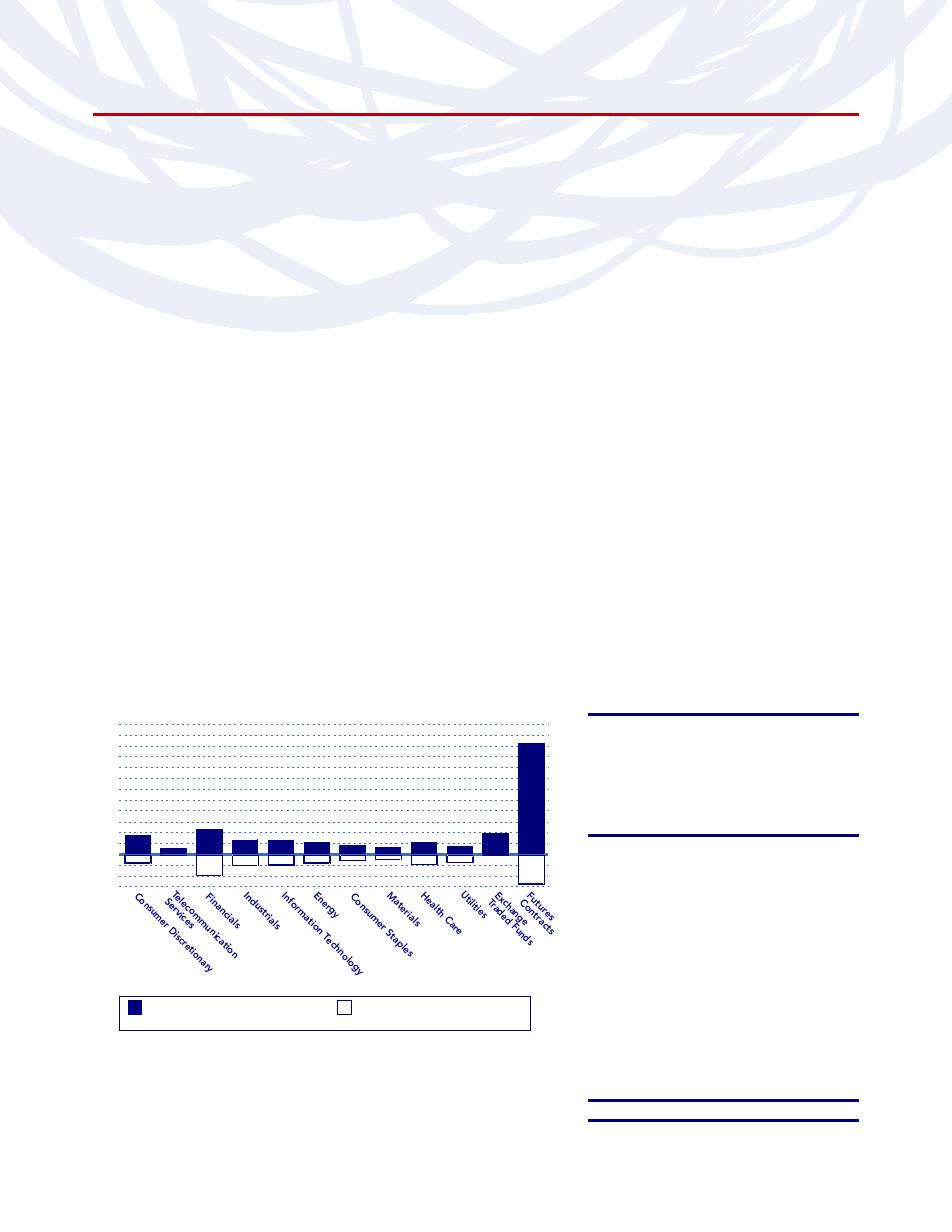
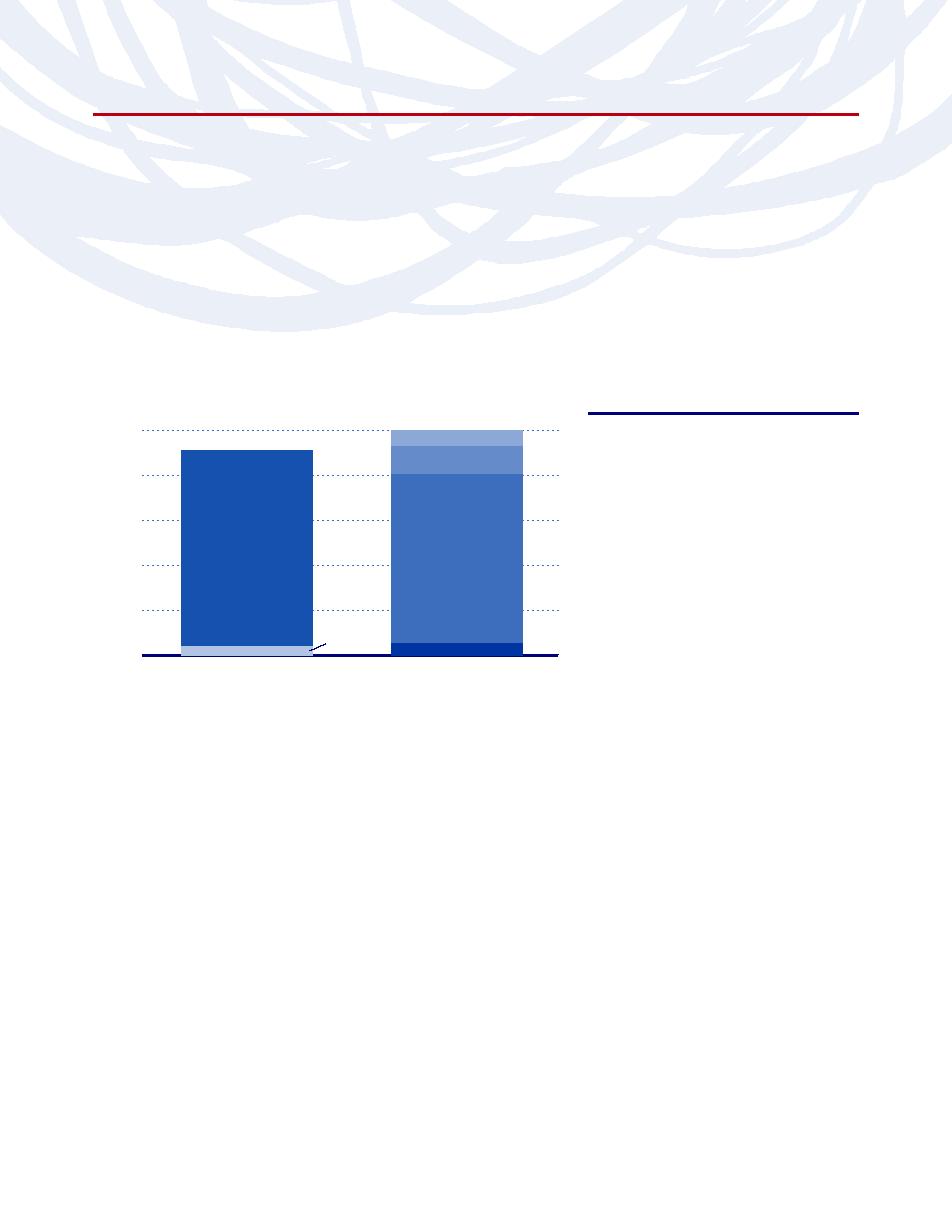
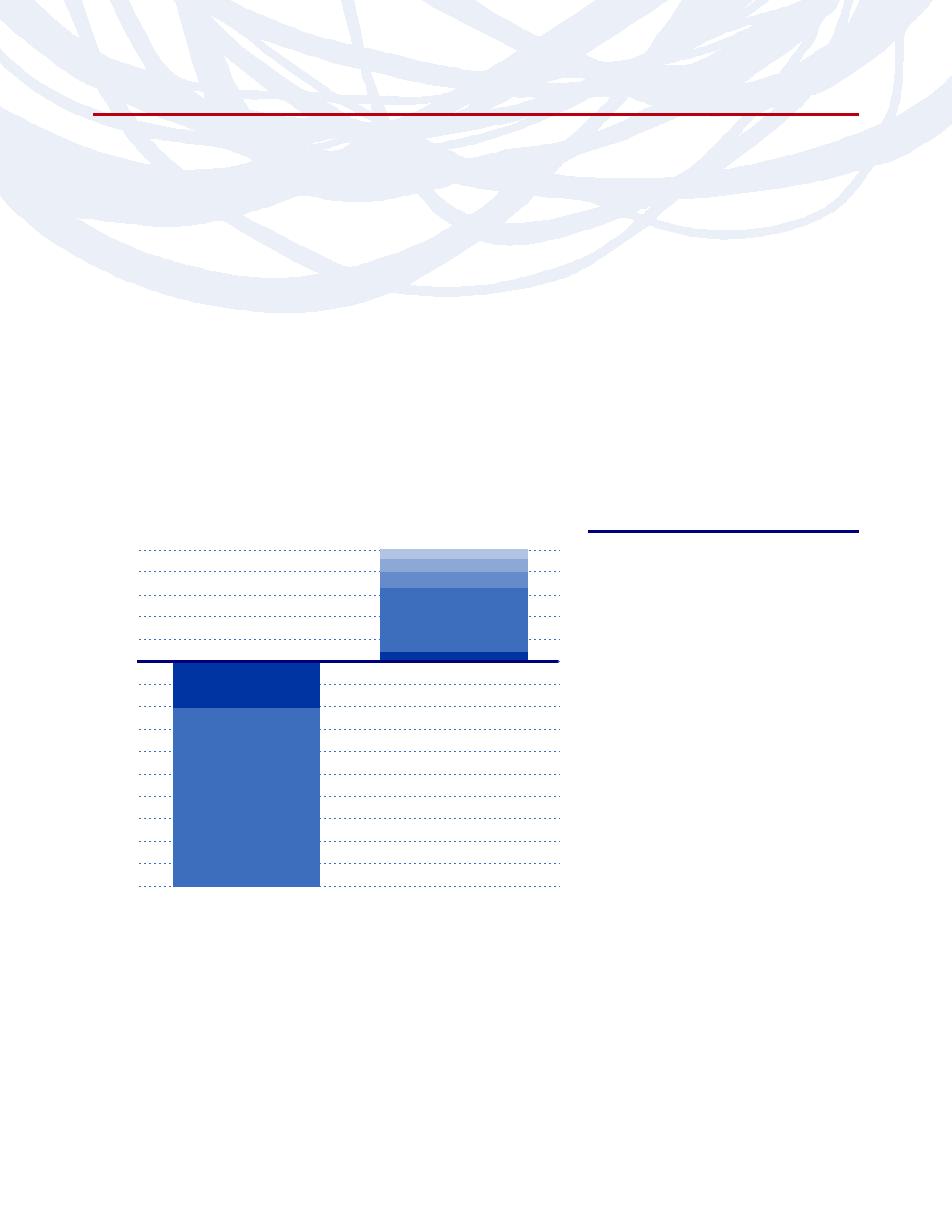
Holdings Diversification (Market Exposure as % of Net Assets)
Inception Dates:
A-Class
March 31, 2004
100%
Equity Index Futures Contracts
C-Class
September 23, 2002
Consumer Staples
H-Class
September 23, 2002
80%
Consumer Discretionary
Energy
Ten Largest Holdings
(% of Total Net Assets)
60%
Health Care
Industrials
Exxon Mobil Corp.
1.9%
AT&T, Inc.
1.1%
40%
Information
Technology
Microsoft Corp.
1.1%
General Electric Co.
1.0%
20%
Financials
Johnson & Johnson, Inc.
0.9%
Other
Chevron Corp.
0.8%
0%
Bank of America Corp.
0.7%
Multi-Cap Core Equity Fund
Hewlett-Packard Co.
0.7%
Procter & Gamble Co.
0.6%
“Holdings Diversification (Market Exposure as % of Net Assets)”
excludes any temporary cash investments.
Intel Corp.
0.6%
Top Ten Total
9.4%
“Ten Largest Holdings” exclude any
temporary cash or derivative investments.
8
|
THE RYDEX SERIES FUNDS ANNUAL REPORT
PERFORMANCE REPORTS AND FUND PROFILES (Unaudited) (continued)
MULTI-CAP CORE EQUITY FUND
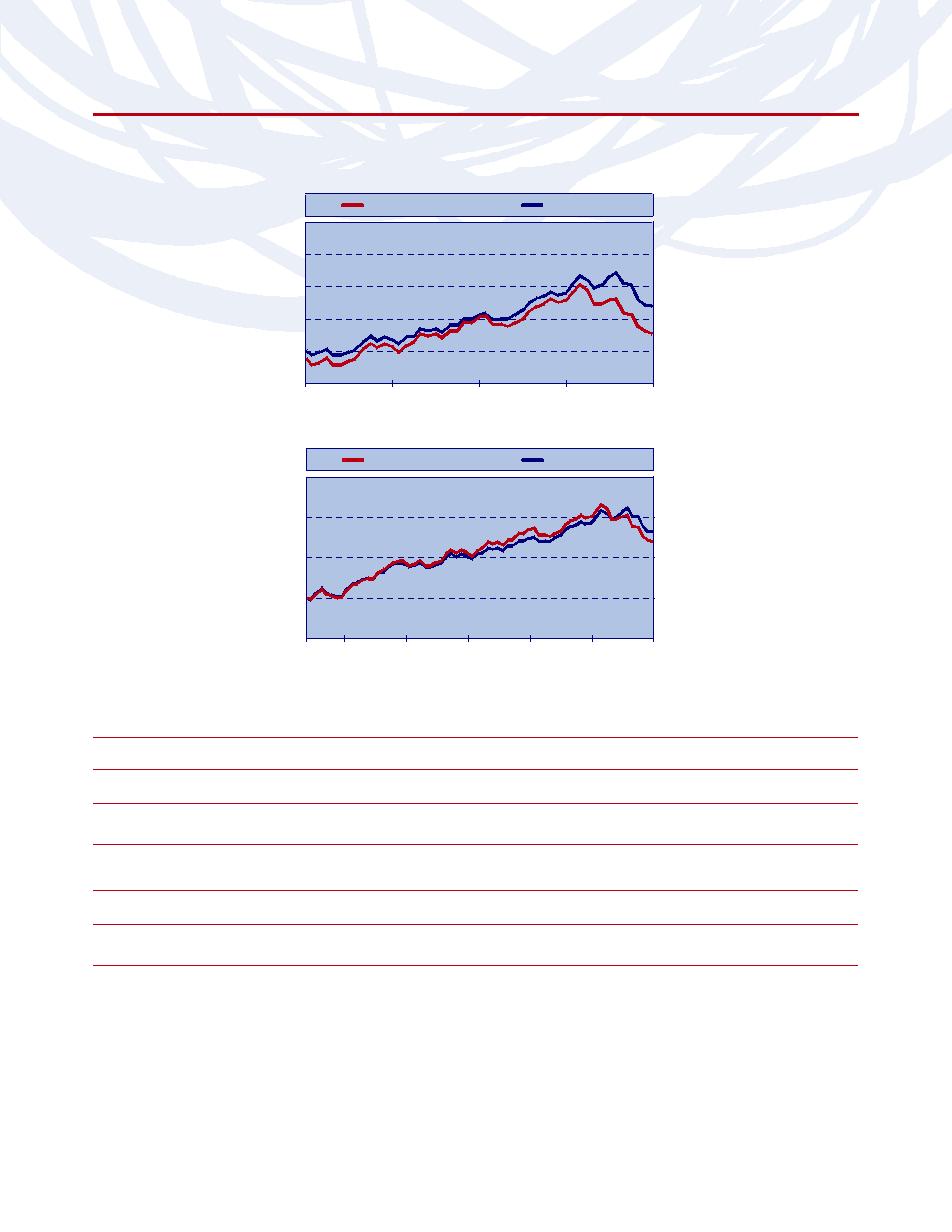
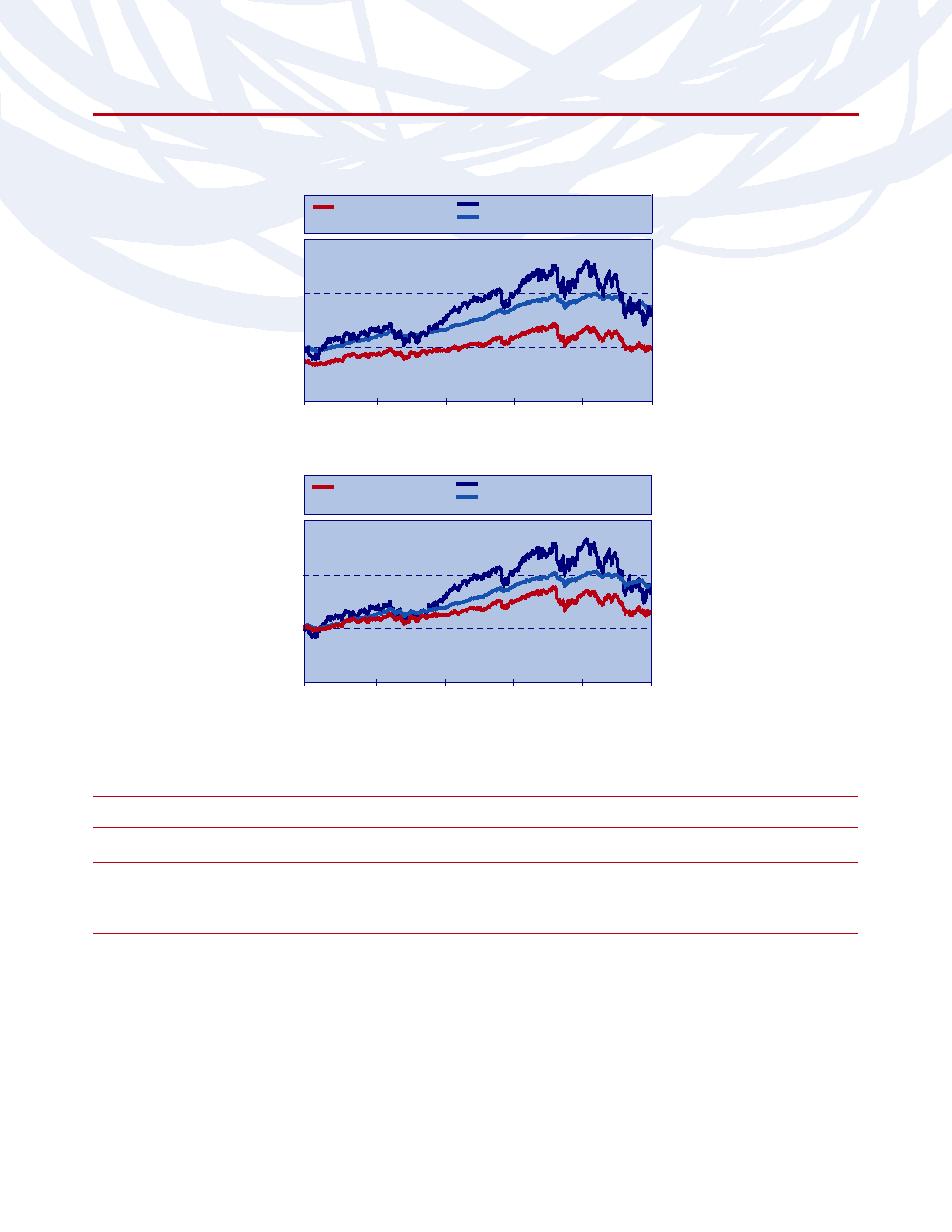
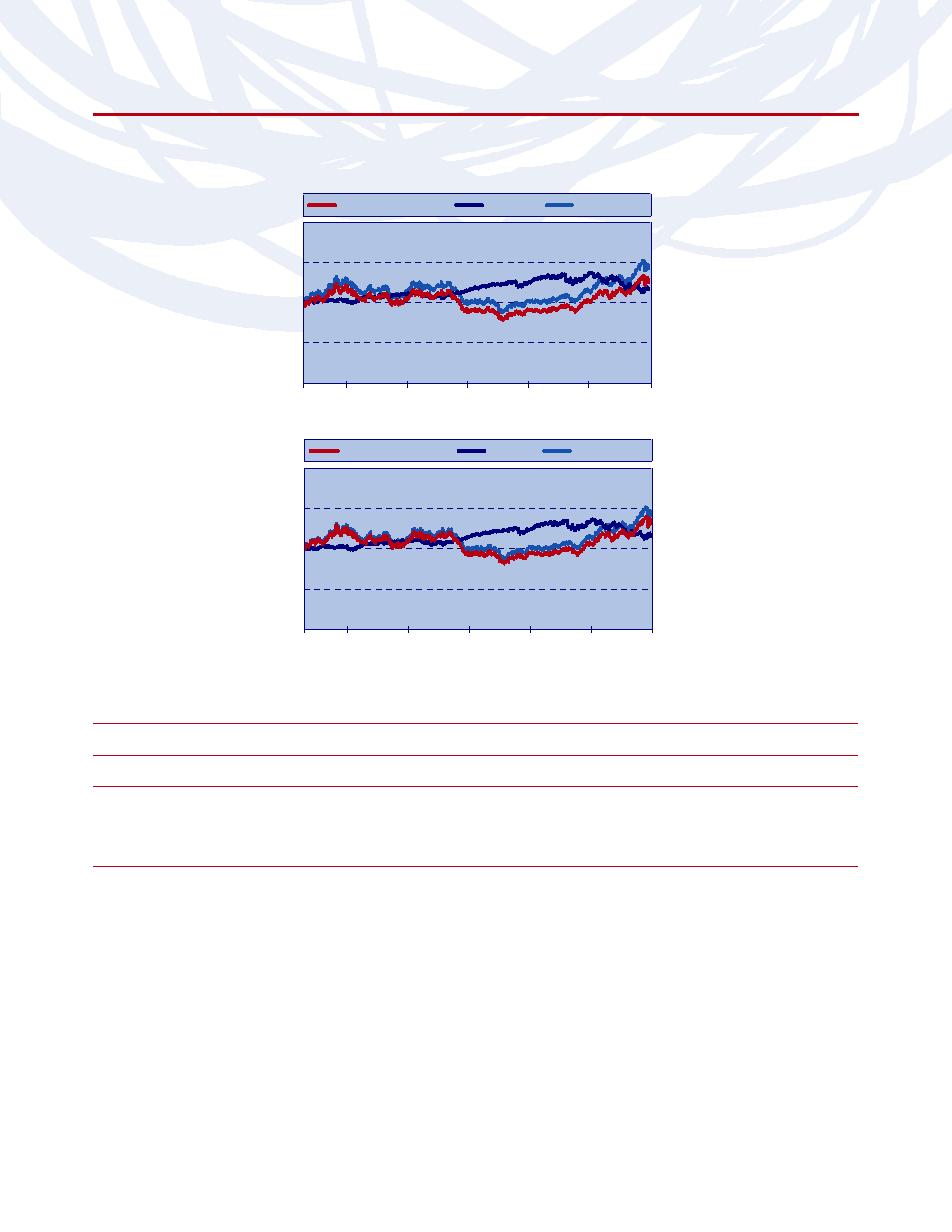
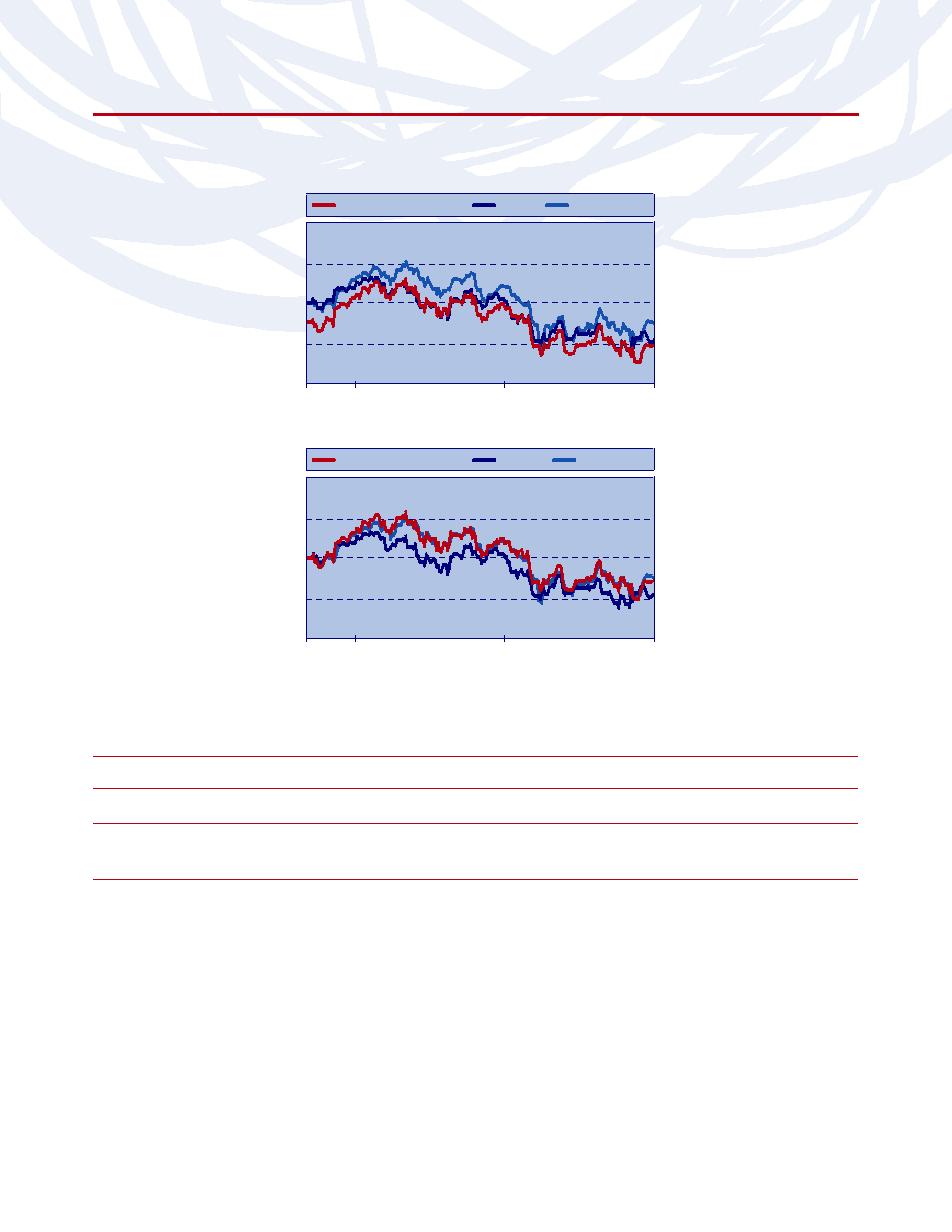
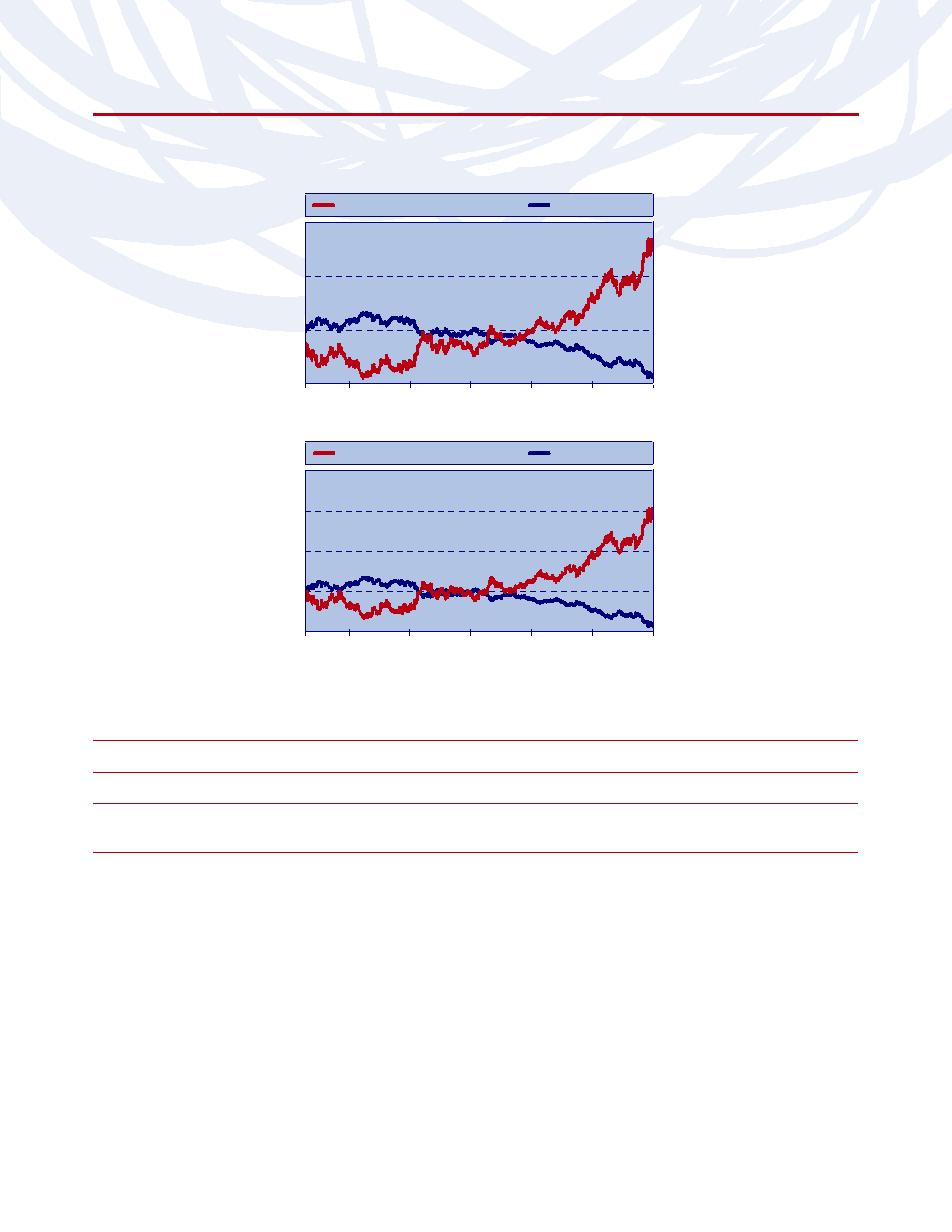
Cumulative Fund Performance
MULTI-CAP CORE EQUITY
RUSSELLL
FUND A-CLASS†
3000® INDEX
$18,000
$16,000
$14,000
$12,792
$12,000
$11,106
$10,000
$8,000
03/31/04
03/31/05
03/31/06
03/31/07
03/31/08
MULTI-CAP CORE EQUITY
RUSSELLL
FUND H-CLASS
3000 INDEX
$25,000
$20,000
$18,180
$16,972
$15,000
$10,000
$5,000
09/23/02
03/31/03
03/31/04
03/31/05
03/31/06
03/31/07
03/31/08
† Initial investment has been adjusted for the maximum sales charge of 4.75%.
AVERAGE ANNUAL TOTAL RETURNS FOR THE PERIOD ENDED 03/31/08
A-Class
C-Class
(03/31/04)
(09/23/02)
ONE
ONE
SINCE
SINCE
ONE
ONE
FIVE
SINCE
YEAR
YEAR*
INCEPTION
INCEPTION*
YEAR
YEAR**
YEAR
INCEPTION
MULTI-CAP CORE EQUITY FUND
-15.78%
-19.78%
3.91%
2.66%
-16.39%
-17.07%
9.99%
9.23%
RUSSELL 3000 INDEX
-6.06%
-6.06%
6.35%
6.35%
-6.06%
-6.06%
12.07%
11.44%
H-Class
(09/23/02)
ONE
FIVE
SINCE
YEAR
YEAR
INCEPTION
MULTI-CAP CORE EQUITY FUND
-15.73%
10.83%
10.06%
RUSSELL 3000 INDEX
-6.06%
12.07%
11.44%
* Fund returns are calculated using the maximum sales charge of 4.75%.
** Fund returns include a contingent deferred sales charge (“CDSC”) of 1% if redeemed within 12 months of purchase.
The returns presented above do not reflect the effects of taxes. Past performance is no guarantee of future results. The Russell 3000
Index is an unmanaged stock index and, unlike the Fund, has no management fees or other operating expenses to reduce its
reported returns. Returns are historical and include changes in principal and reinvested dividends and capital gains. The graphs are
based on A-Class and H-class shares only; performance for C-Class shares will vary due to differences in fee structure.
THE RYDEX SERIES FUNDS ANNUAL REPORT
|
9
PERFORMANCE REPORTS AND FUND PROFILES (Unaudited) (continued)
SECTOR ROTATION FUND
OBJECTIVE: Seeks long-term capital appreciation.
Inception: March 22, 2002
Rydex Sector Rotation Fund H-Class had a relatively good year, returning 1.50% for the year ended March 31, 2008,
a period in which the S&P 500 finished -5.08%. The Fund’s performance was driven primarily by heavy exposures
to the materials, telecom and industrials sectors, all of which rose at least in part due to growth in emerging
markets, particularly in China. A large percentage of the Fund’s relative outperformance versus its benchmark came
from what the Fund didn’t own. Since April 2007, the Fund has completely avoided the financials sector. This paid
off as financials struggled throughout the year, with the U.S. housing market decline due in part to sub-prime loan
defaults. At the more granular industry level, overweights in metals & mining, chemicals, road & rail, marine and
wireless telecommunication services all provided strong performance during the year. Positions in the machinery,
electric utilities and internet & catalog retail all had smaller negative impacts on the Fund’s performance. Of note,
Rydex Sector Rotation Fund received a Lipper Award for the period ended December 31, 2007 for being the top
performer in the Multi-Cap Core Funds category.
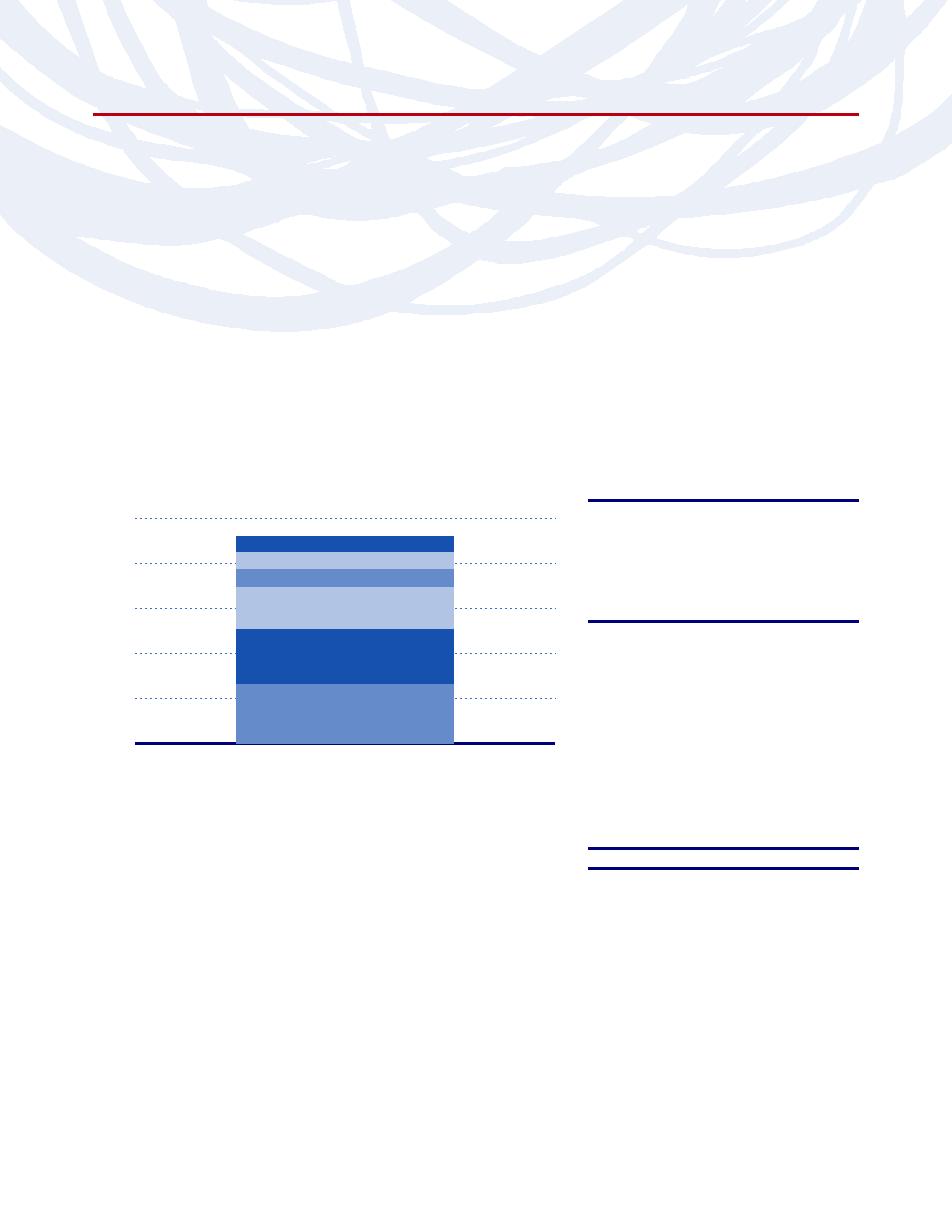
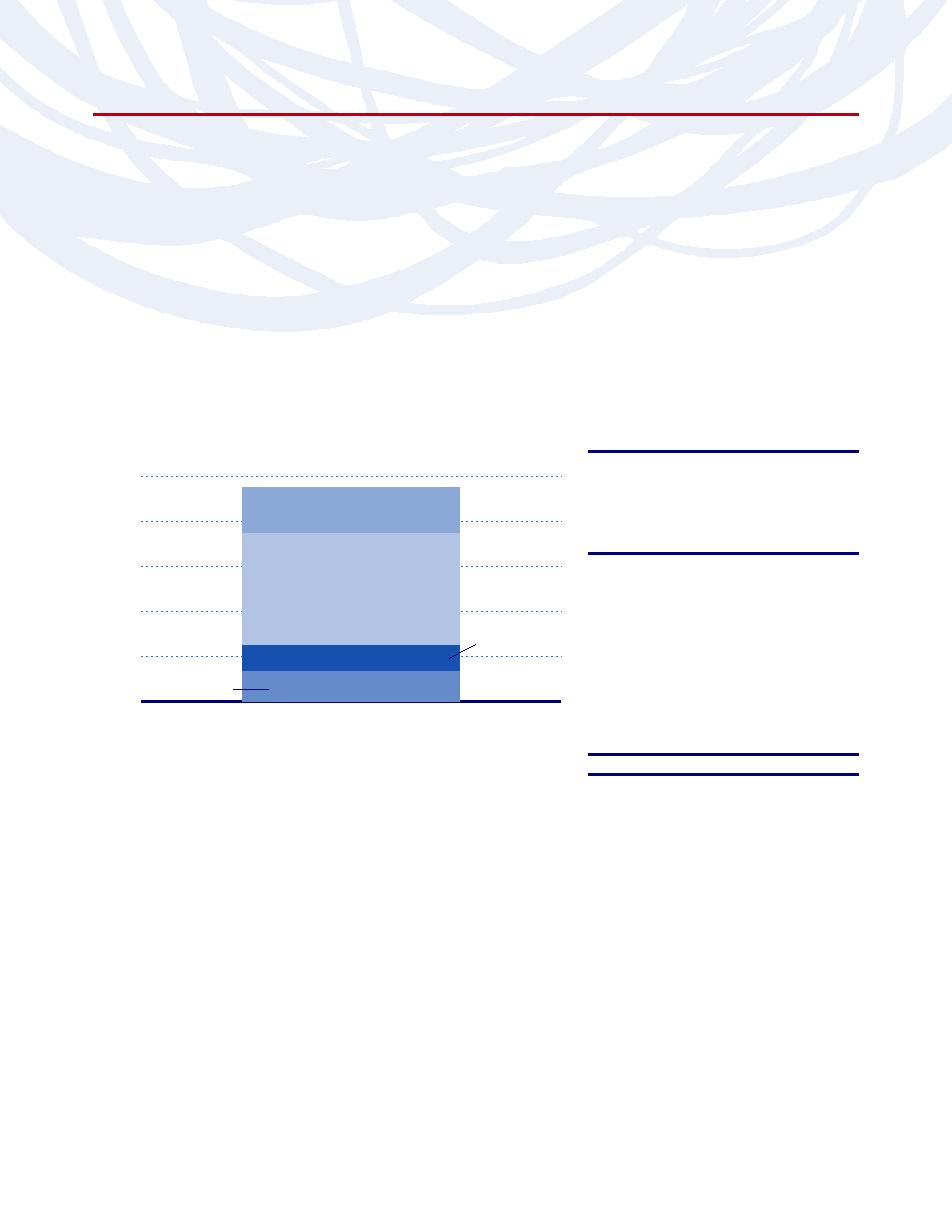
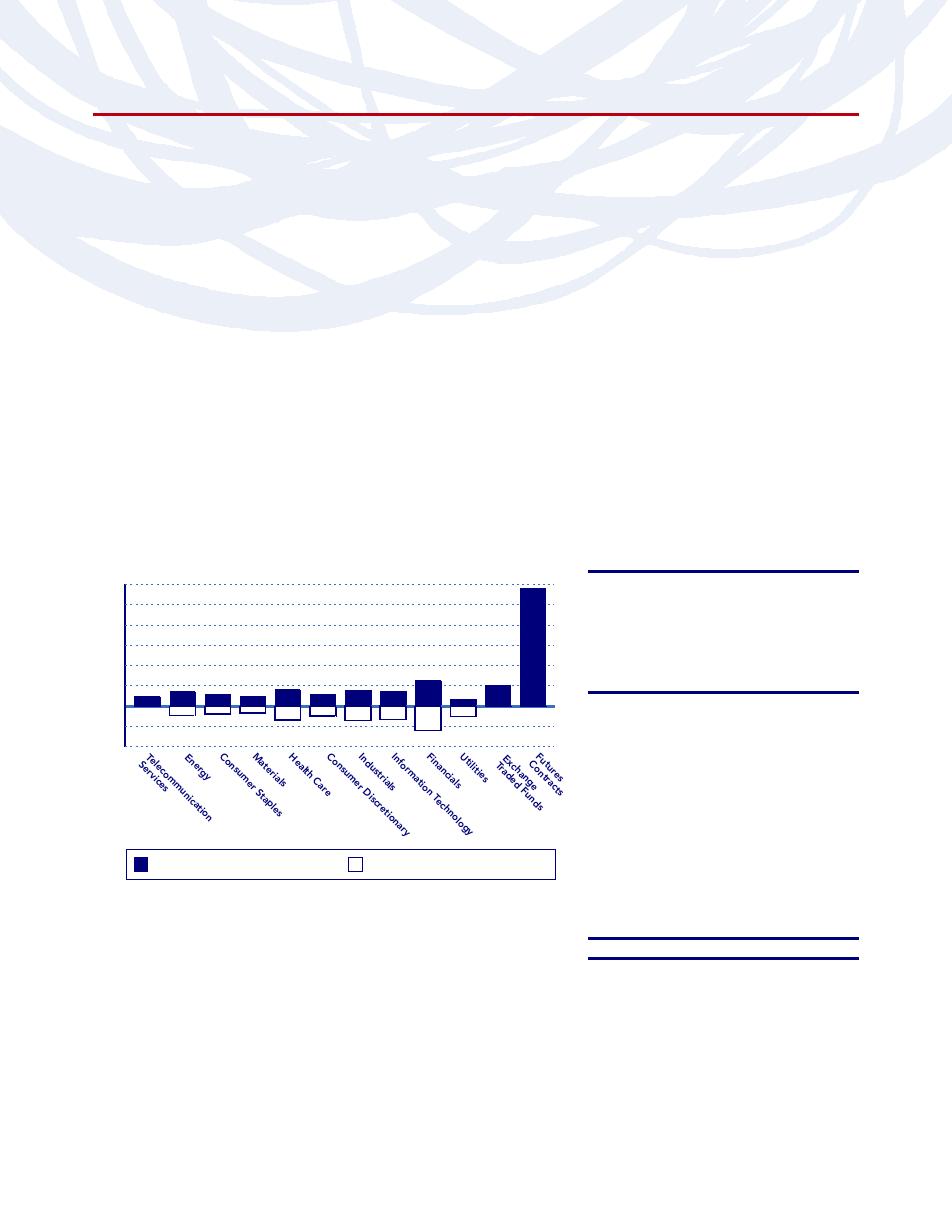
Holdings Diversification (Market Exposure as % of Net Assets)
Inception Dates:
100%
A-Class
March 31, 2004
C-Class
March 22, 2002
Consumer Staples
H-Class
80%
Health Care
March 22, 2002
Telecommunication Services
Ten Largest Holdings
60%
Energy
(% of Total Net Assets)
China Mobile Ltd. — SP ADR
2.1%
40%
Materials
ABB Ltd. — SP ADR
2.0%
Wal-Mart Stores, Inc.
1.8%
20%
The Mosaic Co.
1.7%
Industrials
Companhia Vale do Rio
Doce — SP ADR
1.7%
0%
Sector Rotation Fund
Rio Tinto PLC — SP ADR
1.7%
Monsanto Co.
1.6%
“Holdings Diversification (Market Exposure as % of Net Assets)”
Emerson Electric Co.
1.6%
excludes any temporary cash investments.
BHP Billiton Ltd. — SP ADR
1.5%
Fluor Corp.
1.5%
Top Ten Total
17.2%
“Ten Largest Holdings” exclude any
temporary cash or derivative investments.
10
|
THE RYDEX SERIES FUNDS ANNUAL REPORT
PERFORMANCE REPORTS AND FUND PROFILES (Unaudited) (continued)
SECTOR ROTATION FUND
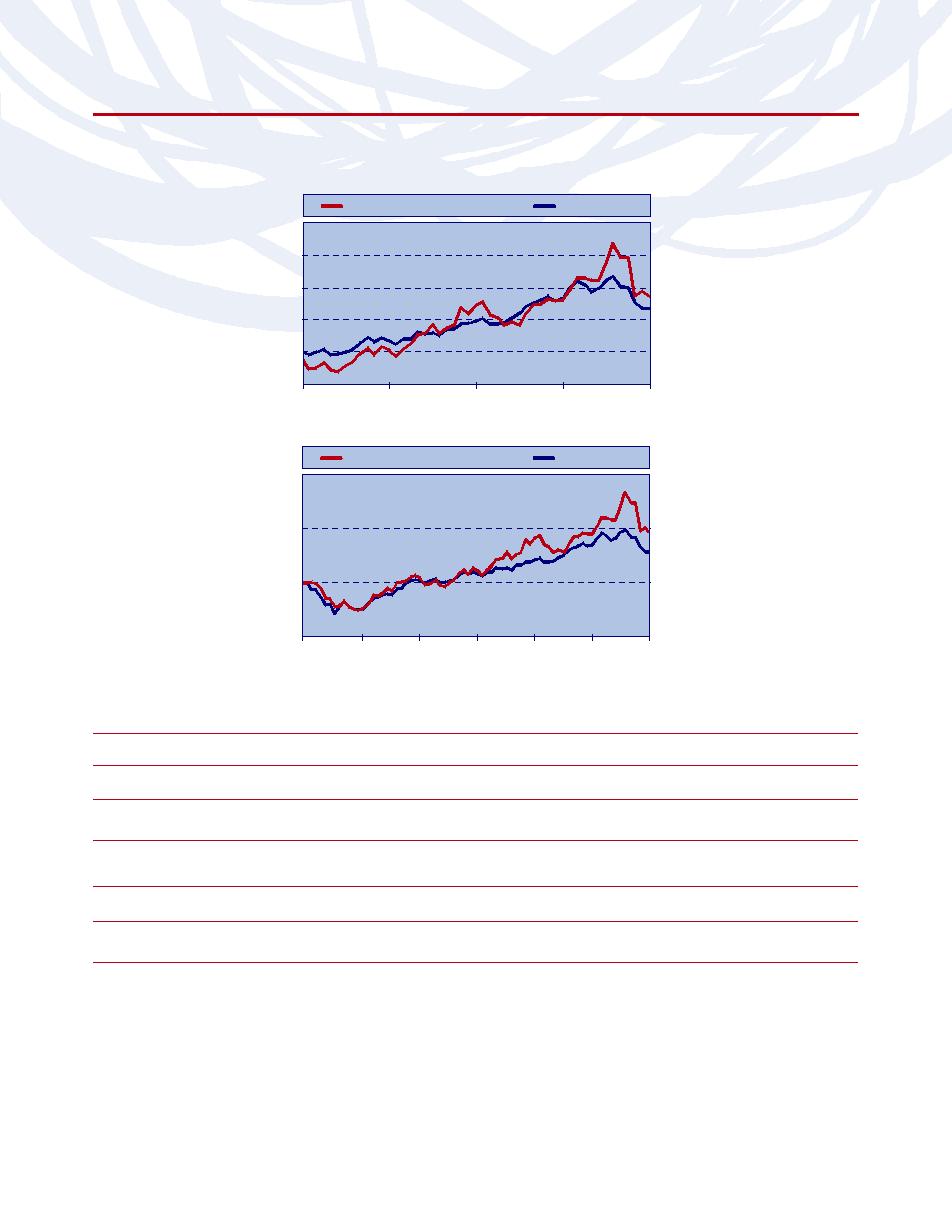
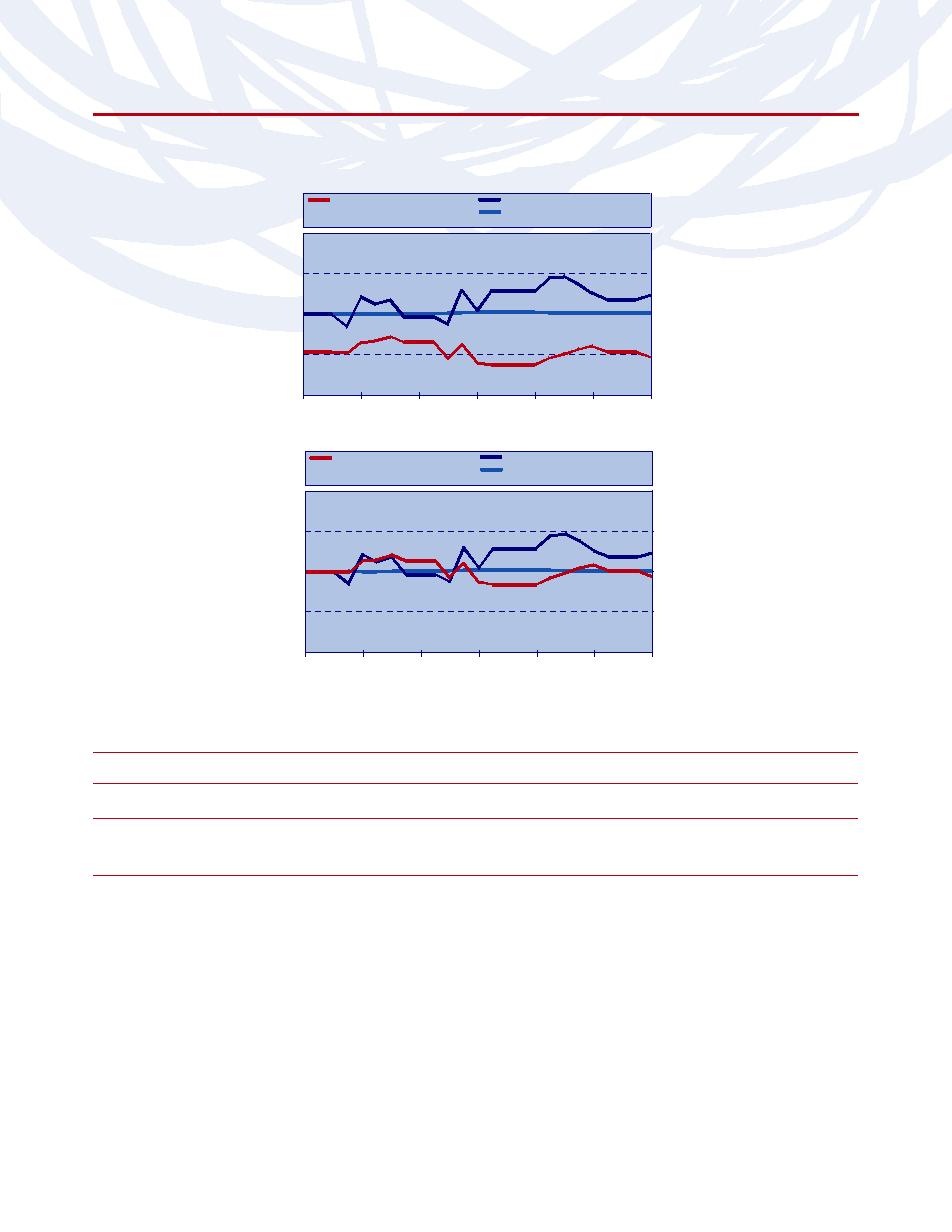
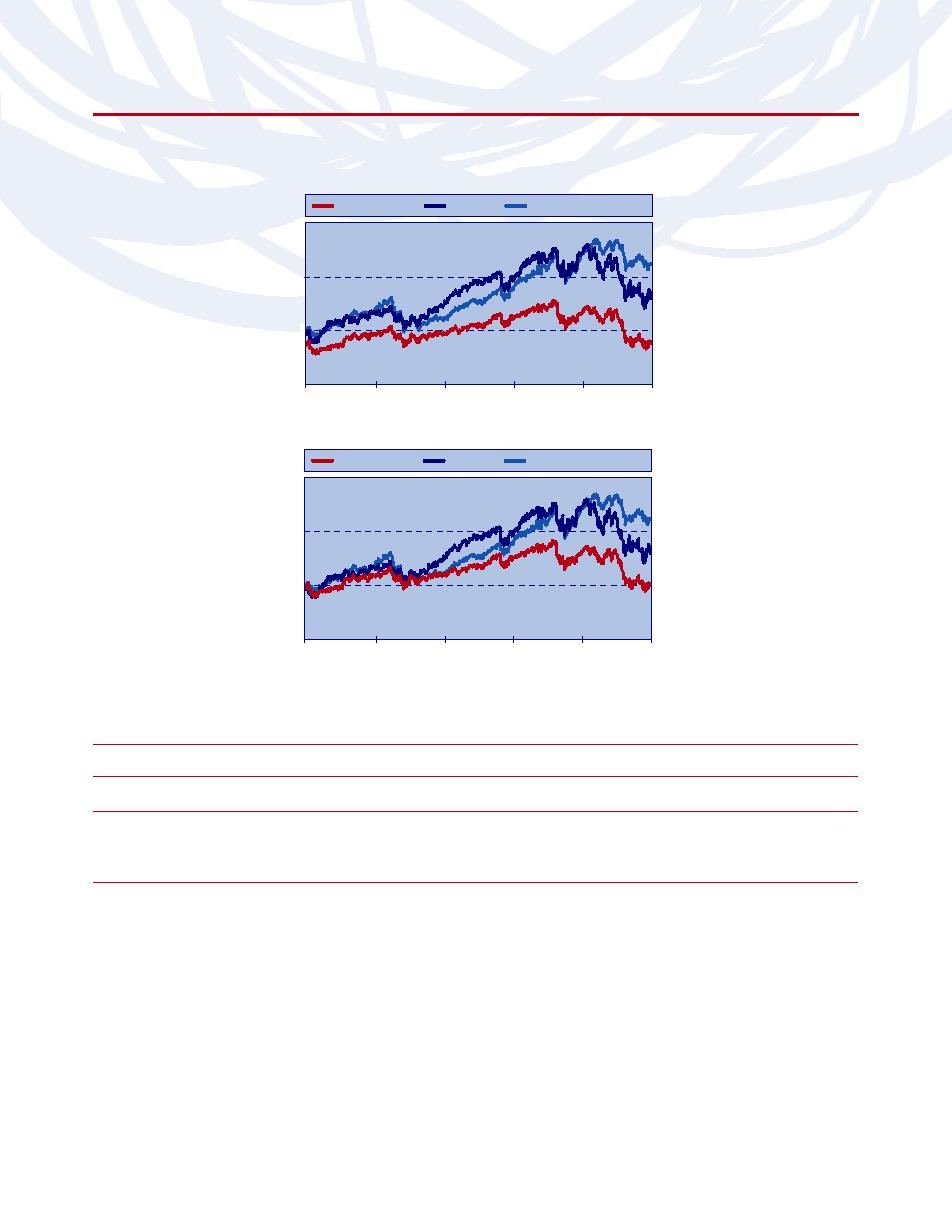
Cumulative Fund Performance
SECTOR ROTATION FUND A-CLASS†
S&P 500 INDEX
$18,000
$16,000
$14,000
$13,452
$12,654
$12,000
$10,000
$8,000
03/31/04
03/31/05
03/31/06
03/31/07
03/31/08
SECTOR ROTATION FUND H-CLASS
S&P 500 INDEX
$20,000
$15,000
$14,797
$12,852
$10,000
$5,000
03/22/02
03/31/03
03/31/04
03/31/05
03/31/06
03/31/07
03/31/08
† Initial investment has been adjusted for the maximum sales charge of 4.75%.
AVERAGE ANNUAL TOTAL RETURNS FOR THE PERIOD ENDED 03/31/08
A-Class
C-Class
(03/31/04)
(03/22/02)
ONE
ONE
SINCE
SINCE
ONE
ONE
FIVE
SINCE
YEAR
YEAR*
INCEPTION
INCEPTION*
YEAR
YEAR**
YEAR
INCEPTION
SECTOR ROTATION FUND
1.50%
-3.31%
9.01%
7.69%
0.81%
-0.14%
13.45%
5.93%
S&P 500 INDEX
-5.08%
-5.08%
6.06%
6.06%
-5.08%
-5.08%
11.32%
4.25%
H-Class
(03/22/02)
ONE
FIVE
SINCE
YEAR
YEAR
INCEPTION
SECTOR ROTATION FUND
1.50%
14.31%
6.72%
S&P 500 INDEX
-5.08%
11.32%
4.25%
* Fund returns are calculated using the maximum sales charge of 4.75%.
** Fund returns include a CDSC of 1% if redeemed within 12 months of purchase.
The returns presented above do not reflect the effects of taxes. Past performance is no guarantee of future results. The S&P 500
Index is an unmanaged stock index and, unlike the Fund, has no management fees or other operating expenses to reduce its
reported returns. Returns are historical and include changes in principal and reinvested dividends and capital gains. The graphs are
based on A-Class shares and H-Class shares only; performance for C-Class shares will vary due to differences in fee structure.
THE RYDEX SERIES FUNDS ANNUAL REPORT
|
11
PERFORMANCE REPORTS AND FUND PROFILES (Unaudited) (continued)
ABSOLUTE RETURN STRATEGIES FUND
OBJECTIVE: To provide capital appreciation consistent with the return and risk characteristics of the hedge fund
universe. The secondary objective is to achieve these returns with low correlation to and less volatility than equity
indices.
Inception: September 19, 2005
The Rydex Absolute Return Strategies Fund H-Class was down 3.71% for the annual period ended March 31, 2008.
The major themes underlying these results were the initiation of a credit crisis accompanied by a dramatic widening
of credit spreads, a de-leveraging of quantitative stock selection strategies by market participants, a significant rise
in equity market volatility, and the continuing commodity bull and dollar bear markets.
The Fund’s Merger Arbitrage strategy suffered most significantly from the aforementioned themes as an unusually
large number of deals broke in the 2nd half of the reporting period. Private equity deals, in particular, had a high
propensity to fail as financial buyers either could not obtain capital or chose to break off deals due to rapidly rising
borrowing rates.
Fixed Income Arbitrage performance also suffered from the credit crisis as widening credit spreads led to capital
losses in Credit Spread positions; trades designed to capture the yield differential between corporate and treasury
bonds. Offsetting these losses in the Fixed Income Arbitrage strategy were yield carry trades which benefited from
declining yields in longer duration treasury securities.
Market Neutral strategies were negatively impacted by the unwinding of quantitative stock selection strategies by
large market participants. In particular, Market Neutral Value positions were impaired during the second half of
calendar year 2007. Partially offsetting these losses were gains from Market Neutral Growth positions which
benefited from investors shifting to growth strategies and the Fund’s increasing allocation to this trade.
The Long/Short Equity strategy was hurt by all global equity markets with the exception of emerging markets which
posted a strong positive gain for the period. In addition, the large increase in market volatility created an attractive
opportunity for covered call-writing positions. The Fund capitalized on this opportunity with an increasing allocation
to call-writing trades.
Global Macro strategies performed very well for the period. The continuing commodities bull market led to strong
gains in the Fund’s long commodity position. Likewise, the continued downward movement of the U.S. dollar led to
gains from the Fund’s short trade-weighted dollar position.
Over the past year, the Fund experienced a monthly correlation with the S&P 500 Index of 83%. The Fund also
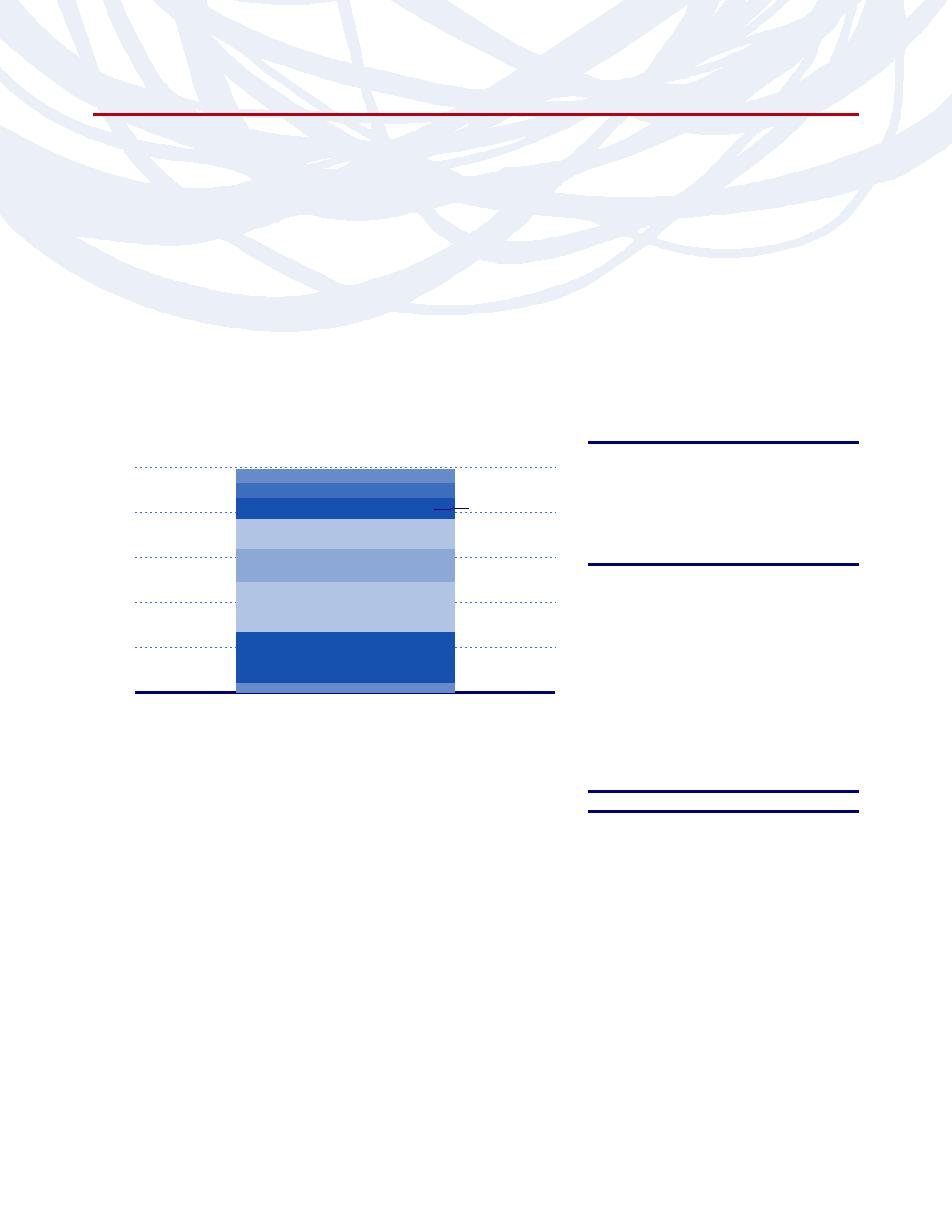
experienced volatility (standard deviation) of daily returns that was half that of the S&P 500 Index.
Holdings Diversification (Market Exposure as % of Net Assets)
Inception Dates:
60%
A-Class
September 19, 2005
55%
50%
C-Class
September 19, 2005
45%
40%
H-Class
September 19, 2005
35%
30%
25%
Ten Largest Long Holdings
20%
15%
(% of Total Net Assets)
10%
5%
iShares S&P GSCI Commodity
0%
-5%
Indexed Trust
4.5%
-10%
-15%
iShares MSCI Emerging Markets
Index Fund
2.0%
Baxter International, Inc.
0.6%
Verizon Communications, Inc.
0.5%
Molson Coors Brewing Co. —
Class B
0.5%
Absolute Return Strategies Fund
Absolute Return Strategies Fund
Long Holdings
Short Holdings
Cumulus Media, Inc. — Class A
0.5%
Myers Industries, Inc.
0.5%
First Charter Corp.
0.5%
“Holdings Diversification (Market Exposure as % of Net Assets)”
excludes any temporary cash investments.
Restoration Hardware, Inc.
0.5%
Bronco Drilling Co., Inc.
0.5%
Top Ten Total
10.6%
“Ten Largest Long Holdings” exclude any
temporary cash or derivative investments.
12
|
THE RYDEX SERIES FUNDS ANNUAL REPORT
PERFORMANCE REPORTS AND FUND PROFILES (Unaudited) (continued)
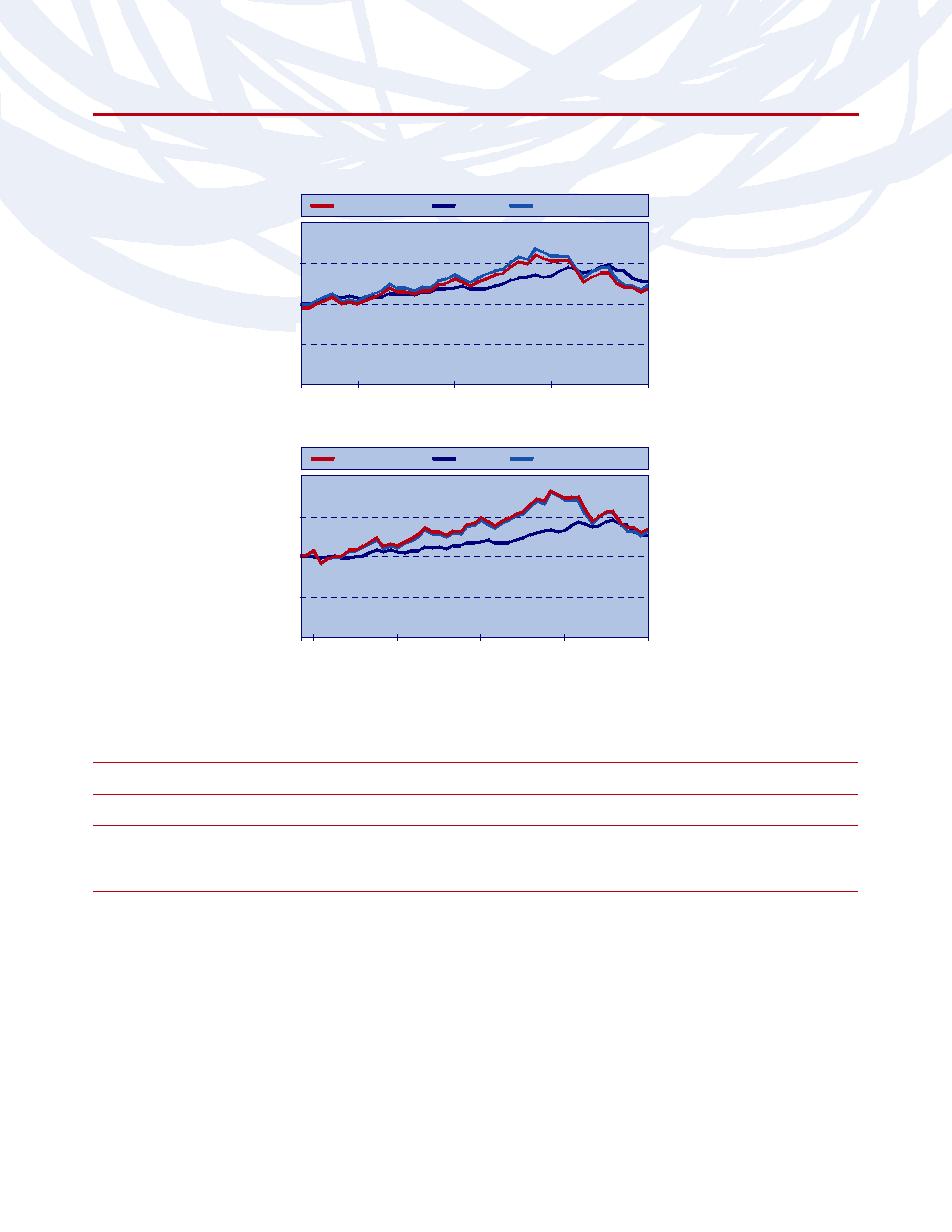
ABSOLUTE RETURN STRATEGIES FUND
Cumulative Fund Performance
ABSOLUTE RETURN
S&P 500 INDEX
STRATEGIES FUND
DOW JONES HEDGE FUND
A-CLASS†
BALANCED PORTFOLIO INDEX
$14,000
$12,000
$11,492
$11,278
$10,000
$9,954
$8,000
09/19/05
03/31/06
09/30/06
03/31/07
09/30/07
03/31/08
ABSOLUTE RETURN
S&P 500 INDEX
STRATEGIES FUND
DOW JONES HEDGE FUND
H-CLASS
BALANCED PORTFOLIO INDEX
$14,000
$12,000
$11,492
$11,278
$10,460
$10,000
$8,000
09/19/05
03/31/06
09/30/06
03/31/07
09/30/07
03/31/08
† Initial investment has been adjusted for the maximum sales charge of 4.75%.
AVERAGE ANNUAL TOTAL RETURNS FOR THE PERIOD ENDED 03/31/08
A-Class
C-Class
H-Class
(09/19/05)
(09/19/05)
(09/19/05)
ONE
ONE
SINCE
SINCE
ONE
ONE
SINCE
ONE
SINCE
YEAR
YEAR*
INCEPTION
INCEPTION*
YEAR
YEAR**
INCEPTION
YEAR
INCEPTION
ABSOLUTE RETURN STRATEGIES FUND
-3.72% -8.29%
-->
-3.72%
-8.29%
1.76%
-0.18%
-4.46%
-5.38%
1.01%
-3.71%
1.80%
S&P 500 INDEX
-5.08% -5.08%
-->
-5.08%
-5.08%
4.87%
4.87%
-5.08%
-5.08%
4.87%
-5.08%
4.87%
DOW JONES HEDGE FUND BALANCED
PORTFOLIO INDEX
0.51%
0.51%
5.65%
5.65%
0.51%
0.51%
5.65%
0.51%
5.65%
* Fund returns are calculated using the maximum sales charge of 4.75%.
** Fund returns include a CDSC of 1% if redeemed within 12 months of purchase.
The returns presented above do not reflect the effects of taxes. Past performance is no guarantee of future results. The S&P 500
Index and the Dow Jones Hedge Fund Balanced Portfolio Index are unmanaged indices and, unlike the Fund, have no
management fees or other operating expenses to reduce their reported returns. Returns are historical and include changes in
principal and reinvested dividends and capital gains. The graphs are based on A-Class shares and H-Class shares only;
performance for C-Class shares will vary due to differences in fee structure.
THE RYDEX SERIES FUNDS ANNUAL REPORT
|
13
PERFORMANCE REPORTS AND FUND PROFILES (Unaudited) (continued)
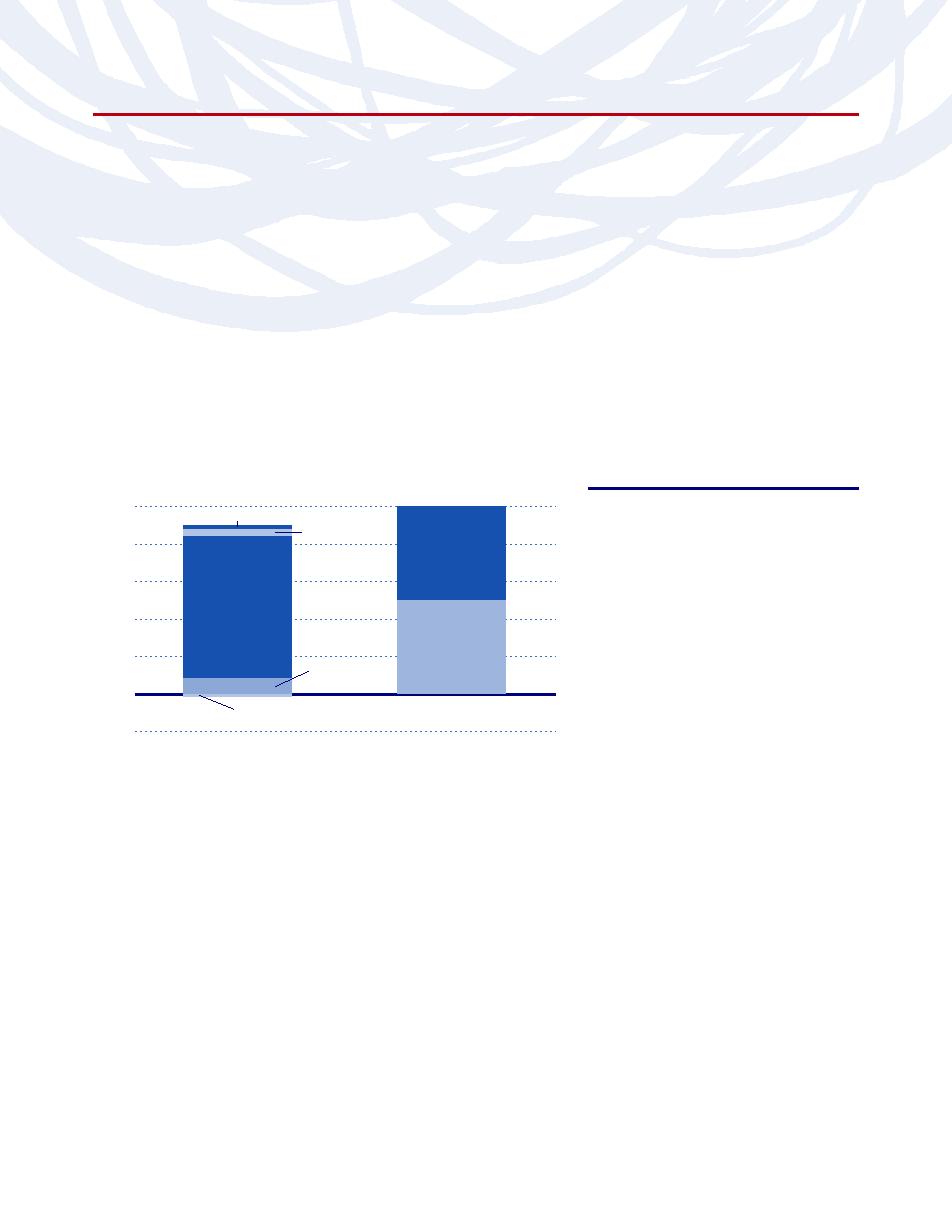
ALTERNATIVE STRATEGIES ALLOCATION FUND
OBJECTIVE: To deliver a return that has a low correlation to the returns of traditional stock and bond asset
classes as well as provide capital appreciation.
Inception: March 7, 2008
Rydex Alternative Strategies Allocation Fund was launched on March 7, 2008. For the three-week period from the
Fund’s inception until the end of the reporting period, March 31, 2008, the Fund’s H-Class returned -0.64%.
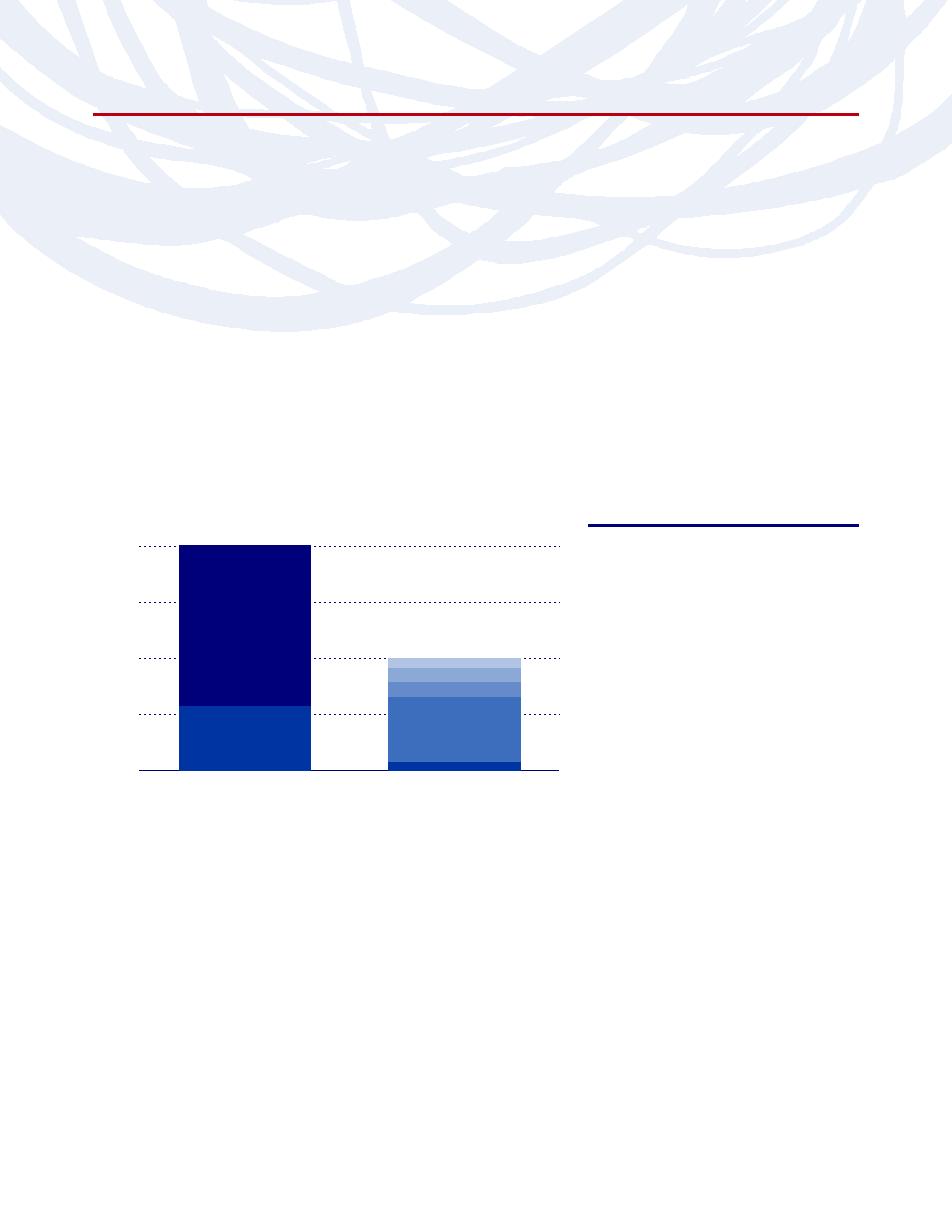
Rydex Alternative Strategies Allocation Fund is designed to be a risk diversifying vehicle. For this time period, its
current largest holding was in Rydex Managed Futures Fund, which follows the S&P Diversified Trends Indicator,
making long/short bets on commodities and financial futures. Its second-largest holding is a currency harvest strategy
that goes long on the highest-yielding currencies while shorting lower-yielding ones. Theoretically, both of these
strategies have low correlations with general stock and bond markets.
Industry Diversification (Market Exposure as % of Net Assets)
Inception Dates:
A-Class
March 7, 2008
100%
C-Class
March 7, 2008
Currency Exchange Traded Fund
H-Class
March 7, 2008
80%
Holdings (% of Total Net Assets)
60%
Rydex Series Funds — Managed
Futures Strategy Fund
45.6%
Alternative Investment Funds
40%
PowerShares DB G10 Currency
Harvest Fund
20.4%
Rydex Series
Fund –
Rydex Series Funds —
20%
Rydex Series
Commodities
Commodities Strategy Fund
13.0%
Fund – Real
Strategy Fund
Estate Fund
Rydex Series Funds —
0%
Real Estate Fund
11.5%
Alternative Strategies Allocation Fund
Rydex Series Funds —
Absolute Return Strategies Fund
4.4%
“Industry Diversification (Market Exposure as % of Net Assets)”
Grand Total
94.9%
excludes any temporary cash investments.
“Holdings” exclude any temporary cash
or derivative investments.
14
|
THE RYDEX SERIES FUNDS ANNUAL REPORT
PERFORMANCE REPORTS AND FUND PROFILES (Unaudited) (continued)
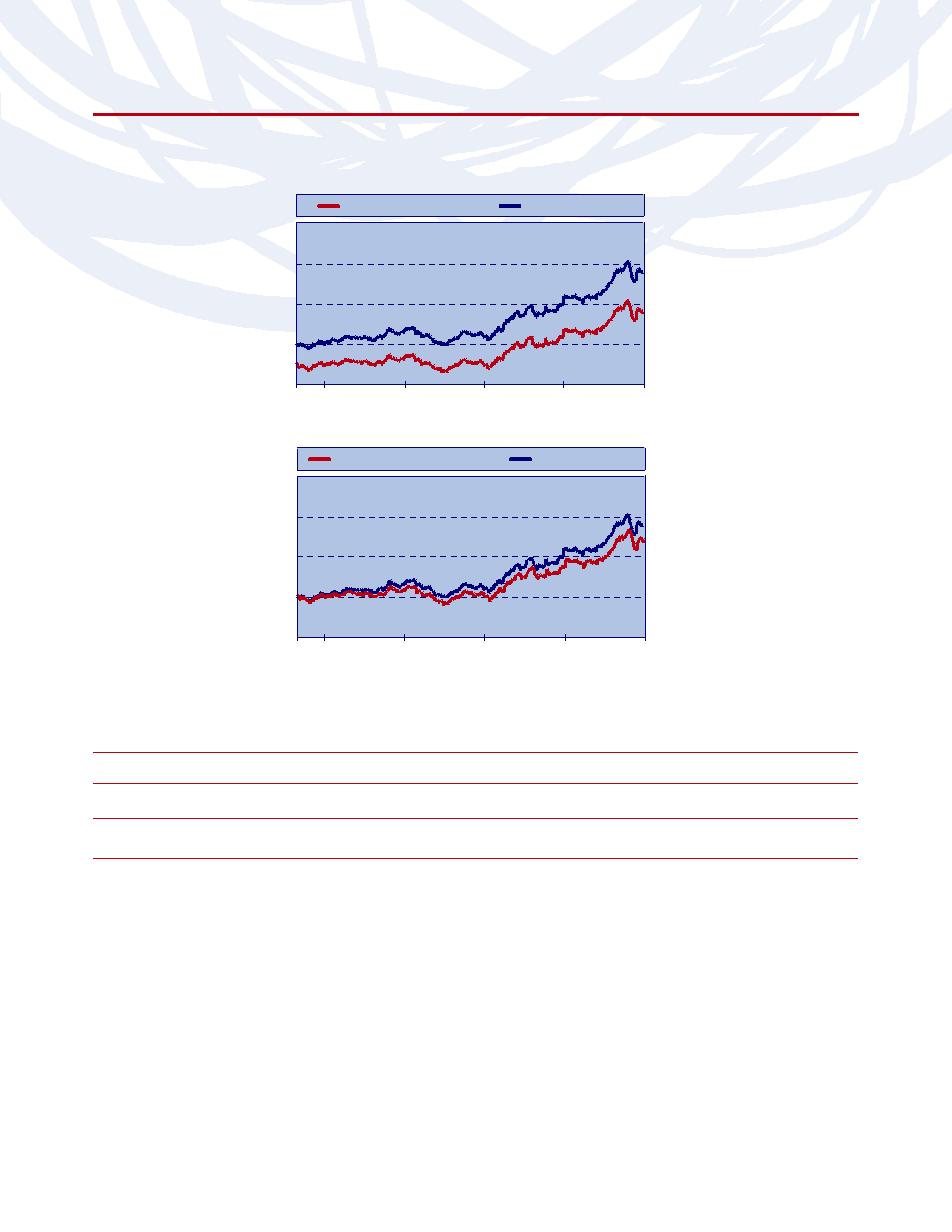
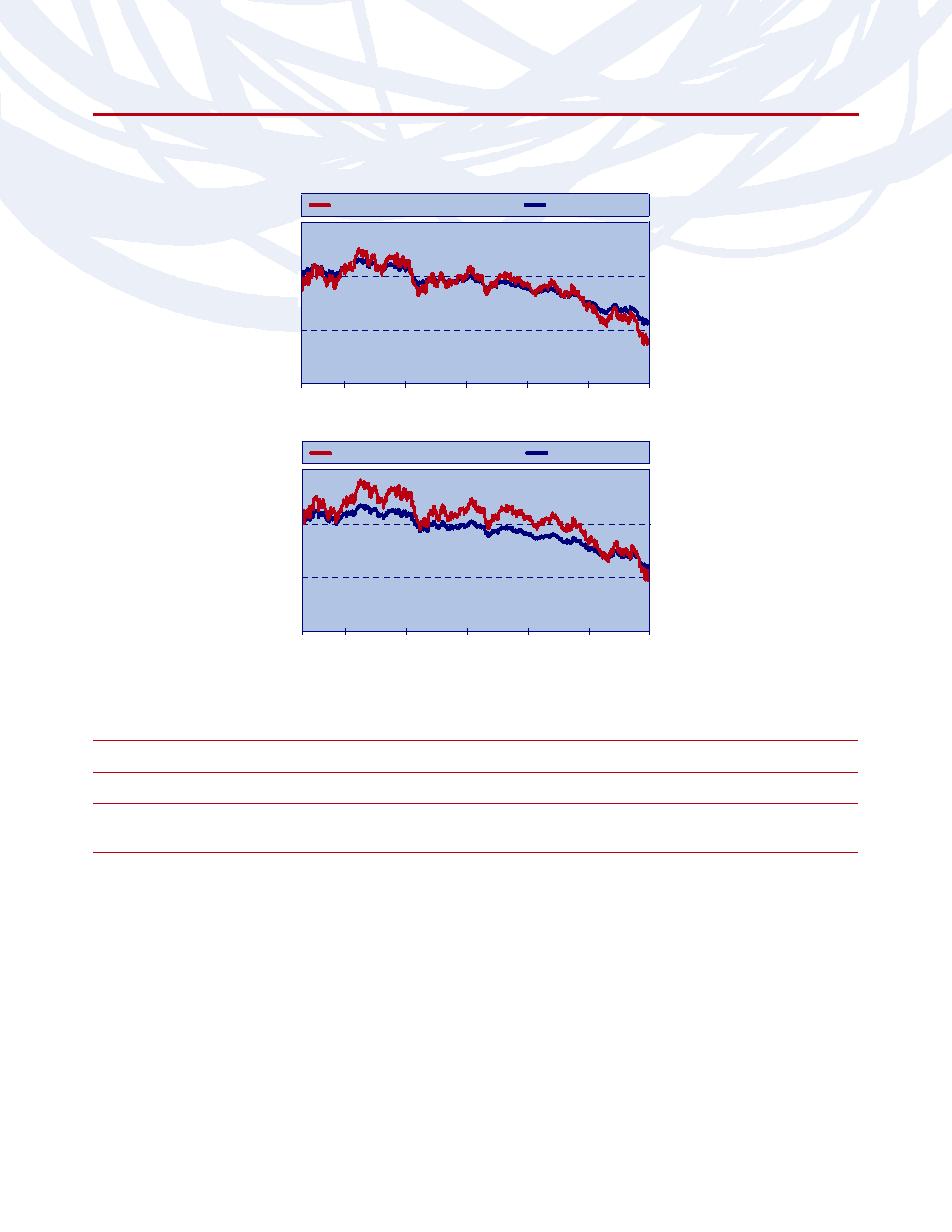
ALTERNATIVE STRATEGIES ALLOCATION FUND
Cumulative Fund Performance
ALTERNATIVE STRATEGIES
S&P 500 INDEX
ALLOCATION FUND
U.S. TREASURY BELLWETHERS:
A-CLASS†
3 MONTH INDEX
$11,000
$10,500
$10,236
$10,000
$10,012
$9,500
$9,463
$9,000
03/07/08
03/11/08
03/15/08
03/19/08
03/23/08
03/27/08
03/31/08
ALTERNATIVE STRATEGIES
S&P 500 INDEX
ALLOCATION FUND
U.S. TREASURY BELLWETHERS:
H-CLASS
3 MONTH INDEX
$11,000
$10,500
$10,236
$10,000
$10,012
$9,936
$9,500
$9,000
03/07/08
03/11/08
03/15/08
03/19/08
03/23/08
03/27/08
03/31/08
† Initial investment has been adjusted for the maximum sales charge of 4.75%.
TOTAL RETURNS FOR THE PERIOD ENDED 03/31/08
A-CLASS
C-CLASS
H-CLASS
(03/07/08)
(03/07/08)
(03/07/08)
SINCE
SINCE
SINCE
SINCE
SINCE
INCEPTION
INCEPTION*
INCEPTION
INCEPTION**
INCEPTION
ALTERNATIVE STRATEGIES ALLOCATION FUND
-0.64%
-5.37%
-0.68%
-1.67%
-0.64%
S&P 500 INDEX
2.36%
2.36%
2.36%
2.36%
2.36%
U.S. TREASURY BELLWETHERS: 3 MONTH INDEX
0.12%
0.12%
0.12%
0.12%
0.12%
* Fund returns are calculated using the maximum sales charge of 4.75%.
** Fund returns include a CDSC of 1% if redeemed within 12 months of purchase.
The returns presented above do not reflect the effects of taxes. Past performance is no guarantee of future results. The S&P 500
Index and the U.S. Treasury Bellwethers: 3 Month Index are unmanaged indices and, unlike the Fund, have no management fees
or other operating expenses to reduce their reported returns. Returns are historical and include changes in principal and reinvested
dividends and capital gains. The graphs are based on A-Class shares and H-Class shares only; performance for C-Class shares will
vary due to differences in fee structure.
THE RYDEX SERIES FUNDS ANNUAL REPORT
|
15
PERFORMANCE REPORTS AND FUND PROFILES (Unaudited) (continued)
COMMODITIES STRATEGY FUND
OBJECTIVE:
Seeks to provide investment results that correlate to the performance of a benchmark for
commodities. The Fund’s current benchmark is the S&P Goldman Sachs Commodity Index (“GSCI™”).
Inception: May 25, 2005
For the one-year period ended March 31, 2008, the S&P GSCI Total Return Index had a return of 38.62%. Oil and
gas commodities represent more than 70% of this Index, and remained a driver of returns.
The commodities that provided the most positive contribution to returns were crude oil, brent crude and wheat.
Conversely, natural gas, lean hogs and live cattle detracted from the Index’s return. Rydex Commodities Strategy
Fund H-Class performed as expected, returning 38.39% for the period.
Holdings Diversification (Market Exposure as % of Net Assets)
Inception Dates:
100%
A-Class
May 25, 2005
Industrial Metals
C-Class
May 25, 2005
Agriculture
H-Class
May 25, 2005
80%
The Fund invests principally in exchange
60%
traded funds and in derivative
S&P GSCI
instruments such as structured notes,
Total Return
40%
Structured Notes
Energy
futures contracts, and options on index
futures.
20%
Exchange
Traded
Funds
Other
0%
Commodities
S&P GSCI
Strategy Fund
Total Return Index
“Holdings Diversification (Market Exposure as % of Net Assets)”
excludes any temporary cash investments.
16
|
THE RYDEX SERIES FUNDS ANNUAL REPORT
PERFORMANCE REPORTS AND FUND PROFILES (Unaudited) (continued)
COMMODITIES STRATEGY FUND
Cumulative Fund Performance
COMMODITIES STRATEGY
S&P 500
S&P GSCI TOTAL
FUND A-CLASS†
INDEX
RETURN INDEX
$20,000
$15,000
$14,248
$12,564
$11,734
$10,000
$5,000
$0
05/25/05
09/30/05
03/31/06
09/30/06
03/31/07
09/30/07
03/31/08
COMMODITIES STRATEGY
S&P 500
S&P GSCI TOTAL
FUND H-CLASS
INDEX
RETURN INDEX
$20,000
$15,000
$14,248
$13,185
$11,734
$10,000
$5,000
$0
05/25/05
09/30/05
03/31/06
09/30/06
03/31/07
09/30/07
03/31/08
† Initial investment has been adjusted for the maximum sales charge of 4.75%.
AVERAGE ANNUAL TOTAL RETURNS FOR THE PERIOD ENDED 03/31/08
A-Class
C-Class
H-Class
(05/25/05)
(05/25/05)
(05/25/05)
ONE
ONE
SINCE
SINCE
ONE
ONE
SINCE
ONE
SINCE
YEAR
YEAR*
INCEPTION
INCEPTION*
YEAR
YEAR**
INCEPTION
YEAR
INCEPTION
COMMODITIES
STRATEGY FUND
38.48%
31.93%
10.21%
8.34%
37.41%
36.41%
9.36%
38.39%
10.19%
S&P 500 INDEX
-5.08%
-5.08%
5.77%
5.77%
-5.08%
-5.08%
5.77%
-5.08%
5.77%
S&P GSCI TOTAL
RETURN INDEX
38.62%
38.62%
13.23%
13.23%
38.62%
38.62%
13.23%
38.62%
13.23%
* Fund returns are calculated using the maximum sales charge of 4.75%.
** Fund returns include a CDSC of 1% if redeemed within 12 months of purchase.
The returns presented above do not reflect the effects of taxes. Past performance is no guarantee of future results. The S&P 500
Index and the S&P GSCI Total Return Index are unmanaged indices and, unlike the Fund, have no management fees or other
operating expenses to reduce their reported returns. Returns are historical and include changes in principal and reinvested
dividends and capital gains. The graphs are based on A-Class shares and H-Class shares only; performance for C-Class shares will
vary due to differences in fee structure.
THE RYDEX SERIES FUNDS ANNUAL REPORT
|
17
PERFORMANCE REPORTS AND FUND PROFILES (Unaudited) (continued)
HEDGED EQUITY FUND
OBJECTIVE: To provide capital appreciation consistent with the return and risk characteristics of the long/short
hedge fund universe. The secondary objective is to achieve these returns with low correlation to and less volatility
than equity indices.
Inception: September 19, 2005
The Rydex Hedged Equity Strategies Fund H-Class was down 8.97% for the annual period ended March 31, 2008.
The major themes underlying these results were the initiation of a credit crisis accompanied by a dramatic widening
of credit spreads, a de-leveraging of quantitative stock selection strategies by market participants, and a significant
rise in equity market volatility.
Long/Short Value and Long/Short Momentum styles were impaired by market participant unwinding of quantitative
stock selection models which accompanied the credit crisis. Partially offsetting these losses were gains from the
Fund’s Long/Short Growth style which resulted from investors shifting allocations away from value and towards
growth. The long equity trades underlying Long/Short styles were mostly negative with Japanese, European, and
U.S. equities posting significant losses for the period. The exceptions to this were Emerging Markets, Sector
Rotation, and call-writing trades all of which posted positive gains.
Over the past year, the Fund had a monthly correlation of 88% with the S&P 500 Index while experiencing about
three-quarters of the standard deviation of the Index.
Holdings Diversification (Market Exposure as % of Net Assets)
Inception Dates:
60%
A-Class
September 19, 2005
50%
C-Class
September 19, 2005
40%
H-Class
September 19, 2005
30%
20%
Ten Largest Long Holdings
(% of Total Net Assets)
10%
0%
iShares MSCI Emerging Markets Index
-10%
Fund
6.7%
-20%
Baxter International, Inc.
0.9%
Verizon Communications, Inc.
0.8%
Molson Coors Brewing Co. —
Class B
0.8%
Goldman Sachs Group, Inc.
0.7%
CSX Corp.
0.7%
Hedged Equity Fund Long Holdings
Hedged Equity Fund Short Holdings
Alleghany Corp.
0.6%
National-Oilwell Varco, Inc.
0.6%
“Holdings Diversification (Market Exposure as % of Net Assets)”
SBA Communications Corp.
0.6%
excludes any temporary cash investments.
Plum Creek Timber Co., Inc. (REIT)
0.6%
Top Ten Total
13.0%
“Ten Largest Long Holdings” exclude any
temporary cash or derivative investments.
18
|
THE RYDEX SERIES FUNDS ANNUAL REPORT
PERFORMANCE REPORTS AND FUND PROFILES (Unaudited) (continued)
HEDGED EQUITY FUND
Cumulative Fund Performance
Cumulative Fund Performance
HEDGED EQUITY
S&P 500
DOW JONES HEDGE FUND
FUND A-CLASS†
INDEX
EQUITY LONG/SHORT INDEX
$14,000
$12,469
$12,000
$11,278
$10,000
$9,522
$8,000
09/19/05
03/31/06
09/30/06
03/31/07
09/30/07
03/31/08
HEDGED EQUITY
S&P 500
DOW JONES HEDGE FUND
FUND H-CLASS
INDEX
EQUITY LONG/SHORT INDEX
$14,000
$12,469
$12,000
$11,278
$10,000
$10,003
$8,000
09/19/05
03/31/06
09/30/06
03/31/07
09/30/07
03/31/08
† Initial investment has been adjusted for the maximum sales charge of 4.75%.
AVERAGE ANNUAL TOTAL RETURNS FOR THE PERIOD ENDED 03/31/08
A-Class
C-Class
H-Class
(09/19/05)
(09/19/05)
(09/19/05)
ONE
ONE
SINCE
SINCE
ONE
ONE
SINCE
ONE
SINCE
YEAR
YEAR*
INCEPTION
INCEPTION*
YEAR
YEAR**
INCEPTION
YEAR
INCEPTION
HEDGED EQUITY FUND
-8.98% -13.30%
-->
-8.98%
-13.30%
-0.01%
-1.92%
-9.63%
-10.50%
-0.75%
-8.97%
0.01%
S&P 500 INDEX
-5.08%
-5.08%
4.87%
4.87%
-5.08%
-5.08%
4.87%
-5.08%
4.87%
DOW JONES HEDGE FUND EQUITY
LONG/SHORT INDEX
7.87%
7.87%
9.12%
9.12%
7.87%
7.87%
9.12%
7.87%
9.12%
* Fund returns are calculated using the maximum sales charge of 4.75%.
** Fund returns include a CDSC of 1% if redeemed within 12 months of purchase.
The returns presented above do not reflect the effects of taxes. Past performance is no guarantee of future results. The S&P 500
Index and the Dow Jones Hedge Fund Equity Long/Short Index are unmanaged indices and, unlike the Fund, have no
management fees or other operating expenses to reduce their reported returns. Returns are historical and include changes in
principal and reinvested dividends and capital gains. The graphs are based on A-Class shares and H-Class shares only;
performance for C-Class shares will vary due to differences in fee structure.
THE RYDEX SERIES FUNDS ANNUAL REPORT
|
19
PERFORMANCE REPORTS AND FUND PROFILES (Unaudited)
PERFORMANCE REPORTS AND FUND PROFILES (Unaudited) (continued)
INTERNATIONAL ROTATION FUND
OBJECTIVE: Seeks long-term capital appreciation.
Inception: August 31, 2007
Rydex International Rotation Fund seeks to add value by allocating assets to countries deemed attractive by a
quantitative investment model. Country allocations are made based on rankings from a set of factors that the
sub-advisor believes are indicative of the future value and growth of developed market countries and their
respective currencies.
Global markets were not immune to the weakness experienced in the U.S. during the one-year period ending March
31, 2008. The MSCI World Ex USA Index was down 8.26%. However, foreign markets fared better in general. The
S&P 500 Index, representative of domestic large-cap stocks, fell 5.08% during the period.
The Fund benefited from its exposure to Spain, which was the best performing country market of the 18 in its
investment universe. It also benefited greatly from what it avoided—there were no allocations made to the United
Kingdom and Japan, for instance, both of which were down more than 10.00%. The biggest detractor from
performance was the Fund’s allocation to Sweden. Rydex International Rotation Fund H-Class returned -5.89%.
Holdings Diversification (Market Exposure as % of Net Assets)
Inception Dates:
100%
Australia
A-Class
August 31, 2007
Australia
North America
C-Class
August 31, 2007
80%
H-Class
August 31, 2007
North America
Asia
60%
The Fund invests principally in exchange
Asia
traded funds and derivative investments
such as swap agreements, futures
40%
contracts and options on currencies.
Europe
Europe
20%
Other
0%
International
MSCI World
Rotation Fund
Ex USA Index
“Holdings Diversification (Market Exposure as % of Net Assets)”
excludes any temporary cash investments.
20
|
THE RYDEX SERIES FUNDS ANNUAL REPORT
PERFORMANCE REPORTS AND FUND PROFILES (Unaudited) (continued)
INTERNATIONAL ROTATION FUND
Cumulative Fund Performance
Cumulative Fund Performance
Cumulative Fund Performance
INTERNATIONAL
S&P 500
MSCI WORLD
ROTATION FUND A-CLASS†
INDEX
Ex USA INDEX SM
$12,000
$11,000
$10,000
$9,509
$9,081
$9,000
$8,959
$8,000
08/31/07
09/30/07
12/31/07
03/31/08
INTERNATIONAL
S&P 500
MSCI WORLD
ROTATION FUND H-CLASS
INDEX
Ex USA INDEX
$12,000
$11,000
$10,000
$9,509
$9,411
$9,000
$9,081
$8,000
08/31/07
09/30/07
12/31/07
03/31/08
† Initial investment has been adjusted for the maximum sales charge of 4.75%.
TOTAL RETURNS FOR THE PERIOD ENDED 03/31/08
A-CLASS
C-CLASS
H-CLASS
(08/31/07)
(08/31/07)
(08/31/07)
SINCE
SINCE
SINCE
SINCE
SINCE
INCEPTION
INCEPTION*
INCEPTION
INCEPTION**
INCEPTION
INTERNATIONAL ROTATION FUND
-5.93%
-10.41%
-6.29%
-7.21%
-5.89%
S&P 500 INDEX
-9.19%
-9.19%
-9.19%
-9.19%
-9.19%
MSCI WORLD EX USA INDEX
-8.26%
-8.26%
-8.26%
-8.26%
-8.26%
* Fund returns are calculated using the maximum sales charge of 4.75%.
** Fund returns include a CDSC of 1% if redeemed within 12 months of purchase.
The returns presented above do not reflect the effects of taxes. Past performance is no guarantee of future results. The S&P 500
Index and the MSCI World Ex USA Index are unmanaged indices and, unlike the Fund, have no management fees or other
operating expenses to reduce their reported returns. Returns are historical and include changes in principal and reinvested
dividends and capital gains. The graphs are based on A-Class shares and H-Class shares only; performance for C-Class shares will
vary due to differences in fee structure.
THE RYDEX SERIES FUNDS ANNUAL REPORT
|
21
PERFORMANCE REPORTS AND FUND PROFILES (Unaudited) (continued)
MANAGED FUTURES STRATEGY FUND
OBJECTIVE: To provide investment results that match the performance of a benchmark for measuring trends in
the commodity and financial futures markets. The Fund’s current benchmark is the Standard & Poor’s Diversified
Trends Indicator®.
Inception: March 2, 2007
For the one-year period ended March 31, 2008, the S&P Diversified Trends Indicator had a return of 16.57%. This
index is comprised of 14 sectors from around the world, with 50% allocated to financial futures and 50% to
commodity futures. Each of the 14 sectors has the potential to be long or short based on price momentum, with the
exception of energy. The returns were split fairly evenly between commodities and financials.
Energy, grains and the euro provided the most positive contribution to return, while industrial metals, softs (“natural”
commodities that are harvested rather than mined) and livestock provided a drag on returns. In terms of components,
light crude and wheat boosted performance and copper, lean hogs and coffee detracted from performance. Rydex
Managed Futures Strategy Fund H-Class returned 12.92% during the period.
Holdings Diversification (Market Exposure as % of Net Assets)
Inception Dates:
100%
A-Class
March 2, 2007
Currency Trusts
Exchange
C-Class
March 2, 2007
Traded Funds
Commodities
80%
H-Class
March 2, 2007
Futures
Contracts
60%
S&P Diversified
The Fund invests principally in exchange
Trends Indicator
traded funds and derivative investments
Total Return
40%
Structured Notes
S&P
Financial
such as structured notes, futures
Diversified
Futures
contracts, and options on index futures.
Trends Indicator
Contracts
20%
Price Return
Structured
Notes
0%
Currency Trust
Short Sales
-20%
Managed Futures
S&P Diversified
Strategy Fund
Trends Indicator
“Holdings Diversification (Market Exposure as % of Net Assets)”
excludes any temporary cash investments.
22
|
THE RYDEX SERIES FUNDS ANNUAL REPORT
PERFORMANCE REPORTS AND FUND PROFILES (Unaudited) (continued)
MANAGED FUTURES STRATEGY FUND
Cumulative Fund Performance
MANAGED FUTURES
S&P DIVERSIFIED
STRATEGY FUND A-CLASS†
TRENDS INDICATOR®
$13,000
$12,000
$11,747
$11,000
$10,767
$10,000
$9,000
03/02/07
06/30/07
09/30/07
12/31/07
03/31/08
03/31/07
MANAGED FUTURES
S&P DIVERSIFIED
STRATEGY FUND H-CLASS
TRENDS INDICATOR®
$13,000
$12,000
$11,747
$11,305
$11,000
$10,000
$9,000
03/02/07
06/30/07
09/30/07
12/31/07
03/31/08
03/31/07
† Initial investment has been adjusted for the maximum sales charge of 4.75%.
AVERAGE ANNUAL TOTAL RETURNS FOR THE PERIOD ENDED 03/31/08
A-Class
C-Class
H-Class
(03/02/07)
(03/02/07)
(03/02/07)
ONE
ONE
SINCE
SINCE
ONE
ONE
SINCE
ONE
SINCE
YEAR
YEAR*
INCEPTION
INCEPTION*
YEAR
YEAR**
INCEPTION
YEAR
INCEPTION
MANAGED FUTURES STRATEGY FUND
12.92%
7.55%
12.04%
7.09%
12.08% 11.08%
-->
12.08%
11.08%
11.23%
12.92%
12.04%
S&P DIVERSIFIED TRENDS INDICATOR
16.57%
16.57%
16.09%
16.09%
16.57%
16.57%
16.09%
16.57%
16.09%
* Fund returns are calculated using the maximum sales charge of 4.75%.
** Fund returns include a CDSC of 1% if redeemed within 12 months of purchase.
The returns presented above do not reflect the effects of taxes. Past performance is no guarantee of future results. The S&P
Diversified Trends Indicator is an unmanaged index and, unlike the Fund, has no management fees or other operating expenses to
reduce its reported return. Returns are historical and include changes in principal and reinvested dividends and capital gains. The
graphs are based on A-Class shares and H-Class shares only; performance for C-Class shares will vary due to differences in fee
structure.
THE RYDEX SERIES FUNDS ANNUAL REPORT
|
23
PERFORMANCE REPORTS AND FUND PROFILES (Unaudited) (continued)
REAL ESTATE FUND
OBJECTIVE:
Seeks to provide capital appreciation by investing in companies that are involved in the real estate
industry including real estate investment trusts (“REITs”).
Inception: February 20, 2004
REITs and real estate management companies suffered through a tough year with the eruption of the sub-prime
mortgage crisis and the subsequent tightening of credit. Both industries were down more than 20.00% each.
Despite the downturn in the commercial real estate industry, there were still bright spots in the sector. The best
performing fund holding was Equity Inns, up approximately 40.00%. The worst performing holding, American Home
Mortgage Investment Corp., returned -96.00%.
Rydex Real Estate Fund H-Class returned -22.60% for the one-year period ending March 31, 2008.
Holdings Diversification (Market Exposure as % of Net Assets)
Inception Dates:
A-Class
September 1, 2004
100%
Industrial REITs
Real Estate
C-Class
February 20, 2004
Diversified REITs
Management &
H-Class
February 20, 2004
Development
80%
Residential REITs
Ten Largest Holdings
60%
(% of Total Net Assets)
Office REITs
Simon Property Group, Inc.
3.0%
40%
Public Storage, Inc.
2.6%
Retail REITs
ProLogis
2.5%
Equity Residential
2.3%
20%
Specialized REITs
Vornado Realty Trust
2.3%
Brookfield Asset
0%
Other
Management, Inc. — Class A
2.2%
Real Estate Fund
KIMCO Realty Corp.
2.2%
“Holdings Diversification (Market Exposure as % of Net Assets)”
Boston Properties, Inc.
2.1%
excludes any temporary cash investments.
General Growth Properties, Inc.
2.0%
AvalonBay Communities, Inc.
1.8%
Top Ten Total
23.0%
“Ten Largest Holdings” exclude any
temporary cash or derivative investments.
24
|
THE RYDEX SERIES FUNDS ANNUAL REPORT
PERFORMANCE REPORTS AND FUND PROFILES (Unaudited) (continued)
REAL ESTATE FUND
Cumulative Fund Performance
REAL ESTATE
S&P 500
S&P REIT COMPOSITE
FUND A-CLASS†
INDEX
INDEX††
$20,000
$15,000
$12,790
$12,363
$11,874
$10,000
$5,000
$0
09/01/04
03/31/05
03/31/06
03/31/07
03/31/08
REAL ESTATE
S&P 500
S&P REIT COMPOSITE
FUND H-CLASS
INDEX
INDEX††
$20,000
$15,000
$13,286
$13,083
$12,478
$10,000
$5,000
$0
02/20/04
03/31/05
03/31/06
03/31/07
03/31/08
03/31/04
† Initial investment has been adjusted for the maximum sales charge of 4.75%.
†† Data points for the line graph do not reflect the reinvestment of dividends on securities in the index.
AVERAGE ANNUAL TOTAL RETURNS FOR THE PERIOD ENDED 03/31/08
A-Class
C-Class
H-Class
(09/01/04)
(02/20/04)
(02/20/04)
ONE
ONE
SINCE
SINCE
ONE
ONE
SINCE
ONE
SINCE
YEAR
YEAR*
INCEPTION
INCEPTION*
YEAR
YEAR**
INCEPTION
YEAR
INCEPTION
REAL ESTATE FUND
-22.59%
-26.26%
6.35%
4.92%
-23.21%
-23.97%
6.39%
-22.60%
7.16%
S&P 500 INDEX
-5.08%
-5.08%
7.12%
7.12%
-5.08%
-5.08%
5.53%
-5.08%
5.53%
S&P REIT
COMPOSITE INDEX
-19.06%
-19.06%
11.32%
11.32%
-19.06%
-19.06%
12.09%
-19.06%
12.09%
* Fund returns are calculated using the maximum sales charge of 4.75%.
** Fund returns include a CDSC of 1% if redeemed within 12 months of purchase.
The returns presented above do not reflect the effects of taxes. Past performance is no guarantee of future results. The S&P 500
Index and the S&P REIT Composite Index are unmanaged stock indices and, unlike the Fund, have no management fees or other
operating expenses to reduce their reported returns. Returns are historical and include changes in principal and reinvested
dividends and capital gains. The graphs are based on A-Class shares and H-Class shares only; performance for C-Class shares will
vary due to differences in fee structure.
THE RYDEX SERIES FUNDS ANNUAL REPORT
|
25
PERFORMANCE REPORTS AND FUND PROFILES (Unaudited) (continued)
STRENGTHENING DOLLAR 2x STRATEGY FUND
OBJECTIVE:
To provide investment results that will match the performance of a specific benchmark on a daily
basis. The Fund's current benchmark is 200% of the performance of the U.S. Dollar Index®.
Inception: May 25, 2005
For the one-year period ending March 31, 2008, the U.S. Dollar Index had a return of –13.42%. The euro remains the
main driver of returns as it represents more than 50% of the index. The U.S. dollar weakened against all six
currencies that comprise the U.S. Dollar Index, namely the euro, Japanese yen, British pound, Canadian dollar,
Swedish krona and the Swiss franc. Although the White House and Treasury Secretary continue to stress the
importance of a strong U.S. dollar, the only bright spot in the economy is an increase in exports directly resulting
from a weaker U.S. dollar. Rydex Strengthening Dollar 2x Strategy Fund H-Class performed as expected, returning
-21.71%. The Fund achieved a daily correlation of 99% to its benchmark of 200% of the daily price movement of the
U.S. Dollar Index.
The effects of compounding may cause the longer-term correlation of the Fund to its benchmark to diminish. The
apparent discrepancy between the leveraged and unleveraged indices is the result of compounding, which is
described briefly on page 3 of this report.
Holdings Diversification (Market Exposure as % of Net Assets)
Inception Dates:
A-Class
May 25, 2005
200%
C-Class
May 25, 2005
H-Class
May 25, 2005
150%
Currency Index
The Fund invests principally in derivative
Swap Agreements
investments such as currency index swap
100%
agreements, futures contracts, and
Canadian Dollar
British Pound
options on index futures.
Japanese Yen
50%
Euro
Futures Contracts
Other
0%
Strengthening Dollar
U.S. Dollar Index
2x Strategy Fund
“Holdings Diversification (Market Exposure as % of Net Assets)”
excludes any temporary cash investments.
26
|
THE RYDEX SERIES FUNDS ANNUAL REPORT
PERFORMANCE REPORTS AND FUND PROFILES (Unaudited) (continued)
STRENGTHENING DOLLAR 2x STRATEGY FUND
Cumulative Fund Performance
STRENGTHENING DOLLAR
2X STRATEGY FUND A-CLASS†
U.S. DOLLAR INDEX
$12,000
$10,000
$8,315
$8,000
$7,597
$6,000
05/25/05
09/30/05
03/31/06
09/30/06
03/31/07
09/30/07
03/31/08
STRENGTHENING DOLLAR
2X STRATEGY FUND H-CLASS
U.S. DOLLAR INDEX
$12,000
$10,000
$8,315
$8,000
$7,968
$6,000
05/25/05
09/30/05
03/31/06
09/30/06
03/31/07
09/30/07
03/31/08
† Initial investment has been adjusted for the maximum sales charge of 4.75%.
AVERAGE ANNUAL TOTAL RETURNS FOR THE PERIOD ENDED 03/31/08
A-Class
C-Class
H-Class
(05/25/05)
(05/25/05)
(05/25/05)
ONE
ONE
SINCE
SINCE
ONE
ONE
SINCE
ONE
SINCE
YEAR
YEAR*
INCEPTION
INCEPTION*
YEAR
YEAR**
INCEPTION
YEAR
INCEPTION
STRENGTHENING DOLLAR
2X STRATEGY FUND
-21.70%
-25.40%
-7.63%
-9.20%
-22.29%
-23.07%
-8.33%
-21.71%
-7.66%
U.S. DOLLAR INDEX
-13.42%
-13.42%
-6.27%
-6.27%
-13.42%
-13.42%
-6.27%
-13.42%
-6.27%
* Fund returns are calculated using the maximum sales charge of 4.75%.
** Fund returns include a CDSC of 1% if redeemed within 12 months of purchase.
The returns presented above do not reflect the effects of taxes. Past performance is no guarantee of future results. The U.S. Dollar
Index is an unmanaged index and, unlike the Fund, has no management fees or other operating expenses to reduce its reported
return. Returns are historical and include changes in principal and reinvested dividends and capital gains. The graphs are based on
A-Class shares and H-Class shares only; performance for C-Class shares will vary due to differences in fee structure.
THE RYDEX SERIES FUNDS ANNUAL REPORT
|
27
PERFORMANCE REPORTS AND FUND PROFILES (Unaudited) (continued)
WEAKENING DOLLAR 2x STRATEGY FUND
OBJECTIVE:
To provide investment results that will match the performance of a specific benchmark on a daily
basis. The Fund's current benchmark is 200% of the inverse performance of the U.S Dollar Index.
Inception: May 25, 2005
Although the White House and Treasury Secretary continue to stress the importance of a strong U.S. dollar, the only
bright spot in the economy is an increase in exports directly resulting from a weaker U.S. dollar. Rydex Weakening
Dollar 2x Strategy Fund H-Class benefited from the dollar’s weakening, performing as expected with a 32.41% return
for the one-year period ended March 31, 2008. During the period, the U.S. Dollar Index had a return of –13.42%.
The euro remains the main driver of returns as it represents more than 50% of the index. The U.S. dollar weakened
against all six currencies that comprise the U.S. Dollar Index, namely the euro, Japanese yen, British pound, Canadian
dollar, Swedish krona and the Swiss franc. The Fund achieved a daily correlation of 99% to its benchmark of -200% of
the daily price movement of the U.S. Dollar Index.
The effects of compounding may cause the longer-term correlation of the Fund to its benchmark to diminish. The
apparent discrepancy between the leveraged and unleveraged indices is the result of compounding, which is
described briefly on page 3 of this report.
Holdings Diversification (Market Exposure as % of Net Assets)
Inception Dates:
100%
A-Class
May 25, 2005
Canadian Dollar
British Pound
80%
C-Class
May 25, 2005
Japanese Yen
H-Class
May 25, 2005
60%
40%
Euro
The Fund invests principally in derivative
20%
investments such as currency index swap
0%
Other
agreements, futures contracts, and
-20%
Futures Contracts
options on index futures.
Short Sales
-40%
-60%
-80%
-100%
Currency Index
Swap Agreements
-120%
Short Sales
-140%
-160%
-180%
-200%
Weakening Dollar
U.S. Dollar Index
2x Strategy Fund
“Holdings Diversification (Market Exposure as % of Net Assets)”
excludes any temporary cash investments.
28
|
THE RYDEX SERIES FUNDS ANNUAL REPORT
PERFORMANCE REPORTS AND FUND PROFILES (Unaudited) (concluded)
WEAKENING DOLLAR 2x STRATEGY FUND
Cumulative Fund Performance
WEAKENING DOLLAR
2X STRATEGY FUND A-CLASS†
U.S. DOLLAR INDEX
$14,000
$13,294
$12,000
$10,000
$8,315
$8,000
05/25/05
09/30/05
03/31/06
09/30/06
03/31/07
09/30/07
03/31/08
WEAKENING DOLLAR
2X STRATEGY FUND H-CLASS
U.S. DOLLAR INDEX
$16,000
$14,000
$13,950
$12,000
$10,000
$8,315
$8,000
05/25/05
09/30/05
03/31/06
09/30/06
03/31/07
09/30/07
03/31/08
† Initial investment has been adjusted for the maximum sales charge of 4.75%.
AVERAGE ANNUAL TOTAL RETURNS FOR THE PERIOD ENDED 03/31/08
A-Class
C-Class
H-Class
(05/25/05)
(05/25/05)
(05/25/05)
ONE
ONE
SINCE
SINCE
ONE
ONE
SINCE
ONE
SINCE
YEAR
YEAR*
INCEPTION
INCEPTION*
YEAR
YEAR**
INCEPTION
YEAR
INCEPTION
WEAKENING DOLLAR
2X STRATEGY FUND
32.49%
26.18%
12.42%
10.51%
31.47%
30.47%
11.56%
32.41%
12.39%
U.S. DOLLAR INDEX
-13.42%
-13.42%
-6.27%
-6.27%
-13.42%
-13.42%
-6.27%
-13.42%
-6.27%
* Fund returns are calculated using the maximum sales charge of 4.75%.
** Fund returns include a CDSC of 1% if redeemed within 12 months of purchase.
The returns presented above do not reflect the effects of taxes. Past performance is no guarantee of future results. The U.S Dollar
Index is an unmanaged index and, unlike the Fund, has no management fees or other operating expenses to reduce its reported
return. Returns are historical and include changes in principal and reinvested dividends and capital gains. The graphs are based on
A-Class shares and H-Class shares only; performance for C-Class shares will vary due to differences in fee structure.
THE RYDEX SERIES FUNDS ANNUAL REPORT
|
29
SCHEDULE OF INVESTMENTS
March 31, 2008
MULTI-CAP CORE EQUITY FUND
MARKET
MARKET
VALUE
VALUE
SHARES
(NOTE 1)
SHARES
(NOTE 1)
COMMON STOCKS 93.0%
Patriot Capital Funding, Inc.†
5,490
$
57,480
Park National Corp.
790
55,972
FINANCIALS 16.1%
East-West Bancorp, Inc.†
3,092
54,883
Bank of America Corp.†
5,950
$
225,564
Assurant, Inc.
900
54,774
Wells Fargo & Co.†
6,121
178,121
NYSE Euronext
820
50,602
CME Group, Inc.†
260
121,966
DiamondRock Hospitality Co.†
3,720
47,132
American International
HRPT Properties Trust†
6,680
44,956
Group, Inc.
2,800
121,100
PartnerRe Ltd.
520
39,676
Bank of New York Mellon Corp.
2,650
110,584
Imperial Capital Bancorp, Inc.
1,820
39,348
Aspen Insurance Holdings Ltd.†
4,190
110,532
Citigroup, Inc.
1,811
38,792
Capital One Financial Corp.†
2,240
110,253
Mission West Properties
4,090
38,651
ACE Ltd.
1,990
109,569
National Financial
ProLogis†
1,850
108,891
Partners Corp.†
1,700
38,199
Realty Income Corp.†
4,190
107,348
Fannie Mae†
1,208
31,795
Platinum Underwriters
Max Capital Group Ltd.†
1,190
31,166
Holdings Ltd.†
3,250
105,495
AmeriCredit Corp.*†
3,090
31,116
Axis Capital Holdings Ltd.
3,090
104,998
Ventas, Inc.†
680
30,539
IPC Holdings Ltd.†
3,730
104,440
iStar Financial, Inc.†
2,140
30,024
American Capital
NorthStar Realty Finance Corp.†
3,670
29,984
Strategies Ltd.†
3,020
103,163
The PMI Group, Inc.†
5,110
29,740
National Retail Properties, Inc.†
4,580
100,989
State Street Corp.†
300
23,700
First Industrial Realty Trust, Inc.†
3,220
99,466
Anthracite Capital, Inc.†
3,230
21,318
Prospect Capital Corp.†
6,390
97,256
Advanta Corp.
2,990
21,020
Transatlantic Holdings, Inc.†
1,440
95,544
SL Green Realty Corp.†
230
18,738
Endurance Specialty
Lexington Realty Trust†
1,290
18,589
Holdings Ltd.
2,600
95,160
Washington Mutual, Inc.†
1,800
18,540
PNC Financial
First Merchants Corp.
540
15,412
Services Group, Inc.†
1,440
94,421
Colonial Properties Trust†
510
12,266
IBERIABANK Corp.
2,130
94,252
Independent Bank Corp.
1,100
11,418
Hospitality Properties Trust
2,770
94,235
Wachovia Corp.†
410
11,070
Entertainment Properties Trust†
1,900
93,727
Senior Housing Properties Trust†
450
10,665
MetLife, Inc.†
1,480
89,185
Commerce Bancshares, Inc.
220
9,247
Hercules Technology
T. Rowe Price Group, Inc.†
140
7,000
Growth Capital, Inc.
8,081
87,760
Bear Stearns Cos., Inc.†
620
6,504
HCC Insurance Holdings, Inc.
3,830
86,903
Triad Guaranty, Inc.*†
1,260
6,300
Agree Realty Corp.†
3,150
86,467
GAMCO Investors, Inc. —
Evercore Partners, Inc. —
Class A
120
6,043
Class A
4,850
86,087
National Health Investors, Inc.
190
5,938
Everest Re Group Ltd.
950
85,053
Franklin Resources, Inc.†
50
4,850
Renasant Corp.†
3,720
83,700
E*Trade Financial Corp.*†
1,210
4,671
Redwood Trust, Inc.†
2,190
79,606
SLM Corp.*†
220
3,377
SunTrust Banks, Inc.†
1,440
79,402
CompuCredit Corp.*†
370
3,282
Marshall & Ilsley Corp.†
3,360
77,952
Genworth Financial, Inc. —
Ameriprise Financial, Inc.
1,500
77,775
Class A
130
2,943
JPMorgan Chase & Co.
1,768
75,936
BB&T Corp.†
70
2,244
Blackrock, Inc.†
370
75,547
Hudson City Bancorp, Inc.
100
1,768
Public Storage, Inc.†
850
75,327
FirstFed Financial Corp.*
50
1,358
Whitney Holding Corp.†
3,020
74,866
FX Real Estate and
Zions Bancorporation†
1,638
74,611
Entertainment, Inc.*
74
435
Loews Corp.
1,800
72,396
Total Financials
5,235,477
Annaly Capital
INFORMATION TECHNOLOGY 15.5%
Management, Inc.†
4,460
68,327
Microsoft Corp.
12,370
351,061
Marathon Acquisition Corp.*†
8,370
64,616
Hewlett-Packard Co.
4,930
225,104
Regions Financial Corp.†
3,160
62,410
Intel Corp.
8,460
179,183
Hersha Hospitality Trust
6,750
60,952
30
|
THE RYDEX SERIES FUNDS ANNUAL REPORT
See Notes to Financial Statements.
SCHEDULE OF INVESTMENTS (continued)
March 31, 2008
MULTI-CAP CORE EQUITY FUND
MARKET
MARKET
VALUE
VALUE
SHARES
(NOTE 1)
SHARES
(NOTE 1)
Qualcomm, Inc.
4,180
$
171,380
Scansource, Inc.*†
860
$
31,123
Google, Inc. — Class A*†
380
167,379
Activision, Inc.*†
1,040
28,402
Apple, Inc.*
1,160
166,460
Vishay Intertechnology, Inc.*
2,830
25,640
Oracle Corp.*
7,221
141,243
Plantronics, Inc.
1,250
24,138
Seagate Technology
5,790
121,243
United Online, Inc.†
2,160
22,810
CA, Inc.
5,150
115,875
Arris Group, Inc.*†
3,420
19,904
Accenture Ltd. — Class A†
3,250
114,302
Ciena Corp.*†
630
19,423
Harris Corp.
2,300
111,619
Ciber, Inc.*
3,530
17,297
Computer Sciences Corp.*†
2,650
108,093
Tellabs, Inc.*
3,130
17,059
Avnet, Inc.*
3,300
108,009
Silicon Storage Technology, Inc.*
5,681
14,884
Texas Instruments, Inc.†
3,700
104,599
Cognizant Technology
Mantech International Corp. —
Solutions Corp. — Class A*
460
13,262
Class A*†
2,240
101,606
Sybase, Inc.*
490
12,887
JDS Uniphase Corp.*†
7,470
100,023
Cadence Design Systems, Inc.*†
1,060
11,321
Western Digital Corp.*†
3,630
98,155
Affiliated Computer
International Business
Services, Inc. — Class A*
220
11,024
Machines Corp.
780
89,809
Juniper Networks, Inc.*†
380
9,500
EMC Corp*†
6,061
86,915
MoneyGram International, Inc.
4,834
8,991
TTM Technologies, Inc.*
7,320
82,862
Blue Coat Systems, Inc.*†
290
6,392
Amkor Technology, Inc.*†
7,571
81,010
Hewitt Associates, Inc. —
Arrow Electronics, Inc.*†
2,360
79,414
Class A*
110
4,375
Cisco Systems, Inc.*
3,230
77,811
Alliance Data Systems Corp.*
90
4,276
Multi-Fineline Electronix, Inc.*†
4,000
75,080
NAVTEQ Corp.*
40
2,720
Integral Systems, Inc.
2,550
74,536
Sohu.com, Inc.*
50
2,257
Electronic Data Systems Corp.
4,410
73,426
Total Information Technology
5,018,561
Sigma Designs, Inc.*†
3,180
72,091
INDUSTRIALS 12.0%
SPSS, Inc.*
1,840
71,355
General Electric Co.
9,120
337,531
Synopsys, Inc.*†
3,040
69,038
Caterpillar, Inc.†
1,660
129,961
Cabot Microelectronics Corp.*†
2,140
68,801
Parker Hannifin Corp.†
1,850
128,150
Oplink Communications, Inc.*
7,740
68,654
Lockheed Martin Corp.†
1,280
127,104
Brocade Communications
Northrop Grumman Corp.
1,520
118,271
Systems, Inc.*
9,141
66,729
Cooper Industries Ltd. —
JDA Software Group, Inc.*
3,590
65,517
Class A†
2,910
116,837
MasterCard, Inc.†
290
64,667
Illinois Tool Works, Inc.†
2,420
116,717
MEMC Electronic Materials, Inc.*
870
61,683
Genco Shipping & Trading Ltd.†
1,980
111,731
Methode Electronics, Inc. —
Honeywell International, Inc.
1,970
111,147
Class A
5,240
61,256
Acuity Brands, Inc.†
2,570
110,382
National Instruments Corp.
2,300
60,122
Union Pacific Corp.
860
107,827
Entegris, Inc.*
7,811
56,161
Belden, Inc.†
3,005
106,137
CommScope, Inc.*†
1,610
56,076
Fluor Corp.†
720
101,635
eBay, Inc.*
1,790
53,414
Brink’s Co.
1,480
99,426
MPS Group, Inc.*†
4,470
52,835
General Dynamics Corp.
1,190
99,210
ADC Telecommunications, Inc.*†
4,260
51,461
Kennametal, Inc.
3,370
99,179
Nvidia Corp.*
2,580
51,058
Oshkosh Truck Corp.
2,700
97,956
Vignette Corp.*†
3,850
50,858
Norfolk Southern Corp.
1,780
96,690
Mattson Technology, Inc.*†
7,541
45,925
Carlisle Cos., Inc.
2,830
94,635
Lam Research Corp.*
1,150
43,953
Dover Corp.†
2,260
94,423
Zoran Corp.*†
3,190
43,575
Esterline Technologies Corp.*†
1,580
79,585
Akamai Technologies, Inc.*
1,510
42,522
Tyco International Ltd.
1,750
77,088
Quality Systems, Inc.†
1,400
41,818
AGCO Corp.*†
1,260
75,449
Xerox Corp.
2,780
41,617
Regal-Beloit Corp.†
2,000
73,260
Immersion Corp.*
5,590
39,745
United Stationers, Inc.*†
1,520
72,504
Imergent, Inc.†
3,210
36,562
UAL Corp.†
3,250
69,973
InfoSpace, Inc.
2,960
34,247
CDI Corp.†
2,760
69,138
PC Connection, Inc.*
4,159
32,939
See Notes to Financial Statements.
THE RYDEX SERIES FUNDS ANNUAL REPORT
|
31
SCHEDULE OF INVESTMENTS (continued)
March 31, 2008
MULTI-CAP CORE EQUITY FUND
MARKET
MARKET
VALUE
VALUE
SHARES
(NOTE 1)
SHARES
(NOTE 1)
Cummins, Inc.
1,420
$
66,484
Owens & Minor, Inc.
2,390
$
94,023
Manitowoc Co., Inc.†
1,620
66,096
UnitedHealth Group, Inc.
2,630
90,367
L-3 Communications
Genentech, Inc.*†
1,110
90,110
Holdings, Inc.
580
63,417
PharmaNet
Mueller Industries, Inc.
2,030
58,566
Development Group, Inc.*†
3,520
88,810
Spherion Corp.*
9,550
58,446
Genzyme Corp.*
1,180
87,957
URS Corp.*†
1,650
53,939
Medicis Pharmaceutical Corp. —
Horizon Lines, Inc. — Class A†
2,830
52,666
Class A†
4,330
85,258
On Assignment, Inc.*
7,811
49,600
OSI Pharmaceuticals, Inc.*†
2,080
77,771
Herman Miller, Inc.†
1,960
48,157
Cynosure, Inc.*†
3,520
74,976
EMCOR Group, Inc.*
2,140
47,529
Coventry Health Care, Inc.*†
1,840
74,244
Manpower, Inc.
840
47,258
Analogic Corp.
1,080
71,863
TBS International Ltd. —
Warner Chilcott Ltd.*
3,910
70,380
Class A*
1,560
47,112
DENTSPLY International, Inc.
1,795
69,287
Trinity Industries, Inc.†
1,700
45,305
PerkinElmer, Inc.
2,780
67,415
Michael Baker Corp.*
1,540
34,588
Schering-Plough Corp.
4,430
63,836
RR Donnelley & Sons Co.
950
28,795
C.R. Bard, Inc.†
660
63,624
Applied Industrial
Intuitive Surgical, Inc.*
190
61,626
Technologies, Inc.
870
26,004
Amedisys, Inc.*
1,520
59,797
Boeing Co.
330
24,542
Lincare Holdings, Inc.*†
2,040
57,344
Bucyrus International, Inc. —
Sun Healthcare Group, Inc.*†
4,270
56,108
Class A
180
18,297
AMERIGROUP Corp.*
2,050
56,026
United Technologies Corp.
255
17,549
Viropharma, Inc.*
6,031
53,917
CH Robinson Worldwide, Inc.†
320
17,408
Merck & Co., Inc.
1,340
50,853
Valmont Industries, Inc.
180
15,820
Cubist Pharmaceuticals, Inc.*†
2,730
50,287
Tecumseh Products Co. —
Res-Care, Inc.*
2,850
48,877
Class A*
490
15,033
Biogen Idec, Inc.*
790
48,735
First Solar, Inc.*
60
13,868
Cantel Medical Corp.*
4,190
44,498
Superior Essex, Inc.*
490
13,779
Sepracor, Inc.*†
2,260
44,115
Shaw Group, Inc.*
270
12,728
King Pharmaceuticals, Inc.*†
5,020
43,674
Allied Waste Industries, Inc.*
1,110
11,999
Eli Lilly & Co.
790
40,756
Waste Management, Inc.
190
6,376
Medco Health Solutions, Inc.*†
910
39,849
Gibraltar Industries, Inc.
514
6,029
Express Scripts, Inc.*
540
34,733
FedEx Corp.†
60
5,560
Providence Service Corp.*
1,120
33,600
Sunpower Corp.*†
60
4,471
Celgene Corp.*†
430
26,355
Robert Half International, Inc.
155
3,990
Conmed Corp.*
1,010
25,896
Eagle Bulk Shipping, Inc.†
20
515
WellCare Health Plans, Inc.*
640
24,928
Total Industrials
3,903,872
Henry Schein, Inc.*†
360
20,664
HEALTH CARE 11.4%
WellPoint, Inc.*
450
19,858
Johnson & Johnson, Inc.
4,640
300,997
Covance, Inc.*
230
19,083
Thermo Fisher Scientific, Inc.*
2,120
120,501
Invitrogen Corp.*†
200
17,094
Hologic, Inc.*
2,160
120,096
Allergan, Inc.†
290
16,353
Aetna, Inc.†
2,680
112,801
Healthways, Inc.*
400
14,136
Becton, Dickinson & Co.
1,280
109,888
Emergent Biosolutions, Inc.*
1,480
13,202
Pfizer, Inc.
5,160
107,999
Phase Forward, Inc.*†
670
11,444
Charles River Laboratories
Kendle International, Inc.*†
220
9,882
International, Inc.*†
1,790
105,503
Abbott Laboratories
110
6,066
Endo Pharmaceuticals
Medtronic, Inc.
80
3,870
Holdings, Inc.*
4,230
101,266
Meridian Bioscience, Inc.†
60
2,006
Millennium
Myriad Genetics, Inc.*†
20
806
Pharmaceuticals, Inc.*
6,360
98,326
Total Health Care
3,692,299
Martek Biosciences Corp.*†
3,190
97,518
ENERGY 10.8%
Sciele Pharma, Inc.*†
4,960
96,720
Exxon Mobil Corp.
7,410
626,738
Perrigo Co.†
2,500
94,325
Chevron Corp.
2,980
254,373
32
|
THE RYDEX SERIES FUNDS ANNUAL REPORT
See Notes to Financial Statements.
SCHEDULE OF INVESTMENTS (continued)
March 31, 2008
MULTI-CAP CORE EQUITY FUND
MARKET
MARKET
VALUE
VALUE
SHARES
(NOTE 1)
SHARES
(NOTE 1)
Williams Cos., Inc.
4,460
$
147,091
Starwood Hotels &
Apache Corp.
1,180
142,568
Resorts Worldwide, Inc.
1,590
$
82,283
Murphy Oil Corp.†
1,700
139,638
Genuine Parts Co.
1,960
78,831
Noble Corp.†
2,640
131,129
Darden Restaurants, Inc.
2,200
71,610
Clayton Williams Energy, Inc.*†
2,270
119,152
Whirlpool Corp.†
800
69,424
ENSCO International, Inc.†
1,870
117,099
Scholastic Corp.*†
2,230
67,502
Transocean, Inc.*†
820
110,864
News Corp. — Class A†
3,420
64,125
ConocoPhillips
1,430
108,980
FTD Group, Inc.
4,750
63,745
Pride International, Inc.*†
3,100
108,345
Service
Cimarex Energy Co.†
1,970
107,838
Corporation International†
5,590
56,683
Swift Energy Co.*†
2,340
105,277
Perry Ellis International, Inc.*†
2,360
51,519
Crosstex Energy, Inc.†
3,080
104,566
Amazon.com, Inc.*†
714
50,908
W&T Offshore, Inc.†
2,820
96,190
TJX Cos., Inc.†
1,520
50,267
SEACOR Holdings, Inc.*
1,120
95,603
P.F. Chang’s China Bistro, Inc.*†
1,710
48,632
Superior Energy Services*†
2,390
94,692
Hooker Furniture Corp.
2,070
46,244
Whiting Petroleum Corp.*†
1,430
92,449
DSW, Inc.*†
2,960
38,332
Rowan Cos., Inc.†
2,010
82,772
Dress Barn, Inc.*†
2,960
38,302
Bois d’Arc Energy, Inc.*†
3,120
67,049
Garmin Ltd.†
670
36,187
National-Oilwell Varco, Inc.*
1,120
65,386
Liberty Global, Inc. — Class A*†
1,030
35,102
Tesoro Corp.†
2,070
62,100
La-Z-Boy, Inc.†
4,180
34,861
Southwestern Energy Co.*
1,720
57,947
Polaris Industries, Inc.†
840
34,448
Union Drilling, Inc.*
3,230
56,493
Zale Corp.*†
1,670
32,999
Valero Energy Corp.
1,150
56,476
McDonald’s Corp.
580
32,347
Schlumberger Ltd.
610
53,070
Sotheby’s†
1,100
31,801
World Fuel Services Corp.
1,880
52,772
Las Vegas Sands Corp.*†
430
31,665
Chesapeake Energy Corp.†
990
45,688
West Marine, Inc.*†
4,330
30,180
FMC Technologies, Inc.*†
770
43,805
Toll Brothers, Inc.*
1,270
29,820
Sunoco, Inc.†
740
38,828
Panera Bread Co. — Class A*
700
29,323
Massey Energy Co.†
1,060
38,690
World Wrestling
Holly Corp.†
740
32,123
Entertainment, Inc.
1,570
29,218
Marathon Oil Corp.
500
22,800
Priceline.com, Inc.*†
240
29,006
Diamond Offshore Drilling, Inc.†
110
12,804
MarineMax, Inc.*†
2,192
27,312
Frontier Oil Corp.†
320
8,723
Red Robin
USEC, Inc.*†
1,720
6,364
Gourmet Burgers, Inc.*†
720
27,050
Atwood Oceanics, Inc.*†
20
1,834
Snap-On, Inc.
460
23,391
Total Energy
3,508,316
Bally Technologies, Inc.*†
660
22,664
CONSUMER DISCRETIONARY 10.4%
Apollo Group, Inc. — Class A*†
520
22,464
Walt Disney Co.†
4,300
134,934
Systemax, Inc.†
1,780
21,467
Carnival Corp.†
2,860
115,773
Penske Auto Group, Inc.
1,070
20,822
Time Warner, Inc.
8,151
114,277
Big Lots, Inc.*
890
19,847
Comcast Corp. — Class A
5,770
111,592
Phillips-Van Heusen Corp.
520
19,718
Best Buy Co., Inc.
2,580
106,967
DeVry, Inc.†
430
17,991
BorgWarner, Inc.
2,450
105,424
Ryland Group, Inc.†
540
17,761
Rent-A-Center, Inc.*†
5,661
103,879
Deckers Outdoor Corp.*
160
17,251
Johnson Controls, Inc.†
3,020
102,076
Standard Motor Products, Inc.†
2,730
16,708
Hanesbrands, Inc.*†
3,490
101,908
G-III Apparel Group Ltd.*
1,010
13,554
VF Corp.†
1,300
100,763
GameStop Corp. — Class A*†
240
12,410
Nike, Inc. — Class B†
1,450
98,600
Clear Channel
Royal Caribbean Cruises Ltd.†
2,860
94,094
Communications, Inc.
380
11,104
Hasbro, Inc.†
3,280
91,512
Cablevision Systems Corp. —
Cooper Tire & Rubber Co.
5,910
88,473
Class A*†
510
10,929
DIRECTV Group, Inc.*
3,560
88,253
Lowe’s Cos., Inc.†
360
8,258
Urban Outfitters, Inc.*
2,640
82,764
MGM MIRAGE*†
110
6,465
General Motors Corp.†
4,320
82,296
OfficeMax, Inc.†
270
5,168
See Notes to Financial Statements.
THE RYDEX SERIES FUNDS ANNUAL REPORT
|
33
SCHEDULE OF INVESTMENTS (continued)
March 31, 2008
MULTI-CAP CORE EQUITY FUND
MARKET
MARKET
VALUE
VALUE
SHARES
(NOTE 1)
SHARES
(NOTE 1)
Bluegreen Corp.*
720
$
4,824
Olympic Steel, Inc.
1,110
$
50,061
CKX, Inc.*
140
1,333
Terra Industries, Inc.*†
1,180
41,925
Total Consumer Discretionary
3,367,440
Southern Copper Corp.
250
25,958
CONSUMER STAPLES 5.8%
Mercer International, Inc.*
3,020
21,049
Procter & Gamble Co.
2,620
183,583
Cleveland-Cliffs, Inc.
150
17,973
CVS Caremark Corp.
3,940
159,609
Ferro Corp.
650
9,659
Bunge Ltd.†
1,300
112,944
Myers Industries, Inc.
100
1,313
Universal Corp.
1,590
104,193
Total Materials
1,390,372
Performance Food Group Co.*†
3,100
101,308
UTILITIES 3.7%
Coca-Cola Co.
1,590
96,783
Public Service
Farmer Brothers Co.
4,130
95,568
Enterprise Group, Inc.
2,571
103,300
Vector Group Ltd.†
5,310
93,403
Pepco Holdings, Inc.†
4,140
102,341
Casey’s General Stores, Inc.†
4,050
91,530
Integrys Energy Group, Inc.†
2,190
102,142
Kroger Co.
3,250
82,550
Oneok, Inc.
2,260
100,864
PepsiCo, Inc.
1,040
75,088
OGE Energy Corp.†
3,190
99,432
Wal-Mart Stores, Inc.
1,350
71,118
Laclede Group, Inc.
2,690
95,845
Corn Products International, Inc.
1,910
70,937
UIL Holding Corp.
3,180
95,813
Winn-Dixie Stores, Inc.*†
3,930
70,583
Great Plains Energy, Inc.
3,840
94,656
Reynolds American, Inc.†
1,130
66,704
Consolidated Edison, Inc.†
2,080
82,576
Pilgrim’s Pride Corp.†
2,920
59,072
Duke Energy Corp.†
4,540
81,039
Philip Morris International, Inc.*
1,120
56,650
Cleco Corp.†
2,740
60,773
PepsiAmericas, Inc.†
2,120
54,124
Exelon Corp.
560
45,511
Molson Coors Brewing Co. —
Alliant Energy Corp.
1,280
44,813
Class B†
840
44,159
Atmos Energy Corp.
1,600
40,800
Pantry, Inc.*
1,600
33,728
New Jersey Resources Corp.
1,170
36,328
Central Garden and Pet Co. —
Reliant Energy, Inc.*
340
8,041
Class A*†
6,751
29,974
Energy East Corp.
200
4,824
Altria Group, Inc.
1,120
24,864
Total Utilities
1,199,098
Fresh Del Monte Produce, Inc.*†
680
24,752
TELECOMMUNICATION SERVICES 3.0%
Village Super Market
410
21,115
AT&T, Inc.
9,420
360,786
Pepsi Bottling Group, Inc.†
580
19,668
American Tower Corp. —
Colgate-Palmolive Co.
200
15,582
Class A*
3,430
134,490
Loews Corp. - Carolina Group
150
10,882
Premiere Global Services, Inc.*†
5,380
77,149
Spartan Stores, Inc.
370
7,715
Atlantic Tele-Network, Inc.
2,040
69,013
Tyson Foods, Inc. — Class A
480
7,656
Verizon Communications, Inc.
1,890
68,891
Church & Dwight Co., Inc.†
30
1,627
CenturyTel, Inc.†
2,030
67,477
Total Consumer Staples
1,887,469
Syniverse Holdings, Inc.*
3,430
57,144
MATERIALS 4.3%
U.S. Cellular Corp.*
820
45,100
Freeport-McMoRan Copper &
Shenandoah
Gold, Inc.†
1,440
138,557
Telecommunications Co.
2,950
43,778
Dow Chemical Co.†
3,520
129,712
NII Holdings, Inc. — Class B*†
1,300
41,314
Greif, Inc. — Class A†
1,660
112,764
Sprint Nextel Corp.†
3,260
21,810
Airgas, Inc.
2,190
99,579
Total Telecommunication Services
986,952
Lubrizol Corp.
1,750
97,142
Total Common Stocks
Stepan Co.
2,450
93,663
(Cost $30,473,727)
30,189,856
Kaiser Aluminum Corp.
1,150
79,695
CF Industries Holdings, Inc.†
750
77,715
FACE
Monsanto Co.†
640
71,360
AMOUNT
Cytec Industries, Inc.†
1,310
70,544
Rock-Tenn Co. — Class A†
2,230
66,833
REPURCHASE AGREEMENTS 6.5%
Sonoco Products Co.
2,320
66,422
Repurchase Agreements (Note 5)
Buckeye Technologies, Inc.*†
5,741
64,070
Mizuho Financial Group, Inc.
The Mosaic Co.*
530
54,378
issued 03/31/08 at 1.30%
due 04/01/08
$1,211,644
1,211,644
34
|
THE RYDEX SERIES FUNDS ANNUAL REPORT
See Notes to Financial Statements.
SCHEDULE OF INVESTMENTS (concluded)
March 31, 2008
MULTI-CAP CORE EQUITY FUND
MARKET
FACE
VALUE
AMOUNT
(NOTE 1)
Lehman Brothers Holdings, Inc.
issued 03/31/08 at 1.15%
due 04/01/08
$
644,482
$
644,482
Morgan Stanley issued 03/31/08
at 1.35% due 04/01/08
252,426
252,426
Total Repurchase Agreements
(Cost $2,108,552)
2,108,552
SHARES
SECURITIES LENDING COLLATERAL 28.2%
Mount Vernon Securities Lending
Trust Prime Portfolio (Note 9)
9,136,749
9,136,749
Total Securities Lending Collateral
(Cost $9,136,749)
9,136,749
Total Investments 127.7%
(Cost $41,719,028)
$41,435,157
Liabilities in Excess of
Other Assets – (27.7)%
$ (8,976,313)
Net Assets – 100.0%
$32,458,844
UNREALIZED
GAIN (LOSS)
CONTRACTS
(NOTE 1)
FUTURES CONTRACTS PURCHASED
June 2008 Russell 2000 Index
Mini Futures Contracts
(Aggregate Market Value
of Contracts $825,000)
12
$
14,526
June 2008 S&P 500 Index
Mini Futures Contracts
(Aggregate Market Value
of Contracts $1,322,250)
20
(28,906)
(Total Aggregate Market Value
of Contracts $2,147,250)
$
(14,380)
*
Non-Income Producing Security.
†
All or a portion of this security is on loan at March 31, 2008 — See Note 9.
See Notes to Financial Statements.
THE RYDEX SERIES FUNDS ANNUAL REPORT
|
35
SCHEDULE OF INVESTMENTS
March 31, 2008
SECTOR ROTATION FUND
MARKET
MARKET
VALUE
VALUE
SHARES
(NOTE 1)
SHARES
(NOTE 1)
COMMON STOCKS 92.1%
Monsanto Co.†
49,600
$
5,530,400
BHP Billiton Ltd. — SP ADR†
80,322
5,289,204
INDUSTRIALS 26.1%
ArcelorMittal†
63,300
5,177,940
ABB Ltd. — SP ADR†
254,400
$
6,848,448
Potash Corporation of
Emerson Electric Co.
107,355
5,524,488
Saskatchewan
32,800
5,090,888
Fluor Corp.†
37,100
5,237,036
Anglo American PLC —
First Solar, Inc.*†
20,600
4,761,484
SP ADR†
127,699
3,801,599
Jacobs
E.I. du Pont de
Engineering Group, Inc.*†
59,100
4,349,169
Nemours and Co.†
74,600
3,488,296
Foster Wheeler Ltd.*
71,600
4,053,992
Barrick Gold Corp.†
70,000
3,041,500
Burlington Northern
Dow Chemical Co.†
79,700
2,936,945
Santa Fe Corp.
39,000
3,596,580
Praxair, Inc.
34,400
2,897,512
Union Pacific Corp.
28,400
3,560,792
POSCO — SP ADR
23,500
2,796,030
CSX Corp.†
58,100
3,257,667
Southern Copper Corp.†
26,000
2,699,580
Quanta Services, Inc.*†
132,569
3,071,624
Goldcorp, Inc.†
67,100
2,600,125
KBR, Inc.
106,599
2,955,990
Air Products & Chemicals, Inc.
26,800
2,465,600
Canadian National Railway Co.†
60,700
2,933,024
Alcoa, Inc.
64,400
2,322,264
Shaw Group, Inc.*
60,500
2,851,970
Agrium, Inc.†
30,800
1,912,988
Norfolk Southern Corp.
52,400
2,846,368
Nucor Corp.†
27,200
1,842,528
Woodward Governor Co.
94,400
2,522,368
Teck Cominco Ltd. - Class B†
44,316
1,815,183
Chicago Bridge & Iron, Co. NV†
63,900
2,507,436
Newmont Mining Corp.†
39,900
1,807,470
URS Corp.*†
65,050
2,126,484
Ecolab, Inc.†
40,700
1,767,601
Suntech Power Holdings
Sigma-Aldrich Corp.†
28,200
1,682,130
Co. Ltd. — SP ADR*†
52,300
2,121,288
Celanese Corp.
40,700
1,589,335
Roper Industries, Inc.†
31,800
1,890,192
PPG Industries, Inc.
24,600
1,488,546
AMETEK, Inc.
42,800
1,879,348
Huntsman Corp.
50,700
1,193,985
Sunpower Corp.*†
24,700
1,840,397
Eastman Chemical Co.†
18,700
1,167,815
Brady Corp. — Class A†
40,300
1,347,229
Freeport-McMoRan Copper &
J.B. Hunt
Gold, Inc.†
11,835
1,138,764
Transport Services, Inc.†
40,100
1,260,343
Total Materials
84,813,501
EMCOR Group, Inc.*
56,400
1,252,644
ENERGY 18.4%
GrafTech International Ltd.*†
76,400
1,238,444
Transocean, Inc.*†
37,681
5,094,471
Ryder System, Inc.†
19,500
1,187,745
Exxon Mobil Corp.
60,100
5,083,258
Hertz Global Holdings, Inc.*†
93,700
1,130,022
Halliburton Co.†
93,000
3,657,690
Kansas City Southern*†
28,000
1,123,080
BP PLC — SP ADR†
53,300
3,232,645
Landstar System, Inc.†
21,000
1,095,360
Weatherford International Ltd.*
43,800
3,174,186
Hubbell, Inc. — Class B†
25,000
1,092,250
Chevron Corp.
37,100
3,166,856
Perini Corp.*†
29,098
1,054,221
Tenaris SA — SP ADR†
55,300
2,756,705
Energy Conversion
ConocoPhillips
33,700
2,568,277
Devices, Inc.*†
34,200
1,022,580
National-Oilwell Varco, Inc.*†
43,200
2,522,016
Con-way, Inc.†
19,100
945,068
Diamond Offshore Drilling, Inc.†
21,400
2,490,960
Belden, Inc.†
23,300
822,956
Baker Hughes, Inc.†
36,300
2,486,550
Regal-Beloit Corp.†
21,300
780,219
Royal Dutch Shell PLC —
American
SP ADR
36,000
2,483,280
Superconductor Corp.*†
33,500
776,865
Noble Corp.†
44,700
2,220,249
Knight Transportation, Inc.†
44,600
734,116
Smith International, Inc.
32,100
2,061,783
Heartland Express, Inc.
49,200
701,592
ENSCO International, Inc.†
31,500
1,972,530
Werner Enterprises, Inc.†
37,500
696,000
Occidental Petroleum Corp.
25,500
1,865,835
Avis Budget Group, Inc.*†
58,000
615,960
Devon Energy Corp.
17,300
1,804,909
Total Industrials
89,612,839
BJ Services Co.†
63,100
1,798,981
MATERIALS 24.7%
Cameron International Corp.*†
42,000
1,748,880
The Mosaic Co.*
57,251
5,873,953
Apache Corp.
13,700
1,655,234
Companhia Vale do Rio Doce —
EOG Resources, Inc.†
13,000
1,560,000
SP ADR†
164,894
5,711,928
XTO Energy, Inc.
23,500
1,453,710
Rio Tinto PLC — SP ADR†
13,800
5,683,392
36
|
THE RYDEX SERIES FUNDS ANNUAL REPORT
See Notes to Financial Statements.
SCHEDULE OF INVESTMENTS (concluded)
March 31, 2008
SECTOR ROTATION FUND
MARKET
MARKET
VALUE
VALUE
SHARES
(NOTE 1)
SHARES
(NOTE 1)
Canadian Natural
CONSUMER STAPLES 7.2%
Resources Ltd.†
21,000
$
1,433,460
Wal-Mart Stores, Inc.
120,100
$
6,326,868
Anadarko Petroleum Corp.
21,100
1,329,933
CVS Caremark Corp.
81,400
3,297,514
Hess Corp.†
14,400
1,269,792
Walgreen Co.
70,700
2,692,963
Marathon Oil Corp.
26,900
1,226,640
Costco Wholesale Corp.†
34,800
2,260,956
Valero Energy Corp.
22,900
1,124,619
Sysco Corp.†
60,600
1,758,612
Total Energy
63,243,449
Kroger Co.
68,200
1,732,280
TELECOMMUNICATION SERVICES 7.9%
Safeway, Inc.†
50,600
1,485,110
China Mobile Ltd. — SP ADR†
96,800
7,260,968
SUPERVALU, INC.†
36,200
1,085,276
Vodafone Group PLC —
Whole Foods Market, Inc.†
24,700
814,359
SP ADR
139,000
4,101,890
Rite Aid Corp.*†
231,800
681,492
America Movil SAB de CV —
BJ’s Wholesale Club, Inc.*†
18,800
670,972
SP ADR
62,600
3,986,994
Ruddick Corp.†
15,800
582,388
Vimpel-Communications —
Longs Drug Stores Corp.†
11,900
505,274
SP ADR
81,200
2,427,068
Great Atlantic & Pacific
Mobile Telesystems — SP ADR
30,000
2,275,500
Tea Company, Inc*†
18,600
487,692
Rogers Communications, Inc. —
Casey’s General Stores, Inc.†
18,800
424,880
Class B†
44,100
1,584,072
Total Consumer Staples
24,806,636
Turkcell Iletisim Hizmet AS, Inc. —
Total Common Stocks
SP ADR
72,600
1,516,614
(Cost $292,596,141)
316,032,422
American Tower Corp. —
Class A*
31,900
1,250,799
FACE
Philippine Long Distance
AMOUNT
Telephone Co. — SP ADR†
17,700
1,176,342
REPURCHASE AGREEMENTS 7.9%
Crown Castle
Repurchase Agreements (Note 5)
International Corp.*†
22,600
779,474
Mizuho Financial Group, Inc.
U.S. Cellular Corp.*†
11,642
640,310
issued 03/31/08 at 1.30%
Total Telecommunication Services
27,000,031
due 04/01/08
$15,673,202
15,673,202
HEALTH CARE 7.8%
Lehman Brothers Holdings, Inc.
Thermo Fisher Scientific, Inc.*
82,500
4,689,300
issued 03/31/08 at 1.15%
Applera Corp. - Applied
due 04/01/08
8,336,691
8,336,691
Biosystems Group†
67,200
2,208,192
Morgan Stanley
Covance, Inc.*†
24,500
2,032,765
issued 03/31/08 at 1.35%
Illumina, Inc.*†
26,700
2,026,530
due 04/01/08
3,265,251
3,265,251
Pharmaceutical Product
Total Repurchase Agreements
Development, Inc.
46,400
1,944,160
(Cost $27,275,144)
27,275,144
Waters Corp.*†
33,900
1,888,230
Invitrogen Corp.*†
20,900
1,786,323
Millipore Corp.*†
26,400
1,779,624
SHARES
Charles River Laboratories
SECURITIES LENDING COLLATERAL 31.6%
International, Inc.*†
29,900
1,762,306
Mount Vernon Securities
PerkinElmer, Inc.
64,000
1,552,000
Lending Trust Prime Portfolio
Techne Corp.*†
23,000
1,549,280
(Note 9)
108,278,629
108,278,629
Bio-Rad Laboratories, Inc. —
Class A*
14,200
1,263,090
Total Securities Lending Collateral
Varian, Inc.*†
20,000
1,158,400
(Cost $108,278,629)
108,278,629
Affymetrix, Inc.*†
52,600
915,766
Total Investments 131.6%
Total Health Care
26,555,966
(Cost $428,149,914)
$ 451,586,195
Liabilities in Excess of
Other Assets – (31.6)%
$(108,353,917)
Net Assets – 100.0%
$ 343,232,278
*
Non-Income Producing Security.
†
All or a portion of this security is on loan at March 31, 2008 — See Note 9.
ADR—American Depository Receipt.
See Notes to Financial Statements.
THE RYDEX SERIES FUNDS ANNUAL REPORT
|
37
SCHEDULE OF INVESTMENTS
March 31, 2008
ABSOLUTE RETURN STRATEGIES FUND
MARKET
MARKET
VALUE
VALUE
SHARES
(NOTE 1)
SHARES
(NOTE 1)
COMMON STOCKS 57.1%
Taubman Centers, Inc.†
3,149
$
164,063
Allianz AG — SP ADR
8,028
157,830
FINANCIALS 11.5%
Banco Bilbao Vizcaya
First Charter Corp.†D
42,135
$
1,125,425
Argentaria SA — SP ADR†
7,043
154,876
Sterling Financial Corp.*
62,590
1,092,195
Lloyds TSB Group PLC —
American Financial Realty Trust†
136,968
1,087,526
SP ADR†
4,265
153,114
Alfa Corp.
48,320
1,062,074
ING Groep NV — SP ADR†
3,993
149,218
GMH Communities TrustD
122,191
1,060,618
Credit Suisse Group — SP ADR†
2,785
141,701
Commerce Group, Inc.†D
29,322
1,057,351
Jones Lang LaSalle, Inc.†
1,690
130,705
Goldman Sachs Group, Inc.†D
6,007
993,498
Apartment Investment &
Nymex Holdings, Inc.†
10,734
972,822
Management Co. — Class A
3,269
117,063
Post Properties, Inc.†
24,805
957,969
AXA — SP ADR†
3,199
115,516
Alleghany Corp.*†
2,718
928,299
T. Rowe Price Group, Inc.†
2,022
101,100
Travelers Cos, Inc.D
19,172
917,380
Northern Trust Corp.†
806
53,575
Plum Creek
Discover Financial Services†
2,224
36,407
Timber Co., Inc. (REIT)D
21,094
858,526
IntercontinentalExchange, Inc.*†
180
23,490
Countrywide Financial Corp.†
154,419
849,304
Lehman Brothers Holdings, Inc.†
512
19,272
Allied World Assurance
CIT Group, Inc.†
524
6,209
Company Holdings Ltd†D
19,928
791,142
Total Financials
27,496,099
Aon Corp.D
19,606
788,161
CONSUMER DISCRETIONARY 8.5%
Toronto-Dominion Bank
11,841
726,455
Cumulus Media, Inc. —
SCPIE Holdings, Inc.*
25,559
704,150
Class A*†D
180,538
1,151,832
Loews Corp.D
15,813
635,999
Restoration Hardware, Inc.*†
256,904
1,114,963
Charles Schwab Corp.D
29,654
558,385
Clear Channel
Allstate Corp.D
10,784
518,279
Communications, Inc.
36,645
1,070,767
Ameriprise Financial, Inc.D
9,648
500,249
Getty Images, Inc.*D
32,590
1,042,880
Transatlantic Holdings, Inc.D
7,454
494,573
Circuit City Stores, Inc.
260,797
1,037,972
Blackrock, Inc.D
2,414
492,891
Bright Horizons
Federated Investors, Inc. —
Family Solutions, Inc.*†D
24,013
1,033,520
Class BD
12,583
492,750
CSK Auto Corp.*†D
110,118
1,025,199
Hartford Financial
Riviera Holdings Corp.*
49,333
1,016,753
Services Group, Inc.
6,417
486,216
CKX, Inc.*
104,260
992,555
Marsh & McLennan Cos., Inc.D
19,464
473,948
Penn National Gaming, Inc.*
21,848
955,413
Chubb Corp.
9,284
459,372
XM Satellite
JPMorgan Chase & Co.D
10,634
456,730
Radio Holdings, Inc.*†
81,451
946,461
ACE Ltd.D
8,168
449,730
Landry’s Restaurants, Inc.†
51,820
843,630
AFLAC, Inc.†
6,721
436,529
Time Warner, Inc.D
58,314
817,562
HSBC Holdings PLC — SP ADR†
5,029
413,887
McDonald’s Corp.D
14,345
800,021
Unum Group†
17,031
374,852
Service Corporation
Prudential Financial, Inc.
3,943
308,540
InternationalD
67,950
689,013
Genworth Financial, Inc. —
DIRECTV Group, Inc.*D
21,164
524,656
Class A
12,885
291,716
Home Depot, Inc.†
15,763
440,891
ProLogis†
4,657
274,111
Carnival Corp.†
8,458
342,380
Annaly Capital
Walt Disney Co.†
10,290
322,900
Management, Inc.†
17,422
266,905
GameStop Corp. — Class A*†
5,753
297,488
Banco Santander Central
Comcast Corp. — Class A
14,375
278,012
Hispano SA — SP ADR†
13,219
263,587
Burger King Holdings, Inc.
9,324
257,902
W.R. Berkley Corp.
8,872
245,666
CTC Media, Inc.*
8,006
222,166
Fidelity National Financial, Inc. —
Expedia, Inc.*†
9,456
206,992
Class A†
11,900
218,127
BorgWarner, Inc.
4,679
201,337
Janus Capital Group, Inc.†
7,966
185,369
Hasbro, Inc.†
6,921
193,096
Protective Life Corp.
4,435
179,884
Discovery Holding Co. —
American Financial Group, Inc.†
6,943
177,463
Class A*†
8,902
188,900
Deutsche Bank AG— SP ADR†
1,548
175,001
Daimler AG — SP ADR†
2,112
180,682
Host Hotels & Resorts, Inc.†
10,572
168,306
38
|
THE RYDEX SERIES FUNDS ANNUAL REPORT
See Notes to Financial Statements.
SCHEDULE OF INVESTMENTS (continued)
March 31, 2008
ABSOLUTE RETURN STRATEGIES FUND
MARKET
MARKET
VALUE
VALUE
SHARES
(NOTE 1)
SHARES
(NOTE 1)
Whirlpool Corp.†
1,942
$
168,527
Terex Corp.*
2,987
$
186,688
Big Lots, Inc.*†
6,329
141,137
DRS Technologies, Inc.†
3,179
185,272
Kohl’s Corp.*†
3,169
135,918
Timken Co.†
5,553
165,035
Amazon.com, Inc.*†
1,832
130,622
Siemens AG — SP ADR†
1,448
157,745
Mohawk Industries, Inc.*†
1,810
129,614
GATX Corp.†
3,733
145,848
Nike, Inc. — Class B†
1,810
123,080
Con-way, Inc.†
2,585
127,906
Wynn Resorts Ltd.†
1,108
111,509
Quanta Services, Inc.*†
5,311
123,056
Mattel, Inc.
5,341
106,286
Shaw Group, Inc.*
2,515
118,557
Ross Stores, Inc.
3,069
91,947
UAL Corp.†
5,413
116,542
Guess?, Inc.†
2,224
90,005
BE Aerospace, Inc.*
3,119
109,009
Brunswick Corp.†
4,727
75,490
SPX Corp.
1,038
108,886
Virgin Media, Inc.†
5,301
74,585
Foster Wheeler Ltd.*
1,912
108,257
American Eagle Outfitters, Inc.†
4,175
73,104
Granite Construction, Inc.†
3,309
108,237
M.D.C. Holdings, Inc.†
1,558
68,225
ABB Ltd. — SP ADR†
3,571
96,131
Goodyear Tire & Rubber Co.*
2,364
60,991
Oshkosh Truck Corp.
2,344
85,040
Johnson Controls, Inc.†
1,740
58,812
Emerson Electric Co.
1,508
77,602
TRW Automotive
Koninklijke Philips
Holdings Corp.*†
2,495
58,308
Electronics NV— SP ADR
1,992
76,373
Dillard’s, Inc. — Class A†
3,339
57,464
KBR, Inc.
2,747
76,174
ITT Educational Services, Inc.*
1,078
49,513
McDermott International, Inc.*
1,328
72,801
Garmin Ltd.†
734
39,643
First Solar, Inc.*
282
65,182
Luxottica Group — SP ADR
1,490
37,488
Copa Holdings SA
1,076
41,006
Liz Claiborne, Inc.†
1,318
23,922
Woodward Governor Co.
1,328
35,484
AutoZone, Inc.*
190
21,628
Chicago Bridge & Iron, Co. NV†
896
35,159
Office Depot, Inc.*
1,390
15,360
Sunpower Corp.*†
442
32,933
Liberty Global, Inc. — Class A*†
414
14,109
Ryanair Holdings PLC —
CROCS, Inc.*†
452
7,896
SP ADR*†
1,108
31,334
Total Consumer Discretionary
20,161,126
URS Corp.*†
914
29,879
INDUSTRIALS 6.6%
Suntech Power Holdings
Trane, Inc.D
23,911
1,097,515
Co. Ltd. — SP ADR*†
734
29,771
CSX Corp.†D
19,062
1,068,806
AMETEK, Inc.
602
26,434
MTC Technologies, Inc.*†
44,270
1,052,741
Roper Industries, Inc.†
444
26,391
Quintana Maritime Ltd.
44,161
1,045,733
Union Pacific Corp.
200
25,076
Nuco2, Inc.*
37,230
1,033,877
Delta Air Lines, Inc.*
2,615
22,489
Deere & Co.D
10,482
843,172
Canadian National Railway Co.†
432
20,874
Waste Industries USA, Inc.
21,856
790,094
Brady Corp. — Class A†
564
18,855
Burlington Northern
EMCOR Group, Inc.*D
794
17,635
Santa Fe Corp.D
7,121
656,699
GrafTech International Ltd.*†
1,076
17,442
Paccar, Inc.D
12,897
580,365
Perini Corp.*†
404
14,637
Caterpillar, Inc.D
6,729
526,813
Energy Conversion
Norfolk Southern Corp.D
9,686
526,144
Devices, Inc.*†
482
14,412
Precision Castparts Corp.D
4,495
458,850
Belden, Inc.†
332
11,726
AGCO Corp.*†
7,081
424,010
Regal-Beloit Corp.†
302
11,062
Waste Management, Inc.
12,585
422,353
American
Ryder System, Inc.†
6,639
404,382
Superconductor Corp.*†
472
10,946
Flowserve Corp.D
3,743
390,694
Stericycle, Inc.*†
192
9,888
Eaton Corp.†D
4,297
342,342
J.B. Hunt Transport Services, Inc.
282
8,863
United Rentals, Inc.*
13,591
256,055
Kansas City Southern*†
200
8,022
Cummins, Inc.
4,849
227,030
Hertz Global Holdings, Inc.*†
654
7,887
Manitowoc Co., Inc.†
5,531
225,665
Landstar System, Inc.
150
7,824
Jacobs
Knight Transportation, Inc.†
312
5,136
Engineering Group, Inc.*†
2,845
209,364
Heartland Express, Inc.
342
4,877
ITT Industries, Inc.†
4,003
207,395
Werner Enterprises, Inc.†
262
4,863
Steelcase, Inc. — Class A
16,901
186,925
Total Industrials
15,818,270
See Notes to Financial Statements.
THE RYDEX SERIES FUNDS ANNUAL REPORT
|
39
SCHEDULE OF INVESTMENTS (continued)
March 31, 2008
ABSOLUTE RETURN STRATEGIES FUND
MARKET
MARKET
VALUE
VALUE
SHARES
(NOTE 1)
SHARES
(NOTE 1)
INFORMATION TECHNOLOGY 6.2%
Pfizer, Inc.D
28,406
$
594,538
ASE Test Ltd.*
73,850
$
1,074,518
Edwards Lifesciences Corp.*D
11,188
498,425
Yahoo!, Inc.*†
35,420
1,024,701
Eli Lilly & Co.
9,214
475,350
NAVTEQ Corp.*
14,445
982,260
CIGNA Corp.
11,568
469,314
Alliance Data Systems Corp.*
19,364
919,984
UnitedHealth Group, Inc.
13,609
467,605
Teradyne, Inc.*D
64,129
796,482
Aetna, Inc.†
8,830
371,655
Vishay Intertechnology, Inc.*D
72,919
660,646
LifePoint Hospitals, Inc.*†
12,213
335,491
MEMC Electronic Materials, Inc.*D
8,932
633,279
McKesson Corp.
6,145
321,814
Avnet, Inc.*D
18,962
620,626
WellPoint, Inc.*†
7,253
320,075
Juniper Networks, Inc.*†D
24,805
620,125
Waters Corp.*†
5,733
319,328
Hewlett-Packard Co.D
13,437
613,533
Novartis AG — SP ADR†
5,925
303,538
NCR Corp.*D
25,391
579,677
Humana, Inc.*†
6,197
277,997
Novellus Systems, Inc.*D
26,487
557,551
Express Scripts, Inc.*
3,883
249,755
EMC Corp*†
38,124
546,698
DENTSPLY International, Inc.
6,127
236,502
Synopsys, Inc.*D
22,563
512,406
Schering-Plough Corp.
16,215
233,658
Electronic Data Systems Corp.D
28,748
478,654
Quest Diagnostics, Inc.†
5,161
233,638
Applied Materials, Inc.
21,768
424,694
Medco Health Solutions, Inc.*†
5,151
225,562
Xerox Corp.†
23,719
355,073
Sanofi-Aventis — SP ADR
5,613
210,712
AVX Corp.†
27,120
347,407
ImClone Systems, Inc.*†
4,545
192,799
Nvidia Corp.*
13,489
266,947
Coventry Health Care, Inc.*†
4,647
187,506
CommScope, Inc.*†
6,711
233,744
Cerner Corp.*†
4,929
183,753
MasterCard, Inc.†
1,046
233,248
VCA Antech, Inc.*†
5,423
148,319
Hewitt Associates, Inc. —
Community Health
Class A*†
5,745
228,479
Systems, Inc.*†
4,417
148,279
Computer Sciences Corp.*†
5,393
219,980
AstraZeneca PLC — SP ADR
3,763
142,956
Nokia Oyj — SP ADR†
6,781
215,839
Lincare Holdings, Inc.*†
4,739
133,213
Affiliated Computer
Stryker Corp.
1,962
127,628
Services, Inc. — Class A*†
4,297
215,323
Charles River Laboratories
VeriSign, Inc.*†
6,257
207,983
International, Inc.*†
2,042
120,355
Apple Computer, Inc.*
1,438
206,353
Biogen Idec, Inc.*†
1,810
111,659
Dolby Laboratories, Inc. —
Health Net, Inc.*†
3,581
110,295
Class A*
5,281
191,489
Invitrogen Corp.*†
1,136
97,094
Tellabs, Inc.*†
28,728
156,568
WellCare Health Plans, Inc.*
2,084
81,172
Intersil Corp. — Class A
4,989
128,068
Alcon, Inc. — SP ADR†
524
74,539
Trimble Navigation Ltd.*†
4,307
123,137
Shire PLC — SP ADR†
956
55,410
Convergys Corp.*
7,493
112,845
Brookdale Senior Living, Inc.†
1,892
45,219
Atmel Corp.*†
27,040
94,099
Teva Pharmaceutical
SAP AG — SP ADR†
1,578
78,221
Industries Ltd. — SP ADR†
956
44,158
Telefonaktiebolaget LM
Applera Corp. - Applied
Ericsson — SP ADR†
2,585
50,795
Biosystems Group†
946
31,086
KLA-Tencor Corp.†
1,278
47,414
Covance, Inc.*†
342
28,376
Polycom, Inc.*†
1,510
34,035
Illumina, Inc.*†
372
28,235
Varian Semiconductor
Pharmaceutical Product
Equipment Associates, Inc.*†
976
27,474
Development, Inc.
654
27,403
Gartner, Inc. — Class A*†
1,318
25,490
Millipore Corp.*†
372
25,076
Cypress Semiconductor Corp.*†
1,058
24,979
Cardinal Health, Inc.†
432
22,684
Ciena Corp.*†
372
11,469
PerkinElmer, Inc.
896
21,728
Total Information Technology
14,882,293
Techne Corp.*
322
21,690
HEALTH CARE 5.5%
Laboratory Corporation of
Baxter International, Inc.D
22,895
1,323,789
America Holdings*
262
19,304
HLTH Corp.*†D
101,900
972,126
Bio-Rad Laboratories, Inc. —
E-Z-EM, Inc.*
42,590
893,112
Class A*
200
17,790
Matria Healthcare, Inc.*†
36,290
809,267
AmerisourceBergen Corp.†
414
16,966
Thermo Fisher Scientific, Inc.*D
13,731
780,470
Varian, Inc.*†
282
16,333
40
|
THE RYDEX SERIES FUNDS ANNUAL REPORT
See Notes to Financial Statements.
SCHEDULE OF INVESTMENTS (continued)
March 31, 2008
ABSOLUTE RETURN STRATEGIES FUND
MARKET
MARKET
VALUE
VALUE
SHARES
(NOTE 1)
SHARES
(NOTE 1)
DaVita, Inc.*†
292
$
13,946
CONSUMER STAPLES 3.9%
Affymetrix, Inc.*†
736
12,814
Molson Coors Brewing Co. —
Total Health Care
13,231,506
Class B†D
22,191
$
1,166,581
ENERGY 5.3%
Performance Food Group Co.*†D
33,457
1,093,375
Bronco Drilling Co., Inc.*D
68,484
1,103,277
Reynolds American, Inc.†D
13,339
787,401
Grant Prideco, Inc.*
21,014
1,034,309
Wal-Mart Stores, Inc.
14,557
766,863
US BioEnergy Corp.*†
140,310
827,829
Safeway, Inc.D
25,801
757,259
Chesapeake Energy Corp.†D
17,674
815,655
Energizer Holdings, Inc.*D
7,816
707,192
Cimarex Energy Co.†D
14,767
808,346
Philip Morris International, Inc.*D
12,052
609,590
MarkWest Energy Partners LP†
23,190
715,180
Pepsi Bottling Group, Inc.†
11,086
375,926
Anadarko Petroleum Corp.D
10,966
691,187
Loews Corp. - Carolina Group
5,111
370,803
ConocoPhillipsD
8,582
654,034
PepsiAmericas, Inc.†
12,232
312,283
Valero Energy Corp.D
10,260
503,869
Archer-Daniels-Midland Co.
7,373
303,473
ENSCO International, Inc.†
7,664
479,920
Altria Group, Inc.D
12,052
267,554
Cameron International Corp.*†
10,684
444,882
Bunge Ltd.†
3,027
262,986
Total SA — SP ADR
4,597
340,224
SUPERVALU, INC.†
6,851
205,393
Newfield Exploration Co.*†
6,147
324,869
Unilever NV†
5,683
191,688
Overseas
Diageo PLC — SP ADR†
2,174
176,790
Shipholding Group, Inc.†
4,535
317,631
CVS Caremark Corp.
4,033
163,377
National-Oilwell Varco, Inc.*†
5,423
316,595
Herbalife Ltd.
2,947
139,982
Denbury Resources, Inc.*
10,844
309,596
Del Monte Foods Co.
13,117
125,005
Royal Dutch Shell PLC —
Dean Foods Co.
5,645
113,408
SP ADR
4,305
296,959
Coca-Cola Co.
1,590
96,783
Noble Corp.†
5,763
286,248
Cadbury Schweppes PLC —
Transocean, Inc.*†
1,922
259,854
SP ADR
1,762
77,916
Superior Energy Services*†
6,427
254,638
NBTY, Inc.*†
2,334
69,903
Frontline Ltd.†
5,151
237,049
UST, Inc.†
996
54,302
ENI-Ente Nazionale Idrocarburi —
Universal Corp.†
434
28,440
SP ADR†
3,309
225,376
Vector Group Ltd.†
976
17,168
Unit Corp.*†
3,117
176,578
Total Consumer Staples
9,241,441
Dresser-Rand Group, Inc.*
5,471
168,233
UTILITIES 3.5%
Oceaneering International, Inc.*
2,595
163,485
Puget Energy, Inc.
39,522
1,022,434
FMC Technologies, Inc.*†
2,234
127,092
Energy East Corp.
41,324
996,735
Diamond Offshore Drilling, Inc.†
786
91,490
Aquila, Inc.*†
303,992
975,814
Global Industries Ltd.*
5,553
89,348
NRG Energy, Inc.*D
20,602
803,272
Exxon Mobil Corp.
844
71,385
Public Service
Halliburton Co.†
1,308
51,444
Enterprise Group, Inc.D
17,181
690,504
Chevron Corp.
522
44,558
PPL Corp.D
10,944
502,549
Weatherford International Ltd.*
614
44,497
Duke Energy Corp.†D
27,159
484,788
Tenaris SA — SP ADR†
776
38,684
CenterPoint Energy, Inc.†
32,269
460,479
Range Resources Corp.
512
32,486
Southern Union Co.
18,338
426,725
Consol Energy, Inc.
442
30,582
Constellation Energy Group, Inc.
4,275
377,354
Smith International, Inc.
452
29,032
Reliant Energy, Inc.*
12,233
289,310
Occidental Petroleum Corp.
362
26,488
Xcel Energy, Inc.
12,313
245,644
Devon Energy Corp.
242
25,248
Sierra Pacific Resources
18,318
231,356
EOG Resources, Inc.†
182
21,840
PG&E Corp.†
5,603
206,303
XTO Energy, Inc.
332
20,537
Energen Corp.†
3,059
190,576
Canadian Natural Resources Ltd.†
292
19,932
Entergy Corp.
1,700
185,436
Hess Corp.
202
17,812
SCANA Corp.
3,601
131,725
Marathon Oil Corp.
374
17,054
TECO Energy, Inc.†
4,467
71,249
Patterson-UTI Energy, Inc.†
412
10,786
Total Utilities
8,292,253
Total Energy
12,566,118
See Notes to Financial Statements.
THE RYDEX SERIES FUNDS ANNUAL REPORT
|
41
SCHEDULE OF INVESTMENTS (continued)
March 31, 2008
ABSOLUTE RETURN STRATEGIES FUND
MARKET
MARKET
VALUE
VALUE
SHARES
(NOTE 1)
SHARES
(NOTE 1)
MATERIALS 3.3%
Telefonica SA — SP ADR†
3,601
$
311,523
Myers Industries, Inc.†D
86,350
$
1,133,775
NII Holdings, Inc. — Class B*†
4,587
145,775
Huntsman Corp.D
46,605
1,097,548
Deutsche Telekom AG —
United States Steel Corp.D
5,925
751,705
SP ADR†
7,393
122,576
E.I. du Pont de
France Telecom SA — SP ADR
3,159
106,079
Nemours and Co.D
11,780
550,833
China Mobile Ltd. — SP ADR
1,358
101,864
Steel Dynamics, Inc.D
13,078
432,097
Telecom Italia — SP ADR
2,805
58,596
Temple-Inland, Inc.D
30,258
384,882
America Movil SAB de CV —
Dow Chemical Co.†
10,392
382,945
SP ADR
876
55,792
Alcoa, Inc.
7,203
259,740
Vimpel-Communications —
The Mosaic Co.*
2,444
250,754
SP ADR
1,138
34,015
Rio Tinto PLC — SP ADR†
584
240,515
Mobile Telesystems —
Albemarle Corp.†
6,559
239,535
SP ADR
422
32,009
Reliance Steel & Aluminum Co.†
3,551
212,563
Rogers Communications, Inc. —
Anglo American PLC —
Class B†
622
22,342
SP ADR†
6,749
200,918
Turkcell Iletisim Hizmet AS, Inc. —
BHP Billiton Ltd. — SP ADR†
2,767
182,207
SP ADR
1,016
21,224
Commercial Metals Co.†
5,955
178,471
Windstream Corp.†
1,690
20,195
Southern Copper Corp.†
1,700
176,511
American Tower Corp. —
ArcelorMittal†
2,094
171,289
Class A*
452
17,723
Lubrizol Corp.†
2,997
166,363
Philippine Long Distance
Cleveland-Cliffs, Inc.
1,248
149,535
Telephone Co. — SP ADR†
250
16,615
Nalco Holding Co.†
6,247
132,124
SK Telecom Co. Ltd. —
Celanese Corp.
2,194
85,676
SP ADR†
664
14,349
Potash Corporation of
Crown Castle International Corp.*†
322
11,106
Saskatchewan
462
71,707
MetroPCS Communications, Inc.*†
584
9,928
Companhia Vale do Rio Doce —
Citizens Communications Co.†
614
6,441
SP ADR†
1,932
66,924
Total Telecommunication Services
6,718,642
Praxair, Inc.
482
40,599
Total Common Stocks
Barrick Gold Corp.†
816
35,455
(Cost $143,627,893)
136,226,428
Air Products & Chemicals, Inc.
374
34,408
POSCO — SP ADR
272
32,363
EXCHANGE TRADED FUNDS 9.6%
Goldcorp, Inc.†
786
30,458
iShares S&P GSCI Commodity
Agrium, Inc.
432
26,832
Indexed Trust*†D
186,090
10,767,167
Sigma-Aldrich Corp.
392
23,383
iShares MSCI Emerging Markets
Teck Cominco Ltd. — Class B
522
21,381
Index Fund†
34,750
4,669,705
Newmont Mining Corp.†
464
21,019
Nuveen Equity Premium and
PPG Industries, Inc.
342
20,694
Growth Fund†
66,970
1,071,520
Freeport-McMoRan Copper &
Nuveen Equity Premium
Gold, Inc.†
140
13,471
Opportunity Fund
69,330
1,062,136
Total Materials
7,818,680
Eaton Vance Tax-Managed
TELECOMMUNICATION SERVICES 2.8%
Buy-Write
Verizon Communications, Inc.D
34,071
1,241,888
Opportunities Fund
66,740
1,060,499
Rural Cellular Corp. —
Liberty All Star Equity Fund†
164,880
1,053,583
Class A*†D
24,241
1,072,179
Eaton Vance Tax-Managed
SBA Communications Corp.*D
29,252
872,587
Buy-Write Income Fund
64,220
1,044,859
AT&T, Inc.D
16,739
641,104
First Trust Enhanced Equity
CenturyTel, Inc.†D
17,482
581,102
Income Fund, Inc.
71,440
1,024,450
U.S. Cellular Corp.*D
9,294
511,170
Nuveen Core Equity
Vodafone Group PLC —
Alpha Fund
68,150
999,079
SP ADR
11,860
349,989
Total Exchange Traded Funds
Telephone & Data
(Cost $20,431,423)
22,752,998
Systems, Inc.
8,670
340,471
42
|
THE RYDEX SERIES FUNDS ANNUAL REPORT
See Notes to Financial Statements.
SCHEDULE OF INVESTMENTS (continued)
March 31, 2008
ABSOLUTE RETURN STRATEGIES FUND
MARKET
MARKET
FACE
VALUE
VALUE
AMOUNT
(NOTE 1)
SHARES
(NOTE 1)
REPURCHASE AGREEMENTS 9.5%
CONSUMER STAPLES (2.5)%
Repurchase Agreements (Note 5)
Hansen Natural Corp.*
340
$
(12,002)
Lehman Brothers Holdings, Inc.
Constellation Brands, Inc. —
issued 03/31/08 at 1.15%
Class A*
3,150
(55,660)
due 04/01/08D
$13,482,545
$
13,482,545
Whole Foods Market, Inc.
7,540
(248,594)
Mizuho Financial Group, Inc.
Rite Aid Corp.*
110,840
(325,870)
issued 03/31/08 at 1.30%
Sara Lee Corp.
31,180
(435,896)
due 04/01/08
7,644,486
7,644,486
Bare Escentuals, Inc.*
21,150
(495,333)
Morgan Stanley issued 03/31/08
Walgreen Co.
13,480
(513,453)
at 1.35% due 04/01/08
1,592,601
1,592,601
Alberto-Culver Co.
18,950
(519,419)
Total Repurchase Agreements
Hershey Co.
16,940
(638,130)
(Cost $22,719,632)
22,719,632
WM Wrigley Jr Co.
11,200
(703,808)
Colgate-Palmolive Co.
9,160
(713,656)
SHARES
Avon Products, Inc.
29,890
(1,181,851)
SECURITIES LENDING COLLATERAL 16.7%
Total Consumer Staples
(5,843,672)
Mount Vernon Securities Lending
UTILITIES (3.3)%
Trust Prime Portfolio (Note 9)
39,871,120
39,871,120
Dynegy, Inc. — Class A*
11,890
(93,812)
Total Securities Lending Collateral
DPL, Inc.
5,450
(139,738)
(Cost $39,871,120)
39,871,120
AES Corp.*
9,710
(161,866)
Atmos Energy Corp.
7,420
(189,210)
Total Long Securities 92.9%
Northeast Utilities
7,800
(191,412)
(Cost $226,650,068)
$221,570,178
Exelon Corp.
2,780
(225,930)
COMMON STOCKS SOLD SHORT (38.3)%
Oneok, Inc.
5,780
(257,961)
Consolidated Edison, Inc.
8,220
(326,334)
TELECOMMUNICATION SERVICES (0.2)%
NiSource, Inc.
24,420
(421,001)
Leap Wireless
Allegheny Energy, Inc.
8,710
(439,855)
International, Inc.*
580
(27,027)
Ameren Corp.
10,360
(456,254)
Sprint Nextel Corp.
4,870
(32,580)
Pepco Holdings, Inc.
19,860
(490,939)
Level 3 Communications, Inc.*
169,290
(358,895)
Pinnacle West Capital Corp.
16,560
(580,925)
Equitable Resources, Inc.
10,210
(601,369)
Total Telecommunication Services
(418,502)
OGE Energy Corp.
20,580
(641,479)
MATERIALS (2.0)%
Aqua America, Inc.
45,310
(850,922)
Eastman Chemical Co.
250
(15,613)
Great Plains Energy, Inc.
37,440
(922,896)
AK Steel Holding Corp.
540
(29,387)
Hawaiian Electric
Owens-Illinois, Inc.*
640
(36,115)
Industries, Inc.
41,240
(984,399)
Scotts Miracle-Gro Co. — Class A
3,270
(106,013)
International Flavors &
Total Utilities
(7,976,302)
Fragrances, Inc.
2,760
(121,578)
CONSUMER DISCRETIONARY (3.6)%
Vulcan Materials Co.
2,170
(144,088)
Central European Media
Louisiana-Pacific Corp.
16,950
(155,601)
Enterprises Ltd. — Class A*
120
(10,228)
Allegheny Technologies, Inc.
2,300
(164,128)
Jones Apparel Group, Inc.
860
(11,541)
Eagle Materials, Inc.
5,000
(177,750)
Macy’s, Inc.
520
(11,991)
Nucor Corp.
2,690
(182,221)
KB Home
870
(21,515)
Ecolab, Inc.
4,480
(194,566)
JC Penney Co., Inc.
1,240
(46,760)
Sonoco Products Co.
7,240
(207,281)
Career Education Corp.*
4,230
(53,806)
Ashland, Inc.
5,780
(273,394)
Gannett Co., Inc.
2,150
(62,457)
Weyerhaeuser Co.
4,570
(297,233)
Chico’s FAS, Inc.*
8,810
(62,639)
Pactiv Corp.*
12,460
(326,577)
Ryland Group, Inc.
2,090
(68,740)
Westlake Chemical Corp.
26,940
(351,567)
Lennar Corp. — Class A
4,130
(77,685)
Crown Holdings, Inc.*
21,870
(550,249)
Coldwater Creek, Inc.*
15,860
(80,093)
Sealed Air Corp.
24,340
(614,585)
Warner Music Group Corp.
16,910
(84,212)
Bemis Co., Inc.
34,540
(878,352)
Pool Corp.
4,530
(85,572)
Scientific Games Corp. —
Total Materials
(4,826,298)
Class A*
4,100
(86,551)
See Notes to Financial Statements.
THE RYDEX SERIES FUNDS ANNUAL REPORT
|
43
SCHEDULE OF INVESTMENTS (continued)
March 31, 2008
ABSOLUTE RETURN STRATEGIES FUND
MARKET
MARKET
VALUE
VALUE
SHARES
(NOTE 1)
SHARES
(NOTE 1)
Wendy’s International, Inc.
3,840
$
(88,550)
HEALTH CARE (4.3)%
Apollo Group, Inc. — Class A*
2,080
(89,856)
Mylan, Inc.
1,620
$
(18,792)
AnnTaylor Stores Corp.*
4,840
(117,031)
PDL BioPharma, Inc.*
2,940
(31,135)
Wyndham Worldwide Corp.
5,710
(118,083)
Health Management
Foot Locker, Inc.
10,090
(118,759)
Associates, Inc. — Class A*
12,170
(64,379)
Eastman Kodak Co.
6,920
(122,276)
King Pharmaceuticals, Inc.*
8,190
(71,253)
Las Vegas Sands Corp.*
1,780
(131,079)
Advanced Medical Optics, Inc.*
4,530
(91,959)
Toll Brothers, Inc.*
5,670
(133,132)
Cooper Cos., Inc.
3,500
(120,505)
Lowe’s Cos., Inc.
7,210
(165,397)
Varian Medical Systems, Inc.*
2,820
(132,089)
OfficeMax, Inc.
8,930
(170,920)
Sepracor, Inc.*
7,360
(143,667)
Centex Corp.
8,500
(205,785)
Intuitive Surgical, Inc.*
510
(165,418)
Urban Outfitters, Inc.*
6,890
(216,002)
Forest Laboratories, Inc.*
4,240
(169,642)
Saks, Inc.*
17,730
(221,093)
Abraxis Bioscience/New, Inc.*
3,510
(207,371)
Coach, Inc.*
7,510
(226,427)
Hospira, Inc.*
5,970
(255,337)
Marriott International, Inc. —
Amylin Pharmaceuticals, Inc.*
9,200
(268,732)
Class A
7,600
(261,136)
Omnicare, Inc.
17,770
(322,703)
CBS Corp.
12,450
(274,896)
CR Bard, Inc.
3,350
(322,940)
DR Horton, Inc.
18,190
(286,493)
Merck & Co., Inc.
8,750
(332,062)
H&R Block, Inc.
13,900
(288,564)
Warner Chilcott*
19,330
(347,940)
Pulte Homes, Inc.
20,990
(305,405)
Allergan, Inc.
8,120
(457,887)
International Game Technology
7,930
(318,865)
Boston Scientific Corp.*
37,220
(479,021)
DreamWorks Animation
APP Pharmaceuticals, Inc.*
40,540
(489,723)
SKG, Inc. — Class A*
13,870
(357,569)
Abbott Laboratories
9,100
(501,865)
General Motors Corp.
19,060
(363,093)
Bristol-Myers Squibb Co.
23,720
(505,236)
Interpublic Group of Cos., Inc.*
49,760
(418,482)
Millennium Pharmaceuticals, Inc.*
33,210
(513,427)
Ford Motor Co.*
80,460
(460,231)
Celgene Corp.*
9,060
(555,287)
Starbucks Corp.*
28,820
(504,350)
Tenet Healthcare Corp.*
110,960
(628,034)
Sirius Satellite Radio, Inc.*
617,960
(1,767,366)
Vertex Pharmaceuticals, Inc.*
27,810
(664,381)
Total Consumer Discretionary
(8,494,630)
Amgen, Inc.*
16,460
(687,699)
ENERGY (3.6)%
Gilead Sciences, Inc.*
15,390
(793,047)
SandRidge Energy, Inc.*
200
(7,830)
Johnson & Johnson
14,780
(958,779)
Arch Coal, Inc.
990
(43,065)
Total Health Care
(10,300,310)
Western Refining, Inc.
3,250
(43,778)
INFORMATION TECHNOLOGY (4.6)%
Teekay Corp.
3,030
(128,684)
VeriFone Holdings, Inc.*
2,050
(32,533)
Massey Energy Co.
3,680
(134,320)
Marvell Technology Group Ltd.*
5,580
(60,710)
Cheniere Energy, Inc.*
8,200
(162,360)
Riverbed Technology, Inc.*
5,740
(85,296)
Holly Corp.
4,100
(177,981)
Google, Inc. — Class A*
200
(88,094)
Forest Oil Corp.*
7,320
(358,387)
EchoStar Corp. — Class A*
4,030
(119,046)
Sunoco, Inc.
7,070
(370,963)
Motorola, Inc.
15,260
(141,918)
Tetra Technologies, Inc.*
27,680
(438,451)
Cognizant Technology
Murphy Oil Corp.
6,230
(511,732)
Solutions Corp. — Class A*
5,240
(151,069)
Allis-Chalmers Energy, Inc.*
37,660
(519,331)
National Instruments Corp.
6,080
(158,931)
Pioneer Natural Resources Co.
10,860
(533,443)
LSI Logic Corp.*
34,140
(168,993)
Baker Hughes, Inc.
7,840
(537,040)
BEA Systems, Inc.*
8,950
(171,393)
W&T Offshore, Inc.
17,820
(607,840)
QLogic Corp.*
12,570
(192,950)
Patriot Coal Corp.*
14,610
(686,232)
Micron Technology, Inc.*
34,970
(208,771)
Nabors Industries Ltd.*
20,980
(708,495)
Novell, Inc.*
36,840
(231,724)
Markwest Energy Partners LP
23,190
(715,180)
Sanmina-SCI Corp.*
152,720
(247,406)
VeraSun Energy Corp.*
118,590
(871,637)
Jabil Circuit, Inc.
27,710
(262,137)
BJ Services Co.
38,800
(1,106,188)
Lexmark International, Inc. —
Total Energy
(8,662,937)
Class A*
10,630
(326,554)
Activision, Inc.*
12,660
(345,745)
44
|
THE RYDEX SERIES FUNDS ANNUAL REPORT
See Notes to Financial Statements.
SCHEDULE OF INVESTMENTS (continued)
March 31, 2008
ABSOLUTE RETURN STRATEGIES FUND
MARKET
MARKET
VALUE
VALUE
SHARES
(NOTE 1)
SHARES
(NOTE 1)
Paychex, Inc.
10,840
$
(371,378)
FINANCIALS (9.5)%
Intel Corp.
19,250
(407,715)
Westamerica Bancorporation
180
$
(9,468)
Akamai Technologies, Inc.*
15,000
(422,400)
CapitalSource, Inc.
2,330
(22,531)
WebMD Health Corp.*
17,990
(424,024)
Bear Stearns Cos., Inc.
2,240
(23,498)
Advanced Micro Devices, Inc.*
72,200
(425,258)
Eaton Vance Corp.
780
(23,798)
Acxiom Corp.
37,720
(447,736)
Legg Mason, Inc.
430
(24,071)
Tech Data Corp.*
15,550
(510,040)
Nasdaq OMX Group*
870
(33,634)
Adobe Systems, Inc.*
14,640
(521,038)
State Street Corp.
590
(46,610)
Unisys Corp.*
121,020
(536,119)
PMI Group, Inc.
8,020
(46,676)
Microsoft Corp.
18,920
(536,950)
Old Republic International Corp.
4,040
(52,156)
NetApp, Inc.*
27,060
(542,553)
First Marblehead Corp.
7,170
(53,488)
Salesforce.com, Inc.*
12,120
(701,384)
Merrill Lynch & Co., Inc.
1,320
(53,777)
Electronic Arts, Inc.*
19,070
(951,974)
BRE Properties, Inc.
1,200
(54,672)
JDS Uniphase Corp.*
83,050
(1,112,040)
iStar Financial, Inc.
5,100
(71,553)
Total Information Technology
(10,903,879)
Liberty Media Corp. - Capital*
4,630
(72,876)
INDUSTRIALS (4.7)%
Citigroup, Inc.
3,720
(79,682)
US Airways Group, Inc.*
3,600
(32,076)
National City Corp.
9,170
(91,241)
Trinity Industries, Inc.
2,620
(69,823)
Forest City Enterprises, Inc. —
YRC Worldwide, Inc.*
6,050
(79,376)
Class A
2,800
(103,040)
Hubbell, Inc. — Class B
1,970
(86,069)
XL Capital
3,580
(105,789)
Avis Budget Group, Inc.*
11,220
(119,156)
First Horizon National Corp.
7,720
(108,157)
ChoicePoint, Inc.*
2,900
(138,040)
SEI Investments Co.
4,790
(118,265)
UTi Worldwide, Inc.
7,190
(144,375)
Duke Realty Corp.
5,240
(119,524)
FedEx Corp.
1,570
(145,492)
Freddie Mac
5,190
(131,411)
Monster Worldwide, Inc.*
7,140
(172,859)
Federal National
Fluor Corp.
1,240
(175,038)
Mortgage Association
5,170
(136,074)
Graco, Inc.
5,360
(194,354)
Student Loan Corp.
1,380
(136,482)
Alexander & Baldwin, Inc.
4,790
(206,353)
Essex Property Trust, Inc.
1,220
(139,056)
Brink’s Co.
3,370
(226,397)
Whitney Holding Corp.
5,760
(142,790)
HNI Corp.
8,500
(228,565)
Colonial BancGroup, Inc.
14,960
(144,065)
Dun & Bradstreet Corp.
2,860
(232,747)
Cincinnati Financial Corp.
3,900
(148,356)
WESCO International, Inc.*
6,530
(238,280)
Arthur J Gallagher & Co.
6,530
(154,239)
Cintas Corp.
8,770
(250,296)
CBL & Associates
Ingersoll-Rand Co. — Class A
5,650
(251,877)
Properties, Inc.
6,810
(160,239)
Tyco International Ltd.
6,110
(269,145)
Webster Financial Corp.
6,250
(174,188)
Fastenal Co.
6,240
(286,603)
First American Corp.
5,770
(195,834)
Corporate Executive Board Co.
7,480
(302,790)
Brown & Brown, Inc.
12,000
(208,560)
Rockwell Collins, Inc.
5,740
(328,041)
Liberty Property Trust
6,720
(209,059)
Continental Airlines, Inc.*
18,820
(361,909)
Capitol Federal Financial
5,650
(211,762)
Owens Corning, Inc.*
21,590
(391,427)
Everest Re Group
2,440
(218,453)
AMR Corp.*
47,680
(430,074)
UDR, Inc.
9,210
(225,829)
CH Robinson Worldwide, Inc.
7,920
(430,848)
Huntington Bancshares, Inc.
21,130
(227,148)
Pitney Bowes, Inc.
12,710
(445,104)
Kilroy Realty Corp.
4,870
(239,166)
General Electric Co.
12,540
(464,105)
Brandywine Realty Trust
14,240
(241,510)
Robert Half International, Inc.
18,050
(464,607)
Capital One Financial Corp.
4,970
(244,623)
Masco Corp.
25,450
(504,674)
Regency Centers Corp.
3,980
(257,745)
Excel Maritime Carriers Ltd.
18,540
(544,149)
Developers Diversified
United Parcel Service, Inc. —
Realty Corp.
6,190
(259,237)
Class B
12,830
(936,847)
Endurance Specialty
Expeditors International
Holdings Ltd.
7,130
(260,958)
Washington, Inc.
20,940
(946,069)
American Campus
Southwest Airlines Co.
88,400
(1,096,160)
Communities, Inc.
9,580
(262,109)
SLM Corp.*
17,220
(264,327)
Total Industrials
(11,193,725)
Conseco, Inc.*
26,310
(268,362)
See Notes to Financial Statements.
THE RYDEX SERIES FUNDS ANNUAL REPORT
|
45
SCHEDULE OF INVESTMENTS (continued)
March 31, 2008
ABSOLUTE RETURN STRATEGIES FUND
MARKET
UNREALIZED
VALUE
GAIN (LOSS)
SHARES
(NOTE 1)
CONTRACTS
(NOTE 1)
Washington Mutual, Inc.
26,860
$
(276,658)
FOREIGN CURRENCY FUTURES
Astoria Financial Corp.
10,280
(279,205)
CONTRACTS PURCHASED
New York Community
June 2008 New Zealand
Bancorp, Inc.
15,840
(288,605)
Dollar Futures Contracts
Zions Bancorporation
6,710
(305,641)
(Aggregate Market Value
Lazard — Class A
8,080
(308,656)
of Contracts $9,078,030)
117
$
(4,869)
AvalonBay Communities, Inc.
3,250
(313,690)
June 2008 Australian Dollar
Bank of New York Mellon Corp.
7,770
(324,242)
Futures Contracts
Popular, Inc.
30,110
(351,083)
(Aggregate Market Value
Gramercy Capital Corp.
17,030
(356,438)
of Contracts $9,402,640)
104
(13,816)
Franklin Resources, Inc.
3,750
(363,713)
June 2008 British Pound
Kimco Realty Corp.
9,510
(372,507)
Futures Contracts
Allied Capital Corp.
21,580
(397,719)
(Aggregate Market Value
Sovereign Bancorp, Inc.
45,140
(420,705)
of Contracts $8,747,200)
71
(103,596)
M&T Bank Corp.
5,500
(442,640)
(Total Aggregate Market Value
CB Richard Ellis Group, Inc. —
of Contracts $27,227,870)
$
(122,281)
Class A*
21,580
(466,991)
Ventas, Inc.
10,780
(484,130)
FUTURES CONTRACTS PURCHASED
Macerich Co.
6,990
(491,187)
June 2008 U.S. 10 Year Treasury
PartnerRe
6,500
(495,950)
Note Futures Contracts
Federal Realty Invs Trust
6,400
(498,880)
(Aggregate Market Value
NYSE Euronext
8,130
(501,702)
of Contracts $27,240,266)
229
$
986,517
Leucadia National Corp.
11,100
(501,942)
June 2008 S&P 500 Index
Regions Financial Corp.
25,960
(512,710)
Mini Futures Contracts
Simon Property Group, Inc.
6,030
(560,247)
(Aggregate Market Value
People’s United Financial, Inc.
33,480
(579,539)
of Contracts $54,873,375)
830
445,311
Moody’s Corp.
18,200
(633,906)
June 2008 Nikkei-225 Stock Average
PNC Financial
Index Futures Contracts
Services Group, Inc.
10,080
(660,946)
(Aggregate Market Value of
Toronto-Dominion Bank
12,170
(746,630)
Contracts $5,391,125)
85
87,314
CME Group, Inc.
1,670
(783,397)
June 2008 S&P 400 MidCap
Fifth Third Bancorp
45,390
(949,559)
Mini Futures Contracts
Bank of America Corp.
28,910
(1,095,978)
(Aggregate Market Value
HCP, Inc.
39,100
(1,321,971)
of Contracts $3,982,590)
51
85,012
Total Financials
(22,663,255)
June 2008 Russell 2000 Index
Total Common Stocks Sold Short
Mini Futures Contracts
(Proceeds $97,792,284)
(91,283,510)
(Aggregate Market Value
of Contracts $4,193,750)
61
63,862
CONTRACTS
(Total Aggregate Market Value
of Contracts $95,681,106)
$
1,668,016
OPTIONS WRITTEN (0.9)%
Call Options on:
April 2008 S&P 500 Index
Futures Contracts
Expiring April 2008
with strike price of 1260
119
(2,180,675)
Total Options Written
(Premiums Received $2,468,798)
(2,180,675)
Other Assets in Excess
of Liabilities – 46.3%
$110,427,475
Net Assets – 100.0%
$238,533,468
46
|
THE RYDEX SERIES FUNDS ANNUAL REPORT
See Notes to Financial Statements.
SCHEDULE OF INVESTMENTS (concluded)
March 31, 2008
ABSOLUTE RETURN STRATEGIES FUND
UNREALIZED
GAIN (LOSS)
CONTRACTS
(NOTE 1)
FOREIGN CURRENCY FUTURES
CONTRACTS SOLD SHORT
June 2008 Japanese Yen
Futures Contracts
(Aggregate Market Value of
Contracts $9,447,188)
75
$
(191,933)
June 2008 Swiss Franc
Futures Contracts
(Aggregate Market Value
of Contracts $9,940,175)
79
(239,694)
(Total Aggregate Market Value
of Contracts $19,387,363)
$
(431,627)
FUTURES CONTRACTS
SOLD SHORT
June 2008 U.S. Dollar Index
Futures Contracts
(Aggregate Market Value
of Contracts $12,412,380)
172
$
269,032
*
Non-Income Producing Security.
†
All or a portion of this security is on loan at March 31, 2008 — See Note 9.
D
All or a portion of this security is pleged as short security collateral at March 31, 2008.
ADR—American Depository Receipt.
REIT—Real Estate Investment Trust.
See Notes to Financial Statements.
THE RYDEX SERIES FUNDS ANNUAL REPORT
|
47
SCHEDULE OF INVESTMENTS
March 31, 2008
ALTERNATIVE STRATEGIES ALLOCATION FUND
MARKET
VALUE
SHARES
(NOTE 1)
CURRENCY EXCHANGE TRADED FUNDS 20.4%
PowerShares DB G10
Currency Harvest Fund*
40,930
$1,053,129
Total Currency Exchange
Traded Funds
(Cost $1,075,228)
1,053,129
MUTUAL FUNDS† 74.6%
Rydex Series Funds - Managed
Futures Strategy Fund
83,463
2,358,658
Rydex Series Funds - Commodities
Strategy Fund
20,538
671,403
Rydex Series Funds -
Real Estate Fund
18,360
595,225
Rydex Series Funds - Absolute
Return Strategies Fund
9,256
227,781
Total Mutual Funds
(Cost $3,861,609)
3,853,067
FACE
AMOUNT
REPURCHASE AGREEMENT 3.0%
Repurchase Agreement (Note 5)
Lehman Brothers Holdings, Inc.
issued 03/31/08 at 1.15%
due 04/01/08
$157,148
157,148
Total Repurchase Agreement
(Cost $157,148)
157,148
Total Investments 98.0%
(Cost $5,093,985)
$5,063,344
Other Assets in Excess
of Liabilities – 2.0%
$
103,016
Net Assets – 100.0%
$5,166,360
*
Non-Income Producing Security.
†
A-Class Shares of Affiliated Funds.
48
|
THE RYDEX SERIES FUNDS ANNUAL REPORT
See Notes to Financial Statements.
SCHEDULE OF INVESTMENTS
March 31, 2008
COMMODITIES STRATEGY FUND
MARKET
MARKET
VALUE
VALUE
SHARES
(NOTE 1)
SHARES
(NOTE 1)
EXCHANGE TRADED FUNDS 4.0%
SECURITIES LENDING COLLATERAL 3.7%
iShares S&P GSCI
Mount Vernon Securities Lending
Commodity Indexed Trust*†
107,720
$
6,232,679
Trust Prime Portfolio (Note 9)
5,673,000
$
5,673,000
Total Exchange Traded Funds
Total Securities Lending Collateral
(Cost $5,886,263)
6,232,679
(Cost $5,673,000)
5,673,000
FACE
Total Investments 104.1%
AMOUNT
(Cost $147,277,637)
$160,660,206
Liabilities in Excess of
STRUCTURED NOTES †† 40.5%
Other Assets – (4.1)%
$
(6,401,433)
Credit Suisse Group,
Net Assets – 100.0%
$154,258,773
S&P GSCI Total Return
Linked Notes 5.59%
due 09/30/08
$19,690,247
34,134,151
Swedish Export Credit Corp.,
S&P GSCI Total Return
Linked Notes 4.89%
due 11/14/08
7,000,000
9,269,750
Swedish Export Credit Corp.,
S&P GSCI Total Return
Linked Notes 2.80%
due 03/27/09
9,000,000
7,216,470
Swedish Export Credit Corp.,
S&P GSCI Total Return
Linked Notes 5.36%
due 04/28/08
3,000,000
6,074,340
Goldman Sachs Group Inc.,
S&P GSCI Total Return
Linked Notes 3.06%
due 03/14/09
6,000,000
5,808,060
Total Structured Notes
(Cost $49,466,618)
62,502,771
REPURCHASE AGREEMENT 55.9%
Repurchase Agreement (Note 5)
Lehman Brothers Holdings, Inc.
issued 03/31/08 at 1.15%
due 04/01/08
86,251,756
86,251,756
Total Repurchase Agreement
(Cost $86,251,756)
86,251,756
*
Non-Income Producing Security.
†
All or a portion of this security is on loan at March 31, 2008 — See Note 9.
††
Structured Notes are leveraged, providing an exposure to the underlying benchmark of three times the face amount. The total
exposure to the S&P GSCI Total Return is $134,070,741 as of March 31, 2008 — See Note 2.
See Notes to Financial Statements.
THE RYDEX SERIES FUNDS ANNUAL REPORT
|
49
SCHEDULE OF INVESTMENTS
March 31, 2008
HEDGED EQUITY FUND
MARKET
MARKET
VALUE
VALUE
SHARES
(NOTE 1)
SHARES
(NOTE 1)
COMMON STOCKS 66.8%
Jones Lang LaSalle, Inc.†
290
$
22,429
Northern Trust Corp.D
330
21,935
FINANCIALS 12.4%
Apartment Investment &
Goldman Sachs Group, Inc.†D
1,120
$
185,237
Management Co. — Class A
570
20,412
Alleghany Corp.*†D
500
170,682
IntercontinentalExchange, Inc.*†
120
15,660
Plum Creek Timber Co., Inc.
Eaton Vance Corp.†
190
5,797
(REIT)D
4,061
165,283
Discover Financial Services†
350
5,729
HSBC Holdings PLC — SP ADR† D
1,860
153,078
Lehman Brothers Holdings, Inc.†
90
3,388
Allied World Assurance
Total Financials
3,408,321
Company Holdings Ltd.D
3,840
152,448
HEALTH CARE 8.0%
Aon Corp.D
3,780
151,956
Baxter International, Inc.D
4,261
246,371
Travelers Cos, Inc.D
3,110
148,813
Thermo Fisher Scientific, Inc.*D
2,850
161,994
Loews Corp.D
3,040
122,269
Novartis AG — SP ADR†D
2,190
112,194
Charles Schwab Corp.D
6,461
121,661
CIGNA Corp.D
2,310
93,717
Banco Santander Central
Pfizer, Inc.D
4,401
92,113
Hispano SA — SP ADR†D
4,901
97,726
Edwards Lifesciences Corp.*†D
1,950
86,872
Ameriprise Financial, Inc.D
1,860
96,441
Eli Lilly & Co.D
1,610
83,060
Blackrock, Inc.†D
460
93,923
UnitedHealth Group, Inc.D
2,330
80,059
Federated Investors, Inc. —
Sanofi-Aventis — SP ADR†D
2,080
78,083
Class BD
2,350
92,026
Waters Corp.*†D
1,190
66,283
Transatlantic Holdings, Inc.†D
1,300
86,255
Aetna, Inc.†D
1,510
63,556
AFLAC, Inc.†D
1,290
83,785
WellPoint, Inc.*†D
1,250
55,162
Marsh & McLennan Cos., Inc.D
3,390
82,546
McKesson Corp.D
1,050
54,988
Allstate Corp.D
1,670
80,260
AstraZeneca PLC — SP ADRD
1,400
53,186
JPMorgan Chase & Co.D
1,850
79,457
Humana, Inc.*†D
1,180
52,935
Hartford Financial
Express Scripts, Inc.*†
820
52,742
Services Group, Inc.D
990
75,012
LifePoint Hospitals, Inc.*†D
1,890
51,918
Unum Group†D
3,280
72,193
Medco Health Solutions, Inc.*D
1,120
49,045
Chubb Corp.D
1,440
71,251
Stryker Corp.D
700
45,535
ACE Ltd.D
1,260
69,376
DENTSPLY International, Inc.
1,100
42,460
Deutsche Bank AG — SP ADRD
570
64,438
Schering-Plough Corp.D
2,830
40,780
Prudential Financial, Inc.D
760
59,470
Quest Diagnostics, Inc.†
890
40,290
Allianz AG — SP ADRD
2,970
58,390
ImClone Systems, Inc.*†
870
36,905
Banco Bilbao Vizcaya Argent
Cerner Corp.*†
950
35,416
aria SA — SP ADR†D
2,610
57,394
Coventry Health Care, Inc.*†
790
31,876
Lloyds TSB Group PLC —
HLTH Corp.*
3,000
28,620
SP ADR†D
1,580
56,722
VCA Antech, Inc.*†
1,040
28,444
ING Groep NV — SP ADR†D
1,480
55,308
Charles River Laboratories
Annaly Capital
International, Inc.*†
470
27,702
Management, Inc.†D
3,600
55,152
Alcon, Inc. — SP ADR†
190
27,027
Credit Suisse Group — SP ADR† D
1,030
52,406
Invitrogen Corp.*†
310
26,496
ProLogis†
810
47,677
Community Health
Genworth Financial, Inc. —
Systems, Inc.*†
680
22,828
Class A†
2,000
45,280
Biogen Idec, Inc.*†
350
21,592
AXA — SP ADR†
1,180
42,610
Health Net, Inc.*†
690
21,252
Janus Capital Group, Inc.†
1,810
42,119
Lincare Holdings, Inc.*†
730
20,520
W.R. Berkley Corp.
1,370
37,935
Shire PLC — SP ADR†
350
20,286
T. Rowe Price Group, Inc.†
720
36,000
Teva Pharmaceutical
Fidelity National Financial, Inc. —
Industries Ltd. — SP ADR†
350
16,167
Class A†
1,840
33,727
WellCare Health Plans, Inc.*
330
12,854
Taubman Centers, Inc.
610
31,781
Applera Corp. - Applied
Host Hotels & Resorts, Inc.†
1,840
29,293
Biosystems Group†
350
11,501
Protective Life Corp.
690
27,986
Covance, Inc.*†
130
10,786
American Financial Group, Inc.†
1,080
27,605
Illumina, Inc.*†
140
10,626
50
|
THE RYDEX SERIES FUNDS ANNUAL REPORT
See Notes to Financial Statements.
SCHEDULE OF INVESTMENTS (continued)
March 31, 2008
HEDGED EQUITY FUND
MARKET
MARKET
VALUE
VALUE
SHARES
(NOTE 1)
SHARES
(NOTE 1)
Pharmaceutical Product
Granite Construction, Inc.
640
$
20,934
Development, Inc.
240
$
10,056
UAL Corp.†
840
18,085
Cardinal Health, Inc.†
180
9,452
McDermott International, Inc.*
300
16,446
Millipore Corp.*†
140
9,437
Sunpower Corp.*†
180
13,412
Techne Corp.*
120
8,083
Woodward Governor Co.
490
13,093
PerkinElmer, Inc.
330
8,003
Oshkosh Truck Corp.
360
13,061
Laboratory Corporation of
Chicago Bridge & Iron, Co. NV†
330
12,949
America Holdings*
100
7,368
Ryanair Holdings PLC —
Bio-Rad Laboratories, Inc. —
SP ADR*†
410
11,595
Class A*
70
6,227
URS Corp.*†
340
11,115
AmerisourceBergen Corp.†
150
6,147
Suntech Power
Varian, Inc.*†
100
5,792
Holdings Co. Ltd. - SP ADR*†
270
10,951
Brookdale Senior Living, Inc.†
240
5,736
Roper Industries, Inc.†
170
10,105
DaVita, Inc.*
110
5,254
AMETEK, Inc.
220
9,660
Affymetrix, Inc.*†
270
4,701
Union Pacific Corp.
70
8,777
Total Health Care
2,200,497
Canadian National Railway Co.†
160
7,731
INDUSTRIALS 7.9%
Stericycle, Inc.*†
150
7,725
CSX Corp.†D
3,190
178,863
Copa Holdings SA
190
7,241
Deere & Co.D
2,020
162,489
Brady Corp. — Class A†
210
7,020
Paccar, Inc.D
2,410
108,450
GrafTech International Ltd.*†
400
6,484
Burlington Northern
EMCOR Group, Inc.*
290
6,441
Santa Fe Corp.D
1,160
106,975
Perini Corp.*†
150
5,435
Precision Castparts Corp.D
940
95,955
Energy
Caterpillar, Inc.†D
1,170
91,599
Conversion Devices, Inc.*†
180
5,382
Norfolk Southern Corp.D
1,580
85,826
Belden, Inc.†
120
4,238
AGCO Corp.*†D
1,360
81,437
Regal-Beloit Corp.†
110
4,029
Flowserve Corp.D
680
70,978
Delta Air Lines, Inc.*
460
3,956
Waste Management, Inc.D
1,950
65,442
American
Ryder System, Inc.†D
1,060
64,565
Superconductor Corp.*†
170
3,942
Jacobs Engineering Group,
J.B. Hunt
Inc.*†D
870
64,023
Transport Services, Inc.†
100
3,143
Siemens AG — SP ADR†D
530
57,738
Hertz Global Holdings, Inc.*†
240
2,894
Eaton Corp.†D
670
53,379
Kansas City Southern*†
70
2,808
Cummins, Inc.
930
43,543
Landstar System, Inc.
50
2,608
Manitowoc Co., Inc.†
990
40,392
Knight Transportation, Inc.†
120
1,975
United Rentals, Inc.*
2,110
39,752
Werner Enterprises, Inc.†
100
1,856
Quanta Services, Inc.*†
1,650
38,231
Heartland Express, Inc.†
130
1,854
ITT Industries, Inc.
700
36,267
Total Industrials
2,160,755
ABB Ltd. — SP ADR†
1,320
35,534
INFORMATION TECHNOLOGY 7.2%
Foster Wheeler Ltd.*D
580
32,840
MEMC Electronic Materials, Inc.*D
1,920
136,128
Steelcase, Inc. — Class A
2,950
32,627
Teradyne, Inc.*D
9,931
123,343
Terex Corp.*
520
32,500
Juniper Networks, Inc.*D
4,781
119,525
Shaw Group, Inc.*
660
31,112
Avnet, Inc.*D
3,370
110,300
Emerson Electric Co.
560
28,818
Vishay Intertechnology, Inc.*D
11,942
108,194
DRS Technologies, Inc.†
490
28,557
EMC Corp*D
7,341
105,270
Koninklijke Philips
Hewlett-Packard Co.D
2,080
94,973
Electronics NV— SP ADR
740
28,372
Novellus Systems, Inc.*†D
4,481
94,325
SPX Corp.D
260
27,274
NCR Corp.*D
3,931
89,745
Timken Co.†
860
25,559
Synopsys, Inc.*D
3,931
89,273
First Solar, Inc.*
110
25,425
Nokia Oyj — SP ADR†D
2,510
79,893
Con-way, Inc.†
480
23,750
Electronic Data Systems Corp.D
4,711
78,438
GATX Corp.†
580
22,661
Applied Materials, Inc.D
3,790
73,943
KBR Inc.
790
21,907
AVX Corp.†D
4,731
60,604
BE Aerospace, Inc.*
600
20,970
Nvidia Corp.*D
2,870
56,797
See Notes to Financial Statements.
THE RYDEX SERIES FUNDS ANNUAL REPORT
|
51
SCHEDULE OF INVESTMENTS (continued)
March 31, 2008
HEDGED EQUITY FUND
MARKET
MARKET
VALUE
VALUE
SHARES
(NOTE 1)
SHARES
(NOTE 1)
Xerox Corp.D
3,670
$
54,940
Oceaneering International, Inc.*
500
$
31,500
MasterCard, Inc.†
210
46,828
Exxon Mobil Corp.
310
26,220
CommScope, Inc.*†D
1,290
44,931
Diamond Offshore Drilling, Inc.†
200
23,280
Hewitt Associates, Inc. —
Halliburton Co.†
480
18,878
Class A*†
1,110
44,145
Unit Corp.*†
320
18,128
VeriSign, Inc.*
1,200
39,888
Weatherford International Ltd.*
230
16,668
Apple Computer, Inc.*
270
38,745
Chevron Corp.
190
16,218
Dolby Laboratories, Inc. —
Global Industries Ltd.*
970
15,607
Class A*
1,020
36,985
Tenaris SA — SP ADR†
290
14,457
Computer Sciences Corp.*†
840
34,264
Smith International, Inc.
170
10,919
Affiliated Computer
Occidental Petroleum Corp.
130
9,512
Services, Inc. — Class A*†
670
33,574
Devon Energy Corp.
90
9,390
SAP AG — SP ADR†
580
28,751
EOG Resources, Inc.†
70
8,400
Trimble Navigation Ltd.*†
830
23,730
Canadian
Intersil Corp. — Class A
870
22,333
Natural Resources Ltd.†
110
7,509
Tellabs, Inc.*
3,710
20,219
XTO Energy, Inc.
120
7,423
Telefonaktiebolaget LM
Consol Energy, Inc.
100
6,919
Ericsson — SP ADR†
960
18,864
Marathon Oil Corp.
140
6,384
Convergys Corp.*
1,110
16,717
Range Resources Corp.†
100
6,345
Atmel Corp.*†
4,711
16,394
Hess Corp.
70
6,173
Cypress Semiconductor Corp.*†
540
12,749
Total Energy
1,916,922
Ciena Corp.*†
300
9,249
CONSUMER DISCRETIONARY 5.8%
KLA-Tencor Corp.†
220
8,162
McDonald’s Corp.D
2,760
153,925
Polycom, Inc.*†
290
6,537
Time Warner, Inc.D
9,611
134,746
Varian Semiconductor
Service Corporation International†D
13,092
132,753
Equipment Associates, Inc.*†
190
5,348
Circuit City Stores, Inc.
28,953
115,233
Gartner, Inc. — Class A*†
250
4,835
DIRECTV Group, Inc.*D
3,690
91,475
Total Information Technology
1,988,939
Home Depot, Inc.†D
2,440
68,247
ENERGY 7.0%
Daimler AG — SP ADRD
780
66,729
National-Oilwell Varco, Inc.*†D
2,900
169,302
GameStop Corp. — Class A*† D
1,110
57,398
Chesapeake Energy Corp.†D
2,740
126,451
Walt Disney Co.†D
1,790
56,170
Total SA — SP ADRD
1,700
125,817
Carnival Corp.D
1,310
53,029
Cimarex Energy Co.†D
2,290
125,355
Comcast Corp. — Class A†D
2,500
48,350
Anadarko Petroleum Corp.D
1,760
110,933
CTC Media, Inc.*
1,620
44,955
Royal Dutch Shell PLC — SP
Burger King Holdings, Inc.
1,620
44,809
ADRD
1,590
109,678
Expedia, Inc.*D
1,820
39,840
ConocoPhillipsD
1,430
108,980
Amazon.com, Inc.*D
550
39,215
Cameron International Corp.*†D
2,160
89,942
BorgWarner, Inc.
900
38,727
ENSCO International, Inc.†D
1,420
88,920
Hasbro, Inc.†
1,330
37,107
Eni SpA — SP ADR†D
1,230
83,775
Discovery Holding Co. —
Valero Energy Corp.D
1,660
81,523
Class A*†
1,710
36,286
Transocean, Inc.*D
460
62,192
Whirlpool Corp.†
300
26,034
Denbury Resources, Inc.*D
2,090
59,669
Big Lots, Inc.*
1,100
24,530
Noble Corp.†D
1,130
56,127
Nike, Inc. — Class B†
350
23,800
Newfield Exploration Co.*†D
950
50,208
Kohl’s Corp.*†
550
23,590
Overseas
Wynn Resorts Ltd.†
210
21,135
Shipholding Group, Inc.†
700
49,028
Mohawk Industries, Inc.*†
280
20,051
Frontline Ltd.†
1,000
46,020
Mattel, Inc.
930
18,507
Superior Energy Services*†
1,120
44,374
Guess?, Inc.†
430
17,402
FMC Technologies, Inc.*†
640
36,410
Ross Stores, Inc.
530
15,879
Dresser-Rand Group, Inc.*
1,050
32,288
Goodyear Tire & Rubber Co.*
570
14,706
Luxottica Group — SP ADR
550
13,838
52
|
THE RYDEX SERIES FUNDS ANNUAL REPORT
See Notes to Financial Statements.
SCHEDULE OF INVESTMENTS (continued)
March 31, 2008
HEDGED EQUITY FUND
MARKET
MARKET
VALUE
VALUE
SHARES
(NOTE 1)
SHARES
(NOTE 1)
Virgin Media, Inc.†
920
$
12,944
Anglo American PLC —
American Eagle Outfitters, Inc.
730
12,782
SP ADR†D
2,500
$
74,425
Brunswick Corp.†
730
11,658
Dow Chemical Co.†D
1,850
68,172
ITT Educational Services, Inc.*
250
11,483
BHP Billiton Ltd. — SP ADR†D
1,030
67,825
Johnson Controls, Inc.
300
10,140
ArcelorMittal†D
780
63,804
TRW Automotive
The Mosaic Co.*D
620
63,612
Holdings Corp.*†
390
9,114
Temple-Inland, Inc.D
4,931
62,722
Dillard’s, Inc. — Class A†
520
8,949
Alcoa, Inc.D
1,400
50,484
Garmin Ltd.†
160
8,642
Albemarle Corp.†
1,230
44,920
M.D.C. Holdings, Inc.†
190
8,320
Reliance Steel & Aluminum Co.
680
40,705
Getty Images, Inc.*†
170
5,440
Southern Copper Corp.†
380
39,455
AutoZone, Inc.*
40
4,553
Lubrizol Corp.†
580
32,196
Liberty Global, Inc. — Class A*†
80
2,726
Cleveland-Cliffs, Inc.
240
28,757
Liz Claiborne, Inc.†
150
2,723
Commercial Metals Co.†
920
27,572
CROCS, Inc.*†
130
2,271
Potash Corporation of
Central European Media
Saskatchewan
170
26,386
Enterprises Ltd. — Class A*†
10
852
Companhia Vale do Rio Doce —
Total Consumer Discretionary
1,591,063
SP ADR†
710
24,594
CONSUMER STAPLES 5.8%
Nalco Holding Co.†
1,090
23,054
Molson Coors Brewing Co. —
Celanese Corp.
520
20,306
Class BD
3,991
209,807
Praxair, Inc.
180
15,161
Reynolds American, Inc.†D
2,460
145,214
Barrick Gold Corp.
300
13,035
Energizer Holdings, Inc.*D
1,510
136,625
Air Products & Chemicals, Inc.
140
12,880
Philip Morris International, Inc.*D
2,530
127,967
POSCO — SP ADR
100
11,898
Safeway, Inc.D
4,311
126,528
Goldcorp, Inc.†
290
11,238
Wal-Mart Stores, Inc.D
2,260
119,057
Agrium, Inc.
160
9,938
Loews Corp. - Carolina Group†D
1,100
79,805
Sigma-Aldrich Corp.
150
8,948
Unilever NV†D
2,100
70,833
PPG Industries, Inc.
130
7,866
Diageo PLC — SP ADRD
810
65,869
Teck Cominco Ltd. — Class B
190
7,782
Pepsi Bottling Group, Inc.†D
1,890
64,090
Newmont Mining Corp.†
170
7,701
PepsiAmericas, Inc.†D
2,380
60,761
Huntsman Corp.
260
6,123
Archer-Daniels-Midland Co.D
1,420
58,447
Freeport-McMoRan Copper &
Altria Group, Inc.D
2,530
56,166
Gold, Inc.†
50
4,811
Bunge Ltd.†D
600
52,128
Total Materials
1,286,484
SUPERVALU, INC.†
1,060
31,779
TELECOMMUNICATION SERVICES 4.5%
CVS Corp.
780
31,598
Verizon Communications, Inc.D
5,981
218,007
Cadbury Schweppes PLC —
SBA Communications Corp.*D
5,631
167,973
SP ADR
650
28,743
Vodafone Group PLC — SP ADRD
4,391
129,578
Herbalife Ltd.
510
24,225
Telefonica SA — SP ADRD
1,330
115,058
Coca-Cola Co.
350
21,305
U.S. Cellular Corp.*†D
1,820
100,100
UST, Inc.†
370
20,172
AT&T, Inc.D
2,590
99,197
Dean Foods Co.
870
17,478
CenturyTel, Inc.†D
2,710
90,080
Universal Corp.
160
10,485
Telephone & Data Systems, Inc.D
1,670
65,581
NBTY, Inc.*
240
7,188
Deutsche Telekom AG —
Hansen Natural Corp.*†
180
6,354
SP ADR†D
2,740
45,429
Vector Group Ltd.†
360
6,332
France Telecom SA — SP ADR
1,170
39,289
Total Consumer Staples
1,578,956
China Mobile Ltd. — SP ADR
500
37,505
MATERIALS 4.7%
NII Holdings, Inc. — Class B*†
800
25,424
United States Steel Corp.D
1,050
133,213
Telecom Italia — SP ADR
1,040
21,726
E.I. du Pont de Nemours and Co.†D
2,260
105,678
America Movil SAB de CV —
Rio Tinto PLC — SP ADR†D
220
90,605
SP ADR
330
21,018
Steel Dynamics, Inc.D
2,440
80,618
Vimpel-Communications —
SP ADR
420
12,554
See Notes to Financial Statements.
THE RYDEX SERIES FUNDS ANNUAL REPORT
|
53
SCHEDULE OF INVESTMENTS (continued)
March 31, 2008
HEDGED EQUITY FUND
MARKET
MARKET
VALUE
VALUE
SHARES
(NOTE 1)
SHARES
(NOTE 1)
Mobile Telesystems — SP ADR
160
$
12,136
Nuveen Core Equity
Rogers Communications, Inc. —
Alpha FundD
8,420
$
123,437
Class B†
230
8,262
iShares Dow Jones US Financial
Turkcell Iletisim Hizmet AS, Inc. —
Sector Index Fund
1
82
SP ADR
380
7,938
Total Exchange Traded Funds
American Tower Corp. —
(Cost $2,672,797)
2,741,831
Class A*
170
6,666
Philippine Long Distance
FACE
Telephone Co. — SP ADR†
90
5,981
AMOUNT
SK Telecom Co. Ltd. — SP ADR†
250
5,402
Crown Castle
REPURCHASE AGREEMENTS 10.3%
International Corp.*†
120
4,139
Repurchase Agreements (Note 5)
MetroPCS
Mizuho Financial Group, Inc.
Communications, Inc.*†
220
3,740
issued 03/31/08 at 1.30%
Windstream Corp.†
290
3,466
due 04/01/08
1,416,580
1,416,580
Citizens Communications Co.†
100
1,049
Lehman Brothers Holdings, Inc.
issued 03/31/08 at 1.15%
Total Telecommunication Services
1,247,298
due 04/01/08†D
1,118,504
1,118,504
UTILITIES 3.5%
Morgan Stanley issued
NRG Energy, Inc.*†D
3,820
148,942
03/31/08 at 1.35%
Public Service
due 04/01/08
295,121
295,121
Enterprise Group, Inc.D
3,400
136,646
Total Repurchase Agreements
PPL Corp.D
2,110
96,891
(Cost $2,830,205)
2,830,205
Constellation Energy Group, Inc. D
940
82,974
CenterPoint Energy, Inc.†D
5,621
80,212
SHARES
Southern Union Co.†D
3,200
74,464
Duke Energy Corp.†D
3,971
70,882
SECURITIES LENDING COLLATERAL 10.3%
Reliant Energy, Inc.*D
2,400
56,760
Mount Vernon Securities Lending
Sierra Pacific Resources
3,040
38,395
Trust Prime Portfolio (Note 9)
2,828,047
2,828,047
Xcel Energy, Inc.
1,910
38,105
Total Securities Lending Collateral
Energen Corp.†
590
36,757
(Cost $2,828,047)
2,828,047
Entergy Corp.
300
32,724
Total Long Securities 97.4%
PG&E Corp.†
870
32,033
(Cost $27,533,864)
$26,738,029
SCANA Corp.
560
20,485
TECO Energy, Inc.†
780
12,441
COMMON STOCKS SOLD SHORT (55.2)%
Total Utilities
958,711
Total Common Stocks
TELECOMMUNICATION SERVICES (0.3)%
(Cost $19,202,815)
18,337,946
Leap Wireless International, Inc.*
110
(5,126)
Sprint Nextel Corp.
990
(6,623)
EXCHANGE TRADED FUNDS 10.0%
Level 3 Communications, Inc.*
33,870
(71,805)
iShares MSCI Emerging Markets
Total Telecommunication Services
(83,554)
Index FundD
13,680
1,838,319
MATERIALS (3.4)%
Nuveen Equity Premium and
Eastman Chemical Co.
41
(2,507)
Growth Fund†D
8,270
132,320
International Flavors &
Nuveen Equity Premium
Fragrances, Inc.
450
(19,822)
Opportunity FundD
8,560
131,139
Scotts Miracle-Gro Co. —
Eaton Vance Tax-Managed
Class A
670
(21,721)
Buy-Write Opportunities FundD
8,240
130,934
Vulcan Materials Co.
350
(23,240)
Liberty All Star Equity FundD
20,360
130,100
Ecolab, Inc.
600
(26,058)
Eaton Vance Tax-Managed
Allegheny Technologies, Inc.
380
(27,117)
Buy-Write Income FundD
7,930
129,021
Nucor Corp.
490
(33,193)
First Trust Enhanced Equity
Louisiana-Pacific Corp.
3,790
(34,792)
Income Fund, Inc.D
8,820
126,479
Eagle Materials, Inc.
1,020
(36,261)
54
|
THE RYDEX SERIES FUNDS ANNUAL REPORT
See Notes to Financial Statements.
SCHEDULE OF INVESTMENTS (continued)
March 31, 2008
HEDGED EQUITY FUND
MARKET
MARKET
VALUE
VALUE
SHARES
(NOTE 1)
SHARES
(NOTE 1)
Sonoco Products Co.
1,470
$
(42,086)
Chico’s FAS, Inc.*
1,790
$
(12,727)
Weyerhaeuser Co.
840
(54,634)
Ryland Group, Inc.
430
(14,143)
Ashland, Inc.
1,180
(55,814)
Scientific Games Corp. —
Pactiv Corp.*
2,730
(71,553)
Class A*
670
(14,144)
Westlake Chemical Corp.
5,980
(78,039)
Wendy’s International, Inc.
710
(16,373)
Crown Holdings, Inc.*
4,030
(101,395)
Coldwater Creek, Inc.*
3,290
(16,614)
Sealed Air Corp.
4,950
(124,988)
Warner Music Group Corp.
3,440
(17,131)
Bemis Co., Inc.
7,030
(178,773)
Pool Corp.
920
(17,379)
Total Materials
(931,993)
Lennar Corp. — Class A
950
(17,869)
CONSUMER STAPLES (3.9)%
Gannett Co., Inc.
620
(18,011)
Del Monte Foods Co.
270
(2,573)
Las Vegas Sands Corp.*
290
(21,356)
Constellation Brands, Inc. —
Wyndham Worldwide Corp.
1,050
(21,714)
Class A*
640
(11,309)
Eastman Kodak Co.
1,270
(22,441)
Whole Foods Market, Inc.
1,540
(50,774)
AnnTaylor Stores Corp.*
980
(23,696)
Rite Aid Corp.*
22,400
(65,856)
Foot Locker, Inc.
2,050
(24,129)
Sara Lee Corp.
5,740
(80,245)
Toll Brothers, Inc.*
1,040
(24,419)
Bare Escentuals, Inc.*
4,030
(94,382)
OfficeMax, Inc.
1,700
(32,538)
Alberto-Culver Co.
3,490
(95,661)
Urban Outfitters, Inc.*
1,130
(35,426)
Walgreen Co.
2,880
(109,699)
Coach, Inc.*
1,230
(37,085)
WM Wrigley Jr Co.
1,830
(114,997)
Centex Corp.
1,640
(39,704)
Colgate-Palmolive Co.
1,500
(116,865)
Saks, Inc.*
3,270
(40,777)
Hershey Co.
3,580
(134,859)
Marriott International, Inc. —
Avon Products, Inc.
5,150
(203,631)
Class A
1,240
(42,606)
Lowe’s Cos., Inc.
2,090
(47,945)
Total Consumer Staples
(1,080,851)
CBS Corp.
2,290
(50,563)
ENERGY (4.6)%
International Game Technology
1,300
(52,273)
SandRidge Energy, Inc.*
30
(1,175)
H&R Block, Inc.
2,650
(55,014)
Western Refining, Inc.
640
(8,621)
DR Horton, Inc.
3,610
(56,858)
Arch Coal, Inc.
200
(8,700)
General Motors Corp.
3,120
(59,436)
Cheniere Energy, Inc.*
970
(19,206)
Pulte Homes, Inc.
4,100
(59,655)
Teekay Corp.
560
(23,783)
DreamWorks Animation
Massey Energy Co.
680
(24,820)
SKG, Inc. — Class A*
2,550
(65,739)
Patterson-UTI Energy, Inc.
1,180
(30,893)
Interpublic Group of Cos., Inc.*
8,830
(74,260)
Holly Corp.
830
(36,030)
Ford Motor Co.*
14,820
(84,770)
Forest Oil Corp.*
1,350
(66,096)
Starbucks Corp.*
5,330
(93,275)
Sunoco, Inc.
1,300
(68,211)
Sirius Satellite Radio, Inc.*
39,920
(114,171)
Tetra Technologies, Inc.*
5,630
(89,179)
Total Consumer Discretionary
(1,370,869)
Murphy Oil Corp.
1,150
(94,461)
Pioneer Natural Resources Co.
2,000
(98,240)
UTILITIES (5.1)%
Baker Hughes, Inc.
1,500
(102,750)
Dynegy, Inc. — Class A*
1,600
(12,624)
Patriot Coal Corp.*
2,390
(112,258)
DPL, Inc.
890
(22,820)
W&T Offshore, Inc.
3,630
(123,819)
Exelon Corp.
310
(25,194)
Nabors Industries Ltd.*
4,270
(144,198)
AES Corp.*
1,790
(29,839)
BJ Services Co.
7,720
(220,097)
Northeast Utilities
1,280
(31,411)
Oneok, Inc.
960
(42,845)
Total Energy
(1,272,537)
Great Plains Energy, Inc.
2,130
(52,505)
CONSUMER DISCRETIONARY (5.0)%
Atmos Energy Corp.
2,550
(65,025)
Office Depot, Inc.*
110
(1,215)
Consolidated Edison, Inc.
1,670
(66,299)
Jones Apparel Group, Inc.
170
(2,281)
Allegheny Energy, Inc.
1,400
(70,700)
Macy’s, Inc.
260
(5,996)
Equitable Resources, Inc.
1,520
(89,528)
KB Home
300
(7,419)
Ameren Corp.
2,050
(90,282)
JC Penney Co., Inc.
250
(9,427)
Pepco Holdings, Inc.
3,660
(90,475)
Career Education Corp.*
780
(9,922)
NiSource, Inc.
5,870
(101,199)
Apollo Group, Inc. — Class A*
240
(10,368)
Pinnacle West Capital Corp.
3,500
(122,780)
See Notes to Financial Statements.
THE RYDEX SERIES FUNDS ANNUAL REPORT
|
55
SCHEDULE OF INVESTMENTS (continued)
March 31, 2008
HEDGED EQUITY FUND
MARKET
MARKET
VALUE
VALUE
SHARES
(NOTE 1)
SHARES
(NOTE 1)
OGE Energy Corp.
4,190
$
(130,602)
Warner Chilcott*
3,340
$
(60,120)
Aqua America, Inc.
8,300
(155,874)
Merck & Co., Inc.
1,610
(61,099)
Hawaiian Electric Industries, Inc.
8,390
(200,269)
Omnicare, Inc.
3,560
(64,650)
Total Utilities
(1,400,271)
Allergan, Inc.
1,330
(74,999)
INFORMATION TECHNOLOGY (6.7)%
Bristol-Myers Squibb Co.
3,880
(82,644)
VeriFone Holdings, Inc.*
421
(6,693)
Celgene Corp.*
1,480
(90,709)
Marvell Technology Group Ltd.*
1,030
(11,206)
Abbott Laboratories
1,680
(92,652)
Google, Inc. — Class A*
30
(13,214)
Millennium
Riverbed Technology, Inc.*
950
(14,117)
Pharmaceuticals, Inc.*
6,120
(94,615)
EchoStar Corp. — Class A*
660
(19,496)
Boston Scientific Corp.*
7,570
(97,426)
Cognizant Technology
APP Pharmaceuticals, Inc.*
8,250
(99,660)
Solutions Corp. — Class A*
860
(24,794)
Tenet Healthcare Corp.*
20,290
(114,841)
National Instruments Corp.
990
(25,879)
Vertex Pharmaceuticals, Inc.*
5,360
(128,050)
BEA Systems, Inc.*
1,650
(31,598)
Gilead Sciences, Inc.*
2,520
(129,856)
QLogic Corp.*
2,560
(39,296)
Amgen, Inc.*
3,350
(139,963)
LSI Logic Corp.*
8,480
(41,976)
Johnson & Johnson
3,010
(195,259)
Novell, Inc.*
6,780
(42,646)
Total Health Care
(1,914,414)
Motorola, Inc.
4,590
(42,687)
INDUSTRIALS (7.2)%
Sanmina-SCI Corp.*
31,080
(50,350)
Fluor Corp.
30
(4,235)
Micron Technology, Inc.*
8,470
(50,566)
US Airways Group, Inc.*
820
(7,306)
Jabil Circuit, Inc.
5,560
(52,598)
Hubbell, Inc. — Class B
290
(12,670)
Activision, Inc.*
2,000
(54,620)
Trinity Industries, Inc.
530
(14,124)
Paychex, Inc.
1,770
(60,640)
YRC Worldwide, Inc.*
1,370
(17,974)
Lexmark International, Inc. —
Avis Budget Group, Inc.*
2,100
(22,302)
Class A*
2,160
(66,355)
ChoicePoint, Inc.*
530
(25,228)
Intel Corp.
3,550
(75,189)
UTi Worldwide, Inc.
1,460
(29,317)
Akamai Technologies, Inc.*
2,700
(76,032)
Monster Worldwide, Inc.*
1,300
(31,473)
Advanced Micro Devices, Inc.*
14,190
(83,579)
Brink’s Co.
550
(36,949)
Adobe Systems, Inc.*
2,400
(85,416)
Alexander & Baldwin, Inc.
880
(37,910)
Acxiom Corp.
7,870
(93,417)
Dun & Bradstreet Corp.
470
(38,249)
Tech Data Corp.*
2,860
(93,808)
Graco, Inc.
1,090
(39,523)
Unisys Corp.*
21,380
(94,713)
HNI Corp.
1,730
(46,520)
NetApp, Inc.*
5,510
(110,476)
Fastenal Co.
1,020
(46,849)
Salesforce.com, Inc.*
1,980
(114,583)
WESCO International, Inc.*
1,330
(48,532)
Electronic Arts, Inc.*
3,320
(165,734)
FedEx Corp.
540
(50,042)
JDS Uniphase Corp.*
15,480
(207,277)
Cintas Corp.
1,780
(50,801)
Total Information Technology
(1,848,955)
Rockwell Collins, Inc.
940
(53,721)
HEALTH CARE (7.0)%
Corporate Executive Board Co.
1,420
(57,482)
PDL BioPharma, Inc.*
370
(3,918)
CH Robinson Worldwide, Inc.
1,200
(65,280)
Mylan, Inc.
880
(10,208)
Tyco International Ltd.
1,670
(73,563)
Health Management
Continental Airlines, Inc.*
3,830
(73,651)
Associates, Inc. — Class A*
2,830
(14,971)
Owens Corning, Inc.*
4,160
(75,421)
King Pharmaceuticals, Inc.*
2,180
(18,966)
Pitney Bowes, Inc.
2,180
(76,344)
Intuitive Surgical, Inc.*
60
(19,461)
General Electric Co.
2,310
(85,493)
Cooper Cos., Inc.
640
(22,035)
AMR Corp.*
9,700
(87,494)
Advanced Medical Optics, Inc.*
1,120
(22,736)
Robert Half International, Inc.
3,670
(94,466)
Varian Medical Systems, Inc.*
570
(26,699)
Masco Corp.
5,020
(99,547)
Sepracor, Inc.*
1,500
(29,280)
Expeditors International
Abraxis Bioscience/New, Inc.*
580
(34,266)
Washington, Inc.
3,780
(170,780)
Forest Laboratories, Inc.*
860
(34,409)
United Parcel Service, Inc. —
Amylin Pharmaceuticals, Inc.*
1,510
(44,107)
Class B
2,610
(190,582)
Hospira, Inc.*
1,100
(47,047)
Southwest Airlines Co.
17,650
(218,860)
CR Bard, Inc.
620
(59,768)
Total Industrials
(1,982,688)
56
|
THE RYDEX SERIES FUNDS ANNUAL REPORT
See Notes to Financial Statements.
SCHEDULE OF INVESTMENTS (continued)
March 31, 2008
HEDGED EQUITY FUND
MARKET
MARKET
VALUE
VALUE
SHARES
(NOTE 1)
SHARES
(NOTE 1)
FINANCIALS (12.0)%
Fifth Third Bancorp
2,590
$
(54,183)
Westamerica Bancorporation
40
$
(2,104)
Conseco, Inc.*
5,350
(54,570)
Nasdaq OMX Group*
60
(2,320)
Astoria Financial Corp.
2,090
(56,764)
CIT Group, Inc.
240
(2,844)
Lazard — Class A
1,490
(56,918)
CapitalSource, Inc.
470
(4,545)
Washington Mutual, Inc.
5,540
(57,062)
CME Group, Inc.
10
(4,691)
Bank of New York Mellon Corp.
1,370
(57,170)
Bear Stearns Cos., Inc.
460
(4,825)
Kimco Realty Corp.
1,560
(61,105)
Legg Mason, Inc.
90
(5,038)
Zions Bancorporation
1,370
(62,404)
State Street Corp.
100
(7,900)
Capital One Financial Corp.
1,360
(66,939)
PMI Group, Inc.
1,740
(10,127)
Popular, Inc.
6,130
(71,476)
Merrill Lynch & Co., Inc.
270
(11,000)
Allied Capital Corp.
3,970
(73,167)
First Marblehead Corp.
1,480
(11,041)
Ventas, Inc.
1,760
(79,042)
BRE Properties, Inc.
290
(13,212)
Leucadia National Corp.
1,780
(80,492)
Liberty Media Corp. - Capital*
850
(13,379)
Sovereign Bancorp, Inc.
8,770
(81,736)
iStar Financial, Inc.
1,040
(14,591)
Federal Realty Invs Trust
1,050
(81,848)
Citigroup, Inc.
760
(16,279)
NYSE Euronext
1,330
(82,074)
SEI Investments Co.
660
(16,295)
CB Richard Ellis Group, Inc. —
Old Republic International Corp.
1,300
(16,783)
Class A*
3,900
(84,396)
Forest City Enterprises, Inc. —
Macerich Co.
1,220
(85,729)
Class A
460
(16,928)
M&T Bank Corp.
1,120
(90,138)
First Horizon National Corp.
1,570
(21,996)
PartnerRe
1,200
(91,560)
XL Capital
770
(22,753)
Simon Property Group, Inc.
990
(91,981)
Essex Property Trust, Inc.
200
(22,796)
People’s United Financial, Inc.
5,480
(94,859)
Duke Realty Corp.
1,070
(24,407)
Regions Financial Corp.
5,280
(104,280)
National City Corp.
2,510
(24,975)
Moody’s Corp.
3,340
(116,332)
Arthur J Gallagher & Co.
1,070
(25,273)
HCP, Inc.
4,820
(162,964)
Federal National
Total Financials
(3,279,548)
Mortgage Association
1,010
(26,583)
Total Common Stocks Sold Short
Freddie Mac
1,060
(26,839)
(Proceeds $15,965,728)
(15,165,680)
Student Loan Corp.
280
(27,692)
Whitney Holding Corp.
1,170
(29,004)
CONTRACTS
Colonial BancGroup, Inc.
3,040
(29,275)
CBL & Associates
OPTIONS WRITTEN (1.3)%
Properties, Inc.
1,390
(32,707)
Call Options on:
Capitol Federal Financial
920
(34,482)
April 2008 S&P 500 Index
Webster Financial Corp.
1,270
(35,395)
Futures Contracts
First American Corp.
1,060
(35,976)
Expiring April 2008
UDR, Inc.
1,510
(37,025)
with strike price of 1260
19
(348,175)
Cincinnati Financial Corp.
1,060
(40,322)
Total Options Written
Kilroy Realty Corp.
850
(41,744)
(Premiums Received $394,178)
(348,175)
Regency Centers Corp.
650
(42,094)
Other Assets in Excess
Brown & Brown, Inc.
2,440
(42,407)
of Liabilities – 59.1%
$16,217,604
Liberty Property Trust
1,370
(42,621)
Net Assets – 100.0%
$27,441,778
Developers
Diversified Realty Corp.
1,020
(42,718)
UNREALIZED
GAIN
Everest Re Group
510
(45,660)
CONTRACTS
(NOTE 1)
Huntington Bancshares, Inc.
4,300
(46,225)
Endurance
FUTURES CONTRACTS PURCHASED
Specialty Holdings Ltd.
1,310
(47,946)
June 2008 S&P 500 Index
Brandywine Realty Trust
2,900
(49,184)
Mini Futures ContractsD
SLM Corp.*
3,300
(50,655)
(Aggregate Market Value of
AvalonBay Communities, Inc.
530
(51,156)
Contracts $10,511,888)
159
$
86,072
New York
Community Bancorp, Inc.
2,920
(53,202)
Franklin Resources, Inc.
550
(53,345)
See Notes to Financial Statements.
THE RYDEX SERIES FUNDS ANNUAL REPORT
|
57
SCHEDULE OF INVESTMENTS (concluded)
March 31, 2008
HEDGED EQUITY FUND
UNREALIZED
GAIN
CONTRACTS
(NOTE 1)
June 2008 Russell 2000 Index
Mini Futures Contracts
(Aggregate Market Value of
Contracts $1,925,000)
28
$
42,848
June 2008 S&P MidCap 400 Index
Mini Futures Contracts
(Aggregate Market Value of
Contracts $1,405,620)
18
38,026
June 2008 Nikkei-225 Stock Average
Index Futures Contracts
(Aggregate Market Value of
Contracts $2,156,450)
34
34,926
(Total Aggregate Market Value of
Contracts $15,998,958)
$
201,872
*
Non-Income Producing Security.
†
All or a portion of this security is on loan at March 31, 2008 -— See Note 9.
D
All or a portion of this security is pledged as short security collateral at March 31, 2008.
ADR—American Depository Receipt.
REIT—Real Estate Investment Trust.
58
|
THE RYDEX SERIES FUNDS ANNUAL REPORT
See Notes to Financial Statements.
SCHEDULE OF INVESTMENTS
March 31, 2008
INTERNATIONAL ROTATION FUND
MARKET
UNREALIZED
VALUE
GAIN (LOSS)
SHARES
(NOTE 1)
CONTRACTS
(NOTE 1)
EXCHANGE TRADED FUNDS 40.6%
FUTURES CONTRACTS PURCHASED
iShares MSCI Australia
April 2008 IBEX 35 Index
Index Fund
183,100
$
4,716,656
Futures Contracts
Vanguard European ETF
41,700
2,865,624
(Aggregate Market Value of
iShares MSCI Belgium
Contracts $2,087,357)
10
$
9,329
Index Fund
102,500
2,429,250
April 2008 Hang Seng Index
iShares MSCI Pacific ex-Japan
Futures Contracts
Index Fund
17,500
2,372,650
(Aggregate Market Value of
iShares MSCI Sweden
Contracts $2,034,190)
14
9,064
Index Fund
5,500
165,275
June 2008 Toronto Stock Exchange
Total Exchange Traded Funds
60 Index Futures Contracts
(Cost $13,494,447)
12,549,455
(Aggregate Market Value of
Contracts $6,593,669)
43
(24,435)
FACE
June 2008 S&P/MIB Index
AMOUNT
Futures Contracts
(Aggregate Market Value of
REPURCHASE AGREEMENTS 54.3%
Contracts $7,031,017)
29
(214,062)
Repurchase Agreements (Note 5)
Mizuho Financial Group, Inc.
(Total Aggregate Market Value of
issued 03/31/08 at 1.30%
Contracts $17,746,233)
$
(220,104)
due 04/01/08
$9,626,781
9,626,781
Lehman Brothers Holdings, Inc.
issued 03/31/08 at 1.15%
due 04/01/08
5,120,556
5,120,556
Morgan Stanley
issued 03/31/08 at 1.35%
due 04/01/08
2,005,579
2,005,579
Total Repurchase Agreements
(Cost $16,752,916)
16,752,916
Total Investments 94.9%
(Cost $30,247,363)
$29,302,371
Other Assets in Excess
of Liabilities – 5.1%
$
1,559,321
Net Assets – 100.0%
$30,861,692
UNREALIZED
GAIN (LOSS)
CONTRACTS
(NOTE 1)
FOREIGN CURRENCY FUTURES
CONTRACTS PURCHASED
June 2008 Euro Currency
Futures Contracts
(Aggregate Market Value of
Contracts $8,849,250)
45
$
246,985
June 2008 Canadian Dollar
Currency Futures Contracts
(Aggregate Market Value of
Contracts $6,319,950)
65
(187,325)
(Total Aggregate Market Value
of Contracts $15,169,200)
$
59,660
See Notes to Financial Statements.
THE RYDEX SERIES FUNDS ANNUAL REPORT
|
59
SCHEDULE OF INVESTMENTS
March 31, 2008
MANAGED FUTURES STRATEGY FUND
MARKET
MARKET
VALUE
FACE
VALUE
SHARES
(NOTE 1)
AMOUNT
(NOTE 1)
EXCHANGE TRADED FUNDS 3.5%
Swedish Export Credit Corp.,
PowerShares DB Energy Fund
154,241
$
6,024,654
S&P Diversified Trends
PowerShares DB
Indicator Total Return
Agriculture Fund†
92,094
3,356,826
Linked Notes 3.07%
iShares Lehman 20+ Year
due 05/23/08
$10,000,000
$
12,984,333
Treasury Bond Fund†
26,728
2,562,948
Swedish Export Credit Corp.,
iShares Lehman 7-10 Year
S&P Diversified Trends
Treasury Bond Fund†
27,758
2,545,131
Indicator Total Return
PowerShares DB Base
Linked Notes 3.16%
Metals Fund†
63,516
1,601,238
due 11/17/08
10,000,000
12,499,622
PowerShares DB Precious
Swedish Export Credit Corp.,
Metals Fund
46,927
1,595,049
S&P Diversified Trends
Total Exchange Traded Funds
Indicator Total Return
(Cost $18,074,894)
17,685,846
Linked Notes 2.87%
due 12/22/08
10,000,000
12,153,291
CURRENCY TRUSTSD 2.0%
Merrill Lynch & Co.,
CurrencyShares Euro Trust†
28,088
4,446,050
S&P Diversified Trends
CurrencyShares
Indicator Price Return
Japanese Yen Trust*†
40,768
4,086,584
Linked Notes 2.87%
CurrencyShares
due 06/13/08
9,000,000
11,824,060
Swiss Franc Trust
6,790
685,451
Goldman Sachs Group, Inc.,
CurrencyShares
S&P Diversified Trends
Australian Dollar Trust
7,190
660,617
Indicator Total Return
CurrencyShares
Linked Notes 2.58%
Canadian Dollar Trust†
3,350
327,228
due 03/26/09
12,000,000
11,119,995
Total Exchange Traded Trusts
Swedish Export Credit Corp.,
(Cost $10,272,709)
10,205,930
S&P Diversified Trends
Indicator Total Return
FACE
Linked Notes 3.95%
AMOUNT
due 07/25/08
7,000,000
8,910,531
Swedish Export Credit Corp.,
STRUCTURED NOTES†† 31.5%
S&P Diversified Trends
Exportfinans, S&P Diversified
Indicator Total Return
Trends Indicator Total Return
Linked Notes 4.49%
Linked Notes 4.06%
due 04/17/08
5,000,000
6,597,396
due 01/26/09
$22,000,000
24,619,601
Total Structured Notes
Goldman Sachs Group, Inc.,
(Cost $140,000,000)
156,572,671
S&P Diversified Trends
Indicator Total Return
REPURCHASE AGREEMENTS 60.0%
Linked Notes 3.07%
Repurchase Agreements (Note 5)
due 02/17/09
20,000,000
22,078,228
Mizuho Financial Group, Inc.
Swedish Export Credit Corp.,
issued 03/31/08 at 1.30%
S&P Diversified Trends
due 04/01/08
171,455,383
171,455,383
Indicator Total Return
Lehman Brothers Holdings, Inc.
Linked Notes 3.00%
issued 03/31/08 at 1.15%
due 03/16/09
20,000,000
19,460,083
due 04/01/08
91,198,378
91,198,378
Merrill Lynch & Co.,
Morgan Stanley
S&P Diversified Trends
issued 03/31/08 at 1.35%
Indicator Price Return
due 04/01/08
35,719,871
35,719,871
Linked Notes 2.87%
due 03/16/09
15,000,000
14,325,531
Total Repurchase Agreements
(Cost $298,373,632)
298,373,632
60
|
THE RYDEX SERIES FUNDS ANNUAL REPORT
See Notes to Financial Statements.
SCHEDULE OF INVESTMENTS (concluded)
March 31, 2008
MANAGED FUTURES STRATEGY FUND
MARKET
VALUE
SHARES
(NOTE 1)
SECURITIES LENDING COLLATERAL 2.1%
Mount Vernon Securities Lending
Trust Prime Portfolio (Note 9)
10,274,354
$
10,274,354
Total Securities Lending Collateral
(Cost $10,274,354)
10,274,354
Total Long Securities 99.1%
(Cost $476,995,589)
$ 493,112,433
CURRENCY TRUST SOLD SHORT (0.2)%
CurrencyShares British
Pound Sterling Trust D
5,000
(996,350)
Total Exchange Traded Trust Sold Short
(Proceeds $1,011,031)
(996,350)
Other Assets in Excess
of Liabilities – 1.1%
$
5,305,553
Net Assets – 100.0%
$ 497,421,636
*
Non-Income Producing Security.
†
All or a portion of this security is on loan at March 31, 2008 — See Note 9.
††
Structured Notes are leveraged, providing an exposure to the underlying benchmark of three times the face amount. The total
exposure to the return would be $72,000,000 and $348,000,000 for the S&P Diversified Trends Indicator Price Return and the
S&P Diversified Trends Indicator Total Return, respectively, as of March 31, 2008 — See Note 2.
D
Affiliated Trusts.
See Notes to Financial Statements.
THE RYDEX SERIES FUNDS ANNUAL REPORT
|
61
SCHEDULE OF INVESTMENTS
March 31, 2008
REAL ESTATE FUND
MARKET
MARKET
VALUE
VALUE
SHARES
(NOTE 1)
SHARES
(NOTE 1)
COMMON STOCKS 99.1%
Apartment Investment &
Management Co. — Class A
6,390
$
228,826
REAL ESTATE INVESTMENT TRUSTS (REITS) 90.2%
Essex Property Trust, Inc.†
1,971
224,655
DIVERSIFIED REITS 6.9%
Camden Property Trust†
4,240
212,848
Vornado Realty Trust†
5,071
$
437,171
BRE Properties, Inc. — Class A†
4,426
201,649
Liberty Property Trust
6,977
217,054
Post Properties, Inc.†
4,397
169,812
Washington Real Estate
Home Properties, Inc.†
3,307
158,703
Investment Trust
4,837
161,652
Mid-America Apartment
Cousins Properties, Inc.†
5,867
144,974
Communities, Inc.†
2,922
145,632
PS Business Parks, Inc.
2,590
134,421
Equity Lifestyle Properties, Inc.†
2,847
140,556
Colonial Properties Trust†
5,491
132,059
American Campus Communities,
Gramercy Capital Corp./New York†
4,544
95,106
Inc.†
3,760
102,874
Total Diversified REITs
1,322,437
Total Residential REITs
2,614,166
INDUSTRIAL REITS 6.3%
RETAIL REITS 22.3%
ProLogis†
8,041
473,293
Simon Property Group, Inc.†
6,238
579,573
AMB Property Corp.†
5,182
282,004
KIMCO Realty Corp.†
10,699
419,080
DCT Industrial Trust, Inc.†
16,510
164,440
General Growth Properties, Inc.†
10,269
391,968
First Industrial Realty Trust, Inc.†
4,422
136,596
Developers Diversified Realty
Eastgroup Properties, Inc.†
2,830
131,482
Corp.†
7,149
299,400
Total Industrial REITs
1,187,815
Macerich Co.†
4,088
287,264
MORTGAGE REITS 3.9%
Federal Realty Investment Trust†
3,525
274,774
Annaly Capital Management, Inc.†
17,239
264,101
Regency Centers Corp.
4,183
270,891
Redwood Trust, Inc.†
3,730
135,585
Weingarten Realty Investors†
6,413
220,864
CapitalSource, Inc.†
13,727
132,740
Taubman Centers, Inc.†
3,977
207,202
iStar Financial, Inc.†
8,939
125,414
Realty Income Corp.†
7,954
203,781
MFA Mortgage Investments, Inc.†
13,374
84,256
Equity One, Inc.†
6,969
167,047
Thornburg Mortgage, Inc.†
14,519
15,390
Alexander’s, Inc.*
460
163,070
CBL & Associates Properties, Inc.†
6,430
151,298
Total Mortgage REITs
757,486
National Retail Properties, Inc.†
6,841
150,844
OFFICE REITS 14.8%
Tanger Factory Outlet Centers,
Boston Properties, Inc.†
4,345
400,044
Inc.†
3,566
137,184
SL Green Realty Corp.†
3,135
255,408
Inland Real Estate Corp.†
8,340
126,851
Duke Realty Corp.
9,728
221,896
Pennsylvania Real Estate Investment
Mack-Cali Realty Corp.
5,666
202,333
Trust†
4,801
117,096
Alexandria Real Estate Equities,
Acadia Realty Trust†
4,440
107,226
Inc.†
2,159
200,182
Total Retail REITs
4,275,413
Douglas Emmett, Inc.
8,426
185,878
Digital Realty Trust, Inc.†
5,143
182,576
SPECIALIZED REITS 22.5%
Highwoods Properties, Inc.†
5,379
167,125
Public Storage, Inc.†
5,730
507,793
Corporate Office Properties Trust
Host Hotels & Resorts, Inc.†
21,160
336,867
SBI†
4,939
166,000
HCP, Inc.†
9,830
332,352
BioMed Realty Trust, Inc.†
6,489
155,022
Plum Creek Timber Co., Inc. (REIT)†
7,638
310,867
Kilroy Realty Corp.
3,038
149,196
Ventas, Inc.†
6,669
299,505
Brandywine Realty Trust†
8,536
144,771
Health Care REIT, Inc.†
5,222
235,669
HRPT Properties Trust†
20,572
138,450
Rayonier, Inc.
5,139
223,238
American Financial Realty Trust†
14,963
118,806
Hospitality Properties Trust†
6,528
222,083
Lexington Realty Trust†
8,030
115,712
Nationwide Health Properties, Inc.†
6,335
213,806
Maguire Properties, Inc.†
4,900
70,119
Senior Housing Properties Trust
7,683
182,087
Potlatch Corp.
3,670
151,461
Total Office REITs
2,873,518
Entertainment Properties Trust†
2,904
143,254
RESIDENTIAL REITS 13.5%
Healthcare Realty Trust, Inc.†
5,427
141,916
Equity Residential†
10,687
443,404
Omega Healthcare Investors, Inc.†
7,788
135,200
AvalonBay Communities, Inc.†
3,607
348,148
Extra Space Storage, Inc.†
8,343
135,073
UDR, Inc.†
9,668
237,059
LaSalle Hotel Properties†
4,437
127,475
62
|
THE RYDEX SERIES FUNDS ANNUAL REPORT
See Notes to Financial Statements.
SCHEDULE OF INVESTMENTS (concluded)
March 31, 2008
REAL ESTATE FUND
MARKET
VALUE
SHARES
(NOTE 1)
Sovran Self Storage, Inc.†
2,910
$
124,286
DiamondRock Hospitality Co.†
9,807
124,255
Strategic Hotels & Resorts, Inc.
8,600
112,918
Sunstone Hotel Investors, Inc.†
7,050
112,870
Ashford Hospitality Trust, Inc.†
17,150
97,412
FelCor Lodging Trust, Inc.†
8,021
96,493
Total Specialized REITs
4,366,880
Total REITs
17,397,715
REAL ESTATE MANAGEMENT & DEVELOPMENT 8.9%
Brookfield Asset Management,
Inc. — Class A
16,065
431,024
Brookfield Properties Corp.
17,570
339,277
CB Richard Ellis Group, Inc. —
Class A*
13,591
294,109
The St. Joe Co.†
5,766
247,534
Jones Lang LaSalle, Inc.†
2,840
219,646
Forest City Enterprises, Inc. —
Class A
5,466
201,149
Total Real Estate Management &
Development
1,732,739
Total Common Stocks
(Cost $17,316,698)
19,130,454
FACE
AMOUNT
REPURCHASE AGREEMENT 0.3%
Repurchase Agreement (Note 5)
Lehman Brothers Holdings, Inc.
issued 03/31/08 at 1.15%
due 04/01/08
$52,432
52,432
Total Repurchase Agreement
(Cost $52,432)
52,432
SHARES
SECURITIES LENDING COLLATERAL 30.8%
Mount Vernon Securities
Lending Trust Prime
Portfolio (Note 9)
5,947,121
5,947,121
Total Securities Lending Collateral
(Cost $5,947,121)
5,947,121
Total Investments 130.2%
(Cost $23,316,251)
$25,130,007
Liabilities in Excess of
Other Assets – (30.2)%
$ (5,833,832)
Net Assets – 100.0%
$19,296,175
*
Non-Income Producing Security.
†
All or a portion of this security is on loan at March 31, 2008 — See Note 9.
REIT—Real Estate Investment Trust.
See Notes to Financial Statements.
THE RYDEX SERIES FUNDS ANNUAL REPORT
|
63
SCHEDULE OF INVESTMENTS
March 31, 2008
STRENGTHENING DOLLAR 2x STRATEGY FUND
MARKET
FACE
VALUE
AMOUNT
(NOTE 1)
REPURCHASE AGREEMENTS 70.9%
Repurchase Agreements (Note 5)
Mizuho Financial Group, Inc.
issued 03/31/08 at 1.30%
due 04/01/08
$15,464,621
$15,464,621
Lehman Brothers Holdings, Inc.
issued 03/31/08 at 1.15%
due 04/01/08
8,225,746
8,225,746
Morgan Stanley issued 03/31/08
at 1.35% due 04/01/08
3,221,796
3,221,796
Total Repurchase Agreements
(Cost $26,912,163)
26,912,163
Total Investments 70.9%
(Cost $26,912,163)
$26,912,163
Other Assets in Excess
of Liabilities – 29.1%
$11,024,885
Net Assets – 100.0%
$37,937,048
UNREALIZED
LOSS
CONTRACTS
(NOTE 1)
FUTURES CONTRACTS PURCHASED
June 2008 U.S. Dollar Index
Futures Contracts
(Aggregate Market Value of
Contracts $21,577,335)
299
$
(148,503)
UNITS
CURRENCY INDEX SWAP AGREEMENT
May 2008 U.S. Dollar Index Swap,
Terminating 05/30/08*
(Notional Market
Value $54,396,421)
754,880
$ (1,848,192)
*
Price Return based on U.S. Dollar Index +/- financing at a variable rate.
64
|
THE RYDEX SERIES FUNDS ANNUAL REPORT
See Notes to Financial Statements.
SCHEDULE OF INVESTMENTS
March 31, 2008
WEAKENING DOLLAR 2x STRATEGY FUND
MARKET
FACE
VALUE
AMOUNT
(NOTE 1)
REPURCHASE AGREEMENTS 66.6%
Repurchase Agreements (Note 5)
Mizuho Financial Group, Inc.
issued 03/31/08 at 1.30%
due 04/01/08
$56,490,656
$
56,490,656
Lehman Brothers Holdings, Inc.
issued 03/31/08 at 1.15%
due 04/01/08
30,047,795
30,047,795
Morgan Stanley issued
03/31/08 at 1.35%
due 04/01/08
11,768,886
11,768,886
Total Repurchase Agreements
(Cost $98,307,337)
98,307,337
Total Investments 66.6%
(Cost $98,307,337)
$
98,307,337
Other Assets in Excess
of Liabilities – 33.4%
$
49,312,613
Net Assets – 100.0%
$ 147,619,950
UNREALIZED
GAIN
CONTRACTS
(NOTE 1)
FUTURES CONTRACTS
SOLD SHORT
June 2008 U.S. Dollar Index
Futures Contracts
(Aggregate Market Value of
Contracts $59,969,115)
831
$
1,000,697
UNITS
CURRENCY INDEX SWAP AGREEMENT
SOLD SHORT
May 2008 U.S. Dollar Index Swap,
Terminating 05/30/08*
(Notional Market
Value $234,788,489)
3,258,250
$
12,069,644
*
Price Return based on U.S. Dollar Index +/- financing at a variable rate.
See Notes to Financial Statements.
THE RYDEX SERIES FUNDS ANNUAL REPORT
|
65
STATEMENTS OF ASSETS AND LIABILITIES
Absolute
Alternative
Multi-Cap
Sector
Return
Strategies
Core Equity
Rotation
Strategies
Allocation
Fund
Fund
Fund
Fund
ASSETS
Investment Securities*
$39,326,605
$424,311,051
$198,850,546
$4,906,196
Repurchase Agreements*
2,108,552
27,275,144
22,719,632
157,148
Segregated Cash with Broker
122,400
—
52,125,250
—
Deposits with Brokers for Securities Sold Short
—
—
97,791,377
—
Receivable for Currency Index Swap Settlement
—
—
—
—
Variation Margin on Futures Contracts
—
—
—
—
Receivable for Securities Sold
—
—
15,188,598
—
Receivable for Fund Shares Sold
26,420
307,938
157,017
221,999
Investment Income Receivable
56,537
590,090
438,474
5
Other Receivables
58,080
—
—
—
Total Assets
41,698,594
452,484,223
387,270,894
5,285,348
LIABILITIES
Short Sales at Market Value**
—
—
91,283,510
—
Written Options at Market Value***
—
—
2,180,675
—
Payable for Currency Index Swap Settlement
—
—
—
—
Variation Margin on Futures Contracts
15,115
—
4,455
—
Payable upon Return of Securities Loaned
9,136,749
108,278,629
39,871,120
—
Payable for Securities Purchased
—
—
14,543,807
117,059
Payable for Fund Shares Redeemed
45,999
409,080
477,134
1,911
Investment Advisory Fees Payable
6,885
246,201
225,977
—
Transfer Agent and Administrative Fees Payable
6,166
68,389
—
—
Distribution and Service Fees Payable
6,835
60,103
36,282
18
Portfolio Accounting Fees Payable
2,466
25,469
—
—
Custody Fees Payable
745
8,441
—
—
Short Sales Dividends Payable
—
—
114,466
—
Other Liabilities
18,790
155,633
—
—
Total Liabilities
9,239,750
109,251,945
148,737,426
118,988
NET ASSETS
$32,458,844
$343,232,278
$238,533,468
$5,166,360
NET ASSETS CONSIST OF
Paid-In Capital
35,270,391
361,859,201
257,255,215
5,196,754
Undistributed Net Investment Income (Loss)
—
—
710,510
247
Accumulated Net Realized Gain (Loss) on Investments
and Futures Contracts
(2,513,296)
(42,063,204)
(22,532,404)
—
Net Unrealized Appreciation (Depreciation) on
Investments and Futures Contracts
(298,251)
23,436,281
3,100,147
(30,641)
NET ASSETS
$32,458,844
$343,232,278
$238,533,468
$5,166,360
A-Class
$
3,361,170
$
49,147,943
$
42,193,242
$1,120,617
C-Class
15,905,945
115,135,562
54,857,257
152,318
H-Class
13,191,729
178,948,773
141,482,969
3,893,425
SHARES OUTSTANDING
A-Class
285,000
3,653,986
1,714,574
45,109
C-Class
1,427,677
8,963,448
2,273,078
6,135
H-Class
1,118,646
13,265,093
5,745,289
156,742
NET ASSET VALUES
A-Class
$11.79
$13.45
$24.61
$24.84
A-Class Maximum Offering Price†
12.38
14.12
25.84
26.08
C-Class
11.14
12.85
24.13
24.83
H-Class
11.79
13.49
24.63
24.84
* The cost of investments is $41,719,028, $428,149,914, $226,650,068, $5,093,985, $147,277,637, $27,533,864, $30,247,363, $476,995,589,
$23,316,251, $26,912,163 and $98,307,337, respectively.
** The proceeds from short sales are $0, $0, $97,792,284, $0, $0, $15,965,728, $0, $1,011,031, $0, $0, and $0, respectively.
*** The premiums received for Written Options at Market Value are $0, $0, $2,468,798, $0, $0, $394,178, $0, $0, 0, $0, and $0, respectively.
† Net asset value adjusted for the maximum sales charge of 4.75% of offering price.
66
|
THE RYDEX SERIES FUNDS ANNUAL REPORT
See Notes to Financial Statements.
March 31, 2008
Managed
Strengthening
Weakening
Commodities
Hedged
International
Futures
Dollar 2x
Dollar 2x
Strategy
Equity
Rotation
Strategy
Real Estate
Strategy
Strategy
Fund
Fund
Fund
Fund
Fund
Fund
Fund
$
74,408,450
$23,907,824
$12,549,455
$194,738,801
$25,077,575
$
—
$
—
86,251,756
2,830,205
16,752,916
298,373,632
52,432
26,912,163
98,307,337
—
2,941,493
1,615,122
3,605,450
—
11,772,338
37,708,191
—
15,965,220
—
1,011,031
—
—
—
—
—
—
—
—
—
12,112,415
—
36,810
8,782
—
—
—
27,200
5,999,634
1,503,059
—
—
—
—
—
866,685
25,605
12,936
11,248,433
992,695
5,559,655
1,258,794
310,901
76,626
587
534,708
85,048
942
3,441
—
33,656
—
—
—
—
—
167,837,426
47,320,498
30,939,798
509,512,055
26,207,750
44,245,098
149,417,378
—
15,165,680
—
996,350
—
—
—
—
348,175
—
—
—
—
—
—
—
—
—
—
2,838,520
—
—
—
25,054
—
—
67,585
51,420
5,673,000
2,828,047
—
10,274,354
5,947,121
—
—
6,544,908
1,475,433
—
—
470,626
—
—
1,179,146
12,093
9,310
203,184
472,808
3,348,445
1,503,752
61,496
26,851
21,469
321,968
8,144
23,990
107,245
36,035
—
5,964
89,435
2,395
6,664
29,790
18,535
3,869
3,586
53,846
1,840
4,033
19,712
14,414
—
2,385
31,783
958
2,666
11,916
4,324
—
716
10,732
287
800
3,575
—
18,572
—
—
—
—
—
46,795
—
9,622
108,767
7,396
15,347
70,018
13,578,653
19,878,720
78,106
12,090,419
6,911,575
6,308,050
1,797,428
$154,258,773
$27,441,778
$30,861,692
$497,421,636
$19,296,175
$37,937,048
$147,619,950
142,151,429
31,962,788
35,844,245
468,919,391
21,852,444
44,132,401
136,494,968
1,407,429
32,482
(2,502,568)
3,663,430
—
(1,856,737)
3,520,639
(2,682,654)
(4,805,580)
(1,374,549)
8,707,290
(4,370,025)
(2,341,921)
(5,465,998)
13,382,569
252,088
(1,105,436)
16,131,525
1,813,756
(1,996,695)
13,070,341
$154,258,773
$27,441,778
$30,861,692
$497,421,636
$19,296,175
$37,937,048
$147,619,950
$
18,579,374
$
5,552,670
$13,482,956
$128,744,282
$
2,865,597
$
2,795,418
$
22,148,424
10,793,145
5,226,350
3,603,357
46,004,597
2,290,140
6,131,097
21,604,215
124,886,254
16,662,758
13,775,379
322,672,757
14,140,438
29,010,533
103,867,311
568,506
242,486
588,117
4,555,784
88,386
140,858
756,789
337,691
232,738
157,792
1,640,684
72,848
315,695
757,336
3,823,410
727,388
600,585
11,418,121
436,474
1,463,116
3,550,726
$32.68
$22.90
$22.93
$28.26
$32.42
$19.85
$29.27
34.31
24.04
24.07
29.67
34.04
20.84
30.73
31.96
22.46
22.84
28.04
31.44
19.42
28.53
32.66
22.91
22.94
28.26
32.40
19.83
29.25
THE RYDEX SERIES FUNDS ANNUAL REPORT
|
67
STATEMENTS OF OPERATIONS
Absolute
Alternative
Multi-Cap
Sector
Return
Strategies
Core Equity
Rotation
Strategies
Allocation
Fund
Fund
Fund
Fund***
INVESTMENT INCOME
Interest†
$
25,131
$
258,405
$
9,221,290
$
267
Income from Securities Lending, net
47,322
419,584
237,032
—
Dividends from Affiliated Funds
—
—
—
—
Dividends, Net of Foreign Tax Withheld*
968,681
5,063,818
3,095,109
—
Total Income
1,041,134
5,741,807
12,553,431
267
EXPENSES
Investment Advisory Fees
252,988
3,307,989
3,474,786
—
Transfer Agent and Administrative Fees
143,282
918,886
—
—
Distribution & Service Fees:
A-Class
10,456
120,530
122,415
—
C-Class
248,389
1,243,218
612,975
20
H-Class
70,728
487,550
479,730
—
Portfolio Accounting Fees
57,313
338,006
—
—
Short Sales Dividend Expense
—
—
1,679,601
—
Trustees’ Fees**
5,965
31,393
—
—
Custody Fees
24,285
110,796
—
—
Miscellaneous
72,889
466,591
—
—
Total Expenses
886,295
7,024,959
6,369,507
20
Less Expenses Waived by Advisor
—
—
—
—
Net Expenses
886,295
7,024,959
6,369,507
20
Net Investment Income (Loss)
154,839
(1,283,152)
6,183,924
247
REALIZED AND UNREALIZED GAIN (LOSS) ON INVESTMENTS
Net Realized Gain (Loss) on:
Investment Securities
1,774,775
(23,253,004)
(13,249,170)
—
Credit Default/Currency Index Swaps
—
—
(3,494,599)
—
Futures Contracts
(47,627)
—
(4,774,234)
—
Securities Sold Short
—
—
6,835,508
—
Total Net Realized Gain (Loss)
1,727,148
(23,253,004)
(14,682,495)
—
Net Change in Unrealized Appreciation (Depreciation) on:
Investment Securities
(9,448,352)
1,680,010
(11,752,198)
(30,641)
Credit Default/Currency Index Swaps
—
—
(147,473)
—
Futures Contracts
(38,390)
—
(468,269)
—
Securities Sold Short
—
—
8,307,009
—
Net Change in Unrealized Appreciation (Depreciation)
(9,486,742)
1,680,010
(4,060,931)
(30,641)
Net Gain (Loss) on Investments
(7,759,594)
(21,572,994)
(18,743,426)
(30,641)
Net Increase (Decrease) in Net Assets
from Operations
$(7,604,755)
$(22,856,146)
$ (12,559,502)
$ (30,394)
* Foreign tax withheld of $0, $134,721, $30,329, $0, $0, $6,667, $0, $0, $2,016, $0 and $0, respectively.
** Relates to Trustees not deemed “interested persons” within the meaning of Section 2(a)(19) of the 1940 Act.
*** Since commencement of operations: August 31, 2007 – International Rotation Fund; March 7, 2008 – Alternative Strategies Allocation Fund.
† Includes rebate income on proceeds for securities sold short of $0, $0, $3,953,232, $0, $0, $757,531, $0, $29,888, $0, $0 and, $0, respectively.
68
|
THE RYDEX SERIES FUNDS ANNUAL REPORT
See Notes to Financial Statements.
Year Ended March 31, 2008
Managed
Strengthening
Weakening
Commodities
Hedged
International
Futures
Dollar 2x
Dollar 2x
Strategy
Equity
Rotation
Strategy
Real Estate
Strategy
Strategy
Fund
Fund
Fund***
Fund
Fund
Fund
Fund
$
2,849,884
$
1,547,809
$
297,632
$ 7,784,725
$
2,404
$ 1,250,912
$
6,223,907
43,839
40,971
—
26,014
27,294
—
—
—
—
—
93,893
—
—
—
—
484,322
525,895
67,109
538,521
—
—
2,893,723
2,073,102
823,527
7,971,741
568,219
1,250,912
6,223,907
638,517
512,329
142,655
1,834,381
156,793
277,097
1,361,166
212,839
—
39,626
509,550
46,116
76,971
378,102
31,342
16,974
16,091
128,725
11,389
7,605
65,491
77,547
73,658
22,473
161,258
28,483
36,099
177,312
162,107
75,988
17,917
340,510
27,606
60,342
268,283
85,136
—
15,851
197,258
18,446
30,789
151,241
—
280,807
—
53,123
—
—
—
6,084
—
798
13,395
2,758
2,455
13,912
23,013
—
5,811
54,482
6,992
8,097
39,495
110,056
—
33,278
379,405
24,555
39,661
197,714
1,346,641
959,756
294,500
3,672,087
323,138
539,116
2,652,716
(273,842)
—
—
—
—
—
—
1,072,799
959,756
294,500
3,672,087
323,138
539,116
2,652,716
1,820,924
1,113,346
529,027
4,299,654
245,081
711,796
3,571,191
10,545,767
1,064,498
(2,000,724)
9,237,921
688,587
—
—
—
—
—
—
—
(6,250,139)
26,704,988
—
(2,533,303)
(1,599,031)
—
—
(1,601,936)
382,060
(11,700)
(2,075,373)
—
(71,796)
—
—
—
10,534,067
(3,544,178)
(3,599,755)
9,166,125
688,587
(7,852,075)
27,087,048
9,210,448
(2,554,193)
(944,992)
15,921,976
(6,818,462)
—
—
—
—
—
—
—
(1,602,437)
7,814,393
—
(211,111)
(160,444)
—
—
(148,503)
1,000,697
—
1,744,487
—
14,681
—
—
—
9,210,448
(1,020,817)
(1,105,436)
15,936,657
(6,818,462)
(1,750,940)
8,815,090
19,744,515
(4,564,995)
(4,705,191)
25,102,782
(6,129,875)
(9,603,015)
35,902,138
$21,565,439
$ (3,451,649)
$(4,176,164)
$29,402,436
$(5,884,794)
$(8,891,219)
$39,473,329
THE RYDEX SERIES FUNDS ANNUAL REPORT
|
69
STATEMENTS OF CHANGES IN NET ASSETS
Multi-Cap
Sector Rotation
Core Equity Fund
Fund
Year
Year
Year
Year
Ended
Ended
Ended
Ended
March 31,
March 31,
March 31,
March 31,
2008
2007
2008
2007
FROM OPERATIONS
Net Investment Income (Loss)
$
154,839
$
(75,714)
$
(1,283,152)
$
(1,406,754)
Net Realized Gain (Loss) on Investments
1,727,148
9,554,278
(23,253,004)
18,858,466
Net Change in Unrealized Appreciation (Depreciation)
on Investments
(9,486,742)
(4,181,238)
1,680,010
(24,045,159)
Net Increase (Decrease) in Net Assets from Operations
(7,604,755)
5,297,326
(22,856,146)
(6,593,447)
Distributions to Shareholders from:
Net Investment Income
A-Class
(3,504)
—
—
—
C-Class
(24,471)
—
—
—
H-Class
(22,326)
—
—
—
Realized Gain on Investments
A-Class
(582,465)
(430,763)
(2,965,934)
(1,452,079)
C-Class
(4,017,324)
(2,032,560)
(7,784,003)
(4,158,598)
H-Class
(3,710,898)
(2,277,933)
(15,425,954)
(5,156,754)
Total Distributions to Shareholders
(8,360,988)
(4,741,256)
(26,175,891)
(10,767,431)
SHARE TRANSACTIONS
Proceeds from Shares Purchased
A-Class
2,764,650
8,596,605
38,627,448
40,385,537
C-Class
8,439,215
14,564,231
44,066,197
77,398,670
H-Class
6,611,755
44,609,359
278,158,887
234,141,195
Redemption Fees Collected
A-Class
1,097
927
26,493
3,010
C-Class
6,533
4,551
66,027
8,847
H-Class
7,492
5,981
114,836
10,823
Value of Shares Purchased through Dividend Reinvestment
A-Class
581,390
406,755
2,702,394
1,347,139
C-Class
3,744,401
1,884,763
7,259,013
3,893,664
H-Class
3,211,062
2,162,556
14,155,545
4,624,777
Cost of Shares Redeemed
A-Class
(4,536,301)
(6,474,290)
(27,230,934)
(31,973,220)
C-Class
(18,623,553)
(17,530,668)
(46,959,917)
(78,313,103)
H-Class
(31,206,054)
(58,746,321)
(217,722,031)
(329,871,105)
Net Increase (Decrease) in Net Assets From
Share Transactions
(28,998,313)
(10,515,551)
93,263,958
(78,343,766)
Net Increase (Decrease) in Net Assets
(44,964,056)
(9,959,481)
44,231,921
(95,704,644)
NET ASSETS—BEGINNING OF PERIOD
77,422,900
87,382,381
299,000,357
394,705,001
NET ASSETS—END OF PERIOD
$ 32,458,844
$ 77,422,900
$343,232,278
$ 299,000,357
Undistributed Net Investment Income —
End of Period
$
—
$
—
$
—
$
—
* Since commencement of operations: March 7, 2008.
70
|
THE RYDEX SERIES FUNDS ANNUAL REPORT
See Notes to Financial Statements.
Absolute Return
Alternative Strategies
Commodities
Strategies Fund
Allocation Fund
Strategy Fund
Hedged Equity Fund
Year
Year
Year
Year
Year
Year
Year
Ended
Ended
Ended
Ended
Ended
Ended
Ended
March 31,
March 31,
March 31,
March 31,
March 31,
March 31,
March 31,
2008
2007
2008*
2008
2007
2008
2007
$
6,183,924
$
4,590,203
$
247
$
1,820,924
$
1,344,467
$
1,113,346
$
1,085,188
(14,682,495)
(120,942)
—
10,534,067
(13,679,514)
(3,544,178)
317,869
(4,060,931)
6,764,082
(30,641)
9,210,448
3,020,659
(1,020,817)
874,283
(12,559,502)
11,233,343
(30,394)
21,565,439
(9,314,388)
(3,451,649)
2,277,340
(1,619,281)
(478,245)
—
(109,198)
—
(256,063)
(82,622)
(1,944,242)
(500,457)
—
(74,170)
—
(264,730)
(158,396)
(5,952,339)
(2,121,298)
—
(267,525)
—
(1,297,480)
(538,983)
(175,613)
(273,932)
—
—
—
(7,986)
(82,314)
(210,855)
(286,655)
—
—
—
(8,257)
(157,806)
(645,538)
(1,215,050)
—
—
—
(40,467)
(536,976)
(10,547,868)
(4,875,637)
—
(450,893)
—
(1,874,983)
(1,557,097)
40,780,536
45,204,127
1,128,617
20,571,490
25,271,737
2,946,000
6,721,318
34,354,420
51,153,952
154,649
12,460,496
6,542,259
3,437,524
8,243,490
100,077,742
211,575,405
3,917,739
272,980,653
162,904,884
16,601,499
27,782,630
3,288
8,648
3
65,524
13,773
981
2,035
4,167
12,956
—
40,266
5,699
1,052
3,418
13,008
59,838
20
392,598
41,595
4,573
13,034
1,575,032
608,550
—
104,193
—
204,865
106,111
2,046,966
742,722
—
68,104
—
254,071
299,790
5,954,321
3,119,023
—
239,163
—
1,306,654
1,060,353
(38,116,726)
(10,745,745)
(898)
(16,044,064)
(23,638,576)
(3,858,525)
(1,552,398)
(24,156,055)
(12,164,964)
(1,900)
(8,184,148)
(5,859,323)
(5,887,950)
(3,262,974)
(126,906,668)
(73,860,896)
(1,476)
(198,501,063)
(148,923,479)
(26,587,232)
(17,741,890)
(4,369,969)
215,713,616
5,196,754
84,193,212
16,358,569
(11,576,488)
21,674,917
(27,477,339)
222,071,322
5,166,360
105,307,758
7,044,181
(16,903,120)
22,395,160
266,010,807
43,939,485
—
48,951,015
41,906,834
44,344,898
21,949,738
$ 238,533,468
$266,010,807
$5,166,360
$154,258,773
$
48,951,015
$ 27,441,778
$ 44,344,898
$
710,510
$
2,740,033
$
247
$
1,407,429
$
—
$
32,482
$
576,613
THE RYDEX SERIES FUNDS ANNUAL REPORT
|
71
STATEMENTS OF CHANGES IN NET ASSETS (concluded)
International Rotation
Managed Futures
Fund
Strategy Fund
Year
Year
Year
Ended
Ended
Ended
March 31,
March 31,
March 31,
2008*
2008
2007*
FROM OPERATIONS
Net Investment Income
$
529,027
$
4,299,654
$
92,846
Net Realized Gain (Loss) on Investments
(3,599,755)
9,166,125
1,145
Net Change in Unrealized Appreciation (Depreciation) on Investments
(1,105,436)
15,936,657
194,868
Net Increase (Decrease) in Net Assets from Operations
(4,176,164)
29,402,436
288,859
Distributions to Shareholders from:
Net Investment Income
A-Class
(270,789)
—
—
C-Class
(81,207)
—
—
H-Class
(153,426)
—
—
Realized Gain on Investments
A-Class
(159,929)
(7,011)
—
C-Class
(47,961)
(2,198)
—
H-Class
(90,614)
(17,515)
—
Total Distributions to Shareholders
(803,926)
(26,724)
—
SHARE TRANSACTIONS
Proceeds from Shares Purchased
A-Class
23,067,035
117,885,098
23,528,217
C-Class
9,620,731
44,369,104
2,681,996
H-Class
34,841,686
307,063,434
55,688,299
Redemption Fees Collected
A-Class
14,179
30,370
550
C-Class
9,795
9,542
43
H-Class
43,318
79,960
1,029
Value of Shares Purchased through Dividend Reinvestment
A-Class
426,494
6,244
—
C-Class
127,790
2,079
—
H-Class
242,525
16,284
—
Cost of Shares Redeemed
A-Class
(7,500,179)
(20,213,507)
(23,195)
C-Class
(5,443,101)
(3,549,917)
—
H-Class
(19,608,491)
(49,792,127)
(10,026,438)
Net Increase (Decrease) in Net Assets From
Share Transactions
35,841,782
395,906,564
71,850,501
Net Increase (Decrease) in Net Assets
30,861,692
425,282,276
72,139,360
NET ASSETS—BEGINNING OF PERIOD
—
72,139,360
—
NET ASSETS—END OF PERIOD
$ 30,861,692
$497,421,636
$ 72,139,360
Undistributed Net Investment Income (Loss)—
End of Period
$
(2,502,568)
$
3,663,430
$
233
* Since commencement of operations: August 31, 2007 – International Rotation Fund; March 2, 2007 – Managed Futures Strategy Fund.
72
|
THE RYDEX SERIES FUNDS ANNUAL REPORT
See Notes to Financial Statements.
Real Estate
Strengthening Dollar 2x
Weakening Dollar 2x
Fund
Strategy Fund
Strategy Fund
Year
Year
Year
Year
Year
Year
Ended
Ended
Ended
Ended
Ended
Ended
March 31,
March 31,
March 31,
March 31,
March 31,
March 31,
2008
2007
2008
2007
2008
2007
$
245,081
$
660,727
$
711,796
$
745,433
$
3,571,191
$
5,139,481
688,587
4,195,767
(7,852,075)
(1,616,102)
27,087,048
4,258,660
(6,818,462)
2,542,463
(1,750,940)
(365,238)
8,815,090
2,344,942
(5,884,794)
7,398,957
(8,891,219)
(1,235,907)
39,473,329
11,743,083
(19,151)
(31,044)
—
—
(4,162,016)
—
(19,174)
(29,562)
—
—
(3,293,861)
—
(29,207)
(333,111)
—
—
(19,472,969)
—
—
(21,055)
—
—
(2,766)
—
—
(20,040)
—
—
(2,190)
—
—
(225,942)
—
—
(12,945)
—
(67,532)
(660,754)
—
—
(26,946,747)
—
4,261,397
22,619,619
17,956,828
1,790,035
43,416,675
32,665,359
24,881,486
19,554,134
32,866,033
18,404,407
35,113,807
26,866,695
225,566,473
637,283,192
273,514,131
213,174,840
255,507,428
435,860,439
—
—
—
—
—
—
—
—
—
—
—
—
—
—
—
—
—
—
18,938
43,894
—
—
3,290,478
—
18,663
48,762
—
—
2,829,351
—
28,965
549,804
—
—
16,757,981
—
(9,310,916)
(14,318,312)
(13,972,483)
(1,758,708)
(48,841,856)
(15,126,440)
(27,239,102)
(18,440,310)
(28,379,029)
(16,631,133)
(31,865,100)
(17,640,979)
(233,291,275)
(667,278,849)
(249,841,075)
(207,190,328)
(287,257,877)
(386,840,467)
(15,065,371)
(19,938,066)
32,144,405
7,789,113
(11,049,113)
75,784,607
(21,017,697)
(13,199,863)
23,253,186
6,553,206
1,477,469
87,527,690
40,313,872
53,513,735
14,683,862
8,130,656
146,142,481
58,614,791
$
19,296,175
$
40,313,872
$
37,937,048
$
14,683,862
$147,619,950
$ 146,142,481
$
—
$
62,053
$
(1,856,737)
$
(338,691)
$
3,520,639
$
47,308
THE RYDEX SERIES FUNDS ANNUAL REPORT
|
73
FINANCIAL HIGHLIGHTS
This table is presented to show selected data for a share outstanding throughout each period, and to assist shareholders in evaluating a Fund’s performance for the periods presented.
Net
Net Increase
Realized
(Decrease)
RATIOS TO
and
in Net
Net Increase
NET
AVERAGE NET ASSETS:
NET ASSET
Net
Unrealized
Asset Value
Distributions
Distributions
(Decrease)
ASSET
Net
Net Assets,
VALUE,
Investment
Gains
Resulting
from Net
from Net
Redemption
in Net
VALUE,
Total
Investment
Portfolio
End of
BEGINNING
Income
(Losses) on
from
Investment
Realized
Total
Fees
Asset
END OF
Investment
Total
Income
Turnover
Period (000’s
Year Ended
OF PERIOD
(Loss)†
Investments
Operations
Income
Gains
Distributions
Collected
Value
PERIOD
Return†††
Expenses
(Loss)
Rate
omitted)
Multi-Cap Core Equity Fund A-Class
March 31, 2008
$17.05
$
.10
$ (2.58)
$ (2.48)
$ (.02)
$ (2.76)
$ (2.78)
$ —§
$ (5.26)
$11.79
(15.78)%
1.21%
0.64%
149%
$
3,361
March 31, 2007
16.72
.05
1.38
1.43
—
(1.10)
(1.10)
—§
.33
17.05
8.89%
1.32%
0.32%
138%
5,680
March 31, 2006
15.01
(.01)
2.59
2.58
—
(.87)
(.87)
—
1.71
16.72
17.55%
1.66%
(0.08)%
168%
3,079
March 31, 2005
14.44
.02
1.16
1.18
—
(.61)
(.61)
—
.57
15.01
8.16%
1.57%
0.16%
159%
906
March 31, 2004*
14.44
—
—
—
—
—
—
—
—
14.44
0.00%
0.00%**à
0.00%**
226%
1
Multi-Cap Core Equity Fund C-Class
March 31, 2008
16.39
(.02)
(2.45)
(2.47)
(.02)
(2.76)
(2.78)
—§
(5.25)
11.14
(16.39)%
1.97%
(0.13)%
149%
15,906
March 31, 2007
16.24
(.09)
1.34
1.25
—
(1.10)
(1.10)
—§
.15
16.39
8.03%
2.12%
(0.54)%
138%
30,181
March 31, 2006
14.71
(.13)
2.53
2.40
—
(.87)
(.87)
—
1.53
16.24
16.68%
2.40%
(0.87)%
168%
30,981
March 31, 2005
14.27
(.10)
1.15
1.05
—
(.61)
(.61)
—
.44
14.71
7.34%
2.31%
(0.71)%
159%
34,793
March 31, 2004
10.11
(.11)
4.38
4.27
—
(.11)
(.11)
—
4.16
14.27
42.29%
2.24%
(0.87)%
226%
23,811
Multi-Cap Core Equity Fund H-Class
March 31, 2008
17.04
0.09
(2.56)
(2.47)
(.02)
(2.76)
(2.78)
—§
(5.25)
11.79
(15.73)%
1.23%
0.57%
149%
13,192
March 31, 2007
16.72
.03
1.39
1.42
—
(1.10)
(1.10)
—§
.32
17.04
8.83%
1.38%
0.18%
138%
41,562
March 31, 2006
15.01
(.02)
2.60
2.58
—
(.87)
(.87)
—
1.71
16.72
17.55%
1.64%
(0.11)%
168%
53,323
March 31, 2005
14.44
—§
1.18
1.18
—
(.61)
(.61)
—
.57
15.01
8.16%
1.56%
0.03%
159%
51,139
March 31, 2004
10.15
(.01)
4.41
4.40
—
(.11)
(.11)
—
4.29
14.44
43.41%
1.49%
(0.11)%
226%
42,568
Sector Rotation Fund A-Class
March 31, 2008
14.08
(.01)
.30
.29
—
(.93)
(.93)
.01
(.63)
13.45
1.50%
1.65%
(0.08)%
278%
49,148
March 31, 2007
14.15
(.01)
.38
.37
—
(.44)
(.44)
—§
(.07)
14.08
2.75%
1.64%
(0.09)%
373%
39,804
March 31, 2006
11.10
(.04)
3.09
3.05
—
—
—
—
3.05
14.15
27.48%
1.67%
(0.33)%
263%
30,593
March 31, 2005
10.45
(.02)
.67
.65
—
—
—
—
.65
11.10
6.22%
1.63%
(0.19)%
262%
2,989
March 31, 2004*
10.45
—
—
—
—
—
—
—
—
10.45
0.00%
0.00%**à
0.00%**
253%
5
Sector Rotation Fund C-Class
March 31, 2008
13.58
(.12)
.31
.19
—
(.93)
(.93)
.01
(.73)
12.85
0.81%
2.41%
(0.80)%
278%
115,136
March 31, 2007
13.76
(.11)
.37
.26
—
(.44)
(.44)
—§
(.18)
13.58
2.02%
2.39%
(0.86)%
373%
118,422
March 31, 2006
10.87
(.12)
3.01
2.89
—
—
—
—
2.89
13.76
26.59%
2.41%
(0.95)%
263%
118,083
March 31, 2005
10.30
(.10)
.67
.57
—
—
—
—
.57
10.87
5.53%
2.38%
(1.03)%
262%
54,604
March 31, 2004
7.53
(.16)
2.93
2.77
—
—
—
—
2.77
10.30
36.79%
2.41%
(1.66)%
253%
59,192
Sector Rotation Fund H-Class
March 31, 2008
14.12
(.02)
.31
.29
—
(.93)
(.93)
.01
(.63)
13.49
1.50%
1.65%
(0.13)%
278%
178,949
March 31, 2007
14.18
(.02)
.40
.38
—
(.44)
(.44)
—§
(.06)
14.12
2.81%
1.65%
(0.16)%
373%
140,774
March 31, 2006
11.12
(.03)
3.09
3.06
—
—
—
—
3.06
14.18
27.52%
1.66%
(0.25)%
263%
246,029
March 31, 2005
10.45
(.03)
.70
.67
—
—
—
—
.67
11.12
6.41%
1.64%
(0.31)%
262%
56,725
March 31, 2004
7.58
(.09)
2.96
2.87
—
—
—
—
2.87
10.45
37.86%
1.66%
(0.88)%
253%
86,677
FINANCIAL HIGHLIGHTS (continued)
This table is presented to show selected data for a share outstanding throughout each period, and to assist shareholders in evaluating a Fund’s performance for the periods presented.
Net
Net Increase
Realized
(Decrease)
RATIOS TO
and
in Net
Net Increase
NET
AVERAGE NET ASSETS:
NET ASSET
Net
Unrealized
Asset Value
Distributions
Distributions
(Decrease)
ASSET
Net
Net Assets,
VALUE,
Investment
Gains
Resulting
from Net
from Net
Redemption
in Net
VALUE,
Total
Investment
Portfolio
End of
BEGINNING
Income
(Losses) on
from
Investment
Realized
Total
Fees
Asset
END OF
Investment
Total
Net
Operating
Income
Turnover
Period (000’s
Year Ended
OF PERIOD
(Loss)†
Investments
Operations
Income
Gains
Distributions
Collected
Value
PERIOD
Return†††
Expenses
Expenses
Expenses
(Loss)
Rate
omitted)
Absolute Return Strategies Fund A-Class
March 31, 2008
$26.44
$ .58
$ (1.53)
$
(.95)
$
(.79)
$
(.09)
$
(.88)
$
—§
$ (1.83)
$24.61
(3.72)%
1.96%
1.96%
1.40%††
2.18%
509%
$
42,193
March 31, 2007
25.52
.71
.80
1.51
(.38)
(.22)
(.60)
.01
.92
26.44
6.05%
1.93%
1.93%
1.43%††
2.74%
298%
41,771
March 31, 2006*
25.00
.29
.24
.53
(.07)
—
(.07)
.06
.52
25.52
2.36%
1.87%**
1.87%**
1.45%††**
2.20%**
127%
5,791
Absolute Return Strategies Fund C-Class
March 31, 2008
26.14
.37
(1.50)
(1.13)
(.79)
(.09)
(.88)
—§
(2.01)
24.13
(4.46)%
2.71%
2.71%
2.15%††
1.41%
509%
54,857
March 31, 2007
25.42
.51
.80
1.31
(.38)
(.22)
(.60)
.01
.72
26.14
5.28%
2.66%
2.66%
2.16%††
1.99%
298%
48,052
March 31, 2006*
25.00
.19
.24
.43
(.07)
—
(.07)
.06
.42
25.42
1.96%
2.65%**
2.65%**
2.23%††**
1.42%**
127%
7,352
Absolute Return Strategies Fund H-Class
March 31, 2008
26.46
.58
(1.53)
(.95)
(.79)
(.09)
(.88)
—§
(1.83)
24.63
(3.71)%
1.95%
1.95%
1.39%††
2.21%
509%
141,483
March 31, 2007
25.53
.72
.80
1.52
(.38)
(.22)
(.60)
.01
.93
26.46
6.09%
1.90%
1.90%
1.40%††
2.78%
298%
176,187
March 31, 2006*
25.00
.29
.25
.54
(.07)
—
(.07)
.06
.53
25.53
2.40%
1.83%**
1.83%**
1.41%††**
2.18%**
127%
30,796
Alternative Strategies Allocation Fund A-Class
March 31, 2008*
25.00
—§
(.16)
(.16)
—
—
—
—
(.16)
24.84
(0.64)%
0.00%**à 0.00%**à
0.00%**à
0.16%**
—
1,121
Alternative Strategies Allocation Fund C-Class
March 31, 2008*
25.00
(.01)
(.16)
(.17)
—
—
—
—
(.17)
24.83
(0.68)%
0.65%**à 0.68%**à
0.68%**à
(0.56)%**
—
152
Alternative Strategies Allocation Fund H-Class
March 31, 2008*
25.00
—§
(.16)
(.16)
—
—
—
—
(.16)
24.84
(0.64)%
0.00%**à 0.00%**à
0.00%**à
0.12%**
—
3,893
Commodities Strategy Fund A-Class
March 31, 2008
23.81
.68
8.27
8.95
(.22)
—
(.22)
.14
8.87
32.68
38.48%
1.51%
1.19%
1.19%
2.49%
405%
18,579
March 31, 2007
27.29
.63
(4.15)
(3.52)
—
—
—
.04
(3.48)
23.81
(12.75)%
1.46%
1.17%
1.17%
2.57%
672%
9,720
March 31, 2006*
25.00
.61
1.68
2.29
—
—
—
—
2.29
27.29
9.16%
1.71%**
1.71%**
1.71%**
2.76%**
—
8,751
Commodities Strategy Fund C-Class
March 31, 2008
23.47
.48
8.09
8.57
(.22)
—
(.22)
.14
8.49
31.96
37.41%
2.26%
1.94%
1.94%
1.79%
405%
10,793
March 31, 2007
27.10
.56
(4.23)
(3.67)
—
—
—
.04
(3.63)
23.47
(13.39)%
2.23%
1.94%
1.94%
2.23%
672%
4,169
March 31, 2006*
25.00
.42
1.68
2.10
—
—
—
—
2.10
27.10
8.40%
2.34%**
2.34%**
2.34%**
1.79%**
—
4,128
Commodities Strategy Fund H-Class
March 31, 2008
23.81
.60
8.30
8.90
(.22)
—
(.22)
.17
8.85
32.66
38.39%
1.51%
1.19%
1.19%
2.10%
405%
124,886
March 31, 2007
27.29
.77
(4.28)
(3.51)
—
—
—
.03
(3.48)
23.81
(12.75)%
1.49%
1.20%
1.20%
2.99%
672%
35,062
March 31, 2006*
25.00
.61
1.68
2.29
—
—
—
—
2.29
27.29
9.16%
1.57%**
1.57%**
1.57%**
2.56%**
—
29,028
Hedged Equity Fund A-Class
March 31, 2008
26.29
.67
(2.94)
(2.27)
(1.09)
(.03)
(1.12)
—§
(3.39)
22.90
(8.98)%
2.04%
2.04%
1.41%††
2.59%
433%
5,553
March 31, 2007
25.86
.82
.63
1.45
(.52)
(.51)
(1.03)
.01
.43
26.29
5.82%
2.13%
2.13%
1.41%††
3.15%
282%
7,086
March 31, 2006*
25.00
.26
.65
.91
(.09)
—
(.09)
.04
.86
25.86
3.81%
2.10%**
2.10%**
1.44%††**
1.91%**
159%
1,672
Hedged Equity Fund C-Class
March 31, 2008
25.99
.48
(2.89)
(2.41)
(1.09)
(.03)
(1.12)
—§
(3.53)
22.46
(9.63)%
2.78%
2.78%
2.15%††
1.89%
433%
5,226
March 31, 2007
25.76
.62
.63
1.25
(.52)
(.51)
(1.03)
.01
.23
25.99
5.05%
2.89%
2.89%
2.17%††
2.40%
282%
8,312
March 31, 2006*
25.00
.16
.65
.81
(.09)
—
(.09)
.04
.76
25.76
3.41%
2.86%**
2.86%**
2.20%††**
1.16%**
159%
2,957
Hedged Equity Fund H-Class
March 31, 2008
26.30
.68
(2.95)
(2.27)
(1.09)
(.03)
(1.12)
—§
(3.39)
22.91
(8.97)%
2.03%
2.03%
1.40%††
2.63%
433%
16,663
March 31, 2007
25.86
.81
.65
1.46
(.52)
(.51)
(1.03)
.01
.44
26.30
5.86%
2.13%
2.13%
1.41%††
3.14%
282%
28,947
March 31, 2006*
25.00
.26
.65
.91
(.09)
—
(.09)
.04
.86
25.86
3.81%
2.07%**
2.07%**
1.41%††**
1.96%**
159%
17,321
FINANCIAL HIGHLIGHTS (continued)
This table is presented to show selected data for a share outstanding throughout each period, and to assist shareholders in evaluating a Fund’s performance for the periods presented.
Net
Net Increase
Realized
(Decrease)
RATIOS TO
and
in Net
Net Increase
NET
AVERAGE NET ASSETS:
NET ASSET
Unrealized
Asset Value
Distributions
Distributions
(Decrease)
ASSET
Net Assets,
VALUE,
Net
Gains
Resulting
from Net
from Net
Redemption
in Net
VALUE,
Total
Net
Portfolio
End of
BEGINNING
Investment
(Losses) on
from
Investment
Realized
Total
Fees
Asset
END OF
Investment
Total
Net
Operating
Investment
Turnover
Period (000’s
Year Ended
OF PERIOD
Income†
Investments
Operations
Income
Gains
Distributions
Collected
Value
PERIOD
Return†††
Expenses
Expenses
Expenses
Income
Rate
omitted)
International Rotation Fund A-Class
March 31, 2008*
$25.00
$ .53
$
(1.98)
$ (1.45)
$ (.41)
$ (.24)
$ (.65)
$ .03
$ (2.07)
$22.93
(5.93)%
1.74%**
1.74%**
1.74%**
3.68%**
160%
$
13,483
International Rotation Fund C-Class
March 31, 2008*
25.00
.39
(1.96)
(1.57)
(.41)
(.24)
(.65)
.06
(2.16)
22.84
(6.29)%
2.49%**
2.49%**
2.49%**
2.70%**
160%
3,603
International Rotation Fund H-Class
March 31, 2008*
25.00
.45
(1.95)
(1.50)
(.41)
(.24)
(.65)
.09
(2.06)
22.94
(5.89)%
1.75%**
1.75%**
1.75%**
3.19%**
160%
13,775
Managed Futures Fund A-Class
March 31, 2008
25.03
.57
2.64
3.21
—
(—)§
(—)§
.02
3.23
28.26
12.92%
1.72%
1.72%
1.69%††
2.15%
154%
128,744
March 31, 2007*
25.00
.09
(.06)
.03
—
—
—
—§
.03
25.03
0.12%
1.81%**
1.81%**
1.81%**††
2.06%**
20%
23,655
Managed Futures Fund C-Class
March 31, 2008
25.02
.35
2.65
3.00
—
(—)§
(—)§
.02
3.02
28.04
12.08%
2.48%
2.48%
2.45%††
1.30%
154%
46,005
March 31, 2007*
25.00
.05
(.03)
.02
—
—
—
—§
.02
25.02
0.08%
2.60%**
2.60%**
2.60%**††
1.15%**
20%
2,703
Managed Futures Fund H-Class
March 31, 2008
25.03
.58
2.63
3.21
—
(—)§
(—)§
.02
3.23
28.26
12.92%
1.73%
1.73%
1.70%††
2.17%
154%
322,673
March 31, 2007*
25.00
.09
(.06)
.03
—
—
—
—§
.03
25.03
0.12%
1.77%**
1.77%**
1.77%**††
2.19%**
20%
45,781
Real Estate Fund A-Class
March 31, 2008
42.16
.54
(10.05)
(9.51)
(.23)
—
(.23)
—
(9.74)
32.42
(22.59)%
1.64%
1.64%
1.64%
1.45%
832%
2,866
March 31, 2007
36.46
.46
5.53
5.99
(.17)
(.12)
(.29)
—
5.70
42.16
16.43%
1.61%
1.61%
1.61%
1.10%
762%
9,061
March 31, 2006
27.84
.64
8.18
8.82
—
(.20)
(.20)
—
8.62
36.46
31.75%
1.57%
1.57%
1.57%
2.02%
1,304%
375
March 31, 2005*
26.66
.09
1.24
1.33
(.03)
(.12)
(.15)
—
1.18
27.84
4.98%
1.54%**
1.54%**
1.54%**
0.52%** 1,773%
71
Real Estate Fund C-Class
March 31, 2008
41.22
.29
(9.84)
(9.55)
(.23)
—
(.23)
—
(9.78)
31.44
(23.21)%
2.39%
2.39%
2.39%
0.78%
832%
2,290
March 31, 2007
35.93
.19
5.39
5.58
(.17)
(.12)
(.29)
—
5.29
41.22
15.53%
2.36%
2.36%
2.36%
0.48%
762%
5,469
March 31, 2006
27.64
.43
8.06
8.49
—
(.20)
(.20)
—
8.29
35.93
30.79%
2.36%
2.36%
2.36%
1.35%
1,304%
3,548
March 31, 2005
26.63
.41
.75
1.16
(.03)
(.12)
(.15)
—
1.01
27.64
4.35%
2.32%
2.32%
2.32%
1.52%
1,773%
1,293
March 31, 2004*
25.00
.02
1.61
1.63
—
—
—
—
1.63
26.63
6.52%
2.36%**
2.36%**
2.36%**
0.72%**
102%
7,562
Real Estate Fund H-Class
March 31, 2008
42.14
.53
(10.04)
(9.51)
(.23)
—
(.23)
—
(9.74)
32.40
(22.60)%
1.64%
1.64%
1.64%
1.43%
832%
14,140
March 31, 2007
36.47
.54
5.42
5.96
(.17)
(.12)
(.29)
—
5.67
42.14
16.34%
1.62%
1.62%
1.62%
1.35%
762%
25,784
March 31, 2006
27.85
.57
8.25
8.82
—
(.20)
(.20)
—
8.62
36.47
31.74%
1.59%
1.59%
1.59%
1.78%
1,304%
49,591
March 31, 2005
26.65
.58
.77
1.35
(.03)
(.12)
(.15)
—
1.20
27.85
5.06%
1.58%
1.58%
1.58%
2.08%
1,773%
8,186
March 31, 2004*
25.00
.10
1.55
1.65
—
—
—
—
1.65
26.65
6.60%
1.61%**
1.61%**
1.61%**
3.83%**
102%
75,916
FINANCIAL HIGHLIGHTS (concluded)
This table is presented to show selected data for a share outstanding throughout each period, and to assist shareholders in evaluating a Fund’s performance for the periods presented.
Net
Net Increase
Realized
(Decrease)
RATIOS TO
and
in Net
Net Increase
NET
AVERAGE NET ASSETS:
NET ASSET
Unrealized
Asset Value
Distributions
Distributions
(Decrease)
ASSET
Net Assets,
VALUE,
Net
Gains
Resulting
from Net
from Net
in Net
VALUE,
Total
Net
Portfolio
End of
BEGINNING
Investment
(Losses) on
from
Investment
Realized
Total
Asset
END OF
Investment
Total
Investment
Turnover
Period (000’s
Year Ended
OF PERIOD
Income†
Investments
Operations
Income
Gains
Distributions
Value
PERIOD
Return†††
Expenses
Income
Rate
omitted)
Strengthening Dollar 2x Strategy Fund A-Class
March 31, 2008
$25.35
$
.39
$ (5.89)
$ (5.50)
$
—
$
—
$
—
$ (5.50)
$19.85
(21.70)%
1.66%
1.73%
—
$
2,795
March 31, 2007
27.74
.91
(3.30)
(2.39)
—
—
—
(2.39)
25.35
(8.62)%
1.66%
3.53%
—
108
March 31, 2006*
25.00
.50
2.37
2.87
(.13)
—
(.13)
2.74
27.74
11.47%
1.68%**
2.17%**
—
91
Strengthening Dollar 2x Strategy Fund C-Class
March 31, 2008
24.99
.42
(5.99)
(5.57)
—
—
—
(5.57)
19.42
(22.29)%
2.40%
1.84%
—
6,131
March 31, 2007
27.56
.70
(3.27)
(2.57)
—
—
—
(2.57)
24.99
(9.33)%
2.40%
2.75%
—
2,630
March 31, 2006*
25.00
.36
2.33
2.69
(.13)
—
(.13)
2.56
27.56
10.75%
2.41%**
1.51%**
—
769
Strengthening Dollar 2x Strategy Fund H-Class
March 31, 2008
25.33
.57
(6.07)
(5.50)
—
—
—
(5.50)
19.83
(21.71)%
1.66%
2.44%
—
29,011
March 31, 2007
27.71
.90
(3.28)
(2.38)
—
—
—
(2.38)
25.33
(8.59)%
1.66%
3.47%
—
11,946
March 31, 2006*
25.00
.51
2.33
2.84
(.13)
—
(.13)
2.71
27.71
11.35%
1.66%**
2.19%**
—
7,270
Weakening Dollar 2x Strategy Fund A-Class
March 31, 2008
26.18
0.70
7.17
7.87
(4.78)
(—)§
(4.78)
3.09
29.27
32.49%
1.67%
2.51%
—
22,148
March 31, 2007
22.70
.91
2.57
3.48
—
—
—
3.48
26.18
15.33%
1.65%
3.63%
—
21,502
March 31, 2006*
25.00
.51
(2.67)
(2.16)
(.14)
—
(.14)
(2.30)
22.70
(8.65)%
1.70%**
2.66%**
—
2,989
Weakening Dollar 2x Strategy Fund C-Class
March 31, 2008
25.81
0.43
7.07
7.50
(4.78)
(—)§
(4.78)
2.72
28.53
31.47%
2.41%
1.57%
—
21,604
March 31, 2007
22.55
.71
2.55
3.26
—
—
—
3.26
25.81
14.46%
2.40%
2.87%
—
14,160
March 31, 2006*
25.00
.34
(2.65)
(2.31)
(.14)
—
(.14)
(2.45)
22.55
(9.25)%
2.46%**
1.79%**
—
3,916
Weakening Dollar 2x Strategy Fund H-Class
March 31, 2008
26.18
0.68
7.17
7.85
(4.78)
(—)§
(4.78)
3.07
29.25
32.41%
1.67%
2.45%
—
103,867
March 31, 2007
22.69
.90
2.59
3.49
—
—
—
3.49
26.18
15.38%
1.65%
3.60%
—
110,480
March 31, 2006*
25.00
.49
(2.66)
(2.17)
(.14)
—
(.14)
(2.31)
22.69
(8.69)%
1.68%**
2.53%**
—
51,710
* Since the commencement of operations:
February 20, 2004 — Real Estate Fund C-Class and H-Class;
March 31, 2004 — Multi-Cap Core Equity Fund A-Class and Sector Rotation Fund A-Class;
September 1, 2004 — Real Estate Fund A-Class;
May 25, 2005 — Commodities Strategy Fund A-Class, C-Class, and H-Class, Strengthening Dollar 2x Strategy Fund A-Class, C-Class and H-Class, Weakening Dollar 2x Strategy Fund A-Class,
C-Class and H-Class;
September 19, 2005 — Absolute Return Strategies Fund A-Class, C-Class and H Class and Hedged Equity Fund A-Class, C-Class and H-Class;
March 2, 2007 — Managed Futures Fund A-Class, C-Class and H-Class;
August 31, 2007 — International Rotation Fund A-Class, C-Class and H Class;
March 7, 2008 — Alternative Strategies Allocation Fund A-Class, C-Class and H-Class.
**
Annualized
† Calculated using the average daily shares outstanding for the year.
†† Operating Expenses exclude short dividends expense.
††† Total investment return does not reflect the impact of any applicable sales charges and has not been annualized.
à Due to the limited length of Fund operations, expense ratios for this period are not indicative of future class performance.
§ Less than $.01 per share
NOTES TO FINANCIAL STATEMENTS
1.
Organization and Significant Accounting Policies
acts as principal underwriter for the Trust. Both Rydex
Organization
Investments and the Distributor are affiliated entities.
The Rydex Series Funds (the “Trust”) is registered with
Significant Accounting Policies
the SEC under the Investment Company Act of 1940 (the
The following significant accounting policies are in con-
“1940 Act”) as a non-diversified, open-ended investment
formity with U.S. generally accepted accounting princi-
company. The Trust offers five separate classes of shares,
ples and are consistently followed by the Trust. All time
Investor Class Shares, Advisor Class Shares, A-Class
references are based on Eastern Time. The information
Shares, C-Class Shares, and H-Class Shares. C-Class
contained in these notes may not apply to every Fund in
Shares have a 1% CDSC if shares are redeemed within
the Trust.
12 months of purchase. Sales of shares of each Class are
made without a sales charge at the NAV, with the excep-
A. Equity securities listed on an exchange (New York
tion of A-Class Shares. A-Class Shares are sold at the
Stock Exchange (“NYSE”) or American Stock Exchange)
NAV, plus the applicable front-end sales charge, except
are valued at the last quoted sales price as of the close
for the U.S. Government Money Market Fund. The sales
of business on the NYSE, usually 4:00 p.m. on the valua-
charge varies depending on the amount purchased,
tion date. Equity securities listed on the NASDAQ mar-
but will not exceed 4.75%. A-Class Share purchases of
ket system are valued at the NASDAQ Official Closing
$1 million or more are exempt from the front-end sales
Price, usually as of 4:00 p.m. on the valuation date.
charge but have a 1% CDSC if shares are redeemed
Listed options held by the Trust are valued at the Official
within 18 months of purchase.
Settlement Price listed by the exchange, usually as of
4:00 p.m. In the event that a settlement price is not
At March 31, 2008, the Trust consisted of fifty-four sepa-
available, fair valuation is enacted. Over-the-counter
rate Funds: twenty-two Benchmark Funds, one Money
options held by the Trust are valued using the average
Market Fund, eleven Alternative Strategy Funds, seven-
bid price obtained from one or more security dealers.
teen Sector Funds, and three Essential Portfolio Funds.
The value of futures contracts purchased and sold by the
This report covers the Alternative Strategy Funds (the
Trust is accounted for using the unrealized gain or loss
“Funds”), while the Money Market Fund, the Benchmark
on the contracts that is determined by marking the con-
Funds, the Sector Funds and the Essential Portfolio
tracts to their current realized settlement prices.
Funds are contained in separate reports.
Financial futures contracts are valued at the last quoted
The Alternative Strategies Allocation Fund is a “fund
sales price, usually as of 4:00 p.m. on the valuation date.
of funds,” which means that the Fund seeks to achieve
In the event that the exchange for a specific futures con-
its investment objective by investing primarily in other
tract closes earlier than 4:00 p.m., the futures contract is
Rydex mutual funds (the “underlying funds”) instead of
valued at the Official Settlement Price of the exchange.
individual securities.
However, the underlying securities from which the
futures contract value is derived are monitored until 4:00
As of March 31, 2008, only A-Class, C-Class and H-Class
p.m. to determine if fair valuation would provide a more
Shares had been issued in the Alternative Strategy Funds.
accurate valuation. Short-term securities, if any, are val-
All share classes of the Multi-Cap Core Equity Fund,
ued at amortized cost, which approximates market value.
Sector Rotation Fund, Absolute Return Strategies Fund,
Structured notes are valued in accordance with the terms
Alternative Strategies Allocation Fund, Commodities
of their agreement at the value of the underlying index
Strategy Fund, Hedged Equity Fund, and International
close, usually 4:00 p.m., adjusted for any interest accruals
Rotation Fund are subject to a 1% redemption fee when
and financing charges. If the securities comprising the
shares are redeemed within 30 days of purchase. All
underlying index cease trading before a Fund’s close of
share classes of the Managed Futures Strategy Fund
business, the index will be fair valued with the use of an
are subject to a 1% redemption fee when shares are
appropriate market indicator.
redeemed within 90 days of purchase.
Traditional open-end investment companies (“Mutual
Valu-Trac Investment Management Limited serves as the
Funds”) are valued at their NAV as of the close of busi-
investment sub-advisor to the International Rotation Fund
ness, usually 4:00 p.m. on the valuation date. Exchange
and is responsible for the development and on-going
Traded Funds (“ETFs”) and closed-end investment com-
maintenance of the investment management strategy
panies are valued at the last quoted sales price.
utilized by that Fund.
The value of domestic equity index and credit default
Rydex Investments provides advisory, transfer agent
swap agreements entered into by a Fund is accounted
and administrative services, and accounting services to
for using the unrealized gain or loss on the agreements
the Trust. Rydex Distributors, Inc. (the “Distributor”)
78
|
THE RYDEX SERIES FUNDS ANNUAL REPORT
NOTES TO FINANCIAL STATEMENTS (continued)
that is determined by marking the agreements to the
D. When a Fund engages in a short sale of an equity or
last quoted value of the index that the swap pertains to
fixed income security, an amount equal to the proceeds
at the close of the NYSE, usually 4:00 p.m. The swap’s
is reflected as an asset and an equivalent liability. The
market value is then adjusted to include dividends
amount of the liability is subsequently marked-to-market
accrued, financing charges and/or interest associated
to reflect the market value of the short sale. The Fund
with the swap agreements.
maintains a segregated account of cash and/or securities
The value of foreign equity index and currency index
as collateral for short sales. The Fund is exposed to
swap agreements entered into by a Fund is accounted
market risk based on the amount, if any, that the market
for using the unrealized gain or loss on the agreements
value of the security exceeds the market value of the
that is determined by marking the agreements to the
securities in the segregated account. Fees, if any, paid to
price at which orders are being filled at the close of the
brokers to borrow securities in connection with short sales
NYSE, usually 4:00 p.m. In the event that no order is
are considered part of the cost of short sale transactions.
filled at 4:00 p.m., the security dealer provides a fair
In addition, the Fund must pay out the dividend rate of
value quote at which the swap agreement is valued. The
the equity or coupon rate of the treasury obligation to
swap’s market value is then adjusted to include dividends
the lender and records this as an expense. Short divi-
accrued, financing charges and/or interest associated
dends or interest expense is a cost associated with the
with the swap agreements.
investment objective of short sales transactions, rather
than an operational cost associated with the day-to-day
Investments, for which market quotations are not readily
management of any mutual fund. The Funds may also
available, are fair valued as determined in good faith by
receive rebate income from the broker resulting from the
Rydex Investments under the direction of the Board of
investment of the proceeds from securities sold short.
Trustees using methods established or ratified by the
Board of Trustees. These methods include, but are not
E. Upon the purchase of an option by a Fund, the pre-
limited to: (i) general information as to how these securi-
mium paid is recorded as an investment, the value of
ties and assets trade; (ii) in connection with futures con-
which is marked-to-market daily. When a purchased
tracts and options thereupon, and other derivative
option expires, that Fund will realize a loss in the amount
investments, information as to how (a) these contracts
of the cost of the option. When a Fund enters into a
and other derivative investments trade in the futures or
closing sale transaction, that Fund will realize a gain or
other derivative markets, respectively, and (b) the securi-
loss depending on whether the proceeds from the clos-
ties underlying these contracts and other derivative
ing sale transaction are greater or less than the cost of
investments trade in the cash market; and (iii) other infor-
the option. When a Fund exercises a put option, that
mation and considerations, including current values in
Fund will realize a gain or loss from the sale of the
related markets.
underlying security and the proceeds from such sale will
be decreased by the premium originally paid. When a
B. Securities transactions are recorded on the trade date
Fund exercises a call option, the cost of the security pur-
for financial reporting purposes. Realized gains and
chased by that Fund upon exercise will be increased by
losses from securities transactions are recorded using the
the premium originally paid. When a Fund writes (sells)
identified cost basis. Proceeds from lawsuits related to
an option, an amount equal to the premium received is
investment holdings are recorded as realized gains in the
entered in that Fund’s accounting records as an asset
respective Fund. Dividend income is recorded on the
and equivalent liability. The amount of the liability is sub-
ex-dividend date, net of applicable taxes withheld by
sequently marked-to-market to reflect the current value
foreign countries. Interest income, including amortization
of the option written. When a written option expires, or
of premiums and accretion of discount, is accrued on a
if a Fund enters into a closing purchase transaction, that
daily basis. Distributions received from investments in
Fund realizes a gain (or loss if the cost of a closing pur-
REITs are recorded as dividend income on the ex-divi-
chase transaction exceeds the premium received when
dend date, subject to reclassification upon notice of the
the option was sold).
character of such distribution by the issuer.
F. The Trust may enter into stock and bond index futures
C. Distributions of net investment income and net real-
contracts and options on such futures contracts. Futures
ized capital gains, if any, are declared and paid at least
contracts are contracts for delayed delivery of securities
annually. Distributions are recorded on the ex-dividend
at a specified future delivery date and at a specific price.
date and are determined in accordance with income tax
Upon entering into a contract, a Fund deposits and
regulations which may differ from U.S. generally
maintains as collateral such initial margin as required by
accepted accounting principles.
the exchange on which the transaction is effected.
THE RYDEX SERIES FUNDS ANNUAL REPORT
|
79
NOTES TO FINANCIAL STATEMENTS (continued)
Pursuant to the contract, the Fund agrees to receive
periodic interest payments. Structured notes are used
from or pay to the broker an amount of cash equal to
to obtain exposure to a market without owning or
the daily fluctuation in value of the contract. Such
taking physical custody of securities or commodities.
receipts or payments are known as variation margin and
Fluctuations in value of the structured notes are
are recorded by the Fund as unrealized gains or losses.
recorded as unrealized gains and losses in the accompa-
When the contract is closed, the Fund records a realized
nying financial statements. Coupon payments are
gain or loss equal to the difference between the value of
recorded as income while net payments are recorded
the contract at the time it was opened and the value at
as net realized gains or losses.
the time it was closed.
I. Investment securities and other assets and liabilities
G. The Trust may enter into domestic equity index and
denominated in foreign currencies are translated into
domestic currency index swap agreements, which are
U.S. dollar amounts at the date of valuation. Purchases
over-the-counter contracts in which one party agrees to
and sales of investment securities and income and
make periodic payments based on the change in market
expense items denominated in foreign currencies are
value of a specified equity security, basket of equity
translated into U.S. dollar amounts on the respective
securities, equity index or domestic currency index, in
dates of such transactions. The Trust does not isolate
return for periodic payments based on a fixed or variable
that portion of the results of operations resulting from
interest rate or the change in market value of a different
changes in foreign exchange rates on investments from
equity security, basket of equity securities, equity index
the fluctuations arising from changes in market prices of
or domestic currency index. Swap agreements are used
securities held. Such fluctuations are included with the
to obtain exposure to an equity or market without own-
net realized and unrealized gain and loss from invest-
ing or taking physical custody of securities. The swap
ments.
agreements are marked-to-market daily based upon
Reported net realized foreign exchange gains or losses
quotations from market makers and the change, if any, is
arise from sales of foreign currencies and currency gains
recorded as unrealized gain or loss. Payments received
or losses realized between the trade and settlement
or made as a result of an agreement or termination of
dates on investment transactions. Net unrealized
the agreement are recognized as realized gains or losses.
exchange gains and losses arise from changes in the fair
The Trust may enter into credit default swap agreements
values of assets and liabilities other than investments in
where one party, the protection buyer, makes an upfront
securities at the fiscal period end, resulting from changes
or periodic payment to a counterparty, the protection
in exchange rates.
seller, in exchange for the right to receive a contingent
J. The Trust may enter into forward currency contracts
payment. The maximum amount of the payment may
primarily to hedge against foreign currency exchange
equal the notional amount, at par, of the underlying index
rate risks on its non-U.S. dollar denominated investment
or security as a result of a related credit event. Upfront
securities. When entering into a forward currency con-
payments received or made by a Fund, are amortized
tract, a Fund agrees to receive or deliver a fixed quantity
over the expected life of the agreement. Periodic pay-
of foreign currency for an agreed-upon price on an
ments received or paid by a Fund are recorded as real-
agreed future date. These contracts are valued daily and
ized gains or losses. The credit default contracts are
the corresponding unrealized gain or loss on the con-
marked-to-market daily based upon quotations from
tracts, as measured by the difference between the for-
market makers and the change, if any, is recorded as
ward foreign exchange rates at the dates of entry into
unrealized gain or loss. Payments received or made as a
the contracts and the forward rates at the reporting
result of a credit event or termination of the contract are
date, is included in the Statement of Assets and
recognized, net of a proportional amount of the upfront
Liabilities. Realized and unrealized gains and losses are
payment, as realized gains or losses.
included in the Statement of Operations.
H. The Trust may invest in structured notes, which are
K. The Funds may leave cash overnight in their cash
over-the-counter contracts linked to the performance of
account with the custodian, U.S. Bank. Periodically, a
an underlying benchmark such as interest rates, equity
Fund may have cash due to custodian bank as an over-
markets, equity indices, commodities indices, corporate
draft balance. A fee is incurred on this overdraft, calcu-
credits or foreign exchange markets. A structured note is
lated by multiplying the overdraft by a rate based on
a type of bond in which an issuer borrows money from
the federal funds rate. Segregated cash with the broker
investors and pays back the principal, adjusted for per-
is held as collateral for investments in derivative instru-
formance of the underlying benchmark, at a specified
ments such as futures contracts and equity index swap
maturity date. In addition, the contract may require
agreements.
80
|
THE RYDEX SERIES FUNDS ANNUAL REPORT
NOTES TO FINANCIAL STATEMENTS (continued)
L. Certain U.S. Government and Agency Obligations are
The risk of such price increases is the principal risk of
traded on a discount basis; the interest rates shown on
engaging in short sales.
the Schedules of Investments reflect the effective rates
The risk associated with purchasing options is limited to
at the time of purchase by the Funds. Other securities
the premium originally paid. The risk in writing a covered
bear interest at the rates shown, payable at fixed dates
call option is that a Fund may forego the opportunity
through maturity. The Funds may also purchase
for profit if the market price of the underlying security
American Depository Receipts, U.S. Government securi-
increases and the option is exercised. The risk in writing
ties, and enter into repurchase agreements.
a covered put option is that a Fund may incur a loss if
M. Interest and dividend income, most expenses, all
the market price of the underlying security decreases
realized gains and losses, and all unrealized gains and
and the option is exercised. In addition, there is the risk
losses are allocated to the Classes based upon the value
that a Fund may not be able to enter into a closing
of the outstanding shares in each Class. Certain costs,
transaction because of an illiquid secondary market or,
such as distribution fees related to A-Class Shares and
for over-the-counter options, because of the counter-
H-Class Shares and service and distribution fees related
party’s inability to perform.
to C-Class Shares, are charged directly to such Classes.
There are several risks in connection with the use of
In addition, certain expenses have been allocated to the
futures contracts. Risks may be caused by an imperfect
individual Funds in the Trust on a pro rata basis upon the
correlation between movements in the price of the
respective aggregate net asset value of each Fund
instruments and the price of the underlying securities.
included in the Trust.
In addition, there is the risk that a Fund may not be able
N. The preparation of financial statements in conformity
to enter into a closing transaction because of an illiquid
with U.S. generally accepted accounting principles
secondary market.
requires management to make estimates and assump-
There are several risks associated with the use of struc-
tions that affect the reported amount of assets and liabil-
tured notes. Structured notes are leveraged, thereby
ities and disclosure of contingent assets and liabilities at
providing an exposure to the underlying benchmark of
the date of the financial statements and the reported
three times the face amount and increasing the volatility
amounts of revenues and expenses during the reporting
of each note relative to the change in the underlying
period. Actual results could differ from these estimates.
linked financial instrument. A highly liquid secondary
O. Throughout the normal course of business, the Funds
market may not exist for the structured notes a Fund
enter into contracts that contain a variety of representa-
invests in, which may make it difficult for that Fund to
tions and warranties which provide general indemnifica-
sell the structured notes it holds at an acceptable price
tions. The Funds’ maximum exposure under these
or to accurately value them. In addition, structured notes
arrangements is unknown, as this would involve future
are subject to the risk that the counterparty to the instru-
claims that may be made against the Funds and/or their
ment, or issuer, might not pay interest when due or
affiliates that have not yet occurred. However, based
repay principal at maturity of the obligation. Although
on experience, the Funds expect the risk of loss to
the Trust will not invest in any structured notes unless
be remote.
Rydex Investments believes that the issuer is creditwor-
2.
Financial Instruments
thy, a Fund does bear the risk of loss of the amount
expected to be received in the event of the default or
As part of its investment strategy, the Trust may utilize
bankruptcy of the issuer.
short sales and a variety of derivative instruments, includ-
ing options, futures, options on futures, structured notes,
There are several risks associated with the use of swap
and swap agreements. These investments involve, to
agreements that are different from those associated with
varying degrees, elements of market risk and risks in
ordinary portfolio securities transactions, due to the fact
excess of the amounts recognized in the Statements of
they could be considered illiquid. Although the Trust
Assets and Liabilities.
will not enter into any swap agreement unless Rydex
Investments believes that the other party to the transac-
Short sales are transactions in which a Fund sells an
tion is creditworthy, the Funds bear the risk of loss of the
equity or fixed income security it does not own. If the
amount expected to be received under a swap agree-
security sold short decreases in price between the time
ment in the event of the default or bankruptcy of the
the Fund sells the security and closes its short position,
agreement counterparty.
that Fund will realize a gain on the transaction.
Conversely, if the security increases in price during the
There are several risks associated with credit default
period, that Fund will realize a loss on the transaction.
swaps. Credit default swaps involve the exchange of a
THE RYDEX SERIES FUNDS ANNUAL REPORT
|
81
NOTES TO FINANCIAL STATEMENTS (continued)
fixed-rate premium for protection against the loss in
calculated at a basic annual fee rate of 0.70% of the
value of an underlying debt instrument in the event of a
average daily net assets of this Fund, adding or subtract-
defined credit event (such as payment default or bank-
ing a performance rate up to 0.20%. The basic annual
ruptcy). Under the terms of the swap, one party acts as a
fee rate, along with the performance adjustment allows
“guarantor,” receiving a periodic payment that is a fixed
the total fee to increase to a maximum of 0.90% or
percentage applied to a notional principal amount. In
decrease to a minimum of 0.50%, depending on the
return, the party agrees to purchase the notional amount
investment performance of the Fund relative to the
of the underlying instrument, at par, if a credit event
Russell 3000 Index (the “Index”). The performance com-
occurs during the term of the swap. A Fund may enter
parison will be made for a rolling 12-month period, with
into credit default swaps in which that Fund or its coun-
performance adjustments made at the end of each
terparty acts as guarantor. By acting as the guarantor
month. Because the performance adjustment is applied
of a swap, that Fund assumes the market and credit risk of
relative to the performance of the Index, Rydex
the underlying instrument, including liquidity and loss
Investments could receive a positive performance adjust-
of value.
ment even during periods where the Fund’s performance
In conjunction with the use of short sales, options,
is negative. At March 31, 2008, the effective manage-
futures, options on futures, and swap agreements, the
ment fee was 0.50% of the Fund’s average daily net assets.
Funds are required to maintain collateral in various
The investment advisory fee for the Commodities
forms. The Funds use, where appropriate, depending on
Strategy Fund is calculated at an annualized rate of
the financial instrument utilized and the broker involved,
0.75% of the average daily net assets of the Fund.
margin deposits at the broker, cash and/or securities
Effective May 1, 2006, Rydex Investments has contractu-
segregated at the custodian bank, discount notes, or the
ally agreed to waive its 0.75% investment advisory fee to
repurchase agreements allocated to each Fund.
the extent necessary to limit the ordinary operating
The risks inherent in the use of short sales, options,
expenses of the Commodities Strategy Fund (but exclud-
futures contracts, options on futures contracts, structured
ing interest expenses, brokerage commissions and
notes, and swap agreements, include i) adverse changes
extraordinary expenses) to not more than 1.20%, 1.95%,
in the value of such instruments; ii) imperfect correlation
and 1.20% per annum of the average monthly net assets
between the price of the instruments and movements in
of the A-Class, C-Class, and H-Class of the Fund (the
the price of the underlying securities, indices, or futures
“Contractual Fee Waiver”). The Contractual Fee Waiver
contracts; iii) the possible absence of a liquid secondary
may not be modified or eliminated prior to August 1,
market for any particular instrument at any time; and
2008, except with the approval of the Board of Trustees.
iv) the potential of counterparty default.
There is no guarantee that the contractual fee waiver will
continue beyond August 1, 2008.
The Trust has established strict counterparty credit
guidelines and enters into transactions only with financial
As part of its agreement with the Trust, Rydex
institutions of investment grade or better.
Investments will pay all expenses of the Absolute Return
Strategies Fund, Alternative Strategies Allocation Fund,
3.
Fees And Other Transactions With Affiliates
and Hedged Equity Fund, including the cost of transfer
Under the terms of an investment advisory contract, the
agency, custody, fund administration, legal, audit and
Trust pays Rydex Investments investment advisory fees
other services, except interest expense, taxes (expected
calculated at an annualized rate of 0.85% of the average
to be de minimis), brokerage commissions and other
daily net assets of the Real Estate Fund; 0.90% of the
expenses connected with execution of portfolio transac-
average daily net assets of the Sector Rotation Fund,
tions, short dividend expenses, and extraordinary
International Rotation Fund, Managed Futures Strategy
expenses. For the year ended March 31, 2008, Rydex
Fund, the Strengthening Dollar 2x Strategy Fund, and
Investments paid expenses in the amount of $443,183
the Weakening Dollar 2x Strategy Fund; and 1.15% of
and $74,052, for the Absolute Return Strategies Fund
the average daily net assets of the Absolute Return
and Hedged Equity Fund, respectively.
Strategies Fund and the Hedged Equity Fund. The
The Alternative Strategies Allocation Fund indirectly
Alternative Strategies Allocation Fund does not pay
bears a proportionate share of the total operating
Rydex Investments a management fee.
expenses (including investment management, share-
Also under the terms of the investment advisory con-
holder servicing, custody, transfer agency, audit and
tract, the Trustees voted to implement a performance
other underlying fund expenses) of the underlying funds
adjustment for the Multi-Cap Core Equity Fund. The
in which the Fund invests. In addition, some underlying
Trust pays Rydex Investments investment advisory fees
funds charge redemption fees if a shareholder, including
82
|
THE RYDEX SERIES FUNDS ANNUAL REPORT
NOTES TO FINANCIAL STATEMENTS (continued)
a Fund, redeems shares before the end of the funds’
0.25% service fee compensates the shareholder’s finan-
requisite holding period. Therefore, if the Fund sells
cial advisor for providing on-going services to the share-
shares of an underlying fund that is subject to a redemp-
holder. The annual 0.75% distribution fee reimburses the
tion fee, that Fund will be responsible for paying the
Distributor for paying the shareholder’s financial advisor
redemption fee to the underlying funds.
an on-going sales commission. The Distributor advances
Rydex Investments provides transfer agent and adminis-
the first year’s service and distribution fees to the
trative services to the Funds for fees calculated at an
Financial Advisor. The Distributor retains the service and
annualized rate of 0.25% of the average daily net assets
distribution fees on accounts with no authorized dealer
of each Fund. Fees related to the Absolute Return
of record.
Strategies, Alternative Strategies Allocation Fund, and
The Alternative Strategies Allocation Fund has not
Hedged Equity Funds are paid by Rydex Investments, as
adopted a Distribution Plan and a Shareholder Services
noted previously.
Plan with respect to A-Class Shares and H-Class Shares.
Rydex Investments provides accounting services to the
Instead, the Funds invest in underlying funds that have a
Trust calculated at an annualized rate of 0.10% on the
distribution plan that allows the underlying funds to pay
first $250 million of the average daily net assets, 0.075%
distribution fees to the Distributor and other firms that
on the next $250 million of the average daily net assets,
provide distribution services (“Service Providers”). The
0.05% on the next $250 million of the average daily net
underlying funds will pay distribution fees to the
assets, and 0.03% on the average daily net assets over
Distributor at an annual rate not to exceed 0.25% of
$750 million of each Fund. Fees related to the Absolute
average daily net assets, pursuant to Rule 12b-1 under
Return Strategies, Alternative Strategies Allocation Fund,
the 1940 Act, as amended. If a Service Provider provides
and Hedged Equity Funds are paid by Rydex
distribution or shareholder services, the Distributor will,
Investments, as noted previously.
in turn, pay the Service Provider for the services it pro-
vides at an annual rate not to exceed 0.25% of the aver-
Rydex Investments engages external service providers to
age daily net assets of a Fund.
perform other necessary services for the Trust, such as
audit and accounting related services, legal services, cus-
The Alternative Strategies Allocation Fund has adopted
tody, printing and mailing, etc., on a pass-through basis.
a Distribution and Shareholder Services Plan applicable
Such expenses vary from Fund to Fund and are allocated
to its C-Class Shares that allows the Fund to pay annual
to the Funds based on relative net assets. Any of these
distribution and service fees of 0.75% of the Fund’s
expenses allocated to the Absolute Return Strategies,
C-Class Shares average daily net assets. The annual
Alternative Strategies Allocation Fund, and Hedged
0.25% service fee compensates the shareholder’s finan-
Equity Funds are paid by Rydex Investments, as noted
cial advisor for providing on-going services to the share-
previously. Organizational and setup costs for new funds
holder. The annual 0.50% distribution fee reimburses the
are paid by the Trust.
Distributor for paying the shareholder’s financial advisor
an ongoing sales commission. The Distributor advances
The Funds, with the exception of the Alternative
the first year’s service and distribution fees to the finan-
Strategies Allocation Fund, have adopted a Distribution
cial advisor. The Distributor retains the service and
Plan applicable to its A-Class Shares and H-Class Shares
distribution fees on accounts with no authorized dealer
for which Rydex Distributors, Inc. (the “Distributor”), an
of record.
affiliated entity, and other firms that provide distribution
and/or shareholder services (“Service Providers”) may
During the year ended March 31, 2008, the Distributor
receive compensation. If a Service Provider provides dis-
retained sales charges of $839,951, relating to sales of
tribution services, the Trust will pay distribution fees to
A-Class Shares of the Trust.
the Distributor at an annual rate not to exceed 0.25% of
Certain officers and trustees of the Trust are also officers
average daily net assets, pursuant to Rule 12b-1 of the
of Rydex Investments and the Distributor.
1940 Act. The Distributor, in turn, will pay the Service
4.
Federal Income Tax Information
Provider out of its fees.
The Funds intend to comply with the provisions of
The Funds, with the exception of the Alternative
Subchapter M of the Internal Revenue Code applicable
Strategies Allocation Fund, have adopted a separate
to regulated investment companies and will distribute
Distribution and Shareholder Services Plan applicable to
substantially all net investment income and capital gains
its C-Class Shares that allows the Funds to pay annual
to shareholders. Therefore, no Federal income tax
distribution and service fees of 1.00% of the Funds’
provision has been recorded.
C-Class Shares average daily net assets. The annual
THE RYDEX SERIES FUNDS ANNUAL REPORT
|
83
NOTES TO FINANCIAL STATEMENTS (continued)
Effective September 30, 2007, the Funds adopted Financial Accounting Standards Board (FASB) Interpretation No. 48
“Accounting for Uncertainty in Income Taxes” (FIN 48). FIN 48 provides guidance for how uncertain tax positions should be
recognized, measured, presented and disclosed in the financial statements. FIN 48 requires the evaluation of tax positions
taken or expected to be taken in the course of preparing the Fund’s tax returns to determine whether the tax positions are
“more-likely-than-not” of being sustained by the applicable tax authority. Tax positions not deemed to meet the more-
likely-than-not threshold would be recorded as a tax benefit or expense in the current year. Management has analyzed the
Funds’ tax positions taken on federal income tax returns for all open tax years for purposes of complying with FIN 48, and
has concluded that no provision for income tax was required in the Funds’ financial statements.
The Funds file U.S. federal income tax returns and returns in various foreign jurisdictions in which it invests. While the statute
of limitations remains open to examine the Fund’s U.S. federal income tax returns filed for the fiscal years 2004 to 2007,
no examinations are in progress or anticipated at this time.
Income and capital gain distributions are determined in accordance with Federal income tax regulations, which may differ
from U.S. generally accepted accounting principles. These differences are primarily due to differing treatments for deriva-
tives, foreign currency transactions, losses deferred due to wash sales, losses deferred due to post-October losses, and
excise tax regulations.
Permanent book and tax basis differences, if any, will result in reclassifications. This includes net operating losses not uti-
lized during the current period, and capital loss carryforward expired, and the utilization of earnings and profits distributed
to the shareholders on redemption of shares as part of the dividends paid deduction for income tax purposes. These
reclassifications have no effect on net assets or net asset values per share. Any undistributed ordinary income or long-term
capital gain remaining at fiscal year end is distributed in the following year.
The Funds recognize interest and penalties, if any, related to unrecognized tax benefits as income tax expense in the state-
ment of operations. During the period, the Funds did not incur any interest or penalties.
The Fund’s tax basis capital gains and losses are determined only at the end of each fiscal year. Tax basis capital losses in
excess of capital gains are carried forward to offset future net capital gains. For the year ended March 31, 2008, the follow-
ing Fund offset net realized capital gains with capital losses from previous years:
Fund
Amount
Commodities Strategy Fund
$6,304,112
The tax character of distributions paid during the year ended March 31, 2008 was as follows:
Ordinary
Long-Term
Total
Fund
Income
Capital Gain
Distributions
Multi-Cap Core Equity Fund
$
3,661,114
$
4,699,874
$
8,360,988
Sector Rotation Fund
12,569,597
13,606,294
26,175,891
Absolute Return Strategies Fund
9,533,830
1,014,038
10,547,868
Alternative Strategies Allocation Fund
—
—
—
Commodities Strategy Fund
450,893
—
450,893
Hedged Equity Fund
1,818,273
56,710
1,874,983
International Rotation Fund
663,835
140,091
803,926
Managed Futures Strategy Fund
26,724
—
26,724
Real Estate Fund
67,532
—
67,532
Strengthening Dollar 2x Strategy Fund
—
—
—
Weakening Dollar 2x Strategy Fund
26,928,846
17,901
26,946,747
84
|
THE RYDEX SERIES FUNDS ANNUAL REPORT
NOTES TO FINANCIAL STATEMENTS (continued)
The tax character of distributions paid during the year ended March 31, 2007 was as follows:
Ordinary
Long-Term
Total
Fund
Income
Capital Gain
Distributions
Multi-Cap Core Equity Fund
$1,969,638
$
2,771,618
$
4,741,256
Sector Rotation Fund
452,594
10,314,837
10,767,431
Absolute Return Strategies Fund
3,781,430
1,094,207
4,875,637
Commodities Strategy Fund
—
—
—
Hedged Equity Fund
1,246,376
310,721
1,557,097
Managed Futures Strategy Fund
—
—
—
Real Estate Fund
393,717
267,037
660,754
Strengthening Dollar 2x Strategy Fund
—
—
—
Weakening Dollar 2x Strategy Fund
—
—
—
The tax character of distributable earnings/(accumulated losses) at March 31, 2008, was as follows:
Undistributed
Undistributed
Net Unrealized
Ordinary
Long-Term
Appreciation/
Capital Loss
Fund
Income
Capital Gain
(Depreciation)
Carryforward
Multi-Cap Core Equity Fund
$
—
$
—
$
(641,281)
$
—
Sector Rotation Fund
—
—
18,862,830
—
Absolute Return Strategies Fund
1,270,043
106,765
(1,669,555)
—
Alternative Strategies Allocation Fund
247
—
(30,641)
—
Commodities Strategy Fund
1,407,429
—
11,233,677
(533,762)1
Hedged Equity Fund
57,228
5,792
(394,444)
—
International Rotation Fund
—
—
(2,156,326)
—
Managed Futures Strategy Fund
6,182,288
6,901,109
15,418,848
—
Real Estate Fund
—
—
(2,175,122)
—
Strengthening Dollar 2x Strategy Fund
—
—
—
(152,230)2
Weakening Dollar 2x Strategy Fund
8,851,202
2,273,780
—
—
Capital Loss Carryforward amounts may be limited due to Treasury Regulations.
1 Expires in 2015.
2 $27,521 expires in 2015 and $124,709 expires in 2016.
At March 31, 2008, the cost of securities for Federal income tax purposes, the aggregate gross unrealized gain for all secu-
rities for which there was an excess of value over tax cost and the aggregate gross unrealized loss for all securities for
which there was an excess of tax cost over value, were as follows:
Tax
Tax
Net
Tax
Unrealized
Unrealized
Unrealized
Fund
Cost
Gain
Loss
Gain (Loss)
Multi-Cap Core Equity Fund
$
42,076,438
$
2,523,657
$
(3,164,938)
$
(641,281)
Sector Rotation Fund
432,723,365
35,089,538
(16,226,708)
18,862,830
Absolute Return Strategies Fund
229,748,508
6,630,931
(14,809,261)
(8,178,330)
Alternative Strategies Allocation Fund
5,093,985
23,325
(53,966)
(30,641)
Commodities Strategy Fund
149,426,529
13,742,448
(2,508,771)
11,233,677
Hedged Equity Fund
27,932,523
893,734
(2,088,228)
(1,194,494)
International Rotation Fund
31,238,593
—
(1,936,222)
(1,936,222)
Managed Futures Strategy Fund
477,708,267
18,745,368
(3,341,202)
15,404,166
Real Estate Fund
27,305,129
—
(2,175,122)
(2,175,122)
Strengthening Dollar 2x Strategy Fund
26,912,163
—
—
—
Weakening Dollar 2x Strategy Fund
98,307,337
—
—
—
THE RYDEX SERIES FUNDS ANNUAL REPORT
|
85
NOTES TO FINANCIAL STATEMENTS (continued)
Pursuant to Federal income tax regulations applicable to investment companies, the Funds have elected to treat net capital
losses realized between November 1 and March 31 of each year as occurring on the first day of the following tax year. For
the year ended March 31, 2008, the following amounts of realized capital and currency losses reflected in the accompany-
ing financial statements will not be recognized for Federal income tax purposes until April 1, 2008:
Fund
Currency
Capital
Multi-Cap Core Equity Fund
$
—
$
(2,170,266)
Sector Rotation Fund
—
(37,489,753)
Absolute Return Strategies Fund
—
(18,429,000)
Hedged Equity Fund
—
(4,189,586)
International Rotation Fund
(2,502,568)
(323,659)
Real Estate Fund
—
(381,147)
Strengthening Dollar 2x Strategy Fund
(1,856,737)
(4,186,386)
5.
Repurchase Agreements
The Trust transfers uninvested cash balances into a single joint account, the daily aggregate balance of which is invested in
one or more repurchase agreements collateralized by obligations of the U.S. Treasury and U.S. Government Agencies. The
collateral is in the possession of the Trust’s custodian and is evaluated daily to ensure that its market value exceeds by, at a
minimum, 102% of the delivery value of the repurchase agreement at maturity. Each Fund holds a pro rata share of the col-
lateral based on the dollar amount of the repurchase agreement entered into by each Fund.
The repurchase agreements executed by the joint account and outstanding as of March 31, 2008, were as follows:
Counterparty
Terms of Agreement
Face Value
Market Value
Repurchase Price
Mizuho Financial Group, Inc.
1.30% due 04/01/08
$600,000,000
$
600,000,000
$
600,021,667
Lehman Brothers Holdings, Inc.
1.15% due 04/01/08
453,981,227
453,981,227
453,995,729
Morgan Stanley
1.35% due 04/01/08
125,000,000
125,000,000
125,004,688
$1,178,981,227
$1,179,022,084
As of March 31, 2008, the collateral for the repurchase agreements in the joint account was as follows:
Security Type
Maturity Dates
Range of Rates
Par Value
Market Value
U.S. Treasury Notes
11/15/08 – 11/15/09
4.500% – 4.750%
$479,616,000
$
501,259,462
U.S. Treasury Bonds
08/15/19 – 08/15/23
6.250% – 8.125%
208,494,000
262,781,309
U.S. TIP Notes
04/15/11 – 01/15/18
1.625% – 2.625%
211,151,000
243,027,372
U.S. TIP Bonds
01/15/25 – 04/15/29
1.750% – 3.875%
172,432,000
179,310,625
U.S. Treasury Bills
04/03/08 – 09/25/08
—
16,097,000
16,047,993
$1,202,426,761
In the event of counterparty default, the Trust has the right to collect the collateral to offset losses incurred. There is poten-
tial loss to the Trust in the event the Trust is delayed or prevented from exercising its rights to dispose of the collateral
securities, including the risk of a possible decline in the value of the underlying securities during the period while the Trust
seeks to assert its rights. The Trust’s investment advisor, acting under the supervision of the Board of Trustees, reviews the
value of the collateral and the creditworthiness of those banks and dealers with which the Trust enters into repurchase
agreements to evaluate potential risks.
6.
Securities Transactions
During the year ended March 31, 2008, the cost of purchases and proceeds from sales of investment securities, excluding
short-term and temporary cash investments, were:
Alternative
Multi-Cap
Absolute Return
Strategies
Commodities
Core Equity
Sector Rotation
Strategies
Allocation
Strategy
Hedged Equity
Fund
Fund
Fund
Fund
Fund
Fund
Purchases
$
83,784,070
$1,036,681,621
$977,791,193
$4,936,836
$185,561,454
$116,044,995
Sales
$121,206,190
$
997,229,750
$948,817,005
$
—
$160,527,967
$120,808,851
86
|
THE RYDEX SERIES FUNDS ANNUAL REPORT
NOTES TO FINANCIAL STATEMENTS (continued)
Strengthening
Weakening
International
Managed
Dollar
Dollar
Rotation
Futures Strategy
Real Estate
2x Strategy
2x Strategy
Fund
Fund
Fund
Fund
Fund
Purchases
$35,660,121
$254,649,210
$163,900,271
$
—
$
—
Sales
$20,164,951
$119,368,213
$178,355,036
$
—
$
—
7.
Call Options Written
Transactions in options written during the period ended March 31, 2008, were as follows:
Absolute Return Strategies Fund
Hedged Equity Fund
Number of
Premiums
Number of
Premiums
Contracts
Received
Contracts
Received
Options outstanding at March 31, 2007
—
$
—
—
$
—
Options written
320
7,009,684
47
1,022,015
Options terminated in closing purchase transactions
(201)
(4,540,886)
(28)
(627,837)
Options expired
—
—
—
—
Options exercised
—
—
—
—
Options outstanding at March 31, 2008
119
$ 2,468,798
19
$
394,178
THE RYDEX SERIES FUNDS ANNUAL REPORT
|
87
NOTES TO FINANCIAL STATEMENTS (continued)
8.
Share Transactions
The Trust is authorized to issue an unlimited number of shares (no par value). Transactions in shares for the years presented were:
Shares Purchased
Purchased through Dividend Reinvestment
Shares Redeemed
Net Shares Purchased (Redeemed)
Year Ended
Year Ended
Year Ended
Year Ended
Year Ended
Year Ended
Year Ended
Year Ended
March 31,
March 31,
March 31,
March 31,
March 31,
March 31,
March 31,
March 31,
2008
2007
2008
2007
2008
2007
2008
2007
Multi-Cap Core Equity Fund
A-Class
183,758
512,324
45,561
25,016
(277,562)
(388,196)
(48,243)
149,144
C-Class
578,996
915,144
309,961
120,278
(1,303,090)
(1,101,463)
(414,133)
(66,041)
H-Class
450,833
2,703,163
251,651
132,999
(2,022,499)
(3,585,911)
(1,320,015)
(749,749)
Sector Rotation Fund
A-Class
2,515,971
2,915,024
180,762
99,346
(1,870,200)
(2,349,522)
826,533
664,848
C-Class
2,985,049
5,827,906
507,269
297,000
(3,247,704)
(5,985,481)
244,614
139,425
H-Class
17,462,062
17,047,675
944,333
340,057
(15,112,460)
(24,762,620)
3,293,935
(7,374,888)
Absolute Return Strategies Fund
A-Class
1,539,342
1,743,268
61,772
23,781
(1,466,196)
(414,314)
134,918
1,352,735
C-Class
1,299,950
1,992,272
81,715
29,287
(946,572)
(472,761)
435,093
1,548,798
H-Class
3,737,413
8,184,826
233,503
121,837
(4,883,815)
(2,854,821)
(912,899)
5,451,842
Alternative Strategies Allocation Fund*
A-Class
45,145
—
—
—
(36)
—
45,109
—
C-Class
6,211
—
—
—
(76)
—
6,135
—
H-Class
156,802
—
—
—
(60)
—
156,742
—
Commodities Strategy Fund
A-Class
735,802
1,038,828
4,195
—
(579,667)
(951,294)
160,330
87,534
C-Class
468,782
257,580
2,792
—
(311,479)
(232,273)
160,095
25,307
H-Class
9,361,274
6,197,206
9,632
—
(7,020,121)
(5,788,416)
2,350,785
408,790
Hedged Equity Fund
A-Class
111,860
260,802
8,201
4,214
(147,120)
(60,153)
(27,059)
204,863
C-Class
134,682
320,629
10,345
12,011
(232,135)
(127,584)
(87,108)
205,056
H-Class
629,575
1,077,651
52,308
42,094
(1,055,321)
(688,667)
(373,438)
431,078
International Rotation Fund*
A-Class
873,569
—
16,911
—
(302,363)
—
588,117
—
C-Class
371,274
—
5,073
—
(218,555)
—
157,792
—
H-Class
1,363,614
—
9,613
—
(772,642)
—
600,585
—
Managed Futures Strategy Fund
A-Class
4,382,451
945,889*
235
—*
(771,855)
(936)*
3,610,831
944,953*
C-Class
1,663,914
108,028*
79
—*
(131,337)
— *
1,532,656
108,028*
H-Class
11,517,109
2,234,248*
614
—*
(1,928,419)
(405,431)*
9,589,304
1,828,817*
* Since the commencement of operations: March 2, 2007 — Managed Futures Strategy Fund; August 31, 2007 — International Rotation Fund; March 7, 2008 — Alternative Strategies Allocation
Fund.
NOTES TO FINANCIAL STATEMENTS (continued)
Shares Purchased
Purchased through Dividend Reinvestment
Shares Redeemed
Net Shares Purchased (Redeemed)
Year Ended
Year Ended
Year Ended
Year Ended
Year Ended
Year Ended
Year Ended
Year Ended
March 31,
March 31,
March 31,
March 31,
March 31,
March 31,
March 31,
March 31,
2008
2007
2008
2007
2008
2007
2008
2007
Real Estate Fund
A-Class
112,803
564,891
557
1,050
(239,901)
(361,294)
(126,541)
204,647
C-Class
700,464
515,598
564
1,190
(760,867)
(482,847)
(59,839)
33,941
H-Class
6,023,194
16,747,783
852
13,156
(6,199,457)
(17,508,928)
(175,411)
(747,989)
Strengthening Dollar 2x Strategy Fund
A-Class
787,126
68,374
—
—
(650,512)
(67,427)
136,614
947
C-Class
1,457,961
722,596
—
—
(1,247,514)
(645,264)
210,447
77,332
H-Class
12,026,223
8,295,060
—
—
(11,034,788)
(8,085,732)
991,435
209,328
Weakening Dollar 2x Strategy Fund
A-Class
1,514,334
1,294,478
127,340
—
(1,706,145)
(604,890)
(64,471)
689,588
C-Class
1,265,049
1,087,128
112,053
—
(1,168,330)
(712,256)
208,772
374,872
H-Class
9,101,734
17,478,708
648,780
—
(10,420,234)
(15,536,958)
(669,720)
1,941,750
NOTES TO FINANCIAL STATEMENTS (continued)
9.
Portfolio Securities Loaned
The Funds may lend their securities to approved brokers to earn additional income. Security lending income shown on the
statement of operations is shown net of rebates paid to borrowers and earnings on cash collateral investments shared with
the lending agent. Within this arrangement, the Fund acts as the lender, U.S. Bank acts as the agent, and other approved
registered broker dealers act as the borrowers. The Funds receive cash collateral, valued at 100% of the value of the securi-
ties on loan, which is initially held in a segregated account at U.S. Bank. Under the terms of the Funds’ securities lending
agreement with U.S. Bank, cash collateral may be invested by U.S. Bank in certain high quality, liquid investments. At
March 31, 2008, the cash collateral investments consisted of a money market mutual fund. The Funds bear the risk of loss
on cash collateral investments. Collateral is maintained over the life of the loan in an amount not less than the value of
loaned securities, as determined at the close of fund business each day; any additional collateral required due to changes
in security values is delivered to the Fund the next business day. Although the collateral mitigates risk, the Funds could
experience a delay in recovering its securities and a possible loss of income or value if the borrower fails to return the
securities. The Funds have the right under the securities lending agreement to recover the securities from the borrower
on demand.
The following represents a breakdown of the collateral, its rates, and maturities:
MUTUAL FUND
Issuer
Shares
Market Value
Mount Vernon Securities Lending Trust
182,009,020
$ 182,009,020
Total Mutual Fund
$182,009,020
At March 31, 2008, the following Funds participated in securities lending and received cash collateral:
Cash Collateral
Value of Securities Loaned
Multi-Cap Core Equity Fund
$
9,136,749
$
8,863,573
Sector Rotation Fund
108,278,629
105,569,817
Absolute Return Strategies Fund
39,871,120
38,311,988
Commodities Strategy Fund
5,673,000
5,380,980
Hedged Equity Fund
2,828,047
2,749,562
Managed Futures Strategy Fund
10,274,354
9,913,861
Real Estate Fund
5,947,121
5,775,688
10. New Accounting Pronouncements
On September 15, 2006, the FASB released Statement of Financial Accounting Standard No. 157 (“FAS 157”) Fair Value
Measurement which provided enhanced guidance for using fair value to measure assets and liabilities. The standard requires
companies to provide expanded information about the assets and liabilities measured at fair value and the potential effect
of these fair valuations on an entity’s financial performance. The standard does not expand the use of fair value in any new
circumstances, but provides clarification on acceptable fair valuation methods and applications. Adoption of FAS 157 is
required for fiscal years beginning after November 15, 2007. The standard is not expected to materially impact the Funds’
financial statements.
In March 2008, the FASB issued FAS No. 161, “Disclosures about Derivative Instruments and Hedging Activities.” The new
requirement is intended to improve disclosures around an entity’s derivatives activity and help investors understand how
entities use derivatives, how they are accounted for and how they affect the financial position and operations of that entity.
FAS 161 is effective for fiscal years and interim periods beginning after November 15, 2008.
11. Acquisition of Rydex Investments and the Distributor
At the close of business on January 17, 2008, Rydex NV, Inc., comprised of Rydex Investments, together with several other
Rydex entities, was acquired by Security Benefit Corporation (“Security Benefit”), a financial services firm that provides a
broad variety of financial programs to investors in the advisor, banking, education, government, institutional, and qualified
plan markets (the “Transaction”). As a result of the Transaction’s completion, Rydex Investments and the Distributor are
wholly-owned subsidiaries of Security Benefit. While the Transaction has no material impact on the Funds or their share-
holders, it resulted in a change of control of Rydex Investments, which in turn caused the termination of the investment
advisory agreement between Rydex Investments and the Funds.
90
|
THE RYDEX SERIES FUNDS ANNUAL REPORT
NOTES TO FINANCIAL STATEMENTS (concluded)
A new investment advisory agreement between Rydex Investments and the Funds was approved under substantially the
same terms as the previous investment advisory agreement (the “New Agreement”). This New Agreement was approved
by shareholders, via proxy, and took effect upon the closing of the Transaction.
The Transaction had no impact on the day-to-day operations of Rydex Investments, the fees payable to Rydex Investments
under the New Agreement, or the persons responsible for the management of the Funds.
THE RYDEX SERIES FUNDS ANNUAL REPORT
|
91
REPORT OF INDEPENDENT REGISTERED PUBLIC
ACCOUNTING FIRM
To the Board of Trustees and Shareholders
of the Rydex Series Funds:
We have audited the accompanying statements of assets and liabilities of the Multi-Cap Core Equity Fund, Sector Rotation
Fund, Absolute Return Strategies Fund, Alternative Strategies Allocation Fund, Commodities Strategy Fund, Hedged
Equity Fund, International Rotation Fund, Managed Futures Strategy Fund, Real Estate Fund, Strengthening Dollar 2x
Strategy Fund, and Weakening Dollar 2x Strategy Fund (11 of the series constituting the Rydex Series Funds) (the “Funds”),
including the schedules of investments, as of March 31, 2008, and the related statements of operations for the period then
ended, statements of changes in net assets, and financial highlights for each of the periods presented in the two years then
ended. These financial statements and financial highlights are the responsibility of the Funds’ management. Our responsi-
bility is to express an opinion on these financial statements and financial highlights based on our audits. The financial high-
lights for each of the periods presented through March 31, 2006 were audited by other auditors, whose report dated May
18, 2006 expressed an unqualified opinion on those financial statements and financial highlights.
We conducted our audits in accordance with the standards of the Public Company Accounting Oversight Board (United
States). Those standards require that we plan and perform the audit to obtain reasonable assurance about whether the
financial statements and financial highlights are free of material misstatement. We were not engaged to perform an audit
of the Funds’ internal control over financial reporting. Our audits included consideration of internal control over financial
reporting as a basis for designing audit procedures that are appropriate in the circumstances, but not for the purpose of
expressing an opinion on the effectiveness of the Funds’ internal control over financial reporting. Accordingly, we express
no such opinion. An audit also includes examining, on a test basis, evidence supporting the amounts and disclosures in the
financial statements and financial highlights, assessing the accounting principles used and significant estimates made by
management, and evaluating the overall financial statement presentation. Our procedures included confirmation of securi-
ties owned as of March 31, 2008, by correspondence with the custodian and brokers or by other appropriate auditing
procedures where replies from brokers were not received. We believe that our audits provide a reasonable basis for our
opinion.
In our opinion, the financial statements and financial highlights referred to above present fairly, in all material respects,
the financial position of each of the Funds at March 31, 2008, and the results of their operations for the period then ended,
the changes in their net assets and their financial highlights for each of the periods presented in the two years then ended,
in conformity with U.S. generally accepted accounting principles.
McLean, Virginia
May 29, 2008
92
|
THE RYDEX SERIES FUNDS ANNUAL REPORT
OTHER INFORMATION (Unaudited)
Tax Information
This information is being provided for the year ended March 31, 2008, as required by the Internal Revenue Code. Amounts
shown may differ from those elsewhere in the report because of differences in tax and financial reporting practice.
Of the ordinary income distributions paid during the year, the following Funds had the corresponding percentages qualify
for the dividends received deduction for corporations:
Fund
% Qualifying
Multi-Cap Core Equity Fund
42.23%
Sector Rotation Fund
12.77%
Absolute Return Strategies Fund
28.73%
Hedged Equity Fund
18.13%
International Rotation Fund
77.38%
Additionally, the following amounts of ordinary dividends paid during the same period qualified for the lower income tax
rate available to individuals under the Jobs and Growth Tax Relief Reconciliation Act of 2003, respectively. This information
was included in Form 1099-DIV sent to shareholders for the calendar year ended on December 31, 2007. Information for
2008 will be sent to shareholders in January of 2009.
Fund
% Qualifying
Multi-Cap Core Equity Fund
88.28%
Sector Rotation Fund
23.69%
Absolute Return Strategies Fund
40.29%
Hedged Equity Fund
7.75%
International Rotation Fund
38.30%
The Funds’ distributions to shareholders included:
Multi-Cap
Sector
Absolute Return
Hedged
Core Equity
Rotation
Strategies
Equity
Fund
Fund
Fund
Fund
From short-term capital gains:
$3,610,813
$12,569,596
$
—
$
—
From long-term capital gains,
subject to the 15% rate gains category:
4,699,874
13,606,294
1,014,038
56,710
From long-term capital gains, using
proceeds from shareholder redemptions:
1,074,101
—
1,524,281
232,955
International
Managed
Real
Weakening
Rotation
Futures
Estate
Dollar 2x
Fund
Fund
Fund
Fund
From short-term capital gains:
$
158,414
$
26,724
$
—
$
—
From long-term capital gains,
subject to the 15% rate gains category:
140,091
—
—
17,901
From long-term capital gains, using
proceeds from shareholder redemptions:
25,198
752,156
940,860
5,704,160
Proxy Voting Information
A description of the policies and procedures that the Trust uses to determine how to vote proxies relating to securities held
in the Funds’ portfolios is available, without charge and upon request, by calling 1-800-820-0888. This information is also
available from the EDGAR database on the SEC’s website at http://www.sec.gov.
Information regarding how the Funds voted proxies relating to portfolio securities during the most recent 12-month period
ended June 30 is available without charge, upon request, by calling 1-800-820-0888. This information is also available from
the EDGAR database on the SEC’s website at http://www.sec.gov.
THE RYDEX SERIES FUNDS ANNUAL REPORT
|
93
OTHER INFORMATION (Unaudited) (concluded)
Proxy Results
At a special meeting of shareholders initially held on October 4, 2007, the shareholders of the Funds voted on whether to
approve a new investment advisory agreement between Rydex Series Funds and Padco Advisors, Inc. A description of the
number of shares voted is as follows:
Shares
Shares
Shares
Fund
For
Against
Abstained
Multi-Cap Core Equity Fund
1,921,466.749
92,938.061
109,303.900
Sector Rotation Fund
9,472,435.898
369,537.644
743,388.025
Absolute Return Strategies Fund
6,220,345.260
160,606.533
308,057.950
Commodities Strategy Fund
1,345,564.619
22,340.563
50,093.783
Hedged Equity Fund
1,001,787.797
22,172.820
50,019.744
Managed Futures Strategy Fund
3,182,571.311
86,985.935
150,411.317
Real Estate Fund
226,238.760
316.000
158.102
Strengthening Dollar 2x Strategy Fund
526,507.812
11,307.176
30,282.777
Weakening Dollar 2x Strategy Fund
2,067,787.756
99,919.384
219,499.286
Quarterly Portfolio Schedules Information
The Trust files its complete schedule of portfolio holdings with the SEC for the first and third quarters of each fiscal year on
Form N-Q, which is available on the SEC’s website at http://www.sec.gov. The Funds’ Forms N-Q may be reviewed and
copied at the SEC’s Public Reference Room in Washington, DC, and that information on the operation of the Public
Reference Room may be obtained by calling 1-800-SEC-0330. Copies of the portfolio holdings are also available to share-
holders, without charge and upon request, by calling 1-800-820-0888.
94
|
THE RYDEX SERIES FUNDS ANNUAL REPORT
INFORMATION ON BOARD OF TRUSTEES AND OFFICERS (Unaudited)
A Board of Trustees oversees all Rydex Investments, in which its members have no stated term of service, and continue to serve
after election until resignation. The Statement of Additional Information includes further information about Fund Trustees and
Officers, and can be obtained without charge by calling 1-800-820-0888.
All Trustees and Officers may be reached c/o Rydex Investments, 9601 Blackwell Rd., Suite 500, Rockville, MD 20850.
TRUSTEES AND OFFICERS
Length of Service
Name, Position and
As Trustee
Number of
–––––––––––––––––
Year of Birth
––––––––––––––––––––––
(Year Began)
––––––––––––––
Funds Overseen
Carl G. Verboncoeur*
Rydex Series Funds – 2004
149
Trustee, President (1952)
Rydex Variable Trust – 2004
Rydex Dynamic Funds – 2004
Rydex ETF Trust – 2004
Principal Occupations During Past Five Years: Chief Executive Officer and Treasurer of Rydex Specialized Products, LLC (2005
to present); Chief Executive Officer of Rydex Investments and Rydex Distributors, Inc. (2003 to present); Executive Vice President
of Rydex Investments (2000 to 2003)
Michael P. Byrum*
Rydex Series Funds – 2005
149
Trustee, Vice President
Rydex Variable Trust – 2005
(1970)
Rydex Dynamic Funds – 2005
Rydex ETF Trust – 2005
Principal Occupations During Past Five Years: Chief Investment Officer of Rydex Investments (2003 to present); Secretary of
Rydex Specialized Products, LLC (2005 to present); Vice President of Rydex Series Funds (1997 to present); Vice President of
Rydex Variable Trust (1998 to present); Vice President of Rydex Dynamic Funds (1999 to present); Vice President of Rydex ETF
Trust (2002 to present); President and Trustee of Rydex Capital Partners SPhinX Fund (2003 to 2006); President of Rydex
Investments (2004 to present); Chief Operating Officer of Rydex Investments and Rydex Distributors, Inc. (2003 to 2004)
INDEPENDENT TRUSTEES
Length of Service
Name, Position and
As Trustee
Number of
–––––––––––––––––
Year of Birth
––––––––––––––––––––––
(Year Began)
––––––––––––––
Funds Overseen
John O. Demaret
Rydex Series Funds – 1997
141
Trustee, Chairman of the
Rydex Variable Trust – 1998
Board (1940)
Rydex Dynamic Funds – 1999
Rydex ETF Trust – 2003
Principal Occupations During Past Five Years: Retired
Corey A. Colehour
Rydex Series Funds – 1993
141
Trustee (1945)
Rydex Variable Trust – 1998
Rydex Dynamic Funds – 1999
Rydex ETF Trust – 2003
Principal Occupations During Past Five Years: Retired (2006 to present); Owner and President of Schield Management
Company, registered investment adviser (2005 to 2006); Senior Vice President of Marketing and Co-Owner of Schield
Management Company, registered investment adviser (1985 to 2005)
J. Kenneth Dalton
Rydex Series Funds – 1995
141
Trustee (1941)
Rydex Variable Trust – 1998
Rydex Dynamic Funds – 1999
Rydex ETF Trust – 2003
Principal Occupations During Past Five Years: Mortgage Banking Consultant and Investor, The Dalton Group
THE RYDEX SERIES FUNDS ANNUAL REPORT
|
95
INFORMATION ON BOARD OF TRUSTEES AND OFFICERS (Unaudited) (concluded)
Length of Service
Name, Position and
As Trustee
Number of
––––––––––––––
Year of Birth
––––––––––––––––––––––
(Year Began)
––––––––––––––
Funds Overseen
Werner E. Keller
Rydex Series Funds – 2005
141
Trustee (1940)
Rydex Variable Trust – 2005
Rydex Dynamic Funds – 2005
Rydex ETF Trust – 2005
Principal Occupations During Past Five Years: Retired (2001 to present); Chairman, Centurion Capital Management (1991 to 2001)
Thomas F. Lydon, Jr.
Rydex Series Funds – 2005
141
Trustee (1960)
Rydex Variable Trust – 2005
Rydex Dynamic Funds – 2005
Rydex ETF Trust – 2005
Principal Occupations During Past Five Years: President, Global Trends Investments
Patrick T. McCarville
Rydex Series Funds – 1997
141
Trustee (1942)
Rydex Variable Trust – 1998
Rydex Dynamic Funds – 1999
Rydex ETF Trust – 2003
Principal Occupations During Past Five Years: Founder and Chief Executive Officer, Par Industries, Inc.
Roger Somers
Rydex Series Funds – 1993
141
Trustee (1944)
Rydex Variable Trust – 1998
Rydex Dynamic Funds – 1999
Rydex ETF Trust – 2003
Principal Occupations During Past Five Years: Owner, Arrow Limousine
EXECUTIVE OFFICERS
Name, Position and
Principal Occupations
––––––––––––––
Year of Birth
During Past Five Years
––––––––––––––––
Nick Bonos*
Chief Financial Officer of Rydex Specialized Products, LLC (2005 to present);
Vice President and Treasurer (1963)
Vice President and Treasurer of Rydex Series Funds, Rydex Variable Trust,
Rydex Dynamic Funds, and Rydex ETF Trust (2003 to present); Senior Vice
President of Rydex Investments (2003 to present); Vice President and Treasurer
of Rydex Capital Partners SPhinX Fund (2003 to 2006); Vice President of
Accounting of Rydex Investments (2000 to 2003)
Joanna M. Haigney*
Chief Compliance Officer of Rydex Series Funds, Rydex Variable Trust, and
Chief Compliance Officer and
Rydex Dynamic Funds (2004 to present); Secretary of Rydex Series Funds,
Secretary (1966)
Rydex Variable Trust, and Rydex Dynamic Funds (2000 to present); Secretary
of Rydex ETF Trust (2002 to present); Vice President of Compliance of Rydex
Investments (2000 to present); Secretary of Rydex Capital Partners SPhinX
Fund (2003 to 2006)
Joseph Arruda*
Assistant Treasurer of Rydex Series Funds, Rydex Variable Trust, Rydex Dynamic
Assistant Treasurer (1966)
Funds, Rydex ETF Trust (2006 to present); Vice President of Rydex Investments
(2004 to present); Director of Accounting of Rydex Investments (2003 to 2004);
Vice President of Mutual Funds, State Street Bank & Trust (2000 to 2003)
Paula Billos*
Controller of Rydex Series Funds, Rydex Variable Trust, Rydex Dynamic Funds,
Controller (1974)
Rydex ETF Trust (2006 to present); Director of Fund Administration of Rydex
Investments (2001 to present)
* Officers of the Fund are deemed to be “interested persons” of the Trust, within the meaning of Section 2(a)(19) of the 1940 Act, inasmuch as this
person is affiliated with Rydex Investments.
96
|
THE RYDEX SERIES FUNDS ANNUAL REPORT
This page intentionally left blank.
9601 Blackwell Road, Suite 500
Rockville, MD 20850
www.rydexinvestments.com
800-820-0888
RSTF–ANN–0308x0309