MARCH 31, 2008
RYDEX SERIES FUNDS ANNUAL REPORT
ESSENTIAL PORTFOLIOS
ESSENTIAL PORTFOLIO CONSERVATIVE FUND
ESSENTIAL PORTFOLIO MODERATE FUND
ESSENTIAL PORTFOLIO AGGRESSIVE FUND
GO GREEN!
ELIMINATE MAILBOX CLUTTER
Go paperless with Rydex eDelivery—a service giving you full
online access to account information and documents. Save time,
cut down on mailbox clutter and be a friend to the environment
with eDelivery.
With Rydex eDelivery you can:
•
View online confirmations and statements at your
convenience.
•
Receive email notifications when your most recent
confirmations, statements and other account documents
are available for review.
•
Access prospectuses, annual reports and semiannual
reports online.
It’s easy to enroll:
1/ Visit www.rydexinvestments.com
e
RYDEX
DELIVERY
2/ Click on the Rydex eDelivery logo
3/ Follow the simple enrollment instructions
If you have questions about Rydex eDelivery services,
contact one of our Shareholder Service Representatives
at 800.820.0888.
This report and the financial statements contained herein are submitted for the general information of our shareholders. The
report is not authorized for distribution to prospective investors unless preceded or accompanied by an effective prospectus.
Distributed by Rydex Distributors, Inc.
TABLE OF CONTENTS
LETTER TO OUR SHAREHOLDERS
. . . . . . . . . . . . . . . . . . . . . . . . . . . . . . . . . . . . . . . . . . . . . . . . . . . . . . . . . .
2
ABOUT SHAREHOLDERS’ FUND EXPENSES
. . . . . . . . . . . . . . . . . . . . . . . . . . . . . . . . . . . . . . . . . . . . . . . . . .
3
PERFORMANCE REPORTS AND FUND PROFILES
. . . . . . . . . . . . . . . . . . . . . . . . . . . . . . . . . . . . . . . . . . . . . .
6
SCHEDULES OF INVESTMENTS
. . . . . . . . . . . . . . . . . . . . . . . . . . . . . . . . . . . . . . . . . . . . . . . . . . . . . . . . . . . .
12
STATEMENTS OF ASSETS AND LIABILITIES
. . . . . . . . . . . . . . . . . . . . . . . . . . . . . . . . . . . . . . . . . . . . . . . . . . .
15
STATEMENTS OF OPERATIONS
. . . . . . . . . . . . . . . . . . . . . . . . . . . . . . . . . . . . . . . . . . . . . . . . . . . . . . . . . . . .
16
STATEMENTS OF CHANGES IN NET ASSETS
. . . . . . . . . . . . . . . . . . . . . . . . . . . . . . . . . . . . . . . . . . . . . . . . .
18
FINANCIAL HIGHLIGHTS
. . . . . . . . . . . . . . . . . . . . . . . . . . . . . . . . . . . . . . . . . . . . . . . . . . . . . . . . . . . . . . . . .
20
NOTES TO FINANCIAL STATEMENTS
. . . . . . . . . . . . . . . . . . . . . . . . . . . . . . . . . . . . . . . . . . . . . . . . . . . . . . .
21
REPORT OF INDEPENDENT REGISTERED PUBLIC ACCOUNTING FIRM
. . . . . . . . . . . . . . . . . . . . . . . . . . . .
28
OTHER INFORMATION
. . . . . . . . . . . . . . . . . . . . . . . . . . . . . . . . . . . . . . . . . . . . . . . . . . . . . . . . . . . . . . . . . . .
29
INFORMATION ON BOARD OF TRUSTEES AND OFFICERS
. . . . . . . . . . . . . . . . . . . . . . . . . . . . . . . . . . . . . .
30
THE RYDEX SERIES FUNDS ANNUAL REPORT
|
1
LETTER TO OUR SHAREHOLDERS
DEAR SHAREHOLDER:
The year ended March 31, 2008 was a momentous one in many respects. The U.S. financial system teetered on the
brink of collapse as the ongoing crisis in the nation’s credit markets seemed to threaten the solvency of many major
Wall Street institutions. Indeed, financial market turmoil, the magnitude of which had not been seen in decades, lead
to the dramatic collapse of Bear Stearns, a powerhouse investment bank that traced its origins back to the 1920’s
and had successfully weathered the Great Depression. At the tail end of the period, stocks soared in a classic relief
rally once it was clear that other major financial institutions did not face solvency issues that threatened their very
existence and the overall health of the U.S. financial system.
During this tumultuous period, the Dow Jones Industrial AverageSM actually managed to eke out a 1.59% gain despite
losing more than 1,000 points in the first three months of 2008, the largest quarterly point decline in the Index’s long
history. The S&P 500® Index found the going a bit tougher, falling 5.08%. With the avoidance of risk as the dominant
theme over the past year, more aggressive exposures such as small-cap and mid-cap stocks suffered. The S&P 400
MidCap Index fell 6.97%, while the Russell 2000® Index of small cap stocks lost 13.00% of its value. Financial stocks
were at the epicenter of the crisis that began to unfold during the summer (the S&P 500 Financials Index fell an
astounding 27.78% during the period). The S&P Small Cap 600/Citigroup Pure Value Index was the worst performing
sector in the traditional style-box series, falling 22.23%.
International stocks were the clear winners in the year ended March 31, 2008. Developed market stocks performed
in-line with their U.S counterparts (the benchmark MSCI EAFE Index declined 2.10%), aided by local currency
appreciation as the U.S. dollar fell over 13.42%. Emerging market stocks, however, continued their multi-year run as
the MSCI EM Index soared over 21.00% on the back of huge rallies in the BRIC markets.
Not surprisingly, investors ran to the safety of U.S. Treasury securities, pulling long-term interest rates down to five-
year lows. Short-term interest rates plummeted, with the yield on the 2-year Treasury note falling in excess of three
percentage points to 1.59%. Longer-term interest rates were a little stickier as the yield on the 10-year Note fell a
more modest 1.2 points to 3.42%. As a result, the yield curve resumed its traditional positive slope after having been
flat for an extended period.
The impetus for the dramatic shift in the term structure of interest rates was a series of emergency rate cuts by the
Federal Reserve (the “Fed”). In six sweeping moves, the Fed slashed the widely watched Fed Funds target rate from
5.25% to 2.25%. In this crisis environment, the Fed, in conjunction with other central banks, continuously pumped
hundreds of billions of dollars of liquidity into the global financial system. With all the ingredients for a recession
firmly in place – depressed consumer sentiment, shrinking payrolls, declining retail sales, curtailed capital spending
plans and falling wealth levels—government at all levels went into crisis prevention mode. Despite all the bad news,
it is unlikely that the U.S. economy actually shrank during this period. The cheap U.S. dollar fueled a boom in
exports which kept economic growth in the black. Low short-term interest rates and a cheap dollar also fueled a
boom in commodities markets as the prices of oil, industrial metals and agricultural products skyrocketed. Oil, in
particular, rose 54%, breaching the psychologically significant $100 per barrel mark by the end of the period.
Although write downs will continue to dribble out of the banking system, the worst of the financial crisis seems to be
behind us at this point. Recent earnings reports from the likes of Lehman Brothers, Goldman Sachs, and Morgan
Stanley indicate that the U.S. financial system is sufficiently capitalized to weather the credit crisis unless estimates of
mortgage debt write offs are substantially off the mark. This leaves us cautiously optimistic about the direction of
stock prices as we move into the new year. There is little doubt that the economy will continue to flirt with recession
and interest rates are poised to rise. Yet there has been an important and discernable shift in market sentiment
indicating, to us at least, that more bad news from the housing front will be taken in stride.
We appreciate the trust you have placed in our firm’s quality and integrity by investing with us.
Sincerely,
David C. Reilly, CFA
Director of Portfolio Strategy
2
|
THE RYDEX SERIES FUNDS ANNUAL REPORT
ABOUT SHAREHOLDERS’ FUND EXPENSES (Unaudited)
All mutual funds have operating expenses and it is important for our shareholders to understand the
impact of costs on their investments. Shareholders of a Fund incur two types of costs: (i) transaction costs,
including sales charges (loads) on purchase payments, reinvested dividends, or other distributions;
redemption fees; and exchange fees; and (ii) ongoing costs, including management fees, administrative
services, and shareholder reports, among others. These ongoing costs, or operating expenses, are
deducted from a fund’s gross income and reduce the investment return of the fund.
A fund’s expenses are expressed as a percentage of its average net assets, which is known as the expense
ratio. The following examples are intended to help investors understand the ongoing costs (in dollars) of
investing in a Fund and to compare these costs with the ongoing costs of investing in other mutual funds.
The examples are based on an investment of $1,000 made at the beginning of the period and held for
the entire six-month period beginning September 30, 2007 and ending March 31, 2008.
The following tables illustrate a Fund’s costs in two ways:
Table 1. Based on actual Fund return. This section helps investors estimate the actual expenses paid
over the period. The “Ending Account Value” shown is derived from the Fund’s actual return, and the
fourth column shows the dollar amount that would have been paid by an investor who started with
$1,000 in the Fund. Investors may use the information here, together with the amount invested, to
estimate the expenses paid over the period. Simply divide the Fund’s account value by $1,000 (for
example, an $8,600 account value divided by $1,000 = 8.6), then multiply the result by the number
provided under the heading “Expenses Paid During Period.”
Table 2. Based on hypothetical 5% return. This section is intended to help investors compare a Fund’s
cost with those of other mutual funds. The table provides information about hypothetical account values
and hypothetical expenses based on the Fund’s actual expense ratio and an assumed rate of return of
5% per year before expenses, which is not the Fund’s actual return. The hypothetical account values
and expenses may not be used to estimate the actual ending account balance or expenses paid during
the period. The example is useful in making comparisons because the U.S. Securities and Exchange
Commission (the “SEC”) requires all mutual funds to calculate expenses based on the 5% return.
Investors can assess a Fund’s costs by comparing this hypothetical example with the hypothetical
examples that appear in shareholder reports of other funds.
Certain retirement plans such as IRA, SEP, Roth IRA and 403(b) accounts are charged an annual $15
maintenance fee. Upon liquidating a retirement account, a $15 account-closing fee will be taken from the
proceeds of the redemption.
The calculations illustrated above assume no shares were bought or sold during the period. Actual costs
may have been higher or lower, depending on the amount of investment and the timing of any purchases
or redemptions.
Note that the expenses shown in the table are meant to highlight and help compare ongoing costs only
and do not reflect any transactional costs which may be incurred by a Fund.
More information about a Fund’s expenses, including annual expense ratios for the past five years, can be
found in the Financial Highlights section of this report. For additional information on operating expenses
and other shareholder costs, please refer to the appropriate Fund prospectus.
THE RYDEX SERIES FUNDS ANNUAL REPORT
|
3
ABOUT SHAREHOLDERS’ FUND EXPENSES (Unaudited) (concluded)
Beginning
Ending
Expenses
Expense
Account Value
Account Value
Paid During
Ratio†
September 30, 2007
March 31, 2008
Period*
Table 1. Based on actual Fund return
Essential Portfolio Conservative Fund
A-Class
0.00%
$1,000.00
$1,001.42
$
—
C-Class
0.75%
1,000.00
997.70
3.77
H-Class
0.00%
1,000.00
1,001.39
—
Essential Portfolio Moderate Fund
A-Class
0.00%
1,000.00
951.95
—
C-Class
0.75%
1,000.00
948.69
3.66
H-Class
0.00%
1,000.00
951.95
—
Essential Portfolio Aggressive Fund
A-Class
0.01%
1,000.00
911.72
0.04
C-Class
0.76%
1,000.00
908.08
3.62
H-Class
0.01%
1,000.00
910.89
0.04
Table 2. Based on hypothetical 5% return (before expenses)
Essential Portfolio Conservative Fund
A-Class
0.00%
1,000.00
1,025.00
—
C-Class
0.75%
1,000.00
1,021.50
3.79
H-Class
0.00%
1,000.00
1,025.00
—
Essential Portfolio Moderate Fund
A-Class
0.00%
1,000.00
1,025.00
—
C-Class
0.75%
1,000.00
1,021.50
3.79
H-Class
0.00%
1,000.00
1,025.00
—
Essential Portfolio Aggressive Fund
A-Class
0.01%
1,000.00
1,024.95
0.05
C-Class
0.76%
1,000.00
1,021.20
3.84
H-Class
0.01%
1,000.00
1,024.95
0.05
* Expenses are equal to the Fund’s annualized expense ratio, multiplied by the average account value over the period, multiplied by the number
of days in the most recent fiscal half-year, then divided by 366.
† Does not include expenses of the underlying funds in which the Funds invest, and is annualized.
4
|
THE RYDEX SERIES FUNDS ANNUAL REPORT
This page intentionally left blank.
THE RYDEX SERIES FUNDS ANNUAL REPORT
|
5
PERFORMANCE REPORTS AND FUND PROFILES (Unaudited)
ESSENTIAL PORTFOLIO CONSERVATIVE FUND
OBJECTIVE: To primarily seek preservation of capital and, secondarily, to seek long-term growth of capital.
Inception: June 30, 2006
Rydex Essential Portfolio Conservative Fund enjoyed relatively strong performance over the past 12-month period
due in part to its sizeable allocations to alternative asset classes and alternative strategies. Exposure to commodities
provided meaningful returns as investors increasingly sought to diversify their investments away from volatile equity
markets. Rising energy prices also helped to boost commodities holdings; Rydex Commodities Strategy Fund was up
38.44% for the period. Rydex Managed Futures Strategy Fund also added a great deal of value over the period.
However, the Conservative Fund’s allocation to fixed income was the largest contributor to returns and helped offset
the majority of the portfolio’s losses. Both domestic and international equity holdings detracted from performance,
as did exposure to real estate. The Essential Portfolio Conservative Fund H-Class finished up 3.69% for the year
ended March 31, 2008, ahead of its benchmark, which was up only 2.96%. Additionally, the Fund’s H-Class was
ranked in the 6th percentile in its open-end fund Conservative Allocation category by Morningstar for the one-year
period ended March 31, 2008.
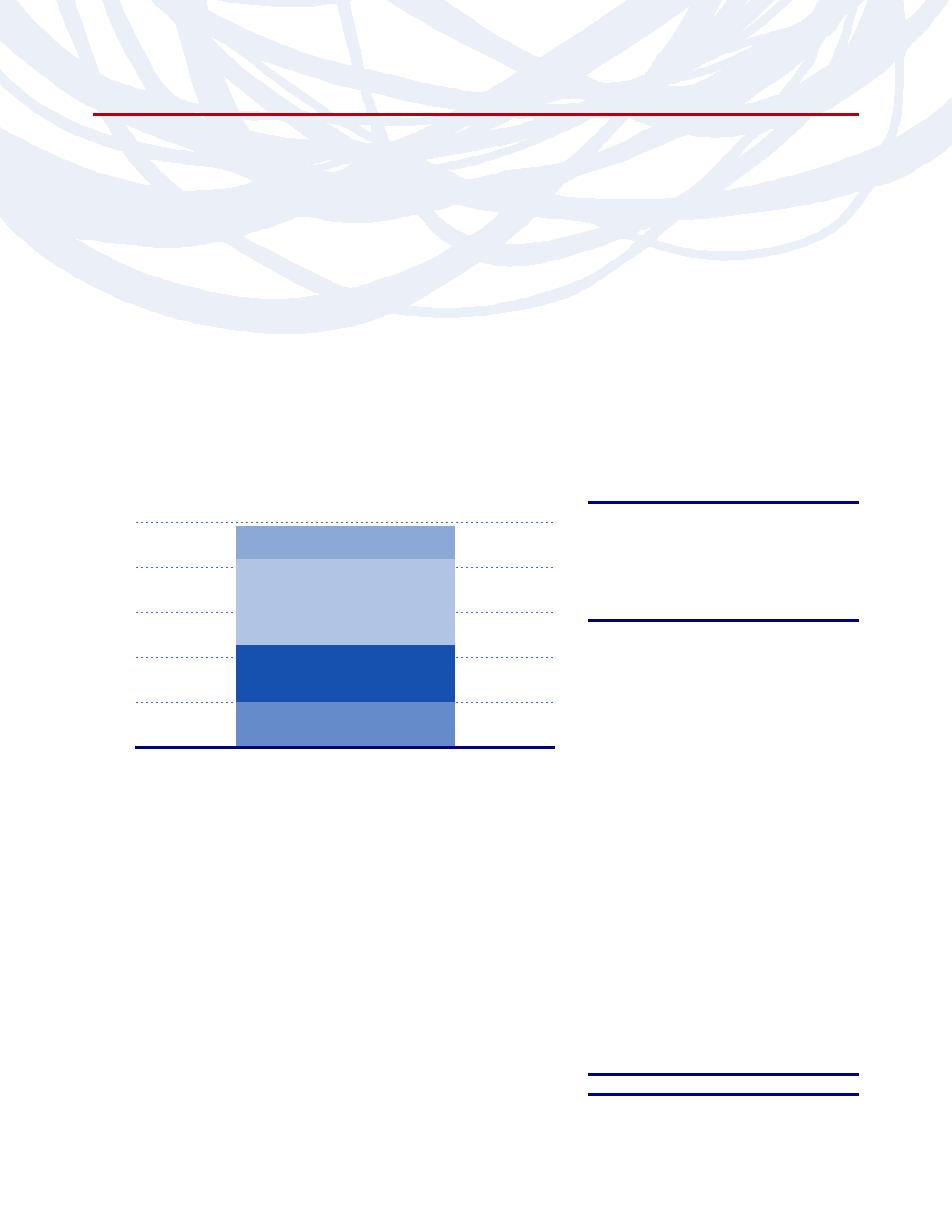
Industry Diversification (Market Exposure as % of Net Assets)
Inception Dates:
100%
A-Class
June 30, 2006
C-Class
June 30, 2006
Money Market Fund
H-Class
June 30, 2006
80%
Ten Largest Holdings
Alternative Investment Funds
60%
(% of Total Net Assets)
Rydex Series Funds —
40%
Government Long Bond
Fixed-Income Fund
1.2x Strategy Fund
25.1%
Rydex Series Funds —
20%
Managed Futures
Domestic Equity Funds
Strategy Fund
17.3%
0%
Rydex Series Funds —
Essential Portfolio Conservative Fund
U.S. Government Money
Market Fund
14.8%
“Industry Diversification (Market Exposure as % of Net Assets)”
Rydex Series Funds —
excludes any temporary cash investments.
International Rotation Fund
7.7%
Rydex Series Funds —
Absolute Return
Strategies Fund
6.6%
Rydex Series Funds —
Large-Cap Value Fund
3.9%
Rydex Series Funds —
Sector Rotation Fund
3.8%
Rydex Series Funds —
Commodities Strategy Fund
2.8%
Rydex Series Funds —
Mid-Cap Growth Fund
2.6%
Rydex Series Funds —
Multi-Cap Core Equity Fund
2.3%
Top Ten Total
86.9%
“Ten Largest Holdings” exclude any
temporary cash or derivative investments.
6
|
THE RYDEX SERIES FUNDS ANNUAL REPORT
PERFORMANCE REPORTS AND FUND PROFILES (Unaudited) (continued)
ESSENTIAL PORTFOLIO CONSERVATIVE FUND
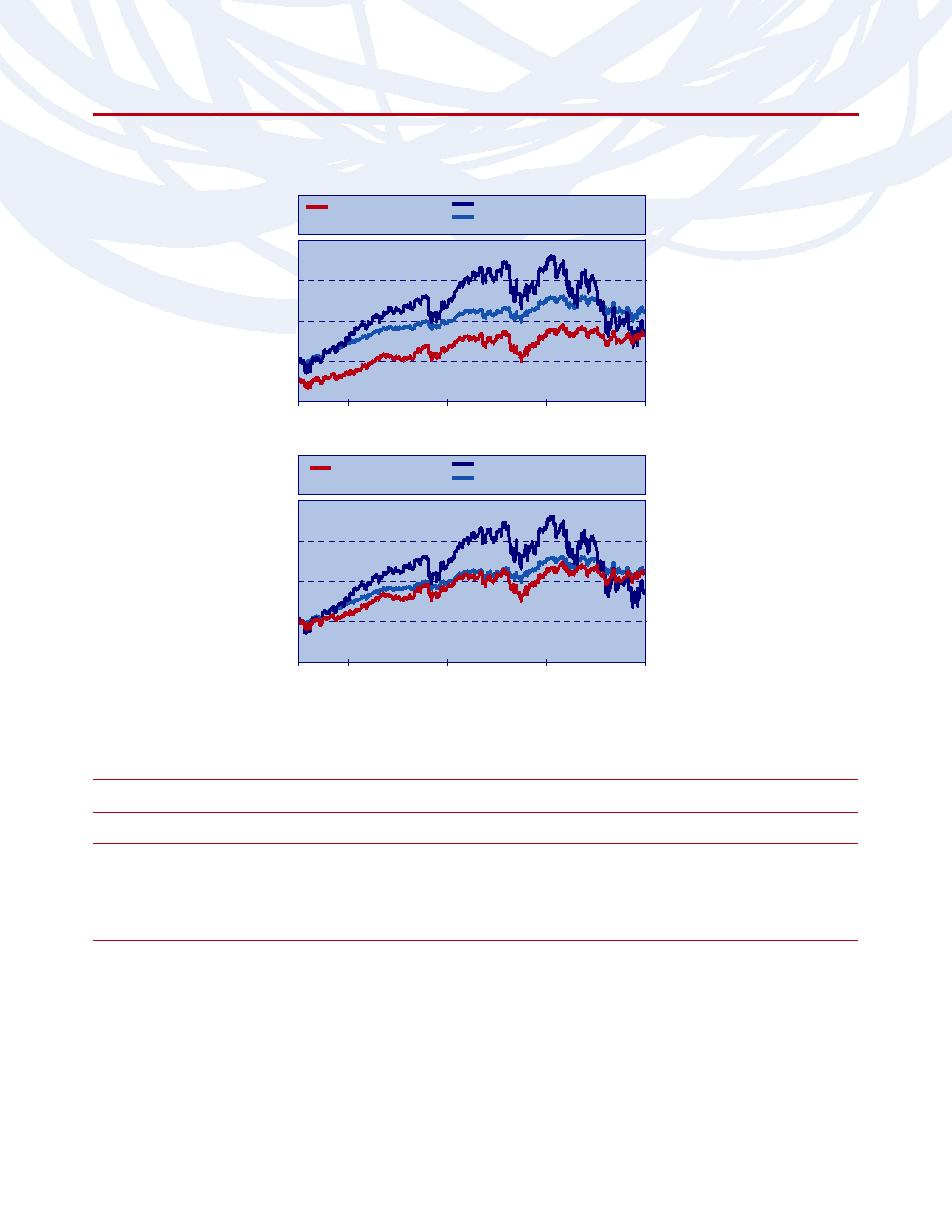
Cumulative Fund Performance
ESSENTIAL PORTFOLIO
S&P 500 INDEX
CONSERVATIVE FUND
SYNTHETIC ESSENTIAL PORTFOLIO
A-CLASS†
CONSERVATIVE BENCHMARK
$13,000
$12,000
$11,265
$11,000
$10,770
$10,661
$10,000
$9,000
06/30/06
09/30/06
03/31/07
09/30/07
03/31/08
ESSENTIAL PORTFOLIO
S&P 500 INDEX
CONSERVATIVE FUND
SYNTHETIC ESSENTIAL PORTFOLIO
H-CLASS
CONSERVATIVE BENCHMARK
$13,000
$12,000
$11,265
$11,000
$11,203
$10,770
$10,000
$9,000
06/30/06
09/30/06
03/31/07
09/30/07
03/31/08
† Initial investment has been adjusted for the maximum sales charge of 4.75%.
AVERAGE ANNUAL TOTAL RETURNS FOR THE PERIOD ENDED 03/31/08
A-Class
C-Class
H-Class
(06/30/06)
(06/30/06)
(06/30/06)
ONE
ONE
SINCE
SINCE
ONE
ONE
SINCE
ONE
SINCE
YEAR
YEAR*
INCEPTION
INCEPTION*
YEAR
YEAR**
INCEPTION
YEAR
INCEPTION
ESSENTIAL PORTFOLIO
CONSERVATIVE FUND
3.70%
-1.20%
6.65%
3.72%
2.86%
1.87%
5.88%
3.69%
6.70%
S&P 500 INDEX
-5.08%
-5.08%
4.33%
4.33%
-5.08%
-5.08%
4.33%
-5.08%
4.33%
SYNTHETIC ESSENTIAL
PORTFOLIO CONSERVATIVE
BENCHMARK***
2.96%
2.96%
7.04%
7.04%
2.96%
2.96%
7.04%
2.96%
7.04%
* Fund returns are calculated using the maximum sales charge of 4.75%.
** Fund returns include a contingent deferred sales charge ("CDSC") of 1% if redeemed within 12 months of purchase.
*** Benchmark reflects a 40/60 ratio of the performance of the S&P 500 Index and the Lehman Aggregate Bond Index.
The returns presented above do not reflect the effects of taxes. Past performance is no guarantee of future results. The S&P 500 Index is an
unmanaged stock index and, unlike the Fund, has no management fees or other operating expenses to reduce its reported return. Returns are
historical and include changes in principal and reinvested dividends and capital gains. The graphs are based on A-Class shares and H-Class shares
only; performance for C-Class shares will vary due to differences in fee structure.
THE RYDEX SERIES FUNDS ANNUAL REPORT
|
7
PERFORMANCE REPORTS AND FUND PROFILES (Unaudited) (continued)
ESSENTIAL PORTFOLIO MODERATE FUND
OBJECTIVE: To primarily seek growth of capital and, secondarily, to seek preservation of capital.
Inception: June 30, 2006
Continued deterioration in consumer sentiment and volatile equity markets made for a challenging 12-month
period for the Rydex Essential Portfolio Moderate Fund. Owing to its alternative asset class and alternative
strategies exposure, however, the Fund posted only moderate losses. Domestic and international equity holdings
were negatively impacted by prevailing market conditions and detracted from overall performance. The Rydex
value style box funds were among the weakest performing holdings over the period, followed by Rydex Real Estate
Fund. Alternatives, on the other hand, provided the Fund with strong returns. Rydex Commodities Strategy Fund in
particular, posted stellar performance for the period and Rydex Managed Futures Fund added considerable value
as well. Fixed-income exposure through Rydex Government Long Bond 1.2x Strategy Fund was an additional
source of positive returns. Rydex Essential Portfolio Moderate Fund H-Class ended the year ended March 31, 2008
down only 0.75%, while its benchmark was relatively flat for the same period at 0.43%. Morningstar ranked the
Fund’s H-Class in the 33rd percentile in its open-end fund Moderate Allocation category for the one-year period
ended March 31, 2008.
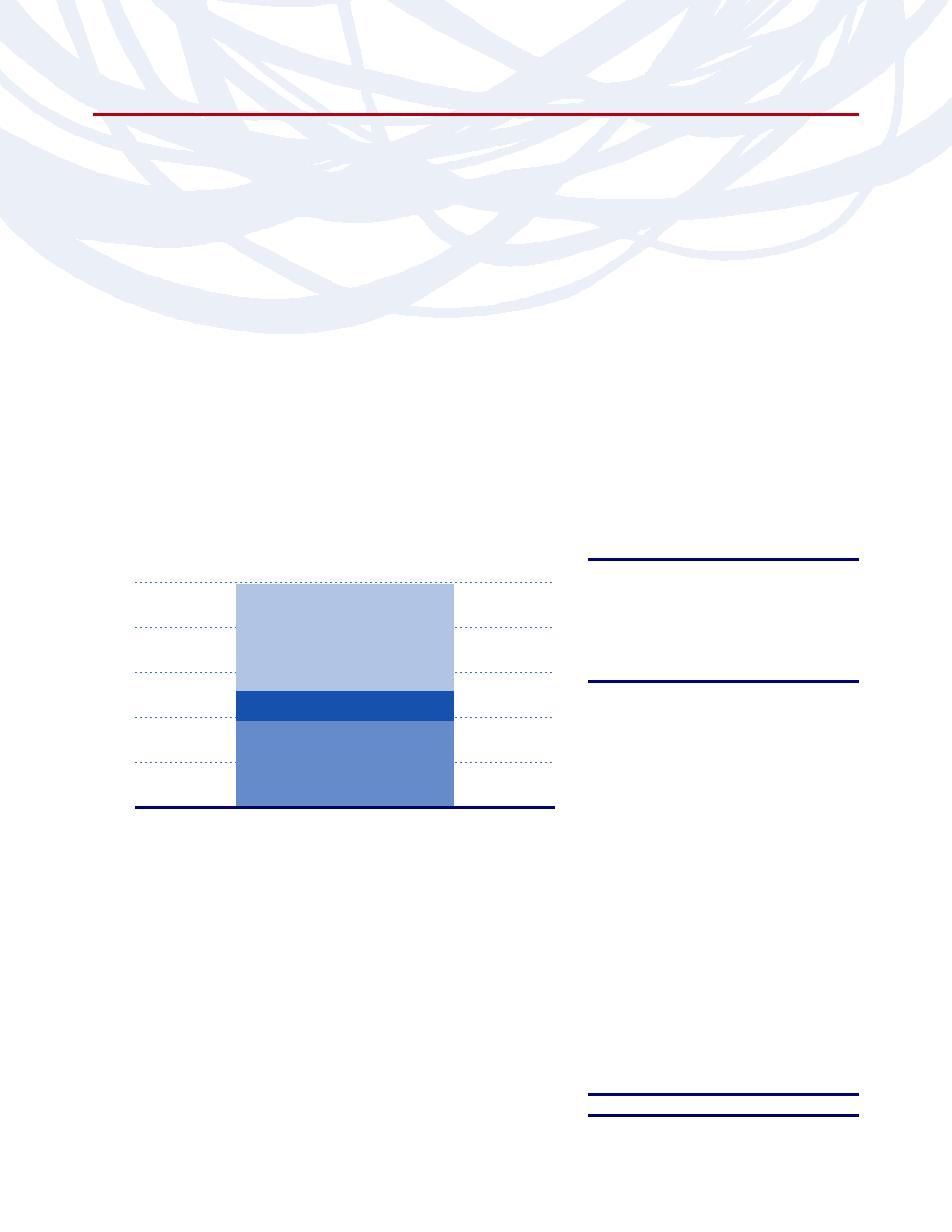
Industry Diversification (Market Exposure as % of Net Assets)
Inception Dates:
100%
A-Class
June 30, 2006
C-Class
June 30, 2006
H-Class
June 30, 2006
80%
Alternative Investment Funds
Ten Largest Holdings
60%
(% of Total Net Assets)
Rydex Series Funds —
40%
Fixed-Income Fund
Managed Futures
Strategy Fund
16.7%
20%
Rydex Series Funds —
Domestic Equity Funds
Government Long Bond
1.2x Strategy Fund
13.6%
0%
Rydex Series Funds —
Essential Portfolio Moderate Fund
International Rotation Fund
13.2%
“Industry Diversification (Market Exposure as % of Net Assets)”
Rydex Series Funds — OTC Fund
7.4%
excludes any temporary cash investments.
Rydex Series Funds —
Commodities Strategy Fund
7.3%
Rydex Series Funds — Absolute
Return Strategies Fund
6.1%
Rydex Series Funds — Sector
Rotation Fund
5.4%
Rydex Series Funds — Large-Cap
Value Fund
5.3%
Rydex Series Funds — Mid-Cap
Growth Fund
3.4%
Rydex Series Funds — Mid-Cap
Value Fund
3.0%
Grand Total
81.4%
“Ten Largest Holdings” exclude any
temporary cash or derivative investments.
8
|
THE RYDEX SERIES FUNDS ANNUAL REPORT
PERFORMANCE REPORTS AND FUND PROFILES (Unaudited) (continued)
ESSENTIAL PORTFOLIO MODERATE FUND
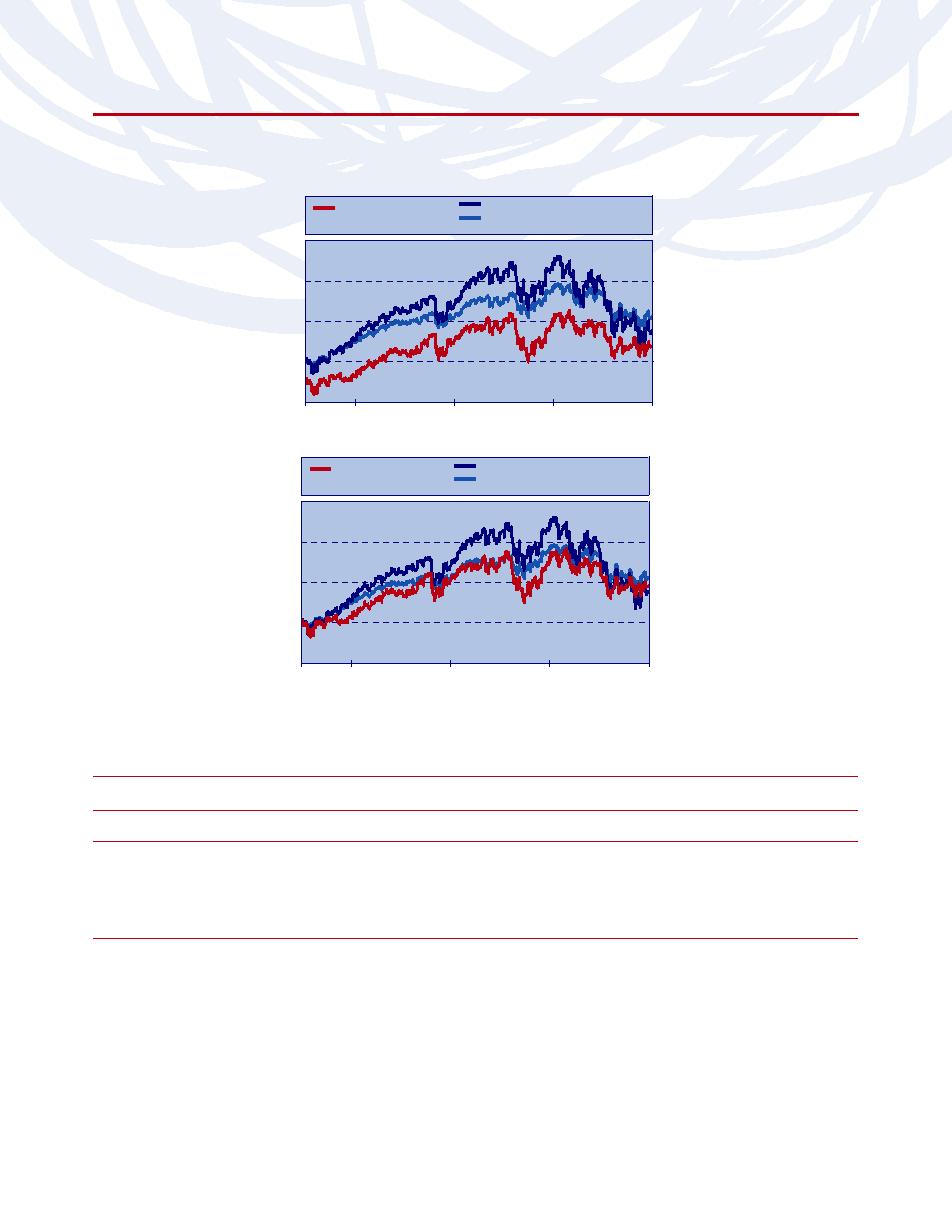
Cumulative Fund Performance
ESSENTIAL PORTFOLIO
S&P 500 INDEX
MODERATE FUND
SYNTHETIC ESSENTIAL PORTFOLIO
A-CLASS†
MODERATE BENCHMARK
$13,000
$12,000
$11,000
$11,121
$10,770
$10,388
$10,000
$9,000
06/30/06
09/30/06
03/31/07
09/30/07
03/31/08
ESSENTIAL PORTFOLIO
S&P 500 INDEX
MODERATE FUND
SYNTHETIC ESSENTIAL PORTFOLIO
H-CLASS
MODERATE BENCHMARK
$13,000
$12,000
$11,121
$11,000
$10,907
$10,770
$10,000
$9,000
06/30/06
09/30/06
03/31/07
09/30/07
03/31/08
† Initial investment has been adjusted for the maximum sales charge of 4.75%.
AVERAGE ANNUAL TOTAL RETURNS FOR THE PERIOD ENDED 03/31/08
A-Class
C-Class
H-Class
(06/30/06)
(06/30/06)
(06/30/06)
ONE
ONE
SINCE
SINCE
ONE
ONE
SINCE
ONE
SINCE
YEAR
YEAR*
INCEPTION
INCEPTION*
YEAR
YEAR**
INCEPTION
YEAR
INCEPTION
ESSENTIAL PORTFOLIO
MODERATE FUND
-0.75%
-5.49%
5.09%
2.20%
-1.43%
-2.38%
4.34%
-0.75%
5.09%
S&P 500 INDEX
-5.08%
-5.08%
4.33%
4.33%
-5.08%
-5.08%
4.33%
-5.08%
4.33%
SYNTHETIC ESSENTIAL
PORTFOLIO MODERATE
BENCHMARK***
0.43%
0.43%
6.26%
6.26%
0.43%
0.43%
6.26%
0.43%
6.26%
* Fund returns are calculated using the maximum sales charge of 4.75%.
** Fund returns include a CDSC of 1% if redeemed within 12 months of purchase.
*** Benchmark reflects a 60/40 ratio of the performance of the S&P 500 Index and the Lehman Aggregate Bond Index.
The returns presented above do not reflect the effects of taxes. Past performance is no guarantee of future results. The S&P 500 Index is an
unmanaged stock index and, unlike the Fund, has no management fees or other operating expenses to reduce its reported return. Returns are
historical and include changes in principal and reinvested dividends and capital gains. The graphs are based on A-Class shares and H-Class shares
only; performance for C-Class shares will vary due to differences in fee structure.
THE RYDEX SERIES FUNDS ANNUAL REPORT
|
9
PERFORMANCE REPORTS AND FUND PROFILES (Unaudited) (continued)
ESSENTIAL PORTFOLIO AGGRESSIVE FUND
OBJECTIVE: To primarily seek growth of capital.
Inception: June 30, 2006
Developments in the financial markets—namely further reductions in housing prices, persistent volatility in equity
markets and growing concerns over the health of the U.S. economy—presented Rydex Essential Portfolio Aggressive
Fund with numerous obstacles over the past 12 months. Considerable exposure to domestic equity markets was the
portfolio’s largest source of negative returns. Two beta OTC 2x Strategy and S&P 500 2x Strategy holdings were
among the largest detractors followed by Rydex Russell 2000® 1.5x Strategy Fund and Rydex Small-Cap Value Fund.
Deteriorating real estate markets also had a considerable negative impact on the portfolio. Exposure to alternatives
and fixed income provided some relief but were insufficient to offset the portfolio’s overall losses. Rydex Essential
Portfolio Moderate Fund H-Class ended the year ended March 31, 2008 down 3.87%, underperforming its
benchmark, which was down 2.27%. The Fund’s H-Class was also ranked in the 33rd percentile in its open-end fund
Aggressive Allocation category by Morningstar for the one-year period ended March 31, 2008.
Industry Diversification (Market Exposure as % of Net Assets)
Inception Dates:
100%
A-Class
June 30, 2006
C-Class
June 30, 2006
H-Class
June 30, 2006
80%
Alternative Investment Funds
Ten Largest Holdings
60%
(% of Total Net Assets)
Fixed-Income Fund
Rydex Series Funds —
40%
International Rotation Fund
13.1%
Rydex Series Funds —
Domestic Equity Funds
20%
Commodities Strategy Fund
12.3%
Rydex Series Funds —
Sector Rotation Fund
12.2%
0%
Essential Portfolio Aggressive Fund
Rydex Series Funds —
Managed Futures
“Industry Diversification (Market Exposure as % of Net Assets)”
Strategy Fund
10.9%
excludes any temporary cash investments.
Rydex Series Funds —
Government Long Bond
1.2x Strategy Fund
7.8%
Rydex Dynamic Funds —
OTC 2x Strategy Fund
7.2%
Rydex Series Funds —
Mid-Cap Growth Fund
4.5%
Rydex Series Funds —
Small-Cap Value Fund
4.2%
Rydex Dynamic Funds —
S&P 500 2x Strategy Fund
4.1%
Rydex Series Funds —
Real Estate Fund
3.4%
Top Ten Total
79.7%
“Ten Largest Holdings” exclude any
temporary cash or derivative investments.
10
|
THE RYDEX SERIES FUNDS ANNUAL REPORT
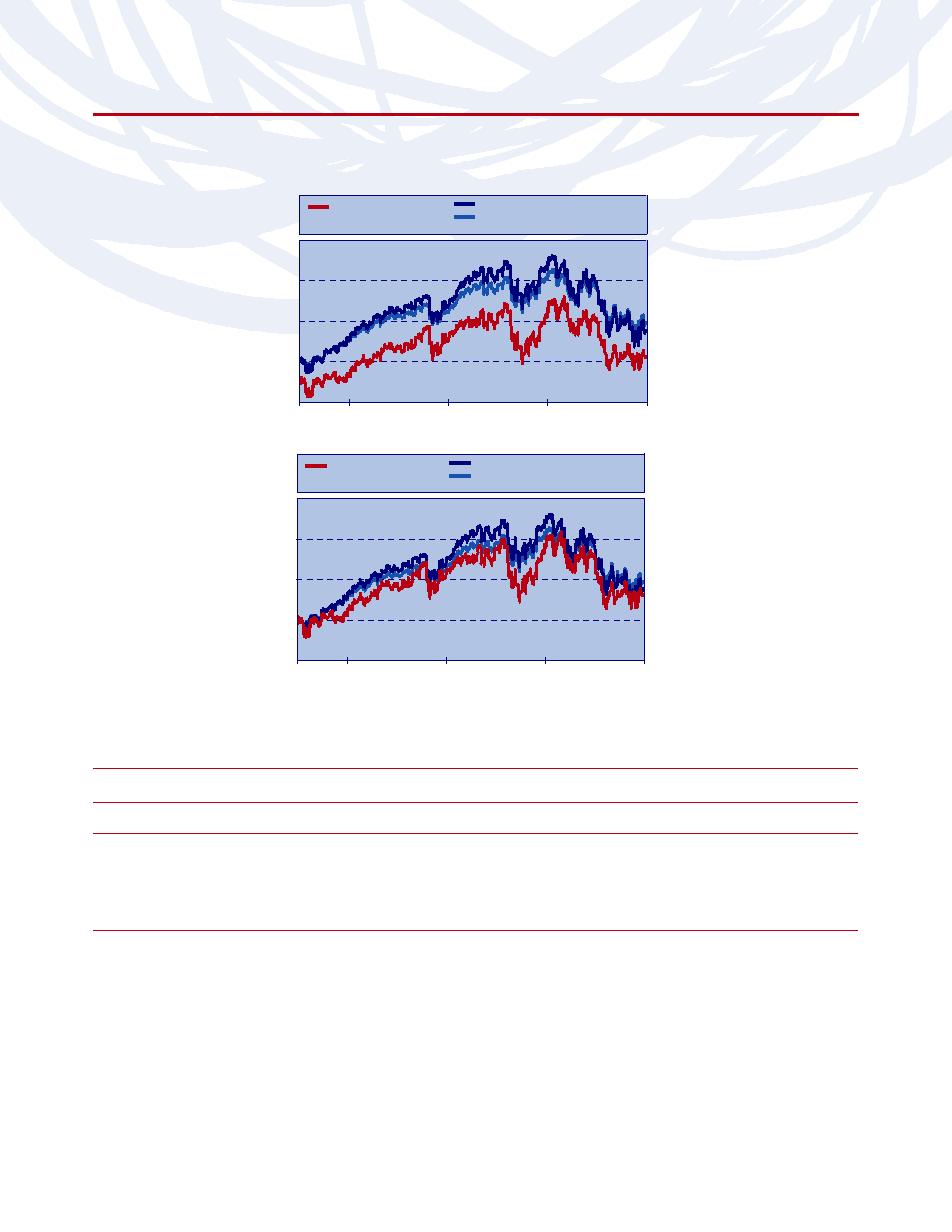
PERFORMANCE REPORTS AND FUND PROFILES (Unaudited) (concluded)
ESSENTIAL PORTFOLIO AGGRESSIVE FUND
Cumulative Fund Performance
ESSENTIAL PORTFOLIO
S&P 500 INDEX
AGGRESSIVE FUND
SYNTHETIC ESSENTIAL PORTFOLIO
A-CLASS†
AGGRESSIVE BENCHMARK
$13,000
$12,000
$11,000
$10,956
$10,770
$10,115
$10,000
$9,000
06/30/06
09/30/06
03/31/07
09/30/07
03/31/08
ESSENTIAL PORTFOLIO
S&P 500 INDEX
AGGRESSIVE FUND
SYNTHETIC ESSENTIAL PORTFOLIO
H-CLASS
AGGRESSIVE BENCHMARK
$13,000
$12,000
$11,000
$10,956
$10,770
$10,621
$10,000
$9,000
06/30/06
09/30/06
03/31/07
09/30/07
03/31/08
† Initial investment has been adjusted for the maximum sales charge of 4.75%.
AVERAGE ANNUAL TOTAL RETURNS FOR THE PERIOD ENDED 03/31/08
A-Class
C-Class
H-Class
(06/30/06)
(06/30/06)
(06/30/06)
ONE
ONE
SINCE
SINCE
ONE
ONE
SINCE
ONE
SINCE
YEAR
YEAR*
INCEPTION
INCEPTION*
YEAR
YEAR**
INCEPTION
YEAR
INCEPTION
ESSENTIAL PORTFOLIO
AGGRESSIVE FUND
-3.77%
-8.32%
3.50%
0.65%
-4.48%
-5.42%
2.73%
-3.87%
3.50%
S&P 500 INDEX
-5.08%
-5.08%
4.33%
4.33%
-5.08%
-5.08%
4.33%
-5.08%
4.33%
SYNTHETIC ESSENTIAL
PORTFOLIO AGGRESSIVE
BENCHMARK***
-2.27%
-2.27%
5.35%
5.35%
-2.27%
-2.27%
5.35%
-2.27%
5.35%
* Fund returns are calculated using the maximum sales charge of 4.75%.
** Fund returns include a CDSC of 1% if redeemed within 12 months of purchase.
*** Benchmark reflects an 80/20 ratio of the performance of the S&P 500 Index and the Lehman Aggregate Bond Index.
The returns presented above do not reflect the effects of taxes. Past performance is no guarantee of future results. The S&P 500 Index is an
unmanaged stock index and, unlike the Fund, has no management fees or other operating expenses to reduce its reported return. Returns are
historical and include changes in principal and reinvested dividends and capital gains. The graphs are based on A-Class shares and H-Class shares
only; performance for C-Class shares will vary due to differences in fee structure.
THE RYDEX SERIES FUNDS ANNUAL REPORT
THE RYDEX SERIES FUNDS ANNUAL REPORT
|
|
11
11
SCHEDULE OF INVESTMENTS
March 31, 2008
ESSENTIAL PORTFOLIO CONSERVATIVE FUND
MARKET
MARKET
VALUE
FACE
VALUE
SHARES
(NOTE 1)
AMOUNT
(NOTE 1)
MUTUAL FUNDS† 98.5%
REPURCHASE AGREEMENT 1.5%
Rydex Series Funds —
Repurchase Agreement (Note 5)
Government Long Bond 1.2x
Lehman Brothers Holdings, Inc.
Strategy Fund
351,588
$
4,145,218
issued 03/31/08 at 1.15%
Rydex Series Funds —
due 04/01/08
$250,232
$
250,232
Managed Futures Strategy
Total Repurchase Agreement
Fund
101,189
2,859,606
(Cost $250,232)
250,232
Rydex Series Funds —
Total Investments 100.0%
U.S. Government Money
(Cost $16,396,348)
$16,525,367
Market Fund
2,450,957
2,450,957
Rydex Series Funds —
Liabilities in Excess of
International Rotation Fund
55,587
1,274,599
Other Assets – (0.0)%
$
(6,242)
Rydex Series Funds — Absolute
Net Assets – 100.0%
$16,519,125
Return Strategies Fund
44,396
1,092,578
Rydex Series Funds — Large-Cap
Value Fund
32,530
650,606
Rydex Series Funds — Sector
Rotation Fund
46,104
620,101
Rydex Series Funds —
Commodities Strategy Fund
14,356
469,297
Rydex Series Funds — Mid-Cap
Growth Fund
15,979
425,837
Rydex Series Funds — Multi-Cap
Core Equity Fund
31,817
375,127
Rydex Series Funds — Hedged
Equity Fund
14,170
324,483
Rydex Series Funds — Large-Cap
Growth Fund
12,762
320,448
Rydex Series Funds — Small-Cap
Value Fund
11,999
318,701
Rydex Series Funds — Small-Cap
Growth Fund
11,612
318,620
Rydex Series Funds — Mid-Cap
Value Fund
10,589
314,697
Rydex Series Funds — Real Estate
Fund
9,693
314,260
Total Mutual Funds
(Cost $16,146,116)
16,275,135
† A-Class shares of Affiliated Funds
12
|
THE RYDEX SERIES FUNDS ANNUAL REPORT
See Notes to Financial Statements.
SCHEDULE OF INVESTMENTS
March 31, 2008
ESSENTIAL PORTFOLIO MODERATE FUND
MARKET
MARKET
VALUE
FACE
VALUE
SHARES
(NOTE 1)
AMOUNT
(NOTE 1)
MUTUAL FUNDS† 99.1%
REPURCHASE AGREEMENT 1.0%
Rydex Series Funds —
Repurchase Agreement (Note 5)
Managed Futures Strategy Fund
307,278
$
8,683,679
Lehman Brothers Holdings, Inc.
Rydex Series Funds —
issued 03/31/08 at 1.15%
Government Long Bond 1.2x
due 04/01/08
$514,240
$
514,240
Strategy Fund
599,076
7,063,108
Total Repurchase Agreement
Rydex Series Funds —
(Cost $514,240)
514,240
International Rotation Fund
298,992
6,855,878
Total Investments 100.1%
Rydex Series Funds — OTC Fund*
337,932
3,835,527
(Cost $53,493,293)
$51,882,526
Rydex Series Funds —
Commodities Strategy Fund
115,925
3,789,590
Liabilities in Excess of
Rydex Series Funds — Absolute
Other Assets – (0.1)%
$
(27,378)
Return Strategies Fund
127,686
3,142,360
Net Assets – 100.0%
$51,855,148
Rydex Series Funds — Sector
Rotation Fund
207,026
2,784,506
Rydex Series Funds — Large-Cap
Value Fund
137,677
2,753,544
Rydex Series Funds — Mid-Cap
Growth Fund
66,441
1,770,652
Rydex Series Funds — Mid-Cap
Value Fund
52,980
1,574,579
Rydex Series Funds — Small-Cap
Value Fund
55,564
1,475,772
Rydex Series Funds — Large-Cap
Growth Fund
49,396
1,240,335
Rydex Series Funds — Multi-Cap
Core Equity Fund
104,160
1,228,043
Rydex Series Funds — Real Estate
Fund
32,789
1,063,025
Rydex Series Funds — Small-Cap
Growth Fund
37,715
1,034,892
Rydex Series Funds — Russell 2000®
1.5x Strategy Fund
36,013
1,030,680
Rydex Series Funds — Hedged
Equity Fund
44,703
1,023,690
Rydex Series Funds — Nova Fund
40,753
1,018,426
Total Mutual Funds
(Cost $52,979,053)
51,368,286
* Non-Income Producing Security.
† A-Class shares of Affiliated Funds
See Notes to Financial Statements.
THE RYDEX SERIES FUNDS ANNUAL REPORT
|
13
SCHEDULE OF INVESTMENTS
March 31, 2008
ESSENTIAL PORTFOLIO AGGRESSIVE FUND
MARKET
MARKET
VALUE
FACE
VALUE
SHARES
(NOTE 1)
AMOUNT
(NOTE 1)
MUTUAL FUNDS† 98.4%
REPURCHASE AGREEMENT 1.3%
Rydex Series Funds —
Repurchase Agreement (Note 5)
International Rotation Fund
109,719
$
2,515,867
Lehman Brothers Holdings, Inc.
Rydex Series Funds —
issued 03/31/08 at 1.15%
Commodities Strategy Fund
72,609
2,373,589
due 04/01/08
$249,610
$
249,610
Rydex Series Funds — Sector
Total Repurchase Agreement
Rotation Fund
174,738
2,350,229
(Cost $249,610)
249,610
Rydex Series Funds — Managed
Total Investments 99.7%
Futures Strategy Fund
74,182
2,096,374
(Cost $19,972,240)
$19,169,792
Rydex Series Funds —
Government Long Bond 1.2x
Other Assets in Excess
Strategy Fund
127,609
1,504,509
of Liabilities – 0.3%
$
50,634
Rydex Dynamic Funds — OTC 2x
Net Assets – 100.0%
$19,220,426
Strategy Fund*
65,921
1,387,644
Rydex Series Funds — Mid-Cap
Growth Fund
32,318
861,275
Rydex Series Funds — Small-Cap
Value Fund
30,081
798,949
Rydex Dynamic Funds —
S&P 500 2x Strategy Fund
21,018
797,635
Rydex Series Funds — Real Estate
Fund
20,230
655,861
Rydex Series Funds — Absolute
Return Strategies Fund
22,595
556,053
Rydex Series Funds — Small-Cap
Growth Fund
19,162
525,797
Rydex Series Funds — Mid-Cap
Value Fund
15,884
472,065
Rydex Series Funds — Large-Cap
Value Fund
23,460
469,204
Rydex Series Funds — Multi-Cap
Core Equity Fund
33,621
396,394
Rydex Series Funds — Large-Cap
Growth Fund
15,717
394,654
Rydex Series Funds — Hedged
Equity Fund
17,090
391,364
Rydex Series Funds — Russell 2000®
1.5x Strategy Fund
13,023
372,719
Total Mutual Funds
(Cost $19,722,630)
18,920,182
* Non-Income Producing Security.
† A-Class shares of Affiliated Funds
14
|
THE RYDEX SERIES FUNDS ANNUAL REPORT
See Notes to Financial Statements.
STATEMENTS OF ASSETS AND LIABILITIES
March 31, 2008
Essential
Essential
Essential
Portfolio
Portfolio
Portfolio
Conservative
Moderate
Aggressive
Fund
Fund
Fund
ASSETS
Investment Securities in Affiliated Funds*
$16,275,135
$51,368,286
$18,920,182
Repurchase Agreements*
250,232
514,240
249,610
Receivable for Fund Shares Sold
5,684
22,339
55,288
Investment Income Receivable
12,280
16,692
3,723
Total Assets
16,543,331
51,921,557
19,228,803
LIABILITIES
Payable for Securities Purchased
12,623
17,259
3,715
Payable for Fund Shares Redeemed
10,220
41,035
3,006
Distribution and Service Fees Payable
1,314
8,001
1,649
Custody Fees Payable
49
—
7
Overdraft Due to Custodian Bank
—
114
—
Total Liabilities
24,206
66,409
8,377
NET ASSETS
$16,519,125
$51,855,148
$19,220,426
NET ASSETS CONSIST OF
Paid-In Capital
16,584,986
53,921,657
20,824,519
Undistributed Net Investment Income
44,030
91,347
412,908
Accumulated Net Realized Loss on Investments
(238,910)
(547,089)
(1,214,553)
Net Unrealized Appreciation (Depreciation) on Investments
129,019
(1,610,767)
(802,448)
NET ASSETS
$16,519,125
$51,855,148
$19,220,426
A-Class
$
4,430,594
$10,213,949
$
8,595,985
C-Class
5,074,191
30,281,947
6,177,674
H-Class
7,014,340
11,359,252
4,446,767
SHARES OUTSTANDING
A-Class
412,515
1,003,594
886,967
C-Class
478,650
3,014,500
646,227
H-Class
652,201
1,116,053
458,778
NET ASSET VALUES
A-Class
$10.74
$10.18
$
9.69
A-Class Maximum Offering Price**
11.28
10.69
10.17
C-Class
10.60
10.05
9.56
H-Class
10.75
10.18
9.69
* The cost of investments is $16,396,348, $53,493,293, and $19,972,240, respectively.
** Net asset value adjusted for the maximum sales charge of 4.75% of offering price.
See Notes to Financial Statements.
THE RYDEX SERIES FUNDS ANNUAL REPORT
|
15
STATEMENTS OF OPERATIONS
Year Ended March 31, 2008
Essential
Essential
Essential
Portfolio
Portfolio
Portfolio
Conservative
Moderate
Aggressive
Fund
Fund
Fund
INVESTMENT INCOME
Interest
$
2,109
$
8,453
$
2,237
Dividends from Affiliated Funds
248,414
731,583
279,851
Total Income
250,523
740,036
282,088
EXPENSES
Distribution & Service Fees:
C-Class
30,010
199,055
55,650
Custody Fees
640
3,247
2,754
Total Expenses
30,650
202,302
58,404
Net Investment Income
219,873
537,734
223,684
REALIZED AND UNREALIZED GAIN (LOSS) ON INVESTMENTS
Net Realized Gain (Loss) on:
Affiliated Investment Securities
(171,106)
(161,244)
(384,258)
Realized Gain Distributions Received from Affiliated Funds
214,188
963,448
476,778
Total Net Realized Gain
43,082
802,204
92,520
Net Change in Unrealized Appreciation (Depreciation) on:
Investment Securities
(22,730)
(2,171,265)
(952,545)
Net Change in Unrealized Appreciation (Depreciation)
(22,730)
(2,171,265)
(952,545)
Net Gain (Loss) on Investments
20,352
(1,369,061)
(860,025)
Net Increase (Decrease) in Net Assets from Operations
$ 240,225
$
(831,327)
$(636,341)
16
|
THE RYDEX SERIES FUNDS ANNUAL REPORT
See Notes to Financial Statements.
This page intentionally left blank.
THE RYDEX SERIES FUNDS ANNUAL REPORT
|
17
STATEMENTS OF CHANGES IN NET ASSETS
Essential Portfolio
Essential Portfolio
Conservative Fund
Moderate Fund
Year
Period
Year
Period
Ended
Ended
Ended
Ended
March 31,
March 31,
March 31,
March 31,
2008
2007*
2008
2007*
FROM OPERATIONS
Net Investment Income
$
219,873
$
39,396
$
537,734
$
232,930
Net Realized Gain on Investments
43,082
4,459
802,204
589,445
Net Change in Unrealized Appreciation (Depreciation)
on Investments
(22,730)
151,749
(2,171,265)
560,498
Net Increase (Decrease) in Net Assets from Operations
240,225
195,604
(831,327)
1,382,873
Distributions to Shareholders from:**
Net Investment Income
A-Class
(47,300)
(4,908)
(125,284)
(43,427)
C-Class
(85,100)
(13,417)
(310,460)
(115,401)
H-Class
(104,141)
(20,629)
(101,990)
(75,440)
Realized Gain on Investments
A-Class
(28,001)
—
(204,413)
(139,703)
C-Class
(50,378)
—
(506,546)
(371,242)
H-Class
(61,650)
—
(166,406)
(242,691)
Total Distributions to Shareholders
(376,570)
(38,954)
(1,415,099)
(987,904)
SHARE TRANSACTIONS
Proceeds from Shares Purchased
A-Class
3,994,722
922,583
6,330,674
9,638,247
C-Class
5,682,278
3,683,969
20,118,009
19,780,346
H-Class
8,551,489
5,576,370
13,258,002
13,553,148
Redemption Fees Collected
A-Class
3,856
1,182
1,253
3,538
C-Class
7,073
3,237
2,938
6,693
H-Class
8,303
4,476
1,229
5,726
Value of Shares Purchased through Dividend Reinvestment
A-Class
57,742
4,090
299,996
155,723
C-Class
119,384
12,328
744,996
464,693
H-Class
156,752
20,356
248,187
289,437
Cost of Shares Redeemed
A-Class
(389,163)
(170,672)
(5,688,827)
(182,346)
C-Class
(3,474,923)
(942,760)
(7,644,269)
(1,849,883)
H-Class
(5,282,222)
(2,051,630)
(10,463,848)
(5,367,057)
Net Increase (Decrease) in Net Assets From Share
Transactions
9,435,291
7,063,529
17,208,340
36,498,265
Net Increase (Decrease) in Net Assets
9,298,946
7,220,179
14,961,914
36,893,234
NET ASSETS—BEGINNING OF PERIOD
7,220,179
—
36,893,234
—
NET ASSETS—END OF PERIOD
$16,519,125
$ 7,220,179
$ 51,855,148
$36,893,234
Undistributed Net Investment Income —
End of Period
$
44,030
$
17,032
$
91,347
$
—
* Since the commencement of operations: June 30, 2006.
** For financial reporting purposes, certain distributions from net investment income for federal income tax purposes have been reclassified to
distributions from realized gains.
18
|
THE RYDEX SERIES FUNDS ANNUAL REPORT
See Notes to Financial Statements.
Essential Portfolio
Aggressive Fund
Year
Period
Ended
Ended
March 31,
March 31,
2008
2007*
$
223,684
$
215,923
92,520
837,488
(952,545)
150,097
(636,341)
1,203,508
(54,939)
(107,051)
(39,975)
(45,811)
(24,441)
(63,061)
(158,306)
(698,818)
(115,188)
(299,049)
(70,426)
(411,659)
(463,275)
(1,625,449)
4,810,125
14,864,958
4,081,423
7,563,157
5,559,805
9,529,259
4,539
5,833
2,410
4,046
2,140
4,647
104,716
187,981
147,234
323,184
93,263
467,626
(9,752,150)
(977,024)
(4,072,572)
(1,287,560)
(7,538,079)
(3,386,978)
(6,557,146)
27,299,129
(7,656,762)
26,877,188
26,877,188
—
$19,220,426
$26,877,188
$
412,908
$
724
See Notes to Financial Statements.
THE RYDEX SERIES FUNDS ANNUAL REPORT
|
19
FINANCIAL HIGHLIGHTS
This table is presented to show selected data for a share outstanding throughout each period, and to assist shareholders in evaluating a Fund’s performance for the periods presented.
RATIOS TO
AVERAGE NET ASSETS:
Net Realized
Net Increase
Net
NET ASSET
Net
and
(Decrease)
Distributions
Distributions
Increase
NET ASSET
Net
Net Assets,
VALUE,
Investment
Unrealized
in Net Asset
from Net
from Net
Redemption
(Decrease)
VALUE,
Total
Investment
Portfolio
End of
BEGINNING
Income
Gains (Losses)
Value Resulting
Investment
Realized
Total
Fees
in Net Asset
END OF
Investment
Total
Income
Turnover
Period (000)’s
Year Ended
OF PERIOD
(Loss)†
on Investments
from Operations
Income***
Gains***
Distributions
Collected
Value
PERIOD
Return†††
Expenses††
(Loss)
Rate
omitted)
Essential Portfolio Conservative Fund A-Class
March 31, 2008
$10.70
$ .26
$
.12
$
.38
$ (.22)
$ (.14)
$ (.36)
$ .02
$
.04
$10.74
3.70%
0.01%
2.39%
119%
$
4,431
March 31, 2007*
10.00
.20
.56
.76
(.09)
—
(.09)
.03
.70
10.70
7.94%
0.01%**
2.47%**
105%
782
Essential Portfolio Conservative Fund C-Class
March 31, 2008
10.65
.17
.12
.29
(.22)
(.14)
(.36)
.02
(.05)
10.60
2.86%
0.75%
1.53%
119%
5,074
March 31, 2007*
10.00
.08
.63
.71
(.09)
—
(.09)
.03
.65
10.65
7.44%
0.76%**
1.05%**
105%
2,804
Essential Portfolio Conservative Fund H-Class
March 31, 2008
10.71
.25
.13
.38
(.22)
(.14)
(.36)
.02
.04
10.75
3.69%
0.01%
2.28%
119%
7,014
March 31, 2007*
10.00
.15
.62
.77
(.09)
—
(.09)
.03
.71
10.71
8.04%
0.01%**
1.93%**
105%
3,634
Essential Portfolio Moderate Fund A-Class
March 31, 2008
10.56
.17
(.24)
(.07)
(.12)
(.19)
(.31)
—§
(.38)
10.18
(0.75)%
0.01%
1.58%
125%
10,214
March 31, 2007*
10.00
.18
.79
.97
(.10)
(.32)
(.42)
.01
.56
10.56
9.90%
—**
2.26%**
66%
9,719
Essential Portfolio Moderate Fund C-Class
March 31, 2008
10.50
.10
(.24)
(.14)
(.12)
(.19)
(.31)
—§
(.45)
10.05
(1.43)%
0.76%
0.90%
125%
30,282
March 31, 2007*
10.00
.11
.80
.91
(.10)
(.32)
(.42)
.01
.50
10.50
9.29%
0.75%**
1.34%**
66%
18,551
Essential Portfolio Moderate Fund H-Class
March 31, 2008
10.56
.13
(.20)
(.07)
(.12)
(.19)
(.31)
—§
(.38)
10.18
(0.75)%
0.01%
1.22%
125%
11,359
March 31, 2007*
10.00
.18
.79
.97
(.10)
(.32)
(.42)
.01
.56
10.56
9.90%
—**
2.32%**
66%
8,623
Essential Portfolio Aggressive Fund A-Class
March 31, 2008
10.28
.11
(.48)
(.37)
(.06)
(.16)
(.22)
—§
(.59)
9.69
(3.77)%
0.01%
1.01%
120%
8,596
March 31, 2007*
10.00
.24
.77
1.01
(.10)
(.64)
(.74)
.01
.28
10.28
10.37%
—**
3.11%**
92%
13,854
Essential Portfolio Aggressive Fund C-Class
March 31, 2008
10.22
.06
(.50)
(.44)
(.06)
(.16)
(.22)
—§
(.66)
9.56
(4.48)%
0.76%
0.60%
120%
6,178
March 31, 2007*
10.00
(.03)
.98
.95
(.10)
(.64)
(.74)
.01
.22
10.22
9.76%
0.75%**
(0.34)%**
92%
6,537
Essential Portfolio Aggressive Fund H-Class
March 31, 2008
10.29
.08
(.46)
(.38)
(.06)
(.16)
(.22)
—§
(.60)
9.69
(3.87)%
0.01%
0.80%
120%
4,447
March 31, 2007*
10.00
.15
.87
1.02
(.10)
(.64)
(.74)
.01
.29
10.29
10.48%
—**
1.94%**
92%
6,486
* Since the commencement of operations: June 30, 2006.
** Annualized
*** For financial reporting purposes, certain distributions from net investment income for federal income tax purposes have been reclassified to distributions from realized gains.
† Calculated using the average daily shares outstanding for the period.
†† Does not include expenses of the underlying funds in which the Funds invest.
††† Total investment return does not reflect the impact of any applicable sales charges and has not been annualized.
§ Less than $.01 per share.
NOTES TO FINANCIAL STATEMENTS
1.
Organization and Significant Accounting Policies
A. The underlying funds are valued at their Net Asset
Organization
Value (“NAV”) as of the close of business, usually 4:00
The Rydex Series Funds (the “Trust”) is registered with
p.m. on the valuation date. Exchange Traded Funds
the SEC under the Investment Company Act of 1940
(“ETFs”) and closed-end investment companies are
(the “1940 Act”) as a non-diversified, open-ended
valued at the last quoted sales price.
investment company. The Trust offers five separate
B. Securities transactions are recorded on the trade
classes of shares, Investor Class Shares, Advisor Class
date for financial reporting purposes. Realized gains
Shares, A-Class Shares, C-Class Shares, and H-Class
and losses from securities transactions are recorded
Shares. C-Class Shares have a 1% CDSC if shares are
using the identified cost basis. Dividend income is
redeemed within 12 months of purchase. Sales of
recorded on the ex-dividend date, net of applicable
shares of each Class are made without a sales charge at
taxes withheld by foreign countries. Interest income,
the net asset value per share, with the exception of
including amortization of premiums and accretion of
A-Class Shares. A-Class Shares are sold at net asset
discount, is accrued on a daily basis.
value, plus the applicable front-end sales charge, except
C. Interest and dividend income, most expenses, all
for U.S. Government Money Market Fund. The sales
realized gains and losses, and all unrealized gains and
charge varies depending on the amount purchased,
losses are allocated to the Classes based upon the
but will not exceed 4.75%. A-Class Share purchases of
value of the outstanding shares in each Class. Certain
$1 million or more are exempt from the front-end sales
costs, such as distribution and service fees related to
charge but have a 1% CDSC if shares are redeemed
C-Class Shares, are charged directly to such class. In
within 18 months of purchase.
addition, certain expenses have been allocated to the
At March 31, 2008, the Trust consisted of fifty-four sep-
individual Funds in the Trust on a pro rata basis upon
arate Funds: twenty-two Benchmark Funds, one Money
the respective aggregate net assets of each Fund
Market Fund, seventeen Sector Funds, eleven
included in the Trust.
Alternative Strategy Funds, and three Essential
D. Distributions of net investment income and net real-
Portfolio Funds. This report covers the Essential
ized capital gains, if any, are declared and paid at least
Portfolio Funds (the “Funds”), while the Benchmark
annually. Distributions are recorded on the ex-dividend
Funds, the Money Market Fund, the Sector Funds, and
date and are determined in accordance with income
the Alternative Strategy Funds are contained in sepa-
tax regulations, which may differ from U.S. generally
rate reports.
accepted accounting principles.
Each Essential Portfolio Fund is a “fund of funds,”
E. The Funds may also purchase American Depository
which means that each Fund seeks to achieve its invest-
Receipts, U.S. Government securities, and enter into
ment objective by investing primarily in other Rydex
repurchase agreements.
mutual funds (the “underlying funds”) instead of indi-
vidual securities. At March 31, 2008, only A-Class, C-
F. The preparation of financial statements in conformity
Class and H-Class Shares had been issued by the
with U.S. generally accepted accounting principles
Funds. All share classes of the funds are subject to a
requires management to make estimates and assump-
1% redemption fee when shares are redeemed within
tions that affect the reported amount of assets and lia-
30 days.
bilities and disclosure of contingent assets and liabilities
at the date of the financial statements and the reported
Rydex Investments provides advisory, transfer agent
amounts of revenues and expenses during the report-
and administrative services, and accounting services to
ing period. Actual results could differ from these esti-
the Trust. Rydex Distributors, Inc. (the “Distributor”)
mates.
acts as principal underwriter for the Trust. Both Rydex
Investments and the Distributor are affiliated entities.
G. Throughout the normal course of business, the
underlying funds enter into contracts that contain a
Significant Accounting Policies
variety of representations and warranties which provide
The following significant accounting policies are in con-
general indemnifications. The underlying funds’ maxi-
formity with U.S. generally accepted accounting princi-
mum exposure under these arrangements is unknown,
ples and are consistently followed by the Trust. All time
as this would involve future claims that may be made
references are based on Eastern Time.
against the underlying funds and/or their affiliates that
have not yet occurred. However, based on experience,
the underlying funds expect the risk of loss to be remote.
THE RYDEX SERIES FUNDS ANNUAL REPORT
|
21
NOTES TO FINANCIAL STATEMENTS (continued)
2.
Financial Instruments
the obligation. Although the underlying funds will not
As part of their investment strategies, the underlying
invest in any structured notes unless Rydex Investments
funds may utilize a variety of derivative instruments,
believes that the issuer is creditworthy, an underlying
including options, futures, options on futures, structured
fund does bear the risk of loss of the amount expected
notes, swap agreements and short sales. These invest-
to be received in the event of the default or bankruptcy
ments involve, to varying degrees, elements of market
of the issuer.
risk and risks in excess of the amounts reflected in the
There are several risks associated with the use of swap
underlying funds’ NAVs.
agreements that are different from those associated
Short sales are transactions in which an underlying fund
with ordinary portfolio securities transactions. Swap
sells an equity or fixed income security it does not own.
agreements may be considered to be illiquid. Although
If the security sold short goes down in price between
the Trust will not enter into any swap agreement unless
the time the underlying fund sells the security and
Rydex Investments believes that the other party to the
closes its short position, that underlying fund will real-
transaction is creditworthy, the underlying funds bear
ize a gain on the transaction. Conversely, if the security
the risk of loss of the amount expected to be received
goes up in price during the period, that underlying
under a swap agreement in the event of the default or
fund will realize a loss on the transaction. The risk of
bankruptcy of the agreement counterparty.
such price increases is the principal risk of engaging in
There are several risks associated with credit default
short sales.
swaps. Credit default swaps involve the exchange of a
The risk associated with purchasing options is limited to
fixed-rate premium for protection against the loss in
the premium originally paid. The risk in writing a cov-
value of an underlying debt instrument in the event of
ered call option is that an underlying fund may forego
a defined credit event (such as payment default or
the opportunity for profit if the market price of the
bankruptcy). Under the terms of the swap, one party
underlying security increases and the option is exer-
acts as a “guarantor,” receiving a periodic payment
cised. The risk in writing a covered put option is that an
that is a fixed percentage applied to a notional princi-
underlying fund may incur a loss if the market price of
pal amount. In return, the party agrees to purchase the
the underlying security decreases and the option is
notional amount of the underlying instrument, at par, if
exercised. In addition, there is the risk that an underly-
a credit event occurs during the term of the swap. An
ing fund may not be able to enter into a closing trans-
underlying fund may enter into credit default swaps in
action because of an illiquid secondary market or, for
which that underlying fund or its counterparty act as
over-the-counter options, because of the counterparty’s
guarantors. By acting as the guarantor of a swap, that
inability to perform.
underlying fund assumes the market and credit risk of
the underlying instrument, including liquidity and loss
There are several risks in connection with the use of
of value.
futures contracts. Risks may be caused by an imperfect
correlation between movements in the price of the
In conjunction with the use of short sales, options,
instruments and the price of the underlying securities.
futures, options on futures, and swap agreements, the
In addition, there is the risk that an underlying fund
underlying funds are required to maintain collateral in
may not be able to enter into a closing transaction
various forms. The underlying funds use, where appro-
because of an illiquid secondary market.
priate, depending on the financial instrument utilized
and the broker involved, margin deposits at the broker,
There are several risks associated with the use of struc-
cash and/or securities segregated at the custodian
tured notes. Structured notes are leveraged, thereby
bank, discount notes, or the repurchase agreements
providing an exposure to the underlying benchmark of
allocated to each underlying fund.
three times the face amount and increasing the volatil-
ity of each note relative to the change in the underlying
The risks inherent in the use of short sales, options,
linked financial instrument. A highly liquid secondary
futures contracts, options on futures contracts, and
market may not exist for the structured notes an under-
swap agreements include i) adverse changes in the
lying fund invests in which may make it difficult for that
value of such instruments; ii) imperfect correlation
underlying fund to sell the structured notes it holds at
between the price of the instruments and movements
an acceptable price or to accurately value them. In
in the price of the underlying securities, indices, or
addition, structured notes are subject to the risk that
futures contracts; iii) the possible absence of a liquid
the counterparty to the instrument, or issuer, might not
secondary market for any particular instrument at any
pay interest when due or repay principal at maturity of
time; and iv) the potential of counterparty default.
22
|
THE RYDEX SERIES FUNDS ANNUAL REPORT
NOTES TO FINANCIAL STATEMENTS (continued)
The Trust has established strict counterparty credit
The Funds have adopted a Distribution and
guidelines and the underlying funds enter into transac-
Shareholder Services Plan applicable to its C-Class
tions only with financial institutions of investment grade
Shares that allows the Funds to pay annual distribution
or better.
and service fees of 0.75% of the Funds’ C-Class Shares
3.
Fees And Other Transactions With Affiliates
average daily net assets. The annual 0.25% service fee
compensates the shareholder’s financial advisor for pro-
Rydex Investments manages the investment and the
viding on-going services to the shareholder. The annual
reinvestment of the assets of each of the Funds in
0.50% distribution fee reimburses the Distributor for
accordance with the investment objectives, policies,
paying the shareholder’s financial advisor an ongoing
and limitations of each Fund, however, the Funds do
sales commission. The Distributor advances the first
not pay Rydex Investments a management fee. As part
year’s service and distribution fees to the financial advi-
of its agreement with the Trust, Rydex Investments will
sor. The Distributor retains the service and distribution
pay all expenses of the Funds, including the cost of
fees on accounts with no authorized dealer of record.
transfer agency, fund administration, audit and other
services, excluding interest expense, taxes (expected to
During the year ended March 31, 2008, the Distributor
be de minimis), brokerage commissions and other
retained sales charges of $839,951, relating to sales
expenses connected with the execution of portfolio
of A-Class Shares of the Trust.
transactions, short dividend expenses, and extraordi-
Certain officers and trustees of the Trust are also officers
nary expenses.
of Rydex Investments and the Distributor.
Each Fund indirectly bears a proportionate share of the
4.
Federal Income Tax Information
total operating expenses (including investment man-
The Funds intend to comply with the provisions of
agement, shareholder servicing, custody, transfer
Subchapter M of the Internal Revenue Code applicable
agency, audit and other expenses) of the underlying
to regulated investment companies and will distribute
funds in which the Fund invests. In addition, some
substantially all net investment income and capital
underlying funds charge redemption fees if a share-
gains to shareholders. Therefore, no Federal income
holder, including a Fund, redeems shares before the
tax provision has been recorded.
end of the funds’ requisite holding period. Therefore, if
a Fund sells shares of an underlying fund that is subject
Effective September 30, 2007, the Funds adopted
to a redemption fee, that Fund will be responsible for
Financial Accounting Standards Board (FASB)
paying the redemption fee to the underlying fund.
Interpretation No. 48 “Accounting for Uncertainty in
Income Taxes” (FIN 48). FIN 48 provides guidance for
Rydex Investments provides transfer agent, accounting
how uncertain tax positions should be recognized, meas-
services and administrative services to the Funds.
ured, presented and disclosed in the financial state-
However, the related fees are paid by Rydex
ments. FIN 48 requires the evaluation of tax positions
Investments, as noted above.
taken or expected to be taken in the course of preparing
The Funds have not adopted a Distribution Plan or a
the Fund’s tax returns to determine whether the tax
Shareholder Services Plan with respect to A-Class
positions are “more-likely-than-not” of being sustained
Shares and H-Class Shares. Instead, the Funds invest in
by the applicable tax authority. Tax positions not
underlying funds that have a distribution plan that
deemed to meet the more-likely-than-not threshold
allows the underlying funds to pay distribution fees to
would be recorded as a tax benefit or expense in the
the Distributor and other firms that provide distribution
current year. Management has analyzed the Funds’ tax
services (“Service Providers”). The underlying funds will
positions taken on federal income tax returns for all
pay distribution fees to the Distributor at an annual rate
open tax years for purposes of complying with FIN 48,
not to exceed 0.25% of average daily net assets, pur-
and has concluded that no provision for income tax was
suant to Rule 12b-1 under the 1940 Act, as amended. If
required in the Fund’s financial statements.
a Service Provider provides distribution or shareholder
The Funds file U.S. federal income tax returns and
services, the Distributor will, in turn, pay the Service
returns in various foreign jurisdictions in which they
Provider for the services it provides at an annual rate
invest. While the statute of limitations remains open to
not to exceed 0.25% of the average daily net assets of
examine the Funds’ U.S. federal income tax returns
a Fund.
filed for the fiscal years 2004 to 2007, no examinations
are in progress or anticipated at this time.
THE RYDEX SERIES FUNDS ANNUAL REPORT
|
23
NOTES TO FINANCIAL STATEMENTS (continued)
Income and capital gain distributions are determined in accordance with Federal income tax regulations, which may differ
from U.S. generally accepted accounting principles. These differences are primarily due to differing treatments for losses
deferred due to wash sales, losses deferred due to post-October losses, and excise tax regulations.
Permanent book and tax basis differences, if any, will result in reclassifications. This includes net operating losses not uti-
lized during the current period, capital loss, carryforward expired, and the utilization of earnings and profits distributed
to the shareholders on redemption of shares as part of the dividends paid deduction for income tax purposes. These
reclassifications have no effect on net assets or net asset values per share. Any undistributed ordinary income or long-
term capital gain remaining at fiscal year end is distributed in the following year.
The Funds recognize interest and penalties, if any, related to unrecognized tax benefits as income tax expense in the
statement of operations. During the period, the Funds did not incur any interest or penalties.
The Funds’ tax basis capital gains and losses are determined only at the end of each fiscal year. Tax basis capital losses
in excess of capital gains are carried forward to offset future net capital gains.
The tax character of distributions paid during the year ended March 31, 2008 was as follows:
Ordinary
Long-Term
Total
Fund
Income
Capital Gain
Distributions
Essential Portfolio Conservative Fund
$
371,958
$
4,612
$
376,570
Essential Portfolio Moderate Fund
1,291,456
123,643
1,415,099
Essential Portfolio Aggressive Fund
286,409
176,866
463,275
The tax character of distributions paid during the year ended March 31, 2007 was as follows:
Ordinary
Long-Term
Total
Fund
Income
Capital Gain
Distributions
Essential Portfolio Conservative Fund
$
38,954
$ —
$
38,954
Essential Portfolio Moderate Fund
987,904
—
987,904
Essential Portfolio Aggressive Fund
1,625,449
—
1,625,449
The tax character of distributable earnings/(accumulated losses) at March 31, 2008, was a follows:
Undistributed
Undistributed
Ordinary
Long-Term
Net Unrealized
Capital Loss
Fund
Income
Capital Gain
Depreciation
Carryforward
Essential Portfolio Conservative Fund
$165,817
$
86,802
$
(318,480)
$
—
Essential Portfolio Moderate Fund
299,846
320,007
(2,686,362)
—
Essential Portfolio Aggressive Fund
412,908
—
(1,358,495)
(343,627)1
Capital Loss Carryforward amounts may be limited due to Treasury Regulations.
1 Expires in 2016.
At March 31, 2008, the cost of securities for Federal income tax purposes, the aggregate gross unrealized gain for all
securities for which there was an excess of value over tax cost and the aggregate gross unrealized loss for all securities
for which there was an excess of tax cost over value, were as follows:
Tax
Tax
Net
Tax
Unrealized
Unrealized
Unrealized
Fund
Cost
Gain
Loss
Loss
Essential Portfolio Conservative Fund
$16,843,847
$
393,969
$
(712,449)
$
(318,480)
Essential Portfolio Moderate Fund
54,568,888
2,031,902
(4,718,264)
(2,686,362)
Essential Portfolio Aggressive Fund
20,528,287
746,140
(2,104,635)
(1,358,495)
Pursuant to Federal income tax regulations applicable to investment companies, the Funds have elected to treat net
capital losses realized between November 1 and March 31 of each year as occurring on the first day of the following tax
year. For the year ended March 31, 2008, $314,879 of realized capital losses reflected in the accompanying financial
statements will not be recognized for Federal income tax purposes until April 1, 2008 for Essential Portfolio Aggressive
Fund.
24
|
THE RYDEX SERIES FUNDS ANNUAL REPORT
NOTES TO FINANCIAL STATEMENTS (continued)
5.
Repurchase Agreements
The Trust transfers uninvested cash balances into a single joint account, the daily aggregate balance of which is invested
in one or more repurchase agreements collateralized by obligations of the U.S. Treasury and U.S. Government Agencies.
The collateral is in the possession of the Trust’s custodian and is evaluated daily to ensure that its market value exceeds
by, at a minimum, 102% of the delivery value of the repurchase agreement at maturity. Each Fund holds a pro rata share
of the collateral based on the dollar amount of the repurchase agreement entered into by each Fund.
The repurchase agreements executed by the joint account and outstanding as of March 31, 2008, were as follows:
Counterparty
Terms of Agreement
Face Value
Market Value
Repurchase Price
Lehman Brothers Holdings, Inc.
1.15% due 04/01/08
$92,565,625
$92,565,625
$92,568,582
$92,565,625
$92,568,582
As of March 31, 2008, the collateral for the repurchase agreements in the joint account was as follows:
Security Type
Maturity Date
Rate
Par Value
Market Value
U.S. Treasury Note
11/15/09
4.625%
$88,565,000
$94,389,680
$94,389,680
In the event of counterparty default, the Trust has the right to collect the collateral to offset losses incurred. There is
potential loss to the Trust in the event the Trust is delayed or prevented from exercising its rights to dispose of the
collateral securities, including the risk of a possible decline in the value of the underlying securities during the period
while the Trust seeks to assert its rights. The Trust’s investment advisor, acting under the supervision of the Board of
Trustees, reviews the value of the collateral and the creditworthiness of those banks and dealers with which the Trust
enters into repurchase agreements to evaluate potential risks.
6.
Securities Transactions
During the year ended March 31, 2008, the cost of purchases and proceeds from sales of investment securities, exclud-
ing short-term and temporary cash investments, were:
Essential Portfolio
Essential Portfolio
Essential Portfolio
Conservative Fund
Moderate Fund
Aggressive Fund
Purchases
$22,109,930
$77,333,445
$31,593,384
Sales
$12,729,007
$59,789,814
$37,815,754
THE RYDEX SERIES FUNDS ANNUAL REPORT
|
25
NOTES TO FINANCIAL STATEMENTS (continued)
7.
Share Transactions
The Trust is authorized to issue an unlimited number of shares (no par value). Transactions in shares for the periods presented were:
Purchased through
Net Shares
Shares Purchased
Dividend Reinvestment
Shares Redeemed
Purchased (Redeemed)
Year Ended
Period Ended
Year Ended
Period Ended
Year Ended
Period Ended
Year Ended
Period Ended
March 31,
March 31,
March 31,
March 31,
March 31,
March 31,
March 31,
March 31,
2008
2007*
2008
2007*
2008
2007*
2008
2007*
Essential Portfolio Conservative Fund
A-Class
369,840
88,762
5,356
391
(35,755)
(16,079)
339,441
73,074
C-Class
529,764
352,492
11,189
1,181
(325,681)
(90,295)
215,272
263,378
H-Class
786,204
532,377
14,514
1,942
(487,803)
(195,033)
312,915
339,286
Essential Portfolio Moderate Fund
A-Class
588,146
922,952
28,409
15,148
(533,666)
(17,395)
82,889
920,705
C-Class
1,900,579
1,899,090
71,291
45,380
(724,002)
(177,838)
1,247,868
1,766,632
H-Class
1,244,646
1,302,388
23,503
28,155
(968,734)
(513,905)
299,415
816,638
Essential Portfolio Aggressive Fund
A-Class
452,957
1,423,819
10,079
18,742
(923,091)
(95,539)
(460,055)
1,347,022
C-Class
390,478
734,083
14,336
32,351
(397,980)
(127,041)
6,834
639,393
H-Class
534,927
914,707
8,976
46,623
(715,671)
(330,784)
(171,768)
630,546
* Since the commencement of operations: June 30, 2006.
NOTES TO FINANCIAL STATEMENTS (concluded)
8.
New Accounting Pronouncements
On September 15, 2006, the FASB released Statement of Financial Accounting Standard No. 157 (“FAS 157”) Fair Value
Measurement which provided enhanced guidance for using fair value to measure assets and liabilities. The standard
requires companies to provide expanded information about the assets and liabilities measured at fair value and the
potential effect of these fair valuations on an entity’s financial performance. The standard does not expand the use of
fair value in any new circumstances, but provides clarification on acceptable fair valuation methods and applications.
Adoption of FAS 157 is required for fiscal years beginning after November 15, 2007. The Funds are currently assessing
the impact of the standard on the Funds’ financial statements.
In March 2008, the FASB issued FAS No. 161, “Disclosures about Derivative Instruments and Hedging Activities.” The
new requirement is intended to improve disclosures around an entity’s derivatives activity and help investors understand
how entities use derivatives, how they are accounted for and how they affect the financial position and operations of
that entity. SFAS 161 is effective for fiscal years and interim periods beginning after November 15, 2008.
9.
Acquisition of Rydex Investments and the Distributor
At the close of business on January 17, 2008, Rydex NV, Inc., comprised of Rydex Investments, together with several
other Rydex entities, was acquired by Security Benefit Corporation (“Security Benefit”), a financial services firm that pro-
vides a broad variety of financial programs to investors in the advisor, banking, education, government, institutional, and
qualified plan markets (the “Transaction”). As a result of the Transaction’s completion, Rydex Investments and the
Distributor are wholly-owned subsidiaries of Security Benefit. While the Transaction has no material impact on the Funds
or their shareholders, it resulted in a change of control of Rydex Investments, which in turn caused the termination of
the investment advisory agreement between Rydex Investments and the Funds.
A new investment advisory agreement between Rydex Investments and the Funds was approved under substantially the
same terms as the previous investment advisory agreement (the “New Agreement”). This New Agreement was
approved by shareholders, via proxy, and took effect upon the closing of the Transaction.
The Transaction had no impact on the day-to-day operations of Rydex Investments, the fees payable to Rydex
Investments under the New Agreement, or the persons responsible for the management of the Funds.
THE RYDEX SERIES FUNDS ANNUAL REPORT
|
27
REPORT OF INDEPENDENT REGISTERED PUBLIC
ACCOUNTING FIRM
To the Board of Trustees and Shareholders
of the Rydex Series Funds:
We have audited the accompanying statements of assets and liabilities of the Essential Portfolio Conservative Fund,
Essential Portfolio Moderate Fund, and Essential Portfolio Aggressive Fund (3 of the series constituting the Rydex Series
Funds) (the “Funds”), including the schedules of investments, as of March 31, 2008, and the related statements of oper-
ations for the year then ended and statements of changes in net assets and financial highlights for the year then ended
and the period June 30, 2006 (commencement of operations) through March 31, 2007. These financial statements and
financial highlights are the responsibility of the Funds’ management. Our responsibility is to express an opinion on these
financial statements and financial highlights based on our audits.
We conducted our audits in accordance with the standards of the Public Company Accounting Oversight Board (United
States). Those standards require that we plan and perform the audit to obtain reasonable assurance about whether the
financial statements and financial highlights are free of material misstatement. We were not engaged to perform an
audit of the Funds’ internal control over financial reporting. Our audits included consideration of internal control over
financial reporting as a basis for designing audit procedures that are appropriate in the circumstances, but not for the
purpose of expressing an opinion on the effectiveness of the Funds’ internal control over financial reporting.
Accordingly, we express no such opinion. An audit also includes examining, on a test basis, evidence supporting the
amounts and disclosures in the financial statements and financial highlights, assessing the accounting principles used
and significant estimates made by management, and evaluating the overall financial statement presentation. Our proce-
dures included confirmation of securities owned as of March 31, 2008, by correspondence with the underlying funds’
transfer agent. We believe that our audits provide a reasonable basis for our opinion.
In our opinion, the financial statements and financial highlights referred to above present fairly, in all material respects,
the financial position of each of the Funds at March 31, 2008, the results of their operations for the year then ended, and
the changes in their net assets and their financial highlights for the year then ended and the period June 30, 2006 (com-
mencement of operations) through March 31, 2007, in conformity with U.S. generally accepted accounting principles.
McLean, Virginia
May 29, 2008
28
|
THE RYDEX SERIES FUNDS ANNUAL REPORT
OTHER INFORMATION (Unaudited)
Tax Information
This information is being provided for the year ended March 31, 2008 as required by the Internal Revenue Code.
Amounts shown may differ from those elsewhere in the report because of differences in tax and financial reporting
practice.
Of the ordinary income distributions paid during the year, the following funds had the corresponding percentages qual-
ify for the dividends received deduction for corporations:
Fund
% Qualifying
Essential Portfolio Conservative Fund
41.59%
Essential Portfolio Moderate Fund
31.21%
Essential Portfolio Aggressive Fund
22.85%
Additionally, the following amounts of ordinary dividends paid during the same period qualified for the lower income
tax rate available to individuals under the Jobs and Growth Tax Relief Reconciliation Act of 2003, respectively. This
information was included in Form 1099-DIV sent to shareholders for the calendar year ended on December 31, 2007.
Information for 2008 will be sent to shareholders in January of 2009.
Fund
% Qualifying
Essential Portfolio Conservative Fund
39.76%
Essential Portfolio Moderate Fund
52.06%
Essential Portfolio Aggressive Fund
99.40%
The Funds’ distributions to shareholders included:
Essential
Essential
Essential
Portfolio
Portfolio
Portfolio
Conservative
Moderate
Aggressive
Fund
Fund
Fund
From short-term capital gains:
$15,163
$100,711
$166,330
From long-term capital gains, subject to the
15% rate gains category:
4,612
123,643
176,866
From long-term capital gains, using proceeds from
shareholder redemptions:
73,659
165,462
—
Proxy Voting Information
A description of the policies and procedures that the Trust uses to determine how to vote proxies relating to securities
held in the Funds’ portfolios is available, without charge and upon request, by calling 1-800-820-0888. This information
is also available from the EDGAR database on the SEC’s website at http://www.sec.gov.
Information regarding how the Funds voted proxies relating to portfolio securities during the most recent 12-month
period ended June 30 is available without charge, upon request, by calling 1-800-820-0888. This information is also
available from the EDGAR database on the SEC’s website at http://www.sec.gov.
Proxy Results
At a special meeting of shareholders initially held on October 4, 2007, the shareholders of the Funds voted on whether
to approve a new investment advisory agreement between Rydex Series Funds and Padco Advisors, Inc. A description
of the number of shares voted is as follows:
Shares
Shares
Shares
Fund
For
Against
Abstained
Essential Portfolio Conservative Fund
510,138.560
7,254.282
29,231.177
Essential Portfolio Moderate Fund
2,042,427.967
61,742.047
167,979.185
Essential Portfolio Aggressive Fund
1,539,830.365
52,095.051
116,784.513
Quarterly Portfolio Schedules Information
The Trust files its complete schedule of portfolio holdings with the SEC for the first and third quarters of each fiscal year
on Form N-Q, which is available on the SEC’s website at http://www.sec.gov. The Funds’ Forms N-Q may be reviewed
and copied at the SEC’s Public Reference Room in Washington, DC, and that information on the operation of the Public
Reference Room may be obtained by calling 1-800-SEC-0330. Copies of the portfolio holdings are also available to
shareholders, without charge and upon request, by calling 1-800-820-0888.
THE RYDEX SERIES FUNDS ANNUAL REPORT
|
29
INFORMATION ON BOARD OF TRUSTEES AND OFFICERS (Unaudited)
A Board of Trustees oversees all Rydex Investments, in which its members have no stated term of service, and continue to serve
after election until resignation. The Statement of Additional Information includes further information about Fund Trustees and
Officers, and can be obtained without charge by calling 1-800-820-0888.
All Trustees and Officers may be reached c/o Rydex Investments, 9601 Blackwell Rd., Suite 500, Rockville, MD 20850.
TRUSTEES AND OFFICERS
Length of Service
Name, Position and
As Trustee
Number of
–––––––––––––––––––––––
Year of Birth
––––––––––––––––––––––––––––
(Year Began)
––––––––––——––––
Funds Overseen
Carl G. Verboncoeur*
Rydex Series Funds – 2004
149
Trustee, President (1952)
Rydex Variable Trust – 2004
Rydex Dynamic Funds – 2004
Rydex ETF Trust – 2004
Principal Occupations During Past Five Years: Chief Executive Officer and Treasurer of Rydex Specialized Products, LLC (2005
to present); Chief Executive Officer of Rydex Investments and Rydex Distributors, Inc. (2003 to present); Executive Vice President
of Rydex Investments (2000 to 2003)
Michael P. Byrum*
Rydex Series Funds – 2005
149
Trustee, Vice President
Rydex Variable Trust – 2005
(1970)
Rydex Dynamic Funds – 2005
Rydex ETF Trust – 2005
Principal Occupations During Past Five Years: Chief Investment Officer of Rydex Investments (2003 to present); Secretary of
Rydex Specialized Products, LLC (2005 to present); Vice President of Rydex Series Funds (1997 to present); Vice President of
Rydex Variable Trust (1998 to present); Vice President of Rydex Dynamic Funds (1999 to present); Vice President of Rydex ETF
Trust (2002 to present); President and Trustee of Rydex Capital Partners SPhinX Fund (2003 to 2006); President of Rydex
Investments (2004 to present); Chief Operating Officer of Rydex Investments and Rydex Distributors, Inc. (2003 to 2004)
INDEPENDENT TRUSTEES
Length of Service
Name, Position and
As Trustee
Number of
––––––––––––––––––––––
Year of Birth
––––––––––––––––––––––––––––
(Year Began)
––––––––––——––––
Funds Overseen
John O. Demaret
Rydex Series Funds – 1997
141
Trustee, Chairman of the
Rydex Variable Trust – 1998
Board (1940)
Rydex Dynamic Funds – 1999
Rydex ETF Trust – 2003
Principal Occupations During Past Five Years: Retired
Corey A. Colehour
Rydex Series Funds – 1993
141
Trustee (1945)
Rydex Variable Trust – 1998
Rydex Dynamic Funds – 1999
Rydex ETF Trust – 2003
Principal Occupations During Past Five Years: Retired (2006 to present); Owner and President of Schield Management
Company, registered investment adviser (2005 to 2006); Senior Vice President of Marketing and Co-Owner of Schield
Management Company, registered investment adviser (1985 to 2005)
J. Kenneth Dalton
Rydex Series Funds – 1995
141
Trustee (1941)
Rydex Variable Trust – 1998
Rydex Dynamic Funds – 1999
Rydex ETF Trust – 2003
Principal Occupations During Past Five Years: Mortgage Banking Consultant and Investor, The Dalton Group
30
|
THE RYDEX SERIES FUNDS ANNUAL REPORT
INFORMATION ON BOARD OF TRUSTEES AND OFFICERS (Unaudited) (concluded)
Name, Position and
Length of Service As Trustee
Number of
––––––––––––––––––––––
Year of Birth
–––––––––––––––––––––––––––––
(Year Began)
––––––––––——–––––
Funds Overseen
Werner E. Keller
Rydex Series Funds – 2005
141
Trustee (1940)
Rydex Variable Trust – 2005
Rydex Dynamic Funds – 2005
Rydex ETF Trust – 2005
Principal Occupations During Past Five Years: Retired (2001 to present); Chairman, Centurion Capital Management (1991 to 2001)
Thomas F. Lydon, Jr.
Rydex Series Funds – 2005
141
Trustee (1960)
Rydex Variable Trust – 2005
Rydex Dynamic Funds – 2005
Rydex ETF Trust – 2005
Principal Occupations During Past Five Years: President, Global Trends Investments
Patrick T. McCarville
Rydex Series Funds – 1997
141
Trustee (1942)
Rydex Variable Trust – 1998
Rydex Dynamic Funds – 1999
Rydex ETF Trust – 2003
Principal Occupations During Past Five Years: Founder and Chief Executive Officer, Par Industries, Inc.
Roger Somers
Rydex Series Funds – 1993
141
Trustee (1944)
Rydex Variable Trust – 1998
Rydex Dynamic Funds – 1999
Rydex ETF Trust – 2003
Principal Occupations During Past Five Years: Owner, Arrow Limousine
EXECUTIVE OFFICERS
Name, Position and
Principal Occupations
–––––––––––––––––––––––––––
Year of Birth
–––––––––––––––––––––
During Past Five Years
Nick Bonos*
Chief Financial Officer of Rydex Specialized Products, LLC (2005
Vice President and Treasurer (1963)
to present); Vice President and Treasurer of Rydex Series Funds,
Rydex Variable Trust, Rydex Dynamic Funds, and Rydex ETF Trust
(2003 to present); Senior Vice President of Rydex Investments
(2003 to present); Vice President and Treasurer of Rydex Capital
Partners SPhinX Fund (2003 to 2006); Vice President of Accounting
of Rydex Investments (2000 to 2003)
Joanna M. Haigney*
Chief Compliance Officer of Rydex Series Funds, Rydex Variable
Chief Compliance Officer and
Trust, and Rydex Dynamic Funds (2004 to present); Secretary of
Secretary (1966)
Rydex Series Funds, Rydex Variable Trust, and Rydex Dynamic
Funds (2000 to present); Secretary of Rydex ETF Trust (2002 to
present); Vice President of Compliance of Rydex Investments
(2000 to present); Secretary of Rydex Capital Partners SPhinX
Fund (2003 to 2006)
Joseph Arruda*
Assistant Treasurer of Rydex Series Funds, Rydex Variable Trust,
Assistant Treasurer (1966)
Rydex Dynamic Funds, Rydex ETF Trust (2006 to present); Vice
President of Rydex Investments (2004 to present); Director of
Accounting of Rydex Investments (2003 to 2004); Vice President
of Mutual Funds, State Street Bank & Trust (2000 to 2003)
Paula Billos*
Controller of Rydex Series Funds, Rydex Variable Trust, Rydex
Controller (1974)
Dynamic Funds, Rydex ETF Trust (2006 to present); Director of
Fund Administration of Rydex Investments (2001 to present)
* Officers of the Fund are deemed to be “interested persons” of the Trust, within the meaning of Section 2(a)(19) of the 1940 Act, inasmuch as
this person is affiliated with Rydex Investments.
THE RYDEX SERIES FUNDS ANNUAL REPORT
|
31
This page intentionally left blank.
This page intentionally left blank.
9601 Blackwell Road, Suite 500
Rockville, MD 20850
www.rydexinvestments.com
800-820-0888
RSEPF-ANN-0308x0309