UNITED STATES
SECURITIES AND EXCHANGE COMMISSION
Washington, D.C. 20549
FORM N-CSR
CERTIFIED SHAREHOLDER REPORT OF REGISTERED MANAGEMENT INVESTMENT COMPANIES
Investment Company Act file number 811- 07584
Rydex Series Funds
(Exact name of registrant as specified in charter)
805 King Farm Boulevard, Suite 600
Rockville, Maryland 20850
(Address of principal executive offices) (Zip code)
Donald C. Cacciapaglia, President
Rydex Series Funds
805 King Farm Boulevard, Suite 600
Rockville, Maryland 20850
(Name and address of agent for service)
Registrant's telephone number, including area code: 1-301-296-5100
Date of fiscal year end: December 31
Date of reporting period: June 30, 2012
Form N-CSR is to be used by management investment companies to file reports with the Commission not later than 10 days after the transmission to stockholders of any report that is required to be transmitted to stockholders under Rule 30e-1 under the Investment Company Act of 1940 (17 CFR 270.30e-1). The Commission may use the information provided on Form N-CSR in its regulatory, disclosure review, inspection, and policymaking roles.
A registrant is required to disclose the information specified by Form N-CSR, and the Commission will make this information public. A registrant is not required to respond to the collection of information contained in Form N-CSR unless the Form displays a currently valid Office of Management and Budget ("OMB") control number. Please direct comments concerning the accuracy of the information collection burden estimate and any suggestions for reducing the burden to Secretary, Securities and Exchange Commission, 450 Fifth Street, NW, Washington, DC 20549-0609. The OMB has reviewed this collection of information under the clearance requirements of 44 U.S.C. § 3507.
Item 1. Reports to Stockholders.

GO GREEN!
ELIMINATE MAILBOX CLUTTER
Go paperless with Guggenheim Investments eDelivery—a service giving you full online access to account information and documents. Save time, cut down on mailbox clutter and be a friend to the environment with eDelivery.
With Guggenheim Investments eDelivery you can:
| · | View online confirmations and statements at your convenience. |
| | | |
| · | Receive email notifications when your most recent confirmations, statements and other account documents are available for review. |
| | | |
| · | Access prospectuses, annual reports and semiannual reports online. |

If you have questions about Guggenheim Investments
eDelivery services, contact one of our Shareholder Service
Representatives at 800.820.0888.

This report and the financial statements contained herein are submitted for the general information of our shareholders. The report is not authorized for
distribution to prospective investors unless preceded or accompanied by an effective prospectus.
Distributed by Rydex Distributors, LLC.
TABLE OF CONTENTS
THE GUGGENHEIM FUNDS semi-annual REPORT | 1
LETTER TO OUR SHAREHOLDERS
To Our Shareholders:
Uncertainty continued to affect securities markets over the six months ended June 30, 2012. The U.S. equity market had strong performance for the period, combining a stellar first quarter with a weak second period, when concern grew about sovereign debt in several European nations, a fledgling U.S. economic recovery and the sustainability of economic growth in Asia. Fixed-income securities, including riskier bonds, also generally provided positive returns over the six-month period, although risk aversion in late spring drove investors into dollar-denominated assets, sending rates on U.S. Treasury bonds to near historic lows.
Weak economic reports in May 2012 indicated that the world’s major economies were beginning to slip in unison, and both the Organization for Economic Cooperation and Development and the International Monetary Fund forecast lower global growth for 2012. This was in spite of recent efforts from leading central bankers to recharge the global economy, including a restructuring of Greece’s debt that enabled a new international bailout earlier in 2012, and an injection of liquidity from the European Central Bank in December that lessened financial stresses across the continent and contributed to improvement in global financial markets in early 2012. However, manufacturing gauges in late spring 2012 indicated that the eurozone was entering a period of economic contraction, meaning that policy makers may need to do more to revive growth across the region and keep the problem from infecting other countries.
Although the U.S. was in better shape than many countries, slowing growth and job creation late in the period indicated the economy is having difficulty gaining traction. U.S. gross domestic product (“GDP”) was reported to have grown at an annualized 1.9% pace in the first quarter of 2012, compared with a 3.0% rate in the fourth quarter of 2011. Companies continue to be cautious in spending and hiring, even though corporate profits have continued to rise, although at a pace lower than in recent quarters. This is translating into weak income growth for consumers, leading them to keep their spending in check and eroding sentiment.
To foster growth, the U.S. Federal Reserve (the “Fed”) has said it will leave its key interest rate close to zero at least through 2014, despite arguments by some Fed officials and investors that the Fed may have to consider raising rates much earlier than that to prevent inflation. For now, the Fed’s leadership appears to be committed to keeping rates low, thus reducing borrowing costs for businesses and consumers, and seems prepared to sustain quantitative easing if the employment and growth picture worsens. The Fed did extend until January its operation twist, a bond-exchange program designed to lower long-term interest rates.
For the six-month period ended June 30, 2012, the Standard & Poor’s 500® Index* (“S&P”), which is generally regarded as an indicator of the broad U.S. stock market, returned 9.49%. Foreign markets were weaker, but positive: the Morgan Stanley Capital International (“MSCI”) Europe-Australasia-Far East Index* (“EAFE”), which is composed of approximately 1,100 companies in 20 developed countries in Europe and the Pacific Basin, returned 2.96%. The return of the MSCI Emerging Markets Index*, which measures market performance in global emerging markets, was 3.93%.
In the bond market, lower-rated bonds outperformed higher quality issues, as investors sought yield. The return of the Barclays U.S. Aggregate Bond Index*, which is a proxy for the U.S. investment grade bond market, posted a 2.37% return for the period, while the Barclays U.S. Corporate High Yield Index* returned 7.27%. Reflecting the Fed’s continuing accommodative monetary policy, interest rates on short-term securities remained at their lowest levels in many years; the return of the Barclays 1–3 Month U.S. Treasury Bill Index* was 0.04% for the six-month period.
2 | THE GUGGENHEIM FUNDS semi-annual REPORT
LETTER TO OUR SHAREHOLDERS (concluded)
We look forward to continuing our service to you. Thank you for investing in our funds.
Sincerely,

Donald C. Cacciapaglia
President
*Indices are defined as follows:
The Standard & Poor’s 500 Index is a capitalization-weighted index of 500 stocks designed to measure the performance of the broad economy, representing all major industries and is considered a representation of U.S. stock market.
The MSCI EAFE Index is a capitalization weighted measure of stock markets in Europe, Australasia and the Far East.
The MSCI Emerging Markets Index is a free float-adjusted market capitalization weighted index that is designed to measure equity market performance in the global emerging markets.
The Barclays U.S. Aggregate Bond Index is a broad-based benchmark that measures the investment grade, U.S. dollar denominated, fixed-rate taxable bond market, including Treasuries, government-related and corporate securities, MBS (agency fixed-rate and hybrid ARM pass-throughs), ABS, and CMBS.
The Barclays U.S. Corporate High Yield Index measures the market of USD-denominated, non-investment grade, fixed-rate, taxable corporate bonds.
The Barclays 1–3 Month U.S. Treasury Bill Index tracks the performance of U.S. Treasury bills with a remaining maturity of one to three months. U.S. Treasury bills, which are short-term loans to the U.S. government, are full-faith-and-credit obligations of the U.S. Treasury and are generally regarded as being free of any risk of default.
Performance displayed represents past performance which is no guarantee of future results. Of course, fund performance is subject to daily market volatility and may be better or worse since the end of the last quarter. For up-to-date fund performance, call us at 800.820.0888 or visit www.rydex-sgi.com.
Read the fund’s prospectus and summary prospectus (if available) carefully before investing. It contains the fund’s investment objectives, risks, charges, expenses and other information, which should be considered carefully before investing. Obtain a prospectus and summary prospectus (if available) at www.rydex-sgi.com or call 800.820.0888.
The referenced fund is distributed by Rydex Distributors, LLC. Guggenheim Investments represents the investment management businesses of Guggenheim Partners, LLC (“GP”), which includes Security Investors, LLC (“SI”), the investment adviser to the referenced fund. Rydex Distributors, LLC, is affiliated with GP and SI.
THE GUGGENHEIM FUNDS SEMI-ANNUAL REPORT | 3
about shareholders’ fund expenses (Unaudited)
All mutual funds have operating expenses and it is important for our shareholders to understand the impact of costs on their investments. Shareholders of a Fund incur two types of costs: (i) transaction costs, including sales charges (loads) on purchase payments, reinvested dividends, or other distributions; and exchange fees; and (ii) ongoing costs, including management fees, administrative services, and shareholder reports, among others. These ongoing costs, or operating expenses, are deducted from a fund’s gross income and reduce the investment return of the fund.
A fund’s expenses are expressed as a percentage of its average net assets, which is known as the expense ratio. The following examples are intended to help investors understand the ongoing costs (in dollars) of investing in a Fund and to compare these costs with the ongoing costs of investing in other mutual funds.
The examples are based on an investment of $1,000 made at the beginning of the period and held for the entire six-month period beginning December 31, 2011 and ending June 30, 2012.
The following tables illustrate a Fund’s costs in two ways:
Table 1. Based on actual Fund return. This section helps investors estimate the actual expenses paid over the period. The “Ending Account Value” shown is derived from the Fund’s actual return, and the fourth column shows the dollar amount that would have been paid by an investor who started with $1,000 in the Fund. Investors may use the information here, together with the amount invested, to estimate the expenses paid over the period. Simply divide the Fund’s account value by $1,000 (for example, an $8,600 account value divided by $1,000 = 8.6), then multiply the result by the number provided under the heading “Expenses Paid During Period.”
Table 2. Based on hypothetical 5% return. This section is intended to help investors compare a Fund’s cost with those of other mutual funds. The table provides information about hypothetical account values and hypothetical expenses based on the Fund’s actual expense ratio and an assumed rate of return of 5% per year before expenses, which is not the Fund’s actual return. The hypothetical account values and expenses may not be used to estimate the actual ending account balance or expenses paid during the period. The example is useful in making comparisons because the U.S. Securities and Exchange Commission (the “SEC”) requires all mutual funds to calculate expenses based on the 5% return. Investors can assess a Fund’s costs by comparing this hypothetical example with the hypothetical examples that appear in shareholder reports of other funds.
The calculations illustrated above assume no shares were bought or sold during the period. Actual costs may have been higher or lower, depending on the amount of investment and the timing of any purchases or redemptions.
Please note that the expenses shown in the table are meant to highlight your ongoing costs only and do not reflect any transactional costs, such as sales charges (loads) on purchase payments, and contingent deferred sales charges (“CDSC”) on redemptions, if any. Therefore, the second table is useful in comparing ongoing costs only, and will not help you determine the relative total costs of owning different funds. In addition, if these transactional costs were included, your costs would have been higher.
More information about a Fund’s expenses, including annual expense ratios for the past five years, can be found in the Financial Highlights section of this report. For additional information on operating expenses and other shareholder costs, please refer to the appropriate Fund prospectus.
4 | THE GUGGENHEIM FUNDS semi-annual REPORT
about shareholders’ fund expenses (Unaudited) (concluded)
| | | | | | | | | Beginning | | | Ending | | | Expenses | |
| | | Expense | | | Fund | | | Account Value | | | Account Value | | | Paid During | |
| | | Ratio1 | | | Return | | | December 31, 2011 | | | June 30, 2012 | | | Period2 | |
| Table 1. Based on actual Fund return3 | | | | | | | | | | | | | | | | | | | | |
| | | | | | | | | | | | | | | | | | | | | |
| Managed Futures Strategy Fund | | | | | | | | | | | | | | | | | | | | |
| A-Class | | | 1.91 | % | | | (10.03 | %) | | $ | 1,000.00 | | | $ | 899.70 | | | $ | 9.02 | |
| C-Class | | | 2.66 | % | | | (10.39 | %) | | | 1,000.00 | | | | 896.10 | | | | 12.54 | |
| H-Class | | | 1.90 | % | | | (10.03 | %) | | | 1,000.00 | | | | 899.70 | | | | 8.97 | |
| Institutional Class | | | 1.66 | % | | | (9.93 | %) | | | 1,000.00 | | | | 900.70 | | | | 7.84 | |
| Y-Class | | | 1.61 | % | | | (9.89 | %) | | | 1,000.00 | | | | 901.10 | | | | 7.61 | |
| | | | | | | | | | | | | | | | | | | | | |
| Table 2. Based on hypothetical 5% return (before expenses) | | | | | | | | | | | | | | | | | |
| | | | | | | | | | | | | | | | | | |
| Managed Futures Strategy Fund | | | | | | | | | | | | | | | | | | | | |
| A-Class | | | 1.91 | % | | | 5.00 | % | | $ | 1,000.00 | | | $ | 1,015.37 | | | $ | 9.57 | |
| C-Class | | | 2.66 | % | | | 5.00 | % | | | 1,000.00 | | | | 1,011.64 | | | | 13.30 | |
| H-Class | | | 1.90 | % | | | 5.00 | % | | | 1,000.00 | | | | 1,015.42 | | | | 9.52 | |
| Institutional Class | | | 1.66 | % | | | 5.00 | % | | | 1,000.00 | | | | 1,016.61 | | | | 8.32 | |
| Y-Class | | | 1.61 | % | | | 5.00 | % | | | 1,000.00 | | | | 1,016.86 | | | | 8.07 | |
| 2 | Expenses are equal to the Fund’s annualized expense ratio, net of any applicable fee waivers, multiplied by the average account value over the period, multiplied by 182/366 (to reflect the one-half year period). |
| 3 | Actual cumulative return at net asset value for the period December 31, 2011 to June 30, 2012. |
THE GUGGENHEIM FUNDS semi-annual REPORT | 5
| FUND PROFILE (Unaudited) | | June 30, 2012 |
| MANAGED FUTURES STRATEGY FUND | | |
| | | |
| OBJECTIVE: Seeks to achieve positive absolute returns. | | |
Holdings Diversification (Market Exposure as % of Net Assets)
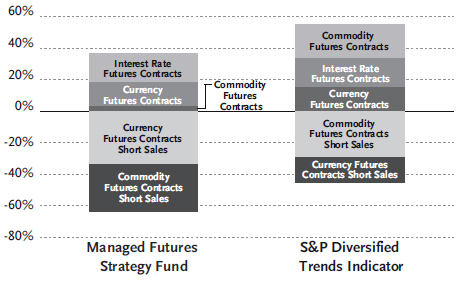
“Holdings Diversification (Market Exposure as % of Net Assets)” excludes any temporary cash investments.
| Inception Dates: | | |
| A-Class | | March 2, 2007 |
| C-Class | | March 2, 2007 |
| H-Class | | March 2, 2007 |
| Institutional Class | | May 3, 2010 |
| Y-Class | | March 29, 2010 |
The Fund invests principally in derivative investments such as futures contracts.
6 | THE GUGGENHEIM FUNDS semi-annual REPORT
| CONSOLIDATED SCHEDULE OF INVESTMENTS (Unaudited) | June 30, 2012 |
| MANAGED FUTURES STRATEGY FUND |
| | | | Face | | | | | |
| | | | Amount | | | | Value | |
| | | | | | | | | |
| FEDERAL AGENCY DISCOUNT NOTES†† - 55.4% | | | | | | | | |
| Farmer Mac1 | | | | | | | | |
| 0.20% due 10/25/12 | | $ | 50,000,000 | | | $ | 49,985,650 | |
| 0.16% due 11/01/12 | | | 50,000,000 | | | | 49,981,350 | |
| 0.21% due 03/28/13 | | | 50,000,000 | | | | 49,936,550 | |
| 0.22% due 05/31/13 | | | 50,000,000 | | | | 49,912,300 | |
| 0.21% due 04/23/13 | | | 40,000,000 | | | | 39,941,080 | |
| 0.23% due 07/17/12 | | | 30,000,000 | | | | 29,999,610 | |
| 0.16% due 11/15/12 | | | 26,000,000 | | | | 25,989,210 | |
| 0.20% due 07/31/12 | | | 25,000,000 | | | | 24,999,400 | |
| 0.12% due 08/01/12 | | | 25,000,000 | | | | 24,997,417 | |
| 0.17% due 12/21/12 | | | 25,000,000 | | | | 24,984,475 | |
| 0.17% due 12/28/12 | | | 25,000,000 | | | | 24,983,850 | |
| 0.17% due 01/02/13 | | | 25,000,000 | | | | 24,982,125 | |
| 0.18% due 01/23/13 | | | 25,000,000 | | | | 24,980,075 | |
| 0.19% due 03/06/13 | | | 25,000,000 | | | | 24,970,875 | |
| 0.17% due 07/24/12 | | | 20,000,000 | | | | 19,999,640 | |
| 0.15% due 10/31/12 | | | 20,000,000 | | | | 19,993,960 | |
| 0.11% due 07/02/12 | | | 15,000,000 | | | | 14,999,954 | |
| 0.11% due 07/03/12 | | | 15,000,000 | | | | 14,999,908 | |
| 0.14% due 08/10/12 | | | 10,000,000 | | | | 9,999,460 | |
| Total Farmer Mac | | | | | | | 550,636,889 | |
| | | | | | | | | |
| Freddie Mac2 | | | | | | | | |
| 0.04% due 07/02/12 | | | 50,000,000 | | | | 49,999,944 | |
| 0.19% due 04/23/13 | | | 50,000,000 | | | | 49,926,350 | |
| 0.17% due 04/23/13 | | | 25,307,000 | | | | 25,269,723 | |
| 0.20% due 08/06/12 | | | 25,000,000 | | | | 24,998,775 | |
| 0.18% due 03/15/13 | | | 25,000,000 | | | | 24,969,826 | |
| 0.18% due 05/21/13 | | | 25,000,000 | | | | 24,957,450 | |
| 0.14% due 11/07/12 | | | 10,000,000 | | | | 9,996,090 | |
| Total Freddie Mac | | | | | | | 210,118,158 | |
| | | | | | | | | |
| Federal Farm Credit Bank1 | | | | | | | | |
| 0.06% due 07/27/12 | | | 50,000,000 | | | | 49,997,833 | |
| 0.19% due 07/02/12 | | | 30,000,000 | | | | 30,000,000 | |
| 0.20% due 07/25/12 | | | 25,000,000 | | | | 24,999,525 | |
| 0.09% due 08/03/12 | | | 25,000,000 | | | | 24,998,900 | |
| 0.13% due 09/05/12 | | | 25,000,000 | | | | 24,996,400 | |
| 0.20% due 03/28/13 | | | 25,000,000 | | | | 24,968,275 | |
| 0.19% due 01/28/13 | | | 15,000,000 | | | | 14,987,760 | |
| Total Federal Farm Credit Bank | | | | | | | 194,948,693 | |
| | | | | | | | | |
| Fannie Mae2 | | | | | | | | |
| 0.14% due 11/15/12 | | | 25,000,000 | | | | 24,989,625 | |
| 0.14% due 11/19/12 | | | 25,000,000 | | | | 24,989,300 | |
| Total Fannie Mae | | | | | | | 49,978,925 | |
| | | | | | | | | |
| Federal Home Loan Bank1 | | | | | | | | |
| 0.18% due 02/26/13 | | | 25,000,000 | | | | 24,973,475 | |
| 0.17% due 11/01/12 | | | 10,000,000 | | | | 9,996,270 | |
| Total Federal Home Loan Bank | | | | | | | 34,969,745 | |
| Total Federal Agency | | | | | | | | |
| Discount Notes | | | | | | | | |
| (Cost $1,040,509,090) | | | | | | | 1,040,652,410 | |
| | | | | | | | | |
| FEDERAL AGENCY NOTES†† - 34.5% | | | | | | | | |
| Federal Home Loan Bank1 | | | | | | | | |
| 0.19% due 02/22/13 | | | 50,000,000 | | | | 49,977,149 | |
| 0.20% due 04/30/13 | | | 50,000,000 | | | | 49,975,200 | |
| 0.12% due 03/01/13 | | | 50,000,000 | | | | 49,955,250 | |
| 0.19% due 10/26/12 | | | 40,750,000 | | | | 40,755,135 | |
| 0.25% due 07/25/12 | | | 40,620,000 | | | | 40,622,600 | |
| 0.22% due 09/07/12 | | | 25,000,000 | | | | 25,003,150 | |
| 0.18% due 11/21/12 | | | 25,000,000 | | | | 25,002,900 | |
| 0.30% due 05/28/13 | | | 25,000,000 | | | | 24,999,250 | |
| 0.18% due 12/28/12 | | | 25,000,000 | | | | 24,996,475 | |
| 0.10% due 05/21/13 | | | 25,000,000 | | | | 24,995,300 | |
| 0.22% due 04/09/13 | | | 25,000,000 | | | | 24,992,325 | |
| 0.22% due 05/02/13 | | | 25,000,000 | | | | 24,991,675 | |
| 0.30% due 06/10/13 | | | 25,000,000 | | | | 24,991,625 | |
| 0.18% due 02/28/13 | | | 25,000,000 | | | | 24,986,900 | |
| 0.16% due 02/08/13 | | | 25,000,000 | | | | 24,985,025 | |
| 0.28% due 01/11/13 | | | 23,500,000 | | | | 23,493,608 | |
| 0.17% due 01/17/13 | | | 18,625,000 | | | | 18,617,755 | |
| 0.18% due 01/10/13 | | | 15,700,000 | | | | 15,695,871 | |
| 0.24% due 09/26/12 | | | 12,600,000 | | | | 12,602,646 | |
| 0.37% due 01/29/13 | | | 10,000,000 | | | | 10,006,600 | |
| 0.20% due 12/28/12 | | | 10,000,000 | | | | 9,999,570 | |
| Total Federal Home Loan Bank | | | | | | | 571,646,009 | |
| | | | | | | | | |
| Freddie Mac2 | | | | | | | | |
| 0.51% due 11/26/12 | | | 36,922,000 | | | | 36,975,869 | |
| Federal Farm Credit Bank1 | | | | | | | | |
| 0.18% due 01/02/13 | | | 25,000,000 | | | | 24,995,175 | |
| Fannie Mae2 | | | | | | | | |
| 0.75% due 02/26/13 | | | 15,000,000 | | | | 15,047,700 | |
| Total Federal Agency Notes | | | | | | | | |
| (Cost $648,765,945) | | | | | | | 648,664,753 | |
| | | | | | | | | |
| WORLD BANK DISCOUNT NOTE†† - 0.8% | | | | | | | | |
| World Bank | | | | | | | | |
| 0.17% due 09/17/12 | | | 15,000,000 | | | | 14,997,435 | |
| Total World Bank Discount Note | | | | | | | | |
| (Cost $14,994,638) | | | | | | | 14,997,435 | |
| | | | | | | | | |
| REPURCHASE AGREEMENTS††,3 - 7.2% | | | | | | | | |
| HSBC Group | | | | | | | | |
| issued 06/29/12 at 0.12% | | | | | | | | |
| due 07/02/12 | | | 69,094,678 | | | | 69,094,678 | |
| Mizuho Financial Group, Inc. | | | | | | | | |
| issued 06/29/12 at 0.12% | | | | | | | | |
| due 07/02/12 | | | 29,466,430 | | | | 29,466,430 | |
| Deutsche Bank | | | | | | | | |
| issued 06/29/12 at 0.10% | | | | | | | | |
| due 07/02/12 | | | 19,511,127 | | | | 19,511,127 | |
| Credit Suisse Group | | | | | | | | |
| issued 06/29/12 at 0.08% | | | | | | | | |
| due 07/02/12 | | | 17,355,249 | | | | 17,355,249 | |
| Total Repurchase Agreements | | | | | | | | |
| (Cost $135,427,484) | | | | | | | 135,427,484 | |
| Total Investments - 97.9% | | | | | | | | |
| (Cost $1,839,697,157) | | | | | | $ | 1,839,742,082 | |
| Other Assets & Liabilities, net - 2.1% | | | | | | | 39,030,078 | |
| Total Net Assets - 100.0% | | | | | | $ | 1,878,772,160 | |
| See Notes to Financial Statements. | THE GUGGENHEIM FUNDS semi-annual REPORT | 7 |
| CONSOLIDATED SCHEDULE OF INVESTMENTS (Unaudited) (continued) | | June 30, 2012 |
| MANAGED FUTURES STRATEGY fund | | |
| | | | | | Unrealized | |
| | | Contracts | | | Gain (Loss) | |
| | | | | | | |
| INTEREST RATE FUTURES CONTRACTS PURCHASED† | | | | | | | | |
| September 2012 U.S. Treasury | | | | | | | | |
| Long Bond Futures Contracts | | | | | | | | |
| (Aggregate Value of | | | | | | | | |
| Contracts $175,231,875) | | | 1,183 | | | $ | 4,130,225 | |
| September 2012 U.S. Treasury | | | | | | | | |
| 10 Year Note Futures Contracts | | | | | | | | |
| (Aggregate Value of | | | | | | | | |
| Contracts $178,005,625) | | | 1,334 | | | | 2,014,819 | |
| (Total Aggregate Value of | | | | | | | | |
| Contracts $353,237,500) | | | | | | $ | 6,145,044 | |
| | | | | | | | | |
| COMMODITY FUTURES CONTRACTS PURCHASED† | | | | | | | | |
| December 2012 Live Cattle | | | | | | | | |
| Futures Contracts | | | | | | | | |
| (Aggregate Value of | | | | | | | | |
| Contracts $25,327,120) | | | 497 | | | $ | 73,146 | |
| December 2012 Lean Hogs | | | | | | | | |
| Futures Contracts | | | | | | | | |
| (Aggregate Value of | | | | | | | | |
| Contracts $18,046,100) | | | 565 | | | | 69,301 | |
| December 2012 Cocoa | | | | | | | | |
| Futures Contracts | | | | | | | | |
| (Aggregate Value of | | | | | | | | |
| Contracts $2,313,000) | | | 100 | | | | 30,482 | |
| March 2013 Cocoa | | | | | | | | |
| Futures Contracts | | | | | | | | |
| (Aggregate Value of | | | | | | | | |
| Contracts $1,088,520) | | | 47 | | | | 12,382 | |
| December 2012 Silver | | | | | | | | |
| Futures Contracts | | | | | | | | |
| (Aggregate Value of | | | | | | | | |
| Contracts $4,830,000) | | | 35 | | | | (191,855 | ) |
| (Total Aggregate Value of | | | | | | | | |
| Contracts $51,604,740) | | | | | | $ | (6,544 | ) |
| | | | | | | | | |
| CURRENCY FUTURES CONTRACTS PURCHASED† | | | | | | | | |
| September 2012 Japanese Yen | | | | | | | | |
| Futures Contracts | | | | | | | | |
| (Aggregate Value of | | | | | | | | |
| Contracts $281,633,451) | | | 1,799 | | | $ | (6,731,105 | ) |
| | | | | | | | | |
| CURRENCY FUTURES CONTRACTS SOLD SHORT† | | | | | | | | |
| September 2012 Swiss Franc | | | | | | | | |
| Futures Contracts | | | | | | | | |
| (Aggregate Value of | | | | | | | | |
| Contracts $48,703,388) | | | 369 | | | $ | (239,750 | ) |
| September 2012 Canadian Dollar | | | | | | | | |
| Futures Contracts | | | | | | | | |
| (Aggregate Value of | | | | | | | | |
| Contracts $24,515,000) | | | 250 | | | | (311,503 | ) |
| September 2012 Euro | | | | | | | | |
| Futures Contracts | | | | | | | | |
| (Aggregate Value of | | | | | | | | |
| Contracts $317,783,362) | | | 2,007 | | | | (1,703,843 | ) |
| September 2012 British Pound | | | | | | | | |
| Futures Contracts | | | | | | | | |
| (Aggregate Value of | | | | | | | | |
| Contracts $122,335,938) | | | 1,250 | | | | (2,148,618 | ) |
| September 2012 Australian Dollar | | | | | | | | |
| Futures Contracts | | | | | | | | |
| (Aggregate Value of | | | | | | | | |
| Contracts $50,815,000) | | | 500 | | | | (2,790,200 | ) |
| (Total Aggregate Value of | | | | | | | | |
| Contracts $564,152,688) | | | | | | $ | (7,193,914 | ) |
| | | | | | | | | |
| COMMODITY FUTURES CONTRACTS SOLD SHORT† | | | | | | | | |
| October 2012 Gold 100 oz. | | | | | | | | |
| Futures Contracts | | | | | | | | |
| (Aggregate Value of | | | | | | | | |
| Contracts $83,091,900) | | | 519 | | | $ | 2,197,673 | |
| September 2012 Silver | | | | | | | | |
| Futures Contracts | | | | | | | | |
| (Aggregate Value of | | | | | | | | |
| Contracts $44,493,300) | | | 324 | | | | 2,121,737 | |
| March 2013 Sugar #11 | | | | | | | | |
| Futures Contracts | | | | | | | | |
| (Aggregate Value of | | | | | | | | |
| Contracts $12,562,368) | | | 520 | | | | 739,237 | |
| October 2012 Sugar #11 | | | | | | | | |
| Futures Contracts | | | | | | | | |
| (Aggregate Value of | | | | | | | | |
| Contracts $13,734,269) | | | 582 | | | | 541,570 | |
| December 2012 Cotton #2 | | | | | | | | |
| Futures Contracts | | | | | | | | |
| (Aggregate Value of | | | | | | | | |
| Contracts $17,093,825) | | | 485 | | | | 105,124 | |
| March 2013 Cotton #2 | | | | | | | | |
| Futures Contracts | | | | | | | | |
| (Aggregate Value of | | | | | | | | |
| Contracts $8,055,000) | | | 225 | | | | 88,775 | |
| September 2012 Cocoa | | | | | | | | |
| Futures Contracts | | | | | | | | |
| (Aggregate Value of | | | | | | | | |
| Contracts $4,136,400) | | | 180 | | | | (77,156 | ) |
| August 2012 Live Cattle | | | | | | | | |
| Futures Contracts | | | | | | | | |
| (Aggregate Value of | | | | | | | | |
| Contracts $7,088,340) | | | 147 | | | | (96,772 | ) |
| August 2012 Lean Hogs | | | | | | | | |
| Futures Contracts | | | | | | | | |
| (Aggregate Value of | | | | | | | | |
| Contracts $6,253,500) | | | 165 | | | | (455,517 | ) |
| March 2013 Coffee ‘C’ | | | | | | | | |
| Futures Contracts | | | | | | | | |
| (Aggregate Value of | | | | | | | | |
| Contracts $4,390,650) | | | 66 | | | | (458,091 | ) |
| December 2012 Coffee ‘C’ | | | | | | | | |
| Futures Contracts | | | | | | | | |
| (Aggregate Value of | | | | | | | | |
| Contracts $6,523,125) | | | 100 | | | | (711,861 | ) |
| 8 | THE GUGGENHEIM FUNDS semi-annual REPORT | See Notes to Financial Statements. |
| CONSOLIDATED SCHEDULE OF INVESTMENTS (Unaudited) (concluded) | June 30, 2012 |
| MANAGED FUTURES STRATEGY fund |
| | | | | | Unrealized | |
| | | Contracts | | | Loss | |
| September 2012 Coffee ‘C’ | | | | | | | | |
| Futures Contracts | | | | | | | | |
| (Aggregate Value of | | | | | | | | |
| Contracts $27,942,150) | | | 436 | | | $ | (2,381,667 | ) |
| March 2013 Corn | | | | | | | | |
| Futures Contracts | | | | | | | | |
| (Aggregate Value of | | | | | | | | |
| Contracts $32,125,000) | | | 1,000 | | | | (5,956,950 | ) |
| September 2012 Copper | | | | | | | | |
| Futures Contracts | | | | | | | | |
| (Aggregate Value of | | | | | | | | |
| Contracts $126,437,500) | | | 1,445 | | | | (5,993,322 | ) |
| September 2012 Corn | | | | | | | | |
| Futures Contracts | | | | | | | | |
| (Aggregate Value of | | | | | | | | |
| Contracts $49,196,000) | | | 1,568 | | | | (8,652,230 | ) |
| September 2012 Wheat | | | | | | | | |
| Futures Contracts | | | | | | | | |
| (Aggregate Value of | | | | | | | | |
| Contracts $57,949,400) | | | 1,528 | | | | (9,317,336 | ) |
| November 2012 Soybean | | | | | | | | |
| Futures Contracts | | | | | | | | |
| (Aggregate Value of | | | | | | | | |
| Contracts $120,800,813) | | | 1,691 | | | | (14,274,913 | ) |
| (Total Aggregate Value of | | | | | | | | |
| Contracts $621,873,540) | | | | | | $ | (42,581,699 | ) |
| † | Value determined based on Level 1 inputs — See Note 4. |
| †† | Value determined based on Level 2 inputs — See Note 4. |
| 1 | The issuer operates under a Congressional charter; its securities are neither issued nor guaranteed by the U.S. Government. |
| 2 | On September 7, 2008, the issuer was placed in conservatorship by the Federal Housing Finance Agency (FHFA). As conservator, the FHFA has full powers to control the assets and operations of the firm. |
| 3 | Repurchase Agreements — See Note 5. |
| See Notes to Financial Statements. | THE GUGGENHEIM FUNDS semi-annual REPORT | 9 |
| MANAGED FUTURES STRATEGY fund |
| CONSOLIDATED STATEMENT OF | | | |
| ASSETS AND LIABILITIES (Unaudited) |
| June 30, 2012 | | | |
| Assets: | | | | |
| Investments, at value | | | | |
| (cost $1,704,269,673) | | $ | 1,704,314,598 | |
| Repurchase agreements, at value | | | | |
| (cost $135,427,484) | | | 135,427,484 | |
| Total investments | | | | |
| (cost $1,839,697,157) | | | 1,839,742,082 | |
| Segregated cash with broker | | | 75,914,078 | |
| Receivables: | | | | |
| Fund shares sold | | | 3,989,603 | |
| Interest | | | 373,580 | |
| Total assets | | | 1,920,019,343 | |
| Liabilities: | | | | |
| Payable for: | | | | |
| Variation margin | | | 31,343,614 | |
| Fund shares redeemed | | | 5,312,520 | |
| Management fees | | | 1,462,146 | |
| Transfer agent and administrative fees | | | 392,850 | |
| Distribution and service fees | | | 367,318 | |
| Portfolio accounting fees | | | 76,416 | |
| Miscellaneous | | | 2,292,319 | |
| Total liabilities | | | 41,247,183 | |
| Net assets | | $ | 1,878,772,160 | |
| net assets consist of: | | | | |
| Paid in capital | | $ | 2,158,508,395 | |
| Accumulated net investment loss | | | (20,623,411 | ) |
| Accumulated net realized loss on investments | | | (208,789,531 | ) |
| Net unrealized depreciation on investments | | | (50,323,293 | ) |
| Net assets | | $ | 1,878,772,160 | |
| A-Class: | | | | |
| Net assets | | $ | 240,228,946 | |
| Capital shares outstanding | | | 11,149,652 | |
| Net asset value per share | | $ | 21.55 | |
| Maximum offering price per share | | | | |
| (Net asset value divided by 95.25%) | | $ | 22.61 | |
| C-Class: | | | | |
| Net assets | | $ | 66,520,221 | |
| Capital shares outstanding | | | 3,214,122 | |
| Net asset value per share | | $ | 20.70 | |
| H-Class: | | | | |
| Net assets | | $ | 1,198,190,526 | |
| Capital shares outstanding | | | 55,611,701 | |
| Net asset value per share | | $ | 21.55 | |
| Institutional class: | | | | |
| Net assets | | $ | 69,958,956 | |
| Capital shares outstanding | | | 3,227,889 | |
| Net asset value per share | | $ | 21.67 | |
| Y-Class: | | | | |
| Net assets | | $ | 303,873,511 | |
| Capital shares outstanding | | | 14,007,742 | |
| Net asset value per share | | $ | 21.69 | |
| CONSOLIDATED STATEMENT | | | |
| OF OPERATIONS (Unaudited) | | | |
| Period Ended June 30, 2012 | | | |
| Investment income: | | | |
| Interest | | $ | 1,936,356 | |
| Total investment income | | | 1,936,356 | |
| Expenses: | | | | |
| Management fees | | | 10,645,218 | |
| Transfer agent and administrative fees | | | | |
| A-Class | | | 478,162 | |
| C-Class | | | 101,685 | |
| H-Class | | | 1,600,700 | |
| Institutional Class | | | 107,652 | |
| Y-Class | | | 370,412 | |
| Distribution and service fees: | | | | |
| A-Class | | | 478,162 | |
| C-Class | | | 406,741 | |
| H-Class | | | 1,600,700 | |
| Portfolio accounting fees | | | 497,985 | |
| Licensing fees | | | 3,706,658 | |
| Custodian fees | | | 265,271 | |
| Trustees’ fees* | | | 115,831 | |
| Miscellaneous | | | 973,232 | |
| Total expenses | | | 21,348,409 | |
| Less: | | | | |
| Expenses waived by Advisor | | | (740,837 | ) |
| Net expenses | | | 20,607,572 | |
| Net investment loss | | | (18,671,216 | ) |
| | | | | |
| Net Realized and Unrealized Gain (loss): | | | | |
| Net realized gain (loss) on: | | | | |
| Investments | | | 8,643 | |
| Futures contracts | | | (135,137,759 | ) |
| Options written | | | 391,575 | |
| Net realized loss | | | (134,737,541 | ) |
| | | | | |
| Net change in unrealized appreciation (depreciation) on: | | | | |
| | | | |
| Investments | | | (741,489 | ) |
| Futures contracts | | | (72,607,607 | ) |
| | | | |
| Net change in unrealized appreciation (depreciation) | | | (73,349,096 | ) |
| Net realized and unrealized loss | | | (208,086,637 | ) |
| Net decrease in net assets resulting from operations | | $ | (226,757,853 | ) |
* Relates to Trustees not deemed “interested persons” within the meaning of Section 2(a)(19) of the 1940 Act.
| 10 | THE GUGGENHEIM FUNDS semi-annual REPORT | See Notes to Financial Statements. |
| MANAGED FUTURES STRATEGY fund |
CONSOLIDATED STATEMENTS OF CHANGES IN NET ASSETS
| | | Period Ended | | | | |
| | | June 30, | | | Year Ended | |
| | | 2012 | | | December 31, | |
| | | (Unaudited) | | | 2011 | |
| Increase (Decrease) In Net Assets From Operations: | | | | | | | | |
| Net investment loss | | $ | (18,671,216 | ) | | $ | (43,185,269 | ) |
| Net realized loss on investments | | | (134,737,541 | ) | | | (76,732,566 | ) |
| Net change in unrealized appreciation (depreciation) on investments | | | (73,349,096 | ) | | | (65,602,982 | ) |
| Net decrease in net assets resulting from operations | | | (226,757,853 | ) | | | (185,520,817 | ) |
| | | | | | | | | |
| Capital share transactions: | | | | | | | | |
| Proceeds from sale of shares | | | | | | | | |
| A-Class | | | 98,590,293 | | | | 511,923,650 | |
| C-Class | | | 3,844,909 | | | | 16,934,292 | |
| H-Class | | | 672,489,228 | | | | 795,455,515 | |
| Institutional Class | | | 13,917,454 | | | | 74,985,665 | |
| Y-Class | | | 38,598,330 | | | | 299,957,366 | |
| Cost of shares redeemed | | | | | | | | |
| A-Class | | | (555,712,234 | ) | | | (383,723,127 | ) |
| C-Class | | | (25,272,633 | ) | | | (69,518,004 | ) |
| H-Class | | | (398,538,187 | ) | | | (847,649,799 | ) |
| Institutional Class | | | (36,771,734 | ) | | | (100,701,093 | ) |
| Y-Class | | | (101,952,253 | ) | | | (55,454,346 | ) |
| Net increase (decrease) from capital share transactions | | | (290,806,827 | ) | | | 242,210,119 | |
| Net increase (decrease) in net assets | | | (517,564,680 | ) | | | 56,689,302 | |
| | | | | | | | | |
| Net Assets: | | | | | | | | |
| Beginning of period | | | 2,396,336,840 | | | | 2,339,647,538 | |
| End of period | | $ | 1,878,772,160 | | | $ | 2,396,336,840 | |
| Accumulated net investment loss at end of period | | $ | (20,623,411 | ) | | $ | (1,952,195 | ) |
| | | | | | | | | |
| Capital Share Activity: | | | | | | | | |
| Shares sold | | | | | | | | |
| A-Class | | | 4,251,708 | | | | 20,376,917 | |
| C-Class | | | 173,076 | | | | 686,909 | |
| H-Class | | | 28,804,717 | | | | 31,500,881 | |
| Institutional Class | | | 598,311 | | | | 2,971,063 | |
| Y-Class | | | 1,653,810 | | | | 11,718,228 | |
| Shares redeemed | | | | | | | | |
| A-Class | | | (23,730,903 | ) | | | (15,245,234 | ) |
| C-Class | | | (1,144,864 | ) | | | (2,835,242 | ) |
| H-Class | | | (17,458,205 | ) | | | (33,774,119 | ) |
| Institutional Class | | | (1,591,297 | ) | | | (3,965,154 | ) |
| Y-Class | | | (4,455,516 | ) | | | (2,232,779 | ) |
| Net increase (decrease) in shares | | | (12,899,163 | ) | | | 9,201,470 | |
| See Notes to Financial Statements. | THE GUGGENHEIM FUNDS semi-annual REPORT | 11 |
| MANAGED FUTURES STRATEGY fund |
FINANCIAL HIGHLIGHTS
This table is presented to show selected data for a share outstanding throughout each period and to assist shareholders in evaluating a Fund’s performance for the periods presented.
| | | Period Ended | | | Year Ended | | | Year Ended | | | Year Ended | | | Period Ended | | | Year Ended | |
| | | June 30, | | | December 31, | | | December 31, | | | December 31, | | | December 31, | | | March 31, | |
| A-Class | | 2012a,b | | | 2011b | | | 2010b | | | 2009b | | | 2008b,c | | | 2008 | |
| Per Share Data | | | | | | | | | | | | | | | | | | | | | | | | |
| Net asset value, beginning of period | | $ | 23.95 | | | $ | 25.78 | | | $ | 26.81 | | | $ | 28.04 | | | $ | 28.26 | | | $ | 25.03 | |
| Income (loss) from investment operations: | | | | | | | | | | | | | | | | | | | | | | | | |
| Net investment income (loss)d | | | (.20 | ) | | | (.44 | ) | | | (.41 | ) | | | (.39 | ) | | | (—) | e | | | .57 | |
| Net gain (loss) on investments (realized | | | | | | | | | | | | | | | | | | | | | | | | |
| and unrealized) | | | (2.20 | ) | | | (1.39 | ) | | | (.62 | ) | | | (.84 | ) | | | .83 | | | | 2.64 | |
| Total from investment operations | | | (2.40 | ) | | | (1.83 | ) | | | (1.03 | ) | | | (1.23 | ) | | | .83 | | | | 3.21 | |
| Less distributions from: | | | | | | | | | | | | | | | | | | | | | | | | |
| Net investment income | | | — | | | | — | | | | — | | | | — | | | | (.57 | ) | | | — | |
| Net realized gains | | | — | | | | — | | | | — | | | | — | | | | (.50 | ) | | | (—) | j |
| Total distributions | | | — | | | | — | | | | — | | | | — | | | | (1.07 | ) | | | (—) | j |
| Redemption fees collected | | | — | | | | — | | | | — | f | | | — | f | | | .02 | | | | .02 | |
| Net asset value, end of period | | $ | 21.55 | | | $ | 23.95 | | | $ | 25.78 | | | $ | 26.81 | | | $ | 28.04 | | | $ | 28.26 | |
| | | | | | | | | | | | | | | | | | | | | | | | | |
| Total Returng | | | (10.03 | %) | | | (7.14 | %) | | | (3.84 | %) | | | (4.39 | %) | | | 2.96 | % | | | 12.92 | % |
| Ratios/Supplemental Data | | | | | | | | | | | | | | | | | | | | | | | | |
| Net assets, end of period (in thousands) | | $ | 240,229 | | | $ | 733,469 | | | $ | 657,317 | | | $ | 636,083 | | | $ | 298,987 | | | $ | 128,744 | |
| Ratios to average net assets: | | | | | | | | | | | | | | | | | | | | | | | | |
| Net investment income (loss) | | | (1.73 | %) | | | (1.76 | %) | | | (1.66 | %) | | | (1.42 | %) | | | (0.02 | %) | | | 2.15 | % |
| Total expenses | | | 1.98 | % | | | 2.05 | % | | | 2.04 | % | | | 2.16 | % | | | 1.77 | % | | | 1.72 | % |
| Net expensesh | | | 1.91 | % | | | 1.97 | % | | | 1.97 | % | | | 2.05 | % | | | 1.77 | % | | | 1.72 | % |
| Operating expensesi | | | 1.91 | % | | | 1.97 | % | | | 1.97 | % | | | 2.05 | % | | | 1.75 | % | | | 1.69 | % |
| Portfolio turnover rate | | | 39 | % | | | 72 | % | | | 148 | % | | | 125 | % | | | 74 | % | | | 154 | % |
| | | Period Ended | | | Year Ended | | | Year Ended | | | Year Ended | | | Period Ended | | | Year Ended | |
| | | June 30, | | | December 31, | | | December 31, | | | December 31, | | | December 31, | | | March 31, | |
| C-Class | | 2012a,b | | | 2011b | | | 2010b | | | 2009b | | | 2008b,c | | | 2008 | |
| Per Share Data | | | | | | | | | | | | | | | | | | | | | | | | |
| Net asset value, beginning of period | | $ | 23.09 | | | $ | 25.04 | | | $ | 26.24 | | | $ | 27.65 | | | $ | 28.04 | | | $ | 25.02 | |
| Income (loss) from investment operations: | | | | | | | | | | | | | | | | | | | | | | | | |
| Net investment income (loss)d | | | (.27 | ) | | | (.61 | ) | | | (.59 | ) | | | (.58 | ) | | | (.16 | ) | | | .35 | |
| Net gain (loss) on investments (realized | | | | | | | | | | | | | | | | | | | | | | | | |
| and unrealized) | | | (2.12 | ) | | | (1.34 | ) | | | (.61 | ) | | | (.83 | ) | | | .82 | | | | 2.65 | |
| Total from investment operations | | | (2.39 | ) | | | (1.95 | ) | | | (1.20 | ) | | | (1.41 | ) | | | .66 | | | | 3.00 | |
| Less distributions from: | | | | | | | | | | | | | | | | | | | | | | | | |
| Net investment income | | | — | | | | — | | | | — | | | | — | | | | (.57 | ) | | | — | |
| Net realized gains | | | — | | | | — | | | | — | | | | — | | | | (.50 | ) | | | (—) | j |
| Total distributions | | | — | | | | — | | | | — | | | | — | | | | (1.07 | ) | | | (—) | j |
| Redemption fees collected | | | — | | | | — | | | | — | f | | | — | f | | | .02 | | | | .02 | |
| Net asset value, end of period | | $ | 20.70 | | | $ | 23.09 | | | $ | 25.04 | | | $ | 26.24 | | | $ | 27.65 | | | $ | 28.04 | |
| | | | | | | | | | | | | | | | | | | | | | | | | |
| Total Returng | | | (10.39 | %) | | | (7.79 | %) | | | (4.57 | %) | | | (5.10 | %) | | | 2.37 | % | | | 12.08 | % |
| Ratios/Supplemental Data | | | | | | | | | | | | | | | | | | | | | | | | |
| Net assets, end of period (in thousands) | | $ | 66,520 | | | $ | 96,647 | | | $ | 158,628 | | | $ | 225,416 | | | $ | 125,601 | | | $ | 46,005 | |
| Ratios to average net assets: | | | | | | | | | | | | | | | | | | | | | | | | |
| Net investment income (loss) | | | (2.48 | %) | | | (2.50 | %) | | | (2.41 | %) | | | (2.17 | %) | | | (0.78 | %) | | | 1.30 | % |
| Total expenses | | | 2.72 | % | | | 2.80 | % | | | 2.79 | % | | | 2.92 | % | | | 2.51 | % | | | 2.48 | % |
| Net expensesh | | | 2.66 | % | | | 2.72 | % | | | 2.72 | % | | | 2.81 | % | | | 2.51 | % | | | 2.48 | % |
| Operating expensesi | | | 2.66 | % | | | 2.72 | % | | | 2.72 | % | | | 2.81 | % | | | 2.49 | % | | | 2.45 | % |
| Portfolio turnover rate | | | 39 | % | | | 72 | % | | | 148 | % | | | 125 | % | | | 74 | % | | | 154 | % |
| 12 | THE GUGGENHEIM FUNDS semi-annual REPORT | See Notes to Financial Statements. |
| MANAGED FUTURES STRATEGY fund |
FINANCIAL HIGHLIGHTS (continued)
This table is presented to show selected data for a share outstanding throughout each period and to assist shareholders in evaluating a Fund’s performance for the periods presented.
| | | Period Ended | | | Year Ended | | | Year Ended | | | Year Ended | | | Period Ended | | | Year Ended | |
| | | June 30, | | | December 31, | | | December 31, | | | December 31, | | | December 31, | | | March 31, | |
| H-Class | | 2012a,b | | | 2011b | | | 2010b | | | 2009b | | | 2008b,c | | | 2008 | |
| Per Share Data | | | | | | | | | | | | | | | | | | | | | | | | |
| Net asset value, beginning of period | | $ | 23.95 | | | $ | 25.78 | | | $ | 26.81 | | | $ | 28.04 | | | $ | 28.26 | | | $ | 25.03 | |
| Income (loss) from investment operations: | | | | | | | | | | | | | | | | | | | | | | | | |
| Net investment income (loss)d | | | (.20 | ) | | | (.44 | ) | | | (.42 | ) | | | (.38 | ) | | | (.01 | ) | | | .58 | |
| Net gain (loss) on investments (realized | | | | | | | | | | | | | | | | | | | | | | | | |
| and unrealized) | | | (2.20 | ) | | | (1.39 | ) | | | (.61 | ) | | | (.85 | ) | | | .84 | | | | 2.63 | |
| Total from investment operations | | | (2.40 | ) | | | (1.83 | ) | | | (1.03 | ) | | | (1.23 | ) | | | .83 | | | | 3.21 | |
| Less distributions from: | | | | | | | | | | | | | | | | | | | | | | | | |
| Net investment income | | | — | | | | — | | | | — | | | | — | | | | (.57 | ) | | | — | |
| Net realized gains | | | — | | | | — | | | | — | | | | — | | | | (.50 | ) | | | (—) | j |
| Total distributions | | | — | | | | — | | | | — | | | | — | | | | (1.07 | ) | | | (—) | j |
| Redemption fees collected | | | — | | | | — | | | | — | f | | | — | f | | | .02 | | | | .02 | |
| Net asset value, end of period | | $ | 21.55 | | | $ | 23.95 | | | $ | 25.78 | | | $ | 26.81 | | | $ | 28.04 | | | $ | 28.26 | |
| | | | | | | | | | | | | | | | | | | | | | | | | |
| Total Returng | | | (10.03 | %) | | | (7.14 | %) | | | (3.84 | %) | | | (4.39 | %) | | | 2.96 | % | | | 12.92 | % |
| Ratios/Supplemental Data | | | | | | | | | | | | | | | | | | | | | | | | |
| Net assets, end of period (in thousands) | | $ | 1,198,191 | | | $ | 1,059,988 | | | $ | 1,199,718 | | | $ | 1,468,770 | | | $ | 838,511 | | | $ | 322,673 | |
| Ratios to average net assets: | | | | | | | | | | | | | | | | | | | | | | | | |
| Net investment income (loss) | | | (1.73 | %) | | | (1.75 | %) | | | (1.66 | %) | | | (1.41 | %) | | | (0.03 | %) | | | 2.17 | % |
| Total expenses | | | 1.97 | % | | | 2.05 | % | | | 2.04 | % | | | 2.16 | % | | | 1.77 | % | | | 1.73 | % |
| Net expensesh | | | 1.90 | % | | | 1.97 | % | | | 1.97 | % | | | 2.05 | % | | | 1.77 | % | | | 1.73 | % |
| Operating expensesi | | | 1.90 | % | | | 1.97 | % | | | 1.97 | % | | | 2.05 | % | | | 1.75 | % | | | 1.70 | % |
| Portfolio turnover rate | | | 39 | % | | | 72 | % | | | 148 | % | | | 125 | % | | | 74 | % | | | 154 | % |
| | | Period Ended | | | Year Ended | | | Period Ended | |
| | | June 30, | | | December 31, | | | December 31, | |
| Institutional Class | | 2012a,b | | | 2011b | | | 2010b,k | |
| Per Share Data | | | | | | | | | | | | |
| Net asset value, beginning of period | | $ | 24.06 | | | $ | 25.84 | | | $ | 25.58 | |
| Income (loss) from investment operations: | | | | | | | | | | | | |
| Net investment lossd | | | (.17 | ) | | | (.38 | ) | | | (.23 | ) |
| Net gain (loss) on investments (realized | | | | | | | | | | | | |
| and unrealized) | | | (2.22 | ) | | | (1.40 | ) | | | .49 | |
| Total from investment operations | | | (2.39 | ) | | | (1.78 | ) | | | .26 | |
| Redemption fees collected | | | — | | | | — | | | | — | f |
| Net asset value, end of period | | $ | 21.67 | | | $ | 24.06 | | | $ | 25.84 | |
| | | | | | | | | | | | | |
| Total Returng | | | (9.93 | %) | | | (6.85 | %) | | | 0.98 | % |
| Ratios/Supplemental Data | | | | | | | | | | | | |
| Net assets, end of period (in thousands) | | $ | 69,959 | | | $ | 101,549 | | | $ | 134,733 | |
| Ratios to average net assets: | | | | | | | | | | | | |
| Net investment loss | | | (1.48 | %) | | | (1.50 | %) | | | (1.41 | %) |
| Total expenses | | | 1.72 | % | | | 1.80 | % | | | 1.78 | % |
| Net expensesh | | | 1.66 | % | | | 1.72 | % | | | 1.72 | % |
| Portfolio turnover rate | | | 39 | % | | | 72 | % | | | 148 | % |
| See Notes to Financial Statements. | THE GUGGENHEIM FUNDS semi-annual REPORT | 13 |
| MANAGED FUTURES STRATEGY fund |
FINANCIAL HIGHLIGHTS (concluded)
This table is presented to show selected data for a share outstanding throughout each period and to assist shareholders in evaluating a Fund’s performance for the periods presented.
| | | Period Ended | | | Year Ended | | | Period Ended | |
| | | June 30, | | | December 31, | | | December 31, | |
| Y-Class | | 2012a,b | | | 2011b | | | 2010b,l | |
| Per Share Data | | | | | | | | | | | | |
| Net asset value, beginning of period | | $ | 24.07 | | | $ | 25.84 | | | $ | 25.74 | |
| Income (loss) from investment operations: | | | | | | | | | | | | |
| Net investment lossd | | | (.16 | ) | | | (.37 | ) | | | (.26 | ) |
| Net gain (loss) on investments (realized | | | | | | | | | | | | |
| and unrealized) | | | (2.22 | ) | | | (1.40 | ) | | | .36 | |
| Total from investment operations | | | (2.38 | ) | | | (1.77 | ) | | | .10 | |
| Redemption fees collected | | | — | | | | — | | | | — | f |
| Net asset value, end of period | | $ | 21.69 | | | $ | 24.07 | | | $ | 25.84 | |
| | | | | | | | | | | | | |
| Total Returng | | | (9.89 | %) | | | (6.85 | %) | | | 0.39 | % |
| Ratios/Supplemental Data | | | | | | | | | | | | |
| Net assets, end of period (in thousands) | | $ | 303,874 | | | $ | 404,684 | | | $ | 189,251 | |
| Ratios to average net assets: | | | | | | | | | | | | |
| Net investment loss | | | (1.43 | %) | | | (1.47 | %) | | | (1.36 | %) |
| Total expenses | | | 1.67 | % | | | 1.75 | % | | | 1.73 | % |
| Net expensesh | | | 1.61 | % | | | 1.68 | % | | | 1.67 | % |
| Portfolio turnover rate | | | 39 | % | | | 72 | % | | | 148 | % |
| a | Unaudited figures for the period ended June 30, 2012. Percentage amounts for the period, except total return and portfolio turnover rate, have been annualized. |
| c | The Fund changed it’s fiscal year end from March 31 to December 31 in 2008. Percentage amounts for the period, except total return and portfolio turnover rate, have been annualized. |
| d | Net investment income (loss) per share was computed using average shares outstanding throughout the period. |
| e | Net investment income is less than $0.01 per share. |
| f | Redemption fees collected are less than $0.01 per share. |
| g | Total return does not reflect the impact of any applicable sales charges and has not been annualized. |
| h | Net expense information reflects the expense ratios after expense waivers. |
| i | Operating expenses exclude interest and dividend expense from securities sold short. |
| j | Distributions from realized gains are less than $0.01 per share. |
| k | Since commencement of operations: May 3, 2010. Percentage amounts for the period, except total return and portfolio turnover rate, have been annualized. |
| l | Since commencement of operations: March 29, 2010. Percentage amounts for the period, except total return and portfolio turnover rate, have been annualized. |
| 14 | THE GUGGENHEIM FUNDS semi-annual REPORT | See Notes to Financial Statements. |
NOTES TO Consolidated FINANCIAL STATEMENTS (Unaudited)
1. Organization, Consolidation of Subsidiary and Significant Accounting Policies
Organization
The Rydex Series Funds (the “Trust”) is registered with the SEC under the Investment Company Act of 1940 (“1940 Act”) as a non-diversified, open-ended investment company. The Trust offers eight separate classes of shares, Investor Class shares, Investor2 Class shares, Advisor Class shares, A-Class shares, C Class shares, H-Class shares, Y-Class shares, Institutional Class shares, and Money Market Class shares. Sales of shares of each Class are made without a sales charge at the NAV, with the exception of A-Class shares. A-Class shares are sold at the NAV, plus the applicable front-end sales charge. The sales charge varies depending on the amount purchased, but will not exceed 4.75%. A-Class share purchases of $1 million or more are exempt from the front-end sales charge but have a 1% CDSC if shares are redeemed within 18 months of purchase. C-Class shares have a 1% CDSC if shares are redeemed within 12 months of purchase.
At June 30, 2012, the Trust consisted of fifty-eight separate funds. This report covers the Managed Futures Strategy Fund (the “Fund”). Only A-Class, C-Class, H-Class, Y-Class and Institutional Class shares had been issued by the Fund.
Guggenheim Investments (“GI”) provides advisory services and Rydex Fund Services, LLC (“RFS”) provides transfer agent, administrative and accounting services to the Trust. Rydex Distributors, LLC (“RDL”) acts as principal underwriter for the Trust. GI, RFS and RDL are affiliated entities.
Consolidation of Subsidiary
Each of the consolidated financial statements of the Fund includes the accounts of a wholly-owned and controlled Cayman Islands subsidiary (the “Subsidiary”). Significant inter-company accounts and transactions have been eliminated in consolidation for the Fund.
The Fund may invest up to 25% of its total assets in its Subsidiary which acts as an investment vehicle in order to effect certain investments consistent with the Fund’s investment objectives and policies.
A summary of the Fund’s investment in its respective Subsidiary is as follows:
| | | | % of Total |
| | | Subsidiary | Net Assets of |
| | Inception | Net Assets at | the Fund at |
| | Date of | June 30, | June 30, |
| | Subsidiary | 2012 | 2012 |
| Managed Futures | | | |
| Strategy Fund | 05/01/08 | $77,476,239 | 4.12% |
Significant Accounting Policies
The following significant accounting policies are in conformity with U.S. generally accepted accounting principles (“GAAP”) and are consistently followed by the Fund. This requires management to make estimates and assumptions that affect the reported amount of assets and liabilities and disclosure of contingent assets and liabilities at the date of the financial statements and the reported amounts of revenues and expenses during the reporting period. Actual results could differ from these estimates. All time references are based on Eastern Time.
A. The value of futures contracts purchased and sold by the Fund is accounted for using the unrealized gain or loss on the contracts that is determined by marking the contracts to their current realized settlement prices. Financial futures contracts are valued at the 4:00 p.m. price on the valuation date. In the event that the exchange for a specific futures contract closes earlier than 4:00 p.m., the futures contract is valued at the Official Settlement Price of the exchange. However, the underlying securities from which the futures contract value is derived are monitored until 4:00 p.m. to determine if fair valuation would provide a more accurate valuation.
Debt securities with a maturity of greater than 60 days at acquisition are valued at prices that reflect broker/dealer supplied valuations or are obtained from independent pricing services, which may consider the trade activity, treasury spreads, yield or price of bonds of comparable quality, coupon, maturity, and type, as well as prices quoted by dealers who make markets in such securities. Short-term debt securities with a maturity of 60 days or less at acquisition and repurchase agreements are valued at amortized cost, which approximates market value.
Investments for which market quotations are not readily available are fair valued as determined in good faith by GI under the direction of the Board of Trustees using methods established or ratified by the Board of Trustees. These methods include, but are not limited to: (i) using general information as to how these securities and assets trade; (ii) in connection with futures contracts and options thereupon, and other derivative
THE GUGGENHEIM FUNDS semi-annual REPORT | 15
NOTES TO Consolidated FINANCIAL STATEMENTS (Unaudited) (continued)
investments, information as to how (a) these contracts and other derivative investments trade in the futures or other derivative markets, respectively, and (b) the securities underlying these contracts and other derivative investments trade in the cash market; and (iii) other information and considerations, including current values in related markets.
B. Security transactions are recorded on the trade date for financial reporting purposes. Realized gains and losses from securities transactions are recorded using the identified cost basis. Proceeds from lawsuits related to investment holdings are recorded as realized gains in the Fund. Dividend income is recorded on the ex-dividend date, net of applicable taxes withheld by foreign countries. Taxable non-cash dividends are recorded as dividend income. Interest income, including amortization of premiums and accretion of discount, is accrued on a daily basis.
C. Distributions of net investment income and net realized gains, if any, are declared and paid at least annually. Distributions are recorded on the ex-dividend date and are determined in accordance with income tax regulations which may differ from U.S. GAAP.
D. Certain U.S. Government and Agency Obligations are traded on a discount basis; the interest rates shown on the Schedule of Investments reflect the effective rates paid at the time of purchase by the Fund. Other securities bear interest at the rates shown, payable at fixed dates through maturity.
E. The Fund may leave cash overnight in its cash account with the custodian, U.S. Bank. Periodically, the Fund may have cash due to the custodian bank as an overdraft balance. A fee is incurred on this overdraft, calculated by multiplying the overdraft by a rate based on the federal funds rate.
Segregated cash with the broker is held as collateral for investments in derivative instruments such as futures contracts or swap agreements.
F. Interest and dividend income, most expenses, all realized gains and losses, and all unrealized gains and losses are allocated to the Classes based upon the value of the outstanding shares in each Class. Certain costs, such as distribution fees relating to A-Class shares and H-Class shares and service and distribution fees related to C-Class shares, are charged directly to specific Classes. In addition, certain expenses have been allocated to the individual Funds in the Trust on a pro rata basis upon the respective aggregate net assets of each Fund included in the Trust.
G. When the Fund writes (sells) an option, an amount equal to the premium received is entered in the Fund’s accounting records as an asset and equivalent liability. The amount of the liability is subsequently marked-to-market to reflect the current value of the option written. When a written option expires, or if the Fund enters into a closing purchase transaction, it realizes a gain (or loss if the cost of a closing purchase transaction exceeds the premium received when the option was sold).
H. Upon entering into a futures contract,the Fund deposits and maintains as collateral such initial margin as required by the exchange on which the transaction is affected. Pursuant to the contract, the Fund agrees to receive from or pay to the broker an amount of cash equal to the daily fluctuation in value of the contract. Such receipts or payments are known as variation margin and are recorded by the Fund as unrealized gains or losses. When the contract is closed, the Fund records a realized gain or loss equal to the difference between the value of the contract at the time it was opened and the value at the time it was closed.
I. Throughout the normal course of business, the Fund enters into contracts that contain a variety of representations and warranties which provide general indemnifications. The Fund’s maximum exposure under these arrangements is unknown, as this would involve future claims that may be made against the Fund and/ or its affiliates that have not yet occurred. However, based on experience, the Fund expects the risk of loss to be remote.
2. Financial Instruments
As part of their investment strategy, the Fund utilizes a variety of derivative instruments including options and futures. These investments involve, to varying degrees, elements of market risk and risks in excess of the amounts recognized in the Statement of Assets and Liabilities.
An option on a security gives the purchaser of the option the right to sell, and the writer of the option the obligation to buy, the underlying security (put option) or the purchaser of the option the right to buy, and the writer of the option the obligation to sell, the underlying security (call option) at any time during the option period. The risk associated with purchasing options is limited to the premium originally paid. The risk in writing a call option is that the Fund may incur a loss if the market price of the underlying security increases and the option is exercised. The risk in writing a put option is that the Fund may incur a loss if the market price of the underlying security decreases and the option is exercised. In addition, there may be an imperfect correlation between the movement in prices of options and the
16 | THE GUGGENHEIM FUNDS semi-annual REPORT
NOTES TO Consolidated FINANCIAL STATEMENTS (Unaudited) (continued)
underlying securities and the Fund may not be able to enter into a closing transaction because of an illiquid secondary market or, for over-the-counter options, because of the counterparty’s inability to perform.
A futures contract is an agreement to purchase (long) or sell (short) an agreed amount of securities or other instruments at a set price for delivery at a future date. There are significant risks associated with a Fund’s or an underlying fund’s use of futures contracts and related options, including (i) there may be an imperfect or no correlation between the changes in market value of the underlying asset and the prices of futures contracts; (ii) there may not be a liquid secondary market for a futures contract; (iii) trading restrictions or limitations may be imposed by an exchange; and (iv) government regulations may restrict trading in futures contracts. When investing in futures, there is minimal counterparty credit risk to the Fund because futures are exchange-traded and the exchange’s clearinghouse, as counterparty to all exchange-traded futures, guarantees against default.
In conjunction with the use of written options and futures, the Fund is required to maintain collateral in various forms. The Fund uses, where appropriate, depending on the financial instrument utilized and the broker involved, margin deposits at the broker, cash and/or securities segregated at the custodian bank, discount notes, or the repurchase agreements allocated to the Fund.
The Trust has established counterparty credit guidelines and enters into transactions only with financial institutions of investment grade or better. The Trust monitors the counterparty credit risk.
3. Fees and Other Transactions with Affiliates
Under the terms of an investment advisory contract, the Fund pays GI investment advisory fees calculated at an annualized rate of 0.90% of the average daily net assets.
RFS provides transfer agent and administrative services to the Fund for fees calculated at an annualized rate of 0.25% of the average daily net assets.
GI has contractually agreed to waive the management fee it receives from the Subsidiary in an amount equal to the management fee paid to GI by the Subsidiary. This undertaking will continue in effect for so long as the Fund invests in the Subsidiary, and may not be terminated by GI unless GI obtains the prior approval of the Fund’s Board of Trustees for such termination. In any event, this undertaking will continue through April 30, 2013.
RFS also provides accounting services to the Fund for fees calculated at annualized rates below, based on the average daily net assets of the Fund.
| Fund Accounting Fees | | (as a % of net assets) |
| On the first $250 million | | 0.10% |
| On the next $250 million | | 0.075% |
| On the next $250 million | | 0.05% |
| Over $750 million | | 0.03% |
RFS engages external service providers to perform other necessary services for the Trust, such as audit and accounting related services, legal services, custody, printing and mailing, etc., on a pass-through basis. Such expenses are allocated to various Funds within the complex based on relative net assets.
The Trust has adopted a Distribution Plan applicable to A-Class shares and H-Class shares for which RDL and other firms that provide distribution and/or shareholder services (“Service Providers”) may receive compensation. If a Service Provider provides distribution services, the Trust will pay distribution fees to RDL at an annual rate not to exceed 0.25% of average daily net assets, pursuant to Rule 12b-1 of the 1940 Act. RDL, in turn, will pay the Service Provider out of its fees. RDL may, at its discretion, retain a portion of such payments to compensate itself for distribution services.
The Trust has adopted a separate Distribution and Shareholder Services Plan applicable to its C-Class shares that allows the Funds to pay annual distribution and service fees of 1.00% of the Funds’ C-Class shares average daily net assets. The annual 0.25% service fee compensates the shareholder’s financial advisor for providing ongoing services to the shareholder. The annual distribution fee of 0.75% reimburses RDL for paying the shareholder’s financial advisor an ongoing sales commission. RDL advances the first year’s service and distribution fees to the financial advisor. RDL retains the service and distribution fees on accounts with no authorized dealer of record.
For the period ended June 30, 2012, RDL retained sales charges of $155,697 relating to sales of A-Class shares of the Trust.
Certain officers and trustees of the Trust are also officers of GI, RFS and RDL.
4. Fair Value Measurement
In accordance with U.S. GAAP, fair value is defined as the price that the Fund would receive to sell an investment or pay to transfer a liability in an orderly transaction with an independent buyer in the principal market, or in the absence of a principal
THE GUGGENHEIM FUNDS semi-annual REPORT | 17
NOTES TO Consolidated FINANCIAL STATEMENTS (Unaudited) (continued)
market the most advantageous market for the investment or liability. A three-tier hierarchy is utilized to distinguish between (1) inputs that reflect the assumptions market participants would use in pricing an asset or liability developed based on market data obtained from sources independent of the reporting entity (observable inputs) and (2) inputs that reflect the reporting entity’s own assumptions about the assumptions market participants would use in pricing an asset or liability developed based on the best information available in the circumstances (unobservable inputs) and to establish classification of fair value measurements for disclosure purposes. Various inputs are used in determining the value of the Fund’s investments. The inputs are summarized in the three broad levels listed below:
Level 1 — quoted prices in active markets for identical securities.
Level 2 — other significant observable inputs (including quoted prices for similar securities, interest rates, prepayment speeds, credit risk, etc.).
Level 3 — significant unobservable inputs (including the fund’s own assumptions used to determine the fair value of investments).
The inputs or methodologies used for valuing securities are not necessarily an indication of the risk associated with investing in those securities.
The following table summarizes the inputs used to value the Fund’s net assets at June 30, 2012:
| | | Level 1 | | | Level 1 | | | Level 2 | | | Level 3 | | | | |
| | | Investments | | | Other Financial | | | Investments | | | Investments | | | | |
| Fund | | In Securities | | | Instruments* | | | In Securities | | | In Securities | | | Total | |
| Assets | | | | | | | | | | | | | | | | | | | | |
| Managed Futures Strategy Fund | | $ | — | | | $ | 12,124,471 | | | $ | 1,839,742,082 | | | $ | — | | | $ | 1,851,866,553 | |
| | | | | | | | | | | | | | | | | | | | | |
| Liabilities | | | | | | | | | | | | | | | | | | | | |
| Managed Futures Strategy Fund | | $ | — | | | $ | 62,492,689 | | | $ | — | | | $ | — | | | $ | 62,492,689 | |
* Other financial instruments include futures contracts, which are reported as unrealized gain/loss at period end.
5. Repurchase Agreements
The Funds transfer uninvested cash balances into a single joint account, the daily aggregate balance of which is invested in one or more repurchase agreements collateralized by obligations of the U.S. Treasury and U.S. Government Agencies. The collateral is in the possession of the Funds’ custodian and is evaluated to ensure that its market value exceeds, at a minimum, 102% of the original face amount of the repurchase agreements. Each Fund holds a pro rata share of the collateral based on the dollar amount of the repurchase agreement entered into by each Fund.
At June 30, 2012, the collateral for the repurchase agreements in the joint account was as follows:
| Counterparty and | | | | | | | | | | | | | | |
| Terms of Agreement | | Face Value | | | Repurchase Price | | | Collateral | | Par Value | | | Fair Value | |
| HSBC Group | | | | | | | | | | U.S. Treasury Bonds | | | | | | | | |
| 0.12% | | | | | | | | | | 3.88% - 4.50% | | | | | | | | |
| Due 07/02/12 | | $ | 696,750,000 | | | $ | 696,756,968 | | | 02/15/36 - 08/15/40 | | $ | 211,564,000 | | | $ | 281,967,002 | |
| | | | | | | | | | | U.S. Treasury STRIPS | | | | | | | | |
| | | | | | | | | | | 0.00% | | | | | | | | |
| | | | | | | | | | | 08/15/14 - 08/15/16 | | | 250,000,000 | | | | 247,095,000 | |
| | | | | | | | | | | Freddie Mac Notes | | | | | | | | |
| | | | | | | | | | | 4.38% - 5.13% | | | | | | | | |
| | | | | | | | | | | 07/15/12 - 05/15/16 | | | 95,565,000 | | | | 106,069,820 | |
| | | | | | | | | | | Federal Home Loan Bank | | | | | | | | |
| | | | | | | | | | | 0.04% | | | | | | | | |
| | | | | | | | | | | 07/02/14 | | | 75,000,000 | | | | 75,553,750 | |
| Mizuho Financial Group, Inc. | | | | | | | | | | U.S. Treasury Bill | | | | | | | | |
| 0.12% | | | | | | | | | | 0.00% | | | | | | | | |
| Due 07/02/12 | | | 297,139,164 | | | | 297,142,136 | | | 11/15/14 | | | 303,689,400 | | | | 303,082,021 | |
| Credit Suisse Group | | | | | | | | | | U.S. Treasury Notes | | | | | | | | |
| 0.08% | | | | | | | | | | 2.13% - 3.13% | | | | | | | | |
| Due 07/02/12 | | | 175,010,152 | | | | 175,011,319 | | | 05/30/13 - 08/15/21 | | | 167,346,200 | | | | 178,510,439 | |
| Deutsche Bank | | | | | | | | | | U.S. Treasury Note | | | | | | | | |
| 0.10% | | | | | | | | | | 0.38% | | | | | | | | |
| Due 07/02/12 | | | 196,750,000 | | | | 196,751,640 | | | 07/17/15 | | | 200,561,000 | | | | 200,685,027 | |
18 | THE GUGGENHEIM FUNDS semi-annual REPORT
NOTES TO Consolidated FINANCIAL STATEMENTS (Unaudited) (continued)
In the event of counterparty default, the Funds have the right to collect the collateral to offset losses incurred. There is potential loss to the Funds in the event the Funds are delayed or prevented from exercising their rights to dispose of the collateral securities, including the risk of a possible decline in the value of the underlying securities during the period while the Funds seek to assert their rights. The Funds’ investment advisor, acting under the supervision of the Board of Trustees, reviews the value of the collateral and the creditworthiness of those banks and dealers with which the Funds enter into repurchase agreements to evaluate potential risks.
6. Derivative Investment Holdings Categorized by Risk Exposure
U.S. GAAP requires disclosures to enable investors to better understand how and why the Fund uses derivative instruments, how these derivative instruments are accounted for and their effects on the Fund’s financial position and results of operations.
The Fund utilized derivatives for the following purposes:
| Fund Name | | Index Exposure | | | Liquidity | |
| Managed Futures Strategy Fund | | | x | | | | x | |
The following table represents the notional amount of derivative instruments outstanding, as an approximate percentage of the Fund’s net assets on a daily basis, while the risk to the Fund is limited to the profit earned on such derivatives.
Approximate percentage of Fund’s net assets on a daily basis
| Fund | | Long | | | Short | |
| Managed Futures Strategy Fund | | | 35% | | | | 65% | |
| The following is a summary of the location of derivative investments on the Fund’s Statement of Assets and Liabilities as of June 30, 2012: |
| |
| Location on the Statement of Assets and Liabilities |
| Derivative Investment Type | | | | | | | | | | | Liability Derivatives | |
| Interest Rate/Currency/Commodity contracts | | | | | | | | Variation margin | |
| | | | | | | | | | |
| The following table sets forth the fair value of the Fund’s derivative investments categorized by primary risk exposure at June 30, 2012: |
| |
| Asset Derivative Investments Value |
| | | | Futures | | | | Futures | | | | Futures | | | | | |
| | | | Currency | | | | Interest Rate | | | | Commodity | | | | Total Value at | |
| Fund | | | Contracts* | | | | Contracts* | | | | Contracts* | | | | June 30, 2012 | |
| Managed Futures Strategy Fund | | $ | — | | | $ | 6,145,044 | | | $ | 5,979,427 | | | $ | 12,124,471 | |
| | | | | | | | | | | | | | | | | |
| Liability Derivative Investments Value |
| | | | Futures | | | | Futures | | | | Futures | | | | | |
| | | | Currency | | | | Interest Rate | | | | Commodity | | | | Total Value at | |
| Fund | | | Contracts* | | | | Contracts* | | | | Contracts* | | | | June 30, 2012 | |
| Managed Futures Strategy Fund | | $ | 13,925,019 | | | $ | — | | | $ | 48,567,670 | | | $ | 62,492,689 | |
| * | Includes cumulative appreciation (depreciation) of futures contracts as reported on the Schedule of Investments. Only current day’s variation margin is reported within the Statement of Assets and Liabilities. |
The following is a summary of the location of derivative investments on the Fund’s Statement of Operations for the period ended June 30, 2012:
| | Location on the Statement of Operations |
| Derivative Investment Type | Location of Gain (Loss) on Derivatives |
| Equity/Interest Rate/Currency/Commodity contracts | Net realized gain (loss) on futures contracts |
| | Net realized gain (loss) on options written |
| | Net change in unrealized appreciation (depreciation) on futures contracts |
THE GUGGENHEIM FUNDS semi-annual REPORT | 19
NOTES TO Consolidated FINANCIAL STATEMENTS (Unaudited) (continued)
The following is a summary of the Fund’s realized gain (loss) and change in unrealized appreciation (depreciation) on derivative investments recognized on the Statement of Operations categorized by primary risk exposure for the period ended June 30, 2012:
Realized Gain (Loss) on Derivative Investments Recognized in the Statement of Operations
| | | Futures | | | Futures | | | Futures | | | Options | | | | |
| | | Currency | | | Interest Rate | | | Commodity | | | Written | | | | |
| | | Contracts | | | Contracts | | | Contracts | | | Contracts | | | Total | |
| Managed Futures Strategy Fund | | $ | (39,559,050 | ) | | $ | (11,301,563 | ) | | $ | (84,277,146 | ) | | $ | 391,575 | | | $ | (134,746,184 | ) |
| Change in Unrealized Appreciation(Depreciation) on Derivative Investments Recognized in the Statement of Operations | |
| | | Futures | | | Futures | | | Futures | | | Options | | | | |
| | | Currency | | | Interest Rate | | | Commodity | | | Written | | | | |
| | | Contracts | | | Contracts | | | Contracts | | | Contracts | | | Total | |
| Managed Futures Strategy Fund | | $ | (22,491,662 | ) | | $ | (314,077 | ) | | $ | (49,801,868 | ) | | $ | — | | | $ | (72,607,607 | ) |
7. Call Options Written
Transactions in options written during the period ended June 30, 2012 were as follows:.
| | | Written Call Options | |
| | | Number of | | | Premiun | |
| Managed Futures Strategy Fund | | contracts | | | amount | |
| Balance at December 31, 2011 | | | — | | | $ | — | |
| Options Written | | | 1,500 | | | | 391,575 | |
| Options terminated in closing purchase transactions | | | — | | | | — | |
| Options expired | | | (1,500 | ) | | | (391,575 | ) |
| Options exercised | | | — | | | | — | |
| Balance at June 30, 2012 | | | — | | | $ | — | |
8. Federal Income Tax Information
The Fund intends to comply with the provisions of Subchapter M of the Internal Revenue Code applicable to regulated investment companies and distribute substantially all taxable net investment income and capital gains sufficient to relieve it from all, or substantially all, federal income, excise and state income taxes. Therefore, no provision for federal or state income tax is required.
Tax positions taken or expected to be taken in the course of preparing the Fund’s tax returns are evaluated to determine whether the tax positions are “more-likely-than-not” of being sustained by the applicable tax authority. Tax positions not deemed to meet the more-likely-than-not threshold would be recorded as a tax benefit or expense in the current year. Management has analyzed the Fund’s tax positions taken, or to be taken, on Federal income tax returns for all open tax years (fiscal years 2008–2011), and has concluded that no provision for income tax is required in the Fund’s financial statements.
The Fund intends to invest up to 25% of its assets in the Subsidiary which is expected to provide the Fund with exposure to the commodities markets within the limitations of the federal tax requirements under Subchapter M of the Internal Revenue Code. The Fund has received a private letter ruling from the IRS that concludes that the income the Fund receives from the Subsidiary will constitute qualifying income for purposes of Subchapter M of the Internal Revenue Code. The Subsidiary will be classified as a corporation for U.S. federal income tax purposes. A foreign corporation, such as the Subsidiary, will generally not be subject to U.S. federal income taxation unless it is deemed to be engaged in a U.S. trade or business.
The RIC Modernization Act of 2010 was signed into law on December 22, 2010 and seeks to simplify some of the tax provisions applicable to regulated investment companies and the tax reporting to their shareholders, and to improve the tax efficiency of certain fund structures. The changes are generally effective for taxable years beginning after the date of enactment.
One of the more prominent changes addresses capital loss carry forwards. The Fund will be permitted to carry forward capital losses incurred in taxable years beginning after December 22, 2010 for an unlimited period. However, any losses incurred during those future taxable years will be required to be utilized prior to the losses incurred in pre-enactment taxable years. Under pre-enactment law, capital losses could be
20 | THE GUGGENHEIM FUNDS semi-annual REPORT
NOTES TO Consolidated FINANCIAL STATEMENTS (Unaudited) (continued)
carried forward for eight years, and carried forward as short-term capital, irrespective of the character of the original loss. As a result of this ordering rule, pre-enactment capital loss carry forwards may potentially expire unused. Additionally, post-enactment capital losses that are carried forward will retain their character as either short-term or long-term capital losses rather than being considered all short-term as under previous law.
At June 30, 2012, the cost of securities for Federal income tax purposes, the aggregate gross unrealized gain for all securities for which there was an excess of value over tax cost and the aggregate gross unrealized loss for all securities for which there was an excess of tax cost over value, were as follows:
| | | | | | Tax | | | Tax | | | Net | |
| | | Tax | | | Unrealized | | | Unrealized | | | Unrealized | |
| Fund Name | | Cost | | | Gain | | | Loss | | | Gain | |
| Managed Futures Strategy Fund | | $ | 1,839,697,157 | | | $ | 169,216 | | | $ | (124,291 | ) | | $ | 44,925 | |
9. Securities Transactions
For the period ended June 30, 2012, the cost of purchases and proceeds from sales of investment securities, excluding government securities and short-term investments, were:
| Fund | | Purchases | | | Sales | |
| Managed Futures Strategy Fund | | $ | 25,000,000 | | | $ | 50,000,000 | |
10. Line of Credit
The Trust, along with other affiliated trusts, has secured an uncommitted, $75,000,000 line of credit with U.S. Bank, N.A. for emergency or temporary purposes. Borrowings, if any, under this arrangement bear interest equal to the Prime Rate, minus 2%, which shall be paid monthly. For the period ended June 30, 2013, the trusts covered under this agreement borrowed an average of $8,800,000 per day, at an average rate of 1.25%. The Fund did not have any borrowings under this agreement at June 30, 2012 and did not participate in borrowing during the period.
11. Legal Proceedings
Tribune Company
Rydex Series Funds has been named as a defendant and a putative member of the proposed defendant class of shareholders in the case entitled Official Committee of Unsecured Creditors of Tribune Co. v. FitzSimons (In re Tribune Co.), Adv. Pro. No. 10-54010 (Bankr. D. Del.), as a result of ownership of shares in the Tribune Company (“Tribune”) in 2007 by certain series of the Rydex Series Funds when Tribune effected a leveraged buyout transaction (“LBO”) by which Tribune converted to a privately-held company. In its complaint, the Unsecured Creditors Committee (the “UCC”) has alleged that, in connection with the LBO, insiders and major shareholders were overpaid for their Tribune stock using financing that the insiders knew would, and ultimately did, leave the Tribune insolvent. The UCC has asserted claims against certain insiders, major shareholders, professional advisers, and others involved in the LBO, and is attempting to obtain from shareholders, including Rydex Series Funds, the proceeds paid out in connection with the LBO. This adversary proceeding has been consolidated in a multidistrict litigation proceeding captioned In re Tribune Company Fraudulent Conveyance Litig., No. 11-md-2696 (S.D.N.Y.), and has been stayed pending further order of that court.
In June 2011, a group of Tribune creditors, not including the UCC, filed multiple actions involving state law constructive fraudulent conveyance claims against former Tribune shareholders. Rydex Series Funds also has been named as a defendant in one or more of these suits. Like the adversary proceeding described above, these cases have been consolidated in the multidistrict litigation proceeding in the United States District Court for the Southern District of New York and have been stayed pending further order of that court.
None of these lawsuits allege any wrongdoing on the part of Rydex Series Funds. The following series of Rydex Series Funds held shares of Tribune and tendered these shares as part of Tribune’s LBO: Nova Fund, S&P 500 Pure Value Fund, Multi-Cap Core Equity Fund, S&P 500 Fund, Multi-Hedge Strategies Fund and Hedged Equity Fund (the “Funds”). The value of the proceeds received by the foregoing Funds
THE GUGGENHEIM FUNDS semi-annual REPORT | 21
NOTES TO consolidated FINANCIAL STATEMENTS (Unaudited) (concluded)
was $28,220, $109,242, $9,860, $3,400, $1,181,160, and $10,880, respectively. At this stage of the proceedings, Rydex Series Funds is not able to make a reliable predication as to the outcome of these lawsuits or the effect, if any, on a Fund’s net asset value.
Lyondell Chemical Company
In December 2011, Rydex Series Funds was named as a defendant in Weisfelner, as Trustee of the LB Creditor Trust, v. Fund 1 (In re Lyondell Chemical Co.), Adv. Pro. No. 10-4609 (Bankr. S.D.N.Y.).
Similar to the claims made in the Tribune matter, the Weisfelner complaint seeks to have set aside and recovered as fraudulent transfers from former Lyondell Chemical Company (“Lyondell”) shareholders the consideration paid to them pursuant to the cash out merger of Lyondell shareholders in connection with the combination of Lyondell and Basell AF in 2007. Lyondell filed for bankruptcy in 2008.
A motion to dismiss is currently pending before the Bankruptcy Court.
This lawsuit does not allege any wrongdoing on the part of Rydex Series Funds. The following series of Rydex Series Funds received cash proceeds from the cash out merger in the following amounts: Basic Materials Fund - $ 1,725,168; U.S. Long Short Momentum Fund - $2,193,600; Global 130/30 Strategy Fund - $37,920; Hedged Equity Fund - $1,440; and Multi-Hedge Strategies Fund - $1,116,480. At this stage of the proceedings, Rydex Series Funds is not able to make a reliable predication as to the outcome of these lawsuits or the effect, if any, on a Fund’s net asset value.
22 | THE GUGGENHEIM FUNDS semi-annual REPORT
OTHER INFORMATION (Unaudited)
Proxy Voting Information
A description of the policies and procedures that the Trust uses to determine how to vote proxies relating to securities held in the Fund’s portfolios is available, without charge and upon request, by calling 1.800.820.0888. This information is also available from the EDGAR database on the SEC’s website at http://www.sec.gov.
Information regarding how the Fund voted proxies relating to portfolio securities during the most recent 12-month period ended June 30 is available without charge, upon request, by calling 1.800.820.0888. This information is also available from the EDGAR database on the SEC’s website at http://www.sec.gov.
Quarterly Portfolio Schedules Information
The Trust files its complete schedule of portfolio holdings with the SEC for the first and third quarters of each fiscal year on Form N-Q; which are available on the SEC’s website at http://www.sec.gov. The Fund’s Forms N-Q may be reviewed and copied at the SEC’s Public Reference Room in Washington, DC, and that information on the operation of the Public Reference Room may be obtained by calling 1-800-SEC-0330. Copies of the portfolio holdings are also available to shareholders, without charge and upon request, by calling 1.800.820.0888.
Office Locations
The offices of Guggenheim Investments can be found in the following locations:
40 East 52nd Street
16th Floor
New York, NY 10022
(Headquarters)
Four Irvington Centre
805 King Farm Boulevard
Suite 600
Rockville, MD 20850
9401 Indian Creek Parkway
40 Corporate Woods
Suite 850
Overland Park, KS 66210
THE GUGGENHEIM FUNDS semi-annual REPORT | 23
INFORMATION ON BOARD OF TRUSTEES AND OFFICERS (Unaudited)
A Board of Trustees oversees the Trust, as well as other trusts of GI, in which its members have no stated term of service, and continue to serve after election until resignation. The Statement of Additional Information includes further information about Fund Trustees and Officers, and can be obtained without charge by calling 800.820.0888.
All Trustees and Officers may be reached c/o Guggenheim Investments, 805 King Farm Boulevard, Suite 600, Rockville, MD 20850.
| | Length of Service | | |
| Name and | | as Trustee | | Number of |
| Year of Birth | | (Year Began) | | Funds Overseen |
| Donald C. Cacciapaglia* | | Rydex Series Funds – 2012 | | 149 |
| (1951) | | Rydex Variable Trust – 2012 | | |
| | Rydex Dynamic Funds – 2012 | | |
| | Rydex ETF Trust – 2012 | | |
Principal Occupations During Past Five Years: Current: Security Investors, LLC: President and CEO from April 2012 to present; Guggenheim Investments: President and Chief Administrative Officer from February 2010 to present; Previous: Channel Capital Group, Inc.: Chairman and CEO from April 2002 to February 2010
Positions held within the Trust: Trustee from 2012 to present; President from 2012 to present
| INDEPENDENT TRUSTEES | | | | |
| | | Length of Service | | |
| Name and | | as Trustee | | Number of |
| Year of Birth | | (Year Began) | | Funds Overseen |
| Corey A. Colehour | | Rydex Series Funds – 1993 | | 149 |
| (1945) | | Rydex Variable Trust – 1998 | | |
| | | Rydex Dynamic Funds – 1999 | | |
| | | Rydex ETF Trust – 2003 | | |
Principal Occupations During Past Five Years: Current: Retired; Previous: President and Senior Vice President of Schield Management Company (registered investment adviser) from 2003 to 2006
Positions held within the Trust: Trustee from 2003 to present; Member of the Audit Committee from 2003 to present; and Member of the Governance and Nominating Committees from 2005 to present
| J. Kenneth Dalton | | Rydex Series Funds – 1995 | | 149 |
| (1941) | | Rydex Variable Trust – 1998 | | |
| | | Rydex Dynamic Funds – 1999 | | |
| | | Rydex ETF Trust – 2003 | | |
Principal Occupations During Past Five Years: Current: Retired
Positions held within the Trust: Trustee from 2003 to present; Member and Chairman of the Audit Committee from 2003 to present; Member of the Governance and Nominating Committees from 2005 to present; and Member of the Risk Oversight Committee from 2010 to present
| John O. Demaret | | Rydex Series Funds – 1997 | | 149 |
| (1940) | | Rydex Variable Trust – 1998 | | |
| | | Rydex Dynamic Funds – 1999 | | |
| | | Rydex ETF Trust – 2003 | | |
Principal Occupations During Past Five Years: Current: Retired
Positions held within the Trust: Trustee from 2003 to present; Chairman of the Board from 2006 to present; Member of the Audit Committee from 2003 to present; and Member of the Risk Oversight Committee from 2010 to present
24 | THE GUGGENHEIM FUNDS semi-annual REPORT
INFORMATION ON BOARD OF TRUSTEES AND OFFICERS (Unaudited) (continued)
| INDEPENDENT TRUSTEES – concluded | | | | |
| | | Length of Service | | |
| Name and | | as Trustee | | Number of |
| Year of Birth | | (Year Began) | | Funds Overseen |
| Werner E. Keller | | Rydex Series Funds – 2005 | | 149 |
| (1940) | | Rydex Variable Trust – 2005 | | |
| | | Rydex Dynamic Funds – 2005 | | |
| | | Rydex ETF Trust – 2005 | | |
Principal Occupations During Past Five Years: Current: Founder and President of Keller Partners, LLC (investment research firm) from 2005 to present; Previous: Retired from 2001 to 2005
Positions held within the Trust: Vice Chairman of the Board of Trustees from 2010 to present; Trustee and Member of the Audit, Governance and Nominating Committees from 2005 to present; and Chairman and Member of the Risk Oversight Committee from 2010 to present
| Thomas F. Lydon, Jr. | | Rydex Series Funds – 2005 | | 149 |
| (1960) | | Rydex Variable Trust – 2005 | | |
| | | Rydex Dynamic Funds – 2005 | | |
| | | Rydex ETF Trust – 2005 | | |
Principal Occupations During Past Five Years: Current: President of Global Trends Investments (registered investment adviser) from 1996 to present
Positions held within the Trust: Trustee and Member of the Audit, Governance and Nominating Committees from 2005 to present
| Patrick T. McCarville | | Rydex Series Funds – 1997 | | 149 |
| (1942) | | Rydex Variable Trust – 1998 | | |
| | | Rydex Dynamic Funds – 1999 | | |
| | | Rydex ETF Trust – 2003 | | |
Principal Occupations During Past Five Years: Current: Retired; Previous: Chief Executive Officer of Par Industries, Inc., d/b/a Par Leasing from 1977 to 2010
Positions held within the Trust: Trustee from 2003 to present; Member of the Audit Committee from 2003 to present; and Chairman of the Governance and Nominating Committees from 2005 to present
| Roger Somers | | Rydex Series Funds – 1993 | | 149 |
| (1944) | | Rydex Variable Trust – 1998 | | |
| | | Rydex Dynamic Funds – 1999 | | |
| | | Rydex ETF Trust – 2003 | | |
Principal Occupations During Past Five Years: Current: Founder and Chief Executive Officer of Arrow Limousine from 1965 to present
Positions held within the Trust: Trustee from 2003 to present; Member of the Audit Committee from 2003 to present; and Member of the Governance and Nominating Committees from 2005 to present
THE GUGGENHEIM FUNDS semi-annual REPORT | 25
INFORMATION ON BOARD OF TRUSTEES AND OFFICERS (Unaudited) (concluded)
EXECUTIVE OFFICERS
| Name, Position and | | Principal Occupations |
| Year of Birth | | During Past Five Years |
Michael P. Byrum* Vice President (1970) | | Current: President, Security Benefit Asset Management Holdings, LLC; Senior Vice President, Security Investors, LLC; President & Chief Investment Officer, Rydex Holdings, LLC; Director & Chairman of the Board, Advisor Research Center, Inc.; and Manager, Rydex Specialized Products, LLC Previous: Rydex Distributors, LLC (f/k/a Rydex Distributors, Inc.), Vice President (2009); Rydex Fund Services, LLC, Director (2009–2010), Secretary (2002–2010), Executive Vice President (2002–2006); Rydex Advisors, LLC (f/k/a PADCO Advisors, Inc.), Director (2008–2010), Chief Investment Officer (2006–2010), President (2004–2010), Secretary (2002–2010); Rydex Advisors II, LLC (f/k/a PADCO Advisors II, Inc.), Director (2008–2010), Chief Investment Officer (2006–2010), President (2004–2010), Secretary (2002–2010); Rydex Capital Partners, LLC, President & Secretary (2003–2007); Rydex Capital Partners II, LLC, (2003–2007); Rydex Holdings, LLC (f/k/a Rydex Holdings, Inc.), Secretary (2005–2008), Executive Vice President (2005–2006); Advisor Research Center, Inc., Secretary (2006–2009), Executive Vice President (2006); and Rydex Specialized Products, LLC, Secretary (2005–2008) |
| | | |
| Nikolaos Bonos* | | Current: Senior Vice President, Security Investors, LLC; Chief Executive Officer & Manager, Rydex Specialized Products, LLC; Chief Executive Officer & President, Rydex Fund Services, LLC; Vice President, Rydex Holdings, LLC; Treasurer, SBL Fund; Security Equity Fund; Security Income Fund; Security Large Cap Value Fund & Security Mid Cap Growth Fund; and Vice President, Security Benefit Asset Management Holdings, LLC |
| Vice President and Treasurer (1963) |
| |
| | | |
| | Previous: Security Global Investors, LLC, Senior Vice President (2010–2011); Rydex Advisors, LLC (f/k/a PADCO Advisors, Inc.) Senior Vice President (2006–2011); Rydex Fund Services, LLC (f/k/a Rydex Fund Services, Inc.), Director (2009) & Senior Vice President (2003–2006); and Rydex Specialized Products, LLC, Chief Financial Officer (2005–2009) |
Elisabeth Miller*
Chief Compliance Officer (1968) | Current: Chief Compliance Officer, Rydex Series Funds, Rydex Dynamic Funds, Rydex Variable Trust, Rydex ETF Trust, Security Equity Fund, Security Income Fund, Security Large Cap Value Fund, Security Mid Cap Growth Fund, SBL Fund, Security Investors, LLC, and Rydex Distributors, LLC |
| | |
| | | |
| | | Previous: Senior Manager, Security Investors, LLC and Rydex Distributors, LLC (2004–2009) |
Amy J. Lee*
Vice President and
Assistant Secretary (1961) | | Current: Senior Vice President & Secretary, Security Investors, LLC; Secretary & Chief Compliance Officer, Security Distributors, Inc.; Vice President, Associate General Counsel ? Assistant Secretary, Security Benefit Life Insurance Company and Security Benefit Corporation; Associate General Counsel, First Security Benefit Life Insurance and Annuity of New York; Vice President ? Secretary, SBL Fund; Security Equity Fund; Security Income Fund; Security Large Cap Value Fund ? Security Mid Cap Growth Fund; Vice President ? Secretary, Rydex Holdings, LLC Secretary, Advisor Research Center, Inc., Rydex Specialized Products, LLC, Rydex Distributors, LLC and Rydex Fund Services, LLC; and Assistant Secretary, Security Benefit Clinic and Hospital |
| |
| | |
| | Previous: Security Global Investors, LLC, Senior Vice President & Secretary (2007-2011); Rydex Advisors, LLC (f/k/a PADCO Advisors, Inc.) & Rydex Advisors II, LLC (f/k/a PADCO Advisors II, Inc.), Senior Vice President & Secretary (2010-2011); and Brecek & Young Advisors, Inc., Director (2004-2008) |
| | |
Joseph M. Arruda*
Assistant Treasurer (1966) | Current: Assistant Treasurer, SBL Fund; Security Equity Fund; Security Income Fund; Security Large Cap Value Fund & Security Mid Cap Growth Fund; Vice President, Security Investors, LLC; and Chief Financial Officer & Manager, Rydex Specialized Products, LLC |
| | |
| | Previous: Security Global Investors, LLC, Vice President (2010-2011); and Rydex Advisors, LLC (f/k/a PADCO Advisors, Inc.) & Rydex Advisors II, LLC (f/k/a PADCO Advisors II, Inc.), Vice President (2004-2011) |
| * | Officers of the Funds are deemed to be “interested persons” of the Trust, within the meaning of Section 2(a)(19) of the 1940 Act, inasmuch as this person is affiliated with Guggenheim Investments. |
26 | THE GUGGENHEIM FUNDS semi-annual REPORT
guggenheim investments PRIVACY POLICIES
Rydex Funds, Guggenheim Funds, Rydex Investments, Rydex Distributors, Inc., Security Investors, LLC, Security Distributors, Inc. and Rydex Advisory Services (Collectively “Guggenheim Investments”)
Our Commitment to You
When you become a Guggenheim Investments investor, you entrust us with not only your hard-earned money but also with personal and financial information about you. We recognize that your relationship with us is based on trust and that you expect us to act responsibly and in your best interests. Because we have access to this private information about you, we hold ourselves to the highest standards in its safekeeping and use. This means, most importantly, that we do not sell client information to anyone—whether it is your personal information or if you are a current or former Guggenheim Investments client.
The Information We Collect About You
In the course of doing business with shareholders and investors, we collect nonpublic personal information about you. You typically provide personal information when you complete a Guggenheim Investments account application or when you request a transaction that involves Rydex and Guggenheim Investments funds or one of the Guggenheim Investments affiliated companies. “Nonpublic personal information” is personally identifiable private information about you. For example, it includes information regarding your name and address, Social Security or taxpayer identification number, assets, income, account balance, bank account information and investment activity (e.g., purchase and redemption history).
How We Handle Your Personal Information
As emphasized above, we do not sell information about current or former clients or their accounts to third parties. Nor do we share such information, except when necessary to complete transactions at your request or to make you aware of related investment products and services that we offer. Additional details about how we handle your personal information are provided below. To complete certain transactions or account changes that you direct, it may be necessary to provide identifying information to companies, individuals or groups that are not affiliated with Guggenheim Investments. For example, if you ask to transfer assets from another financial institution to Guggenheim Investments, we will need to provide certain information about you to that company to complete the transaction. To alert you to other Guggenheim Investments investment products and services, we may share your information within the Guggenheim Investments family of affiliated companies. This would include, for example, sharing your information within Guggenheim Investments so we can make you aware of new Rydex and Guggenheim Investments funds or the services offered through another Guggenheim Investments affiliated company. In certain instances, we may contract with nonaffiliated companies to perform services for us. Where necessary, we will disclose information we have about you to these third parties. In all such cases, we provide the third party with only the information necessary to carry out its assigned responsibilities and only for that purpose. And we require these third parties to treat your private information with the same high degree of confidentiality that we do. In certain instances, we may share information with other financial institutions regarding individuals and entities in response to the U.S.A. Patriot Act. Finally, we will release information about you if you direct us to do so, if we are compelled by law to do so or in other circumstances permitted by law.
Opt Out Provisions
We do not sell your personal information to anyone. The law allows you to “opt out” of only certain kinds of information sharing with third parties. The firm does not share personal information about you with any third parties that triggers this opt-out right. This means YOU ARE ALREADY OPTED OUT.
How We Protect Privacy Online
Our concern for the privacy of our shareholders also extends to those who use our web site, www.rydex-sgi.com. Our web site uses some of the most secure forms of online communication available, including encryption technology, Secure Socket Layer (SSL) protocol, firewalls and user names and passwords. These technologies provide a high level of security and privacy when you access your account information or initiate online transactions. The Guggenheim Investments web site offers customized features that require our use of “http cookies”—tiny pieces of information that we ask your browser to store. However, we make very limited use of these cookies. We only use cookies for session management and security features on the Guggenheim Investments web site. We do not use them to pull data from your hard drive, to learn your email address, or to view data in cookies created by other web sites. We will not share the information in our cookies or give others access to it. See the legal information area on our web site for more details about web site security and privacy features.
THE GUGGENHEIM FUNDS semi-annual REPORT | 27
guggenheim investments PRIVACY POLICIES (concluded)
How We Safeguard Your Personal Information
We restrict access to nonpublic personal information about shareholders to our employees and in some cases to third parties (for example, the service providers described above) as permitted by law. We maintain strict physical, electronic and procedural safeguards that comply with federal standards to guard your nonpublic personal information.
We’ll Keep You Informed
As required by federal law, we will notify shareholders of our privacy policy annually. We reserve the right to modify this policy at any time, but rest assured that if we do change it, we will tell you promptly. You will also be able to access our privacy policy from our web site at www.rydex-sgi.com. Should you have any questions regarding our privacy policy, contact us at 800.820.0888 or 301.296.5100.
28 | THE GUGGENHEIM FUNDS semi-annual REPORT

FOUR IRVINGTON CENTRE
805 King Farm Boulevard, Suite 600
Rockville, MD 20850
www.rydex-sgi.com
800 820 0888
RMFSF–SEMI–0612x1212
GUGGENHEIM ALTERNATIVE INVESTMENT FUNDS
GUGGENHEIM LONG/SHORT COMMODITIES STRATEGY FUND
GUGGENHEIM GLOBAL MANAGED FUTURES STRATEGY FUND
GUGGENHEIM MULTI-HEDGE STRATEGIES FUND
RYDEX SPECIALTY FUND
RYDEX COMMODITIES STRATEGY FUND
GO GREEN!
ELIMINATE MAILBOX CLUTTER
Go paperless with Guggenheim Investments eDelivery—a service giving you full online access to account information and documents. Save time, cut down on mailbox clutter and be a friend to the environment with eDelivery.
With Guggenheim Investments eDelivery you can:
| · | View online confirmations and statements at your convenience. |
| | | |
| · | Receive email notifications when your most recent confirmations, statements and other account documents are available for review. |
| | | |
| · | Access prospectuses, annual reports and semiannual reports online. |
If you have questions about Guggenheim Investments
eDelivery services, contact one of our Shareholder Service
Representatives at 800.820.0888.
This report and the financial statements contained herein are submitted for the general information of our shareholders. The report is not authorized for distribution to prospective investors unless preceded or accompanied by an effective prospectus.
Distributed by Rydex Distributors, LLC.
TABLE OF CONTENTS
THE GUGGENHEIM FUNDS SEMI-ANNUAL REPORT | 1
LETTER TO OUR SHAREHOLDERS
To Our Shareholders:
Uncertainty continued to affect securities markets over the six months ended June 30, 2012. The U.S. equity market had strong performance for the period, combining a stellar first quarter with a weak second period, when concern grew about sovereign debt in several European nations, a fledgling U.S. economic recovery and the sustainability of economic growth in Asia. Fixed-income securities, including riskier bonds, also generally provided positive returns over the six-month period, although risk aversion in late spring drove investors into dollar-denominated assets, sending rates on U.S. Treasury bonds to near historic lows.
Weak economic reports in May 2012 indicated that the world’s major economies were beginning to slip in unison, and both the Organization for Economic Cooperation and Development and the International Monetary Fund forecast lower global growth for 2012. This was in spite of recent efforts from leading central bankers to recharge the global economy, including a restructuring of Greece’s debt that enabled a new international bailout earlier in 2012, and an injection of liquidity from the European Central Bank in December that lessened financial stresses across the continent and contributed to improvement in global financial markets in early 2012. However, manufacturing gauges in late spring 2012 indicated that the eurozone was entering a period of economic contraction, meaning that policy makers may need to do more to revive growth across the region and keep the problem from infecting other countries.
Although the U.S. was in better shape than many countries, slowing growth and job creation late in the period indicated the economy is having difficulty gaining traction. U.S. gross domestic product (“GDP”) was reported to have grown at an annualized 1.9% pace in the first quarter of 2012, compared with a 3.0% rate in the fourth quarter of 2011. Companies continue to be cautious in spending and hiring, even though corporate profits have continued to rise, although at a pace lower than in recent quarters. This is translating into weak income growth for consumers, leading them to keep their spending in check and eroding sentiment.
To foster growth, the U.S. Federal Reserve (the “Fed”) has said it will leave its key interest rate close to zero at least through 2014, despite arguments by some Fed officials and investors that the Fed may have to consider raising rates much earlier than that to prevent inflation. For now, the Fed’s leadership appears to be committed to keeping rates low, thus reducing borrowing costs for businesses and consumers, and seems prepared to sustain quantitative easing if the employment and growth picture worsens. The Fed did extend until January its operation twist, a bond-exchange program designed to lower long-term interest rates.
For the six-month period ended June 30, 2012, the Standard & Poor’s 500® Index* (“S&P”), which is generally regarded as an indicator of the broad U.S. stock market, returned 9.49%. Foreign markets were weaker, but positive: the Morgan Stanley Capital International (“MSCI”) Europe-Australasia-Far East Index* (“EAFE”), which is composed of approximately 1,100 companies in 20 developed countries in Europe and the Pacific Basin, returned 2.96%. The return of the MSCI Emerging Markets Index*, which measures market performance in global emerging markets, was 3.93%.
2 | THE GUGGENHEIM FUNDS SEMI-ANNUAL REPORT
LETTER TO OUR SHAREHOLDERS (concluded)
In the bond market, lower-rated bonds outperformed higher quality issues, as investors sought yield. The return of the Barclays U.S. Aggregate Bond Index*, which is a proxy for the U.S. investment grade bond market, posted a 2.37% return for the period, while the Barclays U.S. Corporate High Yield Index* returned 7.27%. Reflecting the Fed’s continuing accommodative monetary policy, interest rates on short-term securities remained at their lowest levels in many years; the return of the Barclays 1–3 Month U.S. Treasury Bill Index* was 0.04% for the six-month period.
We look forward to continuing our service to you. Thank you for investing in our funds.
Sincerely,

Donald C. Cacciapaglia
President
*Indices are defined as follows:
The Standard & Poor’s 500 Index is a capitalization-weighted index of 500 stocks designed to measure the performance of the broad economy, representing all major industries and is considered a representation of U.S. stock market.
The MSCI EAFE Index is a capitalization weighted measure of stock markets in Europe, Australasia and the Far East.
The MSCI Emerging Markets Index is a free float-adjusted market capitalization weighted index that is designed to measure equity market performance in the global emerging markets.
The Barclays U.S. Aggregate Bond Index is a broad-based benchmark that measures the investment grade, U.S. dollar denominated, fixed-rate taxable bond market, including Treasuries, government-related and corporate securities, MBS (agency fixed-rate and hybrid ARM pass-throughs), ABS, and CMBS.
The Barclays U.S. Corporate High Yield Index measures the market of USD-denominated, non-investment grade, fixed-rate, taxable corporate bonds.
The Barclays 1–3 Month U.S. Treasury Bill Index tracks the performance of U.S. Treasury bills with a remaining maturity of one to three months. U.S. Treasury bills, which are short-term loans to the U.S. government, are full-faith-and-credit obligations of the U.S. Treasury and are generally regarded as being free of any risk of default.
Performance displayed represents past performance which is no guarantee of future results. Of course, fund performance is subject to daily market volatility and may be better or worse since the end of the last quarter. For up-to-date fund performance, call us at 800.820.0888 or visit www.rydex-sgi.com.
Read each fund’s prospectus and summary prospectus (if available) carefully before investing. It contains the fund’s investment objectives, risks, charges, expenses and other information, which should be considered carefully before investing. Obtain a prospectus and summary prospectus (if available) at www.rydex-sgi.com or call 800.820.0888.
The referenced funds are distributed by Rydex Distributors, LLC. Guggenheim Investments represents the investment management businesses of Guggenheim Partners, LLC (“GP”), which includes Security Investors, LLC (“SI”), the investment adviser to the referenced funds. Rydex Distributors, LLC, is affiliated with GP and SI.
THE GUGGENHEIM FUNDS SEMI-ANNUAL REPORT | 3
about shareholders’ fund EXPENSES (Unaudited)
All mutual funds have operating expenses and it is important for our shareholders to understand the impact of costs on their investments. Shareholders of a Fund incur two types of costs: (i) transaction costs, including sales charges (loads) on purchase payments, reinvested dividends, or other distributions; and exchange fees; and (ii) ongoing costs, including management fees, administrative services, and shareholder reports, among others. These ongoing costs, or operating expenses, are deducted from a fund’s gross income and reduce the investment return of the fund.
A fund’s expenses are expressed as a percentage of its average net assets, which is known as the expense ratio. The following examples are intended to help investors understand the ongoing costs (in dollars) of investing in a Fund and to compare these costs with the ongoing costs of investing in other mutual funds.
The examples are based on an investment of $1,000 made at the beginning of the period and held for the entire six-month period beginning December 31, 2011 and ending June 30, 2012.
The following tables illustrate a Fund’s costs in two ways:
Table 1. Based on actual Fund return. This section helps investors estimate the actual expenses paid over the period. The “Ending Account Value” shown is derived from the Fund’s actual return, and the fourth column shows the dollar amount that would have been paid by an investor who started with $1,000 in the Fund. Investors may use the information here, together with the amount invested, to estimate the expenses paid over the period. Simply divide the Fund’s account value by $1,000 (for example, an $8,600 account value divided by $1,000 = 8.6), then multiply the result by the number provided under the heading “Expenses Paid During Period.”
Table 2. Based on hypothetical 5% return. This section is intended to help investors compare a Fund’s cost with those of other mutual funds. The table provides information about hypothetical account values and hypothetical expenses based on the Fund’s actual expense ratio and an assumed rate of return of 5% per year before expenses, which is not the Fund’s actual return. The hypothetical account values and expenses may not be used to estimate the actual ending account balance or expenses paid during the period. The example is useful in making comparisons because the U.S. Securities and Exchange Commission (the “SEC”) requires all mutual funds to calculate expenses based on the 5% return. Investors can assess a Fund’s costs by comparing this hypothetical example with the hypothetical examples that appear in shareholder reports of other funds.
The calculations illustrated above assume no shares were bought or sold during the period. Actual costs may have been higher or lower, depending on the amount of investment and the timing of any purchases or redemptions.
Please note that the expenses shown in the table are meant to highlight your ongoing costs only and do not reflect any transactional costs, such as sales charges (loads) on purchase payments, and contingent deferred sales charges (“CDSC”) on redemptions, if any. Therefore, the second table is useful in comparing ongoing costs only, and will not help you determine the relative total costs of owning different funds. In addition, if these transactional costs were included, your costs would have been higher.
More information about a Fund’s expenses, including annual expense ratios for the past five years, can be found in the Financial Highlights section of this report. For additional information on operating expenses and other shareholder costs, please refer to the appropriate Fund prospectus.
4 | THE GUGGENHEIM FUNDS SEMI-ANNUAL REPORT
about shareholders’ fund EXPENSES (Unaudited) (concluded)
| | | | | | | | | Beginning | | | Ending | | | Expenses | |
| | | Expense | | | Fund | | | Account Value | | | Account Value | | | Paid During | |
| | | ratio1 | | | Return | | | December 31, 2011 | | | June 30, 2012 | | | Period2 | |
| Table 1. Based on actual Fund return3 | | | | | | | | | | | | | | | | | | | | |
| Long/Short Commodities Strategy Fund | | | | | | | | | | | | | | | | | | | | |
| A-Class | | | 1.87 | % | | | (3.04 | %) | | $ | 1,000.00 | | | $ | 969.60 | | | $ | 9.16 | |
| C-Class | | | 2.62 | % | | | (3.40 | %) | | | 1,000.00 | | | | 966.00 | | | | 12.81 | |
| H-Class | | | 1.87 | % | | | (3.00 | %) | | | 1,000.00 | | | | 970.00 | | | | 9.16 | |
| Institutional Class | | | 1.62 | % | | | (2.90 | %) | | | 1,000.00 | | | | 971.00 | | | | 7.94 | |
| Y-Class | | | 1.57 | % | | | (2.90 | %) | | | 1,000.00 | | | | 971.00 | | | | 7.69 | |
| Global Managed Futures Strategy Fund4 | | | | | | | | | | | | | | | | | | | | |
| Institutional Class | | | 1.26 | % | | | (2.16 | %) | | | 1,000.00 | | | | 978.40 | | | | 1.74 | |
| Multi-Hedge Strategies Fund | | | | | | | | | | | | | | | | | | | | |
| A-Class | | | 2.86 | % | | | 0.67 | % | | | 1,000.00 | | | | 1,006.70 | | | | 14.27 | |
| C-Class | | | 3.63 | % | | | 0.28 | % | | | 1,000.00 | | | | 1,002.80 | | | | 18.08 | |
| H-Class | | | 2.89 | % | | | 0.67 | % | | | 1,000.00 | | | | 1,006.70 | | | | 14.42 | |
| Institutional Class | | | 3.01 | % | | | 0.85 | % | | | 1,000.00 | | | | 1,008.50 | | | | 15.03 | |
| Commodities Strategy Fund | | | | | | | | | | | | | | | | | | | | |
| A-Class | | | 1.47 | % | | | (8.04 | %) | | | 1,000.00 | | | | 919.60 | | | | 7.02 | |
| C-Class | | | 2.22 | % | | | (8.41 | %) | | | 1,000.00 | | | | 915.90 | | | | 10.58 | |
| H-Class | | | 1.47 | % | | | (8.04 | %) | | | 1,000.00 | | | | 919.60 | | | | 7.02 | |
| | | | | | | | | | | | | | | | | | | | | |
| Table 2. Based on hypothetical 5% return (before expenses) | | | | | | | | | | | | | | | | | | | | |
| Long/Short Commodities Strategy Fund | | | | | | | | | | | | | | | | | | | | |
| A-Class | | | 1.87 | % | | | 5.00 | % | | $ | 1,000.00 | | | $ | 1,015.56 | | | $ | 9.37 | |
| C-Class | | | 2.62 | % | | | 5.00 | % | | | 1,000.00 | | | | 1,011.83 | | | | 13.11 | |
| H-Class | | | 1.87 | % | | | 5.00 | % | | | 1,000.00 | | | | 1,015.56 | | | | 9.37 | |
| Institutional Class | | | 1.62 | % | | | 5.00 | % | | | 1,000.00 | | | | 1,016.81 | | | | 8.12 | |
| Y-Class | | | 1.57 | % | | | 5.00 | % | | | 1,000.00 | | | | 1,017.06 | | | | 7.87 | |
| Global Managed Futures Strategy Fund4 | | | | | | | | | | | | | | | | | | | | |
| Institutional Class | | | 1.26 | % | | | 5.00 | % | | | 1,000.00 | | | | 1,018.60 | | | | 6.32 | |
| Multi-Hedge Strategies Fund | | | | | | | | | | | | | | | | | | | | |
| A-Class | | | 2.86 | % | | | 5.00 | % | | | 1,000.00 | | | | 1,010.64 | | | | 14.30 | |
| C-Class | | | 3.63 | % | | | 5.00 | % | | | 1,000.00 | | | | 1,006.81 | | | | 18.11 | |
| H-Class | | | 2.89 | % | | | 5.00 | % | | | 1,000.00 | | | | 1,010.49 | | | | 14.45 | |
| Institutional Class | | | 3.01 | % | | | 5.00 | % | | | 1,000.00 | | | | 1,009.90 | | | | 15.04 | |
| Commodities Strategy Fund | | | | | | | | | | | | | | | | | | | | |
| A-Class | | | 1.47 | % | | | 5.00 | % | | | 1,000.00 | | | | 1,017.55 | | | | 7.37 | |
| C-Class | | | 2.22 | % | | | 5.00 | % | | | 1,000.00 | | | | 1,013.82 | | | | 11.12 | |
| H-Class | | | 1.47 | % | | | 5.00 | % | | | 1,000.00 | | | | 1,017.55 | | | | 7.37 | |
| 1 | Annualized and excludes expenses of the underlying funds in which the Funds invest. This ratio represents Net Expenses, which include dividend and interest expense from securities sold short. Excluding short dividend expense and prime broker interest expense, the operating expense ratio would be 1.46% lower in the Multi-Hedge Strategies Fund for the A-Class, C-Class, H-Class and Institutional Class. |
| 2 | Expenses are equal to the Fund’s annualized expense ratio, net of any applicable fee waivers, multiplied by the average account value over the period, multiplied by 182/366 (to reflect the one-half year period). |
| 3 | Actual cumulative return at net asset value for the period December 31, 2011 to June 30, 2012. |
| 4 | Since commencement of operations: May 10, 2012. |
THE GUGGENHEIM FUNDS SEMI-ANNUAL REPORT | 5
| FUND PROFILE (Unaudited) | June 30, 2012 |
Long/Short Commodities Strategy Fund
OBJECTIVE: Seeks to achieve positive total returns with less volatility than the broad commodity markets.
Holdings Diversification (Market Exposure as % of Net Assets)
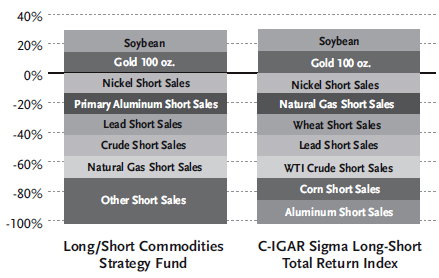
“Holdings Diversification (Market Exposure as % of Net Assets)” excludes any temporary cash investments.
| Inception Dates: | | |
| A-Class | | June 25, 2009 |
| C-Class | | June 25, 2009 |
| H-Class | | June 25, 2009 |
| Institutional Class | | May 3, 2010 |
| Y-Class | | March 29, 2010 |
The Fund invests principally in derivative investments such as commodity-linked futures contracts.
6 | THE GUGGENHEIM FUNDS SEMI-ANNUAL REPORT
| Consolidated SCHEDULE OF INVESTMENTS (Unaudited) | June 30, 2012 |
| Long/Short commodities strategy fund | | |
| | | Face
Amount | | | Value | |
| FEDERAL AGENCY DISCOUNT NOTES†† - 58.5% | | | | | | | | |
| Farmer Mac1 | | | | | | | | |
| 0.17% due 12/18/12 | | $ | 24,984,750 | | | $ | 24,984,750 | |
| 0.17% due 07/24/12 | | | 15,000,000 | | | | 14,999,730 | |
| 0.14% due 08/10/12 | | | 15,000,000 | | | | 14,999,190 | |
| 0.15% due 11/15/12 | | | 15,000,000 | | | | 14,993,775 | |
| 0.16% due 11/30/12 | | | 15,000,000 | | | | 14,993,085 | |
| 0.17% due 12/21/12 | | | 15,000,000 | | | | 14,990,685 | |
| Total Farmer Mac | | | | | | | 99,961,215 | |
| Freddie Mac2 | | | | | | | | |
| 0.14% due 08/06/12 | | | 15,000,000 | | | | 14,999,265 | |
| 0.12% due 10/22/12 | | | 15,000,000 | | | | 14,995,800 | |
| 0.15% due 11/27/12 | | | 15,000,000 | | | | 14,993,220 | |
| 0.13% due 09/17/12 | | | 10,000,000 | | | | 9,998,290 | |
| Total Freddie Mac | | | | | | | 54,986,575 | |
| Federal Home Loan Bank1 | | | | | | | | |
| 0.15% due 10/30/12 | | | 25,000,000 | | | | 24,992,500 | |
| 0.15% due 12/19/12 | | | 15,000,000 | | | | 14,990,805 | |
| 0.17% due 04/01/13 | | | 13,665,000 | | | | 13,646,375 | |
| Total Federal Home Loan Bank | | | | | | | 53,629,680 | |
| Fannie Mae2 | | | | | | | | |
| 0.14% due 09/19/12 | | | 17,000,000 | | | | 16,997,008 | |
| 0.15% due 09/12/12 | | | 10,000,000 | | | | 9,998,400 | |
| Total Fannie Mae | | | | | | | 26,995,408 | |
| Total Federal Agency Discount Notes | | | | | | | | |
| (Cost $235,540,519) | | | | | | | 235,572,878 | |
| FEDERAL AGENCY NOTES†† - 9.7% | | | | | | | | |
| Federal Farm Credit Bank1 | | | | | | | | |
| 0.55% due 11/19/12 | | | 15,000,000 | | | | 15,021,675 | |
| Federal Home Loan Bank1 | | | | | | | | |
| 0.10% due 05/21/13 | | | 14,200,000 | | | | 14,197,330 | |
| Freddie Mac2 | | | | | | | | |
| 0.38% due 11/30/12 | | | 10,000,000 | | | | 10,011,560 | |
| Total Federal Agency Notes | | | | | | | | |
| (Cost $39,227,495) | | | | | | | 39,230,565 | |
| REPURCHASE AGREEMENTS††,3 - 22.6% | | | | | | | | |
| HSBC Group | | | | | | | | |
| issued 06/29/12 at 0.12% | | | | | | | | |
| due 07/02/12 | | | 46,465,861 | | | | 46,465,861 | |
| Mizuho Financial Group, Inc. | | | | | | | | |
| issued 06/29/12 at 0.12% | | | | | | | | |
| due 07/02/12 | | | 19,816,042 | | | | 19,816,042 | |
| Deutsche Bank | | | | | | | | |
| issued 06/29/12 at 0.10% | | | | | | | | |
| due 07/02/12 | | | 13,121,145 | | | | 13,121,145 | |
| Credit Suisse Group | | | | | | | | |
| issued 06/29/12 at 0.08% | | | | | | | | |
| due 07/02/12 | | | 11,671,327 | | | | 11,671,327 | |
| Total Repurchase Agreements | | | | | | | | |
| (Cost $91,074,375) | | | | | | | 91,074,375 | |
| Total Investments - 90.8% | | | |
| (Cost $365,842,389) | | $ | 365,877,818 | |
| Other Assets & Liabilities, net - 9.2% | | | 37,044,636 | |
| Total Net Assets - 100.0% | | $ | 402,922,454 | |
| | | | | |
| | | | | | | |
| | | | | | Unrealized | |
| | | Contracts | | | Gain (Loss) | |
| | | | |
| COMMODITY FUTURES CONTRACTS PURCHASED† | | | | | | | | |
| November 2012 Soybean | | | | | | | | |
| Futures Contracts | | | | | | | | |
| (Aggregate Value of | | | | | | | | |
| Contracts $63,079,313) | | | 883 | | | $ | 5,263,020 | |
| August 2012 Gold 100 oz. | | | | | | | | |
| Futures Contracts | | | | | | | | |
| (Aggregate Value of | | | | | | | | |
| Contracts $61,081,800) | | | 382 | | | | (1,550,536 | ) |
| (Total Aggregate Value of | | | | | | | | |
| Contracts $124,161,113) | | | | | | $ | 3,712,484 | |
| COMMODITY FUTURES CONTRACTS SOLD SHORT† | | | | |
| August 2012 LME Lead | | | | | | | | |
| Futures Contracts | | | | | | | | |
| (Aggregate Value of | | | | | | | | |
| Contracts $60,704,875) | | | 1,309 | | | $ | 3,861,664 | |
| August 2012 LME Primary | | | | | | | | |
| Aluminum Futures Contracts | | | | | | | | |
| (Aggregate Value of | | | | | | | | |
| Contracts $60,497,875) | | | 1,277 | | | | 1,578,241 | |
| August 2012 LME Nickel | | | | | | | | |
| Futures Contracts | | | | | | | | |
| (Aggregate Value of | | | | | | | | |
| Contracts $60,263,472) | | | 601 | | | | 847,827 | |
| August 2012 Natural Gas | | | | | | | | |
| Futures Contracts | | | | | | | | |
| (Aggregate Value of | | | | | | | | |
| Contracts $64,291,500) | | | 2,275 | | | | (3,358,772 | ) |
| August 2012 WTI Crude | | | | | | | | |
| Futures Contracts | | | | | | | | |
| (Aggregate Value of | | | | | | | | |
| Contracts $64,016,450) | | | 755 | | | | (3,879,385 | ) |
| September 2012 Wheat | | | | | | | | |
| Futures Contracts | | | | | | | | |
| (Aggregate Value of | | | | | | | | |
| Contracts $64,396,650) | | | 1,698 | | | | (10,146,180 | ) |
| September 2012 Corn | | | | | | | | |
| Futures Contracts | | | | | | | | |
| (Aggregate Value of | | | | | | | | |
| Contracts $64,820,751) | | | 2,066 | | | | (11,743,972 | ) |
| (Total Aggregate Value of | | | | | | | | |
| Contracts $438,991,573) | | | | | | $ | (22,840,577 | ) |
| † | Value determined based on Level 1 inputs — See Note 4. |
| †† | Value determined based on Level 2 inputs — See Note 4. |
| 1 | The issuer operates under a Congressional charter; its securities are neither issued nor guaranteed by the U.S. Government. |
| 2 | On September 7, 2008, the issuer was placed in conservatorship by the Federal Housing Finance Agency (FHFA). As conservator, the FHFA has full powers to control the assets and operations of the firm. |
| 3 | Repurchase Agreements — See Note 5. |
| SEE NOTES TO FINANCIAL STATEMENTS. | THE GUGGENHEIM FUNDS SEMI-ANNUAL REPORT | 7 |
| Long/Short commodities strategy fund |
consolidated STATEMENT OF
ASSETS AND LIABILITIES (Unaudited)
June 30, 2012
| Assets: | | | | |
| Investments, at value | | | | |
| (cost $274,768,014) | | $ | 274,803,443 | |
| Repurchase agreements, at value | | | | |
| (cost $91,074,375) | | | 91,074,375 | |
| Total investments | | | | |
| (cost $365,842,389) | | | 365,877,818 | |
| Segregated cash with broker | | | 49,935,247 | |
| Receivables: | | | | |
| Fund shares sold | | | 1,390,054 | |
| Interest | | | 15,033 | |
| Total assets | | | 417,218,152 | |
| Liabilities: | | | | |
| Payable for: | | | | |
| Variation margin | | | 12,707,095 | |
| Fund shares redeemed | | | 343,222 | |
| Management fees | | | 311,757 | |
| Distribution and service fees | | | 98,886 | |
| Transfer agent and administrative fees | | | 86,463 | |
| Portfolio accounting fees | | | 31,126 | |
| Miscellaneous | | | 717,149 | |
| Total liabilities | | | 14,295,698 | |
| Net Assets | | $ | 402,922,454 | |
| Net assets consist of: | | | | |
| Paid in capital | | $ | 471,238,581 | |
| Accumulated net investment loss | | | (51,574,893 | ) |
| Undistributed net realized gain on investments | | | 2,351,430 | |
| Net unrealized depreciation on investments | | | (19,092,664 | ) |
| Net assets | | $ | 402,922,454 | |
| A-Class: | | | | |
| Net assets | | $ | 72,371,928 | |
| Capital shares outstanding | | | 3,104,077 | |
| Net asset value per share | | $ | 23.32 | |
| Maximum offering price per share | | | | |
| (Net asset value divided by 95.25%) | | $ | 24.47 | |
| C-Class: | | | | |
| Net assets | | $ | 34,786,688 | |
| Capital shares outstanding | | | 1,529,384 | |
| Net asset value per share | | $ | 22.75 | |
| H-Class: | | | | |
| Net assets | | $ | 247,164,412 | |
| Capital shares outstanding | | | 10,604,275 | |
| Net asset value per share | | $ | 23.31 | |
| Institutional Class: | | | | |
| Net assets | | $ | 43,519,231 | |
| Capital shares outstanding | | | 1,857,095 | |
| Net asset value per share | | $ | 23.43 | |
| Y-Class: | | | | |
| Net assets | | $ | 5,080,195 | |
| Capital shares outstanding | | | 216,473 | |
| Net asset value per share | | $ | 23.47 | |
consolidated STATEMENT
OF OPERATIONS (Unaudited)
Period Ended June 30, 2012
| Investment Income: | | | | |
| Interest | | $ | 277,855 | |
| Total investment income | | | 277,855 | |
| Expenses: | | | | |
| Management fees | | | 2,210,634 | |
| Transfer agent and administrative fees | | | | |
| A-Class | | | 115,974 | |
| C-Class | | | 45,814 | |
| H-Class | | | 306,606 | |
| Institutional Class | | | 48,955 | |
| Y-Class | | | 4,634 | |
| Distribution and service fees: | | | | |
| A-Class | | | 115,973 | |
| C-Class | | | 183,258 | |
| H-Class | | | 306,606 | |
| Portfolio accounting fees | | | 188,022 | |
| Licensing fees | | | 523,142 | |
| Custodian fees | | | 51,037 | |
| Trustees’ fees* | | | 18,356 | |
| Miscellaneous | | | 198,730 | |
| Total expenses | | | 4,317,741 | |
| Less: | | | | |
| Expenses waived by Advisor | | | (327,320 | ) |
| Net expenses | | | 3,990,421 | |
| Net investment loss | | | (3,712,566 | ) |
| Net Realized and Unrealized Gain (Loss): | | | | |
| Net realized gain (loss) on: | | | | |
| Futures contracts | | | 2,861,007 | |
| Net realized gain | | | 2,861,007 | |
| Net change in unrealized appreciation | | | | |
| (depreciation) on: | | | | |
| Investments | | | (70,128 | ) |
| Futures contracts | | | (13,560,637 | ) |
| Net change in unrealized appreciation | | | | |
| (depreciation) | | | (13,630,765 | ) |
| Net realized and unrealized loss | | | (10,769,758 | ) |
| Net decrease in net assets resulting | | | | |
| from operations | | $ | (14,482,324 | ) |
* Relates to Trustees not deemed “interested persons” within the meaning of Section 2(a)(19) of the 1940 Act.
| 8 | THE GUGGENHEIM FUNDS SEMI-ANNUAL REPORT | SEE NOTES TO FINANCIAL STATEMENTS. |
| Long/Short commodities strategy fund |
consolidated STATEMENTS OF CHANGES IN NET ASSETS
| | | Period Ended | | | | |
| | | June 30, | | | Year Ended | |
| | | 2012 | | | December 31, | |
| | | (Unaudited) | | | 2011 | |
| Increase (Decrease) In Net Assets From Operations: | | | | | | | | |
| Net investment loss | | $ | (3,712,566 | ) | | $ | (6,590,386 | ) |
| Net realized gain on investments | | | 2,861,007 | | | | 17,162,084 | |
| Net change in unrealized appreciation (depreciation) on investments | | | (13,630,765 | ) | | | (23,673,062 | ) |
| Net decrease in net assets resulting from operations | | | (14,482,324 | ) | | | (13,101,364 | ) |
| | | | | | | | | |
| Distributions To Shareholders From: | | | | | | | | |
| Net investment income | | | | | | | | |
| A-Class | | | — | | | | (5,635,155 | ) |
| C-Class | | | — | | | | (1,799,816 | ) |
| H-Class | | | — | | | | (10,993,341 | ) |
| Institutional Class | | | — | | | | (1,639,264 | ) |
| Y-Class | | | — | | | | (552 | ) |
| Total distributions to shareholders | | | — | | | | (20,068,128 | ) |
| | | | | | | | | |
| Capital Share Transactions: | | | | | | | | |
| Proceeds from sale of shares | | | | | | | | |
| A-Class | | | 42,747,674 | | | | 98,593,867 | |
| C-Class | | | 8,676,722 | | | | 25,951,255 | |
| H-Class | | | 114,276,172 | | | | 169,426,608 | |
| Institutional Class | | | 20,965,030 | | | | 38,198,427 | |
| Y-Class | | | 5,325,143 | | | | — | |
| Distributions reinvested | | | | | | | | |
| A-Class | | | — | | | | 5,159,745 | |
| C-Class | | | — | | | | 1,730,260 | |
| H-Class | | | — | | | | 9,177,213 | |
| Institutional Class | | | — | | | | 715,921 | |
| Y-Class | | | — | | | | 552 | |
| Cost of shares redeemed | | | | | | | | |
| A-Class | | | (72,762,968 | ) | | | (63,510,864 | ) |
| C-Class | | | (5,056,309 | ) | | | (9,104,887 | ) |
| H-Class | | | (70,614,438 | ) | | | (90,822,313 | ) |
| Institutional Class | | | (4,911,067 | ) | | | (61,251,730 | ) |
| Y-Class | | | — | | | | — | |
| Net increase from capital share transactions | | | 38,645,959 | | | | 124,264,054 | |
| Net increase in net assets | | | 24,163,635 | | | | 91,094,562 | |
| | | | | | | | | |
| Net Assets: | | | | | | | | |
| Beginning of period | | | 378,758,819 | | | | 287,664,257 | |
| End of period | | $ | 402,922,454 | | | $ | 378,758,819 | |
| Accumulated net investment loss at end of period | | $ | (51,574,893 | ) | | $ | (47,862,327 | ) |
| SEE NOTES TO FINANCIAL STATEMENTS. | THE GUGGENHEIM FUNDS SEMI-ANNUAL REPORT | 9 |
| Long/Short commodities strategy fund |
consolidated STATEMENTS OF CHANGES IN NET ASSETS (concluded)
| | | Period Ended | | | | |
| | | June 30, | | | Year Ended | |
| | | 2012 | | | December 31, | |
| | | (Unaudited) | | | 2011 | |
| Capital Share Activity: | | | | | | | | |
| Shares sold | | | | | | | | |
| A-Class | | | 1,694,202 | | | | 3,675,709 | |
| C-Class | | | 355,311 | | | | 974,518 | |
| H-Class | | | 4,548,625 | | | | 6,336,016 | |
| Institutional Class | | | 827,989 | | | | 1,435,975 | |
| Y-Class | | | 216,035 | | | | — | |
| Shares issued from reinvestment of distributions | | | | | | | | |
| A-Class | | | — | | | | 205,404 | |
| C-Class | | | — | | | | 70,307 | |
| H-Class | | | — | | | | 365,480 | |
| Institutional Class | | | — | | | | 28,398 | |
| Y-Class | | | — | | | | 21 | |
| Shares redeemed | | | | | | | | |
| A-Class | | | (2,900,459 | ) | | | (2,413,030 | ) |
| C-Class | | | (205,210 | ) | | | (356,209 | ) |
| H-Class | | | (2,808,149 | ) | | | (3,476,976 | ) |
| Institutional Class | | | (196,122 | ) | | | (2,232,323 | ) |
| Y-Class | | | — | | | | — | |
| Net increase in shares | | | 1,532,222 | | | | 4,613,290 | |
| 10 | THE GUGGENHEIM FUNDS SEMI-ANNUAL REPORT | SEE NOTES TO FINANCIAL STATEMENTS. |
| Long/Short commodities strategy fund |
Consolidated FINANCIAL HIGHLIGHTS
This table is presented to show selected data for a share outstanding throughout each period and to assist shareholders in evaluating a Fund’s performance for the periods presented.
| | | Period Ended | | | Year Ended | | | Year Ended | | | Period Ended | |
| | | June 30, | | | December 31, | | | December 31, | | | December 31, | |
| A-Class | | 2012a | | | 2011 | | | 2010 | | | 2009b | |
| Per Share Data | | | | | | | | | | | | | | | | |
| Net asset value, beginning of period | | $ | 24.04 | | | $ | 25.78 | | | $ | 24.07 | | | $ | 25.00 | |
| Income (loss) from investment operations: | | | | | | | | | | | | | | | | |
| Net investment lossc | | | (.22 | ) | | | (.47 | ) | | | (.41 | ) | | | (.23 | ) |
| Net gain (loss) on investments (realized and unrealized) | | | (.50 | ) | | | .05 | | | | 4.07 | | | | (.70 | ) |
| Total from investment operations | | | (.72 | ) | | | (.42 | ) | | | 3.66 | | | | (.93 | ) |
| Less distributions from: | | | | | | | | | | | | | | | | |
| Net investment income | | | — | | | | (1.32 | ) | | | (1.92 | ) | | | — | |
| Return of Capital | | | — | | | | — | | | | (.03 | ) | | | — | |
| Total distributions | | | — | | | | (1.32 | ) | | | (1.95 | ) | | | — | |
| Redemption fees collected | | | — | | | | — | | | | — | d | | | — | d |
| Net asset value, end of period | | $ | 23.32 | | | $ | 24.04 | | | $ | 25.78 | | | $ | 24.07 | |
| | | | | | | | | | | | | | | | | |
| Total Returne | | | (3.04 | %) | | | (1.83 | %) | | | 15.51 | % | | | (3.72 | %) |
| Ratios/Supplemental Data | | | | | | | | | | | | | | | | |
| Net assets, end of period (in thousands) | | $ | 72,372 | | | $ | 103,637 | | | $ | 73,274 | | | $ | 10,654 | |
| Ratios to average net assets: | | | | | | | | | | | | | | | | |
| Net investment loss | | | (1.73 | %) | | | (1.76 | %) | | | (1.71 | %) | | | (1.74 | %) |
| Total expenses | | | 2.02 | % | | | 2.08 | % | | | 2.09 | % | | | 1.95 | % |
| Net expensesf | | | 1.87 | % | | | 1.92 | % | | | 1.93 | % | | | 1.84 | % |
| Portfolio turnover rate | | | — | | | | — | | | | — | | | | — | |
| | | Period Ended | | | Year Ended | | | Year Ended | | | Period Ended | |
| | | June 30, | | | December 31, | | | December 31, | | | December 31, | |
| C-Class | | 2012a | | | 2011 | | | 2010 | | | 2009b | |
| Per Share Data | | | | | | | | | | | | | | | | |
| Net asset value, beginning of period | | $ | 23.55 | | | $ | 25.46 | | | $ | 23.97 | | | $ | 25.00 | |
| Income (loss) from investment operations: | | | | | | | | | | | | | | | | |
| Net investment lossc | | | (.30 | ) | | | (.66 | ) | | | (.59 | ) | | | (.33 | ) |
| Net gain (loss) on investments (realized and unrealized) | | | (.50 | ) | | | .07 | | | | 4.03 | | | | (.70 | ) |
| Total from investment operations | | | (.80 | ) | | | (.59 | ) | | | 3.44 | | | | (1.03 | ) |
| Less distributions from: | | | | | | | | | | | | | | | | |
| Net investment income | | | — | | | | (1.32 | ) | | | (1.92 | ) | | | — | |
| Return of Capital | | | — | | | | — | | | | (.03 | ) | | | — | |
| Total distributions | | | — | | | | (1.32 | ) | | | (1.95 | ) | | | — | |
| Redemption fees collected | | | — | | | | — | | | | — | d | | | — | d |
| Net asset value, end of period | | $ | 22.75 | | | $ | 23.55 | | | $ | 25.46 | | | $ | 23.97 | |
| | | | | | | | | | | | | | | | | |
| Total Returne | | | (3.40 | %) | | | (2.56 | %) | | | 14.70 | % | | | (4.16 | %) |
| Ratios/Supplemental Data | | | | | | | | | | | | | | | | |
| Net assets, end of period (in thousands) | | $ | 34,787 | | | $ | 32,476 | | | $ | 17,587 | | | $ | 3,642 | |
| Ratios to average net assets: | | | | | | | | | | | | | | | | |
| Net investment income (loss) | | | (2.48 | %) | | | (2.51 | %) | | | (2.46 | %) | | | (2.50 | %) |
| Total expenses | | | 2.77 | % | | | 2.83 | % | | | 2.83 | % | | | 2.70 | % |
| Net expensesf | | | 2.62 | % | | | 2.67 | % | | | 2.67 | % | | | 2.59 | % |
| Portfolio turnover rate | | | — | | | | — | | | | — | | | | — | |
| SEE NOTES TO FINANCIAL STATEMENTS. | THE GUGGENHEIM FUNDS SEMI-ANNUAL REPORT | 11 |
| Long/Short commodities strategy fund |
Consolidated FINANCIAL HIGHLIGHTS (continued)
This table is presented to show selected data for a share outstanding throughout each period and to assist shareholders in evaluating a Fund’s performance for the periods presented.
| | | Period Ended | | | Year Ended | | | Year Ended | | | Period Ended | |
| | | June 30, | | | December 31, | | | December 31, | | | December 31, | |
| H-Class | | 2012a | | | 2011 | | | 2010 | | | 2009b | |
| Per Share Data | | | | | | | | | | | | | | | | |
| Net asset value, beginning of period | | $ | 24.04 | | | $ | 25.77 | | | $ | 24.06 | | | $ | 25.00 | |
| Income (loss) from investment operations: | | | | | | | | | | | | | | | | |
| Net investment lossc | | | (.22 | ) | | | (.47 | ) | | | (.41 | ) | | | (.23 | ) |
| Net gain (loss) on investments (realized and unrealized) | | | (.51 | ) | | | .06 | | | | 4.07 | | | | (.71 | ) |
| Total from investment operations | | | (.73 | ) | | | (.41 | ) | | | 3.66 | | | | (.94 | ) |
| Less distributions from: | | | | | | | | | | | | | | | | |
| Net investment income | | | — | | | | (1.32 | ) | | | (1.92 | ) | | | — | |
| Return of Capital | | | — | | | | — | | | | (.03 | ) | | | — | |
| Total distributions | | | — | | | | (1.32 | ) | | | (1.95 | ) | | | — | |
| Redemption fees collected | | | — | | | | — | | | | — | d | | | — | d |
| Net asset value, end of period | | $ | 23.31 | | | $ | 24.04 | | | $ | 25.77 | | | $ | 24.06 | |
| | | | | | | | | | | | | | | | | |
| Total Returne | | | (3.00 | %) | | | (1.83 | %) | | | 15.51 | % | | | (3.76 | %) |
| Ratios/Supplemental Data | | | | | | | | | | | | | | | | |
| Net assets, end of period (in thousands) | | $ | 247,164 | | | $ | 213,062 | | | $ | 145,349 | | | $ | 71,014 | |
| Ratios to average net assets: | | | | | | | | | | | | | | | | |
| Net investment loss | | | (1.74 | %) | | | (1.76 | %) | | | (1.71 | %) | | | (1.75 | %) |
| Total expenses | | | 2.02 | % | | | 2.08 | % | | | 2.07 | % | | | 1.95 | % |
| Net expensesf | | | 1.87 | % | | | 1.92 | % | | | 1.91 | % | | | 1.84 | % |
| Portfolio turnover rate | | | — | | | | — | | | | — | | | | — | |
| | | Period Ended | | | Year Ended | | | Period Ended | |
| | | June 30, | | | December 31, | | | December 31, | |
| Institutional Class | | 2012a | | | 2011 | | | 2010g | |
| Per Share Data | | | | | | | | | | | | |
| Net asset value, beginning of period | | $ | 24.14 | | | $ | 25.81 | | | $ | 26.39 | |
| Income (loss) from investment operations: | | | | | | | | | | | | |
| Net investment lossc | | | (.19 | ) | | | (.40 | ) | | | (.24 | ) |
| Net gain (loss) on investments (realized and unrealized) | | | (.52 | ) | | | .05 | | | | 1.61 | |
| Total from investment operations | | | (.71 | ) | | | (.35 | ) | | | 1.37 | |
| Less distributions from: | | | | | | | | | | | | |
| Net investment income | | | — | | | | (1.32 | ) | | | (1.92 | ) |
| Return of Capital | | | — | | | | — | | | | (.03 | ) |
| Total distributions | | | — | | | | (1.32 | ) | | | (1.95 | ) |
| Redemption fees collected | | | — | | | | — | | | | —d | |
| Net asset value, end of period | | $ | 23.43 | | | $ | 24.14 | | | $ | 25.81 | |
| | | | | | | | | | | | | |
| Total Returne | | | (2.90 | %) | | | (1.60 | %) | | | 5.47 | % |
| Ratios/Supplemental Data | | | | | | | | | | | | |
| Net assets, end of period (in thousands) | | $ | 43,519 | | | $ | 29,573 | | | $ | 51,444 | |
| Ratios to average net assets: | | | | | | | | | | | | |
| Net investment loss | | | (1.49 | %) | | | (1.50 | %) | | | (1.45 | %) |
| Total expenses | | | 1.78 | % | | | 1.84 | % | | | 1.88 | % |
| Net expensesf | | | 1.62 | % | | | 1.68 | % | | | 1.70 | % |
| Portfolio turnover rate | | | — | | | | — | | | | — | |
| 12 | THE GUGGENHEIM FUNDS SEMI-ANNUAL REPORT | |
| Long/Short commodities strategy fund |
Consolidated FINANCIAL HIGHLIGHTS (concluded)
This table is presented to show selected data for a share outstanding throughout each period and to assist shareholders in evaluating a Fund’s performance for the periods presented.
| | | Period Ended | | | Year Ended | | | Period Ended | |
| | | June 30, | | | December 31, | | | December 31, | |
| Y-Class | | 2012a | | | 2011 | | | 2010h | |
| Per Share Data | | | | | | | | | | | | |
| Net asset value, beginning of period | | $ | 24.17 | | | $ | 25.83 | | | $ | 25.89 | |
| Income (loss) from investment operations: | | | | | | | | | | | | |
| Net investment lossc | | | (.18 | ) | | | (.39 | ) | | | (.26 | ) |
| Net gain (loss) on investments (realized and unrealized) | | | (.52 | ) | | | .05 | | | | 2.15 | |
| Total from investment operations | | | (.70 | ) | | | (.34 | ) | | | 1.89 | |
| Less distributions from: | | | | | | | | | | | | |
| Net investment income | | | — | | | | (1.32 | ) | | | (1.92 | ) |
| Return of Capital | | | — | | | | — | | | | (.03 | ) |
| Total distributions | | | — | | | | (1.32 | ) | | | (1.95 | ) |
| Redemption fees collected | | | — | | | | — | | | | —d | |
| Net asset value, end of period | | $ | 23.47 | | | $ | 24.17 | | | $ | 25.83 | |
| | | | | | | | | | | | | |
| Total Returne | | | (2.90 | %) | | | (1.52 | %) | | | 7.58 | % |
| Ratios/Supplemental Data | | | | | | | | | | | | |
| Net assets, end of period (in thousands) | | $ | 5,080 | | | $ | 11 | | | $ | 11 | |
| Ratios to average net assets: | | | | | | | | | | | | |
| Net investment loss | | | (1.44 | %) | | | (1.46 | %) | | | (1.41 | %) |
| Total expenses | | | 1.72 | % | | | 1.78 | % | | | 1.79 | % |
| Net expensesf | | | 1.57 | % | | | 1.62 | % | | | 1.63 | % |
| Portfolio turnover rate | | | — | | | | — | | | | — | |
a Unaudited figures for the period ended June 30, 2012. Percentage amounts for the period, except total return and portfolio turnover rate, have been annualized.
b Since commencement of operations: June 25, 2009. Percentage amounts for the period, except total return and portfolio turnover rate, have been annualized.
c Net investment loss per share was computed using average shares outstanding throughout the period.
d Redemption fees collected are less than $0.01 per share.
e Total return does not reflect the impact of any applicable sales charges and has not been annualized.
f Net expense information reflects the expense ratios after expense waivers.
g Since commencement of operations: May 3, 2010. Percentage amounts for the period, except total return and portfolio turnover rate, have been annualized.
h Since commencement of operations: March 29, 2010. Percentage amounts for the period, except total return and portfolio turnover rate, have been annualized.
THE GUGGENHEIM FUNDS SEMI-ANNUAL REPORT | 13
| FUND PROFILE (Unaudited) | June 30 , 2012 |
| global managed futures strategy fund |
| |
| OBJECTIVE: Seeks to generate positive total returns over time. |
| |
| Holdings Diversification (Market Exposure as % of Net Assets) |

Global Managed Futures Strategy Fund
“Holdings Diversification (Market Exposure as % of Net Assets)” excludes any temporary cash investments.
| Inception Date: | | |
| Institutional Class | | May 10, 2012 |
The Fund invests principally in derivative investments such as futures contracts.
14 | THE GUGGENHEIM FUNDS SEMI-ANNUAL REPORT
| consolidated SCHEDULE OF INVESTMENTS (Unaudited) | June 30, 2012 |
| global managed futures strategy fund | | |
| | | Face
Amount | | | Value | |
| REPURCHASE AGREEMENTS††,1 - 88.0% | | | | | | | | |
| HSBC Group | | | | | | | | |
| issued 06/29/12 at 0.12% | | | | | | | | |
| due 07/02/12 | | $ | 6,593,203 | | | $ | 6,593,203 | |
| Mizuho Financial Group, Inc. | | | | | | | | |
| issued 06/29/12 at 0.12% | | | | | | | | |
| due 07/02/12 | | | 2,811,767 | | | | 2,811,767 | |
| Deutsche Bank | | | | | | | | |
| issued 06/29/12 at 0.10% | | | | | | | | |
| due 07/02/12 | | | 1,861,805 | | | | 1,861,805 | |
| Credit Suisse Group | | | | | | | | |
| issued 06/29/12 at 0.08% | | | | | | | | |
| due 07/02/12 | | | 1,656,086 | | | | 1,656,086 | |
| Total Repurchase Agreements | | | | | | | | |
| (Cost $12,922,861) | | | | | | | 12,922,861 | |
| Total Investments - 88.0% | | | | | | | | |
| (Cost $12,922,861) | | | | | | $ | 12,922,861 | |
| Other Assets & Liabilities, net - 12.0% | | | | | | | 1,754,306 | |
| Total Net Assets - 100.0% | | | | | | $ | 14,677,167 | |
| | | | | | | | | |
| | | | | | Unrealized | |
| | | Contracts | | | Gain (Loss) | |
| | | | |
| INTEREST RATE FUTURES CONTRACTS PURCHASED† | | | | | | | | |
| September 2012 Australian Government | | | | | | | | |
| 3 Year Bond Futures Contracts | | | | | | | | |
| (Aggregate Value of | | | | | | | | |
| Contracts $5,641,472) | | | 50 | | | $ | 625,367 | |
| September 2012 Australian Government | | | | | | | | |
| 10 Year Bond Futures Contracts | | | | | | | | |
| (Aggregate Value of | | | | | | | | |
| Contracts $2,301,354) | | | 18 | | | | 501,814 | |
| September 2012 Japanese Government | | | | | | | | |
| 10 Year Bond Futures Contracts | | | | | | | | |
| (Aggregate Value of | | | | | | | | |
| Contracts $5,395,008) | | | 3 | | | | 17,063 | |
| December 2012 3 Month | | | | | | | | |
| Eurodollar Futures Contracts | | | | | | | | |
| (Aggregate Value of | | | | | | | | |
| Contracts $10,198,239) | | | 41 | | | | 10,674 | |
| September 2012 U.S. Treasury | | | | | | | | |
| 10 Year Note Futures Contracts | | | | | | | | |
| (Aggregate Value of | | | | | | | | |
| Contracts $1,868,125) | | | 14 | | | | 9,069 | |
| September 2012 U.S. Treasury | | | | | | | | |
| Long Bond Futures Contracts | | | | | | | | |
| (Aggregate Value of | | | | | | | | |
| Contracts $1,185,000) | | | 8 | | | | 7,699 | |
| September 2012 U.S. Treasury | | | | | | | | |
| 5 Year Note Futures Contracts | | | | | | | | |
| (Aggregate Value of | | | | | | | | |
| Contracts $3,100,781) | | | 25 | | | | 6,995 | |
| December 2012 3 Month Euro | | | | | | | | |
| Euribor Futures Contracts | | | | | | | | |
| (Aggregate Value of | | | | | | | | |
| Contracts $8,815,225) | | | 28 | | | | 6,964 | |
| September 2012 Long Gilt | | | | | | | | |
| Futures Contracts | | | | | | | | |
| (Aggregate Value of | | | | | | | | |
| Contracts $1,118,628) | | | 6 | | | | 5,867 | |
| December 2012 3 Month | | | | | | | | |
| Sterling Futures Contracts | | | | | | | | |
| (Aggregate Value of | | | | | | | | |
| Contracts $8,937,241) | | | 46 | | | | 4,601 | |
| September 2012 U.S. Treasury | | | | | | | | |
| 2 Year Note Futures Contracts | | | | | | | | |
| (Aggregate Value of | | | | | | | | |
| Contracts $6,166,125) | | | 28 | | | | (7,041 | ) |
| September 2012 Euro Schatz | | | | | | | | |
| Futures Contracts | | | | | | | | |
| (Aggregate Value of | | | | | | | | |
| Contracts $5,452,547) | | | 39 | | | | (15,199 | ) |
| September 2012 Euro - Bobl | | | | | | | | |
| Futures Contracts | | | | | | | | |
| (Aggregate Value of | | | | | | | | |
| Contracts $2,707,005) | | | 17 | | | | (31,647 | ) |
| September 2012 Euro - Bund | | | | | | | | |
| Futures Contracts | | | | | | | | |
| (Aggregate Value of | | | | | | | | |
| Contracts $1,605,113) | | | 9 | | | | (44,841 | ) |
| (Total Aggregate Value of | | | | | | | | |
| Contracts $64,491,863) | | | | | | $ | 1,097,385 | |
| COMMODITY Futures Contracts Purchased† | | | | | | | | |
| November 2012 Soybean | | | | | | | | |
| Futures Contracts | | | | | | | | |
| (Aggregate Value of | | | | | | | | |
| Contracts $928,688) | | | 13 | | | $ | 55,607 | |
| September 2012 Wheat | | | | | | | | |
| Futures Contracts | | | | | | | | |
| (Aggregate Value of | | | | | | | | |
| Contracts $265,475) | | | 7 | | | | 7,402 | |
| September 2012 Corn | | | | | | | | |
| Futures Contracts | | | | | | | | |
| (Aggregate Value of | | | | | | | | |
| Contracts $156,875) | | | 5 | | | | 4,449 | |
| August 2012 Gasoline RBOB | | | | | | | | |
| Futures Contracts | | | | | | | | |
| (Aggregate Value of | | | | | | | | |
| Contracts $220,634) | | | 2 | | | | 3,416 | |
| (Total Aggregate Value of | | | | | | | | |
| Contracts $1,571,672) | | | | | | $ | 70,874 | |
| SEE NOTES TO FINANCIAL STATEMENTS. | THE GUGGENHEIM FUNDS SEMI-ANNUAL REPORT | 15 |
| consolidated SCHEDULE OF INVESTMENTS (Unaudited) (continued) | June 30, 2012 |
| global managed futures strategy fund | | |
| | | | | | Unrealized | |
| | | Contracts | | | Gain (Loss) | |
| FUTURES CONTRACTS Purchased† | | | | | | | | |
| September 2012 Nikkei 225 | | | | | | | | |
| Index Futures Contracts | | | | | | | | |
| (Aggregate Value of | | | | | | | | |
| Contracts $227,652) | | | 2 | | | $ | 14,600 | |
| September 2012 NASDAQ-100 | | | | | | | | |
| Index Mini Futures Contracts | | | | | | | | |
| (Aggregate Value of | | | | | | | | |
| Contracts $261,200) | | | 5 | | | | 11,723 | |
| September 2012 S&P 500 | | | | | | | | |
| Index Mini Futures Contracts | | | | | | | | |
| (Aggregate Value of | | | | | | | | |
| Contracts $135,725) | | | 2 | | | | 7,877 | |
| September 2012 DJIA Index | | | | | | | | |
| Mini Futures Contracts | | | | | | | | |
| (Aggregate Value of | | | | | | | | |
| Contracts $128,140) | | | 2 | | | | 7,611 | |
| September 2012 Russell 2000 | | | | | | | | |
| Index Mini Futures Contracts | | | | | | | | |
| (Aggregate Value of | | | | | | | | |
| Contracts $79,720) | | | 1 | | | | 5,558 | |
| September 2012 S&P 400 Mid | | | | | | | | |
| Index Mini Futures Contracts | | | | | | | | |
| (Aggregate Value of | | | | | | | | |
| Contracts $94,080) | | | 1 | | | | 4,066 | |
| September 2012 FTSE 100 | | | | | | | | |
| Index Futures Contracts | | | | | | | | |
| (Aggregate Value of | | | | | | | | |
| Contracts $86,830) | | | 1 | | | | 2,131 | |
| September 2012 FTSE/JSE Top | | | | | | | | |
| 40 Index Futures Contracts | | | | | | | | |
| (Aggregate Value of | | | | | | | | |
| Contracts $290,985) | | | 8 | | | | (1,155 | ) |
| (Total Aggregate Value of | | | | | | | | |
| Contracts $1,304,332) | | | | | | $ | 52,411 | |
| CURRENCY FUTURES CONTRACTS Purchased† | | | | | | | | |
| September 2012 Australian | | | | | | | | |
| Dollar Futures Contracts | | | | | | | | |
| (Aggregate Value of | | | | | | | | |
| Contracts $1,219,560) | | | 12 | | | $ | 37,289 | |
| CURRENCY FUTURES CONTRACTS SOLD SHORT† | | | | | | | | |
| September 2012 Japanese Yen | | | | | | | | |
| Futures Contracts | | | | | | | | |
| (Aggregate Value of | | | | | | | | |
| Contracts $1,565,500) | | | 10 | | | $ | 8,725 | |
| September 2012 Canadian | | | | | | | | |
| Dollar Futures Contracts | | | | | | | | |
| (Aggregate Value of | | | | | | | | |
| Contracts $1,568,960) | | | 16 | | | | (13,276 | ) |
| September 2012 Swiss Franc | | | | | | | | |
| Futures Contracts | | | | | | | | |
| (Aggregate Value of | | | | | | | | |
| Contracts $1,451,863) | | | 11 | | | | (16,441 | ) |
| September 2012 Euro FX | | | | | | | | |
| Currency Futures Contracts | | | | | | | | |
| (Aggregate Value of | | | | | | | | |
| Contracts $1,741,713) | | | 11 | | | | (19,343 | ) |
| (Total Aggregate Value of | | | | | | | | |
| Contracts $6,328,036) | | | | | | $ | (40,335 | ) |
| FUTURES CONTRACTS SOLD SHORT† | | | | | | | | |
| September 2012 Amsterdam | | | | | | | | |
| Index Futures Contracts | | | | | | | | |
| (Aggregate Value of | | | | | | | | |
| Contracts $78,048) | | | 1 | | | $ | (3,704 | ) |
| July 2012 CAC40 10 Euro | | | | | | | | |
| Index Futures Contracts | | | | | | | | |
| (Aggregate Value of | | | | | | | | |
| Contracts $81,124) | | | 2 | | | | (3,715 | ) |
| July 2012 Hang Seng Index | | | | | | | | |
| Futures Contracts | | | | | | | | |
| (Aggregate Value of | | | | | | | | |
| Contracts $251,925) | | | 2 | | | | (8,920 | ) |
| July 2012 H-Shares Index | | | | | | | | |
| Futures Contracts | | | | | | | | |
| (Aggregate Value of | | | | | | | | |
| Contracts $370,602) | | | 6 | | | | (9,489 | ) |
| July 2012 IBEX 35 Index | | | | | | | | |
| Futures Contracts | | | | | | | | |
| (Aggregate Value of | | | | | | | | |
| Contracts $177,548) | | | 2 | | | | (12,358 | ) |
| September 2012 Topix Index | | | | | | | | |
| Futures Contracts | | | | | | | | |
| (Aggregate Value of | | | | | | | | |
| Contracts $485,488) | | | 5 | | | | (39,991 | ) |
| (Total Aggregate Value of | | | | | | | | |
| Contracts $1,444,735) | | | | | | $ | (78,177 | ) |
| 16 | THE GUGGENHEIM FUNDS SEMI-ANNUAL REPORT | SEE NOTES TO FINANCIAL STATEMENTS. |
| consolidated SCHEDULE OF INVESTMENTS (Unaudited) (continued) | June 30, 2012 |
| global managed futures strategy fund | | |
| | | | | | Unrealized | |
| | | Contracts | | | Gain (Loss) | |
| | | | |
| COMMODITY FUTURES CONTRACTS SOLD SHORT† | | | | | | | | |
| September 2012 Silver | | | | | | | | |
| Futures Contracts | | | | | | | | |
| (Aggregate Value of | | | | | | | | |
| Contracts $549,300) | | | 4 | | | $ | 30,180 | |
| August 2012 LME Primary | | | | | | | | |
| Aluminum Futures Contracts | | | | | | | | |
| (Aggregate Value of | | | | | | | | |
| Contracts $615,875) | | | 13 | | | | 18,431 | |
| August 2012 LME Lead | | | | | | | | |
| Futures Contracts | | | | | | | | |
| (Aggregate Value of | | | | | | | | |
| Contracts $417,375) | | | 9 | | | | 9,047 | |
| August 2012 LME Nickel | | | | | | | | |
| Futures Contracts | | | | | | | | |
| (Aggregate Value of | | | | | | | | |
| Contracts $401,088) | | | 4 | | | | 5,962 | |
| August 2012 LME Zinc | | | | | | | | |
| Futures Contracts | | | | | | | | |
| (Aggregate Value of | | | | | | | | |
| Contracts $470,500) | | | 10 | | | | (573 | ) |
| December 2012 Cotton #2 | | | | | | | | |
| Futures Contracts | | | | | | | | |
| (Aggregate Value of | | | | | | | | |
| Contracts $1,127,840) | | | 32 | | | | (2,092 | ) |
| August 2012 Gold 100 oz. | | | | | | | | |
| Futures Contracts | | | | | | | | |
| (Aggregate Value of | | | | | | | | |
| Contracts $479,700) | | | 3 | | | | (6,672 | ) |
| August 2012 WTI Crude | | | | | | | | |
| Futures Contracts | | | | | | | | |
| (Aggregate Value of | | | | | | | | |
| Contracts $423,950) | | | 5 | | | | (11,225 | ) |
| August 2012 Heating Oil | | | | | | | | |
| Futures Contracts | | | | | | | | |
| (Aggregate Value of | | | | | | | | |
| Contracts $453,466) | | | 4 | | | | (12,606 | ) |
| September 2012 Copper | | | | | | | | |
| Futures Contracts | | | | | | | | |
| (Aggregate Value of | | | | | | | | |
| Contracts $525,000) | | | 6 | | | | (23,506 | ) |
| August 2012 Gas Oil | | | | | | | | |
| Futures Contracts | | | | | | | | |
| (Aggregate Value of | | | | | | | | |
| Contracts $429,250) | | | 5 | | | | (24,635 | ) |
| August 2012 Live Cattle | | | | | | | | |
| Futures Contracts | | | | | | | | |
| (Aggregate Value of | | | | | | | | |
| Contracts $1,639,480) | | | 34 | | | | (27,055 | ) |
| September 2012 Brent Crude | | | | | | | | |
| Futures Contracts | | | | | | | | |
| (Aggregate Value of | | | | | | | | |
| Contracts $487,800) | | | 5 | | | | (38,249 | ) |
| August 2012 Natural Gas | | | | | | | | |
| Futures Contracts | | | | | | | | |
| (Aggregate Value of | | | | | | | | |
| Contracts $452,160) | | | 16 | | | | (94,103 | ) |
| October 2012 Sugar #11 | | | | | | | | |
| Futures Contracts | | | | | | | | |
| (Aggregate Value of | | | | | | | | |
| Contracts $1,439,502) | | | 61 | | | | (96,192 | ) |
| September 2012 Coffee ‘C’ | | | | | | | | |
| Futures Contracts | | | | | | | | |
| (Aggregate Value of | | | | | | | | |
| Contracts $1,345,838) | | | 21 | | | | (129,910 | ) |
| (Total Aggregate Value of | | | | | | | | |
| Contracts $11,258,124) | | | | | | $ | (403,198 | ) |
| † | Value determined based on Level 1 inputs — See Note 4. |
| †† | Value determined based on Level 2 inputs — See Note 4. |
| 1 | Repurchase Agreements — See Note 5. |
| SEE NOTES TO FINANCIAL STATEMENTS. | THE GUGGENHEIM FUNDS SEMI-ANNUAL REPORT | 17 |
| global managed futures strategy fund | | |
| CONSOLIDATED STATEMENT OF | | | |
| ASSETS AND LIABILITIES (Unaudited) | | | |
| June 30, 2012 | | | | |
| Assets: | | | | |
| Repurchase agreements, at value | | | | |
| (cost $12,922,861) | | $ | 12,922,861 | |
| Foreign currency, at value | | | | |
| (cost $105,483) | | | 107,189 | |
| Segregated cash with broker | | | 2,306,806 | |
| Prepaid expenses | | | 19,515 | |
| Receivables: | | | | |
| Interest | | | 80 | |
| Total assets | | | 15,356,451 | |
| Liabilities: | | | | |
| Overdraft due to custodian bank | | | 104,182 | |
| Payable for: | | | | |
| Variation margin | | | 562,023 | |
| Management fees | | | 5,862 | |
| Transfer agent and administrative fees | | | 3,135 | |
| Portfolio accounting fees | | | 1,254 | |
| Miscellaneous | | | 2,828 | |
| Total liabilities | | | 679,284 | |
| Net Assets | | $ | 14,677,167 | |
| Net Assets Consist Of: | | | | |
| Paid in capital | | $ | 15,000,215 | |
| Accumulated net investment loss | | | (24,157 | ) |
| Accumulated net realized loss on investments | | | (1,036,476 | ) |
| Net unrealized appreciation on investments | | | | |
| and foreign currency | | | 737,585 | |
| Net assets | | $ | 14,677,167 | |
| Institutional Class: | | | | |
| Net assets | | $ | 14,674,093 | |
| Capital shares outstanding | | | 600,000 | |
| Net asset value per share | | $ | 24.46 | |
| CONSOLIDATED STATEMENT | | | |
| OF OPERATIONS (Unaudited) | | | |
| Period Ended June 30, 2012† | | | | |
| Investment Income: | | | | |
| Interest | | $ | 2,522 | |
| Total investment income | | | 2,522 | |
| Expenses: | | | | |
| Management fees | | | 22,119 | |
| Transfer agent and administrative fees | | | 5,290 | |
| Portfolio accounting fees | | | 2,116 | |
| Registration fees | | | 2,666 | |
| Custodian fees | | | 506 | |
| Miscellaneous | | | 2,667 | |
| Total expenses | | | 35,364 | |
| Less: | | | | |
| Expenses waived by Advisor | | | (8,685 | ) |
| Net expenses | | | 26,679 | |
| Net investment loss | | | (24,157 | ) |
| Net Realized and Unrealized Gain (Loss): | | | | |
| Net realized gain (loss) on: | | | | |
| Futures contracts | | | (1,033,449 | ) |
| Foreign currency | | | (3,027 | ) |
| Net realized loss | | | (1,036,476 | ) |
| Net change in unrealized appreciation | | | | |
| (depreciation) on: | | | | |
| Futures contracts | | | 736,249 | |
| Foreign currency | | | 1,336 | |
| Net change in unrealized appreciation | | | | |
| (depreciation) | | | 737,585 | |
| Net realized and unrealized loss | | | (298,891 | ) |
| Net decrease in net assets resulting | | | | |
| from operations | | $ | (323,048 | ) |
† Since commencement of operations: May 10, 2012.
| 18 | THE GUGGENHEIM FUNDS SEMI-ANNUAL REPORT | SEE NOTES TO FINANCIAL STATEMENTS. |
| global managed futures strategy fund | | |
CONSOLIDATED STATEMENTS OF CHANGES IN NET ASSETS
| | | Period Ended | |
| | | June 30, | |
| | | 2012a | |
| Increase (Decrease) In Net Assets From Operations: | | | | |
| Net investment loss | | $ | (24,157 | ) |
| Net realized loss on investments and foreign currency | | | (1,036,476 | ) |
| Net change in unrealized appreciation (depreciation) on investments and foreign currency | | | 737,585 | |
| Net decrease in net assets resulting from operations | | | (323,048 | ) |
| | | | | |
| Capital Share Transactions: | | | | |
| Proceeds from sale of shares | | | | |
| Institutional Class | | | 15,000,215 | |
| Cost of shares redeemed | | | | |
| Institutional Class | | | — | |
| Net increase from capital share transactions | | | 15,000,215 | |
| Net increase in net assets | | | 14,677,167 | |
| | | | | |
| Net Assets: | | | | |
| Beginning of period | | | — | |
| End of period | | $ | 14,677,167 | |
| Accumulated net investment loss at end of period | | $ | (24,157 | ) |
| Capital Share Activity: | | | | |
| Shares sold | | | | |
| Institutional Class | | | 600,000 | |
| Shares redeemed | | | | |
| Institutional Class | | | — | |
| Net increase in shares | | | 600,000 | |
a Since the commencement of operations: May 10, 2012.
| SEE NOTES TO FINANCIAL STATEMENTS. | THE GUGGENHEIM FUNDS SEMI-ANNUAL REPORT | 19 |
| global managed futures strategy fund | | |
consolidated FINANCIAL HIGHLIGHTS
This table is presented to show selected data for a share outstanding throughout each period and to assist shareholders in evaluating a Fund’s performance for the periods presented.
| | | Period Ended | |
| | | June 30, | |
| Institutional Class | | 2012a | |
| Per Share Data | | | | |
| Net asset value, beginning of period | | $ | 25.00 |
| Income (loss) from investment operations: | | | | |
| Net investment lossb | | | (.04) |
| Net loss on investments (realized and unrealized) | | | (.50) |
| Total from investment operations | | | (.54) |
| Net asset value, end of period | | $ | 24.46 |
| | | | | |
| Total Returnc | | | (2.16 | %) |
| Ratios/Supplemental Data | | | | |
| Net assets, end of period (in thousands) | | $ | 14,677 |
| Ratios to average net assets: | | | | |
| Net investment loss | | | (1.14%) |
| Total expenses | | | 1.67% |
| Net expensesd | | | 1.26% |
| Portfolio turnover rate | | | — |
a Since commencement of operations: May 10, 2012. Percentage amounts for the period, except total return and portfolio turnover rate, have been annualized.
b Net investment loss per share was computed using average shares outstanding throughout the period.
c Total return does not reflect the impact of any applicable sales charges and has not been annualized.
d Net expense information reflects the expense ratios after expense waivers.
| 20 | THE GUGGENHEIM FUNDS SEMI-ANNUAL REPORT | SEE NOTES TO FINANCIAL STATEMENTS. |
| FUND PROFILE (Unaudited) | June 30, 2012 |
MULTI-HEDGE STRATEGIES FUND
OBJECTIVE: Seeks long-term capital appreciation with less risk than traditional equity funds.
Holdings Diversification (Market Exposure as % of Net Assets)
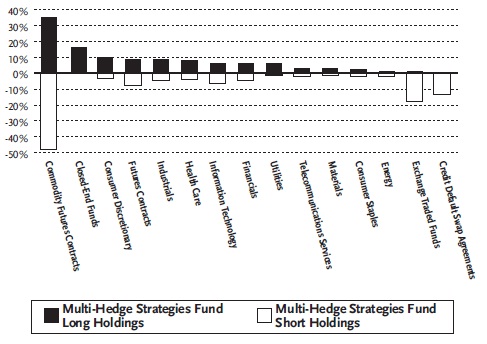
“Holdings Diversification (Market Exposure as % of Net Assets)” excludes any temporary cash investments.
| Inception Dates: | | |
| A-Class | | September 19, 2005 |
| C-Class | | September 19, 2005 |
| H-Class | | September 19, 2005 |
| Institutional Class | | May 3, 2010 |
Ten Largest Long Holdings
(% of Total Net Assets)
| Progress Energy, Inc. | | | 3.2 | % |
| AboveNet, Inc. | | | 2.4 | % |
| Goodrich Corp. | | | 2.2 | % |
| Catalyst Health Solutions, Inc. | | | 2.2 | % |
| Gen-Probe, Inc. | | | 1.9 | % |
| Knology, Inc. | | | 1.7 | % |
| P.F. Chang’s China Bistro, Inc. | | | 1.6 | % |
| Solutia, Inc. | | | 1.4 | % |
| Cooper Industries plc | | | 1.2 | % |
| Ariba, Inc. | | | 1.2 | % |
| Top Ten Total | | | 19.0 | % |
“Ten Largest Long Holdings” exclude any temporary cash or derivative investments.
THE GUGGENHEIM FUNDS SEMI-ANNUAL REPORT | 21
| consolidated SCHEDULE OF INVESTMENTS (Unaudited) | June 30, 2012 |
| multi-hedge strategies fund | | |
| | |
Shares | | | Value | |
| COMMON STOCKS† - 54.3% | | | | | | | | |
| Consumer Discretionary - 9.7% | | | | | | | | |
| Knology, Inc.*,1 | | | 118,996 | | | $ | 2,340,652 | |
| P.F. Chang’s China Bistro, Inc.1 | | | 42,260 | | | | 2,175,122 | |
| Collective Brands, Inc.*,1 | | | 54,743 | | | | 1,172,595 | |
| Pep Boys-Manny Moe & Jack1 | | | 88,387 | | | | 875,031 | |
| Benihana, Inc. — Class A1 | | | 40,861 | | | | 658,271 | |
| Aaron’s, Inc.1 | | | 16,963 | | | | 480,222 | |
| Comcast Corp. — Class A1 | | | 11,090 | | | | 354,548 | |
| Jarden Corp.1 | | | 8,252 | | | | 346,749 | |
| Penn National Gaming, Inc.*,1 | | | 7,706 | | | | 343,610 | |
| Macy’s, Inc.1 | | | 9,488 | | | | 325,913 | |
| Wyndham Worldwide Corp.1 | | | 5,670 | | | | 299,035 | |
| MGM Resorts International*,1 | | | 25,192 | | | | 281,143 | |
| Advance Auto Parts, Inc.1 | | | 3,707 | | | | 252,892 | |
| DISH Network Corp. — Class A1 | | | 7,779 | | | | 222,090 | |
| News Corp. — Class A1 | | | 9,669 | | | | 215,522 | |
| O’Reilly Automotive, Inc.*,1 | | | 2,544 | | | | 213,111 | |
| Time Warner Cable, Inc.1 | | | 2,556 | | | | 209,848 | |
| Polaris Industries, Inc.1 | | | 2,727 | | | | 194,926 | |
| Target Corp.1 | | | 2,978 | | | | 173,290 | |
| Genuine Parts Co.1 | | | 2,844 | | | | 171,351 | |
| Best Buy Company, Inc.1 | | | 7,960 | | | | 166,842 | |
| Talbots, Inc.*,1 | | | 62,793 | | | | 158,238 | |
| Big Lots, Inc.*,1 | | | 3,847 | | | | 156,919 | |
| Kohl’s Corp.1 | | | 3,408 | | | | 155,030 | |
| Nordstrom, Inc.1 | | | 3,119 | | | | 154,983 | |
| Brinker International, Inc.1 | | | 4,799 | | | | 152,944 | |
| Staples, Inc.1 | | | 10,304 | | | | 134,467 | |
| LKQ Corp.*,1 | | | 3,687 | | | | 123,146 | |
| CBS Corp. — Class B1 | | | 3,562 | | | | 116,762 | |
| Kenneth Cole Productions, | | | | | | | | |
| Inc. — Class A* | | | 6,864 | | | | 103,303 | |
| Guess?, Inc.1 | | | 2,816 | | | | 85,522 | |
| Dillard’s, Inc. — Class A1 | | | 1,127 | | | | 71,767 | |
| Hasbro, Inc.1 | | | 2,111 | | | | 71,500 | |
| Fossil, Inc.*,1 | | | 768 | | | | 58,783 | |
| Deckers Outdoor Corp.*,1 | | | 1,144 | | | | 50,347 | |
| Harman International | | | | | | | | |
| Industries, Inc.1 | | | 1,054 | | | | 41,738 | |
| Thor Industries, Inc.1 | | | 1,417 | | | | 38,840 | |
| Limited Brands, Inc.1 | | | 764 | | | | 32,493 | |
| Williams-Sonoma, Inc.1 | | | 447 | | | | 15,632 | |
| Foot Locker, Inc.1 | | | 508 | | | | 15,535 | |
| Abercrombie & Fitch Co. — Class A1 | | | 345 | | | | 11,778 | |
| BorgWarner, Inc.*,1 | | | 164 | | | | 10,757 | |
| Tempur-Pedic International, Inc.*,1 | | | 327 | | | | 7,649 | |
| Family Dollar Stores, Inc.1 | | | 105 | | | | 6,980 | |
| Total Consumer Discretionary | | | | | | | 13,247,876 | |
| Industrials - 8.4% | | | | | | | | |
| Goodrich Corp.1 | | | 23,703 | | | | 3,007,906 | |
| Cooper Industries plc1 | | | 24,065 | | | | 1,640,751 | |
| Interline Brands, Inc.*,1 | | | 51,411 | | | | 1,288,873 | |
| Northrop Grumman Corp.1 | | | 4,908 | | | | 313,081 | |
| Towers Watson & Co. — Class A1 | | | 5,198 | | | | 311,360 | |
| AGCO Corp.*,1 | | | 6,797 | | | | 310,827 | |
| GATX Corp.1 | | | 8,030 | | | | 309,154 | |
| Stanley Black & Decker, Inc.1 | | | 4,217 | | | | 271,406 | |
| Corrections Corporation of | | | | | | | | |
| America1 | | | 8,869 | | | | 261,192 | |
| Tyco International Ltd.1 | | | 4,654 | | | | 245,964 | |
| Kennametal, Inc.1 | | | 7,161 | | | | 237,388 | |
| Cummins, Inc.1 | | | 2,399 | | | | 232,487 | |
| Republic Services, Inc. — Class A1 | | | 8,397 | | | | 222,185 | |
| Union Pacific Corp.1 | | | 1,697 | | | | 202,470 | |
| FedEx Corp.1 | | | 2,068 | | | | 189,448 | |
| Dover Corp.1 | | | 3,453 | | | | 185,115 | |
| Con-way, Inc.1 | | | 5,101 | | | | 184,197 | |
| WESCO International, Inc.*,1 | | | 3,031 | | | | 174,434 | |
| Caterpillar, Inc.1 | | | 1,963 | | | | 166,678 | |
| Ryder System, Inc.1 | | | 4,587 | | | | 165,178 | |
| Kirby Corp.*,1 | | | 3,356 | | | | 158,000 | |
| WW Grainger, Inc.1 | | | 794 | | | | 151,845 | |
| MSC Industrial Direct | | | | | | | | |
| Company, Inc. — Class A1 | | | 2,170 | | | | 142,244 | |
| Fastenal Co.1 | | | 3,416 | | | | 137,699 | |
| L-3 Communications Holdings, Inc.1 | | | 1,818 | | | | 134,550 | |
| Air Lease Corp. — Class A*,1 | | | 6,840 | | | | 132,628 | |
| Chicago Bridge & Iron | | | | | | | | |
| Company N.V.1 | | | 3,425 | | | | 130,013 | |
| CNH Global N.V.1 | | | 3,344 | | | | 129,948 | |
| Parker Hannifin Corp.1 | | | 1,236 | | | | 95,024 | |
| Kansas City Southern1 | | | 1,236 | | | | 85,976 | |
| United Continental Holdings, Inc.*,1 | | | 2,689 | | | | 65,423 | |
| Armstrong World Industries, Inc.1 | | | 1,311 | | | | 64,449 | |
| Hubbell, Inc. — Class B1 | | | 691 | | | | 53,857 | |
| Norfolk Southern Corp.1 | | | 691 | | | | 49,593 | |
| Gardner Denver, Inc.1 | | | 764 | | | | 40,423 | |
| Cintas Corp.1 | | | 617 | | | | 23,822 | |
| General Electric Co.1 | | | 1,018 | | | | 21,215 | |
| Hertz Global Holdings, Inc.*,1 | | | 917 | | | | 11,738 | |
| WABCO Holdings, Inc.* | | | 9 | | | | 476 | |
| Total Industrials | | | | | | | 11,549,017 | |
| Health Care - 7.8% | | | | | | | | |
| Catalyst Health Solutions, Inc.*,1 | | | 31,463 | | | | 2,939,903 | |
| Gen-Probe, Inc.*,1 | | | 30,861 | | | | 2,536,774 | |
| Amgen, Inc.1 | | | 5,512 | | | | 402,596 | |
| Biogen Idec, Inc.*,1 | | | 2,608 | | | | 376,543 | |
| eResearchTechnology, Inc.*,1 | | | 41,846 | | | | 334,349 | |
| LifePoint Hospitals, Inc.*,1 | | | 7,853 | | | | 321,816 | |
| Coventry Health Care, Inc.1 | | | 9,996 | | | | 317,773 | |
| Cooper Companies, Inc.1 | | | 3,926 | | | | 313,138 | |
| Medtox Scientific, Inc.*,1 | | | 11,224 | | | | 302,599 | |
| Forest Laboratories, Inc.*,1 | | | 7,161 | | | | 250,564 | |
| Agilent Technologies, Inc.1 | | | 5,707 | | | | 223,943 | |
| United Therapeutics Corp.*,1 | | | 3,950 | | | | 195,051 | |
| Pfizer, Inc.1 | | | 8,252 | | | | 189,796 | |
| Gilead Sciences, Inc.*,1 | | | 3,699 | | | | 189,685 | |
| Celgene Corp.*,1 | | | 2,719 | | | | 174,451 | |
| Vertex Pharmaceuticals, Inc.*,1 | | | 3,119 | | | | 174,414 | |
| Sun Healthcare Group, Inc.* | | | 19,646 | | | | 164,437 | |
| Myriad Genetics, Inc.*,1 | | | 6,505 | | | | 154,624 | |
| Endo Health Solutions, Inc.*,1 | | | 4,944 | | | | 153,165 | |
| AmerisourceBergen Corp. — Class A1 | | | 3,781 | | | | 148,783 | |
| 22 | THE GUGGENHEIM FUNDS SEMI-ANNUAL REPORT | SEE NOTES TO FINANCIAL STATEMENTS. |
| consolidated SCHEDULE OF INVESTMENTS (Unaudited) (continued) | June 30, 2012 |
| multi-hedge strategies fund | | |
| | |
Shares | | | Value | |
| Perrigo Co.1 | | | 1,211 | | | $ | 142,813 | |
| Bio-Rad Laboratories, Inc. — | | | | | | | | |
| Class A*,1 | | | 1,417 | | | | 141,714 | |
| Boston Scientific Corp.*,1 | | | 21,084 | | | | 119,546 | |
| Allscripts Healthcare | | | | | | | | |
| Solutions, Inc.*,1 | | | 10,539 | | | | 115,191 | |
| McKesson Corp.1 | | | 1,091 | | | | 102,281 | |
| Aetna, Inc.1 | | | 1,635 | | | | 63,389 | |
| UnitedHealth Group, Inc.1 | | | 436 | | | | 25,506 | |
| Humana, Inc.1 | | | 254 | | | | 19,670 | |
| WellPoint, Inc.1 | | | 291 | | | | 18,563 | |
| Alexion Pharmaceuticals, Inc.*,1 | | | 125 | | | | 12,413 | |
| BioMarin Pharmaceutical, Inc.*,1 | | | 216 | | | | 8,549 | |
| Cigna Corp.1 | | | 145 | | | | 6,380 | |
| Omnicare, Inc.1 | | | 109 | | | | 3,404 | |
| Total Health Care | | | | | | | 10,643,823 | |
| Information Technology - 6.4% | | | | | | | | |
| Ariba, Inc.*,1 | | | 36,113 | | | | 1,616,419 | |
| Standard Microsystems Corp.*,1 | | | 40,825 | | | | 1,506,035 | |
| PLX Technology, Inc.*,1 | | | 54,943 | | | | 348,888 | |
| Alliance Data Systems Corp.*,1 | | | 2,582 | | | | 348,569 | |
| Fidelity National Information | | | | | | | | |
| Services, Inc.1 | | | 9,996 | | | | 340,664 | |
| Ingram Micro, Inc. — Class A*,1 | | | 19,157 | | | | 334,673 | |
| Dell, Inc.*,1 | | | 26,355 | | | | 329,964 | |
| Activision Blizzard, Inc.1 | | | 27,155 | | | | 325,588 | |
| IAC/InterActiveCorp.1 | | | 6,761 | | | | 308,302 | |
| Tech Data Corp.*,1 | | | 6,073 | | | | 292,536 | |
| Symantec Corp.*,1 | | | 19,230 | | | | 280,950 | |
| Equinix, Inc.*,1 | | | 1,345 | | | | 236,249 | |
| Jabil Circuit, Inc.1 | | | 11,378 | | | | 231,314 | |
| Cisco Systems, Inc.1 | | | 12,215 | | | | 209,731 | |
| Intel Corp.1 | | | 7,239 | | | | 192,919 | |
| NVIDIA Corp.*,1 | | | 13,742 | | | | 189,914 | |
| QUALCOMM, Inc.1 | | | 3,344 | | | | 186,194 | |
| Maxim Integrated Products, Inc.1 | | | 6,652 | | | | 170,557 | |
| LeCroy Corp.*,1 | | | 11,714 | | | | 167,042 | |
| Tudou Holdings Ltd. ADR*,1 | | | 4,711 | | | | 157,913 | |
| NeuStar, Inc. — Class A*,1 | | | 4,217 | | | | 140,848 | |
| FleetCor Technologies, Inc.*,1 | | | 3,963 | | | | 138,864 | |
| DST Systems, Inc.1 | | | 2,363 | | | | 128,335 | |
| Avago Technologies Ltd.1 | | | 3,163 | | | | 113,552 | |
| Applied Materials, Inc.1 | | | 8,143 | | | | 93,319 | |
| Xilinx, Inc.1 | | | 2,582 | | | | 86,678 | |
| Adobe Systems, Inc.*,1 | | | 2,145 | | | | 69,434 | |
| Intersil Corp. — Class A1 | | | 6,216 | | | | 66,200 | |
| Synopsys, Inc.*,1 | | | 2,072 | | | | 60,979 | |
| Polycom, Inc.*,1 | | | 4,362 | | | | 45,888 | |
| Motorola Solutions, Inc.1 | | | 909 | | | | 43,732 | |
| Monster Worldwide, Inc.*,1 | | | 2,053 | | | | 17,451 | |
| Diebold, Inc.1 | | | 472 | | | | 17,422 | |
| Global Payments, Inc.1 | | | 36 | | | | 1,556 | |
| Total Information Technology | | | | | | | 8,798,679 | |
| Financials - 6.0% | | | | | | | | |
| Pacific Capital Bancorp*,1 | | | 14,595 | | | | 667,430 | |
| American Capital Ltd.*,1 | | | 35,766 | | | | 360,163 | |
| Hospitality Properties Trust1 | | | 14,249 | | | | 352,948 | |
| Assurant, Inc.1 | | | 9,960 | | | | 347,006 | |
| Torchmark Corp.1 | | | 6,761 | | | | 341,768 | |
| U.S. Bancorp1 | | | 10,579 | | | | 340,221 | |
| American Capital Agency Corp.1 | | | 9,925 | | | | 333,579 | |
| Edelman Financial Group, Inc.1 | | | 38,327 | | | | 333,445 | |
| Allied World Assurance | | | | | | | | |
| Company Holdings AG1 | | | 4,108 | | | | 326,463 | |
| SL Green Realty Corp.1 | | | 4,035 | | | | 323,768 | |
| CNA Financial Corp.1 | | | 11,378 | | | | 315,398 | |
| Encore Bancshares, Inc.*,1 | | | 15,214 | | | | 313,865 | |
| Protective Life Corp.1 | | | 9,960 | | | | 292,923 | |
| NASDAQ OMX Group, Inc.1 | | | 12,541 | | | | 284,305 | |
| Huntington Bancshares, Inc.1 | | | 42,109 | | | | 269,498 | |
| BB&T Corp.1 | | | 8,672 | | | | 267,531 | |
| State Street Corp.1 | | | 5,837 | | | | 260,564 | |
| Washington Federal, Inc.1 | | | 15,379 | | | | 259,751 | |
| Marsh & McLennan | | | | | | | | |
| Companies, Inc.1 | | | 7,658 | | | | 246,818 | |
| American Financial Group, Inc.1 | | | 5,634 | | | | 221,022 | |
| Arch Capital Group Ltd.*,1 | | | 5,126 | | | | 203,451 | |
| Axis Capital Holdings Ltd.1 | | | 6,071 | | | | 197,611 | |
| Douglas Emmett, Inc.1 | | | 8,107 | | | | 187,272 | |
| Discover Financial Services1 | | | 5,162 | | | | 178,502 | |
| Macerich Co.1 | | | 2,872 | | | | 169,592 | |
| MetLife, Inc.1 | | | 4,616 | | | | 142,404 | |
| Assured Guaranty Ltd.1 | | | 8,688 | | | | 122,501 | |
| Annaly Capital Management, Inc.1 | | | 6,769 | | | | 113,584 | |
| BlackRock, Inc. — Class A1 | | | 655 | | | | 111,232 | |
| JPMorgan Chase & Co.1 | | | 2,799 | | | | 100,008 | |
| HCP, Inc.1 | | | 1,490 | | | | 65,784 | |
| Interactive Brokers Group, | | | | | | | | |
| Inc. — Class A1 | | | 3,817 | | | | 56,186 | |
| New York Community | | | | | | | | |
| Bancorp, Inc.1 | | | 4,048 | | | | 50,721 | |
| BOK Financial Corp.1 | | | 830 | | | | 48,306 | |
| Capitol Federal Financial, Inc.1 | | | 2,619 | | | | 31,114 | |
| Simon Property Group, Inc.1 | | | 145 | | | | 22,571 | |
| Prudential Financial, Inc.1 | | | 363 | | | | 17,580 | |
| Total Financials | | | | | | | 8,276,885 | |
| Utilities - 6.0% | | | | | | | | |
| Progress Energy, Inc.1 | | | 71,903 | | | | 4,326,404 | |
| CenterPoint Energy, Inc.1 | | | 23,654 | | | | 488,928 | |
| Pinnacle West Capital Corp.1 | | | 6,470 | | | | 334,758 | |
| ONEOK, Inc.1 | | | 7,912 | | | | 334,757 | |
| DTE Energy Co.1 | | | 5,634 | | | | 334,265 | |
| American Electric Power | | | | | | | | |
| Company, Inc.1 | | | 8,361 | | | | 333,604 | |
| CH Energy Group, Inc. | | | 5,038 | | | | 330,946 | |
| Consolidated Edison, Inc.1 | | | 5,307 | | | | 330,042 | |
| NiSource, Inc.1 | | | 12,360 | | | | 305,910 | |
| American Water Works | | | | | | | | |
| Company, Inc.1 | | | 5,489 | | | | 188,163 | |
| Ameren Corp.1 | | | 5,258 | | | | 176,353 | |
| PPL Corp.1 | | | 6,289 | | | | 174,897 | |
| NRG Energy, Inc.*,1 | | | 6,871 | | | | 119,281 | |
| Entergy Corp.1 | | | 1,590 | | | | 107,945 | |
| Public Service Enterprise Group, Inc.1 | | | 3,207 | | | | 104,228 | |
| SEE NOTES TO FINANCIAL STATEMENTS. | THE GUGGENHEIM FUNDS SEMI-ANNUAL REPORT | 23 |
| consolidated SCHEDULE OF INVESTMENTS (Unaudited) (continued) | June 30, 2012 |
| multi-hedge strategies fund | | |
| | |
Shares | | | Value | |
| NextEra Energy, Inc.1 | | | 1,018 | | | $ | 70,049 | |
| TECO Energy, Inc.1 | | | 2,779 | | | | 50,189 | |
| CMS Energy Corp.1 | | | 1,963 | | | | 46,131 | |
| Vectren Corp.1 | | | 283 | | | | 8,354 | |
| Integrys Energy Group, Inc.1 | | | 142 | | | | 8,076 | |
| MDU Resources Group, Inc.1 | | | 323 | | | | 6,980 | |
| PG&E Corp.1 | | | 144 | | | | 6,519 | |
| SCANA Corp.1 | | | 71 | | | | 3,397 | |
| Total Utilities | | | | | | | 8,190,176 | |
| Telecommunication Services - 3.0% | | | | | | | | |
| AboveNet, Inc.*,1 | | | 39,781 | | | | 3,341,605 | |
| SureWest Communications1 | | | 13,770 | | | | 290,134 | |
| Verizon Communications, Inc.1 | | | 5,017 | | | | 222,955 | |
| HUGHES Telematics, Inc.*,1 | | | 12,575 | | | | 150,271 | |
| United States Cellular Corp.*,1 | | | 3,126 | | | | 120,726 | |
| MetroPCS Communications, Inc.*,1 | | | 1,723 | | | | 10,424 | |
| Total Telecommunication Services | | | | | | | 4,136,115 | |
| Materials - 3.0% | | | | | | | | |
| Solutia, Inc.1 | | | 67,213 | | | | 1,885,325 | |
| CF Industries Holdings, Inc.1 | | | 1,999 | | | | 387,287 | |
| Rockwood Holdings, Inc.1 | | | 5,707 | | | | 253,105 | |
| LyondellBasell Industries | | | | | | | | |
| N.V. — Class A1 | | | 6,144 | | | | 247,419 | |
| Westlake Chemical Corp.1 | | | 4,616 | | | | 241,232 | |
| Reliance Steel & Aluminum Co.1 | | | 4,281 | | | | 216,190 | |
| Huntsman Corp.1 | | | 15,777 | | | | 204,154 | |
| Steel Dynamics, Inc.1 | | | 15,858 | | | | 186,331 | |
| International Paper Co.1 | | | 6,144 | | | | 177,623 | |
| Cliffs Natural Resources, Inc.1 | | | 2,964 | | | | 146,096 | |
| Silgan Holdings, Inc.1 | | | 1,935 | | | | 82,605 | |
| Intrepid Potash, Inc.*,1 | | | 2,844 | | | | 64,729 | |
| Bemis Company, Inc.1 | | | 491 | | | | 15,388 | |
| Nucor Corp.1 | | | 313 | | | | 11,863 | |
| Total Materials | | | | | | | 4,119,347 | |
| Consumer Staples - 2.6% | | | | | | | | |
| Coca-Cola Enterprises, Inc.1 | | | 12,650 | | | | 354,706 | |
| Kraft Foods, Inc. — Class A1 | | | 8,652 | | | | 334,140 | |
| ConAgra Foods, Inc.1 | | | 12,759 | | | | 330,841 | |
| Smithfield Foods, Inc.*,1 | | | 13,741 | | | | 297,218 | |
| Constellation Brands, Inc. — | | | | | | | | |
| Class A*,1 | | | 10,833 | | | | 293,141 | |
| Lorillard, Inc.1 | | | 2,032 | | | | 268,123 | |
| CVS Caremark Corp.1 | | | 5,489 | | | | 256,501 | |
| Archer-Daniels-Midland Co.1 | | | 7,743 | | | | 228,573 | |
| Philip Morris International, Inc.1 | | | 2,341 | | | | 204,276 | |
| Reynolds American, Inc.1 | | | 4,137 | | | | 185,627 | |
| Kimberly-Clark Corp.1 | | | 2,043 | | | | 171,142 | |
| Church & Dwight Company, Inc.1 | | | 2,945 | | | | 163,359 | |
| Herbalife Ltd.1 | | | 3,126 | | | | 151,080 | |
| Clorox Co.1 | | | 1,577 | | | | 114,269 | |
| Energizer Holdings, Inc.*,1 | | | 1,419 | | | | 106,780 | |
| Walgreen Co.1 | | | 2,116 | | | | 62,591 | |
| Procter & Gamble Co.1 | | | 323 | | | | 19,784 | |
| Estee Lauder Companies, | | | | | | | | |
| Inc. — Class A1 | | | 145 | | | | 7,847 | |
| Altria Group, Inc.1 | | | 216 | | | | 7,463 | |
| Total Consumer Staples | | | | | | | 3,557,461 | |
| Energy - 1.3% | | | | | | | | |
| Tesoro Corp.*,1 | | | 14,541 | | | | 362,943 | |
| Valero Energy Corp.1 | | | 12,905 | | | | 311,656 | |
| Chevron Corp.1 | | | 2,399 | | | | 253,094 | |
| Marathon Oil Corp.1 | | | 9,548 | | | | 244,142 | |
| Unit Corp.*,1 | | | 4,799 | | | | 177,036 | |
| Patterson-UTI Energy, Inc.1 | | | 8,397 | | | | 122,261 | |
| ConocoPhillips1 | | | 2,036 | | | | 113,772 | |
| National Oilwell Varco, Inc.1 | | | 1,300 | | | | 83,772 | |
| Spectra Energy Corp.1 | | | 2,036 | | | | 59,166 | |
| Helmerich & Payne, Inc.1 | | | 613 | | | | 26,653 | |
| SM Energy Co.1 | | | 363 | | | | 17,827 | |
| Williams Companies, Inc.1 | | | 73 | | | | 2,104 | |
| Total Energy | | | | | | | 1,774,426 | |
| Total Common Stocks | | | | | | | | |
| (Cost $72,036,723) | | | | | | | 74,293,805 | |
| EXCHANGE TRADED FUNDS† 0.9% | | | | | | | | |
| iShares MSCI United Kingdom | | | | | | | | |
| Index Fund1 | | | 28,877 | | | | 470,406 | |
| iShares MSCI Mexico Investable | | | | | | | | |
| Market Index Fund1 | | | 4,465 | | | | 274,374 | |
| iShares MSCI South Africa | | | | | | | | |
| Index Fund1 | | | 2,405 | | | | 153,680 | |
| iShares MSCI Singapore | | | | | | | | |
| Index Fund1 | | | 11,507 | | | | 141,766 | |
| iShares MSCI South Korea | | | | | | | | |
| Index Fund1 | | | 2,563 | | | | 140,478 | |
| Vanguard MSCI Emerging | | | | | | | | |
| Markets ETF1 | | | 1,995 | | | | 79,700 | |
| iShares MSCI Malaysia Index Fund1 | | | 1,675 | | | | 23,902 | |
| Total Exchange Traded Funds | | | | | | | | |
| (Cost $1,293,305) | | | | | | | 1,284,306 | |
| CLOSED-END FUNDS† 16.4% | | | | | | | | |
| India Fund, Inc.1 | | | 60,268 | | | | 1,228,263 | |
| BlackRock Enhanced Equity | | | | | | | | |
| Dividend Trust1 | | | 165,851 | | | | 1,200,762 | |
| Eaton Vance Risk-Managed Diversified | | | | | | | | |
| Equity Income Fund1 | | | 115,633 | | | | 1,185,237 | |
| Royce Value Trust, Inc.1 | | | 92,820 | | | | 1,156,537 | |
| CBRE Clarion Global Real | | | | | | | | |
| Estate Income Fund1 | | | 142,115 | | | | 1,125,551 | |
| Liberty All Star Equity Fund1 | | | 231,664 | | | | 1,044,805 | |
| Zweig Total Return Fund, Inc.1 | | | 77,719 | | | | 955,170 | |
| Gabelli Dividend & Income Trust1 | | | 61,063 | | | | 947,087 | |
| Eaton Vance Enhanced Equity | | | | | | | | |
| Income Fund II1 | | | 88,977 | | | | 944,936 | |
| Adams Express Co.1 | | | 88,174 | | | | 930,236 | |
| Western Asset/Claymore | | | | | | | | |
| Inflation-Linked Opportunities & | | | | | | | | |
| Income Fund1 | | | 69,195 | | | | 902,995 | |
| Eaton Vance Enhanced | | | | | | | | |
| Equity Income Fund1 | | | 79,851 | | | | 846,421 | |
| AGIC Equity & Convertible | | | | | | | | |
| Income Fund1 | | | 42,191 | | | | 696,995 | |
| Zweig Fund, Inc.1 | | | 47,979 | | | | 575,268 | |
| General American Investors | | | | | | | | |
| Company, Inc.1 | | | 20,797 | | | | 567,758 | |
| 24 | THE GUGGENHEIM FUNDS SEMI-ANNUAL REPORT | SEE NOTES TO FINANCIAL STATEMENTS. |
| consolidated SCHEDULE OF INVESTMENTS (Unaudited) (continued) | June 30, 2012 |
| multi-hedge strategies fund | | |
| | |
Shares | | | Value | |
| BlackRock Credit Allocation | | | | | | | | |
| Income Trust IV1 | | | 39,424 | | | $ | 522,368 | |
| Advent Claymore Convertible | | | | | | | | |
| Securities and Income Fund1, 4 | | | 32,993 | | | | 506,113 | |
| Calamos Strategic Total | | | | | | | | |
| Return Fund1 | | | 48,856 | | | | 471,460 | |
| Western Asset/Claymore | | | | | | | | |
| Inflation-Linked Securities & | | | | | | | | |
| Income Fund1, 4 | | | 35,557 | | | | 462,241 | |
| BlackRock Enhanced Capital and | | | | | | | | |
| Income Fund, Inc.1 | | | 34,516 | | | | 441,805 | |
| John Hancock Bank and Thrift | | | | | | | | |
| Opportunity Fund1 | | | 26,767 | | | | 439,782 | |
| First Trust Enhanced Equity | | | | | | | | |
| Income Fund1 | | | 35,010 | | | | 412,068 | |
| Tri-Continental Corp.1 | | | 26,126 | | | | 404,169 | |
| BlackRock Credit Allocation | | | | | | | | |
| Income Trust II, Inc.1 | | | 32,109 | | | | 348,383 | |
| GDL Fund1 | | | 26,531 | | | | 315,984 | |
| Cohen & Steers Dividend | | | | | | | | |
| Majors Fund, Inc.1 | | | 21,539 | | | | 307,362 | |
| Japan Smaller Capitalization | | | | | | | | |
| Fund, Inc.1 | | | 39,516 | | | | 292,023 | |
| Source Capital, Inc.1 | | | 5,854 | | | | 287,490 | |
| Thai Fund, Inc.1 | | | 16,372 | | | | 262,607 | |
| Nuveen Tax-Advantaged Total | | | | | | | | |
| Return Strategy Fund1 | | | 25,719 | | | | 259,248 | |
| Royce Micro-Capital Trust, Inc.1 | | | 28,023 | | | | 250,249 | |
| Swiss Helvetia Fund, Inc.1 | | | 23,598 | | | | 239,048 | |
| Clough Global Allocation Fund1 | | | 16,876 | | | | 219,219 | |
| Lazard Global Total Return and | | | | | | | | |
| Income Fund, Inc.1 | | | 15,273 | | | | 215,960 | |
| H&Q Healthcare Investors1 | | | 11,922 | | | | 205,893 | |
| Madison/Claymore Covered Call & | | | | | | | | |
| Equity Strategy Fund1, 4 | | | 24,833 | | | | 189,476 | |
| Ellsworth Fund Ltd.1 | | | 24,565 | | | | 172,938 | |
| Gabelli Healthcare & | | | | | | | | |
| WellnessRx Trust1 | | | 18,336 | | | | 153,839 | |
| Liberty All Star Growth Fund, Inc.1 | | | 30,209 | | | | 120,534 | |
| John Hancock Hedged Equity & | | | | | | | | |
| Income Fund1 | | | 7,332 | | | | 115,112 | |
| Bancroft Fund Ltd.1 | | | 7,086 | | | | 113,022 | |
| Madison Strategic Sector | | | | | | | | |
| Premium Fund1 | | | 8,623 | | | | 95,025 | |
| Royce Focus Trust, Inc.1 | | | 10,744 | | | | 67,365 | |
| Clough Global Opportunities Fund1 | | | 6,204 | | | | 66,693 | |
| Dividend and Income Fund1 | | | 18,405 | | | | 61,841 | |
| BlackRock Credit Allocation | | | | | | | | |
| Income Trust III, Inc.1 | | | 4,528 | | | | 51,619 | |
| Diamond Hill Financial | | | | | | | | |
| Trends Fund, Inc.1 | | | 3,983 | | | | 39,870 | |
| Total Closed-End Funds | | | | | | | | |
| (Cost $21,482,770) | | | | | | | 22,418,827 | |
| | | Face
Amount | | | Value | |
| REPURCHASE AGREEMENTS††,2 17.9% | | | | | | | | |
| HSBC Group | | | | | | | | |
| issued 06/29/12 at 0.12% | | | | | | | | |
| due 07/02/12 | | $ | 12,499,525 | | | $ | 12,499,525 | |
| Mizuho Financial Group, Inc. | | | | | | | | |
| issued 06/29/12 at 0.12% | | | | | | | | |
| due 07/02/12 | | | 5,330,604 | | | | 5,330,604 | |
| Deutsche Bank | | | | | | | | |
| issued 06/29/12 at 0.10% | | | | | | | | |
| due 07/02/12 | | | 3,529,647 | | | | 3,529,647 | |
| Credit Suisse Group | | | | | | | | |
| issued 06/29/12 at 0.08% | | | | | | | | |
| due 07/02/12 | | | 3,139,640 | | | | 3,139,640 | |
| Total Repurchase Agreements | | | | | | | | |
| (Cost $24,499,416) | | | | | | | 24,499,416 | |
| Total Long Investments 88.0% | | | | | | | | |
| (Cost $119,312,214) | | | | | | $ | 122,496,354 | |
| | |
Shares | | | | |
| COMMON STOCKS SOLD SHORT† (32.4)% | | | | | | | | |
| Telecommunication Services (0.6)% | | | | | | | | |
| NII Holdings, Inc.* | | | 1,524 | | | | (15,591 | ) |
| Sprint Nextel Corp.* | | | 19,417 | | | | (63,299 | ) |
| Windstream Corp. | | | 17,138 | | | | (165,553 | ) |
| tw telecom, Inc. — Class A* | | | 6,732 | | | | (172,743 | ) |
| Crown Castle International Corp.* | | | 3,044 | | | | (178,561 | ) |
| SBA Communications | | | | | | | | |
| Corp. — Class A* | | | 3,256 | | | | (185,755 | ) |
| Total Telecommunication Services | | | | | | | (781,502 | ) |
| Energy - (1.5)% | | | | | | | | |
| Nabors Industries Ltd.* | | | 79 | | | | (1,138 | ) |
| Halliburton Co. | | | 250 | | | | (7,098 | ) |
| Cabot Oil & Gas Corp. | | | 181 | | | | (7,131 | ) |
| Hess Corp. | | | 254 | | | | (11,036 | ) |
| Newfield Exploration Co.* | | | 546 | | | | (16,003 | ) |
| Oil States International, Inc.* | | | 244 | | | | (16,153 | ) |
| QEP Resources, Inc. | | | 654 | | | | (19,600 | ) |
| Atwood Oceanics, Inc.* | | | 534 | | | | (20,207 | ) |
| Tidewater, Inc. | | | 655 | | | | (30,366 | ) |
| Cobalt International Energy, Inc.* | | | 1,648 | | | | (38,728 | ) |
| Forest Oil Corp.* | | | 5,350 | | | | (39,216 | ) |
| Oceaneering International, Inc. | | | 863 | | | | (41,303 | ) |
| Schlumberger Ltd. | | | 691 | | | | (44,853 | ) |
| Arch Coal, Inc. | | | 8,042 | | | | (55,409 | ) |
| Ultra Petroleum Corp.* | | | 3,202 | | | | (73,870 | ) |
| Cimarex Energy Co. | | | 1,565 | | | | (86,263 | ) |
| Core Laboratories N.V. | | | 831 | | | | (96,313 | ) |
| Alpha Natural Resources, Inc.* | | | 12,772 | | | | (111,245 | ) |
| FMC Technologies, Inc.* | | | 3,166 | | | | (124,202 | ) |
| Teekay Corp. | | | 4,670 | | | | (136,738 | ) |
| Range Resources Corp. | | | 2,219 | | | | (137,290 | ) |
| Kosmos Energy Ltd.* | | | 13,099 | | | | (144,744 | ) |
| Cameron International Corp.* | | | 3,421 | | | | (146,111 | ) |
| SEACOR Holdings, Inc.* | | | 1,637 | | | | (146,314 | ) |
| SEE NOTES TO FINANCIAL STATEMENTS. | THE GUGGENHEIM FUNDS SEMI-ANNUAL REPORT | 25 |
| consolidated SCHEDULE OF INVESTMENTS (Unaudited) (continued) | June 30, 2012 |
| multi-hedge strategies fund | | |
| | |
Shares | | | Value | |
| Dresser-Rand Group, Inc.* | | | 3,566 | | | $ | (158,829 | ) |
| Anadarko Petroleum Corp. | | | 2,620 | | | | (173,444 | ) |
| Southwestern Energy Co.* | | | 6,440 | | | | (205,629 | ) |
| Total Energy | | | | | | | (2,089,233 | ) |
| Consumer Staples - (1.5)% | | | | | | | | |
| Avon Products, Inc. | | | 2,656 | | | | (43,054 | ) |
| Hillshire Brands Co. | | | 1,754 | | | | (50,843 | ) |
| Campbell Soup Co. | | | 1,637 | | | | (54,643 | ) |
| PepsiCo, Inc. | | | 1,128 | | | | (79,704 | ) |
| DE Master Blenders 1753 N.V.* | | | 8,769 | | | | (100,668 | ) |
| Mead Johnson Nutrition Co. — | | | | | | | | |
| Class A | | | 1,637 | | | | (131,795 | ) |
| Molson Coors Brewing Co. — | | | | | | | | |
| Class B | | | 3,385 | | | | (140,850 | ) |
| Colgate-Palmolive Co. | | | 1,359 | | | | (141,472 | ) |
| HJ Heinz Co. | | | 2,765 | | | | (150,361 | ) |
| Kellogg Co. | | | 3,093 | | | | (152,578 | ) |
| Flowers Foods, Inc. | | | 7,205 | | | | (167,372 | ) |
| Hershey Co. | | | 2,402 | | | | (173,016 | ) |
| Coca-Cola Co. | | | 2,219 | | | | (173,504 | ) |
| Sysco Corp. | | | 5,822 | | | | (173,554 | ) |
| Dean Foods Co.* | | | 10,479 | | | | (178,457 | ) |
| McCormick & Company, Inc. | | | 2,948 | | | | (178,796 | ) |
| Total Consumer Staples | | | | | | | (2,090,667 | ) |
| Materials - (2.3)% | | | | | | | | |
| Freeport-McMoRan Copper & | | | | | | | | |
| Gold, Inc. | | | 24 | | | | (818 | ) |
| Cabot Corp. | | | 165 | | | | (6,716 | ) |
| MeadWestvaco Corp. | | | 364 | | | | (10,465 | ) |
| Greif, Inc. — Class A | | | 364 | | | | (14,924 | ) |
| Sigma-Aldrich Corp. | | | 292 | | | | (21,588 | ) |
| Newmont Mining Corp. | | | 509 | | | | (24,692 | ) |
| Rock-Tenn Co. — Class A | | | 541 | | | | (29,512 | ) |
| FMC Corp. | | | 655 | | | | (35,029 | ) |
| Ball Corp. | | | 1,380 | | | | (56,649 | ) |
| Sonoco Products Co. | | | 1,929 | | | | (58,159 | ) |
| Packaging Corporation of America | | | 2,159 | | | | (60,970 | ) |
| Compass Minerals | | | | | | | | |
| International, Inc. | | | 1,237 | | | | (94,358 | ) |
| International Flavors & | | | | | | | | |
| Fragrances, Inc. | | | 1,724 | | | | (94,475 | ) |
| Southern Copper Corp. | | | 3,748 | | | | (118,099 | ) |
| Praxair, Inc. | | | 1,128 | | | | (122,647 | ) |
| Carpenter Technology Corp. | | | 2,811 | | | | (134,478 | ) |
| WR Grace & Co.* | | | 2,692 | | | | (135,811 | ) |
| Ashland, Inc. | | | 2,001 | | | | (138,689 | ) |
| Ecolab, Inc. | | | 2,147 | | | | (147,134 | ) |
| Allied Nevada Gold Corp.* | | | 5,640 | | | | (160,063 | ) |
| Scotts Miracle-Gro Co. — Class A | | | 3,971 | | | | (163,288 | ) |
| Royal Gold, Inc. | | | 2,165 | | | | (169,736 | ) |
| Titanium Metals Corp. | | | 15,102 | | | | (170,804 | ) |
| Valspar Corp. | | | 3,276 | | | | (171,957 | ) |
| Owens-Illinois, Inc.* | | | 9,359 | | | | (179,412 | ) |
| Crown Holdings, Inc.* | | | 5,491 | | | | (189,384 | ) |
| Martin Marietta Materials, Inc. | | | 2,511 | | | | (197,917 | ) |
| Eastman Chemical Co. | | | 8,075 | | | | (406,738 | ) |
| Total Materials | | | | | | | (3,114,512 | ) |
| | | | | | | | | |
| Consumer Discretionary - (3.4)% | | | | | | | | |
| Netflix, Inc.* | | | 109 | | | | (7,463 | ) |
| Choice Hotels International, Inc. | | | 288 | | | | (11,500 | ) |
| Hyatt Hotels Corp. — Class A* | | | 364 | | | | (13,526 | ) |
| PulteGroup, Inc.* | | | 1,275 | | | | (13,643 | ) |
| DeVry, Inc. | | | 546 | | | | (16,910 | ) |
| Panera Bread Co. — Class A* | | | 145 | | | | (20,219 | ) |
| Yum! Brands, Inc. | | | 328 | | | | (21,130 | ) |
| Career Education Corp.* | | | 3,202 | | | | (21,421 | ) |
| Lennar Corp. — Class A | | | 1,200 | | | | (37,092 | ) |
| Whirlpool Corp. | | | 618 | | | | (37,797 | ) |
| TJX Companies, Inc. | | | 1,019 | | | | (43,746 | ) |
| JC Penney Company, Inc. | | | 1,927 | | | | (44,918 | ) |
| Gentex Corp. | | | 2,578 | | | | (53,803 | ) |
| Lear Corp. | | | 1,428 | | | | (53,878 | ) |
| Lamar Advertising Co. — Class A* | | | 1,965 | | | | (56,199 | ) |
| CarMax, Inc.* | | | 2,175 | | | | (56,420 | ) |
| Service Corporation International | | | 4,797 | | | | (59,339 | ) |
| Ross Stores, Inc. | | | 1,383 | | | | (86,396 | ) |
| Goodyear Tire & Rubber Co.* | | | 7,538 | | | | (89,024 | ) |
| WMS Industries, Inc.* | | | 4,529 | | | | (90,354 | ) |
| Under Armour, Inc. — Class A* | | | 1,128 | | | | (106,574 | ) |
| Starbucks Corp. | | | 2,001 | | | | (106,693 | ) |
| Darden Restaurants, Inc. | | | 2,110 | | | | (106,829 | ) |
| Federal-Mogul Corp.* | | | 9,825 | | | | (108,075 | ) |
| Tiffany & Co. | | | 2,475 | | | | (131,051 | ) |
| Johnson Controls, Inc. | | | 4,858 | | | | (134,615 | ) |
| Cablevision Systems Corp. — | | | | | | | | |
| Class A | | | 10,443 | | | | (138,787 | ) |
| Madison Square Garden Co. — | | | | | | | | |
| Class A* | | | 3,784 | | | | (141,673 | ) |
| Visteon Corp.* | | | 4,221 | | | | (158,288 | ) |
| Newell Rubbermaid, Inc. | | | 8,733 | | | | (158,417 | ) |
| Urban Outfitters, Inc.* | | | 5,749 | | | | (158,615 | ) |
| Apollo Group, Inc. — Class A* | | | 4,478 | | | | (162,059 | ) |
| Bally Technologies, Inc.* | | | 3,493 | | | | (162,983 | ) |
| Washington Post Co. — Class B | | | 437 | | | | (163,359 | ) |
| Liberty Global, Inc. — Class A* | | | 3,347 | | | | (166,112 | ) |
| Weight Watchers International, Inc. | | | 3,224 | | | | (166,229 | ) |
| Morningstar, Inc. | | | 2,911 | | | | (168,373 | ) |
| Amazon.com, Inc.* | | | 765 | | | | (174,688 | ) |
| NVR, Inc.* | | | 206 | | | | (175,100 | ) |
| Marriott International, Inc. — | | | | | | | | |
| Class A | | | 4,497 | | | | (176,282 | ) |
| American Eagle Outfitters, Inc. | | | 8,951 | | | | (176,603 | ) |
| DreamWorks Animation SKG, | | | | | | | | |
| Inc. — Class A* | | | 9,424 | | | | (179,621 | ) |
| ITT Educational Services, Inc.* | | | 3,106 | | | | (188,689 | ) |
| H&R Block, Inc. | | | 19,993 | | | | (319,488 | ) |
| Total Consumer Discretionary | | | | | | | (4,663,981 | ) |
| Health Care - (3.6)% | | | | | | | | |
| Allergan, Inc. | | | 254 | | | | (23,513 | ) |
| DENTSPLY International, Inc. | | | 765 | | | | (28,925 | ) |
| Stryker Corp. | | | 546 | | | | (30,085 | ) |
| Varian Medical Systems, Inc.* | | | 509 | | | | (30,932 | ) |
| Johnson & Johnson | | | 765 | | | | (51,683 | ) |
| Quest Diagnostics, Inc. | | | 1,164 | | | | (69,724 | ) |
| CR Bard, Inc. | | | 837 | | | | (89,927 | ) |
| 26 | THE GUGGENHEIM FUNDS SEMI-ANNUAL REPORT | SEE NOTES TO FINANCIAL STATEMENTS. |
| consolidated SCHEDULE OF INVESTMENTS (Unaudited) (continued) | June 30, 2012 |
| multi-hedge strategies fund | | |
| | |
Shares | | | Value | |
| Health Net, Inc.* | | | 3,784 | | | $ | (91,838 | ) |
| Alere, Inc.* | | | 4,730 | | | | (91,951 | ) |
| Community Health Systems, Inc.* | | | 3,359 | | | | (94,153 | ) |
| Tenet Healthcare Corp.* | | | 19,214 | | | | (100,681 | ) |
| Regeneron Pharmaceuticals, Inc.* | | | 946 | | | | (108,052 | ) |
| Amylin Pharmaceuticals, Inc.* | | | 3,870 | | | | (109,250 | ) |
| Illumina, Inc.* | | | 2,984 | | | | (120,524 | ) |
| Laboratory Corporation of | | | | | | | | |
| America Holdings* | | | 1,601 | | | | (148,269 | ) |
| Mylan, Inc.* | | | 7,023 | | | | (150,082 | ) |
| Bruker Corp.* | | | 11,317 | | | | (150,629 | ) |
| Warner Chilcott plc — Class A* | | | 8,697 | | | | (155,850 | ) |
| AMERIGROUP Corp.* | | | 2,366 | | | | (155,943 | ) |
| Teleflex, Inc. | | | 2,801 | | | | (170,609 | ) |
| Lincare Holdings, Inc. | | | 5,167 | | | | (175,781 | ) |
| Brookdale Senior Living, Inc. — | | | | | | | | |
| Class A* | | | 9,970 | | | | (176,868 | ) |
| Hospira, Inc.* | | | 5,167 | | | | (180,742 | ) |
| Techne Corp. | | | 2,511 | | | | (186,316 | ) |
| Edwards Lifesciences Corp.* | | | 1,808 | | | | (186,766 | ) |
| SXC Health Solutions Corp.* | | | 20,801 | | | | (2,063,667 | ) |
| Total Health Care | | | | | | | (4,942,760 | ) |
| Industrials - (4.1)% | | | | | | | | |
| Deere & Co. | | | 36 | | | | (2,911 | ) |
| Equifax, Inc. | | | 290 | | | | (13,514 | ) |
| Precision Castparts Corp. | | | 109 | | | | (17,929 | ) |
| General Cable Corp.* | | | 838 | | | | (21,738 | ) |
| GrafTech International Ltd.* | | | 3,057 | | | | (29,500 | ) |
| United Technologies Corp. | | | 401 | | | | (30,288 | ) |
| IDEX Corp. | | | 946 | | | | (36,875 | ) |
| CSX Corp. | | | 1,788 | | | | (39,980 | ) |
| J.B. Hunt Transport Services, Inc. | | | 765 | | | | (45,594 | ) |
| Emerson Electric Co. | | | 1,092 | | | | (50,865 | ) |
| Terex Corp.* | | | 2,899 | | | | (51,689 | ) |
| Quanta Services, Inc.* | | | 2,257 | | | | (54,326 | ) |
| Snap-on, Inc. | | | 874 | | | | (54,407 | ) |
| URS Corp. | | | 1,965 | | | | (68,539 | ) |
| Spirit Aerosystems Holdings, Inc. — | | | | | | | | |
| Class A* | | | 3,347 | | | | (79,759 | ) |
| CH Robinson Worldwide, Inc. | | | 1,383 | | | | (80,947 | ) |
| Roper Industries, Inc. | | | 831 | | | | (81,920 | ) |
| Joy Global, Inc. | | | 1,528 | | | | (86,683 | ) |
| Landstar System, Inc. | | | 1,733 | | | | (89,631 | ) |
| Nielsen Holdings N.V.* | | | 3,748 | | | | (98,273 | ) |
| Jacobs Engineering Group, Inc.* | | | 2,840 | | | | (107,522 | ) |
| Oshkosh Corp.* | | | 5,240 | | | | (109,778 | ) |
| 3M Co. | | | 1,273 | | | | (114,061 | ) |
| Boeing Co. | | | 1,601 | | | | (118,954 | ) |
| Babcock & Wilcox Co.* | | | 5,094 | | | | (124,803 | ) |
| Pentair, Inc. | | | 3,311 | | | | (126,745 | ) |
| Lennox International, Inc. | | | 2,765 | | | | (128,932 | ) |
| Manpower, Inc. | | | 3,711 | | | | (136,008 | ) |
| Rockwell Collins, Inc. | | | 2,765 | | | | (136,453 | ) |
| Southwest Airlines Co. | | | 14,992 | | | | (138,226 | ) |
| UTI Worldwide, Inc. | | | 9,486 | | | | (138,590 | ) |
| Avery Dennison Corp. | | | 5,276 | | | | (144,246 | ) |
| Shaw Group, Inc.* | | | 5,421 | | | | (148,048 | ) |
| Iron Mountain, Inc. | | | 4,621 | | | | (152,308 | ) |
| Expeditors International of | | | | | | | | |
| Washington, Inc. | | | 4,003 | | | | (155,116 | ) |
| Crane Co. | | | 4,476 | | | | (162,837 | ) |
| Toro Co. | | | 2,257 | | | | (165,416 | ) |
| Honeywell International, Inc. | | | 3,020 | | | | (168,637 | ) |
| Ingersoll-Rand plc | | | 4,003 | | | | (168,847 | ) |
| United Parcel Service, Inc. — | | | | | | | | |
| Class B | | | 2,165 | | | | (170,515 | ) |
| Dun & Bradstreet Corp. | | | 2,402 | | | | (170,950 | ) |
| Stericycle, Inc.* | | | 1,892 | | | | (173,440 | ) |
| Harsco Corp. | | | 8,552 | | | | (174,290 | ) |
| Flowserve Corp. | | | 1,528 | | | | (175,338 | ) |
| Masco Corp. | | | 12,706 | | | | (176,232 | ) |
| Manitowoc Company, Inc. | | | 16,520 | | | | (193,284 | ) |
| Eaton Corp. | | | 18,665 | | | | (739,693 | ) |
| Total Industrials | | | | | | | (5,654,637 | ) |
| Information Technology - (4.3)% | | | | | | | | |
| Juniper Networks, Inc.* | | | 182 | | | | (2,968 | ) |
| Arrow Electronics, Inc.* | | | 133 | | | | (4,364 | ) |
| Yahoo!, Inc.* | | | 595 | | | | (9,419 | ) |
| Advanced Micro Devices, Inc.* | | | 2,110 | | | | (12,090 | ) |
| Vishay Intertechnology, Inc.* | | | 1,396 | | | | (13,164 | ) |
| Amphenol Corp. — Class A | | | 290 | | | | (15,927 | ) |
| AOL, Inc.* | | | 582 | | | | (16,343 | ) |
| Western Union Co. | | | 1,383 | | | | (23,290 | ) |
| Marvell Technology Group Ltd. | | | 2,074 | | | | (23,395 | ) |
| Riverbed Technology, Inc.* | | | 1,748 | | | | (28,230 | ) |
| LSI Corp.* | | | 5,263 | | | | (33,525 | ) |
| Microchip Technology, Inc. | | | 1,019 | | | | (33,709 | ) |
| KLA-Tencor Corp. | | | 743 | | | | (36,593 | ) |
| Linear Technology Corp. | | | 1,237 | | | | (38,755 | ) |
| VeriSign, Inc.* | | | 1,019 | | | | (44,398 | ) |
| Electronic Arts, Inc.* | | | 4,512 | | | | (55,723 | ) |
| Citrix Systems, Inc.* | | | 727 | | | | (61,024 | ) |
| MICROS Systems, Inc.* | | | 1,347 | | | | (68,966 | ) |
| Xerox Corp. | | | 9,213 | | | | (72,506 | ) |
| Informatica Corp.* | | | 1,856 | | | | (78,620 | ) |
| Hewlett-Packard Co. | | | 4,148 | | | | (83,416 | ) |
| WebMD Health Corp. — Class A* | | | 4,231 | | | | (86,778 | ) |
| Trimble Navigation Ltd.* | | | 1,929 | | | | (88,753 | ) |
| IPG Photonics Corp.* | | | 2,426 | | | | (105,749 | ) |
| Micron Technology, Inc.* | | | 16,848 | | | | (106,311 | ) |
| CoreLogic, Inc.* | | | 6,659 | | | | (121,926 | ) |
| PMC - Sierra, Inc.* | | | 20,596 | | | | (126,459 | ) |
| ON Semiconductor Corp.* | | | 17,939 | | | | (127,367 | ) |
| Atmel Corp.* | | | 19,479 | | | | (130,509 | ) |
| NetApp, Inc.* | | | 4,123 | | | | (131,194 | ) |
| FactSet Research Systems, Inc. | | | 1,419 | | | | (131,882 | ) |
| MEMC Electronic Materials, Inc.* | | | 61,241 | | | | (132,893 | ) |
| Cree, Inc.* | | | 5,203 | | | | (133,561 | ) |
| Cognizant Technology | | | | | | | | |
| Solutions Corp. — Class A* | | | 2,328 | | | | (139,680 | ) |
| Lender Processing Services, Inc. | | | 5,531 | | | | (139,824 | ) |
| Ciena Corp.* | | | 8,588 | | | | (140,586 | ) |
| SEE NOTES TO FINANCIAL STATEMENTS. | THE GUGGENHEIM FUNDS SEMI-ANNUAL REPORT | 27 |
| consolidated SCHEDULE OF INVESTMENTS (Unaudited) (continued) | June 30, 2012 |
| multi-hedge strategies fund | | |
| | |
Shares | | | Value | |
| Akamai Technologies, Inc.* | | | 4,428 | | | $ | (140,589 | ) |
| Acme Packet, Inc.* | | | 7,562 | | | | (141,031 | ) |
| Broadridge Financial Solutions, Inc. | | | 6,744 | | | | (143,445 | ) |
| Rovi Corp.* | | | 7,751 | | | | (152,075 | ) |
| FLIR Systems, Inc. | | | 8,260 | | | | (161,070 | ) |
| Integrated Device Technology, Inc.* | | | 28,874 | | | | (162,272 | ) |
| Youku, Inc. ADR* | | | 7,521 | | | | (163,055 | ) |
| SAIC, Inc. | | | 13,500 | | | | (163,620 | ) |
| Paychex, Inc. | | | 5,240 | | | | (164,588 | ) |
| Tellabs, Inc. | | | 49,670 | | | | (165,401 | ) |
| Solera Holdings, Inc. | | | 4,003 | | | | (167,285 | ) |
| International Rectifier Corp.* | | | 8,479 | | | | (169,495 | ) |
| Computer Sciences Corp. | | | 6,841 | | | | (169,794 | ) |
| National Instruments Corp. | | | 6,514 | | | | (174,966 | ) |
| Silicon Laboratories, Inc.* | | | 4,621 | | | | (175,136 | ) |
| Salesforce.com, Inc.* | | | 1,273 | | | | (176,006 | ) |
| JDS Uniphase Corp.* | | | 16,812 | | | | (184,932 | ) |
| Itron, Inc.* | | | 4,597 | | | | (189,581 | ) |
| Zebra Technologies Corp. — | | | | | | | | |
| Class A* | | | 8,083 | | | | (277,732 | ) |
| Total Information Technology | | | | | | | (5,841,970 | ) |
| Utilities - (4.4)% | | | | | | | | |
| Westar Energy, Inc. | | | 582 | | | | (17,431 | ) |
| Great Plains Energy, Inc. | | | 863 | | | | (18,477 | ) |
| Alliant Energy Corp. | | | 1,263 | | | | (57,555 | ) |
| N.V. Energy, Inc. | | | 4,257 | | | | (74,838 | ) |
| Exelon Corp. | | | 2,079 | | | | (78,212 | ) |
| AES Corp.* | | | 6,102 | | | | (78,289 | ) |
| Aqua America, Inc. | | | 3,201 | | | | (79,897 | ) |
| National Fuel Gas Co. | | | 1,965 | | | | (92,316 | ) |
| Questar Corp. | | | 4,949 | | | | (103,236 | ) |
| AGL Resources, Inc. | | | 3,894 | | | | (150,893 | ) |
| Hawaiian Electric Industries, Inc. | | | 5,386 | | | | (153,609 | ) |
| Calpine Corp.* | | | 9,752 | | | | (161,006 | ) |
| ITC Holdings Corp. | | | 2,402 | | | | (165,522 | ) |
| Dominion Resources, Inc. | | | 3,117 | | | | (168,318 | ) |
| UGI Corp. | | | 5,749 | | | | (169,193 | ) |
| Northeast Utilities | | | 4,402 | | | | (170,842 | ) |
| Duke Energy Corp. | | | 188,078 | | | | (4,337,079 | ) |
| Total Utilities | | | | | | | (6,076,713 | ) |
| Financials - (6.7)% | | | | | | | | |
| Piedmont Office Realty Trust, Inc. — | | | | | | | | |
| Class A | | | 67 | | | | (1,153 | ) |
| St. Joe Co.* | | | 145 | | | | (2,292 | ) |
| Regions Financial Corp. | | | 454 | | | | (3,065 | ) |
| PNC Financial Services Group, Inc. | | | 71 | | | | (4,339 | ) |
| Boston Properties, Inc. | | | 73 | | | | (7,911 | ) |
| IntercontinentalExchange, Inc.* | | | 73 | | | | (9,927 | ) |
| Goldman Sachs Group, Inc. | | | 182 | | | | (17,447 | ) |
| Wells Fargo & Co. | | | 573 | | | | (19,161 | ) |
| StanCorp Financial Group, Inc. | | | 545 | | | | (20,252 | ) |
| Associated Banc-Corp. | | | 1,553 | | | | (20,484 | ) |
| TD Ameritrade Holding Corp. | | | 1,456 | | | | (24,752 | ) |
| SunTrust Banks, Inc. | | | 1,043 | | | | (25,272 | ) |
| KeyCorp | | | 3,593 | | | | (27,810 | ) |
| Arthur J Gallagher & Co. | | | 910 | | | | (31,914 | ) |
| Morgan Stanley | | | 2,221 | | | | (32,404 | ) |
| City National Corp. | | | 761 | | | | (36,969 | ) |
| Bank of New York Mellon Corp. | | | 1,820 | | | | (39,949 | ) |
| East West Bancorp, Inc. | | | 1,784 | | | | (41,853 | ) |
| Synovus Financial Corp. | | | 21,266 | | | | (42,107 | ) |
| Zions Bancorporation | | | 2,471 | | | | (47,987 | ) |
| Fulton Financial Corp. | | | 6,086 | | | | (60,799 | ) |
| Affiliated Managers Group, Inc.* | | | 591 | | | | (64,685 | ) |
| Bank of America Corp. | | | 8,260 | | | | (67,567 | ) |
| First Citizens BancShares, Inc. — | | | | | | | | |
| Class A | | | 416 | | | | (69,326 | ) |
| Host Hotels & Resorts, Inc. | | | 4,402 | | | | (69,640 | ) |
| BRE Properties, Inc. | | | 1,565 | | | | (78,281 | ) |
| CapitalSource, Inc. | | | 12,933 | | | | (86,910 | ) |
| Greenhill & Company, Inc. | | | 2,438 | | | | (86,915 | ) |
| Howard Hughes Corp.* | | | 1,413 | | | | (87,097 | ) |
| Weingarten Realty Investors | | | 3,311 | | | | (87,212 | ) |
| Validus Holdings Ltd. | | | 2,875 | | | | (92,086 | ) |
| Lazard Ltd. — Class A | | | 3,711 | | | | (96,449 | ) |
| Plum Creek Timber Company, Inc. | | | 2,584 | | | | (102,585 | ) |
| First Niagara Financial Group, Inc. | | | 14,009 | | | | (107,169 | ) |
| Hudson City Bancorp, Inc. | | | 16,828 | | | | (107,194 | ) |
| Brandywine Realty Trust | | | 9,643 | | | | (118,995 | ) |
| Jefferies Group, Inc. | | | 9,716 | | | | (126,211 | ) |
| Mack-Cali Realty Corp. | | | 4,621 | | | | (134,332 | ) |
| Waddell & Reed Financial, Inc. — | | | | | | | | |
| Class A | | | 4,440 | | | | (134,443 | ) |
| Old Republic International Corp. | | | 16,302 | | | | (135,144 | ) |
| Allstate Corp. | | | 4,076 | | | | (143,027 | ) |
| Moody’s Corp. | | | 4,079 | | | | (149,087 | ) |
| Franklin Resources, Inc. | | | 1,372 | | | | (152,278 | ) |
| Vornado Realty Trust | | | 1,820 | | | | (152,844 | ) |
| MSCI, Inc. — Class A* | | | 4,585 | | | | (155,982 | ) |
| Reinsurance Group of | | | | | | | | |
| America, Inc. — Class A | | | 2,984 | | | | (158,779 | ) |
| Northern Trust Corp. | | | 3,493 | | | | (160,748 | ) |
| Markel Corp.* | | | 364 | | | | (160,779 | ) |
| Jones Lang LaSalle, Inc. | | | 2,328 | | | | (163,821 | ) |
| Unum Group | | | 8,661 | | | | (165,685 | ) |
| Valley National Bancorp | | | 15,649 | | | | (165,879 | ) |
| Progressive Corp. | | | 8,006 | | | | (166,765 | ) |
| Endurance Specialty Holdings Ltd. | | | 4,366 | | | | (167,305 | ) |
| RenaissanceRe Holdings Ltd. | | | 2,219 | | | | (168,666 | ) |
| Aspen Insurance Holdings Ltd. | | | 5,858 | | | | (169,296 | ) |
| Leucadia National Corp. | | | 8,042 | | | | (171,053 | ) |
| T. Rowe Price Group, Inc. | | | 2,737 | | | | (172,322 | ) |
| CIT Group, Inc.* | | | 4,839 | | | | (172,462 | ) |
| Brown & Brown, Inc. | | | 6,343 | | | | (172,974 | ) |
| Corporate Office Properties Trust | | | 7,386 | | | | (173,645 | ) |
| XL Group plc — Class A | | | 8,260 | | | | (173,790 | ) |
| Cincinnati Financial Corp. | | | 4,585 | | | | (174,551 | ) |
| Erie Indemnity Co. — Class A | | | 2,438 | | | | (174,585 | ) |
| First Republic Bank* | | | 5,203 | | | | (174,821 | ) |
| Lincoln National Corp. | | | 8,006 | | | | (175,091 | ) |
| Hartford Financial Services Group, Inc. | | | 9,934 | | | | (175,136 | ) |
| Bank of Hawaii Corp. | | | 3,878 | | | | (178,194 | ) |
| Ventas, Inc. | | | 2,839 | | | | (179,198 | ) |
| 28 | THE GUGGENHEIM FUNDS SEMI-ANNUAL REPORT | SEE NOTES TO FINANCIAL STATEMENTS. |
| consolidated SCHEDULE OF INVESTMENTS (Unaudited) (continued) | June 30, 2012 |
| multi-hedge strategies fund | | |
| | |
Shares | | | Value | |
| Raymond James Financial, Inc. | | | 5,294 | | | $ | (181,267 | ) |
| Eaton Vance Corp. | | | 6,732 | | | | (181,427 | ) |
| Weyerhaeuser Co. | | | 8,151 | | | | (182,256 | ) |
| SEI Investments Co. | | | 9,170 | | | | (182,391 | ) |
| First Horizon National Corp. | | | 23,038 | | | | (199,279 | ) |
| TFS Financial Corp.* | | | 29,144 | | | | (278,326 | ) |
| TCF Financial Corp. | | | 24,754 | | | | (284,176 | ) |
| Forest City Enterprises, Inc. — | | | | | | | | |
| Class A* | | | 22,368 | | | | (326,573 | ) |
| Cullen/Frost Bankers, Inc. | | | 5,741 | | | | (330,050 | ) |
| Total Financials | | | | | | | (9,184,596 | ) |
| Total Common Stock Sold Short | | | | | | | | |
| (Proceeds $43,869,613) | | | | | | | (44,440,571 | ) |
| EXCHANGE TRADED FUNDS SOLD SHORT† (17.5)% | | | | |
| PowerShares Emerging Markets | | | | | | | | |
| Sovereign Debt Portfolio | | | 245 | | | | (7,063 | ) |
| iShares MSCI Turkey Index Fund | | | 468 | | | | (24,495 | ) |
| iShares Barclays 7-10 Year | | | | | | | | |
| Treasury Bond Fund | | | 236 | | | | (25,471 | ) |
| iShares MSCI BRIC Index Fund | | | 718 | | | | (25,755 | ) |
| iShares iBoxx Investment Grade | | | | | | | | |
| Corporate Bond Fund | | | 380 | | | | (44,711 | ) |
| iShares MSCI Sweden Index Fund | | | 1,915 | | | | (49,311 | ) |
| iShares MSCI Emerging Markets | | | | | | | | |
| Index Fund | | | 1,384 | | | | (54,239 | ) |
| iShares FTSE China 25 Index Fund | | | 1,798 | | | | (60,539 | ) |
| iShares MSCI Hong Kong | | | | | | | | |
| Index Fund | | | 3,844 | | | | (63,042 | ) |
| iShares MSCI Taiwan Index Fund | | | 6,299 | | | | (77,037 | ) |
| iShares MSCI Austria Investable | | | | | | | | |
| Market Index Fund | | | 5,380 | | | | (77,418 | ) |
| Market Vectors Russia ETF | | | 3,068 | | | | (80,259 | ) |
| iShares MSCI Australia | | | | | | | | |
| Index Fund | | | 3,842 | | | | (84,063 | ) |
| iShares MSCI Germany Index Fund | | | 4,470 | | | | (88,506 | ) |
| iShares MSCI EMU Index Fund | | | 3,301 | | | | (90,612 | ) |
| iShares MSCI Belgium Investable | | | | | | | | |
| Market Index Fund | | | 9,280 | | | | (106,906 | ) |
| iShares JPMorgan USD Emerging | | | | | | | | |
| Markets Bond Fund | | | 987 | | | | (113,229 | ) |
| iShares MSCI France Index Fund | | | 5,902 | | | | (115,561 | ) |
| iShares Barclays Agency | | | | | | | | |
| Bond Fund | | | 1,026 | | | | (116,410 | ) |
| iShares MSCI EAFE Index Fund | | | 2,635 | | | | (131,645 | ) |
| iShares MSCI Netherlands Investable | | | | | | | | |
| Market Index Fund | | | 8,420 | | | | (143,780 | ) |
| iShares MSCI Thailand Index Fund | | | 2,804 | | | | (193,644 | ) |
| iShares MSCI Canada Index Fund | | | 7,830 | | | | (202,327 | ) |
| Market Vectors Gold Miners ETF | | | 4,783 | | | | (214,135 | ) |
| iShares Barclays 3-7 Year Treasury | | | | | | | | |
| Bond Fund | | | 1,834 | | | | (225,582 | ) |
| iShares MSCI Chile Investable | | | | | | | | |
| Market Index Fund | | | 3,864 | | | | (237,597 | ) |
| iShares Barclays MBS Bond Fund | | | 2,446 | | | | (265,244 | ) |
| iShares Barclays 20+ Year | | | | | | | | |
| Treasury Bond Fund | | | 2,179 | | | | (272,811 | ) |
| iShares MSCI Brazil Index Fund | | | 6,482 | | | | (335,768 | ) |
| iShares MSCI Spain Index Fund | | | 14,646 | | | $ | (363,221 | ) |
| iShares MSCI Italy Index Fund | | | 35,577 | | | | (402,376 | ) |
| iShares MSCI Switzerland Index Fund | | | 24,021 | | | | (550,321 | ) |
| iShares Barclays TIPS Bond Fund | | | 4,661 | | | | (557,922 | ) |
| Powershares QQQ Trust Series 1 | | | 9,061 | | | | (581,354 | ) |
| iShares MSCI Japan Index Fund | | | 61,971 | | | | (583,147 | ) |
| iShares Dow Jones US Real | | | | | | | | |
| Estate Index Fund | | | 10,981 | | | | (702,455 | ) |
| iShares Barclays Aggregate | | | | | | | | |
| Bond Fund | | | 8,220 | | | | (914,886 | ) |
| iPath MSCI India Index ETN* | | | 21,221 | | | | (1,094,367 | ) |
| SPDR Barclays Capital High | | | | | | | | |
| Yield Bond ETF | | | 33,905 | | | | (1,337,891 | ) |
| SPDR S&P 500 ETF Trust | | | 14,757 | | | | (2,010,936 | ) |
| iShares Russell 2000 Index Fund | | | 27,880 | | | | (2,220,642 | ) |
| iShares Russell 1000 Growth | | | | | | | | |
| Index Fund | | | 53,707 | | | | (3,395,894 | ) |
| iShares Russell 1000 Value | | | | | | | | |
| Index Fund | | | 82,829 | | | | (5,651,416 | ) |
| Total Exchange Traded | | | | | | | | |
| Funds Sold Short | | | | | | | | |
| (Proceeds $23,341,955) | | | | | | | (23,893,988 | ) |
| Total Securities Sold Short - (48.4)% | | | | | | | | |
| (Proceeds $67,211,568) | | | | | | $ | (68,334,559 | ) |
| Other Assets & Liabilities, net - 60.4% | | | | | | | 82,735,921 | |
| Total Net Assets - 100.0% | | | | | | $ | 136,897,716 | |
| | | | | | Unrealized | |
| | | Contracts | | | Gain (Loss) | |
| COMMODITY FUTURES CONTRACTS | | | | | | | | |
| PURCHASED† | | | | | | | | |
| March 2013 Winter Wheat | | | | | | | | |
| Futures Contracts | | | | | | | | |
| (Aggregate Value of | | | | | | | | |
| Contracts $4,840,000) | | | 121 | | | $ | 614,841 | |
| May 2013 Wheat | | | | | | | | |
| Futures Contracts | | | | | | | | |
| (Aggregate Value of | | | | | | | | |
| Contracts $5,600,000) | | | 140 | | | | 503,698 | |
| October 2012 Sugar #11 | | | | | | | | |
| Futures Contracts | | | | | | | | |
| (Aggregate Value of | | | | | | | | |
| Contracts $4,554,491) | | | 193 | | | | 328,338 | |
| November 2012 Soybean | | | | | | | | |
| Futures Contracts | | | | | | | | |
| (Aggregate Value of | | | | | | | | |
| Contracts $2,143,125) | | | 30 | | | | 273,775 | |
| September 2012 Corn | | | | | | | | |
| Futures Contracts | | | | | | | | |
| (Aggregate Value of | | | | | | | | |
| Contracts $6,055,375) | | | 193 | | | | 231,182 | |
| September 2012 Soybean | | | | | | | | |
| Futures Contracts | | | | | | | | |
| (Aggregate Value of | | | | | | | | |
| Contracts $4,423,263) | | | 61 | | | | 159,158 | |
| SEE NOTES TO FINANCIAL STATEMENTS. | THE GUGGENHEIM FUNDS SEMI-ANNUAL REPORT | 29 |
| consolidated SCHEDULE OF INVESTMENTS (Unaudited) (continued) | June 30, 2012 |
| multi-hedge strategies fund | | |
| | | | | | Unrealized | |
| | | Contracts | | | Gain (Loss) | |
| March 2013 Natural Gas | | | | | | | | |
| Futures Contracts | | | | | | | | |
| (Aggregate Value of | | | | | | | | |
| Contracts $4,453,120) | | | 128 | | | $ | 157,199 | |
| February 2013 Live Cattle | | | | | | | | |
| Futures Contracts | | | | | | | | |
| (Aggregate Value of | | | | | | | | |
| Contracts $4,195,800) | | | 81 | | | | 39,137 | |
| January 2013 Feeder Cattle | | | | | | | | |
| Futures Contracts | | | | | | | | |
| (Aggregate Value of | | | | | | | | |
| Contracts $4,010,513) | | | 51 | | | | (102,418 | ) |
| October 2012 Lean Hogs | | | | | | | | |
| Futures Contracts | | | | | | | | |
| (Aggregate Value of | | | | | | | | |
| Contracts $4,398,310) | | | 133 | | | | (108,301 | ) |
| October 2012 Gasoline RBOB | | | | | | | | |
| Futures Contracts | | | | | | | | |
| (Aggregate Value of | | | | | | | | |
| Contracts $3,315,035) | | | 33 | | | | (793,531 | ) |
| (Total Aggregate Value of | | | | | | | | |
| Contracts $47,989,032) | | | | | | $ | 1,303,078 | |
| Futures Contracts Purchased† | | | | | | | | |
| December 2012 CBOE VIX Index | | | | | | | | |
| Futures Contracts | | | | | | | | |
| (Aggregate Value of | | | | | | | | |
| Contracts $4,134,000) | | | 159 | | | $ | (487,639 | ) |
| November 2012 CBOE VIX Index | | | | | | | | |
| Futures Contracts | | | | | | | | |
| (Aggregate Value of | | | | | | | | |
| Contracts $4,038,600) | | | 159 | | | | (545,151 | ) |
| August 2012 CBOE VIX Index | | | | | | | | |
| Futures Contracts | | | | | | | | |
| (Aggregate Value of | | | | | | | | |
| Contracts $3,762,000) | | | 171 | | | | (816,227 | ) |
| (Total Aggregate Value of | | | | | | | | |
| Contracts $11,934,600) | | | | | | $ | (1,849,017 | ) |
| Futures Contracts SOLD SHORT† | | | | | | | | |
| July 2012 CBOE VIX Index | | | | | | | | |
| Futures Contracts | | | | | | | | |
| (Aggregate Value of | | | | | | | | |
| Contracts $3,447,500) | | | 175 | | | $ | 1,132,240 | |
| September 2012 CBOE VIX Index | | | | | | | | |
| Futures Contracts | | | | | | | | |
| (Aggregate Value of | | | | | | | | |
| Contracts $3,885,750) | | | 165 | | | | 716,213 | |
| October 2012 CBOE VIX Index | | | | | | | | |
| Futures Contracts | | | | | | | | |
| (Aggregate Value of | | | | | | | | |
| Contracts $2,681,400) | | | 109 | | | | 425,711 | |
| (Total Aggregate Value | | | | | | | | |
| of Contracts $10,014,650) | | | | | | $ | 2,274,164 | |
| COMMODITY FUTURES CONTRACTS SOLD SHORT† | | | | | | | | |
| December 2012 Gasoline RBOB | | | | | | | | |
| Futures Contracts | | | | | | | | |
| (Aggregate Value of | | | | | | | | |
| Contracts $4,144,518) | | | 42 | | | $ | 755,188 | |
| December 2012 Natural Gas | | | | | | | | |
| Futures Contracts | | | | | | | | |
| (Aggregate Value of | | | | | | | | |
| Contracts $4,867,650) | | | 145 | | | | 703,647 | |
| March 2013 Sugar #11 | | | | | | | | |
| Futures Contracts | | | | | | | | |
| (Aggregate Value of | | | | | | | | |
| Contracts $5,218,214) | | | 216 | | | | 396,097 | |
| September 2012 Feeder Cattle | | | | | | | | |
| Futures Contracts | | | | | | | | |
| (Aggregate Value of | | | | | | | | |
| Contracts $4,003,350) | | | 52 | | | | 155,788 | |
| July 2012 LME Lead | | | | | | | | |
| Futures Contracts | | | | | | | | |
| (Aggregate Value of | | | | | | | | |
| Contracts $1,388,063) | | | 30 | | | | 71,431 | |
| October 2012 Live Cattle | | | | | | | | |
| Futures Contracts | | | | | | | | |
| (Aggregate Value of | | | | | | | | |
| Contracts $6,911,080) | | | 139 | | | | 61,528 | |
| September 2012 Coffee ‘C’ | | | | | | | | |
| Futures Contracts | | | | | | | | |
| (Aggregate Value of | | | | | | | | |
| Contracts $2,114,888) | | | 33 | | | | 59,470 | |
| March 2013 Cotton #2 | | | | | | | | |
| Futures Contracts | | | | | | | | |
| (Aggregate Value of | | | | | | | | |
| Contracts $1,288,800) | | | 36 | | | | 39,100 | |
| July 2012 LME Nickel | | | | | | | | |
| Futures Contracts | | | | | | | | |
| (Aggregate Value of | | | | | | | | |
| Contracts $701,568) | | | 7 | | | | 33,282 | |
| September 2012 LME Primary | | | | | | | | |
| Aluminum Futures Contracts | | | | | | | | |
| (Aggregate Value of | | | | | | | | |
| Contracts $2,148,469) | | | 45 | | | | 27,124 | |
| July 2012 LME Zinc | | | | | | | | |
| Futures Contracts | | | | | | | | |
| (Aggregate Value of | | | | | | | | |
| Contracts $846,608) | | | 18 | | | | 15,550 | |
| September 2012 Cocoa | | | | | | | | |
| Futures Contracts | | | | | | | | |
| (Aggregate Value of | | | | | | | | |
| Contracts $459,600) | | | 20 | | | | (1,201 | ) |
| August 2012 WTI Crude | | | | | | | | |
| Futures Contracts | | | | | | | | |
| (Aggregate Value of | | | | | | | | |
| Contracts $1,526,220) | | | 18 | | | | (5,565 | ) |
| September 2012 LME Nickel | | | | | | | | |
| Futures Contracts | | | | | | | | |
| (Aggregate Value of | | | | | | | | |
| Contracts $401,496) | | | 4 | | | | (12,134 | ) |
| 30| THE GUGGENHEIM FUNDS SEMI-ANNUAL REPORT | SEE NOTES TO FINANCIAL STATEMENTS. |
| consolidated SCHEDULE OF INVESTMENTS (Unaudited) (concluded) | June 30, 2012 |
| multi-hedge strategies fund | | |
| | | | | | Unrealized | |
| | | Contracts | | | Gain (Loss) | |
| December 2012 Soybean Oil | | | | | | | | |
| Futures Contracts | | | | | | | | |
| (Aggregate Value of | | | | | | | | |
| Contracts $1,084,872) | | | 34 | | | $ | (21,738 | ) |
| September 2012 Heating Oil | | | | | | | | |
| Futures Contracts | | | | | | | | |
| (Aggregate Value of | | | | | | | | |
| Contracts $1,702,071) | | | 15 | | | | (23,292 | ) |
| September 2012 Silver | | | | | | | | |
| Futures Contracts | | | | | | | | |
| (Aggregate Value of | | | | | | | | |
| Contracts $1,373,250) | | | 10 | | | | (40,105 | ) |
| September 2012 LME Zinc | | | | | | | | |
| Futures Contracts | | | | | | | | |
| (Aggregate Value of | | | | | | | | |
| Contracts $939,825) | | | 20 | | | | (42,470 | ) |
| September 2012 Copper | | | | | | | | |
| Futures Contracts | | | | | | | | |
| (Aggregate Value of | | | | | | | | |
| Contracts $875,000) | | | 10 | | | | (47,530 | ) |
| February 2013 Lean Hogs | | | | | | | | |
| Futures Contracts | | | | | | | | |
| (Aggregate Value of | | | | | | | | |
| Contracts $4,375,700) | | | 133 | | | | (57,425 | ) |
| January 2013 Soybean | | | | | | | | |
| Futures Contracts | | | | | | | | |
| (Aggregate Value of | | | | | | | | |
| Contracts $4,350,825) | | | 61 | | | | (239,427 | ) |
| December 2012 Wheat | | | | | | | | |
| Futures Contracts | | | | | | | | |
| (Aggregate Value of | | | | | | | | |
| Contracts $4,817,400) | | | 124 | | | | (516,095 | ) |
| December 2012 Winter Wheat | | | | | | | | |
| Futures Contracts | | | | | | | | |
| (Aggregate Value of | | | | | | | | |
| Contracts $4,860,800) | | | 124 | | | | (612,481 | ) |
| March 2013 Corn | | | | | | | | |
| Futures Contracts | | | | | | | | |
| (Aggregate Value of | | | | | | | | |
| Contracts $4,786,625) | | | 149 | | | | (698,650 | ) |
| (Total Aggregate Value of | | | | | | | | |
| Contracts $65,186,892) | | | | | | $ | 92 | |
| CREDIT DEFAULT SWAP Agreement Protection Sold††,3 |
| | | | | Protection | | | | | | | | | | | Upfront | | | | |
| | | | | Premium | | | Maturity | | Notional | | | Notional | | | Payments | | | Unrealized | |
| Index | | Counterparty | | Rate | | | Date | | Principal | | | Value | | | Received | | | Appreciation | |
| CDX.NA.HY-18 Index | | Barclays Bank plc | | | 5.00 | % | | 06/20/17 | | $ | 18,315,000 | | | $ | (17,696,869 | ) | | $ | (805,402 | ) | | $ | 187,270 | |
| * | Non-income producing security. |
| † | Value determined based on Level 1 inputs — See Note 4. |
| †† | Value determined based on Level 2 inputs — See Note 4. |
| 1 | All or a portion of this security is pledged as short security collateral at June 30,2012. |
| 2 | Repurchase Agreements — See Note 5. |
| 3 | Credit Default Swaps — See Note 7. |
| 4 | Investment in a product that pays a management fee to a party related to the advisor.
ADR — American Depository Receipt
plc — Public Limited Company |
| SEE NOTES TO FINANCIAL STATEMENTS. | THE GUGGENHEIM FUNDS SEMI-ANNUAL REPORT | 31 |
| multi-hedge strategies fund | | |
| CONSOLIDATED STATEMENT OF ASSETS |
| AND LIABILITIES (Unaudited) | | | |
| June 30, 2012 | | | |
| Assets: | | | | |
| Investments, at value | | | | |
| (cost $94,812,798) | | $ | 97,996,938 | |
| Repurchase agreements, at value | | | | |
| (cost $24,499,416) | | | 24,499,416 | |
| Total investments | | | | |
| (cost $119,312,214) | | | 122,496,354 | |
| Segregated cash with broker | | | 82,928,830 | |
| Unrealized appreciation on swap agreements | | | 187,270 | |
| Receivables: | | | | |
| Fund shares sold | | | 872,597 | |
| Securities sold | | | 654,513 | |
| Dividends | | | 76,523 | |
| Interest | | | 28,134 | |
| Total assets | | | 207,244,221 | |
| Liabilities: | | | | |
| Securities sold short, at value | | | | |
| (proceeds $67,211,568) | | | 68,334,559 | |
| Unamortized upfront premiums received | | | | |
| on credit default swaps | | | 805,402 | |
| Overdraft due to custodian bank | | | 2,204 | |
| Payable for: | | | | |
| Variation margin | | | 686,504 | |
| Fund shares redeemed | | | 197,844 | |
| Management fees | | | 126,039 | |
| Distribution and service fees | | | 34,689 | |
| Securities purchased | | | 1,500 | |
| Miscellaneous | | | 157,764 | |
| Total liabilities | | | 70,346,505 | |
| Net Assets | | $ | 136,897,716 | |
| Net Assets Consist Of: | | | | |
| Paid in capital | | $ | 190,799,983 | |
| Accumulated net investment loss | | | (1,941,381 | ) |
| Accumulated net realized loss on investments | | | (55,937,622 | ) |
| Net unrealized appreciation on investments | | | 3,976,736 | |
| Net assets | | $ | 136,897,716 | |
| A-Class: | | | | |
| Net assets | | $ | 27,560,364 | |
| Capital shares outstanding | | | 1,231,450 | |
| Net asset value per share | | $ | 22.38 | |
| Maximum offering price per share | | | | |
| (Net asset value divided by 95.25%) | | $ | 23.50 | |
| C-Class: | | | | |
| Net assets | | $ | 15,119,305 | |
| Capital shares outstanding | | | 711,650 | |
| Net asset value per share | | $ | 21.25 | |
| | | | | |
| H-Class: | | | | |
| Net assets | | $ | 82,869,546 | |
| Capital shares outstanding | | | 3,700,367 | |
| Net asset value per share | | $ | 22.39 | |
| Institutional Class: | | | | |
| Net assets | | $ | 11,348,501 | |
| Capital shares outstanding | | | 503,968 | |
| Net asset value per share | | $ | 22.52 | |
| CONSOLIDATED STATEMENT OF | | | |
| OPERATIONS (Unaudited) | | | |
| Period Ended June 30, 2012 | | | | |
| Investment Income: | | | | |
| Dividends (net of foreign | | | | |
| withholding tax of $621) | | $ | 1,235,563 | |
| Interest | | | 15,370 | |
| Total investment income | | | 1,250,933 | |
| Expenses: | | | | |
| Management fees | | | 709,449 | |
| Distribution and service fees: | | | | |
| A-Class | | | 37,294 | |
| C-Class | | | 72,698 | |
| H-Class | | | 88,523 | |
| Short sales dividend expense | | | 650,088 | |
| Prime broker interest expense | | | 238,075 | |
| Trustees’ fees* | | | 3,830 | |
| Custodian fees | | | 119 | |
| Miscellaneous | | | (3,003 | ) |
| Total expenses | | | 1,797,073 | |
| Less: | | | | |
| Expenses waived by Advisor | | | (24,761 | ) |
| Net expenses | | | 1,772,312 | |
| Net investment loss | | | (521,379 | ) |
| Net Realized And Unrealized Gain (Loss): | | | | |
| Net realized gain (loss) on: | | | | |
| Investments | | | 1,720,994 | |
| Swap agreements | | | 354,718 | |
| Futures contracts | | | (3,001,603 | ) |
| Securities sold short | | | (1,849,320 | ) |
| Net realized loss | | | (2,775,211 | ) |
| Net change in unrealized appreciation | | | | |
| (depreciation) on: | | | | |
| Investments | | | 1,555,451 | |
| Securities sold short | | | (1,268,005 | ) |
| Swap agreements | | | 152,041 | |
| Futures contracts | | | 3,611,454 | |
| Net change in unrealized appreciation | | | | |
| (depreciation) | | | 4,050,941 | |
| Net realized and unrealized gain | | | 1,275,730 | |
| from operations | | $ | 754,351 | |
* Relates to Trustees not deemed “interested persons” within the meaning of Section 2(a)(19) of the 1940 Act.
| 32 | THE GUGGENHEIM FUNDS SEMI-ANNUAL REPORT | SEE NOTES TO FINANCIAL STATEMENTS. |
| multi-hedge strategies fund | | |
Consolidated STATEMENTS OF CHANGES IN NET ASSETS
| | | Period Ended | | | | |
| | | June 30, | | | Year Ended | |
| | | 2012 | | | December 31, | |
| | | (Unaudited) | | | 2011 | |
| Increase (Decrease) In Net Assets From Operations: | | | | | | | | |
| Net investment loss | | $ | (521,379 | ) | | $ | (982,964 | ) |
| Net realized gain (loss) on investments | | | (2,775,211 | ) | | | 8,190,472 | |
| Net change in unrealized appreciation (depreciation) on investments | | | 4,050,941 | | | | (5,221,879 | ) |
| Net increase in net assets resulting from operations | | | 754,351 | | | | 1,985,629 | |
| | | | | | | | | |
| Distributions To Shareholders From: | | | | | | | | |
| Net investment income | | | | | | | | |
| A-Class | | | — | | | | (175,041 | ) |
| C-Class | | | — | | | | (96,950 | ) |
| H-Class | | | — | | | | (465,010 | ) |
| Institutional Class | | | — | | | | (3,870 | ) |
| Total distributions to shareholders | | | — | | | | (740,871 | ) |
| | | | | | | | | |
| Capital Share Transactions: | | | | | | | | |
| Proceeds from sale of shares | | | | | | | | |
| A-Class | | | 28,447,042 | | | | 22,677,918 | |
| C-Class | | | 6,998,674 | | | | 5,688,462 | |
| H-Class | | | 59,896,843 | | | | 64,118,440 | |
| Institutional Class | | | 11,121,392 | | | | 519,704 | |
| Distributions reinvested | | | | | | | | |
| A-Class | | | — | | | | 170,694 | |
| C-Class | | | — | | | | 91,859 | |
| H-Class | | | — | | | | 417,772 | |
| Institutional Class | | | — | | | | 3,870 | |
| Cost of shares redeemed | | | | | | | | |
| A-Class | | | (26,031,208 | ) | | | (12,381,150 | ) |
| C-Class | | | (5,241,714 | ) | | | (7,848,693 | ) |
| H-Class | | | (43,574,876 | ) | | | (43,547,530 | ) |
| Institutional Class | | | (595,177 | ) | | | (18,270 | ) |
| Net increase from capital share transactions | | | 31,020,976 | | | | 29,893,076 | |
| Net increase in net assets | | | 31,775,327 | | | | 31,137,834 | |
| | | | | | | | | |
| Net Assets: | | | | | | | | |
| Beginning of period | | | 105,122,389 | | | | 73,984,555 | |
| End of period | | $ | 136,897,716 | | | $ | 105,122,389 | |
| Accumulated net investment loss at end of period | | $ | (1,941,381 | ) | | $ | (1,420,002 | ) |
| SEE NOTES TO FINANCIAL STATEMENTS. | THE GUGGENHEIM FUNDS SEMI-ANNUAL REPORT | 33 |
| multi-hedge strategies fund | | |
Consolidated STATEMENTS OF CHANGES IN NET ASSETS (concluded)
| | | Period Ended | | | | |
| | | June 30, | | | Year Ended | |
| | | 2012 | | | December 31, | |
| | | (Unaudited) | | | 2011 | |
| Capital Share Activity: | | | | | | | | |
| Shares sold | | | | | | | | |
| A-Class | | | 1,276,211 | | | | 1,019,952 | |
| C-Class | | | 328,855 | | | | 267,782 | |
| H-Class | | | 2,676,605 | | | | 2,874,440 | |
| Institutional Class | | | 494,412 | | | | 23,171 | |
| Shares issued from reinvestment of distributions | | | | | | | | |
| A-Class | | | — | | | | 7,651 | |
| C-Class | | | — | | | | 4,321 | |
| H-Class | | | — | | | | 18,716 | |
| Institutional Class | | | — | | | | 173 | |
| Shares redeemed | | | | | | | | |
| A-Class | | | (1,162,694 | ) | | | (559,378 | ) |
| C-Class | | | (246,632 | ) | | | (373,099 | ) |
| H-Class | | | (1,952,732 | ) | | | (1,966,390 | ) |
| Institutional Class | | | (26,609 | ) | | | (821 | ) |
| Net increase in shares | | | 1,387,416 | | | | 1,316,518 | |
| 34 | THE GUGGENHEIM FUNDS SEMI-ANNUAL REPORT | SEE NOTES TO FINANCIAL STATEMENTS. |
| multi-hedge strategies fund | | |
FINANCIAL HIGHLIGHTS
This table is presented to show selected data for a share outstanding throughout each period and to assist shareholders in evaluating a Fund’s performance for the periods presented.
| | | Period Ended | | | Year Ended | | | Year Ended | | | Period Ended | | | Year Ended | | | Year Ended | |
| | | June 30, | | | December 31, | | | December 31, | | | December 31, | | | March 31, | | | March 31, | |
| A-Class | | 2012a,b | | | 2011b | | | 2010b | | | 2009b,c | | | 2009 | | | 2008 | |
| Per Share Data | | | | | | | | | | | | | | | | | | | | | | | | |
| Net asset value, beginning of period | | $ | 22.21 | | | $ | 21.66 | | | $ | 20.57 | | | $ | 19.96 | | | $ | 24.61 | | | $ | 26.44 | |
| Income (loss) from investment operations: | | | | | | | | | | | | | | | | | | | | | | | | |
| Net investment income (loss)d | | | (.08 | ) | | | (.27 | ) | | | (.40 | ) | | | (.15 | ) | | | (.10 | ) | | | .58 | |
| Net gain (loss) on investments | | | | | | | | | | | | | | | | | | | | | | | | |
| (realized and unrealized) | | | .25 | | | | .98 | | | | 1.49 | | | | .76 | | | | (4.37 | ) | | | (1.53 | ) |
| Total from investment operations | | | .17 | | | | .71 | | | | 1.09 | | | | .61 | | | | (4.47 | ) | | | (.95 | ) |
| Less distributions from: | | | | | | | | | | | | | | | | | | | | | | | | |
| Net investment income | | | — | | | | (.16 | ) | | | — | | | | — | | | | (.12 | ) | | | (.79 | ) |
| Net realized gains | | | — | | | | — | | | | — | | | | — | | | | (.06 | ) | | | (.09 | ) |
| Total distributions | | | — | | | | (.16 | ) | | | — | | | | — | | | | (.18 | ) | | | (.88 | ) |
| Redemption fees collected | | | — | | | | — | | | | — | e | | | — | e | | | — | e | | | — | e |
| Net asset value, end of period | | $ | 22.38 | | | $ | 22.21 | | | $ | 21.66 | | | $ | 20.57 | | | $ | 19.96 | | | $ | 24.61 | |
| | | | | | | | | | | | | | | | | | | | | | | | | |
| Total Returnf | | | 0.67 | % | | | 3.39 | % | | | 5.30 | % | | | 3.06 | % | | | (18.19 | %) | | | (3.72 | %) |
| Ratios/Supplemental Data | | | | | | | | | | | | | | | | | | | | | | | | |
| Net assets, end of period (in thousands) | | $ | 27,560 | | | $ | 24,832 | | | $ | 14,073 | | | $ | 25,010 | | | $ | 45,078 | | | $ | 42,193 | |
| Ratios to average net assets: | | | | | | | | | | | | | | | | | | | | | | | | |
| Net investment income (loss) | | | (0.76 | %) | | | (1.23 | %) | | | (1.97 | %) | | | (1.47 | %) | | | (0.46 | %) | | | 2.18 | % |
| Total expensesg | | | 2.91 | % | | | 2.77 | % | | | 3.56 | % | | | 2.36 | % | | | 2.09 | % | | | 1.96 | % |
| Net expensesh | | | 2.86 | % | | | 2.65 | % | | | 3.40 | % | | | 2.32 | % | | | 2.09 | % | | | 1.96 | % |
| Operating expensesi | | | 1.40 | % | | | 1.41 | % | | | 1.41 | % | | | 1.40 | % | | | 1.40 | % | | | 1.40 | % |
| Portfolio turnover rate | | | 210 | % | | | 433 | % | | | 993 | % | | | 858 | % | | | 1,578 | % | | | 509 | % |
| | | Period Ended | | | Year Ended | | | Year Ended | | | Period Ended | | | Year Ended | | | Year Ended | |
| | | June 30, | | | December 31, | | | December 31, | | | December 31, | | | March 31, | | | March 31, | |
| C-Class | | 2012a,b | | | 2011b | | | 2010b | | | 2009b,c | | | 2009 | | | 2008 | |
| Per Share Data | | | | | | | | | | | | | | | | | | | | | | | | |
| Net asset value, beginning of period | | $ | 21.17 | | | $ | 20.80 | | | $ | 19.90 | | | $ | 19.43 | | | $ | 24.13 | | | $ | 26.14 | |
| Income (loss) from investment operations: | | | | | | | | | | | | | | | | | | | | | | | | |
| Net investment income (loss)d | | | (.16 | ) | | | (.42 | ) | | | (.55 | ) | | | (.31 | ) | | | (.25 | ) | | | .37 | |
| Net gain (loss) on investments | | | | | | | | | | | | | | | | | | | | | | | | |
| (realized and unrealized) | | | .24 | | | | .95 | | | | 1.45 | | | | .78 | | | | (4.27 | ) | | | (1.50 | ) |
| Total from investment operations | | | .08 | | | | .53 | | | | .90 | | | | .47 | | | | (4.52 | ) | | | (1.13 | ) |
| Less distributions from: | | | | | | | | | | | | | | | | | | | | | | | | |
| Net investment income | | | — | | | | (.16 | ) | | | — | | | | — | | | | (.12 | ) | | | (.79 | ) |
| Net realized gains | | | — | | | | — | | | | — | | | | — | | | | (.06 | ) | | | (.09 | ) |
| Total distributions | | | — | | | | (.16 | ) | | | — | | | | — | | | | (.18 | ) | | | (.88 | ) |
| Redemption fees collected | | | — | | | | — | | | | — | e | | | — | e | | | — | e | | | — | e |
| Net asset value, end of period | | $ | 21.25 | | | $ | 21.17 | | | $ | 20.80 | | | $ | 19.90 | | | $ | 19.43 | | | $ | 24.13 | |
| | | | | | | | | | | | | | | | | | | | | | | | | |
| Total Returnf | | | 0.28 | % | | | 2.62 | % | | | 4.52 | % | | | 2.42 | % | | | (18.76 | %) | | | (4.46 | %) |
| Ratios/Supplemental Data | | | | | | | | | | | | | | | | | | | | | | | | |
| Net assets, end of period (in thousands) | | $ | 15,119 | | | $ | 13,322 | | | $ | 15,194 | | | $ | 23,494 | | | $ | 28,706 | | | $ | 54,857 | |
| Ratios to average net assets: | | | | | | | | | | | | | | | | | | | | | | | | |
| Net investment income (loss) | | | (1.54 | %) | | | (1.99 | %) | | | (2.79 | %) | | | (2.07 | %) | | | (1.09 | %) | | | 1.41 | % |
| Total expensesg | | | 3.67 | % | | | 3.52 | % | | | 4.41 | % | | | 3.14 | % | | | 2.82 | % | | | 2.71 | % |
| Net expensesh | | | 3.63 | % | | | 3.39 | % | | | 4.26 | % | | | 3.09 | % | | | 2.82 | % | | | 2.71 | % |
| Operating expensesi | | | 2.15 | % | | | 2.15 | % | | | 2.15 | % | | | 2.17 | % | | | 2.17 | % | | | 2.15 | % |
| Portfolio turnover rate | | | 210 | % | | | 433 | % | | | 993 | % | | | 858 | % | | | 1,578 | % | | | 509 | % |
THE GUGGENHEIM FUNDS semi-annual REPORT | 35
| multi-hedge strategies fund | | |
FINANCIAL HIGHLIGHTS (continued)
This table is presented to show selected data for a share outstanding throughout each period and to assist shareholders in evaluating a Fund’s performance for the periods presented.
| | | Period Ended | | | Year Ended | | | Year Ended | | | Period Ended | | | Year Ended | | | Year Ended | |
| | | June 30, | | | December 31, | | | December 31, | | | December 31, | | | March 31, | | | March 31, | |
| H-Class | | 2012a,b | | | 2011b | | | 2010b | | | 2009b,c | | | 2009 | | | 2008 | |
| Per Share Data | | | | | | | | | | | | | | | | | | | | | | | | |
| Net asset value, beginning of period | | $ | 22.23 | | | $ | 21.67 | | | $ | 20.58 | | | $ | 19.98 | | | $ | 24.63 | | | $ | 26.46 | |
| Income (loss) from investment operations: | | | | | | | | | | | | | | | | | | | | | | | | |
| Net investment income (loss)d | | | (.09 | ) | | | (.27 | ) | | | (.43 | ) | | | (.21 | ) | | | (.07 | ) | | | .58 | |
| Net gain (loss) on investments | | | | | | | | | | | | | | | | | | | | | | | | |
| (realized and unrealized) | | | .25 | | | | .99 | | | | 1.52 | | | | .81 | | | | (4.40 | ) | | | (1.53 | ) |
| Total from investment operations | | | .16 | | | | .72 | | | | 1.09 | | | | .60 | | | | (4.47 | ) | | | (.95 | ) |
| Less distributions from: | | | | | | | | | | | | | | | | | | | | | | | | |
| Net investment income | | | — | | | | (.16 | ) | | | — | | | | — | | | | (.12 | ) | | | (.79 | ) |
| Net realized gains | | | — | | | | — | | | | — | | | | — | | | | (.06 | ) | | | (.09 | ) |
| Total distributions | | | — | | | | (.16 | ) | | | — | | | | — | | | | (.18 | ) | | | (.88 | ) |
| Redemption fees collected | | | — | | | | — | | | | —e | | | | —e | | | | —e | | | | —e | |
| Net asset value, end of period | | $ | 22.39 | | | $ | 22.23 | | | $ | 21.67 | | | $ | 20.58 | | | $ | 19.98 | | | $ | 24.63 | |
| | | | | | | | | | | | | | | | | | | | | | | | | |
| Total Returnf | | | 0.67 | % | | | 3.39 | % | | | 5.30 | % | | | 3.00 | % | | | (18.17 | %) | | | (3.71 | )% |
| Ratios/Supplemental Data | | | | | | | | | | | | | | | | | | | | | | | | |
| Net assets, end of period (in thousands) | | $ | 82,870 | | | $ | 66,161 | | | $ | 44.421 | | | $ | 69,351 | | | $ | 63,229 | | | $ | 141,483 | |
| Ratios to average net assets: | | | | | | | | | | | | | | | | | | | | | | | | |
| Net investment income (loss) | | | (0.81 | %) | | | (1.25 | %) | | | (2.08 | %) | | | (1.18 | %) | | | (0.31 | %) | | | 2.21 | % |
| Total expensesg | | | 2.93 | % | | | 2.78 | % | | | 3.69 | % | | | 2.37 | % | | | 2.07 | % | | | 1.95 | % |
| Net expensesh | | | 2.89 | % | | | 2.65 | % | | | 3.54 | % | | | 2.33 | % | | | 2.07 | % | | | 1.95 | % |
| Operating expensesi | | | 1.40 | % | | | 1.45 | % | | | 1.41 | % | | | 1.41 | % | | | 1.40 | % | | | 1.40 | % |
| Portfolio turnover rate | | | 210 | % | | | 433 | % | | | 993 | % | | | 858 | % | | | 1,578 | % | | | 509 | % |
36 | THE GUGGENHEIM FUNDS semi-annual REPORT
| multi-hedge strategies fund | | |
FINANCIAL HIGHLIGHTS (continued)
This table is presented to show selected data for a share outstanding throughout each period and to assist shareholders in evaluating a Fund’s performance for the periods presented.
| | | Period Ended | | | Year Ended | | | Period Ended | |
| | | June 30, | | | December 31, | | | December 31, | |
| Institutional Class | | 2012a,b | | | 2011b | | | 2010b,j | |
| Per Share Data | | | | | | | | | | | | |
| Net asset value, beginning of period | | $ | 22.32 | | | $ | 21.71 | | | $ | 20.61 | |
| Income (loss) from investment operations: | | | | | | | | | | | | |
| Net investment lossd | | | (.06 | ) | | | (.22 | ) | | | (.43 | ) |
| Net gain on investments (realized and unrealized) | | | .26 | | | | .99 | | | | 1.53 | |
| Total from investment operations | | | .20 | | | | .77 | | | | 1.10 | |
| Less distributions from: | | | | | | | | | | | | |
| Net investment income | | | — | | | | (.16 | ) | | | — | |
| Total distributions | | | — | | | | (.16 | ) | | | — | |
| Redemption fees collected | | | — | | | | — | | | | — | e |
| Net asset value, end of period | | $ | 22.52 | | | $ | 22.32 | | | $ | 21.71 | |
| | | | | | | | | | | | | |
| Total Returnf | | | 0.85 | % | | | 3.61 | % | | | 5.34 | % |
| Ratios/Supplemental Data | | | | | | | | | | | | |
| Net assets, end of period (in thousands) | | $ | 11,349 | | | $ | 807 | | | $ | 296 | |
| Ratios to average net assets: | | | | | | | | | | | | |
| Net investment loss | | | (0.54 | %) | | | (0.99 | %) | | | (3.10 | %) |
| Total expensesg | | | 3.05 | % | | | 2.52 | % | | | 5.13 | % |
| Net expensesh | | | 3.01 | % | | | 2.40 | % | | | 4.98 | % |
| Operating expensesi | | | 1.15 | % | | | 1.16 | % | | | 1.17 | % |
| Portfolio turnover rate | | | 210 | % | | | 433 | % | | | 993 | % |
| a | Unaudited figures for the period ended June 30, 2012. Percentage amounts for the period, except total return and portfolio turnover rate, have been annualized. |
| c | The Fund changed its fiscal year end from March 31 to December 31 in 2009. Percentage amounts for the period, except total return and portfolio turnover rate, have been annualized. |
| d | Net investment income (loss) per share was computed using average shares outstanding throughout the period. |
| e | Redemption fees collected are less than $0.01 per share. |
| f | Total return does not reflect the impact of any applicable sales charges and has not been annualized. |
| g | Does not include expenses of the underlying funds in which the Fund invests. |
| h | Net expense information reflects the expense ratios after expense waivers. |
| i | Operating expenses exclude interest and dividend expense from securities sold short. |
| j | Since commencement of operations: May 3, 2010. Percentage amounts for the period, except total return and portfolio turnover rate, have been annualized. |
THE GUGGENHEIM FUNDS semi-annual REPORT | 37
| FUND PROFILE (Unaudited) | June 30 , 2012 |
COMMODITIES STRATEGY FUND
OBJECTIVE: Seeks to provide investment results that correlate, before fees and expenses, to the performance of a benchmark for commodities. The Fund’s current benchmark is the S&P GSCITM Commodity Index (the “underlying index”).
Holdings Diversification (Market Exposure as % of Net Assets)
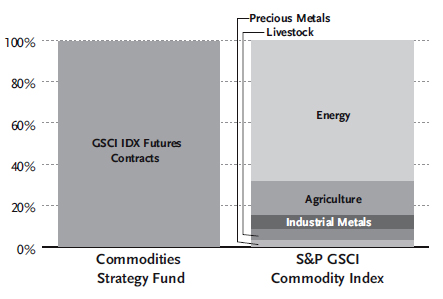
“Holdings Diversification (Market Exposure as % of Net Assets)” excludes any temporary cash investments.
| Inception Dates: | | |
| A-Class | | May 25, 2005 |
| C-Class | | May 25, 2005 |
| H-Class | | May 25, 2005 |
The Fund invests principally in derivative investments such as commodity-linked futures contracts.
38 | THE GUGGENHEIM FUNDS semi-annual REPORT
| consolidated SCHEDULE OF INVESTMENTS (Unaudited) | June 30, 2012 |
| COMMODITIES strategy FUND | | |
| | | Face
Amount | | | Value | |
| REPURCHASE AGREEMENTS††,1 - 86.8% | | | | | | | | |
| Credit Suisse Group | | | | | | | | |
| issued 06/29/12 at 0.08% | | | | | | | | |
| due 07/02/12 | | $ | 14,234,996 | | | $ | 14,234,996 | |
| HSBC Group | | | | | | | | |
| issued 06/29/12 at 0.12% | | | | | | | | |
| due 07/02/12 | | | 575,640 | | | | 575,640 | |
| Mizuho Financial Group, Inc. | | | | | | | | |
| issued 06/29/12 at 0.12% | | | | | | | | |
| due 07/02/12 | | | 245,490 | | | | 245,490 | |
| Deutsche Bank | | | | | | | | |
| issued 06/29/12 at 0.10% | | | | | | | | |
| due 07/02/12 | | | 162,551 | | | | 162,551 | |
| Total Repurchase Agreements | | | | | | | | |
| (Cost $15,218,677) | | | | | | | 15,218,677 | |
| Total Investments - 86.8% | | | | | | | | |
| (Cost $15,218,677) | | | | | | $ | 15,218,677 | |
| Other Assets & | | | | | | | | |
| Liabilities, net - 13.2% | | | | | | | 2,318,096 | |
| Total Net Assets - 100.0% | | | | | | $ | 17,536,773 | |
| | | | | | Unrealized | |
| | | Contracts | | | Gain | |
| commodity FUTURES CONTRACTS PURCHASED† | | | | | | | | |
| July 2012 Goldman Sachs | | | | | | | | |
| Commodity Index Futures Contracts | | | | | | | | |
| (Aggregate Value of | | | | | | | | |
| Contracts $17,404,350) | | | 116 | | | $ | 317,443 | |
| † | Value determined based on Level 1 inputs — See Note 4. |
| †† | Value determined based on Level 2 inputs — See Note 4. |
| 1 | Repurchase Agreements — See Note 5. |
| SEE NOTES TO FINANCIAL STATEMENTS. | THE GUGGENHEIM FUNDS SEMI-ANNUAL REPORT | 39 |
| COMMODITIES strategy FUND | | |
| CONSOLIDATED STATEMENT OF ASSETS |
| AND LIABILITIES (Unaudited) | | | |
| June 30, 2012 | | | |
| Assets: | | | | |
| Repurchase agreements, at value | | | | |
| (cost $15,218,677) | | $ | 15,218,677 | |
| Segregated cash with broker | | | 1,218,000 | |
| Receivables: | | | | |
| Variation margin | | | 946,850 | |
| Fund shares sold | | | 193,744 | |
| Interest | | | 70 | |
| Total assets | | | 17,577,341 | |
| Liabilities: | | | | |
| Payable for: | | | | |
| Management fees | | | 10,771 | |
| Fund shares redeemed | | | 6,516 | |
| Distribution and service fees | | | 5,246 | |
| Transfer agent and administrative fees | | | 3,584 | |
| Portfolio accounting fees | | | 1,434 | |
| Miscellaneous | | | 13,017 | |
| Total liabilities | | | 40,568 | |
| Net Assets | | $ | 17,536,773 | |
| Net Assets Consist Of: | | | | |
| Paid in capital | | $ | 42,547,796 | |
| Accumulated net investment loss | | | (2,188,695 | ) |
| Accumulated net realized loss on investments | | | (23,139,771 | ) |
| Net unrealized appreciation on investments | | | 317,443 | |
| Net assets | | $ | 17,536,773 | |
| A-Class: | | | | |
| Net assets | | $ | 3,659,930 | |
| Capital shares outstanding | | | 246,138 | |
| Net asset value per share | | $ | 14.87 | |
| Maximum offering price per share | | | | |
| (Net asset value divided by 95.25%) | | $ | 15.61 | |
| C-Class: | | | | |
| Net assets | | $ | 2,775,737 | |
| Capital shares outstanding | | | 197,611 | |
| Net asset value per share | | $ | 14.05 | |
| H-Class: | | | | |
| Net assets | | $ | 11,101,106 | |
| Capital shares outstanding | | | 746,665 | |
| Net asset value per share | | $ | 14.87 | |
| CONSOLIDATED STATEMENT OF | | | |
| OPERATIONS (Unaudited) | | | |
| Period Ended June 30, 2012 | | | | |
| Investment Income: | | | | |
| Interest | | $ | 10,224 | |
| Total investment income | | | 10,224 | |
| Expenses: | | | | |
| Management fees | | | 124,050 | |
| Transfer agent and administrative fees | | | 36,270 | |
| Distribution and service fees: | | | | |
| A-Class | | | 8,574 | |
| C-Class | | | 16,675 | |
| H-Class | | | 23,527 | |
| Portfolio accounting fees | | | 14,508 | |
| Registration fees | | | 14,581 | |
| Custodian fees | | | 3,648 | |
| Trustees’ fees* | | | 1,938 | |
| Miscellaneous | | | (2,582 | ) |
| Total expenses | | | 241,189 | |
| Less: | | | | |
| Expenses waived by Advisor | | | (15,240 | ) |
| Net expenses | | | 225,949 | |
| Net investment loss | | | (215,725 | ) |
| Net Realized And Unrealized Gain (Loss): | | | | |
| Net realized gain (loss) on: | | | | |
| Futures contracts | | | (3,288,629 | ) |
| Net realized loss | | | (3,288,629 | ) |
| Net change in unrealized appreciation | | | | |
| (depreciation) on: | | | | |
| Investments | | | (1,288 | ) |
| Futures contracts | | | 536,666 | |
| Net change in unrealized appreciation | | | | |
| (depreciation) | | | 535,378 | |
| Net realized and unrealized loss | | | (2,753,251 | ) |
| Net decrease in net assets resulting | | | | |
| from operations | | $ | (2,968,976 | ) |
*Relates to Trustees not deemed “interested person” within the meaning of Section 2(a)(19) of the 1940 Act.
| 40| THE GUGGENHEIM FUNDS SEMI-ANNUAL REPORT | SEE NOTES TO FINANCIAL STATEMENTS. |
| COMMODITIES strategy FUND | | |
Consolidated STATEMENTS OF CHANGES IN NET ASSETS
| | | Period Ended | | | | |
| | | June 30, | | | Year Ended | |
| | | 2012 | | | December 31, | |
| | | (Unaudited) | | | 2011 | |
| Increase (Decrease) In Net Assets From Operations: | | | | | | | | |
| Net investment loss | | $ | (215,725 | ) | | $ | (799,429 | ) |
| Net realized loss on investments | | | (3,288,629 | ) | | | (185,759 | ) |
| Net change in unrealized appreciation (depreciation) on investments | | | 535,378 | | | | (1,986,758 | ) |
| Net decrease in net assets resulting from operations | | | (2,968,976 | ) | | | (2,971,946 | ) |
| | | | | | | | | |
| Distributions To Shareholders From: | | | | | | | | |
| Net investment income | | | | | | | | |
| A-Class | | | — | | | | (181,426 | ) |
| C-Class | | | — | | | | (123,565 | ) |
| H-Class | | | — | | | | (552,159 | ) |
| Total distributions to shareholders | | | — | | | | (857,150 | ) |
| | | | | | | | | |
| Capital Share Transactions: | | | | | | | | |
| Proceeds from sale of shares | | | | | | | | |
| A-Class | | | 14,881,823 | | | | 11,929,885 | |
| C-Class | | | 346,467 | | | | 1,959,508 | |
| H-Class | | | 57,720,597 | | | | 198,728,902 | |
| Distributions reinvested | | | | | | | | |
| A-Class | | | — | | | | 165,949 | |
| C-Class | | | — | | | | 112,557 | |
| H-Class | | | — | | | | 516,857 | |
| Cost of shares redeemed | | | | | | | | |
| A-Class | | | (15,762,844 | ) | | | (13,331,979 | ) |
| C-Class | | | (880,748 | ) | | | (3,022,060 | ) |
| H-Class | | | (59,561,878 | ) | | | (213,806,275 | ) |
| Net decrease from capital share transactions | | | (3,256,583 | ) | | | (16,746,656 | ) |
| Net decrease in net assets | | | (6,225,559 | ) | | | (20,575,752 | ) |
| | | | | | | | | |
| Net Assets: | | | | | | | | |
| Beginning of period | | | 23,762,332 | | | | 44,338,084 | |
| End of period | | $ | 17,536,773 | | | $ | 23,762,332 | |
| Accumulated net investment loss at end of period | | $ | (2,188,695 | ) | | $ | (1,972,970 | ) |
| | | | | | | | | |
| Capital Share Activity: | | | | | | | | |
| Shares sold | | | | | | | | |
| A-Class | | | 862,124 | | | | 644,840 | |
| C-Class | | | 21,970 | | | | 111,896 | |
| H-Class | | | 3,432,017 | | | | 11,063,570 | |
| Shares issued from reinvestment of distributions | | | | | | | | |
| A-Class | | | — | | | | 10,200 | |
| C-Class | | | — | | | | 7,295 | |
| H-Class | | | — | | | | 31,768 | |
| Shares redeemed | | | | | | | | |
| A-Class | | | (938,859 | ) | | | (747,260 | ) |
| C-Class | | | (56,296 | ) | | | (180,193 | ) |
| H-Class | | | (3,611,590 | ) | | | (12,032,423 | ) |
| Net decrease in shares | | | (290,634 | ) | | | (1,090,307 | ) |
| SEE NOTES TO FINANCIAL STATEMENTS. | THE GUGGENHEIM FUNDS SEMI-ANNUAL REPORT | 41 |
| COMMODITIES strategy FUND | | |
FINANCIAL HIGHLIGHTS
This table is presented to show selected data for a share outstanding throughout each period, and to assist shareholders in evaluating a Fund’s performance for the periods presented.
| | | Period Ended | | | Year Ended | | | Year Ended | | | Period Ended | | | Year Ended | | | Year Ended | |
| | | June 30, | | | December 31, | | | December 31, | | | December 31, | | | March 31, | | | March 31, | |
| A-Class | | 2012a,b | | | 2011b | | | 2010b | | | 2009b,c | | | 2009 | | | 2008 | |
| Per Share Data | | | | | | | | | | | | | | | | | | | | | | | | |
| Net asset value, beginning of period | | $ | 16.18 | | | $ | 17.33 | | | $ | 16.39 | | | $ | 13.26 | | | $ | 32.68 | | | $ | 23.81 | |
| Income (loss) from investment operations: | | | | | | | | | | | | | | | | | | | | | | | | |
| Net investment income (loss)d | | | (.12 | ) | | | (.26 | ) | | | (.22 | ) | | | (.14 | ) | | | — | e | | | .68 | |
| Net gain (loss) on investments | | | | | | | | | | | | | | | | | | | | | | | | |
| (realized and unrealized) | | | (1.19 | ) | | | (.36 | ) | | | 1.16 | | | | 3.37 | | | | (18.80 | ) | | | 8.27 | |
| Total from investment operations | | | (1.31 | ) | | | (.62 | ) | | | .94 | | | | 3.23 | | | | (18.80 | ) | | | 8.95 | |
| Less distributions from: | | | | | | | | | | | | | | | | | | | | | | | | |
| Net investment income | | | — | | | | (.53 | ) | | | — | | | | (.11 | ) | | | (.70 | ) | | | (.22 | ) |
| Total distributions | | | — | | | | (.53 | ) | | | — | | | | (.11 | ) | | | (.70 | ) | | | (.22 | ) |
| Redemption fees collected | | | — | | | | — | | | | — | f | | | .01 | | | | .08 | | | | .14 | |
| Net asset value, end of period | | $ | 14.87 | | | $ | 16.18 | | | $ | 17.33 | | | $ | 16.39 | | | $ | 13.26 | | | $ | 32.68 | |
| | | | | | | | | | | | | | | | | | | | | | | | | |
| Total Returng | | | (8.04 | %) | | | (3.61 | %) | | | 5.74 | % | | | 24.46 | % | | | (57.55 | ) | | | (38.48 | ) |
| Ratios/Supplemental Data | | | | | | | | | | | | | | | | | | | | | | | | |
| Net assets, end of period (in thousands) | | $ | 3,660 | | | $ | 5,223 | | | $ | 7,192 | | | $ | 8,553 | | | $ | 7,189 | | | $ | 18,579 | |
| Ratios to average net assets: | | | | | | | | | | | | | | | | | | | | | | | | |
| Net investment income (loss) | | | (1.40 | %) | | | (1.47 | %) | | | (1.42 | %) | | | (1.24 | %) | | | 0.02 | % | | | 2.49 | % |
| Total expenses | | | 1.58 | % | | | 1.66 | % | | | 1.65 | % | | | 1.56 | % | | | 1.52 | % | | | 1.51 | % |
| Net expensesh | | | 1.47 | % | | | 1.55 | % | | | 1.56 | % | | | 1.38 | % | | | 1.20 | % | | | 1.19 | % |
| Portfolio turnover rate | | | — | | | | — | | | | 200 | % | | | 220 | % | | | 390 | % | | | 405 | % |
| | | Period Ended | | | Year Ended | | | Year Ended | | | Period Ended | | | Year Ended | | | Year Ended | |
| | | June 30, | | | December 31, | | | December 31, | | | December 31, | | | March 31, | | | March 31, | |
| C-Class | | 2012a,b | | | 2011b | | | 2010b | | | 2009b,c | | | 2009 | | | 2008 | |
| Per Share Data | | | | | | | | | | | | | | | | | | | | | | | | |
| Net asset value, beginning of period | | $ | 15.34 | | | $ | 16.58 | | | $ | 15.80 | | | $ | 12.86 | | | $ | 31.96 | | | $ | 23.47 | |
| Income (loss) from investment operations: | | | | | | | | | | | | | | | | | | | | | | | | |
| Net investment income (loss)d | | | (.17 | ) | | | (.37 | ) | | | (.32 | ) | | | (.22 | ) | | | (.06 | ) | | | .48 | |
| Net gain (loss) on investments | | | | | | | | | | | | | | | | | | | | | | | | |
| (realized and unrealized) | | | (1.12 | ) | | | (.34 | ) | | | 1.10 | | | | 3.26 | | | | (18.43 | ) | | | 8.09 | |
| Total from investment operations | | | (1.29 | ) | | | (.71 | ) | | | .78 | | | | 3.04 | | | | (18.49 | ) | | | 8.57 | |
| Less distributions from: | | | | | | | | | | | | | | | | | | | | | | | | |
| Net investment income | | | — | | | | (.53 | ) | | | — | | | | (.11 | ) | | | (.70 | ) | | | (.22 | ) |
| Total distributions | | | — | | | | (.53 | ) | | | — | | | | (.11 | ) | | | (.70 | ) | | | (.22 | ) |
| Redemption fees collected | | | — | | | | — | | | | — | f | | | .01 | | | | .09 | | | | .14 | |
| Net asset value, end of period | | $ | 14.05 | | | $ | 15.34 | | | $ | 16.58 | | | $ | 15.80 | | | $ | 12.86 | | | $ | 31.96 | |
| | | | | | | | | | | | | | | | | | | | | | | | | |
| Total Returng | | | (8.41 | %) | | | (4.32 | %) | | | 4.94 | % | | | 23.74 | % | | | (58.03 | %) | | | 37.41 | % |
| Ratios/Supplemental Data | | | | | | | | | | | | | | | | | | | | | | | | |
| Net assets, end of period (in thousands) | | $ | 2,776 | | | $ | 3,558 | | | $ | 4,857 | | | $ | 6,186 | | | $ | 4,072 | | | $ | 10,793 | |
| Ratios to average net assets: | | | | | | | | | | | | | | | | | | | | | | | | |
| Net investment income (loss) | | | (2.15 | %) | | | (2.22 | %) | | | (2.17 | %) | | | (2.03 | %) | | | (0.22 | %) | | | 1.79 | % |
| Total expenses | | | 2.33 | % | | | 2.41 | % | | | 2.39 | % | | | 2.31 | % | | | 2.28 | % | | | 2.26 | % |
| Net expensesh | | | 2.22 | % | | | 2.30 | % | | | 2.30 | % | | | 2.15 | % | | | 1.95 | % | | | 1.94 | % |
| Portfolio turnover rate | | | — | | | | — | | | | 200 | % | | | 220 | % | | | 390 | % | | | 405 | % |
| 42 | THE GUGGENHEIM FUNDS SEMI-ANNUAL REPORT | SEE NOTES TO FINANCIAL STATEMENTS. |
| COMMODITIES strategy FUND | | |
FINANCIAL HIGHLIGHTS (concluded)
This table is presented to show selected data for a share outstanding throughout each period, and to assist shareholders in evaluating a Fund’s performance for the periods presented.
| | | Period Ended | | | Year Ended | | | Year Ended | | | Period Ended | | | Year Ended | | | Year Ended | |
| | | June 30, | | | December 31, | | | December 31, | | | December 31, | | | March 31, | | | March 31, | |
| H-Class | | 2012a,b | | | 2011b | | | 2010b | | | 2009b,c | | | 2009 | | | 2008 | |
| Per Share Data | | | | | | | | | | | | | | | | | | | | | | | | |
| Net asset value, beginning of period | | $ | 16.18 | | | $ | 17.33 | | | $ | 16.39 | | | $ | 13.26 | | | $ | 32.66 | | | $ | 23.81 | |
| Income (loss) from investment operations: | | | | | | | | | | | | | | | | | | | | | | | | |
| Net investment income (loss)d | | | (.12 | ) | | | (.27 | ) | | | (.22 | ) | | | (.14 | ) | | | .13 | �� | | | .60 | |
| Net gain (loss) on investments | | | | | | | | | | | | | | | | | | | | | | | | |
| (realized and unrealized) | | | (1.19 | ) | | | (.35 | ) | | | 1.16 | | | | 3.37 | | | | (18.93 | ) | | | 8.30 | |
| Total from investment operations | | | (1.31 | ) | | | (.62 | ) | | | .94 | | | | 3.23 | | | | (18.80 | ) | | | 8.90 | |
| Less distributions from: | | | | | | | | | | | | | | | | | | | | | | | | |
| Net investment income | | | — | | | | (.53 | ) | | | — | | | | (.11 | ) | | | (.70 | ) | | | (.22 | ) |
| Total distributions | | | — | | | | (.53 | ) | | | — | | | | (.11 | ) | | | (.70 | ) | | | (.22 | ) |
| Redemption fees collected | | | — | | | | — | | | | — | f | | | .01 | | | | .10 | | | | .17 | |
| Net asset value, end of period | | $ | 14.87 | | | $ | 16.18 | | | $ | 17.33 | | | $ | 16.39 | | | $ | 13.26 | | | $ | 32.66 | |
| | | | | | | | | | | | | | | | | | | | | | | | | |
| Total Returng | | | (8.04 | %) | | | (3.67 | %) | | | 5.74 | % | | | 24.45 | % | | | (57.52 | %) | | | 38.39 | % |
| Ratios/Supplemental Data | | | | | | | | | | | | | | | | | | | | | | | | |
| Net assets, end of period (in thousands) | | $ | 11,101 | | | $ | 14.982 | | | $ | 32,290 | | | $ | 32,019 | | | $ | 50,622 | | | $ | 124,886 | |
| Ratios to average net assets: | | | | | | | | | | | | | | | | | | | | | | | | |
| Net investment income (loss) | | | (1.40 | %) | | | (1.47 | %) | | | (1.42 | %) | | | (1.22 | %) | | | 0.43 | % | | | 2.10 | % |
| Total expenses | | | 1.58 | % | | | 1.66 | % | | | 1.65 | % | | | 1.56 | % | | | 1.52 | % | | | 1.51 | % |
| Net expensesh | | | 1.47 | % | | | 1.56 | % | | | 1.56 | % | | | 1.37 | % | | | 1.20 | % | | | 1.19 | % |
| Portfolio turnover rate | | | — | | | | — | | | | 200 | % | | | 220 | % | | | 390 | % | | | 405 | % |
| a | Unaudited figures for the period ended June 30, 2012. Percentage amounts for the period, except total return and portfolio turnover rate, have been annualized. |
| c | The Fund changed its fiscal year end from March 31 to December 31 in 2009. Percentage amounts for the period, except total return and portfolio turnover rate, have been annualized. |
| d | Net investment income (loss) per share was computed using average shares outstanding throughout the period. |
| e | Net investment income is less than $0.01 per share. |
| f | Redemption fees collected are less than $0.01 per share. |
| g | Total return does not reflect the impact of any applicable sales charges and has not been annualized. |
| h | Net expense information reflects the expense ratios after expense waivers. |
| 44 | THE GUGGENHEIM FUNDS SEMI-ANNUAL REPORT | SEE NOTES TO FINANCIAL STATEMENTS. |
NOTES TO consolidated FINANCIAL STATEMENTS (Unaudited)
1. Organization, Consolidation of Subsidiary and Significant Accounting Policies
Organization
The Rydex Series Funds (the “Trust”) is registered with the SEC under the Investment Company Act of 1940 (“1940 Act”) as a non-diversified, open-ended investment company. The Trust offers eight separate classes of shares, Investor Class shares, Advisor Class shares, A-Class shares, C Class shares, H-Class shares, Y-Class shares, Institutional Class shares and Money Market Class shares. Sales of shares of each Class are made without a sales charge at the net asset value ("NAV"), with the exception of A-Class shares. A-Class shares are sold at the NAV, plus the applicable front-end sales charge. The sales charge varies depending on the amount purchased, but will not exceed 4.75%. A-Class share purchases of $1 million or more are exempt from the front-end sales charge but have a 1% CDSC if shares are redeemed within 18 months of purchase. C-Class shares have a 1% CDSC if shares are redeemed within 12 months of purchase.
At June 30, 2012, the Trust consisted of fifty-eight separate funds. This report covers the Long/Short Commodities Strategy Fund, the Global Managed Futures Fund, the Multi-Hedge Strategies Fund and the Commodities Strategy Fund (collectively, the “Funds”). Only A-Class, C-Class, H-Class, Y-Class and Institutional Class shares had been issued by the Funds.
Guggenheim Investments (“GI”) provides advisory services and Rydex Fund Services, LLC (“RFS”) provides transfer agent, administrative and accounting services to the Trust. Rydex Distributors, LLC (“RDL”) acts as principal underwriter for the Trust. GI, RFS and RDL are affiliated entities.
Consolidation of Subsidiary
Each of the consolidated financial statements of the Funds include the accounts of a wholly-owned and controlled Cayman Islands subsidiary (the “Subsidiary”). Significant inter-company accounts and transactions have been eliminated in consolidation for the Funds.
Each Fund may invest up to 25% of its total assets in its Subsidiary which acts as an investment vehicle in order to effect certain investments consistent with the Fund’s investment objectives and policies.
A summary of each Fund’s investment in its respective Subsidiary is as follows:
| | | | | | | | % of Total | |
| | | | | Subsidiary | | | Net Assets | |
| | | Inception | | Net Assets at | | | of the Fund at | |
| | | Date of | | June 30, | | | June 30, | |
| | | Subsidiary | | 2012 | | | 2012 | |
| Long/Short Commodities | | | | | | | | | | |
| Strategy Fund | | 06/25/09 | | | 44,669,065 | | | | 11.1 | % |
| Global Managed | | | | | | | | | | |
| Futures Strategy Fund | | 05/10/12 | | | 2,194,806 | | | | 15.0 | % |
| Multi-Hedge Strategies Fund | | 09/18/09 | | | 3,587,551 | | | | 2.6 | % |
| Commodities Strategy Fund | | 09/08/09 | | | 3,288,391 | | | | 18.8 | % |
Significant Accounting Policies
The following significant accounting policies are in conformity with U.S. generally accepted accounting principles (“GAAP”) and are consistently followed by the Trust. This requires management to make estimates and assumptions that affect the reported amount of assets and liabilities and disclosure of contingent assets and liabilities at the date of the financial statements and the reported amounts of revenues and expenses during the reporting period. Actual results could differ from these estimates. All time references are based on Eastern Time.
A. Equity securities listed on an exchange (New York Stock Exchange (“NYSE”) or American Stock Exchange) are valued at the last quoted sales price as of the close of business on the NYSE, usually 4.00 p.m. on the valuation date. Equity securities listed on the NASDAQ market system are valued at the NASDAQ Official Closing Price on the valuation date.
The value of futures contracts purchased and sold by the Funds is accounted for using the unrealized gain or loss on the contracts that is determined by marking the contracts to their current realized settlement prices. Financial futures contracts are valued at the 4:00 p.m. price on the valuation date. In the event that the exchange for a specific futures contract closes earlier than 4:00 p.m., the futures contract is valued at the Official Settlement Price of the exchange. However, the underlying securities from which the futures contract value is derived are monitored until 4:00 p.m. to determine if fair valuation would provide a more accurate valuation.
The value of credit default swap agreements entered into by a Fund is accounted for using the unrealized gain or loss on the agreements that is determined by marking the agreements to the last quoted value of the index that the swap pertains to at the close of the NYSE. The swap’s market value is then adjusted to include dividends accrued, financing charges and/or interest associated with the swap agreements.
44 | THE GUGGENHEIM FUNDS semi-annual REPORT
NOTES TO consolidated FINANCIAL STATEMENTS (Unaudited) (continued)
Debt securities with a maturity of greater than 60 days at acquisition are valued at prices that reflect broker/dealer supplied valuations or are obtained from independent pricing services, which may consider the trade activity, treasury spreads, yield or price of bonds of comparable quality, coupon, maturity, and type, as well as prices quoted by dealers who make markets in such securities. Short-term debt securities with a maturity of 60 days or less at acquisition and repurchase agreements are valued at amortized cost, which approximates market value.
Open-end investment companies (“Mutual Funds”) are valued at their NAV as of the close of business on the valuation date. Exchange Trade Funds (“ETF”) and closed-end investment companies are valued at the last quoted sales price.
Investments for which market quotations are not readily available are fair valued as determined in good faith by GI under the direction of the Board of Trustees using methods established or ratified by the Board of Trustees. These methods include, but are not limited to: (i) using general information as to how these securities and assets trade; (ii) in connection with futures contracts and options thereupon, and other derivative investments, information as to how (a) these contracts and other derivative investments trade in the futures or other derivative markets, respectively, and (b) the securities underlying these contracts and other derivative investments trade in the cash market; and (iii) other information and considerations, including current values in related markets.
B. Security transactions are recorded on the trade date for financial reporting purposes. Realized gains and losses from securities transactions are recorded using the identified cost basis. Proceeds from lawsuits related to investment holdings are recorded as realized gains in the respective Fund. Dividend income is recorded on the ex-dividend date, net of applicable taxes withheld by foreign countries. Taxable non-cash dividends are recorded as dividend income. Interest income, including amortization of premiums and accretion of discounts, is accrued on a daily basis. Distributions received from investments in REITs are recorded as dividend income on the ex-dividend date, subject to reclassification upon notice of the character of such distribution by the issuer.
C. Distributions of net investment income and net realized gains, if any, are declared and paid at least annually. Distributions are recorded on the ex-dividend date and are determined in accordance with income tax regulations which may differ from U.S. GAAP.
D. When a Fund engages in a short sale of a security, an amount equal to the proceeds is reflected as an asset and an equivalent liability. The amount of the liability is subsequently marked-to-market to reflect the market value of the short sale. The Fund maintains a segregated account of cash and/or securities as collateral for short sales. The Fund is exposed to market risk based on the amount, if any, that the market value of the security exceeds the market value of the securities in the segregated account.
Fees, if any, paid to brokers to borrow securities in connection with short sales are recorded as interest expense. In addition, the Fund must pay out the dividend rate of the equity or coupon rate of the treasury obligation to the lender and record this as an expense. Short dividend or interest expense is a cost associated with the investment objective of short sales transactions, rather than an operational cost associated with the day-to-day management of any mutual fund. The Funds may also receive rebate income from the broker resulting from the investment of the proceeds from securities sold short.
E. Upon entering into a futures contract, a Fund deposits and maintains as collateral such initial margin as required by the exchange on which the transaction is affected. Pursuant to the contract, the Fund agrees to receive from or pay to the broker an amount of cash equal to the daily fluctuation in value of the contract. Such receipts or payments are known as variation margin and are recorded by the Fund as unrealized gains or losses. When the contract is closed, the Fund records a realized gain or loss equal to the difference between the value of the contract at the time it was opened and the value at the time it was closed.
F. Credit default swap agreements are marked-to-market daily and the change, if any, is recorded as unrealized gain or loss. Upfront payments received or made by a Fund are amortized over the expected life of the agreement. Periodic payments received or paid by a Fund are recorded as realized gains or losses. Payments received or made as a result of a credit event or termination of the contract are recognized, net of a proportional amount of the upfront payment, as realized gains or losses.
G. Investment securities and other assets and liabilities denominated in foreign currencies are translated into U.S. dollar amounts at the date of valuation. Purchases and sales of investment securities and income and expense items denominated in foreign currencies are translated into U.S. dollar amounts on the respective dates of such transactions. The Trust does not isolate that portion of the results of operations resulting from changes in foreign exchange rates on investments from the
THE GUGGENHEIM FUNDS semi-annual REPORT | 45
NOTES TO consolidated FINANCIAL STATEMENTS (Unaudited) (continued)
fluctuations arising from changes in market prices of securities held. Such fluctuations are included with the net realized and unrealized gain and loss from investments.
Reported net realized foreign exchange gains or losses arise from sales of foreign currencies and currency gains or losses realized between the trade and settlement dates on investment transactions. Net unrealized exchange gains and losses arise from changes in the fair values of assets and liabilities other than investments in securities at the fiscal period end, resulting from changes in exchange rates.
H. Certain U.S. Government and Agency Obligations are traded on a discount basis; the interest rates shown on the Schedules of Investments reflect the effective rates paid at the time of purchase by the Funds. Other securities bear interest at the rates shown, payable at fixed dates through maturity.
I. The Funds may leave cash overnight in their cash account with the custodian, U.S. Bank. Periodically, a Fund may have cash due to the custodian bank as an overdraft balance. A fee is incurred on this overdraft, calculated by multiplying the overdraft by a rate based on the federal funds rate.
Segregated cash with the broker is held as collateral for investments in derivative instruments such as futures contracts or swap agreements.
J. Interest and dividend income, most expenses, all realized gains and losses, and all unrealized gains and losses are allocated to the Classes based upon the value of the outstanding shares in each Class. Certain costs, such as distribution fees relating to A-Class shares and H-Class shares and service and distribution fees related to C-Class shares, are charged directly to specific Classes. In addition, certain expenses have been allocated to the individual Funds in the Trust on a pro rata basis upon the respective aggregate net assets of each Fund included in the Trust.
K. Throughout the normal course of business, the Funds enter into contracts that contain a variety of representations and warranties which provide general indemnifications. The Funds’ maximum exposure under these arrangements is unknown, as this would involve future claims that may be made against the Funds and/or their affiliates that have not yet occurred. However, based on experience, the Funds expect the risk of loss to be remote.
2. Financial Instruments
As part of their investment strategy, the Funds utilize short sales and a variety of derivative instruments including futures and swap agreements. These investments involve, to varying degrees, elements of market risk and risks in excess of the amounts recognized in the Statements of Assets and Liabilities.
A short sale is a transaction in which a Fund sells a security it does not own. If the security sold short decreases in price between the time the Fund sells the security and closes its short position, that Fund will realize a gain on the transaction. Conversely, if the security increases in price during the period, that Fund will realize a loss on the transaction. The risk of such price increases is the principal risk of engaging in short sales.
A futures contract is an agreement to purchase (long) or sell (short) an agreed amount of securities or other instruments at a set price for delivery at a future date. There are significant risks associated with a Fund’s or an underlying fund’s use of futures contracts and related options, including (i) there may be an imperfect or no correlation between the changes in market value of the underlying asset and the prices of futures contracts; (ii) there may not be a liquid secondary market for a futures contract; (iii) trading restrictions or limitations may be imposed by an exchange; and (iv) government regulations may restrict trading in futures contracts. When investing in futures, there is minimal counterparty credit risk to the Fund because futures are exchange-traded and the exchange’s clearinghouse, as counterparty to all exchange-traded futures, guarantees against default.
A swap is an agreement that obligates two parties to exchange a series of cash flows at specified intervals based upon or calculated by reference to changes in specified prices or rates for a specified amount of an underlying asset. A credit default swap enables a Fund to buy or sell protection against a defined credit event of an issuer or a basket of securities. Generally, the seller of credit protection against an issuer or basket of securities receives a periodic payment from the buyer to compensate against potential default events. If a default event occurs, the seller must pay the buyer the full notional value of the reference obligation in exchange for the reference obligation. If no default occurs, the counterparty will pay the stream of payments and have no further obligations to the Fund selling the credit protection. A Fund bears the risk of loss of the amount expected to be received under a
46 | THE GUGGENHEIM FUNDS semi-annual REPORT
NOTES TO consolidated FINANCIAL STATEMENTS (Unaudited) (continued)
swap agreement in the event of the default or bankruptcy of a swap agreement counterparty, or in the case of a credit default swap in which the Fund is selling credit protection, the default of a third party issuer. Additionally, there is no guarantee that a Fund or an underlying fund could eliminate its exposure under an outstanding swap agreement by entering into an offsetting swap agreement with the same or another party.
In conjunction with the use of short sales, futures, and swap agreements, the Funds are required to maintain collateral in various forms. The Funds use, where appropriate, depending on the financial instrument utilized and the broker involved, margin deposits at the broker, cash and/or securities segregated at the custodian bank, discount notes, or the repurchase agreements allocated to each Fund.
The Trust has established counterparty credit guidelines and enters into transactions only with financial institutions of investment grade or better. The Trust monitors the counterparty credit risk.
3. Fees and Other Transactions with Affiliates
Under the terms of an investment advisory contract, the Trust pays GI investment advisory fees calculated at the annualized rates below, based on the average daily net assets of the Funds:
| | | Management Fees | |
| Fund | | (as a % of Net Assets) | |
| Long/Short Commodities Strategy Fund | | | 0.90 | % |
| Global Managed Futures Strategy Fund | | | 0.90 | % |
| Multi-Hedge Strategies Fund | | | 1.15 | % |
| Commodities Strategy Fund | | | 0.75 | % |
GI has contractually agreed to waive the management fee it receives from each Subsidiary in an amount equal to the management fee paid to GI by the Subsidiary. This undertaking will continue in effect for so long as the Fund invests in the Subsidiary, and may not be terminated by GI unless GI obtains the prior approval of the Fund’s Board of Trustees for such termination. In any event, this undertaking will continue through April 30, 2013.
Effective May 10, 2012, the investment advisory contract for the Global Managed Futures Strategy Fund provides that the total expenses be limited to 1.25% of average net assets for Institutional Class shares, exclusive of brokerage costs, dividends on securities sold short, expenses of other investment companies in which a Fund invests, interest, taxes, litigation, indemnification and extraordinary expenses (as determined under GAAP). This contract is in effect through May 10, 2013.
As part of its agreement with the Trust, GI will pay all expenses of the Multi-Hedge Strategies Fund, including the cost of transfer agency, custody, fund administration, legal, audit and other services, except interest expense, taxes (expected to be de minimis), brokerage commissions and other expenses connected with execution of portfolio transactions, short dividend expenses, subsidiary expenses and extraordinary expenses.
RFS provides transfer agent and administrative services to the Funds for fees calculated at an annualized rate of 0.25% of the average daily net assets of A-Class, C-Class, H-Class and Institutional Class, and 0.20% of the average daily net assets of Y-Class. Fees related to the Multi-Hedge Strategies Fund are paid by GI, as previously noted.
RFS also provides accounting services to the Funds for fees calculated at annualized rates below, based on the average daily net assets of each Fund. Fees related to the Multi-Hedge Strategies Fund are paid by GI, as previously noted.
| Fund Accounting Fees | | (as a % of Net Assets) | |
| On the first $250 million | | | 0.10 | % |
| On the next $250 million | | | 0.075 | % |
| On the next $250 million | | | 0.05 | % |
| Over $750 million | | | 0.03 | % |
RFS engages external service providers to perform other necessary services for the Trust, such as audit and accounting related services, legal services, custody, printing and mailing, etc., on a pass through basis. Such expenses vary from Fund to Fund and are allocated to the Funds based on relative net assets. Certain expenses allocated to the Multi-Hedge Strategies Fund are paid by GI, as previously noted.
The Trust has adopted a Distribution Plan applicable to A-Class shares and H-Class shares for which RDL and other firms that provide distribution and/or shareholder services (“Service Providers”) may receive compensation. If a Service Provider provides distribution services, the Trust will pay distribution fees to RDL at an annual rate not to exceed 0.25% of average daily net assets, pursuant to Rule 12b-1 of the 1940 Act. RDL, in turn, will pay the Service Provider out of its fees. RDL may, at its discretion, retain a portion of such payments to compensate itself for distribution services.
THE GUGGENHEIM FUNDS semi-annual REPORT | 47
NOTES TO consolidated FINANCIAL STATEMENTS (Unaudited) (continued)
The Trust has adopted a separate Distribution and Shareholder Services Plan applicable to its C-Class shares that allows the Funds to pay annual distribution and service fees of 1.00% of the Funds’ C-Class shares average daily net assets. The annual 0.25% service fee compensates the shareholder’s financial advisor for providing ongoing services to the shareholder. The annual distribution fee of 0.75% reimburses RDL for paying the shareholder’s financial advisor an ongoing sales commission. RDL advances the first year’s service and distribution fees to the financial advisor. RDL retains the service and distribution fees on accounts with no authorized dealer of record.
For the period ended June 30, 2012, RDL retained sales charges of $155,697 relating to sales of A-Class shares of the Trust.
Certain officers and trustees of the Trust are also officers of GI, RFS and RDL.
4. Fair Value Measurement
In accordance with U.S. GAAP, fair value is defined as the price that the Fund would receive to sell an investment or pay to transfer a liability in an orderly transaction with an independent buyer in the principal market, or in the absence of a principal market the most advantageous market for the investment or liability. A three-tier hierarchy is utilized to distinguish between (1) inputs that reflect the assumptions market participants would use in pricing an asset or liability developed based on market data obtained from sources independent of the reporting entity (observable inputs) and (2) inputs that reflect the reporting entity’s own assumptions about the assumptions market participants would use in pricing an asset or liability developed based on the best information available in the circumstances (unobservable inputs) and to establish classification of fair value measurements for disclosure purposes. Various inputs are used in determining the value of the Funds’ investments. The inputs are summarized in the three broad levels listed below:
Level 1 — quoted prices in active markets for identical securities.
Level 2 — other significant observable inputs (including quoted prices for similar securities, interest rates, prepayment speeds, credit risk, etc.).
Level 3 — significant unobservable inputs (including the fund’s own assumptions used to determine the fair value of investments).
The inputs or methodologies used for valuing securities are not necessarily an indication of the risk associated with investing in those securities.
The following table summarizes the inputs used to value the Funds’ net assets at June 30, 2012:
| | | Level 1 | | | Level 1 | | | Level 2 | | | Level 3 | | | | |
| | | Investments | | | Other Financial | | | Investments | | | Investments | | | | |
| | | In Securities | | | Instruments* | | | In Securities | | | In Securities | | | Total | |
| Assets | | | | | | | | | | | | | | | | | | | | |
| Long/Short Commodities Strategy Fund | | $ | — | | | $ | 11,550,752 | | | $ | 365,877,818 | | | $ | — | | | $ | 377,428,570 | |
| Global Managed Futures Strategy Fund | | | — | | | | 1,430,187 | | | | 12,922,861 | | | | — | | | | 14,353,048 | |
| Multi-Hedge Strategies Fund | | | 97,996,938 | | | | 6,899,697 | | | | 24,499,416 | | | | — | | | | 129,396,051 | |
| Commodities Strategy Fund | | | — | | | | 317,443 | | | | 15,218,677 | | | | — | | | | 15,536,120 | |
| | | | | | | | | | | | | | | | | | | | | |
| Liabilities | | | | | | | | | | | | | | | | | | | | |
| Long/Short Commodities Strategy Fund | | $ | — | | | $ | 30,678,845 | | | $ | — | | | $ | — | | | $ | 30,678,845 | |
| Global Managed Futures Strategy Fund | | | — | | | | 693,938 | | | | — | | | | — | | | | 693,938 | |
| Multi-Hedge Strategies Fund | | | 68,334,559 | | | | 5,171,380 | | | | 187,270 | | | | — | | | | 73,693,209 | |
* Other financial instruments include futures contracts and/or swaps, which are reported as unrealized gain/loss at period end.
For the period ended June 30, 2012, there were no transfers between levels.
5. Repurchase Agreements
The Funds transfer uninvested cash balances into a single joint account, the daily aggregate balance of which is invested in one or more repurchase agreements collateralized by obligations of the U.S. Treasury and U.S. Government Agencies. The collateral is in the possession of the Funds’ custodian and is evaluated to ensure that its market value exceeds, at a minimum, 102% of the original face amount of the repurchase agreements. Each Fund holds a pro rata share of the collateral based on the dollar amount of the repurchase agreement entered into by each Fund.
48 | THE GUGGENHEIM FUNDS semi-annual REPORT
NOTES TO consolidated FINANCIAL STATEMENTS (Unaudited) (continued)
At June 30, 2012, the collateral for the repurchase agreements in the joint account was as follows:
| Counterparty and Terms of Agreement | | | Face Value | | | | Repurchase Price | | | Collateral | | | Par Value | | | | Fair Value | |
| HSBC Group | | | | | | | | | | U.S. Treasury Bonds | | | | | | | | |
| 0.12% | | | | | | | | | | 3.88% - 4.50% | | | | | | | | |
| Due 07/02/12 | | $ | 696,750,000 | | | $ | 696,756,968 | | | 02/15/36 - 08/15/40 | | $ | 211,564,000 | | | $ | 281,967,002 | |
| | | | | | | | | | | U.S. Treasury STRIPS | | | | | | | | |
| | | | | | | | | | | 0.00% | | | | | | | | |
| | | | | | | | | | | 08/15/14 - 08/15/16 | | | 250,000,000 | | | | 247,095,000 | |
| | | | | | | | | | | Freddie Mac Notes | | | | | | | | |
| | | | | | | | | | | 4.38% - 5.13% | | | | | | | | |
| | | | | | | | | | | 07/15/12 - 05/15/16 | | | 95,565,000 | | | | 106,069,820 | |
| | | | | | | | | | | Federal Home Loan Bank | | | | | | | | |
| | | | | | | | | | | 0.04% | | | | | | | | |
| | | | | | | | | | | 07/02/14 | | | 75,000,000 | | | | 75,553,750 | |
| Mizuho Financial Group, Inc. | | | | | | | | | | U.S. Treasury Bill | | | | | | | | |
| 0.12% | | | | | | | | | | 0.00% | | | | | | | | |
| Due 07/02/12 | | | 297,139,164 | | | | 297,142,136 | | | 11/15/14 | | | 303,689,400 | | | | 303,082,021 | |
| Credit Suisse Group | | | | | | | | | | U.S. Treasury Notes | | | | | | | | |
| 0.08% | | | | | | | | | | 2.13% - 3.13% | | | | | | | | |
| Due 07/02/12 | | | 203,265,954 | | | | 203,267,309 | | | 05/30/13 - 08/15/21 | | | 192,485,700 | | | | 207,331,467 | |
| Deutsche Bank | | | | | | | | | | U.S. Treasury Note | | | | | | | | |
| 0.10% | | | | | | | | | | 0.38% | | | | | | | | |
| Due 07/02/12 | | | 196,750,000 | | | | 196,751,640 | | | 07/17/15 | | | 200,561,000 | | | | 200,685,027 | |
In the event of counterparty default, the Funds have the right to collect the collateral to offset losses incurred. There is potential loss to the Funds in the event the Funds are delayed or prevented from exercising their rights to dispose of the collateral securities, including the risk of a possible decline in the value of the underlying securities during the period while the Funds seek to assert their rights. The Funds’ investment advisor, acting under the supervision of the Board of Trustees, reviews the value of the collateral and the creditworthiness of those banks and dealers with which the Funds enter into repurchase agreements to evaluate potential risks.
6. Derivative Investment Holdings Categorized by Risk Exposure
U.S. GAAP requires disclosures to enable investors to better understand how and why the Funds use derivative instruments, how these derivative instruments are accounted for and their effects on the Funds’ financial position and results of operations.
The following Funds utilized derivatives for the following purposes:
| Fund Name | Index Exposure | Liquidity | Hedging | Income | Speculation |
| Long/Short Commodities Strategy Fund | x | x | | | |
| Global Managed Futures Strategy Fund | x | x | | | |
| Multi-Hedge Strategies Fund | | | x | x | x |
| Commodities Strategy Fund | x | x | | | |
The following table represents the notional amount of derivative instruments outstanding, as an approximate percentage of the Funds’ net assets on a daily basis, while the risk to the Fund is limited to the profit earned on such derivatives.
| | | Approximate percentage |
| | | of Fund’s net assets |
| | | | | on a daily basis |
| Fund | | Long | | Short |
| Long/Short Commodities Strategy Fund | | 30% | | 110% |
| Global Managed Futures Strategy Fund | | 465% | | 130% |
| Multi-Hedge Strategies Fund | | 45% | | 70% |
| Commodities Strategy Fund | | 100% | | — |
THE GUGGENHEIM FUNDS semi-annual REPORT | 49
NOTES TO consolidated FINANCIAL STATEMENTS (Unaudited) (continued)
The following is a summary of the location of derivative investments on the Funds’ Statements of Assets and Liabilities as of June 30, 2012:
Location on the Statements of Assets and Liabilities
| Derivative Investment Type | Asset Derivatives | Liability Derivatives |
| Equity, currency, interest rate | | |
| and commodity contracts | Variation margin | Variation margin |
| Credit contracts | Unrealized appreciation on swap agreements | Unrealized depreciation on swap agreements |
The following table sets forth the fair value of the Funds’ derivative investments categorized by primary risk exposure at June 30, 2012:
Asset Derivative Investments Value
| | | Futures | | | Futures | | | Futures | | | Futures | | | Swaps | | | | |
| | | Equity | | | Currency | | | Interest Rate | | | Commodity | | | Credit Default | | | Total Value at | |
| Fund | | Contracts* | | | Contracts* | | | Contracts* | | | Contracts* | | | Contracts | | | June 30, 2012 | |
| Long/Short Commodities Strategy Fund | | $ | — | | | $ | — | | | $ | — | | | $ | 11,550,752 | | | $ | — | | | $ | 11,550,752 | |
| Global Managed Futures Strategy Fund | | | 53,566 | | | | 46,014 | | | | 1,196,113 | | | | 134,494 | | | | — | | | | 1,430,187 | |
| Multi-Hedge Strategies Fund | | | 2,274,164 | | | | — | | | | — | | | | 4,625,533 | | | | 187,270 | | | | 7,086,967 | |
| Commodities Strategy Fund | | | — | | | | — | | | | — | | | | 317,443 | | | | — | | | | 317,443 | |
| Liability Derivative Investments Value |
| | | Futures | | | Futures | | | Futures | | | Futures | | | Swaps | | | | |
| | | Equity | | | Currency | | | Interest Rate | | | Commodity | | | Credit Default | | | Total Value at | |
| Fund | | Contracts* | | | Contracts* | | | Contracts* | | | Contracts* | | | Contracts | | | June 30, 2012 | |
| Long/Short Commodities Strategy Fund | | $ | — | | | $ | — | | | $ | — | | | $ | 30,678,845 | | | $ | — | | | $ | 30,678,845 | |
| Global Managed Futures Strategy Fund | | | 79,332 | | | | 49,060 | | | | 98,728 | | | | 466,818 | | | | — | | | | 693,938 | |
| Multi-Hedge Strategies Fund | | | 1,849,017 | | | | — | | | | — | | | | 3,322,363 | | | | — | | | | 5,171,380 | |
* Includes cumulative appreciation (depreciation) of futures contracts as reported on the Schedules of Investments. Only current day’s variation margin is reported within the Statements of Assets and Liabilities.
The following is a summary of the location of derivative investments on the Funds’ Statements of Operations for the period ended June 30, 2012:
| Derivative Investment Type | Location of Gain (Loss) on Derivatives |
| Equity, currency, interest rate, commodity and | Net realized gain (loss) on futures contracts and swap agreements |
| credit default contracts | Net change in net unrealized appreciation (depreciation) on futures contracts and swap agreements |
The following is a summary of the location of derivative investments on the Funds’ Statements of Operations for the period ended June 30, 2012:
Realized Gain (Loss) on Derivative Investments Recognized in the Statement of Operations
| | | Futures | | | Futures | | | Futures | | | Futures | | | Swaps | | | | |
| | | Equity | | | Currency | | | Interest Rate | | | Commodity | | | Credit Default | | | | |
| Fund | | Contracts | | | Contracts | | | Contracts | | | Contracts | | | Contracts | | | Total | |
| Long/Short Commodities Strategy Fund | | $ | — | | | $ | — | | | $ | — | | | $ | 2,861,007 | | | $ | — | | | $ | 2,861,007 | |
| Global Managed Futures Strategy Fund | | | (40,171 | ) | | | 10,832 | | | | (1,034,238 | ) | | | 30,128 | | | | — | | | | (1,033,449 | ) |
| Multi-Hedge Strategies Fund | | | (233,173 | ) | | | — | | | | — | | | | (2,768,430 | ) | | | 63,221 | | | | (2,938,382 | ) |
| Commodities Strategy Fund | | | — | | | | — | | | | — | | | | (3,288,629 | ) | | | — | | | | (3,288,629 | ) |
| Change in Unrealized Appreciation (Depreciation) on Derivative Investments Recognized in the Statement of Operations |
| | | Futures | | | Futures | | | Futures | | | Futures | | | Swaps | | | | |
| | | Equity | | | Currency | | | Interest Rate | | | Commodity | | | Credit Default | | | | |
| Fund | | Contracts | | | Contracts | | | Contracts | | | Contracts | | | Contracts | | | Total | |
| Long/Short Commodities Strategy Fund | | $ | — | | | $ | — | | | $ | — | | | $ | (13,560,637 | ) | | $ | — | | | $ | (13,560,637 | ) |
| Global Managed Futures Strategy Fund | | | (25,766 | ) | | | (3,046 | ) | | | 1,097,385 | | | | (332,324 | ) | | | — | | | | 736,249 | |
| Multi-Hedge Strategies Fund | | | 2,231,125 | | | | — | | | | — | | | | 1,380,329 | | | | 152,041 | | | | 3,763,495 | |
| Commodities Strategy Fund | | | — | | | | — | | | | — | | | | 536,666 | | | | — | | | | 536,666 | |
50 | THE GUGGENHEIM FUNDS semi-annual REPORT
NOTES TO consolidated FINANCIAL STATEMENTS (Unaudited) (continued)
7. Disclosures about Credit Derivatives
In accordance with its principal investment strategy, the Multi-Hedge Strategies Fund entered into credit default swaps as a seller of protection primarily to gain exposure similar to the high yield bond market. Credit default swaps are instruments which allow for the full or partial transfer of third party credit risk, with respect to a particular entity or entities, from one counterparty to the other. A seller of credit default swaps is selling credit protection or assuming credit risk with respect to the underlying entity or entities. If a credit event occurs, as defined under the terms of the swap agreement, the Fund will either (i) pay to the buyer of protection an amount equal to the notional amount of the swap and take delivery of the referenced obligation or underlying securities comprising the referenced index or (ii) pay a net settlement amount in the form of cash or securities equal to the notional amount of the swap less the recovery value of the referenced obligation or underlying securities comprising the referenced index. The Notional Principal reflects the maximum potential amount the Fund could be required to make as a seller of credit protection if a credit event occurs. As the seller of protection, the Fund receives periodic premium payments from the counterparty and may also receive or pay an upfront premium adjustment to the stated periodic premium. In the event a credit event occurs, an adjustment will be made to any upfront premiums that were received by a reduction of 1.00% per credit event.
The quoted market prices and resulting market values for credit default swap agreements on securities and credit indices serve as an indicator of the current status of the payment/performance risk and represent the likelihood of an expected liability (or profit) for the credit derivative had the notional amount of the swap agreement been closed/sold as of the period end. Increasing market values, in absolute terms when compared to the notional amount of the swap, represent a deterioration of the referenced entity’s credit soundness and a greater likelihood or risk of default or other credit event occurring as defined under the terms of the agreement.
The table on page 31 included in the Schedule of Investments summarizes the information with regard to sold protection on credit default swap contracts as of June 30, 2012.
8. Federal Income Tax Information
The Funds intend to comply with the provisions of Subchapter M of the Internal Revenue Code applicable to regulated investment companies and distribute substantially all taxable net investment income and capital gains sufficient to relieve the Funds from all, or substantially all, federal income, excise and state income taxes. Therefore, no provision for federal or state income tax is required.
Tax positions taken or expected to be taken in the course of preparing the Funds’ tax returns are evaluated to determine whether the tax positions are “more-likely-than-not” of being sustained by the applicable tax authority. Tax positions not deemed to meet the more-likely-than-not threshold would be recorded as a tax benefit or expense in the current year. Management has analyzed the Funds’ tax positions taken, or to be taken, on Federal income tax returns for all open tax years (fiscal years 2008-2011), and has concluded that no provision for income tax is required in the Funds’ financial statements.
The Long/Short Commodities Strategy Fund, the Multi-Hedge Strategies Fund and the Commodities Strategy Fund intend to invest up to 25% of their assets in the Subsidiary which is expected to provide the Funds with exposure to the commodities markets within the limitations of the federal tax requirements under Subchapter M of the Internal Revenue Code. The Long/Short Commodities Strategy Fund, the Multi-Hedge Strategies Fund and the Commodities Strategy Fund have received a private letter ruling from the IRS that concludes that the income the Funds receive from the Subsidiary will constitute qualifying income for purposes of Subchapter M of the Internal Revenue Code. The Subsidiary will be classified as a corporation for U.S. federal income tax purposes. A foreign corporation, such as the Subsidiary, will generally not be subject to U.S. federal income taxation unless it is deemed to be engaged in a U.S. trade or business.
In July 2011, the IRS notified the RIC industry that it would not issue further private letter rulings until the (IRS) staff could look at the overall set of issues and consider guidance of broader applicability. The Advisor intends to conduct the Global Managed Futures Strategy Fund’s investments in a manner consistent with the terms and conditions of the private letter ruling and pursuant to an opinion of counsel which concludes that such income should be qualifying income for purposes of the RIC qualification tests.
The RIC Modernization Act of 2010 was signed into law on December 22, 2010 and seeks to simplify some of the tax provisions applicable to regulated investment companies and the tax reporting to their shareholders, and to improve the tax efficiency of certain fund structures. The changes are generally effective for taxable years beginning after the date of enactment.
THE GUGGENHEIM FUNDS semi-annual REPORT | 51
NOTES TO consolidated FINANCIAL STATEMENTS (Unaudited) (continued)
One of the more prominent changes addresses capital loss carry forwards. Funds will be permitted to carry forward capital losses incurred in taxable years beginning after December 22, 2010 for an unlimited period. However, any losses incurred during those future taxable years will be required to be utilized prior to the losses incurred in preenactment taxable years. Under pre-enactment law, capital losses could be carried forward for eight years, and carried forward as short-term capital, irrespective of the character of the original loss. As a result of this ordering rule, pre-enactment capital loss carry forwards may potentially expire unused. Additionally, post-enactment capital losses that are carried forward will retain their character as either short-term or long-term capital losses rather than being considered all short-term as under previous law.
At June 30, 2012, the cost of securities for Federal income tax purposes, the aggregate gross unrealized gain for all securities for which there was an excess of value over tax cost and the aggregate gross unrealized loss for all securities for which there was an excess of tax cost over value, were as follows:
| | | | | | Tax | | | Tax | | | Net | |
| | | Tax | | | Unrealized | | | Unrealized | | | Unrealized | |
| Fund Name | | Cost | | | Gain | | | Loss | | | Gain (Loss) | |
| Long/Short Commodities Strategy Fund | | $ | 373,191,098 | | | $ | — | | | $ | (7,313,280 | ) | | $ | (7,313,280 | ) |
| Global Managed Futures Strategy Fund | | | 12,922,861 | | | | — | | | | — | | | | — | |
| Multi-Hedge Strategies Fund | | | 119,480,261 | | | | 5,166,958 | | | | (2,150,864 | ) | | | 3,016,094 | |
| Commodities Strategy Fund | | | 20,933,470 | | | | — | | | | (5,714,793 | ) | | | (5,714,793 | ) |
9. Securities Transactions
For the period ended June 30, 2012, the cost of purchases and proceeds from sales of investment securities, excluding government securities and short-term investments, were:
| | | Purchases | | | Sales | |
| Long/Short Commodities Strategy Fund | | $ | — | | | $ | — | |
| Global Managed Futures Strategy Fund | | | — | | | | — | |
| Multi-Hedge Strategies Fund | | | 60,621,494 | | | | 49,620,776 | |
| Commodities Strategy Fund | | | — | | | | — | |
The Trust, along with other affiliated trusts, secured an uncommitted, $75,000,000 line of credit from U.S. Bank, N.A., which expires June 15, 2013. This line of credit is reserved for emergency or temporary purposes. Borrowings, if any, under this arrangement bear interest equal to the Prime Rate, minus 2%, which shall be paid monthly, averaging 1.25% for the period ended June 30, 2012. The Funds did not have any borrowings under this agreement at June 30, 2012 and did not participate in borrowing during the period.
11. Legal Proceedings
Tribune Company
Rydex Series Funds has been named as a defendant and a putative member of the proposed defendant class of shareholders in the case entitled Official Committee of Unsecured Creditors of Tribune Co. v. FitzSimons (In re Tribune Co.), Adv. Pro. No. 10-54010 (Bankr. D. Del.), as a result of ownership of shares in the Tribune Company (“Tribune”) in 2007 by certain series of the Rydex Series Funds when Tribune effected a leveraged buyout transaction (“LBO”) by which Tribune converted to a privately-held company. In its complaint, the Unsecured Creditors Committee (the “UCC”) has alleged that, in connection with the LBO, insiders and major shareholders were overpaid for their Tribune stock using financing that the insiders knew would, and ultimately did, leave the Tribune insolvent. The UCC has asserted claims against certain insiders, major shareholders, professional advisers, and others involved in the LBO, and is attempting to obtain from shareholders, including Rydex Series Funds, the proceeds paid out in connection with the LBO. This adversary proceeding has been consolidated in a multidistrict litigation proceeding captioned In re Tribune Company Fraudulent Conveyance Litig., No. 11-md-2696 (S.D.N.Y.), and has been stayed pending further order of that court.
In June 2011, a group of Tribune creditors, not including the UCC, filed multiple actions involving state law constructive fraudulent conveyance claims against former Tribune shareholders. Rydex Series Funds also has been named as a defendant in one or more of these suits. Like the adversary proceeding described above, these cases have been consolidated in the multidistrict litigation proceeding in the United States District Court for the Southern District of New York and have been stayed pending further order of that court.
52 | THE GUGGENHEIM FUNDS semi-annual REPORT
NOTES TO consolidated FINANCIAL STATEMENTS (Unaudited) (concluded)
None of these lawsuits allege any wrongdoing on the part of Rydex Series Funds. The following series of Rydex Series Funds held shares of Tribune and tendered these shares as part of Tribune’s LBO: Nova Fund, S&P 500 Pure Value Fund, Multi-Cap Core Equity Fund, S&P 500 Fund, Multi-Hedge Strategies Fund and Hedged Equity Fund (the “Funds”). The value of the proceeds received by the foregoing Funds was $28,220, $109,242, $9,860, $3,400, $1,181,160, and $10,880, respectively. At this stage of the proceedings, Rydex Series Funds is not able to make a reliable predication as to the outcome of these lawsuits or the effect, if any, on a Fund’s net asset value.
Lyondell Chemical Company
In December 2011, Rydex Series Funds was named as a defendant in Weisfelner, as Trustee of the LB Creditor Trust, v. Fund 1 (In re Lyondell Chemical Co.), Adv. Pro. No. 10-4609 (Bankr. S.D.N.Y.).
Similar to the claims made in the Tribune matter, the Weisfelner complaint seeks to have set aside and recovered as fraudulent transfers from former Lyondell Chemical Company (“Lyondell”) shareholders the consideration paid to them pursuant to the cash out merger of Lyondell shareholders in connection with the combination of Lyondell and Basell AF in 2007. Lyondell filed for bankruptcy in 2008.
A motion to dismiss is currently pending before the Bankruptcy Court.
This lawsuit does not allege any wrongdoing on the part of Rydex Series Funds. The following series of Rydex Series Funds received cash proceeds from the cash out merger in the following amounts: Basic Materials Fund - $ 1,725,168; U.S. Long Short Momentum Fund - $2,193,600; Global 130/30 Strategy Fund - $37,920; Hedged Equity Fund - $1,440; and Multi-Hedge Strategies Fund - $1,116,480. At this stage of the proceedings, Rydex Series Funds is not able to make a reliable predication as to the outcome of these lawsuits or the effect, if any, on a Fund’s net asset value.
12. Fund Merger
At a meeting held on November 21, 2011, the Board of Trustees (the “Board”) of Rydex Series Funds (the “Trust”) unanimously approved an Agreement and Plan of Reorganization (the “Agreement”) providing for the reorganization of the Trust’s Alternative Strategies Allocation Fund with and into the Multi-Hedge Strategies Fund, each a separate series of the Trust. The agreement provides for: (a) the transfer of the assets and stated liabilities of each share class of the Alternative Strategies Allocation Fund in exchange for the corresponding share class of the Multi-Hedge Strategies Fund, and (b) the distribution of the appropriate share class of the Multi-Hedge Strategies Fund pro rata by the Alternative Strategies Allocation Fund to its shareholders, in complete liquidation of the Alternative Strategies Allocation Fund (the “Reorganization”). The Reorganization was a tax-free transaction and was approved at a Special Meeting of Shareholders on June 29, 2012. The Reorganization occurred on July 13, 2012. Shareholders will receive the applicable class of shares of the Multi-Hedge Strategies Fund with a value equal to the value of their investment in the Alternative Strategies Allocation Fund as of 4:00 p.m., Eastern Time on the Closing Date (the “Effective Time”). Following the distribution of Multi-Hedge Strategies Fund shares, the Alternative Strategies Allocation Fund will cease operations and be liquidated.
THE GUGGENHEIM FUNDS semi-annual REPORT | 53
OTHER INFORMATION (Unaudited)
Proxy Voting Information
A description of the policies and procedures that the Trust uses to determine how to vote proxies relating to securities held in the Funds’ portfolios is available, without charge and upon request, by calling 1.800.820.0888. This information is also available from the EDGAR database on the SEC’s website at http://www.sec.gov.
Information regarding how the Funds voted proxies relating to portfolio securities during the most recent 12-month period ended June 30 is available without charge, upon request, by calling 1.800.820.0888. This information is also available from the EDGAR database on the SEC’s website at http://www.sec.gov.
Quarterly Portfolio Schedules Information
The Trust files its complete schedule of portfolio holdings with the SEC for the first and third quarters of each fiscal year on Form N-Q; which are available on the SEC’s website at http://www.sec.gov. The Funds’ Forms N-Q may be reviewed and copied at the SEC’s Public Reference Room in Washington, DC, and that information on the operation of the Public Reference Room may be obtained by calling 1-800-SEC-0330. Copies of the portfolio holdings are also available to shareholders, without charge and upon request, by calling 1.800.820.0888.
Office Locations
The offices of Guggenheim Investments can be found in the following locations:
40 East 52nd Street
16th Floor
New York, NY 10022
(Headquarters)
Four Irvington Centre
805 King Farm Boulevard
Suite 600
Rockville, MD 20850
9401 Indian Creek Parkway
40 Corporate Woods
Suite 850
Overland Park, KS 66210
54 | THE GUGGENHEIM FUNDS semi-annual REPORT
INFORMATION ON BOARD OF TRUSTEES AND OFFICERS (Unaudited)
A Board of Trustees oversees the Trust, as well as other trusts of GI, in which its members have no stated term of service, and continue to serve after election until resignation. The Statement of Additional Information includes further information about Fund Trustees and Officers, and can be obtained without charge by calling 800.820.0888.
All Trustees and Officers may be reached c/o Guggenheim Investments, 805 King Farm Boulevard, Suite 600, Rockville, MD 20850.
| TRUSTEE AND OFFICER | | | | |
| | | Length of Service | | |
| Name and | | As Trustee | | Number of |
| Year of Birth | | (Year Began) | | Funds Overseen |
| Donald C. Cacciapaglia* | | Rydex Series Funds – 2012 | | 149 |
| (1951) | | Rydex Variable Trust – 2012 | | |
| | | Rydex Dynamic Funds – 2012 | | |
| | | Rydex ETF Trust – 2012 | | |
Principal Occupations During Past Five Years: Current: Security Investors, LLC: President and CEO from April 2012 to present; Guggenheim Investments: President and Chief Administrative Officer from February 2010 to present; Previous: Channel Capital Group, Inc.: Chairman and CEO from April 2002 to February 2010
Positions held within the Trust: Trustee from 2012 to present; President from 2012 to present
| INDEPENDENT TRUSTEES | | | | |
| | | Length of Service | | |
| Name and | | As Trustee | | Number of |
| Year of Birth | | (Year Began) | | Funds Overseen |
| Corey A. Colehour | | Rydex Series Funds – 1993 | | 149 |
| (1945) | | Rydex Variable Trust – 1998 | | |
| | | Rydex Dynamic Funds – 1999 | | |
| | | Rydex ETF Trust – 2003 | | |
Principal Occupations During Past Five Years: Current: Retired; Previous: President and Senior Vice President of Schield Management Company (registered investment adviser) from 2003 to 2006
Positions held within the Trust: Trustee from 2003 to present; Member of the Audit Committee from 2003 to present; and Member of the Governance and Nominating Committees from 2005 to present
| J. Kenneth Dalton | | Rydex Series Funds – 1995 | | 149 |
| (1941) | | Rydex Variable Trust – 1998 | | |
| | | Rydex Dynamic Funds – 1999 | | |
| | | Rydex ETF Trust – 2003 | | |
Principal Occupations During Past Five Years: Current: Retired
Positions held within the Trust: Trustee from 2003 to present; Member and Chairman of the Audit Committee from 2003 to present; Member of the Governance and Nominating Committees from 2005 to present; and Member of the Risk Oversight Committee from 2010 to present
| John O. Demaret | | Rydex Series Funds – 1997 | | 149 |
| (1940) | | Rydex Variable Trust – 1998 | | |
| | | Rydex Dynamic Funds – 1999 | | |
| | | Rydex ETF Trust – 2003 | | |
Principal Occupations During Past Five Years: Current: Retired
Positions held within the Trust: Trustee from 2003 to present; Chairman of the Board from 2006 to present; Member of the Audit Committee from 2003 to present; and Member of the Risk Oversight Committee from 2010 to present
THE GUGGENHEIM FUNDS semi-annual REPORT | 55
INFORMATION ON BOARD OF TRUSTEES AND OFFICERS (Unaudited) (continued)
| INDEPENDENT TRUSTEES – concluded | | | | |
| | | Length of Service | | |
| Name and | | As Trustee | | Number of |
| Year of Birth | | (Year Began) | | Funds Overseen |
| Werner E. Keller | | Rydex Series Funds – 2005 | | 149 |
| (1940) | | Rydex Variable Trust – 2005 | | |
| | | Rydex Dynamic Funds – 2005 | | |
| | | Rydex ETF Trust – 2005 | | |
Principal Occupations During Past Five Years: Current: Founder and President of Keller Partners, LLC (investment research firm) from 2005 to present; Previous: Retired from 2001 to 2005
Positions held within the Trust: Vice Chairman of the Board of Trustees from 2010 to present; Trustee and Member of the Audit, Governance and Nominating Committees from 2005 to present; and Chairman and Member of the Risk Oversight Committee from 2010 to present
| Thomas F. Lydon, Jr. | | Rydex Series Funds – 2005 | | 149 |
| (1960) | | Rydex Variable Trust – 2005 | | |
| | | Rydex Dynamic Funds – 2005 | | |
| | | Rydex ETF Trust – 2005 | | |
Principal Occupations During Past Five Years: Current: President of Global Trends Investments (registered investment adviser) from 1996 to present
Positions held within the Trust: Trustee and Member of the Audit, Governance and Nominating Committees from 2005 to present
| Patrick T. McCarville | | Rydex Series Funds – 1997 | | 149 |
| (1942) | | Rydex Variable Trust – 1998 | | |
| | | Rydex Dynamic Funds – 1999 | | |
| | | Rydex ETF Trust – 2003 | | |
Principal Occupations During Past Five Years: Current: Retired; Previous: Chief Executive Officer of Par Industries, Inc., d/b/a Par Leasing from 1977 to 2010
Positions held within the Trust: Trustee from 2003 to present; Member of the Audit Committee from 2003 to present; and Chairman of the Governance and Nominating Committees from 2005 to present
| Roger Somers | | Rydex Series Funds – 1993 | | 149 |
| (1944) | | Rydex Variable Trust – 1998 | | |
| | | Rydex Dynamic Funds – 1999 | | |
| | | Rydex ETF Trust – 2003 | | |
Principal Occupations During Past Five Years: Current: Founder and Chief Executive Officer of Arrow Limousine from 1965 to present
Positions held within the Trust: Trustee from 2003 to present; Member of the Audit Committee from 2003 to present; and Member of the Governance and Nominating Committees from 2005 to present
56 | THE GUGGENHEIM FUNDS semi-annual REPORT
INFORMATION ON BOARD OF TRUSTEES AND OFFICERS (Unaudited) (concluded)
EXECUTIVE OFFICERS
| Name, Position and | | | Principal Occupations | |
| Year of Birth | | | During Past Five Years | |
Michael P. Byrum* Vice President (1970) | Current: President, Security Benefit Asset Management Holdings, LLC; Senior Vice President, Security Investors, LLC; President & Chief Investment Officer, Rydex Holdings, LLC; Director & Chairman of the Board, Advisor Research Center, Inc.; and Manager, Rydex Specialized Products, LLC |
| | |
| | Previous: Rydex Distributors, LLC (f/k/a Rydex Distributors, Inc.), Vice President (2009); Rydex Fund Services, LLC, Director (2009–2010), Secretary (2002–2010), Executive Vice President (2002–2006); Rydex Advisors, LLC (f/k/a PADCO Advisors, Inc.), Director (2008–2010), Chief Investment Officer (2006–2010), President (2004-2010), Secretary (2002–2010); Rydex Advisors II, LLC (f/k/a PADCO Advisors II, Inc.), Director (2008–2010), Chief Investment Officer (2006–2010), President (2004–2010), Secretary (2002–2010); Rydex Capital Partners, LLC, President & Secretary (2003–2007); Rydex Capital Partners II, LLC, (2003–2007); Rydex Holdings, LLC (f/k/a Rydex Holdings, Inc.), Secretary (2005–2008), Executive Vice President (2005–2006); Advisor Research Center, Inc., Secretary (2006–2009), Executive Vice President (2006); and Rydex Specialized Products, LLC, Secretary (2005–2008) |
| | |
Nikolaos Bonos* Vice President and Treasurer (1963) | Current: Senior Vice President, Security Investors, LLC; Chief Executive Officer & Manager, Rydex Specialized Products, LLC; Chief Executive Officer & President, Rydex Fund Services, LLC; Vice President, Rydex Holdings, LLC; Treasurer, SBL Fund; Security Equity Fund; Security Income Fund; Security Large Cap Value Fund & Security Mid Cap Growth Fund; and Vice President, Security Benefit Asset Management Holdings, LLC |
| | |
| | Previous: Security Global Investors, LLC, Senior Vice President (2010–2011); Rydex Advisors, LLC (f/k/a PADCO Advisors, Inc.) Senior Vice President (2006–2011); Rydex Fund Services, LLC (f/k/a Rydex Fund Services, Inc.), Director (2009) & Senior Vice President (2003–2006); and Rydex Specialized Products, LLC, Chief Financial Officer (2005–2009) |
| | |
Elisabeth Miller* Chief Compliance Officer (1968) | Current: Chief Compliance Officer, Rydex Series Funds, Rydex Dynamic Funds, Rydex Variable Trust, Rydex ETF Trust, Security Equity Fund, Security Income Fund, Security Large Cap Value Fund, Security Mid Cap Growth Fund, SBL Fund, Security Investors, LLC, and Rydex Distributors, LLC |
| | |
| | Previous: Senior Manager, Security Investors, LLC and Rydex Distributors, LLC (2004–2009) |
| | |
Amy J. Lee* Vice President and Assistant Secretary (1961) | Current: Senior Vice President & Secretary, Security Investors, LLC; Secretary & Chief Compliance Officer, Security Distributors, Inc.; Vice President, Associate General Counsel & Assistant Secretary, Security Benefit Life Insurance Company and Security Benefit Corporation; Associate General Counsel, First Security Benefit Life Insurance and Annuity of New York; Vice President & Secretary, SBL Fund; Security Equity Fund; Security Income Fund; Security Large Cap Value Fund & Security Mid Cap Growth Fund; Vice President & Secretary, Rydex Holdings, LLC Secretary, Advisor Research Center, Inc., Rydex Specialized Products, LLC, Rydex Distributors, LLC and Rydex Fund Services, LLC; and Assistant Secretary, Security Benefit Clinic and Hospital |
| | |
| | Previous: Security Global Investors, LLC, Senior Vice President & Secretary (2007–2011); Rydex Advisors, LLC (f/k/a PADCO Advisors, Inc.) & Rydex Advisors II, LLC (f/k/a PADCO Advisors II, Inc.), Senior Vice President & Secretary (2010–2011); and Brecek & Young Advisors, Inc., Director (2004–2008) |
| | |
Joseph M. Arruda* Assistant Treasurer (1966) | Current: Assistant Treasurer, SBL Fund; Security Equity Fund; Security Income Fund; Security Large Cap Value Fund & Security Mid Cap Growth Fund; Vice President, Security Investors, LLC; and Chief Financial Officer & Manager, Rydex Specialized Products, LLC |
| | |
| | Previous: Security Global Investors, LLC, Vice President (2010–2011); and Rydex Advisors, LLC (f/k/a PADCO Advisors, Inc.) & Rydex Advisors II, LLC (f/k/a PADCO Advisors II, Inc.), Vice President (2004–2011) |
| * | Officers of the Funds are deemed to be “interested persons” of the Trust, within the meaning of Section 2(a)(19) of the 1940 Act, inasmuch as this person is affiliated with Guggenheim Investments. |
THE GUGGENHEIM FUNDS semi-annual REPORT | 57
GUGGENHEIM INVESTMENTS PRIVACY POLICIES
Rydex Funds, Guggenheim Funds, Rydex Investments, Rydex Distributors, Inc., Security Investors, LLC, Security Distributors, Inc. and Rydex Advisory Services (Collectively “Guggenheim Investments”)
Our Commitment to You
When you become a Guggenheim Investments investor, you entrust us with not only your hard-earned money but also with personal and financial information about you. We recognize that your relationship with us is based on trust and that you expect us to act responsibly and in your best interests. Because we have access to this private information about you, we hold ourselves to the highest standards in its safekeeping and use. This means, most importantly, that we do not sell client information to anyone—whether it is your personal information or if you are a current or former Guggenheim Investments client.
The Information We Collect About You
In the course of doing business with shareholders and investors, we collect nonpublic personal information about you. You typically provide personal information when you complete a Guggenheim Investments account application or when you request a transaction that involves Rydex and Guggenheim Investments funds or one of the Guggenheim Investments affiliated companies. “Nonpublic personal information” is personally identifiable private information about you. For example, it includes information regarding your name and address, Social Security or taxpayer identification number, assets, income, account balance, bank account information and investment activity (e.g., purchase and redemption history).
How We Handle Your Personal Information
As emphasized above, we do not sell information about current or former clients or their accounts to third parties. Nor do we share such information, except when necessary to complete transactions at your request or to make you aware of related investment products and services that we offer. Additional details about how we handle your personal information are provided below. To complete certain transactions or account changes that you direct, it may be necessary to provide identifying information to companies, individuals or groups that are not affiliated with Guggenheim Investments. For example, if you ask to transfer assets from another financial institution to Guggenheim Investments, we will need to provide certain information about you to that company to complete the transaction. To alert you to other Guggenheim Investments investment products and services, we may share your information within the Guggenheim Investments family of affiliated companies. This would include, for example, sharing your information within Guggenheim Investments so we can make you aware of new Rydex and Guggenheim Investments funds or the services offered through another Guggenheim Investments affiliated company. In certain instances, we may contract with nonaffiliated companies to perform services for us. Where necessary, we will disclose information we have about you to these third parties. In all such cases, we provide the third party with only the information necessary to carry out its assigned responsibilities and only for that purpose. And we require these third parties to treat your private information with the same high degree of confidentiality that we do. In certain instances, we may share information with other financial institutions regarding individuals and entities in response to the U.S.A. Patriot Act. Finally, we will release information about you if you direct us to do so, if we are compelled by law to do so or in other circumstances permitted by law.
Opt Out Provisions
We do not sell your personal information to anyone. The law allows you to “opt out” of only certain kinds of information sharing with third parties. The firm does not share personal information about you with any third parties that triggers this opt-out right. This means YOU ARE ALREADY OPTED OUT.
How We Protect Privacy Online
Our concern for the privacy of our shareholders also extends to those who use our web site, www.rydex-sgi.com. Our web site uses some of the most secure forms of online communication available, including encryption technology, Secure Socket Layer (SSL) protocol, firewalls and user names and passwords. These technologies provide a high level of security and privacy when you access your account information or initiate online transactions. The Guggenheim Investments web site offers customized features that require our use of “http cookies”—tiny pieces of information that we ask your browser to store. However, we make very limited use of these cookies. We only use cookies for session management and security features on the Guggenheim Investments web site. We do not use them to pull data from your hard drive, to learn your email address, or to view data in cookies created by other web sites. We will not share the information in our cookies or give others access to it. See the legal information area on our web site for more details about web site security and privacy features.
58 | THE GUGGENHEIM FUNDS semi-annual REPORT
GUGGENHEIM INVESTMENTS PRIVACY POLICIES (concluded)
How We Safeguard Your Personal Information
We restrict access to nonpublic personal information about shareholders to our employees and in some cases to third parties (for example, the service providers described above) as permitted by law. We maintain strict physical, electronic and procedural safeguards that comply with federal standards to guard your nonpublic personal information.
We’ll Keep You Informed
As required by federal law, we will notify shareholders of our privacy policy annually. We reserve the right to modify this policy at any time, but rest assured that if we do change it, we will tell you promptly. You will also be able to access our privacy policy from our web site at www.rydex-sgi.com. Should you have any questions regarding our privacy policy, contact us at 800.820.0888 or 301.296.5100.
THE GUGGENHEIM FUNDS semi-annual REPORT | 59
This page intentionally left blank.
This page intentionally left blank.
805 King Farm Boulevard, Suite 600
Rockville, MD 20850
www.rydex-sgi.com
800 820 0888
RDXSGIALT–SEMI–0612x1212
Item 2. Code of Ethics.
Not applicable at this time.
Item 3. Audit Committee Financial Expert.
Not applicable at this time.
Item 4. Principal Accountant Fees and Services.
Not applicable at this time.
Item 5. Audit Committee of Listed Registrants.
Not applicable.
Item 6. Investments.
Schedule of Investments is included as part of the report to shareholders filed under Item 1 of this form.
Item 7. Disclosure of Proxy Voting Policies and Procedures for Closed-End Management Investment Companies.
Not applicable.
Item 8. Portfolio Managers of Closed-End Management Investment Companies.
Not applicable.
Item 9. Purchases of Equity Securities by Closed-End Management Investment Company and Affiliated Purchasers.
Not applicable.
Item 10. Submission of Matters to a Vote of Security Holders.
There have been no material changes to the procedures by which shareholders may recommend nominees to the registrant’s board.
Item 11. Controls and Procedures.
| | (a) | The registrant’s President (principal executive officer) and Treasurer (principal financial officer) have evaluated the registrant’s disclosure controls and procedures within 90 days of this filing and have concluded that the registrant’s disclosure controls and procedures were effective as of that date in ensuring that information required to be disclosed by the registrant in this Form N-CSR was recorded, processed, summarized, and reported timely. |
| | | |
| | (b) | The registrant’s principal executive officer and principal financial officer are aware of no change in the registrant’s internal control over financial reporting that occurred during the registrant’s second fiscal quarter covered by this report that has materially affected, or is reasonably likely to materially affect, the registrant’s internal control over financial reporting. |
Item 12. Exhibits.
| | (a)(2) | Separate certifications by the President (principal executive officer) and Treasurer (principal financial officer) of the registrant as required by Rule 30a-2(a) under the Act (17 CFR 270.30a-2(a)) are attached. |
| | | |
| | (b) | Separate certifications by the registrant’s President (principal executive officer) and Treasurer (principal financial officer) as required by Rule 30a-2(b) under the Act (17 CFR 270.30a-2(b)) is attached. |
SIGNATURES
Pursuant to the requirements of the Securities Exchange Act of 1934 and the Investment Company Act of 1940, the registrant has duly caused this report to be signed on its behalf by the undersigned, thereunto duly authorized.
| (Registrant) | Rydex Series Funds |
| | |
| By (Signature and Title)* | /s/ Donald C. Cacciapaglia |
| | Donald C. Cacciapaglia, President |
Date August 28, 2012
Pursuant to the requirements of the Securities Exchange Act of 1934 and the Investment Company Act of 1940, this report has been signed below by the following persons on behalf of the registrant and in the capacities and on the dates indicated.
| By (Signature and Title)* | /s/ Donald C. Cacciapaglia |
| | Donald C. Cacciapaglia, President |
Date August 28, 2012
| By (Signature and Title)* | /s/ Nikolaos Bonos |
| | Nikolaos Bonos, Vice President and Treasurer |
Date August 28, 2012
* Print the name and title of each signing officer under his or her signature.