UNITED STATES
SECURITIES AND EXCHANGE COMMISSION
Washington, D.C. 20549
FORM N-CSR
CERTIFIED SHAREHOLDER REPORT OF REGISTERED MANAGEMENT INVESTMENT COMPANIES
Investment Company Act file number 811- 07584
Rydex Series Funds
(Exact name of registrant as specified in charter)
805 King Farm Boulevard, Suite 600
Rockville, Maryland 20850
(Address of principal executive offices) (Zip code)
Donald C. Cacciapaglia, President
Rydex Series Funds
805 King Farm Boulevard, Suite 600
Rockville, Maryland 20850
(Name and address of agent for service)
Registrant's telephone number, including area code: 1-301-296-5100
Date of fiscal year end: December 31
Date of reporting period: June 30, 2013
Form N-CSR is to be used by management investment companies to file reports with the Commission not later than 10 days after the transmission to stockholders of any report that is required to be transmitted to stockholders under Rule 30e-1 under the Investment Company Act of 1940 (17 CFR 270.30e-1). The Commission may use the information provided on Form N-CSR in its regulatory, disclosure review, inspection, and policymaking roles.
A registrant is required to disclose the information specified by Form N-CSR, and the Commission will make this information public. A registrant is not required to respond to the collection of information contained in Form N-CSR unless the Form displays a currently valid Office of Management and Budget ("OMB") control number. Please direct comments concerning the accuracy of the information collection burden estimate and any suggestions for reducing the burden to Secretary, Securities and Exchange Commission, 450 Fifth Street, NW, Washington, DC 20549-0609. The OMB has reviewed this collection of information under the clearance requirements of 44 U.S.C. § 3507.
Item 1. Reports to Stockholders.
ALTERNATIVES FUND
MANAGED FUTURES STRATEGY FUND
RMFSF-SEMI-0613x1213
GO GREEN!
ELIMINATE MAILBOX CLUTTER
Go paperless with Guggenheim Investments eDelivery—a service giving you full online access to account information and documents. Save time, cut down on mailbox clutter and be a friend to the environment with eDelivery.
With Guggenheim Investments eDelivery you can:
| · | View online confirmations and statements at your convenience. |
| · | Receive email notifications when your most recent confirmations, statements and other account documents are available for review. |
| · | Access prospectuses, annual reports and semiannual reports online. |

If you have questions about Guggenheim Investments
eDelivery services, contact one of our Shareholder Service
Representatives at 800.820.0888.

This report and the financial statements contained herein are submitted for the general information of our shareholders. The report is not authorized for distribution to prospective investors unless preceded or accompanied by an effective prospectus.
Distributed by Guggenheim Distributors, LLC.
TABLE OF CONTENTS
| THE GUGGENHEIM FUNDS SEMI-ANNUAL REPORT | 1 |
June 30, 2013
Dear Shareholder:
Security Investors, LLC (the “Investment Adviser”) is pleased to present the semi-annual shareholder report for one or more of our Funds (the “Funds”) for the period ended June 30, 2013.
The Investment Adviser is part of Guggenheim Investments, which represents the investment management businesses of Guggenheim Partners, LLC, a global, diversified financial services firm.
Guggenheim Distributors, LLC is the distributor of the Funds. Guggenheim Distributors, LLC is affiliated with Guggenheim Partners, LLC and Security Investors, LLC.
We encourage you to read the Economic and Market Overview section of the report, which follows this letter, and then the Fund Profile for each Fund.
We are committed to providing innovative investment solutions and appreciate the trust you place in us.
Sincerely,

Donald C. Cacciapaglia
President
July 31, 2013
Read each Fund’s prospectus and summary prospectus (if available) carefully before investing. It contains the Fund’s investment objectives, risks, charges, expenses and other information, which should be considered carefully before investing. Obtain a prospectus and summary prospectus (if available) at guggenheiminvestments.com or call 800.820.0888.
The Funds may not be suitable for all investors. Investing involves risks, including the entire loss of principal amount invested. Certain Funds may be affected by risks that include those associated with sector concentration, international investing, investing in small and/or medium size companies, and/or the Funds’ possible use of investment techniques and strategies such as leverage, derivatives and short sales of securities. Please see each Fund’s prospectus for more information.
| 2 | THE GUGGENHEIM FUNDS SEMI-ANNUAL REPORT |
| ECONOMIC AND MARKET OVERVIEW (Unaudited) | June 30, 2013 |
Monetary accommodation from the world’s central banks and continued improvement in the U.S. housing and labor markets benefited the overall U.S. economy for the six month period ended June 30, 2013. However, speculation about the end of quantitative easing in May and June, along with growing fundamental risk in Japan and China, led to a selloff in fixed income and equity markets. For most of the period, equity markets were strong and abundant liquidity and steady quantitative easing had produced a benign credit environment with low default rates.
Housing was the primary locomotive of U.S. economic growth in the period. Housing-related activity, including private residential investment, personal expenditures on household durable goods and utilities, as well as the wealth effect on consumption from home price appreciation, has contributed positively to GDP since 1Q2011. However, housing’s contribution remains dependent on the maintenance of extremely low mortgage rates, which have recently begun moving higher.
Overshadowing solid job gains in the period was slow improvement in the unemployment rate. The participation rate has been relatively flat over the past six months, and in general, has been declining. A bright spot has been the private sector, where the U.S. economy is currently adding jobs at a rate that is over 20% higher than that of the prior expansion.
A number of global central banks implemented interest rate cuts during the period, owing to sluggish global economic growth and continuing weakness in commodity prices. The world is still in a deflationary environment, which has given policymakers a great deal of leeway to extend and expand accommodative monetary policies aimed at stimulating output.
The rise in volatility late in the period was in large part a result of shifting market sentiment, but, fundamentally, economic growth in the U.S. has not changed materially, although the impact of rising rates on housing has yet to be seen. With ongoing weakness in growth and inflation, global central banks are expected to maintain accommodative policies for the foreseeable future.
For the six-month period ended June 30, 2013, the return of the Standard & Poor’s 500® (“S&P 500”) Index* was 13.82%, and in mid-May reached an all-time high.
The Barclays U.S. Aggregate Bond Index* returned -2.44% for the period, while the Barclays U.S. High Yield Index* returned 1.42%.
The Bank of America Merrill Lynch 3-Month U.S. Treasury Bill Index* returned 0.04%.
The Morgan Stanley Capital International (“MSCI”) Europe-Australasia-Far East (“EAFE”) Index* returned 4.10%. The MSCI Emerging Markets Index* return was -9.57%.
The opinions and forecasts expressed may not actually come to pass. This information is subject to change at any time, based on market and other conditions, and should not be construed as a recommendation of any specific security or strategy.
*Index Definitions:
The following indices are referenced throughout this report. Indices are unmanaged and not available for direct investment. Index performance does not reflect transaction costs, fees, or expenses.
Bank of America Merrill Lynch 3-Month U.S. Treasury Bill Index is an unmanaged market index of U.S. Treasury securities maturing in 90 days that assumes reinvestment of all income.
Barclays U.S. Aggregate Bond Index is a broad-based benchmark that measures the investment grade, U.S. dollar denominated, fixed-rate taxable bond market, including U.S. Treasuries, government-related and corporate securities, MBS (agency fixed-rate and hybrid ARM pass-throughs), ABS, and CMBS.
Barclays U.S. High Yield Index measures the market of USD-denominated, non-investment grade, fixed-rate, taxable corporate bonds. Securities are classified as high yield if the middle rating of Moody’s, Fitch, and S&P is Ba1/BB+/BB+ or below.
MSCI EAFE Index is a free float-adjusted market capitalization index that is designed to measure the equity market performance of developed markets, excluding the U.S. & Canada.
MSCI Emerging Markets Index is a free float-adjusted market capitalization weighted index that is designed to measure equity market performance in the global emerging markets.
S&P 500® Index is a capitalization-weighted index of 500 stocks designed to measure the performance of the broad economy, representing all major industries and is considered a representation of the U.S. stock market.
| THE GUGGENHEIM FUNDS SEMI-ANNUAL REPORT | 3 |
ABOUT SHAREHOLDERS’ FUND EXPENSES (Unaudited)
All mutual funds have operating expenses and it is important for our shareholders to understand the impact of costs on their investments. Shareholders of a Fund incur two types of costs: (i) transaction costs, including sales charges (loads) on purchase payments, reinvested dividends, or other distributions; and exchange fees; and (ii) ongoing costs, including management fees, administrative services, and shareholder reports, among others. These ongoing costs, or operating expenses, are deducted from a fund’s gross income and reduce the investment return of the fund.
A fund’s expenses are expressed as a percentage of its average net assets, which is known as the expense ratio. The following examples are intended to help investors understand the ongoing costs (in dollars) of investing in a Fund and to compare these costs with the ongoing costs of investing in other mutual funds.
The examples are based on an investment of $1,000 made at the beginning of the period and held for the entire six-month period beginning December 31, 2012 and ending June 30, 2013.
The following tables illustrate a Fund’s costs in two ways:
Table 1. Based on actual Fund return. This section helps investors estimate the actual expenses paid over the period. The “Ending Account Value” shown is derived from the Fund’s actual return, and the fourth column shows the dollar amount that would have been paid by an investor who started with $1,000 in the Fund. Investors may use the information here, together with the amount invested, to estimate the expenses paid over the period. Simply divide the Fund’s account value by $1,000 (for example, an $8,600 account value divided by $1,000 = 8.6), then multiply the result by the number provided under the heading “Expenses Paid During Period.”
Table 2. Based on hypothetical 5% return. This section is intended to help investors compare a Fund’s cost with those of other mutual funds. The table provides information about hypothetical account values and hypothetical expenses based on the Fund’s actual expense ratio and an assumed rate of return of 5% per year before expenses, which is not the Fund’s actual return. The hypothetical account values and expenses may not be used to estimate the actual ending account balance or expenses paid during the period. The example is useful in making comparisons because the U.S. Securities and Exchange Commission (the “SEC”) requires all mutual funds to calculate expenses based on the 5% return. Investors can assess a Fund’s costs by comparing this hypothetical example with the hypothetical examples that appear in shareholder reports of other funds.
The calculations illustrated above assume no shares were bought or sold during the period. Actual costs may have been higher or lower, depending on the amount of investment and the timing of any purchases or redemptions.
Please note that the expenses shown in the table are meant to highlight your ongoing costs only and do not reflect any transactional costs, such as sales charges (loads) on purchase payments, and contingent deferred sales charges (“CDSC”) on redemptions, if any. Therefore, the second table is useful in comparing ongoing costs only, and will not help you determine the relative total costs of owning different funds. In addition, if these transactional costs were included, your costs would have been higher.
More information about a Fund’s expenses, including annual expense ratios for the past five years, can be found in the Financial Highlights section of this report. For additional information on operating expenses and other shareholder costs, please refer to the appropriate Fund prospectus.
| 4 | THE GUGGENHEIM FUNDS SEMI-ANNUAL REPORT |
ABOUT SHAREHOLDERS’ FUND EXPENSES (Unaudited) (concluded)
| | | | | | | | | Beginning | | | Ending | | | Expenses | |
| | | Expense | | | Fund | | | Account Value | | | Account Value | | | Paid During | |
| | | Ratio1 | | | Return | | | December 31, 2012 | | | June 30, 2013 | | | Period2 | |
| Table 1. Based on actual Fund return3 | | | | | | | | | | | | | | | | | | | | |
| Managed Futures Strategy Fund | | | | | | | | | | | | | | | | | | | | |
| A-Class | | | 1.71 | % | | | 0.75 | % | | $ | 1,000.00 | | | $ | 1,007.50 | | | $ | 8.51 | |
| C-Class | | | 2.46 | % | | | 0.39 | % | | | 1,000.00 | | | | 1,003.90 | | | | 12.22 | |
| H-Class | | | 1.71 | % | | | 0.75 | % | | | 1,000.00 | | | | 1,007.50 | | | | 8.51 | |
| Institutional Class | | | 1.46 | % | | | 0.89 | % | | | 1,000.00 | | | | 1,008.90 | | | | 7.27 | |
| Y-Class | | | 1.46 | % | | | 0.89 | % | | | 1,000.00 | | | | 1,008.90 | | | | 7.27 | |
| | | | | | | | | | | | | | | | | | | | | |
| Table 2. Based on hypothetical 5% return (before expenses) | | | | | | | | | | | | | | | | | | | | |
| Managed Futures Strategy Fund | | | | | | | | | | | | | | | | | | | | |
| A-Class | | | 1.71 | % | | | 5.00 | % | | $ | 1,000.00 | | | $ | 1,016.31 | | | $ | 8.55 | |
| C-Class | | | 2.46 | % | | | 5.00 | % | | | 1,000.00 | | | | 1,012.60 | | | | 12.28 | |
| H-Class | | | 1.71 | % | | | 5.00 | % | | | 1,000.00 | | | | 1,016.31 | | | | 8.55 | |
| Institutional Class | | | 1.46 | % | | | 5.00 | % | | | 1,000.00 | | | | 1,017.55 | | | | 7.30 | |
| Y-Class | | | 1.46 | % | | | 5.00 | % | | | 1,000.00 | | | | 1,017.55 | | | | 7.30 | |
| 2 | Expenses are equal to the Fund’s annualized expense ratio, net of any applicable fee waivers, multiplied by the average account value over the period, multiplied by 181/365 (to reflect the one-half year period). |
| 3 | Actual cumulative return at net asset value for the period December 31, 2012 to June 30, 2013. |
| THE GUGGENHEIM FUNDS SEMI-ANNUAL REPORT | 5 |
| FUND PROFILE (Unaudited) | June 30, 2013 |
MANAGED FUTURES STRATEGY FUND
OBJECTIVE: Seeks to achieve positive absolute returns.
Consolidated Holdings Diversification (Market Exposure as % of Net Assets)
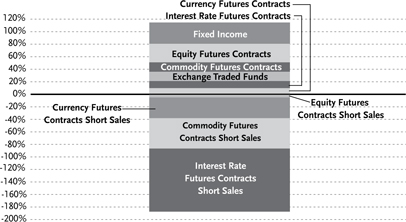
“Consolidated Holdings Diversification (Market Exposure as % of Net Assets)” excludes any temporary cash investments.
| Inception Dates: | | |
| A-Class | | March 2, 2007 |
| C-Class | | March 2, 2007 |
| H-Class | | March 2, 2007 |
| Institutional Class | | May 3, 2010 |
| Y-Class | March 29, 2010 |
| Ten Largest Holdings | | | |
| (% of Total Net Assets) | | | |
| PIMCO Enhanced Short Maturity Exchange-Traded Fund | | | 13.4 | % |
| KKR Financial CLO 2007-A Corp. | | | 5.0 | % |
| Emporia Preferred Funding II Corp. | | | 2.3 | % |
| Credit Suisse Mortgage Capital Certificates 2007-TF2A | | | 2.1 | % |
| Morgan Stanley Reremic Trust | | | 2.0 | % |
| Geer Mountain Financing Ltd. | | | 2.0 | % |
| Guggenheim Enhanced Short Duration Bond ETF | | | 1.5 | % |
| COMM 2007-FL14 Mortgage Trust | | | 1.5 | % |
| Newcastle CDO Ltd. | | | 1.2 | % |
| Brentwood CLO Corp. | | | 1.0 | % |
| Top Ten Total | | | 32.0 | % |
“Ten Largest Holdings” exclude any temporary cash or derivative investments.
| 6 | THE GUGGENHEIM FUNDS SEMI-ANNUAL REPORT |
| CONSOLIDATED SCHEDULE OF INVESTMENTS (Unaudited) | June 30, 2013 |
| MANAGED FUTURES STRATEGY FUND |
| | | Shares | | | Value | |
| | | | | | | |
| EXCHANGE TRADED FUNDS† - 14.9% | | | | | | | | |
| PIMCO Enhanced Short Maturity | | | | | | | | |
| Exchange-Traded Fund1 | | | 600,000 | | | $ | 60,762,000 | |
| Guggenheim Enhanced Short | | | | | | | | |
| Duration Bond ETF1 | | | 140,000 | | | | 7,021,000 | |
| Total Exchange Traded Funds | | | | | | | | |
| (Cost $67,930,214) | | | | | | | 67,783,000 | |
| | | | | | | | | |
| | | | Face | | | | | |
| | | | Amount | | | | | |
| | | | | | | | | |
| ASSET BACKED SECURITIES†† - 17.0% | | | | | | | | |
| KKR Financial CLO 2007-A Corp. 2007-AA, | | | | | | | | |
| 1.03% due 10/15/172,3 | | $ | 22,699,150 | | | | 22,643,538 | |
| Emporia Preferred Funding II Corp. | | | | | | | | |
| 2006-2A,0.56% due 10/18/182,3 | | | 10,349,415 | | | | 10,288,146 | |
| 2006-2X,0.57% due 10/18/18 | | | 4,357,648 | | | | 4,307,664 | |
| Morgan Stanley Reremic Trust 2012-IO, | | | | | | | | |
| 1.00% due 03/27/513 | | | 9,119,794 | | | | 9,049,754 | |
| Geer Mountain Financing Ltd. 2007-1A, | | | | | | | | |
| 0.59% due 04/01/142,3 | | | 9,000,000 | | | | 8,922,600 | |
| Newcastle CDO Ltd., | | | | | | | | |
| 0.45% due 05/25/52 | | | 5,658,145 | | | | 5,495,700 | |
| Brentwood CLO Corp. 2006-1A, | | | | | | | | |
| 0.54% due 02/01/222,3 | | | 4,737,741 | | | | 4,624,225 | |
| N-Star REL CDO VIII Ltd. 2006-8A, | | | | | | | | |
| 0.48% due 02/01/412,3 | | | 3,572,797 | | | | 3,315,019 | |
| Acis CLO 2013-1 Ltd. 2013-1A, | | | | | | | | |
| 1.33% due 04/18/242,3 | | | 3,200,000 | | | | 3,199,904 | |
| FM Leveraged Capital Fund II 2006-2A, | | | | | | | | |
| 1.88% due 11/15/202,3 | | | 2,350,000 | | | | 2,345,629 | |
| NewStar Trust 2005-1 2005-1A, | | | | | | | | |
| 0.78% due 07/25/182,3 | | | 1,494,605 | | | | 1,487,924 | |
| Legg Mason Real Estate CDO I Ltd. 2006-1A, | | | | | | | | |
| 0.47% due 03/25/382,3 | | | 991,708 | | | | 967,619 | |
| Gleneagles CLO Ltd. 2005-1A, | | | | | | | | |
| 0.55% due 11/01/172,3 | | | 698,306 | | | | 689,898 | |
| Total Asset Backed Securities | | | | | | | | |
| (Cost $77,175,807) | | | | | | | 77,337,620 | |
| | | | | | | | | |
| U.S. GOVERNMENT SECURITIES† - 14.3% | | | | | | | | |
| U.S. Treasury Bill | | | | | | | | |
| 0.00% due 07/11/13 | | | 29,150,000 | | | | 29,149,825 | |
| 0.00% due 07/18/13 | | | 24,870,000 | | | | 24,869,726 | |
| 0.00% due 07/25/13 | | | 11,110,000 | | | | 11,109,867 | |
| Total U.S. Treasury Bill | | | | | | | 65,129,418 | |
| Total U.S. Government Securities | | | | | | | | |
| (Cost $65,129,742) | | | | | | | 65,129,418 | |
| | | | | | | | | |
| CORPORATE BONDS†† - 9.2% | | | | | | | | |
| Financials - 5.4% | | | | | | | | |
| Aspen Insurance Holdings Ltd. | | | | | | | | |
| 6.00% due 08/15/14 | | | 3,920,000 | | | | 4,110,857 | |
| JPMorgan Chase & Co. | | | | | | | | |
| 0.89% due 02/26/162 | | | 4,000,000 | | | | 3,991,740 | |
| Ford Motor Credit Company LLC | | | | | | | | |
| 8.00% due 06/01/14 | | | 1,384,000 | | | | 1,463,768 | |
| 8.70% due 10/01/14 | | | 1,200,000 | | | | 1,302,445 | |
| 7.00% due 04/15/15 | | | 500,000 | | | | 542,056 | |
| Nomura Holdings, Inc. | | | | | | | | |
| 1.72% due 09/13/162 | | | 3,200,000 | | | | 3,196,064 | |
| Goldman Sachs Group, Inc. | | | | | | | | |
| 1.48% due 04/30/182 | | | 3,000,000 | | | | 2,972,244 | |
| Bank of America Corp. | | | | | | | | |
| 4.50% due 04/01/15 | | | 2,400,000 | | | | 2,517,422 | |
| Morgan Stanley | | | | | | | | |
| 4.20% due 11/20/14 | | | 2,400,000 | | | | 2,482,752 | |
| Macquarie Group Ltd. | | | | | | | | |
| 7.30% due 08/01/143 | | | 1,920,000 | | | | 2,024,907 | |
| Total Financials | | | | | | | 24,604,255 | |
| | | | | | | | | |
| INDUSTRIAL - 1.9% | | | | | | | | |
| Glencore Funding LLC | | | | | | | | |
| 1.43% due 05/27/162,3 | | | 4,350,000 | | | | 4,235,699 | |
| Rio Tinto Finance USA plc | | | | | | | | |
| 1.11% due 06/17/162 | | | 3,000,000 | | | | 2,999,103 | |
| Anglo American Capital plc | | | | | | | | |
| 9.38% due 04/08/143 | | | 1,387,000 | | | | 1,470,262 | |
| Total Industrial | | | | | | | 8,705,064 | |
| | | | | | | | | |
| ENERGY - 1.0% | | | | | | | | |
| Ras Laffan Liquefied Natural | | | | | | | | |
| Gas Company Limited III | | | | | | | | |
| 5.83% due 09/30/163 | | | 4,144,613 | | | | 4,403,651 | |
| FINANCIAL INSTITUTIONS - 0.5% | | | | | | | | |
| Mack-Cali Realty, LP | | | | | | | | |
| 5.13% due 02/15/14 | | | 1,300,000 | | | | 1,330,226 | |
| WEA Finance LLC / WT | | | | | | | | |
| Finance Aust Pty Ltd. | | | | | | | | |
| 5.75% due 09/02/153 | | | 900,000 | | | | 983,299 | |
| Total Financial Institutions | | | | | | | 2,313,525 | |
| | | | | | | | | |
| INDUSTRIALS - 0.4% | | | | | | | | |
| International Lease Finance Corp. | | | | | | | | |
| 2.22% due 06/15/162 | | | 2,000,000 | | | | 1,985,000 | |
| Total Industrials | | | | | | | 1,985,000 | |
| Total Corporate Bonds | | | | | | | | |
| (Cost $42,293,513) | | | | | | | 42,011,495 | |
| | | | | | | | | |
| MORTGAGE BACKED SECURITIES†† - 7.0% | | | | | | | | |
| Credit Suisse Mortgage Capital Certificates | | | | | | | | |
| 2007-TF2A,0.37% due 04/15/222,3 | | | 9,719,696 | | | | 9,611,282 | |
| 2006-TF2A,0.39% due 10/15/212,3 | | | 3,000,000 | | | | 2,902,401 | |
| COMM 2007-FL14 Mortgage Trust | | | | | | | | |
| 2007-FL14,0.37% due 06/15/222,3 | | | 6,755,963 | | | | 6,699,828 | |
| Wachovia Bank Commercial Mortgage | | | | | | | | |
| Trust Series 2006-WHALE 7 | | | | | | | | |
| 2006-WL7A,0.36% due 09/15/212,3 | | | 4,250,000 | | | | 4,202,090 | |
| SEE NOTES TO FINANCIAL STATEMENTS. | THE GUGGENHEIM FUNDS SEMI-ANNUAL REPORT | 7 |
| CONSOLIDATED SCHEDULE OF INVESTMENTS (Unaudited) (continued) | June 30, 2013 |
| MANAGED FUTURES STRATEGY FUND |
| | | Face | | | | |
| | | Amount | | | Value | |
| | | | | | | |
| COMM 2006-FL12 Mortgage Trust | | | | | | | | |
| 2006-FL12,0.32% due 12/15/202,3 | | $ | 4,007,635 | | | $ | 3,917,515 | |
| Banc of America Large Loan Trust | | | | | | | | |
| 2007-BMB1,1.29% due 08/15/292,3 | | | 1,937,000 | | | | 1,919,311 | |
| GCCFC 2006-FL4A C | | | | | | | | |
| 2006-FL4A,0.42% due 11/05/21 | | | 1,900,000 | | | | 1,844,165 | |
| UBS Commercial Mortgage Trust | | | | | | | | |
| 2007-FL1,0.77% due 07/15/242,3 | | | 984,007 | | | | 982,187 | |
| Total Mortgage Backed Securities | | | | | | | | |
| (Cost $31,882,050) | | | | | | | 32,078,779 | |
| | | | | | | | | |
| MUNICIPAL BONDS†† - 0.7% | | | | | | | | |
| New York - 0.7% | | | | | | | | |
| City of New York New York | | | | | | | | |
| General Obligation Unlimited | | | | | | | | |
| 0.36% due 04/01/352 | | | 3,000,000 | | | | 3,000,000 | |
| Total Municipal Bonds | | | | | | | | |
| (Cost $3,000,000) | | | | | | | 3,000,000 | |
| | | | | | | | | |
| COMMERCIAL PAPER†† - 13.7% | | | | | | | | |
| National Grid Holdings, Inc. | | | | | | | | |
| 0.26% due 07/08/133 | | | 6,000,000 | | | | 5,999,697 | |
| Aegon N.V. | | | | | | | | |
| 0.27% due 07/08/133 | | | 6,000,000 | | | | 5,999,685 | |
| Ecolab, Inc. | | | | | | | | |
| 0.21% due 07/18/133 | | | 6,000,000 | | | | 5,999,405 | |
| Duke Energy Corp. | | | | | | | | |
| 0.27% due 07/25/133 | | | 6,000,000 | | | | 5,998,920 | |
| Tesco Treasury Services plc | | | | | | | | |
| 0.28% due 08/05/133 | | | 6,000,000 | | | | 5,998,366 | |
| Pentair Finance S.A. | | | | | | | | |
| 0.29% due 07/09/133 | | | 5,400,000 | | | | 5,399,652 | |
| AbbVie, Inc. | | | | | | | | |
| 0.19% due 07/02/133 | | | 5,000,000 | | | | 4,999,974 | |
| Kellogg Co. | | | | | | | | |
| 0.17% due 07/09/133 | | | 5,000,000 | | | | 4,999,811 | |
| Southern California Edison Co. | | | | | | | | |
| 0.22% due 07/08/133 | | | 5,000,000 | | | | 4,999,786 | |
| Noble Corporation/Cayman Islands | | | | | | | | |
| 0.31% due 07/19/133 | | | 5,000,000 | | | | 4,999,225 | |
| Kinder Morgan Energy Partners, LP | | | | | | | | |
| 0.27% due 07/24/133 | | | 5,000,000 | | | | 4,999,106 | |
| Northeast Utilities | | | | | | | | |
| 0.20% due 07/01/133 | | | 1,900,000 | | | | 1,900,000 | |
| Total Commercial Paper | | | | | | | | |
| (Cost $62,293,627) | | | | | | | 62,293,627 | |
| | | | | | | | | |
| REPURCHASE AGREEMENTS††,4 - 10.7% | | | | | | | | |
| HSBC Group | | | | | | | | |
| issued 06/28/13 at 0.07% | | | | | | | | |
| due 07/01/13 | | | 39,064,143 | | | | 39,064,143 | |
| Mizuho Financial Group, Inc. | | | | | | | | |
| issued 06/28/13 at 0.06% | | | | | | | | |
| due 07/01/13 | | | 6,713,905 | | | | 6,713,905 | |
| Deutsche Bank | | | | | | | | |
| issued 06/28/13 at 0.06% | | | | | | | | |
| due 07/01/13 | | | 2,725,405 | | | | 2,725,405 | |
| Total Repurchase Agreements | | | | | | | | |
| (Cost $48,503,453) | | | | | | | 48,503,453 | |
| | | | | | | | | |
| SECURITIES LENDING COLLATERAL††,5 - 1.1% | | | | | | | | |
| Repurchase Agreements | | | | | | | | |
| HSBC Securities, Inc. | | | | | | | | |
| issued 06/28/13 at 0.11% | | | | | | | | |
| due 07/01/13 | | | 4,338,910 | | | | 4,338,910 | |
| RBS Securities, Inc. | | | | | | | | |
| issued 06/28/13 at 0.10% | | | | | | | | |
| due 07/01/13 | | | 507,490 | | | | 507,490 | |
| Total Securities Lending Collateral | | | | | | | | |
| (Cost $4,846,400) | | | | | | | 4,846,400 | |
| | | | | | | | | |
| | | | Contracts | | | | | |
| | | | | | | | | |
| OPTIONS PURCHASED† - 0.9% | | | | | | | | |
| Put options on: | | | | | | | | |
| S&P 500 E-mini 1640 Index | | | | | | | | |
| Expiring December 2013 | | | | | | | | |
| with strike price of $640.00 | | | 625 | | | | 3,023,438 | |
| S&P 500 E-mini 1660 Index | | | | | | | | |
| Expiring December 2013 | | | | | | | | |
| with strike price of $660.00 | | | 210 | | | | 1,123,500 | |
| Total Put options | | | | | | | 4,146,938 | |
| Total Options Purchased | | | | | | | | |
| (Cost $3,210,026) | | | | | | | 4,146,938 | |
| Total Investments - 89.5% | | | | | | | | |
| (Cost $406,264,832) | | | | | | $ | 407,130,730 | |
| Other Assets & Liabilities, net - 10.5% | | | | | | | 47,521,302 | |
| Total Net Assets - 100.0% | | | | | | $ | 454,652,032 | |
| 8 | The Guggenheim Funds SEMI-annual REPORT | See Notes to Financial Statements. |
| CONSOLIDATED SCHEDULE OF INVESTMENTS (Unaudited) (continued) | June 30, 2013 |
| Managed Futures Strategy Fund | |
| | | | | | Unrealized | |
| | | Contracts | | | Gain (Loss) | |
| | | | | | | |
| INTEREST RATE FUTURES CONTRACTS PURCHASED†† | | | | | | | | |
| September 2013 Euro - Bund | | | | | | | | |
| Futures Contracts | | | | | | | | |
| (Aggregate Value of | | | | | | | | |
| Contracts $9,577,611) | | | 52 | | | $ | (65,913 | ) |
| September 2013 Euro - Bobl | | | | | | | | |
| Futures Contracts | | | | | | | | |
| (Aggregate Value of | | | | | | | | |
| Contracts $41,556,785) | | | 255 | | | | (141,383 | ) |
| (Total Aggregate Value of Contracts | | | | | | | | |
| $51,134,396) | | | | | | $ | (207,296 | ) |
| CURRENCY FUTURES CONTRACTS PURCHASED† | | | | | | | | |
| September 2013 Euro FX Currency | | | | | | | | |
| Futures Contracts | | | | | | | | |
| (Aggregate Value of | | | | | | | | |
| Contracts $37,760,900) | | | 232 | | | $ | (817,652 | ) |
| EQUITY FUTURES CONTRACTS PURCHASED† | | | | | | | | |
| September 2013 Topix Index | | | | | | | | |
| Futures Contracts†† | | | | | | | | |
| (Aggregate Value of | | | | | | | | |
| Contracts $10,560,359) | | | 92 | | | $ | 525,588 | |
| September 2013 Nikkei 225 Index | | | | | | | | |
| Futures Contracts†† | | | | | | | | |
| (Aggregate Value of | | | | | | | | |
| Contracts $12,136,423) | | | 88 | | | | 458,422 | |
| July 2013 MSCI Taiwan Stock Index | | | | | | | | |
| Futures Contracts | | | | | | | | |
| (Aggregate Value of | | | | | | | | |
| Contracts $6,840,645) | | | 245 | | | | 354,515 | |
| September 2013 SPI 200 Index | | | | | | | | |
| Futures Contracts†† | | | | | | | | |
| (Aggregate Value of | | | | | | | | |
| Contracts $5,119,908) | | | 47 | | | | (12,254 | ) |
| September 2013 Financial | | | | | | | | |
| Select Sector Mini Futures | | | | | | | | |
| (Aggregate Value of | | | | | | | | |
| Contracts $6,258,113) | | | 129 | | | | (27,638 | ) |
| September 2013 FTSE 100 Index | | | | | | | | |
| Futures Contracts†† | | | | | | | | |
| (Aggregate Value of | | | | | | | | |
| Contracts $3,754,506) | | | 40 | | | | (71,856 | ) |
| September 2013 Russell 2000 Index | | | | | | | | |
| Mini Futures Contracts | | | | | | | | |
| (Aggregate Value of | | | | | | | | |
| Contracts $11,534,670) | | | 119 | | | | (89,283 | ) |
| September 2013 S&P MidCap 400 Index | | | | | | | | |
| Mini Futures Contracts | | | | | | | | |
| (Aggregate Value of | | | | | | | | |
| Contracts $10,955,400) | | | 95 | | | | (94,855 | ) |
| July 2013 CAC40 10 Euro Index | | | | | | | | |
| Futures Contracts†† | | | | | | | | |
| (Aggregate Value of | | | | | | | | |
| Contracts $5,827,009) | | | 120 | | | | (142,271 | ) |
| July 2013 Amsterdam Index | | | | | | | | |
| Futures Contracts†† | | | | | | | | |
| (Aggregate Value of | | | | | | | | |
| Contracts $7,347,712) | | | 82 | | | | (162,461 | ) |
| September 2013 NASDAQ-100 Index | | | | | | | | |
| Mini Futures Contracts | | | | | | | | |
| (Aggregate Value of | | | | | | | | |
| Contracts $8,932,770) | | | 154 | | | | (170,681 | ) |
| September 2013 S&P 500 Index | | | | | | | | |
| Mini Futures Contracts | | | | | | | | |
| (Aggregate Value of | | | | | | | | |
| Contracts $12,602,475) | | | 158 | | | | (182,272 | ) |
| September 2013 Dow Jones | | | | | | | | |
| Industrial Average Index | | | | | | | | |
| Mini Futures Contracts | | | | | | | | |
| (Aggregate Value of | | | | | | | | |
| Contracts $14,729,980) | | | 199 | | | | (234,457 | ) |
| September 2013 DAX Index | | | | | | | | |
| Futures Contracts†† | | | | | | | | |
| (Aggregate Value of | | | | | | | | |
| Contracts $9,831,403) | | | 38 | | | | (277,685 | ) |
| July 2013 FTSE China A50 Index | | | | | | | | |
| Futures Contracts | | | | | | | | |
| (Aggregate Value of | | | | | | | | |
| Contracts $8,418,971) | | | 1,247 | | | | (700,344 | ) |
| (Total Aggregate Value of Contracts | | | | | | | | |
| $134,850,344) | | | | | | $ | (827,532 | ) |
| | | | | | | | | |
| COMMODITY FUTURES CONTRACTS PURCHASED† | | | | | | | | |
| August 2013 WTI Crude | | | | | | | | |
| Futures Contracts | | | | | | | | |
| (Aggregate Value of | | | | | | | | |
| Contracts $1,736,460) | | | 18 | | | $ | 5,375 | |
| September 2013 Brent Crude | | | | | | | | |
| Futures Contracts | | | | | | | | |
| (Aggregate Value of | | | | | | | | |
| Contracts $1,726,860) | | | 17 | | | | (11,398 | ) |
| August 2013 Lean Hogs | | | | | | | | |
| Futures Contracts | | | | | | | | |
| (Aggregate Value of | | | | | | | | |
| Contracts $26,379,000) | | | 675 | | | | (121,594 | ) |
| August 2013 Gasoline RBOB | | | | | | | | |
| Futures Contracts | | | | | | | | |
| (Aggregate Value of | | | | | | | | |
| Contracts $4,216,468) | | | 37 | | | | (129,286 | ) |
| August 2013 Natural Gas | | | | | | | | |
| Futures Contracts | | | | | | | | |
| (Aggregate Value of | | | | | | | | |
| Contracts $6,080,900) | | | 170 | | | | (279,894 | ) |
| December 2013 Cotton #2 | | | | | | | | |
| Futures Contracts | | | | | | | | |
| (Aggregate Value of | | | | | | | | |
| Contracts $15,357,160) | | | 364 | | | | (514,154 | ) |
| See Notes to Financial Statements. | the Guggenheim Funds SEMI - annual REPORT | 9 |
| CONSOLIDATED SCHEDULE OF INVESTMENTS (Unaudited) (continued) | June 30, 2013 |
| Managed Futures Strategy Fund | |
| | | | | | Unrealized | |
| | | Contracts | | | Gain (Loss) | |
| | | | | | | |
| November 2013 Soybean | | | | | | | | |
| Futures Contracts | | | | | | | | |
| (Aggregate Value of | | | | | | | | |
| Contracts $12,632,575) | | | 202 | | | $ | (545,971 | ) |
| (Total Aggregate Value of | | | | | | | | |
| Contracts $68,129,423) | | | | | | $ | (1,596,922 | ) |
| | | | | | | | | |
| CURRENCY FUTURES CONTRACTS SOLD SHORT† | | | | | | | | |
| September 2013 Japanese Yen | | | | | | | | |
| Futures Contracts | | | | | | | | |
| (Aggregate Value of | | | | | | | | |
| Contracts $55,725,150) | | | 442 | | | $ | 1,632,603 | |
| September 2013 Australian Dollar | | | | | | | | |
| Futures Contracts | | | | | | | | |
| (Aggregate Value of | | | | | | | | |
| Contracts $48,273,210) | | | 531 | | | | 1,606,117 | |
| September 2013 Canadian Dollar | | | | | | | | |
| Futures Contracts | | | | | | | | |
| (Aggregate Value of | | | | | | | | |
| Contracts $44,982,600) | | | 474 | | | | 581,949 | |
| September 2013 British Pound | | | | | | | | |
| Futures Contracts | | | | | | | | |
| (Aggregate Value of | | | | | | | | |
| Contracts $950,125) | | | 10 | | | | 233 | |
| September 2013 Swiss Franc | | | | | | | | |
| Futures Contracts | | | | | | | | |
| (Aggregate Value of | | | | | | | | |
| Contracts $132,425) | | | 1 | | | | (29 | ) |
| (Total Aggregate Value of | | | | | | | | |
| Contracts $150,063,510) | | | | | | $ | 3,820,873 | |
| | | | | | | | | |
| INTEREST RATE FUTURES CONTRACTS SOLD SHORT† | | | | | | | | |
| September 2013 Long Gilt | | | | | | | | |
| Futures Contracts†† | | | | | | | | |
| (Aggregate Value of | | | | | | | | |
| Contracts $33,392,593) | | | 196 | | | $ | 1,010,250 | |
| September 2013 U.S. Treasury | | | | | | | | |
| Ultra Long Bond | | | | | | | | |
| Futures Contracts | | | | | | | | |
| (Aggregate Value of | | | | | | | | |
| Contracts $34,360,219) | | | 233 | | | | 847,634 | |
| September 2013 U.S. Treasury | | | | | | | | |
| 30 Year Bond Futures Contracts | | | | | | | | |
| (Aggregate Value of | | | | | | | | |
| Contracts $38,978,188) | | | 287 | | | | 838,363 | |
| September 2013 U.S. Treasury | | | | | | | | |
| 5 Year Note Futures Contracts | | | | | | | | |
| (Aggregate Value of | | | | | | | | |
| Contracts $82,642,999) | | | 683 | | | | 691,652 | |
| September 2013 U.S. Treasury | | | | | | | | |
| 10 Year Note Futures Contracts | | | | | | | | |
| (Aggregate Value of | | | | | | | | |
| Contracts $47,937,578) | | | 379 | | | | 632,208 | |
| September 2013 Canadian | | | | | | | | |
| Government 10 Year Bond | | | | | | | | |
| Futures Contracts†† | | | | | | | | |
| (Aggregate Value of | | | | | | | | |
| Contracts $40,756,587) | | | 326 | | | | 560,335 | |
| September 2013 Japanese | | | | | | | | |
| Government 10 Year Bond | | | | | | | | |
| Futures Contracts†† | | | | | | | | |
| (Aggregate Value of | | | | | | | | |
| Contracts $57,528,859) | | | 40 | | | | 77,988 | |
| September 2013 Euro - Schatz | | | | | | | | |
| Futures Contracts†† | | | | | | | | |
| (Aggregate Value of | | | | | | | | |
| Contracts $19,680,208) | | | 137 | | | | 20,915 | |
| September 2013 Australian | | | | | | | | |
| Government 3 Year Bond | | | | | | | | |
| Futures Contracts†† | | | | | | | | |
| (Aggregate Value of | | | | | | | | |
| Contracts $56,325,216) | | | 564 | | | | (223,387 | ) |
| September 2013 Australian | | | | | | | | |
| Government 10 Year Bond | | | | | | | | |
| Futures Contracts†† | | | | | | | | |
| (Aggregate Value of | | | | | | | | |
| Contracts $47,238,599) | | | 437 | | | | (791,339 | ) |
| (Total Aggregate Value of | | | | | | | | |
| Contracts $458,841,046) | | | | | | $ | 3,664,619 | |
| | | | | | | | | |
| COMMODITY FUTURES CONTRACTS SOLD SHORT† | | | | | | | | |
| September 2013 Coffee ‘C’ | | | | | | | | |
| Futures Contracts | | | | | | | | |
| (Aggregate Value of | | | | | | | | |
| Contracts $28,694,063) | | | 635 | | | $ | 1,055,897 | |
| September 2013 Winter Wheat | | | | | | | | |
| Futures Contracts | | | | | | | | |
| (Aggregate Value of | | | | | | | | |
| Contracts $15,537,500) | | | 452 | | | | 814,182 | |
| August 2013 LME Primary | | | | | | | | |
| Aluminum Futures Contracts | | | | | | | | |
| (Aggregate Value of | | | | | | | | |
| Contracts $17,067,375) | | | 389 | | | | 740,237 | |
| September 2013 Wheat Futures | | | | | | | | |
| Contracts (Aggregate Value of | | | | | | | | |
| Contracts $14,908,225) | | | 454 | | | | 682,044 | |
| September 2013 Silver | | | | | | | | |
| Futures Contracts | | | | | | | | |
| (Aggregate Value of | | | | | | | | |
| Contracts $6,858,250) | | | 70 | | | | 585,659 | |
| August 2013 LME Nickel | | | | | | | | |
| Futures Contracts | | | | | | | | |
| (Aggregate Value of | | | | | | | | |
| Contracts $10,424,541) | | | 127 | | | | 423,615 | |
| September 2013 Corn | | | | | | | | |
| Futures Contracts | | | | | | | | |
| (Aggregate Value of | | | | | | | | |
| Contracts $5,609,313) | | | 205 | | | | 279,186 | |
| 10 | The Guggenheim Funds SEMI - annual REPORT | See Notes to Financial Statements. |
| CONSOLIDATED SCHEDULE OF INVESTMENTS (Unaudited) (concluded) | June 30, 2013 |
| Managed Futures Strategy Fund | |
| | | | | | Unrealized | |
| | | Contracts | | | Gain (Loss) | |
| | | | | | | |
| September 2013 Copper | | | | | | | | |
| Futures Contracts | | | | | | | | |
| (Aggregate Value of | | | | | | | | |
| Contracts $6,808,500) | | | 89 | | | $ | 252,096 | |
| August 2013 Gold 100 oz. | | | | | | | | |
| Futures Contracts | | | | | | | | |
| (Aggregate Value of | | | | | | | | |
| Contracts $4,065,270) | | | 33 | | | | 42,475 | |
| August 2013 New York Harbor | | | | | | | | |
| Ultra-Low Sulfur Diesel | | | | | | | | |
| Futures Contracts | | | | | | | | |
| (Aggregate Value of | | | | | | | | |
| Contracts $2,522,961) | | | 21 | | | | 33,048 | |
| August 2013 Gas Oil | | | | | | | | |
| Futures Contracts | | | | | | | | |
| (Aggregate Value of | | | | | | | | |
| Contracts $2,790,400) | | | 32 | | | | 19,053 | |
| August 2013 LME Zinc | | | | | | | | |
| Futures Contracts | | | | | | | | |
| (Aggregate Value of | | | | | | | | |
| Contracts $15,661,250) | | | 340 | | | | 16,156 | |
| August 2013 LME Lead | | | | | | | | |
| Futures Contracts | | | | | | | | |
| (Aggregate Value of | | | | | | | | |
| Contracts $2,969,963) | | | 58 | | | | (5,688 | ) |
| October 2013 Sugar #11 | | | | | | | | |
| Futures Contracts | | | | | | | | |
| (Aggregate Value of | | | | | | | | |
| Contracts $30,947,280) | | | 1,635 | | | | (513,465 | ) |
| August 2013 Live Cattle | | | | | | | | |
| Futures Contracts | | | | | | | | |
| (Aggregate Value of | | | | | | | | |
| Contracts $55,832,380) | | | 1,142 | | | | (861,604 | ) |
| (Total Aggregate Value of | | | | | | | | |
| Contracts $220,697,271) | | | | | | $ | 3,562,891 | |
| | | | | | | | | |
| EQUITY FUTURES CONTRACTS SOLD SHORT†† | | | | | | | | |
| July 2013 IBEX 35 Index | | | | | | | | |
| Futures Contracts | | | | | | | | |
| (Aggregate Value of | | | | | | | | |
| Contracts $1,093,300) | | | 11 | | | $ | 9,446 | |
| July 2013 Hang Seng Index | | | | | | | | |
| Futures Contracts | | | | | | | | |
| (Aggregate Value of | | | | | | | | |
| Contracts $5,713,984) | | | 43 | | | | (260,113 | ) |
| July 2013 H-Shares Index | | | | | | | | |
| Futures Contracts | | | | | | | | |
| (Aggregate Value of | | | | | | | | |
| Contracts $10,451,784) | | | 176 | | | | (464,573 | ) |
| (Total Aggregate Value of | | | | | | | | |
| Contracts $17,259,068) | | | | | | $ | (715,240 | ) |
| † | | Value determined based on Level 1 inputs, unless otherwise noted — See Note 4. |
| †† | | Value determined based on Level 2 inputs — See Note 4. |
| 1 | | All or portion of this security is on loan at June 30, 2013 — See Note 10. |
| 2 | | Variable rate security. Rate indicated is rate effective at June 30, 2013. |
| 3 | | Security is a 144A or Section 4(a)(2) security. The total market value of 144A or Section 4(a)(2) securities is $173,180,315 (cost $173,046,997), or 38.1% of total net assets. |
| 4 | | Repurchase Agreements — See Note 5. |
| 5 | | Securities lending collateral — See Note 10. |
| | | plc — Public Limited Company |
| | | REIT — Real Estate Investment Trust |
| See Notes to Financial Statements. | the Guggenheim Funds SEMI - annual REPORT | 11 |
| Managed Futures Strategy Fund | |
| Consolidated STATEMENT OF |
| ASSETS AND LIABILITIES (Unaudited) |
June 30, 2013
| Assets: | | | | |
| Investments, at value - including $4,712,780 of securities loaned (cost $352,914,979) | | $ | 353,780,877 | |
| Repurchase agreements, at value (cost $53,349,853) | | | 53,349,853 | |
| Total investments (cost $406,264,832) | | | 407,130,730 | |
| Segregated cash with broker | | | 34,736,967 | |
| Receivables: | | | | |
| Securities sold | | | 20,303,735 | |
| Variation margin | | | 1,712,176 | |
| Interest | | | 910,390 | |
| Fund shares sold | | | 751,899 | |
| Dividends | | | 36,000 | |
| Total assets | | | 465,581,897 | |
| Liabilities: | | | | |
| Overdraft due to custodian bank | | | 1,851,931 | |
| Foreign currency, at value (cost $935,718) | | | 924,543 | |
| Payable for: | | | | |
| Upon return of securities loaned | | | 4,846,400 | |
| Fund shares redeemed | | | 2,603,335 | |
| Management fees | | | 320,564 | |
| Distribution and service fees | | | 102,560 | |
| Transfer agent and administrative fees | | | 88,515 | |
| Portfolio accounting fees | | | 31,508 | |
| Miscellaneous | | | 160,509 | |
| Total liabilities | | | 10,929,865 | |
| Net assets | | $ | 454,652,032 | |
| Net assets consist of: | | | | |
| Paid in capital | | $ | 555,360,203 | |
| Accumulated net investment loss | | | (5,770,737 | ) |
| Accumulated net realized loss on investments | | | (102,695,958 | ) |
| Net unrealized appreciation on investments | | | 7,758,524 | |
| Net assets | | $ | 454,652,032 | |
| A-Class: | | | | |
| Net assets | | $ | 95,777,899 | |
| Capital shares outstanding | | | 4,478,436 | |
| Net asset value per share | | $ | 21.39 | |
| Maximum offering price per share (Net asset value divided by 95.25%) | | $ | 22.46 | |
| C-Class: | | | | |
| Net assets | | $ | 38,183,218 | |
| Capital shares outstanding | | | 1,872,702 | |
| Net asset value per share | | $ | 20.39 | |
| H-Class: | | | | |
| Net assets | | $ | 277,431,353 | |
| Capital shares outstanding | | | 12,971,705 | |
| Net asset value per share | | $ | 21.39 | |
| Institutional Class: | | | | |
| Net assets | | $ | 30,953,958 | |
| Capital shares outstanding | | | 1,435,286 | |
| Net asset value per share | | $ | 21.57 | |
| Y-Class: | | | | |
| Net assets | | $ | 12,305,604 | |
| Capital shares outstanding | | | 569,797 | |
| Net asset value per share | | $ | 21.60 | |
| Consolidated STATEMENT |
| OF OPERATIONS (Unaudited) |
Period Ended June 30, 2013
| Investment Income: | | | | |
| Interest | | $ | 1,028,291 | |
| Dividends | | | 273,940 | |
| Income from securities lending, net | | | 18,735 | |
| Total investment income | | | 1,320,966 | |
| | | | | |
| Expenses: | | | | |
| Management fees | | | 2,875,135 | |
| Transfer agent and administrative fees: | | | | |
| A-Class | | | 144,409 | |
| C-Class | | | 53,864 | |
| H-Class | | | 445,929 | |
| Institutional Class | | | 46,214 | |
| Y-Class | | | 39,199 | |
| Distribution and service fees: | | | | |
| A-Class | | | 144,410 | |
| C-Class | | | 215,456 | |
| H-Class | | | 445,928 | |
| Portfolio accounting fees | | | 239,296 | |
| Registration fees | | | 521,653 | |
| Trustees’ fees* | | | 55,581 | |
| Custodian fees | | | 37,277 | |
| Miscellaneous | | | 78,275 | |
| Total expenses | | | 5,342,626 | |
| Less: | | | | |
| Expenses waived by advisor | | | (213,240 | ) |
| Net expenses | | | 5,129,386 | |
| Net investment loss | | | (3,808,420 | ) |
| | | | | |
| Net Realized and Unrealized Gain (Loss): | | | | |
| Net realized gain (loss) on: | | | | |
| Investments | | | (169,320 | ) |
| Swap agreements | | | 490,143 | |
| Futures contracts | | | 22,343,708 | |
| Foreign currency | | | (99,926 | ) |
| Options purchased | | | 74,456 | |
| Net realized gain | | | 22,639,061 | |
| Net change in unrealized appreciation (depreciation) on: | | | | |
| Investments | | | (214,384 | ) |
| Futures contracts | | | (11,654,626 | ) |
| Options purchased | | | 936,912 | |
| Foreign currency | | | 9,057 | |
| Net change in unrealized appreciation (depreciation) | | | (10,923,041 | ) |
| Net realized and unrealized gain | | | 11,716,020 | |
| Net increase in net assets resulting from operations | | $ | 7,907,600 | |
* Relates to Trustees not deemed “interested persons” within the meaning of Section 2(a)(19) of the 1940 Act.
| 12 | the GUGGENHEIM FUNDS SEMI-annual report | See Notes to Financial Statements. |
| Managed Futures Strategy Fund | |
Consolidated STATEMENTS OF CHANGES IN NET ASSETS
| | | Period Ended | | | | |
| | | June 30, | | | Year Ended | |
| | | 2013 | | | December 31, | |
| | | (Unaudited) | | | 2012 | |
| Increase (Decrease) In Net Assets From Operations: | | | | | | | | |
| Net investment loss | | $ | (3,808,420 | ) | | $ | (30,926,614 | ) |
| Net realized gain (loss) on investments | | | 22,639,061 | | | | (208,209,108 | ) |
| Net change in unrealized appreciation (depreciation) on investments | | | (10,923,041 | ) | | | (4,344,238 | ) |
| Net increase (decrease) in net assets resulting from operations | | | 7,907,600 | | | | (243,479,960 | ) |
| | | | | | | | | |
| Capital share transactions: | | | | | | | | |
| Proceeds from sale of shares | | | | | | | | |
| A-Class | | | 15,065,370 | | | | 122,900,483 | |
| C-Class | | | 1,286,836 | | | | 6,406,783 | |
| H-Class | | | 51,923,046 | | | | 809,349,983 | |
| Institutional Class | | | 4,897,757 | | | | 41,570,693 | |
| Y-Class | | | 574,073 | | | | 40,444,459 | |
| Cost of shares redeemed | | | | | | | | |
| A-Class | | | (66,637,813 | ) | | | (671,652,699 | ) |
| C-Class | | | (12,741,448 | ) | | | (43,969,338 | ) |
| H-Class | | | (280,366,435 | ) | | | (1,219,877,947 | ) |
| Institutional Class | | | (20,082,301 | ) | | | (88,606,366 | ) |
| Y-Class | | | (90,498,581 | ) | | | (306,099,003 | ) |
| Net decrease from capital share transactions | | | (396,579,496 | ) | | | (1,309,532,952 | ) |
| Net decrease in net assets | | | (388,671,896 | ) | | | (1,553,012,912 | ) |
| | | | | | | | | |
| Net assets: | | | | | | | | |
| Beginning of period | | | 843,323,928 | | | | 2,396,336,840 | |
| End of period | | $ | 454,652,032 | | | $ | 843,323,928 | |
| Accumulated net investment loss at end of period | | $ | (5,770,737 | ) | | $ | (1,962,317 | ) |
| | | | | | | | | |
| Capital share activity: | | | | | | | | |
| Shares sold | | | | | | | | |
| A-Class | | | 701,750 | | | | 5,377,085 | |
| C-Class | | | 62,654 | | | | 298,490 | |
| H-Class | | | 2,414,052 | | | | 35,175,121 | |
| Institutional Class | | | 226,376 | | | | 1,899,025 | |
| Y-Class | | | 26,784 | | | | 1,739,090 | |
| Shares redeemed | | | | | | | | |
| A-Class | | | (3,098,351 | ) | | | (29,130,895 | ) |
| C-Class | | | (620,604 | ) | | | (2,053,748 | ) |
| H-Class | | | (13,046,784 | ) | | | (55,835,873 | ) |
| Institutional Class | | | (928,446 | ) | | | (3,982,544 | ) |
| Y-Class | | | (4,183,990 | ) | | | (13,821,535 | ) |
| Net decrease in shares | | | (18,446,559 | ) | | | (60,335,784 | ) |
| See Notes to Financial Statements. | the GUGGENHEIM FUNDS SEMI - annual report | 13 |
| Managed Futures Strategy Fund | |
This table is presented to show selected data for a share outstanding throughout each period and to assist shareholders in evaluating a Fund’s performance for the periods presented.
| | | Period Ended | | | Year Ended | | | Year Ended | | | Year Ended | | | Year Ended | | | Period Ended | |
| | | June 30, | | | December 31, | | | December 31, | | | December 31, | | | December 31, | | | December 31, | |
| A-Class | | 2013a,b | | | 2012b | | | 2011b | | | 2010b | | | 2009b | | | 2008b,c | |
| Per Share Data | | | | | | | | | | | | | | | | | | | | | | | | |
| Net asset value, beginning of period | | $ | 21.23 | | | $ | 23.95 | | | $ | 25.78 | | | $ | 26.81 | | | $ | 28.04 | | | $ | 28.26 | |
| Income (loss) from investment operations: | | | | | | | | | | | | | | | | | | | | | | | | |
| Net investment lossd | | | (.13 | ) | | | (.39 | ) | | | (.44 | ) | | | (.41 | ) | | | (.39 | ) | | | (— | )e |
| Net gain (loss) on investments (realized and unrealized) | | | .29 | | | | (2.33 | ) | | | (1.39 | ) | | | (.62 | ) | | | (.84 | ) | | | .83 | |
| Total from investment operations | | | .16 | | | | (2.72 | ) | | | (1.83 | ) | | | (1.03 | ) | | | (1.23 | ) | | | .83 | |
| Less distributions from: | | | | | | | | | | | | | | | | | | | | | | | | |
| Net investment income | | | — | | | | — | | | | — | | | | — | | | | — | | | | (.57 | ) |
| Net realized gains | | | — | | | | — | | | | — | | | | — | | | | — | | | | (.50 | ) |
| Total distributions | | | — | | | | — | | | | — | | | | — | | | | — | | | | (1.07 | ) |
| Redemption fees collected | | | — | | | | — | | | | — | | | | — | f | | | — | f | | | .02 | |
| Net asset value, end of period | | $ | 21.39 | | | $ | 21.23 | | | $ | 23.95 | | | $ | 25.78 | | | $ | 26.81 | | | $ | 28.04 | |
| | | | | | | | | | | | | | | | | | | | | | | | | |
| Total Returng | | | 0.75 | % | | | (11.32 | %) | | | (7.14 | %) | | | (3.84 | %) | | | (4.39 | %) | | | 2.96 | % |
| Ratios/Supplemental Data | | | | | | | | | | | | | | | | | | | | | | | | |
| Net assets, end of period (in thousands) | | $ | 95,778 | | | $ | 145,950 | | | $ | 733,469 | | | $ | 657,317 | | | $ | 636,083 | | | $ | 298,987 | |
| Ratios to average net assets: | | | | | | | | | | | | | | | | | | | | | | | | |
| Net investment loss | | | (1.24 | %) | | | (1.71 | %) | | | (1.76 | %) | | | (1.66 | %) | | | (1.42 | %) | | | (0.02 | %) |
| Total expensesh | | | 1.78 | % | | | 1.96 | % | | | 2.05 | % | | | 2.04 | % | | | 2.16 | % | | | 1.77 | % |
| Net expensesi | | | 1.71 | % | | | 1.89 | % | | | 1.97 | % | | | 1.97 | % | | | 2.05 | % | | | 1.77 | % |
| Portfolio turnover rate | | | 27 | % | | | 172 | % | | | 72 | % | | | 148 | % | | | 125 | % | | | 74 | % |
| | | | | | | | | | | | | | | | | | | | | | | | | |
| | | Period Ended | | | Year Ended | | | Year Ended | | | Year Ended | | | Year Ended | | | Period Ended | |
| | | June 30, | | | December 31, | | | December 31, | | | December 31, | | | December 31, | | | December 31, | |
| C-Class | | 2013a,b | | | 2012b | | | 2011b | | | 2010b | | | 2009b | | | 2008b,c | |
| Per Share Data | | | | | | | | | | | | | | | | | | | | | | | | |
| Net asset value, beginning of period | | $ | 20.31 | | | $ | 23.09 | | | $ | 25.04 | | | $ | 26.24 | | | $ | 27.65 | | | $ | 28.04 | |
| Income (loss) from investment operations: | | | | | | | | | | | | | | | | | | | | | | | | |
| Net investment lossd | | | (.20 | ) | | | (.53 | ) | | | (.61 | ) | | | (.59 | ) | | | (.58 | ) | | | (.16 | ) |
| Net gain (loss) on investments (realized and unrealized) | | | .28 | | | | (2.25 | ) | | | (1.34 | ) | | | (.61 | ) | | | (.83 | ) | | | .82 | |
| Total from investment operations | | | .08 | | | | (2.78 | ) | | | (1.95 | ) | | | (1.20 | ) | | | (1.41 | ) | | | .66 | |
| Less distributions from: | | | | | | | | | | | | | | | | | | | | | | | | |
| Net investment income | | | — | | | | — | | | | — | | | | — | | | | — | | | | (.57 | ) |
| Net realized gains | | | — | | | | — | | | | — | | | | — | | | | — | | | | (.50 | ) |
| Total distributions | | | — | | | | — | | | | — | | | | — | | | | — | | | | (1.07 | ) |
| Redemption fees collected | | | — | | | | — | | | | — | | | | — | f | | | — | f | | | .02 | |
| Net asset value, end of period | | $ | 20.39 | | | $ | 20.31 | | | $ | 23.09 | | | $ | 25.04 | | | $ | 26.24 | | | $ | 27.65 | |
| | | | | | | | | | | | | | | | | | | | | | | | | |
| Total Returng | | | 0.39 | % | | | (12.04 | %) | | | (7.79 | %) | | | (4.57 | %) | | | (5.10 | %) | | | 2.37 | % |
| Ratios/Supplemental Data | | | | | | | | | | | | | | | | | | | | | | | | |
| Net assets, end of period (in thousands) | | $ | 38,183 | | | $ | 49,378 | | | $ | 96,647 | | | $ | 158,628 | | | $ | 225,416 | | | $ | 125,601 | |
| Ratios to average net assets: | | | | | | | | | | | | | | | | | | | | | | | | |
| Net investment loss | | | (1.98 | %) | | | (2.45 | %) | | | (2.50 | %) | | | (2.41 | %) | | | (2.17 | %) | | | (0.78 | %) |
| Total expensesh | | | 2.53 | % | | | 2.70 | % | | | 2.80 | % | | | 2.79 | % | | | 2.92 | % | | | 2.51 | % |
| Net expensesi | | | 2.46 | % | | | 2.64 | % | | | 2.72 | % | | | 2.72 | % | | | 2.81 | % | | | 2.51 | % |
| Portfolio turnover rate | | | 27 | % | | | 172 | % | | | 72 | % | | | 148 | % | | | 125 | % | | | 74 | % |
| 14 | the GUGGENHEIM FUNDS SEMI - annual report | See Notes to Financial Statements. |
| Managed Futures Strategy Fund | |
| FINANCIAL HIGHLIGHTS (continued) |
This table is presented to show selected data for a share outstanding throughout each period and to assist shareholders in evaluating a Fund’s performance for the periods presented.
| | | Period Ended | | | Year Ended | | | Year Ended | | | Year Ended | | | Year Ended | | | Period Ended | |
| | | June 30, | | | December 31, | | | December 31, | | | December 31, | | | December 31, | | | December 31, | |
| H-Class | | 2013a,b | | | 2012b | | | 2011b | | | 2010b | | | 2009b | | | 2008b,c | |
| Per Share Data | | | | | | | | | | | | | | | | | | | | | | | | |
| Net asset value, beginning of period | | $ | 21.23 | | | $ | 23.95 | | | $ | 25.78 | | | $ | 26.81 | | | $ | 28.04 | | | $ | 28.26 | |
| Income (loss) from investment operations: | | | | | | | | | | | | | | | | | | | | | | | | |
| Net investment lossd | | | (.13 | ) | | | (.38 | ) | | | (.44 | ) | | | (.42 | ) | | | (.38 | ) | | | (.01 | ) |
| Net gain (loss) on investments (realized and unrealized) | | | .29 | | | | (2.34 | ) | | | (1.39 | ) | | | (.61 | ) | | | (.85 | ) | | | .84 | |
| Total from investment operations | | | .16 | | | | (2.72 | ) | | | (1.83 | ) | | | (1.03 | ) | | | (1.23 | ) | | | .83 | |
| Less distributions from: | | | | | | | | | | | | | | | | | | | | | | | | |
| Net investment income | | | — | | | | — | | | | — | | | | — | | | | — | | | | (.57 | ) |
| Net realized gains | | | — | | | | — | | | | — | | | | — | | | | — | | | | (.50 | ) |
| Total distributions | | | — | | | | — | | | | — | | | | — | | | | — | | | | (1.07 | ) |
| Redemption fees collected | | | — | | | | — | | | | — | | | | — | f | | | — | f | | | .02 | |
| Net asset value, end of period | | $ | 21.39 | | | $ | 21.23 | | | $ | 23.95 | | | $ | 25.78 | | | $ | 26.81 | | | $ | 28.04 | |
| | | | | | | | | | | | | | | | | | | | | | | | | |
| Total Returng | | | 0.75 | % | | | (11.32 | %) | | | (7.14 | %) | | | (3.84 | %) | | | (4.39 | %) | | | 2.96 | % |
| Ratios/Supplemental Data | | | | | | | | | | | | | | | | | | | | | | | | |
| Net assets, end of period (in thousands) | | $ | 277,431 | | | $ | 501,109 | | | $ | 1,059,988 | | | $ | 1,199,718 | | | $ | 1,468,770 | | | $ | 838,511 | |
| Ratios to average net assets: | | | | | | | | | | | | | | | | | | | | | | | | |
| Net investment loss | | | (1.27 | %) | | | (1.70 | %) | | | (1.75 | %) | | | (1.66 | %) | | | (1.41 | %) | | | (0.03 | %) |
| Total expensesh | | | 1.79 | % | | | 1.95 | % | | | 2.05 | % | | | 2.04 | % | | | 2.16 | % | | | 1.77 | % |
| Net expensesi | | | 1.71 | % | | | 1.89 | % | | | 1.97 | % | | | 1.97 | % | | | 2.05 | % | | | 1.77 | % |
| Portfolio turnover rate | | | 27 | % | | | 172 | % | | | 72 | % | | | 148 | % | | | 125 | % | | | 74 | % |
| | | | | | | | | | | | | | | | | | | | | | | | | |
| | | | | | | | | | | Period Ended | | | Year Ended | | | Year Ended | | | Period Ended | |
| | | | | | | | | | | June 30, | | | December 31, | | | December 31, | | | December 31, | |
| Institutional Class | | | | | | | | | | 2013a,b | | | 2012b | | | 2011b | | | 2010b,j | |
| Per Share Data | | | | | | | | | | | | | | | | | | | | | | | | |
| Net asset value, beginning of period | | | | | | | | | | $ | 21.38 | | | $ | 24.06 | | | $ | 25.84 | | | $ | 25.58 | |
| Income (loss) from investment operations: | | | | | | | | | | | | | | | | | | | | | | | | |
| Net investment lossd | | | | | | | | | | | (.11 | ) | | | (.33 | ) | | | (.38 | ) | | | (.23 | ) |
| Net gain (loss) on investments (realized and unrealized) | | | | | | | | | | | .30 | | | | (2.35 | ) | | | (1.40 | ) | | | .49 | |
| Total from investment operations | | | | | | | | | | | .19 | | | | (2.68 | ) | | | (1.78 | ) | | | .26 | |
| Redemption fees collected | | | | | | | | | | | — | | | | — | | | | — | | | | — | f |
| Net asset value, end of period | | | | | | | | | | $ | 21.57 | | | $ | 21.38 | | | $ | 24.06 | | | $ | 25.84 | |
| | | | | | | | | | | | | | | | | | | | | | | | | |
| Total Returng | | | | | | | | | | | 0.89 | % | | | (11.14 | %) | | | (6.85 | %) | | | 0.98 | % |
| Ratios/Supplemental Data | | | | | | | | | | | | | | | | | | | | | | | | |
| Net assets, end of period (in thousands) | | | | | | | | | | $ | 30,954 | | | $ | 45,700 | | | $ | 101,549 | | | $ | 134,733 | |
| Ratios to average net assets: | | | | | | | | | | | | | | | | | | | | | | | | |
| Net investment loss | | | | | | | | | | | (0.99 | %) | | | (1.45 | %) | | | (1.50 | %) | | | (1.41 | %) |
| Total expensesh | | | | | | | | | | | 1.53 | % | | | 1.70 | % | | | 1.80 | % | | | 1.78 | % |
| Net expensesi | | | | | | | | | | | 1.46 | % | | | 1.64 | % | | | 1.72 | % | | | 1.72 | % |
| Portfolio turnover rate | | | | | | | | | | | 27 | % | | | 172 | % | | | 72 | % | | | 148 | % |
| See Notes to Financial Statements. | the GUGGENHEIM FUNDS SEMI - annual report | 15 |
| Managed Futures Strategy Fund | |
| FINANCIAL HIGHLIGHTS (concluded) |
This table is presented to show selected data for a share outstanding throughout each period and to assist shareholders in evaluating a Fund’s performance for the periods presented.
| | | Period Ended | | | Year Ended | | | Year Ended | | | Period Ended | |
| | | June 30, | | | December 31, | | | December 31, | | | December 31, | |
| Y-Class | | 2013a,b | | | 2012b | | | 2011b | | | 2010b,k | |
| Per Share Data | | | | | | | | | | | | | | | | |
| Net asset value, beginning of period | | $ | 21.41 | | | $ | 24.07 | | | $ | 25.84 | | | $ | 25.74 | |
| Income (loss) from investment operations: | | | | | | | | | | | | | | | | |
| Net investment lossd | | | (.12 | ) | | | (.32 | ) | | | (.37 | ) | | | (.26 | ) |
| Net gain (loss) on investments (realized and unrealized) | | | .31 | | | | (2.34 | ) | | | (1.40 | ) | | | .36 | |
| Total from investment operations | | | .19 | | | | (2.66 | ) | | | (1.77 | ) | | | .10 | |
| Redemption fees collected | | | — | | | | — | | | | — | | | | — | f |
| Net asset value, end of period | | $ | 21.60 | | | $ | 21.41 | | | $ | 24.07 | | | $ | 25.84 | |
| | | | | | | | | | | | | | | | | |
| Total Returng | | | 0.89 | % | | | (11.05 | %) | | | 6.85 | % | | | 0.39 | % |
| Ratios/Supplemental Data | | | | | | | | | | | | | | | | |
| Net assets, end of period (in thousands) | | $ | 12,306 | | | $ | 101,187 | | | $ | 404,684 | | | $ | 189,251 | |
| Ratios to average net assets: | | | | | | | | | | | | | | | | |
| Net investment loss | | | (1.12 | %) | | | (1.41 | %) | | | (1.47 | %) | | | (1.36 | %) |
| Total expensesh | | | 1.53 | % | | | 1.65 | % | | | 1.75 | % | | | 1.73 | % |
| Net expensesi | | | 1.46 | % | | | 1.59 | % | | | 1.68 | % | | | 1.67 | % |
| Portfolio turnover rate | | | 27 | % | | | 172 | % | | | 72 | % | | | 148 | % |
| a | Unaudited figures for the period ended June 30, 2013. Percentage amounts for the period, except total return and portfolio turnover rate, have been annualized. |
| c | The Fund changed its fiscal year end from March 31 to December 31 in 2008. Percentage amounts for the period, except total return and portfolio turnover rate, have been annualized. |
| d | Net investment loss per share was computed using average shares outstanding throughout the period. |
| e | Net investment income is less than $0.01 per share. |
| f | Redemption fees collected are less than $0.01 per share. |
| g | Total return does not reflect the impact of any applicable sales charges and has not been annualized. |
| h | Does not include expenses of the underlying funds in which the Fund invests. |
| i | Net expense information reflects the expense ratios after expense waivers. |
| j | Since commencement of operations: May 3, 2010. Percentage amounts for the period, except total return and portfolio turnover rate, have been annualized. |
| k | Since commencement of operations: March 29, 2010. Percentage amounts for the period, except total return and portfolio turnover rate, have been annualized. |
| 16 | the GUGGENHEIM FUNDS SEMI - annual report | See Notes to Financial Statements. |
| NOTES TO Consolidated FINANCIAL STATEMENTS (Unaudited) |
1. Organization, Consolidation of Subsidiary and Significant Accounting Policies
Organization
The Rydex Series Funds (the “Trust”) is registered with the SEC under the Investment Company Act of 1940 (“1940 Act”), as a non-diversified, open-ended investment company. Each series, in effect, is representing a separate Fund (collectively the “Funds”). The Trust is authorized to issue an unlimited number of shares. The Trust accounts for the assets of each Fund separately. The Trust offers a combination of eight separate classes of shares:
Investor Class shares, Advisor Class shares, A-Class shares, C-Class shares, H-Class shares, Y-Class shares, Institutional Class shares, and Money Market Class shares. Sales of shares of each Class are made without a front-end sales charge at the net asset value per share (“NAV”), with the exception of A-Class shares. A-Class shares are sold at the NAV, plus the applicable front-end sales charge. The sales charge varies depending on the amount purchased, but will not exceed 4.75%. A-Class share purchases of $1 million or more are exempt from the front-end sales charge but have a 1% contingent deferred sales charge (“CDSC”) if shares are redeemed within 12 months of purchase. C-Class shares have a 1% CDSC if shares are redeemed within 12 months of purchase. Institutional Class shares are offered primarily for direct investment by institutions such as pension and profit sharing plans, endowments, foundations and corporations. Institutional Class shares have a minimum initial investment of $2 million and a minimum account balance of $1 million. Institutional Class shares are offered without a front-end sales charge or CDSC.
At June 30, 2013, the Trust consisted of fifty-one separate funds. This report covers the the Managed Futures Strategy Fund (the “Fund”). Only A-Class, C-Class, H-Class, Y-Class and Institutional Class shares had been issued by the Fund.
Guggenheim Investments (“GI”) provides advisory services and Rydex Fund Services, LLC (“RFS”) provides transfer agent, administrative and accounting services to the Trust. Guggenheim Distributors, LLC (“GDL”) acts as principal underwriter for the Trust. GI, RFS and GDL are affiliated entities.
Consolidation of Subsidiary
The consolidated financial statements of the Fund includes the accounts of a wholly-owned and controlled Cayman Islands subsidiary (the “Subsidiary”). Significant inter-company accounts and transactions have been eliminated in consolidation for the Fund.
The Fund may invest up to 25% of its total assets in its Subsidiary which acts as an investment vehicle in order to effect certain investments consistent with the Fund’s investment objectives and policies.
A summary of the Fund’s investment in its respective Subsidiary is as follows:
| | | | | Subsidiary | | | % of Total Net | |
| | | | | Net Assets at | | | Assets of the Fund | |
| | | Inception Date | | June 30, | | | at June 30, | |
| | | of Subsidiary | | 2013 | | | 2013 | |
| Managed Futures Strategy Fund | | 05/10/12 | | | $47,157,000 | | | | 10.4 | % |
Significant Accounting Policies
The following significant accounting policies are in conformity with U.S. generally accepted accounting principles (“U.S. GAAP”) and are consistently followed by the Fund. This requires management to make estimates and assumptions that affect the reported amount of assets and liabilities and disclosure of contingent assets and liabilities at the date of the financial statements and the reported amounts of revenues and expenses during the reporting period. Actual results could differ from these estimates. All time references are based on Eastern Time.
A. The value of futures contracts is accounted for using the unrealized gain or loss on the contracts that is determined by marking the contracts to their current realized settlement prices. Financial futures contracts are valued at the 4:00 p.m. price on the valuation date. In the event that the exchange for a specific futures contract closes earlier than 4:00 p.m., the futures contract is valued at the Official Settlement Price of the exchange. However, the underlying securities from which the futures contract value is derived are monitored until 4:00 p.m. to determine if fair valuation would provide a more accurate valuation.
Debt securities with a maturity of greater than 60 days at acquisition are valued at prices that reflect broker/dealer supplied valuations or are obtained from independent pricing services, which may consider the trade activity, treasury spreads, yields or price of bonds of comparable quality, coupon, maturity, and type, as well as prices quoted by dealers who make markets in such securities. Short-term debt securities with a maturity of 60 days or less at acquisition and repurchase agreements are valued at amortized cost, which approximates market value.
Listed options are valued at the Official Settlement Price listed by the exchange, usually as of 4:00 p.m. Long options are valued using the bid price and short options are valued using the ask price. In the event that a settlement price is not available, fair valuation is enacted. Over-the-counter options are valued using the average bid price (for long options), or average ask price (for short options) obtained from one or more security dealers.
Open-end investment companies (“Mutual Funds”) are valued at their NAV as of the close of business, on the valuation date.
| the GUGGENHEIM FUNDS SEMI - annual report | 17 |
| NOTES TO CONSOLIDATED FINANCIAL STATEMENTS (Unaudited) (continued) |
ETFs and closed-end investment companies are valued at the last quoted sales price.
Investments for which market quotations are not readily available are fair valued as determined in good faith by GI under the direction of the Board of Trustees using methods established or ratified by the Board of Trustees. These methods include, but are not limited to: (i) obtaining general information as to how these securities and assets trade; (ii) in connection with futures contracts and options thereupon, and other derivative investments, obtaining information as to how (a) these contracts and other derivative investments trade in the futures or other derivative markets, respectively, and (b) the securities underlying these contracts and other derivative investments trade in the cash market; and (iii) obtaining other information and considerations, including current values in related markets.
B. Security transactions are recorded on the trade date for financial reporting purposes. Realized gains and losses from securities transactions are recorded using the identified cost basis. Proceeds from lawsuits related to investment holdings are recorded as realized gains in the Fund. Dividend income is recorded on the ex-dividend date, net of applicable taxes withheld by foreign countries. Taxable non-cash dividends are recorded as dividend income. Interest income, including amortization of premiums and accretion of discount, is accrued on a daily basis.
C. Distributions of net investment income and net realized gains, if any, are declared and paid at least annually. Distributions are recorded on the ex-dividend date and are determined in accordance with income tax regulations which may differ from U.S. GAAP.
D. Upon entering into a futures contract, the Fund deposits and maintains as collateral such initial margin as required by the exchange on which the transaction is affected. Pursuant to the contract, the Fund agrees to receive from or pay to the broker an amount of cash equal to the daily fluctuation in value of the contract. Such receipts or payments are known as variation margin and are recorded by the Fund as unrealized gains or losses. When the contract is closed, the Fund records a realized gain or loss equal to the difference between the value of the contract at the time it was opened and the value at the time it was closed.
E. Certain U.S. Government and Agency Obligations are traded on a discount basis; the interest rates shown on the Schedule of Investments reflect the effective rates paid at the time of purchase by the Fund. Other securities bear interest at the rates shown, payable at fixed dates through maturity.
F. The Fund may leave cash overnight in its cash account with the custodian, U.S. Bank. Periodically, the Fund may have cash due to the custodian bank as an overdraft balance. A fee is incurred on this overdraft, calculated by multiplying the overdraft by a rate based on the federal funds rate.
Segregated cash with the broker is held as collateral for investments in derivative instruments such as futures contracts or swap agreements.
G. Interest and dividend income, most expenses, all realized gains and losses, and all unrealized gains and losses are allocated to the Classes based upon the value of the outstanding shares in each Class. Certain costs, such as distribution fees relating to A-Class shares and H-Class shares and service and distribution fees related to C-Class shares, are charged directly to specific Classes. In addition, certain expenses have been allocated to the individual Funds in the Trust on a pro rata basis upon the respective aggregate net assets of each Fund included in the Trust.
H. Throughout the normal course of business, the Fund enters into contracts that contain a variety of representations and warranties which provide general indemnifications. The Fund’s maximum exposure under these arrangements is unknown, as this would involve future claims that may be made against the Fund and/or its affiliates that have not yet occurred. However, based on experience, the Fund expects the risk of loss to be remote.
2. Financial Instruments
As part of its investment strategy, the Fund utilizes a variety of derivative instruments including options, futures and swap agreements. These investments involve, to varying degrees, elements of market risk and risks in excess of the amounts recognized in the Statement of Assets and Liabilities.
A futures contract is an agreement to purchase (long) or sell (short) an agreed amount of securities or other instruments at a set price for delivery at a future date. There are significant risks associated with a Fund’s use of futures contracts and related options, including (i) there may be an imperfect or no correlation between the changes in market value of the underlying asset and the prices of futures contracts; (ii) there may not be a liquid secondary market for a futures contract; (iii) trading restrictions or limitations may be imposed by an exchange; and (iv) government regulations may restrict trading in futures contracts. When investing in futures, there is minimal counterparty credit risk to the Fund because futures are exchange-traded and the exchange’s clearinghouse, as counterparty to all exchange-traded futures, guarantees against default.
| 18 | the GUGGENHEIM FUNDS SEMI - annual report |
| NOTES TO Consolidated FINANCIAL STATEMENTS (Unaudited) (continued) |
A swap is an agreement that obligates two parties to exchange a series of cash flows at specified intervals based upon or calculated by reference to changes in specified prices or rates for a specified amount of an underlying asset. A Fund bears the risk of loss of the amount expected to be received under a swap agreement in the event of the default or bankruptcy of a swap agreement counterparty. Additionally, there is no guarantee that a Fund or an underlying fund could eliminate its exposure under an outstanding swap agreement by entering into an offsetting swap agreement with the same or another party.
An option on a security gives the purchaser of the option the right to sell, and the writer of the option the obligation to buy, the underlying security (put option) or the purchaser of the option the right to buy, and the writer of the option the obligation to sell, the underlying security (call option) at any time during the option period. The risk associated with purchasing options is limited to the premium originally paid. The risk in writing a call option is that a Fund may incur a loss if the market price of the underlying security increases and the option is exercised. The risk in writing a put option is that a Fund may incur a loss if the market price of the underlying security decreases and the option is exercised. In addition, there may be an imperfect correlation between the movement in prices of options and the underlying securities and a Fund may not be able to enter into a closing transaction because of an illiquid secondary market or, for over-the-counter options, because of the counterparty’s inability to perform.
In conjunction with the use of futures and swap agreements, the Fund is required to maintain collateral in various forms. The Fund uses, where appropriate, depending on the financial instrument utilized and the broker involved, margin deposits at the broker, cash and/or securities segregated at the custodian bank, discount notes, or the repurchase agreements allocated to the Fund.
The Trust has established counterparty credit guidelines and enters into transactions only with financial institutions of investment grade or better. The Trust monitors the counterparty credit risk.
3. Fees and Other Transactions with Affiliates
Under the terms of an investment advisory contract, the Fund pays GI investment advisory fees calculated at an annualized rate of 0.90% of the average daily net assets.
RFS provides transfer agent and administrative services to the Fund calculated at an annualized rate of 0.25% of the average daily net assets of A-Class, C-Class, H-Class and Institutional Class and 0.20% of the average daily net assets of Y-Class.
GI has contractually agreed to waive the management fee it receives from the Subsidiary in an amount equal to the management fee paid to GI by the Subsidiary. This undertaking will continue in effect for so long as the Fund invests in the Subsidiary, and may not be terminated by GI unless GI obtains the prior approval of the Fund’s Board of Trustees for such termination. In any event, this undertaking will continue through April 30, 2014.
RFS also provides accounting services to the Fund for fees calculated at annualized rates below, based on the average daily net assets of the Fund.
| Fund Accounting Fees | | (as a % of net assets) | |
| On the first $250 million | | | 0.10 | % |
| On the next $250 million | | | 0.075 | % |
| On the next $250 million | | | 0.05 | % |
| Over $750 million | | | 0.03 | % |
RFS engages external service providers to perform other necessary services for the Trust, such as audit and accounting related services, legal services, custody, printing and mailing, etc., on a pass-through basis. Such expenses are allocated to various Funds within the complex based on relative net assets.
The Trust has adopted a Distribution Plan applicable to A-Class shares and H-Class shares for which GDL and other firms that provide distribution and/or shareholder services (“Service Providers”) may receive compensation. If a Service Provider provides distribution services, the Trust will pay distribution fees to GDL at an annual rate not to exceed 0.25% of average daily net assets, pursuant to Rule 12b-1 of the 1940 Act. GDL, in turn, will pay the Service Provider out of its fees. GDL may, at its discretion, retain a portion of such payments to compensate itself for distribution services.
The Trust has adopted a separate Distribution and Shareholder Services Plan applicable to its C-Class shares that allows the Funds to pay annual distribution and service fees of 1.00% of the Funds’ C-Class shares average daily net assets. The annual 0.25% service fee compensates the shareholder’s financial advisor for providing ongoing services to the shareholder. The annual distribution fee of 0.75% reimburses GDL for paying the shareholder’s financial advisor an ongoing sales commission. GDL advances the first year’s service and distribution fees to the financial advisor. GDL retains the service and distribution fees on accounts with no authorized dealer of record.
For the period ended June 30, 2013, GDL retained sales charges of $158,835 relating to sales of A-Class shares of the Trust.
Certain officers and trustees of the Trust are also officers of GI, RFS and GDL.
| THE GUGGENHEIM FUNDS SEMI - ANNUAL REPORT | 19 |
| NOTES TO CONSOLIDATED FINANCIAL STATEMENTS (Unaudited) (continued) |
4. Fair Value Measurement
In accordance with U.S. GAAP, fair value is defined as the price that the Fund would receive to sell an investment or pay to transfer a liability in an orderly transaction with an independent buyer in the principal market, or in the absence of a principal market the most advantageous market for the investment or liability. A three-tier hierarchy is utilized to distinguish between (1) inputs that reflect the assumptions market participants would use in pricing an asset or liability developed based on market data obtained from sources independent of the reporting entity (observable inputs) and (2) inputs that reflect the reporting entity’s own assumptions about the assumptions market participants would use in pricing an asset or liability developed based on the best information available in the circumstances (unobservable inputs) and to establish classification of fair value measurements for disclosure purposes. Various inputs are used in determining the value of the Fund’s investments. The inputs are summarized in the three broad levels listed below:
Level 1 — quoted prices in active markets for identical securities.
Level 2 — other significant observable inputs (including quoted prices for similar securities, interest rates, prepayment speeds, credit risk, etc.).
Level 3 — significant unobservable inputs (including the fund’s own assumptions used to determine the fair value of investments).
The inputs or methodologies used for valuing securities are not necessarily an indication of the risk associated with investing in those securities.
The following table summarizes the inputs used to value the Fund’s net assets at June 30, 2013:
| | | Level 1 | | | Level 1 | | | Level 2 | | | Level 2 | | | Level 3 | | | | |
| | | Investments | | | Other Financial | | | Investments | | | Other Financial | | | Investments | | | | |
| | | In Securities | | | Instruments* | | | In Securities | | | Instruments* | | | In Securities | | | Total | |
| Assets | | | | | | | | | | | | | | | | | | | | | | | | |
| Managed Futures Strategy Fund | | $ | 132,912,418 | | | $ | 16,281,235 | | | $ | 270,071,374 | | | $ | 2,662,944 | | | $ | — | | | $ | 421,927,971 | |
| Liabilities | | | | | | | | | | | | | | | | | | | | | | | | |
| Managed Futures Strategy Fund | | $ | — | | | $ | 5,300,265 | | | $ | — | | | $ | 2,613,235 | | | $ | — | | | $ | 7,913,500 | |
* Other financial instruments may include futures contracts, which are reported as unrealized gain/loss at period end.
For the period ended June 30, 2013, there were no transfers between levels.
5. Repurchase Agreements
The Funds transfer uninvested cash balances into a single joint account, the daily aggregate balance of which is invested in one or more repurchase agreements collateralized by obligations of the U.S. Treasury and U.S. Government Agencies. The collateral is in the possession of the Funds’ custodian and is evaluated to ensure that its market value exceeds, at a minimum, 102% of the original face amount of the repurchase agreements. Each Fund holds a pro rata share of the collateral based on the dollar amount of the repurchase agreement entered into by each Fund.
| 20 | the GUGGENHEIM FUNDS SEMI - annual report |
| NOTES TO Consolidated FINANCIAL STATEMENTS (Unaudited) (continued) |
At June 30, 2013, the repurchase agreements in the joint account were as follows:
| Counterparty and Terms of Agreement | | Face Value | | | Repurchase Price | | | Collateral | | Par Value | | | Fair Value | |
| HSBC Group | | | | | | | | | | Fannie Mae | | | | | | | | |
| 0.07% | | | | | | | | | | 0.50% - 0.65% | | | | | | | | |
| Due 07/01/13 | | $ | 860,000,000 | | | $ | 860,005,017 | | | 10/22/15 - 05/27/16 | | $ | 298,566,000 | | | $ | 299,638,582 | |
| | | | | | | | | | | Freddie Mac | | | | | | | | |
| | | | | | | | | | | 0.50% - 0.60% | | | | | | | | |
| | | | | | | | | | | 10/09/15 - 03/28/16 | | | 250,000,000 | | | | 251,160,833 | |
| | | | | | | | | | | Federal Home Loan Bank | | | | | | | | |
| | | | | | | | | | | 0.13% | | | | | | | | |
| | | | | | | | | | | 03/19/14 | | | 200,000,000 | | | | 200,947,222 | |
| | | | | | | | | | | Federal Farm Credit Bank | | | | | | | | |
| | | | | | | | | | | 0.30% | | | | | | | | |
| | | | | | | | | | | 06/04/15 | | | 125,000,000 | | | | 125,454,167 | |
| Mizuho Financial Group, Inc. | | | | | | | | | | U.S. Treasury Note | | | | | | | | |
| 0.06% | | | | | | | | | | 0.88% | | | | | | | | |
| Due 07/01/13 | | | 147,807,111 | | | | 147,807,850 | | | 01/31/18 | | | 152,694,700 | | | | 150,763,344 | |
| Deutsche Bank | | | | | | | | | | U.S. Treasury Note | | | | | | | | |
| 0.06% | | | | | | | | | | 0.25% | | | | | | | | |
| Due 07/01/13 | | | 60,000,000 | | | | 60,000,300 | | | 09/15/15 | | | 61,428,800 | | | | 61,200,019 | |
In the event of counterparty default, the Funds have the right to collect the collateral to offset losses incurred. There is potential loss to the Funds in the event the Funds are delayed or prevented from exercising their rights to dispose of the collateral securities, including the risk of a possible decline in the value of the underlying securities during the period while the Funds seek to assert their rights. The Funds’ investment advisor, acting under the supervision of the Board of Trustees, reviews the value of the collateral and the creditworthiness of those banks and dealers with which the Funds enter into repurchase agreements to evaluate potential risks.
6. Derivative Investment Holdings Categorized by Risk Exposure
U.S. GAAP requires disclosures to enable investors to better understand how and why the Fund uses derivative instruments, how these derivative instruments are accounted for and their effects on the Fund’s financial position and results of operations.
The Fund utilized derivatives for the following purposes:
| Fund | | | Index Exposure | | | | Liquidity | |
| Managed Futures Strategy Fund | | | x | | | | x | |
The following table represents the notional amount of derivative instruments outstanding, as an approximate percentage of the Fund’s net assets on a daily basis.
| | Approximate percentage of
Fund’s net assets on a daily basis | |
| Fund | | Long | | | Short | |
| Managed Futures Strategy Fund | | | 65 | % | | | 185 | % |
The following is a summary of the location of derivative investments on the Fund’s Statement of Assets and Liabilities as of June 30, 2013:
| Derivative Investment Type | Asset Derivatives | Liability Derivatives |
| Equity/Interest Rate/Currency/Commodity contracts | Variation margin | Variation margin |
The following table sets forth the fair value of the Fund’s derivative investments categorized by primary risk exposure at June 30, 2013:
| Asset Derivative Investments Value |
| | | Futures | | | Futures | | | Futures | | | Futures | | | Options | | | | |
| | | Equity | | | Currency | | | Interest Rate | | | Commodity | | | Purchased Equity | | | Total Value at | |
| Fund | | Contracts* | | | Contracts* | | | Contracts* | | | Contracts* | | | Contracts | | | June 30, 2013 | |
| Managed Futures Strategy Fund | | $ | 1,347,971 | | | $ | 3,820,902 | | | $ | 4,679,345 | | | $ | 4,949,023 | | | $ | 4,146,938 | | | $ | 18,944,179 | |
| THE GUGGENHEIM FUNDS SEMI - ANNUAL REPORT | 21 |
| NOTES TO CONSOLIDATED FINANCIAL STATEMENTS (Unaudited) (continued) |
| Liability Derivative Investments Value |
| | | Futures | | | Futures | | | Futures | | | Futures | | | Options | | | | |
| | | Equity | | | Currency | | | Interest Rate | | | Commodity | | | Purchased Equity | | | Total Value at | |
| Fund | | Contracts* | | | Contracts* | | | Contracts* | | | Contracts* | | | Contracts | | | June 30, 2013 | |
| Managed Futures Strategy Fund | | $ | 2,890,743 | | | $ | 817,681 | | | $ | 1,222,022 | | | $ | 2,983,054 | | | $ | — | | | $ | 7,913,500 | |
| * | Includes cumulative appreciation (depreciation) of futures contracts as reported on the Schedule of Investments. Only current day’s variation margin is reported within the Statement of Assets and Liabilities. |
The following is a summary of the location of derivative investments on the Fund’s Statement of Operations for the period ended June 30, 2013:
| Derivative Investment Type | Location of Gain (Loss) on Derivatives |
| Equity/Interest Rate/Currency/Commodity contracts | Net realized gain (loss) on futures contracts |
| | Net change in unrealized appreciation (depreciation) on futures contracts |
The following is a summary of the Fund’s realized gain (loss) and change in unrealized appreciation (depreciation) on derivative investments recognized on the Statement of Operations categorized by primary risk exposure for the period ended June 30, 2013:
| Realized Gain (Loss) on Derivative Investments Recognized on the Statement of Operations |
| | | Futures | | | Swaps | | | Futures | | | Futures | | | Futures | | | Options | | | | |
| | | Equity | | | Equity | | | Currency | | | Interest Rate | | | Commodity | | | Purchased Equity | | | | |
| Fund | | Contracts | | | Contracts | | | Contracts | | | Contracts | | | Contracts | | | Contracts | | | Total | |
| Managed Futures Strategy Fund | | $ | 7,647,528 | | | $ | 490,143 | | | $ | 7,561,564 | | | $ | (3,221,331 | ) | | $ | 10,355,947 | | | $ | 74,456 | | | $ | 22,908,307 | |
| |
| Change in Unrealized Appreciation (Depreciation) on Derivative Investments Recognized on the Statement of Operations |
| | | | Futures | | | | Swaps | | | | Futures | | | | Futures | | | | Futures | | | | Options | | | | | |
| | | | Equity | | | | Equity | | | | Currency | | | | Interest Rate | | | | Commodity | | | | Purchased Equity | | | | | |
| Fund | | | Contracts | | | | Contracts | | | | Contracts | | | | Contracts | | | | Contracts | | | | Contracts | | | | Total | |
| Managed Futures Strategy Fund | | $ | (2,622,794 | ) | | $ | — | | | $ | (2,304,627 | ) | | $ | 3,269,991 | | | $ | (9,997,196 | ) | | $ | 936,912 | | | $ | (10,717,714 | ) |
7. Federal Income Tax Information
The Fund intend to comply with the provisions of Subchapter M of the Internal Revenue Code applicable to regulated investment companies and distribute substantially all taxable net investment income and capital gains sufficient to relieve the Fund from all, or substantially all, federal income, excise and state income taxes. Therefore, no provision for federal or state income tax is required.
Tax positions taken or expected to be taken in the course of preparing the Fund’s tax returns are evaluated to determine whether the tax positions are “more-likely-than-not” of being sustained by the applicable tax authority. Tax positions not deemed to meet the more-likely-than-not threshold would be recorded as a tax benefit or expense in the current year. Management has analyzed the Fund’s tax positions taken, or to be taken, on Federal income tax returns for all open tax years (fiscal years 2009 – 2012), and has concluded that no provision for income tax is required in the Fund’s financial statements.
The RIC Modernization Act of 2010 was signed into law on December 22, 2010. It simplified some of the tax provisions applicable to regulated investment companies and the tax reporting to their shareholders, and improved the tax efficiency of certain fund structures. The changes were generally effective for taxable years beginning after the date of enactment.
One of the more prominent changes addresses capital loss carryforwards. The Fund is permitted to carry forward capital losses incurred in taxable years beginning after December 22, 2010 for an unlimited period. However, any losses incurred during those future taxable years will be required to be utilized prior to the losses incurred in pre-enactment taxable years. Under pre-enactment law, capital losses could be carried forward for eight years, and carried forward as short-term capital, irrespective of the character of the original loss. As a result of this ordering rule, pre-enactment capital loss carryforwards may potentially expire unused. Additionally, post-enactment capital losses that are carried forward will retain their character as either short-term or long-term capital losses rather than being considered all short-term as under previous law.
| 22 | THE GUGGENHEIM FUNDS SEMI - ANNUAL REPORT |
| NOTES TO Consolidated FINANCIAL STATEMENTS (Unaudited) (continued) |
At June 30, 2013, the cost of securities for Federal income tax purposes, the aggregate gross unrealized gain for all securities for which there was an excess of value over tax cost and the aggregate gross unrealized loss for all securities for which there was an excess of tax cost over value, were as follows:
| | | | | | Tax | | | Tax | | | Net | |
| | | Tax | | | Unrealized | | | Unrealized | | | Unrealized | |
| Fund | | Cost | | | Gain | | | Loss | | | Gain | |
| Managed Futures Strategy Fund | | $ | 406,264,832 | | | $ | 1,376,609 | | | $ | (510,711 | ) | | $ | 865,898 | |
8. Securities Transactions
For the period ended June 30, 2013, the cost of purchases and proceeds from sales of investment securities, excluding government securities and short-term investments, were as follows:
| Fund | | Purchases | | | Sales | |
| Managed Futures Strategy Fund | | $ | 134,264,749 | | | $ | 33,812,308 | |
9. Line of Credit
The Trust, along with other affiliated trusts, secured an uncommitted, $75,000,000 line of credit from U.S. Bank, N.A., which expires June 15, 2014.
This line of credit is reserved for emergency or temporary purposes. Borrowings, if any, under this arrangement bear interest equal to the Prime Rate, minus 2%, which shall be paid monthly, averaging 1.25% for the period ended June 30, 2013. The Fund did not have any borrowings under this agreement at June 30, 2013, and did not participate in borrowing during the period.
10. Portfolio Securities Loaned
The Funds may lend their securities to approved brokers to earn additional income. Security lending income shown on the statement of operations is shown net of rebates paid to the borrowers and earnings on cash collateral investments shared with the lending agent. Within this arrangement, the Funds act as the lender, Credit Suisse acts as the lending agent, and other approved registered broker dealers act as the borrowers. The Funds receive cash collateral, valued at 102% of the value of the securities on loan. Under the terms of the Funds’ securities lending agreement with Credit Suisse, cash collateral is invested in one or more joint repurchase agreements collateralized by obligations of the U.S. Treasury or Government Agencies and cash. The Funds bear the risk of loss on cash collateral investments. Collateral is maintained over the life of the loan in an amount not less than the value of loaned securities, as determined at the close of fund business each day; any additional collateral required due to changes in security values is delivered to the Funds the next business day. Although the collateral mitigates the risk, the Funds could experience a delay in recovering its securities and a possible loss of income or value if the borrower fails to return the securities. The Funds have the right under the securities lending agreement to recover the securities from the borrower on demand.
At June 30, 2013, the Fund participated in securities lending as follows:
| Fund | | Value of Securities Loaned | | | Cash Collateral Received | |
| Managed Futures Strategy Fund | | $ | 4,712,780 | | | $ | 4,846,400 | |
The following represents a breakdown of the collateral for the joint repurchase agreements at June 30, 2013:
| Counterparty and Terms of Agreement | | Face Value | | | Repurchase Price | | | Collateral | | Par Value | | | Fair Value | |
| HSBC Securities, Inc. | | | | | | | | | | Federal Home Loan Bank | | | | | | | | |
| 0.11% | | | | | | | | | | 0.00% | | | | | | | | |
| Due 07/01/13 | | $ | 53,372,568 | | | $ | 53,373,221 | | | 09/06/13 | | $ | 21,437,136 | | | $ | 21,434,991 | |
| | | | | | | | | | | Federal Home Loan Bank | | | | | | | | |
| | | | | | | | | | | 0.00% | | | | | | | | |
| | | | | | | | | | | 11/15/13 | | | 33,019,728 | | | | 33,009,492 | |
| RBS Securities, Inc. | | | | | | | | | | Federal Home Loan Bank | | | | | | | | |
| 0.10% | | | | | | | | | | 3.18% | | | | | | | | |
| Due 07/01/13 | | | 6,242,589 | | | | 6,242,659 | | | 11/26/32 | | | 6,905,520 | | | | 6,370,458 | |
| THE GUGGENHEIM FUNDS SEMI - ANNUAL REPORT | 23 |
| NOTES TO CONSOLIDATED FINANCIAL STATEMENTS (Unaudited) (continued) |
11. Legal Proceedings
Tribune Company
Rydex Series Funds has been named as a defendant in the case entitled Marc S. Kirscher, as Litigation Trustee for the Tribune Litigation Trust v. FitzSimons, No. 12-2652 (S.D.N.Y.) (formerly Official Committee of Unsecured Creditors of Tribune Co. v. FitzSimons, Adv. Pro. No. 10-54010 (Bankr. D. Del.)) (the “FitzSimons” Action), as a result of the ownership of shares in the Tribune Company (“Tribune”) in 2007 by certain series of the Rydex Series Funds when Tribune effected a leveraged buyout transaction (“LBO”) by which Tribune converted to a privately-held company. The plaintiff has alleged that, in connection with the LBO, insiders and shareholders were paid for their Tribune stock using financing that the insiders knew would, and ultimately did, leave the Tribune insolvent. The plaintiff has asserted claims against certain insiders, shareholders, professional advisers, and others involved in the LBO, and is attempting to obtain from these individuals and entities the proceeds paid out in connection with the LBO.
Rydex Series Funds also has been named as a defendant in one or more of a group of lawsuits filed by a group of Tribune creditors that allege state law constructive fraudulent conveyance claims against former Tribune shareholders (the “SLCFC actions”).
The FitzSimons action and the SLCFC actions have been consolidated with the majority of the other Tribune LBO-related lawsuits in a multidistrict litigation proceeding captioned In re Tribune Company Fraudulent Conveyance Litig., No. 11-md-2696 (S.D.N.Y.) (the “MDL Proceeding”). On November 6, 2012, the defendants moved to dismiss the SLCFC actions. On December 21, 2012, the plaintiffs filed a memorandum in opposition to the motion to dismiss. On February 4, 2013, the defendants filed a reply in support of the motion to dismiss. The Court has not yet issued a decision on the motion.
None of these lawsuits allege any wrongdoing on the part of Rydex Series Funds. The following series of Rydex Series Funds held shares of Tribune and tendered these shares as part of Tribune’s LBO: Nova Fund, S&P 500® Pure Value Fund, Multi-Cap Core Equity Fund, S&P 500® Fund, Multi-Hedge Strategies Fund and Hedged Equity Fund (the “Funds”). The value of the proceeds received by the foregoing Funds was $28,220, $109,242, $9,860, $3,400, $1,181,160, and $10,880, respectively. At this stage of the proceedings, Rydex Series Funds is not able to make a reliable predication as to the outcome of these lawsuits or the effect, if any, on a Fund’s net asset value.
Lyondell Chemical Company
In December 2011, Rydex Series Funds was named as a defendant in Weisfelner, as Trustee of the LB Creditor Trust, v. Fund 1 (In re Lyondell Chemical Co.), Adv. Pro. No. 10-4609 (Bankr. S.D.N.Y.).
Similar to the claims made in the Tribune matter, the Weisfelner complaint seeks to have set aside and recovered as fraudulent transfers from former Lyondell Chemical Company (“Lyondell”) shareholders the consideration paid to them pursuant to the cash out merger of Lyondell shareholders in connection with the combination of Lyondell and Basell AF in 2007. Lyondell filed for bankruptcy in 2008.
A motion to dismiss is currently pending before the Bankruptcy Court.
This lawsuit does not allege any wrongdoing on the part of Rydex Series Funds. The following series of Rydex Series Funds received cash proceeds from the cash out merger in the following amounts: Basic Materials Fund - $1,725,168; U.S. Long Short Momentum Fund - $2,193,600; Global 130/30 Strategy Fund - $37,920; Hedged Equity Fund - $1,440; and Multi-Hedge Strategies Fund - $1,116,480. At this stage of the proceedings, Rydex Series Funds is not able to make a reliable predication as to the outcome of these lawsuits or the effect, if any, on a Fund’s net asset value.
| 24 | THE GUGGENHEIM FUNDS SEMI - ANNUAL REPORT |
| NOTES TO Consolidated FINANCIAL STATEMENTS (Unaudited) (continued) |
12. Offsetting
In the normal course of business, the Funds may have entered in transactions subject to enforceable master netting arrangements or other similar arrangements. Generally, the right to offset in those agreements allows the funds to counteract the exposure to a specific counterparty with collateral received or delivered to that counterparty based on the terms of the arrangements. These arrangements provide for the right to liquidate upon the occurrence of an event of default, credit event upon merger or additional termination event.
The following tables present derivative financial instruments and secured financing transactions that are subject to enforceable netting arrangements and offset in the Statements of Assets and Liabilities in conformity with U.S. GAAP.
| | | | | | | | | | | | | | Gross Amounts Not Offset | | | | |
| | | | | | | | | | | | | | in the Statement of Assets | | | | |
| | | | | | | | | | | Net Amount of Assets | | | and Liabilities | | | | |
| | | | | | | | Gross Amounts Offset | | | Presented on the | | | | | | Cash | | | | |
| | | | | Gross Amounts of | | | in the Statement of | | | Statement of Assets | | | Financial | | | Collateral | | | Net | |
| Fund | | Instrument1 | | Recognized Assets | | | Assets and Liabilities | | | and Liabilities | | | Instrument | | | Received2 | | | Amount | |
| Managed Futures Strategy Fund | | Futures Equity Contracts | | $ | 1,347,971 | | | $ | — | | | $ | 1,347,971 | | | $ | — | | | $ | — | | | $ | 1,347,971 | |
| | | Futures Currency Contracts | | | 3,820,902 | | | | — | | | | 3,820,902 | | | | — | | | | — | | | | 3,820,902 | |
| | | Futures Interest Rate Contracts | | | 4,679,345 | | | | — | | | | 4,679,345 | | | | — | | | | — | | | | 4,679,345 | |
| | | Futures Commodity Contracts | | | 4,949,023 | | | | — | | | | 4,949,023 | | | | — | | | | — | | | | 4,949,023 | |
| | | Options Purchased Equity Contracts | | | 4,146,938 | | | | — | | | | 4,146,938 | | | | — | | | | — | | | | 4,146,938 | |
| | | Repurchase agreements | | | 53,349,853 | | | | — | | | | 53,349,853 | | | | — | | | | 53,349,853 | | | | — | |
| | | Securities lending | | | 4,712,780 | | | | — | | | | 4,712,780 | | | | — | | | | 4,712,780 | | | | — | |
| Total | | | | $ | 77,006,812 | | | $ | — | | | $ | 77,006,812 | | | $ | — | | | $ | 58,062,633 | | | $ | 18,944,179 | |
| | | | | | | | | | | | | | Gross Amounts Not Offset | | | | |
| | | | | | | | | | | | | | in the Statement of Assets | | | | |
| | | | | | | | | | | Net Amount of | | | and Liabilities | | | | |
| | | | | | | | Gross Amounts Offset | | | Liabilities Presented | | | | | | Cash | | | | |
| | | | | Gross Amounts of | | | in the Statement of | | | on the Statement of | | | Financial | | | Collateral | | | Net | |
| Fund | | Instrument1 | | Recognized Liabilities | | | Assets and Liabilities | | | Assets and Liabilities | | | Instrument | | | Pledged2 | | | Amount | |
| Managed Futures Strategy Fund | | Futures Equity Contracts | | $ | 2,890,743 | | | $ | — | | | $ | 2,890,743 | | | $ | — | | | $ | — | | | $ | 2,890,743 | |
| | | Futures Currency Contracts | | | 817,681 | | | | — | | | | 817,681 | | | | — | | | | — | | | | 817,681 | |
| | | Futures Interest Rate Contracts | | | 1,222,022 | | | | — | | | | 1,222,022 | | | | — | | | | — | | | | 1,222,022 | |
| | | Futures Commodity Contracts | | | 2,983,054 | | | | — | | | | 2,983,054 | | | | — | | | | — | | | | 2,983,054 | |
| | | Securities lending | | | 4,846,400 | | | | — | | | | 4,846,400 | | | | — | | | | 4,846,400 | | | | — | |
| Total | | | | $ | 12,759,900 | | | $ | — | | | $ | 12,759,900 | | | $ | — | | | $ | 4,846,400 | | | $ | 7,913,500 | |
| 1 | Refer to notes 5 and 10 for additional information regarding repurchase agreements and securities lending arrangements, respectively. |
| 2 | Excludes maintenance margin deposits held at the broker related to derivatives. These amounts are reflected as Segregated cash with broker on the Statement of Assets and Liabilities. |
| THE GUGGENHEIM FUNDS SEMI - ANNUAL REPORT | 25 |
| OTHER INFORMATION (Unaudited) |
Proxy Voting Information
A description of the policies and procedures that the Trust uses to determine how to vote proxies relating to securities held in the Funds’ portfolios is available, without charge and upon request, by calling 1.800.820.0888. This information is also available from the EDGAR database on the SEC’s website at http://www.sec.gov.
Information regarding how the Funds voted proxies relating to portfolio securities during the most recent 12-month period ended June 30 is available without charge, upon request, by calling 1.800.820.0888. This information is also available from the EDGAR database on the SEC’s website at http://www.sec.gov.
Quarterly Portfolio Schedules Information
The Trust files its complete schedule of portfolio holdings with the SEC for the first and third quarters of each fiscal year on Form N-Q; which are available on the SEC’s website at http://www.sec.gov. The Funds’ Forms N-Q may be reviewed and copied at the SEC’s Public Reference Room in Washington, DC, and that information on the operation of the Public Reference Room may be obtained by calling 1-800-SEC-0330. Copies of the portfolio holdings are also available to shareholders, without charge and upon request, by calling 1.800.820.0888.
Office Locations
The offices of Guggenheim Investments can be found in the following locations:
40 East 52nd Street
16th Floor
New York, NY 10022
(Headquarters)
Four Irvington Centre
805 King Farm Boulevard
Suite 600
Rockville, MD 20850
9401 Indian Creek Parkway
40 Corporate Woods
Suite 850
Overland Park, KS 66210
Distributor Name Change
Effective January 1, 2013, Rydex Distributors, LLC changed its name to Guggenheim Distributors, LLC. The name change marks another step in the business integration process following the acquisition of Rydex by Guggenheim announced last year. The name change did not result in any material change to the day-to-day management or operations of the funds.
Board Considerations in Approving the Investment Advisory Agreements
At an in-person meetings of the Rydex Series Funds’ (the “Trust”) Board of Trustees (the “Board”) held on May 16 and June 5, 2013 (collectively, the “Meetings”), called for the purpose of, among other things, consideration of, and voting on, the approval and continuation of the investment advisory agreement applicable to the series of the Trust (each a “Fund” and collectively, the “Funds”), the Board, including the Trustees who are not “interested persons,” as defined by the Investment Company Act of 1940, of the Trust (“Independent Trustees”), unanimously approved the continuation of the investment advisory agreement (the “Investment Advisory Agreement”) between the Trust and Security Investors, LLC (referred to herein as the “Adviser”) with respect to each of the Funds for an additional one-year period, based on the Board’s review of qualitative and quantitative information provided by the Adviser.
In reaching the conclusion to approve the continuation of the Investment Advisory Agreement, the Independent Trustees requested and obtained from the Adviser such information as the Independent Trustees deemed reasonably necessary to evaluate the Investment Advisory Agreement. The Independent Trustees carefully evaluated this information and were advised by independent legal counsel with respect to their deliberations. In addition, the Board also received a memorandum from Fund counsel regarding the responsibilities of the Board for the
| 26 | THE GUGGENHEIM FUNDS SEMI - ANNUAL REPORT |
| OTHER INFORMATION (Unaudited) (continued) |
approval of investment advisory agreements, and the Independent Trustees met in executive session outside the presence of Fund management, and participated in question and answer sessions with representatives of the Adviser.
In considering the continuation of the Investment Advisory Agreement, the Board determined that the agreement would enable shareholders of the Funds to continue to obtain high quality services at a cost that was appropriate, reasonable, and in the best interests of their shareholders. The Board, including the Independent Trustees, unanimously approved the continuation of the existing Investment Advisory Agreement. In reaching their decision, the Trustees carefully considered information that they had received throughout the year as part of their regular oversight of the Funds, including, in particular, information from the Adviser that the Board had received relating to Investment Advisory Agreement at the Meetings. The Trustees noted that, at the Meetings, they had obtained and reviewed a wide variety of information, including certain comparative information regarding performance of the Funds relative to performance of other comparable funds.
As a part of their consideration of the approval of the Investment Advisory Agreement at the Meetings, the Trustees, including the Independent Trustees, had evaluated a number of considerations, including among others: (a) the nature and quality of the Adviser’s investment advisory and other services; (b) the Adviser’s investment management personnel; (c) the Adviser’s operations and financial condition; (d) the Adviser’s brokerage practices (including any soft dollar arrangements) and investment strategies; (e) the level of the fees that the Adviser charges compared with the fees charged to comparable funds or accounts, giving special attention to the absence of breakpoints in these fees and the rationale provide by the Advisor as to why the addition of breakpoints was not currently appropriate; (f) each Fund’s overall fees and operating expenses compared with similar funds; (g) the level of the Adviser’s profitability from its Fund-related operations; (h) the Adviser’s compliance systems; (i) the Adviser’s policies and compliance procedures applicable to personal securities transactions; (j) the Adviser’s reputation, expertise and resources in the financial markets; and (k) Fund performance compared with similar funds. In its deliberations, the Board did not identify any single piece of information that was all-important or controlling. Based on the Board’s deliberations at the Meetings, the Board, including all of the Independent Trustees, unanimously: (a) concluded that terms of the Investment Advisory Agreement are fair and reasonable; (b) concluded that the Adviser’s fees were reasonable in light of the services that it provides to the Funds; and (c) agreed to approve and continue the Investment Advisory Agreement based upon the following considerations, among others:
| • | Nature, Extent and Quality of Services Provided by the Adviser. At the Meetings, the Board reviewed the scope of services to be provided by the Adviser under the Investment Advisory Agreement and noted that there would be no significant differences between the scope of services required to be provided by the Adviser for the past year and the scope of services required to be provided during the upcoming year. The Trustees also considered the Adviser’s representations to the Board that the Adviser would continue to provide investment and related services that were of materially the same quality and quantity as services provided to the Funds in the past, and that these services are appropriate in scope and extent in light of the Funds’ operations, the competitive landscape of the investment company business and investor needs. |
| • | Fund Expenses and Performance of the Funds and the Adviser. At the Meetings, the Board reviewed statistical information provided by the Adviser regarding the expense ratio components and performance of each Fund. The Adviser engaged FUSE Research Network LLC (“FUSE”), an independent, third party research provider, to prepare advisory contract renewal reports to help the Board fulfill its advisory contract renewal responsibilities. The objective of the reports is to present the subject Funds’ relative position regarding fees, expenses and total return performance, with peer group and universe comparisons. This statistical information related to the expense ratio components included actual advisory fees, waivers/reimbursements, and gross and net total expenses for each Fund in comparison to other funds determined by FUSE to comprise each Fund’s applicable peer group. The Board also considered the Adviser’s representation that it found the peer groups compiled by FUSE to be appropriate. The statistical information related to the performance of each Fund included three month and one, three, and five year performance for the Fund compared to its peers. |
| • | Costs of Services Provided to the Funds and Profits Realized by the Adviser and its Affiliates. At the Meetings, the Board had reviewed information about the profitability of the Funds to the Adviser based on the advisory fees payable under the current Investment Advisory Agreement for the last calendar year. At the Meetings, the Board also analyzed the Funds’ expenses, including the investment advisory fees paid to the Adviser, and reviewed reports comparing the expense ratios of the Funds to those of other comparable funds. The Board also reviewed information regarding the direct revenue received by the Advisor and ancillary revenue received by the Advisor and/or its affiliates in connection with the services provided to the Funds by the Advisor and/or its affiliates. The Board also discussed the Advisor’s profit margin as reflected in the Adviser’s profitability analysis. |
| THE GUGGENHEIM FUNDS SEMI - ANNUAL REPORT | 27 |
| OTHER INFORMATION (Unaudited) (concluded) |
| • | Economies of Scale. In connection with its review of the Funds’ profitability analysis at the Meetings, the Board reviewed information regarding economies of scale or other efficiencies that may result from increases in the Funds’ asset levels. The Trustees noted that the fees would not change due to breakpoints under the current Investment Advisory Agreement, and that no additional economies of scale would be directly realized as a result of increases in the asset levels of the Funds. In light of the relatively small size of many of the Funds and the fact that the size of individual Funds in the complex increases and decreases significantly from time to time due to unlimited trading that is permitted among most of the Funds in the complex, the Board concluded that economies of scale were not likely to be directly realized as a result of increases in the asset levels of the individual Funds, and accordingly, fee breakpoints were not currently appropriate for the Funds. |
| • | Other Benefits to the Adviser and/or its Affiliates. In addition to evaluating the services provided by the Adviser, the Board had considered the nature, extent, quality and cost of the administrative, distribution, and shareholder services performed by the Adviser’s affiliates under separate agreements at the Meetings. The Board noted that the Adviser reports portfolio transactions on behalf of the Funds placed through an affiliate of the Funds or the Adviser at each quarterly Board meeting. |
On the basis of the information provided to it and its evaluation of that information, the Board, including the Independent Trustees, concluded that the terms of the Investment Advisory Agreement for the Funds were reasonable, and that approval of the Investment Advisory Agreement was in the best interests of the Funds.
| 28 | THE GUGGENHEIM FUNDS SEMI - ANNUAL REPORT |
| INFORMATION ON BOARD OF TRUSTEES AND OFFICERS (Unaudited) |
A Board of Trustees oversees the Trust, as well as other trusts of GI, in which its members have no stated term of service, and continue to serve after election until resignation. The Statement of Additional Information includes further information about Fund Trustees and Officers, and can be obtained without charge by calling 800.820.0888.
All Trustees and Officers may be reached c/o Guggenheim Investments, 805 King Farm Boulevard, Suite 600, Rockville, MD 20850.
TRUSTEE AND OFFICER
| Name and | | Length of Service as Trustee | | Number of Funds |
| Year of Birth | | (Year Began) | | Overseen |
| | | | | |
| Donald C. Cacciapaglia* | | Rydex Series Funds – 2012 | | 136 |
| (1951) | | Rydex Variable Trust – 2012 | | |
| | | Rydex Dynamic Funds – 2012 | | |
| | | Rydex ETF Trust – 2012 | | |
Principal Occupations During Past Five Years: Current: Security Investors, LLC: President and CEO from April 2012 to present; Guggenheim Investments: President and Chief Administrative Officer from February 2010 to present; Previous: Channel Capital Group, Inc.: Chairman and CEO from April 2002 to February 2010
Positions held within the Trust: Trustee from 2012 to present; President from 2012 to present
INDEPENDENT TRUSTEES
| Name and | | Length of Service as Trustee | | Number of Funds |
| Year of Birth | | (Year Began) | | Overseen |
| | | | | |
| Corey A. Colehour | | Rydex Series Funds – 1993 | | 136 |
| (1945) | | Rydex Variable Trust – 1998 | | |
| | | Rydex Dynamic Funds – 1999 | | |
| | | Rydex ETF Trust – 2003 | | |
Principal Occupations During Past Five Years: Current: Retired; Previous: President and Senior Vice President of Schield Management Company (registered investment adviser) from 2003 to 2006
Positions held within the Trust: Trustee from 1993 to present; Member of the Audit and Governance and Nominating Committees from 1995 to present
| | | | | |
| J. Kenneth Dalton | | Rydex Series Funds – 1995 | | 136 |
| (1941) | | Rydex Variable Trust – 1998 | | |
| | | Rydex Dynamic Funds – 1999 | | |
| | | Rydex ETF Trust – 2003 | | |
Principal Occupations During Past Five Years: Current: Retired
Positions held within the Trust: Trustee from 1995 to present; Member and Chairman of the Audit Committee from 1997 to present; Member of the Governance and Nominating Committees from 1995 to present; and Member of the Risk Oversight Committee from 2010 to present
| | | | | |
| John O. Demaret | | Rydex Series Funds – 1997 | | 136 |
| (1940) | | Rydex Variable Trust – 1998 | | |
| | | Rydex Dynamic Funds – 1999 | | |
| | | Rydex ETF Trust – 2003 | | |
Principal Occupations During Past Five Years: Current: Retired
Positions held within the Trust: Trustee from 1997 to present; Chairman of the Board from 2006 to present; Member of the Audit Committee from 1997 to present; and Member of the Risk Oversight Committee from 2010 to present
| the GUGGENHEIM FUNDS SEMI-annual report | 29 |
| INFORMATION ON BOARD OF TRUSTEES AND OFFICERS (Unaudited) (continued) |
INDEPENDENT TRUSTEES - concluded
| Name and | | Length of Service as Trustee | | Number of Funds |
| Year of Birth | | (Year Began) | | Overseen |
| | | | | |
| Werner E. Keller | | Rydex Series Funds – 2005 | | 136 |
| (1940) | | Rydex Variable Trust – 2005 | | |
| | | Rydex Dynamic Funds – 2005 | | |
| | | Rydex ETF Trust – 2005 | | |
Principal Occupations During Past Five Years: Current: Founder and President of Keller Partners, LLC (investment research firm) from 2005 to present; Previous: Retired from 2001 to 2005
Positions held within the Trust: Vice Chairman of the Board of Trustees from 2010 to present; Trustee and Member of the Audit and Governance and Nominating Committees from 2005 to present; and Chairman and Member of the Risk Oversight Committee from 2010 to present
| | | | | |
| Thomas F. Lydon, Jr. | | Rydex Series Funds – 2005 | | 136 |
| (1960) | | Rydex Variable Trust – 2005 | | |
| | | Rydex Dynamic Funds – 2005 | | |
| | | Rydex ETF Trust – 2005 | | |
Principal Occupations During Past Five Years: Current: President of Global Trends Investments (registered investment adviser) from 1996 to present
Positions held within the Trust: Trustee and Member of the Audit and Governance and Nominating Committees from 2005 to present
| | | | | |
| Patrick T. McCarville | | Rydex Series Funds – 1997 | | 136 |
| (1942) | | Rydex Variable Trust – 1998 | | |
| | | Rydex Dynamic Funds – 1999 | | |
| | | Rydex ETF Trust – 2003 | | |
Principal Occupations During Past Five Years: Current: Retired; Previous: Chief Executive Officer of Par Industries, Inc., d/b/a Par Leasing from 1977 to 2010
Positions held within the Trust: Trustee from 1997 to present; Member of the Audit Committee from 1997 to present; and Chairman of the Governance and Nominating Committees from 1997 to present
| | | | | |
| Roger Somers | | Rydex Series Funds – 1993 | | 136 |
| (1944) | | Rydex Variable Trust – 1998 | | |
| | | Rydex Dynamic Funds – 1999 | | |
| | | Rydex ETF Trust – 2003 | | |
Principal Occupations During Past Five Years: Current: Founder and Chief Executive Officer of Arrow Limousine from 1965 to present
Positions held within the Trust: Trustee from 1993 to present; Member of the Audit and Governance and Nominating Committees from 1995 to present
| 30 | the GUGGENHEIM FUNDS SEMI-annual report |
| INFORMATION ON BOARD OF TRUSTEES AND OFFICERS (Unaudited) (concluded) |
EXECUTIVE OFFICERS
| Name, Position and | | | Principal Occupations | |
| Year of Birth | | | During Past Five Years | |
| | | |
Michael P. Byrum* Vice President (1970) | | Current: President, Security Benefit Asset Management Holdings, LLC; Senior Vice President, Security Investors, LLC; President & Chief Investment Officer, Rydex Holdings, LLC; Director & Chairman of the Board, Advisor Research Center, Inc.; and Manager, Rydex Specialized Products, LLC |
| | | |
| | | Previous: Guggenheim Distributors, LLC (f/k/a Rydex Distributors, LLC), Vice President (2009); Rydex Fund Services, LLC, Director (2009–2010), Secretary (2002–2010), Executive Vice President (2002–2006); Rydex Advisors, LLC (f/k/a PADCO Advisors, Inc.), Director (2008–2010), Chief Investment Officer (2006–2010), President (2004–2010), Secretary (2002–2010); Rydex Advisors II, LLC (f/k/a PADCO Advisors II, Inc.), Director (2008–2010), Chief Investment Officer (2006–2010), President (2004–2010), Secretary (2002–2010); Rydex Capital Partners, LLC, President & Secretary (2003–2007); Rydex Capital Partners II, LLC, (2003–2007); Rydex Holdings, LLC (f/k/a Rydex Holdings, Inc.), Secretary (2005–2008), Executive Vice President (2005–2006); Advisor Research Center, Inc., Secretary (2006–2009), Executive Vice President (2006); and Rydex Specialized Products, LLC, Secretary (2005–2008) |
| | | |
Nikolaos Bonos* Vice President and Treasurer (1963) | | Current: Senior Vice President, Security Investors, LLC; Chief Executive Officer & Manager, Rydex Specialized Products, LLC; Chief Executive Officer & President, Rydex Fund Services, LLC; Vice President, Rydex Holdings, LLC; Treasurer, SBL Fund; Security Equity Fund; Security Income Fund; Security Large Cap Value Fund & Security Mid Cap Growth Fund; and Vice President, Security Benefit Asset Management Holdings, LLC |
| | | |
| | | Previous: Security Global Investors, LLC, Senior Vice President (2010–2011); Rydex Advisors, LLC (f/k/a PADCO Advisors, Inc.) Senior Vice President (2006–2011); Rydex Fund Services, LLC (f/k/a Rydex Fund Services, Inc.), Director (2009) & Senior Vice President (2003–2006); and Rydex Specialized Products, LLC, Chief Financial Officer (2005–2009) |
| | | |
Elisabeth Miller* Chief Compliance Officer (1968) | | Current: Chief Compliance Officer, Rydex Series Funds, Rydex Dynamic Funds, Rydex Variable Trust, Rydex ETF Trust, Security Equity Fund, Security Income Fund, Security Large Cap Value Fund, Security Mid Cap Growth Fund, SBL Fund, Security Investors, LLC, and Guggenheim Distributors, LLC |
| | | |
| | | Previous: Senior Manager, Security Investors, LLC and Guggenheim Distributors, LLC (2004–2009) |
| | | |
Amy J. Lee* Vice President and Secretary (1961) | | Current: Managing Director, Guggenheim Investments; Senior Vice President & Secretary, Security Investors, LLC; Secretary & Vice President, Rydex ETF Trust, Rydex Dynamic Funds, Rydex Variable Trust, SBL Fund, Security Equity Fund, Security Income Fund, Security Large Cap Value Fund and Security Mid Cap Growth Fund; Vice President & Secretary, Rydex Holdings, LLC; Secretary, Advisor Research Center, Inc., Guggenheim Specialized Products, LLC, Guggenheim Distributors, LLC and Rydex Fund Services, LLC |
| | | |
| | | Previous: Vice President, Associate General Counsel & Assistant Secretary, Security Benefit Life Insurance Company and Security Benefit Corporation (1987–2012); Security Global Investors, LLC, Senior Vice President & Secretary (2007–2011); Rydex Advisors, LLC (f/k/a PADCO Advisors, Inc.) & Rydex Advisors II, LLC (f/k/a PADCO Advisors II, Inc.), Senior Vice President & Secretary (2010–2011) |
| | | |
Joseph M. Arruda*
Assistant Treasurer (1966) | | Current: Assistant Treasurer, SBL Fund; Security Equity Fund; Security Income Fund; Security Large Cap Value Fund & Security Mid Cap Growth Fund; Vice President, Security Investors, LLC; and Chief Financial Officer & Manager, Rydex Specialized Products, LLC |
| | | |
| | | Previous: Security Global Investors, LLC, Vice President (2010–2011); and Rydex Advisors, LLC (f/k/a PADCO Advisors, Inc.) & Rydex Advisors II, LLC (f/k/a PADCO Advisors II, Inc.), Vice President (2004–2011) |
| * | Officers of the Funds are deemed to be “interested persons” of the Trust, within the meaning of Section 2(a)(19) of the 1940 Act, inasmuch as this person is affiliated with Guggenheim Investments. |
| the GUGGENHEIM FUNDS SEMI-annual reporT | 31 |
| GUGGENHEIM INVESTMENTS PRIVACY POLICIES |
Rydex Funds, Guggenheim Funds, Rydex Investments, Guggenheim Distributors, LLC, Security Investors, LLC, Security Distributors, Inc. and Rydex Advisory Services (Collectively “Guggenheim Investments”).
Our Commitment to You
When you become a Guggenheim Investments investor, you entrust us with not only your hard-earned money but also with personal and financial information about you. We recognize that your relationship with us is based on trust and that you expect us to act responsibly and in your best interests. Because we have access to this private information about you, we hold ourselves to the highest standards in its safekeeping and use. This means, most importantly, that we do not sell client information to anyone—whether it is your personal information or if you are a current or former Guggenheim Investments client.
The Information We Collect About You
In the course of doing business with shareholders and investors, we collect nonpublic personal information about you. You typically provide personal information when you complete a Guggenheim Investments account application or when you request a transaction that involves Rydex and Guggenheim Investments funds or one of the Guggenheim Investments affiliated companies. “Nonpublic personal information” is personally identifiable private information about you. For example, it includes information regarding your name and address, Social Security or taxpayer identification number, assets, income, account balance, bank account information and investment activity (e.g., purchase and redemption history).
How We Handle Your Personal Information
As emphasized above, we do not sell information about current or former clients or their accounts to third parties. Nor do we share such information, except when necessary to complete transactions at your request or to make you aware of related investment products and services that we offer. Additional details about how we handle your personal information are provided below. To complete certain transactions or account changes that you direct, it may be necessary to provide identifying information to companies, individuals or groups that are not affiliated with Guggenheim Investments. For example, if you ask to transfer assets from another financial institution to Guggenheim Investments, we will need to provide certain information about you to that company to complete the transaction. To alert you to other Guggenheim Investments investment products and services, we may share your information within the Guggenheim Investments family of affiliated companies. This would include, for example, sharing your information within Guggenheim Investments so we can make you aware of new Rydex and Guggenheim Investments funds or the services offered through another Guggenheim Investments affiliated company. In certain instances, we may contract with nonaffiliated companies to perform services for us. Where necessary, we will disclose information we have about you to these third parties. In all such cases, we provide the third party with only the information necessary to carry out its assigned responsibilities and only for that purpose. And we require these third parties to treat your private information with the same high degree of confidentiality that we do. In certain instances, we may share information with other financial institutions regarding individuals and entities in response to the U.S.A. Patriot Act. Finally, we will release information about you if you direct us to do so, if we are compelled by law to do so or in other circumstances permitted by law.
Opt Out Provisions
We do not sell your personal information to anyone. The law allows you to “opt out” of only certain kinds of information sharing with third parties. The firm does not share personal information about you with any third parties that triggers this opt-out right. This means YOU ARE ALREADY OPTED OUT.
How We Protect Privacy Online
Our concern for the privacy of our shareholders also extends to those who use our web site, guggenheiminvestments.com. Our web site uses some of the most secure forms of online communication available, including encryption technology, Secure Socket Layer (SSL) protocol, firewalls and user names and passwords. These technologies provide a high level of security and privacy when you access your account information or initiate online transactions. The Guggenheim Investments web site offers customized features that require our use of “http cookies”—tiny pieces of information that we ask your browser to store. However, we make very limited use of these cookies. We only use cookies for session management and security features on the Guggenheim Investments web site. We do not use them to pull data from your hard drive, to learn your email address, or to view data in cookies created by other web sites. We will not share the information in our cookies or give others access to it. See the legal information area on our web site for more details about web site security and privacy features.
| 32 | The Guggenheim Funds SEMI-annual REPORT |
| GUGGENHEIM INVESTMENTS PRIVACY Policies (concluded) |
How We Safeguard Your Personal Information
We restrict access to nonpublic personal information about shareholders to our employees and in some cases to third parties (for example, the service providers described above) as permitted by law. We maintain strict physical, electronic and procedural safeguards that comply with federal standards to guard your nonpublic personal information.
We’ll Keep You Informed
As required by federal law, we will notify shareholders of our privacy policy annually. We reserve the right to modify this policy at any time, but rest assured that if we do change it, we will tell you promptly. You will also be able to access our privacy policy from our web site at guggenheiminvestments.com. Should you have any questions regarding our privacy policy, contact us at 800.820.0888 or 301.296.5100.
| the Guggenheim Funds SEMI-annual REPORT | 33 |
This page intentionally left blank.
This page intentionally left blank.
This page intentionally left blank.
This page intentionally left blank.

GUGGENHEIM ALTERNATIVE INVESTMENT FUNDS
GUGGENHEIM MANAGED COMMODITIES STRATEGY FUND
(Formerly, Long/Short Commodities Strategy Fund)
GUGGENHEIM MULTI-HEDGE STRATEGIES FUND
RYDEX SPECIALTY FUND
RYDEX COMMODITIES STRATEGY FUND
RDXSGIALT-SEMI-0613x1213
GO GREEN!
ELIMINATE MAILBOX CLUTTER
Go Paperless with Guggenheim Investments eDelivery —a service giving you full online access to a account information and documents. Save time, cut down on mailbox clutter and be a friend to the environment with eDelivery.
With Guggenheim Investments eDelivery you can:
| · | View online confirmations and statements at your convenience. |
| · | Receive email notifations when your most recent confirmations, statements and other account documents are available for review. |
| · | Access prospectuses, annual reports and semiannual reports online. |

If you have questions about Guggenheim Investments eDelivery services, contact one of our Shareholder Service Representatives at 800.820.0888.

This report and the financial statements contained herein are submitted for the general information of our shareholders. The report is not authorized for distribution to prospective investors unless preceded or accompanied by an effective prospectus.
Distributed by Guggenheim Distributors, LLC.
| the GUGGENHEIM FUNDS SEMI-ANNUAL REPORT | 1 |
Dear Shareholder:
Security Investors, LLC (the “Investment Adviser”) is pleased to present the semi-annual shareholder report for one or more of our Funds (the “Funds”) for the period ended June 30, 2013.
The Investment Adviser is part of Guggenheim Investments, which represents the investment management businesses of Guggenheim Partners, LLC, a global, diversified financial services firm.
Guggenheim Distributors, LLC is the distributor of the Funds. Guggenheim Distributors, LLC is affiliated with Guggenheim Partners, LLC and Security Investors, LLC.
We encourage you to read the Economic and Market Overview section of the report, which follows this letter, and then the Fund Profile for each Fund.
We are committed to providing innovative investment solutions and appreciate the trust you place in us.
Sincerely,

Donald C. Cacciapaglia
President
July 31, 2013
Read each Fund’s prospectus and summary prospectus (if available) carefully before investing. It contains the Fund’s investment objectives, risks, charges, expenses and other information, which should be considered carefully before investing. Obtain a prospectus and summary prospectus (if available) at guggenheiminvestments.com or call 800.820.0888.
The Funds may not be suitable for all investors. Investing involves risks, including the entire loss of principal amount invested. Certain Funds may be affected by risks that include those associated with sector concentration, international investing, investing in small and/or medium size companies, and/or the Funds’ possible use of investment techniques and strategies such as leverage, derivatives and short sales of securities. Please see each Fund’s prospectus for more information.
| 2 | the GUGGENHEIM FUNDS SEMI-ANNUAL REPORT |
| Economic and Market overview (Unaudited) | June 30, 2013 |
Monetary accommodation from the world’s central banks and continued improvement in the U.S. housing and labor markets benefited the overall U.S. economy for the six month period ended June 30, 2013. However, speculation about the end of quantitative easing in May and June, along with growing fundamental risk in Japan and China, led to a selloff in fixed income and equity markets. For most of the period, equity markets were strong and abundant liquidity and steady quantitative easing had produced a benign credit environment with low default rates.
Housing was the primary locomotive of U.S. economic growth in the period. Housing-related activity, including private residential investment, personal expenditures on household durable goods and utilities, as well as the wealth effect on consumption from home price appreciation, has contributed positively to GDP since 1Q2011. However, housing’s contribution remains dependent on the maintenance of extremely low mortgage rates, which have recently begun moving higher.
Overshadowing solid job gains in the period was slow improvement in the unemployment rate. The participation rate has been relatively flat over the past six months, and in general, has been declining. A bright spot has been the private sector, where the U.S. economy is currently adding jobs at a rate that is over 20% higher than that of the prior expansion.
A number of global central banks implemented interest rate cuts during the period, owing to sluggish global economic growth and continuing weakness in commodity prices. The world is still in a deflationary environment, which has given policymakers a great deal of leeway to extend and expand accommodative monetary policies aimed at stimulating output.
The rise in volatility late in the period was in large part a result of shifting market sentiment, but, fundamentally, economic growth in the U.S. has not changed materially, although the impact of rising rates on housing has yet to be seen. With ongoing weakness in growth and inflation, global central banks are expected to maintain accommodative policies for the foreseeable future.
For the six-month period ended June 30, 2013, the return of the Standard & Poor’s 500® (“S&P 500”) Index* was 13.82%, and in mid-May reached an all-time high.
The Barclays U.S. Aggregate Bond Index* returned -2.44% for the period, while the Barclays U.S. High Yield Index* returned 1.42%.
The Bank of America Merrill Lynch 3-Month U.S. Treasury Bill Index* returned 0.04%.
The Morgan Stanley Capital International (“MSCI”) Europe-Australasia-Far East (“EAFE”) Index* returned 4.10%. The MSCI Emerging Markets Index* return was -9.57%.
The opinions and forecasts expressed may not actually come to pass. This information is subject to change at any time, based on market and other conditions, and should not be construed as a recommendation of any specific security or strategy.
*Index Definitions:
The following indices are referenced throughout this report. Indices are unmanaged and not available for direct investment. Index performance does not reflect transaction costs, fees, or expenses.
Bank of America Merrill Lynch 3-Month U.S. Treasury Bill Index is an unmanaged market index of U.S. Treasury securities maturing in 90 days that assumes reinvestment of all income.
Barclays U.S. Aggregate Bond Index is a broad-based benchmark that measures the investment grade, U.S. dollar denominated, fixed-rate taxable bond market, including U.S. Treasuries, government-related and corporate securities, MBS (agency fixed-rate and hybrid ARM pass-throughs), ABS, and CMBS.
Barclays U.S. High Yield Index measures the market of USD-denominated, non-investment grade, fixed-rate, taxable corporate bonds. Securities are classified as high yield if the middle rating of Moody’s, Fitch, and S&P is Ba1/BB+/BB+ or below.
MSCI EAFE Index is a free float-adjusted market capitalization index that is designed to measure the equity market performance of developed markets, excluding the U.S. & Canada.
MSCI Emerging Markets Index is a free float-adjusted market capitalization weighted index that is designed to measure equity market performance in the global emerging markets.
S&P 500® Index is a capitalization-weighted index of 500 stocks designed to measure the performance of the broad economy, representing all major industries and is considered a representation of the U.S. stock market.
| the GUGGENHEIM FUNDS SEMI-ANNUAL REPORT | 3 |
| ABOUT SHAREHOLDERS’ FUND EXPENSES (Unaudited) |
All mutual funds have operating expenses and it is important for our shareholders to understand the impact of costs on their investments. Shareholders of a Fund incur two types of costs: (i) transaction costs, including sales charges (loads) on purchase payments, reinvested dividends, or other distributions; and exchange fees; and (ii) ongoing costs, including management fees, administrative services, and shareholder reports, among others. These ongoing costs, or operating expenses, are deducted from a fund’s gross income and reduce the investment return of the fund.
A fund’s expenses are expressed as a percentage of its average net assets, which is known as the expense ratio. The following examples are intended to help investors understand the ongoing costs (in dollars) of investing in a Fund and to compare these costs with the ongoing costs of investing in other mutual funds.
The examples are based on an investment of $1,000 made at the beginning of the period and held for the entire six-month period beginning December 31, 2012 and ending June 30, 2013.
The following tables illustrate a Fund’s costs in two ways:
Table 1. Based on actual Fund return. This section helps investors estimate the actual expenses paid over the period. The “Ending Account Value” shown is derived from the Fund’s actual return, and the fourth column shows the dollar amount that would have been paid by an investor who started with $1,000 in the Fund. Investors may use the information here, together with the amount invested, to estimate the expenses paid over the period. Simply divide the Fund’s account value by $1,000 (for example, an $8,600 account value divided by $1,000 = 8.6), then multiply the result by the number provided under the heading “Expenses Paid During Period.”
Table 2. Based on hypothetical 5% return. This section is intended to help investors compare a Fund’s cost with those of other mutual funds. The table provides information about hypothetical account values and hypothetical expenses based on the Fund’s actual expense ratio and an assumed rate of return of 5% per year before expenses, which is not the Fund’s actual return. The hypothetical account values and expenses may not be used to estimate the actual ending account balance or expenses paid during the period. The example is useful in making comparisons because the U.S. Securities and Exchange Commission (the “SEC”) requires all mutual funds to calculate expenses based on the 5% return. Investors can assess a Fund’s costs by comparing this hypothetical example with the hypothetical examples that appear in shareholder reports of other funds.
The calculations illustrated above assume no shares were bought or sold during the period. Actual costs may have been higher or lower, depending on the amount of investment and the timing of any purchases or redemptions.
Please note that the expenses shown in the table are meant to highlight your ongoing costs only and do not reflect any transactional costs, such as sales charges (loads) on purchase payments, and contingent deferred sales charges (“CDSC”) on redemptions, if any. Therefore, the second table is useful in comparing ongoing costs only, and will not help you determine the relative total costs of owning different funds. In addition, if these transactional costs were included, your costs would have been higher.
More information about a Fund’s expenses, including annual expense ratios for the past five years, can be found in the Financial Highlights section of this report. For additional information on operating expenses and other shareholder costs, please refer to the appropriate Fund prospectus.
| 4 | the GUGGENHEIM FUNDS SEMI-ANNUAL REPORT |
| ABOUT SHAREHOLDERS’ FUND EXPENSES (Unaudited) (concluded) |
| | | | | | | | | Beginning | | | Ending | | | Expenses | |
| | | Expense | | | Fund | | | Account Value | | | Account Value | | | Paid During | |
| | | Ratio1 | | | Return | | | December 31, 2012 | | | June 30, 2013 | | | Period2 | |
| Table 1. Based on actual Fund return3 | | | | | | | | | | | | | | | | | | | | |
| Managed Commodities Strategy Fund | | | | | | | | | | | | | | | | | | | | |
| A-Class | | | 1.87 | % | | | (19.34 | %) | | $ | 1,000.00 | | | $ | 806.60 | | | $ | 8.38 | |
| C-Class | | | 2.62 | % | | | (19.60 | %) | | | 1,000.00 | | | | 804.00 | | | | 11.72 | |
| H-Class | | | 1.88 | % | | | (19.34 | %) | | | 1,000.00 | | | | 806.60 | | | | 8.42 | |
| Institutional Class | | | 1.65 | % | | | (19.22 | %) | | | 1,000.00 | | | | 807.80 | | | | 7.40 | |
| Y-Class | | | 1.54 | % | | | (19.24 | %) | | | 1,000.00 | | | | 807.60 | | | | 6.90 | |
| Multi-Hedge Strategies Fund | | | | | | | | | | | | | | | | | | | | |
| A-Class | | | 2.56 | % | | | 1.98 | % | | | 1,000.00 | | | | 1,019.80 | | | | 12.82 | |
| C-Class | | | 3.33 | % | | | 1.63 | % | | | 1,000.00 | | | | 1,016.30 | | | | 16.65 | |
| H-Class | | | 2.58 | % | | | 1.98 | % | | | 1,000.00 | | | | 1,019.80 | | | | 12.92 | |
| Institutional Class | | | 2.35 | % | | | 2.15 | % | | | 1,000.00 | | | | 1,021.50 | | | | 11.78 | |
| Commodities Strategy Fund | | | | | | | | | | | | | | | | | | | | |
| A-Class | | | 1.53 | % | | | (6.91 | %) | | | 1,000.00 | | | | 930.90 | | | | 7.32 | |
| C-Class | | | 2.28 | % | | | (7.28 | %) | | | 1,000.00 | | | | 927.20 | | | | 10.89 | |
| H-Class | | | 1.53 | % | | | (6.90 | %) | | | 1,000.00 | | | | 931.00 | | | | 7.33 | |
| | | | | | | | | | | | | | | | | | | | | |
| Table 2. Based on hypothetical 5% return (before expenses) | | | | | | | | | | | | | |
| Managed Commodities Strategy Fund | | | | | | | | | | | | | | | | | | | | |
| A-Class | | | 1.87 | % | | | 5.00 | % | | $ | 1,000.00 | | | $ | 1,015.52 | | | $ | 9.35 | |
| C-Class | | | 2.62 | % | | | 5.00 | % | | | 1,000.00 | | | | 1,011.80 | | | | 13.07 | |
| H-Class | | | 1.88 | % | | | 5.00 | % | | | 1,000.00 | | | | 1,015.47 | | | | 9.39 | |
| Institutional Class | | | 1.65 | % | | | 5.00 | % | | | 1,000.00 | | | | 1,016.61 | | | | 8.25 | |
| Y-Class | | | 1.54 | % | | | 5.00 | % | | | 1,000.00 | | | | 1,017.16 | | | | 7.70 | |
| Multi-Hedge Strategies Fund | | | | | | | | | | | | | | | | | | | | |
| A-Class | | | 2.56 | % | | | 5.00 | % | | | 1,000.00 | | | | 1,012.10 | | | | 12.77 | |
| C-Class | | | 3.33 | % | | | 5.00 | % | | | 1,000.00 | | | | 1,008.28 | | | | 16.58 | |
| H-Class | | | 2.58 | % | | | 5.00 | % | | | 1,000.00 | | | | 1,012.00 | | | | 12.87 | |
| Institutional Class | | | 2.35 | % | | | 5.00 | % | | | 1,000.00 | | | | 1,013.14 | | | | 11.73 | |
| Commodities Strategy Fund | | | | | | | | | | | | | | | | | | | | |
| A-Class | | | 1.53 | % | | | 5.00 | % | | | 1,000.00 | | | | 1,017.21 | | | | 7.65 | |
| C-Class | | | 2.28 | % | | | 5.00 | % | | | 1,000.00 | | | | 1,013.49 | | | | 11.38 | |
| H-Class | | | 1.53 | % | | | 5.00 | % | | | 1,000.00 | | | | 1,017.21 | | | | 7.65 | |
| 1 | This ratio represents annualized Net Expenses, which include interest expense related to securities sold short. Excluding short interest expenses, the operating expense ratio of the Multi-Hedge Strategies Fund would be 1.40%, 2.15%, 1.40% and 1.15% for the A-Class, C-Class, H-Class and Institutional Class, respectively. |
| 2 | Expenses are equal to the Fund’s annualized expense ratio, net of any applicable fee waivers, multiplied by the average account value over the period, multiplied by 181/365 (to reflect the one-half year period). |
| 3 | Actual cumulative return at net asset value for the period December 31, 2012 to June 30, 2013. |
| the GUGGENHEIM FUNDS SEMI-ANNUAL REPORT | 5 |
| FUND PROFILE (Unaudited) | June 30, 2013 |
MANAGED COMMODITIES STRATEGY FUND
OBJECTIVE: Seeks to achieve positive total returns with less volatility than the broad commodity markets.
Consolidated Holdings Diversification (Market Exposure as % of Net Assets)
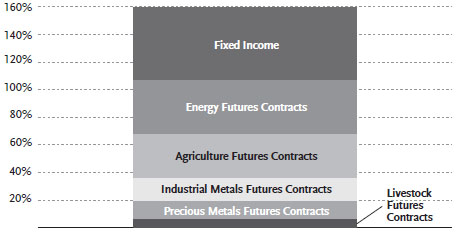
“Consolidated Holdings Diversification (Market Exposure as % of Net Assets)” excludes any temporary cash investments.
| Inception Dates: | | | | |
| A-Class | | | June 25, 2009 | |
| C-Class | | | June 25, 2009 | |
| H-Class | | | June 25, 2009 | |
| Institutional Class | | | May 3, 2010 | |
| Y-Class | | | March 29, 2010 | |
| Ten Largest Holdings | | | |
| (% of Total Net Assets) | | | |
| KKR Financial CLO 2007-A Corp. | | 8.7 | % |
| COMM 2007-FL14 Mortgage Trust | | | 3.9 | % |
| Geer Mountain Financing Ltd. | | | 3.2 | % |
| Emporia Preferred Funding II Corp. | | | 3.1 | % |
| Emporia Preferred Funding | | | 2.5 | % |
| Aspen Insurance Holdings Ltd. | | | 2.4 | % |
| JPMorgan Chase & Co. | | | 2.3 | % |
| Newcastle CDO Ltd. | | | 2.1 | % |
| COMM 2006-FL12 Mortgage Trust | | | 2.1 | % |
| Acis CLO 2013-1 Ltd. | | | 1.8 | % |
| Top Ten Total | | | 32.1 | % |
“Ten Largest Holdings” exclude any temporary cash or derivative investments.
| 6 | the GUGGENHEIM FUNDS SEMI-ANNUAL REPORT |
| CONSOLIDATED SCHEDULE OF INVESTMENTS (Unaudited) | June 30, 2013 |
| MANAGED Commodities Strategy Fund | |
| | | Face | | | | |
| | | Amount | | | Value | |
| ASSET BACKED SECURITIES†† - 27.0% | | | | | | | | |
| KKR Financial CLO 2007-A Corp. | | | | | | | | |
| 2007-AA, 1.03% due 10/15/171,2 | | $ | 3,783,192 | | | $ | 3,773,922 | |
| Geer Mountain Financing Ltd. | | | | | | | | |
| 2007-1A, 0.59% due 04/01/141,2 | | | 1,400,000 | | | | 1,387,960 | |
| Emporia Preferred Funding II Corp. | | | | | | | | |
| 2006-2A, 0.56% due 10/18/181,2 | | | 1,361,765 | | | | 1,353,703 | |
| 2006-2X, 0.57% due 10/18/18 | | | 1,089,412 | | | | 1,076,916 | |
| Newcastle CDO Ltd. | | | | | | | | |
| 0.45% due 05/25/52 | | | 943,024 | | | | 915,950 | |
| Acis CLO 2013-1 Ltd. | | | | | | | | |
| 2013-1A, 1.33% due 04/18/241,2 | | | 800,000 | | | | 799,976 | |
| Brentwood CLO Corp. | | | | | | | | |
| 2006-1A, 0.54% due 02/01/221,2 | | | 812,184 | | | | 792,724 | |
| NewStar Trust 2005-1 | | | | | | | | |
| 2005-1A, 0.78% due 07/25/181,2 | | | 498,202 | | | | 495,975 | |
| N-Star REL CDO VIII Ltd. | | | | | | | | |
| 2006-8A, 0.48% due 02/01/411,2 | | | 464,000 | | | | 430,522 | |
| FM Leveraged Capital Fund II | | | | | | | | |
| 2006-2A, 1.88% due 11/15/201,2 | | | 350,000 | | | | 349,349 | |
| Gleneagles CLO Ltd. | | | | | | | | |
| 2005-1A, 0.55% due 11/01/171,2 | | | 174,577 | | | | 172,475 | |
| Legg Mason Real Estate CDO I Ltd. | | | | | | | | |
| 2006-1A, 0.47% due 03/25/381,2 | | | 165,285 | | | | 161,270 | |
| Total Asset Backed Securities | | | | | | | | |
| (Cost $11,687,628) | | | | | | | 11,710,742 | |
| | | | | | | | | |
| CORPORATE BONDS†† - 18.3% | | | | | | | | |
| Financials - 12.1% | | | | | | | | |
| Aspen Insurance Holdings Ltd. | | | | | | | | |
| 6.00% due 08/15/14 | | | 980,000 | | | | 1,027,714 | |
| JPMorgan Chase & Co. | | | | | | | | |
| 0.89% due 02/26/161 | | | 1,000,000 | | | | 997,935 | |
| Nomura Holdings, Inc. | | | | | | | | |
| 1.72% due 09/13/161 | | | 800,000 | | | | 799,016 | |
| Ford Motor Credit Company LLC | | | | | | | | |
| 8.00% due 06/01/14 | | | 340,000 | | | | 359,596 | |
| 8.70% due 10/01/14 | | | 300,000 | | | | 325,611 | |
| Bank of America Corp. | | | | | | | | |
| 4.50% due 04/01/15 | | | 600,000 | | | | 629,356 | |
| Morgan Stanley | | | | | | | | |
| 4.20% due 11/20/14 | | | 600,000 | | | | 620,688 | |
| Macquarie Group Ltd. | | | | | | | | |
| 7.30% due 08/01/142 | | | 480,000 | | | | 506,227 | |
| Total Financials | | | | | | | 5,266,143 | |
| Industrial - 3.1% | | | | | | | | |
| Glencore Funding LLC | | | | | | | | |
| 1.43% due 05/27/161,2 | | | 675,000 | | | | 657,264 | |
| Rio Tinto Finance USA plc | | | | | | | | |
| 1.11% due 06/17/161 | | | 450,000 | | | | 449,865 | |
| Anglo American Capital plc | | | | | | | | |
| 9.38% due 04/08/142 | | | 225,000 | | | | 238,507 | |
| Total Industrial | | | | | | | 1,345,636 | |
| Energy - 1.6% | | | | | | | | |
| Ras Laffan Liquefied Natural Gas | | | | | | | | |
| Company Limited III | | | | | | | | |
| 5.83% due 09/30/162 | | | 639,870 | | | | 679,862 | |
| Financial Institutions - 0.8% | | | | | | | | |
| Mack-Cali Realty, LP | | | | | | | | |
| 5.13% due 02/15/14 | | | 200,000 | | | | 204,650 | |
| WEA Finance LLC / | | | | | | | | |
| WT Finance Aust Pty Ltd. | | | | | | | | |
| 5.75% due 09/02/152 | | | 144,000 | | | | 157,328 | |
| Total Financial Institutions | | | | | | | 361,978 | |
| Industrials - 0.7% | | | | | | | | |
| International Lease Finance Corp. | | | | | | | | |
| 2.22% due 06/15/161 | | | 300,000 | | | | 297,750 | |
| Total Industrials | | | | | | | 297,750 | |
| Total Corporate Bonds | | | | | | | | |
| (Cost $7,991,779) | | | | | | | 7,951,369 | |
| U.S. GOVERNMENT SECURITIES† - 11.0% | | | | | | | | |
| U.S. Treasury Bill | | | | | | | | |
| 0.00% due 07/11/13 | | | 1,800,000 | | | | 1,799,990 | |
| 0.00% due 07/25/13 | | | 1,722,000 | | | | 1,721,979 | |
| 0.00% due 07/18/13 | | | 1,275,000 | | | | 1,274,986 | |
| Total U.S. Treasury Bill | | | | | | | 4,796,955 | |
| Total U.S. Government Securities | | | | | | | | |
| (Cost $4,796,973) | | | | | | | 4,796,955 | |
| MORTGAGE BACKED SECURITIES†† - 6.5% | | | | | | | | |
| COMM 2007-FL14 Mortgage Trust | | | | | | | | |
| 2007-FL14, 0.37% due 06/15/221,2 | | | 1,690,006 | | | | 1,675,965 | |
| COMM 2006-FL12 Mortgage Trust | | | | | | | | |
| 2006-FL12, 0.32% due 12/15/201,2 | | | 916,659 | | | | 896,046 | |
| Banc of America Large Loan Trust | | | | | | | | |
| 2007-BMB1, 1.29% due 08/15/291,2 | | | 270,000 | | | | 267,534 | |
| Total Mortgage Backed Securities | | | | | | | | |
| (Cost $2,822,635) | | | | | | | 2,839,545 | |
| See Notes to Financial Statements. | the Guggenheim Funds SEMI-ANNUAL REPORT | 7 |
| CONSOLIDATED SCHEDULE OF INVESTMENTS (Unaudited) (continued) | June 30, 2013 |
| MANAGED Commodities Strategy Fund | |
| | | Face | | | | |
| | | Amount | | | Value | |
| MUNICIPAL BONDS†† - 1.2% | | | | | | | | |
| New York - 1.2% | | | | | | | | |
| City of New York New York General | | | | | | | | |
| Obligation Unlimited 0.36% | | | | | | | | |
| due 04/01/351 | | $ | 500,000 | | | $ | 500,000 | |
| Total Municipal Bonds | | | | | | | | |
| (Cost $500,000) | | | | | | | 500,000 | |
| COMMERCIAL PAPER†† - 17.0% | | | | | | | | |
| National Grid Holdings, Inc. | | | | | | | | |
| 0.26% due 07/08/132 | | | 700,000 | | | | 699,965 | |
| Ecolab, Inc. | | | | | | | | |
| 0.21% due 07/18/132 | | | 700,000 | | | | 699,931 | |
| Pentair Finance S.A. | | | | | | | | |
| 0.29% due 07/09/132 | | | 600,000 | | | | 599,960 | |
| CBS Corp. | | | | | | | | |
| 0.23% due 07/01/132 | | | 500,000 | | | | 500,000 | |
| AbbVie, Inc. | | | | | | | | |
| 0.18% due 07/02/132 | | | 500,000 | | | | 499,997 | |
| American Water Capital Corp. | | | | | | | | |
| 0.29% due 07/03/132 | | | 500,000 | | | | 499,992 | |
| Aegon N.V. | | | | | | | | |
| 0.27% due 07/08/132 | | | 500,000 | | | | 499,974 | |
| Nissan Motor Acceptance Corp. | | | | | | | | |
| 0.25% due 07/17/132 | | | 500,000 | | | | 499,942 | |
| Apache Corp. | | | | | | | | |
| 0.29% due 07/16/132 | | | 500,000 | | | | 499,939 | |
| Noble Corporation/Cayman Islands | | | | | | | | |
| 0.31% due 07/19/132 | | | 500,000 | | | | 499,923 | |
| Kinder Morgan Energy Partners, LP | | | | | | | | |
| 0.27% due 07/24/132 | | | 500,000 | | | | 499,911 | |
| Duke Energy Corp. | | | | | | | | |
| 0.27% due 07/25/132 | | | 500,000 | | | | 499,910 | |
| Tesco Treasury Services plc | | | | | | | | |
| 0.28% due 08/05/132 | | | 500,000 | | | | 499,864 | |
| Southern California Edison Co. | | | | | | | | |
| 0.22% due 07/08/132 | | | 400,000 | | | | 399,983 | |
| Total Commercial Paper | | | | | | | | |
| (Cost $7,399,291) | | | | | | | 7,399,291 | |
| REPURCHASE AGREEMENTS††,3 - 3.8% | | | | | | | | |
| HSBC Group | | | | | | | | |
| issued 06/28/13 at 0.07% | | | | | | | | |
| due 07/01/13 | | | 1,311,359 | | | | 1,311,359 | |
| Mizuho Financial Group, Inc. | | | | | | | | |
| issued 06/28/13 at 0.06% | | | | | | | | |
| due 07/01/13 | | | 225,381 | | | | 225,381 | |
| Deutsche Bank | | | | | | | | |
| issued 06/28/13 at 0.06% | | | | | | | | |
| due 07/01/13 | | | 91,490 | | | | 91,490 | |
| Total Repurchase Agreements | | | | | | | | |
| (Cost $1,628,230) | | | | | | | 1,628,230 | |
| | | Contracts | | | | |
| OPTIONS PURCHASED† - 4.6% | | | | | | | | |
| Call options on: | | | | | | | | |
| Gold Futures | | | | | | | | |
| Expiring May 2015 | | | | | | | | |
| with strike price of $425.00 | | | 40 | | | | 310,000 | |
| Gold Futures | | | | | | | | |
| Expiring November 2014 | | | | | | | | |
| with strike price of $415.00 | | | 40 | | | | 243,600 | |
| Silver Futures | | | | | | | | |
| Expiring June 2015 | | | | | | | | |
| with strike price of $23.50 | | | 15 | | | | 157,950 | |
| Silver Futures | | | | | | | | |
| Expiring November 2014 | | | | | | | | |
| with strike price of $23.50 | | | 15 | | | | 115,050 | |
| Total Call options | | | | | | | 826,600 | |
| Put options on: | | | | | | | | |
| Gold Futures | | | | | | | | |
| Expiring November 2013 | | | | | | | | |
| with strike price of $450.00 | | | 50 | | | | 1,179,500 | |
| Total Put options | | | | | | | 1,179,500 | |
| Total Options Purchased | | | | | | | | |
| (Cost $1,945,092) | | | | | | | 2,006,100 | |
| Total Long Investments - 89.4% | | | | | | | | |
| (Cost $38,771,628) | | | | | | $ | 38,832,232 | |
| OPTIONS WRITTEN† - (1.3)% | | | | | | | | |
| Call options on: | | | | | | | | |
| Silver Futures | | | | | | | | |
| Expiring November 2014 | | | | | | | | |
| with strike price of $28.25 | | | 15 | | | | (51,600 | ) |
| Gold Futures | | | | | | | | |
| Expiring November 2014 | | | | | | | | |
| with strike price of $700.00 | | | 40 | | | | (76,800 | ) |
| Silver Futures | | | | | | | | |
| Expiring June 2015 | | | | | | | | |
| with strike price of $28.25 | | | 15 | | | | (85,650 | ) |
| Gold Futures | | | | | | | | |
| Expiring May 2015 | | | | | | | | |
| with strike price of $710.00 | | | 40 | | | | (120,000 | ) |
| Total Call options | | | | | | | (334,050 | ) |
| Put options on: | | | | | | | | |
| Gold Futures | | | | | | | | |
| Expiring November 2013 | | | | | | | | |
| with strike price of $150.00 | | | 50 | | | | (235,000 | ) |
| Total Options Written | | | | | | | | |
| (Premiums received $691,408) | | | | | | | (569,050 | ) |
| Other Assets & Liabilities, net - 11.9% | | | | | | | 5,160,598 | |
| Total Net Assets - 100.0% | | | | | | $ | 43,423,780 | |
| 8 | The Guggenheim FUNDS SEMI-ANNUAL REPORT | See Notes to Financial Statements. |
| CONSOLIDATED SCHEDULE OF INVESTMENTS (Unaudited) (concluded) | June 30, 2013 |
| MANAGED COMMODITIES STRATEGY FUND | |
| | | Contracts | | | Unrealized
Gain (Loss) | |
| | | | | | | |
| COMMODITY FUTURES CONTRACTS PURCHASED† | | | | | | | | |
| August 2013 Live Cattle | | | | | | | | |
| Futures Contracts | | | | | | | | |
| (Aggregate Value of | | | | | | | | |
| Contracts $1,515,590) | | | 31 | | | $ | 22,094 | |
| October 2013 Sugar #11 | | | | | | | | |
| Futures Contracts | | | | | | | | |
| (Aggregate Value of | | | | | | | | |
| Contracts $1,571,024) | | | 83 | | | | 21,534 | |
| September 2013 WTI Crude | | | | | | | | |
| Futures Contracts | | | | | | | | |
| (Aggregate Value of | | | | | | | | |
| Contracts $4,721,149) | | | 49 | | | | 14,843 | |
| August 2013 Lean Hogs | | | | | | | | |
| Futures Contracts | | | | | | | | |
| (Aggregate Value of | | | | | | | | |
| Contracts $1,055,160) | | | 27 | | | | 13,117 | |
| August 2013 Gas Oil | | | | | | | | |
| Futures Contracts | | | | | | | | |
| (Aggregate Value of | | | | | | | | |
| Contracts $523,200) | | | 6 | | | | 1,565 | |
| September 2013 LME Zinc | | | | | | | | |
| Futures Contracts | | | | | | | | |
| (Aggregate Value of | | | | | | | | |
| Contracts $1,158,844) | | | 25 | | | | (10,124 | ) |
| September 2013 New York Harbor | | | | | | | | |
| Ultra-Low Sulfur Diesel | | | | | | | | |
| Futures Contracts | | | | | | | | |
| (Aggregate Value of | | | | | | | | |
| Contracts $1,202,712) | | | 10 | | | | (15,847 | ) |
| December 2013 Cotton #2 | | | | | | | | |
| Futures Contracts | | | | | | | | |
| (Aggregate Value of | | | | | | | | |
| Contracts $1,012,560) | | | 24 | | | | (27,946 | ) |
| September 2013 Brent Crude | | | | | | | | |
| Futures Contracts | | | | | | | | |
| (Aggregate Value of | | | | | | | | |
| Contracts $2,742,660) | | | 27 | | | | (35,193 | ) |
| September 2013 Winter Wheat | | | | | | | | |
| Futures Contracts | | | | | | | | |
| (Aggregate Value of | | | | | | | | |
| Contracts $550,000) | | | 16 | | | | (37,779 | ) |
| September 2013 LME Nickel | | | | | | | | |
| Futures Contracts | | | | | | | | |
| (Aggregate Value of | | | | | | | | |
| Contracts $739,989) | | | 9 | | | | (45,275 | ) |
| | | | | | | | | |
| | | | | | | | Unrealized | |
| | | | | | | | Loss | |
| | | | | | | | | |
| September 2013 Coffee ‘C’ | | | | | | | | |
| Futures Contracts | | | | | | | | |
| (Aggregate Value of | | | | | | | | |
| Contracts $903,750) | | | 20 | | | $ | (53,640 | ) |
| December 2013 Soybean Oil | | | | | | | | |
| Futures Contracts | | | | | | | | |
| (Aggregate Value of | | | | | | | | |
| Contracts $1,247,520) | | | 46 | | | | (62,908 | ) |
| December 2013 Soybean Meal | | | | | | | | |
| Futures Contracts | | | | | | | | |
| (Aggregate Value of | | | | | | | | |
| Contracts $1,303,750) | | | 35 | | | | (66,347 | ) |
| September 2013 Gasoline RBOB | | | | | | | | |
| Futures Contracts | | | | | | | | |
| (Aggregate Value of | | | | | | | | |
| Contracts $1,698,795) | | | 15 | | | | (70,849 | ) |
| September 2013 Wheat | | | | | | | | |
| Futures Contracts | | | | | | | | |
| (Aggregate Value of | | | | | | | | |
| Contracts $1,477,688) | | | 45 | | | | (99,801 | ) |
| September 2013 Silver | | | | | | | | |
| Futures Contracts | | | | | | | | |
| (Aggregate Value of | | | | | | | | |
| Contracts $979,750) | | | 10 | | | | (104,355 | ) |
| November 2013 Soybean | | | | | | | | |
| Futures Contracts | | | | | | | | |
| (Aggregate Value of | | | | | | | | |
| Contracts $2,814,188) | | | 45 | | | | (158,062 | ) |
| September 2013 LME Primary Aluminum | | | | | | | | |
| Futures Contracts | | | | | | | | |
| (Aggregate Value of | | | | | | | | |
| Contracts $2,211,875) | | | 50 | | | | (164,063 | ) |
| September 2013 Copper | | | | | | | | |
| Futures Contracts | | | | | | | | |
| (Aggregate Value of | | | | | | | | |
| Contracts $3,136,500) | | | 41 | | | | (182,748 | ) |
| September 2013 Corn | | | | | | | | |
| Futures Contracts | | | | | | | | |
| (Aggregate Value of | | | | | | | | |
| Contracts $3,201,413) | | | 117 | | | | (204,679 | ) |
| September 2013 Natural Gas | | | | | | | | |
| Futures Contracts | | | | | | | | |
| (Aggregate Value of | | | | | | | | |
| Contracts $6,034,989) | | | 169 | | | | (419,227 | ) |
| August 2013 Gold 100 oz. | | | | | | | | |
| Futures Contracts | | | | | | | | |
| (Aggregate Value of | | | | | | | | |
| Contracts $4,558,030) | | | 37 | | | | (793,781 | ) |
| (Total Aggregate Value of | | | | | | | | |
| Contracts $46,361,136) | | | | | | $ | (2,479,471 | ) |
| † | Value determined based on Level 1 inputs — See Note 4. |
| †† | Value determined based on Level 2 inputs — See Note 4. |
| 1 | Variable rate security. Rate indicated is rate effective at June 30, 2013. |
| 2 | Security is a 144A or Section 4(a)(2) security. The total market value of 144A or Section 4(a)(2) securities is $22,195,900 (cost $22,187,381), or 51.1% of total net assets. |
| 3 | Repurchase Agreements — See Note 5. |
plc — Public Limited Company
REIT — Real Estate Investment Trust
| SEE NOTES TO FINANCIAL STATEMENTS. | THE GUGGENHEIM FUNDS SEMI-ANNUAL REPORT | 9 |
| MANAGED COMMODITIES STRATEGY FUND |
| CONSOLIDATED STATEMENT OF |
| ASSETS AND LIABILITIES (Unaudited) |
June 30, 2013
| Assets: | | | | |
| Investments, at value | | | | |
| (cost $37,143,398) | | $ | 37,204,002 | |
| Repurchase agreements, at value | | | | |
| (cost $1,628,230) | | | 1,628,230 | |
| Total investments | | | | |
| (cost $38,771,628) | | | 38,832,232 | |
| Segregated cash with broker | | | 2,185,854 | |
| Receivables: | | | | |
| Securities sold | | | 3,775,736 | |
| Interest | | | 184,318 | |
| Fund shares sold | | | 21,357 | |
| Total assets | | | 44,999,497 | |
| Liabilities: | | | | |
| Options written, at value | | | | |
| (premiums received $691,408) | | | 569,050 | |
| Overdraft due to custodian bank | | | 260,629 | |
| Payable for: | | | | |
| Fund shares redeemed | | | 364,838 | |
| Variation margin | | | 296,498 | |
| Management fees | | | 32,351 | |
| Distribution and service fees | | | 12,575 | |
| Transfer agent and administrative fees | | | 8,986 | |
| Portfolio accounting fees | | | 3,594 | |
| Miscellaneous | | | 27,196 | |
| Total liabilities | | | 1,575,717 | |
| Net assets | | $ | 43,423,780 | |
| Net assets consist of: | | | | |
| Paid in capital | | $ | 111,189,016 | |
| Accumulated net investment loss | | | (48,573,615 | ) |
| Accumulated net realized loss on investments | | | (16,895,112 | ) |
| Net unrealized depreciation on investments | | | (2,296,509 | ) |
| Net assets | | $ | 43,423,780 | |
| A-Class: | | | | |
| Net assets | | $ | 13,758,232 | |
| Capital shares outstanding | | | 967,227 | |
| Net asset value per share | | $ | 14.22 | |
| Maximum offering price per share | | | | |
| (Net asset value divided by 95.25%) | | $ | 14.93 | |
| C-Class: | | | | |
| Net assets | | $ | 5,935,111 | |
| Capital shares outstanding | | | 430,761 | |
| Net asset value per share | | $ | 13.78 | |
| H-Class: | | | | |
| Net assets | | $ | 22,761,736 | |
| Capital shares outstanding | | | 1,600,671 | |
| Net asset value per share | | $ | 14.22 | |
| Institutional Class: | | | | |
| Net assets | | $ | 962,405 | |
| Capital shares outstanding | | | 67,140 | |
| Net asset value per share | | $ | 14.33 | |
| Y-Class: | | | | |
| Net assets | | $ | 6,296 | |
| Capital shares outstanding | | | 438 | |
| Net asset value per share | | $ | 14.36 | |
| CONSOLIDATED STATEMENT |
| OF OPERATIONS (Unaudited) |
Period Ended June 30, 2013
| Investment Income: | | | | |
| Interest | | $ | 163,784 | |
| Total investment income | | | 163,784 | |
| | | | | |
| Expenses: | | | | |
| Management fees | | | 471,878 | |
| Transfer agent and administrative fees: | | | | |
| A-Class | | | 26,106 | |
| C-Class | | | 13,191 | |
| H-Class | | | 50,374 | |
| Institutional Class | | | 24,773 | |
| Y-Class | | | 7 | |
| Distribution and service fees: | | | | |
| A-Class | | | 26,106 | |
| C-Class | | | 52,765 | |
| H-Class | | | 50,374 | |
| Portfolio accounting fees | | | 45,781 | |
| Registration fees | | | 97,424 | |
| Licensing fees | | | 88,349 | |
| Trustees’ fees* | | | 10,399 | |
| Custodian fees | | | 6,137 | |
| Miscellaneous | | | (28,745 | ) |
| Total expenses | | | 934,919 | |
| Less: | | | | |
| Expenses waived by Advisor | | | (59,848 | ) |
| Net expenses | | | 875,071 | |
| Net investment loss | | | (711,287 | ) |
| | | | | |
| Net Realized and Unrealized Gain (Loss): | | | | |
| Net realized gain (loss) on: | | | | |
| Investments | | | (20,095 | ) |
| Futures contracts | | | (16,410,514 | ) |
| Options purchased | | | 65,646 | |
| Options written | | | (23,436 | ) |
| Net realized loss | | | (16,388,399 | ) |
| Net change in unrealized appreciation (depreciation) on: | | | | |
| Investments | | | (12,364 | ) |
| Futures contracts | | | (2,177,257 | ) |
| Options purchased | | | 61,008 | |
| Options written | | | 122,358 | |
| Net change in unrealized appreciation (depreciation) | | | (2,006,255 | ) |
| Net realized and unrealized loss | | | (18,394,654 | ) |
| Net decrease in net assets resulting from operations | | $ | (19,105,941 | ) |
* Relates to Trustees not deemed “interested persons” within the meaning of Section 2(a)(19) of the 1940 Act.
| 10 | THE GUGGENHEIM FUNDS SEMI-ANNUAL REPORT | SEE NOTES TO FINANCIAL STATEMENTS. |
| MANAGED COMMODITIES STRATEGY FUND |
| CONSOLIDATED STATEMENTS OF CHANGES IN NET ASSETS |
| | | Period Ended | | | | |
| | | June 30, | | | Year Ended | |
| | | 2013 | | | December 31, | |
| | | (Unaudited) | | | 2012 | |
| Increase (Decrease) In Net Assets From Operations: | | | | | | | | |
| Net investment loss | | $ | (711,287 | ) | | $ | (6,100,973 | ) |
| Net realized loss on investments | | | (16,388,399 | ) | | | (103,156,077 | ) |
| Net change in unrealized appreciation (depreciation) on investments | | | (2,006,255 | ) | | | 5,171,645 | |
| Net decrease in net assets resulting from operations | | | (19,105,941 | ) | | | (104,085,405 | ) |
| | | | | | | | | |
| Capital share transactions: | | | | | | | | |
| Proceeds from sale of shares | | | | | | | | |
| A-Class | | | 1,962,493 | | | | 56,097,770 | |
| C-Class | | | 1,070,795 | | | | 10,530,172 | |
| H-Class | | | 6,793,276 | | | | 148,038,271 | |
| Institutional Class | | | 6,694,999 | | | | 35,895,054 | |
| Y-Class | | | — | | | | 5,700,143 | |
| Cost of shares redeemed | | | | | | | | |
| A-Class | | | (14,467,149 | ) | | | (112,080,141 | ) |
| C-Class | | | (9,190,730 | ) | | | (17,548,039 | ) |
| H-Class | | | (40,421,554 | ) | | | (233,390,442 | ) |
| Institutional Class | | | (32,142,272 | ) | | | (21,403,749 | ) |
| Y-Class | | | — | | | | (4,282,590 | ) |
| Net decrease from capital share transactions | | | (79,700,142 | ) | | | (132,443,551 | ) |
| Net decrease in net assets | | | (98,806,083 | ) | | | (236,528,956 | ) |
| | | | | | | | | |
| Net assets: | | | | | | | | |
| Beginning of period | | | 142,229,863 | | | | 378,758,819 | |
| End of period | | $ | 43,423,780 | | | $ | 142,229,863 | |
| Accumulated net investment loss at end of period | | $ | (48,573,615 | ) | | $ | (47,862,328 | ) |
| | | | | | | | | |
| Capital share activity: | | | | | | | | |
| Shares sold | | | | | | | | |
| A-Class | | | 122,382 | | | | 2,385,538 | |
| C-Class | | | 65,492 | | | | 448,122 | |
| H-Class | | | 404,116 | | | | 6,223,527 | |
| Institutional Class | | | 392,912 | | | | 1,592,407 | |
| Y-Class | | | — | | | | 232,709 | |
| Shares redeemed | | | | | | | | |
| A-Class | | | (876,626 | ) | | | (4,974,401 | ) |
| C-Class | | | (576,214 | ) | | | (885,922 | ) |
| H-Class | | | (2,446,965 | ) | | | (11,443,806 | ) |
| Institutional Class | | | (2,100,881 | ) | | | (1,042,526 | ) |
| Y-Class | | | — | | | | (232,709 | ) |
| Net decrease in shares | | | (5,015,784 | ) | | | (7,697,061 | ) |
| SEE NOTES TO FINANCIAL STATEMENTS. | THE GUGGENHEIM FUNDS SEMI-ANNUAL REPORT | 11 |
| MANAGED COMMODITIES STRATEGY FUND |
This table is presented to show selected data for a share outstanding throughout each period and to assist shareholders in evaluating a Fund’s performance for the periods presented.
| | | Period Ended | | | Year Ended | | | Year Ended | | | Year Ended | | | Period Ended | |
| | | June 30, | | | December 31, | | | December 31, | | | December 31, | | | December 31, | |
| A-Class | | 2013a,b | | | 2012b | | | 2011b | | | 2010b | | | 2009b,c | |
| Per Share Data | | | | | | | | | | | | | | | | | | | | |
| Net asset value, beginning of period | | $ | 17.63 | | | $ | 24.04 | | | $ | 25.78 | | | $ | 24.07 | | | $ | 25.00 | |
| Income (loss) from investment operations: | | | | | | | | | | | | | | | | | | | | |
| Net investment lossd | | | (.12 | ) | | | (.40 | ) | | | (.47 | ) | | | (.41 | ) | | | (.23 | ) |
| Net gain (loss) on investments (realized and unrealized) | | | (3.29 | ) | | | (6.01 | ) | | | .05 | | | | 4.07 | | | | (.70 | ) |
| Total from investment operations | | | (3.41 | ) | | | (6.41 | ) | | | (.42 | ) | | | 3.66 | | | | (.93 | ) |
| Less distributions from: | | | | | | | | | | | | | | | | | | | | |
| Net investment income | | | — | | | | — | | | | (1.32 | ) | | | (1.92 | ) | | | — | |
| Return of Capital | | | — | | | | — | | | | — | | | | (.03 | ) | | | — | |
| Total distributions | | | — | | | | — | | | | (1.32 | ) | | | (1.95 | ) | | | — | |
| Redemption fees collected | | | — | | | | — | | | | — | | | | — | e | | | — | e |
| Net asset value, end of period | | $ | 14.22 | | | $ | 17.63 | | | $ | 24.04 | | | $ | 25.78 | | | $ | 24.07 | |
| | | | | | | | | | | | | | | | | | | | | |
| Total Returnf | | | (19.34 | %) | | | (26.66 | %) | | | (1.83 | %) | | | 15.51 | % | | | (3.72 | %) |
| Ratios/Supplemental Data | | | | | | | | | | | | | | | | | | | | |
| Net assets, end of period (in thousands) | | $ | 13,758 | | | $ | 30,355 | | | $ | 103,637 | | | $ | 73,274 | | | $ | 10,654 | |
| Ratios to average net assets: | | | | | | | | | | | | | | | | | | | | |
| Net investment loss | | | (1.46 | %) | | | (1.74 | %) | | | (1.76 | %) | | | (1.71 | %) | | | (1.74 | %) |
| Total expenses | | | 1.99 | % | | | 2.04 | % | | | 2.08 | % | | | 2.09 | % | | | 1.95 | % |
| Net expensesg | | | 1.87 | % | | | 1.88 | % | | | 1.92 | % | | | 1.93 | % | | | 1.84 | % |
| Portfolio turnover rate | | | 62 | % | | | — | | | | — | | | | — | | | | — | |
| | | Period Ended | | | Year Ended | | | Year Ended | | | Year Ended | | | Period Ended | |
| | | June 30, | | | December 31, | | | December 31, | | | December 31, | | | December 31, | |
| C-Class | | 2013a,b | | | 2012b | | | 2011b | | | 2010b | | | 2009b,c | |
| Per Share Data | | | | | | | | | | | | | | | | | | | | |
| Net asset value, beginning of period | | $ | 17.14 | | | $ | 23.55 | | | $ | 25.46 | | | $ | 23.97 | | | $ | 25.00 | |
| Income (loss) from investment operations: | | | | | | | | | | | | | | | | | | | | |
| Net investment lossd | | | (.18 | ) | | | (.55 | ) | | | (.66 | ) | | | (.59 | ) | | | (.33 | ) |
| Net gain (loss) on investments (realized and unrealized) | | | (3.18 | ) | | | (5.86 | ) | | | .07 | | | | 4.03 | | | | (.70 | ) |
| Total from investment operations | | | (3.36 | ) | | | (6.41 | ) | | | (.59 | ) | | | 3.44 | | | | (1.03 | ) |
| Less distributions from: | | | | | | | | | | | | | | | | | | | | |
| Net investment income | | | — | | | | — | | | | (1.32 | ) | | | (1.92 | ) | | | — | |
| Return of capital | | | — | | | | — | | | | — | | | | (.03 | ) | | | — | |
| Total distributions | | | — | | | | — | | | | (1.32 | ) | | | (1.95 | ) | | | — | |
| Redemption fees collected | | | — | | | | — | | | | — | | | | — | e | | | — | e |
| Net asset value, end of period | | $ | 13.78 | | | $ | 17.14 | | | $ | 23.55 | | | $ | 25.46 | | | $ | 23.97 | |
| | | | | | | | | | | | | | | | | | | | | |
| Total Returnf | | | (19.60 | %) | | | (27.19 | %) | | | (2.56 | %) | | | 14.70 | % | | | (4.16 | %) |
| Ratios/Supplemental Data | | | | | | | | | | | | | | | | | | | | |
| Net assets, end of period (in thousands) | | $ | 5,935 | | | $ | 16,141 | | | $ | 32,476 | | | $ | 17,587 | | | $ | 3,642 | |
| Ratios to average net assets: | | | | | | | | | | | | | | | | | | | | |
| Net investment loss | | | (2.24 | %) | | | (2.50 | %) | | | (2.51 | %) | | | (2.46 | %) | | | (2.50 | %) |
| Total expenses | | | 2.75 | % | | | 2.79 | % | | | 2.83 | % | | | 2.83 | % | | | 2.70 | % |
| Net expensesg | | | 2.62 | % | | | 2.63 | % | | | 2.67 | % | | | 2.67 | % | | | 2.59 | % |
| Portfolio turnover rate | | | 62 | % | | | — | | | | — | | | | — | | | | — | |
| 12 | THE GUGGENHEIM FUNDS SEMI-ANNUAL REPORT | SEE NOTES TO FINANCIAL STATEMENTS. |
| MANAGED COMMODITIES STRATEGY FUND |
| FINANCIAL HIGHLIGHTS (continued) |
This table is presented to show selected data for a share outstanding throughout each period and to assist shareholders in evaluating a Fund’s performance for the periods presented.
| | | Period Ended | | | Year Ended | | | Year Ended | | | Year Ended | | | Period Ended | |
| | | June 30, | | | December 31, | | | December 31, | | | December 31, | | | December 31, | |
| H-Class | | 2013a,b | | | 2012b | | | 2011b | | | 2010b | | | 2009b,c | |
| Per Share Data | | | | | | | | | | | | | | | | | | | | |
| Net asset value, beginning of period | | $ | 17.63 | | | $ | 24.04 | | | $ | 25.77 | | | $ | 24.06 | | | $ | 25.00 | |
| Income (loss) from investment operations: | | | | | | | | | | | | | | | | | | | | |
| Net investment lossd | | | (.12 | ) | | | (.40 | ) | | | (.47 | ) | | | (.41 | ) | | | (.23 | ) |
| Net gain (loss) on investments (realized and unrealized) | | | (3.29 | ) | | | (6.01 | ) | | | .06 | | | | 4.07 | | | | (.71 | ) |
| Total from investment operations | | | (3.41 | ) | | | (6.41 | ) | | | (.41 | ) | | | 3.66 | | | | (.94 | ) |
| Less distributions from: | | | | | | | | | | | | | | | | | | | | |
| Net investment income | | | — | | | | — | | | | (1.32 | ) | | | (1.92 | ) | | | — | |
| Return of Capital | | | — | | | | — | | | | — | | | | (.03 | ) | | | — | |
| Total distributions | | | — | | | | — | | | | (1.32 | ) | | | (1.95 | ) | | | — | |
| Redemption fees collected | | | — | | | | — | | | | — | | | | — | e | | | — | e |
| Net asset value, end of period | | $ | 14.22 | | | $ | 17.63 | | | $ | 24.04 | | | $ | 25.77 | | | $ | 24.06 | |
| | | | | | | | | | | | | | | | | | | | | |
| Total Returnf | | | (19.34 | %) | | | (26.63 | %) | | | (1.83 | %) | | | 15.51 | % | | | (3.76 | %) |
| Ratios/Supplemental Data | | | | | | | | | | | | | | | | | | | | |
| Net assets, end of period (in thousands) | | $ | 22,762 | | | $ | 64,227 | | | $ | 213,062 | | | $ | 145,349 | | | $ | 71,014 | |
| Ratios to average net assets: | | | | | | | | | | | | | | | | | | | | |
| Net investment loss | | | (1.50 | %) | | | (1.75 | %) | | | (1.76 | %) | | | (1.71 | %) | | | (1.75 | %) |
| Total expenses | | | 2.01 | % | | | 2.04 | % | | | 2.08 | % | | | 2.07 | % | | | 1.95 | % |
| Net expensesg | | | 1.88 | % | | | 1.88 | % | | | 1.92 | % | | | 1.91 | % | | | 1.84 | % |
| Portfolio turnover rate | | | 62 | % | | | — | | | | — | | | | — | | | | — | |
| | | | | | | Period Ended | | | Year Ended | | | Year Ended | | | Period Ended | |
| | | | | | | June 30, | | | December 31, | | | December 31, | | | December 31, | |
| Institutional Class | | | | | | 2013a,b | | | 2012b | | | 2011b | | | 2010b,h | |
| Per Share Data | | | | | | | | | | | | | | | | | | | | |
| Net asset value, beginning of period | | | | | | $ | 17.75 | | | $ | 24.14 | | | $ | 25.81 | | | $ | 26.39 | |
| Income (loss) from investment operations: | | | | | | | | | | | | | | | | | | | | |
| Net investment lossd | | | | | | | (.12 | ) | | | (.33 | ) | | | (.40 | ) | | | (.24 | ) |
| Net gain (loss) on investments (realized and unrealized) | | | | | | | (3.30 | ) | | | (6.06 | ) | | | .05 | | | | 1.61 | |
| Total from investment operations | | | | | | | (3.42 | ) | | | (6.39 | ) | | | (.35 | ) | | | 1.37 | |
| Less distributions from: | | | | | | | | | | | | | | | | | | | | |
| Net investment income | | | | | | | — | | | | — | | | | (1.32 | ) | | | (1.92 | ) |
| Return of Capital | | | | | | | — | | | | — | | | | — | | | | (.03 | ) |
| Total distributions | | | | | | | — | | | | — | | | | (1.32 | ) | | | (1.95 | ) |
| Redemption fees collected | | | | | | | — | | | | — | | | | — | | | | — | e |
| Net asset value, end of period | | | | | | $ | 14.33 | | | $ | 17.75 | | | $ | 24.14 | | | $ | 25.81 | |
| | | | | | | | | | | | | | | | | | | | | |
| Total Returnf | | | | | | | (19.22 | %) | | | (26.48 | %) | | | (1.60 | %) | | | 5.47 | % |
| Ratios/Supplemental Data | | | | | | | | | | | | | | | | | | | | |
| Net assets, end of period (in thousands) | | | | | | $ | 962 | | | $ | 31,499 | | | $ | 29,573 | | | $ | 51,444 | |
| Ratios to average net assets: | | | | | | | | | | | | | | | | | | | | |
| Net investment loss | | | | | | | (1.39 | %) | | | (1.50 | %) | | | (1.50 | %) | | | (1.45 | %) |
| Total expenses | | | | | | | 1.78 | % | | | 1.79 | % | | | 1.84 | % | | | 1.88 | % |
| Net expensesg | | | | | | | 1.65 | % | | | 1.64 | % | | | 1.68 | % | | | 1.70 | % |
| Portfolio turnover rate | | | | | | | 62 | % | | | — | | | | — | | | | — | |
| SEE NOTES TO FINANCIAL STATEMENTS. | THE GUGGENHEIM FUNDS SEMI-ANNUAL REPORT | 13 |
| MANAGED COMMODITIES STRATEGY FUND |
| FINANCIAL HIGHLIGHTS (concluded) |
This table is presented to show selected data for a share outstanding throughout each period and to assist shareholders in evaluating a Fund’s performance for the periods presented.
| | | | | | | Period Ended | | | Year Ended | | | Year Ended | | | Period Ended | |
| | | | | | | June 30, | | | December 31, | | | December 31, | | | December 31, | |
| Y-Class | | | | | | 2013a,b | | | 2012b | | | 2011b | | | 2010b,i | |
| Per Share Data | | | | | | | | | | | | | | | | | | | | |
| Net asset value, beginning of period | | | | | | $ | 17.79 | | | $ | 24.17 | | | $ | 25.83 | | | $ | 25.89 | |
| Income (loss) from investment operations: | | | | | | | | | | | | | | | | | | | | |
| Net investment lossd | | | | | | | (.09 | ) | | | (.35 | ) | | | (.39 | ) | | | (.26 | ) |
| Net gain (loss) on investments (realized and unrealized) | | | | | | | (3.34 | ) | | | (6.03 | ) | | | .05 | | | | 2.15 | |
| Total from investment operations | | | | | | | (3.43 | ) | | | 6.38 | | | | (.34 | ) | | | 1.89 | |
| Less distributions from: | | | | | | | | | | | | | | | | | | | | |
| Net investment income | | | | | | | — | | | | — | | | | (1.32 | ) | | | (1.92 | ) |
| Return of Capital | | | | | | | — | | | | — | | | | — | | | | (.03 | ) |
| Total distributions | | | | | | | — | | | | — | | | | (1.32 | ) | | | (1.95 | ) |
| Redemption fees collected | | | | | | | — | | | | — | | | | — | | | | — | e |
| Net asset value, end of period | | | | | | $ | 14.36 | | | $ | 17.79 | | | $ | 24.17 | | | $ | 25.83 | |
| | | | | | | | | | | | | | | | | | | | | |
| Total Returnf | | | | | | | (19.24 | %) | | | (26.44 | %) | | | (1.52 | %) | | | 7.58 | % |
| Ratios/Supplemental Data | | | | | | | | | | | | | | | | | | | | |
| Net assets, end of period (in thousands) | | | | | | $ | 6 | | | $ | 8 | | | $ | 11 | | | $ | 11 | |
| Ratios to average net assets: | | | | | | | | | | | | | | | | | | | | |
| Net investment loss | | | | | | | (1.08 | %) | | | (1.45 | %) | | | (1.46 | %) | | | (1.41 | %) |
| Total expenses | | | | | | | 1.66 | % | | | 1.73 | % | | | 1.78 | % | | | 1.79 | % |
| Net expensesg | | | | | | | 1.54 | % | | | 1.58 | % | | | 1.62 | % | | | 1.63 | % |
| Portfolio turnover rate | | | | | | | 62 | % | | | — | | | | — | | | | — | |
| a | Unaudited figures for the period ended June 30, 2013. Percentage amounts for the period, except total return and portfolio turnover rate, have been annualized. |
| c | Since commencement of operations: June 25, 2009. Percentage amounts for the period, except total return and portfolio turnover rate, have been annualized. |
| d | Net investment loss per share was computed using average shares outstanding throughout the period. |
| e | Redemption fees collected are less than $0.01 per share. |
| f | Total return does not reflect the impact of any applicable sales charges and has not been annualized. |
| g | Net expense information reflects the expense ratios after expense waivers. |
| h | Since commencement of operations: May 3, 2010. Percentage amounts for the period, except total return and portfolio turnover rate, have been annualized. |
| i | Since commencement of operations: March 29, 2010. Percentage amounts for the period, except total return and portfolio turnover rate, have been annualized. |
| 14 | THE GUGGENHEIM FUNDS SEMI-ANNUAL REPORT | SEE NOTES TO FINANCIAL STATEMENTS. |
| FUND PROFILE (Unaudited) | June 30, 2013 |
MULTI-HEDGE STRATEGIES FUND
OBJECTIVE: Seeks long-term capital appreciation with less risk than traditional equity funds.
Consolidated Holdings Diversification (Market Exposure as % of Net Assets)
“Consolidated Holdings Diversification (Market Exposure as % of Net Assets)” excludes any temporary cash investments.
| Inception Dates: | |
| A-Class | September 19, 2005 |
| C-Class | September 19, 2005 |
| H-Class | September 19, 2005 |
| Institutional Class | May 3, 2010 |
| Ten Largest Long Holdings | | | |
| (% of Total Net Assets) | | | |
| National Financial Partners Corp. | | | 2.6 | % |
| BMC Software, Inc. | | | 2.2 | % |
| Lufkin Industries, Inc. | | | 2.2 | % |
| NYSE Euronext | | | 2.0 | % |
| N.V. Energy, Inc. | | | 2.0 | % |
| Gardner Denver, Inc. | | | 2.0 | % |
| Arbitron, Inc. | | | 1.7 | % |
| Hudson City Bancorp, Inc. | | | 1.4 | % |
| True Religion Apparel, Inc. | | | 1.3 | % |
| Life Technologies Corp. | | | 1.2 | % |
| Top Ten Total | | | 18.6 | % |
“Ten Largest Long Holdings” exclude any temporary cash or derivative investments.
| THE GUGGENHEIM FUNDS SEMI-ANNUAL REPORT | 15 |
| CONSOLIDATED SCHEDULE OF INVESTMENTS (Unaudited) | June 30, 2013 |
| MULTI-HEDGE STRATEGIES FUND |
| | | Shares | | | Value | |
| | | | | | | | | |
| COMMON STOCKS† - 58.8% | | | | | | | | |
| FINANCIALS - 14.2% | | | | | | | | |
| National Financial Partners Corp.*,1 | | | 111,558 | | | $ | 2,823,524 | |
| NYSE Euronext1 | | | 52,849 | | | | 2,187,949 | |
| Hudson City Bancorp, Inc.1 | | | 165,788 | | | | 1,518,619 | |
| Colonial Properties Trust1 | | | 50,140 | | | | 1,209,377 | |
| Virginia Commerce Bancorp, Inc.*,1 | | | 38,933 | | | | 543,505 | |
| Knight Capital Group, Inc. — Class A*,1 | | | 112,554 | | | | 404,068 | |
| Netspend Holdings, Inc.*,1 | | | 22,721 | | | | 362,855 | |
| American Safety Insurance Holdings Ltd.*,1 | | | 12,412 | | | | 359,328 | |
| StellarOne Corp.1 | | | 18,013 | | | | 353,955 | |
| BOK Financial Corp.1 | | | 4,136 | | | | 264,911 | |
| HCC Insurance Holdings, Inc.1 | | | 6,066 | | | | 261,506 | |
| Allstate Corp.1 | | | 5,423 | | | | 260,955 | |
| Aspen Insurance Holdings Ltd.1 | | | 6,894 | | | | 255,698 | |
| MFA Financial, Inc.1 | | | 29,781 | | | | 251,649 | |
| Everest Re Group Ltd.1 | | | 1,961 | | | | 251,518 | |
| XL Group plc — Class A1 | | | 8,212 | | | | 248,988 | |
| Hatteras Financial Corp.1 | | | 9,651 | | | | 237,801 | |
| Axis Capital Holdings Ltd.1 | | | 5,117 | | | | 234,256 | |
| American Capital Ltd.*,1 | | | 18,107 | | | | 229,416 | |
| CapitalSource, Inc.1 | | | 23,868 | | | | 223,882 | |
| Arch Capital Group Ltd.*,1 | | | 4,320 | | | | 222,091 | |
| Annaly Capital Management, Inc.1 | | | 16,974 | | | | 213,363 | |
| Ares Capital Corp.1 | | | 11,674 | | | | 200,793 | |
| Protective Life Corp.1 | | | 4,964 | | | | 190,667 | |
| Goldman Sachs Group, Inc.1 | | | 1,225 | | | | 185,281 | |
| MPG Office Trust, Inc.*,1 | | | 57,899 | | | | 181,803 | |
| Douglas Emmett, Inc.1 | | | 6,802 | | | | 169,710 | |
| First Financial Holdings, Inc.1 | | | 7,997 | | | | 169,616 | |
| Synovus Financial Corp.1 | | | 50,216 | | | | 146,631 | |
| Macerich Co.1 | | | 2,298 | | | | 140,109 | |
| Bank of America Corp.1 | | | 10,785 | | | | 138,695 | |
| PartnerRe Ltd.1 | | | 1,471 | | | | 133,214 | |
| Regions Financial Corp.1 | | | 13,205 | | | | 125,844 | |
| Torchmark Corp.1 | | | 1,899 | | | | 123,701 | |
| American Capital Agency Corp.1 | | | 4,933 | | | | 113,410 | |
| SunTrust Banks, Inc.1 | | | 2,757 | | | | 87,038 | |
| SLM Corp.1 | | | 3,370 | | | | 77,038 | |
| Corrections Corporation of America1 | | | 2,206 | | | | 74,717 | |
| Extra Space Storage, Inc.1 | | | 1,440 | | | | 60,379 | |
| Wells Fargo & Co.1 | | | 1,286 | | | | 53,073 | |
| Discover Financial Services1 | | | 1,011 | | | | 48,164 | |
| Morgan Stanley1 | | | 888 | | | | 21,694 | |
| Roma Financial Corp.1 | | | 1,046 | | | | 18,995 | |
| National Retail Properties, Inc.1 | | | 153 | | | | 5,263 | |
| People’s United Financial, Inc.1 | | | 306 | | | | 4,559 | |
| Total Financials | | | | | | | 15,389,608 | |
| CONSUMER DISCRETIONARY - 11.3% | | | | | | | | |
| Arbitron, Inc.1 | | | 39,611 | | | | 1,839,972 | |
| True Religion Apparel, Inc.1 | | | 45,595 | | | | 1,443,537 | |
| rue21, Inc.*,1 | | | 26,639 | | | | 1,108,448 | |
| WMS Industries, Inc.*,1 | | | 38,992 | | | | 994,686 | |
| Cooper Tire & Rubber Co.1 | | | 24,664 | | | | 818,105 | |
| 7 Days Group Holdings Ltd. ADR*,1 | | | 55,379 | | | | 763,677 | |
| Ameristar Casinos, Inc.1 | | | 24,979 | | | | 656,698 | |
| Stewart Enterprises, Inc. — Class A1 | | | 31,012 | | | | 405,947 | |
| Belo Corp. — Class A1 | | | 24,613 | | | | 343,351 | |
| OfficeMax, Inc.1 | | | 30,859 | | | | 315,688 | |
| Service Corporation International1 | | | 14,553 | | | | 262,391 | |
| Foot Locker, Inc.1 | | | 7,446 | | | | 261,578 | |
| Comcast Corp. — Class A1 | | | 6,222 | | | | 260,578 | |
| Liberty Interactive Corp. — Class A*,1 | | | 11,214 | | | | 258,034 | |
| Thomson Reuters Corp.1,2 | | | 7,813 | | | | 254,469 | |
| Chico’s FAS, Inc.1 | | | 14,523 | | | | 247,762 | |
| Time Warner Cable, Inc.1 | | | 2,155 | | | | 242,395 | |
| Wyndham Worldwide Corp.1 | | | 3,738 | | | | 213,926 | |
| Abercrombie & Fitch Co. — Class A1 | | | 4,228 | | | | 191,317 | |
| Macy’s, Inc.1 | | | 3,523 | | | | 169,105 | |
| Dillard’s, Inc. — Class A1 | | | 1,961 | | | | 160,743 | |
| Brinker International, Inc.1 | | | 4,045 | | | | 159,494 | |
| American Eagle Outfitters, Inc.1 | | | 7,507 | | | | 137,078 | |
| Time Warner, Inc.1 | | | 1,808 | | | | 104,539 | |
| Fossil Group, Inc.*,1 | | | 950 | | | | 98,144 | |
| Lear Corp.1 | | | 1,379 | | | | 83,374 | |
| Whirlpool Corp.1 | | | 705 | | | | 80,624 | |
| Penn National Gaming, Inc.*,1 | | | 1,410 | | | | 74,533 | |
| Newell Rubbermaid, Inc.1 | | | 2,482 | | | | 65,153 | |
| Hanesbrands, Inc.1 | | | 1,225 | | | | 62,990 | |
| PulteGroup, Inc.*,1 | | | 2,359 | | | | 44,751 | |
| Carter’s, Inc.1 | | | 521 | | | | 38,590 | |
| Delphi Automotive plc1 | | | 552 | | | | 27,981 | |
| Darden Restaurants, Inc.1 | | | 521 | | | | 26,300 | |
| The Gap, Inc.1 | | | 460 | | | | 19,196 | |
| DR Horton, Inc.1 | | | 673 | | | | 14,321 | |
| Madison Square Garden Co. — Class A*,1 | | | 184 | | | | 10,902 | |
| Total Consumer Discretionary | | | | | | | 12,260,377 | |
| INFORMATION TECHNOLOGY - 9.6% | | | | | | | | |
| BMC Software, Inc.*,1 | | | 53,318 | | | | 2,406,776 | |
| Dell, Inc.1 | | | 93,923 | | | | 1,253,872 | |
| Intermec, Inc.*,1 | | | 100,988 | | | | 992,713 | |
| ExactTarget, Inc.*,1 | | | 21,548 | | | | 726,598 | |
| Keynote Systems, Inc. | | | 18,401 | | | | 363,604 | |
| AsiaInfo-Linkage, Inc.*,1 | | | 25,776 | | | | 297,454 | |
| Cisco Systems, Inc.1 | | | 10,754 | | | | 261,429 | |
| Alliance Data Systems Corp.*,1 | | | 1,440 | | | | 260,682 | |
| STEC, Inc.* | | | 37,932 | | | | 254,903 | |
| Activision Blizzard, Inc.1 | | | 17,740 | | | | 252,972 | |
| Western Digital Corp.1 | | | 4,045 | | | | 251,154 | |
| KLA-Tencor Corp.1 | | | 4,473 | | | | 249,280 | |
| Symantec Corp.1 | | | 9,743 | | | | 218,925 | |
| Intel Corp.1 | | | 8,946 | | | | 216,672 | |
| Fidelity National Information Services, Inc.1 | | | 4,657 | | | | 199,506 | |
| Power-One, Inc.*,1 | | | 28,720 | | | | 181,511 | |
| Brocade Communications Systems, Inc.*,1 | | | 29,812 | | | | 171,717 | |
| NeuStar, Inc. — Class A*,1 | | | 3,370 | | | | 164,052 | |
| Maxim Integrated Products, Inc.1 | | | 5,606 | | | | 155,735 | |
| 16 | THE GUGGENHEIM FUNDS SEMI-ANNUAL REPORT | SEE NOTES TO FINANCIAL STATEMENTS. |
| CONSOLIDATED SCHEDULE OF INVESTMENTS (Unaudited) (continued) | June 30, 2013 |
| MULTI-HEDGE STRATEGIES FUND |
| | | Shares | | | Value | |
| | | | | | | |
| Ebix, Inc.1 | | | 16,510 | | | $ | 152,882 | |
| AOL, Inc.1 | | | 4,136 | | | | 150,881 | |
| Computer Sciences Corp.1 | | | 3,217 | | | | 140,808 | |
| QUALCOMM, Inc.1 | | | 2,298 | | | | 140,362 | |
| DST Systems, Inc.1 | | | 1,838 | | | | 120,077 | |
| Harris Corp.1 | | | 2,114 | | | | 104,115 | |
| CoreLogic, Inc.*,1 | | | 3,829 | | | | 88,718 | |
| EMC Corp.1 | | | 3,738 | | | | 88,292 | |
| LSI Corp.*,1 | | | 11,244 | | | | 80,282 | |
| Xerox Corp.1 | | | 8,027 | | | | 72,805 | |
| NVIDIA Corp.1 | | | 5,086 | | | | 71,357 | |
| Adobe Systems, Inc.*,1 | | | 1,410 | | | | 64,240 | |
| Market Leader, Inc.*,1 | | | 5,370 | | | | 57,459 | |
| Booz Allen Hamilton Holding Corp.1 | | | 2,910 | | | | 50,576 | |
| Synopsys, Inc.*,1 | | | 1,225 | | | | 43,794 | |
| CA, Inc.1 | | | 1,502 | | | | 43,002 | |
| EchoStar Corp. — Class A*,1 | | | 980 | | | | 38,328 | |
| Trimble Navigation Ltd.*,1 | | | 1,379 | | | | 35,868 | |
| Molex, Inc.1 | | | 919 | | | | 26,963 | |
| Cadence Design Systems, Inc.*,1 | | | 1,379 | | | | 19,968 | |
| Avago Technologies Ltd.1 | | | 61 | | | | 2,280 | |
| Total Information Technology | | | | | | | 10,472,612 | |
| INDUSTRIALS - 5.3% | | | | | | | | |
| Gardner Denver, Inc.1 | | | 28,623 | | | | 2,151,877 | |
| Northrop Grumman Corp.1 | | | 3,126 | | | | 258,832 | |
| Trinity Industries, Inc.1 | | | 6,464 | | | | 248,477 | |
| Carlisle Companies, Inc.1 | | | 3,922 | | | | 244,380 | |
| Southwest Airlines Co.1 | | | 18,690 | | | | 240,914 | |
| Ingersoll-Rand plc1 | | | 4,045 | | | | 224,578 | |
| Union Pacific Corp.1 | | | 1,429 | | | | 220,466 | |
| FedEx Corp.1 | | | 2,145 | | | | 211,455 | |
| Crane Co.1 | | | 3,401 | | | | 203,788 | |
| Cintas Corp.1 | | | 4,259 | | | | 193,954 | |
| MRC Global, Inc.*,1 | | | 6,434 | | | | 177,706 | |
| Avery Dennison Corp.1 | | | 4,075 | | | | 174,247 | |
| Raytheon Co.1 | | | 2,390 | | | | 158,027 | |
| Air Lease Corp. — Class A1 | | | 5,056 | | | | 139,495 | |
| Terex Corp.*,1 | | | 5,218 | | | | 137,233 | |
| Hertz Global Holdings, Inc.*,1 | | | 5,086 | | | | 126,133 | |
| Regal-Beloit Corp.1 | | | 1,838 | | | | 119,176 | |
| Oshkosh Corp.*,1 | | | 2,910 | | | | 110,493 | |
| L-3 Communications Holdings, Inc.1 | | | 1,286 | | | | 110,262 | |
| AGCO Corp.1 | | | 2,176 | | | | 109,213 | |
| URS Corp.1 | | | 1,930 | | | | 91,135 | |
| GATX Corp.1 | | | 827 | | | | 39,225 | |
| Timken Co.1 | | | 644 | | | | 36,244 | |
| CNH Global N.V.1 | | | 797 | | | | 33,203 | |
| Equifax, Inc.1 | | | 491 | | | | 28,935 | |
| Triumph Group, Inc.1 | | | 184 | | | | 14,564 | |
| Delta Air Lines, Inc.*,1 | | | 245 | | | | 4,584 | |
| Total Industrials | | | | | | | 5,808,596 | |
| HEALTH CARE - 4.7% | | | | | | | | |
| Life Technologies Corp.*,1 | | | 16,942 | | | | 1,253,877 | |
| Assisted Living Concepts, Inc. — Class A1 | | | 55,239 | | | | 660,659 | |
| Warner Chilcott plc — Class A1 | | | 28,094 | | | | 558,509 | |
| Vanguard Health Systems, Inc.* | | | 21,267 | | | | 441,078 | |
| Biogen Idec, Inc.*,1 | | | 1,194 | | | | 256,948 | |
| Cooper Companies, Inc.1 | | | 2,114 | | | | 251,672 | |
| Amgen, Inc.1 | | | 2,472 | | | | 243,888 | |
| Pfizer, Inc.1 | | | 6,955 | | | | 194,810 | |
| Medtronic, Inc.1 | | | 3,615 | | | | 186,065 | |
| United Therapeutics Corp.*,1 | | | 2,818 | | | | 185,481 | |
| MEDNAX, Inc.*,1 | | | 1,777 | | | | 162,738 | |
| Perrigo Co.1 | | | 898 | | | | 108,658 | |
| ResMed, Inc.1 | | | 2,359 | | | | 106,462 | |
| McKesson Corp.1 | | | 919 | | | | 105,226 | |
| Merck & Company, Inc.1 | | | 1,593 | | | | 73,995 | |
| Omnicare, Inc.1 | | | 1,440 | | | | 68,702 | |
| Abbott Laboratories1 | | | 1,838 | | | | 64,109 | |
| Universal Health Services, Inc. — Class B1 | | | 613 | | | | 41,046 | |
| Quest Diagnostics, Inc.1 | | | 613 | | | | 37,166 | |
| Tenet Healthcare Corp.*,1 | | | 797 | | | | 36,742 | |
| HCA Holdings, Inc.1 | | | 735 | | | | 26,504 | |
| UnitedHealth Group, Inc.1 | | | 368 | | | | 24,097 | |
| Alexion Pharmaceuticals, Inc.*,1 | | | 245 | | | | 22,599 | |
| Zimmer Holdings, Inc.1 | | | 275 | | | | 20,609 | |
| Cigna Corp.1 | | | 122 | | | | 8,844 | |
| Agilent Technologies, Inc.1 | | | 122 | | | | 5,217 | |
| Total Health Care | | | | | | | 5,145,701 | |
| ENERGY - 4.1% | | | | | | | | |
| Lufkin Industries, Inc.1 | | | 26,434 | | | | 2,338,616 | |
| ConocoPhillips1 | | | 4,228 | | | | 255,793 | |
| Chevron Corp.1 | | | 2,144 | | | | 253,721 | |
| Valero Energy Corp.1 | | | 5,791 | | | | 201,353 | |
| HollyFrontier Corp.1 | | | 4,687 | | | | 200,510 | |
| Hess Corp.1 | | | 2,941 | | | | 195,547 | |
| Murphy Oil Corp.1 | | | 2,788 | | | | 169,761 | |
| Superior Energy Services, Inc.*,1 | | | 6,219 | | | | 161,321 | |
| Denbury Resources, Inc.*,1 | | | 8,915 | | | | 154,408 | |
| Unit Corp.*,1 | | | 2,941 | | | | 125,228 | |
| Marathon Petroleum Corp.1 | | | 1,685 | | | | 119,736 | |
| Tesoro Corp.1 | | | 1,899 | | | | 99,356 | |
| Patterson-UTI Energy, Inc.1 | | | 4,351 | | | | 84,214 | |
| Helmerich & Payne, Inc.1 | | | 1,072 | | | | 66,946 | |
| Phillips 661 | | | 797 | | | | 46,951 | |
| Golar LNG Ltd.1 | | | 337 | | | | 10,747 | |
| Total Energy | | | | | | | 4,484,208 | |
| UTILITIES - 4.0% | | | | | | | | |
| N.V. Energy, Inc.1 | | | 91,771 | | | | 2,152,949 | |
| Westar Energy, Inc.1 | | | 8,180 | | | | 261,434 | |
| DTE Energy Co.1 | | | 3,860 | | | | 258,658 | |
| Pinnacle West Capital Corp.1 | | | 4,504 | | | | 249,837 | |
| American Water Works Company, Inc.1 | | | 5,913 | | | | 243,793 | |
| CMS Energy Corp.1 | | | 8,946 | | | | 243,063 | |
| Atmos Energy Corp.1 | | | 5,913 | | | | 242,788 | |
| SCANA Corp.1 | | | 4,167 | | | | 204,600 | |
| Great Plains Energy, Inc.1 | | | 8,058 | | | | 181,627 | |
| NRG Energy, Inc.1 | | | 5,453 | | | | 145,595 | |
| Integrys Energy Group, Inc.1 | | | 1,593 | | | | 93,238 | |
| UGI Corp.1 | | | 1,593 | | | | 62,302 | |
| Vectren Corp.1 | | | 491 | | | | 16,611 | |
| Total Utilities | | | | | | | 4,356,495 | |
| SEE NOTES TO FINANCIAL STATEMENTS. | THE GUGGENHEIM FUNDS SEMI-ANNUAL REPORT | 17 |
| CONSOLIDATED SCHEDULE OF INVESTMENTS (Unaudited) (continued) | June 30, 2013 |
| MULTI-HEDGE STRATEGIES FUND |
| | | Shares | | | Value | |
| | | | | | | |
| MATERIALS - 2.8% | | | | | | | | |
| Buckeye Technologies, Inc.1 | | | 30,044 | | | $ | 1,112,831 | |
| Reliance Steel & Aluminum Co.1 | | | 3,983 | | | | 261,125 | |
| Westlake Chemical Corp.1 | | | 2,635 | | | | 254,040 | |
| LyondellBasell Industries N.V. — Class A1 | | | 3,829 | | | | 253,710 | |
| Rock Tenn Co. — Class A1 | | | 2,451 | | | | 244,806 | |
| CF Industries Holdings, Inc.1 | | | 1,379 | | | | 236,498 | |
| Commercial Metals Co.1 | | | 15,901 | | | | 234,858 | |
| Greif, Inc. — Class A1 | | | 3,523 | | | | 185,556 | |
| Crown Holdings, Inc.*,1 | | | 2,635 | | | | 108,378 | |
| Cabot Corp.1 | | | 2,421 | | | | 90,594 | |
| Huntsman Corp.1 | | | 1,685 | | | | 27,904 | |
| Cytec Industries, Inc.1 | | | 153 | | | | 11,207 | |
| Packaging Corporation of America1 | | | 214 | | | | 10,477 | |
| NewMarket Corp.1 | | | 31 | | | | 8,139 | |
| Total Materials | | | | | | | 3,040,123 | |
| CONSUMER STAPLES - 2.7% | | | | | | | | |
| Smithfield Foods, Inc.*,1 | | | 30,666 | | | | 1,004,312 | |
| JM Smucker Co.1 | | | 2,543 | | | | 262,310 | |
| Coca-Cola Enterprises, Inc.1 | | | 7,138 | | | | 250,973 | |
| CVS Caremark Corp.1 | | | 4,381 | | | | 250,505 | |
| Ingredion, Inc.1 | | | 3,768 | | | | 247,257 | |
| Energizer Holdings, Inc.1 | | | 2,298 | | | | 230,972 | |
| General Mills, Inc.1 | | | 3,707 | | | | 179,901 | |
| Nu Skin Enterprises, Inc. — Class A1 | | | 2,268 | | | | 138,621 | |
| Dean Foods Co.*,1 | | | 13,665 | | | | 136,923 | |
| Kroger Co.1 | | | 2,910 | | | | 100,511 | |
| Flowers Foods, Inc.1 | | | 3,723 | | | | 82,092 | |
| Molson Coors Brewing Co. — Class B1 | | | 919 | | | | 43,983 | |
| Green Mountain Coffee Roasters, Inc.*,1 | | | 184 | | | | 13,811 | |
| Constellation Brands, Inc. — Class A*,1 | | | 245 | | | | 12,769 | |
| Total Consumer Staples | | | | | | | 2,954,940 | |
| TELECOMMUNICATION SERVICES - 0.1% | | | | | | | | |
| Verizon Communications, Inc.1 | | | 1,593 | | | | 80,191 | |
| CenturyLink, Inc.1 | | | 459 | | | | 16,226 | |
| Total Telecommunication Services | | | | | | | 96,417 | |
| Total Common Stocks | | | | | | | | |
| (Cost $59,146,534) | | | | | | | 64,009,077 | |
| CLOSED-END FUNDS† - 13.8% | | | | | | | | |
| BlackRock Enhanced Equity Dividend Trust1 | | | 101,635 | | | | 773,441 | |
| BlackRock Credit Allocation Income Trust1 | | | 59,586 | | | | 773,426 | |
| Cohen & Steers REIT and Preferred Income Fund, Inc.1 | | | 44,447 | | | | 768,044 | |
| AllianceBernstein Income Fund1 | | | 102,775 | | | | 766,701 | |
| Western Asset/Claymore Inflation-Linked Opportunities & Income Fund1 | | | 63,823 | | | | 756,303 | |
| Eaton Vance Enhanced Equity Income Fund II1 | | | 57,883 | | | | 665,655 | |
| Adams Express Co.1 | | | 55,507 | | | | 664,419 | |
| Nuveen Dividend Advantage Municipal Income Fund1 | | | 44,214 | | | | 590,256 | |
| AllianzGI Equity & Convertible Income Fund1 | | | 31,488 | | | | 577,175 | |
| BlackRock Income Opportunity Trust, Inc.1 | | | 44,965 | | | | 452,347 | |
| Western Asset/Claymore Inflation-Linked Securities & Income Fund1 | | | 33,242 | | | | 397,574 | |
| Zweig Total Return Fund, Inc.1 | | | 28,300 | | | | 363,938 | |
| Morgan Stanley Emerging Markets Debt Fund, Inc.1 | | | 34,781 | | | | 354,071 | |
| Eaton Vance Risk-Managed Diversified Equity Income Fund1 | | | 30,312 | | | | 330,401 | |
| Tri-Continental Corp.1 | | | 18,310 | | | | 328,115 | |
| Gabelli Dividend & Income Trust1 | | | 16,280 | | | | 314,367 | |
| Nuveen Maryland Premium Income Municipal Fund1 | | | 22,997 | | | | 308,160 | |
| Advent Claymore Convertible Securities and Income Fund II1 | | | 40,562 | | | | 279,878 | |
| John Hancock Hedged Equity & Income Fund1 | | | 16,140 | | | | 272,605 | |
| BlackRock Global Opportunities Equity Trust1 | | | 19,726 | | | | 266,301 | |
| Swiss Helvetia Fund, Inc.1 | | | 19,884 | | | | 244,971 | |
| General American Investors Company, Inc.1 | | | 7,564 | | | | 241,594 | |
| Western Asset Worldwide Income Fund, Inc.1 | | | 17,691 | | | | 231,575 | |
| Gabelli Healthcare & WellnessRx Trust1,2 | | | 23,317 | | | | 228,507 | |
| First Trust Enhanced Equity Income Fund1 | | | 17,056 | | | | 215,076 | |
| BlackRock MuniYield Michigan Quality Fund II, Inc.1 | | | 16,886 | | | | 214,790 | |
| China Fund, Inc.1 | | | 10,194 | | | | 203,676 | |
| GDL Fund1 | | | 17,845 | | | | 203,255 | |
| Madison Covered Call & Equity Strategy Fund1 | | | 25,608 | | | | 203,071 | |
| Central Europe Russia and Turkey Fund, Inc.1 | | | 6,012 | | | | 179,278 | |
| Morgan Stanley Income Securities, Inc.1 | | | 9,535 | | | | 162,381 | |
| Royce Value Trust, Inc.1 | | | 10,640 | | | | 161,302 | |
| Putnam High Income Securities Fund1 | | | 19,600 | | | | 154,840 | |
| Clough Global Allocation Fund1 | | | 10,177 | | | | 154,385 | |
| Cohen & Steers Infrastructure Fund, Inc.1 | | | 7,749 | | | | 146,379 | |
| Royce Micro-Capital Trust, Inc.1 | | | 12,738 | | | | 137,698 | |
| MFS InterMarket Income Trust I1 | | | 16,541 | | | | 134,313 | |
| Lazard Global Total Return and Income Fund, Inc.1 | | | 7,482 | | | | 122,256 | |
| Clough Global Opportunities Fund1 | | | 8,207 | | | | 105,624 | |
| Liberty All Star Equity Fund1 | | | 20,071 | | | | 104,369 | |
| Morgan Stanley India Investment Fund, Inc.1 | | | 6,711 | | | | 103,417 | |
| Nuveen New Jersey Dividend Advantage Municipal Fund1 | | | 6,998 | | | | 94,543 | |
| Delaware Investments National Municipal Income Fund1 | | | 7,217 | | | | 91,872 | |
| Ellsworth Fund Ltd.1 | | | 11,985 | | | | 91,805 | |
| Bancroft Fund Ltd.1 | | | 5,181 | | | | 89,787 | |
| Eaton Vance Enhanced Equity Income Fund1 | | | 7,631 | | | | 88,138 | |
| Korea Equity Fund, Inc.1 | | | 10,766 | | | | 84,190 | |
| Morgan Stanley Asia Pacific Fund, Inc.1 | | | 5,184 | | | | 81,285 | |
| New Ireland Fund, Inc.1 | | | 7,249 | | | | 75,027 | |
| Liberty All Star Growth Fund, Inc.1 | | | 15,533 | | | | 69,588 | |
| 18 | THE GUGGENHEIM FUNDS SEMI-ANNUAL REPORT | SEE NOTES TO FINANCIAL STATEMENTS. |
| CONSOLIDATED SCHEDULE OF INVESTMENTS (Unaudited) (continued) | June 30, 2013 |
| MULTI-HEDGE STRATEGIES FUND | |
| | Shares | | | Value | |
| | | | | | | |
| Helios Strategic Income Fund, Inc.1 | | | 10,873 | | | $ | 66,325 | |
| Madison Strategic Sector Premium Fund1 | | | 5,719 | | | | 66,283 | |
| Asia Tigers Fund, Inc.1 | | | 5,595 | | | | 64,119 | |
| Japan Smaller Capitalization Fund, Inc.1 | | | 6,583 | | | | 56,416 | |
| First Trust Dividend and Income Fund1 | | | 6,406 | | | | 52,145 | |
| DWS Global High Income Fund, Inc.1 | | | 6,296 | | | | 50,998 | |
| Nuveen Pennsylvania Dividend Advantage Municipal Fund 21 | | | 3,677 | | | | 47,875 | |
| India Fund, Inc.1 | | | 1,981 | | | | 37,976 | |
| Korea Fund, Inc.1 | | | 923 | | | | 31,816 | |
| New Germany Fund, Inc.1 | | | 1,703 | | | | 29,939 | |
| European Equity Fund, Inc.1 | | | 4,166 | | | | 29,829 | |
| Templeton Dragon Fund, Inc.1 | | | 1,037 | | | | 26,029 | |
| Greater China Fund, Inc.1 | | | 545 | | | | 5,973 | |
| Total Closed-End Funds | | | | | | | | |
| (Cost $14,343,431) | | | | | | | 14,987,892 | |
| | | | | | | | | |
| | | Face | | | | | |
| | | Amount | | | | | |
| REPURCHASE AGREEMENTS††,3 - 9.1% | | | | | | | | |
| HSBC Group | | | | | | | | |
| issued 06/28/13 at 0.07% | | | | | | | | |
| due 07/01/13 | | $ | 7,932,074 | | | | 7,932,074 | |
| Mizuho Financial Group, Inc. | | | | | | | | |
| issued 06/28/13 at 0.06% | | | | | | | | |
| due 07/01/13 | | | 1,363,276 | | | | 1,363,276 | |
| Deutsche Bank | | | | | | | | |
| issued 06/28/13 at 0.06% | | | | | | | | |
| due 07/01/13 | | | 553,400 | | | | 553,400 | |
| Total Repurchase Agreements | | | | | | | | |
| (Cost $9,848,750) | | | | | | | 9,848,750 | |
| | | | | | | | | |
| SECURITIES LENDING COLLATERAL††,4 - 0.1% | | | | | | | | |
| Repurchase Agreements | | | | | | | | |
| HSBC Securities, Inc. | | | | | | | | |
| issued 06/28/13 at 0.11% | | | | | | | | |
| due 07/01/13 | | | 98,748 | | | | 98,748 | |
| RBS Securities, Inc. | | | | | | | | |
| issued 06/28/13 at 0.10% | | | | | | | | |
| due 07/01/13 | | | 11,550 | | | | 11,550 | |
| Total Securities Lending Collateral | | | | | | | | |
| (Cost $110,298) | | | | | | | 110,298 | |
| Total Long Investments - 81.8% | | | | | | | | |
| (Cost $83,449,013) | | | | | | $ | 88,956,017 | |
| | | | | | | | | |
| | | Shares | | | | | |
| COMMON STOCKS SOLD SHORT† - (31.1)% | | | | | | | | |
| TELECOMMUNICATION SERVICES - (0.1)% | | | | | | | | |
| Level 3 Communications, Inc.* | | | 5,906 | | | | (124,498 | ) |
| ENERGY - (1.6)% | | | | | | | | |
| Devon Energy Corp. | | | 92 | | | | (4,773 | ) |
| Williams Companies, Inc. | | | 493 | | | | (16,008 | ) |
| EXCO Resources, Inc. | | | 8,735 | | | | (66,735 | ) |
| McDermott International, Inc.* | | | 8,551 | | | | (69,947 | ) |
| CONSOL Energy, Inc. | | | 4,061 | | | | (110,053 | ) |
| Peabody Energy Corp. | | | 7,751 | | | | (113,475 | ) |
| Alpha Natural Resources, Inc.* | | | 21,685 | | | | (113,629 | ) |
| Newfield Exploration Co.* | | | 5,014 | | | | (119,784 | ) |
| Kosmos Energy Ltd.* | | | 12,058 | | | | (122,509 | ) |
| Ultra Petroleum Corp.* | | | 6,213 | | | | (123,142 | ) |
| SM Energy Co. | | | 2,091 | | | | (125,418 | ) |
| Chesapeake Energy Corp. | | | 6,182 | | | | (125,989 | ) |
| Southwestern Energy Co.* | | | 3,506 | | | | (128,074 | ) |
| FMC Technologies, Inc.* | | | 2,338 | | | | (130,180 | ) |
| Dresser-Rand Group, Inc.* | | | 2,215 | | | | (132,856 | ) |
| Cobalt International Energy, Inc.* | | | 5,045 | | | | (134,046 | ) |
| Range Resources Corp. | | | 1,753 | | | | (135,542 | ) |
| Total Energy | | | | | | | (1,772,160 | ) |
| MATERIALS - (1.7)% | | | | | | | | |
| Allied Nevada Gold Corp.* | | | 6,244 | | | | (40,461 | ) |
| Royal Gold, Inc. | | | 984 | | | | (41,407 | ) |
| Southern Copper Corp. | | | 1,938 | | | | (53,528 | ) |
| Dow Chemical Co. | | | 2,369 | | | | (76,211 | ) |
| Sealed Air Corp. | | | 3,814 | | | | (91,345 | ) |
| Walter Energy, Inc. | | | 9,566 | | | | (99,486 | ) |
| Silgan Holdings, Inc. | | | 2,246 | | | | (105,472 | ) |
| Praxair, Inc. | | | 953 | | | | (109,747 | ) |
| Alcoa, Inc. | | | 14,241 | | | | (111,365 | ) |
| Tahoe Resources, Inc.* | | | 8,398 | | | | (118,832 | ) |
| Celanese Corp. — Class A | | | 2,737 | | | | (122,618 | ) |
| MeadWestvaco Corp. | | | 3,629 | | | | (123,785 | ) |
| Albemarle Corp. | | | 1,999 | | | | (124,518 | ) |
| Aptargroup, Inc. | | | 2,277 | | | | (125,713 | ) |
| Sigma-Aldrich Corp. | | | 1,569 | | | | (126,084 | ) |
| Compass Minerals International, Inc. | | | 1,507 | | | | (127,387 | ) |
| EI du Pont de Nemours & Co. | | | 2,461 | | | | (129,203 | ) |
| Scotts Miracle-Gro Co. — Class A | | | 2,707 | | | | (130,775 | ) |
| Total Materials | | | | | | | (1,857,937 | ) |
| CONSUMER STAPLES - (2.0)% | | | | | | | | |
| Church & Dwight Company, Inc. | | | 61 | | | | (3,764 | ) |
| Philip Morris International, Inc. | | | 616 | | | | (53,358 | ) |
| Altria Group, Inc. | | | 2,277 | | | | (79,672 | ) |
| Colgate-Palmolive Co. | | | 1,558 | | | | (89,258 | ) |
| Mead Johnson Nutrition Co. — Class A | | | 1,168 | | | | (92,541 | ) |
| Campbell Soup Co. | | | 2,184 | | | | (97,821 | ) |
| Mondelez International, Inc. — Class A | | | 3,476 | | | | (99,170 | ) |
| Brown-Forman Corp. — Class B | | | 1,523 | | | | (102,878 | ) |
| Avon Products, Inc. | | | 5,660 | | | | (119,030 | ) |
| Estee Lauder Companies, Inc. — Class A | | | 1,845 | | | | (121,346 | ) |
| Whole Foods Market, Inc. | | | 2,369 | | | | (121,956 | ) |
| Fresh Market, Inc.* | | | 2,492 | | | | (123,902 | ) |
| Hillshire Brands Co. | | | 3,783 | | | | (125,142 | ) |
| Coca-Cola Co. | | | 3,138 | | | | (125,865 | ) |
| Sysco Corp. | | | 3,752 | | | | (128,168 | ) |
| PepsiCo, Inc. | | | 1,569 | | | | (128,329 | ) |
| Kellogg Co. | | | 1,999 | | | | (128,396 | ) |
| Bunge Ltd. | | | 1,815 | | | | (128,448 | ) |
| ConAgra Foods, Inc. | | | 3,691 | | | | (128,927 | ) |
| Monster Beverage Corp.* | | | 2,184 | | | | (132,722 | ) |
| Total Consumer Staples | | | | | | | (2,130,693 | ) |
| SEE NOTES TO FINANCIAL STATEMENTS. | THE GUGGENHEIM FUNDS SEMI-ANNUAL REPORT | 19 |
| CONSOLIDATED SCHEDULE OF INVESTMENTS (Unaudited) (continued) | June 30, 2013 |
| MULTI-HEDGE STRATEGIES FUND | |
| | | Shares | | | Value | |
| | | | | | | |
| UTILITIES - (2.0)% | | | | | | | | |
| PG&E Corp. | | | 1,743 | | | $ | (79,707 | ) |
| TECO Energy, Inc. | | | 5,845 | | | | (100,476 | ) |
| FirstEnergy Corp. | | | 2,860 | | | | (106,792 | ) |
| Aqua America, Inc. | | | 3,537 | | | | (110,673 | ) |
| Exelon Corp. | | | 3,629 | | | | (112,064 | ) |
| Ameren Corp. | | | 3,414 | | | | (117,578 | ) |
| Duke Energy Corp. | | | 1,753 | | | | (118,328 | ) |
| Hawaiian Electric Industries, Inc. | | | 4,736 | | | | (119,868 | ) |
| ONEOK, Inc. | | | 2,922 | | | | (120,708 | ) |
| AES Corp. | | | 10,540 | | | | (126,375 | ) |
| Calpine Corp.* | | | 5,967 | | | | (126,679 | ) |
| Questar Corp. | | | 5,352 | | | | (127,645 | ) |
| CenterPoint Energy, Inc. | | | 5,444 | | | | (127,880 | ) |
| Southern Co. | | | 2,922 | | | | (128,948 | ) |
| Pepco Holdings, Inc. | | | 6,397 | | | | (128,964 | ) |
| Dominion Resources, Inc. | | | 2,296 | | | | (130,459 | ) |
| ITC Holdings Corp. | | | 1,446 | | | | (132,020 | ) |
| MDU Resources Group, Inc. | | | 5,188 | | | | (134,421 | ) |
| Total Utilities | | | | | | | (2,149,585 | ) |
| HEALTH CARE - (2.6)% | | | | | | | | |
| IDEXX Laboratories, Inc.* | | | 61 | | | | (5,477 | ) |
| Bruker Corp.* | | | 892 | | | | (14,406 | ) |
| Gilead Sciences, Inc.* | | | 369 | | | | (18,896 | ) |
| Varian Medical Systems, Inc.* | | | 430 | | | | (29,004 | ) |
| Alere, Inc.* | | | 3,107 | | | | (76,122 | ) |
| Johnson & Johnson | | | 1,323 | | | | (113,593 | ) |
| Onyx Pharmaceuticals, Inc.* | | | 1,354 | | | | (117,554 | ) |
| Hologic, Inc.* | | | 6,121 | | | | (118,135 | ) |
| BioMarin Pharmaceutical, Inc.* | | | 2,122 | | | | (118,386 | ) |
| Humana, Inc. | | | 1,415 | | | | (119,398 | ) |
| Incyte Corporation Ltd.* | | | 5,598 | | | | (123,156 | ) |
| Endo Health Solutions, Inc.* | | | 3,353 | | | | (123,357 | ) |
| Medivation, Inc.* | | | 2,553 | | | | (125,608 | ) |
| Ariad Pharmaceuticals, Inc.* | | | 7,197 | | | | (125,876 | ) |
| Boston Scientific Corp.* | | | 13,688 | | | | (126,888 | ) |
| Thoratec Corp.* | | | 4,061 | | | | (127,150 | ) |
| Allscripts Healthcare Solutions, Inc.* | | | 9,873 | | | | (127,757 | ) |
| Vertex Pharmaceuticals, Inc.* | | | 1,600 | | | | (127,792 | ) |
| Salix Pharmaceuticals Ltd.* | | | 1,938 | | | | (128,199 | ) |
| Forest Laboratories, Inc.* | | | 3,169 | | | | (129,929 | ) |
| Techne Corp. | | | 1,938 | | | | (133,877 | ) |
| Health Net, Inc.* | | | 4,214 | | | | (134,090 | ) |
| Actavis, Inc.* | | | 4,521 | | | | (570,641 | ) |
| Total Health Care | | | | | | | (2,835,291 | ) |
| CONSUMER DISCRETIONARY - (3.3)% | | | | | | | | |
| Hyatt Hotels Corp. — Class A* | | | 307 | | | | (12,391 | ) |
| DeVry, Inc. | | | 461 | | | | (14,300 | ) |
| Dollar Tree, Inc.* | | | 307 | | | | (15,608 | ) |
| Yum! Brands, Inc. | | | 276 | | | | (19,138 | ) |
| McDonald’s Corp. | | | 215 | | | | (21,285 | ) |
| Garmin Ltd. | | | 614 | | | | (22,202 | ) |
| Best Buy Company, Inc. | | | 1,046 | | | | (28,587 | ) |
| Nordstrom, Inc. | | | 523 | | | | (31,349 | ) |
| NIKE, Inc. — Class B | | | 493 | | | | (31,394 | ) |
| Choice Hotels International, Inc. | | | 861 | | | | (34,173 | ) |
| Guess?, Inc. | | | 1,230 | | | | (38,167 | ) |
| Wynn Resorts Ltd. | | | 307 | | | | (39,296 | ) |
| Gentex Corp. | | | 1,845 | | | | (42,527 | ) |
| International Game Technology | | | 2,952 | | | | (49,328 | ) |
| Wendy’s Co. | | | 8,828 | | | | (51,467 | ) |
| Interpublic Group of Companies, Inc. | | | 3,752 | | | | (54,592 | ) |
| Chipotle Mexican Grill, Inc. — Class A* | | | 154 | | | | (56,110 | ) |
| DSW, Inc. — Class A | | | 923 | | | | (67,813 | ) |
| Coach, Inc. | | | 1,323 | | | | (75,530 | ) |
| Apollo Group, Inc. — Class A* | | | 5,260 | | | | (93,207 | ) |
| Marriott International, Inc. — Class A | | | 2,386 | | | | (96,323 | ) |
| Netflix, Inc.* | | | 462 | | | | (97,524 | ) |
| Groupon, Inc. — Class A* | | | 11,904 | | | | (101,184 | ) |
| Starbucks Corp. | | | 1,692 | | | | (110,809 | ) |
| Harman International Industries, Inc. | | | 2,184 | | | | (118,373 | ) |
| Las Vegas Sands Corp. | | | 2,307 | | | | (122,110 | ) |
| Advance Auto Parts, Inc. | | | 1,538 | | | | (124,839 | ) |
| Tiffany & Co. | | | 1,723 | | | | (125,503 | ) |
| L Brands, Inc. | | | 2,553 | | | | (125,735 | ) |
| Family Dollar Stores, Inc. | | | 2,030 | | | | (126,489 | ) |
| JC Penney Company, Inc.* | | | 7,475 | | | | (127,673 | ) |
| Amazon.com, Inc.* | | | 462 | | | | (128,292 | ) |
| Staples, Inc. | | | 8,120 | | | | (128,783 | ) |
| CarMax, Inc.* | | | 2,799 | | | | (129,202 | ) |
| Tempur Sealy International, Inc.* | | | 2,952 | | | | (129,593 | ) |
| Clear Channel Outdoor Holdings, Inc. — Class A* | | | 17,655 | | | | (131,706 | ) |
| Morningstar, Inc. | | | 1,723 | | | | (133,670 | ) |
| Ulta Salon Cosmetics & Fragrance, Inc.* | | | 1,354 | | | | (135,617 | ) |
| DreamWorks Animation SKG, Inc. — Class A* | | | 5,691 | | | | (146,032 | ) |
| Cablevision Systems Corp. — Class A | | | 8,735 | | | | (146,923 | ) |
| Office Depot, Inc.* | | | 82,559 | | | | (319,504 | ) |
| Total Consumer Discretionary | | | | | | | (3,604,348 | ) |
| INFORMATION TECHNOLOGY - (3.5)% | | | | | | | | |
| Red Hat, Inc.* | | | 123 | | | | (5,882 | ) |
| MICROS Systems, Inc.* | | | 369 | | | | (15,922 | ) |
| Rovi Corp.* | | | 738 | | | | (16,856 | ) |
| Lender Processing Services, Inc. | | | 614 | | | | (19,863 | ) |
| Marvell Technology Group Ltd. | | | 1,754 | | | | (20,539 | ) |
| Cognizant Technology Solutions Corp. — Class A* | | | 370 | | | | (23,166 | ) |
| Western Union Co. | | | 1,385 | | | | (23,697 | ) |
| Trulia, Inc.* | | | 834 | | | | (25,929 | ) |
| Microchip Technology, Inc. | | | 861 | | | | (32,072 | ) |
| Linear Technology Corp. | | | 953 | | | | (35,109 | ) |
| Citrix Systems, Inc.* | | | 616 | | | | (37,163 | ) |
| Broadridge Financial Solutions, Inc. | | | 1,579 | | | | (41,970 | ) |
| Zynga, Inc. — Class A* | | | 17,841 | | | | (49,598 | ) |
| Fortinet, Inc.* | | | 3,814 | | | | (66,745 | ) |
| FactSet Research Systems, Inc. | | | 677 | | | | (69,013 | ) |
| Rackspace Hosting, Inc.* | | | 2,091 | | | | (79,228 | ) |
| Teradata Corp.* | | | 1,600 | | | | (80,368 | ) |
| Global Payments, Inc. | | | 1,845 | | | | (85,460 | ) |
| Automatic Data Processing, Inc. | | | 1,385 | | | | (95,371 | ) |
| 20 | THE GUGGENHEIM FUNDS SEMI-ANNUAL REPORT | SEE NOTES TO FINANCIAL STATEMENTS. |
| CONSOLIDATED SCHEDULE OF INVESTMENTS (Unaudited) (continued) | June 30, 2013 |
| MULTI-HEDGE STRATEGIES FUND | |
| | | Shares | | | Value | |
| | | | | | | |
| NetApp, Inc. | | | 2,654 | | | $ | (100,268 | ) |
| Riverbed Technology, Inc.* | | | 7,228 | | | | (112,468 | ) |
| Paychex, Inc. | | | 3,138 | | | | (114,600 | ) |
| Polycom, Inc.* | | | 11,319 | | | | (119,302 | ) |
| Juniper Networks, Inc.* | | | 6,367 | | | | (122,947 | ) |
| VMware, Inc. — Class A* | | | 1,845 | | | | (123,597 | ) |
| Atmel Corp.* | | | 16,825 | | | | (123,664 | ) |
| Altera Corp. | | | 3,752 | | | | (123,778 | ) |
| Ingram Micro, Inc. — Class A* | | | 6,614 | | | | (125,600 | ) |
| Solera Holdings, Inc. | | | 2,277 | | | | (126,715 | ) |
| Cypress Semiconductor Corp. | | | 11,873 | | | | (127,397 | ) |
| AVX Corp. | | | 10,858 | | | | (127,582 | ) |
| Informatica Corp.* | | | 3,660 | | | | (128,027 | ) |
| NCR Corp.* | | | 3,907 | | | | (128,892 | ) |
| ON Semiconductor Corp.* | | | 15,994 | | | | (129,232 | ) |
| Visa, Inc. — Class A | | | 708 | | | | (129,387 | ) |
| Hewlett-Packard Co. | | | 5,260 | | | | (130,448 | ) |
| Salesforce.com, Inc.* | | | 3,445 | | | | (131,530 | ) |
| JDS Uniphase Corp.* | | | 9,167 | | | | (131,821 | ) |
| Advanced Micro Devices, Inc.* | | | 33,035 | | | | (134,783 | ) |
| Diebold, Inc. | | | 4,030 | | | | (135,771 | ) |
| PMC - Sierra, Inc.* | | | 21,532 | | | | (136,728 | ) |
| Facebook, Inc. — Class A* | | | 5,505 | | | | (136,854 | ) |
| VeriFone Systems, Inc.* | | | 8,244 | | | | (138,582 | ) |
| Total Information Technology | | | | | | | (3,863,924 | ) |
| INDUSTRIALS - (3.6)% | | | | | | | | |
| Stericycle, Inc.* | | | 61 | | | | (6,736 | ) |
| MSC Industrial Direct Company, Inc. — Class A | | | 92 | | | | (7,126 | ) |
| United Parcel Service, Inc. — Class B | | | 123 | | | | (10,637 | ) |
| Armstrong World Industries, Inc.* | | | 369 | | | | (17,635 | ) |
| Nordson Corp. | | | 307 | | | | (21,278 | ) |
| Lockheed Martin Corp. | | | 215 | | | | (23,319 | ) |
| GrafTech International Ltd.* | | | 3,321 | | | | (24,177 | ) |
| IHS, Inc. — Class A* | | | 430 | | | | (44,884 | ) |
| Fluor Corp. | | | 769 | | | | (45,609 | ) |
| Chicago Bridge & Iron Company N.V. | | | 831 | | | | (49,577 | ) |
| Emerson Electric Co. | | | 923 | | | | (50,340 | ) |
| Copart, Inc.* | | | 1,999 | | | | (61,569 | ) |
| Joy Global, Inc. | | | 1,291 | | | | (62,652 | ) |
| J.B. Hunt Transport Services, Inc. | | | 892 | | | | (64,438 | ) |
| CH Robinson Worldwide, Inc. | | | 1,415 | | | | (79,679 | ) |
| Tyco International Ltd. | | | 2,645 | | | | (87,153 | ) |
| Iron Mountain, Inc. | | | 3,445 | | | | (91,671 | ) |
| Cummins, Inc. | | | 861 | | | | (93,384 | ) |
| Clean Harbors, Inc.* | | | 1,938 | | | | (97,927 | ) |
| CSX Corp. | | | 4,276 | | | | (99,160 | ) |
| Fastenal Co. | | | 2,246 | | | | (102,979 | ) |
| Deere & Co. | | | 1,415 | | | | (114,969 | ) |
| Navistar International Corp.* | | | 4,183 | | | | (116,120 | ) |
| SPX Corp. | | | 1,692 | | | | (121,790 | ) |
| General Cable Corp. | | | 3,968 | | | | (122,016 | ) |
| Matson, Inc. | | | 4,891 | | | | (122,275 | ) |
| KBR, Inc. | | | 3,814 | | | | (123,956 | ) |
| United Continental Holdings, Inc.* | | | 3,968 | | | | (124,159 | ) |
| Pentair Ltd. | | | 2,153 | | | | (124,207 | ) |
| Landstar System, Inc. | | | 2,420 | | | | (124,630 | ) |
| Stanley Black & Decker, Inc. | | | 1,630 | | | | (125,999 | ) |
| WW Grainger, Inc. | | | 502 | | | | (126,594 | ) |
| Pall Corp. | | | 1,907 | | | | (126,682 | ) |
| Donaldson Company, Inc. | | | 3,568 | | | | (127,235 | ) |
| 3M Co. | | | 1,168 | | | | (127,721 | ) |
| Expeditors International of Washington, Inc. | | | 3,384 | | | | (128,626 | ) |
| United Technologies Corp. | | | 1,385 | | | | (128,722 | ) |
| General Dynamics Corp. | | | 1,661 | | | | (130,106 | ) |
| Graco, Inc. | | | 2,060 | | | | (130,213 | ) |
| Harsco Corp. | | | 5,660 | | | | (131,255 | ) |
| Precision Castparts Corp. | | | 585 | | | | (132,216 | ) |
| Rollins, Inc. | | | 5,229 | | | | (135,431 | ) |
| UTI Worldwide, Inc. | | | 8,387 | | | | (138,134 | ) |
| Total Industrials | | | | | | | (3,924,986 | ) |
| FINANCIALS - (10.7)% | | | | | | | | |
| New York Community Bancorp, Inc. | | | 370 | | | | (5,180 | ) |
| BioMed Realty Trust, Inc. | | | 369 | | | | (7,465 | ) |
| Weyerhaeuser Co. | | | 493 | | | | (14,046 | ) |
| Investors Bancorp, Inc. | | | 936 | | | | (19,731 | ) |
| Franklin Resources, Inc. | | | 184 | | | | (25,028 | ) |
| T. Rowe Price Group, Inc. | | | 399 | | | | (29,187 | ) |
| Kilroy Realty Corp. | | | 738 | | | | (39,121 | ) |
| SEI Investments Co. | | | 1,415 | | | | (40,228 | ) |
| UDR, Inc. | | | 1,784 | | | | (45,474 | ) |
| Plum Creek Timber Company, Inc. | | | 1,138 | | | | (53,110 | ) |
| U.S. Bancorp | | | 1,569 | | | | (56,719 | ) |
| CNA Financial Corp. | | | 1,845 | | | | (60,184 | ) |
| BB&T Corp. | | | 1,815 | | | | (61,492 | ) |
| TFS Financial Corp.* | | | 5,885 | | | | (65,912 | ) |
| BRE Properties, Inc. | | | 1,323 | | | | (66,176 | ) |
| MetLife, Inc. | | | 1,600 | | | | (73,216 | ) |
| Washington Federal, Inc. | | | 4,153 | | | | (78,409 | ) |
| Lazard Ltd. — Class A | | | 2,492 | | | | (80,118 | ) |
| CIT Group, Inc.* | | | 1,815 | | | | (84,633 | ) |
| Invesco Ltd. | | | 3,076 | | | | (97,817 | ) |
| Realty Income Corp. | | | 2,584 | | | | (108,321 | ) |
| Hartford Financial Services Group, Inc. | | | 3,506 | | | | (108,406 | ) |
| Duke Realty Corp. | | | 7,413 | | | | (115,569 | ) |
| Mack-Cali Realty Corp. | | | 4,736 | | | | (115,985 | ) |
| Aon plc | | | 1,815 | | | | (116,795 | ) |
| Alexandria Real Estate Equities, Inc. | | | 1,784 | | | | (117,244 | ) |
| Howard Hughes Corp.* | | | 1,076 | | | | (120,609 | ) |
| Valley National Bancorp | | | 12,797 | | | | (121,188 | ) |
| American Campus Communities, Inc. | | | 2,983 | | | | (121,289 | ) |
| American Tower Corp. — Class A | | | 1,661 | | | | (121,535 | ) |
| Legg Mason, Inc. | | | 3,968 | | | | (123,048 | ) |
| Boston Properties, Inc. | | | 1,168 | | | | (123,189 | ) |
| White Mountains Insurance Group Ltd. | | | 215 | | | | (123,612 | ) |
| First Citizens BancShares, Inc. — Class A | | | 646 | | | | (124,064 | ) |
| Forest City Enterprises, Inc. — Class A* | | | 6,952 | | | | (124,510 | ) |
| SL Green Realty Corp. | | | 1,415 | | | | (124,789 | ) |
| SEE NOTES TO FINANCIAL STATEMENTS. | THE GUGGENHEIM FUNDS SEMI-ANNUAL REPORT | 21 |
| CONSOLIDATED SCHEDULE OF INVESTMENTS (Unaudited) (continued) | June 30, 2013 |
| MULTI-HEDGE STRATEGIES FUND | |
| | | Shares | | | Value | |
| | | | | | | |
| Vornado Realty Trust | | | 1,507 | | | $ | (124,855 | ) |
| MSCI, Inc. — Class A* | | | 3,783 | | | | (125,860 | ) |
| Piedmont Office Realty Trust, Inc. — Class A | | | 7,167 | | | | (128,146 | ) |
| AvalonBay Communities, Inc. | | | 953 | | | | (128,569 | ) |
| Brown & Brown, Inc. | | | 4,009 | | | | (129,250 | ) |
| Loews Corp. | | | 2,922 | | | | (129,737 | ) |
| ProAssurance Corp. | | | 2,492 | | | | (129,983 | ) |
| Marsh & McLennan Companies, Inc. | | | 3,261 | | | | (130,180 | ) |
| Commerce Bancshares, Inc. | | | 3,014 | | | | (131,290 | ) |
| Bank of Hawaii Corp. | | | 2,615 | | | | (131,587 | ) |
| Interactive Brokers Group, Inc. — Class A | | | 8,275 | | | | (132,152 | ) |
| Prudential Financial, Inc. | | | 1,815 | | | | (132,549 | ) |
| First Horizon National Corp. | | | 11,843 | | | | (132,642 | ) |
| Progressive Corp. | | | 5,229 | | | | (132,921 | ) |
| CME Group, Inc. — Class A | | | 1,753 | | | | (133,193 | ) |
| American Express Co. | | | 1,784 | | | | (133,372 | ) |
| Mercury General Corp. | | | 3,046 | | | | (133,902 | ) |
| TD Ameritrade Holding Corp. | | | 5,536 | | | | (134,469 | ) |
| City National Corp. | | | 2,122 | | | | (134,471 | ) |
| BankUnited, Inc. | | | 5,198 | | | | (135,200 | ) |
| Cullen/Frost Bankers, Inc. | | | 2,030 | | | | (135,543 | ) |
| Charles Schwab Corp. | | | 6,583 | | | | (139,757 | ) |
| SVB Financial Group* | | | 1,692 | | | | (140,977 | ) |
| E*TRADE Financial Corp.* | | | 11,381 | | | | (144,083 | ) |
| SCBT Financial Corp. | | | 3,498 | | | | (176,264 | ) |
| Union First Market Bankshares Corp. | | | 17,642 | | | | (363,249 | ) |
| United Bankshares, Inc. | | | 21,193 | | | | (560,555 | ) |
| Mid-America Apartment Communities, Inc. | | | 18,145 | | | | (1,229,687 | ) |
| M&T Bank Corp. | | | 13,931 | | | | (1,556,790 | ) |
| IntercontinentalExchange, Inc.* | | | 9,001 | | | | (1,600,010 | ) |
| Total Financials | | | | | | | (11,584,642 | ) |
| Total Common Stock Sold Short | | | | | | | | |
| (Proceeds $32,075,909) | | | | | | | (33,848,064 | ) |
| | | | | | | | | |
| EXCHANGE TRADED FUNDS SOLD SHORT† - (14.0)% | | | | | | | | |
| iShares MSCI EAFE ETF | | | 26 | | | | (1,492 | ) |
| iShares MSCI Emerging Markets ETF | | | 117 | | | | (4,513 | ) |
| iShares MSCI Austria Capped ETF | | | 870 | | | | (14,129 | ) |
| iShares MSCI Australia ETF | | | 642 | | | | (14,496 | ) |
| iShares MSCI South Africa ETF | | | 269 | | | | (15,720 | ) |
| iShares MSCI France ETF | | | 741 | | | | (17,273 | ) |
| iShares MSCI Thailand Capped ETF | | | 248 | | | | (19,453 | ) |
| iShares MSCI Sweden ETF | | | 708 | | | | (21,105 | ) |
| iShares MSCI Italy Capped ETF | | | 1,920 | | | | (22,675 | ) |
| iShares MSCI Spain Capped ETF | | | 874 | | | | (24,201 | ) |
| iShares MSCI Mexico Capped ETF | | | 528 | | | | (34,426 | ) |
| iShares MSCI Belgium Capped ETF | | | 2,959 | | | | (40,302 | ) |
| iShares MSCI Germany ETF | | | 1,645 | | | | (40,632 | ) |
| iShares MSCI Singapore ETF | | | 3,291 | | | | (42,092 | ) |
| iShares MSCI Chile Capped ETF | | | 786 | | | | (42,279 | ) |
| iShares JP Morgan USD Emerging Markets Bond ETF | | | 409 | | | | (44,798 | ) |
| iShares MSCI Turkey ETF | | | 801 | | | | (47,403 | ) |
| Market Vectors Gold Miners ETF | | | 1,950 | | | | (47,600 | ) |
| iShares MSCI Malaysia ETF | | | 3,340 | | | | (51,937 | ) |
| iShares MSCI Brazil Capped ETF | | | 1,212 | | | | (53,158 | ) |
| iShares MSCI Netherlands ETF | | | 3,058 | | | | (63,606 | ) |
| iShares MSCI Hong Kong ETF | | | 3,550 | | | | (65,001 | ) |
| iShares MSCI United Kingdom ETF | | | 4,329 | | | | (76,450 | ) |
| iShares China Large-Capital ETF | | | 2,884 | | | | (93,788 | ) |
| iShares MSCI Taiwan ETF | | | 7,334 | | | | (97,542 | ) |
| iShares MSCI Canada ETF | | | 3,798 | | | | (99,508 | ) |
| iShares MSCI South Korea Capped ETF | | | 2,148 | | | | (114,274 | ) |
| iShares MSCI Japan ETF | | | 10,234 | | | | (114,825 | ) |
| Market Vectors Russia ETF | | | 4,985 | | | | (125,423 | ) |
| iPath MSCI India Index ETN* | | | 2,815 | | | | (150,659 | ) |
| iShares MSCI Switzerland Capped ETF | | | 7,794 | | | | (223,298 | ) |
| Powershares QQQ Trust Series 1 | | | 3,609 | | | | (256,997 | ) |
| iShares 20+ Year Treasury Bond ETF | | | 2,642 | | | | (291,782 | ) |
| iShares 7-10 Year Treasury Bond ETF | | | 2,929 | | | | (300,223 | ) |
| iShares iBoxx $ Investment Grade Corporate Bond ETF | | | 2,983 | | | | (339,018 | ) |
| PowerShares Insured National Municipal Bond Portfolio | | | 14,948 | | | | (357,405 | ) |
| iShares Agency Bond ETF | | | 3,378 | | | | (373,945 | ) |
| iShares TIPS Bond ETF | | | 4,119 | | | | (461,369 | ) |
| iShares US Real Estate ETF | | | 8,018 | | | | (532,315 | ) |
| iShares MBS ETF | | | 5,149 | | | | (541,829 | ) |
| iShares Russell 1000 Value ETF | | | 6,561 | | | | (549,745 | ) |
| iShares 3-7 Year Treasury Bond ETF | | | 4,810 | | | | (580,759 | ) |
| iShares Russell 2000 ETF | | | 6,245 | | | | (606,764 | ) |
| iShares Core Total US Bond Market ETF | | | 6,472 | | | | (693,798 | ) |
| PowerShares Emerging Markets Sovereign Debt Portfolio | | | 28,089 | | | | (767,110 | ) |
| SPDR Barclays High Yield Bond ETF | | | 32,479 | | | | (1,282,596 | ) |
| SPDR Nuveen Barclays Municipal Bond ETF | | | 61,975 | | | | (1,414,889 | ) |
| SPDR S&P 500 ETF Trust | | | 25,198 | | | | (4,031,933 | ) |
| Total Exchange Traded Funds Sold Short | | | | | | | | |
| (Proceeds $15,379,608) | | | | | | | (15,206,535 | ) |
| Total Securities Sold Short - (45.1)% | | | | | | | | |
| (Proceeds $47,455,517) | | | | | | $ | (49,054,599 | ) |
| Other Assets & Liabilities, net - 63.3% | | | | | | | 68,839,862 | |
| Total Net Assets - 100.0% | | | | | | $ | 108,741,280 | |
| | | | | | Unrealized | |
| | | Contracts | | | Gain | |
| EQUITY FUTURES CONTRACTS PURCHASED† | | | | | | | | |
| November 2013 CBOE VIX Index | | | | | | | | |
| Futures Contracts | | | | | | | | |
| (Aggregate Value of | | | | | | | | |
| Contracts $5,353,500) | | | 258 | | | $ | 536,162 | |
| 22 | THE GUGGENHEIM FUNDS SEMI-ANNUAL REPORT | SEE NOTES TO FINANCIAL STATEMENTS. |
| CONSOLIDATED SCHEDULE OF INVESTMENTS (Unaudited) (continued) | June 30, 2013 |
| MULTI-HEDGE STRATEGIES FUND | |
| | | | | | Unrealized | |
| | | Contracts | | | Gain (Loss) | |
| | | | | | | |
| December 2013 CBOE VIX Index | | | | | | | | |
| Futures Contracts | | | | | | | | |
| (Aggregate Value of | | | | | | | | |
| Contracts $5,376,000) | | | 256 | | | $ | (72,133 | ) |
| October 2013 CBOE VIX Index | | | | | | | | |
| Futures Contracts | | | | | | | | |
| (Aggregate Value of | | | | | | | | |
| Contracts $4,232,800) | | | 208 | | | | (84,739 | ) |
| (Total Aggregate Value of | | | | | | | | |
| Contracts $14,962,300) | | | | | | $ | 379,290 | |
| | | | | | | | | |
| COMMODITY FUTURES CONTRACTS PURCHASED† | | | | | | | | |
| September 2013 Soybean | | | | | | | | |
| Futures Contracts | | | | | | | | |
| (Aggregate Value of | | | | | | | | |
| Contracts $6,115,875) | | | 94 | | | $ | 193,307 | |
| December 2013 WTI Crude | | | | | | | | |
| Futures Contracts | | | | | | | | |
| (Aggregate Value of | | | | | | | | |
| Contracts $6,219,181) | | | 66 | | | | 174,048 | |
| December 2013 Cotton #2 | | | | | | | | |
| Futures Contracts | | | | | | | | |
| (Aggregate Value of | | | | | | | | |
| Contracts $801,610) | | | 19 | | | | (30,168 | ) |
| October 2013 Lean Hogs | | | | | | | | |
| Futures Contracts | | | | | | | | |
| (Aggregate Value of | | | | | | | | |
| Contracts $5,189,870) | | | 151 | | | | (38,596 | ) |
| December 2013 Corn | | | | | | | | |
| Futures Contracts | | | | | | | | |
| (Aggregate Value of | | | | | | | | |
| Contracts $4,984,688) | | | 195 | | | | (162,459 | ) |
| April 2014 Natural Gas | | | | | | | | |
| Futures Contracts | | | | | | | | |
| (Aggregate Value of | | | | | | | | |
| Contracts $3,415,500) | | | 90 | | | | (283,367 | ) |
| October 2013 Gasoline RBOB | | | | | | | | |
| Futures Contracts | | | | | | | | |
| (Aggregate Value of | | | | | | | | |
| Contracts $5,209,142) | | | 48 | | | | (328,725 | ) |
| (Total Aggregate Value of | | | | | | | | |
| Contracts $31,935,866) | | | | | | $ | (475,960 | ) |
| | | | | | | | | |
| COMMODITY FUTURES CONTRACTS SOLD SHORT† | | | | | | | | |
| December 2013 Natural Gas | | | | | | | | |
| Futures Contracts | | | | | | | | |
| (Aggregate Value of | | | | | | | | |
| Contracts $4,208,600) | | | 110 | | | $ | 445,689 | |
| August 2013 Gold 100 oz. | | | | | | | | |
| Futures Contracts | | | | | | | | |
| (Aggregate Value of | | | | | | | | |
| Contracts $2,463,800) | | | 20 | | | | 291,740 | |
| September 2013 Coffee ‘C’ | | | | | | | | |
| Futures Contracts | | | | | | | | |
| (Aggregate Value of | | | | | | | | |
| Contracts $1,671,938) | | | 37 | | | | 207,149 | |
| March 2014 Corn | | | | | | | | |
| Futures Contracts | | | | | | | | |
| (Aggregate Value of | | | | | | | | |
| Contracts $4,980,325) | | | 191 | | | | 161,158 | |
| September 2013 Gasoline RBOB | | | | | | | | |
| Futures Contracts | | | | | | | | |
| (Aggregate Value of | | | | | | | | |
| Contracts $5,096,385) | | | 45 | | | | 156,375 | |
| October 2013 Live Cattle | | | | | | | | |
| Futures Contracts | | | | | | | | |
| (Aggregate Value of | | | | | | | | |
| Contracts $2,267,100) | | | 45 | | | | 126,445 | |
| July 2013 LME Nickel | | | | | | | | |
| Futures Contracts | | | | | | | | |
| (Aggregate Value of | | | | | | | | |
| Contracts $1,556,727) | | | 19 | | | | 118,083 | |
| August 2013 Soybean Oil | | | | | | | | |
| Futures Contracts | | | | | | | | |
| (Aggregate Value of | | | | | | | | |
| Contracts $2,560,176) | | | 92 | | | | 87,988 | |
| September 2013 LME Primary Aluminum | | | | | | | | |
| Futures Contracts | | | | | | | | |
| (Aggregate Value of | | | | | | | | |
| Contracts $1,725,263) | | | 39 | | | | 84,895 | |
| December 2013 Wheat | | | | | | | | |
| Futures Contracts | | | | | | | | |
| (Aggregate Value of | | | | | | | | |
| Contracts $1,040,050) | | | 31 | | | | 55,889 | |
| September 2013 WTI Crude | | | | | | | | |
| Futures Contracts | | | | | | | | |
| (Aggregate Value of | | | | | | | | |
| Contracts $5,202,900) | | | 54 | | | | 38,394 | |
| March 2014 Sugar #11 | | | | | | | | |
| Futures Contracts | | | | | | | | |
| (Aggregate Value of | | | | | | | | |
| Contracts $595,056) | | | 30 | | | | 34,502 | |
| September 2013 Silver | | | | | | | | |
| Futures Contracts | | | | | | | | |
| (Aggregate Value of | | | | | | | | |
| Contracts $1,273,675) | | | 13 | | | | 27,261 | |
| July 2013 LME Zinc | | | | | | | | |
| Futures Contracts | | | | | | | | |
| (Aggregate Value of | | | | | | | | |
| Contracts $868,300) | | | 19 | | | | 18,625 | |
| September 2013 Copper | | | | | | | | |
| Futures Contracts | | | | | | | | |
| (Aggregate Value of | | | | | | | | |
| Contracts $1,989,000) | | | 26 | | | | 11,925 | |
| December 2013 Cocoa | | | | | | | | |
| Futures Contracts | | | | | | | | |
| (Aggregate Value of | | | | | | | | |
| Contracts $434,000) | | | 20 | | | | 9,554 | |
| September 2013 LME Lead | | | | | | | | |
| Futures Contracts | | | | | | | | |
| (Aggregate Value of | | | | | | | | |
| Contracts $922,613) | | | 18 | | | | (5,351 | ) |
| SEE NOTES TO FINANCIAL STATEMENTS. | THE GUGGENHEIM FUNDS SEMI-ANNUAL REPORT | 23 |
| CONSOLIDATED SCHEDULE OF INVESTMENTS (Unaudited) (concluded) | June 30, 2013 |
| MULTI-HEDGE STRATEGIES FUND | |
| | | | | | Unrealized | |
| | | Contracts | | | Gain (Loss) | |
| | | | | | | |
| February 2014 Lean Hogs | | | | | | | | |
| Futures Contracts | | | | | | | | |
| (Aggregate Value of | | | | | | | | |
| Contracts $5,195,600) | | | 155 | | | $ | (27,001 | ) |
| November 2013 Soybean | | | | | | | | |
| Futures Contracts | | | | | | | | |
| (Aggregate Value of | | | | | | | | |
| Contracts $5,003,000) | | | 80 | | | | (150,693 | ) |
| (Total Aggregate Value of | | | | | | | | |
| Contracts $49,054,508) | | | | | | $ | 1,692,627 | |
| | | | | | | | | |
| EQUITY FUTURES CONTRACTS SOLD SHORT† | | | | | | | | |
| August 2013 CBOE VIX Index | | | | | | | | |
| Futures Contracts | | | | | | | | |
| (Aggregate Value of | | | | | | | | |
| Contracts $5,224,680) | | | 276 | | | $ | 50,616 | |
| September 2013 CBOE VIX Index | | | | | | | | |
| Futures Contracts | | | | | | | | |
| (Aggregate Value of | | | | | | | | |
| Contracts $5,273,250) | | | 267 | | | | (516,602 | ) |
| (Total Aggregate Value of | | | | | | | | |
| Contracts $10,497,930) | | | | | | $ | (465,986 | ) |
| | | | | | | |
| | | Units | | | | |
| | | | | | | |
| EQUITY INDEX SWAP AGREEMENTS†† | | | | | | | | |
| Goldman Sachs International | | | | | | | | |
| September 2013 Goldman Sachs | | | | | | | | |
| Multi-Hedge Strategies L Index Swap, | | | | | | | | |
| Terminating 09/18/135 | | | | | | | | |
| (Notional Value $10,900,924) | | | 106,252 | | | $ | 181,085 | |
| | | | | | | | | |
| EQUITY INDEX SWAP AGREEMENTS SOLD SHORT†† | | | | | | | | |
| Goldman Sachs International | | | | | | | | |
| September 2013 Goldman Sachs | | | | | | | | |
| Multi-Hedge Strategies S Index Swap, | | | | | | | | |
| Terminating 09/18/136 | | | | | | | | |
| (Notional Value $2,429,452) | | | 24,671 | | | $ | 49,564 | |
| * | Non-income producing security. |
| † | Value determined based on Level 1 inputs — See Note 4. |
| †† | Value determined based on Level 2 inputs — See Note 4. |
| 1 | All or a portion of this security is pledged as short security collateral at June 30, 2013. |
| 2 | All or portion of this security is on loan at June 30, 2013 — See Note 11. |
| 3 | Repurchase Agreements — See Note 5. |
| 4 | Securities lending collateral — See Note 11. |
| 5 | Total Return based on Goldman Sachs Multi-Hedge Strategies L Index +/- financing at a variable rate. |
| 6 | Total Return based on Goldman Sachs Multi-Hedge Strategies S Index +/- financing at a variable rate. |
ADR — American Depositary Receipt
plc — Public Limited Company
REIT — Real Estate Investment Trust
| 24 | THE GUGGENHEIM FUNDS SEMI-ANNUAL REPORT | SEE NOTES TO FINANCIAL STATEMENTS. |
| MULTI-HEDGE STRATEGIES FUND |
| CONSOLIDATED STATEMENT OF |
| ASSETS AND LIABILITIES (Unaudited) |
| June 30, 2013 |
| Assets: | | | | |
| Investments, at value - including $103,387 of securities loaned | | | | |
| (cost $73,489,965) | | $ | 78,996,969 | |
| Repurchase agreements, at value | | | | |
| (cost $9,959,048) | | | 9,959,048 | |
| Total investments | | | | |
| (cost $83,449,013) | | | 88,956,017 | |
| Segregated cash with broker | | | 70,714,602 | |
| Cash | | | 1,295,112 | |
| Unrealized appreciation on swap agreements | | | 230,649 | |
| Receivable for swap settlement | | | 41,154 | |
| Receivables: | | | | |
| Fund shares sold | | | 2,133,609 | |
| Securities sold | | | 727,088 | |
| Dividends | | | 79,519 | |
| Interest | | | 9,003 | |
| Total assets | | | 164,186,753 | |
| Liabilities: | | | | |
| Securities sold short, at value | | | | |
| (proceeds $47,455,517) | | | 49,054,599 | |
| Payable for: | | | | |
| Fund shares redeemed | | | 4,728,595 | |
| Securities purchased | | | 1,275,030 | |
| Upon return of securities loaned | | | 110,298 | |
| Management fees | | | 96,286 | |
| Variation margin | | | 35,971 | |
| Distribution and service fees | | | 27,202 | |
| Miscellaneous | | | 117,492 | |
| Total liabilities | | | 55,445,473 | |
| Net assets | | $ | 108,741,280 | |
| Net assets consist of: | | | | |
| Paid in capital | | $ | 154,825,806 | |
| Accumulated net investment loss | | | (1,579,592 | ) |
| Accumulated net realized loss on investments | | | (49,773,476 | ) |
| Net unrealized appreciation on investments | | | 5,268,542 | |
| Net assets | | $ | 108,741,280 | |
| A-Class: | | | | |
| Net assets | | $ | 18,465,937 | |
| Capital shares outstanding | | | 798,513 | |
| Net asset value per share | | $ | 23.13 | |
| Maximum offering price per share | | | | |
| (Net asset value divided by 95.25%) | | $ | 24.28 | |
| C-Class: | | | | |
| Net assets | | $ | 16,703,408 | |
| Capital shares outstanding | | | 766,590 | |
| Net asset value per share | | $ | 21.79 | |
| H-Class: | | | | |
| Net assets | | $ | 55,124,149 | |
| Capital shares outstanding | | | 2,382,016 | |
| Net asset value per share | | $ | 23.14 | |
| Institutional class: | | | | |
| Net assets | | $ | 18,447,786 | |
| Capital shares outstanding | | | 790,842 | |
| Net asset value per share | | $ | 23.33 | |
| CONSOLIDATED STATEMENT |
| OF OPERATIONS (Unaudited) |
| Period Ended June 30, 2013 |
| Investment Income: | | | | |
| Dividends (net of foreign withholding tax of $1,979) | | $ | 1,095,226 | |
| Interest | | | 6,704 | |
| Income from securities lending, net | | | 867 | |
| Other income | | | 11,419 | |
| Total investment income | | | 1,114,216 | |
| | | | | |
| Expenses: | | | | |
| Management fees | | | 682,172 | |
| Distribution and service fees: | | | | |
| A-Class | | | 28,386 | |
| C-Class | | | 79,494 | |
| H-Class | | | 76,734 | |
| Short sales dividend expense | | | 464,229 | |
| Prime broker interest expense | | | 209,175 | |
| Trustees’ fees* | | | 4,493 | |
| Custodian fees | | | 107 | |
| Miscellaneous | | | (3,241 | ) |
| Total expenses | | | 1,541,549 | |
| Less: | | | | |
| Expenses waived by Advisor | | | (24,532 | ) |
| Net expenses | | | 1,517,017 | |
| Net investment loss | | | (402,801 | ) |
| | | | | |
| Net Realized and Unrealized Gain (Loss): | | | | |
| Net realized gain (loss) on: | | | | |
| Investments | | | 10,937,152 | |
| Swap agreements | | | (17,999 | ) |
| Futures contracts | | | 1,031,931 | |
| Securities sold short | | | (9,567,899 | ) |
| Options purchased | | | (4,726 | ) |
| Net realized gain | | | 2,378,459 | |
| Net change in unrealized appreciation (depreciation) on: | | | | |
| Investments | | | (1,719,778 | ) |
| Securities sold short | | | 1,618,043 | |
| Swap agreements | | | 230,649 | |
| Futures contracts | | | 112,354 | |
| Options purchased | | | 1,926 | |
| Net change in unrealized appreciation (depreciation) | | | 243,194 | |
| Net realized and unrealized gain | | | 2,621,653 | |
| Net increase in net assets resulting from operations | | $ | 2,218,852 | |
* Relates to Trustees not deemed “interested persons” within the meaning of Section 2(a)(19) of the 1940 Act.
| SEE NOTES TO FINANCIAL STATEMENTS. | THE GUGGENHEIM FUNDS SEMI-ANNUAL REPORT | 25 |
| MULTI-HEDGE STRATEGIES FUND |
| CONSOLIDATED STATEMENTS OF CHANGES IN NET ASSETS |
| | | Period Ended | | | | |
| | | June 30, | | | Year Ended | |
| | | 2013 | | | December 31, | |
| | | (Unaudited) | | | 2012 | |
| | | | | | | |
| Increase (Decrease) In Net Assets From Operations: | | | | | | | | |
| Net investment loss | | $ | (402,801 | ) | | $ | (2,163,432 | ) |
| Net realized gain (loss) on investments | | | 2,378,459 | | | | (435,038 | ) |
| Net change in unrealized appreciation (depreciation) on investments | | | 243,194 | | | | 4,953,461 | |
| Net increase in net assets resulting from operations | | | 2,218,852 | | | | 2,354,991 | |
| | | | | | | | | |
| Capital share transactions: | | | | | | | | |
| Proceeds from sale of shares | | | | | | | | |
| A-Class | | | 3,895,396 | | | | 41,635,919 | |
| C-Class | | | 5,867,826 | | | | 9,448,075 | |
| H-Class | | | 15,338,151 | | | | 80,707,028 | |
| Institutional Class | | | 4,744,929 | | | | 15,460,536 | |
| Value of proceeds from merger | | | | | | | | |
| A-Class | | | — | | | | 1,354,905 | |
| C-Class | | | — | | | | 2,433,192 | |
| H-Class | | | — | | | | 2,281,147 | |
| Cost of shares redeemed | | | | | | | | |
| A-Class | | | (13,572,414 | ) | | | (40,779,286 | ) |
| C-Class | | | (6,209,463 | ) | | | (8,561,191 | ) |
| H-Class | | | (28,240,317 | ) | | | (83,697,859 | ) |
| Institutional Class | | | (730,139 | ) | | | (2,331,387 | ) |
| Net increase (decrease) from capital share transactions | | | (18,906,031 | ) | | | 17,951,079 | |
| Net increase (decrease) in net assets | | | (16,687,179 | ) | | | 20,306,070 | |
| | | | | | | | | |
| Net assets: | | | | | | | | |
| Beginning of period | | | 125,428,459 | | | | 105,122,389 | |
| End of period | | $ | 108,741,280 | | | $ | 125,428,459 | |
| Accumulated net investment loss at end of period | | $ | (1,579,592 | ) | | $ | (1,176,791 | ) |
| | | | | | | | | |
| Capital share activity: | | | | | | | | |
| Shares sold | | | | | | | | |
| A-Class | | | 170,442 | | | | 1,919,863 | † |
| C-Class | | | 271,208 | | | | 554,953 | † |
| H-Class | | | 670,086 | | | | 3,696,849 | † |
| Institutional Class | | | 203,964 | | | | 685,352 | |
| Shares redeemed | | | | | | | | |
| A-Class | | | (593,470 | ) | | | (1,816,255 | ) |
| C-Class | | | (287,081 | ) | | | (401,917 | ) |
| H-Class | | | (1,232,731 | ) | | | (3,728,682 | ) |
| Institutional Class | | | (31,666 | ) | | | (102,973 | ) |
| Net increase (decrease) in shares | | | (829,248 | ) | | | 807,190 | |
† Includes 60,298 A-Class, 114,074 C-Class, 101,429 H-Class shares issued in connection with Fund merger.
| 26 | THE GUGGENHEIM FUNDS SEMI-ANNUAL REPORT | SEE NOTES TO FINANCIAL STATEMENTS. |
| MULTI-HEDGE STRATEGIES FUND |
This table is presented to show selected data for a share outstanding throughout each period and to assist shareholders in evaluating a Fund’s performance for the periods presented.
| | | Period Ended | | | Year Ended | | | Year Ended | | | Year Ended | | | Period Ended | | | Year Ended | |
| | | June 30, | | | December 31, | | | December 31, | | | December 31, | | | December 31, | | | March 31, | |
| A-Class | | 2013a,b | | | 2012b | | | 2011b | | | 2010b | | | 2009b,c | | | 2009 | |
| Per Share Data | | | | | | | | | | | | | | | | | | | | | | | | |
| Net asset value, beginning of period | | $ | 22.68 | | | $ | 22.21 | | | $ | 21.66 | | | $ | 20.57 | | | $ | 19.96 | | | $ | 24.61 | |
| Income (loss) from investment operations: | | | | | | | | | | | | | | | | | | | | | | | | |
| Net investment lossd | | | (.07 | ) | | | (.35 | ) | | | (.27 | ) | | | (.40 | ) | | | (.15 | ) | | | (.10 | ) |
| Net gain (loss) on investments (realized and unrealized) | | | .52 | | | | .82 | | | | .98 | | | | 1.49 | | | | .76 | | | | (4.37 | ) |
| Total from investment operations | | | .45 | | | | .47 | | | | .71 | | | | 1.09 | | | | .61 | | | | (4.47 | ) |
| Less distributions from: | | | | | | | | | | | | | | | | | | | | | | | | |
| Net investment income | | | — | | | | — | | | | (.16 | ) | | | — | | | | — | | | | (.12 | ) |
| Net realized gains | | | — | | | | — | | | | — | | | | — | | | | — | | | | (.06 | ) |
| Total distributions | | | — | | | | — | | | | (.16 | ) | | | — | | | | — | | | | (.18 | ) |
| Redemption fees collected | | | — | | | | — | | | | — | | | | — | e | | | — | e | | | — | e |
| Net asset value, end of period | | $ | 23.13 | | | $ | 22.68 | | | $ | 22.21 | | | $ | 21.66 | | | $ | 20.57 | | | $ | 19.96 | |
| | | | | | | | | | | | | | | | | | | | | | | | | |
| Total Returnf | | | 1.98 | % | | | 2.02 | % | | | 3.39 | % | | | 5.30 | % | | | 3.06 | % | | | (18.19 | %) |
| Ratios/Supplemental Data | | | | | | | | | | | | | | | | | | | | | | | | |
| Net assets, end of period (in thousands) | | $ | 18,466 | | | $ | 27,700 | | | $ | 24,832 | | | $ | 14,073 | | | $ | 25,010 | | | $ | 45,078 | |
| Ratios to average net assets: | | | | | | | | | | | | | | | | | | | | | | | | |
| Net investment loss | | | (0.59 | %) | | | (1.54 | %) | | | (1.23 | %) | | | (1.97 | %) | | | (1.47 | %) | | | (0.46 | %) |
| Total expensesg | | | 2.60 | % | | | 3.09 | % | | | 2.77 | % | | | 3.56 | % | | | 2.36 | % | | | 2.09 | % |
| Net expensesh,i | | | 2.56 | % | | | 3.05 | % | | | 2.65 | % | | | 3.40 | % | | | 2.32 | % | | | 2.09 | % |
| Portfolio turnover rate | | | 160 | % | | | 465 | % | | | 433 | % | | | 993 | % | | | 858 | % | | | 1,578 | % |
| | | Period Ended | | | Year Ended | | | Year Ended | | | Year Ended | | | Period Ended | | | Year Ended | |
| | | June 30, | | | December 31, | | | December 31, | | | December 31, | | | December 31, | | | March 31, | |
| C-Class | | 2013a,b | | | 2012b | | | 2011b | | | 2010b | | | 2009b,c | | | 2009 | |
| Per Share Data | | | | | | | | | | | | | | | | | | | | | | | | |
| Net asset value, beginning of period | | $ | 21.45 | | | $ | 21.17 | | | $ | 20.80 | | | $ | 19.90 | | | $ | 19.43 | | | $ | 24.13 | |
| Income (loss) from investment operations: | | | | | | | | | | | | | | | | | | | | | | | | |
| Net investment lossd | | | (.15 | ) | | | (.50 | ) | | | (.42 | ) | | | (.55 | ) | | | (.31 | ) | | | (.25 | ) |
| Net gain (loss) on investments (realized and unrealized) | | | .49 | | | | .78 | | | | .95 | | | | 1.45 | | | | .78 | | | | (4.27 | ) |
| Total from investment operations | | | .34 | | | | .28 | | | | .53 | | | | .90 | | | | .47 | | | | (4.52 | ) |
| Less distributions from: | | | | | | | | | | | | | | | | | | | | | | | | |
| Net investment income | | | — | | | | — | | | | (.16 | ) | | | — | | | | — | | | | (.12 | ) |
| Net realized gains | | | — | | | | — | | | | — | | | | — | | | | — | | | | (.06 | ) |
| Total distributions | | | — | | | | — | | | | (.16 | ) | | | — | | | | — | | | | (.18 | ) |
| Redemption fees collected | | | — | | | | — | | | | — | | | | — | e | | | — | e | | | — | e |
| Net asset value, end of period | | $ | 21.79 | | | $ | 21.45 | | | $ | 21.17 | | | $ | 20.80 | | | $ | 19.90 | | | $ | 19.43 | |
| | | | | | | | | | | | | | | | | | | | | | | | | |
| Total Returnf | | | 1.63 | % | | | 1.23 | % | | | 2.62 | % | | | 4.52 | % | | | 2.42 | % | | | (18.76 | %) |
| Ratios/Supplemental Data | | | | | | | | | | | | | | | | | | | | | | | | |
| Net assets, end of period (in thousands) | | $ | 16,703 | | | $ | 16,780 | | | $ | 13,322 | | | $ | 15,194 | | | $ | 23,494 | | | $ | 28,706 | |
| Ratios to average net assets: | | | | | | | | | | | | | | | | | | | | | | | | |
| Net investment loss | | | (1.41 | %) | | | (2.33 | %) | | | (1.99 | %) | | | (2.79 | %) | | | (2.07 | %) | | | (1.09 | %) |
| Total expensesg | | | 3.38 | % | | | 3.85 | % | | | 3.52 | % | | | 4.41 | % | | | 3.14 | % | | | 2.82 | % |
| Net expensesh,i | | | 3.33 | % | | | 3.81 | % | | | 3.39 | % | | | 4.26 | % | | | 3.09 | % | | | 2.82 | % |
| Portfolio turnover rate | | | 160 | % | | | 465 | % | | | 432 | % | | | 993 | % | | | 858 | % | | | 1,578 | % |
| SEE NOTES TO FINANCIAL STATEMENTS. | THE GUGGENHEIM FUNDS SEMI-ANNUAL REPORT | 27 |
| MULTI-HEDGE STRATEGIES FUND |
| FINANCIAL HIGHLIGHTS (continued) |
This table is presented to show selected data for a share outstanding throughout each period and to assist shareholders in evaluating a Fund’s performance for the periods presented.
| | | Period Ended | | | Year Ended | | | Year Ended | | | Year Ended | | | Period Ended | | | Year Ended | |
| | | June 30, | | | December 31, | | | December 31, | | | December 31, | | | December 31, | | | March 31, | |
| H-Class | | 2013a,b | | | 2012b | | | 2011b | | | 2010b | | | 2009b,c | | | 2009 | |
| Per Share Data | | | | | | | | | | | | | | | | | | | | | | | | |
| Net asset value, beginning of period | | $ | 22.69 | | | $ | 22.23 | | | $ | 21.67 | | | $ | 20.58 | | | $ | 19.98 | | | $ | 24.63 | |
| Income (loss) from investment operations: | | | | | | | | | | | | | | | | | | | | | | | | |
| Net investment lossd | | | (.07 | ) | | | (.36 | ) | | | (.27 | ) | | | (.43 | ) | | | (.21 | ) | | | (.07 | ) |
| Net gain (loss) on investments (realized and unrealized) | | | .52 | | | | .82 | | | | .99 | | | | 1.52 | | | | .81 | | | | (4.40 | ) |
| Total from investment operations | | | .45 | | | | .46 | | | | .72 | | | | 1.09 | | | | .60 | | | | (4.47 | ) |
| Less distributions from: | | | | | | | | | | | | | | | | | | | | | | | | |
| Net investment income | | | — | | | | — | | | | (.16 | ) | | | — | | | | — | | | | (.12 | ) |
| Net realized gains | | | — | | | | — | | | | — | | | | — | | | | — | | | | (.06 | ) |
| Total distributions | | | — | | | | — | | | | (.16 | ) | | | — | | | | — | | | | (.18 | ) |
| Redemption fees collected | | | — | | | | — | | | | — | | | | — | e | | | — | e | | | — | e |
| Net asset value, end of period | | $ | 23.14 | | | $ | 22.69 | | | $ | 22.23 | | | $ | 21.67 | | | $ | 20.58 | | | $ | 19.98 | |
| | | | | | | | | | | | | | | | | | | | | | | | | |
| Total Returnf | | | 1.98 | % | | | 2.02 | % | | | 3.39 | % | | | 5.30 | % | | | 3.00 | % | | | (18.17 | %) |
| Ratios/Supplemental Data | | | | | | | | | | | | | | | | | | | | | | | | |
| Net assets, end of period (in thousands) | | $ | 55,124 | | | $ | 66,818 | | | $ | 66,161 | | | $ | 44,421 | | | $ | 69,351 | | | $ | 63,229 | |
| Ratios to average net assets: | | | | | | | | | | | | | | | | | | | | | | | | |
| Net investment loss | | | (0.64 | %) | | | (1.59 | %) | | | (1.25 | %) | | | (2.08 | %) | | | (1.18 | %) | | | (0.31 | %) |
| Total expensesg | | | 2.63 | % | | | 3.07 | % | | | 2.78 | % | | | 3.69 | % | | | 2.37 | % | | | 2.07 | % |
| Net expensesh,i | | | 2.58 | % | | | 3.03 | % | | | 2.65 | % | | | 3.54 | % | | | 2.33 | % | | | 2.07 | % |
| Portfolio turnover rate | | | 160 | % | | | 465 | % | | | 433 | % | | | 993 | % | | | 858 | % | | | 1,578 | % |
| 28 | THE GUGGENHEIM FUNDS SEMI-ANNUAL REPORT | SEE NOTES TO FINANCIAL STATEMENTS. |
| MULTI-HEDGE STRATEGIES FUND |
| FINANCIAL HIGHLIGHTS (concluded) |
This table is presented to show selected data for a share outstanding throughout each period and to assist shareholders in evaluating a Fund’s performance for the periods presented.
| | | Period Ended | | | Year Ended | | | Year Ended | | | Period Ended | |
| | | June 30, | | | December 31, | | | December 31, | | | December 31, | |
| Institutional Class | | 2013a,b | | | 2012b | | | 2011b | | | 2010b,j | |
| Per Share Data | | | | | | | | | | | | | | | | |
| Net asset value, beginning of period | | $ | 22.84 | | | $ | 22.32 | | | $ | 21.71 | | | $ | 20.61 | |
| Income (loss) from investment operations: | | | | | | | | | | | | | | | | |
| Net investment lossd | | | (.05 | ) | | | (.33 | ) | | | (.22 | ) | | | (.43 | ) |
| Net gain on investments (realized and unrealized) | | | .54 | | | | .85 | | | | .99 | | | | 1.53 | |
| Total from investment operations | | | .49 | | | | .52 | | | | .77 | | | | 1.10 | |
| Less distributions from: | | | | | | | | | | | | | | | | |
| Net investment income | | | — | | | | — | | | | (.16 | ) | | | — | |
| Total distributions | | | — | | | | — | | | | (.16 | ) | | | — | |
| Redemption fees collected | | | — | | | | — | | | | — | | | | — | e |
| Net asset value, end of period | | $ | 23.33 | | | $ | 22.84 | | | $ | 22.32 | | | $ | 21.71 | |
| | | | | | | | | | | | | | | | | |
| Total Returnf | | | 2.15 | % | | | 2.28 | % | | | 3.61 | % | | | 5.34 | % |
| Ratios/Supplemental Data | | | | | | | | | | | | | | | | |
| Net assets, end of period (in thousands) | | $ | 18,448 | | | $ | 14,130 | | | $ | 807 | | | $ | 296 | |
| Ratios to average net assets: | | | | | | | | | | | | | | | | |
| Net investment loss | | | (0.40 | %) | | | (1.46 | %) | | | (0.99 | %) | | | (3.10 | %) |
| Total expensesg | | | 2.39 | % | | | 3.05 | % | | | 2.52 | % | | | 5.13 | % |
| Net expensesh,i | | | 2.35 | % | | | 3.01 | % | | | 2.40 | % | | | 4.98 | % |
| Portfolio turnover rate | | | 160 | % | | | 465 | % | | | 433 | % | | | 993 | % |
| a | Unaudited figures for the period ended June 30, 2013. Percentage amounts for the period, except total return and portfolio turnover rate, have been annualized. |
| c | The fund changed its fiscal year end from March 31 to December 31 in 2009. Percentage amounts for the period, except total return and portfolio turnover rate, have been annualized. |
| d | Net investment income loss per share was computed using average shares outstanding throughout the period. |
| e | Redemption fees collected are less than $0.01 per share. |
| f | Total return does not reflect the impact of any applicable sales charges and has not been annualized. |
| g | Does not include expenses of the underlying funds in which the Fund invests. |
| h | Net expense information reflects the expense ratios after expense waivers, and may include interest or dividend expense. |
| i | Excluding interest and dividend expense related to short sales, the operating expense ratios for the years or periods presented would be: |
| | | 6/30/13 | | | 12/31/12 | | | 12/31/11 | | | 12/31/10 | | | 12/31/09 | | | 3/31/09 | |
| A-Class | | | 1.40 | % | | | 1.40 | % | | | 1.41 | % | | | 1.41 | % | | | 1.40 | % | | | 1.40 | % |
| C-Class | | | 2.15 | % | | | 2.15 | % | | | 2.15 | % | | | 2.15 | % | | | 2.17 | % | | | 2.17 | % |
| H-Class | | | 1.40 | % | | | 1.40 | % | | | 1.41 | % | | | 1.41 | % | | | 1.41 | % | | | 1.40 | % |
| Institutional Class | | | 1.15 | % | | | 1.15 | % | | | 1.16 | % | | | 1.17 | % | | | N/A | | | | N/A | |
| j | Since commencement of operations: May 3, 2010. Percentage amounts for the period, except total return and portfolio turnover rate, have been annualized. |
| SEE NOTES TO FINANCIAL STATEMENTS. | THE GUGGENHEIM FUNDS SEMI-ANNUAL REPORT | 29 |
| FUND PROFILE (Unaudited) | June 30, 2013 |
COMMODITIES STRATEGY FUND
OBJECTIVE: Seeks to provide investment results that correlate, before fees and expenses, to the performance of a benchmark for commodities. The Fund’s current benchmark is the S&P GSCITM Commodity Index (the “underlying index”).
Holdings Diversification (Market Exposure as % of Net Assets)
“Holdings Diversification (Market Exposure as % of Net Assets)” excludes any temporary cash investments.
| Inception Dates: | |
| A-Class | May 25, 2005 |
| C-Class | May 25, 2005 |
| H-Class | May 25, 2005 |
The Fund invests principally in derivative investments such as commodity-linked futures contracts.
| 30 | THE GUGGENHEIM FUNDS SEMI-ANNUAL REPORT |
| CONSOLIDATED SCHEDULE OF INVESTMENTS (Unaudited) | June 30, 2013 |
| COMMODITIES STRATEGY FUND | |
| | | Face | | | | |
| | | Amount | | | Value | |
| | | | | | | |
| REPURCHASE AGREEMENTS††,1 - 6.8% | | | | | | | | |
| HSBC Group | | | | | | | | |
| issued 06/28/13 at 0.07% | | | | | | | | |
| due 07/01/13 | | $ | 855,708 | | | $ | 855,708 | |
| Mizuho Financial Group, Inc. | | | | | | | | |
| issued 06/28/13 at 0.06% | | | | | | | | |
| due 07/01/13 | | | 147,069 | | | | 147,069 | |
| Deutsche Bank | | | | | | | | |
| issued 06/28/13 at 0.06% | | | | | | | | |
| due 07/01/13 | | | 59,701 | | | | 59,701 | |
| Total Repurchase Agreements | | | | | | | | |
| (Cost $1,062,478) | | | | | | | 1,062,478 | |
| Total Investments - 6.8% | | | | | | | | |
| (Cost $1,062,478) | | | | | | $ | 1,062,478 | |
| Other Assets & Liabilities, net - 93.2% | | | | | | | 14,485,568 | |
| Total Net Assets - 100.0% | | | | | | $ | 15,548,046 | |
| | | | | | Unrealized | |
| | | Contracts | | | Gain (Loss) | |
| COMMODITY FUTURES CONTRACTS PURCHASED† | | | | | | | | |
| December 2013 Gold 100 oz. | | | | | | | | |
| Futures Contracts | | | | | | | | |
| (Aggregate Value of | | | | | | | | |
| Contracts $123,430) | | | 1 | | | $ | 3,597 | |
| October 2013 Sugar #11 | | | | | | | | |
| Futures Contracts | | | | | | | | |
| (Aggregate Value of | | | | | | | | |
| Contracts $56,784) | | | 3 | | | | 1,028 | |
| September 2013 Natural Gas | | | | | | | | |
| Futures Contracts | | | | | | | | |
| (Aggregate Value of | | | | | | | | |
| Contracts $107,130) | | | 3 | | | | 561 | |
| October 2013 Live Cattle | | | | | | | | |
| Futures Contracts | | | | | | | | |
| (Aggregate Value of | | | | | | | | |
| Contracts $100,760) | | | 2 | | | | 93 | |
| September 2013 LME Copper | | | | | | | | |
| Futures Contracts | | | | | | | | |
| (Aggregate Value of | | | | | | | | |
| Contracts $168,781) | | | 1 | | | | (1 | ) |
| September 2013 LME Zinc | | | | | | | | |
| Futures Contracts | | | | | | | | |
| (Aggregate Value of | | | | | | | | |
| Contracts $46,354) | | | 1 | | | | (4 | ) |
| September 2013 LME Primary Aluminum | | | | | | | | |
| Futures Contracts | | | | | | | | |
| (Aggregate Value of | | | | | | | | |
| Contracts $176,950) | | | 4 | | | | (4 | ) |
| October 2013 Lean Hogs | | | | | | | | |
| Futures Contracts | | | | | | | | |
| (Aggregate Value of | | | | | | | | |
| Contracts $68,740) | | | 2 | | | | (747 | ) |
| September 2013 Winter Wheat | | | | | | | | |
| Futures Contracts | | | | | | | | |
| (Aggregate Value of | | | | | | | | |
| Contracts $34,375) | | | 1 | | | | (1,528 | ) |
| December 2013 Cotton #2 | | | | | | | | |
| Futures Contracts | | | | | | | | |
| (Aggregate Value of | | | | | | | | |
| Contracts $42,190) | | | 1 | | | | (1,833 | ) |
| September 2013 Gasoline RBOB | | | | | | | | |
| Futures Contracts | | | | | | | | |
| (Aggregate Value of | | | | | | | | |
| Contracts $226,506) | | | 2 | | | | (2,022 | ) |
| September 2013 New York Harbor | | | | | | | | |
| Ultra-Low Sulfur Diesel | | | | | | | | |
| Futures Contracts | | | | | | | | |
| (Aggregate Value of | | | | | | | | |
| Contracts $240,542) | | | 2 | | | | (3,232 | ) |
| November 2013 Gas Oil | | | | | | | | |
| Futures Contracts | | | | | | | | |
| (Aggregate Value of | | | | | | | | |
| Contracts $346,200) | | | 4 | | | | (3,307 | ) |
| November 2013 Soybean | | | | | | | | |
| Futures Contracts | | | | | | | | |
| (Aggregate Value of | | | | | | | | |
| Contracts $125,075) | | | 2 | | | | (4,532 | ) |
| September 2013 WTI Crude | | | | | | | | |
| Futures Contracts | | | | | | | | |
| (Aggregate Value of | | | | | | | | |
| Contracts $1,059,850) | | | 11 | | | | (4,873 | ) |
| September 2013 Wheat | | | | | | | | |
| Futures Contracts | | | | | | | | |
| (Aggregate Value of | | | | | | | | |
| Contracts $131,350) | | | 4 | | | | (5,826 | ) |
| September 2013 Corn | | | | | | | | |
| Futures Contracts | | | | | | | | |
| (Aggregate Value of | | | | | | | | |
| Contracts $164,175) | | | 6 | | | | (6,367 | ) |
| November 2013 Brent Crude | | | | | | | | |
| Futures Contracts | | | | | | | | |
| (Aggregate Value of | | | | | | | | |
| Contracts $806,160) | | | 8 | | | | (7,373 | ) |
| July 2013 Goldman Sachs Commodity Index | | | | | | | | |
| Futures Contracts | | | | | | | | |
| (Aggregate Value of | | | | | | | | |
| Contracts $4,886,400) | | | 32 | | | | (24,937 | ) |
| August 2013 Goldman Sachs Commodity Index | | | | | | | | |
| Futures Contracts | | | | | | | | |
| (Aggregate Value of | | | | | | | | |
| Contracts $6,845,625) | | | 45 | | | | (49,076 | ) |
| (Total Aggregate Value of | | | | | | | | |
| Contracts $15,757,377) | | | | | | $ | (110,383 | ) |
| † | Value determined based on Level 1 inputs — See Note 4. |
| †† | Value determined based on Level 2 inputs — See Note 4. |
| 1 | Repurchase Agreements — See Note 5. |
| SEE NOTES TO FINANCIAL STATEMENTS. | THE GUGGENHEIM FUNDS SEMI-ANNUAL REPORT | 31 |
| COMMODITIES STRATEGY FUND |
| CONSOLIDATED STATEMENT OF |
| ASSETS AND LIABILITIES (Unaudited) |
| June 30, 2013 |
| Assets: | | | | |
| Repurchase agreements, at value | | | | |
| (cost $1,062,478) | | $ | 1,062,478 | |
| Cash | | | 13,491,707 | |
| Segregated cash with broker | | | 1,130,527 | |
| Receivables: | | | | |
| Fund shares sold | | | 2,735 | |
| Interest | | | 6 | |
| Total assets | | | 15,687,453 | |
| Liabilities: | | | | |
| Payable for: | | | | |
| Variation margin | | | 111,109 | |
| Management fees | | | 7,350 | |
| Distribution and service fees | | | 3,644 | |
| Transfer agent and administrative fees | | | 2,450 | |
| Fund shares redeemed | | | 1,791 | |
| Portfolio accounting fees | | | 980 | |
| Miscellaneous | | | 12,083 | |
| Total liabilities | | | 139,407 | |
| Net assets | | $ | 15,548,046 | |
| Net assets consist of: | | | | |
| Paid in capital | | $ | 38,731,420 | |
| Accumulated net investment loss | | | (2,922,614 | ) |
| Accumulated net realized loss on investments | | | (20,150,377 | ) |
| Net unrealized depreciation on investments | | | (110,383 | ) |
| Net assets | | $ | 15,548,046 | |
| A-Class: | | | | |
| Net assets | | $ | 2,053,291 | |
| Capital shares outstanding | | | 142,411 | |
| Net asset value per share | | $ | 14.42 | |
| Maximum offering price per share | | | | |
| (Net asset value divided by 95.25%) | | $ | 15.14 | |
| C-Class: | | | | |
| Net assets | | $ | 2,014,122 | |
| Capital shares outstanding | | | 149,174 | |
| Net asset value per share | | $ | 13.50 | |
| H-Class: | | | | |
| Net assets | | $ | 11,480,633 | |
| Capital shares outstanding | | | 795,686 | |
| Net asset value per share | | $ | 14.43 | |
| CONSOLIDATED STATEMENT |
| OF OPERATIONS (Unaudited) |
| Period Ended June 30, 2013 |
| Investment Income: | | | | |
| Interest | | $ | 4,088 | |
| Total investment income | | | 4,088 | |
| | | | | |
| Expenses: | | | | |
| Management fees | | | 84,790 | |
| Transfer agent and administrative fees | | | 24,087 | |
| Distribution and service fees: | | | | |
| A-Class | | | 4,077 | |
| C-Class | | | 11,635 | |
| H-Class | | | 17,101 | |
| Portfolio accounting fees | | | 9,635 | |
| Registration fees | | | 9,921 | |
| Trustees’ fees* | | | 1,065 | |
| Custodian fees | | | 912 | |
| Miscellaneous | | | 5,792 | |
| Total expenses | | | 169,015 | |
| Less: | | | | |
| Expenses waived by Advisor | | | (12,530 | ) |
| Net expenses | | | 156,485 | |
| Net investment loss | | | (152,397 | ) |
| | | | | |
| Net Realized and Unrealized Gain (Loss): | | | | |
| Net realized gain (loss) on: | | | | |
| Futures contracts | | | (299,235 | ) |
| Net realized loss | | | (299,235 | ) |
| Net change in unrealized appreciation | | | | |
| (depreciation) on: | | | | |
| Futures contracts | | | (496,321 | ) |
| Net change in unrealized appreciation | | | | |
| (depreciation) | | | (496,321 | ) |
| Net realized and unrealized loss | | | (795,556 | ) |
| Net decrease in net assets resulting | | | | |
| from operations | | $ | (947,953 | ) |
* Relates to Trustees not deemed “interested persons” within the meaning of Section 2(a)(19) of the 1940 Act.
| 32 | THE GUGGENHEIM FUNDS SEMI-ANNUAL REPORT | SEE NOTES TO FINANCIAL STATEMENTS. |
| COMMODITIES STRATEGY FUND |
| CONSOLIDATED STATEMENTS OF CHANGES IN NET ASSETS |
| | | Period Ended | | | | |
| | | June 30, | | | Year Ended | |
| | | 2013 | | | December 31, | |
| | | (Unaudited) | | | 2012 | |
| | | | | | | |
| Increase (Decrease) In Net Assets From Operations: | | | | | | | | |
| Net investment loss | | $ | (152,397 | ) | | $ | (462,443 | ) |
| Net realized loss on investments | | | (299,235 | ) | | | (1,866,445 | ) |
| Net change in unrealized appreciation (depreciation) on investments | | | (496,321 | ) | | | 603,873 | |
| Net decrease in net assets resulting from operations | | | (947,953 | ) | | | (1,725,015 | ) |
| | | | | | | | | |
| Distributions to shareholders from: | | | | | | | | |
| Net investment income | | | | | | | | |
| A-Class | | | — | | | | (90,394 | ) |
| C-Class | | | — | | | | (72,057 | ) |
| H-Class | | | — | | | | (634,797 | ) |
| Total distributions to shareholders | | | — | | | | (797,248 | ) |
| | | | | | | | | |
| Capital share transactions: | | | | | | | | |
| Proceeds from sale of shares | | | | | | | | |
| A-Class | | | 143,746 | | | | 21,757,665 | |
| C-Class | | | 120,204 | | | | 624,941 | |
| H-Class | | | 24,948,208 | | | | 141,800,896 | |
| Distributions reinvested | | | | | | | | |
| A-Class | | | — | | | | 77,852 | |
| C-Class | | | — | | | | 65,263 | |
| H-Class | | | — | | | | 597,525 | |
| Cost of shares redeemed | | | | | | | | |
| A-Class | | | (3,773,577 | ) | | | (20,880,282 | ) |
| C-Class | | | (509,072 | ) | | | (1,544,634 | ) |
| H-Class | | | (36,519,405 | ) | | | (131,653,400 | ) |
| Net increase (decrease) from capital share transactions | | | (15,589,896 | ) | | | 10,845,826 | |
| Net increase (decrease) in net assets | | | (16,537,849 | ) | | | 8,323,563 | |
| | | | | | | | | |
| Net assets: | | | | | | | | |
| Beginning of period | | | 32,085,895 | | | | 23,762,332 | |
| End of period | | $ | 15,548,046 | | | $ | 32,085,895 | |
| Accumulated net investment loss at end of period | | $ | (2,922,614 | ) | | $ | (2,770,217 | ) |
| | | | | | | | | |
| Capital share activity: | | | | | | | | |
| Shares sold | | | | | | | | |
| A-Class | | | 9,423 | | | | 1,304,505 | |
| C-Class | | | 8,326 | | | | 40,528 | |
| H-Class | | | 1,625,967 | | | | 8,637,054 | |
| Shares issued from reinvestment of distributions | | | | | | | | |
| A-Class | | | — | | | | 5,129 | |
| C-Class | | | — | | | | 4,573 | |
| H-Class | | | — | | | | 39,337 | |
| Shares redeemed | | | | | | | | |
| A-Class | | | (243,989 | ) | | | (1,255,530 | ) |
| C-Class | | | (36,034 | ) | | | (100,156 | ) |
| H-Class | | | (2,357,869 | ) | | | (8,075,041 | ) |
| Net increase (decrease) in shares | | | (994,176 | ) | | | 600,399 | |
| SEE NOTES TO FINANCIAL STATEMENTS. | THE GUGGENHEIM FUNDS SEMI-ANNUAL REPORT | 33 |
| COMMODITIES STRATEGY FUND |
This table is presented to show selected data for a share outstanding throughout each period and to assist shareholders in evaluating a Fund’s performance for the periods presented.
| | | Period Ended | | | Year Ended | | | Year Ended | | | Year Ended | | | Period Ended | | | Year Ended | |
| | | June 30, | | | December 31, | | | December 31, | | | December 31, | | | December 31, | | | March 31, | |
| A-Class | | 2013a,b | | | 2012b | | | 2011b | | | 2010b | | | 2009b,c | | | 2009 | |
| Per Share Data | | | | | | | | | | | | | | | | | | | | | | | | |
| Net asset value, beginning of period | | $ | 15.49 | | | $ | 16.18 | | | $ | 17.33 | | | $ | 16.39 | | | $ | 13.26 | | | $ | 32.68 | |
| Income (loss) from investment operations: | | | | | | | | | | | | | | | | | | | | | | | | |
| Net investment income (loss)d | | | (.11 | ) | | | (.23 | ) | | | (.26 | ) | | | (.22 | ) | | | (.14 | ) | | | — | e |
| Net gain (loss) on investments (realized and unrealized) | | | (.96 | ) | | | (.05 | ) | | | (.36 | ) | | | 1.16 | | | | 3.37 | | | | (18.80 | ) |
| Total from investment operations | | | (1.07 | ) | | | (.28 | ) | | | (.62 | ) | | | .94 | | | | 3.23 | | | | (18.80 | ) |
| Less distributions from: | | | | | | | | | | | | | | | | | | | | | | | | |
| Net investment income | | | — | | | | (.41 | ) | | | (.53 | ) | | | — | | | | (.11 | ) | | | (.70 | ) |
| Total distributions | | | — | | | | (.41 | ) | | | (.53 | ) | | | — | | | | (.11 | ) | | | (.70 | ) |
| Redemption fees collected | | | — | | | | — | | | | — | | | | — | f | | | .01 | | | | .08 | |
| Net asset value, end of period | | $ | 14.42 | | | $ | 15.49 | | | $ | 16.18 | | | $ | 17.33 | | | $ | 16.39 | | | $ | 13.26 | |
| | | | | | | | | | | | | | | | | | | | | | | | | |
| Total Returng | | | (6.91 | %) | | | (1.63 | %) | | | (3.61 | %) | | | 5.74 | % | | | 24.46 | % | | | (57.55 | %) |
| Ratios/Supplemental Data | | | | | | | | | | | | | | | | | | | | | | | | |
| Net assets, end of period (in thousands) | | $ | 2,053 | | | $ | 5,840 | | | $ | 5,223 | | | $ | 7,192 | | | $ | 8,553 | | | $ | 7,189 | |
| Ratios to average net assets: | | | | | | | | | | | | | | | | | | | | | | | | |
| Net investment income (loss) | | | (1.49 | %) | | | (1.40 | %) | | | (1.47 | %) | | | (1.42 | %) | | | (1.24 | %) | | | 0.02 | % |
| Total expenses | | | 1.66 | % | | | 1.59 | % | | | 1.66 | % | | | 1.65 | % | | | 1.56 | % | | | 1.52 | % |
| Net expensesh | | | 1.53 | % | | | 1.49 | % | | | 1.55 | % | | | 1.56 | % | | | 1.38 | % | | | 1.20 | % |
| Portfolio turnover rate | | | — | | | | — | | | | — | | | | 200 | % | | | 220 | % | | | 390 | % |
| | | Period Ended | | | Year Ended | | | Year Ended | | | Year Ended | | | Period Ended | | | Year Ended | |
| | | June 30, | | | December 31, | | | December 31, | | | December 31, | | | December 31, | | | March 31, | |
| C-Class | | 2013a,b | | | 2012b | | | 2011b | | | 2010b | | | 2009b,c | | | 2009 | |
| Per Share Data | | | | | | | | | | | | | | | | | | | | | | | | |
| Net asset value, beginning of period | | $ | 14.56 | | | $ | 15.34 | | | $ | 16.58 | | | $ | 15.80 | | | $ | 12.86 | | | $ | 31.96 | |
| Income (loss) from investment operations: | | | | | | | | | | | | | | | | | | | | | | | | |
| Net investment lossd | | | (.16 | ) | | | (.33 | ) | | | (.37 | ) | | | (.32 | ) | | | (.22 | ) | | | (.06 | ) |
| Net gain (loss) on investments (realized and unrealized) | | | (.90 | ) | | | (.04 | ) | | | (.34 | ) | | | 1.10 | | | | 3.26 | | | | (18.43 | ) |
| Total from investment operations | | | (1.06 | ) | | | (.37 | ) | | | (.71 | ) | | | .78 | | | | 3.04 | | | | (18.49 | ) |
| Less distributions from: | | | | | | | | | | | | | | | | | | | | | | | | |
| Net investment income | | | — | | | | (.41 | ) | | | (.53 | ) | | | — | | | | (.11 | ) | | | (.70 | ) |
| Total distributions | | | — | | | | (.41 | ) | | | (.53 | ) | | | — | | | | (.11 | ) | | | (.70 | ) |
| Redemption fees collected | | | — | | | | — | | | | — | | | | — | f | | | .01 | | | | .09 | |
| Net asset value, end of period | | $ | 13.50 | | | $ | 14.56 | | | $ | 15.34 | | | $ | 16.58 | | | $ | 15.80 | | | $ | 12.86 | |
| | | | | | | | | | | | | | | | | | | | | | | | | |
| Total Returng | | | (7.28 | %) | | | (2.38 | %) | | | (4.32 | %) | | | 4.94 | % | | | 23.74 | % | | | (58.03 | %) |
| Ratios/Supplemental Data | | | | | | | | | | | | | | | | | | | | | | | | |
| Net assets, end of period (in thousands) | | $ | 2,014 | | | $ | 2,575 | | | $ | 3,558 | | | $ | 4,857 | | | $ | 6,186 | | | $ | 4,072 | |
| Ratios to average net assets: | | | | | | | | | | | | | | | | | | | | | | | | |
| Net investment loss | | | (2.24 | %) | | | (2.15 | %) | | | (2.22 | %) | | | (2.17 | %) | | | (2.03 | %) | | | (0.22 | %) |
| Total expenses | | | 2.41 | % | | | 2.34 | % | | | 2.41 | % | | | 2.39 | % | | | 2.31 | % | | | 2.28 | % |
| Net expensesh | | | 2.28 | % | | | 2.24 | % | | | 2.30 | % | | | 2.30 | % | | | 2.15 | % | | | 1.95 | % |
| Portfolio turnover rate | | | — | | | | — | | | | — | | | | 200 | % | | | 220 | % | | | 390 | % |
| 34 | THE GUGGENHEIM FUNDS SEMI-ANNUAL REPORT | SEE NOTES TO FINANCIAL STATEMENTS. |
| COMMODITIES STRATEGY FUND |
| FINANCIAL HIGHLIGHTS (concluded) |
This table is presented to show selected data for a share outstanding throughout each period and to assist shareholders in evaluating a Fund’s performance for the periods presented.
| | | Period Ended | | | Year Ended | | | Year Ended | | | Year Ended | | | Period Ended | | | Year Ended | |
| | | June 30, | | | December 31, | | | December 31, | | | December 31, | | | December 31, | | | March 31, | |
| H-Class | | 2013a,b | | | 2012b | | | 2011b | | | 2010b | | | 2009b,c | | | 2009 | |
| Per Share Data | | | | | | | | | | | | | | | | | | | | | | | | |
| Net asset value, beginning of period | | $ | 15.50 | | | $ | 16.18 | | | $ | 17.33 | | | $ | 16.39 | | | $ | 13.26 | | | $ | 32.66 | |
| Income (loss) from investment operations: | | | | | | | | | | | | | | | | | | | | | | | | |
| Net investment income (loss)d | | | (.11 | ) | | | (.23 | ) | | | (.27 | ) | | | (.22 | ) | | | (.14 | ) | | | .13 | |
| Net gain (loss) on investments (realized and unrealized) | | | (.96 | ) | | | (.04 | ) | | | (.35 | ) | | | 1.16 | | | | 3.37 | | | | (18.93 | ) |
| Total from investment operations | | | (1.07 | ) | | | (.27 | ) | | | (.62 | ) | | | .94 | | | | 3.23 | | | | (18.80 | ) |
| Less distributions from: | | | | | | | | | | | | | | | | | | | | | | | | |
| Net investment income | | | — | | | | (.41 | ) | | | (.53 | ) | | | — | | | | (.11 | ) | | | (.70 | ) |
| Total distributions | | | — | | | | (.41 | ) | | | (.53 | ) | | | — | | | | (.11 | ) | | | (.70 | ) |
| Redemption fees collected | | | — | | | | — | | | | — | | | | — | f | | | .01 | | | | .10 | |
| Net asset value, end of period | | $ | 14.43 | | | $ | 15.50 | | | $ | 16.18 | | | $ | 17.33 | | | $ | 16.39 | | | $ | 13.26 | |
| | | | | | | | | | | | | | | | | | | | | | | | | |
| Total Returng | | | (6.90 | %) | | | (1.57 | %) | | | (3.67 | %) | | | 5.74 | % | | | 24.45 | % | | | (57.52 | %) |
| Ratios/Supplemental Data | | | | | | | | | | | | | | | | | | | | | | | | |
| Net assets, end of period (in thousands) | | $ | 11,481 | | | $ | 23,671 | | | $ | 14,982 | | | $ | 32,290 | | | $ | 32,019 | | | $ | 50,622 | |
| Ratios to average net assets: | | | | | | | | | | | | | | | | | | | | | | | | |
| Net investment income (loss) | | | (1.49 | %) | | | (1.40 | %) | | | (1.47 | %) | | | (1.42 | %) | | | (1.22 | %) | | | 0.43 | % |
| Total expenses | | | 1.66 | % | | | 1.60 | % | | | 1.66 | % | | | 1.65 | % | | | 1.56 | % | | | 1.52 | % |
| Net expensesh | | | 1.53 | % | | | 1.49 | % | | | 1.56 | % | | | 1.56 | % | | | 1.37 | % | | | 1.20 | % |
| Portfolio turnover rate | | | — | | | | — | | | | — | | | | 200 | % | | | 220 | % | | | 390 | % |
| a | Unaudited figures for the period ended June 30, 2013. Percentage amounts for the period, except total return and portfolio turnover rate, have been annualized. |
| c | The Fund changed its fiscal year from March 31 to December 31 in 2009. Percentage amounts for the period, except total return and portfolio turnover rate, have been annualized. |
| d | Net investment income (loss) per share was computed using average shares outstanding throughout the period. |
| e | Net investment income is less than $0.01 per share. |
| f | Redemption fees collected are less than $0.01 per share. |
| g | Total return does not reflect the impact of any applicable sales charges and has not been annualized. |
| h | Net expense information reflects the expense ratios after expense waivers. |
| SEE NOTES TO FINANCIAL STATEMENTS. | THE GUGGENHEIM FUNDS SEMI-ANNUAL REPORT | 35 |
| NOTES TO CONSOLIDATED FINANCIAL STATEMENTS (Unaudited) |
| 1. | Organization, Consolidation of Subsidiary and Significant Accounting Policies |
Organization
The Rydex Series Funds (the “Trust”) is registered with the SEC under the Investment Company Act of 1940 (“1940 Act”), as a non-diversified, open-ended investment company. Each series, in effect, is representing a separate Fund (collectively the “Funds”). The Trust is authorized to issue an unlimited number of shares. The Trust accounts for the assets of each Fund separately.
The Trust offers a combination of eight separate classes of shares: Investor Class shares, Advisor Class shares, A-Class shares, C Class shares, H-Class shares, Y-Class shares, Institutional Class shares, and Money Market Class shares. Sales of shares of each Class are made without a front-end sales charge at the net asset value per share (“NAV”), with the exception of A-Class shares. A-Class shares are sold at the NAV, plus the applicable front-end sales charge. The sales charge varies depending on the amount purchased, but will not exceed 4.75%. A-Class share purchases of $1 million or more are exempt from the front-end sales charge but have a 1% contingent deferred sales charge (“CDSC”) if shares are redeemed within 12 months of purchase. C-Class shares have a 1% CDSC if shares are redeemed within 12 months of purchase. Institutional Class shares are offered primarily for direct investment by institutions such as pension and profit sharing plans, endowments, foundations and corporations. Institutional Class shares have a minimum initial investment of $2 million and a minimum account balance of $1 million. Institutional Class shares are offered without a front-end sales charge or CDSC.
At June 30, 2013, the Trust consisted of fifty-one separate funds. This report covers the Managed Commodities Strategy Fund, the Multi-Hedge Strategies Fund and the Commodities Strategy Fund (collectively, the “Funds”). Only A-Class, C-Class, H-Class, Y-Class and Institutional Class shares had been issued by the Funds.
Guggenheim Investments (“GI”) provides advisory services and Rydex Fund Services, LLC (“RFS”) provides transfer agent, administrative and accounting services to the Trust. Guggenheim Distributors, LLC (“GDL”) acts as principal underwriter for the Trust. GI, RFS and GDL are affiliated entities.
Consolidation of Subsidiary
Each of the consolidated financial statements of the Funds include the accounts of a wholly-owned and controlled Cayman Islands subsidiary (the “Subsidiary”). Significant inter-company accounts and transactions have been eliminated in consolidation for the Funds.
Each Fund may invest up to 25% of its total assets in its Subsidiary which acts as an investment vehicle in order to effect certain investments consistent with the Fund’s investment objectives and policies.
A summary of each Fund’s investment in its respective Subsidiary is as follows:
| | | | | | | | % of Total | |
| | | | | Subsidiary | | | Net Assets | |
| | | Inception | | Net Assets at | | | of the Fund at | |
| | | Date of | | June 30, | | | June 30, | |
| | | Subsidiary | | 2013 | | | 2013 | |
| Managed Commodities Strategy Fund | | 06/25/09 | | $ | 3,136,601 | | | | 7.2 | % |
| Multi-Hedge Strategies Fund | | 09/18/09 | | | 5,403,397 | | | | 5.0 | % |
| Commodities Strategy Fund | | 09/08/09 | | | 2,054,685 | | | | 13.2 | % |
Significant Accounting Policies
The following significant accounting policies are in conformity with U.S. generally accepted accounting principles (“U.S. GAAP”) and are consistently followed by the Trust. This requires management to make estimates and assumptions that affect the reported amount of assets and liabilities and disclosure of contingent assets and liabilities at the date of the financial statements and the reported amounts of revenues and expenses during the reporting period. Actual results could differ from these estimates. All time references are based on Eastern Time.
A. Equity securities listed on an exchange (New York Stock Exchange (“NYSE”) or American Stock Exchange) are valued at the last quoted sales price as of the close of business on the NYSE, usually 4:00 p.m. on the valuation date. Equity securities listed on the NASDAQ market system are valued at the NASDAQ Official Closing Price on the valuation date.
Listed options are valued at the Official Settlement Price listed by the exchange, usually as of 4:00 p.m. Long options are valued using the bid price and short options are valued using the ask price. In the event that a settlement price is not available, fair valuation is enacted. Over-the-counter options are valued using the average bid price (for long options), or average ask price (for short options) obtained from one or more security dealers.
The value of futures contracts is accounted for using the unrealized gain or loss on the contracts that is determined by marking the contracts to their current realized settlement prices. Financial futures contracts are valued at the 4:00 p.m. price on the valuation date. In the event that the exchange for a specific futures contract closes earlier than 4:00 p.m., the futures contract is valued at the Official Settlement Price of the exchange. However, the underlying securities from which the futures contract value is derived
| 36 | THE GUGGENHEIM FUNDS SEMI-ANNUAL REPORT |
| NOTES TO CONSOLIDATED FINANCIAL STATEMENTS (Unaudited) (continued) |
are monitored until 4:00 p.m. to determine if fair valuation would provide a more accurate valuation.
Debt securities with a maturity of greater than 60 days at acquisition are valued at prices that reflect broker/dealer supplied valuations or are obtained from independent pricing services, which may consider the trade activity, treasury spreads, yields or price of bonds of comparable quality, coupon, maturity, and type, as well as prices quoted by dealers who make markets in such securities. Short-term debt securities with a maturity of 60 days or less at acquisition and repurchase agreements are valued at amortized cost, which approximates market value.
Open-end investment companies (“Mutual Funds”) are valued at their NAV as of the close of business on the valuation date. Exchange Traded Funds (“ETFs”) and closed-end investment companies are valued at the last quoted sales price.
The value of swap agreements entered into by a Fund is accounted for using the unrealized gain or loss on the agreements that is determined by marking the agreements to the last quoted value of the index that the swap pertains to at the close of the NYSE. The swap’s market value is then adjusted to include dividends accrued, financing charges and/or interest associated with the swap agreements.
Investments for which market quotations are not readily available are fair valued as determined in good faith by GI under the direction of the Board of Trustees using methods established or ratified by the Board of Trustees. These methods include, but are not limited to: (i) obtaining general information as to how these securities and assets trade; (ii) in connection with futures contracts and options thereupon, and other derivative investments, obtaining information as to how (a) these contracts and other derivative investments trade in the futures or other derivative markets, respectively, and (b) the securities underlying these contracts and other derivative investments trade in the cash market; and (iii) obtaining other information and considerations, including current values in related markets.
B. Security transactions are recorded on the trade date for financial reporting purposes. Realized gains and losses from securities transactions are recorded using the identified cost basis. Proceeds from lawsuits related to investment holdings are recorded as realized gains in the respective Fund. Dividend income is recorded on the ex-dividend date, net of applicable taxes withheld by foreign countries. Taxable non-cash dividends are recorded as dividend income. Interest income, including amortization of premiums and accretion of discounts, is accrued on a daily basis. Distributions received from investments in REITs are recorded as dividend income on the ex-dividend date, subject to reclassification upon notice of the character of such distribution by the issuer.
C. Distributions of net investment income and net realized gains, if any, are declared and paid at least annually. Distributions are recorded on the ex-dividend date and are determined in accordance with income tax regulations which may differ from U.S. GAAP.
D. When a Fund engages in a short sale of a security, an amount equal to the proceeds is reflected as an asset and an equivalent liability. The amount of the liability is subsequently marked-to-market to reflect the market value of the short sale. The Fund maintains a segregated account of cash and/or securities as collateral for short sales.
Fees, if any, paid to brokers to borrow securities in connection with short sales are recorded as interest expense. In addition, the Fund must pay out the dividend rate of the equity or coupon rate of the treasury obligation to the lender and record this as an expense. Short dividend or interest expense is a cost associated with the investment objective of short sales transactions, rather than an operational cost associated with the day-to-day management of any mutual fund. The Funds may also receive rebate income from the broker resulting from the investment of the proceeds from securities sold short.
E. Upon the purchase of an option, the premium paid is recorded as an investment, the value of which is marked-to-market daily. If a purchased option expires, the Fund realizes a loss in the amount of the cost of the option. When the Fund enters into a closing sale transaction, it realizes a gain or loss depending on whether the proceeds from the closing sale transaction are greater or less than the cost of the option. If the Fund exercises a put option, it realizes a gain or loss from the sale of the underlying security and the proceeds from such sale will be decreased by the premium originally paid. When the Fund exercises a call option, the cost of the security purchased by the Fund upon exercise increases by the premium originally paid.
When the Fund writes (sells) an option, an amount equal to the premium received is entered in that Fund’s accounting records as an asset and equivalent liability. The amount of the liability is subsequently marked-to-market to reflect the current value of the option written. When a written option expires, or if the Fund enters into a closing purchase transaction, it realizes a gain (or loss if the cost of a closing purchase transaction exceeds the premium received when the option was sold).
| THE GUGGENHEIM FUNDS SEMI-ANNUAL REPORT | 37 |
| NOTES TO CONSOLIDATED FINANCIAL STATEMENTS (Unaudited) (continued) |
F. Upon entering into a futures contract, a Fund deposits and maintains as collateral such initial margin as required by the exchange on which the transaction is affected. Pursuant to the contract, the Fund agrees to receive from or pay to the broker an amount of cash equal to the daily fluctuation in value of the contract. Such receipts or payments are known as variation margin and are recorded by the Fund as unrealized gains or losses. When the contract is closed, the Fund records a realized gain or loss equal to the difference between the value of the contract at the time it was opened and the value at the time it was closed.
G. Swap agreements are marked-to-market daily and the change, if any, is recorded as unrealized gain or loss. Payments received or made as a result of an agreement or termination of the agreement are recognized as realized gains or losses.
H. Investment securities and other assets and liabilities denominated in foreign currencies are translated into U.S. dollar amounts at the date of valuation. Purchases and sales of investment securities and income and expense items denominated in foreign currencies are translated into U.S. dollar amounts on the respective dates of such transactions. The Funds do not isolate that portion of the results of operations resulting from changes in foreign exchange rates on investments from the fluctuations arising from changes in market prices of securities held. Such fluctuations are included with the net realized and unrealized gain and loss from investments.
Reported net realized foreign exchange gains or losses arise from sales of foreign currencies and currency gains or losses realized between the trade and settlement dates on investment transactions. Net unrealized exchange gains and losses arise from changes in the fair values of assets and liabilities other than investments in securities at the fiscal period end, resulting from changes in exchange rates.
I. Certain U.S. Government and Agency Obligations are traded on a discount basis; the interest rates shown on the Schedules of Investments reflect the effective rates paid at the time of purchase by the Funds. Other securities bear interest at the rates shown, payable at fixed dates through maturity.
J. The Funds may leave cash overnight in their cash account with the custodian, U.S. Bank. Periodically, a Fund may have cash due to the custodian bank as an overdraft balance. A fee is incurred on this overdraft, calculated by multiplying the overdraft by a rate based on the federal funds rate.
Segregated cash with the broker is held as collateral for investments in derivative instruments such as futures contracts or swap agreements.
K. Interest and dividend income, most expenses, all realized gains and losses, and all unrealized gains and losses are allocated to the Classes based upon the value of the outstanding shares in each Class. Certain costs, such as distribution fees relating to A-Class shares and H-Class shares and service and distribution fees related to C-Class shares, are charged directly to specific Classes. In addition, certain expenses have been allocated to the individual Funds in the Trust on a pro rata basis upon the respective aggregate net assets of each Fund included in the Trust.
L. Throughout the normal course of business, the Funds enter into contracts that contain a variety of representations and warranties which provide general indemnifications. The Funds’ maximum exposure under these arrangements is unknown, as this would involve future claims that may be made against the Funds and/or their affiliates that have not yet occurred. However, based on experience, the Funds expect the risk of loss to be remote.
2. Financial Instruments
As part of their investment strategy, the Funds utilize short sales and a variety of derivative instruments including futures, options and swap agreements. These investments involve, to varying degrees, elements of market risk and risks in excess of the amounts recognized in the Statements of Assets and Liabilities.
A short sale is a transaction in which a Fund sells a security it does not own. If the security sold short decreases in price between the time the Fund sells the security and closes its short position, that Fund will realize a gain on the transaction. Conversely, if the security increases in price during the period, that Fund will realize a loss on the transaction. The risk of such price increases is the principal risk of engaging in short sales.
A futures contract is an agreement to purchase (long) or sell (short) an agreed amount of securities or other instruments at a set price for delivery at a future date. There are significant risks associated with a Fund’s use of futures contracts and related options, including (i) there may be an imperfect or no correlation between the changes in market value of the underlying asset and the prices of futures contracts; (ii) there may not be a liquid secondary market for a futures contract; (iii) trading restrictions or limitations may be imposed by an exchange; and (iv) government regulations may restrict trading in futures contracts. When investing in futures, there is minimal counterparty credit risk to
| 38 | THE GUGGENHEIM FUNDS SEMI-ANNUAL REPORT |
| NOTES TO CONSOLIDATED FINANCIAL STATEMENTS (Unaudited) (continued) |
the Fund because futures are exchange-traded and the exchange’s clearinghouse, as counterparty to all exchange-traded futures, guarantees against default.
A swap is an agreement that obligates two parties to exchange a series of cash flows at specified intervals based upon or calculated by reference to changes in specified prices or rates for a specified amount of an underlying asset. A Fund bears the risk of loss of the amount expected to be received under a swap agreement in the event of the default or bankruptcy of a swap agreement counterparty. Additionally, there is no guarantee that a Fund or an underlying fund could eliminate its exposure under an outstanding swap agreement by entering into an offsetting swap agreement with the same or another party.
An option on a security gives the purchaser of the option the right to sell, and the writer of the option the obligation to buy, the underlying security (put option) or the purchaser of the option the right to buy, and the writer of the option the obligation to sell, the underlying security (call option) at any time during the option period. The risk associated with purchasing options is limited to the premium originally paid. The risk in writing a call option is that a Fund may incur a loss if the market price of the underlying security increases and the option is exercised. The risk in writing a put option is that a Fund may incur a loss if the market price of the underlying security decreases and the option is exercised. In addition, there may be an imperfect correlation between the movement in prices of options and the underlying securities and a Fund may not be able to enter into a closing transaction because of an illiquid secondary market or, for over-the-counter options, because of the counterparty’s inability to perform.
In conjunction with the use of short sales, futures, options and swap agreements, the Funds are required to maintain collateral in various forms. The Funds use, where appropriate, depending on the financial instrument utilized and the broker involved, margin deposits at the broker, cash and/or securities segregated at the custodian bank, discount notes, or the repurchase agreements allocated to each Fund.
The Trust has established counterparty credit guidelines and enters into transactions only with financial institutions of investment grade or better. The Trust monitors the counterparty credit risk.
3. Fees and Other Transactions with Affiliates
Under the terms of an investment advisory contract, the Funds pay GI investment advisory fees calculated at the annualized rates below, based on the average daily net assets of the Funds:
| | | Management Fees | |
| Fund | | (as a % of Net Assets) | |
| Managed Commodities Strategy Fund | | | 0.90 | % |
| Multi-Hedge Strategies Fund | | | 1.15 | % |
| Commodities Strategy Fund | | | 0.75 | % |
GI has contractually agreed to waive the management fee it receives from each Subsidiary in an amount equal to the management fee paid to GI by the Subsidiary. This undertaking will continue in effect for so long as the Fund invests in the Subsidiary, and may not be terminated by GI unless GI obtains the prior approval of the Fund’s Board of Trustees for such termination. In any event, this undertaking will continue through April 30, 2014.
As part of its agreement with the Trust, GI will pay all expenses of the Multi-Hedge Strategies Fund, including the cost of transfer agency, custody, fund administration, legal, audit and other services, except interest expense, taxes (expected to be de minimis), brokerage commissions and other expenses connected with execution of portfolio transactions, short dividend expenses, subsidiary expenses and extraordinary expenses.
RFS provides transfer agent and administrative services to the Funds for fees calculated at an annualized rate of 0.25% of the average daily net assets of A-Class, C-Class, H-Class and Institutional Class, and 0.20% of the average daily net assets of Y-Class. Fees related to the Multi-Hedge Strategies Fund are paid by GI, as previously noted.
RFS also provides accounting services to the Funds for fees calculated at annualized rates below, based on the average daily net assets each Fund. Fees related to the Multi-Hedge Strategies Fund are paid by GI, as previously noted.
| Fund Accounting Fees | | (as a % of Net Assets) | |
| On the first $250 million | | | 0.10 | % |
| On the next $250 million | | | 0.075 | % |
| On the next $250 million | | | 0.05 | % |
| Over $750 million | | | 0.03 | % |
RFS engages external service providers to perform other necessary services for the Trust, such as audit and accounting related services, legal services, custody, printing and mailing, etc., on a pass through basis. Such expenses vary from Fund to Fund and are allocated to the Funds based on relative net assets. Certain expenses allocated to the Multi-Hedge Strategies Fund are paid by GI, as previously noted.
| THE GUGGENHEIM FUNDS SEMI-ANNUAL REPORT | 39 |
| NOTES TO CONSOLIDATED FINANCIAL STATEMENTS (Unaudited) (continued) |
The Trust has adopted a Distribution Plan applicable to A-Class shares and H-Class shares for which GDL and other firms that provide distribution and/or shareholder services (“Service Providers”) may receive compensation. If a Service Provider provides distribution services, the Trust will pay distribution fees to GDL at an annual rate not to exceed 0.25% of average daily net assets, pursuant to Rule 12b-1 of the 1940 Act. GDL, in turn, will pay the Service Provider out of its fees. GDL may, at its discretion, retain a portion of such payments to compensate itself for distribution services.
The Trust has adopted a separate Distribution and Shareholder Services Plan applicable to its C-Class shares that allows the Funds to pay annual distribution and service fees of 1.00% of the Funds’ C-Class shares average daily net assets. The annual 0.25% service fee compensates the shareholder’s financial advisor for providing ongoing services to the shareholder. The annual distribution fee of 0.75% reimburses GDL for paying the shareholder’s financial advisor an ongoing sales commission. GDL advances the first year’s service and distribution fees to the financial advisor. GDL retains the service and distribution fees on accounts with no authorized dealer of record.
For the period ended June 30, 2013, GDL retained sales charges of $158,835 relating to sales of A-Class shares of the Trust.
Certain officers and trustees of the Trust are also officers of GI, RFS and GDL.
4. Fair Value Measurement
In accordance with U.S. GAAP, fair value is defined as the price that the Fund would receive to sell an investment or pay to transfer a liability in an orderly transaction with an independent buyer in the principal market, or in the absence of a principal market the most advantageous market for the investment or liability. A three-tier hierarchy is utilized to distinguish between (1) inputs that reflect the assumptions market participants would use in pricing an asset or liability developed based on market data obtained from sources independent of the reporting entity (observable inputs) and (2) inputs that reflect the reporting entity’s own assumptions about the assumptions market participants would use in pricing an asset or liability developed based on the best information available in the circumstances (unobservable inputs) and to establish classification of fair value measurements for disclosure purposes. Various inputs are used in determining the value of the Funds’ investments. The inputs are summarized in the three broad levels listed below:
Level 1 — quoted prices in active markets for identical securities.
Level 2 — other significant observable inputs (including quoted prices for similar securities, interest rates, prepayment speeds, credit risk, etc.).
Level 3 — significant unobservable inputs (including the fund’s own assumptions used to determine the fair value of investments).
The inputs or methodologies used for valuing securities are not necessarily an indication of the risk associated with investing in those securities.
The following table summarizes the inputs used to value the Funds’ net assets at June 30, 2013:
| | | Level 1 | | | Level 1 | | | Level 2 | | | Level 2 | | | Level 3 | | | | |
| | | Investments | | | Other Financial | | | Investments | | | Other Financial | | | Investments | | | | |
| | | In Securities | | | Instruments* | | | In Securities | | | Instruments* | | | In Securities | | | Total | |
| Assets | | | | | | | | | | | | | | | | | | | | | | | | |
| Managed Commodities Strategy Fund | | $ | 4,796,955 | | | $ | 2,079,253 | | | $ | 32,029,177 | | | $ | — | | | $ | — | | | $ | 38,905,385 | |
| Multi-Hedge Strategies Fund | | | 78,996,969 | | | | 2,829,805 | | | | 9,959,048 | | | | 230,649 | | | | — | | | | 92,016,471 | |
| Commodities Strategy Fund | | | — | | | | 5,279 | | | | 1,062,478 | | | | — | | | | — | | | | 1,067,757 | |
| | | | | | | | | | | | | | | | | | | | | | | | | |
| Liabilities | | | | | | | | | | | | | | | | | | | | | | | | |
| Managed Commodities Strategy Fund | | $ | — | | | $ | 3,121,674 | | | $ | — | | | $ | — | | | $ | — | | | $ | 3,121,674 | |
| Multi-Hedge Strategies Fund | | | 49,054,599 | | | | 1,699,834 | | | | — | | | | — | | | | — | | | | 50,754,433 | |
| Commodities Strategy Fund | | | — | | | | 115,662 | | | | — | | | | — | | | | — | | | | 115,662 | |
* Other financial instruments may include futures contracts and/or swaps, which are reported as unrealized gain/loss at period end.
For the period ended June 30, 2013, there were no transfers between levels.
5. Repurchase Agreements
The Funds transfer uninvested cash balances into a single joint account, the daily aggregate balance of which is invested in one or more repurchase agreements collateralized by obligations of the U.S. Treasury and U.S. Government Agencies. The collateral is in the possession of the
| 40 | THE GUGGENHEIM FUNDS SEMI-ANNUAL REPORT |
| NOTES TO CONSOLIDATED FINANCIAL STATEMENTS (Unaudited) (continued) |
Funds’ custodian and is evaluated to ensure that its market value exceeds, at a minimum, 102% of the original face amount of the repurchase agreements. Each Fund holds a pro rata share of the collateral based on the dollar amount of the repurchase agreement entered into by each Fund.
At June 30, 2013, the repurchase agreements in the joint account were as follows:
| Counterparty and Terms of Agreement | | Face Value | | | Repurchase Price | | | Collateral | | Par Value | | | Fair Value | |
| HSBC Group | | | | | | | | | | Fannie Mae | | | | | | | | |
| 0.07% | | | | | | | | | | 0.50% - 0.65% | | | | | | | | |
| Due 07/01/13 | | $ | 860,000,000 | | | $ | 860,005,017 | | | 10/22/15 - 05/27/16 | | $ | 298,566,000 | | | $ | 299,638,582 | |
| | | | | | | | | | | Freddie Mac | | | | | | | | |
| | | | | | | | | | | 0.50% - 0.60% | | | | | | | | |
| | | | | | | | | | | 10/09/15 - 03/28/16 | | | 250,000,000 | | | | 251,160,833 | |
| | | | | | | | | | | Federal Home Loan Bank | | | | | | | | |
| | | | | | | | | | | 0.13% | | | | | | | | |
| | | | | | | | | | | 03/19/14 | | | 200,000,000 | | | | 200,947,222 | |
| | | | | | | | | | | Federal Farm Credit Bank | | | | | | | | |
| | | | | | | | | | | 0.30% | | | | | | | | |
| | | | | | | | | | | 06/04/15 | | | 125,000,000 | | | | 125,454,167 | |
| Mizuho Financial Group, Inc. | | | | | | | | | | U.S. Treasury Note | | | | | | | | |
| 0.06% | | | | | | | | | | 0.88% | | | | | | | | |
| Due 07/01/13 | | | 147,807,111 | | | | 147,807,850 | | | 01/31/18 | | | 152,694,700 | | | | 150,763,344 | |
| Deutsche Bank | | | | | | | | | | U.S. Treasury Note | | | | | | | | |
| 0.06% | | | | | | | | | | 0.25% | | | | | | | | |
| Due 07/01/13 | | | 60,000,000 | | | | 60,000,300 | | | 09/15/15 | | | 61,428,800 | | | | 61,200,019 | |
In the event of counterparty default, the Funds have the right to collect the collateral to offset losses incurred. There is potential loss to the Funds in the event the Funds are delayed or prevented from exercising their rights to dispose of the collateral securities, including the risk of a possible decline in the value of the underlying securities during the period while the Funds seek to assert their rights. The Funds’ investment advisor, acting under the supervision of the Board of Trustees, reviews the value of the collateral and the creditworthiness of those banks and dealers with which the Funds enter into repurchase agreements to evaluate potential risks.
6. Derivative Investment Holdings Categorized by Risk Exposure
U.S. GAAP requires disclosures to enable investors to better understand how and why the Funds use derivative instruments, how these derivative instruments are accounted for and their effects on the Funds’ financial position and results of operations.
The following Funds utilized derivatives for the following purposes:
| Fund | Index Exposure | Liquidity | Hedging | Income | Speculation |
| Managed Commodities Strategy Fund | x | x | | | |
| Multi-Hedge Strategies Fund | | | x | x | x |
| Commodities Strategy Fund | x | x | | | |
The following table represents the notional amount of derivative instruments outstanding, as an approximate percentage of the Funds’ net assets on a daily basis.
| | | Approximate percentage | |
| | | of Fund’s net assets on | |
| | | | | a daily basis | |
| Fund | | Long | | Short | |
| Managed Commodities Strategy Fund | | 105% | | | — | |
| Multi-Hedge Strategies Fund | | 55% | | | 55 | % |
| Commodities Strategy Fund | | 100% | | | — | |
The following is a summary of the location of derivative investments on the Funds’ Statements of Assets and Liabilities as of June 30, 2013:
| Derivative Investment Type | | Asset Derivatives | | Liability Derivatives |
| Equity/Commodity contracts | | Variation margin | | Variation margin |
| | | Unrealized appreciation on swap agreements | | Unrealized depreciation on swap agreements |
| | | Investments, at value | | Options written, at value |
| THE GUGGENHEIM FUNDS SEMI-ANNUAL REPORT | 41 |
| NOTES TO CONSOLIDATED FINANCIAL STATEMENTS (Unaudited) (continued) |
The following table sets forth the fair value of the Funds’ derivative investments categorized by primary risk exposure at June 30, 2013:
| Asset Derivative Investments Value |
| | | | | | | | | | | | Options | | | Options | | | | |
| | | Futures | | | Swaps | | | Futures | | | Written | | | Purchased | | | Total Value at | |
| | | Equity | | | Equity | | | Commodity | | | Commodity | | | Commodity | | | June 30, | |
| Fund | | Contracts* | | | Contracts | | | Contracts* | | | Contracts | | | Contracts | | | 2013 | |
| Managed Commodities Strategy Fund | | $ | — | | | $ | — | | | $ | 73,153 | | | $ | — | | | $ | 2,006,100 | | | $ | 2,079,253 | |
| Multi-Hedge Strategies Fund | | | 586,778 | | | | 230,649 | | | | 2,243,027 | | | | — | | | | — | | | | 3,060,454 | |
| Commodities Strategy Fund | | | — | | | | — | | | | 5,279 | | | | — | | | | — | | | | 5,279 | |
| Liability Derivative Investments Value |
| | | | | | | | | | | | Options | | | Options | | | | |
| | | Futures | | | Swaps | | | Futures | | | Written | | | Purchased | | | Total Value at | |
| | | Equity | | | Equity | | | Commodity | | | Commodity | | | Commodity | | | June 30, | |
| Fund | | Contracts* | | | Contracts | | | Contracts* | | | Contracts | | | Contracts | | | 2013 | |
| Managed Commodities Strategy Fund | | $ | — | | | $ | — | | | $ | 2,552,624 | | | $ | 569,050 | | | $ | — | | | $ | 3,121,674 | |
| Multi-Hedge Strategies Fund | | | 673,474 | | | | — | | | | 1,026,360 | | | | — | | | | — | | | | 1,699,834 | |
| Commodities Strategy Fund | | | — | | | | — | | | | 115,662 | | | | — | | | | — | | | | 115,662 | |
* Includes cumulative appreciation (depreciation) of futures contracts as reported on the Schedules of Investments. Only current day’s variation margin is reported within the Statements of Assets and Liabilities.
The following is a summary of the location of derivative investments on the Funds’ Statements of Operations for the period ended June 30, 2013:
| Derivative Investment Type | | Location of Gain (Loss) on Derivatives |
| Equity/Commodity contracts | | Net realized gain (loss) on swap agreements |
| | | Net realized gain (loss) on futures contracts |
| | | Net realized gain (loss) on options purchased |
| | | Net realized gain (loss) on options written |
| | | Net change in unrealized appreciation (depreciation) on swap agreements |
| | | Net change in unrealized appreciation (depreciation) on futures contracts |
| | | Net change in unrealized appreciation (depreciation) on options purchased |
| | | Net change in unrealized appreciation (depreciation) on options written |
The following is a summary of the Funds’ realized gain (loss) and change in unrealized appreciation (depreciation) on derivative investments recognized on the Statements of Operations categorized by primary risk exposure for the period ended June 30, 2013:
| Realized Gain (Loss) on Derivative Investments Recognized on the Statements of Operations |
| | | | | | | | | | | | Options | | | Options | | | Options | | | | |
| | | Futures | | | Swaps | | | Futures | | | Written | | | Purchased | | | Purchased | | | | |
| | | Equity | | | Equity | | | Commodity | | | Commodity | | | Commodity | | | Equity | | | | |
| Fund | | Contracts* | | | Contracts | | | Contracts* | | | Contracts | | | Contracts | | | Contracts | | | Total | |
| Managed Commodities Strategy Fund | | $ | — | | | $ | — | | | $ | (16,410,514 | ) | | $ | (23,436 | ) | | $ | 65,646 | | | $ | — | | | $ | (16,368,304 | ) |
| Multi-Hedge Strategies Fund | | | 1,057,164 | | | | (17,999 | ) | | | (25,233 | ) | | | — | | | | — | | | | (4,726 | ) | | | 1,009,206 | |
| Commodities Strategy Fund | | | — | | | | — | | | | (299,235 | ) | | | — | | | | — | | | | — | | | | (299,235 | ) |
| Change in Unrealized Appreciation (Depreciation) on Derivative Investments Recognized on the Statements of Operations |
| | | | | | | | | | | | Options | | | Options | | | Options | | | | |
| | | Futures | | | Swaps | | | Futures | | | Written | | | Purchased | | | Purchased | | | | |
| | | Equity | | | Equity | | | Commodity | | | Commodity | | | Commodity | | | Equity | | | | |
| Fund | | Contracts* | | | Contracts | | | Contracts* | | | Contracts | | | Contracts | | | Contracts | | | Total | |
| Managed Commodities Strategy Fund | | $ | — | | | $ | — | | | $ | (2,177,257 | ) | | $ | 122,358 | | | $ | 61,008 | | | $ | — | | | $ | (1,993,891 | ) |
| Multi-Hedge Strategies Fund | | | (930,959 | ) | | | 230,649 | | | | 1,043,313 | | | | — | | | | — | | | | 1,926 | | | | 344,929 | |
| Commodities Strategy Fund | | | — | | | | — | | | | (496,321 | ) | | | — | | | | — | | | | — | | | | (496,321 | ) |
| 42 | THE GUGGENHEIM FUNDS SEMI-ANNUAL REPORT |
| NOTES TO CONSOLIDATED FINANCIAL STATEMENTS (Unaudited) (continued) |
Transactions in options written during the period ended June 30, 2013 were as follows:
| | | Written Call Options | |
| | | Number of | | | Premium | |
| Managed Commodities Strategy Fund | | contracts | | | amount | |
| Balance at December 31, 2012 | | | — | | | $ | — | |
| Options Written | | | 110 | | | | 648,093 | |
| Options terminated in closing purchase transactions | | | — | | | | — | |
| Options expired | | | — | | | | — | |
| Options exercised | | | — | | | | — | |
| Balance at June 30, 2013 | | | 110 | | | $ | 648,093 | |
| | | Written Put Options | |
| | | Number of | | | Premium | |
| Managed Commodities Strategy Fund | | contracts | | | amount | |
| Balance at December 31, 2012 | | | — | | | $ | — | |
| Options Written | | | 144 | | | | 113,227 | |
| Options terminated in closing purchase transactions | | | (94 | ) | | | (69,912 | ) |
| Options expired | | | — | | | | — | |
| Options exercised | | | — | | | | — | |
| Balance at June 30, 2013 | | | 50 | | | $ | 43,315 | |
| 8. | Federal Income Tax Information |
The Funds intend to comply with the provisions of Subchapter M of the Internal Revenue Code applicable to regulated investment companies and distribute substantially all taxable net investment income and capital gains sufficient to relieve the Funds from all, or substantially all, federal income, excise and state income taxes. Therefore, no provision for federal or state income tax is required.
Tax positions taken or expected to be taken in the course of preparing the Funds’ tax returns are evaluated to determine whether the tax positions are “more-likely-than-not” of being sustained by the applicable tax authority. Tax positions not deemed to meet the more-likely-than-not threshold would be recorded as a tax benefit or expense in the current year. Management has analyzed the Funds’ tax positions taken, or to be taken, on Federal income tax returns for all open tax years (fiscal years 2009-2012), and has concluded that no provision for income tax is required in the Funds’ financial statements.
The Managed Commodities Strategy Fund, the Multi-Hedge Strategies Fund and the Commodities Strategy Fund intend to invest up to 25% of their assets in the Subsidiary which is expected to provide the Funds with exposure to the commodities markets within the limitations of the federal tax requirements under Subchapter M of the Internal Revenue Code. The Managed Commodities Strategy Fund, the Multi-Hedge Strategies Fund and the Commodities Strategy Fund have received a private letter ruling from the IRS that concludes that the income the Funds receive from the Subsidiary will constitute qualifying income for purposes of Subchapter M of the Internal Revenue Code. The Subsidiary will be classified as a corporation for U.S. federal income tax purposes. A foreign corporation, such as the Subsidiary, will generally not be subject to U.S. federal income taxation unless it is deemed to be engaged in a U.S. trade or business.
In July 2011, the IRS notified the RIC industry that it would not issue further private letter rulings until the (IRS) staff could look at the overall set of issues and consider guidance of broader applicability.
The RIC Modernization Act of 2010 was signed into law on December 22, 2010. It simplified some of the tax provisions applicable to regulated investment companies, the tax reporting to their shareholders and improved the tax efficiency of certain fund structures. The changes were generally effective for taxable years beginning after the date of enactment.
One of the more prominent changes addresses capital loss carry forwards. Funds are permitted to carry forward capital losses incurred in taxable years beginning after December 22, 2010 for an unlimited period. However, any losses incurred during those future taxable years will be required to be utilized prior to the losses incurred in pre-enactment taxable years. Under pre-enactment law, capital losses could be carried forward for eight years, and carried forward as short-term capital, irrespective of the character of the original loss. As a result of this ordering rule, pre-enactment capital loss carry forwards may potentially expire unused. Additionally, post-enactment capital losses that are carried forward will retain their character as either short-term or long-term capital losses rather than being considered all short-term as under previous law.
| THE GUGGENHEIM FUNDS SEMI-ANNUAL REPORT | 43 |
| NOTES TO CONSOLIDATED FINANCIAL STATEMENTS (Unaudited) (continued) |
At June 30, 2013, the cost of securities for Federal income tax purposes, the aggregate gross unrealized gain for all securities for which there was an excess of value over tax cost and the aggregate gross unrealized loss for all securities for which there was an excess of tax cost over value, were as follows:
| | | | | | Tax | | | Tax | | | Net | |
| | | Tax | | | Unrealized | | | Unrealized | | | Unrealized | |
| Fund | | Cost | | | Gain | | | Loss | | | Gain (Loss) | |
| Managed Commodities Strategy Fund | | $ | 71,218,580 | | | $ | — | | | $ | (32,386,348 | ) | | $ | (32,386,348 | ) |
| Multi-Hedge Strategies Fund | | | 83,580,281 | | | | 6,397,239 | | | | (1,021,503 | ) | | | 5,375,736 | |
| Commodities Strategy Fund | | | 1,432,658 | | | | — | | | | (370,180 | ) | | | (370,180 | ) |
| 9. | Securities Transactions |
For the period ended June 30, 2013, the cost of purchases and proceeds from sales of investment securities, excluding government securities and short-term investments, were as follows:
| Fund | | Purchases | | | Sales | |
| Managed Commodities Strategy Fund | | $ | 20,004,740 | | | $ | 5,842,296 | |
| Multi-Hedge Strategies Fund | | | 44,221,201 | | | | 43,610,488 | |
| Commodities Strategy Fund | | | — | | | | — | |
10. Line of Credit
The Trust, along with other affiliated trusts, secured an uncommitted, $75,000,000 line of credit from U.S. Bank, N.A., which expires June 15, 2014. This line of credit is reserved for emergency or temporary purposes. Borrowings, if any, under this arrangement bear interest equal to the Prime Rate, minus 2%, which shall be paid monthly, averaging 1.25% for the period ended June 30, 2013. The Funds did not have any borrowings under this agreement at June 30, 2013, and did not participate in borrowing during the period.
11. Portfolio Securities Loaned
The Funds may lend their securities to approved brokers to earn additional income. Security lending income shown on the statement of operations is shown net of rebates paid to the borrowers and earnings on cash collateral investments shared with the lending agent. Within this arrangement, the Funds act as the lender, Credit Suisse acts as the lending agent, and other approved registered broker dealers act as the borrowers. The Funds receive cash collateral, valued at 102% of the value of the securities on loan. Under the terms of the Funds’ securities lending agreement with Credit Suisse, cash collateral is invested in one or more joint repurchase agreements collateralized by obligations of the U.S. Treasury or Government Agencies and cash. The Funds bear the risk of loss on cash collateral investments. Collateral is maintained over the life of the loan in an amount not less than the value of loaned securities, as determined at the close of fund business each day; any additional collateral required due to changes in security values is delivered to the Funds the next business day. Although the collateral mitigates the risk, the Funds could experience a delay in recovering its securities and a possible loss of income or value if the borrower fails to return the securities. The Funds have the right under the securities lending agreement to recover the securities from the borrower on demand.
At June 30, 2013, the Funds participated in securities lending as follows:
| | | | | | Cash | |
| | | Value of | | | Collateral | |
| Fund | | Securities Loaned | | | Received | |
| Multi-Hedge Strategies Fund | | $ | 103,387 | | | $ | 110,298 | |
The following represents a breakdown of the collateral for the joint repurchase agreements at June 30, 2013:
| Counterparty and Terms of Agreement | | Face Value | | | Repurchase Price | | | Collateral | | Par Value | | | Fair Value | |
| HSBC Securities, Inc. | | | | | | | | | | Federal Home Loan Bank | | | | | | | | |
| 0.11% | | | | | | | | | | 0.00% | | | | | | | | |
| Due 07/01/13 | | $ | 53,372,568 | | | $ | 53,373,221 | | | 09/06/13 | | $ | 21,437,136 | | | $ | 21,434,991 | |
| | | | | | | | | | | Federal Home Loan Bank | | | | | | | | |
| | | | | | | | | | | 0.00% | | | | | | | | |
| | | | | | | | | | | 11/15/13 | | | 33,019,728 | | | | 33,009,492 | |
| RBS Securities, Inc. | | | | | | | | | | Federal Home Loan Bank | | | | | | | | |
| 0.10% | | | | | | | | | | 3.18% | | | | | | | | |
| Due 07/01/13 | | | 6,242,589 | | | | 6,242,659 | | | 11/26/32 | | | 6,905,520 | | | | 6,370,458 | |
| 44 | THE GUGGENHEIM FUNDS SEMI-ANNUAL REPORT |
| NOTES TO CONSOLIDATED FINANCIAL STATEMENTS (Unaudited) (continued) |
12. Legal Proceedings
Tribune Company
Rydex Series Funds has been named as a defendant in the case entitled Marc S. Kirscher, as Litigation Trustee for the Tribune Litigation Trust v. FitzSimons, No. 12-2652 (S.D.N.Y.) (formerly Official Committee of Unsecured Creditors of Tribune Co. v. FitzSimons, Adv. Pro. No. 10-54010 (Bankr. D. Del.)) (the “FitzSimons” Action), as a result of the ownership of shares in the Tribune Company (“Tribune”) in 2007 by certain series of the Rydex Series Funds when Tribune effected a leveraged buyout transaction (“LBO”) by which Tribune converted to a privately-held company. The plaintiff has alleged that, in connection with the LBO, insiders and shareholders were paid for their Tribune stock using financing that the insiders knew would, and ultimately did, leave the Tribune insolvent. The plaintiff has asserted claims against certain insiders, shareholders, professional advisers, and others involved in the LBO, and is attempting to obtain from these individuals and entities the proceeds paid out in connection with the LBO.
Rydex Series Funds also has been named as a defendant in one or more of a group of lawsuits filed by a group of Tribune creditors that allege state law constructive fraudulent conveyance claims against former Tribune shareholders (the “SLCFC actions”).
The FitzSimons action and the SLCFC actions have been consolidated with the majority of the other Tribune LBO-related lawsuits in a multidistrict litigation proceeding captioned In re Tribune Company Fraudulent Conveyance Litig., No. 11-md-2696 (S.D.N.Y.) (the “MDL Proceeding”). On November 6, 2012, the defendants moved to dismiss the SLCFC actions. On December 21, 2012, the plaintiffs filed a memorandum in opposition to the motion to dismiss. On February 4, 2013, the defendants filed a reply in support of the motion to dismiss. The Court has not yet issued a decision on the motion.
None of these lawsuits allege any wrongdoing on the part of Rydex Series Funds. The following series of Rydex Series Funds held shares of Tribune and tendered these shares as part of Tribune’s LBO: Nova Fund, S&P 500® Pure Value Fund, Multi-Cap Core Equity Fund, S&P 500® Fund, Multi-Hedge Strategies Fund and Hedged Equity Fund (the “Funds”). The value of the proceeds received by the foregoing Funds was $28,220, $109,242, $9,860, $3,400, $1,181,160, and $10,880, respectively. At this stage of the proceedings, Rydex Series Funds is not able to make a reliable predication as to the outcome of these lawsuits or the effect, if any, on a Fund’s net asset value.
Lyondell Chemical Company
In December 2011, Rydex Series Funds was named as a defendant in Weisfelner, as Trustee of the LB Creditor Trust, v. Fund 1 (In re Lyondell Chemical Co.), Adv. Pro. No. 10-4609 (Bankr. S.D.N.Y.).
Similar to the claims made in the Tribune matter, the Weisfelner complaint seeks to have set aside and recovered as fraudulent transfers from former Lyondell Chemical Company (“Lyondell”) shareholders the consideration paid to them pursuant to the cash out merger of Lyondell shareholders in connection with the combination of Lyondell and Basell AF in 2007. Lyondell filed for bankruptcy in 2008.
A motion to dismiss is currently pending before the Bankruptcy Court.
This lawsuit does not allege any wrongdoing on the part of Rydex Series Funds. The following series of Rydex Series Funds received cash proceeds from the cash out merger in the following amounts: Basic Materials Fund - $1,725,168; U.S. Long Short Momentum Fund - $2,193,600; Global 130/30 Strategy Fund - $37,920; Hedged Equity Fund - $1,440; and Multi-Hedge Strategies Fund - $1,116,480. At this stage of the proceedings, Rydex Series Funds is not able to make a reliable predication as to the outcome of these lawsuits or the effect, if any, on a Fund’s net asset value.
| THE GUGGENHEIM FUNDS SEMI-ANNUAL REPORT | 45 |
| NOTES TO CONSOLIDATED FINANCIAL STATEMENTS (Unaudited) (concluded) |
13. Offsetting
In the normal course of business, the Funds may have entered in transactions subject to enforceable master netting arrangements or other similar arrangements. Generally, the right to offset in those agreements allows the funds to counteract the exposure to a specific counterparty with collateral received or delivered to that counterparty based on the terms of the arrangements. These arrangements provide for the right to liquidate upon the occurrence of an event of default, credit event upon merger or additional termination event.
The following tables present derivative financial instruments and secured financing transactions that are subject to enforceable netting arrangements and offset in the Statements of Assets and Liabilities in conformity with U.S. GAAP.
| | | | | | | | | | | | | | Gross Amounts Not Offset | | | | |
| | | | | | | | | | | | | | in the Statement of Assets | | | | |
| | | | | | | | | | | | | | and Liabilities | | | | |
| | | | | | | | | | | Net Amount of Assets | | | | | | | | | | |
| | | | | | | | Gross Amounts Offset | | | Presented on the | | | | | | Cash | | | | |
| | | | | Gross Amounts of | | | in the Statement of | | | Statement of Assets | | | Financial | | | Collateral | | | Net | |
| Fund | | Instrument1 | | Recognized Assets | | | Assets and Liabilities | | | and Liabilities | | | Instrument | | | Received2 | | | Amount | |
| Managed Commodities | | | | | | | | | | | | | | | �� | | | | | | | | | | | |
| Strategy Fund | | Futures Commodity Contracts | | $ | 73,153 | | | $ | — | | | $ | 73,153 | | | $ | — | | | $ | — | | | $ | 73,153 | |
| | | Options Purchased Equity Contracts | | | 2,006,100 | | | | — | | | | 2,006,100 | | | | — | | | | — | | | | 2,006,100 | |
| | | Repurchase agreements | | | 1,628,230 | | | | — | | | | 1,628,230 | | | | — | | | | 1,628,230 | | | | — | |
| Total | | | | | 3,707,483 | | | | — | | | | 3,707,483 | | | | — | | | | 1,628,230 | | | | 2,079,253 | |
| | | | | | | | | | | | | | | | | | | | | | | | | | | |
| Multi-Hedge Strategies Fund | | Futures Commodity Contracts | | | 2,829,805 | | | | — | | | | 2,829,805 | | | | — | | | | — | | | | 2,829,805 | |
| | | Swaps Equity Contracts | | | 230,649 | | | | — | | | | 230,649 | | | | — | | | | — | | | | 230,649 | |
| | | Repurchase agreements | | | 9,959,048 | | | | — | | | | 9,959,048 | | | | — | | | | 9,959,048 | | | | — | |
| | | Securities lending | | | 103,387 | | | | — | | | | 103,387 | | | | — | | | | 103,387 | | | | — | |
| Total | | | | | 13,122,889 | | | | — | | | | 13,122,889 | | | | — | | | | 10,062,435 | | | | 3,060,454 | |
| | | | | | | | | | | | | | | | | | | | | | | | | | | |
| Commodities Strategy Fund | | Futures Commodity Contracts | | | 5,279 | | | | — | | | | 5,279 | | | | — | | | | — | | | | 5,279 | |
| | | Repurchase agreements | | | 1,062,478 | | | | — | | | | 1,062,478 | | | | — | | | | 1,062,478 | | | | — | |
| Total | | | | | 1,067,757 | | | | — | | | | 1,067,757 | | | | — | | | | 1,062,478 | | | | 5,279 | |
| | | | | | | | | | | | | | Gross Amounts Not Offset | | | | |
| | | | | | | | | | | | | | in the Statement of Assets | | | | |
| | | | | | | | | | | | | | and Liabilities | | | | |
| | | | | | | | | | | Net Amount of | | | | | | | | | | |
| | | | | | | | Gross Amounts Offset | | | Liabilities Presented | | | | | | Cash | | | | |
| | | | | Gross Amounts of | | | in the Statement of | | | on the Statement of | | | Financial | | | Collateral | | | Net | |
| Fund | | Instrument1 | | Recognized Liabilities | | | Assets and Liabilities | | | Assets and Liabilities | | | Instrument | | | Pledged2 | | | Amount | |
| Managed Commodities | | | | | | | | | | | | | | | | | | | | | | | | | | |
| Strategy Fund | | Futures Commodity Contracts | | $ | 2,552,624 | | | $ | — | | | $ | 2,552,624 | | | $ | — | | | $ | — | | | $ | 2,552,624 | |
| | | Options Written Equity Contracts | | | 569,050 | | | | — | | | | 569,050 | | | | — | | | | — | | | | 569,050 | |
| Total | | | | | 3,121,674 | | | | — | | | | 3,121,674 | | | | — | | | | — | | | | 3,121,674 | |
| | | | | | | | | | | | | | | | | | | | | | | | | | | |
| Multi-Hedge Strategies Fund | | Futures Commodity Contracts | | | 1,699,834 | | | | — | | | | 1,699,834 | | | | — | | | | — | | | | 1,699,834 | |
| | | Securities lending | | | 110,298 | | | | — | | | | 110,298 | | | | — | | | | 110,298 | | | | — | |
| Total | | | | | 1,810,132 | | | | — | | | | 1,810,132 | | | | — | | | | 110,298 | | | | 1,699,834 | |
| | | | | | | | | | | | | | | | | | | | | | | | | | | |
| Commodities Strategy Fund | | Futures Commodity Contracts | | | 115,662 | | | | — | | | | 115,662 | | | | — | | | | — | | | | 115,662 | |
| 1 | Refer to notes 5 and 11 for additional information regarding repurchase agreements and securities lending arrangements, respectively. |
| 2 | Excludes maintenance margin deposits held at the broker related to derivatives. These amounts are reflected as Segregated cash with broker on the Statement of Assets and Liabilities. |
| 46 | THE GUGGENHEIM FUNDS SEMI-ANNUAL REPORT |
| OTHER INFORMATION (Unaudited) |
Proxy Voting Information
A description of the policies and procedures that the Trust uses to determine how to vote proxies relating to securities held in the Funds’ portfolios is available, without charge and upon request, by calling 1.800.820.0888. This information is also available from the EDGAR database on the SEC’s website at http://www.sec.gov.
Information regarding how the Funds voted proxies relating to portfolio securities during the most recent 12-month period ended June 30 is available without charge, upon request, by calling 1.800.820.0888. This information is also available from the EDGAR database on the SEC’s website at http://www.sec.gov.
Quarterly Portfolio Schedules Information
The Trust files its complete schedule of portfolio holdings with the SEC for the first and third quarters of each fiscal year on Form N-Q; which are available on the SEC’s website at http://www.sec.gov. The Funds’ Forms N-Q may be reviewed and copied at the SEC’s Public Reference Room in Washington, DC, and that information on the operation of the Public Reference Room may be obtained by calling 1-800-SEC-0330. Copies of the portfolio holdings are also available to shareholders, without charge and upon request, by calling 1.800.820.0888.
Office Locations
The offices of Guggenheim Investments can be found in the following locations:
40 East 52nd Street
16th Floor
New York, NY 10022
(Headquarters)
Four Irvington Centre
805 King Farm Boulevard
Suite 600
Rockville, MD 20850
9401 Indian Creek Parkway
40 Corporate Woods
Suite 850
Overland Park, KS 66210
Distributor Name Change
Effective January 1, 2013, Rydex Distributors, LLC changed its name to Guggenheim Distributors, LLC. The name change marks another step in the business integration process following the acquisition of Rydex by Guggenheim announced last year. The name change did not result in any material change to the day-to-day management or operations of the funds.
Board Considerations in Approving the Investment Advisory Agreements
At an in-person meetings of the Rydex Series Funds’ (the “Trust”) Board of Trustees (the “Board”) held on May 16 and June 5, 2013 (collectively, the “Meetings”), called for the purpose of, among other things, consideration of, and voting on, the approval and continuation of the investment advisory agreement applicable to the series of the Trust (each a “Fund” and collectively, the “Funds”), the Board, including the Trustees who are not “interested persons,” as defined by the Investment Company Act of 1940, of the Trust (“Independent Trustees”), unanimously approved the continuation of the investment advisory agreement (the “Investment Advisory Agreement”) between the Trust and Security Investors, LLC (referred to herein as the “Adviser”) with respect to each of the Funds for an additional one-year period, based on the Board’s review of qualitative and quantitative information provided by the Adviser.
In reaching the conclusion to approve the continuation of the Investment Advisory Agreement, the Independent Trustees requested and obtained from the Adviser such information as the Independent Trustees deemed reasonably necessary to evaluate the Investment Advisory Agreement. The Independent Trustees carefully evaluated this information and were advised by independent legal counsel with respect to their deliberations. In addition, the Board also received a memorandum from Fund counsel regarding the responsibilities of the Board for the
| THE GUGGENHEIM FUNDS SEMI-ANNUAL REPORT | 47 |
| OTHER INFORMATION (Unaudited) (continued) |
approval of investment advisory agreements, and the Independent Trustees met in executive session outside the presence of Fund management, and participated in question and answer sessions with representatives of the Adviser.
In considering the continuation of the Investment Advisory Agreement, the Board determined that the agreement would enable shareholders of the Funds to continue to obtain high quality services at a cost that was appropriate, reasonable, and in the best interests of their shareholders. The Board, including the Independent Trustees, unanimously approved the continuation of the existing Investment Advisory Agreement. In reaching their decision, the Trustees carefully considered information that they had received throughout the year as part of their regular oversight of the Funds, including, in particular, information from the Adviser that the Board had received relating to Investment Advisory Agreement at the Meetings. The Trustees noted that, at the Meetings, they had obtained and reviewed a wide variety of information, including certain comparative information regarding performance of the Funds relative to performance of other comparable funds.
As a part of their consideration of the approval of the Investment Advisory Agreement at the Meetings, the Trustees, including the Independent Trustees, had evaluated a number of considerations, including among others: (a) the nature and quality of the Adviser’s investment advisory and other services; (b) the Adviser’s investment management personnel; (c) the Adviser’s operations and financial condition; (d) the Adviser’s brokerage practices (including any soft dollar arrangements) and investment strategies; (e) the level of the fees that the Adviser charges compared with the fees charged to comparable funds or accounts, giving special attention to the absence of breakpoints in these fees and the rationale provide by the Advisor as to why the addition of breakpoints was not currently appropriate; (f) each Fund’s overall fees and operating expenses compared with similar funds; (g) the level of the Adviser’s profitability from its Fund-related operations; (h) the Adviser’s compliance systems; (i) the Adviser’s policies and compliance procedures applicable to personal securities transactions; (j) the Adviser’s reputation, expertise and resources in the financial markets; and (k) Fund performance compared with similar funds. In its deliberations, the Board did not identify any single piece of information that was all-important or controlling. Based on the Board’s deliberations at the Meetings, the Board, including all of the Independent Trustees, unanimously: (a) concluded that terms of the Investment Advisory Agreement are fair and reasonable; (b) concluded that the Adviser’s fees were reasonable in light of the services that it provides to the Funds; and (c) agreed to approve and continue the Investment Advisory Agreement based upon the following considerations, among others:
| • | Nature, Extent and Quality of Services Provided by the Adviser. At the Meetings, the Board reviewed the scope of services to be provided by the Adviser under the Investment Advisory Agreement and noted that there would be no significant differences between the scope of services required to be provided by the Adviser for the past year and the scope of services required to be provided during the upcoming year. The Trustees also considered the Adviser’s representations to the Board that the Adviser would continue to provide investment and related services that were of materially the same quality and quantity as services provided to the Funds in the past, and that these services are appropriate in scope and extent in light of the Funds’ operations, the competitive landscape of the investment company business and investor needs. |
| • | Fund Expenses and Performance of the Funds and the Adviser. At the Meetings, the Board reviewed statistical information provided by the Adviser regarding the expense ratio components and performance of each Fund. The Adviser engaged FUSE Research Network LLC (“FUSE”), an independent, third party research provider, to prepare advisory contract renewal reports to help the Board fulfill its advisory contract renewal responsibilities. The objective of the reports is to present the subject Funds’ relative position regarding fees, expenses and total return performance, with peer group and universe comparisons. This statistical information related to the expense ratio components included actual advisory fees, waivers/reimbursements, and gross and net total expenses for each Fund in comparison to other funds determined by FUSE to comprise each Fund’s applicable peer group. The Board also considered the Adviser’s representation that it found the peer groups compiled by FUSE to be appropriate. The statistical information related to the performance of each Fund included three month and one, three, and five year performance for the Fund compared to its peers. |
| • | Costs of Services Provided to the Funds and Profits Realized by the Adviser and its Affiliates. At the Meetings, the Board had reviewed information about the profitability of the Funds to the Adviser based on the advisory fees payable under the current Investment Advisory Agreement for the last calendar year. At the Meetings, the Board also analyzed the Funds’ expenses, including the investment advisory fees paid to the Adviser, and reviewed reports comparing the expense ratios of the Funds to those of other comparable funds. The Board also reviewed information regarding the direct revenue received by the Advisor and ancillary revenue received by the Advisor and/ or its affiliates in connection with the services provided to the Funds by the Advisor and/or its affiliates. The Board also discussed the Advisor’s profit margin as reflected in the Adviser’s profitability analysis. |
| 48 | THE GUGGENHEIM FUNDS SEMI-ANNUAL REPORT |
| OTHER INFORMATION (Unaudited) (concluded) |
| • | Economies of Scale. In connection with its review of the Funds’ profitability analysis at the Meetings, the Board reviewed information regarding economies of scale or other efficiencies that may result from increases in the Funds’ asset levels. The Trustees noted that the fees would not change due to breakpoints under the current Investment Advisory Agreement, and that no additional economies of scale would be directly realized as a result of increases in the asset levels of the Funds. In light of the relatively small size of many of the Funds and the fact that the size of individual Funds in the complex increases and decreases significantly from time to time due to unlimited trading that is permitted among most of the Funds in the complex, the Board concluded that economies of scale were not likely to be directly realized as a result of increases in the asset levels of the individual Funds, and accordingly, fee breakpoints were not currently appropriate for the Funds. |
| • | Other Benefits to the Adviser and/or its Affiliates. In addition to evaluating the services provided by the Adviser, the Board had considered the nature, extent, quality and cost of the administrative, distribution, and shareholder services performed by the Adviser’s affiliates under separate agreements at the Meetings. The Board noted that the Adviser reports portfolio transactions on behalf of the Funds placed through an affiliate of the Funds or the Adviser at each quarterly Board meeting. |
On the basis of the information provided to it and its evaluation of that information, the Board, including the Independent Trustees, concluded that the terms of the Investment Advisory Agreement for the Funds were reasonable, and that approval of the Investment Advisory Agreement was in the best interests of the Funds.
| THE GUGGENHEIM FUNDS SEMI-ANNUAL REPORT | 49 |
| INFORMATION ON BOARD OF TRUSTEES AND OFFICERS (Unaudited) |
A Board of Trustees oversees the Trust, as well as other trusts of GI, in which its members have no stated term of service, and continue to serve after election until resignation. The Statement of Additional Information includes further information about Fund Trustees and Officers, and can be obtained without charge by calling 800.820.0888.
All Trustees and Officers may be reached c/o Guggenheim Investments, 805 King Farm Boulevard, Suite 600, Rockville, MD 20850.
| TRUSTEE AND OFFICER | | | | |
| | | | | |
| Name and | | Length of Service as Trustee | | Number of Funds |
| Year of Birth | | (Year Began) | | Overseen |
| Donald C. Cacciapaglia* | | Rydex Series Funds – 2012 | | 136 |
| (1951) | | Rydex Variable Trust – 2012 | | |
| | | Rydex Dynamic Funds – 2012 | | |
| | | Rydex ETF Trust – 2012 | | |
Principal Occupations During Past Five Years: Current: Security Investors, LLC: President and CEO from April 2012 to present; Guggenheim Investments: President and Chief Administrative Officer from February 2010 to present; Previous: Channel Capital Group, Inc.: Chairman and CEO from April 2002 to February 2010
Positions held within the Trust: Trustee from 2012 to present; President from 2012 to present
| INDEPENDENT TRUSTEES | | | | |
| | | | | |
| Name and | | Length of Service as Trustee | | Number of Funds |
| Year of Birth | | (Year Began) | | Overseen |
| Corey A. Colehour | | Rydex Series Funds – 1993 | | 136 |
| (1945) | | Rydex Variable Trust – 1998 | | |
| | | Rydex Dynamic Funds – 1999 | | |
| | | Rydex ETF Trust – 2003 | | |
Principal Occupations During Past Five Years: Current: Retired; Previous: President and Senior Vice President of Schield Management Company (registered investment adviser) from 2003 to 2006
Positions held within the Trust: Trustee from 1993 to present; Member of the Audit and Governance and Nominating Committees from 1995 to present
| J. Kenneth Dalton | | Rydex Series Funds – 1995 | | 136 |
| (1941) | | Rydex Variable Trust – 1998 | | |
| | | Rydex Dynamic Funds – 1999 | | |
| | | Rydex ETF Trust – 2003 | | |
Principal Occupations During Past Five Years: Current: Retired
Positions held within the Trust: Trustee from 1995 to present; Member and Chairman of the Audit Committee from 1997 to present; Member of the Governance and Nominating Committees from 1995 to present; and Member of the Risk Oversight Committee from 2010 to present
| John O. Demaret | | Rydex Series Funds – 1997 | | 136 |
| (1940) | | Rydex Variable Trust – 1998 | | |
| | | Rydex Dynamic Funds – 1999 | | |
| | | Rydex ETF Trust – 2003 | | |
Principal Occupations During Past Five Years: Current: Retired
Positions held within the Trust: Trustee from 1997 to present; Chairman of the Board from 2006 to present; Member of the Audit Committee from 1997 to present; and Member of the Risk Oversight Committee from 2010 to present
| 50 | THE GUGGENHEIM FUNDS SEMI-ANNUAL REPORT |
| INFORMATION ON BOARD OF TRUSTEES AND OFFICERS (Unaudited) (continued) |
| INDEPENDENT TRUSTEES – concluded | | |
| | | |
| Name and | | Length of Service as Trustee | | Number of Funds |
| Year of Birth | | (Year Began) | | Overseen |
| Werner E. Keller | | Rydex Series Funds – 2005 | | 136 |
| (1940) | | Rydex Variable Trust – 2005 | | |
| | | Rydex Dynamic Funds – 2005 | | |
| | | Rydex ETF Trust – 2005 | | |
Principal Occupations During Past Five Years: Current: Founder and President of Keller Partners, LLC (investment research firm) from 2005 to present; Previous: Retired from 2001 to 2005
Positions held within the Trust: Vice Chairman of the Board of Trustees from 2010 to present; Trustee and Member of the Audit and Governance and Nominating Committees from 2005 to present; and Chairman and Member of the Risk Oversight Committee from 2010 to present
| Thomas F. Lydon, Jr. | | Rydex Series Funds – 2005 | | 136 |
| (1960) | | Rydex Variable Trust – 2005 | | |
| | | Rydex Dynamic Funds – 2005 | | |
| | | Rydex ETF Trust – 2005 | | |
Principal Occupations During Past Five Years: Current: President of Global Trends Investments (registered investment adviser) from 1996 to present
Positions held within the Trust: Trustee and Member of the Audit and Governance and Nominating Committees from 2005 to present
| Patrick T. McCarville | | Rydex Series Funds – 1997 | | 136 |
| (1942) | | Rydex Variable Trust – 1998 | | |
| | | Rydex Dynamic Funds – 1999 | | |
| | | Rydex ETF Trust – 2003 | | |
Principal Occupations During Past Five Years: Current: Retired; Previous: Chief Executive Officer of Par Industries, Inc., d/b/a Par Leasing from 1977 to 2010
Positions held within the Trust: Trustee from 1997 to present; Member of the Audit Committee from 1997 to present; and Chairman of the Governance and Nominating Committees from 1997 to present
| Roger Somers | | Rydex Series Funds – 1993 | | 136 |
| (1944) | | Rydex Variable Trust – 1998 | | |
| | | Rydex Dynamic Funds – 1999 | | |
| | | Rydex ETF Trust – 2003 | | |
Principal Occupations During Past Five Years: Current: Founder and Chief Executive Officer of Arrow Limousine from 1965 to present
Positions held within the Trust: Trustee from 1993 to present; Member of the Audit and Governance and Nominating Committees from 1995 to present
EXECUTIVE OFFICERS
| Name, Position and | | | Principal Occupations | |
| Year of Birth | | | During Past Five Years | |
Michael P. Byrum* Vice President (1970) | | Current: President, Security Benefit Asset Management Holdings, LLC; Senior Vice President, Security Investors, LLC; President & Chief Investment Officer, Rydex Holdings, LLC; Director & Chairman of the Board, Advisor Research Center, Inc.; and Manager, Rydex Specialized Products, LLC |
| | | |
| | | Previous: Guggenheim Distributors, LLC (f/k/a Rydex Distributors, LLC), Vice President (2009); Rydex Fund Services, LLC, Director (2009–2010), Secretary (2002–2010), Executive Vice President (2002–2006); Rydex Advisors, LLC (f/k/a PADCO Advisors, Inc.), Director (2008–2010), Chief Investment Officer (2006–2010), President (2004–2010), Secretary (2002–2010); Rydex Advisors II, LLC (f/k/a PADCO Advisors II, Inc.), Director (2008–2010), Chief Investment Officer (2006–2010), President (2004–2010), Secretary (2002–2010); Rydex Capital Partners, LLC, President & Secretary (2003–2007); Rydex Capital Partners II, LLC, (2003–2007); Rydex Holdings, LLC (f/k/a Rydex Holdings, Inc.), Secretary (2005–2008), Executive Vice President (2005–2006); Advisor Research Center, Inc., Secretary (2006–2009), Executive Vice President (2006); and Rydex Specialized Products, LLC, Secretary (2005–2008) |
| THE GUGGENHEIM FUNDS SEMI-ANNUAL REPORT | 51 |
| INFORMATION ON BOARD OF TRUSTEES AND OFFICERS (Unaudited) (concluded) |
EXECUTIVE OFFICERS – concluded
| Name, Position and | | | Principal Occupations | |
| Year of Birth | | | During Past Five Years | |
Nikolaos Bonos* Vice President and Treasurer (1963) | | Current: Senior Vice President, Security Investors, LLC; Chief Executive Officer & Manager, Rydex Specialized Products, LLC; Chief Executive Officer & President, Rydex Fund Services, LLC; Vice President, Rydex Holdings, LLC; Treasurer, SBL Fund; Security Equity Fund; Security Income Fund; Security Large Cap Value Fund & Security Mid Cap Growth Fund; and Vice President, Security Benefit Asset Management Holdings, LLC |
| | | |
| | | Previous: Security Global Investors, LLC, Senior Vice President (2010–2011); Rydex Advisors, LLC (f/k/a PADCO Advisors, Inc.) Senior Vice President (2006–2011); Rydex Fund Services, LLC (f/k/a Rydex Fund Services, Inc.), Director (2009) & Senior Vice President (2003–2006); and Rydex Specialized Products, LLC, Chief Financial Officer (2005–2009) |
| | | |
Elisabeth Miller* Chief Compliance Officer (1968) | | Current: Chief Compliance Officer, Rydex Series Funds, Rydex Dynamic Funds, Rydex Variable Trust, Rydex ETF Trust, Security Equity Fund, Security Income Fund, Security Large Cap Value Fund, Security Mid Cap Growth Fund, SBL Fund, Security Investors, LLC, and Guggenheim Distributors, LLC |
| | | |
| | | Previous: Senior Manager, Security Investors, LLC and Guggenheim Distributors, LLC (2004–2009) |
| | | |
Amy J. Lee*
Vice President and
Secretary (1961) | | Current: Managing Director, Guggenheim Investments; Senior Vice President & Secretary, Security Investors, LLC; Secretary & Vice President, Rydex ETF Trust, Rydex Dynamic Funds, Rydex Variable Trust, SBL Fund, Security Equity Fund, Security Income Fund, Security Large Cap Value Fund and Security Mid Cap Growth Fund; Vice President & Secretary, Rydex Holdings, LLC; Secretary, Advisor Research Center, Inc., Guggenheim Specialized Products, LLC, Guggenheim Distributors, LLC and Rydex Fund Services, LLC |
| | | |
| | | Previous: Vice President, Associate General Counsel & Assistant Secretary, Security Benefit Life Insurance Company and Security Benefit Corporation (1987–2012); Security Global Investors, LLC, Senior Vice President & Secretary (2007–2011); Rydex Advisors, LLC (f/k/a/ PADCO Advisors, Inc.) & Rydex Advisors II, LLC (f/k/a PADCO Advisors II, Inc.), Senior Vice President & Secretary (2010–2011) |
| | | |
Joseph M. Arruda*
Assistant Treasurer (1966) | | Current: Assistant Treasurer, SBL Fund; Security Equity Fund; Security Income Fund; Security Large Cap Value Fund & Security Mid Cap Growth Fund; Vice President, Security Investors, LLC; and Chief Financial Officer & Manager, Rydex Specialized Products, LLC |
| | | |
| | | Previous: Security Global Investors, LLC, Vice President (2010–2011); and Rydex Advisors, LLC (f/k/a PADCO Advisors, Inc.) & Rydex Advisors II, LLC (f/k/a PADCO Advisors II, Inc.), Vice President (2004–2011) |
| * | Officers of the Funds are deemed to be “interested persons” of the Trust, within the meaning of Section 2(a)(19) of the 1940 Act, inasmuch as this person is affiliated with Guggenheim Investments. |
| 52 | THE GUGGENHEIM FUNDS SEMI-ANNUAL REPORT |
| GUGGENHEIM INVESTMENTS PRIVACY POLICIES |
Rydex Funds, Guggenheim Funds, Rydex Investments, Guggenheim Distributors, LLC, Security Investors, LLC, Security Distributors, Inc. and Rydex Advisory Services (Collectively “Guggenheim Investments”).
Our Commitment to You
When you become a Guggenheim Investments investor, you entrust us with not only your hard-earned money but also with personal and financial information about you. We recognize that your relationship with us is based on trust and that you expect us to act responsibly and in your best interests. Because we have access to this private information about you, we hold ourselves to the highest standards in its safekeeping and use. This means, most importantly, that we do not sell client information to anyone—whether it is your personal information or if you are a current or former Guggenheim Investments client.
The Information We Collect About You
In the course of doing business with shareholders and investors, we collect nonpublic personal information about you. You typically provide personal information when you complete a Guggenheim Investments account application or when you request a transaction that involves Rydex and Guggenheim Investments funds or one of the Guggenheim Investments affiliated companies. “Nonpublic personal information” is personally identifiable private information about you. For example, it includes information regarding your name and address, Social Security or taxpayer identification number, assets, income, account balance, bank account information and investment activity (e.g., purchase and redemption history).
How We Handle Your Personal Information
As emphasized above, we do not sell information about current or former clients or their accounts to third parties. Nor do we share such information, except when necessary to complete transactions at your request or to make you aware of related investment products and services that we offer. Additional details about how we handle your personal information are provided below. To complete certain transactions or account changes that you direct, it may be necessary to provide identifying information to companies, individuals or groups that are not affiliated with Guggenheim Investments. For example, if you ask to transfer assets from another financial institution to Guggenheim Investments, we will need to provide certain information about you to that company to complete the transaction. To alert you to other Guggenheim Investments investment products and services, we may share your information within the Guggenheim Investments family of affiliated companies. This would include, for example, sharing your information within Guggenheim Investments so we can make you aware of new Rydex and Guggenheim Investments funds or the services offered through another Guggenheim Investments affiliated company. In certain instances, we may contract with nonaffiliated companies to perform services for us. Where necessary, we will disclose information we have about you to these third parties. In all such cases, we provide the third party with only the information necessary to carry out its assigned responsibilities and only for that purpose. And we require these third parties to treat your private information with the same high degree of confidentiality that we do. In certain instances, we may share information with other financial institutions regarding individuals and entities in response to the U.S.A. Patriot Act. Finally, we will release information about you if you direct us to do so, if we are compelled by law to do so or in other circumstances permitted by law.
Opt Out Provisions
We do not sell your personal information to anyone. The law allows you to “opt out” of only certain kinds of information sharing with third parties. The firm does not share personal information about you with any third parties that triggers this opt-out right. This means YOU ARE ALREADY OPTED OUT.
How We Protect Privacy Online
Our concern for the privacy of our shareholders also extends to those who use our web site, guggenheiminvestments.com. Our web site uses some of the most secure forms of online communication available, including encryption technology, Secure Socket Layer (SSL) protocol, firewalls and user names and passwords. These technologies provide a high level of security and privacy when you access your account information or initiate online transactions. The Guggenheim Investments web site offers customized features that require our use of “http cookies”—tiny pieces of information that we ask your browser to store. However, we make very limited use of these cookies. We only use cookies for session management and security features on the Guggenheim Investments web site. We do not use them to pull data from your hard drive, to learn your email address, or to view data in cookies created by other web sites. We will not share the information in our cookies or give others access to it. See the legal information area on our web site for more details about web site security and privacy features.
| THE GUGGENHEIM FUNDS SEMI-ANNUAL REPORT | 53 |
| GUGGENHEIM INVESTMENTS PRIVACY POLICIES (concluded) |
How We Safeguard Your Personal Information
��
We restrict access to nonpublic personal information about shareholders to our employees and in some cases to third parties (for example, the service providers described above) as permitted by law. We maintain strict physical, electronic and procedural safeguards that comply with federal standards to guard your nonpublic personal information.
We’ll Keep You Informed
As required by federal law, we will notify shareholders of our privacy policy annually. We reserve the right to modify this policy at any time, but rest assured that if we do change it, we will tell you promptly. You will also be able to access our privacy policy from our web site at guggenheiminvestments.com. Should you have any questions regarding our privacy policy, contact us at 800.820.0888 or 301.296.5100.
| 54 | THE GUGGENHEIM FUNDS SEMI-ANNUAL REPORT |
This page intentionally left blank.
This page intentionally left blank.
This page intentionally left blank.
This page intentionally left blank.
This page intentionally left blank.
This page intentionally left blank.
This page intentionally left blank.
Item 2. Code of Ethics.
Not applicable at this time.
Item 3. Audit Committee Financial Expert.
Not applicable at this time.
Item 4. Principal Accountant Fees and Services.
Not applicable at this time.
Item 5. Audit Committee of Listed Registrants.
Not applicable.
Item 6. Investments.
Schedule of Investments is included as part of the report to shareholders filed under Item 1 of this form.
Item 7. Disclosure of Proxy Voting Policies and Procedures for Closed-End Management Investment Companies.
Not applicable.
Item 8. Portfolio Managers of Closed-End Management Investment Companies.
Not applicable.
Item 9. Purchases of Equity Securities by Closed-End Management Investment Company and Affiliated Purchasers.
Not applicable.
Item 10. Submission of Matters to a Vote of Security Holders.
Not applicable.
Item 11. Controls and Procedures.
(a) The registrant’s President (principal executive officer) and Treasurer (principal financial officer) have evaluated the registrant’s disclosure controls and procedures within 90 days of this filing and have concluded that the registrant’s disclosure controls and procedures were effective as of that date in ensuring that information required to be disclosed by the registrant in this Form N-CSR was recorded, processed, summarized, and reported timely.
(b) The registrant’s principal executive officer and principal financial officer are aware of no change in the registrant’s internal control over financial reporting that occurred during the registrant’s second fiscal quarter covered by this report that has materially affected, or is reasonably likely to materially affect, the registrant’s internal control over financial reporting.
Item 12. Exhibits.
(a)(2) Separate certifications by the President (principal executive officer) and Treasurer (principal financial officer) of the registrant as required by Rule 30a-2(a) under the Act (17 CFR 270.30a-2(a)) are attached.
(b) Separate certifications by the registrant’s President (principal executive officer) and Treasurer (principal financial officer) as required by Rule 30a-2(b) under the Act (17 CFR 270.30a-2(b)) are attached.
SIGNATURES
Pursuant to the requirements of the Securities Exchange Act of 1934 and the Investment Company Act of 1940, the registrant has duly caused this report to be signed on its behalf by the undersigned, thereunto duly authorized.
(Registrant) Rydex Series Funds
By (Signature and Title)* /s/ Donald C. Cacciapaglia
Donald C. Cacciapaglia, President
Date September 06, 2013
Pursuant to the requirements of the Securities Exchange Act of 1934 and the Investment Company Act of 1940, this report has been signed below by the following persons on behalf of the registrant and in the capacities and on the dates indicated.
By (Signature and Title)* /s/ Donald C. Cacciapaglia
Donald C. Cacciapaglia, President
Date September 06, 2013
By (Signature and Title)* /s/ Nikolaos Bonos
Nikolaos Bonos, Vice President and Treasurer
Date September 06, 2013
* Print the name and title of each signing officer under his or her signature.