UNITED STATES
SECURITIES AND EXCHANGE COMMISSION
Washington, D.C. 20549
FORM N-CSR
CERTIFIED SHAREHOLDER REPORT OF REGISTERED MANAGEMENT INVESTMENT COMPANIES
| Investment Company Act file number | 811- 07584 |
Rydex Series Funds
(Exact name of registrant as specified in charter)
805 King Farm Boulevard, Suite 600
Rockville, Maryland 20850
(Address of principal executive offices) (Zip code)
Donald C. Cacciapaglia, President
Rydex Series Funds
805 King Farm Boulevard, Suite 600
Rockville, Maryland 20850
(Name and address of agent for service)
Registrant's telephone number, including area code: 1-301-296-5100
Date of fiscal year end: December 31
Date of reporting period: December 31, 2012
Form N-CSR is to be used by management investment companies to file reports with the Commission not later than 10 days after the transmission to stockholders of any report that is required to be transmitted to stockholders under Rule 30e-1 under the Investment Company Act of 1940 (17 CFR 270.30e-1). The Commission may use the information provided on Form N-CSR in its regulatory, disclosure review, inspection, and policymaking roles.
A registrant is required to disclose the information specified by Form N-CSR, and the Commission will make this information public. A registrant is not required to respond to the collection of information contained in Form N-CSR unless the Form displays a currently valid Office of Management and Budget ("OMB") control number. Please direct comments concerning the accuracy of the information collection burden estimate and any suggestions for reducing the burden to Secretary, Securities and Exchange Commission, 450 Fifth Street, NW, Washington, DC 20549-0609. The OMB has reviewed this collection of information under the clearance requirements of 44 U.S.C. § 3507.
Item 1. Reports to Stockholders.
ALTERNATIVES FUND
MANAGED FUTURES STRATEGY FUND
GO GREEN!
ELIMINATE MAILBOX CLUTTER
Go paperless with Guggenheim Investments eDelivery—a service giving you full online access to account information and documents. Save time, cut down on mailbox clutter and be a friend to the environment with eDelivery.
With Guggenheim Investments eDelivery you can:
| • | View online confirmations and statements at your convenience. |
| • | Receive email notifications when your most recent confirmations, statements and other account documents are available for review. |
| • | Access prospectuses, annual reports and semiannual reports online |

If you have questions about Guggenheim Investments eDelivery services, contact one of our Shareholder Service Representatives at 800.820.0888.

This report and the financial statements contained herein are submitted for the general information of our shareholders. The report is not authorized for distribution to prospective investors unless preceded or accompanied by an effective prospectus.
Distributed by Guggenheim Distributors, LLC.
| the GUGGENHEIM FUNDS annual report | 1 |
Dear Shareholder:
Security Investors, LLC (the “Investment Adviser”) is pleased to present the annual shareholder report for the Managed Futures Strategy Fund that is part of the Rydex Series Funds.
The Investment Adviser is a part of Guggenheim Investments, which represents the investment management businesses of Guggenheim Partners, LLC, a global, diversified financial services firm.
This report covers performance of the following Fund for the period ended December 31, 2012:
– Managed Futures Strategy Fund
Guggenheim Distributors, LLC, is the distributor of the Funds. Guggenheim Distributors, LLC is affiliated with Guggenheim Partners LLC and Security Investors, LLC.
We encourage you to read the Economic and Market Overview section of the report, which follows this letter, and then the Performance Report for each Fund.
We are committed to providing innovative investment solutions and appreciate the trust you place in us.
Sincerely,

Donald C. Cacciapaglia
President
January 31, 2013
Read each fund’s prospectus and summary prospectus (if available) carefully before investing. It contains the fund’s investment objectives, risks, charges, expenses and other information, which should be considered carefully before investing. Obtain a prospectus and summary prospectus (if available) at guggenheiminvestments.com or call 800.820.0888.
Alternative funds may not be suitable for all investors. A Fund’s use of derivatives, such as futures, options, structured notes and swap agreements, may expose the fund to additional risks that it would not be subject to if it invested directly in the securities or investments underlying those derivatives. The more a Fund invests in leveraged instruments, the more the leverage will magnify any gains or losses on those investments. A Fund’s use of short selling involves increased risk and costs. A Fund risks paying more for a security than it received from its sale. Theoretically, securities sold short have the risk of unlimited losses. A Fund’s exposure to the commodity markets may subject the fund to greater volatility as commodity-linked investments may be affected by changes in overall market movements, commodity index volatility, changes in interest rates or factors affecting a particular industry or commodity—such as droughts, floods, weather, embargos, tariffs and international economic, political and regulatory developments. A Fund’s fixed income investments will change in value in response to interest rate changes and other factors. A fund may invest in securities of foreign companies directly or indirectly through the use of other investment companies and financial instruments that are linked to the performance of foreign issuers. Foreign securities markets generally have less trading volume and less liquidity than U.S. markets, and prices in some foreign markets may fluctuate more than those of securities traded in U.S. markets. See the prospectus for more information on these and additional risks.
| 2 | the GUGGENHEIM FUNDS annual report |
| Economic and Market Overview | December 31, 2012 |
The U.S. economy is reaching “escape velocity,” powered by the monetary rocket fuel from central banks around the world. Almost every domestic economic indicator is now positive and the economic backdrop is stronger than it has been in the last seven years.
Markets have now begun focusing on the U.S. debt ceiling debate, following Congress’ New Year’s reprieve on the Fiscal Cliff. Despite the uncertainty created by political partisanship in Washington, the strength of recent U.S. economic data demonstrates the resilience of the current U.S. economic expansion, including improvements in industrial production, initial jobless claims, third quarter GDP and continued recovery in the housing market. Investors can expect a continuation of the themes that have dominated the environment since the recovery began: tighter credit spreads, low interest rates, improving employment, modest inflation, and sustained economic growth.
Although Europe remains in a recession, more importantly, the political process towards fiscal unity appears to be underway with the initial steps taken towards the creation of a banking union. This has, for the time being, eliminated the worst-case scenario – an unwinding of the European Union. As the structural outlook in Europe improves, albeit at a glacial pace, tail risk, the possibility that an unlikely event will occur and cause a very large loss, is significantly mitigated. In China, along with the transition in political leadership, there are positive signs that the country may also have passed the bottom in the economic cycle, which could also be good news for emerging markets.
For the 12-month period ended December 31, 2012, the Standard & Poor’s 500 (“S&P 500”) Index*, which is generally regarded as an indicator of the broad U.S. stock market, returned 16.00%. Foreign markets were even stronger: the Morgan Stanley Capital International (“MSCI”) Europe-Australasia-Far East (“EAFE”) Index*, which is composed of approximately 1,100 companies in 20 developed countries in Europe and the Pacific Basin, returned 17.32%. The return of the MSCI Emerging Markets Index*, which measures market performance in global emerging markets, was 21.93%.
In the bond market, higher quality issues underperformed lower-rated bonds, as investors embraced risk. The Barclays U.S. Aggregate Bond Index*, which is a proxy for the U.S. investment grade bond market, posted a 4.21% return for the period, while the Barclays U.S. High Yield Index* returned 15.81%. Reflecting the Fed’s continuing accommodative monetary policy, interest rates on short-term securities remained at their lowest levels in many years; the return of the Bank of America Merrill Lynch 3-Month U.S. Treasury Bill Index* was 0.11% for the 12-month period.
The opinions and forecasts expressed may not actually come to pass. This information is subject to change at any time, based on market and other conditions, and should not be construed as a recommendation of any specific security or strategy.
*Index Definitions:
The following indices are referenced throughout this report. Indices are unmanaged and not available for direct investment. Index performance does not reflect transaction costs, fees, or expenses.
Barclays U.S. Aggregate Bond Index is a broad-based benchmark that measures the investment grade, U.S. dollar denominated, fixed-rate taxable bond market, including U.S. Treasuries, government-related and corporate securities, MBS (agency fixed-rate and hybrid ARM pass-throughs), ABS, and CMBS.
Barclays U.S. Corporate High Yield Index measures the market of USD-denominated, non-investment grade, fixed-rate, taxable corporate bonds. Securities are classified as high yield if the middle rating of Moody’s, Fitch, and S&P is Ba1/BB+/BB+ or below.
Bank of America Merrill Lynch 3-Month U.S. Treasury Bill Index is an unmanaged market index of U.S. Treasury securities maturing in 90 days that assumes reinvestment of all income.
MSCI EAFE Index is a free float-adjusted market capitalization index that is designed to measure the equity market performance of developed markets, excluding the U.S. & Canada.
MSCI Emerging Markets Index is a free float-adjusted market capitalization weighted index that is designed to measure equity market performance in the global emerging markets.
S&P 500® Index is a capitalization-weighted index of 500 stocks designed to measure the performance of the broad economy, representing all major industries and is considered a representation of the U.S. stock market.
Standard & Poor’s Diversified Trends Indicator® (S&P DTI) is an investable long/short strategy that can benefit from trends (in either direction) in the global futures markets. It consists of 24 futures contracts, with a 50% weighting in financial futures and 50% weighting in commodities futures. S&P Indices also offers financials-only and commodities-only subsets of the S&P DTI, providing a flexible way to tailor exposure to these respective asset classes.
| the GUGGENHEIM FUNDS annual report | 3 |
| about shareholders’ fund expenses (Unaudited) |
All mutual funds have operating expenses and it is important for our shareholders to understand the impact of costs on their investments. Shareholders of a Fund incur two types of costs: (i) transaction costs, including sales charges (loads) on purchase payments, reinvested dividends, or other distributions; and exchange fees; and (ii) ongoing costs, including management fees, administrative services, and shareholder reports, among others. These ongoing costs, or operating expenses, are deducted from a fund’s gross income and reduce the investment return of the fund.
A fund’s expenses are expressed as a percentage of its average net assets, which is known as the expense ratio. The following examples are intended to help investors understand the ongoing costs (in dollars) of investing in a Fund and to compare these costs with the ongoing costs of investing in other mutual funds.
The examples are based on an investment of $1,000 made at the beginning of the period and held for the entire six-month period beginning June 30, 2012 and ending December 31, 2012.
The following tables illustrate a Fund’s costs in two ways:
Table 1. Based on actual Fund return. This section helps investors estimate the actual expenses paid over the period. The “Ending Account Value” shown is derived from the Fund’s actual return, and the fourth column shows the dollar amount that would have been paid by an investor who started with $1,000 in the Fund. Investors may use the information here, together with the amount invested, to estimate the expenses paid over the period. Simply divide the Fund’s account value by $1,000 (for example, an $8,600 account value divided by $1,000 = 8.6), then multiply the result by the number provided under the heading “Expenses Paid During Period.”
Table 2. Based on hypothetical 5% return. This section is intended to help investors compare a Fund’s cost with those of other mutual funds. The table provides information about hypothetical account values and hypothetical expenses based on the Fund’s actual expense ratio and an assumed rate of return of 5% per year before expenses, which is not the Fund’s actual return. The hypothetical account values and expenses may not be used to estimate the actual ending account balance or expenses paid during the period. The example is useful in making comparisons because the U.S. Securities and Exchange Commission (the “SEC”) requires all mutual funds to calculate expenses based on the 5% return. Investors can assess a Fund’s costs by comparing this hypothetical example with the hypothetical examples that appear in shareholder reports of other funds.
The calculations illustrated above assume no shares were bought or sold during the period. Actual costs may have been higher or lower, depending on the amount of investment and the timing of any purchases or redemptions.
Please note that the expenses shown in the table are meant to highlight your ongoing costs only and do not reflect any transactional costs, such as sales charges (loads) on purchase payments, and contingent deferred sales charges (“CDSC”) on redemptions, if any. Therefore, the second table is useful in comparing ongoing costs only, and will not help you determine the relative total costs of owning different funds. In addition, if these transactional costs were included, your costs would have been higher.
More information about a Fund’s expenses, including annual expense ratios for the past five years, can be found in the Financial Highlights section of this report. For additional information on operating expenses and other shareholder costs, please refer to the appropriate Fund prospectus.
| 4 | the GUGGENHEIM FUNDS annual report |
| about shareholders’ fund expenses (Unaudited) (concluded) |
| | | | | | | | | Beginning | | | Ending | | | Expenses | |
| | | Expense | | | Fund | | | Account Value | | | Account Value | | | Paid During | |
| | | Ratio1 | | | Return | | | June 30, 2012 | | | December 31, 2012 | | | Period2 | |
| Table 1. Based on actual Fund return3 | | | | | | | | | | | | | | | | | | | | |
| Managed Futures Strategy Fund | | | | | | | | | | | | | | | | | | | | |
| A-Class | | | 1.87 | % | | | (1.44 | %) | | | $1,000.00 | | | | $985.60 | | | | $9.33 | |
| C-Class | | | 2.62 | % | | | (1.84 | %) | | | 1,000.00 | | | | 981.60 | | | | 13.05 | |
| H-Class | | | 1.87 | % | | | (1.44 | %) | | | 1,000.00 | | | | 985.60 | | | | 9.33 | |
| Institutional Class | | | 1.62 | % | | | (1.34 | %) | | | 1,000.00 | | | | 986.60 | | | | 8.09 | |
| Y-Class | | | 1.57 | % | | | (1.29 | %) | | | 1,000.00 | | | | 987.10 | | | | 7.84 | |
| | | | | | | | | | | | | | | | | | | | | |
| Table 2. Based on hypothetical 5% return (before expenses) | | | | | | | | | | | | |
| Managed Futures Strategy Fund | | | | | | | | | | | | | | | | | | | | |
| A-Class | | | 1.87 | % | | | 5.00 | % | | | $1,000.00 | | | | $1,015.74 | | | | $9.48 | |
| C-Class | | | 2.62 | % | | | 5.00 | % | | | 1,000.00 | | | | 1,011.97 | | | | 13.25 | |
| H-Class | | | 1.87 | % | | | 5.00 | % | | | 1,000.00 | | | | 1,015.74 | | | | 9.48 | |
| Institutional Class | | | 1.62 | % | | | 5.00 | % | | | 1,000.00 | | | | 1,016.99 | | | | 8.21 | |
| Y-Class | | | 1.57 | % | | | 5.00 | % | | | 1,000.00 | | | | 1,017.24 | | | | 7.96 | |
| 2 | Expenses are equal to the Fund’s annualized expense ratio, net of any applicable fee waivers, multiplied by the average account value over the period, multiplied by 184/366 (to reflect the one-half year period). |
| 3 | Actual cumulative return at net asset value for the period June 30, 2012 to December 31, 2012. |
| the GUGGENHEIM FUNDS annual report | 5 |
| Performance Report and FUND PROFILE (Unaudited) | December 31, 2012 |
Managed Futures Strategy FUND
OBJECTIVE: Seeks to achieve positive absolute returns.
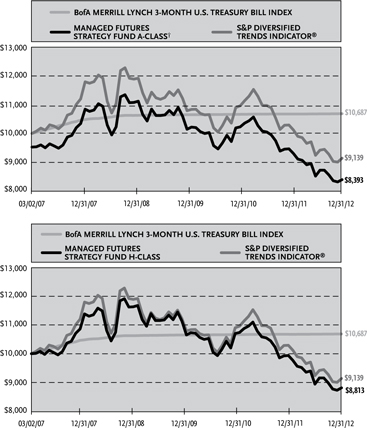
The Managed Futures Strategy Fund H-Class returned -11.32%, compared with a return of -11.21% for its benchmark comparison, the Standard & Poor’s Diversified Trends Indicator® (S&P DTI). The Fund also underperformed the 0.11% return of the Bank of America Merrill Lynch 3-Month U.S. Treasury Bill Index.
For 2012, the leading positive contributors to Fund performance were coffee, reformulated gasoline blendstock for oxygen blending (Gasoline RBOB) and heating oil. Copper, soybeans and gold contributed negatively to Fund performance. Most of the negative contribution for the year came from commodities.
Derivatives in the Fund are used to help provide desired exposure in the most efficient manner, as well as to provide liquidity.
In August 2012, the Fund’s Board of Trustees approved a change in investment strategy, which took effect October 29, 2012. The change involved investing 20% of the Fund’s assets in a proprietary managed futures strategy. The proprietary strategy offers more broadly based access to the futures markets, expanding the opportunity set to include both domestic and international traded futures and adding additional asset classes, such as equities and short-term interest rates.
The proprietary strategy detracted from the Fund’s performance for the two months of 2012 it was being implemented in the portfolio.
In November 2012, the Fund’s Board of Trustees approved a second change in investment strategy, effective January 29, 2013. That change involved investing the remaining 80% of the Fund’s assets in the proprietary managed futures strategy.
Performance displayed represents past performance which is no guarantee of future results.
Holdings Diversification (Market Exposure as % of Net Assets)

“Holdings Diversification (Market Exposure as % of Net Assets)” excludes any temporary cash investments.
| Inception Dates: | | | | |
| A-Class | | | March 2, 2007 | |
| C-Class | | | March 2, 2007 | |
| H-Class | | | March 2, 2007 | |
| Institutional Class | | | May 3, 2010 | |
| Y-Class | | | March 29, 2010 | |
The Fund invests principally in derivative investments such as futures contracts.
| 6 | the GUGGENHEIM FUNDS annual report |
| Performance Report and FUND PROFILE (Unaudited)(concluded) |
Cumulative Fund Performance*
Average Annual Returns*
Periods Ended 12/31/12
| | | | | | | | | Since | |
| | | | | | | | | Inception | |
| | | 1 Year | | | 5 Year | | | (03/02/07) | |
| A-Class Shares | | | -11.32 | % | | | -3.82 | % | | | -2.14 | % |
| A-Class Shares with sales charge† | | | -15.52 | % | | | -4.75 | % | | | -2.96 | % |
| C-Class Shares | | | -12.04 | % | | | -4.55 | % | | | -2.88 | % |
| C-Class Shares with CDSC‡ | | | -12.92 | % | | | -4.55 | % | | | -2.88 | % |
| H-Class Shares | | | -11.32 | % | | | -3.82 | % | | | -2.14 | % |
| S&P Diversified Trends Indicator | | | -11.21 | % | | | -3.65 | % | | | -1.53 | % |
| Bank of America Merrill Lynch 3-Month U.S. Treasury Bill Index | | | 0.11 | % | | | 0.52 | % | | | 1.14 | % |
| | | | | | Since | |
| | | | | | Inception | |
| | | 1 Year | | | (05/03/10) | |
| Institutional Class Shares | | | -11.14 | % | | | -6.51 | % |
| S&P Diversified Trends Indicator | | | -11.21 | % | | | -5.92 | % |
| Bank of America Merrill Lynch 3-Month U.S. Treasury Bill Index | | | 0.11 | % | | | 0.12 | % |
| | | | | | Since | |
| | | | | | Inception | |
| | | | | | (03/29/10) | |
| Y-Class Shares | | | -11.05 | % | | | -6.46 | % |
| S&P Diversified Trends Indicator | | | -11.21 | % | | | -5.89 | % |
| Bank of America Merrill Lynch 3-Month U.S. Treasury Bill Index | | | 0.11 | % | | | 0.12 | % |
| * | The performance data above represents past performance that is not predictive of future results. The investment return and principal value of an investment in the Fund will fluctuate so that an investor’s shares, when redeemed, may be worth more or less than their original cost. Returns are historical and include changes in principal and reinvested dividends and capital gains and do not reflect the effect of taxes. The S&P Diversified Trends Indicator and Bank of America Merrill Lynch 3-Month U.S. Treasury Bill Index are unmanaged indices and, unlike the Fund, have no management fees or operating expenses to reduce their reported returns. The graphs are based on A-Class shares and H-Class shares only; performance for C-Class shares, Institutional Class shares, and Y-Class shares will vary due to differences in fee structure. |
| | † | Fund returns are calculated using the maximum sales charge of 4.75%. |
| | ‡ | Fund returns include a CDSC of 1% if redeemed within 12 months of purchase. |
| the GUGGENHEIM FUNDS annual report | 7 |
| CONSOLIDATED SCHEDULE OF INVESTMENTS | December 31, 2012 |
| Managed Futures Strategy Fund | |
| | | Shares | | | Value | |
| | | | | | | |
| EXCHANGE TRADED FUNDS† - 8.1% | | | | | | | | |
| PIMCO Enhanced Short Maturity | | | | | | | | |
| Exchange-Traded Fund1 | | | 600,000 | | | $ | 60,888,000 | |
| Guggenheim Enhanced Short | | | | | | | | |
| Duration Bond ETF1,6 | | | 140,000 | | | | 7,007,000 | |
| Total Exchange Traded Funds | | | | | | | | |
| (Cost $67,930,214) | | | | | | | 67,895,000 | |
| | | Face | | | | | |
| | | amount | | | | | |
| FEDERAL AGENCY DISCOUNT NOTES†† - 41.4% | | | | | | | | |
| Farmer Mac2 | | | | | | | | |
| 0.21% due 03/28/13 | | $ | 50,000,000 | | | | 49,994,099 | |
| 0.22% due 05/31/13 | | | 50,000,000 | | | | 49,981,400 | |
| 0.21% due 04/23/13 | | | 40,000,000 | | | | 39,991,360 | |
| 0.18% due 01/23/13 | | | 25,000,000 | | | | 24,999,700 | |
| 0.19% due 03/06/13 | | | 25,000,000 | | | | 24,997,800 | |
| Total Farmer Mac | | | | | | | 189,964,359 | |
| Federal Home Loan Bank2 | | | | | | | | |
| 0.18% due 02/26/13 | | | 25,000,000 | | | | 24,998,475 | |
| 0.22% due 07/01/13 | | | 25,000,000 | | | | 24,985,000 | |
| 0.18% due 09/09/13 | | | 20,000,000 | | | | 19,980,580 | |
| Total Federal Home Loan Bank | | | | | | | 69,964,055 | |
| Freddie Mac3 | | | | | | | | |
| 0.18% due 03/15/13 | | | 25,000,000 | | | | 24,997,500 | |
| 0.18% due 05/21/13 | | | 25,000,000 | | | | 24,991,325 | |
| Total Freddie Mac | | | | | | | 49,988,825 | |
| Federal Farm Credit Bank2 | | | | | | | | |
| 0.20% due 03/28/13 | | | 25,000,000 | | | | 24,997,050 | |
| 0.19% due 01/28/13 | | | 15,000,000 | | | | 14,999,790 | |
| Total Federal Farm Credit Bank | | | | | | | 39,996,840 | |
| Total Federal Agency Discount Notes | | | | | | | | |
| (Cost $349,791,295) | | | | | | | 349,914,079 | |
| FEDERAL AGENCY NOTES†† - 37.5% | | | | | | | | |
| Federal Home Loan Bank2 | | | | | | | | |
| 0.20% due 04/30/13 | | | 50,000,000 | | | | 50,013,100 | |
| 0.13% due 03/01/13 | | | 50,000,000 | | | | 50,000,400 | |
| 0.22% due 05/02/13 | | | 25,000,000 | | | | 25,008,325 | |
| 0.22% due 07/23/13 | | | 25,000,000 | | | | 25,006,825 | |
| 0.22% due 04/09/13 | | | 25,000,000 | | | | 25,006,725 | |
| 0.18% due 02/28/13 | | | 25,000,000 | | | | 25,002,350 | |
| 0.19% due 02/15/13 | | | 21,500,000 | | | | 21,501,785 | |
| 0.17% due 01/17/13 | | | 18,625,000 | | | | 18,625,391 | |
| 0.18% due 01/10/13 | | | 15,700,000 | | | | 15,700,204 | |
| 0.38% due 01/29/13 | | | 10,000,000 | | | | 10,001,910 | |
| 0.19% due 12/13/13 | | | 10,000,000 | | | | 10,000,950 | |
| Total Federal Home Loan Bank | | | | | | | 275,867,965 | |
| Federal Farm Credit Bank2 | | | | | | | | |
| 0.18% due 01/02/13 | | | 25,000,000 | | | | 25,000,000 | |
| Fannie Mae3 | | | | | | | | |
| 0.75% due 02/26/13 | | | 15,000,000 | | | | 15,014,160 | |
| Total Federal Agency Notes | | | | | | | | |
| (Cost $315,826,325) | | | | | | | 315,882,125 | |
| REPURCHASE AGREEMENTS††,4 - 11.1% | | | | | | | | |
| HSBC Group | | | | | | | | |
| issued 12/31/12 at 0.12% | | | | | | | | |
| due 01/02/13 | | | 40,882,794 | | | | 40,882,794 | |
| Deutsche Bank | | | | | | | | |
| issued 12/31/12 at 0.11% | | | | | | | | |
| due 01/02/13 | | | 20,908,998 | | | | 20,908,998 | |
| Mizuho Financial Group, Inc. | | | | | | | | |
| issued 12/31/12 at 0.14% | | | | | | | | |
| due 01/02/13 | | | 17,785,984 | | | | 17,785,984 | |
| Credit Suisse Group | | | | | | | | |
| issued 12/31/12 at 0.12% | | | | | | | | |
| due 01/02/13 | | | 14,004,813 | | | | 14,004,813 | |
| Total Repurchase Agreements | | | | | | | | |
| (Cost $93,582,589) | | | | | | | 93,582,589 | |
| SECURITIES LENDING COLLATERAL††,5 - 0.2% | | | | | | | | |
| Repurchase Agreements | | | | | | | | |
| Merrill Lynch, Pierce, | | | | | | | | |
| Fenner & Smith, Inc. | | | | | | | | |
| issued 12/31/12 at 0.16% | | | | | | | | |
| due 01/02/13 | | | 932,003 | | | | 932,003 | |
| RBS Securities, Inc. | | | | | | | | |
| issued 12/31/12 at 0.20% | | | | | | | | |
| due 01/02/13 | | | 591,522 | | | | 591,522 | |
| Total Securities Lending Collateral | | | | | | | | |
| (Cost $1,523,525) | | | | | | | 1,523,525 | |
| Total Investments - 98.3% | | | | | | | | |
| (Cost $828,653,948) | | | | | | $ | 828,797,318 | |
| Other Assets & Liabilities, net - 1.7% | | | | | | | 14,526,610 | |
| Total Net Assets - 100.0% | | | | | | $ | 843,323,928 | |
| 8 | The Guggenheim Funds annual REPORT | See Notes to Financial Statements. |
| CONSOLIDATED SCHEDULE OF INVESTMENTS (continued) | December 31, 2012 |
| Managed Futures Strategy Fund | |
| | | | | | Unrealized | |
| | | Contracts | | | Gain (Loss) | |
| COMMODITY FUTURES CONTRACTS PURCHASED† | | | | | | | | |
| March 2013 WTI Crude | | | | | | | | |
| Futures Contracts | | | | | | | | |
| (Aggregate Value of | | | | | | | | |
| Contracts $50,330,280) | | | 546 | | | $ | 2,540,761 | |
| March 2013 Gasoline RBOB | | | | | | | | |
| Futures Contracts | | | | | | | | |
| (Aggregate Value of | | | | | | | | |
| Contracts $29,343,699) | | | 253 | | | | 1,303,175 | |
| March 2013 Heating Oil | | | | | | | | |
| Futures Contracts | | | | | | | | |
| (Aggregate Value of | | | | | | | | |
| Contracts $20,146,190) | | | 159 | | | | 473,453 | |
| February 2013 Live Cattle | | | | | | | | |
| Futures Contracts | | | | | | | | |
| (Aggregate Value of | | | | | | | | |
| Contracts $11,123,700) | | | 210 | | | | 300,996 | |
| February 2013 Lean Hogs | | | | | | | | |
| Futures Contracts | | | | | | | | |
| (Aggregate Value of | | | | | | | | |
| Contracts $13,889,520) | | | 404 | | | | 245,027 | |
| February 2013 Gold 100 oz. | | | | | | | | |
| Futures Contracts | | | | | | | | |
| (Aggregate Value of | | | | | | | | |
| Contracts $9,037,440) | | | 54 | | | | 135,918 | |
| March 2013 Silver | | | | | | | | |
| Futures Contracts | | | | | | | | |
| (Aggregate Value of | | | | | | | | |
| Contracts $759,125) | | | 5 | | | | 14,860 | |
| March 2013 Copper | | | | | | | | |
| Futures Contracts | | | | | | | | |
| (Aggregate Value of | | | | | | | | |
| Contracts $30,187,200) | | | 331 | | | | (5,232 | ) |
| March 2013 Natural Gas | | | | | | | | |
| Futures Contracts | | | | | | | | |
| (Aggregate Value of | | | | | | | | |
| Contracts $20,602,920) | | | 611 | | | | (332,091 | ) |
| (Total Aggregate Value of | | | �� | | | | | |
| Contracts $185,420,074) | | | | | | $ | 4,676,867 | |
| EQUITY FUTURES CONTRACTS PURCHASED† | | | | | | | | |
| March 2013 Nikkei 225 Index | | | | | | | | |
| Futures Contracts†† | | | | | | | | |
| (Aggregate Value of | | | | | | | | |
| Contracts $5,187,978) | | | 43 | | | $ | 422,520 | |
| March 2013 FTSE/JSE Top 40 Index | | | | | | | | |
| Futures Contracts†† | | | | | | | | |
| (Aggregate Value of | | | | | | | | |
| Contracts $7,560,901) | | | 179 | | | | 206,414 | |
| March 2013 SPI 200 Index | | | | | | | | |
| Futures Contracts†† | | | | | | | | |
| (Aggregate Value of | | | | | | | | |
| Contracts $7,464,420) | | | 61 | | | | 172,176 | |
| January 2013 Hang Seng Index | | | | | | | | |
| Futures Contracts†† | | | | | | | | |
| (Aggregate Value of | | | | | | | | |
| Contracts $5,636,851) | | | 38 | | | | 58,501 | |
| January 2013 CAC40 10 Euro Index | | | | | | | | |
| Futures Contracts†† | | | | | | | | |
| (Aggregate Value of | | | | | | | | |
| Contracts $2,450,670) | | | 50 | | | | 44,549 | |
| March 2013 Russell 2000 Index | | | | | | | | |
| Mini Futures Contracts | | | | | | | | |
| (Aggregate Value of | | | | | | | | |
| Contracts $2,539,200) | | | 30 | | | | 44,268 | |
| January 2013 Amsterdam Index | | | | | | | | |
| Futures Contracts†† | | | | | | | | |
| (Aggregate Value of | | | | | | | | |
| Contracts $2,583,825) | | | 28 | | | | 43,773 | |
| January 2013 H-Shares Index | | | | | | | | |
| Futures Contracts†† | | | | | | | | |
| (Aggregate Value of | | | | | | | | |
| Contracts $2,547,107) | | | 34 | | | | 38,870 | |
| March 2013 FTSE 100 Index | | | | | | | | |
| Futures Contracts†† | | | | | | | | |
| (Aggregate Value of | | | | | | | | |
| Contracts $2,518,064) | | | 26 | | | | 25,021 | |
| March 2013 DAX Index | | | | | | | | |
| Futures Contracts†† | | | | | | | | |
| (Aggregate Value of | | | | | | | | |
| Contracts $2,547,335) | | | 10 | | | | 21,436 | |
| March 2013 S&P MidCap 400 Index | | | | | | | | |
| Mini Futures Contracts | | | | | | | | |
| (Aggregate Value of | | | | | | | | |
| Contracts $2,543,750) | | | 25 | | | | 20,194 | |
| March 2013 Topix Index | | | | | | | | |
| Futures Contracts†† | | | | | | | | |
| (Aggregate Value of | | | | | | | | |
| Contracts $2,600,330) | | | 26 | | | | 17,864 | |
| January 2013 IBEX 35 Index | | | | | | | | |
| Futures Contracts†† | | | | | | | | |
| (Aggregate Value of | | | | | | | | |
| Contracts $976,265) | | | 9 | | | | 3,144 | |
| March 2013 S&P 500 Index | | | | | | | | |
| Mini Futures Contracts | | | | | | | | |
| (Aggregate Value of | | | | | | | | |
| Contracts $2,488,063) | | | 35 | | | | (5,161 | ) |
| March 2013 NASDAQ-100 Index | | | | | | | | |
| Mini Futures Contracts | | | | | | | | |
| (Aggregate Value of | | | | | | | | |
| Contracts $1,221,875) | | | 23 | | | | (7,088 | ) |
| March 2013 Dow Jones | | | | | | | | |
| Industrial Average Index | | | | | | | | |
| Mini Futures Contracts | | | | | | | | |
| (Aggregate Value of | | | | | | | | |
| Contracts $2,477,600) | | | 38 | | | | (26,459 | ) |
| (Total Aggregate Value of | | | | | | | | |
| Contracts $53,344,234) | | | | | | $ | 1,080,022 | |
| CURRENCY FUTURES CONTRACTS PURCHASED† | | | | | | | | |
| March 2013 Euro FX Currency | | | | | | | | |
| Futures Contracts | | | | | | | | |
| (Aggregate Value of | | | | | | | | |
| Contracts $88,955,213) | | | 539 | | | $ | 1,261,633 | |
| See Notes to Financial Statements. | the Guggenheim Funds annual REPORT | 9 |
| CONSOLIDATED SCHEDULE OF INVESTMENTS (continued) | December 31, 2012 |
| Managed Futures Strategy Fund | |
| | | | | | Unrealized | |
| | | Contracts | | | Gain (Loss) | |
| March 2013 British Pound | | | | | | | | |
| Futures Contracts | | | | | | | | |
| (Aggregate Value of | | | | | | | | |
| Contracts $52,897,781) | | | 521 | | | $ | 178,166 | |
| March 2013 Swiss Franc | | | | | | | | |
| Futures Contracts | | | | | | | | |
| (Aggregate Value of | | | | | | | | |
| Contracts $13,675,000) | | | 100 | | | | 91,656 | |
| March 2013 Canadian Dollar | | | | | | | | |
| Futures Contracts | | | | | | | | |
| (Aggregate Value of | | | | | | | | |
| Contracts $26,457,800) | | | 263 | | | | (185,628 | ) |
| March 2013 Australian Dollar | | | | | | | | |
| Futures Contracts | | | | | | | | |
| (Aggregate Value of | | | | | | | | |
| Contracts $46,413,130) | | | 449 | | | | (682,636 | ) |
| (Total Aggregate Value of | | | | | | | | |
| Contracts $228,398,924) | | | | | | $ | 663,191 | |
| INTEREST RATE FUTURES CONTRACTS PURCHASED† | | | | | | | | |
| June 2013 3 Month Euro Euribor | | | | | | | | |
| Futures Contracts†† | | | | | | | | |
| (Aggregate Value of | | | | | | | | |
| Contracts $103,462,559) | | | 308 | | | $ | 2,037,030 | |
| March 2013 Euro - Schatz | | | | | | | | |
| Futures Contracts†† | | | | | | | | |
| (Aggregate Value of | | | | | | | | |
| Contracts $60,576,235) | | | 410 | | | | 661,271 | |
| March 2013 Euro - Bund | | | | | | | | |
| Futures Contracts†† | | | | | | | | |
| (Aggregate Value of | | | | | | | | |
| Contracts $17,415,900) | | | 91 | | | | 75,067 | |
| March 2013 Euro - Bobl | | | | | | | | |
| Futures Contracts†† | | | | | | | | |
| (Aggregate Value of | | | | | | | | |
| Contracts $30,069,921) | | | 179 | | | | 69,811 | |
| June 2013 3 Month Eurodollar | | | | | | | | |
| Futures Contracts | | | | | | | | |
| (Aggregate Value of | | | | | | | | |
| Contracts $113,131,125) | | | 454 | | | | 6,217 | |
| June 2013 3 Month Sterling | | | | | | | | |
| Futures Contracts†† | | | | | | | | |
| (Aggregate Value of | | | | | | | | |
| Contracts $100,817,705) | | | 499 | | | | (1,050 | ) |
| March 2013 U.S. Treasury 2 Year Note | | | | | | | | |
| Futures Contracts | | | | | | | | |
| (Aggregate Value of | | | | | | | | |
| Contracts $67,885,125) | | | 308 | | | | (5,259 | ) |
| March 2013 U.S. Treasury 5 Year Note | | | | | | | | |
| Futures Contracts | | | | | | | | |
| (Aggregate Value of | | | | | | | | |
| Contracts $33,774,750) | | | 272 | | | | (119,394 | ) |
| March 2013 Long Gilt | | | | | | | | |
| Futures Contracts†† | | | | | | | | |
| (Aggregate Value of | | | | | | | | |
| Contracts $15,980,889) | | | 83 | | | | (137,605 | ) |
| March 2013 U.S. Treasury 30 Year Bond | | | | | | | | |
| Futures Contracts | | | | | | | | |
| (Aggregate Value of | | | | | | | | |
| Contracts $13,368,469) | | | 91 | | | | (282,241 | ) |
| March 2013 Japanese Government | | | | | | | | |
| 10 Year Bond | | | | | | | | |
| Futures Contracts†† | | | | | | | | |
| (Aggregate Value of | | | | | | | | |
| Contracts $54,507,349) | | | 33 | | | | (549,230 | ) |
| March 2013 U.S. Treasury 10 Year Note | | | | | | | | |
| Futures Contracts | | | | | | | | |
| (Aggregate Value of | | | | | | | | |
| Contracts $70,158,750) | | | 530 | | | | (673,000 | ) |
| March 2013 Australian Government 10 Year | | | | | | | | |
| Bond Futures Contracts†† | | | | | | | | |
| (Aggregate Value of | | | | | | | | |
| Contracts $32,143,031) | | | 258 | | | | (894,285 | ) |
| (Total Aggregate Value of | | | | | | | | |
| Contracts $713,291,808) | | | | | | $ | 187,332 | |
| COMMODITY FUTURES CONTRACTS SOLD SHORT† | | | | | | | | |
| March 2013 Soybean | | | | | | | | |
| Futures Contracts | | | | | | | | |
| (Aggregate Value of | | | | | | | | |
| Contracts $29,307,200) | | | 416 | | | $ | 2,250,442 | |
| March 2013 Coffee ‘C’ | | | | | | | | |
| Futures Contracts | | | | | | | | |
| (Aggregate Value of | | | | | | | | |
| Contracts $20,628,000) | | | 382 | | | | 1,881,355 | |
| March 2013 Wheat | | | | | | | | |
| Futures Contracts | | | | | | | | |
| (Aggregate Value of | | | | | | | | |
| Contracts $12,191,350) | | | 313 | | | | 1,418,915 | |
| March 2013 Corn | | | | | | | | |
| Futures Contracts | | | | | | | | |
| (Aggregate Value of | | | | | | | | |
| Contracts $20,782,575) | | | 594 | | | | 1,283,543 | |
| March 2013 Sugar #11 | | | | | | | | |
| Futures Contracts | | | | | | | | |
| (Aggregate Value of | | | | | | | | |
| Contracts $19,377,960) | | | 885 | | | | 838,091 | |
| February 2013 LME Primary Aluminum | | | | | | | | |
| Futures Contracts | | | | | | | | |
| (Aggregate Value of | | | | | | | | |
| Contracts $3,194,550) | | | 62 | | | | 93,046 | |
| February 2013 LME Nickel | | | | | | | | |
| Futures Contracts | | | | | | | | |
| (Aggregate Value of | | | | | | | | |
| Contracts $2,248,620) | | | 22 | | | | 90,547 | |
| March 2013 Cocoa | | | | | | | | |
| Futures Contracts | | | | | | | | |
| (Aggregate Value of | | | | | | | | |
| Contracts $2,477,520) | | | 111 | | | | (20,285 | ) |
| March 2013 Gas Oil | | | | | | | | |
| Futures Contracts | | | | | | | | |
| (Aggregate Value of | | | | | | | | |
| Contracts $2,621,500) | | | 28 | | | | (23,146 | ) |
| 10 | The Guggenheim Funds annual REPORT | See Notes to Financial Statements. |
| CONSOLIDATED SCHEDULE OF INVESTMENTS (concluded) | December 31, 2012 |
| Managed Futures Strategy Fund | |
| | | | | | Unrealized | |
| | | Contracts | | | Gain (Loss) | |
| March 2013 Brent Crude | | | | | | | | |
| Futures Contracts | | | | | | | | |
| (Aggregate Value of | | | | | | | | |
| Contracts $2,310,630) | | | 21 | | | $ | (59,951 | ) |
| March 2013 Cotton #2 | | | | | | | | |
| Futures Contracts | | | | | | | | |
| (Aggregate Value of | | | | | | | | |
| Contracts $8,859,500) | | | 235 | | | | (466,259 | ) |
| (Total Aggregate Value of | | | | | | | | |
| Contracts $123,999,405) | | | | | | $ | 7,286,298 | |
| CURRENCY FUTURES CONTRACTS SOLD SHORT† | | | | | | | | |
| March 2013 Japanese Yen | | | | | | | | |
| Futures Contracts | | | | | | | | |
| (Aggregate Value of | | | | | | | | |
| Contracts $108,429,000) | | | 752 | | | $ | 4,644,657 | |
| † | Value determined based on Level 1 inputs, unless otherwise noted — See Note 4. |
| †† | Value determined based on Level 2 inputs — See Note 4. |
| 1 | All or portion of this security is on loan at December 31, 2012 - See Note 11. |
| 2 | The issuer operates under a Congressional charter; its securities are neither issued nor guaranteed by the U.S. Government. |
| 3 | On September 7, 2008, the issuer was placed in conservatorship by the Federal Housing Finance Agency (FHFA). As conservator, the FHFA has full powers to control the assets and operations of the firm. |
| 4 | Repurchase Agreements — See Note 5. |
| 5 | Securities lending collateral — See Note 11. |
| 6 | Investment in a product that pays a management fee to a party related to the advisor. |
| See Notes to Financial Statements . | the Guggenheim Funds annual REPORT | 11 |
| Managed Futures Strategy Fund |
| |
| Consolidated STATEMENT OF |
| ASSETS AND LIABILITIES |
|
| December 31, 2012 |
| Assets: | | | | |
| Investments, at value - including $1,486,613 of securities loaned | | | | |
| (cost $733,547,834) | | $ | 733,691,204 | |
| Repurchase agreements, at value | | | | |
| (cost $95,106,114) | | | 95,106,114 | |
| Total investments | | | | |
| (cost $828,653,948) | | | 828,797,318 | |
| Segregated cash with broker | | | 34,820,989 | |
| Receivables: | | | | |
| Variation margin | | | 3,073,679 | |
| Fund shares sold | | | 2,335,594 | |
| Interest | | | 242,622 | |
| Dividends | | | 76,980 | |
| Total assets | | | 869,347,182 | |
| Liabilities: | | | | |
| Overdraft due to custodian bank | | | 714,206 | |
| Payable for: | | | | |
| Fund shares redeemed | | | 20,842,235 | |
| Payable upon return of securities loaned | | | 1,523,525 | |
| Management fees | | | 755,067 | |
| Distribution and service fees | | | 206,536 | |
| Transfer agent and administrative fees | | | 205,053 | |
| Portfolio accounting fees | | | 51,911 | |
| Miscellaneous | | | 1,724,721 | |
| Total liabilities | | | 26,023,254 | |
| Net assets | | $ | 843,323,928 | |
| Net assets consist of: | | | | |
| Paid in capital | | $ | 951,939,699 | |
| Accumulated net investment loss | | | (1,962,317 | ) |
| Accumulated net realized loss on investments | | | (125,335,019 | ) |
| Net unrealized appreciation on investments | | | 18,681,565 | |
| Net assets | | $ | 843,323,928 | |
| A-Class: | | | | |
| Net assets | | $ | 145,950,146 | |
| Capital shares outstanding | | | 6,875,037 | |
| Net asset value per share | | $ | 21.23 | |
| Maximum offering price per share | | | | |
| (Net asset value divided by 95.25%) | | $ | 22.29 | |
| C-Class: | | | | |
| Net assets | | $ | 49,378,192 | |
| Capital shares outstanding | | | 2,430,652 | |
| Net asset value per share | | $ | 20.31 | |
| H-Class: | | | | |
| Net assets | | $ | 501,108,625 | |
| Capital shares outstanding | | | 23,604,437 | |
| Net asset value per share | | $ | 21.23 | |
| Institutional Class: | | | | |
| Net assets | | $ | 45,700,193 | |
| Capital shares outstanding | | | 2,137,356 | |
| Net asset value per share | | $ | 21.38 | |
| Y-Class: | | | | |
| Net assets | | $ | 101,186,772 | |
| Capital shares outstanding | | | 4,727,003 | |
| Net asset value per share | | $ | 21.41 | |
| Consolidated STATEMENT |
| OF OPERATIONS |
|
| Year Ended December 31, 2012 |
| Investment Income: | | | | |
| Interest | | $ | 3,267,443 | |
| Dividends | | | 184,800 | |
| Income from securities lending, net | | | 5,210 | |
| Total investment income | | | 3,457,453 | |
| | | | | |
| Expenses: | | | | |
| Management fees | | | 17,713,571 | |
| Transfer agent and administrative fees | | | | |
| A-Class | | | 728,405 | |
| C-Class | | | 175,529 | |
| H-Class | | | 2,824,637 | |
| I-Class | | | 174,627 | |
| Y-Class | | | 565,594 | |
| Distribution and service fees: | | | | |
| A-Class | | | 728,405 | |
| C-Class | | | 702,118 | |
| H-Class | | | 2,824,637 | |
| Portfolio accounting fees | | | 890,737 | |
| Licensing fees | | | 5,674,687 | |
| Custodian fees | | | 375,180 | |
| Trustees’ fees* | | | 275,382 | |
| Miscellaneous | | | 1,847,177 | |
| Total expenses | | | 35,500,686 | |
| Less: | | | | |
| Expenses waived by Advisor | | | (1,116,619 | ) |
| Net expenses | | | 34,384,067 | |
| Net investment loss | | | (30,926,614 | ) |
| | | | | |
| Net Realized and Unrealized Gain (Loss): | | | | |
| Net realized gain (loss) on: | | | | |
| Investments | | | 48,374 | |
| Futures contracts | | | (209,489,515 | ) |
| Foreign currency | | | (3,518 | ) |
| Options written | | | 1,235,551 | |
| Net realized loss | | | (208,209,108 | ) |
| Net change in unrealized appreciation | | | | |
| (depreciation) on: | | | | |
| Investments | | | (643,044 | ) |
| Futures contracts | | | (3,701,022 | ) |
| Foreign currency | | | (172 | ) |
| Net change in unrealized appreciation | | | | |
| (depreciation) | | | (4,344,238 | ) |
| Net realized and unrealized loss | | | (212,553,346 | ) |
| Net decrease in net assets resulting from operations | | $ | (243,479,960 | ) |
| * | Relates to Trustees not deemed “interested persons” within the meaning of Section 2(a)(19) of the 1940 Act. |
| 12 | the GUGGENHEIM FUNDS annual report | See Notes to Financial Statements. |
| Managed Futures Strategy Fund |
| |
| Consolidated STATEMENTS OF CHANGES IN NET ASSETS |
| | | Year Ended | | | Year Ended | |
| | | December 31, | | | December 31, | |
| | | 2012 | | | 2011 | |
| Increase (Decrease) In Net Assets From Operations: | | | | | | | | |
| Net investment loss | | $ | (30,926,614 | ) | | $ | (43,185,269 | ) |
| Net realized loss on investments | | | (208,209,108 | ) | | | (76,732,566 | ) |
| Net change in unrealized appreciation (depreciation) on investments | | | (4,344,238 | ) | | | (65,602,982 | ) |
| Net decrease in net assets resulting from operations | | | (243,479,960 | ) | | | (185,520,817 | ) |
| | | | | | | | | |
| Capital share transactions: | | | | | | | | |
| Proceeds from sale of shares | | | | | | | | |
| A-Class | | | 122,900,483 | | | | 511,923,650 | |
| C-Class | | | 6,406,783 | | | | 16,934,292 | |
| H-Class | | | 809,349,983 | | | | 795,455,515 | |
| Institutional Class | | | 41,570,693 | | | | 74,985,665 | |
| Y-Class | | | 40,444,459 | | | | 299,957,366 | |
| Cost of shares redeemed | | | | | | | | |
| A-Class | | | (671,652,699 | ) | | | (383,723,127 | ) |
| C-Class | | | (43,969,338 | ) | | | (69,518,004 | ) |
| H-Class | | | (1,219,877,947 | ) | | | (847,649,799 | ) |
| Institutional Class | | | (88,606,366 | ) | | | (100,701,093 | ) |
| Y-Class | | | (306,099,003 | ) | | | (55,454,346 | ) |
| Net increase (decrease) from capital share transactions | | | (1,309,532,952 | ) | | | 242,210,119 | |
| Net increase (decrease) in net assets | | | (1,553,012,912 | ) | | | 56,689,302 | |
| | | | | | | | | |
| Net assets: | | | | | | | | |
| Beginning of year | | | 2,396,336,840 | | | | 2,339,647,538 | |
| End of year | | $ | 843,323,928 | | | $ | 2,396,336,840 | |
| Accumulated net investment loss at end of year | | $ | (1,962,317 | ) | | $ | (1,952,195 | ) |
| | | | | | | | | |
| Capital share activity: | | | | | | | | |
| Shares sold | | | | | | | | |
| A-Class | | | 5,377,085 | | | | 20,376,917 | |
| C-Class | | | 298,490 | | | | 686,909 | |
| H-Class | | | 35,175,121 | | | | 31,500,881 | |
| Institutional Class | | | 1,899,025 | | | | 2,971,063 | |
| Y-Class | | | 1,739,090 | | | | 11,718,228 | |
| Shares redeemed | | | | | | | | |
| A-Class | | | (29,130,895 | ) | | | (15,245,234 | ) |
| C-Class | | | (2,053,748 | ) | | | (2,835,242 | ) |
| H-Class | | | (55,835,873 | ) | | | (33,774,119 | ) |
| Institutional Class | | | (3,982,544 | ) | | | (3,965,154 | ) |
| Y-Class | | | (13,821,535 | ) | | | (2,232,779 | ) |
| Net increase (decrease) in shares | | | (60,335,784 | ) | | | 9,201,470 | |
| See Notes to Financial Statements. | the GUGGENHEIM FUNDS annual report | 13 |
MANAGED FUTURES STRATEGY FUND
FINANCIAL HIGHLIGHTS
This table is presented to show selected data for a share outstanding throughout each period and to assist shareholders in evaluating a Fund’s performance for the periods presented.
| | | Year Ended | | | Year Ended | | | Year Ended | | | Year Ended | | | Period Ended | | | Year Ended | |
| | | December 31, | | | December 31, | | | December 31, | | | December 31, | | | December 31, | | | March 31, | |
| A-Class | | | 2012a | | | | 2011a | | | | 2010a | | | | 2009a | | | | 2008a,b | | | | 2008 | |
| Per Share Data | | | | | | | | | | | | | | | | | | | | | | | | |
| Net asset value, beginning of period | | $ | 23.95 | | | $ | 25.78 | | | $ | 26.81 | | | $ | 28.04 | | | $ | 28.26 | | | $ | 25.03 | |
| Income (loss) from investment operations: | | | | | | | | | | | | | | | | | | | | | | | | |
| Net investment income (loss)c | | | (.39 | ) | | | (.44 | ) | | | (.41 | ) | | | (.39 | ) | | | (—) | d | | | .57 | |
| Net gain (loss) on investments (realized and unrealized) | | | (2.33 | ) | | | (1.39 | ) | | | (.62 | ) | | | (.84 | ) | | | .83 | | | | 2.64 | |
| Total from investment operations | | | (2.72 | ) | | | (1.83 | ) | | | (1.03 | ) | | | (1.23 | ) | | | .83 | | | | 3.21 | |
| Less distributions from: | | | | | | | | | | | | | | | | | | | | | | | | |
| Net investment income | | | — | | | | — | | | | — | | | | — | | | | (.57 | ) | | | — | |
| Net realized gains | | | — | | | | — | | | | — | | | | — | | | | (.50 | ) | | | (—) | i |
| Total distributions | | | — | | | | — | | | | — | | | | — | | | | (1.07 | ) | | | (—) | i |
| Redemption fees collected | | | — | | | | — | | | | — | e | | | — | e | | | .02 | | | | .02 | |
| Net asset value, end of period | | $ | 21.23 | | | $ | 23.95 | | | $ | 25.78 | | | $ | 26.81 | | | $ | 28.04 | | | $ | 28.26 | |
| | | | | | | | | | | | | | | | | | | | | | | | | |
| Total Returnf | | | (11.32 | %) | | | (7.14 | %) | | | (3.84 | %) | | | (4.39 | %) | | | 2.96 | % | | | 12.92 | % |
| Ratios/Supplemental Data | | | | | | | | | | | | | | | | | | | | | | | | |
| Net assets, end of period (in thousands) | | $ | 145,950 | | | $ | 733,469 | | | $ | 657,317 | | | $ | 636,083 | | | $ | 298,987 | | | $ | 128,744 | |
| Ratios to average net assets: | | | | | | | | | | | | | | | | | | | | | | | | |
| Net investment income (loss) | | | (1.71 | %) | | | (1.76 | %) | | | (1.66 | %) | | | (1.42 | %) | | | (0.02 | %) | | | 2.15 | % |
| Total expensesg | | | 1.96 | % | | | 2.05 | % | | | 2.04 | % | | | 2.16 | % | | | 1.77 | % | | | 1.72 | % |
| Net expensesh | | | 1.89 | % | | | 1.97 | % | | | 1.97 | % | | | 2.05 | % | | | 1.77 | % | | | 1.72 | % |
| Portfolio turnover rate | | | 172 | % | | | 72 | % | | | 148 | % | | | 125 | % | | | 74 | % | | | 154 | % |
| | | Year Ended | | | Year Ended | | | Year Ended | | | Year Ended | | | Period Ended | | | Year Ended | |
| | | December 31, | | | December 31, | | | December 31, | | | December 31, | | | December 31, | | | March 31, | |
| C-Class | | 2012a | | | 2011a | | | 2010a | | | 2009a | | | 2008a,b | | | 2008 | |
| Per Share Data | | | | | | | | | | | | | | | | | | |
| Net asset value, beginning of period | | $ | 23.09 | | | $ | 25.04 | | | $ | 26.24 | | | $ | 27.65 | | | $ | 28.04 | | | $ | 25.02 | |
| Income (loss) from investment operations: | | | | | | | | | | | | | | | | | | | | | | | | |
| Net investment income (loss)c | | | (.53 | ) | | | (.61 | ) | | | (.59 | ) | | | (.58 | ) | | | (.16 | ) | | | .35 | |
| Net gain (loss) on investments (realized and unrealized) | | | (2.25 | ) | | | (1.34 | ) | | | (.61 | ) | | | (.83 | ) | | | .82 | | | | 2.65 | |
| Total from investment operations | | | (2.78 | ) | | | (1.95 | ) | | | (1.20 | ) | | | (1.41 | ) | | | .66 | | | | 3.00 | |
| Less distributions from: | | | | | | | | | | | | | | | | | | | | | | | | |
| Net investment income | | | — | | | | — | | | | — | | | | — | | | | (.57 | ) | | | — | |
| Net realized gains | | | — | | | | — | | | | — | | | | — | | | | (.50 | ) | | | (—) | i |
| Total distributions | | | — | | | | — | | | | — | | | | — | | | | (1.07 | ) | | | (—) | i |
| Redemption fees collected | | | — | | | | — | | | | — | e | | | — | e | | | .02 | | | | .02 | |
| Net asset value, end of period | | $ | 20.31 | | | $ | 23.09 | | | $ | 25.04 | | | $ | 26.24 | | | $ | 27.65 | | | $ | 28.04 | |
| | | | | | | | | | | | | | | | | | | | | | | | | |
| Total Returnf | | | (12.04 | %) | | | (7.79 | %) | | | (4.57 | %) | | | (5.10 | %) | | | 2.37 | % | | | 12.08 | % |
| Ratios/Supplemental Data | | | | | | | | | | | | | | | | | | | | | | | | |
| Net assets, end of period (in thousands) | | $ | 49,378 | | | $ | 96,647 | | | $ | 158,628 | | | $ | 225,416 | | | $ | 125,601 | | | $ | 46,005 | |
| Ratios to average net assets: | | | | | | | | | | | | | | | | | | | | | | | | |
| Net investment income (loss) | | | (2.45 | %) | | | (2.50 | %) | | | (2.41 | %) | | | (2.17 | %) | | | (0.78 | %) | | | 1.30 | % |
| Total expensesg | | | 2.70 | % | | | 2.80 | % | | | 2.79 | % | | | 2.92 | % | | | 2.51 | % | | | 2.48 | % |
| Net expensesh | | | 2.64 | % | | | 2.72 | % | | | 2.72 | % | | | 2.81 | % | | | 2.51 | % | | | 2.48 | % |
| Portfolio turnover rate | | | 172 | % | | | 72 | % | | | 148 | % | | | 125 | % | | | 74 | % | | | 154 | % |
| 14 | THE GUGGENHEIM FUNDS ANNUAL REPORT | SEE NOTES TO FINANCIAL STATEMENTS . |
MANAGED FUTURES STRATEGY FUND
FINANCIAL HIGHLIGHTS (continued)
This table is presented to show selected data for a share outstanding throughout each period and to assist shareholders in evaluating a Fund’s performance for the periods presented.
| | | Year Ended | | | Year Ended | | | Year Ended | | | Year Ended | | | Period Ended | | | Year Ended | |
| | | December 31, | | | December 31, | | | December 31, | | | December 31, | | | December 31, | | | March 31, | |
| H-Class | | 2012a | | | 2011a | | | 2010a | | | 2009a | | | 2008a, b | | | 2008 | |
| Per Share Data | | | | | | | | | | | | | | | | | | |
| Net asset value, beginning of period | | $ | 23.95 | | | $ | 25.78 | | | $ | 26.81 | | | $ | 28.04 | | | $ | 28.26 | | | $ | 25.03 | |
| Income (loss) from investment operations: | | | | | | | | | | | | | | | | | | | | | | | | |
| Net investment income (loss)c | | | (.38 | ) | | | (.44 | ) | | | (.42 | ) | | | (.38 | ) | | | (.01 | ) | | | .58 | |
| Net gain (loss) on investments (realized and unrealized) | | | (2.34 | ) | | | (1.39 | ) | | | (.61 | ) | | | (.85 | ) | | | .84 | | | | 2.63 | |
| Total from investment operations | | | (2.72 | ) | | | (1.83 | ) | | | (1.03 | ) | | | (1.23 | ) | | | .83 | | | | 3.21 | |
| Less distributions from: | | | | | | | | | | | | | | | | | | | | | | | | |
| Net investment income | | | — | | | | — | | | | — | | | | — | | | | (.57 | ) | | | — | |
| Net realized gains | | | — | | | | — | | | | — | | | | — | | | | (.50 | ) | | | (—) | i |
| Total distributions | | | — | | | | — | | | | — | | | | — | | | | (1.07 | ) | | | (—) | i |
| Redemption fees collected | | | — | | | | — | | | | — | e | | | — | e | | | .02 | | | | .02 | |
| Net asset value, end of period | | $ | 21.23 | | | $ | 23.95 | | | $ | 25.78 | | | $ | 26.81 | | | $ | 28.04 | | | $ | 28.26 | |
| | | | | | | | | | | | | | | | | | | | | | | | | |
| Total Returnf | | | (11.32 | %) | | | (7.14 | %) | | | (3.84 | %) | | | (4.39 | %) | | | 2.96 | % | | | 12.92 | % |
| Ratios/Supplemental Data | | | | | | | | | | | | | | | | | | | | | | | | |
| Net assets, end of period (in thousands) | | $ | 501,109 | | | $ | 1,059,988 | | | $ | 1,199,718 | | | $ | 1,468,770 | | | $ | 838,511 | | | $ | 322,673 | |
| Ratios to average net assets: | | | | | | | | | | | | | | | | | | | | | | | | |
| Net investment income (loss) | | | (1.70 | %) | | | (1.75 | %) | | | (1.66 | %) | | | 1.41 | % | | | (0.03 | %) | | | 2.17 | % |
| Total expensesg | | | 1.95 | % | | | 2.05 | % | | | 2.04 | % | | | 2.16 | % | | | 1.77 | % | | | 1.73 | % |
| Net expensesh | | | 1.89 | % | | | 1.97 | % | | | 1.97 | % | | | 2.05 | % | | | 1.77 | % | | | 1.73 | % |
| Portfolio turnover rate | | | 172 | % | | | 72 | % | | | 148 | % | | | 125 | % | | | 74 | % | | | 154 | % |
| | | Year Ended | | | Year Ended | | | Period Ended | |
| | | December 31, | | | December 31, | | | December 31, | |
| Institutional Class | | 2012a | | | 2011a | | | 2010a,j | |
| Per Share Data | | | | | | | | | |
| Net asset value, beginning of period | | $ | 24.06 | | | $ | 25.84 | | | $ | 25.58 | |
| Income (loss) from investment operations: | | | | | | | | | | | | |
| Net investment lossc | | | (.33 | ) | | | (.38 | ) | | | (.23 | ) |
| Net gain (loss) on investments (realized and unrealized) | | | (2.35 | ) | | | (1.40 | ) | | | .49 | |
| Total from investment operations | | | (2.68 | ) | | | (1.78 | ) | | | .26 | |
| Redemption fees collected | | | — | | | | — | | | | — | e |
| Net asset value, end of period | | $ | 21.38 | | | $ | 24.06 | | | $ | 25.84 | |
| | | | | | | | | | | | | |
| Total Returnf | | | (11.14 | %) | | | (6.85 | %) | | | 0.98 | % |
| Ratios/Supplemental Data | | | | | | | | | | | | |
| Net assets, end of period (in thousands) | | $ | 45,700 | | | $ | 101,549 | | | $ | 134,733 | |
| Ratios to average net assets: | | | | | | | | | | | | |
| Net investment loss | | | (1.45 | %) | | | (1.50 | %) | | | (1.41 | %) |
| Total expensesg | | | 1.70 | % | | | 1.80 | % | | | 1.78 | % |
| Net expensesh | | | 1.64 | % | | | 1.72 | % | | | 1.72 | % |
| Portfolio turnover rate | | | 172 | % | | | 72 | % | | | 148 | % |
| SEE NOTES TO FINANCIAL STATEMENTS. | THE GUGGENHEIM FUNDS ANNUAL REPORT | 15 |
MANAGED FUTURES STRATEGY FUND
FINANCIAL HIGHLIGHTS (concluded)
This table is presented to show selected data for a share outstanding throughout each period and to assist shareholders in evaluating a Fund’s performance for the periods presented.
| | | Year Ended | | | Year Ended | | | Period Ended | |
| | | December 31, | | | December 31, | | | December 31, | |
| Y-Class | | 2012a | | | 2011a | | | 2010a, k | |
| Per Share Data | | | | | | | | | |
| Net asset value, beginning of period | | $ | 24.07 | | | $ | 25.84 | | | $ | 25.74 | |
| Income (loss) from investment operations: | | | | | | | | | | | | |
| Net investment lossc | | | (.32 | ) | | | (.37 | ) | | | (.26 | ) |
| Net gain (loss) on investments (realized and unrealized) | | | (2.34 | ) | | | (1.40 | ) | | | .36 | |
| Total from investment operations | | | (2.66 | ) | | | (1.77 | ) | | | .10 | |
| Redemption fees collected | | | — | | | | — | | | | — | e |
| Net asset value, end of period | | $ | 21.41 | | | $ | 24.07 | | | $ | 25.84 | |
| | | | | | | | | | | | | |
| Total Returnf | | | (11.05 | %) | | | (6.85 | %) | | | 0.39 | % |
| Ratios/Supplemental Data | | | | | | | | | | | | |
| Net assets, end of period (in thousands) | | $ | 101,187 | | | $ | 404,684 | | | $ | 189,251 | |
| Ratios to average net assets: | | | | | | | | | | | | |
| Net investment loss | | | (1.41 | %) | | | (1.47 | %) | | | (1.36 | %) |
| Total expensesg | | | 1.65 | % | | | 1.75 | % | | | 1.73 | % |
| Net expensesh | | | 1.59 | % | | | 1.68 | % | | | 1.67 | % |
| Portfolio turnover rate | | | 172 | % | | | 72 | % | | | 148 | % |
| b | The Fund changed its fiscal year end from March 31 to December 31 in 2008. Percentage amounts for the period, except total return and portfolio turnover rate, have been annualized. |
| c | Net investment income (loss) per share was computed using average shares outstanding throughout the period. |
| d | Net investment loss is less than $0.01 per share. |
| e | Redemption fees collected are less than $0.01 per share. |
| f | Total return does not reflect the impact of any applicable sales charges and has not been annualized. |
| g | Does not include expenses of the underlying funds in which the Fund invests. |
| h | Net expense information reflects the expense ratios after expense waivers. |
| I | Distributions from realized gains are less than $0.01 per share. |
| j | Since commencement of operations: May 3, 2010. Percentage amounts for the period, except total return and portfolio turnover rate, have been annualized. |
| k | Since commencement of operations: March 29, 2010. Percentage amounts for the period, except total return and portfolio turnover rate, have been annualized. |
| 16 | THE GUGGENHEIM FUNDS ANNUAL REPORT | SEE NOTES TO FINANCIAL STATEMENTS. |
NOTES TO CONSOLIDATED FINANCIAL STATEMENTS
1. Organization, Consolidation of Subsidiary and Significant Accounting Policies
Organization
The Rydex Series Funds (the “Trust”) is registered with the SEC under the Investment Company Act of 1940 (“1940 Act”), as a non-diversified, open-ended investment company of the series type. Each series, in effect, is representing a separate Fund (collectively the “Funds”). The Trust is authorized to issue an unlimited number of shares. The Trust accounts for the assets of each Fund separately.
The Trust offers a combination of eight separate classes of shares: Investor Class shares, Advisor Class shares, A-Class shares, C-Class shares, H-Class shares, Y-Class shares, Institutional Class shares, and Money Market Class shares. Sales of shares of each Class are made without a front-end sales charge at the net asset value per share (“NAV”), with the exception of A-Class shares. A-Class shares are sold at the NAV, plus the applicable front-end sales charge. The sales charge varies depending on the amount purchased, but will not exceed 4.75%. A-Class share purchases of $1 million or more are exempt from the front-end sales charge but have a 1% contingent deferred sales charge (“CDSC”) if shares are redeemed within 12 months of purchase. C-Class shares have a 1% CDSC if shares are redeemed within 12 months of purchase. Institutional Class shares are offered primarily for direct investment by institutions such as pension and profit sharing plans, endowments, foundations and corporations. Institutional Class shares have a minimum initial investment of $2 million and a minimum account balance of $1 million. Institutional Class shares are offered without a front-end sales charge or CDSC.
At December 31, 2012, the Trust consisted of fifty-six separate funds. This report covers the Managed Futures Strategy Fund (the “Fund”). Only A-Class, C-Class, H-Class, Y-Class and Institutional Class shares had been issued by the Fund.
Guggenheim Investments (“GI”) provides advisory services and Rydex Fund Services, LLC (“RFS”) provides transfer agent, administrative and accounting services to the Trust. Guggenheim Distributors, LLC (“GDL”) acts as principal underwriter for the Trust. GI, RFS and GDL are affiliated entities.
Consolidation of Subsidiary
The consolidated financial statements of the Fund include the accounts of a wholly-owned and controlled Cayman Islands subsidiary (the “Subsidiary”). Significant inter-company accounts and transactions have been eliminated in consolidation for the Fund.
The Fund may invest up to 25% of its total assets in its Subsidiary which acts as an investment vehicle in order to effect certain investments consistent with the Fund’s investment objectives and policies.
A summary of the Fund’s investment in its Subsidiary is as follows:
| | | | | Subsidiary | | | % of Total Net | |
| | | | | Net Assets at | | | Assets of the Fund | |
| | | Inception Date | | December 31, | | | at December 31, | |
| | | of Subsidiary | | 2012 | | | 2012 | |
| Managed Futures | | | | | | | | | | |
| Strategy Fund | | 05/01/08 | | $ | 57,016,033 | | | | 6.8 | % |
Significant Accounting Policies
The following significant accounting policies are in conformity with U.S. generally accepted accounting principles (“U.S. GAAP”) and are consistently followed by the Fund. This requires management to make estimates and assumptions that affect the reported amount of assets and liabilities and disclosure of contingent assets and liabilities at the date of the financial statements and the reported amounts of revenues and expenses during the reporting period. Actual results could differ from these estimates. All time references are based on Eastern Time.
A. The value of futures contracts is accounted for using the unrealized gain or loss on the contracts that is determined by marking the contracts to their current realized settlement prices. Financial futures contracts are valued at the 4:00 p.m. price on the valuation date. In the event that the exchange for a specific futures contract closes earlier than 4:00 p.m., the futures contract is valued at the Official Settlement Price of the exchange. However, the underlying securities from which the futures contract value is derived are monitored until 4:00 p.m. to determine if fair valuation would provide a more accurate valuation.
Debt securities with a maturity of greater than 60 days at acquisition are valued at prices that reflect broker/dealer supplied valuations or are obtained from independent pricing services, which may consider the trade activity, treasury spreads, yields or price of bonds of comparable quality, coupon, maturity, and type, as well as prices quoted by dealers who make markets in such securities. Short-term debt securities with a maturity of 60 days or less at acquisition and repurchase agreements are valued at amortized cost, which approximates market value.
Open-end investment companies (“Mutual Funds”) are valued at their NAV as of the close of business on the valuation date. Exchange Traded Funds (“ETFs”) and close-end investment companies are valued at the last quoted sales price.
| THE GUGGENHEIM FUNDS ANNUAL REPORT | 17 |
NOTES TO CONSOLIDATED FINANCIAL STATEMENTS (continued)
Investments for which market quotations are not readily available are fair valued as determined in good faith by GI under the direction of the Board of Trustees using methods established or ratified by the Board of Trustees. These methods include, but are not limited to: (i) obtaining general information as to how these securities and assets trade; (ii) in connection with futures contracts and options thereupon, and other derivative investments, obtaining information as to how (a) these contracts and other derivative investments trade in the futures or other derivative markets, respectively, and (b) the securities underlying these contracts and other derivative investments trade in the cash market; and (iii) obtaining other information and considerations, including current values in related markets.
B. Security transactions are recorded on the trade date for financial reporting purposes. Realized gains and losses from securities transactions are recorded using the identified cost basis. Proceeds from lawsuits related to investment holdings are recorded as realized gains in the Fund. Dividend income is recorded on the ex-dividend date, net of applicable taxes withheld by foreign countries. Taxable non-cash dividends are recorded as dividend income. Interest income, including amortization of premiums and accretion of discount, is accrued on a daily basis.
C. Distributions of net investment income and net realized gains, if any, are declared and paid at least annually. Distributions are recorded on the ex-dividend date and are determined in accordance with income tax regulations which may differ from U.S. GAAP.
D. Upon entering into a futures contract, the Fund deposits and maintains as collateral such initial margin as required by the exchange on which the transaction is affected. Pursuant to the contract, the Fund agrees to receive from or pay to the broker an amount of cash equal to the daily fluctuation in value of the contract. Such receipts or payments are known as variation margin and are recorded by the Fund as unrealized gains or losses. When the contract is closed, the Fund records a realized gain or loss equal to the difference between the value of the contract at the time it was opened and the value at the time it was closed.
E. Certain U.S. Government and Agency Obligations are traded on a discount basis; the interest rates shown on the Schedule of Investments reflect the effective rates paid at the time of purchase by the Fund. Other securities bear interest at the rates shown, payable at fixed dates through maturity.
F. The Fund may leave cash overnight in its cash account with the custodian, U.S. Bank. Periodically, the Fund may have cash due to the custodian bank as an overdraft balance. A fee is incurred on this overdraft, calculated by multiplying the overdraft by a rate based on the federal funds rate.
Segregated cash with the broker is held as collateral for investments in derivative instruments such as futures contracts or swap agreements.
G. Interest and dividend income, most expenses, all realized gains and losses, and all unrealized gains and losses are allocated to the Classes based upon the value of the outstanding shares in each Class. Certain costs, such as distribution fees relating to A-Class shares and H-Class shares and service and distribution fees related to C-Class shares, are charged directly to specific Classes. In addition, certain expenses have been allocated to the individual Funds in the Trust on a pro rata basis upon the respective aggregate net assets of each Fund included in the Trust.
H. Throughout the normal course of business, the Fund enters into contracts that contain a variety of representations and warranties which provide general indemnifications. The Fund’s maximum exposure under these arrangements is unknown, as this would involve future claims that may be made against the Fund and/or its affiliates that have not yet occurred. However, based on experience, the Fund expects the risk of loss to be remote.
2. Financial Instruments
As part of their investment strategy, the Fund utilizes a variety of derivative instruments including options and futures. These investments involve, to varying degrees, elements of market risk and risks in excess of the amounts recognized in the Statement of Assets and Liabilities.
A futures contract is an agreement to purchase (long) or sell (short) an agreed amount of securities or other instruments at a set price for delivery at a future date. There are significant risks associated with a Fund’s use of futures contracts and related options, including (i) there may be an imperfect or no correlation between the changes in market value of the underlying asset and the prices of futures contracts; (ii) there may not be a liquid secondary market for a futures contract; (iii) trading restrictions or limitations may be imposed by an exchange; and (iv) government regulations may restrict trading in futures contracts. When investing in futures, there is minimal counterparty credit risk to the Fund because futures are exchange-traded and the exchange’s clearinghouse, as counterparty to all exchange-traded futures, guarantees against default. Cash deposits are shown as restricted cash on the Statement of Assets and Liabilities; securities held as collateral are noted on the Schedule of Investments.
| 18 | THE GUGGENHEIM FUNDS ANNUAL REPORT |
NOTES TO CONSOLIDATED FINANCIAL STATEMENTS (continued)
The Fund wrote call options on a covered basis and put options on securities that are traded on recognized securities exchanges and over-the-counter markets. Call and put options on securities give the writer the obligation to sell or purchase a security at a specified price, until a certain date. The risk in writing a covered call option is that a Fund may forego the opportunity for profit if the market price of the underlying security increases and the option is exercised. The risk in writing a covered put option is that a Fund may incur a loss if the market price of the underlying security decreases and the option is exercised. In addition, there is the risk that a Fund may not be able to enter into a closing transaction because of an illiquid secondary market or, for over-the-counter options, because of the counterparty’s inability to perform. An amount equal to the premium received is entered in the Fund’s accounting records as an asset and equivalent liability. The amount of the liability is subsequently marked-to-market to reflect the current value of the option written. When a written option expires, or if a Fund enters into a closing purchase transaction, it realizes a gain (or loss if the cost of a closing purchase transaction exceeds the premium received when the option was sold).
In conjunction with the use of written options and futures, the Fund is required to maintain collateral in various forms. The Fund uses, where appropriate, depending on the financial instrument utilized and the broker involved, margin deposits at the broker, cash and/or securities segregated at the custodian bank, discount notes, or the repurchase agreements allocated to the Fund.
The Trust has established counterparty credit guidelines and enters into transactions only with financial institutions of investment grade or better. The Trust monitors the counterparty credit risk.
3. Fees and Other Transactions with Affiliates
Under the terms of an investment advisory contract, the Fund pays GI investment advisory fees calculated at an annualized rate of 0.90% of the average daily net assets.
RFS provides transfer agent and administrative services to the Fund for fees calculated at an annualized rate of 0.25% of the average daily net assets of A-Class, C-Class, H-Class and Institutional Class and 0.20% of the average daily net assets of Y-Class.
GI has contractually agreed to waive the management fee it receives from the Subsidiary in an amount equal to the management fee paid to GI by the Subsidiary. This undertaking will continue in effect for so long as the Fund invests in the Subsidiary, and may not be terminated by GI unless GI obtains the prior approval of the Fund’s Board of Trustees for such termination. In any event, this undertaking will continue through April 30, 2013.
RFS also provides accounting services to the Fund for fees calculated at annualized rates below, based on the average daily net assets of the Fund.
| Fund Accounting Fees | | (as a % of net assets) |
| On the first $250 million | | 0.10% |
| On the next $250 million | | 0.075% |
| On the next $250 million | | 0.05% |
| Over $750 million | | 0.03% |
RFS engages external service providers to perform other necessary services for the Trust, such as audit and accounting related services, legal services, custody, printing and mailing, etc., on a pass-through basis. Such expenses are allocated to various Funds within the complex based on relative net assets.
The Trust has adopted a Distribution Plan applicable to A-Class shares and H-Class shares for which GDL and other firms that provide distribution and/or shareholder services (“Service Providers”) may receive compensation. If a Service Provider provides distribution services, the Fund will pay distribution fees to GDL at an annual rate not to exceed 0.25% of average daily net assets, pursuant to Rule 12b-1 of the 1940 Act. GDL, in turn, will pay the Service Provider out of its fees. GDL may, at its discretion, retain a portion of such payments to compensate itself for distribution services.
The Trust has adopted a separate Distribution and Shareholder Services Plan applicable to its C-Class shares that allows the Funds to pay annual distribution and service fees of 1.00% of the Funds’ C-Class shares average daily net assets. The annual 0.25% service fee compensates the shareholder’s financial advisor for providing ongoing services to the shareholder. The annual distribution fee of 0.75% reimburses GDL for paying the shareholder’s financial advisor an ongoing sales commission. GDL advances the first year’s service and distribution fees to the financial advisor. RDL retains the service and distribution fees on accounts with no authorized dealer of record.
For the year ended December 31, 2012, GDL retained sales charges of $258,671 relating to sales of A-Class shares of the Trust.
Certain officers and trustees of the Trust are also officers of GI, RFS and GDL.
4. Fair Value Measurement
In accordance with U.S. GAAP, fair value is defined as the price that the Fund would receive to sell an investment or pay to transfer a liability in an orderly transaction with an independent buyer in the principal market, or in the absence of a principal market the most advantageous market for the investment or liability. A
| THE GUGGENHEIM FUNDS ANNUAL REPORT | 19 |
NOTES TO CONSOLIDATED FINANCIAL STATEMENTS (continued)
three-tier hierarchy is utilized to distinguish between (1) inputs that reflect the assumptions market participants would use in pricing an asset or liability developed based on market data obtained from sources independent of the reporting entity (observable inputs) and (2) inputs that reflect the reporting entity’s own assumptions about the assumptions market participants would use in pricing an asset or liability developed based on the best information available in the circumstances (unobservable inputs) and to establish classification of fair value measurements for disclosure purposes. Various inputs are used in determining the value of the Fund’s investments. The inputs are summarized in the three broad levels listed below:
Level 1 — quoted prices in active markets for identical securities.
Level 2 — other significant observable inputs (including quoted prices for similar securities, interest rates, prepayment speeds, credit risk, etc.).
Level 3 — significant unobservable inputs (including the fund’s own assumptions used to determine the fair value of investments).
The inputs or methodologies used for valuing securities are not necessarily an indication of the risk associated with investing in those securities.
The following table summarizes the inputs used to value the Fund’s net assets at December 31, 2012:
| | | Level 1 | | | Level 1 | | | Level 2 | | | Level 3 | | | | |
| | | Investments | | | Other Financial | | | Investments | | | Investments | | | | |
| Fund | | In Securities | | | Instruments* | | | In Securities | | | In Securities | | | Total | |
| Assets | | | | | | | | | | | | | | | | | | | | |
| Managed Futures Strategy Fund | | $ | 67,895,000 | | | $ | 19,116,920 | | | $ | 764,799,765 | | | $ | — | | | $ | 851,811,685 | |
| Liabilities | | | | | | | | | | | | | | | | | | | | |
| Managed Futures Strategy Fund | | $ | — | | | $ | 2,893,830 | | | $ | 1,582,170 | | | $ | — | | | $ | 4,476,000 | |
| * | Other financial instruments include futures contracts which are reported as unrealized gain/loss at period end. |
For the year ended December 31, 2012, there were no transfers between levels.
5. Repurchase Agreements
The Funds transfer uninvested cash balances into a single joint account, the daily aggregate balance of which is invested in one or more repurchase agreements collateralized by obligations of the U.S. Treasury and U.S. Government Agencies. The collateral is in the possession of the Funds’ custodian and is evaluated to ensure that its market value exceeds, at a minimum, 102% of the original face amount of the repurchase agreements. Each Fund holds a pro rata share of the collateral based on the dollar amount of the repurchase agreement entered into by each Fund.
At December 31, 2012, the repurchase agreements in the joint account were as follows:
| Counterparty and Terms of Agreement | | Face Value | | | Repurchase Price | | | Collateral | | Par Value | | | Fair Value | |
| HSBC Group | | | | | | | | | | Federal Home Loan Bank | | | | | | | | |
| 0.12% | | | | | | | | | | 0.17% | | | | | | | | |
| Due 01/02/13 | | $ | 665,217,013 | | | $ | 665,221,448 | | | 12/18/13 - 12/24/13 | | $ | 677,040,000 | | | $ | 678,525,865 | |
| Deutsche Bank | | | | | | | | | | U.S. Treasury Note | | | | | | | | |
| 0.11% | | | | | | | | | | 2.13% - 3.38% | | | | | | | | |
| Due 01/02/13 | | | 340,217,013 | | | | 340,219,092 | | | 06/30/13 - 12/31/2015 | | | 338,332,600 | | | | 347,021,360 | |
| Mizuho Financial Group, Inc. | | | | | | | | | | U.S. Treasury Note | | | | | | | | |
| 0.14% | | | | | | | | | | 2.75% | | | | | | | | |
| Due 01/02/13 | | | 289,401,448 | | | | 289,403,699 | | | 10/31/13 | | | 286,361,000 | | | | 295,189,494 | |
| Credit Suisse Group | | | | | | | | | | U.S. Treasury Note | | | | | | | | |
| 0.12% | | | | | | | | | | 2.50% | | | | | | | | |
| Due 01/02/13 | | | 227,876,805 | | | | 227,878,325 | | | 03/31/15 | | | 218,783,700 | | | | 232,434,390 | |
In the event of counterparty default, the Funds have the right to collect the collateral to offset losses incurred. There is potential loss to the Funds in the event the Funds are delayed or prevented from exercising their rights to dispose of the collateral securities, including the risk of a possible decline in the value of the underlying securities during the period while the Funds seek to assert their rights. The Funds’ investment advisor, acting under the supervision of the Board of Trustees, reviews the value of the collateral and the creditworthiness of those banks and dealers with which the Funds enter into repurchase agreements to evaluate potential risks.
| 20 | THE GUGGENHEIM FUNDS ANNUAL REPORT |
NOTES TO CONSOLIDATED FINANCIAL STATEMENTS (continued)
6. Derivative Investment Holdings Categorized by Risk Exposure
U.S. GAAP requires disclosures to enable investors to better understand how and why the Fund uses derivative instruments, how these derivative instruments are accounted for and their effects on the Fund’s financial position and results of operations.
The Fund utilized derivatives for the following purposes:.
| Fund | | | Index Exposure | | | | Liquidity | |
| Managed Futures Strategy Fund | | | x | | | | x | |
The following table represents the notional amount of futures contracts outstanding, as an approximate percentage of the Fund’s net assets on a daily basis.
| | | Approximate percentage of |
| | | Fund’s net assets on a daily basis |
| Fund | | Long | | Short |
| Managed Futures Strategy Fund | | 140% | | 30% |
The following is a summary of the location of derivative investments on the Fund’s Statement of Assets and Liabilities as of December 31, 2012:
| Derivative Investment Type | | Asset Derivatives |
| Equity/Interest rate/Currency/Commodity contracts | | Variation margin |
The following table sets forth the fair value of the Fund’s derivative investments categorized by primary risk exposure at December 31, 2012:
| Asset Derivative Investments Value |
| | | Futures | | | Futures | | | Futures | | | Futures | | | Total Value at | |
| | | Equity | | | Currency | | | Interest Rate | | | Commodity | | | December 31, | |
| Fund | | Contracts* | | | Contracts* | | | Contracts* | | | Contracts* | | | 2012 | |
| Managed Futures Strategy Fund | | $ | 1,118,730 | | | $ | 6,176,112 | | | $ | 2,849,396 | | | $ | 12,870,129 | | | $ | 23,014,367 | |
| Liability Derivative Investments Value |
| | | Futures | | | Futures | | | Futures | | | Futures | | | Total Value at | |
| | | Equity | | | Currency | | | Interest Rate | | | Commodity | | | December 31, | |
| Fund | | Contracts* | | | Contracts* | | | Contracts* | | | Contracts* | | | 2012 | |
| Managed Futures Strategy Fund | | $ | 38,708 | | | $ | 868,264 | | | $ | 2,662,064 | | | $ | 906,964 | | | $ | 4,476,000 | |
| * | Includes cumulative appreciation (depreciation) of futures contracts as reported on the Schedule of Investments. Only current day’s variation margin is reported within the Statement of Assets and Liabilities. |
The following is a summary of the location of derivative investments on the Fund’s Statement of Operations for the year ended December 31, 2012:
| Derivative Investment Type | Location of Gain (Loss) on Derivatives |
| Equity/Interest Rate/Currency/Commodity contracts | Net realized gain (loss) on futures contracts |
| | Net change in unrealized appreciation (depreciation) on futures contracts |
| Equity contracts | Net realized gain (loss) on options written |
The following is a summary of the Fund’s realized gain (loss) and change in unrealized appreciation (depreciation) on derivative investments recognized on the Statement of Operations categorized by primary risk exposure for the year ended December 31, 2012:
| Realized Gain (Loss) on Derivative Investments Recognized in the Statement of Operations |
| | | Futures | | | Futures | | | Futures | | | Futures | | | Options | | | | |
| | | Equity | | | Currency | | | Interest Rate | | | Commodity | | | Written Equity | | | | |
| Fund | | Contracts | | | Contracts | | | Contracts | | | Contracts | | | Contracts | | | Total | |
| Managed Futures Strategy Fund | | $ | 2,818,019 | | | $ | (44,127,822 | ) | | $ | (10,413,175 | ) | | $ | (157,766,537 | ) | | $ | 1,235,551 | | | $ | (208,253,964 | ) |
| Change in Unrealized Appreciation (Depreciation) on Derivative Investments Recognized in the Statement of Operations |
| | | Futures | | | Futures | | | Futures | | | Futures | | | Options | | | | |
| | | Equity | | | Currency | | | Interest Rate | | | Commodity | | | Written Equity | | | | |
| Fund | | Contracts | | | Contracts | | | Contracts | | | Contracts | | | Contracts | | | Total | |
| Managed Futures Strategy Fund | | $ | 1,080,022 | | | $ | (3,258,795 | ) | | $ | (6,271,789 | ) | | $ | 4,749,540 | | | | $ | — | | | $ | (3,701,022 | ) |
| THE GUGGENHEIM FUNDS ANNUAL REPORT | 21 |
NOTES TO CONSOLIDATED FINANCIAL STATEMENTS (continued)
7. Options Written
Transactions in options written during the year ended December 31, 2012 were as follows:
| | | Written Call Options | |
| | | Number of | | | Premium | |
| Managed Futures Strategy Fund | | contracts | | | amount | |
| Balance at December 31, 2011 | | | — | | | $ | — | |
| Options Written | | | 2,750 | | | | 1,255,825 | |
| Options terminated in closing purchase transactions | | | (625 | ) | | | (319,375 | ) |
| Options expired | | | (2,125 | ) | | | (936,450 | ) |
| Options exercised | | | — | | | | — | |
| Balance at December 31, 2012 | | | — | | | $ | — | |
| | | Written Put Options | |
| | | Number of | | | Premium | |
| Managed Futures Strategy Fund | | contracts | | | amount | |
| Balance at December 31, 2011 | | | — | | | $ | — | |
| Options Written | | | 175 | | | | 50,351 | |
| Options terminated in closing purchase transactions | | | — | | | | — | |
| Options expired | | | (175 | ) | | | (50,351 | ) |
| Options exercised | | | — | | | | — | |
| Balance at December 31, 2012 | | | — | | | $ | — | |
8. Federal Income Tax Information
The Fund intends to comply with the provisions of Subchapter M of the Internal Revenue Code applicable to regulated investment companies and distribute substantially all taxable net investment income and capital gains sufficient to relieve the Fund from all, or substantially all, federal income, excise and state income taxes. Therefore, no provision for federal or state income tax is required.
Tax positions taken or expected to be taken in the course of preparing the Fund’s tax returns are evaluated to determine whether the tax positions are “more-likely-than-not” of being sustained by the applicable tax authority. Tax positions not deemed to meet the more-likely-than-not threshold would be recorded as a tax benefit or expense in the current year. Management has analyzed the Fund’s tax positions taken, or to be taken, on Federal income tax returns for all open tax years (fiscal years 2009–2012), and has concluded that no provision for income tax is required in the Fund’s financial statements.
The RIC Modernization Act of 2010 was signed into law on December 22, 2010 and simplified some of the tax provisions applicable to regulated investment companies and the tax reporting to their shareholders, and improved the tax efficiency of certain fund structures. The changes were generally effective for taxable years beginning after the date of enactment.
One of the more prominent changes addresses capital loss carry forwards. The Fund is permitted to carry forward capital losses incurred in taxable years beginning after December 22, 2010 for an unlimited period. However, any losses incurred during those future taxable years will be required to be utilized prior to the losses incurred in pre-enactment taxable years. Under pre-enactment law, capital losses could be carried forward for eight years, and carried forward as short-term capital, irrespective of the character of the original loss. As a result of this ordering rule, pre-enactment capital loss carry forwards may potentially expire unused. Additionally, post-enactment capital losses that are carried forward will retain their character as either short-term or long-term capital losses rather than being considered all short-term as under previous law.
Tax basis capital losses in excess of capital gains are carried forward to offset future net capital gains. For the year ended December 31, 2012, the following capital loss carryforward amounts expired, were used, or were permanently lost due to loss limitation rules in Section 382 of the Internal Revenue Code:
| Fund | | | Amount | |
| Managed Futures Strategy Fund | | $ | — | |
The tax character of distributions paid during the year ended December 31, 2012, was as follows:
| | | | Ordinary | | | | Long-Term | | | | Total | |
| Fund | | | Income | | | | Capital Gain | | | | Distributions | |
| Managed Futures Strategy Fund | | $ | — | | | $ | — | | | $ | — | |
| 22 | THE GUGGENHEIM FUNDS ANNUAL REPORT |
NOTES TO CONSOLIDATED FINANCIAL STATEMENTS (continued)
The tax character of distributions paid during the year ended December 31, 2011, was as follows:
| | | | Ordinary | | | | Long-Term | | | | Total | |
| Fund | | | Income | | | | Capital Gain | | | | Distributions | |
| Managed Futures Strategy Fund | | $ | — | | | $ | — | | | $ | — | |
Note: For federal income tax purposes, short term capital gain distributions are treated as ordinary income distributions.
The tax character of distributable earnings/(accumulated losses) at December 31, 2012, was as follows:
| | | Undistributed | | | Undistributed | | | Net Unrealized | | | | |
| | | Ordinary | | | Long-Term | | | Appreciation/ | | | Capital Loss | |
| Fund | | Income | | | Capital Gain | | | Depreciation | | | Carryforward | |
| Managed Futures Strategy Fund | | $ | — | | | $ | — | | | $ | 10,501,500 | | | $ | (109,898,117 | )1 |
Capital Loss Carryforward amounts may be limited due to Federal income tax regulations.
| 1 | A summary of the expiration of the aforementioned Capital Loss Carryforward is as follows: |
| | | | | | | | | | | | | | | Total | |
| | | Expires in | | | Expires in | | | Unlimited | | | Capital Loss | |
| Fund | | 2017 | | | 2018 | | | Short Term | | | Long Term | | | Carryforward | |
| Managed Futures Strategy Fund | | $ | (9,859,364 | ) | | $ | (42,873,423 | ) | | $ | (13,965,201 | ) | | $ | (43,200,129 | ) | | $ | (109,898,117 | ) |
Net investment income and net realized gains (losses) may differ for financial statement and tax purposes because of temporary or permanent book/tax differences. These differences are primarily due to mark-to-market of futures contracts, foreign currency gains and losses, and post-October losses. Additional differences may result from the tax treatment of net investment losses and expired capital loss carryforwards. To the extent these differences are permanent, reclassifications are made to the appropriate equity accounts in the period that the differences arise. These reclassifications have no effect on net assets or NAV per share.
On the Statement of Assets and Liabilities the following adjustments were made for permanent book/tax differences:
| | | Paid In | | | Net Investment | | | Net Realized | |
| Fund | | Capital | | | Income | | | gain | |
| Managed Futures Strategy Fund | | $ | (187,842,571 | ) | | $ | 30,916,492 | | | $ | 156,926,079 | |
At December 31, 2012, the cost of securities for Federal income tax purposes, the aggregate gross unrealized gain for all securities for which there was an excess of value over tax cost and the aggregate gross unrealized loss for all securities for which there was an excess of tax cost over value, were as follows:
| | | | | | Tax | | | Tax | | | Net | |
| | | Tax | | | Unrealized | | | Unrealized | | | Unrealized | |
| Fund | | Cost | | | gain | | | Loss | | | Loss | |
| Managed Futures Strategy Fund | | $ | 830,606,143 | | | $ | 178,584 | | | $ | (1,987,409 | ) | | $ | (1,808,825 | ) |
Pursuant to Federal income tax regulations applicable to investment companies, the Fund has elected to treat net capital losses and certain ordinary losses realized between November 1 and December 31 of each year as occurring on the first day of the following tax year. For the year ended December 31, 2012, the following losses reflected in the accompanying financial statements were deferred for Federal income tax purposes until January 1, 2013:
| Fund | | Ordinary | | | Capital | |
| Managed Futures Strategy Fund | | $ | 10,122 | | | $ | 9,209,032 | |
9. Securities Transactions
For the year ended December 31, 2012, the cost of purchases and proceeds from sales of investment securities, excluding government securities and short-term investments, were as follows:
| Fund | | Purchases | | | Sales | |
| Managed Futures Strategy Fund | | $ | 92,930,214 | | | $ | 100,000,000 | |
| THE GUGGENHEIM FUNDS ANNUAL REPORT | 23 |
NOTES TO CONSOLIDATED FINANCIAL STATEMENTS (continued)
10. Line of Credit
The Trust, along with other affiliated Trust, secured an uncommitted, $75,000,000 line of credit from U.S. Bank, N.A., which expires June 15, 2013. This line of credit is reserved for emergency or temporary purposes. Borrowings, if any, under this arrangement bear interest equal to the Prime Rate, minus 2%, which shall be paid monthly, averaging 1.25% for the year ended December 31, 2012. The Fund did not have any borrowings under this agreement at December 31, 2012.
The average daily balance borrowed for the year ended December 31, 2012 was as follows:
| Fund | | Average Daily Balance | |
| Managed Futures Strategy Fund | | $ | 30,440 | |
11. Portfolio Securities Loaned
The Funds may lend their securities to approved brokers to earn additional income. Security lending income shown on the statement of operations is shown net of rebates paid to the borrowers and earnings on cash collateral investments shared with the lending agent. Within this arrangement, the Funds act as the lender, Credit Suisse acts as the lending agent, and other approved registered broker dealers act as the borrowers. The Funds receive cash collateral, valued at 102% of the value of the securities on loan. Under the terms of the Funds’ securities lending agreement with Credit Suisse, cash collateral is invested in one or more joint repurchase agreements collateralized by obligations of the U.S. Treasury or Government Agencies and cash. The Funds bear the risk of loss on cash collateral investments. Collateral is maintained over the life of the loan in an amount not less than the value of loaned securities, as determined at the close of fund business each day; any additional collateral required due to changes in security values is delivered to the Funds the next business day. Although the collateral mitigates the risk, the Funds could experience a delay in recovering its securities and a possible loss of income or value if the borrower fails to return the securities. The Funds have the right under the securities lending agreement to recover the securities from the borrower on demand.
At December 31, 2012, the Funds participated in securities lending as follows:
| | | Value of | | | Cash | |
| Fund | | Securities Loaned | | | Collateral Received | |
| Managed Futures Strategy Fund | | $ | 1,486,613 | | | $ | 1,523,525 | |
The following represents a breakdown of the collateral for the joint repurchase agreements at December 31, 2012:
| Counterparty and Terms of Agreement | | Face Value | | | Repurchase Price | | | Collateral | | | Par Value | | | Fair Value | |
| Merrill Lynch, Pierce, Fenner & Smith, Inc. | | | | | | | | | | | Fannie Mae | | | | | | | | | |
| 0.16% | | | | | | | | | | | 1.00% | | | | | | | | | |
| Due 01/02/13 | | $ | 56,000,000 | | | $ | 56,000,498 | | | | 09/20/17 | | | $ | 17,736,000 | | | $ | 17,748,238 | |
| | | | | | | | | | | | U.S. Treasury Note | | | | | | | | | |
| | | | | | | | | | | | 0.25% | | | | | | | | | |
| | | | | | | | | | | | 08/15/15 | | | | 39,359,000 | | | | 39,285,202 | |
| RBS Securities, Inc. | | | | | | | | | | | Freddie Mac | | | | | | | | | |
| 0.20% | | | | | | | | | | | 1.00% | | | | | | | | | |
| Due 01/02/13 | | | 35,542,000 | | | | 35,542,395 | | | | 03/08/17 | | | | 10,481,300 | | | | 10,618,396 | |
| | | | | | | | | | | | Fannie Mae | | | | | | | | | |
| | | | | | | | | | | | 6.25% | | | | | | | | | |
| | | | | | | | | | | | 05/15/29 | | | | 13,845,000 | | | | 20,014,471 | |
| | | | | | | | | | | | Federal Home Loan Bank | | | | | | | | | |
| | | | | | | | | | | | 0.375% | | | | | | | | | |
| | | | | | | | | | | | 10/18/13 | | | | 7,935,000 | | | | 7,947,298 | |
| | | | | | | | | | | | U.S. Treasury Note | | | | | | | | | |
| | | | | | | | | | | | 1.75% | | | | | | | | | |
| | | | | | | | | | | | 05/15/22 | | | | 39,050,000 | | | | 39,504,544 | |
| | | | | | | | | | | | Cash | | | | 38,815,000 | | | | 38,815,000 | |
12. Legal Proceedings
Tribune Company
Rydex Series Funds has been named as a defendant and a putative member of the proposed defendant class of shareholders in the case entitled Official Committee of Unsecured Creditors of Tribune Co. v. FitzSimons, No. 12-2652 (S.D.N.Y.) (formerly Adv. Pro. No. 10-54010 (Bankr. D. Del.)) (the “FitzSimons” Action), as a result of ownership of shares in the Tribune Company (“Tribune”) in 2007 by certain series of
| 24 | THE GUGGENHEIM FUNDS ANNUAL REPORT |
NOTES TO CONSOLIDATED FINANCIAL STATEMENTS (concluded)
the Rydex Series Funds when Tribune effected a leveraged buyout transaction (“LBO”) by which Tribune converted to a privately-held company. In its complaint, the Unsecured Creditors Committee (the “UCC”) has alleged that, in connection with the LBO, insiders and shareholders were overpaid for their Tribune stock using financing that the insiders knew would, and ultimately did, leave the Tribune insolvent. The UCC has asserted claims against certain insiders, shareholders, professional advisers, and others involved in the LBO, and is attempting to obtain from these individuals and entities the proceeds paid out in connection with the LBO.
Rydex Series Funds also has been named as a defendant in one or more of a group of lawsuits filed by a group of Tribune creditors that allege state law constructive fraudulent conveyance claims against former Tribune shareholders (the “SLCFC actions”).
The FitzSimons action and the SLCFC actions have been consolidated with the majority of the other Tribune LBO-related lawsuits in a multidistrict litigation proceeding captioned In re Tribune Company Fraudulent Conveyance Litig., No. 11-md-2696 (S.D.N.Y.) (the “MDL Proceeding”). On November 6, 2012, the defendants moved to dismiss the SLCFC actions. On December 21, 2012, the plaintiffs filed a memorandum in opposition to the motion to dismiss. On February 4, 2013, the defendants filed a reply in support of the motion to dismiss. The Court has not yet issued a decision on the motion.
None of these lawsuits allege any wrongdoing on the part of Rydex Series Funds. The following series of Rydex Series Funds held shares of Tribune and tendered these shares as part of Tribune’s LBO: Nova Fund, S&P 500 Pure Value Fund, Multi-Cap Core Equity Fund, S&P 500 Fund, Multi-Hedge Strategies Fund and Hedged Equity Fund (the “Funds”). The value of the proceeds received by the foregoing Funds was $28,220, $109,242, $9,860, $3,400, $1,181,160, and $10,880, respectively. At this stage of the proceedings, Rydex Series Funds is not able to make a reliable predication as to the outcome of these lawsuits or the effect, if any, on a Fund’s net asset value.
Lyondell Chemical Company
In December 2011, Rydex Series Funds was named as a defendant in Weisfelner, as Trustee of the LB Creditor Trust, v. Fund 1 (In re Lyondell Chemical Co.), Adv. Pro. No. 10-4609 (Bankr. S.D.N.Y.).
Similar to the claims made in the Tribune matter, the Weisfelner complaint seeks to have set aside and recovered as fraudulent transfers from former Lyondell Chemical Company (“Lyondell”) shareholders the consideration paid to them pursuant to the cash out merger of Lyondell shareholders in connection with the combination of Lyondell and Basell AF in 2007. Lyondell filed for bankruptcy in 2008.
A motion to dismiss is currently pending before the Bankruptcy Court.
This lawsuit does not allege any wrongdoing on the part of Rydex Series Funds. The following series of Rydex Series Funds received cash proceeds from the cash out merger in the following amounts: Basic Materials Fund - $ 1,725,168; U.S. Long Short Momentum Fund - $2,193,600; Global 130/30 Strategy Fund - $37,920; Hedged Equity Fund - $1,440; and Multi-Hedge Strategies Fund - $1,116,480. At this stage of the proceedings, Rydex Series Funds is not able to make a reliable predication as to the outcome of these lawsuits or the effect, if any, on a Fund’s net asset value.
13. Subsequent Events
Strategy Change
At a meeting held on November 19, 2012, the Board of Trustees (the “Board”) of Rydex Series Funds (the “Trust”) approved a revised investment objective and revised principal investment strategies for the Managed Futures Strategy Fund. The revisions to the Fund’s principal investment strategies are primarily intended to diversify the Fund’s investment exposure by broadening the variety of investment strategies it may pursue in seeking to achieve its investment objective. Therefore, effective January 29, 2013, the changes noted above will apply to the Fund.
The changes to the Fund’s investment objective, principal investment strategies, and principal risks will not result in an increase in the Fund’s fees. The changes may decrease the Fund’s expenses due to a reduction of the current index licensing fee paid by the Fund. Please read the Fund’s prospectus for more information on these changes.
Distributor Name Change
Effective January 1, 2013, Rydex Distributors LLC changed its name to Guggenheim Distributors, LLC. The name change marks another step in the business integration process following the acquisition of Rydex by Guggenheim announced last year. The name change should not result in any material change to the day-to-day management or operations of the funds.
| THE GUGGENHEIM FUNDS ANNUAL REPORT | 25 |
REPORT OF INDEPENDENT REGISTERED PUBLIC ACCOUNTING FIRM
To the Board of Trustees and Shareholders
of Rydex Series Funds:
We have audited the accompanying consolidated statement of assets and liabilities of the Managed Futures Strategy Fund (one of the series constituting the Rydex Series Funds) (the “Fund”), including the consolidated schedule of investments, as of December 31, 2012, and the related consolidated statement of operations for the year then ended, the consolidated statements of changes in net assets for each of the two years in the period then ended, and the financial highlights for each of the years or periods indicated therein (consolidated for the years or periods ended December 31, 2012, 2011, 2010, 2009, and 2008). These consolidated financial statements and financial highlights are the responsibility of the Fund’s management. Our responsibility is to express an opinion on these consolidated financial statements and financial highlights based on our audits.
We conducted our audits in accordance with the standards of the Public Company Accounting Oversight Board (United States). Those standards require that we plan and perform the audit to obtain reasonable assurance about whether the financial statements and financial highlights are free of material misstatement. We were not engaged to perform an audit of the Fund’s internal control over financial reporting. Our audits included consideration of internal control over financial reporting as a basis for designing audit procedures that are appropriate in the circumstances, but not for the purpose of expressing an opinion on the effectiveness of the Fund’s internal control over financial reporting. Accordingly, we express no such opinion. An audit also includes examining, on a test basis, evidence supporting the amounts and disclosures in the financial statements and financial highlights, assessing the accounting principles used and significant estimates made by management, and evaluating the overall financial statement presentation. Our procedures included confirmation of securities owned as of December 31, 2012, by correspondence with the custodian and brokers. We believe that our audits provide a reasonable basis for our opinion.
In our opinion, the consolidated financial statements and financial highlights referred to above present fairly, in all material respects, the consolidated financial position of the Managed Futures Strategy Fund at December 31, 2012, the consolidated results of its operations for the year then ended, the consolidated changes in its net assets for each of the two years in the period then ended, and its financial highlights for each of the years or periods indicated therein (consolidated for the years or periods ended December 31, 2012, 2011, 2010, 2009, and 2008), in conformity with U.S. generally accepted accounting principles.

McLean, Virginia
February 27, 2013
| 26 | THE GUGGENHEIM FUNDS ANNUAL REPORT |
OTHER INFORMATION (Unaudited)
Proxy Voting Information
A description of the policies and procedures that the Trust uses to determine how to vote proxies relating to securities held in the Funds’ portfolios is available, without charge and upon request, by calling 1.800.820.0888. This information is also available from the EDGAR database on the SEC’s website at http://www.sec.gov.
Information regarding how the Funds voted proxies relating to portfolio securities during the most recent 12-month period ended June 30 is available without charge, upon request, by calling 1.800.820.0888. This information is also available from the EDGAR database on the SEC’s website at http://www.sec.gov.
Quarterly Portfolio Schedules Information
The Trust files its complete schedule of portfolio holdings with the SEC for the first and third quarters of each fiscal year on Form N-Q; which are available on the SEC’s website at http://www.sec.gov. The Funds’ Forms N-Q may be reviewed and copied at the SEC’s Public Reference Room in Washington, DC, and that information on the operation of the Public Reference Room may be obtained by calling 1-800-SEC-0330. Copies of the portfolio holdings are also available to shareholders, without charge and upon request, by calling 1.800.820.0888.
Office Locations
The offices of Guggenheim Investments can be found in the following locations:
40 East 52nd Street
16th Floor
New York, NY 10022
(Headquarters)
Four Irvington Centre
805 King Farm Boulevard
Suite 600
Rockville, MD 20850
9401 Indian Creek Parkway
40 Corporate Woods
Suite 850
Overland Park, KS 66210
| THE GUGGENHEIM FUNDS ANNUAL REPORT | 27 |
INFORMATION on board of trustees and officers (Unaudited)
A Board of Trustees oversees the Trust, as well as other trusts of GI, in which its members have no stated term of service, and continue to serve after election until resignation. The Statement of Additional Information includes further information about Fund Trustees and Officers, and can be obtained without charge by calling 800.820.0888.
All Trustees and Officers may be reached c/o Guggenheim Investments, 805 King Farm Boulevard, Suite 600, Rockville, MD 20850.
TRUSTEE AND OFFICER
| | | Length of Service | | |
| Name and | | as Trustee | | Number of Funds |
| Year of Birth | | (Year Began) | | Overseen |
| Donald C. Cacciapaglia* | | Rydex Series Funds – 2012 | | 146 |
| (1951) | | Rydex Variable Trust – 2012 | | |
| | | Rydex Dynamic Funds – 2012 | | |
| | | Rydex ETF Trust – 2012 | | |
Principal Occupations During Past Five Years: Current: Security Investors, LLC: President and CEO from April 2012 to present; Guggenheim Investments: President and Chief Administrative Officer from February 2010 to present; Previous: Channel Capital Group, Inc.: Chairman and CEO from April 2002 to February 2010
`
Positions held within the Trust: Trustee from 2012 to present; President from 2012 to present
INDEPENDENT TRUSTEES
| | | Length of Service | | |
| Name and | | as Trustee | | Number of Funds |
| Year of Birth | | (Year Began) | | Overseen |
| Corey A. Colehour | | Rydex Series Funds – 1993 | | 146 |
| (1945) | | Rydex Variable Trust – 1998 | | |
| | | Rydex Dynamic Funds – 1999 | | |
| | | Rydex ETF Trust – 2003 | | |
Principal Occupations During Past Five Years: Current: Retired; Previous: President and Senior Vice President of Schield Management Company (registered investment adviser) from 2003 to 2006
Positions held within the Trust: Trustee from 1993 to present; Member of the Audit and Governance and Nominating Committees from 1995 to present
| J. Kenneth Dalton | | Rydex Series Funds – 1995 | | 146 |
| (1941) | | Rydex Variable Trust – 1998 | | |
| | | Rydex Dynamic Funds – 1999 | | |
| | | Rydex ETF Trust – 2003 | | |
Principal Occupations During Past Five Years: Current: Retired
Positions held within the Trust: Trustee from 1995 to present; Member and Chairman of the Audit Committee from 1997 to present; Member of the Governance and Nominating Committees from 1995 to present; and Member of the Risk Oversight Committee from 2010 to present
| John O. Demaret | | Rydex Series Funds – 1997 | | 146 |
| (1940) | | Rydex Variable Trust – 1998 | | |
| | | Rydex Dynamic Funds – 1999 | | |
| | | Rydex ETF Trust – 2003 | | |
Principal Occupations During Past Five Years: Current: Retired
Positions held within the Trust: Trustee from 1997 to present; Chairman of the Board from 2006 to present; Member of the Audit Committee from 1997 to present; and Member of the Risk Oversight Committee from 2010 to present
| 28 | THE GUGGENHEIM FUNDS ANNUAL REPORT |
INFORMATION ON BOARD OF TRUSTEES AND OFFICERS (Unaudited) (continued)
INDEPENDENT TRUSTEES - concluded
| Name and | | Length of Service as Trustee | | Number of Funds |
| Year of Birth | | (Year Began) | | Overseen |
| Werner E. Keller | | Rydex Series Funds – 2005 | | 146 |
| (1940) | | Rydex Variable Trust – 2005 | | |
| | | Rydex Dynamic Funds – 2005 | | |
| | | Rydex ETF Trust – 2005 | | |
Principal Occupations During Past Five Years: Current: Founder and President of Keller Partners, LLC (investment research firm) from 2005 to present; Previous: Retired from 2001 to 2005
Positions held within the Trust: Vice Chairman of the Board of Trustees from 2010 to present; Trustee and Member of the Audit and Governance and Nominating Committees from 2005 to present; and Chairman and Member of the Risk Oversight Committee from 2010 to present
| Thomas F. Lydon, Jr. | | Rydex Series Funds – 2005 | | 146 |
| (1960) | | Rydex Variable Trust – 2005 | | |
| | | Rydex Dynamic Funds – 2005 | | |
| | | Rydex ETF Trust – 2005 | | |
Principal Occupations During Past Five Years: Current: President of Global Trends Investments (registered investment adviser) from 1996 to present
Positions held within the Trust: Trustee and Member of the Audit and Governance and Nominating Committees from 2005 to present
| Patrick T. McCarville | | Rydex Series Funds – 1997 | | 146 |
| (1942) | | Rydex Variable Trust – 1998 | | |
| | | Rydex Dynamic Funds – 1999 | | |
| | | Rydex ETF Trust – 2003 | | |
Principal Occupations During Past Five Years: Current: Retired; Previous: Chief Executive Officer of Par Industries, Inc., d/b/a Par Leasing from 1977 to 2010
Positions held within the Trust: Trustee from 1997 to present; Member of the Audit Committee from 1997 to present; and Chairman of the Governance and Nominating Committees from 1997 to present
| Roger Somers | | Rydex Series Funds – 1993 | | 146 |
| (1944) | | Rydex Variable Trust – 1998 | | |
| | | Rydex Dynamic Funds – 1999 | | |
| | | Rydex ETF Trust – 2003 | | |
Principal Occupations During Past Five Years: Current: Founder and Chief Executive Officer of Arrow Limousine from 1965 to present
Positions held within the Trust: Trustee from 1993 to present; Member of the Audit and Governance and Nominating Committees from 1995 to present
| THE GUGGENHEIM FUNDS ANNUAL REPORT | 29 |
INFORMATION ON BOARD OF TRUSTEES AND OFFICERS (Unaudited) (concluded)
EXECUTIVE OFFICERS
| Name, Position and | | | Principal Occupations | |
| Year of Birth | | | During Past Five Years | |
Michael P. Byrum*
Vice President (1970) | Current: President, Security Benefit Asset Management Holdings, LLC; Senior Vice President, Security Investors, LLC; President & Chief Investment Officer, Rydex Holdings, LLC; Director & Chairman of the Board, Advisor Research Center, Inc.; and Manager, Rydex Specialized Products, LLC |
| | |
| | Previous: Guggenheim Distributors, LLC (f/k/a Rydex Distributors, LLC), Vice President (2009); Rydex Fund Services, LLC, Director (2009–2010), Secretary (2002–2010), Executive Vice President (2002–2006); Rydex Advisors, LLC (f/k/a PADCO Advisors, Inc.), Director (2008–2010), Chief Investment Officer (2006–2010), President (2004–2010), Secretary (2002–2010); Rydex Advisors II, LLC (f/k/a PADCO Advisors II, Inc.), Director (2008-2010), Chief Investment Officer (2006-2010), President (2004–2010), Secretary (2002–2010); Rydex Capital Partners, LLC, President & Secretary (2003–2007); Rydex Capital Partners II, LLC, (2003–2007); Rydex Holdings, LLC (f/k/a Rydex Holdings, Inc.), Secretary (2005–2008), Executive Vice President (2005–2006); Advisor Research Center, Inc., Secretary (2006–2009), Executive Vice President (2006); and Rydex Specialized Products, LLC, Secretary (2005–2008) |
| | |
Nikolaos Bonos*
Vice President and Treasurer (1963) | Current: Senior Vice President, Security Investors, LLC; Chief Executive Officer & Manager, Rydex Specialized Products, LLC; Chief Executive Officer & President, Rydex Fund Services, LLC; Vice President, Rydex Holdings, LLC; Treasurer, SBL Fund; Security Equity Fund; Security Income Fund; Security Large Cap Value Fund & Security Mid Cap Growth Fund; and Vice President, Security Benefit Asset Management Holdings, LLC |
| | |
| | Previous: Security Global Investors, LLC, Senior Vice President (2010–2011); Rydex Advisors, LLC (f/k/a PADCO Advisors, Inc.) Senior Vice President (2006–2011); Rydex Fund Services, LLC (f/k/a Rydex Fund Services, Inc.), Director (2009) & Senior Vice President (2003–2006); and Rydex Specialized Products, LLC, Chief Financial Officer (2005–2009) |
| | |
Elisabeth Miller*
Chief Compliance Officer (1968) | Current: Chief Compliance Officer, Rydex Series Funds, Rydex Dynamic Funds, Rydex Variable Trust, Rydex ETF Trust, Security Equity Fund, Security Income Fund, Security Large Cap Value Fund, Security Mid Cap Growth Fund, SBL Fund, Security Investors, LLC, and Guggenheim Distributors, LLC |
| | |
| | Previous: Senior Manager, Security Investors, LLC and Guggenheim Distributors, LLC (2004–2009) |
| | |
Amy J. Lee*
Vice President and Assistant Secretary (1961) | Current: Senior Vice President & Secretary, Security Investors, LLC; Secretary & Chief Compliance Officer, Security Distributors, Inc.; Vice President, Associate General Counsel & Assistant Secretary, Security Benefit Life Insurance Company and Security Benefit Corporation; Associate General Counsel, First Security Benefit Life Insurance and Annuity of New York; Vice President & Secretary, SBL Fund; Security Equity Fund; Security Income Fund; Security Large Cap Value Fund & Security Mid Cap Growth Fund; Vice President & Secretary, Rydex Holdings, LLC Secretary, Advisor Research Center, Inc., Rydex Specialized Products, LLC, Guggenheim Distributors, LLC and Rydex Fund Services, LLC; and Assistant Secretary, Security Benefit Clinic and Hospital |
| | |
| | Previous: Security Global Investors, LLC, Senior Vice President & Secretary (2007–2011); Rydex Advisors, LLC (f/k/a PADCO Advisors, Inc.) & Rydex Advisors II, LLC (f/k/a PADCO Advisors II, Inc.), Senior Vice President & Secretary (2010–2011); and Brecek & Young Advisors, Inc., Director (2004–2008) |
| | |
Joseph M. Arruda*
Assistant Treasurer (1966) | Current: Assistant Treasurer, SBL Fund; Security Equity Fund; Security Income Fund; Security Large Cap Value Fund & Security Mid Cap Growth Fund; Vice President, Security Investors, LLC; and Chief Financial Officer & Manager, Rydex Specialized Products, LLC |
| | |
| | Previous: Security Global Investors, LLC, Vice President (2010–2011); and Rydex Advisors, LLC (f/k/a PADCO Advisors, Inc.) & Rydex Advisors II, LLC (f/k/a PADCO Advisors II, Inc.), Vice President (2004–2011) |
| * | Officers of the Funds are deemed to be “interested persons” of the Trust, within the meaning of Section 2(a)(19) of the 1940 Act, inasmuch as this person is affiliated with Guggenheim Investments. |
| 30 | THE GUGGENHEIM FUNDS ANNUAL REPORT |
GUGGENHEIM INVESTMENTS PRIVACY POLICIES
Rydex Funds, Guggenheim Funds, Rydex Investments, Guggenheim Distributors, Inc., Security Investors, LLC, Security Distributors, Inc. and Rydex Advisory Services (Collectively “Guggenheim Investments”)
Our Commitment to You
When you become a Guggenheim Investments investor, you entrust us with not only your hard-earned money but also with personal and financial information about you. We recognize that your relationship with us is based on trust and that you expect us to act responsibly and in your best interests. Because we have access to this private information about you, we hold ourselves to the highest standards in its safekeeping and use. This means, most importantly, that we do not sell client information to anyone—whether it is your personal information or if you are a current or former Guggenheim Investments client.
The Information We Collect About You
In the course of doing business with shareholders and investors, we collect nonpublic personal information about you. You typically provide personal information when you complete a Guggenheim Investments account application or when you request a transaction that involves Rydex and Guggenheim Investments funds or one of the Guggenheim Investments affiliated companies. “Nonpublic personal information” is personally identifiable private information about you. For example, it includes information regarding your name and address, Social Security or taxpayer identification number, assets, income, account balance, bank account information and investment activity (e.g., purchase and redemption history).
How We Handle Your Personal Information
As emphasized above, we do not sell information about current or former clients or their accounts to third parties. Nor do we share such information, except when necessary to complete transactions at your request or to make you aware of related investment products and services that we offer. Additional details about how we handle your personal information are provided below. To complete certain transactions or account changes that you direct, it may be necessary to provide identifying information to companies, individuals or groups that are not affiliated with Guggenheim Investments. For example, if you ask to transfer assets from another financial institution to Guggenheim Investments, we will need to provide certain information about you to that company to complete the transaction. To alert you to other Guggenheim Investments investment products and services, we may share your information within the Guggenheim Investments family of affiliated companies. This would include, for example, sharing your information within Guggenheim Investments so we can make you aware of new Rydex and Guggenheim Investments funds or the services offered through another Guggenheim Investments affiliated company. In certain instances, we may contract with nonaffiliated companies to perform services for us. Where necessary, we will disclose information we have about you to these third parties. In all such cases, we provide the third party with only the information necessary to carry out its assigned responsibilities and only for that purpose. And we require these third parties to treat your private information with the same high degree of confidentiality that we do. In certain instances, we may share information with other financial institutions regarding individuals and entities in response to the U.S.A. Patriot Act. Finally, we will release information about you if you direct us to do so, if we are compelled by law to do so or in other circumstances permitted by law.
Opt Out Provisions
We do not sell your personal information to anyone. The law allows you to “opt out” of only certain kinds of information sharing with third parties. The firm does not share personal information about you with any third parties that triggers this opt-out right. This means YOU ARE ALREADY OPTED OUT.
How We Protect Privacy Online
Our concern for the privacy of our shareholders also extends to those who use our web site, guggenheiminvestments.com. Our web site uses some of the most secure forms of online communication available, including encryption technology, Secure Socket Layer (SSL) protocol, firewalls and user names and passwords. These technologies provide a high level of security and privacy when you access your account information or initiate online transactions. The Guggenheim Investments web site offers customized features that require our use of “http cookies”—tiny pieces of information that we ask your browser to store. However, we make very limited use of these cookies. We only use cookies for session management and security features on the Guggenheim Investments web site. We do not use them to pull data from your hard drive, to learn your email address, or to view data in cookies created by other web sites. We will not share the information in our cookies or give others access to it. See the legal information area on our web site for more details about web site security and privacy features.
| THE GUGGENHEIM FUNDS ANNUAL REPORT | 31 |
GUGGENHEIM INVESTMENTS PRIVACY POLICIES (concluded)
How We Safeguard Your Personal Information
We restrict access to nonpublic personal information about shareholders to our employees and in some cases to third parties (for example, the service providers described above) as permitted by law. We maintain strict physical, electronic and procedural safeguards that comply with federal standards to guard your nonpublic personal information.
We’ll Keep You Informed
As required by federal law, we will notify shareholders of our privacy policy annually. We reserve the right to modify this policy at any time, but rest assured that if we do change it, we will tell you promptly. You will also be able to access our privacy policy from our web site at guggenheiminvestments.com. Should you have any questions regarding our privacy policy, contact us at 800.820.0888 or 301.296.5100.
| 32 | THE GUGGENHEIM FUNDS ANNUAL REPORT |
This page intentionally left blank.
This page intentionally left blank.
This page intentionally left blank.
This page intentionally left blank.
This page intentionally left blank.
GUGGENHEIM ALTERNATIVE INVESTMENT FUNDS
GUGGENHEIM LONG/SHORT COMMODITIES STRATEGY FUND
GUGGENHEIM GLOBAL MANAGED FUTURES STRATEGY FUND
GUGGENHEIM MULTI-HEDGE STRATEGIES FUND
RYDEX SPECIALTY FUND
RYDEX COMMODITIES STRATEGY FUND
RDXSGIALT-ANN-1212x1213
GO GREEN!
ELIMINATE MAILBOX CLUTTER
Go paperless with Guggenheim Investments eDelivery—a service giving you full online access to account information and documents. Save time, cut down on mailbox clutter and be a friend to the environment with eDelivery.
With Guggenheim Investments eDelivery you can:
| • | View online confirmations and statements at your convenience. |
| • | Receive email notifications when your most recent confirmations, statements and other account documents are available for review. |
| • | Access prospectuses, annual reports and semiannual reports online. |

If you have questions about Guggenheim Investments eDelivery services, contact one of our Shareholder Service Representatives at 800.820.0888.

This report and the financial statements contained herein are submitted for the general information of our shareholders. The report is not authorized for distribution to prospective investors unless preceded or accompanied by an effective prospectus.
Distributed by Guggenheim Distributors, LLC.
| the GUGGENHEIM FUNDS annual report | 1 |
Dear Shareholder:
Security Investors, LLC (the “Investment Adviser”) is pleased to present the annual shareholder report for four alternative strategies that are part of the Rydex Series Funds.
The Investment Adviser is a part of Guggenheim Investments, which represents the investment management businesses of Guggenheim Partners, LLC, a global, diversified financial services firm.
This report covers performance of the following Funds for the period ended December 31, 2012:
– Long Short Commodities Strategy Fund
– Global Managed Futures Strategy Fund
– Multi-Hedge Strategies Fund
– Commodities Strategy Fund
Guggenheim Distributors, LLC, is the distributor of the Funds. Guggenheim Distributors, LLC is affiliated with Guggenheim Partners, LLC and Security Investors, LLC.
We encourage you to read the Economic and Market Overview section of the report, which follows this letter, and then the Performance Report for each Fund.
We are committed to providing innovative investment solutions and appreciate the trust you place in us.
Sincerely,

Donald C. Cacciapaglia
President
January 31, 2013
Read each fund’s prospectus and summary prospectus (if available) carefully before investing. It contains the fund’s investment objectives, risks, charges, expenses and other information, which should be considered carefully before investing. Obtain a prospectus and summary prospectus (if available) at guggenheiminvestments.com or call 800.820.0888.
Alternative funds may not be suitable for all investors. • A Fund’s use of derivatives, such as futures, options, structured notes and swap agreements, may expose the Fund to additional risks that it would not be subject to if it invested directly in the securities or investments underlying those derivatives. • The more a Fund invests in leveraged instruments, the more the leverage will magnify any gains or losses on those investments. • A Fund’s use of short selling involves increased risk and costs. A Fund risks paying more for a security than it received from its sale. Theoretically, securities sold short have the risk of unlimited losses • A Fund’s exposure to the commodity markets may subject the fund to greater volatility as commodity-linked investments may be affected by changes in overall market movements, commodity index volatility, changes in interest rates or factors affecting a particular industry or commodity—such as droughts, floods, weather, embargos, tariffs and international economic, political and regulatory developments. • A Fund’s fixed income investments will change in value in response to interest rate changes and other factors. • A Fund may invest in securities of foreign companies directly or indirectly through the use of other investment companies and financial instruments that are linked to the performance of foreign issuers. Foreign securities markets generally have less trading volume and less liquidity than U.S. markets, and prices in some foreign markets may fluctuate more than those of securities traded in U.S. markets. • A Fund is considered non-diversified and can invest a greater portion of its assets in securities of individual issuers than a diversified fund. As a result, changes in the market value of a single security could cause greater fluctuations in the value of Fund shares than would occur in a more diversified fund. • See the prospectus for more information on these and additional risks.
| 2 | the GUGGENHEIM FUNDS annual report |
| ECONOMIC AND MARKET OVERVIEW | December 31, 2012 |
The U.S. economy is reaching “escape velocity,” powered by the monetary rocket fuel from central banks around the world. Almost every domestic economic indicator is now positive and the economic backdrop is stronger than it has been in the last seven years.
Markets have now begun focusing on the U.S. debt ceiling debate, following Congress’ New Year’s reprieve on the Fiscal Cliff. Despite the uncertainty created by political partisanship in Washington, the strength of recent U.S. economic data demonstrates the resilience of the current U.S. economic expansion, including improvements in industrial production, initial jobless claims, third quarter GDP and continued recovery in the housing market. Investors can expect a continuation of the themes that have dominated the environment since the recovery began: tighter credit spreads, low interest rates, improving employment, modest inflation, and sustained economic growth.
Although Europe remains in a recession, more importantly, the political process towards fiscal unity appears to be underway with the initial steps taken towards the creation of a banking union. This has, for the time being, eliminated the worst-case scenario – an unwinding of the European Union. As the structural outlook in Europe improves, albeit at a glacial pace, tail risk, the possibility that an unlikely event will occur and cause a very large loss, is significantly mitigated. In China, along with the transition in political leadership, there are positive signs that the country may also have passed the bottom in the economic cycle, which could also be good news for emerging markets.
For the 12-month period ended December 31, 2012, the Standard & Poor’s 500 (“S&P 500”) Index*, which is generally regarded as an indicator of the broad U.S. stock market, returned 16.00%. Foreign markets were even stronger: the Morgan Stanley Capital International (“MSCI”) Europe-Australasia-Far East (“EAFE”) Index*, which is composed of approximately 1,100 companies in 20 developed countries in Europe and the Pacific Basin, returned 17.32%. The return of the MSCI Emerging Markets Index*, which measures market performance in global emerging markets, was 21.93%.
In the bond market, higher quality issues underperformed lower-rated bonds, as investors embraced risk. The Barclays U.S. Aggregate Bond Index*, which is a proxy for the U.S. investment grade bond market, posted a 4.21% return for the period, while the Barclays U.S. High Yield Index* returned 15.81%. Reflecting the Fed’s continuing accommodative monetary policy, interest rates on short-term securities remained at their lowest levels in many years; the return of the Bank of America Merrill Lynch 3-Month U.S. Treasury Bill Index* was 0.11% for the 12-month period.
The opinions and forecasts expressed may not actually come to pass. This information is subject to change at any time, based on market and other conditions, and should not be construed as a recommendation of any specific security or strategy.
| the GUGGENHEIM FUNDS annual report | 3 |
| ECONOMIC AND MARKET OVERVIEW (concluded) | December 31, 2012 |
*Index Definitions:
The following indices are referenced throughout this report. Indices are unmanaged and not available for direct investment. Index performance does not reflect transaction costs, fees, or expenses.
Barclays U.S. Aggregate Bond Index is a broad-based benchmark that measures the investment grade, U.S. dollar denominated, fixed-rate taxable bond market, including U.S. Treasuries, government-related and corporate securities, MBS (agency fixed-rate and hybrid ARM pass-throughs), ABS, and CMBS.
Barclays U.S. High Yield Index measures the market of USD-denominated, non-investment grade, fixed-rate, taxable corporate bonds. Securities are classified as high yield if the middle rating of Moody’s, Fitch, and S&P is Ba1/BB+/BB+ or below.
Bank of America Merrill Lynch 3-Month U.S. Treasury Bill Index is an unmanaged market index of U.S. Treasury securities maturing in 90 days that assumes reinvestment of all income.
MSCI EAFE Index is a free float-adjusted market capitalization index that is designed to measure the equity market performance of developed markets, excluding the U.S. & Canada.
MSCI Emerging Markets Index is a free float-adjusted market capitalization weighted index that is designed to measure equity market performance in the global emerging markets.
S&P 500® Index is a capitalization-weighted index of 500 stocks designed to measure the performance of the broad economy, representing all major industries and is considered a representation of the U.S. stock market.
JPMorgan Core Commodity-Investable Global Asset Rotator Sigma Long-Short Total Return Index references the value of a synthetic portfolio of up to 7 long constituents and 7 short constituents. As a total return index, it reflects the returns that are potentially available through an unleveraged investment in the contracts comprising such index plus interest that could be earned on funds committed to the trading of the underlying futures contracts.
Dow Jones-UBS Commodity IndexSM is composed of commodities traded on U.S. exchanges, with the exception of aluminum, nickel and zinc, which trade on the London Metal Exchange (LME). The DJ-UBSCI is calculated on an excess return basis, which means it reflects the return of underlying commodity futures price movements only.
S&P GSCI®, a benchmark for investment performance in the commodity markets, measures investable commodity price movements and inflation in the world economy. The index is calculated primarily on a world production weighted basis and is comprised of the principal physical commodities that are the subject of active, liquid futures markets.
Standard & Poor’s Diversified Trends Indicator® is an investable long/short strategy that can benefit from trends (in either direction) in the global futures markets. It consists of 24 futures contracts, with a 50% weighting in financial futures and 50% weighting in commodities futures. S&P Indices also offers financials-only and commodities-only subsets of the S&P DTI, providing a flexible way to tailor exposure to these respective asset classes.
HFRX Global Hedge Fund Index is designed to be representative of the overall composition of the hedge fund universe. It is comprised of all eligible hedge fund strategies, including, but not limited to, convertible arbitrage, distressed securities, equity hedge, equity market neutral, event driven, macro, merger arbitrage and relative-value arbitrage. The strategies are asset weighted based on the distribution of assets in the hedge fund industry.
HFRX Merger Arbitrage Index is designed to measure merger arbitrage strategies which employ an investment process primarily focused on opportunities in equity and equity related instruments of companies currently engaged in a corporate transaction. Merger arbitrage strategies typically have over 75% of positions in announced transactions over a given market cycle.
HFRX Equity Market Neutral Index is designed to measure equity market neutral strategies which employ sophisticated quantitative techniques of analyzing price data to ascertain information about future price movement and relationships between securities, select securities for purchase and sale. Equity market neutral strategies typically maintain characteristic net equity market exposure no greater than 10% long or short.
| 4 | THE GUGGENHEIM FUNDS ANNUAL REPORT |
ABOUT SHAREHOLDERS’ FUND EXPENSES (Unaudited)
All mutual funds have operating expenses and it is important for our shareholders to understand the impact of costs on their investments. Shareholders of a Fund incur two types of costs: (i) transaction costs, including sales charges (loads) on purchase payments, reinvested dividends, or other distributions; and exchange fees; and (ii) ongoing costs, including management fees, administrative services, and shareholder reports, among others. These ongoing costs, or operating expenses, are deducted from a fund’s gross income and reduce the investment return of the fund.
A fund’s expenses are expressed as a percentage of its average net assets, which is known as the expense ratio. The following examples are intended to help investors understand the ongoing costs (in dollars) of investing in a Fund and to compare these costs with the ongoing costs of investing in other mutual funds.
The examples are based on an investment of $1,000 made at the beginning of the period and held for the entire six-month period beginning June 30, 2012 and ending December 31, 2012.
The following tables illustrate a Fund’s costs in two ways:
Table 1. Based on actual Fund return. This section helps investors estimate the actual expenses paid over the period. The “Ending Account Value” shown is derived from the Fund’s actual return, and the fourth column shows the dollar amount that would have been paid by an investor who started with $1,000 in the Fund. Investors may use the information here, together with the amount invested, to estimate the expenses paid over the period. Simply divide the Fund’s account value by $1,000 (for example, an $8,600 account value divided by $1,000 = 8.6), then multiply the result by the number provided under the heading “Expenses Paid During Period.”
Table 2. Based on hypothetical 5% return. This section is intended to help investors compare a Fund’s cost with those of other mutual funds. The table provides information about hypothetical account values and hypothetical expenses based on the Fund’s actual expense ratio and an assumed rate of return of 5% per year before expenses, which is not the Fund’s actual return. The hypothetical account values and expenses may not be used to estimate the actual ending account balance or expenses paid during the period. The example is useful in making comparisons because the U.S. Securities and Exchange Commission (the “SEC”) requires all mutual funds to calculate expenses based on the 5% return. Investors can assess a Fund’s costs by comparing this hypothetical example with the hypothetical examples that appear in shareholder reports of other funds.
The calculations illustrated above assume no shares were bought or sold during the period. Actual costs may have been higher or lower, depending on the amount of investment and the timing of any purchases or redemptions.
Please note that the expenses shown in the table are meant to highlight your ongoing costs only and do not reflect any transactional costs, such as sales charges (loads) on purchase payments, and contingent deferred sales charges (“CDSC”) on redemptions, if any. Therefore, the second table is useful in comparing ongoing costs only, and will not help you determine the relative total costs of owning different funds. In addition, if these transactional costs were included, your costs would have been higher.
More information about a Fund’s expenses, including annual expense ratios for the past five years, can be found in the Financial Highlights section of this report. For additional information on operating expenses and other shareholder costs, please refer to the appropriate Fund prospectus.
| THE GUGGENHEIM FUNDS ANNUAL REPORT | 5 |
About Shareholders’ Fund Expenses (Unaudited) (concluded)
| | | | | | | | | Beginning | | | Ending | | | Expenses | |
| | | Expense | | | Fund | | | Account Value | | | Account Value | | | Paid During | |
| | | Ratio1 | | | Return | | | June 30, 2012 | | | December 31, 2012 | | | Period2 | |
| Table 1. Based on actual Fund return3 | | | | | | | | | | | | | | | | | | | | |
| Long/Short Commodities Strategy Fund | | | | | | | | | | | | | | | | | | | | |
| A-Class | | | 1.90 | % | | | (24.37 | %) | | | $1,000.00 | | | | $756.30 | | | | $8.39 | |
| C-Class | | | 2.65 | % | | | (24.63 | %) | | | 1,000.00 | | | | 753.70 | | | | 11.68 | |
| H-Class | | | 1.90 | % | | | (24.37 | %) | | | 1,000.00 | | | | 756.30 | | | | 8.39 | |
| Institutional Class | | | 1.65 | % | | | (24.29 | %) | | | 1,000.00 | | | | 757.10 | | | | 7.29 | |
| Y-Class | | | 1.60 | % | | | (24.24 | %) | | | 1,000.00 | | | | 757.60 | | | | 7.07 | |
| Global Managed Futures Strategy Fund | | | | | | | | | | | | | | | | | | | | |
| Institutional Class | | | 1.26 | % | | | (1.38 | %) | | | 1,000.00 | | | | 986.20 | | | | 6.29 | |
| Multi-Hedge Strategies Fund | | | | | | | | | | | | | | | | | | | | |
| A-Class | | | 3.22 | % | | | 1.34 | % | | | 1,000.00 | | | | 1,013.40 | | | | 16.30 | |
| C-Class | | | 3.95 | % | | | 0.94 | % | | | 1,000.00 | | | | 1,009.40 | | | | 19.95 | |
| H-Class | | | 3.16 | % | | | 1.34 | % | | | 1,000.00 | | | | 1,013.40 | | | | 15.99 | |
| Institutional Class | | | 3.01 | % | | | 1.42 | % | | | 1,000.00 | | | | 1,014.20 | | | | 15.24 | |
| Commodities Strategy Fund | | | | | | | | | | | | | | | | | | | | |
| A-Class | | | 1.50 | % | | | 6.96 | % | | | 1,000.00 | | | | 1,069.60 | | | | 7.80 | |
| C-Class | | | 2.26 | % | | | 6.59 | % | | | 1,000.00 | | | | 1,065.90 | | | | 11.74 | |
| H-Class | | | 1.51 | % | | | 7.03 | % | | | 1,000.00 | | | | 1,070.30 | | | | 7.86 | |
| | | | | | | | | | | | | | | | | | | | | |
| Table 2. Based on hypothetical 5% return (before expenses) | | | | | | | | | | | | | | | | | | | | |
| Long/Short Commodities Strategy Fund | | | | | | | | | | | | | | | | | | | | |
| A-Class | | | 1.90 | % | | | 5.00 | % | | | $1,000.00 | | | | $1,015.58 | | | | $9.63 | |
| C-Class | | | 2.65 | % | | | 5.00 | % | | | 1,000.00 | | | | 1,011.81 | | | | 13.40 | |
| H-Class | | | 1.90 | % | | | 5.00 | % | | | 1,000.00 | | | | 1,015.58 | | | | 9.63 | |
| Institutional Class | | | 1.65 | % | | | 5.00 | % | | | 1,000.00 | | | | 1,016.84 | | | | 8.36 | |
| Y-Class | | | 1.60 | % | | | 5.00 | % | | | 1,000.00 | | | | 1,017.09 | | | | 8.11 | |
| Global Managed Futures Strategy Fund | | | | | | | | | | | | | | | | | | | | |
| Institutional Class | | | 1.26 | % | | | 5.00 | % | | | 1,000.00 | | | | 1,018.80 | | | | 6.39 | |
| Multi-Hedge Strategies Fund | | | | | | | | | | | | | | | | | | | | |
| A-Class | | | 3.22 | % | | | 5.00 | % | | | 1,000.00 | | | | 1,008.95 | | | | 16.26 | |
| C-Class | | | 3.95 | % | | | 5.00 | % | | | 1,000.00 | | | | 1,005.28 | | | | 19.91 | |
| H-Class | | | 3.16 | % | | | 5.00 | % | | | 1,000.00 | | | | 1,009.25 | | | | 15.96 | |
| Institutional Class | | | 3.01 | % | | | 5.00 | % | | | 1,000.00 | | | | 1,010.00 | | | | 15.21 | |
| Commodities Strategy Fund | | | | | | | | | | | | | | | | | | | | |
| A-Class | | | 1.50 | % | | | 5.00 | % | | | 1,000.00 | | | | 1,017.60 | | | | 7.61 | |
| C-Class | | | 2.26 | % | | | 5.00 | % | | | 1,000.00 | | | | 1,013.77 | | | | 11.44 | |
| H-Class | | | 1.51 | % | | | 5.00 | % | | | 1,000.00 | | | | 1,017.55 | | | | 7.66 | |
| 1 | Annualized and excludes expenses of the underlying funds in which the Funds invest. This ratio represents net expenses, which include dividend and interest expense from securities sold short. Excluding short dividend expense and prime broker interest expense, the operating expense ratio would be 1.40%, 2.15%, 1.40% and 1.15% in the Multi-Hedge Strategies Fund for the A-Class, C-Class, H-Class and Institutional Class, respectively. |
| 2 | Expenses are equal to the Fund’s annualized expense ratio, net of any applicable fee waivers, multiplied by the average account value over the period, multiplied by 184/366 (to reflect the one-half year period). |
| 3 | Actual cumulative return at net asset value for the period June 30, 2012 to December 31, 2012. |
| 6 | THE GUGGENHEIM FUNDS ANNUAL REPORT |
This page intentionally left blank.
| THE GUGGENHEIM FUNDS ANNUAL REPORT | 7 |
| PERFORMANCE REPORT AND FUND PROFILE (Unaudited) | December 31, 2012 |
Long/Short Commodities Strategy FUND
OBJECTIVE: Seeks to achieve positive total returns with less volatility than the broad commodity markets.
For the year ended December 31, 2012, the Fund’s H-Class returned -26.63%. Its benchmark comparison, the JPMorgan Core Commodity-Investable Global Asset Rotator Sigma Long-Short Total Return Index (C-IGAR Sigma Index), returned -24.60%.
As for other benchmark comparisons, the Fund underperformed the Dow Jones-UBS Commodity Index (-1.05%) and the S&P GSCI (0.08%).
In the fourth quarter of 2012, Guggenheim Investments announced several changes to the Fund, effective January 29, 2013. Among the changes are that the Fund will be renamed the Guggenheim Managed Commodities Strategy Fund. The objective of the Fund will be revised and it will be to seek to achieve total returns with less volatility than the broad commodities markets. As a result of the change, the Fund’s principal investment strategies will be changed to a more broadly defined commodities trading strategy that will allow for multiple proprietary strategies. The Fund will incorporate a global multi-strategy approach and may trade all globally traded futures contracts that meet liquidity, regulatory and operational requirements. The strategies may be quantitative or fundamental in nature, and may use market data and macroeconomic analysis to determine positions. The proprietary strategies may range from broad strategies that seek to provide exposure to all commodities markets, to focused strategies that seek to provide exposure to a single asset class, sector or market. Additionally, the fund will incorporate the macroeconomic views of Guggenheim Investments’ CIO, B. Scott Minerd, into the investment process to guide the new approach.
For 2012, the Fund managed both long and short positions across a number of commodities. Nickel, natural gas and reformulated gasoline blendstock for oxygen blending (gasoline RBOB) were among the commodities which provided the most performance to the Fund during the year. Heating oil, copper and wheat were among the commodities which detracted from performance during the year. At year end, six components were long and one component was short. The long components were heating oil, Brent crude, gasoline, lead, corn and soybeans. The short component was WTI crude.
Derivatives in the Fund are used to help provide desired exposure in the most efficient manner, as well as to provide liquidity.
Holdings Diversification (Market Exposure as % of Net Assets)

“Holdings Diversification (Market Exposure as % of Net Assets)” excludes any temporary cash investments.
| Inception Dates: | |
| A-Class | June 25, 2009 |
| C-Class | June 25, 2009 |
| H-Class | June 25, 2009 |
| Institutional Class | | May 3, 2010 |
| Y-Class | | March 29, 2010 |
The Fund invests principally in derivative investments such as commodity-linked futures contracts.
| 8 | THE GUGGENHEIM FUNDS ANNUAL REPORT |
PERFORMANCE REPORT AND FUND PROFILE (Unaudited) (concluded)
Cumulative Fund Performance*
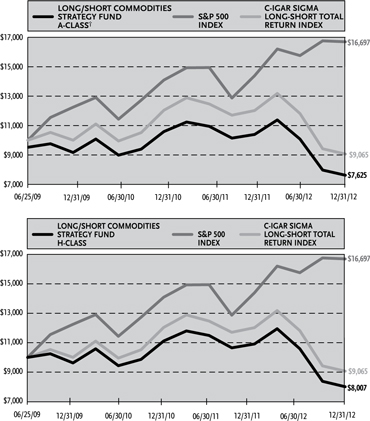
| Average Annual Returns* | | | | | | |
| Periods Ended 12/31/12 | | | | | | |
| | | | | | Since | |
| | | | | | Inception | |
| | | 1 Year | | | (06/25/09) | |
| A-Class Shares | | | -26.66 | % | | | -6.13 | % |
| A-Class Shares with sales charge† | | | -30.15 | % | | | -7.42 | % |
| C-Class Shares | | | -27.19 | % | | | -6.82 | % |
| C-Class Shares with CDSC‡ | | | -27.92 | % | | | -6.82 | % |
| H-Class Shares | | | -26.63 | % | | | -6.12 | % |
| JPMorgan Core Commodity-IGAR Sigma Long-Short Total Return Index | | | -24.60 | % | | | -2.75 | % |
| S&P 500 Index | | | 16.00 | % | | | 15.69 | % |
| | | | | | | | (05/03/10) | |
| Institutional Class Shares | | | -26.48 | % | | | -9.66 | % |
| JPMorgan Core Commodity-IGAR Sigma Long-Short Total Return Index | | | -24.60 | % | | | -7.49 | % |
| S&P 500 Index | | | 16.00 | % | | | 8.96 | % |
| | | | | | | | (03/29/10) | |
| Y-Class Shares | | | -26.44 | % | | | -8.64 | % |
| JPMorgan Core Commodity-IGAR Sigma Long-Short Total Return Index | | | -24.60 | % | | | -6.29 | % |
| S&P 500 Index | | | 16.00 | % | | | 9.65 | % |
| * | The performance data above represents past performance that is not predictive of future results. The investment return and principal value of an investment in the Fund will fluctuate so that an investor’s shares, when redeemed, may be worth more or less than their original cost. Returns are historical and include changes in principal and reinvested dividends and capital gains and do not reflect the effect of taxes. The JPMorgan Core Commodity-IGAR Sigma Long-Short Total Return Index and S&P 500 Index are unmanaged indices and, unlike the Fund, have no management fees or operating expenses to reduce their reported returns. The graphs are based on A-Class and H-Class shares only; performance for C-Class, Y-Class, and Institutional Class shares will vary due to differences in fee structures. |
| † | Fund returns are calculated using the maximum sales charge of 4.75%. |
| ‡ | Fund returns include a CDSC of 1% if redeemed within 12 months of purchase. |
| THE GUGGENHEIM FUNDS ANNUAL REPORT | 9 |
| CONSOLIDATED SCHEDULE OF INVESTMENTS | December 31, 2012 |
| LONG/SHORT COMMODITIES STRATEGY FUND |
| | | Face | | | | |
| | | amount | | | Value | |
| | | | | | | |
| FEDERAL AGENCY DISCOUNT NOTES†† - 34.2% | | | | | | | | |
| Fannie Mae1 | | | | | | | | |
| 0.18% due 07/01/13 | | $ | 20,000,000 | | | $ | 19,988,000 | |
| Freddie Mac1 | | | | | | | | |
| 0.16% due 08/13/13 | | | 15,000,000 | | | | 14,987,925 | |
| Federal Home Loan Bank2 | | | | | | | | |
| 0.17% due 04/01/13 | | | 13,665,000 | | | | 13,662,636 | |
| Total Federal Agency Discount Notes | | | | | | | | |
| (Cost $48,626,159) | | | | | | | 48,638,561 | |
| FEDERAL AGENCY NOTES†† - 21.4% | | | | | | | | |
| Federal Home Loan Bank2 | | | | | | | | |
| 0.18% due 12/26/13 | | | 15,000,000 | | | | 15,000,000 | |
| 0.25% due 09/06/13 | | | 10,300,000 | | | | 10,304,882 | |
| 0.27% due 08/16/13 | | | 5,175,000 | | | | 5,177,893 | |
| Total Federal Home Loan Bank | | | | | | | 30,482,775 | |
| Total Federal Agency Notes | | | | | | | | |
| (Cost $30,483,217) | | | | | | | 30,482,775 | |
| REPURCHASE AGREEMENTS††,3 - 37.6% | | | | | | | | |
| HSBC Group | | | | | | | | |
| issued 12/31/12 at 0.12% | | | | | | | | |
| due 01/02/13 | | | 23,349,001 | | | | 23,349,001 | |
| Deutsche Bank | | | | | | | | |
| issued 12/31/12 at 0.11% | | | | | | | | |
| due 01/02/13 | | | 11,941,557 | | | | 11,941,557 | |
| Mizuho Financial Group, Inc. | | | | | | | | |
| issued 12/31/12 at 0.14% | | | | | | | | |
| due 01/02/13 | | | 10,157,940 | | | | 10,157,940 | |
| Credit Suisse Group | | | | | | | | |
| issued 12/31/12 at 0.12% | | | | | | | | |
| due 01/02/13 | | | 7,998,436 | | | | 7,998,436 | |
| Total Repurchase Agreements | | | | | | | | |
| (Cost $53,446,934) | | | | | | | 53,446,934 | |
| Total Investments - 93.2% | | | | | | | | |
| (Cost $132,556,310) | | | | | | $ | 132,568,270 | |
| Other Assets & Liabilities, net - 6.8% | | | | | | | 9,661,593 | |
| Total Net Assets - 100.0% | | | | | | $ | 142,229,863 | |
| | | | | | unrealized | |
| | | contracts | | | Gain (Loss) | |
| | | | | | | |
| COMMODITY FUTURES CONTRACTS PURCHASED† | | | | | | | | |
| February 2013 Gasoline RBOB | | | | | | | | |
| Futures Contracts | | | | | | | | |
| (Aggregate Value of | | | | | | | | |
| Contracts $20,891,304) | | | 180 | | | $ | 1,103,730 | |
| March 2013 Brent Crude | | | | | | | | |
| Futures Contracts | | | | | | | | |
| (Aggregate Value of | | | | | | | | |
| Contracts $16,174,410) | | | 147 | | | | 571,636 | |
| April 2013 Brent Crude | | | | | | | | |
| Futures Contracts | | | | | | | | |
| (Aggregate Value of | | | | | | | | |
| Contracts $4,585,980) | | | 42 | | | | 174,491 | |
| February 2013 Heating Oil | | | | | | | | |
| Futures Contracts | | | | | | | | |
| (Aggregate Value of | | | | | | | | |
| Contracts $20,648,779) | | | 162 | | | | 135,682 | |
| February 2013 LME Lead | | | | | | | | |
| Futures Contracts | | | | | | | | |
| (Aggregate Value of | | | | | | | | |
| Contracts $20,648,000) | | | 356 | | | | 15,850 | |
| March 2013 Corn | | | | | | | | |
| Futures Contracts | | | | | | | | |
| (Aggregate Value of | | | | | | | | |
| Contracts $20,467,688) | | | 585 | | | | (160,284 | ) |
| March 2013 Soybean | | | | | | | | |
| Futures Contracts | | | | | | | | |
| (Aggregate Value of | | | | | | | | |
| Contracts $20,289,600) | | | 288 | | | | (939,831 | ) |
| (Total Aggregate Value of | | | | | | | | |
| Contracts $123,705,761) | | | | | | $ | 901,274 | |
| COMMODITY FUTURES CONTRACTS SOLD SHORT† | | | | | | | | |
| February 2013 WTI Crude | | | | | | | | |
| Futures Contracts | | | | | | | | |
| (Aggregate Value of | | | | | | | | |
| Contracts $21,187,320) | | | 231 | | | $ | (1,203,488 | ) |
| † | Value determined based on Level 1 inputs — See Note 4. |
| †† | Value determined based on Level 2 inputs — See Note 4. |
| 1 | On September 7, 2008, the issuer was placed in conservatorship by the Federal Housing Finance Agency (FHFA). As conservator, the FHFA has full powers to control the assets and operations of the firm. |
| 2 | The issuer operates under a Congressional charter; its securities are neither issued nor guaranteed by the U.S. Government. |
| 3 | Repurchase Agreements — See Note 5. |
| 10 | THE GUGGENHEIM FUNDS ANNUAL REPORT | SEE NOTES TO FINANCIAL STATEMENTS. |
| LONG/SHORT COMMODITIES STRATEGY FUND |
CONSOLIDATED STATEMENT OF
ASSETS AND LIABILITIES
December 31, 2012
| Assets: | | | | | |
| Investments, at value | | | | |
| (cost $79,109,376) | | $ | 79,121,336 | |
| Repurchase agreements, at value | | | | |
| (cost $53,446,934) | | | 53,446,934 | |
| Total investments | | | | |
| (cost $132,556,310) | | | 132,568,270 | |
| Segregated cash with broker | | | 16,042,425 | |
| Receivables: | | | | |
| Fund shares sold | | | 280,621 | |
| Interest | | | 14,223 | |
| Total assets | | | 148,905,539 | |
| Liabilities: | | | | | |
| Overdraft due to custodian bank | | | 4,657,346 | |
| Payable for: | | | | |
| Licensing fees | | | 849,449 | |
| Fund shares redeemed | | | 832,576 | |
| Management fees | | | 107,149 | |
| Distribution and service fees | | | 33,823 | |
| Transfer agent and administrative fees | | | 29,763 | |
| Variation margin | | | 16,275 | |
| Portfolio accounting fees | | | 11,905 | |
| Miscellaneous | | | 137,390 | |
| Total liabilities | | | 6,675,676 | |
| Net assets | | $ | 142,229,863 | | |
| Net assets consist of: | | | | |
| Paid in capital | | $ | 190,889,158 | |
| Accumulated net investment loss | | | (47,862,328 | ) |
| Accumulated net realized loss on investments | | | (506,713 | ) |
| Net unrealized depreciation on investments | | | (290,254 | ) |
| Net assets | | $ | 142,229,863 | |
| A-Class: | | | | |
| Net assets | | $ | 30,355,076 | |
| Capital shares outstanding | | | 1,721,471 | |
| Net asset value per share | | $ | 17.63 | |
| Maximum offering price per share | | | | |
| (Net asset value divided by 95.25%) | | $ | 18.51 | |
| C-Class: | | | | |
| Net assets | | $ | 16,140,855 | |
| Capital shares outstanding | | | 941,483 | |
| Net asset value per share | | $ | 17.14 | |
| H-Class: | | | | |
| Net assets | | $ | 64,226,625 | |
| Capital shares outstanding | | | 3,643,520 | |
| Net asset value per share | | $ | 17.63 | |
| Institutional Class: | | | | | |
| Net assets | | $ | 31,499,514 | |
| Capital shares outstanding | | | 1,775,109 | |
| Net asset value per share | | $ | 17.75 | |
| Y-Class: | | | | |
| Net assets | | $ | 7,793 | |
| Capital shares outstanding | | | 438 | |
| Net asset value per share | | $ | 17.79 | |
CONSOLIDATED STATEMENT
OF OPERATIONS
Year Ended December 31, 2012
| investment income: | | | | |
| Interest | | $ | 458,910 | |
| Total investment income | | | 458,910 | |
Expenses: | | | | |
| Management fees | | | 3,616,734 | |
| Transfer agent and administrative fees | | | | |
| A-Class | | | 176,976 | |
| C-Class | | | 76,872 | |
| H-Class | | | 500,046 | |
| Institutional Class | | | 92,107 | |
| Y-Class | | | 6,992 | |
| Distribution and service fees: | | | | |
| A-Class | | | 176,976 | |
| C-Class | | | 307,487 | |
| H-Class | | | 500,046 | |
| Portfolio accounting fees | | | 314,681 | |
| Licensing fees | | | 854,741 | |
| Custodian fees | | | 71,943 | |
| Trustees’ fees* | | | 62,596 | |
| Miscellaneous | | | 341,218 | |
| Total expenses | | | 7,099,415 | |
| Less: | | | | |
| Expenses waived by Advisor | | | (539,532 | ) |
| Net expenses | | | 6,559,883 | |
| Net investment loss | | | (6,100,973 | ) |
| | | | | |
Net Realized and Unrealized Gain (Loss): | | | | |
| Net realized gain (loss) on: | | | | |
| Investments | | | 2,864 | |
| Futures contracts | | | (103,158,941 | ) |
| Net realized loss | | | (103,156,077 | ) |
| Net change in unrealized appreciation (depreciation) on: | | | | |
| Investments | | | (93,597 | ) |
| Futures contracts | | | 5,265,242 | |
| Net change in unrealized appreciation (depreciation) | | | 5,171,645 | |
| Net realized and unrealized loss | | | (97,984,432 | ) |
| Net decrease in net assets resulting from operations | | $ | (104,085,405 | ) |
| * | Relates to Trustees not deemed “interested persons” within the meaning of Section 2(a)(19) of the 1940 Act. |
| SEE NOTES TO FINANCIAL STATEMENTS. | THE GUGGENHEIM FUNDS ANNUAL REPORT | 11 |
| LONG/SHORT COMMODITIES STRATEGY FUND |
CONSOLIDATED STATEMENTS OF CHANGES IN NET ASSETS
| | | Year Ended | | | Year Ended | |
| | | December 31, | | | December 31, | |
| | | 2012 | | | 2011 | |
| | | | | | | |
Increase (Decrease) In Net Assets From Operations: | | | | | | | | |
| Net investment loss | | $ | (6,100,973 | ) | | $ | (6,590,386 | ) |
| Net realized gain (loss) on investments | | | (103,156,077 | ) | | | 17,162,084 | |
| Net change in unrealized appreciation (depreciation) on investments | | | 5,171,645 | | | | (23,673,062 | ) |
| Net decrease in net assets resulting from operations | | | (104,085,405 | ) | | | (13,101,364 | ) |
| | | | | | | | | |
Distributions to shareholders from: | | | | | | | | |
| Net investment income | | | | | | | | |
| A-Class | | | — | | | | (5,635,155 | ) |
| C-Class | | | — | | | | (1,799,816 | ) |
| H-Class | | | — | | | | (10,993,341 | ) |
| Institutional Class | | | — | | | | (1,639,264 | ) |
| Y-Class | | | — | | | | (552 | ) |
| Total distributions to shareholders | | | — | | | | (20,068,128 | ) |
| | | | | | | | | |
Capital share transactions: | | | | | | | | |
| Proceeds from sale of shares | | | | | | | | |
| A-Class | | | 56,097,770 | | | | 98,593,867 | |
| C-Class | | | 10,530,172 | | | | 25,951,255 | |
| H-Class | | | 148,038,271 | | | | 169,426,608 | |
| Institutional Class | | | 35,895,054 | | | | 38,198,427 | |
| Y-Class | | | 5,700,143 | | | | — | |
| Distributions reinvested | | | | | | | | |
| A-Class | | | — | | | | 5,159,745 | |
| C-Class | | | — | | | | 1,730,260 | |
| H-Class | | | — | | | | 9,177,213 | |
| Institutional Class | | | — | | | | 715,921 | |
| Y-Class | | | — | | | | 552 | |
| Cost of shares redeemed | | | | | | | | |
| A-Class | | | (112,080,141 | ) | | | (63,510,864 | ) |
| C-Class | | | (17,548,039 | ) | | | (9,104,887 | ) |
| H-Class | | | (233,390,442 | ) | | | (90,822,313 | ) |
| Institutional Class | | | (21,403,749 | ) | | | (61,251,730 | ) |
| Y-Class | | | (4,282,590 | ) | | | — | |
| Net increase (decrease) from capital share transactions | | | (132,443,551 | ) | | | 124,264,054 | |
| Net increase (decrease) in net assets | | | (236,528,956 | ) | | | 91,094,562 | |
| | | | | | | | | |
| Net assets: | | | | | | | | |
| Beginning of year | | | 378,758,819 | | | | 287,664,257 | |
| End of year | | $ | 142,229,863 | | | $ | 378,758,819 | |
| Accumulated net investment loss at end of year | | $ | (47,862,328 | ) | | $ | (47,862,327 | ) |
| 12 | THE GUGGENHEIM FUNDS ANNUAL REPORT | SEE NOTES TO FINANCIAL STATEMENTS. |
| LONG/SHORT COMMODITIES STRATEGY FUND |
CONSOLIDATED STATEMENTS OF CHANGES IN NET ASSETS (concluded)
| | | Year Ended | | | Year Ended | |
| | | December 31, | | | December 31, | |
| | | 2012 | | | 2011 | |
| | | | | | | |
Capital share activity: | | | | | | | | |
| Shares sold | | | | | | | | |
| A-Class | | | 2,385,538 | | | | 3,675,709 | |
| C-Class | | | 448,122 | | | | 974,518 | |
| H-Class | | | 6,223,527 | | | | 6,336,016 | |
| Institutional Class | | | 1,592,407 | | | | 1,435,975 | |
| Y-Class | | | 232,709 | | | | — | |
| Shares issued from reinvestment of distributions | | | | | | | | |
| A-Class | | | — | | | | 205,404 | |
| C-Class | | | — | | | | 70,307 | |
| H-Class | | | — | | | | 365,480 | |
| Institutional Class | | | — | | | | 28,398 | |
| Y-Class | | | — | | | | 21 | |
| Shares redeemed | | | | | | | | |
| A-Class | | | (4,974,401 | ) | | | (2,413,030 | ) |
| C-Class | | | (885,922 | ) | | | (356,209 | ) |
| H-Class | | | (11,443,806 | ) | | | (3,476,976 | ) |
| Institutional Class | | | (1,042,526 | ) | | | (2,232,323 | ) |
| Y-Class | | | (232,709 | ) | | | — | |
| Net increase (decrease) in shares | | | (7,697,061 | ) | | | 4,613,290 | |
| SEE NOTES TO FINANCIAL STATEMENTS. | THE GUGGENHEIM FUNDS ANNUAL REPORT | 13 |
| LONG/SHORT COMMODITIES STRATEGY FUND |
FINANCIAL HIGHLIGHTS
This table is presented to show selected data for a share outstanding throughout each period and to assist shareholders in evaluating a Fund’s performance for the periods presented.
| | | Year Ended | | | Year Ended | | | Year Ended | | | Period Ended | |
| | | December 31, | | | December 31, | | | December 31, | | | December 31, | |
| A-Class | | 2012a | | | 2011a | | | 2010a | | | 2009a,b | |
| Per Share Data | | | | | | | | | | | | | | | | |
| Net asset value, beginning of period | | $ | 24.04 | | | $ | 25.78 | | | $ | 24.07 | | | $ | 25.00 | |
| Income (loss) from investment operations: | | | | | | | | | | | | | | | | |
| Net investment lossc | | | (.40 | ) | | | (.47 | ) | | | (.41 | ) | | | (.23 | ) |
| Net gain (loss) on investments (realized and unrealized) | | | (6.01 | ) | | | .05 | | | | 4.07 | | | | (.70 | ) |
| Total from investment operations | | | (6.41 | ) | | | (.42 | ) | | | 3.66 | | | | (.93 | ) |
| Less distributions from: | | | | | | | | | | | | | | | | |
| Net investment income | | | — | | | | (1.32 | ) | | | (1.92 | ) | | | — | |
| Return of Capital | | | — | | | | — | | | | (.03 | ) | | | — | |
| Total distributions | | | — | | | | (1.32 | ) | | | (1.95 | ) | | | — | |
| Redemption fees collected | | | — | | | | — | | | | — | d | | | — | d |
| Net asset value, end of period | | $ | 17.63 | | | $ | 24.04 | | | $ | 25.78 | | | $ | 24.07 | |
| | | | | | | | | | | | | | | | | |
| Total Returne | | | (26.66 | %) | | | (1.83 | %) | | | 15.51 | % | | | (3.72 | %) |
| Ratios/Supplemental Data | | | | | | | | | | | | | | | | |
| Net assets, end of period (in thousands) | | $ | 30,355 | | | $ | 103,637 | | | $ | 73,274 | | | $ | 10,654 | |
| Ratios to average net assets: | | | | | | | | | | | | | | | | |
| Net investment loss | | | (1.74 | %) | | | (1.76 | %) | | | (1.71 | %) | | | (1.74 | %) |
| Total expenses | | | 2.04 | % | | | 2.08 | % | | | 2.09 | % | | | 1.95 | % |
| Net expensesf | | | 1.88 | % | | | 1.92 | % | | | 1.93 | % | | | 1.84 | % |
| Portfolio turnover rate | | | — | | | | — | | | | — | | | | — | |
| | | Year Ended | | | Year Ended | | | Year Ended | | | Period Ended | |
| | | December 31, | | | December 31, | | | December 31, | | | December 31, | |
| C-Class | | 2012a | | | 2011a | | | 2010a | | | 2009a,b | |
| Per Share Data | | | | | | | | | | | | | | | | |
| Net asset value, beginning of period | | $ | 23.55 | | | $ | 25.46 | | | $ | 23.97 | | | $ | 25.00 | |
| Income (loss) from investment operations: | | | | | | | | | | | | | | | | |
| Net investment lossc | | | (.55 | ) | | | (.66 | ) | | | (.59 | ) | | | (.33 | ) |
| Net gain (loss) on investments (realized and unrealized) | | | (5.86 | ) | | | .07 | | | | 4.03 | | | | (.70 | ) |
| Total from investment operations | | | (6.41 | ) | | | (.59 | ) | | | 3.44 | | | | (1.03 | ) |
| Less distributions from: | | | | | | | | | | | | | | | | |
| Net investment income | | | — | | | | (1.32 | ) | | | (1.92 | ) | | | — | |
| Return of Capital | | | — | | | | — | | | | (.03 | ) | | | — | |
| Total distributions | | | — | | | | (1.32 | ) | | | (1.95 | ) | | | — | |
| Redemption fees collected | | | — | | | | — | | | | — | d | | | — | d |
| Net asset value, end of period | | $ | 17.14 | | | $ | 23.55 | | | $ | 25.46 | | | $ | 23.97 | |
| | | | | | | | | | | | | | | | | |
| Total Returne | | | (27.19 | %) | | | (2.56 | %) | | | 14.70 | % | | | (4.16 | %) |
| Ratios/Supplemental Data | | | | | | | | | | | | | | | | |
| Net assets, end of period (in thousands) | | $ | 16,141 | | | $ | 32,476 | | | $ | 17,587 | | | $ | 3,642 | |
| Ratios to average net assets: | | | | | | | | | | | | | | | | |
| Net investment loss | | | (2.50 | %) | | | (2.51 | %) | | | (2.46 | %) | | | (2.50 | %) |
| Total expenses | | | 2.79 | % | | | 2.83 | % | | | 2.83 | % | | | 2.70 | % |
| Net expensesf | | | 2.63 | % | | | 2.67 | % | | | 2.67 | % | | | 2.59 | % |
| Portfolio turnover rate | | | — | | | | — | | | | — | | | | — | |
| 14 | THE GUGGENHEIM FUNDS ANNUAL REPORT | SEE NOTES TO FINANCIAL STATEMENTS. |
| LONG/SHORT COMMODITIES STRATEGY FUND |
FINANCIAL HIGHLIGHTS (continued)
This table is presented to show selected data for a share outstanding throughout each period and to assist shareholders in evaluating a Fund’s performance for the periods presented.
| | | Year Ended | | | Year Ended | | | Year Ended | | | Period Ended | |
| | | December 31, | | | December 31, | | | December 31, | | | December 31, | |
| H-Class | | 2012a | | | 2011a | | | 2010a | | | 2009a,b | |
| Per Share Data | | | | | | | | | | | | | | | | |
| Net asset value, beginning of period | | $ | 24.04 | | | $ | 25.77 | | | $ | 24.06 | | | $ | 25.00 | |
| Income (loss) from investment operations: | | | | | | | | | | | | | | | | |
| Net investment lossc | | | (.40 | ) | | | (.47 | ) | | | (.41 | ) | | | (.23 | ) |
| Net gain (loss) on investments (realized and unrealized) | | | (6.01 | ) | | | .06 | | | | 4.07 | | | | (.71 | ) |
| Total from investment operations | | | (6.41 | ) | | | (.41 | ) | | | 3.66 | | | | (.94 | ) |
| Less distributions from: | | | | | | | | | | | | | | | | |
| Net investment income | | | — | | | | (1.32 | ) | | | (1.92 | ) | | | — | |
| Return of Capital | | | — | | | | — | | | | (.03 | ) | | | — | |
| Total distributions | | | — | | | | (1.32 | ) | | | (1.95 | ) | | | — | |
| Redemption fees collected | | | — | | | | — | | | | — | d | | | — | d |
| Net asset value, end of period | | $ | 17.63 | | | $ | 24.04 | | | $ | 25.77 | | | $ | 24.06 | |
| | | | | | | | | | | | | | | | | |
| Total Returne | | | (26.63 | %) | | | (1.83 | %) | | | 15.51 | % | | | (3.76 | %) |
| Ratios/Supplemental Data | | | | | | | | | | | | | | | | |
| Net assets, end of period (in thousands) | | $ | 64,227 | | | $ | 213,062 | | | $ | 145,349 | | | $ | 71,014 | |
| Ratios to average net assets: | | | | | | | | | | | | | | | | |
| Net investment loss | | | (1.75 | %) | | | (1.76 | %) | | | (1.71 | %) | | | (1.75 | %) |
| Total expenses | | | 2.04 | % | | | 2.08 | % | | | 2.07 | % | | | 1.95 | % |
| Net expensesf | | | 1.88 | % | | | 1.92 | % | | | 1.91 | % | | | 1.84 | % |
| Portfolio turnover rate | | | — | | | | — | | | | — | | | | — | |
| | | Year Ended | | | Year Ended | | | Period Ended | |
| | | December 31, | | | December 31, | | | December 31, | |
| Institutional Class | | 2012a | | | 2011a | | | 2010a,g | |
| Per Share Data | | | | | | | | | | | | |
| Net asset value, beginning of period | | $ | 24.14 | | | $ | 25.81 | | | $ | 26.39 | |
| Income (loss) from investment operations: | | | | | | | | | | | | |
| Net investment lossc | | | (.33 | ) | | | (.40 | ) | | | (.24 | ) |
| Net gain (loss) on investments (realized and unrealized) | | | (6.06 | ) | | | .05 | | | | 1.61 | |
| Total from investment operations | | | (6.39 | ) | | | (.35 | ) | | | 1.37 | |
| Less distributions from: | | | | | | | | | | | | |
| Net investment income | | | — | | | | (1.32 | ) | | | (1.92 | ) |
| Return of Capital | | | — | | | | — | | | | (.03 | ) |
| Total distributions | | | — | | | | (1.32 | ) | | | (1.95 | ) |
| Redemption fees collected | | | — | | | | — | | | | — | d |
| Net asset value, end of period | | $ | 17.75 | | | $ | 24.14 | | | $ | 25.81 | |
| | | | | | | | | | | | | |
| Total Returne | | | (26.48 | %) | | | (1.60 | %) | | | 5.47 | % |
| Ratios/Supplemental Data | | | | | | | | | | | | |
| Net assets, end of period (in thousands) | | $ | 31,499 | | | $ | 29,573 | | | $ | 51,444 | |
| Ratios to average net assets: | | | | | | | | | | | | |
| Net investment loss | | | (1.50 | %) | | | (1.50 | %) | | | (1.45 | %) |
| Total expenses | | | 1.79 | % | | | 1.84 | % | | | 1.88 | % |
| Net expensesf | | | 1.64 | % | | | 1.68 | % | | | 1.70 | % |
| Portfolio turnover rate | | | — | | | | — | | | | — | |
| SEE NOTES TO FINANCIAL STATEMENTS. | THE GUGGENHEIM FUNDS ANNUAL REPORT | 15 |
| LONG/SHORT COMMODITIES STRATEGY FUND |
FINANCIAL HIGHLIGHTS (concluded)
This table is presented to show selected data for a share outstanding throughout each period and to assist shareholders in evaluating a Fund’s performance for the periods presented.
| | | Year Ended | | | Year Ended | | | Period Ended | |
| | | December 31, | | | December 31, | | | December 31, | |
| Y-Class | | 2012a | | | 2011a | | | 2010a,h | |
| Per Share Data | | | | | | | | | | | | |
| Net asset value, beginning of period | | $ | 24.17 | | | $ | 25.83 | | | $ | 25.89 | |
| Income (loss) from investment operations: | | | | | | | | | | | | |
| Net investment lossc | | | (.35 | ) | | | (.39 | ) | | | (.26 | ) |
| Net gain (loss) on investments (realized and unrealized) | | | (6.03 | ) | | | .05 | | | | 2.15 | |
| Total from investment operations | | | (6.38 | ) | | | (.34 | ) | | | 1.89 | |
| Less distributions from: | | | | | | | | | | | | |
| Net investment income | | | — | | | | (1.32 | ) | | | (1.92 | ) |
| Return of Capital | | | — | | | | — | | | | (.03 | ) |
| Total distributions | | | — | | | | (1.32 | ) | | | (1.95 | ) |
| Redemption fees collected | | | — | | | | — | | | | — | d |
| Net asset value, end of period | | $ | 17.79 | | | $ | 24.17 | | | $ | 25.83 | |
| | | | | | | | | | | | | |
| Total Returne | | | (26.44 | %) | | | (1.52 | %) | | | 7.58 | % |
| Ratios/Supplemental Data | | | | | | | | | | | | |
| Net assets, end of period (in thousands) | | $ | 8 | | | $ | 11 | | | $ | 11 | |
| Ratios to average net assets: | | | | | | | | | | | | |
| Net investment loss | | | (1.45 | %) | | | (1.46 | %) | | | (1.41 | %) |
| Total expenses | | | 1.73 | % | | | 1.78 | % | | | 1.79 | % |
| Net expensesf | | | 1.58 | % | | | 1.62 | % | | | 1.63 | % |
| Portfolio turnover rate | | | — | | | | — | | | | — | |
| b | Since commencement of operations: June 25, 2009. Percentage amounts for the period, except total return and portfolio turnover rate, have been annualized. |
| c | Net investment loss per share was computed using average shares outstanding throughout the period. |
| d | Redemption fees collected are less than $0.01 per share. |
| e | Total return does not reflect the impact of any applicable sales charges and has not been annualized. |
| f | Net expense information reflects the expense ratios after expense waivers. |
| g | Since commencement of operations: May 3, 2010. Percentage amounts for the period, except total return and portfolio turnover rate, have been annualized. |
| h | Since commencement of operations: March 29, 2010. Percentage amounts for the period, except total return and portfolio turnover rate, have been annualized. |
| 16 | THE GUGGENHEIM FUNDS ANNUAL REPORT | SEE NOTES TO FINANCIAL STATEMENTS. |
This page intentionally left blank.
| THE GUGGENHEIM FUNDS ANNUAL REPORT | 17 |
| PERFORMANCE REPORT AND FUND PROFILE (Unaudited) | December 31, 2012 |
GLOBAL MANAGED FUTURES STRATEGY FUND
OBJECTIVE: Seeks to generate positive total returns over time.
The Global Managed Futures Strategy Fund Institutional Class had an inception date of May 10, 2012, and is managed according to a proprietary strategy that ultimately was implemented in the Guggenheim Managed Futures Fund. For the abbreviated fiscal period from May 10, 2012 through December 31, 2012, the Fund returned -3.15%, compared with a return of -5.95% for its benchmark comparison, the Standard & Poor’s Diversified Trends Indicator® (S&P DTI). The Fund also underperformed the 0.14% return of the Bank of America Merrill Lynch 3-Month U.S. Treasury Bill Index.
The proprietary strategy offers more broadly based access to the futures markets, expanding the opportunity set to include both domestic and international traded futures and adding additional asset classes, such as equities and short-term interest rates.
Derivatives in the Fund are used to help provide desired exposure in the most efficient manner, as well as to provide liquidity.
Performance displayed represents past performance which is no guarantee of future results.
Consolidated Holdings Diversification (Market Exposure as % of Net Assets)

“Consolidated Holdings Diversification (Market Exposure as % of Net Assets)” excludes any temporary cash investments.
| Inception Date: | |
| Institutional Class | May 10, 2012 |
The Fund invests principally in derivative investments such as futures contracts.
| 18 | THE GUGGENHEIM FUNDS ANNUAL REPORT |
PERFORMANCE REPORT AND FUND PROFILE (Unaudited) (concluded)
Cumulative Fund Performance*
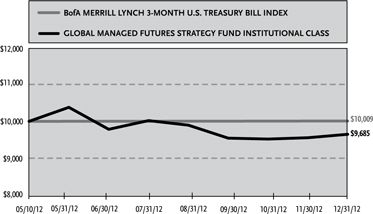
Total Annual Returns*
Periods Ended 12/31/12
| | | Since | |
| | | Inception | |
| | | (05/10/12) | |
| Institutional Class Shares | | | -3.15 | % |
| Bank of America Merrill Lynch 3-Month U.S. Treasury Bill Index | | | 0.14 | % |
| * | The performance data above represents past performance that is not predictive of future results. The investment return and principal value of an investment in the Fund will fluctuate so that an investor’s shares, when redeemed, may be worth more or less than their original cost. Returns are historical and include changes in principal and reinvested dividends and capital gains and do not reflect the effect of taxes. The Bank of America Merrill Lynch 3-Month U.S. Treasury Bill Index is an unmanaged index and, unlike the Fund, has no management fees or operating expenses to reduce its reported return. |
| THE GUGGENHEIM FUNDS ANNUAL REPORT | 19 |
| CONSOLIDATED SCHEDULE OF INVESTMENTS | December 31, 2012 |
| Global Managed Futures Strategy Fund |
| | | Face | | | | |
| | | Amount | | | Value | |
| | | | | | | |
| REPURCHASE AGREEMENTS††,1 - 86.3% | | | | | | | | |
| HSBC Group | | | | | | | | |
| issued 12/31/12 at 0.12% | | | | | | | | |
| due 01/02/13 | | $ | 5,478,497 | | | $ | 5,478,497 | |
| Deutsche Bank | | | | | | | | |
| issued 12/31/12 at 0.11% | | | | | | | | |
| due 01/02/13 | | | 2,801,910 | | | | 2,801,910 | |
| Mizuho Financial Group, Inc. | | | | | | | | |
| issued 12/31/12 at 0.14% | | | | | | | | |
| due 01/02/13 | | | 2,383,410 | | | | 2,383,410 | |
| Credit Suisse Group | | | | | | | | |
| issued 12/31/12 at 0.12% | | | | | | | | |
| due 01/02/13 | | | 1,876,715 | | | | 1,876,715 | |
| Total Repurchase Agreements | | | | | | | | |
| (Cost $12,540,532) | | | | | | | 12,540,532 | |
| Total Investments - 86.6% | | | | | | | | |
| (Cost $12,540,532) | | | | | | $ | 12,540,532 | |
| Other Assets & Liabilities, net - 13.4% | | | | | | | 1,988,210 | |
| Total Net Assets - 100.0% | | | | | | $ | 14,528,742 | |
| | | | | | unrealized | |
| | | contracts | | | Gain (Loss) | |
| | | | | | | |
| EQUITY FUTURES CONTRACTS PURCHASED† | | | | | | | | |
| March 2013 Nikkei 225 Index | | | | | | | | |
| Futures Contracts†† | | | | | | | | |
| (Aggregate Value of | | | | | | | | |
| Contracts $482,603) | | | 4 | | | $ | 39,304 | |
| March 2013 FTSE/JSE Top 40 Index | | | | | | | | |
| Futures Contracts†† | | | | | | | | |
| (Aggregate Value of | | | | | | | | |
| Contracts $633,595) | | | 15 | | | | 17,297 | |
| March 2013 SPI 200 Index | | | | | | | | |
| Futures Contracts†† | | | | | | | | |
| (Aggregate Value of | | | | | | | | |
| Contracts $611,837) | | | 5 | | | | 14,112 | |
| January 2013 Amsterdam Index | | | | | | | | |
| Futures Contracts†† | | | | | | | | |
| (Aggregate Value of | | | | | | | | |
| Contracts $276,838) | | | 3 | | | | 4,690 | |
| January 2013 Hang Seng Index | | | | | | | | |
| Futures Contracts†† | | | | | | | | |
| (Aggregate Value of | | | | | | | | |
| Contracts $445,015) | | | 3 | | | | 4,619 | |
| March 2013 Russell 2000 Index | | | | | | | | |
| Mini Futures Contracts | | | | | | | | |
| (Aggregate Value of | | | | | | | | |
| Contracts $253,920) | | | 3 | | | | 4,427 | |
| January 2013 CAC40 10 Euro Index | | | | | | | | |
| Futures Contracts†† | | | | | | | | |
| (Aggregate Value of | | | | | | | | |
| Contracts $196,054) | | | 4 | | | | 3,564 | |
| January 2013 H-Shares Index | | | | | | | | |
| Futures Contracts†† | | | | | | | | |
| (Aggregate Value of | | | | | | | | |
| Contracts $224,745) | | | 3 | | | | 3,430 | |
| March 2013 DAX Index | | | | | | | | |
| Futures Contracts†† | | | | | | | | |
| (Aggregate Value of | | | | | | | | |
| Contracts $254,733) | | | 1 | | | | 2,129 | |
| March 2013 FTSE 100 Index | | | | | | | | |
| Futures Contracts†† | | | | | | | | |
| (Aggregate Value of | | | | | | | | |
| Contracts $193,697) | | | 2 | | | | 1,925 | |
| March 2013 S&P MidCap 400 Index | | | | | | | | |
| Mini Futures Contracts | | | | | | | | |
| (Aggregate Value of | | | | | | | | |
| Contracts $203,500) | | | 2 | | | | 1,616 | |
| January 2013 IBEX 35 Index | | | | | | | | |
| Futures Contracts†† | | | | | | | | |
| (Aggregate Value of | | | | | | | | |
| Contracts $108,474) | | | 1 | | | | 349 | |
| March 2013 S&P 500 Index | | | | | | | | |
| Mini Futures Contracts | | | | | | | | |
| (Aggregate Value of | | | | | | | | |
| Contracts $213,263) | | | 3 | | | | (442 | ) |
| March 2013 NASDAQ-100 Index | | | | | | | | |
| Mini Futures Contracts | | | | | | | | |
| (Aggregate Value of | | | | | | | | |
| Contracts $106,250) | | | 2 | | | | (616 | ) |
| March 2013 Dow Jones Industrial | | | | | | | | |
| Average Index | | | | | | | | |
| Mini Futures Contracts | | | | | | | | |
| (Aggregate Value of | | | | | | | | |
| Contracts $195,600) | | | 3 | | | | (2,089 | ) |
| (Total Aggregate Value of | | | | | | | | |
| Contracts $4,400,124) | | | | | | $ | 94,315 | |
| | | | | | | | | |
| INTEREST RATE FUTURES CONTRACTS PURCHASED† | | | | | | | | |
| June 2013 3 Month Euro Euribor | | | | | | | | |
| Futures Contracts†† | | | | | | | | |
| (Aggregate Value of | | | | | | | | |
| Contracts $8,733,851) | | | 26 | | | $ | 172,379 | |
| March 2013 Euro - Schatz | | | | | | | | |
| Futures Contracts†† | | | | | | | | |
| (Aggregate Value of | | | | | | | | |
| Contracts $5,171,142) | | | 35 | | | | 56,196 | |
| March 2013 Euro - Bund | | | | | | | | |
| Futures Contracts†† | | | | | | | | |
| (Aggregate Value of | | | | | | | | |
| Contracts $1,531,068) | | | 8 | | | | 6,594 | |
| March 2013 Euro - Bobl | | | | | | | | |
| Futures Contracts†† | | | | | | | | |
| (Aggregate Value of | | | | | | | | |
| Contracts $2,519,826) | | | 15 | | | | 6,571 | |
| 20 | THE GUGGENHEIM FUNDS ANNUAL REPORT | SEE NOTES TO FINANCIAL STATEMENTS. |
| CONSOLIDATED SCHEDULE OF INVESTMENTS (continued) | December 31, 2012 |
| Global Managed Futures Strategy Fund |
| | | | | | unrealized | |
| | | contracts | | | Gain (Loss) | |
| | | | | | | |
| June 2013 3 Month Eurodollar | | | | | | | | |
| Futures Contracts | | | | | | | | |
| (Aggregate Value of | | | | | | | | |
| Contracts $9,718,312) | | | 39 | | | $ | 891 | |
| March 2013 U.S. Treasury 2 Year Note | | | | | | | | |
| Futures Contracts | | | | | | | | |
| (Aggregate Value of | | | | | | | | |
| Contracts $5,730,563) | | | 26 | | | | (38 | ) |
| June 2013 3 Month Sterling | | | | | | | | |
| Futures Contracts†† | | | | | | | | |
| (Aggregate Value of | | | | | | | | |
| Contracts $8,485,659) | | | 42 | | | | (88 | ) |
| March 2013 U.S. Treasury 5 Year Note | | | | | | | | |
| Futures Contracts | | | | | | | | |
| (Aggregate Value of | | | | | | | | |
| Contracts $2,855,953) | | | 23 | | | | (7,740 | ) |
| March 2013 U.S. Treasury 10 Year Note | | | | | | | | |
| Futures Contracts | | | | | | | | |
| (Aggregate Value of | | | | | | | | |
| Contracts $1,720,875) | | | 13 | | | | (11,044 | ) |
| March 2013 Long Gilt | | | | | | | | |
| Futures Contracts†† | | | | | | | | |
| (Aggregate Value of | | | | | | | | |
| Contracts $1,347,786) | | | 7 | | | | (11,702 | ) |
| March 2013 U.S. Treasury 30 Year Bond | | | | | | | | |
| Futures Contracts | | | | | | | | |
| (Aggregate Value of | | | | | | | | |
| Contracts $1,175,250) | | | 8 | | | | (21,988 | ) |
| March 2013 Japanese Government | | | | | | | | |
| 10 Year Bond | | | | | | | | |
| Futures Contracts†† | | | | | | | | |
| (Aggregate Value of | | | | | | | | |
| Contracts $4,955,214) | | | 3 | | | | (49,930 | ) |
| March 2013 Australian Government | | | | | | | | |
| 10 Year Bond | | | | | | | | |
| Futures Contracts†† | | | | | | | | |
| (Aggregate Value of | | | | | | | | |
| Contracts $2,740,879) | | | 22 | | | | (75,976 | ) |
| (Total Aggregate Value of | | | | | | | | |
| Contracts $56,686,378) | | | | | | $ | 64,125 | |
| | | | | | | | | |
| CURRENCY FUTURES CONTRACTS PURCHASED† | | | | | | | | |
| March 2013 British Pound | | | | | | | | |
| Futures Contracts | | | | | | | | |
| (Aggregate Value of | | | | | | | | |
| Contracts $1,624,500) | | | 16 | | | $ | (3,236 | ) |
| March 2013 Canadian Dollar | | | | | | | | |
| Futures Contracts | | | | | | | | |
| (Aggregate Value of | | | | | | | | |
| Contracts $2,816,800) | | | 28 | | | | (19,762 | ) |
| March 2013 Australian Dollar | | | | | | | | |
| Futures Contracts | | | | | | | | |
| (Aggregate Value of | | | | | | | | |
| Contracts $2,790,990) | | | 27 | | | | (41,049 | ) |
| (Total Aggregate Value of | | | | | | | | |
| Contracts $7,232,290) | | | | | | $ | (64,047 | ) |
| | | | | | | | | |
| COMMODITY FUTURES CONTRACTS PURCHASED† | | | | | | | | |
| February 2013 Gasoline RBOB | | | | | | | | |
| Futures Contracts | | | | | | | | |
| (Aggregate Value of | | | | | | | | |
| Contracts $348,188) | | | 3 | | | $ | 13,796 | |
| February 2013 Natural Gas | | | | | | | | |
| Futures Contracts | | | | | | | | |
| (Aggregate Value of | | | | | | | | |
| Contracts $402,720) | | | 12 | | | | (9,704 | ) |
| March 2013 Soybean | | | | | | | | |
| Futures Contracts | | | | | | | | |
| (Aggregate Value of | | | | | | | | |
| Contracts $352,250) | | | 5 | | | | (15,376 | ) |
| March 2013 Corn | | | | | | | | |
| Futures Contracts | | | | | | | | |
| (Aggregate Value of | | | | | | | | |
| Contracts $279,900) | | | 8 | | | | (16,985 | ) |
| March 2013 Wheat | | | | | | | | |
| Futures Contracts | | | | | | | | |
| (Aggregate Value of | | | | | | | | |
| Contracts $233,700) | | | 6 | | | | (33,519 | ) |
| (Total Aggregate Value of | | | | | | | | |
| Contracts $1,616,758) | | | | | | $ | (61,788 | ) |
| CURRENCY FUTURES CONTRACTS SOLD SHORT† | | | | | | | | |
| March 2013 Japanese Yen | | | | | | | | |
| Futures Contracts | | | | | | | | |
| (Aggregate Value of | | | | | | | | |
| Contracts $2,739,563) | | | 19 | | | $ | 127,608 | |
| COMMODITY FUTURES CONTRACTS SOLD SHORT† | | | | | | | | |
| March 2013 Coffee ‘C’ | | | | | | | | |
| Futures Contracts | | | | | | | | |
| (Aggregate Value of | | | | | | | | |
| Contracts $972,000) | | | 18 | | | $ | 85,493 | |
| March 2013 Sugar #11 | | | | | | | | |
| Futures Contracts | | | | | | | | |
| (Aggregate Value of | | | | | | | | |
| Contracts $1,072,904) | | | 49 | | | | 48,431 | |
| February 2013 LME Nickel | | | | | | | | |
| Futures Contracts | | | | | | | | |
| (Aggregate Value of | | | | | | | | |
| Contracts $204,420) | | | 2 | | | | 7,973 | |
| February 2013 LME Primary Aluminum | | | | | | | | |
| Futures Contracts | | | | | | | | |
| (Aggregate Value of | | | | | | | | |
| Contracts $257,625) | | | 5 | | | | 7,670 | |
| March 2013 Silver | | | | | | | | |
| Futures Contracts | | | | | | | | |
| (Aggregate Value of | | | | | | | | |
| Contracts $303,650) | | | 2 | | | | (1,981 | ) |
| February 2013 Gas Oil | | | | | | | | |
| Futures Contracts | | | | | | | | |
| (Aggregate Value of | | | | | | | | |
| Contracts $187,750) | | | 2 | | | | (3,953 | ) |
| SEE NOTES TO FINANCIAL STATEMENTS. | THE GUGGENHEIM FUNDS ANNUAL REPORT | 21 |
| CONSOLIDATED SCHEDULE OF INVESTMENTS (concluded) | December 31, 2012 |
| Global Managed Futures Strategy Fund |
| | | | | | unrealized | |
| | | contracts | | | Gain (Loss) | |
| | | | | | | |
| March 2013 Brent Crude | | | | | | | | |
| Futures Contracts | | | | | | | | |
| (Aggregate Value of | | | | | | | | |
| Contracts $220,060) | | | 2 | | | $ | (5,710 | ) |
| February 2013 Heating Oil | | | | | | | | |
| Futures Contracts | | | | | | | | |
| (Aggregate Value of | | | | | | | | |
| Contracts $254,923) | | | 2 | | | | (6,531 | ) |
| March 2013 Copper | | | | | | | | |
| Futures Contracts | | | | | | | | |
| (Aggregate Value of | | | | | | | | |
| Contracts $273,600) | | | 3 | | | | (14,832 | ) |
| February 2013 WTI Crude | | | | | | | | |
| Futures Contracts | | | | | | | | |
| (Aggregate Value of | | | | | | | | |
| Contracts $366,880) | | | 4 | | | | (17,922 | ) |
| February 2013 Live Cattle | | | | | | | | |
| Futures Contracts | | | | | | | | |
| (Aggregate Value of | | | | | | | | |
| Contracts $794,550) | | | 15 | | | | (22,882 | ) |
| March 2013 Cotton #2 | | | | | | | | |
| Futures Contracts | | | | | | | | |
| (Aggregate Value of | | | | | | | | |
| Contracts $1,357,200) | | | 36 | | | | (84,376 | ) |
| (Total Aggregate Value of | | | | | | | | |
| Contracts $6,265,562) | | | | | | $ | (8,620 | ) |
| † | Value determined based on Level 1 inputs, unless otherwise noted. — See Note 4. |
| †† | Value determined based on Level 2 inputs — See Note 4. |
| 1 | Repurchase Agreements — See Note 5. |
| 22 | THE GUGGENHEIM FUNDS ANNUAL REPORT | SEE NOTES TO FINANCIAL STATEMENTS. |
| Global Managed Futures Strategy Fund |
Consolidated STATEMENT OF
ASSETS AND LIABILITIES
| December 31, 2012 | | | |
| | | | |
Assets: | | | | |
| Repurchase agreements, at value | | | | |
| (cost $12,540,532) | | $ | 12,540,532 | |
| Segregated cash with broker | | | 1,834,669 | |
| Prepaid expenses | | | 8,364 | |
| Receivables: | | | | |
| Variation margin | | | 198,236 | |
| Interest | | | 42 | |
| Total assets | | | 14,581,843 | |
| Liabilities: | | | | |
| Overdraft due to custodian bank | | | 37,998 | |
| Payable for: | | | | |
| Management fees | | | 6,635 | |
| Transfer agent and administrative fees | | | 2,836 | |
| Portfolio accounting fees | | | 1,134 | |
| Miscellaneous | | | 4,498 | |
| Total liabilities | | | 53,101 | |
| Net assets | | $ | 14,528,742 | |
| Net assets consist of: | | | | |
| Paid in capital | | $ | 14,096,588 | |
| Undistributed net investment income | | | — | |
| Accumulated net realized gain on investments | | | 280,215 | |
| Net unrealized appreciation on investments | | | 151,939 | |
| Net assets | | $ | 14,528,742 | |
Institutional Class: | | | | |
| Net assets | | $ | 14,528,742 | |
| Capital shares outstanding | | | 600,000 | |
| Net asset value per share | | $ | 24.21 | |
Consolidated STATEMENT
OF OPERATIONS
| Period Ended December 31, 2012† | | | |
| | | | |
| investment income: | | | | |
| Interest | | $ | 13,078 | |
| Total investment income | | | 13,078 | |
| | | | | |
| Expenses: | | | | |
| Management fees | | | 96,335 | |
| Transfer agent and administrative fees | | | 23,533 | |
| Portfolio accounting fees | | | 9,413 | |
| Registration fees | | | 15,268 | |
| Custodian fees | | | 1,612 | |
| Trustees’ fees* | | | 1,537 | |
| Miscellaneous | | | 10,193 | |
| Total expenses | | | 157,891 | |
| Less: | | | | |
| Expenses waived by Advisor | | | (39,442 | ) |
| Net expenses | | | 118,449 | |
| Net investment loss | | | (105,371 | ) |
| | | | | |
| Net Realized and Unrealized Gain (Loss): | | | | |
| Net realized gain (loss) on: | | | | |
| Futures contracts | | | (522,502 | ) |
| Foreign currency | | | 6,166 | |
| Net realized loss | | | (516,336 | ) |
| Net change in unrealized appreciation (depreciation) on: | | | | |
| Futures contracts | | | 151,593 | |
| Foreign currency | | | 346 | |
| Net change in unrealized appreciation (depreciation) | | | 151,939 | |
| Net realized and unrealized loss | | | (364,397 | ) |
| Net decrease in net assets resulting from operations | | $ | (469,768 | ) |
| † | Since commencement of operations: May 10, 2012. |
| * | Relates to Trustees not deemed “interested persons” within the meaning of Section 2(a)(19) of the 1940 Act. |
| SEE NOTES TO FINANCIAL STATEMENTS. | THE GUGGENHEIM FUNDS ANNUAL REPORT | 23 |
| GLOBAL MANAGED FUTURES STRATEGY FUND |
| |
| CONSOLIDATED STATEMENT OF CHANGES IN NET ASSETS |
| | | Period Ended | |
| | | December 31, | |
| | | 2012a | |
| | | | |
| Increase (decrease) in net assets from operations: | | | | |
| Net investment loss | | $ | (105,371 | ) |
| Net realized loss on investments | | | (516,336 | ) |
| Net change in unrealized appreciation (depreciation) on investments | | | 151,939 | |
| Net decrease in net assets resulting from operations | | | (469,768 | ) |
| | | | | |
| Distributions to shareholders from: | | | | |
| Net realized gains | | | | |
| Institutional Class | | | (1,704 | ) |
| Total distributions to shareholders | | | (1,704 | ) |
| | | | | |
| Capital share transactions: | | | | |
| Proceeds from sale of shares | | | | |
| Institutional Class | | | 15,000,214 | |
| Cost of shares redeemed | | | | |
| Institutional Class | | | — | |
| Net increase from capital share transactions | | | 15,000,214 | |
| Net increase in net assets | | | 14,528,742 | |
| | | | | |
| Net assets: | | | | |
| Beginning of period | | | — | |
| End of period | | $ | 14,528,742 | |
| Undistributed net investment income at end of period | | $ | — | |
| | | | | |
| Capital share activity: | | | | |
| Shares sold | | | | |
| Institutional Class | | | 600,000 | |
| Shares redeemed | | | | |
| Institutional Class | | | — | |
| Net increase in shares | | | 600,000 | |
| a | Since commencement of operations: May 10, 2012. |
| 24 | THE GUGGENHEIM FUNDS ANNUAL REPORT | SEE NOTES TO FINANCIAL STATEMENTS. |
| GLOBAL MANAGED FUTURES STRATEGY FUND |
| |
| FINANCIAL HIGHLIGHTS |
This table is presented to show selected data for a share outstanding throughout each period and to assist shareholders in evaluating a Fund’s performance for the periods presented.
| | | Period Ended | |
| | | December 31, | |
| Institutional Class | | 2012a,f | |
| Per Share Data | | | | |
| Net asset value, beginning of period | | $ | 25.00 | |
| Income (loss) from investment operations: | | | | |
| Net investment lossb | | | (.22 | ) |
| Net loss on investments (realized and unrealized) | | | (.57 | ) |
| Total from investment operations | | | (.79 | ) |
| Less distributions from: | | | | |
| Net realized gains | | | (— | )c |
| Net asset value, end of period | | $ | 24.21 | |
| | | | | |
| Total Returnd | | | (3.15 | %) |
| Ratios/Supplemental Data | | | | |
| Net assets, end of period (in thousands) | | $ | 14,529 | |
| Ratios to average net assets: | | | | |
| Net investment loss | | | (1.11 | %) |
| Total expenses | | | 1.67 | % |
| Net expensese | | | 1.25 | % |
| Portfolio turnover rate | | | — | |
| a | Since commencement of operations: May 10, 2012. Percentage amounts for the period, except total return and portfolio turnover rate, have been annualized. |
| b | Net investment loss per share was computed using average shares outstanding throughout the period. |
| c | Distributions from realized gains are less than $0.01 per share. |
| d | Total return does not reflect the impact of any applicable sales charges and has not been annualized. |
| e | Net expense information reflects the expense ratios after expense waivers. |
| SEE NOTES TO FINANCIAL STATEMENTS. | THE GUGGENHEIM FUNDS ANNUAL REPORT | 25 |
| PERFORMANCE REPORT AND FUND PROFILE (Unaudited) | December 31, 2012 |
MULTI-HEDGE STRATEGIES FUND
OBJECTIVE: Seeks to provide long-term capital appreciation with less risk than traditional equity funds.
2012 was the third full calendar year of performance since the Fund’s objective was changed from hedge fund replication to capital appreciation. The risk-adjusted results for 2012 were good for a third year, as the Fund’s H-Class generated a 2.02% return with only 2.5% annualized risk, for a Sharpe ratio* approximating 0.8. In addition to generating a strong Sharpe ratio, the Fund generated a correlation** of 9% to the S&P 500 Index and -1% to the Barclays U.S. Aggregate Bond Index over the course of the year. While a strong year for equities, the S&P 500 did have three negative return calendar months. The Fund generated positive returns in two of these three months, illustrating its diversification benefits. Similarly, the Fund has generated positive returns in seven of the 14 negative equity return calendar months since the Fund objective change in September 2009.
While no longer a replication product, the Fund still maintains the HFRX Global Hedge Fund Index as its benchmark, which was up 3.58% for the year. In contrast to the diversification benefits provided by Multi-Hedge Strategies Fund, the HFRX Global Hedge Fund Index had a correlation of 75% to the S&P 500. In spite of the equity return contribution to HFRX Global Hedge Fund Index performance, the Multi-Hedge Strategies Fund has outperformed this index by more than 1000bps (3.4% annualized), net of fees, since the Fund changed its investment objective.
All five of the hedge fund styles (global macro, long/short equity, equity market neutral, merger arbitrage, and fixed income strategies) employed by the Fund contributed positive returns to the Fund once again this year.
Merger Arbitrage contributed the most to gross returns, 1.1%, as the model continued to generate attractive risk-adjusted returns. Our strategy realized a return of 2.1% with 1.2% annualized volatility, better than the 0.9% gain with 2.9% annualized risk reported for the HFRX Merger Arbitrage Index.
Global Macro strategies contributed the second most, adding 0.9% to gross fund returns. The Volatility Arbitrage model had a very strong year, offsetting losses in both the Managed Futures Trend and Managed Futures Relative Value models. The difficulty experienced by these models was consistent with observations for other funds employing managed futures strategies.
Equity Market Neutral contributed 0.6% to gross fund returns. The Closed End Fund Arbitrage model performed very well during the year. The increased exposure we took to this strategy in the fourth quarter of 2011 enhanced the benefit to fund performance. Our Equity Market Neutral model detracted -0.2% from fund returns by generating a -0.7% return for the year. While disappointing, it significantly outperformed the -4.7% loss posted by the HFRX Equity Market Neutral Index.
Long/Short Equity contributed 0.5% to gross fund return. The industry rotation and size models contributed 0.3% and 0.4%, respectively, while the country rotation model detracted -0.2% from fund performance. For the past two calendar years, small caps underperformed large caps. Prior to 2011 this would have led to negative performance from our size model; however, enhancements made in 2011 allowed us to profit once again from shifting trends in the relative performance of stocks in different market capitalization categories. In the fourth quarter of 2012, changes were introduced to the Industry Rotation model that increase its equity bias, aligning it more closely to other long/short equity managers.
Fixed Income strategies contributed 0.5% to gross fund return. The addition of the Credit Spread model in the fourth quarter of 2011 explained the entirety of this result.
Derivatives in the Fund are used for various purposes, including hedging, producing income and for speculation.
Performance displayed represents past performance which is no guarantee of future results.
| * | Sharpe Ratio: a risk-adjusted measure calculated using standard deviation and excess return to determine reward per unit of risk. The higher the Sharpe ratio, the better the fund’s historical risk-adjusted performance. |
| ** | Correlation is a measurement between -1 and 1, which indicates the linear relationship between two variables. If there is no relationship between two variables, the correlation coefficient is 0. If there is a perfect relationship, the correlation is 1. And if there is a perfect inverse relationship, the correlation is -1. |
| 26 | THE GUGGENHEIM FUNDS ANNUAL REPORT | |
| PERFORMANCE REPORT AND FUND PROFILE (Unaudited) (concluded) |
Consolidated Holdings Diversification (Market Exposure as % of Net Assets)
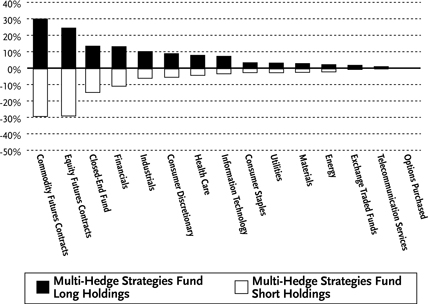
“Consolidated Holdings Diversification (Market Exposure as % of Net Assets)” excludes any temporary cash investments.
| Inception Dates: | | | | |
| A-Class | | | September 19, 2005 | |
| C-Class | | | September 19, 2005 | |
| H-Class | | | September 19, 2005 | |
| Institutional Class | | | May 3, 2010 | |
| Ten Largest Long Holdings | | | |
| (% of Total Net Assets) | | | |
| Coventry Health Care, Inc. | | | 2.3 | % |
| Warnaco Group, Inc. | | | 2.1 | % |
| Jefferies Group, Inc. | | | 2.1 | % |
| Robbins & Myers, Inc. | | | 2.0 | % |
| PSS World Medical, Inc. | | | 1.8 | % |
| Shaw Group, Inc. | | | 1.4 | % |
| Ralcorp Holdings, Inc. | | | 1.3 | % |
| Kayak Software Corp. | | | 1.1 | % |
| Cascade Corp. | | | 1.1 | % |
| Cymer, Inc. | | | 1.1 | % |
| Top Ten Total | | | 16.3 | % |
“Ten Largest Long Holdings” exclude any temporary cash or derivative investments.
Cumulative Fund Performance*
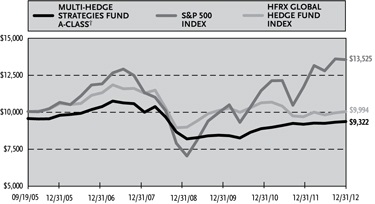
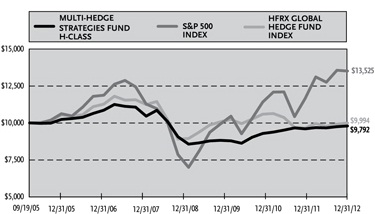
Average Annual Returns*
Periods Ended 12/31/12
| | | | | | | | | Since | |
| | | | | | | | | Inception | |
| | | | 1 Year | | | | 5 Year | | | | (09/19/05) | |
| A-Class Shares | | | 2.02 | % | | | -2.42 | % | | | -0.29 | % |
| A-Class Shares with sales charge† | | | -2.83 | % | | | -3.37 | % | | | -0.96 | % |
| C-Class Shares | | | 1.23 | % | | | -3.16 | % | | | -1.04 | % |
| C-Class Shares with CDSC‡ | | | 0.23 | % | | | -3.16 | % | | | -1.04 | % |
| H-Class Shares | | | 2.02 | % | | | -2.43 | % | | | -0.29 | % |
| HFRX Global Hedge Fund Index | | | 3.58 | % | | | -2.89 | % | | | -0.01 | % |
| S&P 500 Index | | | 16.00 | % | | | 1.66 | % | | | 4.23 | % |
| | | | | | | | | Since | |
| | | | | | | | | Inception | |
| | | | | | 1 Year | | | (05/03/10) | |
| Institutional Class Shares | | | | | | | 2.28 | % | | | 4.22 | % |
| HFRX Global Hedge Fund Index | | | | | | | 3.58 | % | | | -1.16 | % |
| S&P 500 Index | | | | | | | 16.00 | % | | | 8.96 | % |
| * | The performance data above represents past performance that is not predictive of future results. The investment return and principal value of an investment in the Fund will fluctuate so that an investor’s shares, when redeemed, may be worth more or less than their original cost. Returns are historical and include changes in principal and reinvested dividends and capital gains and do not reflect the effect of taxes. The HFRX Global Hedge Fund Index and S&P 500 Index are unmanaged indices and, unlike the Fund, have no management fees or operating expenses to reduce their reported returns. The graphs are based on A-Class shares and H-Class shares only; performance for C-Class shares and Institutional Class shares will vary due to differences in fee structures. |
| † | Fund returns are calculated using the maximum sales charge of 4.75%. |
| ‡ | Fund returns include a CDSC of 1% if redeemed within 12 months of purchase. |
| THE GUGGENHEIM FUNDS ANNUAL REPORT | 27 |
| CONSOLIDATED SCHEDULE OF INVESTMENTS | December 31, 2012 |
| MULTI-HEDGE STRATEGIES FUND | |
| | | Shares | | | Value | |
| | | | | | | |
| COMMON STOCKS† - 59.2% | | | | | | | | |
| FINANCIALS - 13.1% | | | | | | | | |
| Jefferies Group, Inc.1 | | | 139,036 | | | $ | 2,581,899 | |
| NYSE Euronext | | | 37,026 | | | | 1,167,799 | |
| Alterra Capital Holdings Ltd. | | | 29,302 | | | | 826,023 | |
| Hudson City Bancorp, Inc.1 | | | 100,428 | | | | 816,479 | |
| SeaBright Holdings, Inc.1 | | | 61,823 | | | | 684,381 | |
| Knight Capital Group, Inc. — Class A*,2 | | | 194,798 | | | | 683,741 | |
| Epoch Holding Corp. | | | 24,237 | | | | 676,212 | |
| Citizens Republic Bancorp, Inc.*,1 | | | 35,558 | | | | 674,535 | |
| State Street Corp.1 | | | 7,796 | | | | 366,490 | |
| American Capital Ltd.*,1 | | | 29,746 | | | | 356,952 | |
| Torchmark Corp.1 | | | 6,813 | | | | 352,028 | |
| MFA Financial, Inc.1 | | | 43,259 | | | | 350,830 | |
| Allied World Assurance Company Holdings AG1 | | | 4,277 | | | | 337,028 | |
| CNA Financial Corp.1 | | | 11,845 | | | | 331,778 | |
| American Capital Agency Corp.1 | | | 11,354 | | | | 328,585 | |
| Huntington Bancshares, Inc.1 | | | 51,319 | | | | 327,928 | |
| Assurant, Inc.1 | | | 9,385 | | | | 325,660 | |
| Hospitality Properties Trust1 | | | 13,775 | | | | 322,610 | |
| BB&T Corp.1 | | | 10,522 | | | | 306,295 | |
| Hatteras Financial Corp.1 | | | 11,922 | | | | 295,785 | |
| BOK Financial Corp.1 | | | 5,298 | | | | 288,529 | |
| Allstate Corp.1 | | | 6,623 | | | | 266,046 | |
| American International Group, Inc.*,1 | | | 6,964 | | | | 245,829 | |
| Bank of America Corp.1 | | | 20,285 | | | | 235,306 | |
| Arch Capital Group Ltd.*,1 | | | 5,336 | | | | 234,891 | |
| Axis Capital Holdings Ltd.1 | | | 6,320 | | | | 218,925 | |
| Discover Financial Services1 | | | 5,222 | | | | 201,308 | |
| Howard Hughes Corp.*,1 | | | 2,737 | | | | 199,856 | |
| Douglas Emmett, Inc.1 | | | 8,477 | | | | 197,513 | |
| PNC Financial Services Group, Inc.1 | | | 3,292 | | | | 191,957 | |
| Washington Federal, Inc.1 | | | 10,824 | | | | 182,601 | |
| Protective Life Corp.1 | | | 6,130 | | | | 175,195 | |
| JPMorgan Chase & Co.1 | | | 3,973 | | | | 174,693 | |
| Macerich Co.1 | | | 2,990 | | | | 174,316 | |
| Alliance Financial Corp.1 | | | 3,825 | | | | 166,426 | |
| Invesco Ltd.1 | | | 6,130 | | | | 159,932 | |
| MetLife, Inc.1 | | | 4,807 | | | | 158,343 | |
| Synovus Financial Corp.1 | | | 62,029 | | | | 151,971 | |
| Regions Financial Corp.1 | | | 16,312 | | | | 116,141 | |
| SunTrust Banks, Inc.1 | | | 3,406 | | | | 96,560 | |
| Ares Capital Corp.1 | | | 4,789 | | | | 83,808 | |
| SLM Corp.1 | | | 4,821 | | | | 82,584 | |
| Ameriprise Financial, Inc.1 | | | 1,286 | | | | 80,542 | |
| American Realty Capital Trust, Inc. | | | 5,864 | | | | 67,729 | |
| Assured Guaranty Ltd.1 | | | 2,914 | | | | 41,466 | |
| Capitol Federal Financial, Inc.1 | | | 2,723 | | | | 31,832 | |
| American Tower Corp. — Class A1 | | | 341 | | | | 26,349 | |
| Simon Property Group, Inc.1 | | | 151 | | | | 23,872 | |
| Alexander & Baldwin, Inc.*,1 | | | 784 | | | | 23,026 | |
| American National Insurance Co.1 | | | 317 | | | | 21,648 | |
| Ventas, Inc.1 | | | 114 | | | | 7,378 | |
| Everest Re Group Ltd.1 | | | 37 | | | | 4,068 | |
| Validus Holdings Ltd. | | | 1 | | | | 35 | |
| Total Financials | | | | | | | 16,443,713 | |
| INDUSTRIALS - 10.1% | | | | | | | | |
| Robbins & Myers, Inc.1 | | | 42,647 | | | | 2,535,365 | |
| Shaw Group, Inc.*,1 | | | 37,325 | | | | 1,739,718 | |
| Cascade Corp.1 | | | 21,047 | | | | 1,353,321 | |
| GeoEye, Inc.*,1 | | | 41,726 | | | | 1,282,239 | |
| Timken Co.1 | | | 9,007 | | | | 430,806 | |
| Southwest Airlines Co.1 | | | 35,308 | | | | 361,554 | |
| Northrop Grumman Corp.1 | | | 5,298 | | | | 358,039 | |
| Terex Corp.*,1 | | | 12,351 | | | | 347,187 | |
| Carlisle Companies, Inc.1 | | | 5,185 | | | | 304,671 | |
| Trinity Industries, Inc.1 | | | 8,326 | | | | 298,237 | |
| Regal-Beloit Corp.1 | | | 4,087 | | | | 288,012 | |
| Raytheon Co.1 | | | 4,807 | | | | 276,691 | |
| Republic Services, Inc. — Class A1 | | | 8,289 | | | | 243,117 | |
| KAR Auction Services, Inc.1 | | | 11,922 | | | | 241,301 | |
| Ingersoll-Rand plc1 | | | 4,995 | | | | 239,560 | |
| Union Pacific Corp.1 | | | 1,767 | | | | 222,146 | |
| FedEx Corp.1 | | | 2,390 | | | | 219,212 | |
| Cintas Corp.1 | | | 5,261 | | | | 215,175 | |
| L-3 Communications Holdings, Inc.1 | | | 2,679 | | | | 205,265 | |
| Armstrong World Industries, Inc.1 | | | 4,014 | | | | 203,630 | |
| Lincoln Electric Holdings, Inc.1 | | | 3,973 | | | | 193,406 | |
| GATX Corp.1 | | | 4,126 | | | | 178,655 | |
| AGCO Corp.*,1 | | | 3,065 | | | | 150,553 | |
| Copa Holdings S.A. — Class A1 | | | 1,342 | | | | 133,462 | |
| Con-way, Inc.1 | | | 3,785 | | | | 105,299 | |
| Owens Corning*,1 | | | 2,452 | | | | 90,699 | |
| Kansas City Southern1 | | | 1,022 | | | | 85,317 | |
| Fortune Brands Home & Security, Inc.*,1 | | | 2,899 | | | | 84,709 | |
| Equifax, Inc.1 | | | 1,400 | | | | 75,768 | |
| Delta Air Lines, Inc.*,1 | | | 5,560 | | | | 65,997 | |
| Hertz Global Holdings, Inc.*,1 | | | 3,528 | | | | 57,401 | |
| Kennametal, Inc.1 | | | 605 | | | | 24,200 | |
| Hubbell, Inc. — Class B1 | | | 264 | | | | 22,342 | |
| General Electric Co.1 | | | 1,060 | | | | 22,249 | |
| WESCO International, Inc.*,1 | | | 50 | | | | 3,372 | |
| Eaton Corporation plc | | | 14 | | | | 759 | |
| Total Industrials | | | | | | | 12,659,434 | |
| CONSUMER DISCRETIONARY - 8.8% | | | | | | | | |
| Warnaco Group, Inc.*,1 | | | 37,547 | | | | 2,687,239 | |
| Kayak Software Corp.* | | | 34,255 | | | | 1,360,608 | |
| Arbitron, Inc. | | | 21,358 | | | | 996,992 | |
| Jarden Corp.1 | | | 8,265 | | | | 427,301 | |
| Comcast Corp. — Class A1 | | | 9,540 | | | | 356,604 | |
| Focus Media Holding Ltd. ADR | | | 13,387 | | | | 343,779 | |
| Foot Locker, Inc.1 | | | 10,673 | | | | 342,817 | |
| Ameristar Casinos, Inc. | | | 12,936 | | | | 339,440 | |
| Macy’s, Inc.1 | | | 8,667 | | | | 338,187 | |
| Liberty Media Corporation - | | | | | | | | |
| Liberty Capital — Class A*,1 | | | 2,687 | | | | 311,719 | |
| Wyndham Worldwide Corp.1 | | | 5,639 | | | | 300,051 | |
| Time Warner Cable, Inc.1 | | | 2,662 | | | | 258,720 | |
| O’Reilly Automotive, Inc.*,1 | | | 2,650 | | | | 236,963 | |
| Dillard’s, Inc. — Class A1 | | | 2,725 | | | | 228,273 | |
| Thor Industries, Inc.1 | | | 6,058 | | | | 226,751 | |
| Service Corporation International1 | | | 15,545 | | | | 214,677 | |
| Advance Auto Parts, Inc.1 | | | 2,801 | | | | 202,652 | |
| 28 | THE GUGGENHEIM FUNDS ANNUAL REPORT | SEE NOTES TO FINANCIAL STATEMENTS. |
| CONSOLIDATED SCHEDULE OF INVESTMENTS (continued) | December 31, 2012 |
| MULTI-HEDGE STRATEGIES FUND | |
| | | Shares | | | Value | |
| | | | | | | |
| Newell Rubbermaid, Inc.1 | | | 7,018 | | | $ | 156,291 | |
| Brinker International, Inc.1 | | | 4,995 | | | | 154,795 | |
| Whirlpool Corp.1 | | | 1,407 | | | | 143,162 | |
| Harman International Industries, Inc.1 | | | 3,205 | | | | 143,071 | |
| Madison Square Garden Co. — Class A*,1 | | | 2,763 | | | | 122,539 | |
| Time Warner, Inc.1 | | | 2,536 | | | | 121,297 | |
| DR Horton, Inc.1 | | | 5,008 | | | | 99,058 | |
| PulteGroup, Inc.*,1 | | | 4,949 | | | | 89,874 | |
| Mohawk Industries, Inc.*,1 | | | 966 | | | | 87,393 | |
| Lennar Corp. — Class A1 | | | 2,226 | | | | 86,079 | |
| Toll Brothers, Inc.*,1 | | | 2,626 | | | | 84,899 | |
| Leggett & Platt, Inc.1 | | | 3,053 | | | | 83,103 | |
| Cinemark Holdings, Inc.1 | | | 3,104 | | | | 80,642 | |
| Genuine Parts Co.1 | | | 1,191 | | | | 75,724 | |
| John Wiley & Sons, Inc. — Class A1 | | | 1,897 | | | | 73,850 | |
| Expedia, Inc.1 | | | 946 | | | | 58,132 | |
| Staples, Inc.1 | | | 4,105 | | | | 46,797 | |
| Goodyear Tire & Rubber Co.*,1 | | | 3,028 | | | | 41,817 | |
| Carter’s, Inc.*,1 | | | 644 | | | | 35,839 | |
| Tempur-Pedic International, Inc.*,1 | | | 791 | | | | 24,909 | |
| General Motors Co.*,1 | | | 271 | | | | 7,813 | |
| Liberty Interactive Corp. — Class A*,1 | | | 303 | | | | 5,963 | |
| Harley-Davidson, Inc.1 | | | 97 | | | | 4,737 | |
| Total Consumer Discretionary | | | | | | | 11,000,557 | |
| HEALTH CARE - 7.8% | | | | | | | | |
| Coventry Health Care, Inc.1 | | | 65,320 | | | | 2,928,295 | |
| PSS World Medical, Inc.*,1 | | | 78,531 | | | | 2,267,975 | |
| Sunrise Senior Living, Inc.*,1 | | | 70,819 | | | | 1,018,378 | |
| LifePoint Hospitals, Inc.*,1 | | | 10,382 | | | | 391,921 | |
| Amgen, Inc.1 | | | 4,076 | | | | 351,840 | |
| Cooper Companies, Inc.1 | | | 3,672 | | | | 339,587 | |
| Biogen Idec, Inc.*,1 | | | 2,056 | | | | 301,554 | |
| Merck & Company, Inc.1 | | | 6,158 | | | | 252,108 | |
| Agilent Technologies, Inc.1 | | | 5,942 | | | | 243,264 | |
| Medtronic, Inc.1 | | | 4,466 | | | | 183,195 | |
| Pfizer, Inc.1 | | | 6,911 | | | | 173,328 | |
| YM Biosciences, Inc.* | | | 58,271 | | | | 167,238 | |
| United Therapeutics Corp.*,1 | | | 2,898 | | | | 154,811 | |
| Perrigo Co.1 | | | 1,261 | | | | 131,182 | |
| Alexion Pharmaceuticals, Inc.*,1 | | | 1,184 | | | | 111,071 | |
| McKesson Corp.1 | | | 1,135 | | | | 110,050 | |
| Gilead Sciences, Inc.*,1 | | | 1,285 | | | | 94,383 | |
| Celgene Corp.*,1 | | | 1,070 | | | | 84,230 | |
| Bio-Rad Laboratories, Inc. — Class A*,1 | | | 795 | | | | 83,515 | |
| Onyx Pharmaceuticals, Inc.*,1 | | | 1,085 | | | | 81,950 | |
| Vertex Pharmaceuticals, Inc.*,1 | | | 1,840 | | | | 77,170 | |
| Myriad Genetics, Inc.*,1 | | | 2,700 | | | | 73,575 | |
| Quest Diagnostics, Inc.1 | | | 757 | | | | 44,111 | |
| Regeneron Pharmaceuticals, Inc.*,1 | | | 174 | | | | 29,766 | |
| HCA Holdings, Inc.1 | | | 908 | | | | 27,394 | |
| UnitedHealth Group, Inc.1 | | | 454 | | | | 24,625 | |
| Community Health Systems, Inc.1 | | | 741 | | | | 22,778 | |
| Covance, Inc.*,1 | | | 163 | | | | 9,417 | |
| Cigna Corp.1 | | | 151 | | | | 8,072 | |
| Omnicare, Inc.1 | | | 114 | | | | 4,115 | |
| Medivation, Inc.*,1 | | | 55 | | | | 2,814 | |
| Total Health Care | | | | | | | 9,793,712 | |
| INFORMATION TECHNOLOGY - 7.3% | | | | | | | | |
| Cymer, Inc.*,1 | | | 14,906 | | | | 1,347,949 | |
| TNS, Inc.* | | | 32,693 | | | | 677,727 | |
| Intermec, Inc.* | | | 68,446 | | | | 674,877 | |
| Retalix Ltd.*,1 | | | 22,593 | | | | 672,369 | |
| IAC/InterActiveCorp1 | | | 8,460 | | | | 400,157 | |
| Alliance Data Systems Corp.*,1 | | | 2,423 | | | | 350,753 | |
| Fidelity National Information Services, Inc.1 | | | 9,915 | | | | 345,141 | |
| Symantec Corp.*,1 | | | 17,901 | | | | 336,717 | |
| Activision Blizzard, Inc.1 | | | 28,271 | | | | 300,238 | |
| Tech Data Corp.*,1 | | | 6,323 | | | | 287,886 | |
| Western Digital Corp.1 | | | 6,699 | | | | 284,641 | |
| Diebold, Inc.1 | | | 8,175 | | | | 250,237 | |
| Cisco Systems, Inc.1 | | | 12,716 | | | | 249,869 | |
| KLA-Tencor Corp.1 | | | 4,844 | | | | 231,349 | |
| Intel Corp.1 | | | 11,143 | | | | 229,881 | |
| FleetCor Technologies, Inc.*,1 | | | 4,126 | | | | 221,360 | |
| QUALCOMM, Inc.1 | | | 3,482 | | | | 215,954 | |
| Maxim Integrated Products, Inc.1 | | | 6,926 | | | | 203,624 | |
| Brocade Communications Systems, Inc.*,1 | | | 36,824 | | | | 196,272 | |
| NeuStar, Inc. — Class A*,1 | | | 4,390 | | | | 184,073 | |
| Equinix, Inc.*,1 | | | 764 | | | | 157,536 | |
| DST Systems, Inc.1 | | | 2,460 | | | | 149,076 | |
| Booz Allen Hamilton Holding Corp.1,2 | | | 9,061 | | | | 126,129 | |
| Applied Materials, Inc.1 | | | 8,477 | | | | 96,977 | |
| Xilinx, Inc.1 | | | 2,687 | | | | 96,463 | |
| Yahoo!, Inc.*,1 | | | 4,625 | | | | 92,038 | |
| Akamai Technologies, Inc.*,1 | | | 2,215 | | | | 90,616 | |
| eBay, Inc.*,1 | | | 1,706 | | | | 87,040 | |
| Adobe Systems, Inc.*,1 | | | 2,233 | | | | 84,139 | |
| Rackspace Hosting, Inc.*,1 | | | 1,040 | | | | 77,241 | |
| Synopsys, Inc.*,1 | | | 2,157 | | | | 68,679 | |
| Xerox Corp.1 | | | 9,915 | | | | 67,620 | |
| Avago Technologies Ltd.1 | | | 2,088 | | | | 66,106 | |
| AOL, Inc.1 | | | 2,124 | | | | 62,892 | |
| Jabil Circuit, Inc.1 | | | 2,536 | | | | 48,919 | |
| CA, Inc.1 | | | 1,816 | | | | 39,916 | |
| VeriSign, Inc.*,1 | | | 825 | | | | 32,027 | |
| Total Information Technology | | | | | | | 9,104,488 | |
| CONSUMER STAPLES - 3.3% | | | | | | | | |
| Ralcorp Holdings, Inc.* | | | 18,760 | | | | 1,681,833 | |
| CVS Caremark Corp.1 | | | 7,342 | | | | 354,986 | |
| Ingredion, Inc.1 | | | 5,488 | | | | 353,591 | |
| Coca-Cola Enterprises, Inc.1 | | | 9,802 | | | | 311,018 | |
| Smithfield Foods, Inc.*,1 | | | 14,306 | | | | 308,580 | |
| JM Smucker Co.1 | | | 3,445 | | | | 297,097 | |
| Mondelez International, Inc. — Class A1 | | | 9,538 | | | | 242,933 | |
| Church & Dwight Company, Inc.1 | | | 2,838 | | | | 152,032 | |
| Nu Skin Enterprises, Inc. — Class A1,2 | | | 3,681 | | | | 136,381 | |
| Constellation Brands, Inc. — Class A*,1 | | | 3,445 | | | | 121,919 | |
| Archer-Daniels-Midland Co.1 | | | 3,899 | | | | 106,794 | |
| Wal-Mart Stores, Inc.1 | | | 1,098 | | | | 74,917 | |
| Total Consumer Staples | | | | | | | 4,142,081 | |
| SEE NOTES TO FINANCIAL STATEMENTS. | THE GUGGENHEIM FUNDS ANNUAL REPORT | 29 |
| CONSOLIDATED SCHEDULE OF INVESTMENTS (continued) | December 31, 2012 |
| MULTI-HEDGE STRATEGIES FUND | |
| | | Shares | | | Value | |
| | | | | | | |
| UTILITIES - 3.1% | | | | | | | | |
| CH Energy Group, Inc.1 | | | 15,916 | | | $ | 1,038,042 | |
| Pinnacle West Capital Corp.1 | | | 7,001 | | | | 356,912 | |
| DTE Energy Co.1 | | | 5,903 | | | | 354,475 | |
| American Water Works Company, Inc.1 | | | 9,272 | | | | 344,270 | |
| SCANA Corp.1 | | | 7,455 | | | | 340,246 | |
| ONEOK, Inc.1 | | | 7,405 | | | | 316,563 | |
| Ameren Corp.1 | | | 9,158 | | | | 281,334 | |
| NextEra Energy, Inc.1 | | | 3,368 | | | | 233,032 | |
| American Electric Power Company, Inc.1 | | | 5,449 | | | | 232,563 | |
| PPL Corp.1 | | | 7,682 | | | | 219,936 | |
| Wisconsin Energy Corp.1 | | | 2,611 | | | | 96,215 | |
| Atmos Energy Corp.1 | | | 605 | | | | 21,248 | |
| Westar Energy, Inc.1 | | | 491 | | | | 14,052 | |
| Total Utilities | | | | | | | 3,848,888 | |
| MATERIALS - 2.8% | | | | | | | | |
| Reliance Steel & Aluminum Co.1 | | | 6,207 | | | | 385,454 | |
| Rock Tenn Co. — Class A1 | | | 5,449 | | | | 380,939 | |
| Commercial Metals Co.1 | | | 25,432 | | | | 377,919 | |
| Huntsman Corp.1 | | | 21,634 | | | | 343,981 | |
| CF Industries Holdings, Inc.1 | | | 1,627 | | | | 330,542 | |
| Westlake Chemical Corp.1 | | | 3,292 | | | | 261,056 | |
| International Paper Co.1 | | | 5,752 | | | | 229,160 | |
| Rockwood Holdings, Inc.1 | | | 3,899 | | | | 192,845 | |
| Spartech Corp.*,1 | | | 21,200 | | | | 192,284 | |
| LyondellBasell Industries N.V. — Class A1 | | | 3,368 | | | | 192,279 | |
| Nucor Corp.1 | | | 3,104 | | | | 134,031 | |
| Bemis Company, Inc.1 | | | 3,595 | | | | 120,289 | |
| Vulcan Materials Co.1 | | | 1,722 | | | | 89,630 | |
| RPM International, Inc.1 | | | 2,558 | | | | 75,103 | |
| Cytec Industries, Inc.1 | | | 1,022 | | | | 70,344 | |
| Steel Dynamics, Inc.1 | | | 3,558 | | | | 48,851 | |
| Intrepid Potash, Inc.1 | | | 2,067 | | | | 44,006 | |
| Domtar Corp.1 | | | 372 | | | | 31,069 | |
| Carpenter Technology Corp.1 | | | 454 | | | | 23,440 | |
| Cabot Corp.1 | | | 270 | | | | 10,743 | |
| Total Materials | | | | | | | 3,533,965 | |
| ENERGY - 2.0% | | | | | | | | |
| Tesoro Corp.1 | | | 8,326 | | | | 366,760 | |
| ConocoPhillips1 | | | 6,093 | | | | 353,333 | |
| Nexen, Inc.1 | | | 12,703 | | | | 342,219 | |
| Chevron Corp.1 | | | 2,990 | | | | 323,338 | |
| Valero Energy Corp.1 | | | 7,986 | | | | 272,482 | |
| Unit Corp.*,1 | | | 5,071 | | | | 228,449 | |
| Denbury Resources, Inc.*,1 | | | 11,013 | | | | 178,411 | |
| Marathon Petroleum Corp.1 | | | 1,627 | | | | 102,501 | |
| Patterson-UTI Energy, Inc.1 | | | 5,109 | | | | 95,181 | |
| Helmerich & Payne, Inc.1 | | | 1,325 | | | | 74,213 | |
| Oil States International, Inc.*,1 | | | 946 | | | | 67,677 | |
| Concho Resources, Inc.*,1 | | | 795 | | | | 64,045 | |
| HollyFrontier Corp.1 | | | 984 | | | | 45,805 | |
| SandRidge Energy, Inc.*,1,2 | | | 6,888 | | | | 43,739 | |
| Pioneer Natural Resources Co.1 | | | 190 | | | | 20,252 | |
| Atwood Oceanics, Inc.*,1 | | | 114 | | | | 5,220 | |
| Total Energy | | | | | | | 2,583,625 | |
| TELECOMMUNICATION SERVICES - 0.9% | | | | | | | | |
| Sprint Nextel Corp.*,1 | | | 123,543 | | | | 700,489 | |
| Verizon Communications, Inc.1 | | | 5,903 | | | | 255,423 | |
| Telephone & Data Systems, Inc.1 | | | 3,464 | | | | 76,693 | |
| SBA Communications Corp. — Class A*,1 | | | 827 | | | | 58,734 | |
| United States Cellular Corp.*,1 | | | 638 | | | | 22,483 | |
| CenturyLink, Inc.1 | | | 568 | | | | 22,220 | |
| MetroPCS Communications, Inc.*,1 | | | 1,364 | | | | 13,558 | |
| Total Telecommunication Services | | | | | | | 1,149,600 | |
| Total Common Stocks | | | | | | | | |
| (Cost $68,609,527) | | | | | | | 74,260,063 | |
| EXCHANGE TRADED FUNDS† - 1.7% | | | | | | | | |
| iShares MSCI Mexico Investable Market | | | | | | | | |
| Index Fund1 | | | 8,517 | | | | 600,704 | |
| iShares MSCI United Kingdom Index Fund1,2 | | | 22,538 | | | | 404,332 | |
| iShares MSCI Australia Index Fund1,2 | | | 9,482 | | | | 238,377 | |
| iShares MSCI Turkey Index Fund1 | | | 2,997 | | | | 200,140 | |
| iShares MSCI South Africa Index Fund1 | | | 1,721 | | | | 123,189 | |
| iShares MSCI Malaysia Index Fund1 | | | 7,425 | | | | 112,340 | |
| iShares MSCI Singapore Index Fund1 | | | 8,052 | | | | 110,232 | |
| iShares MSCI South Korea Index Fund1 | | | 1,739 | | | | 110,183 | |
| iShares MSCI Sweden Index Fund1 | | | 3,287 | | | | 99,267 | |
| Vanguard MSCI Emerging Markets ETF1 | | | 2,138 | | | | 95,205 | |
| Total Exchange Traded Funds | | | | | | | | |
| (Cost $1,881,608) | | | | | | | 2,093,969 | |
| CLOSED-END FUNDS† - 13.4% | | | | | | | | |
| Royce Value Trust, Inc.1 | | | 63,596 | | | | 853,457 | |
| BlackRock Global Opportunities Equity Trust1 | | | 63,930 | | | | 843,875 | |
| Gabelli Dividend & Income Trust1 | | | 51,125 | | | | 827,203 | |
| Eaton Vance Risk-Managed Diversified | | | | | | | | |
| Equity Income Fund1 | | | 78,310 | | | | 816,773 | |
| BlackRock Enhanced Equity | | | | | | | | |
| Dividend Trust1 | | | 111,759 | | | | 802,430 | |
| Eaton Vance Tax-Managed Diversified | | | | | | | | |
| Equity Income Fund1 | | | 85,338 | | | | 799,617 | |
| Eaton Vance Enhanced Equity | | | | | | | | |
| Income Fund II1 | | | 74,790 | | | | 780,808 | |
| India Fund, Inc.1 | | | 36,176 | | | | 756,440 | |
| Liberty All Star Equity Fund1 | | | 145,253 | | | | 692,857 | |
| BlackRock Credit Allocation Income Trust IV1 | | | 47,204 | | | | 648,111 | |
| Western Asset/Claymore Inflation-Linked | | | | | | | | |
| Opportunities & Income Fund1,6 | | | 49,006 | | | | 646,879 | |
| AGIC Equity & Convertible Income Fund1 | | | 32,513 | | | | 541,016 | |
| Adams Express Co.1 | | | 48,740 | | | | 516,157 | |
| Clough Global Opportunities Fund1 | | | 43,576 | | | | 511,582 | |
| Eaton Vance Enhanced Equity Income Fund1 | | | 46,624 | | | | 497,012 | |
| Eaton Vance Tax-Managed Global | | | | | | | | |
| Diversified Equity Income Fund1 | | | 54,885 | | | | 483,537 | |
| Zweig Total Return Fund, Inc.1 | | | 38,348 | | | | 472,064 | |
| Eaton Vance Tax-Advantaged Global | | | | | | | | |
| Dividend Opportunities Fund1 | | | 23,364 | | | | 469,383 | |
| General American Investors Company, Inc.1 | | | 15,572 | | | | 433,213 | |
| Western Asset/Claymore Inflation-Linked | | | | | | | | |
| Securities & Income Fund1,6 | | | 27,960 | | | | 366,556 | |
| John Hancock Hedged | | | | | | | | |
| Equity & Income Fund1 | | | 21,516 | | | | 328,334 | |
| 30 | THE GUGGENHEIM FUNDS ANNUAL REPORT | SEE NOTES TO FINANCIAL STATEMENTS. |
| CONSOLIDATED SCHEDULE OF INVESTMENTS (continued) | December 31, 2012 |
| MULTI-HEDGE STRATEGIES FUND | |
| | | Shares | | | Value | |
| | | | | | | |
| Tri-Continental Corp.1 | | | 20,226 | | | $ | 323,616 | |
| Zweig Fund, Inc.1 | | | 24,956 | | | | 304,214 | |
| Royce Micro-Capital Trust, Inc.1 | | | 26,710 | | | | 252,410 | |
| First Trust Enhanced Equity Income Fund1 | | | 19,237 | | | | 227,766 | |
| Eaton Vance Tax Managed Global Buy | | | | | | | | |
| Write Opportunities Fund1 | | | 21,027 | | | | 224,779 | |
| Japan Smaller Capitalization Fund, Inc.1 | | | 30,436 | | | | 219,139 | |
| Source Capital, Inc.1 | | | 3,994 | | | | 208,567 | |
| Madison Covered Call & Equity | | | | | | | | |
| Strategy Fund1 | | | 26,818 | | | | 204,353 | |
| GDL Fund1 | | | 17,097 | | | | 195,248 | |
| Nuveen Tax-Advantaged Total Return | | | | | | | | |
| Strategy Fund1 | | | 18,283 | | | | 192,154 | |
| AGIC Global Equity & Convertible | | | | | | | | |
| Income Fund1 | | | 12,927 | | | | 174,385 | |
| Clough Global Allocation Fund1 | | | 12,185 | | | | 166,935 | |
| Templeton Dragon Fund, Inc.1 | | | 5,719 | | | | 162,648 | |
| Swiss Helvetia Fund, Inc.1 | | | 14,072 | | | | 158,873 | |
| Lazard Global Total Return and | | | | | | | | |
| Income Fund, Inc.1 | | | 8,577 | | | | 129,427 | |
| Gabelli Healthcare & WellnessRx Trust1 | | | 12,261 | | | | 105,690 | |
| Royce Focus Trust, Inc.1 | | | 15,453 | | | | 101,990 | |
| Liberty All Star Growth Fund, Inc.1 | | | 25,081 | | | | 101,578 | |
| Madison Strategic Sector Premium Fund1 | | | 6,573 | | | | 72,895 | |
| Ellsworth Fund Ltd.1 | | | 9,816 | | | | 70,086 | |
| Bancroft Fund Ltd.1 | | | 3,958 | | | | 64,990 | |
| Dividend and Income Fund1 | | | 1,820 | | | | 24,625 | |
| Thai Fund, Inc.1 | | | 180 | | | | 3,591 | |
| Total Closed-End Funds | | | | | | | | |
| (Cost $15,413,661) | | | | | | | 16,777,263 | |
| | | | Face | | | | | |
| | | | Amount | | | | | |
| FEDERAL AGENCY DISCOUNT NOTES†† - 1.6% | | | | | | | | |
| Freddie Mac3 | | | | | | | | |
| 0.15% due 02/11/13 | | $ | 1,000,000 | | | | 999,956 | |
| Fannie Mae3 | | | | | | | | |
| 0.15% due 02/21/13 | | | 1,000,000 | | | | 999,944 | |
| Total Federal Agency Discount Notes | | | | | | | | |
| (Cost $1,999,617) | | | | | | | 1,999,900 | |
| REPURCHASE AGREEMENTS††,4 - 14.2% | | | | | | | | |
| HSBC Group | | | | | | | | |
| issued 12/31/12 at 0.12% | | | | | | | | |
| due 01/02/13 | | | 7,779,622 | | | | 7,779,622 | |
| Deutsche Bank | | | | | | | | |
| issued 12/31/12 at 0.11% | | | | | | | | |
| due 01/02/13 | | | 3,978,792 | | | | 3,978,792 | |
| Mizuho Financial Group, Inc. | | | | | | | | |
| issued 12/31/12 at 0.14% | | | | | | | | |
| due 01/02/13 | | | 3,384,511 | | | | 3,384,511 | |
| Credit Suisse Group | | | | | | | | |
| issued 12/31/12 at 0.12% | | | | | | | | |
| due 01/02/13 | | | 2,664,988 | | | | 2,664,988 | |
| Total Repurchase Agreements | | | | | | | | |
| (Cost $17,807,913) | | | | | | | 17,807,913 | |
| SECURITIES LENDING COLLATERAL††,5 - 0.6% | | | | | | | | |
| Repurchase Agreements | | | | | | | | |
| Merrill Lynch, Pierce, Fenner & Smith, Inc. | | | | | | | | |
| issued 12/31/12 at 0.16% | | | | | | | | |
| due 01/02/13 | | | 472,702 | | | | 472,702 | |
| RBS Securities, Inc. | | | | | | | | |
| issued 12/31/12 at 0.20% | | | | | | | | |
| due 01/02/13 | | | 300,014 | | | | 300,014 | |
| Total Securities Lending Collateral | | | | | | | | |
| (Cost $772,716) | | | | | | | 772,716 | |
| | | | Contracts | | | | | |
| OPTIONS PURCHASED† - 0.0% | | | | | | | | |
| Put Option on: | | | | | | | | |
| Sprint Nextel Corp. | | | | | | | | |
| Expiring February 2013 | | | | | | | | |
| with strike price of $5.00 | | | 560 | | | | 2,800 | |
| Total Options Purchased | | | | | | | | |
| (Cost $4,726) | | | | | | | 2,800 | |
| Total Long Investments - 90.7% | | | | | | | | |
| (Cost $106,489,768) | | | | | | | 113,714,624 | |
| | | | Shares | | | | | |
| COMMON STOCKS SOLD SHORT† - (37.3)% | | | | | | | | |
| Telecommunication Services - (0.3)% | | | | | | | | |
| Windstream Corp. | | | 17,407 | | | | (144,130 | ) |
| Level 3 Communications, Inc.* | | | 8,969 | | | | (207,274 | ) |
| Total Telecommunication Services | | | | | | | (351,404 | ) |
| ENERGY - (1.8)% | | | | | | | | |
| Cameron International Corp.* | | | 114 | | | | (6,436 | ) |
| Cobalt International Energy, Inc.* | | | 379 | | | | (9,308 | ) |
| Cabot Oil & Gas Corp. | | | 188 | | | | (9,351 | ) |
| Exxon Mobil Corp. | | | 122 | | | | (10,559 | ) |
| Newfield Exploration Co.* | | | 568 | | | | (15,211 | ) |
| QEP Resources, Inc. | | | 681 | | | | (20,614 | ) |
| Equities Corp. | | | 378 | | | | (22,294 | ) |
| National Oilwell Varco, Inc. | | | 572 | | | | (39,096 | ) |
| Schlumberger Ltd. | | | 1,310 | | | | (90,770 | ) |
| Cimarex Energy Co. | | | 1,627 | | | | (93,927 | ) |
| Hess Corp. | | | 2,119 | | | | (112,222 | ) |
| Range Resources Corp. | | | 2,157 | | | | (135,524 | ) |
| SEACOR Holdings, Inc. | | | 1,703 | | | | (142,711 | ) |
| Ultra Petroleum Corp.* | | | 8,061 | | | | (146,146 | ) |
| CONSOL Energy, Inc. | | | 4,806 | | | | (154,273 | ) |
| Teekay Corp. | | | 4,856 | | | | (155,878 | ) |
| Southwestern Energy Co.* | | | 5,033 | | | | (168,153 | ) |
| Kosmos Energy Ltd.* | | | 13,623 | | | | (168,244 | ) |
| Alpha Natural Resources, Inc.* | | | 17,634 | | | | (171,755 | ) |
| Anadarko Petroleum Corp. | | | 2,384 | | | | (177,155 | ) |
| Dresser-Rand Group, Inc.* | | | 3,178 | | | | (178,413 | ) |
| FMC Technologies, Inc.* | | | 5,186 | | | | (222,117 | ) |
| Total Energy | | | | | | | (2,250,157 | ) |
| SEE NOTES TO FINANCIAL STATEMENTS. | THE GUGGENHEIM FUNDS ANNUAL REPORT | 31 |
| CONSOLIDATED SCHEDULE OF INVESTMENTS (continued) | December 31, 2012 |
| MULTI-HEDGE STRATEGIES FUND | |
| | | Shares | | | Value | |
| | | | | | | |
| CONSUMER STAPLES - (2.1)% | | | | | | | | |
| Herbalife Ltd. | | | 875 | | | $ | (28,823 | ) |
| Dr Pepper Snapple Group, Inc. | | | 681 | | | | (30,087 | ) |
| Estee Lauder Companies, Inc. — Class A | | | 705 | | | | (42,201 | ) |
| Brown-Forman Corp. — Class B | | | 738 | | | | (46,679 | ) |
| Campbell Soup Co. | | | 2,687 | | | | (93,749 | ) |
| Colgate-Palmolive Co. | | | 958 | | | | (100,149 | ) |
| ConAgra Foods, Inc. | | | 4,540 | | | | (133,930 | ) |
| Dean Foods Co.* | | | 8,742 | | | | (144,330 | ) |
| Hormel Foods Corp. | | | 4,730 | | | | (147,623 | ) |
| Hershey Co. | | | 2,157 | | | | (155,779 | ) |
| Coca-Cola Co. | | | 4,390 | | | | (159,138 | ) |
| HJ Heinz Co. | | | 2,877 | | | | (165,945 | ) |
| PepsiCo, Inc. | | | 2,460 | | | | (168,337 | ) |
| Sysco Corp. | | | 5,374 | | | | (170,141 | ) |
| Mead Johnson Nutrition Co. — Class A | | | 2,611 | | | | (172,039 | ) |
| Avon Products, Inc. | | | 12,034 | | | | (172,808 | ) |
| Procter & Gamble Co. | | | 2,573 | | | | (174,682 | ) |
| Kellogg Co. | | | 3,217 | | | | (179,669 | ) |
| Kroger Co. | | | 6,926 | | | | (180,215 | ) |
| Flowers Foods, Inc. | | | 8,325 | | | | (193,723 | ) |
| Total Consumer Staples | | | | | | | (2,660,047 | ) |
| UTILITIES - (2.3)% | | | | | | | | |
| UGI Corp. | | | 718 | | | | (23,486 | ) |
| Pepco Holdings, Inc. | | | 2,914 | | | | (57,144 | ) |
| TECO Energy, Inc. | | | 7,190 | | | | (120,504 | ) |
| CMS Energy Corp. | | | 5,449 | | | | (132,847 | ) |
| Exelon Corp. | | | 4,617 | | | | (137,310 | ) |
| Hawaiian Electric Industries, Inc. | | | 5,601 | | | | (140,809 | ) |
| PG&E Corp. | | | 3,886 | | | | (156,139 | ) |
| AGL Resources, Inc. | | | 4,012 | | | | (160,360 | ) |
| CenterPoint Energy, Inc. | | | 8,552 | | | | (164,626 | ) |
| National Fuel Gas Co. | | | 3,292 | | | | (166,871 | ) |
| Aqua America, Inc. | | | 6,699 | | | | (170,289 | ) |
| Alliant Energy Corp. | | | 3,960 | | | | (173,884 | ) |
| ITC Holdings Corp. | | | 2,270 | | | | (174,586 | ) |
| Questar Corp. | | | 8,969 | | | | (177,227 | ) |
| Northeast Utilities | | | 4,540 | | | | (177,423 | ) |
| Duke Energy Corp. | | | 2,800 | | | | (178,640 | ) |
| Dominion Resources, Inc. | | | 3,506 | | | | (181,611 | ) |
| MDU Resources Group, Inc. | | | 8,653 | | | | (183,790 | ) |
| AES Corp. | | | 17,434 | | | | (186,544 | ) |
| Total Utilities | | | | | | | (2,864,090 | ) |
| MATERIALS - (2.4)% | | | | | | | | |
| Cliffs Natural Resources, Inc. | | | 354 | | | | (13,650 | ) |
| MeadWestvaco Corp. | | | 1,022 | | | | (32,571 | ) |
| Royal Gold, Inc. | | | 464 | | | | (37,728 | ) |
| Walter Energy, Inc. | | | 1,238 | | | | (44,419 | ) |
| Martin Marietta Materials, Inc. | | | 1,058 | | | | (99,748 | ) |
| Tahoe Resources, Inc.* | | | 6,092 | | | | (111,605 | ) |
| Praxair, Inc. | | | 1,172 | | | | (128,275 | ) |
| Alcoa, Inc. | | | 15,629 | | | | (135,660 | ) |
| PolyOne Corp. | | | 6,712 | | | | (137,059 | ) |
| Southern Copper Corp. | | | 3,898 | | | | (147,578 | ) |
| Crown Holdings, Inc.* | | | 4,239 | | | | (156,038 | ) |
| Sigma-Aldrich Corp. | | | 2,195 | | | | (161,508 | ) |
| Compass Minerals International, Inc. | | | 2,233 | | | | (166,828 | ) |
| Ashland, Inc. | | | 2,082 | | | | (167,414 | ) |
| Allied Nevada Gold Corp.* | | | 5,635 | | | | (169,783 | ) |
| Ecolab, Inc. | | | 2,460 | | | | (176,874 | ) |
| Scotts Miracle-Gro Co. — Class A | | | 4,038 | | | | (177,874 | ) |
| Sealed Air Corp. | | | 10,255 | | | | (179,565 | ) |
| International Flavors & Fragrances, Inc. | | | 2,724 | | | | (181,255 | ) |
| Valspar Corp. | | | 3,027 | | | | (188,885 | ) |
| Owens-Illinois, Inc.* | | | 9,044 | | | | (192,365 | ) |
| Newmont Mining Corp. | | | 4,406 | | | | (204,614 | ) |
| Total Materials | | | | | | | (3,011,296 | ) |
| HEALTH CARE - (3.1)% | | | | | | | | |
| Allscripts Healthcare Solutions, Inc.* | | | 3,303 | | | | (31,114 | ) |
| DENTSPLY International, Inc. | | | 795 | | | | (31,490 | ) |
| Ariad Pharmaceuticals, Inc.* | | | 1,739 | | | | (33,354 | ) |
| Varian Medical Systems, Inc.* | | | 530 | | | | (37,227 | ) |
| Salix Pharmaceuticals Ltd.* | | | 999 | | | | (40,440 | ) |
| Cerner Corp.* | | | 526 | | | | (40,839 | ) |
| Watson Pharmaceuticals, Inc.* | | | 475 | | | | (40,850 | ) |
| Abbott Laboratories | | | 624 | | | | (40,872 | ) |
| Allergan, Inc. | | | 447 | | | | (41,003 | ) |
| Eli Lilly & Co. | | | 837 | | | | (41,281 | ) |
| Bristol-Myers Squibb Co. | | | 1,268 | | | | (41,324 | ) |
| CR Bard, Inc. | | | 644 | | | | (62,945 | ) |
| Humana, Inc. | | | 945 | | | | (64,855 | ) |
| Incyte Corp.* | | | 5,471 | | | | (90,873 | ) |
| Alere, Inc.* | | | 4,920 | | | | (91,020 | ) |
| BioMarin Pharmaceutical, Inc.* | | | 1,913 | | | | (94,215 | ) |
| Health Net, Inc.* | | | 4,151 | | | | (100,869 | ) |
| Endo Health Solutions, Inc.* | | | 4,300 | | | | (112,961 | ) |
| Illumina, Inc.* | | | 2,536 | | | | (140,976 | ) |
| Warner Chilcott plc — Class A | | | 12,006 | | | | (144,552 | ) |
| Edwards Lifesciences Corp.* | | | 1,653 | | | | (149,051 | ) |
| Hospira, Inc.* | | | 5,108 | | | | (159,574 | ) |
| Tenet Healthcare Corp.* | | | 4,995 | | | | (162,188 | ) |
| Johnson & Johnson | | | 2,360 | | | | (165,436 | ) |
| Techne Corp. | | | 2,423 | | | | (165,588 | ) |
| Teleflex, Inc. | | | 2,497 | | | | (178,061 | ) |
| Boston Scientific Corp.* | | | 32,165 | | | | (184,305 | ) |
| Bruker Corp.* | | | 12,223 | | | | (186,645 | ) |
| Aetna, Inc. | | | 25,377 | | | | (1,174,955 | ) |
| Total Health Care | | | | | | | (3,848,863 | ) |
| CONSUMER DISCRETIONARY - (4.0)% | | | | | | | | |
| Hyatt Hotels Corp. — Class A* | | | 378 | | | | (14,579 | ) |
| Guess?, Inc. | | | 638 | | | | (15,657 | ) |
| Yum! Brands, Inc. | | | 341 | | | | (22,642 | ) |
| McDonald’s Corp. | | | 264 | | | | (23,287 | ) |
| Hasbro, Inc. | | | 681 | | | | (24,448 | ) |
| NIKE, Inc. — Class B | | | 606 | | | | (31,270 | ) |
| Chipotle Mexican Grill, Inc. — Class A* | | | 114 | | | | (33,910 | ) |
| Washington Post Co. — Class B | | | 101 | | | | (36,886 | ) |
| Weight Watchers International, Inc. | | | 710 | | | | (37,176 | ) |
| Apollo Group, Inc. — Class A* | | | 1,794 | | | | (37,530 | ) |
| Wynn Resorts Ltd. | | | 378 | | | | (42,521 | ) |
| 32 | THE GUGGENHEIM FUNDS ANNUAL REPORT | SEE NOTES TO FINANCIAL STATEMENTS. |
| CONSOLIDATED SCHEDULE OF INVESTMENTS (continued) | December 31, 2012 |
| MULTI-HEDGE STRATEGIES FUND | |
| | | Shares | | | Value | |
| | | | | | | |
| Nordstrom, Inc. | | | 795 | | | $ | (42,533 | ) |
| Gentex Corp. | | | 2,270 | | | | (42,721 | ) |
| DeVry, Inc. | | | 2,209 | | | | (52,420 | ) |
| NVR, Inc.* | | | 84 | | | | (77,280 | ) |
| Cablevision Systems Corp. — Class A | | | 5,260 | | | | (78,584 | ) |
| DreamWorks Animation SKG, Inc. — | | | | | | | | |
| Class A* | | | 4,743 | | | | (78,592 | ) |
| International Game Technology | | | 6,130 | | | | (86,862 | ) |
| Tupperware Brands Corp. | | | 1,487 | | | | (95,317 | ) |
| Morningstar, Inc. | | | 1,627 | | | | (102,224 | ) |
| Starbucks Corp. | | | 2,082 | | | | (111,637 | ) |
| Fossil, Inc.* | | | 1,340 | | | | (124,754 | ) |
| Clear Channel Outdoor Holdings, Inc. — | | | | | | | | |
| Class A | | | 18,053 | | | | (126,732 | ) |
| Limited Brands, Inc. | | | 2,877 | | | | (135,392 | ) |
| Las Vegas Sands Corp. | | | 2,951 | | | | (136,218 | ) |
| Choice Hotels International, Inc. | | | 4,390 | | | | (147,592 | ) |
| Tiffany & Co. | | | 2,800 | | | | (160,552 | ) |
| Family Dollar Stores, Inc. | | | 2,536 | | | | (160,808 | ) |
| Marriott International, Inc. — Class A | | | 4,449 | | | | (165,814 | ) |
| Thomson Reuters Corp. | | | 5,979 | | | | (173,750 | ) |
| Urban Outfitters, Inc.* | | | 4,579 | | | | (180,229 | ) |
| Liberty Global, Inc. — Class A* | | | 2,877 | | | | (181,222 | ) |
| Visteon Corp.* | | | 3,405 | | | | (183,258 | ) |
| Wendy’s Co. | | | 39,847 | | | | (187,282 | ) |
| CarMax, Inc.* | | | 5,071 | | | | (190,365 | ) |
| H&R Block, Inc. | | | 11,202 | | | | (208,021 | ) |
| JC Penney Company, Inc. | | | 11,618 | | | | (228,991 | ) |
| Amazon.com, Inc.* | | | 936 | | | | (235,067 | ) |
| Abercrombie & Fitch Co. — Class A | | | 5,033 | | | | (241,433 | ) |
| PVH Corp. | | | 6,838 | | | | (759,086 | ) |
| Total Consumer Discretionary | | | | | | | (5,014,642 | ) |
| INDUSTRIALS - (5.1)% | | | | | | | | |
| WW Grainger, Inc. | | | 12 | | | | (2,428 | ) |
| Verisk Analytics, Inc. — Class A* | | | 60 | | | | (3,060 | ) |
| MSC Industrial Direct Company, Inc. — | | | | | | | | |
| Class A | | | 114 | | | | (8,593 | ) |
| Exelis, Inc. | | | 833 | | | | (9,388 | ) |
| Alliant Techsystems, Inc. | | | 264 | | | | (16,357 | ) |
| General Cable Corp.* | | | 871 | | | | (26,487 | ) |
| IHS, Inc. — Class A* | | | 331 | | | | (31,776 | ) |
| Lennox International, Inc. | | | 616 | | | | (32,352 | ) |
| Cummins, Inc. | | | 303 | | | | (32,830 | ) |
| United Technologies Corp. | | | 417 | | | | (34,198 | ) |
| Dun & Bradstreet Corp. | | | 501 | | | | (39,404 | ) |
| United Parcel Service, Inc. — Class B | | | 561 | | | | (41,363 | ) |
| RR Donnelley & Sons Co. | | | 5,335 | | | | (48,015 | ) |
| Quanta Services, Inc.* | | | 2,006 | | | | (54,744 | ) |
| Fluor Corp. | | | 945 | | | | (55,509 | ) |
| Emerson Electric Co. | | | 1,135 | | | | (60,110 | ) |
| J.B. Hunt Transport Services, Inc. | | | 1,098 | | | | (65,562 | ) |
| UTI Worldwide, Inc. | | | 6,080 | | | | (81,472 | ) |
| Masco Corp. | | | 5,067 | | | | (84,416 | ) |
| Deere & Co. | | | 984 | | | | (85,037 | ) |
| United Continental Holdings, Inc.* | | | 4,326 | | | | (101,142 | ) |
| Joy Global, Inc. | | | 1,589 | | | | (101,346 | ) |
| GrafTech International Ltd.* | | | 11,163 | | | | (104,821 | ) |
| CSX Corp. | | | 5,865 | | | | (115,716 | ) |
| Clean Harbors, Inc.* | | | 2,384 | | | | (131,144 | ) |
| Babcock & Wilcox Co. | | | 5,298 | | | | (138,808 | ) |
| Waste Connections, Inc. | | | 4,200 | | | | (141,918 | ) |
| 3M Co. | | | 1,552 | | | | (144,103 | ) |
| Iron Mountain, Inc. | | | 4,906 | | | | (152,331 | ) |
| Stericycle, Inc.* | | | 1,665 | | | | (155,295 | ) |
| Landstar System, Inc. | | | 2,978 | | | | (156,226 | ) |
| Rockwell Collins, Inc. | | | 2,877 | | | | (167,355 | ) |
| CH Robinson Worldwide, Inc. | | | 2,800 | | | | (177,016 | ) |
| Honeywell International, Inc. | | | 2,800 | | | | (177,716 | ) |
| Precision Castparts Corp. | | | 945 | | | | (179,002 | ) |
| Nordson Corp. | | | 2,838 | | | | (179,135 | ) |
| SPX Corp. | | | 2,611 | | | | (183,162 | ) |
| Towers Watson & Co. — Class A | | | 3,292 | | | | (185,043 | ) |
| ITT Corp. | | | 7,908 | | | | (185,522 | ) |
| Navistar International Corp.* | | | 8,552 | | | | (186,177 | ) |
| Matson, Inc. | | | 7,568 | | | | (187,081 | ) |
| Pentair Ltd. | | | 3,859 | | | | (189,670 | ) |
| Expeditors International of Washington, Inc. | | | 4,810 | | | | (190,236 | ) |
| Crane Co. | | | 4,125 | | | | (190,905 | ) |
| Colfax Corp.* | | | 4,768 | | | | (192,389 | ) |
| Harsco Corp. | | | 8,969 | | | | (210,772 | ) |
| Chicago Bridge & Iron Company N.V. | | | 4,817 | | | | (223,268 | ) |
| DigitalGlobe, Inc.* | | | 47,666 | | | | (1,164,957 | ) |
| Total Industrials | | | | | | | (6,425,357 | ) |
| INFORMATION TECHNOLOGY - (5.7)% | | | | | | | | |
| Ingram Micro, Inc. — Class A* | | | 228 | | | | (3,858 | ) |
| Polycom, Inc.* | | | 418 | | | | (4,372 | ) |
| Dell, Inc. | | | 896 | | | | (9,076 | ) |
| Marvell Technology Group Ltd. | | | 2,536 | | | | (18,411 | ) |
| Texas Instruments, Inc. | | | 626 | | | | (19,368 | ) |
| FLIR Systems, Inc. | | | 871 | | | | (19,432 | ) |
| Western Union Co. | | | 1,438 | | | | (19,571 | ) |
| Teradyne, Inc.* | | | 1,260 | | | | (21,281 | ) |
| Electronic Arts, Inc.* | | | 1,892 | | | | (27,491 | ) |
| Microchip Technology, Inc. | | | 1,059 | | | | (34,513 | ) |
| Oracle Corp. | | | 1,070 | | | | (35,652 | ) |
| Microsoft Corp. | | | 1,434 | | | | (38,331 | ) |
| Skyworks Solutions, Inc.* | | | 1,946 | | | | (39,504 | ) |
| Apple, Inc. | | | 75 | | | | (39,977 | ) |
| NVIDIA Corp. | | | 3,398 | | | | (41,761 | ) |
| Advanced Micro Devices, Inc.* | | | 17,567 | | | | (42,161 | ) |
| Zynga, Inc. — Class A* | | | 17,884 | | | | (42,385 | ) |
| EMC Corp.* | | | 1,681 | | | | (42,529 | ) |
| Lam Research Corp.* | | | 1,179 | | | | (42,597 | ) |
| LSI Corp.* | | | 6,062 | | | | (42,919 | ) |
| Fusion-io, Inc.* | | | 1,877 | | | | (43,040 | ) |
| Broadcom Corp. — Class A | | | 1,310 | | | | (43,505 | ) |
| VeriFone Systems, Inc.* | | | 1,476 | | | | (43,808 | ) |
| Linear Technology Corp. | | | 1,286 | | | | (44,110 | ) |
| Citrix Systems, Inc.* | | | 757 | | | | (49,773 | ) |
| Freescale Semiconductor Ltd.* | | | 4,758 | | | | (52,386 | ) |
| MICROS Systems, Inc.* | | | 1,400 | | | | (59,416 | ) |
| NCR Corp.* | | | 2,645 | | | | (67,395 | ) |
| SEE NOTES TO FINANCIAL STATEMENTS. | THE GUGGENHEIM FUNDS ANNUAL REPORT | 33 |
| CONSOLIDATED SCHEDULE OF INVESTMENTS (continued) | December 31, 2012 |
| MULTI-HEDGE STRATEGIES FUND | |
| | | Shares | | | Value | |
| | | | | | | | | |
| LinkedIn Corp. — Class A* | | | 620 | | | $ | (71,188 | ) |
| Broadridge Financial Solutions, Inc. | | | 3,443 | | | | (78,776 | ) |
| VMware, Inc. — Class A* | | | 908 | | | | (85,479 | ) |
| SAIC, Inc. | | | 8,264 | | | | (93,548 | ) |
| Lender Processing Services, Inc. | | | 4,654 | | | | (114,581 | ) |
| Rovi Corp.* | | | 8,422 | | | | (129,951 | ) |
| FactSet Research Systems, Inc. | | | 1,476 | | | | (129,977 | ) |
| Computer Sciences Corp. | | | 3,519 | | | | (140,936 | ) |
| PMC - Sierra, Inc.* | | | 27,379 | | | | (142,645 | ) |
| NetApp, Inc.* | | | 4,351 | | | | (145,976 | ) |
| Micron Technology, Inc.* | | | 24,797 | | | | (157,461 | ) |
| Paychex, Inc. | | | 5,222 | | | | (162,613 | ) |
| AVX Corp. | | | 15,439 | | | | (166,432 | ) |
| Altera Corp. | | | 4,957 | | | | (170,719 | ) |
| Itron, Inc.* | | | 4,024 | | | | (179,269 | ) |
| Cognizant Technology Solutions Corp. — | | | | | | | | |
| Class A* | | | 2,423 | | | | (179,424 | ) |
| Global Payments, Inc. | | | 4,012 | | | | (181,744 | ) |
| Cree, Inc.* | | | 5,421 | | | | (184,206 | ) |
| Solera Holdings, Inc. | | | 3,481 | | | | (186,129 | ) |
| National Instruments Corp. | | | 7,304 | | | | (188,516 | ) |
| Juniper Networks, Inc.* | | | 9,725 | | | | (191,291 | ) |
| SanDisk Corp.* | | | 4,453 | | | | (193,973 | ) |
| Cypress Semiconductor Corp. | | | 18,089 | | | | (196,085 | ) |
| Informatica Corp.* | | | 6,509 | | | | (197,353 | ) |
| JDS Uniphase Corp.* | | | 15,478 | | | | (209,572 | ) |
| ON Semiconductor Corp.* | | | 30,863 | | | | (217,584 | ) |
| Hewlett-Packard Co. | | | 15,507 | | | | (220,975 | ) |
| Salesforce.com, Inc.* | | | 1,496 | | | | (251,478 | ) |
| Acme Packet, Inc.* | | | 11,488 | | | | (254,115 | ) |
| Atmel Corp.* | | | 43,611 | | | | (285,651 | ) |
| ASML Holding N.V. | | | 17,145 | | | | (1,104,322 | ) |
| Total Information Technology | | | | | | | (7,200,591 | ) |
| FINANCIALS - (10.5)% | | | | | | | | |
| American Financial Group, Inc. | | | 114 | | | | (4,505 | ) |
| Bank of Hawaii Corp. | | | 123 | | | | (5,418 | ) |
| New York Community Bancorp, Inc. | | | 454 | | | | (5,947 | ) |
| BioMed Realty Trust, Inc. | | | 455 | | | | (8,795 | ) |
| St. Joe Co.* | | | 504 | | | | (11,632 | ) |
| Citigroup, Inc. | | | 685 | | | | (27,099 | ) |
| Franklin Resources, Inc. | | | 227 | | | | (28,534 | ) |
| Arthur J Gallagher & Co. | | | 945 | | | | (32,744 | ) |
| East West Bancorp, Inc. | | | 1,854 | | | | (39,842 | ) |
| Capital One Financial Corp. | | | 757 | | | | (43,853 | ) |
| Jones Lang LaSalle, Inc. | | | 530 | | | | (44,488 | ) |
| StanCorp Financial Group, Inc. | | | 1,286 | | | | (47,158 | ) |
| Realty Income Corp. | | | 1,725 | | | | (69,362 | ) |
| BRE Properties, Inc. | | | 1,627 | | | | (82,700 | ) |
| Morgan Stanley | | | 4,352 | | | | (83,210 | ) |
| Hanover Insurance Group, Inc. | | | 2,234 | | | | (86,545 | ) |
| Weingarten Realty Investors | | | 3,444 | | | | (92,196 | ) |
| Forest City Enterprises, Inc. — | | | | | | | | |
| Class A* | | | 5,907 | | | | (95,398 | ) |
| Moody’s Corp. | | | 2,195 | | | | (110,452 | ) |
| Mack-Cali Realty Corp. | | | 4,466 | | | | (116,607 | ) |
| MBIA, Inc.* | | | 14,910 | | | | (117,044 | ) |
| XL Group plc — Class A | | | 5,108 | | | | (128,006 | ) |
| Weyerhaeuser Co. | | | 4,844 | | | | (134,760 | ) |
| SL Green Realty Corp. | | | 1,816 | | | | (139,196 | ) |
| MSCI, Inc. — Class A* | | | 4,768 | | | | (147,760 | ) |
| Bank of New York Mellon Corp. | | | 5,789 | | | | (148,777 | ) |
| SVB Financial Group* | | | 2,687 | | | | (150,391 | ) |
| Vornado Realty Trust | | | 1,892 | | | | (151,511 | ) |
| Piedmont Office Realty Trust, Inc. — | | | | | | | | |
| Class A | | | 8,628 | | | | (155,735 | ) |
| Legg Mason, Inc. | | | 6,130 | | | | (157,664 | ) |
| Alexandria Real Estate Equities, Inc. | | | 2,346 | | | | (162,625 | ) |
| Progressive Corp. | | | 7,758 | | | | (163,694 | ) |
| Cullen/Frost Bankers, Inc. | | | 3,027 | | | | (164,275 | ) |
| Duke Realty Corp. | | | 11,844 | | | | (164,276 | ) |
| First Republic Bank | | | 5,033 | | | | (164,982 | ) |
| Equity Lifestyle Properties, Inc. | | | 2,460 | | | | (165,534 | ) |
| CIT Group, Inc.* | | | 4,313 | | | | (166,654 | ) |
| NBT Bancorp, Inc. | | | 8,353 | | | | (169,315 | ) |
| Brown & Brown, Inc. | | | 6,672 | | | | (169,869 | ) |
| Aon plc | | | 3,065 | | | | (170,414 | ) |
| Mercury General Corp. | | | 4,313 | | | | (171,183 | ) |
| Kemper Corp. | | | 5,828 | | | | (171,926 | ) |
| Chubb Corp. | | | 2,309 | | | | (173,914 | ) |
| Plum Creek Timber Company, Inc. | | | 3,936 | | | | (174,640 | ) |
| Prudential Financial, Inc. | | | 3,292 | | | | (175,562 | ) |
| Valley National Bancorp | | | 18,922 | | | | (175,975 | ) |
| Corporate Office Properties Trust | | | 7,114 | | | | (177,708 | ) |
| First Horizon National Corp. | | | 18,050 | | | | (178,876 | ) |
| First Niagara Financial Group, Inc. | | | 22,895 | | | | (181,557 | ) |
| Erie Indemnity Co. — Class A | | | 2,650 | | | | (183,433 | ) |
| Unum Group | | | 8,817 | | | | (183,570 | ) |
| Lazard Ltd. — Class A | | | 6,168 | | | | (184,053 | ) |
| TCF Financial Corp. | | | 15,175 | | | | (184,376 | ) |
| Hartford Financial Services Group, Inc. | | | 8,249 | | | | (185,108 | ) |
| TD Ameritrade Holding Corp. | | | 11,049 | | | | (185,734 | ) |
| Lincoln National Corp. | | | 7,190 | | | | (186,221 | ) |
| SEI Investments Co. | | | 7,985 | | | | (186,370 | ) |
| Charles Schwab Corp. | | | 13,358 | | | | (191,821 | ) |
| TFS Financial Corp.* | | | 20,485 | | | | (197,066 | ) |
| Markel Corp.* | | | 1,264 | | | | (547,843 | ) |
| FirstMerit Corp. | | | 48,591 | | | | (689,506 | ) |
| IntercontinentalExchange, Inc.* | | | 6,306 | | | | (780,746 | ) |
| M&T Bank Corp. | | | 8,639 | | | | (850,683 | ) |
| Leucadia National Corp. | | | 112,619 | | | | (2,679,206 | ) |
| Total Financials | | | | | | | (13,126,044 | ) |
| Total Common Stock Sold Short | | | | | | | | |
| (Proceeds $44,577,862) | | | | | | | (46,752,491 | ) |
| 34 | THE GUGGENHEIM FUNDS ANNUAL REPORT | SEE NOTES TO FINANCIAL STATEMENTS. |
| CONSOLIDATED SCHEDULE OF INVESTMENTS (continued) | December 31, 2012 |
| MULTI-HEDGE STRATEGIES FUND | |
| | | Shares | | | Value | |
| | | | | | | | | |
| EXCHANGE TRADED FUNDS SOLD SHORT† - (14.5)% | | | | | | | | |
| Market Vectors Russia ETF | | | 363 | | | $ | (10,879 | ) |
| iShares Barclays 7-10 Year Treasury | | | | | | | | |
| Bond Fund | | | 133 | | | | (14,296 | ) |
| iShares MSCI Austria Investable Market | | | | | | | | |
| Index Fund | | | 829 | | | | (15,080 | ) |
| iShares MSCI Thailand Index Fund | | | 197 | | | | (16,251 | ) |
| iShares MSCI BRIC Index Fund | | | 741 | | | | (30,262 | ) |
| iShares MSCI Chile Investable Market | | | | | | | | |
| Index Fund | | | 753 | | | | (47,620 | ) |
| iShares MSCI Hong Kong Index Fund | | | 2,766 | | | | (53,716 | ) |
| iShares MSCI Belgium Capped Investable | | | | | | | | |
| Market Index Fund | | | 4,514 | | | | (62,519 | ) |
| iShares MSCI France Index Fund | | | 2,758 | | | | (65,061 | ) |
| iShares Barclays 20+ Year Treasury | | | | | | | | |
| Bond Fund | | | 547 | | | | (66,285 | ) |
| iShares MSCI EMU Index Fund | | | 2,423 | | | | (81,074 | ) |
| iShares MSCI EAFE Index Fund | | | 1,539 | | | | (87,446 | ) |
| iShares MSCI Taiwan Index Fund | | | 7,351 | | | | (100,121 | ) |
| iShares MSCI Netherlands Investable | | | | | | | | |
| Market Index Fund | | | 5,032 | | | | (103,206 | ) |
| iShares MSCI Germany Index Fund | | | 4,264 | | | | (105,406 | ) |
| iShares Barclays Agency Bond Fund | | | 1,026 | | | | (116,318 | ) |
| PowerShares Emerging Markets Sovereign | | | | | | | | |
| Debt Portfolio | | | 4,103 | | | | (129,039 | ) |
| iShares Barclays MBS Bond Fund | | | 1,200 | | | | (129,600 | ) |
| Market Vectors Gold Miners ETF | | | 3,441 | | | | (159,628 | ) |
| iShares FTSE China 25 Index Fund | | | 4,244 | | | | (171,797 | ) |
| iShares MSCI Switzerland Index Fund | | | 7,535 | | | | (201,938 | ) |
| iShares MSCI Italy Index Fund | | | 16,314 | | | | (219,423 | ) |
| iShares iBoxx Investment Grade Corporate | | | | | | | | |
| Bond Fund | | | 1,818 | | | | (219,960 | ) |
| iShares JPMorgan USD Emerging Markets | | | | | | | | |
| Bond Fund | | | 1,899 | | | | (233,197 | ) |
| iShares MSCI Canada Index Fund | | | 9,063 | | | | (257,389 | ) |
| iShares Barclays 3-7 Year Treasury | | | | | | | | |
| Bond Fund | | | 2,967 | | | | (365,594 | ) |
| iShares Barclays TIPS Bond Fund | | | 3,058 | | | | (371,272 | ) |
| iShares MSCI Spain Index Fund | | | 13,342 | | | | (403,729 | ) |
| SPDR Barclays High Yield Bond ETF | | | 10,821 | | | | (440,415 | ) |
| iShares Core Total US Bond Market ETF | | | 5,033 | | | | (559,116 | ) |
| Powershares QQQ Trust Series 1 | | | 8,920 | | | | (580,781 | ) |
| iPath MSCI India Index ETN* | | | 12,050 | | | | (716,734 | ) |
| iShares MSCI Brazil Index Fund | | | 13,727 | | | | (769,536 | ) |
| iShares MSCI Japan Index Fund | | | 143,424 | | | | (1,398,384 | ) |
| iShares Russell 2000 Index Fund | | | 18,901 | | | | (1,593,165 | ) |
| iShares Russell 1000 Growth Index Fund | | | 34,519 | | | | (2,260,649 | ) |
| SPDR S&P 500 ETF Trust | | | 18,030 | | | | (2,569,636 | ) |
| iShares Russell 1000 Value Index Fund | | | 47,798 | | | | (3,480,650 | ) |
| Total Exchange Traded Funds Sold Short | | | | | | | | |
| (Proceeds $17,164,676) | | | | | | | (18,207,172 | ) |
| Total Securities Sold Short- (51.8)% | | | | | | | | |
| (Proceeds $61,742,538) | | | | | | $ | (64,959,663 | ) |
| Other Assets & Liabilities, net - 61.1% | | | | | | | 76,673,498 | |
| Total Net Assets - 100.0% | | | | | | $ | 125,428,459 | |
| | | Contracts | | | Unrealized Gain (Loss) | |
| | | | | | | | | |
| EQUITY FUTURES CONTRACTS PURCHASED† | | | | | | | | |
| March 2013 Russell 2000 Index | | | | | | | | |
| Mini Futures Contracts | | | | | | | | |
| (Aggregate Value of | | | | | | | | |
| Contracts $10,833,920) | | | 128 | | | $ | 305,056 | |
| January 2013 CBOE VIX Index | | | | | | | | |
| Futures Contracts | | | | | | | | |
| (Aggregate Value of | | | | | | | | |
| Contracts $4,295,900) | | | 238 | | | | 227,826 | |
| March 2013 S&P MidCap 400 Index | | | | | | | | |
| Mini Futures Contracts | | | | | | | | |
| (Aggregate Value of | | | | | | | | |
| Contracts $11,090,750) | | | 109 | | | | 180,385 | |
| February 2013 CBOE VIX Index | | | | | | | | |
| Futures Contracts | | | | | | | | |
| (Aggregate Value of | | | | | | | | |
| Contracts $4,420,050) | | | 237 | | | | (392,090 | ) |
| (Total Aggregate Value of | | | | | | | | |
| Contracts $30,640,620) | | | | | | $ | 321,177 | |
| COMMODITY FUTURES CONTRACTS PURCHASED† | | | | | | | | |
| June 2013 Gasoline RBOB | | | | | | | | |
| Futures Contracts | | | | | | | | |
| (Aggregate Value of | | | | | | | | |
| Contracts $4,686,809) | | | 39 | | | $ | 222,418 | |
| December 2013 WTI Crude | | | | | | | | |
| Futures Contracts | | | | | | | | |
| (Aggregate Value of | | | | | | | | |
| Contracts $4,279,840) | | | 46 | | | | 146,474 | |
| January 2013 LME Lead | | | | | | | | |
| Futures Contracts | | | | | | | | |
| (Aggregate Value of | | | | | | | | |
| Contracts $1,794,396) | | | 31 | | | | 117,513 | |
| December 2013 Soybean | | | | | | | | |
| Futures Contracts | | | | | | | | |
| (Aggregate Value of | | | | | | | | |
| Contracts $4,071,060) | | | 135 | | | | 33,655 | |
| January 2013 LME Zinc | | | | | | | | |
| Futures Contracts | | | | | | | | |
| (Aggregate Value of | | | | | | | | |
| Contracts $1,078,508) | | | 21 | | | | 28,065 | |
| February 2013 Gasoline RBOB | | | | | | | | |
| Futures Contracts | | | | | | | | |
| (Aggregate Value of | | | | | | | | |
| Contracts $1,392,754) | | | 12 | | | | 24,660 | |
| March 2013 Cotton #2 | | | | | | | | |
| Futures Contracts | | | | | | | | |
| (Aggregate Value of | | | | | | | | |
| Contracts $452,400) | | | 12 | | | | (5,520 | ) |
| March 2013 Copper | | | | | | | | |
| Futures Contracts | | | | | | | | |
| (Aggregate Value of | | | | | | | | |
| Contracts $1,185,600) | | | 13 | | | | (6,993 | ) |
| November 2013 Soybean | | | | | | | | |
| Futures Contracts | | | | | | | | |
| (Aggregate Value of | | | | | | | | |
| Contracts $4,293,300) | | | 66 | | | | (29,961 | ) |
| SEE NOTES TO FINANCIAL STATEMENTS. | THE GUGGENHEIM FUNDS ANNUAL REPORT | 35 |
| CONSOLIDATED SCHEDULE OF INVESTMENTS (concluded) | December 31, 2012 |
| MULTI-HEDGE STRATEGIES FUND | |
| | | | | | Unrealized | |
| | | Contracts | | | Gain (Loss) | |
| | | | | | | |
| June 2013 Live Cattle | | | | | | | | |
| Futures Contracts | | | | | | | | |
| (Aggregate Value of | | | | | | | | |
| Contracts $5,337,660) | | | 102 | | | $ | (64,305 | ) |
| July 2013 Corn | | | | | | | | |
| Futures Contracts | | | | | | | | |
| (Aggregate Value of | | | | | | | | |
| Contracts $523,688) | | | 15 | | | | (66,613 | ) |
| October 2013 Lean Hogs | | | | | | | | |
| Futures Contracts | | | | | | | | |
| (Aggregate Value of | | | | | | | | |
| Contracts $4,361,180) | | | 127 | | | | (151,347 | ) |
| September 2013 Corn | | | | | | | | |
| Futures Contracts | | | | | | | | |
| (Aggregate Value of | | | | | | | | |
| Contracts $4,074,100) | | | 131 | | | | (240,498 | ) |
| (Total Aggregate Value of | | | | | | | | |
| Contracts $37,531,295) | | | | | | $ | 7,548 | |
| COMMODITY FUTURES CONTRACTS SOLD SHORT† | | | | | | | | |
| May 2013 Corn | | | | | | | | |
| Futures Contracts | | | | | | | | |
| (Aggregate Value of | | | | | | | | |
| Contracts $3,998,550) | | | 114 | | | $ | 281,340 | |
| March 2013 Sugar #11 | | | | | | | | |
| Futures Contracts | | | | | | | | |
| (Aggregate Value of | | | | | | | | |
| Contracts $700,672) | | | 32 | | | | 164,964 | |
| March 2013 Coffee ‘C’ | | | | | | | | |
| Futures Contracts | | | | | | | | |
| (Aggregate Value of | | | | | | | | |
| Contracts $2,160,000) | | | 40 | | | | 128,369 | |
| June 2013 Lean Hogs | | | | | | | | |
| Futures Contracts | | | | | | | | |
| (Aggregate Value of | | | | | | | | |
| Contracts $4,436,380) | | | 113 | | | | 85,119 | |
| July 2013 Soybean | | | | | | | | |
| Futures Contracts | | | | | | | | |
| (Aggregate Value of | | | | | | | | |
| Contracts $4,324,500) | | | 62 | | | | 36,992 | |
| March 2013 Natural Gas | | | | | | | | |
| Futures Contracts | | | | | | | | |
| (Aggregate Value of | | | | | | | | |
| Contracts $876,720) | | | 26 | | | | 6,270 | |
| March 2013 Soybean Oil | | | | | | | | |
| Futures Contracts | | | | | | | | |
| (Aggregate Value of | | | | | | | | |
| Contracts $2,269,056) | | | 76 | | | | (25,468 | ) |
| May 2013 Soybean Oil | | | | | | | | |
| Futures Contracts | | | | | | | | |
| (Aggregate Value of | | | | | | | | |
| Contracts $4,067,820) | | | 135 | | | | (31,232 | ) |
| April 2013 Live Cattle | | | | | | | | |
| Futures Contracts | | | | | | | | |
| (Aggregate Value of | | | | | | | | |
| Contracts $4,034,480) | | | 74 | | | | (32,515 | ) |
| March 2013 WTI Crude | | | | | | | | |
| Futures Contracts | | | | | | | | |
| (Aggregate Value of | | | | | | | | |
| Contracts $4,332,460) | | | 47 | | | | (212,371 | ) |
| April 2013 Gasoline RBOB | | | | | | | | |
| Futures Contracts | | | | | | | | |
| (Aggregate Value of | | | | | | | | |
| Contracts $4,748,071) | | | 39 | | | | (235,661 | ) |
| (Total Aggregate Value of | | | | | | | | |
| Contracts $35,948,709) | | | | | | $ | 165,807 | |
| EQUITY FUTURES CONTRACTS SOLD SHORT† | | | | | | | | |
| April 2013 CBOE VIX Index | | | | | | | | |
| Futures Contracts | | | | | | | | |
| (Aggregate Value of | | | | | | | | |
| Contracts $4,522,500) | | | 225 | | | $ | 470,601 | |
| May 2013 CBOE VIX Index | | | | | | | | |
| Futures Contracts | | | | | | | | |
| (Aggregate Value of | | | | | | | | |
| Contracts $4,523,500) | | | 218 | | | | 189,130 | |
| March 2013 CBOE VIX Index | | | | | | | | |
| Futures Contracts | | | | | | | | |
| (Aggregate Value of | | | | | | | | |
| Contracts $1,264,250) | | | 65 | | | | 79,942 | |
| June 2013 CBOE VIX Index | | | | | | | | |
| Futures Contracts | | | | | | | | |
| (Aggregate Value of | | | | | | | | |
| Contracts $4,589,800) | | | 212 | | | | (28,072 | ) |
| March 2013 S&P 500 Index | | | | | | | | |
| Mini Futures Contracts | | | | | | | | |
| (Aggregate Value of | | | | | | | | |
| Contracts $21,397,338) | | | 301 | | | | (188,516 | ) |
| (Total Aggregate Value of | | | | | | | | |
| Contracts $36,297,388) | | | | | | $ | 523,085 | |
| * | Non-income producing security. |
| † | Value determined based on Level 1 inputs — See Note 4. |
| †† | Value determined based on Level 2 inputs — See Note 4. |
| 1 | All or a portion of this security is pledged as short security collateral at December 31, 2012. |
| 2 | All or portion of this security is on loan at December 31, 2012 — See Note 10. |
| 3 | On September 7, 2008, the issuer was placed in conservatorship by the Federal Housing Finance Agency (FHFA). As conservator, the FHFA has full powers to control the assets and operations of the firm. |
| 4 | Repurchase Agreements — See Note 5. |
| 5 | Securities lending collateral — See Note 10. |
| 6 | Investment in a product that pays a management fee to a party related to the advisor. |
ADR — American Depositary Receipt
plc — Public Limited Company
| 36 | THE GUGGENHEIM FUNDS ANNUAL REPORT | SEE NOTES TO FINANCIAL STATEMENTS. |
| MULTI-HEDGE STRATEGIES FUND |
CONSOLIDATED STATEMENT OF
ASSETS AND LIABILITIES |
| Assets: | | | | |
| Investments, at value - including $718,322 of securities loaned (cost $87,909,139) | | $ | 95,133,995 | |
| Repurchase agreements, at value | | | | |
| (cost $18,580,629) | | | 18,580,629 | |
| Total investments | | | | |
| (cost $106,489,768) | | | 113,714,624 | |
| Segregated cash with broker | | | 79,175,635 | |
| Cash | | | 18,766 | |
| Receivables: | | | | |
| Securities sold | | | 1,436,088 | |
| Fund shares sold | | | 230,985 | |
| Dividends | | | 210,054 | |
| Interest | | | 706 | |
| Total assets | | | 194,786,858 | |
| Liabilities: | | | | |
| Securities sold short, at value (proceeds $61,742,538) | | | 64,959,663 | |
| Payable for: | | | | |
| Securities purchased | | | 2,521,821 | |
| Payable upon return of securities loaned | | | 772,716 | |
| Variation margin | | | 702,235 | |
| Fund shares redeemed | | | 163,738 | |
| Management fees | | | 116,116 | |
| Distribution and service fees | | | 32,326 | |
| Miscellaneous | | | 89,784 | |
| Total liabilities | | | 69,358,399 | |
| Net assets | | $ | 125,428,459 | |
| Net assets consist of: | | | | |
| Paid in capital | | $ | 173,731,837 | |
| Accumulated net investment loss | | | (1,176,791 | ) |
| Accumulated net realized loss on investments | | | (52,151,935 | ) |
| Net unrealized appreciation on investments | | | 5,025,348 | |
| Net assets | | $ | 125,428,459 | |
| A-Class: | | | | |
| Net assets | | $ | 27,699,936 | |
| Capital shares outstanding | | | 1,221,541 | |
| Net asset value per share | | $ | 22.68 | |
| Maximum offering price per share (Net asset value divided by 95.25%) | | $ | 23.81 | |
| C-Class: | | | | |
| Net assets | | $ | 16,780,318 | |
| Capital shares outstanding | | | 782,463 | |
| Net asset value per share | | $ | 21.45 | |
| H-Class: | | | | |
| Net assets | | $ | 66,817,947 | |
| Capital shares outstanding | | | 2,944,661 | |
| Net asset value per share | | $ | 22.69 | |
| Institutional Class: | | | | |
| Net assets | | $ | 14,130,258 | |
| Capital shares outstanding | | | 618,544 | |
| Net asset value per share | | $ | 22.84 | |
CONSOLIDATED STATEMENT
OF OPERATIONS |
|
| Year Ended December 31, 2012 |
| Investment Income: | | | | |
| Dividends (net of foreign withholding tax of $4,071) | | $ | 1,861,467 | |
| Interest | | | 39,694 | |
| Income from securities lending, net | | | 1,520 | |
| Total investment income | | | 1,902,681 | |
| | | | | |
| Expenses: | | | | |
| Management fees | | | 1,547,257 | |
| Distribution and service fees: | | | | |
| A-Class | | | 75,674 | |
| C-Class | | | 158,907 | |
| H-Class | | | 188,372 | |
| Short sales dividend expense | | | 1,660,785 | |
| Prime broker interest expense | | | 485,667 | |
| Trustees’ fees* | | | 11,028 | |
| Custodian fees | | | 270 | |
| Miscellaneous | | | (9,248 | ) |
| Total expenses | | | 4,118,712 | |
| Less: | | | | |
| Expenses waived by Advisor | | | (52,599 | ) |
| Net expenses | | | 4,066,113 | |
| Net investment loss | | | (2,163,432 | ) |
| | | | | |
| Net Realized and Unrealized Gain (Loss): | | | | |
| Net realized gain (loss) on: | | | | |
| Investments | | | 4,196,332 | |
| Swap agreements | | | 1,252,691 | |
| Futures contracts | | | (715,211 | ) |
| Realized gain distributions recieved from investment company shares | | | 282,090 | |
| Securities sold short | | | (5,410,734 | ) |
| Options purchased | | | (40,206 | ) |
| Net realized loss | | | (435,038 | ) |
| Net change in unrealized appreciation (depreciation) on: | | | | |
| Investments | | | 5,452,002 | |
| Securities sold short | | | (3,362,140 | ) |
| Swap agreements | | | (35,229 | ) |
| Futures contracts | | | 2,900,754 | |
| Options purchased | | | (1,926 | ) |
| Net change in unrealized appreciation (depreciation) | | | 4,953,461 | |
| Net realized and unrealized gain | | | 4,518,423 | |
| Net increase in net assets resulting from operations | | $ | 2,354,991 | |
| * | Relates to Trustees not deemed “interested persons” within the meaning of Section 2(a)(19) of the 1940 Act. |
| SEE NOTES TO FINANCIAL STATEMENTS. | THE GUGGENHEIM FUNDS ANNUAL REPORT | 37 |
| MULTI-HEDGE STRATEGIES FUND |
| |
| CONSOLIDATED STATEMENTS OF CHANGES IN NET ASSETS |
| | | Year Ended | | | Year Ended | |
| | | December 31, | | | December 31, | |
| | | 2012 | | | 2011 | |
| | | | | | | |
| Increase (Decrease) In Net Assets From Operations: | | | | | | | | |
| Net investment loss | | $ | (2,163,432 | ) | | $ | (982,964 | ) |
| Net realized gain (loss) on investments | | | (435,038 | ) | | | 8,190,472 | |
| Net change in unrealized appreciation (depreciation) on investments | | | 4,953,461 | | | | (5,221,879 | ) |
| Net increase in net assets resulting from operations | | | 2,354,991 | | | | 1,985,629 | |
| | | | | | | | | |
| Distributions to shareholders from: | | | | | | | | |
| Net investment income | | | | | | | | |
| A-Class | | | — | | | | (175,041 | ) |
| C-Class | | | — | | | | (96,950 | ) |
| H-Class | | | — | | | | (465,010 | ) |
| Institutional Class | | | — | | | | (3,870 | ) |
| Total distributions to shareholders | | | — | | | | (740,871 | ) |
| | | | | | | | | |
| Capital share transactions: | | | | | | | | |
| Proceeds from sale of shares | | | | | | | | |
| A-Class | | | 41,635,919 | | | | 22,677,918 | |
| C-Class | | | 9,448,075 | | | | 5,688,462 | |
| H-Class | | | 80,707,028 | | | | 64,118,440 | |
| Institutional Class | | | 15,460,536 | | | | 519,704 | |
| Value of proceeds from merger | | | | | | | | |
| A-Class | | | 1,354,905 | | | | — | |
| C-Class | | | 2,433,192 | | | | — | |
| H-Class | | | 2,281,147 | | | | — | |
| Distributions reinvested | | | | | | | | |
| A-Class | | | — | | | | 170,694 | |
| C-Class | | | — | | | | 91,859 | |
| H-Class | | | — | | | | 417,772 | |
| Institutional Class | | | — | | | | 3,870 | |
| Cost of shares redeemed | | | | | | | | |
| A-Class | | | (40,779,286 | ) | | | (12,381,150 | ) |
| C-Class | | | (8,561,191 | ) | | | (7,848,693 | ) |
| H-Class | | | (83,697,859 | ) | | | (43,547,530 | ) |
| Institutional Class | | | (2,331,387 | ) | | | (18,270 | ) |
| Net increase from capital share transactions | | | 17,951,079 | | | | 29,893,076 | |
| Net increase in net assets | | | 20,306,070 | | | | 31,137,834 | |
| | | | | | | | | |
| Net assets: | | | | | | | | |
| Beginning of year | | | 105,122,389 | | | | 73,984,555 | |
| End of year | | $ | 125,428,459 | | | $ | 105,122,389 | |
| Accumulated net investment loss at end of year | | $ | (1,176,791 | ) | | $ | (1,420,002 | ) |
| | | | | | | | | |
| Capital share activity: | | | | | | | | |
| Shares sold | | | | | | | | |
| A-Class | | | 1,919,863 | † | | | 1,019,952 | |
| C-Class | | | 554,953 | † | | | 267,782 | |
| H-Class | | | 3,696,849 | † | | | 2,874,440 | |
| Institutional Class | | | 685,352 | | | | 23,171 | |
| Shares issued from reinvestment of distributions | | | | | | | | |
| A-Class | | | — | | | | 7,651 | |
| C-Class | | | — | | | | 4,321 | |
| H Class | | | — | | | | 18,716 | |
| Institutional Class | | | — | | | | 173 | |
| Shares redeemed | | | | | | | | |
| A-Class | | | (1,816,255 | ) | | | (559,378 | ) |
| C-Class | | | (401,917 | ) | | | (373,099 | ) |
| H-Class | | | (3,728,682 | ) | | | (1,966,390 | ) |
| Institutional Class | | | (102,973 | ) | | | (821 | ) |
| Net increase in shares | | | 807,190 | | | | 1,316,518 | |
| † | Includes 60,298 A-Class, 114,074 C-Class, 101,429 H-Class shares issued in connection with Fund merger. |
| 38 | THE GUGGENHEIM FUNDS ANNUAL REPORT | SEE NOTES TO FINANCIAL STATEMENTS. |
| MULTI-HEDGE STRATEGIES FUND |
| |
| FINANCIAL HIGHLIGHTS |
This table is presented to show selected data for a share outstanding throughout each period and to assist shareholders in evaluating a Fund’s performance for the periods presented.
| | | Year Ended | | | Year Ended | | | Year Ended | | | Period Ended | | | Year Ended | | | Year Ended | |
| | | December 31, | | | December 31, | | | December 31, | | | December 31, | | | March 31, | | | March 31, | |
| A-Class | | 2012a | | | 2011a | | | 2010a | | | 2009a,b | | | 2009 | | | 2008 | |
| Per Share Data | | | | | | | | | | | | | | | | | | | | | | | | |
| Net asset value, beginning of period | | $ | 22.21 | | | $ | 21.66 | | | $ | 20.57 | | | $ | 19.96 | | | $ | 24.61 | | | $ | 26.44 | |
| Income (loss) from investment operations: | | | | | | | | | | | | | | | | | | | | | | | | |
| Net investment income (loss)c | | | (.35 | ) | | | (.27 | ) | | | (.40 | ) | | | (.15 | ) | | | (.10 | ) | | | .58 | |
| Net gain (loss) on investments (realized and unrealized) | | | .82 | | | | .98 | | | | 1.49 | | | | .76 | | | | (4.37 | ) | | | (1.53 | ) |
| Total from investment operations | | | .47 | | | | .71 | | | | 1.09 | | | | .61 | | | | (4.47 | ) | | | (.95 | ) |
| Less distributions from: | | | | | | | | | | | | | | | | | | | | | | | | |
| Net investment income | | | — | | | | (.16 | ) | | | — | | | | — | | | | (.12 | ) | | | (.79 | ) |
| Net realized gains | | | — | | | | — | | | | — | | | | — | | | | (.06 | ) | | | (.09 | ) |
| Total distributions | | | — | | | | (.16 | ) | | | — | | | | — | | | | (.18 | ) | | | (.88 | ) |
| Redemption fees collected | | | — | | | | — | | | | — | d | | | — | d | | | — | d | | | — | d |
| Net asset value, end of period | | $ | 22.68 | | | $ | 22.21 | | | $ | 21.66 | | | $ | 20.57 | | | $ | 19.96 | | | $ | 24.61 | |
| | | | | | | | | | | | | | | | | | | | | | | | | |
| Total Returne | | | 2.02 | % | | | 3.39 | % | | | 5.30 | % | | | 3.06 | % | | | (18.19 | %) | | | (3.72 | %) |
| Ratios/Supplemental Data | | | | | | | | | | | | | | | | | | | | | | | | |
| Net assets, end of period (in thousands) | | $ | 27,700 | | | $ | 24,832 | | | $ | 14,073 | | | $ | 25,010 | | | $ | 45,078 | | | $ | 42,193 | |
| Ratios to average net assets: | | | | | | | | | | | | | | | | | | | | | | | | |
| Net investment income (loss) | | | (1.54 | %) | | | (1.23 | %) | | | (1.97 | %) | | | (1.47 | %) | | | (0.46 | %) | | | 2.18 | % |
| Total expensesf | | | 3.09 | % | | | 2.77 | % | | | 3.56 | % | | | 2.36 | % | | | 2.09 | % | | | 1.96 | % |
| Net expensesg,h | | | 3.05 | % | | | 2.65 | % | | | 3.40 | % | | | 2.32 | % | | | 2.09 | % | | | 1.96 | % |
| Portfolio turnover rate | | | 465 | % | | | 433 | % | | | 993 | % | | | 858 | % | | | 1,578 | % | | | 509 | % |
| | | Year Ended | | | Year Ended | | | Year Ended | | | Period Ended | | | Year Ended | | | Year Ended | |
| | | December 31, | | | December 31, | | | December 31, | | | December 31, | | | March 31, | | | March 31, | |
| C-Class | | 2012a | | | 2011a | | | 2010a | | | 2009a,b | | | 2009 | | | 2008 | |
| Per Share Data | | | | | | | | | | | | | | | | | | | | | | | | |
| Net asset value, beginning of period | | $ | 21.17 | | | $ | 20.80 | | | $ | 19.90 | | | $ | 19.43 | | | $ | 24.13 | | | $ | 26.14 | |
| Income (loss) from investment operations: | | | | | | | | | | | | | | | | | | | | | | | | |
| Net investment income (loss)c | | | (.50 | ) | | | (.42 | ) | | | (.55 | ) | | | (.31 | ) | | | (.25 | ) | | | .37 | |
| Net gain (loss) on investments (realized and unrealized) | | | .78 | | | | .95 | | | | 1.45 | | | | .78 | | | | (4.27 | ) | | | (1.50 | ) |
| Total from investment operations | | | .28 | | | | .53 | | | | .90 | | | | .47 | | | | (4.52 | ) | | | (1.13 | ) |
| Less distributions from: | | | | | | | | | | | | | | | | | | | | | | | | |
| Net investment income | | | — | | | | (.16 | ) | | | — | | | | — | | | | (.12 | ) | | | (.79 | ) |
| Net realized gains | | | — | | | | — | | | | — | | | | — | | | | (.06 | ) | | | (.09 | ) |
| Total distributions | | | — | | | | (.16 | ) | | | — | | | | — | | | | (.18 | ) | | | (.88 | ) |
| Redemption fees collected | | | — | | | | — | | | | — | d | | | — | d | | | — | d | | | — | d |
| Net asset value, end of period | | $ | 21.45 | | | $ | 21.17 | | | $ | 20.80 | | | $ | 19.90 | | | $ | 19.43 | | | $ | 24.13 | |
| | | | | | | | | | | | | | | | | | | | | | | | | |
| Total Returne | | | 1.23 | % | | | 2.62 | % | | | 4.52 | % | | | 2.42 | % | | | (18.76 | %) | | | (4.46 | %) |
| Ratios/Supplemental Data | | | | | | | | | | | | | | | | | | | | | | | | |
| Net assets, end of period (in thousands) | | $ | 16,780 | | | $ | 13,322 | | | $ | 15,194 | | | $ | 23,494 | | | $ | 28,706 | | | $ | 54,857 | |
| Ratios to average net assets: | | | | | | | | | | | | | | | | | | | | | | | | |
| Net investment income (loss) | | | (2.33 | %) | | | (1.99 | %) | | | (2.79 | %) | | | (2.07 | %) | | | (1.09 | %) | | | 1.41 | % |
| Total expensesf | | | 3.85 | % | | | 3.52 | % | | | 4.41 | % | | | 3.14 | % | | | 2.82 | % | | | 2.71 | % |
| Net expensesg,h | | | 3.81 | % | | | 3.39 | % | | | 4.26 | % | | | 3.09 | % | | | 2.82 | % | | | 2.71 | % |
| Portfolio turnover rate | | | 465 | % | | | 433 | % | | | 993 | % | | | 858 | % | | | 1,578 | % | | | 509 | % |
| SEE NOTES TO FINANCIAL STATEMENTS. | THE GUGGENHEIM FUNDS ANNUAL REPORT | 39 |
| MULTI-HEDGE STRATEGIES FUND |
| |
| FINANCIAL HIGHLIGHTS (continued) |
This table is presented to show selected data for a share outstanding throughout each period and to assist shareholders in evaluating a Fund’s performance for the periods presented.
| | | Year Ended | | | Year Ended | | | Year Ended | | | Period Ended | | | Year Ended | | | Year Ended | |
| | | December 31, | | | December 31, | | | December 31, | | | December 31, | | | March 31, | | | March 31, | |
| H-Class | | | 2012a | | | | 2011a | | | | 2010a | | | | 2009a,b | | | | 2009 | | | | 2008 | |
| Per Share Data | | | | | | | | | | | | | | | | | | | | | | | | |
| Net asset value, beginning of period | | $ | 22.23 | | | $ | 21.67 | | | $ | 20.58 | | | $ | 19.98 | | | $ | 24.63 | | | $ | 26.46 | |
| Income (loss) from investment operations: | | | | | | | | | | | | | | | | | | | | | | | | |
| Net investment income (loss)c | | | (.36 | ) | | | (.27 | ) | | | (.43 | ) | | | (.21 | ) | | | (.07 | ) | | | .58 | |
| Net gain (loss) on investments (realized and unrealized) | | | .82 | | | | .99 | | | | 1.52 | | | | .81 | | | | (4.40 | ) | | | (1.53 | ) |
| Total from investment operations | | | .46 | | | | .72 | | | | 1.09 | | | | .60 | | | | (4.47 | ) | | | (.95 | ) |
| Less distributions from: | | | | | | | | | | | | | | | | | | | | | | | | |
| Net investment income | | | — | | | | (.16 | ) | | | — | | | | — | | | | (.12 | ) | | | (.79 | ) |
| Net realized gains | | | — | | | | — | | | | — | | | | — | | | | (.06 | ) | | | (.09 | ) |
| Total distributions | | | — | | | | (.16 | ) | | | — | | | | — | | | | (.18 | ) | | | (.88 | ) |
| Redemption fees collected | | | — | | | | — | | | | — | d | | | — | d | | | — | d | | | — | d |
| Net asset value, end of period | | $ | 22.69 | | | $ | 22.23 | | | $ | 21.67 | | | $ | 20.58 | | | $ | 19.98 | | | $ | 24.63 | |
| | | | | | | | | | | | | | | | | | | | | | | | | |
| Total Returne | | | 2.02 | % | | | 3.39 | % | | | 5.30 | % | | | 3.00 | % | | | (18.17 | %) | | | (3.71 | %) |
| Ratios/Supplemental Data | | | | | | | | | | | | | | | | | | | | | | | | |
| Net assets, end of period (in thousands) | | $ | 66,818 | | | $ | 66,161 | | | $ | 44,421 | | | $ | 69,351 | | | $ | 63,229 | | | $ | 141,483 | |
| Ratios to average net assets: | | | | | | | | | | | | | | | | | | | | | | | | |
| Net investment income (loss) | | | (1.59 | %) | | | (1.25 | %) | | | (2.08 | %) | | | (1.18 | %) | | | (0.31 | %) | | | 2.21 | % |
| Total expensesf | | | 3.07 | % | | | 2.78 | % | | | 3.69 | % | | | 2.37 | % | | | 2.07 | % | | | 1.95 | % |
| Net expensesg,h | | | 3.03 | % | | | 2.65 | % | | | 3.54 | % | | | 2.33 | % | | | 2.07 | % | | | 1.95 | % |
| Portfolio turnover rate | | | 465 | % | | | 433 | % | | | 993 | % | | | 858 | % | | | 1,578 | % | | | 509 | % |
| 40 | THE GUGGENHEIM FUNDS ANNUAL REPORT | SEE NOTES TO FINANCIAL STATEMENTS. |
| MULTI-HEDGE STRATEGIES FUND |
| |
| FINANCIAL HIGHLIGHTS (concluded) |
This table is presented to show selected data for a share outstanding throughout each period and to assist shareholders in evaluating a Fund’s performance for the periods presented.
| | | Year Ended | | | Year Ended | | | Period Ended | |
| | | December 31, | | | December 31, | | | December 31, | |
| Institutional Class | | | 2012a | | | | 2011a | | | | 2010a,i | |
| Per Share Data | | | | | | | | | | | | |
| Net asset value, beginning of period | | $ | 22.32 | | | $ | 21.71 | | | $ | 20.61 | |
| Income (loss) from investment operations: | | | | | | | | | | | | |
| Net investment lossc | | | (.33 | ) | | | (.22 | ) | | | (.43 | ) |
| Net gain on investments (realized and unrealized) | | | .85 | | | | .99 | | | | 1.53 | |
| Total from investment operations | | | .52 | | | | .77 | | | | 1.10 | |
| Less distributions from: | | | | | | | | | | | | |
| Net investment income | | | — | | | | (.16 | ) | | | — | |
| Total distributions | | | — | | | | (.16 | ) | | | — | |
| Redemption fees collected | | | — | | | | — | | | | — | d |
| Net asset value, end of period | | $ | 22.84 | | | $ | 22.32 | | | $ | 21.71 | |
| | | | | | | | | | | | | |
| Total Returne | | | 2.28 | % | | | 3.61 | % | | | 5.34 | % |
| Ratios/Supplemental Data | | | | | | | | | | | | |
| Net assets, end of period (in thousands) | | $ | 14,130 | | | $ | 807 | | | $ | 296 | |
| Ratios to average net assets: | | | | | | | | | | | | |
| Net investment loss | | | (1.46 | %) | | | (0.99 | %) | | | (3.10 | %) |
| Total expensesf | | | 3.05 | % | | | 2.52 | % | | | 5.13 | % |
| Net expensesg,h | | | 3.01 | % | | | 2.40 | % | | | 4.98 | % |
| Portfolio turnover rate | | | 465 | % | | | 433 | % | | | 993 | % |
| b | The fund changed its fiscal year end from March 31 to December 31 in 2009. Percentage amounts for the period, except total return and portfolio turnover rate, have been annualized. |
| c | Net investment income (loss) per share was computed using average shares outstanding throughout the period. |
| d | Redemption fees collected are less than $0.01 per share. |
| e | Total return does not reflect the impact of any applicable sales charges and has not been annualized. |
| f | Does not include expenses of the underlying funds in which the Fund invests. |
| g | Net expense information reflects the expense ratios after expense waivers, and may include interest or dividend expense. |
| h | Excluding interest and dividend expense related to short sales, the operating expense ratios for the years or periods presented would be: |
| | | 12/31/12 | | | 12/31/11 | | | 12/31/10 | | | 12/31/09 | | | 3/31/09 | | | 3/31/08 | |
| A-Class | | | 1.40 | % | | | 1.41 | % | | | 1.41 | % | | | 1.40 | % | | | 1.40 | % | | | 1.40 | % |
| C-Class | | | 2.15 | % | | | 2.15 | % | | | 2.15 | % | | | 2.17 | % | | | 2.17 | % | | | 2.15 | % |
| H-Class | | | 1.40 | % | | | 1.41 | % | | | 1.41 | % | | | 1.41 | % | | | 1.40 | % | | | 1.40 | % |
| Institutional Class | | | 1.15 | % | | | 1.16 | % | | | 1.17 | % | | | N/A | | | | N/A | | | | N/A | |
| i | Since commencement of operations: May 3, 2010. Percentage amounts for the period, except total return and portfolio turnover rate, have been annualized. |
| SEE NOTES TO FINANCIAL STATEMENTS. | THE GUGGENHEIM FUNDS ANNUAL REPORT | 41 |
| PERFORMANCE REPORT AND FUND PROFILE (Unaudited) | December 31, 2012 |
COMMODITIES STRATEGY FUND
OBJECTIVE: Seeks to provide investment results that correlate, before fees and expenses, to the performance of a benchmark for commodities. The Fund’s current benchmark is the S&P GSCITM Commodity Index (the “underlying index”).
For the one-year period ended December 31, 2012, the Fund’s H-Class returned -1.57%, compared with a return of 0.08% for its benchmark, the S&P Goldman Sachs Commodity Index (S&P GSCI). The S&P GSCI represents an unleveraged, long-only investment in commodity futures that is broadly diversified across the spectrum of commodities. It provides exposure to tangible assets, such as oil, metals and agricultural products.
Gasoline, soybeans and corn were among the commodities which provided the most performance to the Fund during the year.
Sugar, natural gas and coffee were among the commodities which provided the least performance to the Fund during the year.
The underlying index was about flat for the year, masking considerable volatility in the commodities markets, which started the year well, then fell off through June when investors worried whether a reflaring of the European debt crisis and a slowing Chinese economy could impact commodities’ growth. As the situation improved in Europe and China appeared to be averting a hard landing, commodities regained ground, but did not go much further.
Oil, as measured by the price of a barrel of Brent crude, was about flat for the year, as concerns about the effect of the weak global economy on demand were offset by the impact of middle east tensions on supply. A surge in gas supply that resulted from more production in U.S. fields drove prices to record lows, which led to some producers cutting back production. Gold continued to benefit from safe-haven buying, and rose about 10%, its 12th consecutive year of increases. Prices of many industrial metals, particularly those closely tied to Chinese production, fell. Copper, which is often regarded as a key indicator of the health of the global economy, rose only 4%. America’s worst drought in 50 years caused prices of many crops to rise, including corn and soybeans, both of which saw bushel prices to record levels.
Derivatives in the Fund are used to help provide exposure to the composition of the benchmark in the most efficient manner, as well as to provide liquidity.
Performance displayed represents past performance which is no guarantee of future results.
Holdings Diversification (Market Exposure as % of Net Assets)
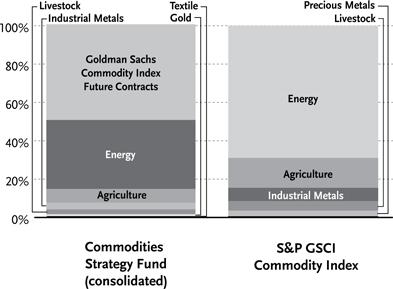
“Holdings Diversification (Market Exposure as % of Net Assets)” excludes any temporary cash investments.
Inception Dates:
| A-Class | | | May 25, 2005 | |
| C-Class | | | May 25, 2005 | |
| H-Class | | | May 25, 2005 | |
The Fund invests principally in derivative investments such as commodity-linked futures contracts.
| 42 | THE GUGGENHEIM FUNDS ANNUAL REPORT |
| PERFORMANCE REPORT AND FUND PROFILE (Unaudited) (concluded) | |
Cumulative Fund Performance*
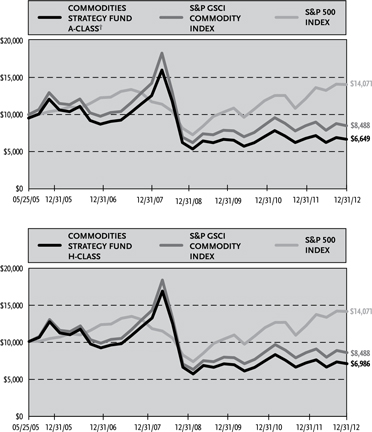
Average Annual Returns*
Periods Ended 12/31/12
| | | | | | | | | Since | |
| | | | | | | | | Inception | |
| | | 1 Year | | | 5 Year | | | (05/25/05) | |
| A-Class Shares | | | -1.63 | % | | | -10.31 | % | | | -4.62 | % |
| A-Class Shares with sales charge† | | | -6.33 | % | | | -11.18 | % | | | -5.23 | % |
| C-Class Shares | | | -2.38 | % | | | -10.96 | % | | | -5.33 | % |
| C-Class Shares with CDSC‡ | | | -3.32 | % | | | -10.96 | % | | | -5.33 | % |
| H-Class Shares | | | -1.57 | % | | | -10.29 | % | | | -4.61 | % |
| S&P Goldman Sachs Commodity Index | | | 0.08 | % | | | -8.12 | % | | | -2.13 | % |
| S&P 500 Index | | | 16.00 | % | | | 1.66 | % | | | 4.60 | % |
| * | The performance data above represents past performance that is not predictive of future results. The investment return and principal value of an investment in the Fund will fluctuate so that an investor’s shares, when redeemed, may be worth more or less than their original cost. Returns are historical and include changes in principal and reinvested dividends and capital gains and do not reflect the effect of taxes. The S&P Goldman Sachs Commodity Index and S&P 500 Index are unmanaged indices and, unlike the Fund, have no management fees or operating expenses to reduce their reported returns. The graphs are based on A-Class shares and H-Class shares only; performance for C-Class shares will vary due to differences in fee structures. |
| † | Fund returns are calculated using the maximum sales charge of 4.75%. |
| ‡ | Fund returns include a CDSC of 1% if redeemed within 12 months of purchase. |
| | THE GUGGENHEIM FUNDS ANNUAL REPORT | 43 |
| CONSOLIDATED SCHEDULE OF INVESTMENTS | December 31, 2012 |
| COMMODITIES STRATEGY FUND |
| | | Face | | | | |
| | | Amount | | | Value | |
| | | | | | | |
| REPURCHASE AGREEMENTS††,1 - 92.5% | | | | | | | | |
| Credit Suisse Group | | | | | | | | |
| issued 12/31/12 at 0.12% | | | | | | | | |
| due 01/02/13 | | $ | 27,660,729 | | | $ | 27,660,729 | |
| HSBC Group | | | | | | | | |
| issued 12/31/12 at 0.12% | | | | | | | | |
| due 01/02/13 | | | 1,033,170 | | | | 1,033,170 | |
| Deutsche Bank | | | | | | | | |
| issued 12/31/12 at 0.11% | | | | | | | | |
| due 01/02/13 | | | 528,402 | | | | 528,402 | |
| Mizuho Financial Group, Inc. | | | | | | | | |
| issued 12/31/12 at 0.14% | | | | | | | | |
| due 01/02/13 | | | 449,479 | | | | 449,479 | |
| Total Repurchase Agreements | | | | | | | | |
| (Cost $29,671,780) | | | | | | | 29,671,780 | |
| Total Investments - 92.5% | | | | | | | | |
| (Cost $29,671,780) | | | | | | $ | 29,671,780 | |
| Other Assets & Liabilities, net - 7.5% | | | | | | | 2,414,115 | |
| Total Net Assets - 100.0% | | | | | | $ | 32,085,895 | |
| | | | | | | | Unrealized | |
| | | | Contracts | | | | Gain (Loss) | |
| COMMODITY FUTURES CONTRACTS PURCHASED† | | | | | | | | |
| February 2013 WTI Crude | | | | | | | | |
| Futures Contracts | | | | | | | | |
| (Aggregate Value of | | | | | | | | |
| Contracts $5,778,359) | | | 63 | | | $ | 310,323 | |
| March 2013 Brent Crude | | | | | | | | |
| Futures Contracts | | | | | | | | |
| (Aggregate Value of | | | | | | | | |
| Contracts $2,860,780) | | | 26 | | | | 115,857 | |
| February 2013 Gas Oil | | | | | | | | |
| Futures Contracts | | | | | | | | |
| (Aggregate Value of | | | | | | | | |
| Contracts $1,220,375) | | | 13 | | | | 38,979 | |
| February 2013 Gasoline RBOB | | | | | | | | |
| Futures Contracts | | | | | | | | |
| (Aggregate Value of | | | | | | | | |
| Contracts $696,377) | | | 6 | | | | 36,287 | |
| February 2013 Heating Oil | | | | | | | | |
| Futures Contracts | | | | | | | | |
| (Aggregate Value of | | | | | | | | |
| Contracts $764,770) | | | 6 | | | | 26,211 | |
| March 2013 Sugar #11 | | | | | | | | |
| Futures Contracts | | | | | | | | |
| (Aggregate Value of | | | | | | | | |
| Contracts $240,856) | | | 11 | | | | 8,081 | |
| February 2013 Lean Hogs | | | | | | | | |
| Futures Contracts | | | | | | | | |
| (Aggregate Value of | | | | | | | | |
| Contracts $240,660) | | | 7 | | | | 5,566 | |
| February 2013 Live Cattle | | | | | | | | |
| Futures Contracts | | | | | | | | |
| (Aggregate Value of | | | | | | | | |
| Contracts $476,730) | | | 9 | | | | 1,849 | |
| March 2013 Cotton #2 | | | | | | | | |
| Futures Contracts | | | | | | | | |
| (Aggregate Value of | | | | | | | | |
| Contracts $150,800) | | | 4 | | | | 1,317 | |
| February 2013 LME Lead | | | | | | | | |
| Futures Contracts | | | | | | | | |
| (Aggregate Value of | | | | | | | | |
| Contracts $58,000) | | | 1 | | | | 628 | |
| March 2013 Feeder Cattle | | | | | | | | |
| Futures Contracts | | | | | | | | |
| (Aggregate Value of | | | | | | | | |
| Contracts $77,088) | | | 1 | | | | 272 | |
| February 2013 LME Zinc | | | | | | | | |
| Futures Contracts | | | | | | | | |
| (Aggregate Value of | | | | | | | | |
| Contracts $103,408) | | | 2 | | | | (325 | ) |
| March 2013 Cocoa | | | | | | | | |
| Futures Contracts | | | | | | | | |
| (Aggregate Value of | | | | | | | | |
| Contracts $44,640) | | | 2 | | | | (3,067 | ) |
| March 2013 Coffee ‘C’ | | | | | | | | |
| Futures Contracts | | | | | | | | |
| (Aggregate Value of | | | | | | | | |
| Contracts $108,000) | | | 2 | | | | (4,320 | ) |
| February 2013 LME Nickel | | | | | | | | |
| Futures Contracts | | | | | | | | |
| (Aggregate Value of | | | | | | | | |
| Contracts $102,210) | | | 1 | | | | (4,516 | ) |
| February 2013 LME Primary Aluminum | | | | | | | | |
| Futures Contracts | | | | | | | | |
| (Aggregate Value of | | | | | | | | |
| Contracts $309,150) | | | 6 | | | | (7,596 | ) |
| March 2013 Winter Wheat | | | | | | | | |
| Futures Contracts | | | | | | | | |
| (Aggregate Value of | | | | | | | | |
| Contracts $166,100) | | | 4 | | | | (9,505 | ) |
| February 2013 Gold 100 oz. | | | | | | | | |
| Futures Contracts | | | | | | | | |
| (Aggregate Value of | | | | | | | | |
| Contracts $502,080) | | | 3 | | | | (10,869 | ) |
| February 2013 Natural Gas | | | | | | | | |
| Futures Contracts | | | | | | | �� | |
| (Aggregate Value of | | | | | | | | |
| Contracts $369,160) | | | 11 | | | | (13,363 | ) |
| February 2013 LME Copper | | | | | | | | |
| Futures Contracts | | | | | | | | |
| (Aggregate Value of | | | | | | | | |
| Contracts $594,293) | | | 3 | | | | (13,518 | ) |
| January 2013 Goldman Sachs Index | | | | | | | | |
| Futures Contracts | | | | | | | | |
| (Aggregate Value of | | | | | | | | |
| Contracts $16,199,999) | | | 100 | | | | (16,825 | ) |
| March 2013 Soybean | | | | | | | | |
| Futures Contracts | | | | | | | | |
| (Aggregate Value of | | | | | | | | |
| Contracts $422,700) | | | 6 | | | | (17,870 | ) |
| March 2013 Wheat | | | | | | | | |
| Futures Contracts | | | | | | | �� | |
| (Aggregate Value of | | | | | | | | |
| Contracts $545,300) | | | 14 | | | | (28,797 | ) |
| March 2013 Corn | | | | | | | | |
| Futures Contracts | | | | | | | | |
| (Aggregate Value of | | | | | | | | |
| Contracts $769,725) | | | 22 | | | | (28,861 | ) |
| (Total Aggregate Value of | | | | | | | | |
| Contracts $32,801,560) | | | | | | $ | 385,938 | |
| † | Value determined based on Level 1 inputs — See Note 4. |
| †† | Value determined based on Level 2 inputs — See Note 4. |
| 1 | Repurchase Agreements — See Note 5. |
| 44 | THE GUGGENHEIM FUNDS ANNUAL REPORT | SEE NOTES TO FINANCIAL STATEMENTS. |
| COMMODITIES STRATEGY FUND |
CONSOLIDATED STATEMENT OF
ASSETS AND LIABILITIES |
| December 31, 2012 |
| Assets: | | | | |
| Repurchase agreements, at value | | | | |
| (cost $29,671,780) | | $ | 29,671,780 | |
| Segregated cash with broker | | | 2,344,015 | |
| Receivables: | | | | |
| Variation margin | | | 187,670 | |
| Fund shares sold | | | 137,044 | |
| Interest | | | 99 | |
| Total assets | | | 32,340,608 | |
| Liabilities: | | | | |
| Overdraft due to custodian bank | | | 30,335 | |
| Payable for: | | | | |
| Fund shares redeemed | | | 169,894 | |
| Management fees | | | 18,451 | |
| Distribution and service fees | | | 7,690 | |
| Transfer agent and administrative fees | | | 6,150 | |
| Portfolio accounting fees | | | 2,460 | |
| Miscellaneous | | | 19,733 | |
| Total liabilities | | | 254,713 | |
| Net assets | | $ | 32,085,895 | |
| Net assets consist of: | | | | |
| Paid in capital | | $ | 54,321,316 | |
| Accumulated net investment loss | | | (2,770,217 | ) |
| Accumulated net realized loss on investments | | | (19,851,142 | ) |
| Net unrealized appreciation on investments | | | 385,938 | |
| Net assets | | $ | 32,085,895 | |
| A-Class: | | | | |
| Net assets | | $ | 5,839,758 | |
| Capital shares outstanding | | | 376,977 | |
| Net asset value per share | | $ | 15.49 | |
| Maximum offering price per share (Net asset value divided by 95.25%) | | $ | 16.26 | |
| C-Class: | | | | |
| Net assets | | $ | 2,574,959 | |
| Capital shares outstanding | | | 176,882 | |
| Net asset value per share | | $ | 14.56 | |
| H-Class: | | | | |
| Net assets | | $ | 23,671,178 | |
| Capital shares outstanding | | | 1,527,588 | |
| Net asset value per share | | $ | 15.50 | |
CONSOLIDATED STATEMENT
OF OPERATIONS |
| Year Ended December 31, 2012 |
| Investment Income: | | | | |
| Interest | | $ | 28,668 | |
| Total investment income | | | 28,668 | |
| | | | | |
| Expenses: | | | | |
| Management fees | | | 267,028 | |
| Transfer agent and administrative fees | | | 78,417 | |
| Distribution and service fees: | | | | |
| A-Class | | | 14,444 | |
| C-Class | | | 30,801 | |
| H-Class | | | 56,273 | |
| Portfolio accounting fees | | | 31,366 | |
| Custodian fees | | | 6,317 | |
| Trustees’ fees* | | | 5,015 | |
| Miscellaneous | | | 33,225 | |
| Total expenses | | | 522,886 | |
| Less: | | | | |
| Expenses waived by Advisor | | | (31,775 | ) |
| Net expenses | | | 491,111 | |
| Net investment loss | | | (462,443 | ) |
| | | | | |
| Net Realized and Unrealized Gain (Loss): | | | | |
| Net realized gain (loss) on: | | | | |
| Futures contracts | | | (1,866,445 | ) |
| Net realized loss | | | (1,866,445 | ) |
| Net change in unrealized appreciation (depreciation) on: | | | | |
| Investments | | | (1,288 | ) |
| Futures contracts | | | 605,161 | |
| Net change in unrealized appreciation (depreciation) | | | 603,873 | |
| Net realized and unrealized loss | | | (1,262,572 | ) |
| Net decrease in net assets resulting from operations | | $ | (1,725,015 | ) |
| * | Relates to Trustees not deemed “interested persons” within the meaning of Section 2(a)(19) of the 1940 Act. |
| SEE NOTES TO FINANCIAL STATEMENTS. | THE GUGGENHEIM FUNDS ANNUAL REPORT | 45 |
| COMMODITIES STRATEGY FUND |
CONSOLIDATED STATEMENTS OF CHANGES IN NET ASSETS
| | | Year Ended | | | Year Ended | |
| | | December 31, | | | December 31, | |
| | | 2012 | | | 2011 | |
| | | | | | | |
| Increase (Decrease) In Net Assets From Operations: | | | | | | | | |
| Net investment loss | | $ | (462,443 | ) | | $ | (799,429 | ) |
| Net realized loss on investments | | | (1,866,445 | ) | | | (185,759 | ) |
| Net change in unrealized appreciation (depreciation) on investments | | | 603,873 | | | | (1,986,758 | ) |
| Net decrease in net assets resulting from operations | | | (1,725,015 | ) | | | (2,971,946 | ) |
| | | | | | | | | |
| Distributions to shareholders from: | | | | | | | | |
| Net investment income | | | | | | | | |
| A-Class | | | (90,394 | ) | | | (181,426 | ) |
| C-Class | | | (72,057 | ) | | | (123,565 | ) |
| H-Class | | | (634,797 | ) | | | (552,159 | ) |
| Total distributions to shareholders | | | (797,248 | ) | | | (857,150 | ) |
| | | | | | | | | |
| Capital share transactions: | | | | | | | | |
| Proceeds from sale of shares | | | | | | | | |
| A-Class | | | 21,757,665 | | | | 11,929,885 | |
| C-Class | | | 624,941 | | | | 1,959,508 | |
| H-Class | | | 141,800,896 | | | | 198,728,902 | |
| Distributions reinvested | | | | | | | | |
| A-Class | | | 77,852 | | | | 165,949 | |
| C-Class | | | 65,263 | | | | 112,557 | |
| H-Class | | | 597,525 | | | | 516,857 | |
| Cost of shares redeemed | | | | | | | | |
| A-Class | | | (20,880,282 | ) | | | (13,331,979 | ) |
| C-Class | | | (1,544,634 | ) | | | (3,022,060 | ) |
| H-Class | | | (131,653,400 | ) | | | (213,806,275 | ) |
| Net increase (decrease) from capital share transactions | | | 10,845,826 | | | | (16,746,656 | ) |
| Net increase (decrease) in net assets | | | 8,323,563 | | | | (20,575,752 | ) |
| | | | | | | | | |
| Net assets: | | | | | | | | |
| Beginning of year | | | 23,762,332 | | | | 44,338,084 | |
| End of year | | $ | 32,085,895 | | | $ | 23,762,332 | |
| Accumulated net investment loss at end of year | | $ | (2,770,217 | ) | | $ | (1,972,970 | ) |
| | | | | | | | | |
| Capital share activity: | | | | | | | | |
| Shares sold | | | | | | | | |
| A-Class | | | 1,304,505 | | | | 644,840 | |
| C-Class | | | 40,528 | | | | 111,896 | |
| H-Class | | | 8,637,054 | | | | 11,063,570 | |
| Shares issued from reinvestment of distributions | | | | | | | | |
| A-Class | | | 5,129 | | | | 10,200 | |
| C-Class | | | 4,573 | | | | 7,295 | |
| H-Class | | | 39,337 | | | | 31,768 | |
| Shares redeemed | | | | | | | | |
| A-Class | | | (1,255,530 | ) | | | (747,260 | ) |
| C-Class | | | (100,156 | ) | | | (180,193 | ) |
| H-Class | | | (8,075,041 | ) | | | (12,032,423 | ) |
| Net increase (decrease) in shares | | | 600,399 | | | | (1,090,307 | ) |
| 46 | THE GUGGENHEIM FUNDS ANNUAL REPORT | SEE NOTES TO FINANCIAL STATEMENTS. |
| Commodities Strategy Fund |
This table is presented to show selected data for a share outstanding throughout each period and to assist shareholders in evaluating a Fund’s performance for the periods presented.
| | | Year Ended | | | Year Ended | | | Year Ended | | | Period Ended | | | Year Ended | | | Year Ended | |
| | | December 31, | | | December 31, | | | December 31, | | | December 31, | | | March 31, | | | March 31, | |
| A-Class | | 2012a | | | 2011a | | | 2010a | | | 2009a,b | | | 2009 | | | 2008 | |
| Per Share Data | | | | | | | | | | | | | | | | | | | | | | | | |
| Net asset value, beginning of period | | $ | 16.18 | | | $ | 17.33 | | | $ | 16.39 | | | $ | 13.26 | | | $ | 32.68 | | | $ | 23.81 | |
| Income (loss) from investment operations: | | | | | | | | | | | | | | | | | | | | | | | | |
| Net investment income (loss)c | | | (.23 | ) | | | (.26 | ) | | | (.22 | ) | | | (.14 | ) | | | — | d | | | .68 | |
| Net gain (loss) on investments (realized and unrealized) | | | (.05 | ) | | | (.36 | ) | | | 1.16 | | | | 3.37 | | | | (18.80 | ) | | | 8.27 | |
| Total from investment operations | | | (.28 | ) | | | (.62 | ) | | | .94 | | | | 3.23 | | | | (18.80 | ) | | | 8.95 | |
| Less distributions from: | | | | | | | | | | | | | | | | | | | | | | | | |
| Net investment income | | | (.41 | ) | | | (.53 | ) | | | — | | | | (.11 | ) | | | (.70 | ) | | | (.22 | ) |
| Total distributions | | | (.41 | ) | | | (.53 | ) | | | — | | | | (.11 | ) | | | (.70 | ) | | | (.22 | ) |
| Redemption fees collected | | | — | | | | — | | | | — | e | | | .01 | | | | .08 | | | | .14 | |
| Net asset value, end of period | | $ | 15.49 | | | $ | 16.18 | | | $ | 17.33 | | | $ | 16.39 | | | $ | 13.26 | | | $ | 32.68 | |
| | | | | | | | | | | | | | | | | | | | | | | | | |
| Total Returnf | | | (1.63 | %) | | | (3.61 | %) | | | 5.74 | % | | | 24.46 | % | | | (57.55 | %) | | | 38.48 | % |
| Ratios/Supplemental Data | | | | | | | | | | | | | | | | | | | | | | | | |
| Net assets, end of period (in thousands) | | $ | 5,840 | | | $ | 5,223 | | | $ | 7,192 | | | $ | 8,553 | | | $ | 7,189 | | | $ | 18,579 | |
| Ratios to average net assets: | | | | | | | | | | | | | | | | | | | | | | | | |
| Net investment income (loss) | | | (1.40 | %) | | | (1.47 | %) | | | (1.42 | %) | | | (1.24 | %) | | | 0.02 | % | | | 2.49 | % |
| Total expenses | | | 1.59 | % | | | 1.66 | % | | | 1.65 | % | | | 1.56 | % | | | 1.52 | % | | | 1.51 | % |
| Net expensesg | | | 1.49 | % | | | 1.55 | % | | | 1.56 | % | | | 1.38 | % | | | 1.20 | % | | | 1.19 | % |
| Portfolio turnover rate | | | — | | | | — | | | | 200 | % | | | 220 | % | | | 390 | % | | | 405 | % |
| | | Year Ended | | | Year Ended | | | Year Ended | | | Period Ended | | | Year Ended | | | Year Ended | |
| | | December 31, | | | December 31, | | | December 31, | | | December 31, | | | March 31, | | | March 31, | |
| C-Class | | 2012a | | | 2011a | | | 2010a | | | 2009a,b | | | 2009 | | | 2008 | |
| Per Share Data | | | | | | | | | | | | | | | | | | | | | | | | |
| Net asset value, beginning of period | | $ | 15.34 | | | $ | 16.58 | | | $ | 15.80 | | | $ | 12.86 | | | $ | 31.96 | | | $ | 23.47 | |
| Income (loss) from investment operations: | | | | | | | | | | | | | | | | | | | | | | | | |
| Net investment income (loss)c | | | (.33 | ) | | | (.37 | ) | | | (.32 | ) | | | (.22 | ) | | | (.06 | ) | | | .48 | |
| Net gain (loss) on investments (realized and unrealized) | | | (.04 | ) | | | (.34 | ) | | | 1.10 | | | | 3.26 | | | | (18.43 | ) | | | 8.09 | |
| Total from investment operations | | | (.37 | ) | | | (.71 | ) | | | .78 | | | | 3.04 | | | | (18.49 | ) | | | 8.57 | |
| Less distributions from: | | | | | | | | | | | | | | | | | | | | | | | | |
| Net investment income | | | (.41 | ) | | | (.53 | ) | | | — | | | | (.11 | ) | | | (.70 | ) | | | (.22 | ) |
| Total distributions | | | (.41 | ) | | | (.53 | ) | | | — | | | | (.11 | ) | | | (.70 | ) | | | (.22 | ) |
| Redemption fees collected | | | — | | | | — | | | | — | e | | | .01 | | | | .09 | | | | .14 | |
| Net asset value, end of period | | $ | 14.56 | | | $ | 15.34 | | | $ | 16.58 | | | $ | 15.80 | | | $ | 12.86 | | | $ | 31.96 | |
| | | | | | | | | | | | | | | | | | | | | | | | | |
| Total Returnf | | | (2.38 | %) | | | (4.32 | %) | | | 4.94 | % | | | 23.74 | % | | | (58.03 | %) | | | 37.41 | % |
| Ratios/Supplemental Data | | | | | | | | | | | | | | | | | | | | | | | | |
| Net assets, end of period (in thousands) | | $ | 2,575 | | | $ | 3,558 | | | $ | 4,857 | | | $ | 6,186 | | | $ | 4,072 | | | $ | 10,793 | |
| Ratios to average net assets: | | | | | | | | | | | | | | | | | | | | | | | | |
| Net investment income (loss) | | | (2.15 | %) | | | (2.22 | %) | | | (2.17 | %) | | | (2.03 | %) | | | (0.22 | %) | | | 1.79 | % |
| Total expenses | | | 2.34 | % | | | 2.41 | % | | | 2.39 | % | | | 2.31 | % | | | 2.28 | % | | | 2.26 | % |
| Net expensesg | | | 2.24 | % | | | 2.30 | % | | | 2.30 | % | | | 2.15 | % | | | 1.95 | % | | | 1.94 | % |
| Portfolio turnover rate | | | — | | | | — | | | | 200 | % | | | 220 | % | | | 390 | % | | | 405 | % |
| See Notes to Financial Statements. | the GUGGENHEIM FUNDS annual report | 47 |
| Commodities Strategy Fund |
| FINANCIAL HIGHLIGHTS (concluded) |
This table is presented to show selected data for a share outstanding throughout each period and to assist shareholders in evaluating a Fund’s performance for the periods presented.
| | | Year Ended | | | Year Ended | | | Year Ended | | | Period Ended | | | Year Ended | | | Year Ended | |
| | | December 31, | | | December 31, | | | December 31, | | | December 31, | | | March 31, | | | March 31, | |
| H-Class | | 2012a | | | 2011a | | | 2010a | | | 2009a,b | | | 2009 | | | 2008 | |
| Per Share Data | | | | | | | | | | | | | | | | | | | | | | | | |
| Net asset value, beginning of period | | $ | 16.18 | | | $ | 17.33 | | | $ | 16.39 | | | $ | 13.26 | | | $ | 32.66 | | | $ | 23.81 | |
| Income (loss) from investment operations: | | | | | | | | | | | | | | | | | | | | | | | | |
| Net investment income (loss)c | | | (.23 | ) | | | (.27 | ) | | | (.22 | ) | | | (.14 | ) | | | .13 | | | | .60 | |
| Net gain (loss) on investments (realized and unrealized) | | | (.04 | ) | | | (.35 | ) | | | 1.16 | | | | 3.37 | | | | (18.93 | ) | | | 8.30 | |
| Total from investment operations | | | (.27 | ) | | | (.62 | ) | | | .94 | | | | 3.23 | | | | (18.80 | ) | | | 8.90 | |
| Less distributions from: | | | | | | | | | | | | | | | | | | | | | | | | |
| Net investment income | | | (.41 | ) | | | (.53 | ) | | | — | | | | (.11 | ) | | | (.70 | ) | | | (.22 | ) |
| Total distributions | | | (.41 | ) | | | (.53 | ) | | | — | | | | (.11 | ) | | | (.70 | ) | | | (.22 | ) |
| Redemption fees collected | | | — | | | | — | | | | — | e | | | .01 | | | | .10 | | | | .17 | |
| Net asset value, end of period | | $ | 15.50 | | | $ | 16.18 | | | $ | 17.33 | | | $ | 16.39 | | | $ | 13.26 | | | $ | 32.66 | |
| | | | | | | | | | | | | | | | | | | | | | | | | |
| Total Returnf | | | (1.57 | %) | | | (3.67 | %) | | | 5.74 | % | | | 24.45 | % | | | (57.52 | %) | | | 38.39 | % |
| Ratios/Supplemental Data | | | | | | | | | | | | | | | | | | | | | | | | |
| Net assets, end of period (in thousands) | | $ | 23,671 | | | $ | 14,982 | | | $ | 32,290 | | | $ | 32,019 | | | $ | 50,622 | | | $ | 124,886 | |
| Ratios to average net assets: | | | | | | | | | | | | | | | | | | | | | | | | |
| Net investment income (loss) | | | (1.40 | %) | | | (1.47 | %) | | | (1.42 | %) | | | (1.22 | %) | | | 0.43 | % | | | 2.10 | % |
| Total expenses | | | 1.60 | % | | | 1.66 | % | | | 1.65 | % | | | 1.56 | % | | | 1.52 | % | | | 1.51 | % |
| Net expensesg | | | 1.49 | % | | | 1.56 | % | | | 1.56 | % | | | 1.37 | % | | | 1.20 | % | | | 1.19 | % |
| Portfolio turnover rate | | | — | | | | — | | | | 200 | % | | | 220 | % | | | 390 | % | | | 405 | % |
| b | The Fund changed its fiscal year from March 31 to December 31 in 2009. Percentage amounts for the period, except total return and portfolio turnover rate, have been annualized. |
| c | Net investment income (loss) per share was computed using average shares outstanding throughout the period. |
| d | Net investment income is less than $0.01 per share. |
| e | Redemption fees collected are less than $0.01 per share. |
| f | Total return does not reflect the impact of any applicable sales charges. |
| g | Net expense information reflects the expense ratios after expense waivers. |
| 48 | the GUGGENHEIM FUNDS annual report | See Notes to Financial Statements. |
| NOTES TO Consolidated FINANCIAL STATEMENTS |
| 1. | Organization, Consolidation of Subsidiary and Significant Accounting Policies |
Organization
The Rydex Series Funds (the “Trust”) is registered with the SEC under the Investment Company Act of 1940 (“1940 Act”), as a non-diversified, open-ended investment company. Each series, in effect, is representing a separate Fund (collectively the “Funds”). The Trust is authorized to issue an unlimited number of shares. The Trust accounts for the assets of each Fund separately.
The Trust offers a combination of eight separate classes of shares: Investor Class shares, Advisor Class shares, A-Class shares, C-Class shares, H-Class shares, Y-Class shares, Institutional Class shares, and Money Market Class shares. Sales of shares of each Class are made without a front-end sales charge at the net asset value per share (“NAV”), with the exception of A-Class shares. A-Class shares are sold at the NAV, plus the applicable front-end sales charge. The sales charge varies depending on the amount purchased, but will not exceed 4.75%. A-Class share purchases of $1 million or more are exempt from the front-end sales charge but have a 1% contingent deferred sales charge (“CDSC “) if shares are redeemed within 12 months of purchase. C-Class shares have a 1% CDSC if shares are redeemed within 12 months of purchase. Institutional Class shares are offered primarily for direct investment by institutions such as pension and profit sharing plans, endowments, foundations and corporations. Institutional Class shares have a minimum initial investment of $2 million and a minimum account balance of $1 million. Institutional Class shares are offered without a front-end sales charge or CDSC.
At December 31, 2012, the Trust consisted of fifty-six separate funds. This report covers the Long/Short Commodites Strategy Fund, the Global Managed Futures Strategy Fund, the Multi-Hedge Strategies Fund and the Commodities Strategy Fund (collectively, the “Funds”). Only A-Class, C-Class, H-Class, Y-Class and Institutional Class shares had been issued by the Funds.
Guggenheim Investments (“GI”) provides advisory services and Rydex Fund Services, LLC (“RFS”) provides transfer agent, administrative and accounting services to the Trust. Guggenheim Distributors, LLC (“GDL”) acts as principal underwriter for the Trust. GI, RFS and GDL are affiliated entities.
Consolidation of Subsidiary
Each of the consolidated financial statements of the Funds include the accounts of a wholly-owned and controlled Cayman Islands subsidiary (the “Subsidiary”). Significant inter-company accounts and transactions have been eliminated in consolidation for the Funds.
Each Fund may invest up to 25% of its total assets in its Subsidiary which acts as an investment vehicle in order to effect certain investments consistent with the Fund’s investment objectives and policies.
A summary of each Fund’s investment in its respective Subsidiary is as follows:
| | | | | | | | | % of Total | |
| | | | | | Subsidiary | | | Net Assets | |
| | | Inception | | | Net Assets at | | | of the Fund at | |
| | | Date of | | | December 31, | | | December 31, | |
| | | Subsidiary | | | 2012 | | | 2012 | |
| Long/Short Commodities | | | | | | | | | | | | |
| Strategy Fund | | | 06/25/09 | | | $ | 27,260,200 | | | | 19.2 | % |
| Global Managed Futures | | | | | | | | | | | | |
| Strategy Fund | | | 05/10/12 | | | | 1,525,967 | | | | 10.5 | % |
| Multi-Hedge Strategies Fund | | | 09/18/09 | | | | 4,410,754 | | | | 3.5 | % |
| Commodities Strategy Fund | | | 09/08/09 | | | | 4,863,056 | | | | 15.2 | % |
Significant Accounting Policies
The following significant accounting policies are in conformity with U.S. generally accepted accounting principles (“U.S. GAAP”) and are consistently followed by the Trust. This requires management to make estimates and assumptions that affect the reported amount of assets and liabilities and disclosure of contingent assets and liabilities at the date of the financial statements and the reported amounts of revenues and expenses during the reporting period. Actual results could differ from these estimates. All time references are based on Eastern Time.
A. Equity securities listed on an exchange (New York Stock Exchange (“NYSE”) or American Stock Exchange) are valued at the last quoted sales price as of the close of business on the NYSE, usually 4:00 p.m. on the valuation date. Equity securities listed on the NASDAQ market system are valued at the NASDAQ Official Closing Price on the valuation date.
Listed options held by the Trust are valued at the Official Settlement Price listed by the exchange, usually as of 4:00 p.m. Long options are valued using the bid price and short options are valued using the ask price. In the event that a settlement price is not available, fair valuation is enacted. Over-the-counter options held by the Trust are valued using the average bid price (for long options), or average ask price (for short options) obtained from one or more security dealers.
The value of futures contracts is accounted for using the unrealized gain or loss on the contracts that is determined by marking the contracts to their current realized settlement prices. Financial futures contracts are valued at the 4:00 p.m. price on the valuation date. In the event that the exchange for a specific futures contract closes earlier than 4:00 p.m., the futures contract is valued at the Official Settlement Price of the exchange. However, the underlying
| the GUGGENHEIM FUNDS annual report | 49 |
| NOTES TO Consolidated FINANCIAL STATEMENTS (continued) |
securities from which the futures contract value is derived are monitored until 4:00 p.m. to determine if fair valuation would provide a more accurate valuation.
The value of credit default swap agreements entered into by a Fund is accounted for using the unrealized gain or loss on the agreements that is determined by marking the agreements to the last quoted value of the index that the swap pertains to at the close of the NYSE. The swap’s market value is then adjusted to include dividends accrued, financing charges and/or interest associated with the swap agreements.
Debt securities with a maturity of greater than 60 days at acquisition are valued at prices that reflect broker/dealer supplied valuations or are obtained from independent pricing services, which may consider the trade activity, treasury spreads, yields or price of bonds of comparable quality, coupon, maturity, and type, as well as prices quoted by dealers who make markets in such securities. Short-term debt securities with a maturity of 60 days or less at acquisition and repurchase agreements are valued at amortized cost, which approximates market value.
Open-end investment companies (“Mutual Funds”) are valued at their NAV as of the close of business on the valuation date. Exchange Traded Funds (“ETFs”) and closed-end investment companies are valued at the last quoted sales price.
Investments for which market quotations are not readily available are fair valued as determined in good faith by GI under the direction of the Board of Trustees using methods established or ratified by the Board of Trustees. These methods include, but are not limited to: (i) obtaining general information as to how these securities and assets trade; (ii) in connection with futures contracts and options thereupon, and other derivative investments, obtaining information as to how (a) these contracts and other derivative investments trade in the futures or other derivative markets, respectively, and (b) the securities underlying these contracts and other derivative investments trade in the cash market; and (iii) obtaining other information and considerations, including current values in related markets.
B. Securities transactions are recorded on the trade date for financial reporting purposes. Realized gains and losses from securities transactions are recorded using the identified cost basis. Proceeds from lawsuits related to investment holdings are recorded as realized gains in the respective Fund. Dividend income is recorded on the ex-dividend date, net of applicable taxes withheld by foreign countries. Taxable non-cash dividends are recorded as dividend income. Interest income, including amortization of premiums and accretion of discounts, is accrued on a daily basis. Distributions received from investments in REITs are recorded as dividend income on the ex-dividend date, subject to reclassification upon notice of the character of such distribution by the issuer.
C. Distributions of net investment income and net realized gains, if any, are declared and paid at least annually. Distributions are recorded on the ex-dividend date and are determined in accordance with income tax regulations which may differ from U.S. GAAP.
D. When a Fund engages in a short sale of a security, an amount equal to the proceeds is reflected as an asset and an equivalent liability. The amount of the liability is subsequently marked-to-market to reflect the market value of the short sale. The Fund maintains a segregated account of cash and/or securities as collateral for short sales. The Fund is exposed to market risk based on the amount, if any, that the market value of the security exceeds the market value of the securities in the segregated account.
Fees, if any, paid to brokers to borrow securities in connection with short sales are recorded as interest expense. In addition, the Fund must pay out the dividend rate of the equity or coupon rate of the treasury obligation to the lender and record this as an expense. Short dividend or interest expense is a cost associated with the investment objective of short sales transactions, rather than an operational cost associated with the day-to-day management of any mutual fund. The Funds may also receive rebate income from the broker resulting from the investment of the proceeds from securities sold short.
E. Upon the purchase of an option, the premium paid is recorded as an investment, the value of which is marked-to market daily. If a purchased option expires, the Fund realizes a loss in the amount of the cost of the option. When the Fund enters into a closing sale transaction, it realizes a gain or loss depending on whether the proceeds from the closing sale transaction are greater or less than the cost of the option. If the Fund exercises a put option, it realizes a gain or loss from the sale of the underlying security and the proceeds from such sale will be decreased by the premium originally paid. When the Fund exercises a call option, the cost of the security purchased by the Fund upon exercise increases by the premium originally paid.
When the Fund writes (sells) an option, an amount equal to the premium received is entered in that Fund’s accounting records as an asset and equivalent liability. The amount of the liability is subsequently marked-to-market to reflect the current value of the option written. When a written option expires, or if the Fund enters into a closing purchase transaction, it realizes a gain (or loss if the cost of a closing purchase transaction exceeds the premium received when the option was sold).
| 50 | the GUGGENHEIM FUNDS annual report |
| NOTES TO Consolidated FINANCIAL STATEMENTS (continued) |
F. Upon entering into a futures contract, a Fund deposits and maintains as collateral such initial margin as required by the exchange on which the transaction is affected. Pursuant to the contract, the Fund agrees to receive from or pay to the broker an amount of cash equal to the daily fluctuation in value of the contract. Such receipts or payments are known as variation margin and are recorded by the Fund as unrealized gains or losses. When the contract is closed, the Fund records a realized gain or loss equal to the difference between the value of the contract at the time it was opened and the value at the time it was closed.
G. Credit default swap agreements are marked-to-market daily and the change, if any, is recorded as unrealized gain or loss. Upfront payments received or made by a Fund on credit default swap agreements are amortized over the expected life of the agreement. Periodic payments received or paid by a Fund are recorded as realized gains or losses. Payments received or made as a result of a credit event or termination of the contract are recognized, net of a proportional amount of the upfront payment, as realized gains or losses.
H. Investment securities and other assets and liabilities denominated in foreign currencies are translated into U.S. dollar amounts at the date of valuation. Purchases and sales of investment securities and income and expense items denominated in foreign currencies are translated into U.S. dollar amounts on the respective dates of such transactions. The Trust does not isolate that portion of the results of operations resulting from changes in foreign exchange rates on investments from the fluctuations arising from changes in market prices of securities held. Such fluctuations are included with the net realized and unrealized gain and loss from investments.
Reported net realized foreign exchange gains or losses arise from sales of foreign currencies and currency gains or losses realized between the trade and settlement dates on investment transactions. Net unrealized exchange gains and losses arise from changes in the fair values of assets and liabilities other than investments in securities at the fiscal period end, resulting from changes in exchange rates.
I. Certain U.S. Government and Agency Obligations are traded on a discount basis; the interest rates shown on the Schedules of Investments reflect the effective rates paid at the time of purchase by the Funds. Other securities bear interest at the rates shown, payable at fixed dates through maturity.
J. The Funds may leave cash overnight in their cash account with the custodian, U.S. Bank. Periodically, a Fund may have cash due to the custodian bank as an overdraft balance. A fee is incurred on this overdraft, calculated by multiplying the overdraft by a rate based on the federal funds rate.
Segregated cash with the broker is held as collateral for short sales and investments in derivative instruments such as futures con-tracts or swap agreements.
K. Interest and dividend income, most expenses, all realized gains and losses, and all unrealized gains and losses are allocated to the classes based upon the value of the outstanding shares in each class. Certain costs, such as distribution fees relating to A-Class shares and H-Class shares and service and distribution fees related to C-Class shares, are charged directly to specific classes. In addition, certain expenses have been allocated to the individual Funds in the Trust on a pro rata basis upon the respective aggregate net assets of each Fund included in the Trust.
L. Throughout the normal course of business, the Funds enter into contracts that contain a variety of representations and warranties which provide general indemnifications. The Funds’ maximum exposure under these arrangements is unknown, as this would involve future claims that may be made against the Funds and/or their affiliates that have not yet occurred. However, based on experience, the Funds expect the risk of loss to be remote.
2. Financial Instruments
As part of their investment strategy, the Funds utilize short sales, swaps, and options and a variety of derivative instruments including futures. These investments involve, to varying degrees, elements of market risk and risks in excess of the amounts recognized in the Statements of Assets and Liabilities.
A short sale is a transaction in which a Fund sells a security it does not own. If the security sold short decreases in price between the time the Fund sells the security and closes its short position, that Fund will realize a gain on the transaction. Conversely, if the security increases in price during the period, that Fund will realize a loss on the transaction. The risk of such price increases is the principal risk of engaging in short sales.
A futures contract is an agreement to purchase (long) or sell (short) an agreed amount of securities or other instruments at a set price for delivery at a future date. There are significant risks associated with a Fund’s or an underlying fund’s use of futures contracts and related options, including (i) there may be an imperfect or no correlation between the changes in market value of the underlying asset and the prices of futures contracts; (ii) there may not be a liquid secondary market for a futures contract; (iii) trading restrictions or limitations may be imposed by an exchange; and (iv) government regulations may restrict trading in futures contracts. When investing in futures, there is minimal counterparty credit risk to the Fund because futures are exchange-
| the GUGGENHEIM FUNDS annual report | 51 |
| NOTES TO Consolidated FINANCIAL STATEMENTS (continued) |
traded and the exchange’s clearinghouse, as counterparty to all exchange-traded futures, guarantees against default.
A swap is an agreement that obligates two parties to exchange a series of cash flows at specified intervals based upon or calculated by reference to changes in specified prices or rates for a specified amount of an underlying asset. A credit default swap enables a Fund to buy or sell protection against a defined credit event of an issuer or a basket of securities. Generally, the seller of credit protection against an issuer or basket of securities receives a periodic payment from the buyer to compensate against potential default events. If a default event occurs, the seller must pay the buyer the full notional value of the reference obligation in exchange for the reference obligation. If no default occurs, the counterparty will pay the stream of payments and have no further obligations to the Fund selling the credit protection. A Fund bears the risk of loss of the amount expected to be received under a swap agreement in the event of the default or bankruptcy of a swap agreement counterparty, or in the case of a credit default swap in which the Fund is selling credit protection, the default of a third party issuer. Additionally, there is no guarantee that a Fund or an underlying fund could eliminate its exposure under an outstanding swap agreement by entering into an offsetting swap agreement with the same or another party.
An option on a security gives the purchaser of the option the right to sell, and the writer of the option the obligation to buy, the underlying security (put option) or the purchaser of the option the right to buy, and the writer of the option the obligation to sell, the underlying security (call option) at any time during the option period. The risk associated with purchasing options is limited to the premium originally paid. The risk in writing a call option is that a Fund may incur a loss if the market price of the underlying security increases and the option is exercised. The risk in writing a put option is that a Fund may incur a loss if the market price of the underlying security decreases and the option is exercised. In addition, there may be an imperfect correlation between the movement in prices of options and the underlying securities and a Fund may not be able to enter into a closing transaction because of an illiquid secondary market or, for over-the-counter options, because of the counterparty’s inability to perform.
In conjunction with the use of short sales, purchased options, futures, and swap agreements, the Funds are required to maintain collateral in various forms. The Funds use, where appropriate, depending on the financial instrument utilized and the broker involved, margin deposits at the broker, cash and/or securities segregated at the custodian bank, discount notes, or the repurchase agreements allocated to each Fund.
The Trust has established counterparty credit guidelines and enters into transactions only with financial institutions of investment grade or better. The Trust monitors the counterparty credit risk.
3. Fees and Other Transactions with Affiliates
Under the terms of an investment advisory contract, the Funds pay GI investment advisory fees calculated at the annualized rates below, based on the average daily net assets of the Funds:
| | | Management Fees | |
| Fund | | (as a % of Net Assets) | |
| Long/Short Commodities Strategy Fund | | | 0.90 | % |
| Global Managed Futures Strategy Fund | | | 0.90 | % |
| Multi-Hedge Strategies Fund | | | 1.15 | % |
| Commodities Strategy Fund | | | 0.75 | % |
GI has contractually agreed to waive the management fee it receives from each Subsidiary in an amount equal to the management fee paid to GI by the Subsidiary. This undertaking will continue in effect for so long as the Fund invests in the Subsidiary, and may not be terminated by GI unless GI obtains the prior approval of the Fund’s Board of Trustees for such termination. In any event, this undertaking will continue through April 30, 2013.
Effective May 10, 2012, the investment advisory contract for the Global Managed Futures Strategy Fund provides that the total expenses be limited to 1.25% of average net assets for Institutional Class shares, exclusive of brokerage costs, dividends on securities sold short, expenses of other investment companies in which a Fund invests, interest, taxes, litigation, indemnification and extraordinary expenses (as determined under generally accepted accounting principles). This contract is in effect through August 1, 2013.
As part of its agreement with the Trust, GI will pay all expenses of the Multi-Hedge Strategies Fund, including the cost of transfer agency, custody, fund administration, legal, audit and other services, except interest expense, taxes (expected to be de minimis), brokerage commissions and other expenses connected with execution of portfolio transactions, short dividend expenses, subsidiary expenses and extraordinary expenses.
RFS provides transfer agent and administrative services to the Funds for fees calculated at an annualized rate of 0.25% of the average daily net assets of A-Class, C-Class, H-Class and Institutional Class, and 0.20% of the average daily net assets
| 52 | the GUGGENHEIM FUNDS annual report |
| NOTES TO Consolidated FINANCIAL STATEMENTS (continued) |
of Y-Class. Fees related to the Multi-Hedge Strategies Fund are paid by GI, as previously noted.
RFS also provides accounting services to the Funds for fees calculated at annualized rates below, based on the average daily net assets each Fund. Fees related to the Multi-Hedge Strategies Fund are paid by GI, as previously noted.
| Fund Accounting Fees | | (as a % of Net Assets) | |
| On the first $250 million | | | 0.10 | % |
| On the next $250 million | | | 0.075 | % |
| On the next $250 million | | | 0.05 | % |
| Over $750 million | | | 0.03 | % |
RFS engages external service providers to perform other necessary services for the Trust, such as audit and accounting related services, legal services, custody, printing and mailing, etc., on a pass through basis. Such expenses vary from Fund to Fund and are allocated to the Funds based on relative net assets. Certain expenses allocated to the Multi-Hedge Strategies Fund are paid by GI, as previously noted.
The Trust has adopted a Distribution Plan applicable to A-Class shares and H-Class shares for which GDL and other firms that provide distribution and/or shareholder services (“Service Providers”) may receive compensation. If a Service Provider provides distribution services, the Funds will pay distribution fees to GDL at an annual rate not to exceed 0.25% of average daily net assets, pursuant to Rule 12b-1 of the 1940 Act. GDL, in turn, will pay the Service Provider out of its fees. GDL may, at its discretion, retain a portion of such payments to compensate itself for distribution services.
The Trust has adopted a separate Distribution and Shareholder Services Plan applicable to its C-Class shares that allows the Funds to pay annual distribution and service fees of 1.00% of the Funds’ C-Class shares average daily net assets. The annual 0.25% service fee compensates the shareholder’s financial advisor for providing ongoing services to the shareholder. The annual distribution fee of 0.75% reimburses GDL for paying the shareholder’s financial advisor an ongoing sales commission. GDL advances the first year’s service and distribution fees to the financial advisor. GDL retains the service and distribution fees on accounts with no authorized dealer of record.
For the year ended December 31, 2012, GDL retained sales charges of $258,671 relating to sales of A-Class shares of the Trust.
Certain officers and trustees of the Trust are also officers of GI, RFS and GDL.
At December 31, 2012, Guggenheim Investments and its subsidiaries owned over five percent of the outstanding shares of the Trust, as follows:
| | | Percent of outstanding | |
| Fund | | shares owned | |
| Global Managed Futures Fund | | | 100 | % |
4. Fair Value Measurement
In accordance with U.S. GAAP, fair value is defined as the price that the Fund would receive to sell an investment or pay to transfer a liability in an orderly transaction with an independent buyer in the principal market, or in the absence of a principal market the most advantageous market for the investment or liability. A three-tier hierarchy is utilized to distinguish between (1) inputs that reflect the assumptions market participants would use in pricing an asset or liability developed based on market data obtained from sources independent of the reporting entity (observable inputs) and (2) inputs that reflect the reporting entity’s own assumptions about the assumptions market participants would use in pricing an asset or liability developed based on the best information available in the circumstances (unobservable inputs) and to establish classification of fair value measurements for disclosure purposes. Various inputs are used in determining the value of the Funds’ investments. The inputs are summarized in the three broad levels listed below:
Level 1 — quoted prices in active markets for identical securities.
Level 2 — other significant observable inputs (including quoted prices for similar securities, interest rates, prepayment speeds, credit risk, etc.).
Level 3 — significant unobservable inputs (including the fund’s own assumptions used to determine the fair value of investments).
The inputs or methodologies used for valuing securities are not necessarily an indication of the risk associated with investing in those securities.
| the GUGGENHEIM FUNDS annual report | 53 |
| NOTES TO Consolidated FINANCIAL STATEMENTS (continued) |
The following table summarizes the inputs used to value the Funds’ net assets at December 31, 2012:
| | | Level 1 | | | Level 1 | | | Level 2 | | | Level 3 | | | | |
| | | Investments | | | Other Financial | | | Investments | | | Investments | | | | |
| | | In Securities | | | Instruments* | | | In Securities | | | In Securities | | | Total | |
| Assets | | | | | | | | | | | | | | | | | | | | |
| Long/Short Commodities Strategy Fund | | $ | — | | | $ | 2,001,389 | | | $ | 132,568,270 | | | $ | — | | | $ | 134,569,659 | |
| Global Managed Futures Strategy Fund | | | — | | | | 297,905 | | | | 12,873,691 | | | | — | | | | 13,171,596 | |
| Multi-Hedge Strategies Fund | | | 93,134,095 | | | | 2,728,779 | | | | 20,580,529 | | | | — | | | | 116,443,403 | |
| Commodities Strategy Fund | | | — | | | | 545,370 | | | | 29,671,780 | | | | — | | | | 30,217,150 | |
| Liabilities | | | | | | | | | | | | | | | | | | | | |
| Long/Short Commodities Strategy Fund | | $ | — | | | $ | 2,303,603 | | | $ | — | | | $ | — | | | $ | 2,303,603 | |
| Global Managed Futures Strategy Fund | | | — | | | | 341,775 | | | | 137,696 | | | | — | | | | 479,471 | |
| Multi-Hedge Strategies Fund | | | 64,959,663 | | | | 1,711,162 | | | | — | | | | — | | | | 66,670,825 | |
| Commodities Strategy Fund | | | — | | | | 159,432 | | | | — | | | | — | | | | 159,432 | |
* Other financial instruments include futures contracts which are reported as unrealized gain/loss at period end.
For the year ended December 31, 2012, there were no transfers between levels.
5. Repurchase Agreements
The Funds transfer uninvested cash balances into a single joint account, the daily aggregate balance of which is invested in one or more repurchase agreements collateralized by obligations of the U.S. Treasury and U.S. Government Agencies. The collateral is in the possession of the Funds’ custodian and is evaluated to ensure that its market value exceeds, at a minimum, 102% of the original face amount of the repurchase agreements. Each Fund holds a pro rata share of the collateral based on the dollar amount of the repurchase agreement entered into by each Fund.
At December 31, 2012, the repurchase agreements in the joint account were as follows:
Counterparty and
Terms of Agreement | | Face Value | | | Repurchase Price | | | Collateral | | Par Value | | | Fair Value | |
| HSBC Group | | | | | | | | | | Federal Home Loan Bank | | | | | | | | |
| 0.12% | | | | | | | | | | 0.17% | | | | | | | | |
| Due 01/02/13 | | $ | 665,217,013 | | | $ | 665,221,448 | | | 12/18/13 - 12/24/13 | | $ | 677,040,000 | | | $ | 678,525,865 | |
| Deutsche Bank | | | | | | | | | | U.S. Treasury Note | | | | | | | | |
| 0.11% | | | | | | | | | | 2.13% - 3.38% | | | | | | | | |
| Due 01/02/13 | | | 340,217,013 | | | | 340,219,092 | | | 06/30/13 - 12/31/2015 | | | 338,332,600 | | | | 347,021,360 | |
| Mizuho Financial Group, Inc. | | | | | | | | | | U.S. Treasury Note | | | | | | | | |
| 0.14% | | | | | | | | | | 2.75% | | | | | | | | |
| Due 01/02/13 | | | 289,401,448 | | | | 289,403,699 | | | 10/31/13 | | | 286,361,000 | | | | 295,189,494 | |
| Credit Suisse Group | | | | | | | | | | U.S. Treasury Note | | | | | | | | |
| 0.12% | | | | | | | | | | 2.50% | | | | | | | | |
| Due 01/02/13 | | | 227,876,805 | | | | 227,878,325 | | | 03/31/15 | | | 218,783,700 | | | | 232,434,390 | |
In the event of counterparty default, the Funds have the right to collect the collateral to offset losses incurred. There is potential loss to the Funds in the event the Funds are delayed or prevented from exercising their rights to dispose of the collateral securities, including the risk of a possible decline in the value of the underlying securities during the period while the Funds seek to assert their rights. The Funds’ investment advisor, acting under the supervision of the Board of Trustees, reviews the value of the collateral and the creditworthiness of those banks and dealers with which the Funds enter into repurchase agreements to evaluate potential risks.
6. Derivative Investment Holdings Categorized by Risk Exposure
U.S. GAAP requires disclosures to enable investors to better understand how and why the Funds use derivative instruments, how these derivative instruments are accounted for and their effects on the Funds’ financial position and results of operations.
| 54 | the GUGGENHEIM FUNDS annual report |
| NOTES TO Consolidated FINANCIAL STATEMENTS (continued) |
The following Funds utilized derivatives for the following purposes:
| Fund Name | Index Exposure | Liquidity | Hedging | Income | Speculation |
| Long/Short Commodities Strategy Fund | x | x | | | |
| Global Managed Futures Strategy Fund | x | x | | | |
| Multi-Hedge Strategies Fund | | | x | x | x |
| Commodities Strategy Fund | x | x | | | |
The following table represents the notional amount of futures contracts outstanding, as an approximate percentage of the Funds’ net assets on a daily basis.
| | | Approximate percentage
of Fund’s net assets on on
a daily basis | |
| Fund | | Long | | | Short | |
| Long/Short Commodities Strategy Fund | | | 85 | % | | | 15 | % |
| Global Managed Futures Strategy Fund | | | 485 | % | | | 60 | % |
| Multi-Hedge Strategies Fund | | | 55 | % | | | 60 | % |
| Commodities Strategy Fund | | | 100 | % | | | — | |
The following is a summary of the location of derivative investments on the Funds’ Statements of Assets and Liabilities as of December 31, 2012
| Derivative Investment Type | Asset Derivatives | Liability Derivatives |
| Equity/interest rate/currency/commodity contracts | Variation margin | Variation margin |
| Equity contracts | Investments, at value | |
The following table sets forth the fair value of the Funds’ derivative investments categorized by primary risk exposure at December 31, 2012:
Asset Derivative Investments Value
| | | Futures | | | Futures | | | Futures | | | Futures | | | Options | | | Total Value at | |
| | | Equity | | | Currency | | | Interest Rate | | | Commodity | | | Purchased Equity | | | December 31, | |
| Fund | | Contracts* | | | Contracts* | | | Contracts* | | | Contracts* | | | Contracts | | | 2012 | |
| Long/Short Commodities Strategy Fund | | $ | — | | | $ | — | | | $ | — | | | $ | 2,001,389 | | | $ | — | | | $ | 2,001,389 | |
| Global Managed Futures Strategy Fund | | | 97,462 | | | | 127,608 | | | | 242,631 | | | | 163,363 | | | | — | | | | 631,064 | |
| Multi-Hedge Strategies Fund | | | 1,452,940 | | | | — | | | | — | | | | 1,275,839 | | | | 2,800 | | | | 2,731,579 | |
| Commodities Strategy Fund | | | — | | | | — | | | | — | | | | 545,370 | | | | — | | | | 545,370 | |
| | | | | | | | | | | | | | | | | | | | | | | | | |
| Liability Derivative Investments Value |
| | | Futures | | | Futures | | | Futures | | | Futures | | | Options | | | Total Value at | |
| | | Equity | | | Currency | | | Interest Rate | | | Commodity | | | Purchased Equity | | | December 31, | |
| Fund | | Contracts* | | | Contracts* | | | Contracts* | | | Contracts* | | | Contracts | | | 2012 | |
| Long/Short Commodities Strategy Fund | | $ | — | | | $ | — | | | $ | — | | | $ | 2,303,603 | | | $ | — | | | $ | 2,303,603 | |
| Global Managed Futures Strategy Fund | | | 3,147 | | | | 64,047 | | | | 178,506 | | | | 233,771 | | | | — | | | | 479,471 | |
| Multi-Hedge Strategies Fund | | | 608,678 | | | | — | | | | — | | | | 1,102,484 | | | | — | | | | 1,711,162 | |
| Commodities Strategy Fund | | | — | | | | — | | | | — | | | | 159,432 | | | | — | | | | 159,432 | |
* Includes cumulative appreciation (depreciation) of futures contracts as reported on the Schedules of Investments. Only current day’s variation margin is reported within the Statements of Assets and Liabilities.
The following is a summary of the location of derivative investments on the Funds’ Statements of Operations for the year ended December 31, 2012:
| Derivative Investment Type | Location of Gain (Loss) on Derivatives |
| Equity/interest rate/currency/commodity contracts | Net realized gain (loss) on swap agreements |
| | Net realized gain (loss) on futures contracts |
| | Net change in unrealized appreciation (depreciation) on swap agreements |
| | Net change in unrealized appreciation (depreciation) on futures contracts |
| Equity contracts | Net realized gain (loss) on options purchased |
| | Net change in unrealized appreciation (depreciation) on options purchased |
| the GUGGENHEIM FUNDS annual report | 55 |
| NOTES TO Consolidated FINANCIAL STATEMENTS (continued) |
The following is a summary of the Funds’ realized gain (loss) and change in unrealized appreciation (depreciation) on derivative investments recognized on the Statements of Operations categorized by primary risk exposure for the year ended December 31, 2012:
Realized Gain (Loss) on Derivative Investments Recognized in the Statements of Operations
| | | Futures | | | Futures | | | Futures | | | Futures | | | Swaps | | | Options | | | | |
| | | Equity | | | Currency | | | Interest Rate | | | Commodity | | | Credit Default | | | Purchased Equity | | | | |
| Fund | | Contracts | | | Contracts | | | Contracts | | | Contracts | | | Contracts | | | Contracts | | | Total | |
| Long/Short Commodities Strategy Fund | | $ | — | | | $ | — | | | $ | — | | | $ | (103,158,941 | ) | | $ | — | | | $ | — | | | $ | (103,158,941 | ) |
| Global Managed Futures Strategy Fund | | | 210,473 | | | | (32,262 | ) | | | 191,554 | | | | (892,267 | ) | | | — | | | | — | | | | (522,502 | ) |
| Multi-Hedge Strategies Fund | | | 2,073,085 | | | | — | | | | — | | | | (2,788,296 | ) | | | 1,252,691 | | | | (40,206 | ) | | | 497,274 | |
| Commodities Strategy Fund | | | 1,341,739 | | | | — | | | | — | | | | (3,208,184 | ) | | | — | | | | — | | | | (1,866,445 | ) |
| | | | | | | | | | | | | | | | | | | | | | | | | | | | | |
| Change in Unrealized Appreciation (Depreciation) on Derivative Investments Recognized in the Statements of Operations |
| | | Futures | | | Futures | | | Futures | | | Futures | | | Swaps | | | Options | | | | | |
| | | Equity | | | Currency | | | Interest Rate | | | Commodity | | | Credit Default | | | Purchased Equity | | | | | |
| Fund | | Contracts | | | Contracts | | | Contracts | | | Contracts | | | Contracts | | | Contracts | | | Total | |
| Long/Short Commodities Strategy Fund | | $ | — | | | $ | — | | | $ | — | | | $ | 5,265,242 | | | $ | — | | | $ | — | | | $ | 5,265,242 | |
| Global Managed Futures Strategy Fund | | | 94,315 | | | | 63,561 | | | | 64,125 | | | | (70,408 | ) | | | — | | | | — | | | | 151,593 | |
| Multi-Hedge Strategies Fund | | | 2,650,240 | | | | — | | | | — | | | | 250,514 | | | | (35,229 | ) | | | (1,926 | ) | | | 2,863,599 | |
| Commodities Strategy Fund | | | — | | | | — | | | | — | | | | 605,161 | | | | — | | | | — | | | | 605,161 | |
7. Federal Income Tax Information
The Funds intend to comply with the provisions of Subchapter M of the Internal Revenue Code applicable to regulated investment companies and distribute substantially all taxable net investment income and capital gains sufficient to relieve the Funds from all, or substantially all, federal income, excise and state income taxes. Therefore, no provision for federal or state income tax is required.
Tax positions taken or expected to be taken in the course of preparing the Funds’ tax returns are evaluated to determine whether the tax positions are “more-likely-than-not” of being sustained by the applicable tax authority. Tax positions not deemed to meet the more-likely-than-not threshold would be recorded as a tax benefit or expense in the current year. Management has analyzed the Funds’ tax positions taken, or to be taken, on Federal income tax returns for all open tax years (fiscal years 2009-2012), and has concluded that no provision for income tax is required in the Funds’ financial statements.
The Long/Short Commodities Strategy Fund, the Multi-Hedge Strategies Fund and the Commodities Strategy Fund intend to invest up to 25% of their assets in the Subsidiary which is expected to provide the Funds with exposure to the commodities markets within the limitations of the federal tax requirements under Subchapter M of the Internal Revenue Code. The Long/Short Commodities Strategy Fund, the Multi-Hedge Strategies Fund and the Commodities Strategy Fund have received a private letter ruling from the IRS that concludes that the income the Funds receive from the Subsidiary will constitute qualifying income for purposes of Subchapter M of the Internal Revenue Code. The Subsidiary will be classified as a corporation for U.S. federal income tax purposes. A foreign corporation, such as the Subsidiary, will generally not be subject to U.S. federal income taxation unless it is deemed to be engaged in a U.S. trade or business.
In July 2011, the IRS notified the RIC industry that it would not issue further private letter rulings until the (IRS) staff could look at the overall set of issues and consider guidance of broader applicability. The Advisor intends to conduct the Global Managed Futures Strategy Fund’s investments in a manner consistent with the terms and conditions of the private letter ruling and pursuant to an opinion of counsel which concludes that such income should be qualifying income for purposes of the RIC qualification tests.
The RIC Modernization Act of 2010 was signed into law on December 22, 2010 and simplified some of the tax provisions applicable to regulated investment companies and the tax reporting to their shareholders, improved the tax efficiency of certain fund structures. The changes were generally effective for taxable years beginning after the date of enactment.
One of the more prominent changes addresses capital loss carry forwards. Funds are permitted to carry forward capital losses incurred in taxable years beginning after December 22, 2010 for an unlimited period. However, any losses incurred during those future taxable years will be required to be utilized prior to the losses incurred in pre-enactment taxable years. Under pre-enactment law, capital losses could be carried forward for eight years, and carried forward as short-term capital, irrespective of the character of the original loss. As a result of this ordering rule, pre-enactment capital loss carry forwards may potentially expire unused. Additionally, post-enactment capital losses that are carried forward will retain their character as either short-term or long-term capital losses rather than being considered all short-term as under previous law.
| 56 | the GUGGENHEIM FUNDS annual report |
| NOTES TO Consolidated FINANCIAL STATEMENTS (continued) |
Tax basis capital losses in excess of capital gains are carried forward to offset future net capital gains. For the year ended December 31, 2012, the following capital loss carryforward amounts expired, were used, or were permanently lost due to loss limitation rules in Section 382 of the Internal Revenue Code:
| Fund | | Amount | |
| Long/Short Commodities Strategy Fund | | $ | 2,864 | |
| Multi-Hedge Strategies Fund | | | 12,157,768 | |
The tax character of distributions paid during the year ended December 31, 2012 was as follows:
| | | Ordinary | | | Long-Term | | | Total | |
| Fund | | Income | | | Capital Gain | | | Distributions | |
| Long/Short Commodities Strategy Fund | | $ | — | | | $ | — | | | $ | — | |
| Multi-Hedge Strategies Fund | | | — | | | | — | | | | — | |
| Commodities Strategy Fund | | | 797,248 | | | | — | | | | 797,248 | |
| Global Managed Futures Strategy | | | — | | | | 1,704 | | | | 1,704 | |
The tax character of distributions paid during the year ended December 31, 2011 was as follows:
| | | Ordinary | | | Long-Term | | | Total | |
| Fund | | Income | | | Capital Gain | | | Distributions | |
| Long/Short Commodities Strategy Fund | | $ | 20,068,128 | | | $ | — | | | $ | 20,068,128 | |
| Multi-Hedge Strategies Fund | | | 740,871 | | | | — | | | | 740,871 | |
| Commodities Strategy Fund | | | 857,150 | | | | — | | | | 857,150 | |
Note: For federal income tax purposes, short term capital gain distributions are treated as ordinary income distributions.
The tax character of distributable earnings/(accumulated losses) at December 31, 2012 was as follows:
| | | Undistributed | | | Undistributed | | | Net Unrealized | | | | |
| | | Ordinary | | | Long-Term | | | Appreciation/ | | | Capital Loss | |
| Fund | | Income | | | Capital Gain | | | Depreciation | | | Carryforward1 | |
| Long/Short Commodities Strategy Fund | | $ | — | | | $ | — | | | $ | (48,152,582 | ) | | $ | (506,713 | ) |
| Multi-Hedge Strategies Fund | | | — | | | | — | | | | 2,688,733 | | | | (50,992,112 | ) |
| Commodities Strategy Fund | | | — | | | | — | | | | (2,384,279 | ) | | | (19,851,142 | ) |
| Global Managed Futures Strategy | | | 229,110 | | | | 243,718 | | | | (40,674 | ) | | | — | |
Capital Loss Carryforward amounts may be limited due to Federal income tax regulations.
1 A summary of the expiration of the aforementioned Capital Loss Carryforward is as follows:
| | | | | | | | | | | | | | | | | | | | | Total | |
| | | Expires in | | | Expires in | | | Expires in | | | Expires in | | | Unlimited | | | Capital Loss | |
| Fund | | 2015 | | | 2016 | | | 2017 | | | 2018 | | | Short Term | | | Long Term | | | Carryforward | |
| Long/Short Commodities Strategy Fund | | $ | — | | | $ | — | | | $ | — | | | $ | (506,713 | ) | | $ | — | | | $ | — | | | $ | (506,713 | ) |
| Multi-Hedge Strategies Fund | | | (1,854,174 | ) | | | (39,423,813 | ) | | | (8,615,889 | ) | | | (178,812 | ) | | | (161,411 | ) | | | (758,013 | ) | | | (50,992,112 | ) |
| Commodities Strategy Fund | | | — | | | | — | | | | (19,850,783 | ) | | | — | | | | — | | | | (359 | ) | | | (19,851,142 | ) |
Net investment income and net realized gains (losses) may differ for financial statement and tax purposes because of temporary or permanent book/tax differences. These differences are primarily due to mark-market of futures contracts and foreign currency gains and losses. Additional differences may result from the tax treatment of net investment losses and expired capital loss carryforwards. To the extent these differences are permanent, reclassifications are made to the appropriate equity accounts in the period that the differences arise. These reclassifications have no effect on net assets or NAV per share.
On the Statements of Assets and Liabilities the following adjustments were made for permanent book/tax differences:
| | | | | | Undistributed | | | Accumulated | |
| | | Paid In | | | Net Investment | | | Net Realized | |
| Fund | | Capital | | | Income | | | Gain (Loss) | |
| Long/Short Commodities Strategy Fund | | $ | (109,259,913 | ) | | $ | 6,100,972 | | | $ | 103,158,941 | |
| Multi-Hedge Strategies Fund | | | (3,852,157 | ) | | | 2,406,643 | | | | 1,445,514 | |
| Commodities Strategy Fund | | | (2,328,889 | ) | | | 462,444 | | | | 1,866,445 | |
| Global Managed Futures Strategy | | | (903,626 | ) | | | 105,371 | | | | 798,255 | |
| the GUGGENHEIM FUNDS annual report | 57 |
| NOTES TO Consolidated FINANCIAL STATEMENTS (continued) |
At December 31, 2012, the cost of securities for Federal income tax purposes, the aggregate gross unrealized gain for all securities for which there was an excess of value over tax cost and the aggregate gross unrealized loss for all securities for which there was an excess of tax cost over value, were as follows:
| | | | | | Tax | | | Tax | | | Net | |
| | | Tax | | | Unrealized | | | Unrealized | | | Unrealized | |
| Fund | | Cost | | | Gain | | | Loss | | | Gain (Loss) | |
| Long/Short Commodities Strategy Fund | | $ | 180,418,637 | | | $ | 11,960 | | | $ | (47,862,327 | ) | | $ | (47,850,367 | ) |
| Multi-Hedge Strategies Fund | | | 107,984,045 | | | | 6,574,288 | | | | (843,709 | ) | | | 5,730,579 | |
| Commodities Strategy Fund | | | 32,441,998 | | | | — | | | | (2,770,218 | ) | | | (2,770,218 | ) |
| Global Managed Futures Strategy | | | 12,540,532 | | | | — | | | | — | | | | — | |
8. Securities Transactions
For the year ended December 31, 2012, the cost of purchases and proceeds from sales of investment securities, excluding government securities and short-term investments, were as follows:
| Fund | | Purchases | | | Sales | |
| Long/Short Commodities Strategy Fund | | $ | — | | | $ | — | |
| Global Managed Futures Strategy Fund | | | — | | | | — | |
| Multi-Hedge Strategies Fund | | | 129,083,827 | | | | 119,867,774 | |
| Commodities Strategy Fund | | | — | | | | — | |
9. Line of Credit
The Trust, along with other affiliated trusts, secured an uncommitted, $75,000,000 line of credit from U.S. Bank, N.A., which expires June 15, 2013. This line of credit is reserved for emergency or temporary purposes. Borrowings, if any, under this arrangement bear interest equal to the Prime Rate, minus 2%, which shall be paid monthly, averaging 1.25% for the year ended December 31, 2012. The Funds did not have any borrowings under this agreement at December 31, 2012.
The average daily balances borrowed for the year ended December 31, 2012 was as follows:
| Fund | | Average Daily Balance | |
| Long/Short Commodities Strategy Fund | | $ | 52,374 | |
10. Portfolio Securities Loaned
The Funds may lend their securities to approved brokers to earn additional income. Security lending income shown on the statement of operations is shown net of rebates paid to the borrowers and earnings on cash collateral investments shared with the lending agent. Within this arrangement, the Funds act as the lender, Credit Suisse acts as the lending agent, and other approved registered broker dealers act as the borrowers. The Funds receive cash collateral, valued at 102% of the value of the securities on loan. Under the terms of the Funds’ securities lending agreement with Credit Suisse, cash collateral is invested in one or more joint repurchase agreements collateralized by obligations of the U.S. Treasury or Government Agencies and cash. The Funds bear the risk of loss on cash collateral investments. Collateral is maintained over the life of the loan in an amount not less than the value of loaned securities, as determined at the close of fund business each day; any additional collateral required due to changes in security values is delivered to the Funds the next business day. Although the collateral mitigates the risk, the Funds could experience a delay in recovering its securities and a possible loss of income or value if the borrower fails to return the securities. The Funds have the right under the securities lending agreement to recover the securities from the borrower on demand.
At December 31, 2012, the Funds participated in securities lending as follows:
| | | | | | Cash | |
| | | Value of | | | Collateral | |
| Fund | | Securities Loaned | | | Received | |
| Multi-Hedge Strategies Fund | | $ | 718,322 | | | $ | 772,716 | |
| 58 | the GUGGENHEIM FUNDS annual report |
| NOTES TO Consolidated FINANCIAL STATEMENTS (continued) |
The following represents a breakdown of the collateral for the joint repurchase agreements at December 31, 2012:
| Counterparty and Terms of Agreement | | Face Value | | | Repurchase Price | | | Collateral | | Par Value | | | Fair Value | |
| Merrill Lynch, Pierce, Fenner & Smith, Inc. | | | | | | | | | | Fannie Mae | | | | | | | | |
| 0.16% | | | | | | | | | | 1.00% | | | | | | | | |
| Due 01/02/13 | | $ | 56,000,000 | | | $ | 56,000,498 | | | 09/20/17 | | $ | 17,736,000 | | | $ | 17,748,238 | |
| | | | | | | | | | | U.S. Treasury Note | | | | | | | | |
| | | | | | | | | | | 0.25% | | | | | | | | |
| | | | | | | | | | | 08/15/15 | | | 39,359,000 | | | | 39,285,202 | |
| RBS Securities, Inc. | | | | | | | | | | Freddie Mac | | | | | | | | |
| 0.20% | | | | | | | | | | 1.00% | | | | | | | | |
| Due 01/02/13 | | | 35,542,000 | | | | 35,542,395 | | | 03/08/17 | | | 10,481,300 | | | | 10,618,396 | |
| | | | | | | | | | | Fannie Mae | | | | | | | | |
| | | | | | | | | | | 6.25% | | | | | | | | |
| | | | | | | | | | | 05/15/29 | | | 13,845,000 | | | | 20,014,471 | |
| | | | | | | | | | | Federal Home Loan Bank | | | | | | | | |
| | | | | | | | | | | 0.375% | | | | | | | | |
| | | | | | | | | | | 10/18/13 | | | 7,935,000 | | | | 7,947,298 | |
| | | | | | | | | | | U.S. Treasury Note | | | | | | | | |
| | | | | | | | | | | 1.75% | | | | | | | | |
| | | | | | | | | | | 05/15/22 | | | 39,050,000 | | | | 39,504,544 | |
| | | | | | | | | | | Cash | | | 38,815,000 | | | | 38,815,000 | |
11. Fund Merger
On July 13, 2012, the Multi-Hedge Strategies Fund acquired all of the net assets of Alternative Strategies Allocation Fund, a separate series of the Trust, in exchange for shares of the Multi-Hedge Strategies Fund, pursuant to an agreement and plan of reorganization approved by the Board of Trustees and approved by the shareholders of the Alternative Strategies Allocation Fund. The primary reason for the transaction was to combine a smaller fund into a larger fund with a similar investment objective. The acquisition was accomplished through a tax-free exchange of the outstanding shares of the Alternative Strategies Allocation Fund (70,937 A-Class; 131,738 C-Class, and 119,432 H-Class) valued at $6,069,244 ($1,354,905 A-Class; $2,433,192 C-Class, and $2,281,147 H-Class) for the respective shares of the Multi-Hedge Strategies Fund (60,298 A-Class; 114,074 C-Class, and 101,429 H-Class). For financial reporting purposes, the net assets received and shares issued by Multi-Hedge Strategies Fund were recorded at fair value; however, the Alternative Strategies Allocation Fund’s cost of the investments were carried forward to align with the ongoing reporting of the Multi-Hedge Strategies Fund’s realized and unrealized gains and losses with the amounts distributable to shareholders for tax purposes.
Alternative Strategies Allocation Fund’s net assets on July 13, 2012 were $6,069,244, including $146,091 of unrealized appreciation. Alternative Strategies Allocation Fund’s net assets were primarily comprised of investments with a fair value of $6,738,242. The aggregate net assets of Multi-Hedge Strategies Fund immediately before and after the acquisition were $137,383,754 and $143,452,998, respectively.
The financial statements reflect the operations of the Multi-Hedge Strategies Fund for the period prior to the acquisition and the combined fund for the period subsequent to the fund merger. Because the combined investment portfolios have been managed as a single integrated portfolio since the acquisition was completed, it is not practicable to separate the amounts of revenue and earnings of the Alternative Strategies Allocation Fund that have been included in the combined fund’s Statement of Operations since the acquisition was completed. Assuming the acquisition had been completed on January 1, 2012, Multi-Hedge Strategies Fund pro-forma net investment loss, net realized and unrealized gain on investments and net increase in net assets from operations for the period January 1, 2012 to December 31, 2012 would have been $(2,193,739), $4,529,631 and $2,335,892, respectively. Guggenheim Investments and its affiliates bore all of the expenses related to the reorganization.
12. Legal Proceedings
Tribune Company
Rydex Series Funds has been named as a defendant and a putative member of the proposed defendant class of shareholders in the case entitled Official Committee of Unsecured Creditors of Tribune Co. v. FitzSimons, No. 12-2652 (S.D.N.Y.) (formerly Adv. Pro. No. 10-54010 (Bankr. D. Del.)) (the “FitzSimons” Action), as a result of ownership of shares in the Tribune Company (“Tribune”) in 2007 by certain series of the Rydex Series Funds when Tribune effected a leveraged buyout transaction (“LBO”) by which Tribune converted to a privately-held company. In its complaint, the Unsecured Creditors Committee (the “UCC”) has alleged that, in connection with the LBO, insiders and shareholders were overpaid for their Tribune stock using financing that the insiders knew would, and ultimately did, leave the Tribune insolvent. The UCC has
| the GUGGENHEIM FUNDS annual report | 59 |
| NOTES TO Consolidated FINANCIAL STATEMENTS (continued) |
asserted claims against certain insiders, shareholders, professional advisers, and others involved in the LBO, and is attempting to obtain from these individuals and entities the proceeds paid out in connection with the LBO.
Rydex Series Funds also has been named as a defendant in one or more of a group of lawsuits filed by a group of Tribune creditors that allege state law constructive fraudulent conveyance claims against former Tribune shareholders (the “SLCFC actions”).
The FitzSimons action and the SLCFC actions have been consolidated with the majority of the other Tribune LBO-related lawsuits in a multidistrict litigation proceeding captioned In re Tribune Company Fraudulent Conveyance Litig., No. 11-md-2696 (S.D.N.Y.) (the “MDL Proceeding”). On November 6, 2012, the defendants moved to dismiss the SLCFC actions. On December 21, 2012, the plaintiffs filed a memorandum in opposition to the motion to dismiss. On February 4, 2013, the defendants filed a reply in support of the motion to dismiss. The Court has not yet issued a decision on the motion.
None of these lawsuits allege any wrongdoing on the part of Rydex Series Funds. The following series of Rydex Series Funds held shares of Tribune and tendered these shares as part of Tribune’s LBO: Nova Fund, S&P 500 Pure Value Fund, Multi-Cap Core Equity Fund, S&P 500 Fund, Multi-Hedge Strategies Fund and Hedged Equity Fund (the “Funds”). The value of the proceeds received by the foregoing Funds was $28,220, $109,242, $9,860, $3,400, $1,181,160, and $10,880, respectively. At this stage of the proceedings, Rydex Series Funds is not able to make a reliable predication as to the outcome of these lawsuits or the effect, if any, on a Fund’s net asset value.
Lyondell Chemical Company
In December 2011, Rydex Series Funds was named as a defendant in Weisfelner, as Trustee of the LB Creditor Trust, v. Fund 1 (In re Lyondell Chemical Co.), Adv. Pro. No. 10-4609 (Bankr. S.D.N.Y.).
Similar to the claims made in the Tribune matter, the Weisfelner complaint seeks to have set aside and recovered as fraudulent transfers from former Lyondell Chemical Company (“Lyondell”) shareholders the consideration paid to them pursuant to the cash out merger of Lyondell shareholders in connection with the combination of Lyondell and Basell AF in 2007. Lyondell filed for bankruptcy in 2008.
A motion to dismiss is currently pending before the Bankruptcy Court.
This lawsuit does not allege any wrongdoing on the part of Rydex Series Funds. The following series of Rydex Series Funds received cash proceeds from the cash out merger in the following amounts: Basic Materials Fund - $1,725,168; U.S. Long Short Momentum Fund - $2,193,600; Global 130/30 Strategy Fund - $37,920; Hedged Equity Fund - $1,440; and Multi-Hedge Strategies Fund - $1,116,480. At this stage of the proceedings, Rydex Series Funds is not able to make a reliable predication as to the outcome of these lawsuits or the effect, if any, on a Fund’s net asset value.
13. Subsequent Events
Long/Short Commodities Fund Name and Strategy Change
At a meeting held on November 19, 2012, the Board of Trustees (the “Board”) of Rydex Series Funds (the “Trust”) approved a new name, revised investment objective and revised principal investment strategies for the Long/Short Commodities Strategy Fund. The revisions to the Fund’s principal investment strategies are primarily intended to diversify the Fund’s investment exposure by broadening the variety of investment strategies it may pursue in seeking to achieve its investment objective. Therefore, effective January 29, 2013, the changes noted above will apply to the Fund.
The changes to the Fund’s name, investment objective, principal investment strategies, and principal risks will not result in an increase in the Fund’s fees. The changes may decrease the Fund’s expenses due to a reduction of the current index licensing fee paid by the Fund. Please read the Fund’s prospectus for more information on these changes.
Distribution Name Change
Effective January 1, 2013, Rydex Distributors LLC, changed its name to Guggenheim Distributors, LLC. The name change marks another step in the business integration process following the acquisition of Rydex by Guggenheim announced last year. The name change should not result in any material change to the day-to-day management or operations of the funds.
| 60 | the GUGGENHEIM FUNDS annual report |
| NOTES TO Consolidated FINANCIAL STATEMENTS (concluded) |
Global Managed Futures Liquidation
On February 14, 2013, at the recommendation of Security Investors, LLC, the investment adviser to the series of Rydex Series Funds (the “Trust”), the Trust’s Board of Trustees approved the closing and subsequent liquidation of the Global Managed Futures Strategy Fund pursuant to the terms of a Plan of Liquidation. Accordingly, the Global Managed Futures Strategy Fund is expected to cease operations, liquidate its assets, and distribute the liquidation proceeds to shareholders of record on or about February 28, 2013.
| the GUGGENHEIM FUNDS annual report | 61 |
| REPORT OF INDEPENDENT REGISTERED PUBLIC ACCOUNTING FIRM |
To the Board of Trustees and Shareholders
of Rydex Series Funds:
We have audited the accompanying consolidated statements of assets and liabilities of the Long/Short Commodities Strategy Fund, Global Managed Futures Strategy Fund, Multi-Hedge Strategies Fund and Commodities Strategy Fund (four of the series constituting the Rydex Series Funds) (the “Funds”), including the consolidated schedules of investments, as of December 31, 2012, and the related consolidated statements of operations for the year or period then ended, the consolidated statements of changes in net assets for each of the years or periods indicated therein, and the financial highlights for each of the years or periods indicated therein (consolidated for the years or periods ended December 31, 2012, 2011, 2010, and 2009). These consolidated financial statements and financial highlights are the responsibility of the Funds’ management. Our responsibility is to express an opinion on these consolidated financial statements and financial highlights based on our audits.
We conducted our audits in accordance with the standards of the Public Company Accounting Oversight Board (United States). Those standards require that we plan and perform the audit to obtain reasonable assurance about whether the financial statements and financial highlights are free of material misstatement. We were not engaged to perform an audit of the Funds’ internal control over financial reporting. Our audits included consideration of internal control over financial reporting as a basis for designing audit procedures that are appropriate in the circumstances, but not for the purpose of expressing an opinion on the effectiveness of the Funds’ internal control over financial reporting. Accordingly, we express no such opinion. An audit also includes examining, on a test basis, evidence supporting the amounts and disclosures in the financial statements and financial highlights, assessing the accounting principles used and significant estimates made by management, and evaluating the overall financial statement presentation. Our procedures included confirmation of securities owned as of December 31, 2012, by correspondence with the custodian and brokers or by other appropriate auditing procedures where replies from brokers were not received. We believe that our audits provide a reasonable basis for our opinion.
In our opinion, the consolidated financial statements and financial highlights referred to above present fairly, in all material respects, the consolidated financial position of the above listed Funds at December 31, 2012, the consolidated results of their operations for the year or period then ended, the consolidated changes in their net assets for each of the years or periods indicated therein, and their financial highlights for each of the years or periods indicated therein (consolidated for years or periods ended December 31, 2012, 2011, 2010, and 2009), in conformity with U.S. generally accepted accounting principles.

McLean, Virginia
February 27, 2013
| 62 | the GUGGENHEIM FUNDS annual report |
| OTHER INFORMATION (Unaudited) |
Tax Information
This information is being provided as required by the Internal Revenue Code. Amounts shown may differ from those elsewhere in the report because of differences in tax and financial reporting practice.
With respect to the taxable year ended December 31, 2012, the Funds hereby designate as capital gain dividends the amounts listed below, or, if subsequently determined to be different, the net capital gain of such year:
| | | Global Managed | |
| | | Futures Strategy | |
| | | Fund | |
| From long-term capital gains, subject to the 15% rate gains category: | | $ | 1,704 | |
Proxy Voting Information
A description of the policies and procedures that the Trust uses to determine how to vote proxies relating to securities held in the Funds’ portfolios is available, without charge and upon request, by calling 1.800.820.0888. This information is also available from the EDGAR database on the SEC’s website at http://www.sec.gov.
Information regarding how the Funds voted proxies relating to portfolio securities during the most recent 12-month period ended June 30 is available without charge, upon request, by calling 1.800.820.0888. This information is also available from the EDGAR database on the SEC’s website at http://www.sec.gov.
Quarterly Portfolio Schedules Information
The Trust files its complete schedule of portfolio holdings with the SEC for the first and third quarters of each fiscal year on Form N-Q; which are available on the SEC’s website at http://www.sec.gov. The Funds’ Forms N-Q may be reviewed and copied at the SEC’s Public Reference Room in Washington, DC, and that information on the operation of the Public Reference Room may be obtained by calling 1-800-SEC-0330. Copies of the portfolio holdings are also available to shareholders, without charge and upon request, by calling 1.800.820.0888.
Office Locations
The offices of Guggenheim Investments can be found in the following locations:
40 East 52nd Street
16th Floor
New York, NY 10022
(Headquarters)
Four Irvington Centre
805 King Farm Boulevard
Suite 600
Rockville, MD 20850
9401 Indian Creek Parkway
40 Corporate Woods
Suite 850
Overland Park, KS 66210
| the GUGGENHEIM FUNDS annual report | 63 |
| INFORMATION on board of trustees and officers (Unaudited) |
A Board of Trustees oversees the Trust, as well as other trusts of GI, in which its members have no stated term of service, and continue to serve after election until resignation. The Statement of Additional Information includes further information about Fund Trustees and Officers, and can be obtained without charge by calling 800.820.0888.
All Trustees and Officers may be reached c/o Guggenheim Investments, 805 King Farm Boulevard, Suite 600, Rockville, MD 20850.
| TRUSTEE AND OFFICER | | | | |
| Name and | | Length of Service as Trustee | | Number of Funds |
| Year of Birth | | (Year Began) | | Overseen |
| Donald C. Cacciapaglia* | | Rydex Series Funds – 2012 | | 146 |
| (1951) | | Rydex Variable Trust – 2012 | | |
| | | Rydex Dynamic Funds – 2012 | | |
| | | Rydex ETF Trust – 2012 | | |
Principal Occupations During Past Five Years: Current: Security Investors, LLC: President and CEO from April 2012 to present; Guggenheim Investments: President and Chief Administrative Officer from February 2010 to present; Previous: Channel Capital Group, Inc.: Chairman and CEO from April 2002 to February 2010
Positions held within the Trust: Trustee from 2012 to present; President from 2012 to present
| INDEPENDENT TRUSTEES | | | | |
| Name and | | Length of Service as Trustee | | Number of Funds |
| Year of Birth | | (Year Began) | | Overseen |
| Corey A. Colehour | | Rydex Series Funds – 1993 | | 146 |
| (1945) | | Rydex Variable Trust – 1998 | | |
| | | Rydex Dynamic Funds – 1999 | | |
| | | Rydex ETF Trust – 2003 | | |
Principal Occupations During Past Five Years: Current: Retired; Previous: President and Senior Vice President of Schield Management Company (registered investment adviser) from 2003 to 2006
Positions held within the Trust: Trustee from 1993 to present; Member of the Audit and Governance and Nominating Committees from 1995 to present
| J. Kenneth Dalton | Rydex Series Funds – 1995 | 146 |
| (1941) | Rydex Variable Trust – 1998 | |
| | Rydex Dynamic Funds – 1999 | |
| | Rydex ETF Trust – 2003 | |
Principal Occupations During Past Five Years: Current: Retired
Positions held within the Trust: Trustee from 1995 to present; Member and Chairman of the Audit Committee from 1997 to present; Member of the Governance and Nominating Committees from 1995 to present; and Member of the Risk Oversight Committee from 2010 to present
| John O. Demaret | Rydex Series Funds – 1997 | 146 |
| (1940) | Rydex Variable Trust – 1998 | |
| | Rydex Dynamic Funds – 1999 | |
| | Rydex ETF Trust – 2003 | |
Principal Occupations During Past Five Years: Current: Retired
Positions held within the Trust: Trustee from 1997 to present; Chairman of the Board from 2006 to present; Member of the Audit Committee from 1997 to present; and Member of the Risk Oversight Committee from 2010 to present
| Werner E. Keller | Rydex Series Funds – 2005 | 146 |
| (1940) | Rydex Variable Trust – 2005 | |
| | Rydex Dynamic Funds – 2005 | |
| | Rydex ETF Trust – 2005 | |
| 64 | the GUGGENHEIM FUNDS annual report |
| INFORMATION on board of trustees and officers (Unaudited) (continued) |
| INDEPENDENT TRUSTEES – concluded | | | | |
| Name and | | Length of Service as Trustee | | Number of Funds |
| Year of Birth | | (Year Began) | | Overseen |
| | | | | |
Principal Occupations During Past Five Years: Current: Founder and President of Keller Partners, LLC (investment research firm) from 2005 to present; Previous: Retired from 2001 to 2005
Positions held within the Trust: Vice Chairman of the Board of Trustees from 2010 to present; Trustee and Member of the Audit and Governance and Nominating Committees from 2005 to present; and Chairman and Member of the Risk Oversight Committee from 2010 to present
| Thomas F. Lydon, Jr. | Rydex Series Funds – 2005 | 146 |
| (1960) | Rydex Variable Trust – 2005 | |
| | Rydex Dynamic Funds – 2005 | |
| | Rydex ETF Trust – 2005 | |
Principal Occupations During Past Five Years: Current: President of Global Trends Investments (registered investment adviser) from 1996 to present
Positions held within the Trust: Trustee and Member of the Audit and Governance and Nominating Committees from 2005 to present
| Patrick T. McCarville | Rydex Series Funds – 1997 | 146 |
| (1942) | Rydex Variable Trust – 1998 | |
| | Rydex Dynamic Funds – 1999 | |
| | Rydex ETF Trust – 2003 | |
Principal Occupations During Past Five Years: Current: Retired; Previous: Chief Executive Officer of Par Industries, Inc., d/b/a Par Leasing from 1977 to 2010
Positions held within the Trust: Trustee from 1997 to present; Member of the Audit Committee from 1997 to present; and Chairman of the Governance and Nominating Committees from 1997 to present
| Roger Somers | Rydex Series Funds – 1993 | 146 |
| (1944) | Rydex Variable Trust – 1998 | |
| | Rydex Dynamic Funds – 1999 | |
| | Rydex ETF Trust – 2003 | |
Principal Occupations During Past Five Years: Current: Founder and Chief Executive Officer of Arrow Limousine from 1965 to present
Positions held within the Trust: Trustee from 1993 to present; Member of the Audit and Governance and Nominating Committees from 1995 to present
EXECUTIVE OFFICERS
| Name, Position and | | Principal Occupations |
| Year of Birth | | During Past Five Years |
| | | |
Michael P. Byrum*
Vice President (1970) | | Current: President, Security Benefit Asset Management Holdings, LLC; Senior Vice President, Security Investors, LLC; President & Chief Investment Officer, Rydex Holdings, LLC; Director & Chairman of the Board, Advisor Research Center, Inc.; and Manager, Rydex Specialized Products, LLC |
| | | |
| | | Previous: Guggenheim Distributors, LLC (f/k/a Rydex Distributors, LLC), Vice President (2009); Rydex Fund Services, LLC, Director (2009–2010), Secretary (2002–2010), Executive Vice President (2002–2006); Rydex Advisors, LLC (f/k/a PADCO Advisors, Inc.), Director (2008–2010), Chief Investment Officer (2006–2010), President (2004-2010), Secretary (2002–2010); Rydex Advisors II, LLC (f/k/a PADCO Advisors II, Inc.), Director (2008–2010), Chief Investment Officer (2006–2010), President (2004–2010), Secretary (2002–2010); Rydex Capital Partners, LLC, President & Secretary (2003–2007); Rydex Capital Partners II, LLC, (2003–2007); Rydex Holdings, LLC (f/k/a Rydex Holdings, Inc.), Secretary (2005–2008), Executive Vice President (2005–2006); Advisor Research Center, Inc., Secretary (2006–2009), Executive Vice President (2006); and Rydex Specialized Products, LLC, Secretary (2005–2008) |
| the GUGGENHEIM FUNDS annual report | 65 |
| INFORMATION on board of trustees and officers (Unaudited) (concluded) |
| EXECUTIVE OFFICERS – concluded | | |
| | | |
| Name, Position and | | Principal Occupations |
| Year of Birth | | During Past Five Years |
| | | |
Nikolaos Bonos* Vice President and Treasurer (1963) | | Current: Senior Vice President, Security Investors, LLC; Chief Executive Officer & Manager, Rydex Specialized Products, LLC; Chief Executive Officer & President, Rydex Fund Services, LLC; Vice President, Rydex Holdings, LLC; Treasurer, SBL Fund; Security Equity Fund; Security Income Fund; Security Large Cap Value Fund & Security Mid Cap Growth Fund; and Vice President, Security Benefit Asset Management Holdings, LLC |
| | | |
| | | Previous: Security Global Investors, LLC, Senior Vice President (2010–2011); Rydex Advisors, LLC (f/k/a PADCO Advisors, Inc.) Senior Vice President (2006–2011); Rydex Fund Services, LLC (f/k/a Rydex Fund Services, Inc.), Director (2009) & Senior Vice President (2003–2006); and Rydex Specialized Products, LLC, Chief Financial Officer (2005–2009) |
| | | |
Elisabeth Miller* Chief Compliance Officer (1968) | | Current: Chief Compliance Officer, Rydex Series Funds, Rydex Dynamic Funds, Rydex Variable Trust, Rydex ETF Trust, Security Equity Fund, Security Income Fund, Security Large Cap Value Fund, Security Mid Cap Growth Fund, SBL Fund, Security Investors, LLC, and Guggenheim Distributors, LLC |
| | | |
| | | Previous: Senior Manager, Security Investors, LLC and Guggenheim Distributors, LLC (2004–2009) |
| | | |
Amy J. Lee* Vice President and Assistant Secretary (1961) | | Current: Senior Vice President & Secretary, Security Investors, LLC; Secretary & Chief Compliance Officer, Security Distributors, Inc.; Vice President, Associate General Counsel & Assistant Secretary, Security Benefit Life Insurance Company and Security Benefit Corporation; Associate General Counsel, First Security Benefit Life Insurance and Annuity of New York; Vice President & Secretary, SBL Fund; Security Equity Fund; Security Income Fund; Security Large Cap Value Fund & Security Mid Cap Growth Fund; Vice President & Secretary, Rydex Holdings, LLC Secretary, Advisor Research Center, Inc., Rydex Specialized Products, LLC, Guggenheim Distributors, LLC and Rydex Fund Services, LLC; and Assistant Secretary, Security Benefit Clinic and Hospital |
| | | |
| | | Previous: Security Global Investors, LLC, Senior Vice President & Secretary (2007–2011); Rydex Advisors, LLC (f/k/a PADCO Advisors, Inc.) & Rydex Advisors II, LLC (f/k/a PADCO Advisors II, Inc.), Senior Vice President & Secretary (2010–2011); and Brecek & Young Advisors, Inc., Director (2004–2008) |
| | | |
Joseph M. Arruda* Assistant Treasurer (1966) | | Current: Assistant Treasurer, SBL Fund; Security Equity Fund; Security Income Fund; Security Large Cap Value Fund & Security Mid Cap Growth Fund; Vice President, Security Investors, LLC; and Chief Financial Officer & Manager, Rydex Specialized Products, LLC |
| | | |
| | | Previous: Security Global Investors, LLC, Vice President (2010–2011); and Rydex Advisors, LLC (f/k/a PADCO Advisors, Inc.) & Rydex Advisors II, LLC (f/k/a PADCO Advisors II, Inc.), Vice President (2004–2011) |
| * | Officers of the Funds are deemed to be “interested persons” of the Trust, within the meaning of Section 2(a)(19) of the 1940 Act, inasmuch as this person is affiliated with Guggenheim Investments. |
| 66 | the GUGGENHEIM FUNDS annual report |
| GUGGENHEIM INVESTMENTS PRIVACY Policies |
Rydex Funds, Guggenheim Funds, Rydex Investments, Guggenheim Distributors, Inc., Security Investors, LLC, Security Distributors, Inc. and Rydex Advisory Services (Collectively “Guggenheim Investments”)
Our Commitment to You
When you become a Guggenheim Investments investor, you entrust us with not only your hard-earned money but also with personal and financial information about you. We recognize that your relationship with us is based on trust and that you expect us to act responsibly and in your best interests. Because we have access to this private information about you, we hold ourselves to the highest standards in its safekeeping and use. This means, most importantly, that we do not sell client information to anyone—whether it is your personal information or if you are a current or former Guggenheim Investments client.
The Information We Collect About You
In the course of doing business with shareholders and investors, we collect nonpublic personal information about you. You typically provide personal information when you complete a Guggenheim Investments account application or when you request a transaction that involves Rydex and Guggenheim Investments funds or one of the Guggenheim Investments affiliated companies. “Nonpublic personal information” is personally identifiable private information about you. For example, it includes information regarding your name and address, Social Security or taxpayer identification number, assets, income, account balance, bank account information and investment activity (e.g., purchase and redemption history).
How We Handle Your Personal Information
As emphasized above, we do not sell information about current or former clients or their accounts to third parties. Nor do we share such information, except when necessary to complete transactions at your request or to make you aware of related investment products and services that we offer. Additional details about how we handle your personal information are provided below. To complete certain transactions or account changes that you direct, it may be necessary to provide identifying information to companies, individuals or groups that are not affiliated with Guggenheim Investments. For example, if you ask to transfer assets from another financial institution to Guggenheim Investments, we will need to provide certain information about you to that company to complete the transaction. To alert you to other Guggenheim Investments investment products and services, we may share your information within the Guggenheim Investments family of affiliated companies. This would include, for example, sharing your information within Guggenheim Investments so we can make you aware of new Rydex and Guggenheim Investments funds or the services offered through another Guggenheim Investments affiliated company. In certain instances, we may contract with nonaffiliated companies to perform services for us. Where necessary, we will disclose information we have about you to these third parties. In all such cases, we provide the third party with only the information necessary to carry out its assigned responsibilities and only for that purpose. And we require these third parties to treat your private information with the same high degree of confidentiality that we do. In certain instances, we may share information with other financial institutions regarding individuals and entities in response to the U.S.A. Patriot Act. Finally, we will release information about you if you direct us to do so, if we are compelled by law to do so or in other circumstances permitted by law.
Opt Out Provisions
We do not sell your personal information to anyone. The law allows you to “opt out” of only certain kinds of information sharing with third parties. The firm does not share personal information about you with any third parties that triggers this opt-out right. This means YOU ARE ALREADY OPTED OUT.
How We Protect Privacy Online
Our concern for the privacy of our shareholders also extends to those who use our web site, guggenheiminvestments.com. Our web site uses some of the most secure forms of online communication available, including encryption technology, Secure Socket Layer (SSL) protocol, firewalls and user names and passwords. These technologies provide a high level of security and privacy when you access your account information or initiate online transactions. The Guggenheim Investments web site offers customized features that require our use of “http cookies”—tiny pieces of information that we ask your browser to store. However, we make very limited use of these cookies. We only use cookies for session management and security features on the Guggenheim Investments web site. We do not use them to pull data from your hard drive, to learn your email address, or to view data in cookies created by other web sites. We will not share the information in our cookies or give others access to it. See the legal information area on our web site for more details about web site security and privacy features.
| the Guggenheim Funds annual REPORT | 67 |
| GUGGENHEIM INVESTMENTS PRIVACY Policies (concluded) |
How We Safeguard Your Personal Information
We restrict access to nonpublic personal information about shareholders to our employees and in some cases to third parties (for example, the service providers described above) as permitted by law. We maintain strict physical, electronic and procedural safeguards that comply with federal standards to guard your nonpublic personal information.
We’ll Keep You Informed
As required by federal law, we will notify shareholders of our privacy policy annually. We reserve the right to modify this policy at any time, but rest assured that if we do change it, we will tell you promptly. You will also be able to access our privacy policy from our web site at guggenheiminvestments.com. Should you have any questions regarding our privacy policy, contact us at 800.820.0888 or 301.296.5100.
| 68 | The Guggenheim Funds annual REPORT |
| |
| |
| This page intentionally left blank. |
Item 2. Code of Ethics.
The registrant’s Board of Trustees has adopted a code of ethics that applies to the registrant’s principal executive officer and principal financial officer. No substantive amendments were approved or waivers were granted to the Code during the period covered by this report. The Code is filed as an exhibit to this Form N-CSR.
Item 3. Audit Committee Financial Expert.
The registrant's Board of Trustees has determined that Werner Keller, an "independent" Trustee serving on the registrant's audit committee, is an "audit committee financial expert," as defined in Item 3 of Form N-CSR. Under applicable securities laws, a person who is determined to be an audit committee financial expert will not be deemed an "expert" for any purpose, including without limitation for the purposes of Section 11 of the Securities Act of 1933, as a result of being designated or identified as an audit committee financial expert. The designation or identification of a person as an audit committee financial expert does not impose on such person any duties, obligations, or liabilities that are greater than the duties, obligations, and liabilities imposed on such person as a member of the audit committee and Board of Trustees in the absence of such designation or identification.
Item 4. Principal Accountant Fees and Services.
(a) The aggregate Audit Fees billed by the Trust’s principal accountant, for the audit of the annual financial statements in connection with statutory and regulatory filings for the fiscal years ended December 31, 2012 and December 31, 2011 were $77,411 and $73,437, respectively.
(b) The aggregate Audit Related Fees by the Trust’s principal accountant billed for the fiscal years ended December 31, 2012 and December 31, 2011 were $0 and $0, respectively.
The aggregate fees billed in the Reporting Periods for assurance and related services by the Auditor to the Registrant’s investment adviser (not including any sub-investment adviser whose role is primarily portfolio management and is subcontracted with or overseen by another investment adviser), and any entity controlling, controlled by or under common control with the investment adviser that provides ongoing services to the Registrant (“Service Affiliates”) which required pre-approval by the Audit Committee which related to the review of the transfer agent function for the fiscal years ended December 31, 2012 and December 31, 2011 were $35,000 and $30,000, respectively.
(c) The aggregate Tax Fees billed by the Trust’s principal accountant for professional services rendered for tax compliance, tax advice, and tax planning, including preparation of tax returns and distribution assistance, for the fiscal years ended December 31, 2012 and December 31, 2011 was $0 and $9,216, respectively.
(d) The aggregate All Other Fees billed by the Trust’s principal accountant for products and services provided by the Auditor, other than the services reported in paragraphs (a) through (c) of this Item, for the fiscal years ended December 31, 2012 and December 31, 2011 were $0 and $0, respectively.
(e) The audit committee has adopted a policy whereby audit and non-audit services performed by the registrant’s principal accountant for the registrant, its investment advisor, and any entity controlling, controlled by, or under common control with the investment advisor that provides ongoing services to the registrant require pre-approval in advance at regularly scheduled audit committee meetings. If such service is required between regularly scheduled audit committee meetings, the chairman of the audit committee, J. Kenneth Dalton, is authorized to pre-approve the service with full committee approval at the next scheduled meeting. There shall be no waivers of the pre-approval process. No services described in (b)-(d) above were approved pursuant to paragraph (c)(7)(i)(C) of Rule 2-01 of Regulation S-X.
(f) Not applicable.
(g) The aggregate non-audit fees billed by the registrant’s accountant for the most recent fiscal year and the preceding fiscal year for services rendered to the registrant, the investment advisor, and any entity controlling, controlled by, or under common control with the advisor that provides ongoing services to the registrant were $35,000 and $39,216, respectively. These aggregate fees were less than the aggregate fees billed for the same periods by the registrant’s principal accountant for audit services rendered to the registrant, the investment advisor, and any entity controlling, controlled by, or under common control with the advisor that provides ongoing services to the registrant.
(h) All non-audit services rendered in (g) above were pre-approved by the registrant’s audit committee. As such, the audit committee has considered these services in maintaining the principal accountant’s independence.
Item 5. Audit Committee of Listed Registrants.
Not applicable.
Item 6. Investments.
Schedule of Investments is included as part of the report to shareholders filed under Item 1 of this form.
Item 7. Disclosure of Proxy Voting Policies and Procedures for Closed-End Management Investment Companies.
Not applicable.
Item 8. Portfolio Managers of Closed-End Management Investment Companies.
Not applicable.
Item 9. Purchases of Equity Securities by Closed-End Management Investment Company and Affiliated Purchasers.
Not applicable.
Item 10. Submission of Matters to a Vote of Security Holders.
Not applicable.
Item 11. Controls and Procedures.
(a) The registrant’s President (principal executive officer) and Treasurer (principal financial officer) have evaluated the registrant’s disclosure controls and procedures within 90 days of this filing and have concluded that the registrant’s disclosure controls and procedures were effective as of that date in ensuring that information required to be disclosed by the registrant in this Form N-CSR was recorded, processed, summarized, and reported timely.
(b) The registrant’s principal executive officer and principal financial officer are aware of no change in the registrant’s internal control over financial reporting that occurred during the registrant’s second fiscal quarter covered by this report that has materially affected, or is reasonably likely to materially affect, the registrant’s internal control over financial reporting.
Item 12. Exhibits.
(a)(1) The registrant’s code of ethics pursuant to Item 2 of Form N-CSR is attached.
(a)(2) Separate certifications by the President (principal executive officer) and Treasurer (principal financial officer) of the registrant as required by Rule 30a-2(a) under the Act (17 CFR 270.30a-2(a)) are attached.
(b) A certification by the registrant’s President (principal executive officer) and Treasurer (principal financial officer) as required by Rule 30a-2(b) under the Act (17 CFR 270.30a-2(b)) is attached.
SIGNATURES
Pursuant to the requirements of the Securities Exchange Act of 1934 and the Investment Company Act of 1940, the registrant has duly caused this report to be signed on its behalf by the undersigned, thereunto duly authorized.
| (Registrant) | Rydex Series Funds |
| By (Signature and Title)* | /s/ Donald C. Cacciapaglia |
| | Donald C. Cacciapaglia, President |
Pursuant to the requirements of the Securities Exchange Act of 1934 and the Investment Company Act of 1940, this report has been signed below by the following persons on behalf of the registrant and in the capacities and on the dates indicated.
| By (Signature and Title)* | /s/ Donald C. Cacciapaglia |
| | Donald C. Cacciapaglia, President |
| By (Signature and Title)* | /s/ Nikolaos Bonos |
| | Nikolaos Bonos, Vice President and Treasurer |
* Print the name and title of each signing officer under his or her signature.