UNITED STATES
SECURITIES AND EXCHANGE COMMISSION
Washington, D.C. 20549
FORM N-CSR
CERTIFIED SHAREHOLDER REPORT OF REGISTERED
ANAGEMENT INVESTMENT COMPANIES
Investment Company Act file number 811- 07584
Rydex Series Funds
(Exact name of registrant as specified in charter)
805 King Farm Boulevard, Suite 600
Rockville, Maryland 20850
(Address of principal executive offices) (Zip code)
Amy J. Lee
Rydex Series Funds
805 King Farm Boulevard, Suite 600
Rockville, Maryland 20850
(Name and address of agent for service)
Registrant's telephone number, including area code: 1-301-296-5100
Date of fiscal year end: December 31
Date of reporting period: December 31, 2014
Form N-CSR is to be used by management investment companies to file reports with the Commission not later than 10 days after the transmission to stockholders of any report that is required to be transmitted to stockholders under Rule 30e-1 under the Investment Company Act of 1940 (17 CFR 270.30e-1). The Commission may use the information provided on Form N-CSR in its regulatory, disclosure review, inspection, and policymaking roles.
A registrant is required to disclose the information specified by Form N-CSR, and the Commission will make this information public. A registrant is not required to respond to the collection of information contained in Form N-CSR unless the Form displays a currently valid Office of Management and Budget ("OMB") control number. Please direct comments concerning the accuracy of the information collection burden estimate and any suggestions for reducing the burden to Secretary, Securities and Exchange Commission, 450 Fifth Street, NW, Washington, DC 20549-0609. The OMB has reviewed this collection of information under the clearance requirements of 44 U.S.C. § 3507.
Item 1. Reports to Stockholders.

12.31.2014
Guggenheim Funds Annual Report
| Guggenheim Alternative Fund |
| Guggenheim Multi-Hedge Strategies Fund | | |
| Rydex Specialty Fund |
| Rydex Commodities Strategy Fund | | |
| RDXSGIALT-ANN-1214x1215 | guggenheiminvestments.com |
| DEAR SHAREHOLDER | 2 |
| ECONOMIC AND MARKET OVERVIEW | 4 |
| ABOUT SHAREHOLDERS’ FUND EXPENSES | 7 |
| ALTERNATIVE FUND | |
| MULTI-HEDGE STRATEGIES FUND | 10 |
| SPECIALTY FUND | |
| COMMODITIES STRATEGY FUND | 43 |
| NOTES TO CONSOLIDATED FINANCIAL STATEMENTS | 55 |
| REPORT OF INDEPENDENT REGISTERED PUBLIC ACCOUNTING FIRM | 78 |
| OTHER INFORMATION | 79 |
| INFORMATION ON BOARD OF TRUSTEES AND OFFICERS | 80 |
| GUGGENHEIM INVESTMENTS PRIVACY POLICIES | 84 |
| | THE GUGGENHEIM FUNDS ANNUAL REPORT | 1 |
Dear Shareholder:
Security Investors, LLC (the “Investment Adviser”) is pleased to present the annual shareholder report for two alternative strategy funds (the “Funds”) that are part of the Rydex Series Funds. This report covers performance of the Funds for the annual period ended December 31, 2014.
The Investment Adviser is a part of Guggenheim Investments, which represents the investment management businesses of Guggenheim Partners, LLC, a global, diversified financial services firm.
Guggenheim Funds Distributors, LLC is the distributor of the Funds. Guggenheim Funds Distributors, LLC is affiliated with Guggenheim Partners, LLC and Security Investors, LLC.
We encourage you to read the Economic and Market Overview section of the report, which follows this letter, and then the Performance Report and Fund profile for each Fund.
We are committed to providing innovative investment solutions and appreciate the trust you place in us.
Sincerely,
Donald C. Cacciapaglia
President
January 31, 2015
Read a prospectus and summary prospectus (if available) carefully before investing. It contains the investment objectives, risks, charges, expenses and other information, which should be considered carefully before investing. Obtain a prospectus and summary prospectus (if available) at guggenheiminvestments.com or call 800.820.0888.
| 2 | THE GUGGENHEIM FUNDS ANNUAL REPORT | |
The Multi-Hedge Strategies Fund is subject to a number of risks and may not be suitable for all investors. • The Fund’s use of derivatives such as futures, options and swap agreements may expose the Fund to additional risks that it would not be subject to if it invested directly in the securities underlying those derivatives. • The more the Fund invests in leveraged instruments, the more the leverage will magnify any gains or losses on those investments. • The Fund’s use of short selling involves increased risks and costs. The Fund risks paying more for a security than it received from its sale. • The Fund’s investments in high yield securities and unrated securities of similar credit quality (“junk bonds”) may be subject to greater levels of interest rate, credit and liquidity risk than funds that do not invest in such securities. • The Fund’s fixed income investments will change in value in response to interest rate changes and other factors. • The Fund’s exposure to the commodity and currency markets may subject the Fund to greater volatility as commodity-and currency-linked derivative investments may be affected by changes in overall market movements, commodity index volatility, changes in interest rates or factors affecting a particular industry, commodity or currency—such as droughts, floods, weather, livestock disease, embargoes, tariffs and international economic, political and regulatory developments. The Fund may also incur transaction costs with the conversion between various currencies. • The Fund’s exposure to foreign currencies subjects the Fund to the risk that those currencies will decline in value relative to the U.S. dollar, or, in the case of short positions, that the U.S. dollar will decline in value relative to the currency being hedged. • These risks may cause the Fund to experience higher losses and/or volatility than a fund that does not invest in derivatives, use leverage or short sales or have exposure to high yield/fixed income securities, foreign currencies and/or securities. • This Fund is considered non-diversified and can invest a greater portion of its assets in securities of individual issuers than a diversified fund. As a result, changes in the market value of a single security could cause greater fluctuations in the value of fund shares than would occur in a more diversified fund. • Please read the prospectus for more detailed information regarding these and other risks.
The Commodities Strategy Fund is subject may not be suitable for all investors. • The Fund’s exposure to the commodity markets may subject the Fund to greater volatility as commodity-linked investments may be affected by changes in overall market movements, commodity index volatility, changes in interest rates or factors affecting a particular industry or commodity—such as droughts, floods, weather, embargos, tariffs and international economic, political and regulatory developments. • To the extent that the Fund’s investments are concentrated in energy-related commodities, the Fund is subject to the risk that this sector will underperform the market as a whole. • The Fund’s use of derivatives, such as futures, options, structured notes and swap agreements, may expose the Fund to additional risks that it would not be subject to if it invested directly in the securities or investments underlying those derivatives. • The more the Fund invests in leveraged instruments, the more the leverage will magnify any gains or losses on those investments. • The Fund is subject to tracking error risks, which may cause the Fund’s performance not to match that of or be lower than the Fund’s underlying benchmark. • The Fund's investments in other investment companies subjects the Fund to those risks affecting the investment company, including the possibility that the value of the underlying securities held by the investment company could decrease. Moreover, the Fund will incur its pro rata share of the expenses of the underlying investment companies’ expenses. • This Fund is considered non-diversified and can invest a greater portion of its assets in securities of individual issuers than a diversified fund. As a result, changes in the market value of a single security could cause greater fluctuations in the value of fund shares than would occur in a more diversified fund. • See the prospectus for more information on these and additional risks.
| | THE GUGGENHEIM FUNDS ANNUAL REPORT | 3 |
ECONOMIC AND MARKET OVERVIEW (Unaudited) | December 31, 2014 |
The U.S. economy continued to grow throughout the 12 months ended December 31, 2014, despite some seasonal volatility in September and October that caused spreads in leveraged credit to widen and upward momentum in U.S. stocks to deteriorate. By the end of October, the spread widening had reversed and equities regained their footing, with some key indices shooting to new highs. Markets similarly overcame a weather-related winter soft patch in the first quarter of 2014. The benchmark U.S. 10-year Treasury rate declined from 3.03% to 2.17% over the period, a positive stimulant to continued economic expansion.
U.S. growth appears to have decoupled from the rest of the world. The third quarter’s 5% U.S. gross domestic product (GDP) growth—the fastest pace in 11 years—signals that the U.S. economy is doing very well. Deeming growth sustainable, the U.S. Federal Reserve (the “Fed”) formally ended its quantitative easing (QE) program in October, and all eyes are now on economic data—primarily inflation and employment figures—that would prompt the Fed to raise rates in 2015. Slowing global growth has translated into expectations of weaker demand for oil in an already oversupplied market, which contributed to oil’s 49% decline in the second half of the year, with West Texas Intermediate ending the year at a five-year low of $53 a barrel.
The bright side to declining energy prices is that it leaves more money for consumers to spend on other goods. Data are already confirming this, as American consumer confidence reached new post-recession highs, and fourth quarter retail spending posted solid gains. Overall, this should be positive for consumer-related companies with primarily domestic operations.
The U.S. added 246,000 jobs per month on average in 2014. Employment levels are transitioning from the recovery phase to the expansion phase, which typically coincides with accelerating economic activity. The downward trend in labor force participation has begun to flatten and, as fewer people leave the workforce, the rapid decline in the nation’s unemployment rate could begin to slow. Until unemployment falls below the natural rate of unemployment, it’s unlikely that the U.S. economy will experience the kind of meaningful wage pressure that would spur action by the Fed. An improving labor market, subdued mortgage rates, and tight housing inventory all point to a rebound in the housing market.
The battle against deflation in Europe forced the European Central Bank (ECB) to announce its own form of QE via purchases of asset-backed securities (ABS) and covered bonds. The consensus appears to be that in its current form, the program is insufficient to avert a slowdown. The next step for the ECB may be to buy sovereign bonds, which the ECB will decide on in the coming months. The only notable positive for Europe over the past year has been the devaluation of
| 4 | THE GUGGENHEIM FUNDS ANNUAL REPORT | |
ECONOMIC AND MARKET OVERVIEW (Unaudited)(continued) | December 31, 2014 |
the euro, which fell by 13% against the U.S. dollar between May and December. A weaker euro makes exports more competitive, but still will not be enough to boost inflation in the region.
While markets were already anxious over Europe’s struggles and the potential impact of a stronger dollar on U.S. company earnings, Japan relapsed into recession. This drove the Bank of Japan to announce it would expand its asset purchase program in 2015. China also faces slowing growth as financing costs remain high for smaller companies, forcing the People’s Bank of China (PBOC) to cut benchmark interest rates for the first time since July 2012.
From an investment standpoint, U.S. assets continue to look attractive. With global central banks easing or engaging in their form of QE, global yields remain anchored and are driving investors into U.S. markets. But we are wary of the potential for a setback in U.S. equities as certain factors, such as oil prices and currency fluctuations, drive markets to aggressively discount valuations for some sectors more than others.
For the year ended December 31, 2014, the Standard & Poor’s 500® (“S&P 500”) Index* returned 13.69%. The Morgan Stanley Capital International (“MSCI”) Europe-Australasia-Far East (“EAFE”) Index* returned -4.90%. The return of the MSCI Emerging Markets Index* was -2.19%.
In the bond market, the Barclays U.S. Aggregate Bond Index* posted a 5.97% return for the period, while the Barclays U.S. Corporate High Yield Index* returned 2.45%. The return of the Bank of America Merrill Lynch 3-Month U.S. Treasury Bill Index* was 0.04% for the 12-month period.
The opinions and forecasts expressed may not actually come to pass. This information is subject to change at any time, based on market and other conditions, and should not be construed as a recommendation of any specific security or strategy.
*Index Definitions:
The following indices are referenced throughout this report. Indices are unmanaged and not available for direct investment. Index performance does not reflect transaction costs, fees, or expenses.
Barclays U.S. Aggregate Bond Index is a broad-based benchmark that measures the investment grade, U.S. dollar denominated, fixed-rate taxable bond market, including U.S. Treasuries, government-related and corporate securities, MBS (agency fixed-rate and hybrid ARM pass-throughs), ABS, and CMBS.
Barclays U.S. Corporate High Yield Index measures the market of U.S. dollar denominated, non-investment grade, fixed-rate, taxable corporate bonds. Securities are classified as high yield if the middle rating of Moody’s, Fitch, and S&P is Ba1/BB +/BB + or below.
| | THE GUGGENHEIM FUNDS ANNUAL REPORT | 5 |
ECONOMIC AND MARKET OVERVIEW (Unaudited)(concluded) | December 31, 2014 |
Bank of America (“BofA”) Merrill Lynch 3-Month U.S. Treasury Bill Index is an unmanaged market index of U.S. Treasury securities maturing in 90 days that assumes reinvestment of all income.
MSCI EAFE Index is a free float-adjusted market capitalization index that is designed to measure the equity market performance of developed markets, excluding the U.S. & Canada.
MSCI Emerging Markets Index is a free float-adjusted market capitalization weighted index that is designed to measure equity market performance in the global emerging markets.
S&P 500®Index is a capitalization-weighted index of 500 stocks designed to measure the performance of the broad economy, representing all major industries and is considered a representation of the U.S. stock market.
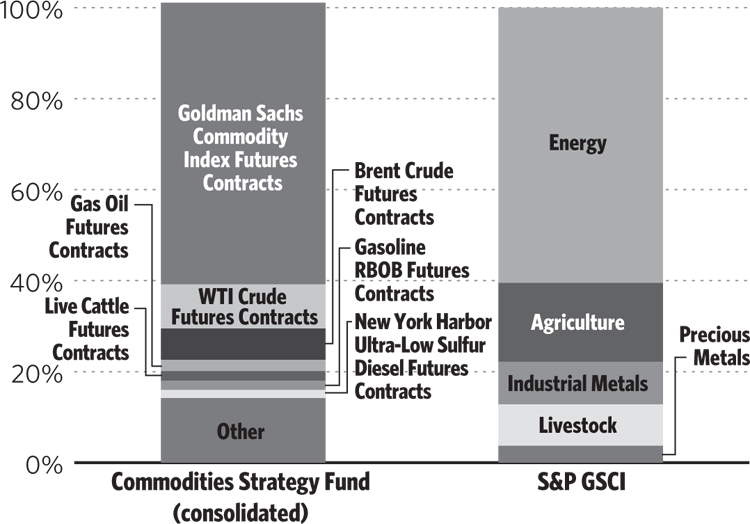
S&P Goldman Sachs Commodity Index (“GSCI”)TM, a benchmark for investment performance in the commodity markets, measures investable commodity price movements and inflation in the world economy. The index is calculated primarily on a world production weighted basis and is comprised of the principal physical commodities that are the subject of active, liquid futures markets.
HFRX Global Hedge Fund Index is designed to be representative of the overall composition of the hedge fund universe. It is comprised of all eligible hedge fund strategies, including, but not limited to, convertible arbitrage, distressed securities, equity hedge, equity market neutral, event driven, macro, merger arbitrage and relative-value arbitrage. The strategies are asset weighted based on the distribution of assets in the hedge fund industry.
| 6 | THE GUGGENHEIM FUNDS ANNUAL REPORT | |
ABOUT SHAREHOLDERS’ FUND EXPENSES (Unaudited) |
All mutual funds have operating expenses and it is important for our shareholders to understand the impact of costs on their investments. Shareholders of a Fund incur two types of costs: (i) transaction costs, including sales charges (loads) on purchase payments, reinvested dividends, or other distributions; and exchange fees; and (ii) ongoing costs, including management fees, administrative services, and shareholder reports, among others. These ongoing costs, or operating expenses, are deducted from a fund’s gross income and reduce the investment return of the fund.
A fund’s expenses are expressed as a percentage of its average net assets, which is known as the expense ratio. The following examples are intended to help investors understand the ongoing costs (in dollars) of investing in a Fund and to compare these costs with the ongoing costs of investing in other mutual funds.
The examples are based on an investment of $1,000 made at the beginning of the period and held for the entire six-month period beginning June 30, 2014 and ending December 31, 2014.
The following tables illustrate a Fund’s costs in two ways:
Table 1. Based on actual Fund return. This section helps investors estimate the actual expenses paid over the period. The “Ending Account Value” shown is derived from the Fund’s actual return, and the fourth column shows the dollar amount that would have been paid by an investor who started with $1,000 in the Fund. Investors may use the information here, together with the amount invested, to estimate the expenses paid over the period. Simply divide the Fund’s account value by $1,000 (for example, an $8,600 account value divided by $1,000 = 8.6), then multiply the result by the number provided under the heading “Expenses Paid During Period.”
Table 2. Based on hypothetical 5% return. This section is intended to help investors compare a Fund’s cost with those of other mutual funds. The table provides information about hypothetical account values and hypothetical expenses based on the Fund’s actual expense ratio and an assumed rate of return of 5% per year before expenses, which is not the Fund’s actual return. The hypothetical account values and expenses may not be used to estimate the actual ending account balance or expenses paid during the period. The example is useful in making comparisons because the U.S. Securities and Exchange Commission (the “SEC”) requires all mutual funds to calculate expenses based on the 5% return. Investors can assess a Fund’s costs by comparing this hypothetical example with the hypothetical examples that appear in shareholder reports of other funds.
| | THE GUGGENHEIM FUNDS ANNUAL REPORT | 7 |
ABOUT SHAREHOLDERS’ FUND EXPENSES (Unaudited)(continued) |
The calculations illustrated above assume no shares were bought or sold during the period. Actual costs may have been higher or lower, depending on the amount of investment and the timing of any purchases or redemptions.
Please note that the expenses shown in the table are meant to highlight your ongoing costs only and do not reflect any transactional costs, such as sales charges (loads) on purchase payments, and contingent deferred sales charges ("CDSC") on redemptions, if any. Therefore, the second table is useful in comparing ongoing costs only, and will not help you determine the relative total costs of owning different funds. In addition, if these transactional costs were included, your costs would have been higher.
More information about a Fund’s expenses, including annual expense ratios for the past five years, can be found in the Financial Highlights section of this report. For additional information on operating expenses and other shareholder costs, please refer to the appropriate Fund prospectus.
| 8 | THE GUGGENHEIM FUNDS ANNUAL REPORT | |
ABOUT SHAREHOLDERS’ FUND EXPENSES (Unaudited)(concluded) |
| | Expense Ratio1 | Fund Return | Beginning Account Value June 30, 2014 | Ending Account Value December 31, 2014 | Expenses Paid During Period2 |
Table 1. Based on actual Fund return3 | |
| | |
| Multi-Hedge Strategies Fund | | | | | |
| A-Class | 3.00% | 4.68% | $1,000.00 | $1,046.80 | $15.48 |
| C-Class | 3.76% | 4.26% | 1,000.00 | 1,042.60 | 19.36 |
| H-Class | 3.00% | 4.68% | 1,000.00 | 1,046.80 | 15.48 |
| Institutional Class | 2.75% | 4.80% | 1,000.00 | 1,048.00 | 14.20 |
| Commodities Strategy Fund | | | | | |
| A-Class | 1.56% | (36.85%) | 1,000.00 | 631.50 | 6.42 |
| C-Class | 2.34% | (37.03%) | 1,000.00 | 629.70 | 9.61 |
| H-Class | 1.60% | (36.76%) | 1,000.00 | 632.40 | 6.58 |
| |
| Table 2. Based on hypothetical 5% return (before expenses) |
| |
| Multi-Hedge Strategies Fund | | | | | |
| A-Class | 3.00% | 5.00% | $1,000.00 | $1,010.08 | $15.20 |
| C-Class | 3.76% | 5.00% | 1,000.00 | 1,006.25 | 19.01 |
| H-Class | 3.00% | 5.00% | 1,000.00 | 1,010.08 | 15.20 |
| Institutional Class | 2.75% | 5.00% | 1,000.00 | 1,011.34 | 13.94 |
| Commodities Strategy Fund | | | | | |
| A-Class | 1.56% | 5.00% | 1,000.00 | 1,017.34 | 7.93 |
| C-Class | 2.34% | 5.00% | 1,000.00 | 1,013.41 | 11.88 |
| H-Class | 1.60% | 5.00% | 1,000.00 | 1,017.14 | 8.13 |
1 | Annualized and excludes expenses of the underlying funds in which the Funds invest. This ratio represents net expenses, which include interest expense related to securities sold short. Excluding short interest expenses, the operating expense ratio of the Multi-Hedge Strategies Fund would be 1.44%, 2.19%, 1.44% and 1.18% for the A-Class, C-Class, H-Class and Institutional Class, respectively. |
2 | Expenses are equal to the Fund's annualized expense ratio, net of any applicable fee waivers, multiplied by the average account value over the period, multiplied by 184/365 (to reflect the one-half year period). |
3 | Actual cumulative return at net asset value for the period June 30, 2014 to December 31, 2014. |
| | THE GUGGENHEIM FUNDS ANNUAL REPORT | 9 |
PERFORMANCE REPORT AND FUND PROFILE (Unaudited) | December 31, 2014 |
MULTI-HEDGE STRATEGIES FUND
OBJECTIVE: Seeks long-term capital appreciation with less risk than traditional equity funds.
2014 was the fifth full fiscal year of performance since the Fund’s objective was changed from hedge fund replication to capital appreciation. The Fund seeks capital appreciation with low correlation to equity and fixed income markets, while doing so with low risk–typically in the 5.0% to 8.0% range. The risk-adjusted results for fiscal year 2014 were good for a fifth year, as the Fund’s H-Class shares generated a 4.77% return with only 3.3% annualized risk, resulting in a Sharpe ratio* of 1.42. In addition to generating a good Sharpe ratio, the Fund did so with correlation** of 48% to the S&P 500 Index and -17% to the Barclays U.S. Aggregate Bond Index over the course of the year.
The S&P 500 had four negative-return calendar months in 2014 and, in two of these months, Multi-Hedge Strategies produced positive returns; the Barclays U.S. Aggregate Bond Index had three negative-return calendar months and, in one of these months, Multi-Hedge Strategies produced a positive return.
The S&P 500 beta-adjusted performance (i.e., alpha) of the Fund’s H-Class shares for the year was 2.80% as the fund had a realized beta of 14%. These results demonstrate the Fund’s diversification benefits.
While no longer a replication product, the Fund still maintains the HFRX Global Hedge Fund Index as one of its benchmarks. This benchmark returned -0.58% for the year. In contrast to the diversification benefits provided by the Multi-Hedge Strategies Fund, the HFRX Global Hedge Fund Index had a correlation of 81% to the S&P 500 in 2014. In spite of the greater equity return contribution to the HFRX Global Hedge Fund performance, the Multi-Hedge Strategies Fund has outperformed this index by more than 8% (1.3% annualized), net of fees, since the Fund changed its investment objective on August 1, 2009.
All five of the hedge fund strategies used within the Fund contributed positively to gross fund returns in 2014.
The Fund’s Global Macro strategies contributed the most to gross fund returns with 2.56%. Within Global Macro, the Managed Futures models contributed 2.95%. The Managed Futures models seek to profit from global trends and reversions by trading commodity, currency, equity, and fixed income futures. The Volatility Arbitrage model contributed -0.38%; this strategy seeks to profit from relative value trades across the VIX futures curve.
| 10 | THE GUGGENHEIM FUNDS ANNUAL REPORT | |
PERFORMANCE REPORT AND FUND PROFILE (Unaudited)(continued) | December 31, 2014 |
The Equity Market Neutral strategies contributed 1.28% to gross fund returns. The Quantitative Market Neutral model contributed 1.12%; this model allocates to stocks resulting in a portfolio with tilts toward value and momentum characteristics while seeking equity beta neutrality. The Closed-end Arbitrage model contributed 0.16%; this strategy purchases closed-end funds trading at discounts while hedging the market-related risks associated with each fund.
The Long/Short Equity strategies contributed 0.97% to gross fund returns, with the Industry and Factor Rotation model contributing 0.54% and the Size model contributing 0.43%. The Industry and Factor Rotation model allocates to industries and risk factors based upon recent trends while typically maintaining a positive equity market beta. The Size model tactically trades the relative performance of large capitalization equities versus small capitalization equities.
The Merger Arbitrage strategy contributed 0.82% to gross fund returns; this strategy typically invests in definitive merger deals and makes allocations based upon the expected return and risk parameters of each trade.
The Treasury Flattener model is the only Fixed Income strategy currently being used and it contributed 0.52% to gross fund returns. The Treasury Flattener model purchases ten-year Treasury note futures and hedges with two-year Treasury note futures on a duration-neutral basis when the yield spread between the two representative bonds is attractive.
Performance displayed represents past performance which is no guarantee of future results.
| * | Sharpe Ratio: a risk-adjusted measure calculated using standard deviation and excess return to determine reward per unit of risk. The higher the Sharpe ratio, the better the fund’s historical risk-adjusted performance. |
| ** | Correlation is a measurement between -1 and 1, which indicates the linear relationship between two variables. If there is no relationship between two variables, the correlation coefficient is 0. If there is a perfect relationship, the correlation is 1. And if there is a perfect inverse relationship, the correlation is -1. |
| | THE GUGGENHEIM FUNDS ANNUAL REPORT | 11 |
PERFORMANCE REPORT AND FUND PROFILE (Unaudited)(continued) | December 31, 2014 |
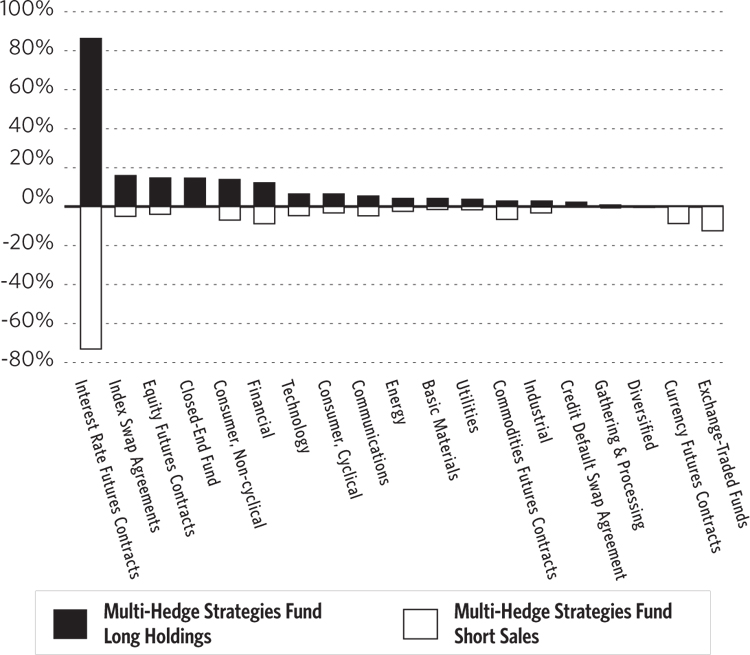
Consolidated Holdings Diversification
(Market Exposure as % of Net Assets)
“Consolidated Holdings Diversification (Market Exposure as % of Net Assets)” excludes any temporary cash investments or investments in Guggenheim Strategy Funds Trust mutual funds.
| Inception Dates: |
| A-Class | September 19, 2005 |
| C-Class | September 19, 2005 |
| H-Class | September 19, 2005 |
| Institutional Class | May 3, 2010 |
| Ten Largest Long Holdings (% of Total Net Assets) |
| TRW Automotive Holdings Corp. | 2.5% |
| Protective Life Corp. | 2.2% |
| Covance, Inc. | 2.1% |
| Time Warner Cable, Inc. | 2.1% |
| CareFusion Corp. | 2.0% |
| Covidien plc | 1.8% |
| Hudson City Bancorp, Inc. | 1.7% |
| Sigma-Aldrich Corp. | 1.6% |
| Dresser-Rand Group, Inc. | 1.5% |
| Lorillard, Inc. | 1.4% |
| Top Ten Total | 18.9% |
| | |
| “Ten Largest Long Holdings” exclude any temporary cash or derivative investments. |
| 12 | THE GUGGENHEIM FUNDS ANNUAL REPORT | |
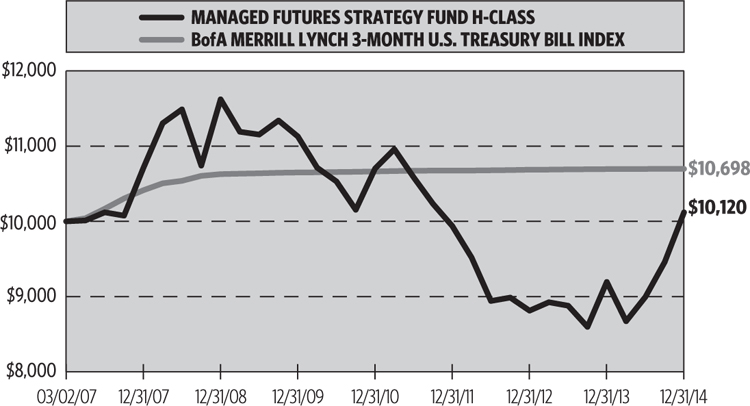
PERFORMANCE REPORT AND FUND PROFILE (Unaudited)(continued) | December 31, 2014 |
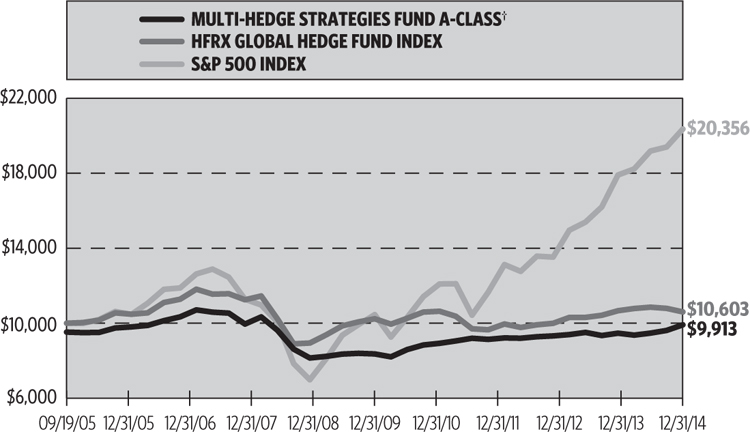
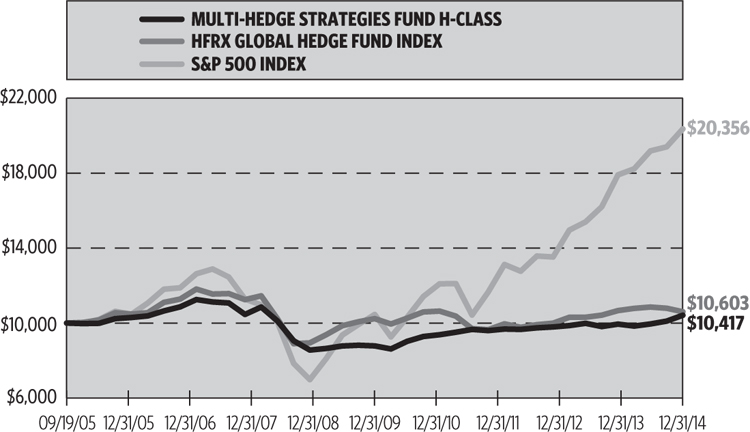
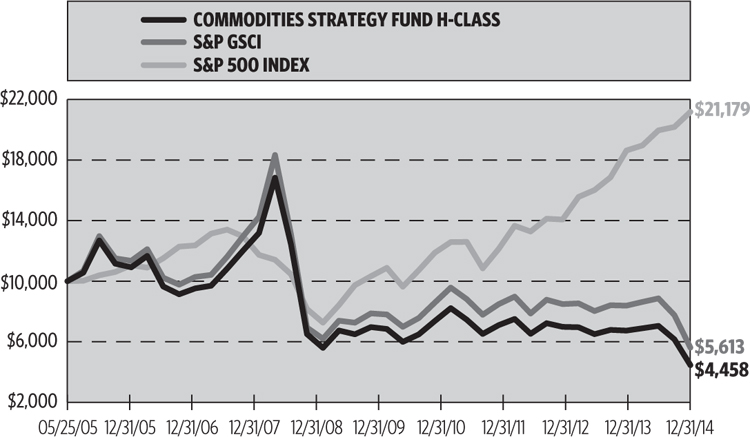
Cumulative Fund Performance*
| | THE GUGGENHEIM FUNDS ANNUAL REPORT | 13 |
PERFORMANCE REPORT AND FUND PROFILE (Unaudited)(concluded) | December 31, 2014 |
Average Annual Returns*
Periods Ended December 31, 2014
| | 1 Year | 5 Year | Since Inception (09/19/05) |
| A-Class Shares | 4.73% | 3.39% | 0.43% |
A-Class Shares with sales charge† | -0.26% | 2.38% | -0.09% |
| C-Class Shares | 3.97% | 2.62% | -0.32% |
C-Class Shares with CDSC‡ | 2.97% | 2.62% | -0.32% |
| H-Class Shares | 4.77% | 3.39% | 0.44% |
| HFRX Global Hedge Fund Index | -0.58% | 1.04% | 0.63% |
| S&P 500 Index | 13.69% | 15.45% | 7.96% |
| | | | |
| | | 1 Year | Since Inception (05/03/10) |
| Institutional Class Shares | | 4.98% | 3.87% |
| HFRX Global Hedge Fund Index | | -0.58% | 0.61% |
| S&P 500 Index | | 13.69% | 14.65% |
| * | The performance data represents past performance that is not predictive of future results. The investment return and principal value of an investment in the Fund will fluctuate so that an investor’s shares, when redeemed, may be worth more or less than their original cost. Returns are historical and include changes in principal and reinvested dividends and capital gains and do not reflect the effect of taxes. The HFRX Global Hedge Fund Index and the S&P 500 Index are unmanaged indices and, unlike the Fund, have no management fees or operating expenses to reduce their reported returns. The graphs are based on A-Class shares and H-Class shares only; performance for C-Class and Institutional Class shares will vary due to differences in fee structures. |
† | Fund returns are calculated using the maximum sales charge of 4.75%. |
‡ | Fund returns include a CDSC of 1% if redeemed within 12 months of purchase. |
| 14 | THE GUGGENHEIM FUNDS ANNUAL REPORT | |
| CONSOLIDATED SCHEDULE OF INVESTMENTS | December 31, 2014 |
| MULTI-HEDGE STRATEGIES FUND | |
| | | Shares | | | Value | |
| | | | | | | | | |
COMMON STOCKS† - 60.2% | |
| | | | | | | | | |
| CONSUMER, NON-CYCLICAL - 13.9% | |
Covance, Inc.*,1 | | | 20,022 | | | $ | 2,079,084 | |
CareFusion Corp.*,1 | | | 33,555 | | | | 1,991,154 | |
Covidien plc1 | | | 17,232 | | | | 1,762,489 | |
Lorillard, Inc.1 | | | 23,249 | | | | 1,463,292 | |
| Cubist Pharmaceuticals, Inc.* | | | 11,581 | | | | 1,165,627 | |
Allergan, Inc.1 | | | 4,120 | | | | 875,872 | |
| Volcano Corp.* | | | 14,948 | | | | 267,270 | |
Gentiva Health Services, Inc.*,1 | | | 11,621 | | | | 221,380 | |
| Avanir Pharmaceuticals, Inc. — Class A* | | | 12,924 | | | | 219,062 | |
Kroger Co.1 | | | 3,297 | | | | 211,701 | |
Chiquita Brands International, Inc.*,1 | | | 14,612 | | | | 211,290 | |
Ingredion, Inc.1 | | | 2,342 | | | | 198,696 | |
Archer-Daniels-Midland Co.1 | | | 3,632 | | | | 188,864 | |
Tyson Foods, Inc. — Class A1 | | | 4,683 | | | | 187,741 | |
Molson Coors Brewing Co. — Class B1 | | | 2,509 | | | | 186,971 | |
Humana, Inc.1 | | | 1,242 | | | | 178,388 | |
Tornier N.V.*,1 | | | 6,894 | | | | 175,797 | |
Amgen, Inc.1 | | | 1,092 | | | | 173,945 | |
Pfizer, Inc.1 | | | 5,423 | | | | 168,926 | |
Cintas Corp.1 | | | 1,625 | | | | 127,465 | |
DENTSPLY International, Inc.1 | | | 2,365 | | | | 125,983 | |
DaVita HealthCare Partners, Inc.*,1 | | | 1,648 | | | | 124,820 | |
| Pilgrim’s Pride Corp.* | | | 3,154 | | | | 103,420 | |
Hill-Rom Holdings, Inc.1 | | | 2,174 | | | | 99,178 | |
Dr Pepper Snapple Group, Inc.1 | | | 1,338 | | | | 95,908 | |
Omnicare, Inc.1 | | | 1,314 | | | | 95,830 | |
Johnson & Johnson1 | | | 884 | | | | 92,440 | |
Charles River Laboratories International, Inc.*,1 | | | 1,433 | | | | 91,196 | |
Quanta Services, Inc.*,1 | | | 2,652 | | | | 75,290 | |
United Therapeutics Corp.*,1 | | | 526 | | | | 68,112 | |
JM Smucker Co.1 | | | 646 | | | | 65,233 | |
UnitedHealth Group, Inc.1 | | | 621 | | | | 62,777 | |
Apollo Education Group, Inc. — Class A*,1 | | | 1,816 | | | | 61,944 | |
DeVry Education Group, Inc.1 | | | 1,290 | | | | 61,236 | |
Constellation Brands, Inc. — Class A*,1 | | | 597 | | | | 58,607 | |
General Mills, Inc.1 | | | 1,052 | | | | 56,103 | |
Cooper Companies, Inc.1 | | | 335 | | | | 54,300 | |
Universal Health Services, Inc. — Class B1 | | | 478 | | | | 53,182 | |
Myriad Genetics, Inc.*,2 | | | 1,433 | | | | 48,808 | |
Biogen Idec, Inc.*,1 | | | 143 | | | | 48,541 | |
Anthem, Inc.1 | | | 383 | | | | 48,132 | |
Gilead Sciences, Inc.*,1 | | | 406 | | | | 38,270 | |
ManpowerGroup, Inc.1 | | | 526 | | | | 35,857 | |
| Herbalife Ltd. | | | 932 | | | | 35,136 | |
Eli Lilly & Co.1 | | | 478 | | | | 32,977 | |
United Rentals, Inc.*,1 | | | 263 | | | | 26,829 | |
Coca-Cola Enterprises, Inc.1 | | | 239 | | | | 10,569 | |
| Mallinckrodt plc* | | | 95 | | | | 9,408 | |
Edwards Lifesciences Corp.*,1 | | | 72 | | | | 9,171 | |
| Total Consumer, Non-cyclical | | | | | | | 13,844,271 | |
| | | | | | | | | |
| FINANCIAL - 12.2% | |
Protective Life Corp.1 | | | 31,983 | | | | 2,227,617 | |
Hudson City Bancorp, Inc.1 | | | 165,788 | | | | 1,677,775 | |
American Realty Capital Healthcare Trust, Inc.1 | | | 103,593 | | | | 1,232,757 | |
Aviv REIT, Inc.1 | | | 24,835 | | | | 856,311 | |
Susquehanna Bancshares, Inc.1 | | | 51,302 | | | | 688,986 | |
Glimcher Realty Trust1 | | | 28,045 | | | | 385,339 | |
Bank of Kentucky Financial Corp.1 | | | 7,865 | | | | 379,644 | |
Morgan Stanley1 | | | 5,423 | | | | 210,412 | |
SunTrust Banks, Inc.1 | | | 4,826 | | | | 202,209 | |
Bank of America Corp.1 | | | 11,254 | | | | 201,334 | |
Voya Financial, Inc.1 | | | 4,635 | | | | 196,432 | |
| SEE NOTES TO FINANCIAL STATEMENTS. | THE GUGGENHEIM FUNDS ANNUAL REPORT | 15 |
CONSOLIDATED SCHEDULE OF INVESTMENTS (continued) | December 31, 2014 |
| MULTI-HEDGE STRATEGIES FUND | |
| | | Shares | | | Value | |
| | | | | | | | | |
ACE Ltd.1 | | | 1,696 | | | $ | 194,836 | |
Berkshire Hathaway, Inc. — Class B*,1 | | | 1,290 | | | | 193,694 | |
Hanover Insurance Group, Inc.1 | | | 2,700 | | | | 192,564 | |
Starwood Property Trust, Inc.1 | | | 8,148 | | | | 189,359 | |
PartnerRe Ltd.1 | | | 1,648 | | | | 188,086 | |
Wells Fargo & Co.1 | | | 3,417 | | | | 187,320 | |
Everest Re Group Ltd.1 | | | 1,099 | | | | 187,160 | |
MFA Financial, Inc.1 | | | 23,319 | | | | 186,319 | |
Two Harbors Investment Corp.1 | | | 18,541 | | | | 185,781 | |
Chimera Investment Corp.1 | | | 57,700 | | | | 183,486 | |
American Capital Agency Corp.1 | | | 8,291 | | | | 180,993 | |
Interactive Brokers Group, Inc. — Class A1 | | | 6,164 | | | | 179,742 | |
Air Lease Corp. — Class A1 | | | 5,065 | | | | 173,780 | |
AmREIT, Inc.1 | | | 6,349 | | | | 168,503 | |
Ameriprise Financial, Inc.1 | | | 1,242 | | | | 164,254 | |
PNC Financial Services Group, Inc.1 | | | 1,625 | | | | 148,249 | |
Allstate Corp.1 | | | 1,962 | | | | 137,831 | |
Capital One Financial Corp.1 | | | 1,529 | | | | 126,219 | |
| Hudson Valley Holding Corp. | | | 3,400 | | | | 92,344 | |
Reinsurance Group of America, Inc. — Class A1 | | | 1,004 | | | | 87,970 | |
CNA Financial Corp.1 | | | 2,174 | | | | 84,156 | |
Travelers Companies, Inc.1 | | | 764 | | | | 80,869 | |
Axis Capital Holdings Ltd.1 | | | 1,481 | | | | 75,664 | |
Taubman Centers, Inc.1 | | | 884 | | | | 67,555 | |
Navient Corp.1 | | | 2,628 | | | | 56,791 | |
Southside Bancshares, Inc.1 | | | 1,882 | | | | 54,411 | |
Annaly Capital Management, Inc.1 | | | 4,945 | | | | 53,455 | |
BioMed Realty Trust, Inc.1 | | | 2,270 | | | | 48,896 | |
Assurant, Inc.1 | | | 478 | | | | 32,710 | |
Huntington Bancshares, Inc.1 | | | 1,505 | | | | 15,833 | |
Legg Mason, Inc.1 | | | 238 | | | | 12,702 | |
Fifth Third Bancorp1 | | | 406 | | | | 8,272 | |
Jones Lang LaSalle, Inc.1 | | | 48 | | | | 7,197 | |
Unum Group1 | | | 48 | | | | 1,674 | |
| Total Financial | | | | | | | 12,207,491 | |
| | | | | | | | | |
| CONSUMER, CYCLICAL - 6.5% | |
TRW Automotive Holdings Corp.*,1 | | | 23,954 | | | | 2,463,669 | |
| PetSmart, Inc. | | | 13,076 | | | | 1,063,013 | |
| Brookfield Residential Properties, Inc.* | | | 11,052 | | | | 265,911 | |
Royal Caribbean Cruises Ltd.1 | | | 2,700 | | | | 222,561 | |
Alaska Air Group, Inc.1 | | | 3,489 | | | | 208,502 | |
Lowe’s Companies, Inc.1 | | | 3,011 | | | | 207,157 | |
CVS Health Corp.1 | | | 2,127 | | | | 204,851 | |
Whirlpool Corp.1 | | | 1,027 | | | | 198,971 | |
Foot Locker, Inc.1 | | | 3,417 | | | | 191,968 | |
Wyndham Worldwide Corp.1 | | | 2,222 | | | | 190,559 | |
PACCAR, Inc.1 | | | 2,771 | | | | 188,456 | |
Lear Corp.1 | | | 1,911 | | | | 187,431 | |
Macy’s, Inc.1 | | | 2,748 | | | | 180,681 | |
The Gap, Inc.1 | | | 2,963 | | | | 124,772 | |
PulteGroup, Inc.1 | | | 5,566 | | | | 119,446 | |
Carnival Corp.1 | | | 1,433 | | | | 64,958 | |
Deckers Outdoor Corp.*,1 | | | 693 | | | | 63,091 | |
Wendy’s Co.1 | | | 6,858 | | | | 61,928 | |
WABCO Holdings, Inc.*,1 | | | 526 | | | | 55,114 | |
Southwest Airlines Co.1 | | | 1,218 | | | | 51,546 | |
Visteon Corp.*,1 | | | 430 | | | | 45,950 | |
Dillard’s, Inc. — Class A1 | | | 286 | | | | 35,801 | |
Dolby Laboratories, Inc. — Class A1 | | | 764 | | | | 32,944 | |
Leggett & Platt, Inc.1 | | | 549 | | | | 23,393 | |
GameStop Corp. — Class A1 | | | 430 | | | | 14,534 | |
Ford Motor Co.1 | | | 884 | | | | 13,702 | |
Kohl’s Corp.1 | | | 191 | | | | 11,659 | |
General Motors Co.1 | | | 95 | | | | 3,316 | |
Walgreens Boots Alliance, Inc.1 | | | 24 | | | | 1,829 | |
Brinker International, Inc.1 | | | 24 | | | | 1,409 | |
| Total Consumer, Cyclical | | | | | | | 6,499,122 | |
| 16 | THE GUGGENHEIM FUNDS ANNUAL REPORT | SEE NOTES TO FINANCIAL STATEMENTS. |
CONSOLIDATED SCHEDULE OF INVESTMENTS (continued) | December 31, 2014 |
| MULTI-HEDGE STRATEGIES FUND | |
| | | Shares | | | Value | |
| | | | | | | | | |
| TECHNOLOGY - 6.5% | |
| Spansion, Inc. — Class A* | | | 41,436 | | | $ | 1,417,940 | |
International Rectifier Corp.*,1 | | | 27,913 | | | | 1,113,729 | |
Tokyo Electron Ltd. ADR1 | | | 53,832 | | | | 1,027,115 | |
Digital River, Inc.*,1 | | | 9,801 | | | | 242,378 | |
Oracle Corp.1 | | | 4,659 | | | | 209,516 | |
Hewlett-Packard Co.1 | | | 5,137 | | | | 206,148 | |
Intel Corp.1 | | | 5,328 | | | | 193,353 | |
Microsoft Corp.1 | | | 4,086 | | | | 189,794 | |
DST Systems, Inc.1 | | | 1,936 | | | | 182,274 | |
Broadridge Financial Solutions, Inc.1 | | | 3,752 | | | | 173,268 | |
Activision Blizzard, Inc.1 | | | 8,577 | | | | 172,826 | |
Western Digital Corp.1 | | | 1,433 | | | | 158,633 | |
Computer Sciences Corp.1 | | | 2,509 | | | | 158,192 | |
CA, Inc.1 | | | 5,065 | | | | 154,229 | |
Micron Technology, Inc.*,1 | | | 4,205 | | | | 147,217 | |
Brocade Communications Systems, Inc.1 | | | 12,066 | | | | 142,862 | |
Xerox Corp.1 | | | 9,844 | | | | 136,438 | |
QUALCOMM, Inc.1 | | | 1,744 | | | | 129,632 | |
Fidelity National Information Services, Inc.1 | | | 1,696 | | | | 105,491 | |
NVIDIA Corp.1 | | | 3,966 | | | | 79,518 | |
Pitney Bowes, Inc.1 | | | 2,820 | | | | 68,723 | |
Lam Research Corp.1 | | | 478 | | | | 37,925 | |
Skyworks Solutions, Inc.1 | | | 263 | | | | 19,123 | |
PTC, Inc.*,1 | | | 286 | | | | 10,482 | |
KLA-Tencor Corp.1 | | | 143 | | | | 10,056 | |
| Total Technology | | | | | | | 6,486,862 | |
| | | | | | | | | |
| COMMUNICATIONS - 5.4% | |
Time Warner Cable, Inc.1 | | | 13,634 | | | | 2,073,186 | |
DIRECTV*,1 | | | 10,793 | | | | 935,753 | |
Trulia, Inc.*,1 | | | 14,948 | | | | 688,056 | |
Sapient Corp.*,1 | | | 17,033 | | | | 423,780 | |
Time Warner, Inc.1 | | | 2,365 | | | | 202,018 | |
Liberty Interactive Corp. — Class A*,1 | | | 6,713 | | | | 197,496 | |
Gannett Company, Inc.1 | | | 5,973 | | | | 190,718 | |
Frontier Communications Corp.1,2 | | | 26,377 | | | | 175,935 | |
Yahoo!, Inc.*,1 | | | 3,249 | | | | 164,107 | |
IAC/InterActiveCorp1 | | | 1,601 | | | | 97,325 | |
Walt Disney Co.1 | | | 932 | | | | 87,785 | |
| Windstream Holdings, Inc. | | | 6,547 | | | | 53,947 | |
Cisco Systems, Inc.1 | | | 1,458 | | | | 40,554 | |
John Wiley & Sons, Inc. — Class A1 | | | 311 | | | | 18,424 | |
Harris Corp.1 | | | 24 | | | | 1,724 | |
T-Mobile US, Inc.*,1 | | | 48 | | | | 1,293 | |
| Total Communications | | | | | | | 5,352,101 | |
| | | | | | | | | |
| ENERGY - 4.2% | |
Dresser-Rand Group, Inc.*,1 | | | 18,548 | | | | 1,517,230 | |
Baker Hughes, Inc.1 | | | 19,325 | | | | 1,083,553 | |
| Talisman Energy, Inc. | | | 22,574 | | | | 176,755 | |
Chevron Corp.1 | | | 1,458 | | | | 163,559 | |
Devon Energy Corp.1 | | | 2,437 | | | | 149,170 | |
Murphy Oil Corp.1 | | | 2,891 | | | | 146,053 | |
Hess Corp.1 | | | 1,936 | | | | 142,916 | |
Murphy USA, Inc.*,1 | | | 2,054 | | | | 141,438 | |
ConocoPhillips1 | | | 2,007 | | | | 138,603 | |
Valero Energy Corp.1 | | | 2,031 | | | | 100,535 | |
Chesapeake Energy Corp.1 | | | 4,205 | | | | 82,292 | |
Unit Corp.*,1 | | | 2,222 | | | | 75,770 | |
Nabors Industries Ltd.1 | | | 4,587 | | | | 59,540 | |
Occidental Petroleum Corp.1 | | | 669 | | | | 53,928 | |
Denbury Resources, Inc.1 | | | 5,973 | | | | 48,560 | |
Helmerich & Payne, Inc.1 | | | 646 | | | | 43,553 | |
Apache Corp.1 | | | 526 | | | | 32,964 | |
Superior Energy Services, Inc.1 | | | 1,458 | | | | 29,379 | |
| Amec Foster Wheeler plc ADR | | | 1,285 | | | | 16,622 | |
California Resources Corp.*,1 | | | 267 | | | | 1,471 | |
| Total Energy | | | | | | | 4,203,891 | |
| | | | | | | | | |
| BASIC MATERIALS - 4.2% | |
Sigma-Aldrich Corp.1 | | | 11,809 | | | | 1,621,021 | |
Rockwood Holdings, Inc.1 | | | 18,373 | | | | 1,447,793 | |
| SEE NOTES TO FINANCIAL STATEMENTS. | THE GUGGENHEIM FUNDS ANNUAL REPORT | 17 |
CONSOLIDATED SCHEDULE OF INVESTMENTS (continued) | December 31, 2014 |
| MULTI-HEDGE STRATEGIES FUND | |
| | | Shares | | | Value | |
| | | | | | | | | |
CF Industries Holdings, Inc.1 | | | 717 | | | $ | 195,411 | |
Dow Chemical Co.1 | | | 3,584 | | | | 163,466 | |
LyondellBasell Industries N.V. — Class A1 | | | 1,696 | | | | 134,645 | |
Freeport-McMoRan, Inc.1 | | | 5,376 | | | | 125,583 | |
Penford Corp.*,1 | | | 6,408 | | | | 119,766 | |
Cabot Corp.1 | | | 2,389 | | | | 104,782 | |
Domtar Corp.1 | | | 2,270 | | | | 91,299 | |
United States Steel Corp.1 | | | 3,058 | | | | 81,771 | |
Ashland, Inc.1 | | | 597 | | | | 71,497 | |
Westlake Chemical Corp.1 | | | 693 | | | | 42,335 | |
| Total Basic Materials | | | | | | | 4,199,369 | |
| | | | | | | | | |
| UTILITIES - 3.7% | |
Cleco Corp.1 | | | 24,148 | | | | 1,317,031 | |
Pepco Holdings, Inc.1 | | | 25,759 | | | | 693,690 | |
Ameren Corp.1 | | | 4,539 | | | | 209,384 | |
Great Plains Energy, Inc.1 | | | 7,239 | | | | 205,660 | |
Westar Energy, Inc.1 | | | 4,970 | | | | 204,963 | |
American Electric Power Company, Inc.1 | | | 3,249 | | | | 197,279 | |
Public Service Enterprise Group, Inc.1 | | | 4,731 | | | | 195,911 | |
DTE Energy Co.1 | | | 1,888 | | | | 163,067 | |
Xcel Energy, Inc.1 | | | 4,373 | | | | 157,078 | |
Atmos Energy Corp.1 | | | 2,605 | | | | 145,203 | |
AGL Resources, Inc.1 | | | 1,768 | | | | 96,374 | |
UGI Corp.1 | | | 1,864 | | | | 70,795 | |
Alliant Energy Corp.1 | | | 501 | | | | 33,276 | |
| Total Utilities | | | | | | | 3,689,711 | |
| | | | | | | | | |
| INDUSTRIAL - 2.9% | |
Republic Services, Inc. — Class A1 | | | 4,922 | | | | 198,111 | |
Sonoco Products Co.1 | | | 4,420 | | | | 193,155 | |
FedEx Corp.1 | | | 1,076 | | | | 186,857 | |
Ryder System, Inc.1 | | | 2,007 | | | | 186,350 | |
AMERCO1 | | | 646 | | | | 183,631 | |
GATX Corp.1 | | | 2,963 | | | | 170,491 | |
Caterpillar, Inc.1 | | | 1,816 | | | | 166,218 | |
Corning, Inc.1 | | | 6,976 | | | | 159,959 | |
Energizer Holdings, Inc.1 | | | 1,242 | | | | 159,672 | |
Dover Corp.1 | | | 2,127 | | | | 152,547 | |
Northrop Grumman Corp.1 | | | 1,027 | | | | 151,369 | |
Trinity Industries, Inc.1 | | | 4,898 | | | | 137,193 | |
Exelis, Inc.1 | | | 7,598 | | | | 133,193 | |
Alliant Techsystems, Inc.1 | | | 1,123 | | | | 130,549 | |
General Electric Co.1 | | | 4,373 | | | | 110,506 | |
Timken Co.1 | | | 2,222 | | | | 94,835 | |
Packaging Corporation of America1 | | | 1,147 | | | | 89,523 | |
Arrow Electronics, Inc.*,1 | | | 1,362 | | | | 78,846 | |
CSX Corp.1 | | | 1,648 | | | | 59,707 | |
| Garmin Ltd. | | | 812 | | | | 42,898 | |
Raytheon Co.1 | | | 358 | | | | 38,725 | |
Snap-on, Inc.1 | | | 191 | | | | 26,117 | |
Huntington Ingalls Industries, Inc.1 | | | 191 | | | | 21,480 | |
Norfolk Southern Corp.1 | | | 120 | | | | 13,153 | |
PerkinElmer, Inc.1 | | | 120 | | | | 5,248 | |
SPX Corp.1 | | | 48 | | | | 4,124 | |
Vishay Intertechnology, Inc.1 | | | 238 | | | | 3,368 | |
General Dynamics Corp.1 | | | 24 | | | | 3,303 | |
ITT Corp.1 | | | 72 | | | | 2,913 | |
| Total Industrial | | | | | | | 2,904,041 | |
| | | | | | | | | |
| GATHERING & PROCESSING - 0.4% | |
| Atlas Pipeline Partners, LP | | | 14,838 | | | | 404,484 | |
| | | | | | | | | |
| DIVERSIFIED - 0.3% | |
| Restaurant Brands International, Inc.* | | | 8,744 | | | | 341,367 | |
| | | | | | | | | |
| Total Common Stocks | | | | | | | | |
| (Cost $54,631,820) | | | | | | | 60,132,710 | |
| | | | | | | | | |
CLOSED-END FUNDS† - 14.6% | |
Cohen & Steers REIT and Preferred Income Fund, Inc.1 | | | 29,266 | | | | 555,762 | |
AllianzGI Equity & Convertible Income Fund1 | | | 26,297 | | | | 543,822 | |
Adams Express Co.1 | | | 38,366 | | | | 524,848 | |
| 18 | THE GUGGENHEIM FUNDS ANNUAL REPORT | SEE NOTES TO FINANCIAL STATEMENTS. |
CONSOLIDATED SCHEDULE OF INVESTMENTS (continued) | December 31, 2014 |
| MULTI-HEDGE STRATEGIES FUND | |
| | | Shares | | | Value | |
| | | | | | | | | |
Western Asset/Claymore Inflation-Linked Opportunities & Income Fund1,2,3 | | | 42,994 | | | $ | 485,833 | |
Nuveen Dividend Advantage Municipal Income Fund1 | | | 29,006 | | | | 409,275 | |
Nuveen Maryland Premium Income Municipal Fund1 | | | 31,217 | | | | 394,895 | |
Alpine Total Dynamic Dividend Fund1 | | | 46,227 | | | | 392,467 | |
BlackRock Enhanced Equity Dividend Trust1 | | | 46,007 | | | | 373,578 | |
Gabelli Healthcare & WellnessRx Trust1 | | | 34,995 | | | | 364,649 | |
Tri-Continental Corp.1 | | | 16,527 | | | | 353,843 | |
BlackRock Core Bond Trust1 | | | 26,503 | | | | 349,839 | |
Morgan Stanley Emerging Markets Debt Fund, Inc.1 | | | 38,416 | | | | 349,201 | |
Western Asset/Claymore Inflation-Linked Securities & Income Fund1,3 | | | 28,621 | | | | 332,004 | |
GDL Fund1 | | | 28,773 | | | | 294,348 | |
General American Investors Company, Inc.1 | | | 8,131 | | | | 284,585 | |
Zweig Total Return Fund, Inc.1 | | | 19,794 | | | | 277,314 | |
BlackRock Credit Allocation Income Trust1 | | | 19,837 | | | | 256,294 | |
Swiss Helvetia Fund, Inc.1 | | | 22,252 | | | | 247,887 | |
Clough Global Opportunities Fund1 | | | 17,603 | | | | 225,670 | |
Neuberger Berman Real Estate Securities Income Fund, Inc.1 | | | 40,537 | | | | 214,441 | |
BlackRock Resources & Commodities Strategy Trust1 | | | 20,190 | | | | 196,044 | |
Clough Global Allocation Fund1 | | | 13,038 | | | | 192,441 | |
First Trust High Income Long/Short Fund1 | | | 11,584 | | | | 185,343 | |
Petroleum & Resources Corp.1 | | | 7,691 | | | | 183,353 | |
Advent Claymore Convertible Securities and Income Fund II1,3 | | | 27,025 | | | | 170,258 | |
BlackRock MuniYield Michigan Quality Fund II, Inc.1 | | | 12,262 | | | | 157,689 | |
Duff & Phelps Global Utility Income Fund, Inc.1 | | | 7,151 | | | | 154,747 | |
Madison Covered Call & Equity Strategy Fund1 | | | 18,832 | | | | 153,292 | |
Western Asset Worldwide Income Fund, Inc.1 | | | 11,879 | | | | 135,539 | |
First Trust Enhanced Equity Income Fund1 | | | 8,919 | | | | 127,898 | |
Cohen & Steers Infrastructure Fund, Inc.1 | | | 5,610 | | | | 127,459 | |
Morgan Stanley Income Securities, Inc.1 | | | 6,723 | | | | 120,543 | |
Central Securities Corp.1 | | | 4,995 | | | | 109,489 | |
Ellsworth Fund Ltd.1 | | | 12,425 | | | | 108,222 | |
Western Asset High Yield Defined Opportunity Fund, Inc.1 | | | 6,787 | | | | 107,031 | |
MFS InterMarket Income Trust I1 | | | 12,819 | | | | 106,782 | |
MFS Multimarket Income Trust1 | | | 16,107 | | | | 104,695 | |
Putnam High Income Securities Fund1,2 | | | 12,831 | | | | 104,059 | |
Boulder Total Return Fund, Inc.1 | | | 3,724 | | | | 103,267 | |
Bancroft Fund Ltd.1 | | | 5,140 | | | | 103,108 | |
Zweig Fund, Inc.1 | | | 6,564 | | | | 101,479 | |
Morgan Stanley India Investment Fund, Inc.1 | | | 3,722 | | | | 100,010 | |
New Ireland Fund, Inc.1 | | | 7,889 | | | | 99,559 | |
Eaton Vance Tax-Advantaged Dividend Income Fund1 | | | 4,497 | | | | 93,538 | |
Franklin Limited Duration Income Trust1 | | | 7,159 | | | | 87,268 | |
| SEE NOTES TO FINANCIAL STATEMENTS. | THE GUGGENHEIM FUNDS ANNUAL REPORT | 19 |
CONSOLIDATED SCHEDULE OF INVESTMENTS (continued) | December 31, 2014 |
| MULTI-HEDGE STRATEGIES FUND | |
| | | Shares | | | Value | |
| | | | | | | | | |
LMP Real Estate Income Fund, Inc.1 | | | 6,951 | | | $ | 87,235 | |
Cohen & Steers Quality Income Realty Fund, Inc.1 | | | 7,131 | | | | 86,927 | |
First Trust Aberdeen Global Opportunity Income Fund1 | | | 7,156 | | | | 86,158 | |
RMR Real Estate Income Fund1 | | | 3,998 | | | | 83,238 | |
John Hancock Premium Dividend Fund1 | | | 6,029 | | | | 82,899 | |
China Fund, Inc.1 | | | 4,542 | | | | 82,801 | |
CBRE Clarion Global Real Estate Income Fund1 | | | 9,163 | | | | 82,375 | |
Nuveen New Jersey Dividend Advantage Municipal Fund1 | | | 6,097 | | | | 82,188 | |
Brookfield Global Listed Infrastructure Income Fund, Inc.1 | | | 3,892 | | | | 81,304 | |
Cohen & Steers Closed-End Opportunity Fund, Inc.1 | | | 6,097 | | | | 80,176 | |
Korea Equity Fund, Inc.1 | | | 10,366 | | | | 79,818 | |
Japan Smaller Capitalization Fund, Inc.1 | | | 8,839 | | | | 79,286 | |
MFS Charter Income Trust1 | | | 8,537 | | | | 78,455 | |
Boulder Growth & Income Fund, Inc.1 | | | 8,654 | | | | 78,319 | |
BlackRock Corporate High Yield Fund, Inc.1 | | | 6,640 | | | | 75,696 | |
Liberty All Star Equity Fund1 | | | 12,634 | | | | 75,551 | |
Western Asset Global Corporate Defined Opportunity Fund, Inc.1 | | | 4,093 | | | | 72,774 | |
Templeton Dragon Fund, Inc.1 | | | 2,978 | | | | 71,591 | |
Central Europe Russia and Turkey Fund, Inc.1 | | | 3,581 | | | | 70,832 | |
Gabelli Dividend & Income Trust1 | | | 3,261 | | | | 70,633 | |
Tortoise Energy Independence Fund, Inc.1 | | | 3,656 | | | | 69,281 | |
Cushing Renaissance Fund1 | | | 3,125 | | | | 66,625 | |
AllianceBernstein Income Fund, Inc.1 | | | 8,909 | | | | 66,550 | |
Delaware Investments National Municipal Income Fund1 | | | 5,003 | | | | 65,339 | |
Wells Fargo Advantage Multi-Sector Income Fund1 | | | 4,784 | | | | 65,206 | |
Voya Natural Resources Equity Income Fund1 | | | 7,843 | | | | 65,018 | |
BlackRock Multi-Sector Income Trust1 | | | 3,867 | | | | 64,850 | |
Morgan Stanley Asia-Pacific Fund, Inc.1 | | | 4,131 | | | | 61,345 | |
Western Asset Emerging Markets Income Fund, Inc.1 | | | 5,495 | | | | 60,170 | |
Royce Value Trust, Inc.1 | | | 4,192 | | | | 60,071 | |
Lazard Global Total Return and Income Fund, Inc.1 | | | 3,778 | | | | 59,730 | |
Ivy High Income Opportunities Fund1 | | | 3,751 | | | | 59,491 | |
Korea Fund, Inc.1 | | | 1,526 | | | | 57,256 | |
Strategic Global Income Fund, Inc.1 | | | 6,389 | | | | 54,179 | |
Clough Global Equity Fund1 | | | 3,675 | | | | 53,214 | |
Asia Tigers Fund, Inc.1 | | | 4,644 | | | | 51,688 | |
Royce Micro-Capital Trust, Inc.1 | | | 4,981 | | | | 50,208 | |
Macquarie Global Infrastructure Total Return Fund, Inc.1 | | | 2,022 | | | | 49,984 | |
Western Asset Emerging Markets Debt Fund, Inc.1 | | | 3,152 | | | | 49,676 | |
Nuveen Diversified Dividend & Income Fund1 | | | 3,859 | | | | 45,420 | |
Deutsche Global High Income Fund, Inc.1 | | | 5,758 | | | | 45,200 | |
| 20 | THE GUGGENHEIM FUNDS ANNUAL REPORT | SEE NOTES TO FINANCIAL STATEMENTS. |
CONSOLIDATED SCHEDULE OF INVESTMENTS (continued) | December 31, 2014 |
| MULTI-HEDGE STRATEGIES FUND | |
| | | Shares | | | Value | |
| | | | | | | | | |
Delaware Enhanced Global Dividend & Income Fund1 | | | 3,974 | | | $ | 44,787 | |
Global High Income Fund, Inc.1 | | | 5,023 | | | | 44,303 | |
Nuveen Build America Bond Opportunity Fund1 | | | 1,993 | | | | 43,746 | |
Source Capital, Inc.1 | | | 592 | | | | 42,700 | |
Gabelli Global Utility & Income Trust1 | | | 2,140 | | | | 41,516 | |
Nuveen S&P 500 Dynamic Overwrite Fund1 | | | 2,842 | | | | 40,641 | |
Cohen & Steers Total Return Realty Fund, Inc.1 | | | 3,052 | | | | 40,286 | |
LMP Capital and Income Fund, Inc.1 | | | 2,346 | | | | 39,319 | |
Virtus Global Multi-Sector Income Fund1 | | | 2,412 | | | | 38,230 | |
New America High Income Fund, Inc.1 | | | 4,150 | | | | 37,101 | |
First Trust Intermediate Duration Preferred & Income Fund1 | | | 1,622 | | | | 36,836 | |
First Trust Dividend and Income Fund1 | | | 3,869 | | | | 35,827 | |
Nuveen Build America Bond Fund1 | | | 1,631 | | | | 34,545 | |
Advent/Claymore Enhanced Growth & Income Fund1,3 | | | 3,863 | | | | 34,381 | |
India Fund, Inc.1 | | | 1,310 | | | | 33,811 | |
First Opportunity Fund, Inc.1 | | | 3,444 | | | | 32,890 | |
Aberdeen Greater China Fund, Inc.1 | | | 3,173 | | | | 31,477 | |
Alpine Global Dynamic Dividend Fund1 | | | 3,182 | | | | 31,311 | |
John Hancock Income Securities Trust1 | | | 2,074 | | | | 29,637 | |
Blackstone / GSO Strategic Credit Fund1 | | | 1,731 | | | | 28,527 | |
BlackRock Debt Strategies Fund, Inc.1 | | | 7,592 | | | | 28,242 | |
Royce Focus Trust, Inc.1 | | | 3,557 | | | | 25,859 | |
Nuveen Multi-Market Income Fund1 | | | 3,331 | | | | 25,549 | |
BlackRock Global Opportunities Equity Trust1 | | | 1,921 | | | | 25,223 | |
European Equity Fund, Inc.1 | | | 3,075 | | | | 25,215 | |
Cohen & Steers Limited Duration Preferred and Income Fund, Inc.1 | | | 1,021 | | | | 23,136 | |
Madison Strategic Sector Premium Fund1 | | | 1,898 | | | | 22,605 | |
First Trust Aberdeen Emerging Opportunity Fund1 | | | 1,337 | | | | 21,994 | |
Delaware Investments Dividend & Income Fund, Inc.1 | | | 2,182 | | | | 21,493 | |
Asia Pacific Fund, Inc.*,1 | | | 1,898 | | | | 21,390 | |
Aberdeen Singapore Fund, Inc.1 | | | 1,738 | | | | 20,717 | |
Nuveen Global Equity Income Fund1 | | | 1,570 | | | | 20,426 | |
Nuveen S&P 500 Buy-Write Income Fund1 | | | 1,635 | | | | 19,800 | |
New Germany Fund, Inc.1 | | | 1,405 | | | | 19,684 | |
MFS Intermediate High Income Fund1 | | | 7,331 | | | | 19,427 | |
Fort Dearborn Income Securities, Inc.1 | | | 1,333 | | | | 18,875 | |
BlackRock Utility and Infrastructure Trust1 | | | 892 | | | | 18,500 | |
Nuveen Tax-Advantaged Dividend Growth Fund1 | | | 1,029 | | | | 16,618 | |
Nuveen Pennsylvania Investment Quality Municipal Fund1 | | | 986 | | | | 13,538 | |
Managed High Yield Plus Fund, Inc.1 | | | 7,327 | | | | 13,189 | |
Mexico Equity & Income Fund, Inc.1 | | | 937 | | | | 11,666 | |
Nuveen Credit Strategies Income Fund1 | | | 1,309 | | | | 11,480 | |
Aberdeen Latin America Equity Fund, Inc.1 | | | 509 | | | | 11,402 | |
| SEE NOTES TO FINANCIAL STATEMENTS. | THE GUGGENHEIM FUNDS ANNUAL REPORT | 21 |
CONSOLIDATED SCHEDULE OF INVESTMENTS (continued) | December 31, 2014 |
| MULTI-HEDGE STRATEGIES FUND | |
| | | Shares | | | Value | |
| | | | | | | | | |
Morgan Stanley Emerging Markets Fund, Inc.1 | | | 754 | | | $ | 10,971 | |
Transamerica Income Shares, Inc. — Class E1 | | | 506 | | | | 10,231 | |
Deutsche Strategic Income Trust1 | | | 830 | | | | 9,595 | |
Western Asset Income Fund1 | | | 664 | | | | 8,931 | |
JPMorgan China Region Fund, Inc.1 | | | 492 | | | | 8,310 | |
Denali Fund, Inc.1 | | | 355 | | | | 7,899 | |
Aberdeen Emerging Markets Smaller Company Opportunities Fund, Inc.1 | | | 526 | | | | 6,880 | |
Neuberger Berman High Yield Strategies Fund, Inc.1 | | | 553 | | | | 6,802 | |
Latin American Discovery Fund, Inc.1 | | | 544 | | | | 6,066 | |
Invesco Bond Fund1 | | | 242 | | | | 4,453 | |
BlackRock Income Trust, Inc.1 | | | 685 | | | | 4,384 | |
Taiwan Fund, Inc.1 | | | 219 | | | | 3,581 | |
Montgomery Street Income Securities, Inc.1 | | | 182 | | | | 2,988 | |
Deutsche High Income Trust1 | | | 327 | | | | 2,858 | |
Cutwater Select Income Fund1 | | | 76 | | | | 1,470 | |
Diversified Real Asset Income Fund1 | | | 84 | | | | 1,457 | |
Calamos Global Dynamic Income Fund1 | | | 156 | | | | 1,440 | |
| Total Closed-End Funds | | | | | | | | |
| (Cost $14,008,716) | | | | | | | 14,568,640 | |
| | | | | | | | | |
MUTUAL FUNDS†,3 - 0.0% | |
| Guggenheim Strategy Fund I | | | 788 | | | | 19,578 | |
| Guggenheim Strategy Fund II | | | 235 | | | | 5,833 | |
| Total Mutual Funds | | | | | | | | |
| (Cost $25,489) | | | | | | | 25,411 | |
| | | | | | | | | |
| | | Face
Amount | | | | |
| | | | | | | | | |
REPURCHASE AGREEMENTS††,4 - 18.3% | |
HSBC Group
issued 12/31/14 at 0.02%
due 01/02/15 | | $ | 11,842,089 | | | | 11,842,089 | |
RBC Capital Markets
issued 12/31/14 at 0.03%
due 01/02/15 | | | 6,397,604 | | | | 6,397,604 | |
| Total Repurchase Agreements | | | | | | | | |
| (Cost $18,239,693) | | | | | | | 18,239,693 | |
| | | | | | | | | |
SECURITIES LENDING COLLATERAL††,5 - 0.2% | |
| Repurchase Agreements | | | | | | | | |
HSBC Securities, Inc.
issued 12/31/14 at 0.06%
due 01/02/15 | | | 124,751 | | | | 124,751 | |
BNP Paribas Securities Corp.
issued 12/31/14 at 0.06%
due 01/02/15 | | | 50,420 | | | | 50,420 | |
Barclays Capital, Inc.
issued 12/31/14 at 0.05%
due 01/02/15 | | | 23,910 | | | | 23,910 | |
| Total Securities Lending Collateral | | | | | | | | |
| (Cost $199,081) | | | | | | | 199,081 | |
| | | | | | | | | |
| Total Investments - 93.3% | | | | | | | | |
| (Cost $87,104,799) | | | | | | $ | 93,165,535 | |
| 22 | THE GUGGENHEIM FUNDS ANNUAL REPORT | SEE NOTES TO FINANCIAL STATEMENTS. |
CONSOLIDATED SCHEDULE OF INVESTMENTS (continued) | December 31, 2014 |
| MULTI-HEDGE STRATEGIES FUND | |
| | | Shares | | | Value | |
| | | | | | | | | |
COMMON STOCKS SOLD SHORT† - (37.3)% | |
| | | | | | | | | |
| DIVERSIFIED - (0.4)% | |
| Restaurant Brands International, LP* | | | 87 | | | $ | (3,287 | ) |
| Leucadia National Corp. | | | 3,900 | | | | (87,438 | ) |
| Restaurant Brands International, Inc.* | | | 8,657 | | | | (337,952 | ) |
| Total Diversified | | | | | | | (428,677 | ) |
| | | | | | | | | |
| BASIC MATERIALS - (1.6)% | |
| Compass Minerals International, Inc. | | | 48 | | | | (4,168 | ) |
| Carpenter Technology Corp. | | | 95 | | | | (4,679 | ) |
| Tahoe Resources, Inc. | | | 1,220 | | | | (16,921 | ) |
| Airgas, Inc. | | | 192 | | | | (22,115 | ) |
| Sherwin-Williams Co. | | | 143 | | | | (37,615 | ) |
| PPG Industries, Inc. | | | 192 | | | | (44,381 | ) |
| Newmont Mining Corp. | | | 3,565 | | | | (67,379 | ) |
| Southern Copper Corp. | | | 2,847 | | | | (80,285 | ) |
| Ecolab, Inc. | | | 813 | | | | (84,975 | ) |
| Monsanto Co. | | | 718 | | | | (85,779 | ) |
| Praxair, Inc. | | | 718 | | | | (93,024 | ) |
| FMC Corp. | | | 1,675 | | | | (95,525 | ) |
| EI du Pont de Nemours & Co. | | | 1,292 | | | | (95,530 | ) |
| Allegheny Technologies, Inc. | | | 2,751 | | | | (95,652 | ) |
| WR Grace & Co.* | | | 1,005 | | | | (95,867 | ) |
| Valspar Corp. | | | 1,125 | | | | (97,290 | ) |
| Albemarle Corp. | | | 8,824 | | | | (530,587 | ) |
| Total Basic Materials | | | | | | | (1,551,772 | ) |
| | | | | | | | | |
| UTILITIES - (1.6)% | |
| NRG Energy, Inc. | | | 359 | | | | (9,675 | ) |
| American Water Works Company, Inc. | | | 215 | | | | (11,460 | ) |
| Exelon Corp. | | | 933 | | | | (34,596 | ) |
| PG&E Corp. | | | 1,340 | | | | (71,342 | ) |
| MDU Resources Group, Inc. | | | 3,724 | | | | (87,514 | ) |
| Calpine Corp.* | | | 4,163 | | | | (92,127 | ) |
| PPL Corp. | | | 2,560 | | | | (93,005 | ) |
| CenterPoint Energy, Inc. | | | 3,971 | | | | (93,041 | ) |
| OGE Energy Corp. | | | 2,632 | | | | (93,383 | ) |
| Sempra Energy | | | 861 | | | | (95,881 | ) |
| National Fuel Gas Co. | | | 1,388 | | | | (96,508 | ) |
| Aqua America, Inc. | | | 3,678 | | | | (98,202 | ) |
| NextEra Energy, Inc. | | | 933 | | | | (99,169 | ) |
| ITC Holdings Corp. | | | 2,464 | | | | (99,620 | ) |
| Dominion Resources, Inc. | | | 1,308 | | | | (100,585 | ) |
| Southern Co. | | | 2,057 | | | | (101,019 | ) |
| TECO Energy, Inc. | | | 4,952 | | | | (101,466 | ) |
| Questar Corp. | | | 4,018 | | | | (101,575 | ) |
| FirstEnergy Corp. | | | 2,655 | | | | (103,518 | ) |
| Total Utilities | | | | | | | (1,583,686 | ) |
| | | | | | | | | |
| ENERGY - (2.4)% | |
| Continental Resources, Inc.* | | | 48 | | | | (1,841 | ) |
| Amec Foster Wheeler plc ADR | | | 593 | | | | (7,673 | ) |
| Southwestern Energy Co.* | | | 310 | | | | (8,460 | ) |
| Williams Companies, Inc. | | | 335 | | | | (15,055 | ) |
| Frank’s International N.V. | | | 1,052 | | | | (17,495 | ) |
| Laredo Petroleum, Inc.* | | | 1,795 | | | | (18,578 | ) |
| WPX Energy, Inc.* | | | 2,225 | | | | (25,877 | ) |
| RPC, Inc. | | | 2,512 | | | | (32,756 | ) |
| Gulfport Energy Corp.* | | | 1,077 | | | | (44,954 | ) |
| MRC Global, Inc.* | | | 3,086 | | | | (46,753 | ) |
| Cheniere Energy, Inc.* | | | 790 | | | | (55,616 | ) |
| Concho Resources, Inc.* | | | 574 | | | | (57,257 | ) |
| Peabody Energy Corp. | | | 7,560 | | | | (58,514 | ) |
| Range Resources Corp. | | | 1,363 | | | | (72,852 | ) |
| Antero Resources Corp.* | | | 1,818 | | | | (73,774 | ) |
| Kosmos Energy Ltd.* | | | 8,947 | | | | (75,065 | ) |
| Cobalt International Energy, Inc.* | | | 8,756 | | | | (77,841 | ) |
| Dril-Quip, Inc.* | | | 1,028 | | | | (78,878 | ) |
| CONSOL Energy, Inc. | | | 2,345 | | | | (79,285 | ) |
| Oceaneering International, Inc. | | | 1,363 | | | | (80,158 | ) |
| FMC Technologies, Inc.* | | | 1,722 | | | | (80,659 | ) |
| Pioneer Natural Resources Co. | | | 550 | | | | (81,868 | ) |
| SEE NOTES TO FINANCIAL STATEMENTS. | THE GUGGENHEIM FUNDS ANNUAL REPORT | 23 |
CONSOLIDATED SCHEDULE OF INVESTMENTS (continued) | December 31, 2014 |
| MULTI-HEDGE STRATEGIES FUND | |
| | | Shares | | | Value | |
| | | | | | | | | |
| Cabot Oil & Gas Corp. — Class A | | | 2,775 | | | $ | (82,168 | ) |
| Targa Resources Partners, LP | | | 8,674 | | | | (415,312 | ) |
| Halliburton Co. | | | 21,644 | | | | (851,259 | ) |
| Total Energy | | | | | | | (2,439,948 | ) |
| | | | | | | | | |
| INDUSTRIAL - (3.0)% | |
| Hexcel Corp.* | | | 167 | | | | (6,929 | ) |
| Fortune Brands Home & Security, Inc. | | | 192 | | | | (8,692 | ) |
| Vulcan Materials Co. | | | 143 | | | | (9,399 | ) |
| USG Corp.* | | | 360 | | | | (10,076 | ) |
| Roper Industries, Inc. | | | 72 | | | | (11,257 | ) |
| Tyco International plc | | | 263 | | | | (11,535 | ) |
| Teekay Corp. | | | 263 | | | | (13,384 | ) |
| Babcock & Wilcox Co. | | | 478 | | | | (14,483 | ) |
| Waste Management, Inc. | | | 287 | | | | (14,729 | ) |
| Clean Harbors, Inc.* | | | 359 | | | | (17,250 | ) |
| Martin Marietta Materials, Inc. | | | 167 | | | | (18,423 | ) |
| Genesee & Wyoming, Inc. — Class A* | | | 215 | | | | (19,333 | ) |
| Wabtec Corp. | | | 240 | | | | (20,854 | ) |
| KLX, Inc.* | | | 622 | | | | (25,658 | ) |
| Lincoln Electric Holdings, Inc. | | | 383 | | | | (26,461 | ) |
| Rockwell Collins, Inc. | | | 359 | | | | (30,328 | ) |
| Xylem, Inc. | | | 1,005 | | | | (38,260 | ) |
| Jacobs Engineering Group, Inc.* | | | 861 | | | | (38,478 | ) |
| Triumph Group, Inc. | | | 574 | | | | (38,584 | ) |
| Colfax Corp.* | | | 790 | | | | (40,740 | ) |
| Acuity Brands, Inc. | | | 311 | | | | (43,562 | ) |
| Waters Corp.* | | | 407 | | | | (45,877 | ) |
| Emerson Electric Co. | | | 790 | | | | (48,767 | ) |
| Chicago Bridge & Iron Company N.V. | | | 1,172 | | | | (49,201 | ) |
| Eagle Materials, Inc. | | | 837 | | | | (63,638 | ) |
| Manitowoc Company, Inc. | | | 2,943 | | | | (65,040 | ) |
| Donaldson Company, Inc. | | | 1,698 | | | | (65,594 | ) |
| B/E Aerospace, Inc.* | | | 1,244 | | | | (72,177 | ) |
| KBR, Inc. | | | 4,808 | | | | (81,496 | ) |
| Jabil Circuit, Inc. | | | 3,828 | | | | (83,565 | ) |
| SunPower Corp. — Class A* | | | 3,301 | | | | (85,265 | ) |
| Armstrong World Industries, Inc.* | | | 1,698 | | | | (86,802 | ) |
| Landstar System, Inc. | | | 1,212 | | | | (87,906 | ) |
| Graco, Inc. | | | 1,100 | | | | (88,198 | ) |
| SBA Communications Corp. — Class A* | | | 813 | | | | (90,047 | ) |
| Trimble Navigation Ltd.* | | | 3,421 | | | | (90,793 | ) |
| National Instruments Corp. | | | 2,966 | | | | (92,213 | ) |
| Nordson Corp. | | | 1,196 | | | | (93,240 | ) |
| Boeing Co. | | | 718 | | | | (93,326 | ) |
| Kansas City Southern | | | 765 | | | | (93,353 | ) |
| TransDigm Group, Inc. | | | 478 | | | | (93,855 | ) |
| Mettler-Toledo International, Inc.* | | | 311 | | | | (94,065 | ) |
| AptarGroup, Inc. | | | 1,435 | | | | (95,915 | ) |
| Expeditors International of Washington, Inc. | | | 2,153 | | | | (96,045 | ) |
| Stericycle, Inc.* | | | 742 | | | | (97,261 | ) |
| United Parcel Service, Inc. — Class B | | | 885 | | | | (98,385 | ) |
| CH Robinson Worldwide, Inc. | | | 1,315 | | | | (98,480 | ) |
| J.B. Hunt Transport Services, Inc. | | | 1,172 | | | | (98,741 | ) |
| Pall Corp. | | | 1,005 | | | | (101,716 | ) |
| Middleby Corp.* | | | 1,028 | | | | (101,875 | ) |
| Sealed Air Corp. | | | 2,464 | | | | (104,548 | ) |
| Total Industrial | | | | | | | (3,015,799 | ) |
| | | | | | | | | |
| CONSUMER, CYCLICAL - (3.2)% | |
| Domino’s Pizza, Inc. | | | 48 | | | | (4,520 | ) |
| Kate Spade & Co.* | | | 215 | | | | (6,882 | ) |
| Coach, Inc. | | | 215 | | | | (8,075 | ) |
| Taylor Morrison Home Corp. — Class A* | | | 527 | | | | (9,955 | ) |
| Hasbro, Inc. | | | 215 | | | | (11,823 | ) |
| World Fuel Services Corp. | | | 263 | | | | (12,343 | ) |
| Sally Beauty Holdings, Inc.* | | | 430 | | | | (13,218 | ) |
| McDonald’s Corp. | | | 167 | | | | (15,648 | ) |
| Spirit Airlines, Inc.* | | | 311 | | | | (23,505 | ) |
| Mattel, Inc. | | | 790 | | | | (24,446 | ) |
| 24 | THE GUGGENHEIM FUNDS ANNUAL REPORT | SEE NOTES TO FINANCIAL STATEMENTS. |
CONSOLIDATED SCHEDULE OF INVESTMENTS (continued) | December 31, 2014 |
| MULTI-HEDGE STRATEGIES FUND | |
| | | Shares | | | Value | |
| | | | | | | | | |
| BorgWarner, Inc. | | | 455 | | | $ | (25,002 | ) |
| Dollar General Corp.* | | | 478 | | | | (33,795 | ) |
| Ross Stores, Inc. | | | 383 | | | | (36,102 | ) |
| MSC Industrial Direct Company, Inc. — Class A | | | 455 | | | | (36,969 | ) |
| Scotts Miracle-Gro Co. — Class A | | | 598 | | | | (37,267 | ) |
| Rite Aid Corp.* | | | 5,071 | | | | (38,134 | ) |
| Cabela’s, Inc.* | | | 765 | | | | (40,323 | ) |
| Delta Air Lines, Inc. | | | 1,028 | | | | (50,567 | ) |
| L Brands, Inc. | | | 598 | | | | (51,757 | ) |
| DSW, Inc. — Class A | | | 1,435 | | | | (53,526 | ) |
| SeaWorld Entertainment, Inc. | | | 3,301 | | | | (59,088 | ) |
| Tesla Motors, Inc.* | | | 335 | | | | (74,507 | ) |
| Ralph Lauren Corp. — Class A | | | 407 | | | | (75,360 | ) |
| United Continental Holdings, Inc.* | | | 1,196 | | | | (80,001 | ) |
| Yum! Brands, Inc. | | | 1,148 | | | | (83,632 | ) |
| Tupperware Brands Corp. | | | 1,340 | | | | (84,420 | ) |
| Dunkin’ Brands Group, Inc. | | | 2,010 | | | | (85,727 | ) |
| Navistar International Corp.* | | | 2,608 | | | | (87,316 | ) |
| WW Grainger, Inc. | | | 343 | | | | (87,427 | ) |
| Tempur Sealy International, Inc.* | | | 1,603 | | | | (88,021 | ) |
| Toll Brothers, Inc.* | | | 2,583 | | | | (88,519 | ) |
| PVH Corp. | | | 693 | | | | (88,822 | ) |
| Target Corp. | | | 1,172 | | | | (88,967 | ) |
| Toro Co. | | | 1,435 | | | | (91,568 | ) |
| DreamWorks Animation SKG, Inc. — Class A* | | | 4,163 | | | | (92,960 | ) |
| LKQ Corp.* | | | 3,325 | | | | (93,499 | ) |
| Ulta Salon Cosmetics & Fragrance, Inc.* | | | 742 | | | | (94,857 | ) |
| Costco Wholesale Corp. | | | 670 | | | | (94,972 | ) |
| HD Supply Holdings, Inc.* | | | 3,253 | | | | (95,931 | ) |
| Choice Hotels International, Inc. | | | 1,746 | | | | (97,811 | ) |
| Tractor Supply Co. | | | 1,244 | | | | (98,052 | ) |
| Starbucks Corp. | | | 1,196 | | | | (98,132 | ) |
| Fastenal Co. | | | 2,081 | | | | (98,973 | ) |
| Panera Bread Co. — Class A* | | | 574 | | | | (100,335 | ) |
| GNC Holdings, Inc. — Class A | | | 2,153 | | | | (101,105 | ) |
| Goodyear Tire & Rubber Co. | | | 3,540 | | | | (101,138 | ) |
| Copart, Inc.* | | | 2,798 | | | | (102,099 | ) |
| CarMax, Inc.* | | | 1,698 | | | | (113,053 | ) |
| Lions Gate Entertainment Corp. | | | 3,764 | | | | (120,523 | ) |
| Total Consumer, Cyclical | | | | | | | (3,200,672 | ) |
| | | | | | | | | |
| TECHNOLOGY - (4.6)% | |
| salesforce.com, Inc.* | | | 95 | | | | (5,634 | ) |
| Accenture plc — Class A | | | 72 | | | | (6,430 | ) |
| Red Hat, Inc.* | | | 95 | | | | (6,568 | ) |
| Teradata Corp.* | | | 167 | | | | (7,295 | ) |
| International Business Machines Corp. | | | 48 | | | | (7,701 | ) |
| Jack Henry & Associates, Inc. | | | 143 | | | | (8,886 | ) |
| Solera Holdings, Inc. | | | 239 | | | | (12,232 | ) |
| VeriFone Systems, Inc.* | | | 598 | | | | (22,246 | ) |
| Veeva Systems, Inc. — Class A* | | | 957 | | | | (25,274 | ) |
| Linear Technology Corp. | | | 574 | | | | (26,174 | ) |
| IHS, Inc. — Class A* | | | 263 | | | | (29,950 | ) |
| SunEdison, Inc.* | | | 1,578 | | | | (30,787 | ) |
| athenahealth, Inc.* | | | 263 | | | | (38,319 | ) |
| Diebold, Inc. | | | 1,148 | | | | (39,767 | ) |
| Genpact Ltd.* | | | 2,583 | | | | (48,896 | ) |
| Informatica Corp.* | | | 1,340 | | | | (51,101 | ) |
| Allscripts Healthcare Solutions, Inc.* | | | 4,091 | | | | (52,242 | ) |
| Freescale Semiconductor Ltd.* | | | 2,655 | | | | (66,986 | ) |
| Cree, Inc.* | | | 2,201 | | | | (70,916 | ) |
| Stratasys Ltd.* | | | 909 | | | | (75,547 | ) |
| Rackspace Hosting, Inc.* | | | 1,675 | | | | (78,407 | ) |
| Workday, Inc. — Class A* | | | 1,028 | | | | (83,895 | ) |
| Zynga, Inc. — Class A* | | | 32,008 | | | | (85,141 | ) |
| Altera Corp. | | | 2,392 | | | | (88,360 | ) |
| SEE NOTES TO FINANCIAL STATEMENTS. | THE GUGGENHEIM FUNDS ANNUAL REPORT | 25 |
CONSOLIDATED SCHEDULE OF INVESTMENTS (continued) | December 31, 2014 |
| MULTI-HEDGE STRATEGIES FUND | |
| | | Shares | | | Value | |
| | | | | | | | | |
| Nuance Communications, Inc.* | | | 6,220 | | | $ | (88,759 | ) |
| SolarWinds, Inc.* | | | 1,795 | | | | (89,445 | ) |
| MSCI, Inc. — Class A | | | 1,962 | | | | (93,077 | ) |
| Paychex, Inc. | | | 2,033 | | | | (93,864 | ) |
| NCR Corp.* | | | 3,253 | | | | (94,792 | ) |
| Atmel Corp.* | | | 11,315 | | | | (94,989 | ) |
| Tableau Software, Inc. — Class A* | | | 1,148 | | | | (97,304 | ) |
| IPG Photonics Corp.* | | | 1,315 | | | | (98,520 | ) |
| NetSuite, Inc.* | | | 909 | | | | (99,236 | ) |
| ServiceNow, Inc.* | | | 1,507 | | | | (102,251 | ) |
| Leidos Holdings, Inc. | | | 2,392 | | | | (104,100 | ) |
| Applied Materials, Inc. | | | 43,739 | | | | (1,089,977 | ) |
| Cypress Semiconductor Corp. | | | 101,811 | | | | (1,453,862 | ) |
| Total Technology | | | | | | | (4,568,930 | ) |
| | | | | | | | | |
| COMMUNICATIONS - (4.7)% | |
| United States Cellular Corp.* | | | 335 | | | | (13,343 | ) |
| Alliance Data Systems Corp.* | | | 72 | | | | (20,596 | ) |
| CenturyLink, Inc. | | | 550 | | | | (21,769 | ) |
| DISH Network Corp. — Class A* | | | 311 | | | | (22,669 | ) |
| Charter Communications, Inc. — Class A* | | | 167 | | | | (27,826 | ) |
| Clear Channel Outdoor Holdings, Inc. — Class A | | | 2,798 | | | | (29,631 | ) |
| Verizon Communications, Inc. | | | 742 | | | | (34,711 | ) |
| HomeAway, Inc.* | | | 1,698 | | | | (50,566 | ) |
| Pandora Media, Inc.* | | | 3,421 | | | | (60,996 | ) |
| Netflix, Inc.* | | | 192 | | | | (65,589 | ) |
| Palo Alto Networks, Inc.* | | | 550 | | | | (67,413 | ) |
| Level 3 Communications, Inc.* | | | 1,389 | | | | (68,589 | ) |
| Discovery Communications, Inc. — Class A* | | | 2,416 | | | | (83,231 | ) |
| Splunk, Inc.* | | | 1,435 | | | | (84,593 | ) |
| Amazon.com, Inc.* | | | 287 | | | | (89,070 | ) |
| Motorola Solutions, Inc. | | | 1,460 | | | | (97,937 | ) |
| LinkedIn Corp. — Class A* | | | 430 | | | | (98,775 | ) |
| JDS Uniphase Corp.* | | | 7,201 | | | | (98,798 | ) |
| AMC Networks, Inc. — Class A* | | | 1,555 | | | | (99,162 | ) |
| Groupon, Inc. — Class A* | | | 12,894 | | | | (106,504 | ) |
| AT&T, Inc. | | | 15,000 | | | | (503,850 | ) |
| Zillow, Inc. — Class A* | | | 6,636 | | | | (702,686 | ) |
| Comcast Corp. — Class A | | | 39,197 | | | | (2,273,818 | ) |
| Total Communications | | | | | | | (4,722,122 | ) |
| | | | | | | | | |
| CONSUMER, NON-CYCLICAL - (7.0)% | |
| Medivation, Inc.* | | | 24 | | | | (2,391 | ) |
| Intercept Pharmaceuticals, Inc.* | | | 24 | | | | (3,744 | ) |
| Keurig Green Mountain, Inc. | | | 48 | | | | (6,355 | ) |
| Coty, Inc. — Class A* | | | 311 | | | | (6,425 | ) |
| ConAgra Foods, Inc. | | | 215 | | | | (7,800 | ) |
| Robert Half International, Inc. | | | 143 | | | | (8,348 | ) |
| Alnylam Pharmaceuticals, Inc.* | | | 95 | | | | (9,215 | ) |
| Clorox Co. | | | 95 | | | | (9,900 | ) |
| Moody’s Corp. | | | 120 | | | | (11,497 | ) |
| H&R Block, Inc. | | | 360 | | | | (12,125 | ) |
| Altria Group, Inc. | | | 263 | | | | (12,958 | ) |
| PepsiCo, Inc. | | | 167 | | | | (15,792 | ) |
| Kellogg Co. | | | 263 | | | | (17,211 | ) |
| Western Union Co. | | | 1,077 | | | | (19,289 | ) |
| Kraft Foods Group, Inc. | | | 311 | | | | (19,487 | ) |
| FleetCor Technologies, Inc.* | | | 215 | | | | (31,973 | ) |
| Bruker Corp.* | | | 1,938 | | | | (38,024 | ) |
| WhiteWave Foods Co. — Class A* | | | 1,100 | | | | (38,489 | ) |
| Incyte Corp.* | | | 574 | | | | (41,965 | ) |
| Gartner, Inc.* | | | 527 | | | | (44,379 | ) |
| Sysco Corp. | | | 1,244 | | | | (49,374 | ) |
| Kindred Healthcare, Inc. | | | 2,987 | | | | (54,304 | ) |
| CoStar Group, Inc.* | | | 311 | | | | (57,109 | ) |
| Intuitive Surgical, Inc.* | | | 120 | | | | (63,473 | ) |
| Hain Celestial Group, Inc.* | | | 1,100 | | | | (64,119 | ) |
| Bunge Ltd. | | | 718 | | | | (65,273 | ) |
| 26 | THE GUGGENHEIM FUNDS ANNUAL REPORT | SEE NOTES TO FINANCIAL STATEMENTS. |
CONSOLIDATED SCHEDULE OF INVESTMENTS (continued) | December 31, 2014 |
| MULTI-HEDGE STRATEGIES FUND | |
| | | Shares | | | Value | |
| | | | | | | | | |
| Avon Products, Inc. | | | 7,176 | | | $ | (67,383 | ) |
| Catamaran Corp.* | | | 1,315 | | | | (68,051 | ) |
| Vertex Pharmaceuticals, Inc.* | | | 598 | | | | (71,042 | ) |
| Estee Lauder Companies, Inc. — Class A | | | 957 | | | | (72,923 | ) |
| Pharmacyclics, Inc.* | | | 670 | | | | (81,914 | ) |
| Seattle Genetics, Inc.* | | | 2,583 | | | | (82,992 | ) |
| Brown-Forman Corp. — Class B | | | 993 | | | | (87,225 | ) |
| Hertz Global Holdings, Inc.* | | | 3,517 | | | | (87,714 | ) |
| Tenet Healthcare Corp.* | | | 1,746 | | | | (88,470 | ) |
| Philip Morris International, Inc. | | | 1,100 | | | | (89,595 | ) |
| Morningstar, Inc. | | | 1,412 | | | | (91,371 | ) |
| McGraw Hill Financial, Inc. | | | 1,028 | | | | (91,471 | ) |
| Coca-Cola Co. | | | 2,177 | | | | (91,913 | ) |
| Zoetis, Inc. | | | 2,153 | | | | (92,644 | ) |
| Automatic Data Processing, Inc. | | | 1,125 | | | | (93,791 | ) |
| Flowers Foods, Inc. | | | 4,916 | | | | (94,338 | ) |
| Campbell Soup Co. | | | 2,153 | | | | (94,732 | ) |
| Align Technology, Inc.* | | | 1,698 | | | | (94,935 | ) |
| AmerisourceBergen Corp. — Class A | | | 1,053 | | | | (94,938 | ) |
| Monster Beverage Corp.* | | | 885 | | | | (95,890 | ) |
| Bristol-Myers Squibb Co. | | | 1,627 | | | | (96,042 | ) |
| Mead Johnson Nutrition Co. — Class A | | | 957 | | | | (96,216 | ) |
| Premier, Inc. — Class A* | | | 2,870 | | | | (96,231 | ) |
| Hologic, Inc.* | | | 3,612 | | | | (96,585 | ) |
| Patterson Companies, Inc. | | | 2,010 | | | | (96,681 | ) |
| MasterCard, Inc. — Class A | | | 1,125 | | | | (96,931 | ) |
| Colgate-Palmolive Co. | | | 1,403 | | | | (97,074 | ) |
| Rollins, Inc. | | | 2,943 | | | | (97,413 | ) |
| McCormick & Company, Inc. | | | 1,315 | | | | (97,705 | ) |
| Verisk Analytics, Inc. — Class A* | | | 1,531 | | | | (98,060 | ) |
| BioMarin Pharmaceutical, Inc.* | | | 1,100 | | | | (99,440 | ) |
| Whole Foods Market, Inc. | | | 1,985 | | | | (100,084 | ) |
| Hershey Co. | | | 981 | | | | (101,955 | ) |
| Sprouts Farmers Market, Inc.* | | | 3,015 | | | | (102,450 | ) |
| Wright Medical Group, Inc.* | | | 6,760 | | | | (181,641 | ) |
| Becton Dickinson and Co. | | | 2,607 | | | | (362,790 | ) |
| Actavis plc* | | | 1,516 | | | | (390,234 | ) |
| Reynolds American, Inc. | | | 6,762 | | | | (434,594 | ) |
| Laboratory Corporation of America Holdings* | | | 5,378 | | | | (580,286 | ) |
| Medtronic, Inc. | | | 16,472 | | | | (1,189,277 | ) |
| Total Consumer, Non-cyclical | | | | | | | (6,956,040 | ) |
| | | | | | | | | |
| FINANCIAL - (8.8)% | |
| Mid-America Apartment Communities, Inc. | | | 24 | | | | (1,792 | ) |
| PacWest Bancorp | | | 72 | | | | (3,273 | ) |
| DDR Corp. | | | 192 | | | | (3,525 | ) |
| First Niagara Financial Group, Inc. | | | 454 | | | | (3,827 | ) |
| Macerich Co. | | | 48 | | | | (4,004 | ) |
| Prologis, Inc. | | | 96 | | | | (4,131 | ) |
| Charles Schwab Corp. | | | 143 | | | | (4,317 | ) |
| Tanger Factory Outlet Centers, Inc. | | | 120 | | | | (4,435 | ) |
| Chubb Corp. | | | 48 | | | | (4,967 | ) |
| Weingarten Realty Investors | | | 143 | | | | (4,994 | ) |
| Lamar Advertising Co. — Class A | | | 95 | | | | (5,096 | ) |
| Liberty Property Trust | | | 143 | | | | (5,381 | ) |
| American Realty Capital Properties, Inc. | | | 645 | | | | (5,837 | ) |
| Rayonier, Inc. | | | 263 | | | | (7,348 | ) |
| Prudential Financial, Inc. | | | 95 | | | | (8,594 | ) |
| American Campus Communities, Inc. | | | 240 | | | | (9,926 | ) |
| Apartment Investment & Management Co. — Class A | | | 335 | | | | (12,445 | ) |
| Waddell & Reed Financial, Inc. — Class A | | | 287 | | | | (14,298 | ) |
| CBL & Associates Properties, Inc. | | | 742 | | | | (14,410 | ) |
| SEE NOTES TO FINANCIAL STATEMENTS. | THE GUGGENHEIM FUNDS ANNUAL REPORT | 27 |
CONSOLIDATED SCHEDULE OF INVESTMENTS (continued) | December 31, 2014 |
| MULTI-HEDGE STRATEGIES FUND | |
| | | Shares | | | Value | |
| | | | | | | | | |
| Crown Castle International Corp. | | | 215 | | | $ | (16,921 | ) |
| Realogy Holdings Corp.* | | | 407 | | | | (18,107 | ) |
| WP Carey, Inc. | | | 263 | | | | (18,437 | ) |
| AvalonBay Communities, Inc. | | | 120 | | | | (19,608 | ) |
| Ocwen Financial Corp.* | | | 1,842 | | | | (27,814 | ) |
| T. Rowe Price Group, Inc. | | | 430 | | | | (36,920 | ) |
| Kilroy Realty Corp. | | | 550 | | | | (37,989 | ) |
| LPL Financial Holdings, Inc. | | | 957 | | | | (42,634 | ) |
| Markel Corp.* | | | 72 | | | | (49,164 | ) |
| Visa, Inc. — Class A | | | 215 | | | | (56,373 | ) |
| American Tower Corp. — Class A | | | 598 | | | | (59,112 | ) |
| TFS Financial Corp. | | | 4,235 | | | | (63,038 | ) |
| MBIA, Inc.* | | | 7,416 | | | | (70,749 | ) |
| Aflac, Inc. | | | 1,363 | | | | (83,265 | ) |
| Cullen/Frost Bankers, Inc. | | | 1,196 | | | | (84,485 | ) |
| BOK Financial Corp. | | | 1,412 | | | | (84,776 | ) |
| Genworth Financial, Inc. — Class A* | | | 10,311 | | | | (87,644 | ) |
| Bank of Hawaii Corp. | | | 1,483 | | | | (87,957 | ) |
| BankUnited, Inc. | | | 3,062 | | | | (88,706 | ) |
| TD Ameritrade Holding Corp. | | | 2,512 | | | | (89,880 | ) |
| White Mountains Insurance Group Ltd. | | | 143 | | | | (90,106 | ) |
| Commerce Bancshares, Inc. | | | 2,117 | | | | (92,087 | ) |
| Old Republic International Corp. | | | 6,340 | | | | (92,754 | ) |
| Eaton Vance Corp. | | | 2,273 | | | | (93,034 | ) |
| Zions Bancorporation | | | 3,277 | | | | (93,427 | ) |
| Sterling Bancorp | | | 6,500 | | | | (93,470 | ) |
| Loews Corp. | | | 2,225 | | | | (93,495 | ) |
| Intercontinental Exchange, Inc. | | | 430 | | | | (94,295 | ) |
| Arthur J Gallagher & Co. | | | 2,010 | | | | (94,631 | ) |
| ProAssurance Corp. | | | 2,105 | | | | (95,041 | ) |
| Piedmont Office Realty Trust, Inc. — Class A | | | 5,048 | | | | (95,104 | ) |
| Forest City Enterprises, Inc. — Class A* | | | 4,473 | | | | (95,275 | ) |
| Progressive Corp. | | | 3,540 | | | | (95,544 | ) |
| Realty Income Corp. | | | 2,010 | | | | (95,897 | ) |
| Simon Property Group, Inc. | | | 527 | | | | (95,972 | ) |
| Washington Prime Group, Inc. | | | 5,577 | | | | (96,036 | ) |
| Duke Realty Corp. | | | 4,760 | | | | (96,152 | ) |
| Affiliated Managers Group, Inc.* | | | 455 | | | | (96,569 | ) |
| Cincinnati Financial Corp. | | | 1,866 | | | | (96,715 | ) |
| Senior Housing Properties Trust | | | 4,378 | | | | (96,798 | ) |
| HCP, Inc. | | | 2,201 | | | | (96,910 | ) |
| Marsh & McLennan Companies, Inc. | | | 1,698 | | | | (97,194 | ) |
| First Republic Bank | | | 1,866 | | | | (97,256 | ) |
| Aon plc | | | 1,028 | | | | (97,485 | ) |
| State Street Corp. | | | 1,244 | | | | (97,654 | ) |
| American Express Co. | | | 1,053 | | | | (97,971 | ) |
| Brown & Brown, Inc. | | | 2,998 | | | | (98,664 | ) |
| Plum Creek Timber Company, Inc. | | | 2,320 | | | | (99,273 | ) |
| Health Care REIT, Inc. | | | 1,315 | | | | (99,506 | ) |
| CBOE Holdings, Inc. | | | 1,627 | | | | (103,184 | ) |
| Healthcare Trust of America, Inc. — Class A | | | 3,852 | | | | (103,759 | ) |
| BB&T Corp. | | | 20,942 | | | | (814,435 | ) |
| Omega Healthcare Investors, Inc. | | | 22,351 | | | | (873,254 | ) |
| Ventas, Inc. | | | 15,736 | | | | (1,128,271 | ) |
| M&T Bank Corp. | | | 13,931 | | | | (1,750,012 | ) |
| Total Financial | | | | | | | (8,793,409 | ) |
| | | | | | | | |
| Total Common Stock Sold Short | | | | | | | | |
| (Proceeds $35,884,086) | | | | | | | (37,261,055 | ) |
| | | | | | | | | |
EXCHANGE-TRADED FUNDS SOLD SHORT† - (12.4)% | |
| Market Vectors Gold Miners ETF | | | 2,265 | | | | (41,631 | ) |
| SPDR S&P Regional Banking ETF | | | 1,396 | | | | (56,817 | ) |
| iShares MSCI Australia ETF | | | 2,605 | | | | (57,753 | ) |
| iShares MSCI Mexico Capped ETF | | | 1,297 | | | | (77,029 | ) |
| iShares MSCI Malaysia ETF | | | 6,413 | | | | (86,447 | ) |
| 28 | THE GUGGENHEIM FUNDS ANNUAL REPORT | SEE NOTES TO FINANCIAL STATEMENTS. |
CONSOLIDATED SCHEDULE OF INVESTMENTS (continued) | December 31, 2014 |
| MULTI-HEDGE STRATEGIES FUND | |
| | | Shares | | | Value | |
| | | | | | | | | |
| iShares MSCI Taiwan ETF | | | 5,868 | | | $ | (88,665 | ) |
| iShares MSCI Hong Kong ETF | | | 5,570 | | | | (114,408 | ) |
| iShares iBoxx $ Investment Grade Corporate Bond ETF | | | 1,007 | | | | (120,246 | ) |
| iShares China Large-Capital ETF | | | 3,066 | | | | (127,607 | ) |
| iShares MSCI South Korea Capped ETF | | | 2,616 | | | | (144,665 | ) |
| iShares MSCI Japan ETF | | | 13,604 | | | | (152,909 | ) |
| Powershares QQQ Trust Series 1 | | | 1,522 | | | | (157,147 | ) |
| iShares MSCI EAFE ETF | | | 3,045 | | | | (185,258 | ) |
| iShares MSCI Canada ETF | | | 7,055 | | | | (203,607 | ) |
| iShares MSCI Emerging Markets ETF | | | 5,850 | | | | (229,847 | ) |
| iShares MSCI United Kingdom ETF | | | 13,292 | | | | (239,655 | ) |
| iShares Core U.S. Aggregate Bond ETF | | | 2,454 | | | | (270,234 | ) |
| iShares 20+ Year Treasury Bond ETF | | | 2,402 | | | | (302,460 | ) |
| iShares TIPS Bond ETF | | | 3,509 | | | | (393,043 | ) |
| iShares MSCI Switzerland Capped ETF | | | 15,763 | | | | (499,529 | ) |
| iShares 7-10 Year Treasury Bond ETF | | | 4,713 | | | | (499,531 | ) |
| iShares Russell 2000 ETF | | | 5,013 | | | | (599,906 | ) |
| iShares US Real Estate ETF | | | 13,386 | | | | (1,028,579 | ) |
| iShares Russell 1000 Value ETF | | | 12,844 | | | | (1,340,913 | ) |
| SPDR Barclays High Yield Bond ETF | | | 47,429 | | | | (1,831,233 | ) |
| SPDR S&P 500 ETF Trust | | | 16,992 | | | | (3,491,855 | ) |
| Total Exchange-Traded Funds Sold Short | |
| (Proceeds $11,222,326) | | | | | | | (12,340,974 | ) |
| | |
| Total Securities Sold Short- (49.7)% | |
| (Proceeds $47,106,412) | | | | | | $ | (49,602,029 | ) |
| Other Assets & Liabilities, net - 56.4% | | | | | | | 56,299,254 | |
| Total Net Assets - 100.0% | | | | | | $ | 99,862,760 | |
| | | | | | | | | |
| | | Contracts | | | Unrealized
Gain | |
| | | | | | | | | |
INTEREST RATE FUTURES CONTRACTS PURCHASED† | |
March 2015 Euro - Bund
Futures Contracts††
(Aggregate Value of
Contracts $7,925,286) | | | 42 | | | $ | 153,635 | |
March 2015 Japanese Government 10 Year Bond
Futures Contracts††
(Aggregate Value of
Contracts $23,449,171) | | | 19 | | | | 110,448 | |
March 2015 U.S. Treasury Long Bond
Futures Contracts
(Aggregate Value of
Contracts $3,901,500) | | | 27 | | | | 98,738 | |
March 2015 Euro - Bobl
Futures Contracts††
(Aggregate Value of
Contracts $11,047,014) | | | 70 | | | | 83,137 | |
March 2015 U.S. Treasury Ultra Long Bond
Futures Contracts
(Aggregate Value of
Contracts $1,651,250) | | | 10 | | | | 57,098 | |
March 2015 Australian Government 10 Year Bond
Futures Contracts††
(Aggregate Value of
Contracts $3,034,749) | | | 29 | | | | 40,830 | |
March 2015 U.S. Treasury 10 Year Note
Futures Contracts
(Aggregate Value of
Contracts $20,270,000) | | | 160 | | | | 29,248 | |
March 2015 Canadian Government 10 Year Bond
Futures Contracts††
(Aggregate Value of
Contracts $1,906,146) | | | 16 | | | | 24,381 | |
March 2015 Australian Government 3 Year Bond
Futures Contracts††
(Aggregate Value of
Contracts $4,634,244) | | | 51 | | | | 18,233 | |
| SEE NOTES TO FINANCIAL STATEMENTS. | THE GUGGENHEIM FUNDS ANNUAL REPORT | 29 |
CONSOLIDATED SCHEDULE OF INVESTMENTS (continued) | December 31, 2014 |
| MULTI-HEDGE STRATEGIES FUND | |
| | | Contracts | | | Unrealized
Gain (Loss) | |
| | | | | | | | | |
March 2015 Long Gilt
Futures Contracts††
(Aggregate Value of
Contracts $745,008) | | | 4 | | | $ | 16,810 | |
March 2015 Euro - Schatz
Futures Contracts††
(Aggregate Value of
Contracts $6,991,226) | | | 52 | | | | 12,038 | |
March 2015 U.S. Treasury 5 Year Note
Futures Contracts
(Aggregate Value of
Contracts $594,336) | | | 5 | | | | (528 | ) |
| (Total Aggregate Value of Contracts $86,149,930) | | | | | | $ | 644,068 | |
| | | | | | | | | |
EQUITY FUTURES CONTRACTS PURCHASED† | |
March 2015 CBOE Volatility Index
Futures Contracts
(Aggregate Value of
Contracts $2,520,800) | | | 137 | | | $ | 160,850 | |
January 2015 Amsterdam Index
Futures Contracts††
(Aggregate Value of
Contracts $1,219,735) | | | 12 | | | | 61,564 | |
May 2015 CBOE Volatility Index
Futures Contracts
(Aggregate Value of
Contracts $627,000) | | | 33 | | | | 37,080 | |
January 2015 H-Shares Index
Futures Contracts††
(Aggregate Value of
Contracts $462,015) | | | 6 | | | | 18,822 | |
March 2015 SPI 200 Index
Futures Contracts††
(Aggregate Value of
Contracts $434,666) | | | 4 | | | | 16,502 | |
March 2015 S&P MidCap 400 Index
Mini Futures Contracts
(Aggregate Value of
Contracts $1,449,000) | | | 10 | | | | 9,862 | |
January 2015 MSCI Taiwan Stock Index
Futures Contracts
(Aggregate Value of
Contracts $787,221) | | | 23 | | | | 4,828 | |
January 2015 IBEX 35 Index
Futures Contracts††
(Aggregate Value of
Contracts $245,789) | | | 2 | | | | 4,332 | |
March 2015 Dow Jones Industrial Average Index
Mini Futures Contracts
(Aggregate Value of
Contracts $1,509,005) | | | 17 | | | | 3,958 | |
March 2015 FTSE 100 Index
Futures Contracts††
(Aggregate Value of
Contracts $502,518) | | | 5 | | | | 138 | |
March 2015 Nikkei 225 (OSE) Index
Futures Contracts††
(Aggregate Value of
Contracts $574,631) | | | 4 | | | | (2,863 | ) |
March 2015 S&P 500 Index
Mini Futures Contracts
(Aggregate Value of
Contracts $2,052,000) | | | 20 | | | | (5,204 | ) |
March 2015 Topix Index
Futures Contracts††
(Aggregate Value of
Contracts $695,978) | | | 6 | | | | (6,458 | ) |
March 2015 NASDAQ-100 Index
Mini Futures Contracts
(Aggregate Value of
Contracts $1,608,635) | | | 19 | | | | (19,691 | ) |
| (Total Aggregate Value of Contracts $14,688,993) | | | | | | $ | 283,720 | |
| 30 | THE GUGGENHEIM FUNDS ANNUAL REPORT | SEE NOTES TO FINANCIAL STATEMENTS. |
CONSOLIDATED SCHEDULE OF INVESTMENTS (continued) | December 31, 2014 |
| MULTI-HEDGE STRATEGIES FUND | |
| | | Contracts | | | Unrealized
Gain (Loss) | |
| | | | | | | | | |
COMMODITY FUTURES CONTRACTS PURCHASED† | |
February 2015 Gold 100 oz.
Futures Contracts
(Aggregate Value of
Contracts $354,810) | | | 3 | | | $ | 5,687 | |
March 2015 Wheat
Futures Contracts
(Aggregate Value of
Contracts $265,500) | | | 9 | | | | 2,028 | |
February 2015 LME Zinc
Futures Contracts
(Aggregate Value of
Contracts $161,869) | | | 3 | | | | (1,427 | ) |
March 2015 Soybean
Futures Contracts
(Aggregate Value of
Contracts $306,900) | | | 6 | | | | (4,579 | ) |
March 2015 Coffee ‘C’
Futures Contracts
(Aggregate Value of
Contracts $189,338) | | | 3 | | | | (22,353 | ) |
February 2015 Live Cattle
Futures Contracts
(Aggregate Value of
Contracts $1,650,750) | | | 25 | | | | (43,575 | ) |
| (Total Aggregate Value of Contracts $2,929,167) | | | | | | $ | (64,219 | ) |
| | | | | | | | | |
COMMODITY FUTURES CONTRACTS SOLD SHORT† | |
March 2015 Sugar #11
Futures Contracts
(Aggregate Value of
Contracts $1,257,379) | | | 77 | | | $ | 145,781 | |
February 2015 Gas Oil
Futures Contracts
(Aggregate Value of
Contracts $1,341,250) | | | 25 | | | | 140,351 | |
March 2015 Brent Crude
Futures Contracts
(Aggregate Value of
Contracts $701,520) | | | 12 | | | | 81,642 | |
February 2015 Natural Gas
Futures Contracts
(Aggregate Value of
Contracts $321,200) | | | 11 | | | | 78,711 | |
February 2015 LME Primary Aluminum
Futures Contracts
(Aggregate Value of
Contracts $685,725) | | | 15 | | | | 24,343 | |
March 2015 Silver
Futures Contracts
(Aggregate Value of
Contracts $313,800) | | | 4 | | | | 17,438 | |
March 2015 Copper
Futures Contracts
(Aggregate Value of
Contracts $423,750) | | | 6 | | �� | | 13,743 | |
February 2015 Lean Hogs
Futures Contracts
(Aggregate Value of
Contracts $324,300) | | | 10 | | | | 10,398 | |
March 2015 Hard Red Winter Wheat
Futures Contracts
(Aggregate Value of
Contracts $345,675) | | | 11 | | | | 4,803 | |
March 2015 Cotton #2
Futures Contracts
(Aggregate Value of
Contracts $391,625) | | | 13 | | | | 965 | |
February 2015 LME Lead
Futures Contracts
(Aggregate Value of
Contracts $46,126) | | | 1 | | | | 779 | |
February 2015 LME Nickel
Futures Contracts
(Aggregate Value of
Contracts $90,145) | | | 1 | | | | (58 | ) |
March 2015 Corn
Futures Contracts
(Aggregate Value of
Contracts $158,900) | | | 8 | | | | (1,743 | ) |
| SEE NOTES TO FINANCIAL STATEMENTS. | THE GUGGENHEIM FUNDS ANNUAL REPORT | 31 |
CONSOLIDATED SCHEDULE OF INVESTMENTS (continued) | December 31, 2014 |
| MULTI-HEDGE STRATEGIES FUND | |
| | | Contracts | | | Unrealized
Gain (Loss) | |
| | | | | | | | | |
February 2015 New York Harbor Ultra-Low Sulfur Diesel
Futures Contracts
(Aggregate Value of
Contracts $155,686) | | | 2 | | | $ | (2,321 | ) |
| (Total Aggregate Value of Contracts $6,557,081) | | | | | | $ | 514,832 | |
| | | | | | | | | |
INTEREST RATE FUTURES CONTRACTS SOLD SHORT† | |
March 2015 U.S. Treasury 2 Year Note
Futures Contracts
(Aggregate Value of
Contracts $73,005,094) | | | 334 | | | $ | 141,111 | |
| | | | | | | | | |
CURRENCY FUTURES CONTRACTS SOLD SHORT† | |
March 2015 Euro FX
Futures Contracts
(Aggregate Value of
Contracts $1,967,550) | | | 13 | | | $ | 29,304 | |
March 2015 Swiss Franc
Futures Contracts
(Aggregate Value of
Contracts $755,400) | | | 6 | | | | 18,443 | |
March 2015 Canadian Dollar
Futures Contracts
(Aggregate Value of
Contracts $1,374,880) | | | 16 | | | | 15,124 | |
March 2015 Japanese Yen
Futures Contracts
(Aggregate Value of
Contracts $3,446,025) | | | 33 | | | | 7,129 | |
March 2015 Australian Dollar
Futures Contracts
(Aggregate Value of
Contracts $243,660) | | | 3 | | | | 7 | |
March 2015 British Pound
Futures Contracts
(Aggregate Value of
Contracts $876,094) | | | 9 | | | | (482 | ) |
| (Total Aggregate Value of Contracts $8,663,609) | | | | | | $ | 69,525 | |
| | | | | | | | | |
EQUITY FUTURES CONTRACTS SOLD SHORT† | |
February 2015 CBOE Volatility Index
Futures Contracts
(Aggregate Value of
Contracts $2,117,000) | | | 116 | | | $ | 52,279 | |
January 2015 Hang Seng Index
Futures Contracts††
(Aggregate Value of
Contracts $303,784) | | | 2 | | | | 3,179 | |
April 2015 CBOE Volatility Index
Futures Contracts
(Aggregate Value of
Contracts $299,200) | | | 16 | | | | (937 | ) |
June 2015 CBOE Volatility Index
Futures Contracts
(Aggregate Value of
Contracts $345,420) | | | 18 | | | | (3,120 | ) |
March 2015 Russell 2000 Index
Mini Futures Contracts
(Aggregate Value of
Contracts $360,390) | | | 3 | | | | (6,245 | ) |
January 2015 CAC40 10 Euro Index
Futures Contracts††
(Aggregate Value of
Contracts $460,309) | | | 9 | | | | (12,981 | ) |
| (Total Aggregate Value of Contracts $3,886,103) | | | | | | $ | 32,175 | |
| 32 | THE GUGGENHEIM FUNDS ANNUAL REPORT | SEE NOTES TO FINANCIAL STATEMENTS. |
CONSOLIDATED SCHEDULE OF INVESTMENTS (continued) | December 31, 2014 |
| MULTI-HEDGE STRATEGIES FUND | |
| | | Units | | | Unrealized
Gain | |
| | | | | | | | | |
OTC EQUITY INDEX SWAP AGREEMENTS†† | |
Goldman Sachs International
March 2015 Goldman Sachs Multi-Hedge Strategies
Long Index Swap,
Terminating 03/09/156
(Notional Value $15,897,505) | | | 121,355 | | | $ | 160,365 | |
Goldman Sachs International
March 2015 Goldman Sachs Multi-Hedge Strategies
Short Index Swap,
Terminating 03/09/157
(Notional Value $4,950,236) | | | 41,866 | | | $ | 76,763 | |
CENTRALLY CLEARED CREDIT DEFAULT SWAP AGREEMENT PROTECTION PURCHASED†† | |
| Index | Counterparty | | | | Maturity
Date | | Notional
Principal | | | Notional
Value | | | Upfront
Premiums
Paid | | | Unrealized
Appreciation | |
| CDX.EM-22 Index | Barclays Bank plc | | | 1.00 | % | 12/20/19 | | $ | 1,850,000 | | | $ | 1,659,448 | | | $ | 134,388 | | | $ | 60,876 | |
| SEE NOTES TO FINANCIAL STATEMENTS. | THE GUGGENHEIM FUNDS ANNUAL REPORT | 33 |
CONSOLIDATED SCHEDULE OF INVESTMENTS (concluded) | December 31, 2014 |
| MULTI-HEDGE STRATEGIES FUND | |
SECTOR DIVERSIFICATION
Goldman Sachs Multi-Hedge Strategies Short Index Swap7
| Sector | % of Index |
| Energy | 37.4% |
| Financials | 17.9% |
| Industrials | 16.5% |
| Consumer Discretionary | 6.8% |
| Communications | 5.7% |
| Materials | 5.4% |
| Consumer Staples | 3.7% |
| Health Care | 3.0% |
| Technology | 1.8% |
| Utilities | 1.8% |
| Total | 100.0% |
Goldman Sachs Multi-Hedge Strategies Long Index Swap6
| Sector | % of Index |
| Health Care | 24.4% |
| Consumer Discretionary | 16.9% |
| Consumer Staples | 13.6% |
| Technology | 11.7% |
| Financials | 11.2% |
| Utilities | 8.4% |
| Industrials | 6.9% |
| Communications | 3.4% |
| Materials | 2.9% |
| Energy | 0.6% |
| Total | 100.0% |
| * | Non-income producing security. |
| † | Value determined based on Level 1 inputs, unless otherwise noted — See Note 4. |
| †† | Value determined based on Level 2 inputs — See Note 4. |
| 1 | All or a portion of this security is pledged as short security collateral at December 31, 2014. |
| 2 | All or a portion of this security is on loan at December 31, 2014 — See Note 6. |
| 3 | Investment in a product that is managed by and/or pays a management fee to a party related to the Adviser — See Note 11. |
| 4 | Repurchase Agreements — See Note 5. |
| 5 | Securities lending collateral — See Note 6. |
| 6 | Customized basket of 198 exchange-traded equity securities. Total return based on Goldman-Sachs Multi-Hedge Strategies Long Index +/- financing at a variable rate. |
| 7 | Customized basket of 124 exchange-traded equity securities. Total return based on Goldman-Sachs Multi-Hedge Strategies Short Index +/- financing at a variable rate. |
| | ADR — American Depositary Receipt |
| | plc — Public Limited Company |
| | REIT — Real Estate Investment Trust |
| 34 | THE GUGGENHEIM FUNDS ANNUAL REPORT | SEE NOTES TO FINANCIAL STATEMENTS. |
| CONSOLIDATED STATEMENT OF ASSETS AND LIABILITIES |
| MULTI-HEDGE STRATEGIES FUND | |
December 31, 2014
| Assets: | |
| Investments, at value - including $192,994 of securities loaned (cost $68,666,025) | | $ | 74,726,761 | |
| Repurchase agreements, at value (cost $18,438,774) | | | 18,438,774 | |
| Total investments (cost $87,104,799) | | | 93,165,535 | |
| Foreign currency, at value (cost $113,182) | | | 112,957 | |
| Segregated cash with broker | | | 57,066,472 | |
| Unrealized appreciation on swap agreements | | | 298,004 | |
| Unamortized upfront premiums paid on credit default swaps | | | 134,388 | |
| Receivables: | |
| Securities sold | | | 1,422,195 | |
| Dividends | | | 186,349 | |
| Fund shares sold | | | 20,051 | |
| Variation margin | | | 2,816 | |
| Securities lending income | | | 562 | |
| Foreign taxes reclaim | | | 488 | |
| Interest | | | 12 | |
| Total assets | | | 152,409,829 | |
| | | | | |
| Liabilities: | |
| Securities sold short, at value (proceeds $47,106,412) | | | 49,602,029 | |
| Due to broker | | | 188,786 | |
| Overdraft due to custodian bank | | | 116,525 | |
| Payable for: | |
| Securities purchased | | | 1,998,222 | |
| Fund shares redeemed | | | 223,590 | |
| Upon return of securities loaned | | | 199,600 | |
| Management fees | | | 98,891 | |
| Distribution and service fees | | | 18,341 | |
| Miscellaneous | | | 101,085 | |
| Total liabilities | | | 52,547,069 | |
| Net assets | | $ | 99,862,760 | |
| | | | | |
| Net assets consist of: | |
| Paid in capital | | $ | 142,637,426 | |
| Accumulated net investment loss | | | (2,997,600 | ) |
| Accumulated net realized loss on investments | | | (45,261,225 | ) |
| Net unrealized appreciation on investments | | | 5,484,159 | |
| Net assets | | $ | 99,862,760 | |
| | | | | |
| A-Class: | |
| Net assets | | $ | 11,620,349 | |
| Capital shares outstanding | | | 485,398 | |
| Net asset value per share | | $ | 23.94 | |
| Maximum offering price per share (Net asset value divided by 95.25%) | | $ | 25.13 | |
| | | | | |
| C-Class: | |
| Net assets | | $ | 9,627,327 | |
| Capital shares outstanding | | | 431,920 | |
| Net asset value per share | | $ | 22.29 | |
| | | | | |
| H-Class: | |
| Net assets | | $ | 36,410,980 | |
| Capital shares outstanding | | | 1,519,878 | |
| Net asset value per share | | $ | 23.96 | |
| | | | | |
| Institutional Class: | |
| Net assets | | $ | 42,204,104 | |
| Capital shares outstanding | | | 1,741,228 | |
| Net asset value per share | | $ | 24.24 | |
| SEE NOTES TO FINANCIAL STATEMENTS. | THE GUGGENHEIM FUNDS ANNUAL REPORT | 35 |
| CONSOLIDATED STATEMENT OF OPERATIONS |
| MULTI-HEDGE STRATEGIES FUND |
Year Ended December 31, 2014
| Investment Income: | |
| Dividends (net of foreign withholding tax of $10,308) | | $ | 1,929,301 | |
| Income from securities lending, net | | | 22,496 | |
| Interest | | | 3,830 | |
| Total investment income | | | 1,955,627 | |
| | | | | |
| Expenses: | |
| Management fees | | | 1,331,880 | |
| Distribution and service fees: | | | | |
| A-Class | | | 37,105 | |
| C-Class | | | 105,346 | |
| H-Class | | | 106,379 | |
| Short sales dividend expense | | | 1,170,287 | |
| Prime broker interest expense | | | 402,646 | |
| Trustees’ fees* | | | 10,077 | |
| Custodian fees | | | 242 | |
| Miscellaneous | | | 14,067 | |
| Total expenses | | | 3,178,029 | |
| Less: | |
| Expenses waived by Adviser | | | (55,172 | ) |
| Net expenses | | | 3,122,857 | |
| Net investment loss | | | (1,167,230 | ) |
| | | | | |
| Net Realized and Unrealized Gain (Loss): | |
| Net realized gain (loss) on: | |
| Investments | | $ | 7,377,732 | |
| Realized gain distributions received from investment company shares | | | 302,659 | |
| Swap agreements | | | 704,778 | |
| Futures contracts | | | 3,466,232 | |
| Foreign currency | | | (6,866 | ) |
| Securities sold short | | | (7,840,391 | ) |
| Net realized gain | | | 4,004,144 | |
| Net change in unrealized appreciation (depreciation) on: | |
| Investments | | | (924,363 | ) |
| Securities sold short | | | 2,366,399 | |
| Swap agreements | | | (20,756 | ) |
| Futures contracts | | | 729,539 | |
| Foreign currency | | | (181 | ) |
| Net change in unrealized appreciation (depreciation) | | | 2,150,638 | |
| Net realized and unrealized gain | | | 6,154,782 | |
| Net increase in net assets resulting from operations | | $ | 4,987,552 | |
| * | Relates to Trustees not deemed "interested persons" within the meaning of Section 2(a)(19) of the 1940 Act. |
| 36 | THE GUGGENHEIM FUNDS ANNUAL REPORT | SEE NOTES TO FINANCIAL STATEMENTS. |
| CONSOLIDATED STATEMENTS OF CHANGES IN NET ASSETS |
| MULTI-HEDGE STRATEGIES FUND | |
| | | Year Ended December 31, 2014 | | | Year Ended December 31, 2013 | |
| Increase (Decrease) in Net Assets from Operations: | | | | | | |
| Net investment loss | | $ | (1,167,230 | ) | | $ | (978,021 | ) |
| Net realized gain on investments | | | 4,004,144 | | | | 4,409,208 | |
| Net change in unrealized appreciation (depreciation) on investments | | | 2,150,638 | | | | (1,691,827 | ) |
| Net increase in net assets resulting from operations | | | 4,987,552 | | | | 1,739,360 | |
| | | | | | | | | |
| Distributions to shareholders from: | | | | | | | | |
| Net investment income | | | | | | | | |
| A-Class | | | (88,690 | ) | | | — | |
| C-Class | | | (79,610 | ) | | | — | |
| H-Class | | | (298,563 | ) | | | — | |
| Institutional Class | | | (333,912 | ) | | | — | |
| Total distributions to shareholders | | | (800,775 | ) | | | — | |
| | | | | | | | | |
| Capital share transactions: | | | | | | | | |
| Proceeds from sale of shares | | | | | | | | |
| A-Class | | | 3,310,696 | | | | 6,631,895 | |
| C-Class | | | 593,454 | | | | 7,058,465 | |
| H-Class | | | 10,267,963 | | | | 29,831,781 | |
| Institutional Class | | | 30,581,943 | | | | 12,702,579 | |
| Distributions reinvested | | | | | | | | |
| A-Class | | | 83,254 | | | | — | |
| C-Class | | | 66,457 | | | | — | |
| H-Class | | | 276,480 | | | | — | |
| Institutional Class | | | 333,762 | | | | — | |
| Cost of shares redeemed | | | | | | | | |
| A-Class | | | (10,563,094 | ) | | | (16,377,874 | ) |
| C-Class | | | (4,016,782 | ) | | | (11,244,261 | ) |
| H-Class | | | (26,531,348 | ) | | | (46,597,477 | ) |
| Institutional Class | | | (16,163,978 | ) | | | (1,735,751 | ) |
| Net decrease from capital share transactions | | | (11,761,193 | ) | | | (19,730,643 | ) |
| Net decrease in net assets | | | (7,574,416 | ) | | | (17,991,283 | ) |
| | | | | | | | | |
| Net assets: | | | | | | | | |
| Beginning of year | | | 107,437,176 | | | | 125,428,459 | |
| End of year | | $ | 99,862,760 | | | $ | 107,437,176 | |
| Accumulated net investment loss at end of year | | $ | (2,997,600 | ) | | $ | (1,446,348 | ) |
| SEE NOTES TO FINANCIAL STATEMENTS. | THE GUGGENHEIM FUNDS ANNUAL REPORT | 37 |
CONSOLIDATED STATEMENTS OF CHANGES IN NET ASSETS (concluded) |
| MULTI-HEDGE STRATEGIES FUND | |
| | | Year Ended December 31, 2014 | | | Year Ended December 31, 2013 | |
| Capital share activity: | | | | | | | | |
| Shares sold | | | | | | | | |
| A-Class | | | 142,495 | | | | 289,566 | |
| C-Class | | | 27,363 | | | | 326,236 | |
| H-Class | | | 445,101 | | | | 1,303,395 | |
| Institutional Class | | | 1,321,595 | | | | 550,448 | |
| Shares issued from reinvestment of distributions | | | | | | | | |
| A-Class | | | 3,522 | | | | — | |
| C-Class | | | 3,018 | | | | — | |
| H-Class | | | 11,691 | | | | — | |
| Institutional Class | | | 13,947 | | | | — | |
| Shares redeemed | | | | | | | | |
| A-Class | | | (455,620 | ) | | | (716,106 | ) |
| C-Class | | | (186,245 | ) | | | (520,915 | ) |
| H-Class | | | (1,149,657 | ) | | | (2,035,313 | ) |
| Institutional Class | | | (688,008 | ) | | | (75,298 | ) |
| Net decrease in shares | | | (510,798 | ) | | | (877,987 | ) |
| 38 | THE GUGGENHEIM FUNDS ANNUAL REPORT | SEE NOTES TO FINANCIAL STATEMENTS. |
| CONSOLIDATED FINANCIAL HIGHLIGHTS |
| MULTI-HEDGE STRATEGIES FUND | |
This table is presented to show selected data for a share outstanding throughout each period and to assist shareholders in evaluating a Fund’s performance for the periods presented.
| A-Class | | Year Ended Dec. 31, 2014 | | | Year Ended Dec. 31, 2013 | | | Year Ended Dec. 31, 2012 | | | Year Ended Dec. 31, 2011 | | | Year Ended Dec. 31, 2010 | |
| Per Share Data | | | | | | | | | | | | | | | |
| Net asset value, beginning of period | | $ | 23.03 | | | $ | 22.68 | | | $ | 22.21 | | | $ | 21.66 | | | $ | 20.57 | |
| Income (loss) from investment operations: | |
Net investment income (loss)a | | | (.26 | ) | | | (.18 | ) | | | (.35 | ) | | | (.27 | ) | | | (.40 | ) |
| Net gain (loss) on investments (realized and unrealized) | | | 1.36 | | | | .53 | | | | .82 | | | | .98 | | | | 1.49 | |
| Total from investment operations | | | 1.10 | | | | .35 | | | | .47 | | | | .71 | | | | 1.09 | |
| Less distributions from: | |
| Net investment income | | | (.19 | ) | | | — | | | | — | | | | (.16 | ) | | | — | |
| Total distributions | | | (.19 | ) | | | — | | | | — | | | | (.16 | ) | | | — | |
| Redemption fees collected | | | — | | | | — | | | | — | | | | — | | | | — | b |
| Net asset value, end of period | | $ | 23.94 | | | $ | 23.03 | | | $ | 22.68 | | | $ | 22.21 | | | $ | 21.66 | |
| | |
Total Returnc | | | 4.73 | % | | | 1.54 | % | | | 2.02 | % | | | 3.39 | % | | | 5.30 | % |
| Ratios/Supplemental Data | |
| Net assets, end of period (in thousands) | | $ | 11,620 | | | $ | 18,307 | | | $ | 27,700 | | | $ | 24,832 | | | $ | 14,073 | |
| Ratios to average net assets: | |
| Net investment income (loss) | | | (1.13 | %) | | | (0.79 | %) | | | (1.54 | %) | | | (1.23 | %) | | | (1.97 | %) |
Total expensesd | | | 2.86 | % | | | 2.74 | % | | | 3.09 | % | | | 2.77 | % | | | 3.56 | % |
Net expensese,f | | | 2.81 | % | | | 2.69 | % | | | 3.05 | % | | | 2.65 | % | | | 3.40 | % |
| Portfolio turnover rate | | | 304 | % | | | 302 | % | | | 465 | % | | | 433 | % | | | 993 | % |
| SEE NOTES TO FINANCIAL STATEMENTS. | THE GUGGENHEIM FUNDS ANNUAL REPORT | 39 |
CONSOLIDATED FINANCIAL HIGHLIGHTS (continued) |
| MULTI-HEDGE STRATEGIES FUND |
This table is presented to show selected data for a share outstanding throughout each period and to assist shareholders in evaluating a Fund’s performance for the periods presented.
| C-Class | | Year Ended Dec. 31, 2014 | | | Year Ended Dec. 31, 2013 | | | Year Ended Dec. 31, 2012 | | | Year Ended Dec. 31, 2011 | | | Year Ended Dec. 31, 2010 | |
| Per Share Data | | | | | | | | | | | | | | | |
| Net asset value, beginning of period | | $ | 21.62 | | | $ | 21.45 | | | $ | 21.17 | | | $ | 20.80 | | | $ | 19.90 | |
| Income (loss) from investment operations: | |
Net investment income (loss)a | | | (.40 | ) | | | (.35 | ) | | | (.50 | ) | | | (.42 | ) | | | (.55 | ) |
| Net gain (loss) on investments (realized and unrealized) | | | 1.26 | | | | .52 | | | | .78 | | | | .95 | | | | 1.45 | |
| Total from investment operations | | | .86 | | | | .17 | | | | .28 | | | | .53 | | | | .90 | |
| Less distributions from: | |
| Net investment income | | | (.19 | ) | | | — | | | | — | | | | (.16 | ) | | | — | |
| Total distributions | | | (.19 | ) | | | — | | | | — | | | | (.16 | ) | | | — | |
| Redemption fees collected | | | — | | | | — | | | | — | | | | — | | | | — | b |
| Net asset value, end of period | | $ | 22.29 | | | $ | 21.62 | | | $ | 21.45 | | | $ | 21.17 | | | $ | 20.80 | |
| | |
Total Returnc | | | 3.97 | % | | | 0.79 | % | | | 1.23 | % | | | 2.62 | % | | | 4.52 | % |
| Ratios/Supplemental Data | |
| Net assets, end of period (in thousands) | | $ | 9,627 | | | $ | 12,705 | | | $ | 16,780 | | | $ | 13,322 | | | $ | 15,194 | |
| Ratios to average net assets: | |
| Net investment income (loss) | | | (1.84 | %) | | | (1.60 | %) | | | (2.33 | %) | | | (1.99 | %) | | | (2.79 | %) |
Total expensesd | | | 3.62 | % | | | 3.50 | % | | | 3.85 | % | | | 3.52 | % | | | 4.41 | % |
Net expensese,f | | | 3.57 | % | | | 3.45 | % | | | 3.81 | % | | | 3.39 | % | | | 4.26 | % |
| Portfolio turnover rate | | | 304 | % | | | 302 | % | | | 465 | % | | | 432 | % | | | 993 | % |
| 40 | THE GUGGENHEIM FUNDS ANNUAL REPORT | SEE NOTES TO FINANCIAL STATEMENTS. |
CONSOLIDATED FINANCIAL HIGHLIGHTS (continued) |
| MULTI-HEDGE STRATEGIES FUND |
This table is presented to show selected data for a share outstanding throughout each period and to assist shareholders in evaluating a Fund’s performance for the periods presented.
| H-Class | | Year Ended Dec. 31, 2014 | | | Year Ended Dec. 31, 2013 | | | Year Ended Dec. 31, 2012 | | | Year Ended Dec. 31, 2011 | | | Year Ended Dec. 31, 2010 | |
| Per Share Data | | | | | | | | | | | | | | | |
| Net asset value, beginning of period | | $ | 23.04 | | | $ | 22.69 | | | $ | 22.23 | | | $ | 21.67 | | | $ | 20.58 | |
| Income (loss) from investment operations: | |
Net investment income (loss)a | | | (.25 | ) | | | (.19 | ) | | | (.36 | ) | | | (.27 | ) | | | (.43 | ) |
| Net gain (loss) on investments (realized and unrealized) | | | 1.36 | | | | .54 | | | | .82 | | | | .99 | | | | 1.52 | |
| Total from investment operations | | | 1.11 | | | | .35 | | | | .46 | | | | .72 | | | | 1.09 | |
| Less distributions from: | |
| Net investment income | | | (.19 | ) | | | — | | | | — | | | | (.16 | ) | | | — | |
| Total distributions | | | (.19 | ) | | | — | | | | — | | | | (.16 | ) | | | — | |
| Redemption fees collected | | | — | | | | — | | | | — | | | | — | | | | — | b |
| Net asset value, end of period | | $ | 23.96 | | | $ | 23.04 | | | $ | 22.69 | | | $ | 22.23 | | | $ | 21.67 | |
| | |
Total Returnc | | | 4.77 | % | | | 1.54 | % | | | 2.02 | % | | | 3.39 | % | | | 5.30 | % |
| Ratios/Supplemental Data | |
| Net assets, end of period (in thousands) | | $ | 36,411 | | | $ | 50,990 | | | $ | 66,818 | | | $ | 66,161 | | | $ | 44,421 | |
| Ratios to average net assets: | |
| Net investment income (loss) | | | (1.09 | %) | | | (0.82 | %) | | | (1.59 | %) | | | (1.25 | %) | | | (2.08 | %) |
Total expensesd | | | 2.87 | % | | | 2.75 | % | | | 3.07 | % | | | 2.78 | % | | | 3.69 | % |
Net expensese,f | | | 2.82 | % | | | 2.71 | % | | | 3.03 | % | | | 2.65 | % | | | 3.54 | % |
| Portfolio turnover rate | | | 304 | % | | | 302 | % | | | 465 | % | | | 433 | % | | | 993 | % |
| SEE NOTES TO FINANCIAL STATEMENTS. | THE GUGGENHEIM FUNDS ANNUAL REPORT | 41 |
CONSOLIDATED FINANCIAL HIGHLIGHTS (concluded) |
| MULTI-HEDGE STRATEGIES FUND |
This table is presented to show selected data for a share outstanding throughout each period and to assist shareholders in evaluating a Fund’s performance for the periods presented.
| Institutional Class | | Year Ended Dec. 31, 2014 | | | Year Ended Dec. 31, 2013 | | | Year Ended Dec. 31, 2012 | | | Year Ended Dec. 31, 2011 | | | Period Ended Dec. 31, 2010g | |
| Per Share Data | | | | | | | | | | | | | | | |
| Net asset value, beginning of period | | $ | 23.26 | | | $ | 22.84 | | | $ | 22.32 | | | $ | 21.71 | | | $ | 20.61 | |
| Income (loss) from investment operations: | |
Net investment income (loss)a | | | (.18 | ) | | | (.13 | ) | | | (.33 | ) | | | (.22 | ) | | | (.43 | ) |
| Net gain (loss) on investments (realized and unrealized) | | | 1.35 | | | | .55 | | | | .85 | | | | .99 | | | | 1.53 | |
| Total from investment operations | | | 1.17 | | | | .42 | | | | .52 | | | | .77 | | | | 1.10 | |
| Less distributions from: | |
| Net investment income | | | (.19 | ) | | | — | | | | — | | | | (.16 | ) | | | — | |
| Total distributions | | | (.19 | ) | | | — | | | | — | | | | (.16 | ) | | | — | |
| Redemption fees collected | | | — | | | | — | | | | — | | | | — | | | | — | b |
| Net asset value, end of period | | $ | 24.24 | | | $ | 23.26 | | | $ | 22.84 | | | $ | 22.32 | | | $ | 21.71 | |
| | |
Total Returnc | | | 4.98 | % | | | 1.84 | % | | | 2.28 | % | | | 3.61 | % | | | 5.34 | % |
| Ratios/Supplemental Data | |
| Net assets, end of period (in thousands) | | $ | 42,204 | | | $ | 25,435 | | | $ | 14,130 | | | $ | 807 | | | $ | 296 | |
| Ratios to average net assets: | |
| Net investment income (loss) | | | (0.79 | %) | | | (0.54 | %) | | | (1.46 | %) | | | (0.99 | %) | | | (3.10 | %) |
Total expensesd | | | 2.67 | % | | | 2.56 | % | | | 3.05 | % | | | 2.52 | % | | | 5.13 | % |
Net expensese,f | | | 2.62 | % | | | 2.51 | % | | | 3.01 | % | | | 2.40 | % | | | 4.98 | % |
| Portfolio turnover rate | | | 304 | % | | | 302 | % | | | 465 | % | | | 433 | % | | | 993 | % |
a | Net investment income (loss) per share was computed using average shares outstanding throughout the period. |
b | Redemption fees collected are less than $0.01 per share. |
c | Total return does not reflect the impact of any applicable sales charges and has not been annualized. |
d | Does not include expenses of the underlying funds in which the Fund invests. |
e | Net expense information reflects the expense ratios after expense waivers. |
f | Excluding interest and dividend expense related to short sales, the operating expense ratios for the years or periods presented would be: |
| | 12/31/14 | 12/31/13 | 12/31/12 | 12/31/11 | 12/31/10 |
| A-Class | 1.42% | 1.40% | 1.40% | 1.41% | 1.41% |
| C-Class | 2.17% | 2.15% | 2.15% | 2.15% | 2.15% |
| H-Class | 1.42% | 1.40% | 1.40% | 1.41% | 1.41% |
| Institutional Class | 1.17% | 1.15% | 1.15% | 1.16% | 1.17% |
g | Since commencement of operations: May 3, 2010. Percentage amounts for the period, except total return and portfolio turnover rate, have been annualized. |
| 42 | THE GUGGENHEIM FUNDS ANNUAL REPORT | SEE NOTES TO FINANCIAL STATEMENTS. |
PERFORMANCE REPORT AND FUND PROFILE (Unaudited) | December 31, 2014 |
COMMODITIES STRATEGY FUND
OBJECTIVE: Seeks to provide investment results that correlate, before fees and expenses, to the performance of a benchmark for commodities. The Fund’s current benchmark is the S&P Goldman Sachs Commodity Index (“GSCI“)TM Commodity Index (the “underlying index”).
For the one-year period ended December 31, 2014, the Fund’s H-Class returned -33.85%, compared with a return of -33.05% for its benchmark, the S&P GSCI.
Live Cattle, Coffee and Feeder Cattle were the components which contributed the most to the GSCI during the year.
Brent Crude, WTI Crude and Gas Oil were the components which detracted the most from the GSCI during the year.
Commodities were punished in 2014 by lower estimates of global growth, particularly in China, but also in Europe and Japan. The energy sector was the worst-performing sector, including about a 50% fall in oil prices, but precious metals, agricultural commodities and base metals also declined, though there were variations within each sector. Coffee and live cattle, for example, were strong performers, while sugar, hogs, silver and copper had a down year. Gold was only about 2% lower for the year.
The U.S. dollar’s rise also weighed on commodity prices, as the U.S. Dollar Index rose almost 13% for the year. Commodities are mostly denominated in U.S. dollars, so commodity prices typically move in the opposite direction from the dollar.
Derivatives in the Fund are used to help provide exposure to the composition of the benchmark in the most efficient manner, as well as to provide liquidity.
Performance displayed represents past performance which is no guarantee of future results.
| | THE GUGGENHEIM FUNDS ANNUAL REPORT | 43 |
PERFORMANCE REPORT AND FUND PROFILE (Unaudited)(continued) | December 31, 2014 |
Holdings Diversification
(Market Exposure as % of Net Assets)
“Holdings Diversification (Market Exposure as % of Net Assets)” excludes any temporary cash investments or investments in Guggenheim Strategy Funds Trust mutual funds.
| Inception Dates: |
| A-Class | May 25, 2005 |
| C-Class | May 25, 2005 |
| H-Class | May 25, 2005 |
The Fund invests principally in derivative investments such as commodity-linked futures contracts.
| Largest Holdings (% of Total Net Assets) |
| Guggenheim Strategy Fund I | 17.5% |
| Guggenheim Strategy Fund II | 12.4% |
| Total | 29.9% |
| | |
| “Largest Holdings” exclude any temporary cash or derivative investments. |
| 44 | THE GUGGENHEIM FUNDS ANNUAL REPORT | |
PERFORMANCE REPORT AND FUND PROFILE (Unaudited)(continued) | December 31, 2014 |
Cumulative Fund Performance*
| | THE GUGGENHEIM FUNDS ANNUAL REPORT | 45 |
PERFORMANCE REPORT AND FUND PROFILE (Unaudited)(concluded) | December 31, 2014 |
Average Annual Returns*
Periods Ended December 31, 2014
| | 1 Year | 5 Year | Since Inception (05/25/05) |
| A-Class Shares | -33.89% | -8.58% | -8.09% |
A-Class Shares with sales charge† | -37.01% | -9.47% | -8.55% |
| C-Class Shares | -34.31% | -9.24% | -8.76% |
C-Class Shares with CDSC‡ | -34.97% | -9.24% | -8.76% |
| H-Class Shares | -33.85% | -8.55% | -8.07% |
| S&P GSCI | -33.05% | -6.55% | -5.84% |
| S&P 500 Index | 13.69% | 15.45% | 8.13% |
| * | The performance data represents past performance that is not predictive of future results. The investment return and principal value of an investment in the Fund will fluctuate so that an investor’s shares, when redeemed, may be worth more or less than their original cost. Returns are historical and include changes in principal and reinvested dividends and capital gains and do not reflect the effect of taxes. The S&P GSCI and the S&P 500 Index are unmanaged indices and, unlike the Fund, have no management fees or operating expenses to reduce their reported returns. The graphs are based on A-Class shares and H-Class shares only; performance for C-Class shares will vary due to differences in fee structures. |
† | Fund returns are calculated using the maximum sales charge of 4.75%. |
‡ | Fund returns include a CDSC of 1% if redeemed within 12 months of purchase. |
| 46 | THE GUGGENHEIM FUNDS ANNUAL REPORT | |
| CONSOLIDATED SCHEDULE OF INVESTMENTS | December 31, 2014 |
| COMMODITIES STRATEGY FUND | |
| | | Shares | | | Value | |
| | | | | | | | | |
MUTUAL FUNDS†,1 - 29.9% | |
| Guggenheim Strategy Fund I | | | 89,428 | | | $ | 2,221,398 | |
| Guggenheim Strategy Fund II | | | 63,403 | | | | 1,575,572 | |
| Total Mutual Funds | | | | | | | | |
| (Cost $3,800,275) | | | | | | | 3,796,970 | |
| | | | | | | | | |
| | | Face
Amount | | | | |
| | | | | | | | | |
REPURCHASE AGREEMENTS††,2 - 3.3% | |
HSBC Group
issued 12/31/14 at 0.02%
due 01/02/15 | | $ | 276,060 | | | | 276,060 | |
RBC Capital Markets
issued 12/31/14 at 0.03%
due 01/02/15 | | | 149,140 | | | | 149,140 | |
| Total Repurchase Agreements | | | | | | | | |
| (Cost $425,200) | | | | | | | 425,200 | |
| | | | | | | | | |
| Total Investments - 33.2% | | | | | | | | |
| (Cost $4,225,475) | | | | | | $ | 4,222,170 | |
| Other Assets & Liabilities, net - 66.8% | | | | | | | 8,491,901 | |
| Total Net Assets - 100.0% | | | | | | $ | 12,714,071 | |
| | | | | | | | | |
| | | Contracts | | | Unrealized
Gain (Loss) | |
| | | | | | | | | |
COMMODITY FUTURES CONTRACTS PURCHASED† | |
March 2015 Wheat
Futures Contracts
(Aggregate Value of
Contracts $206,500) | | | 7 | | | $ | 11,951 | |
February 2015 Gasoline RBOB
Futures Contracts
(Aggregate Value of
Contracts $249,010) | | | 4 | | | | 2,945 | |
February 2015 New York Harbor Ultra-Low Sulfur Diesel
Futures Contracts
(Aggregate Value of
Contracts $233,528) | | | 3 | | | | 2,398 | |
March 2015 Cocoa
Futures Contracts
(Aggregate Value of
Contracts $29,190) | | | 1 | | | | 1,086 | |
February 2015 Gas Oil
Futures Contracts
(Aggregate Value of
Contracts $321,900) | | | 6 | | | | 1,040 | |
March 2015 Hard Red Winter Wheat
Futures Contracts
(Aggregate Value of
Contracts $31,425) | | | 1 | | | | 1,022 | |
March 2015 Cotton #2
Futures Contracts
(Aggregate Value of
Contracts $60,250) | | | 2 | | | | 924 | |
March 2015 Brent Crude
Futures Contracts
(Aggregate Value of
Contracts $876,900) | | | 15 | | | | 765 | |
March 2015 Feeder Cattle
Futures Contracts
(Aggregate Value of
Contracts $108,900) | | | 1 | | | | 471 | |
February 2015 Live Cattle
Futures Contracts
(Aggregate Value of
Contracts $264,120) | | | 4 | | | | (434 | ) |
February 2015 Lean Hogs
Futures Contracts
(Aggregate Value of
Contracts $97,290) | | | 3 | | | | (591 | ) |
February 2015 Gold 100 oz.
Futures Contracts
(Aggregate Value of
Contracts $118,270) | | | 1 | | | | (723 | ) |
| SEE NOTES TO FINANCIAL STATEMENTS. | THE GUGGENHEIM FUNDS ANNUAL REPORT | 47 |
CONSOLIDATED SCHEDULE OF INVESTMENTS (concluded) | December 31, 2014 |
| COMMODITIES STRATEGY FUND | |
| | | Contracts | | | Unrealized
Loss | |
| | | | | | | | | |
March 2015 Corn
Futures Contracts
(Aggregate Value of
Contracts $198,625) | | | 10 | | | $ | (785 | ) |
February 2015 LME Zinc
Futures Contracts
(Aggregate Value of
Contracts $53,957) | | | 1 | | | | (851 | ) |
March 2015 Soybean
Futures Contracts
(Aggregate Value of
Contracts $153,450) | | | 3 | | | | (2,335 | ) |
February 2015 LME Lead
Futures Contracts
(Aggregate Value of
Contracts $46,126) | | | 1 | | | | (3,337 | ) |
February 2015 LME Copper
Futures Contracts
(Aggregate Value of
Contracts $157,229) | | | 1 | | | | (4,591 | ) |
February 2015 LME Nickel
Futures Contracts
(Aggregate Value of
Contracts $90,145) | | | 1 | | | | (7,437 | ) |
February 2015 LME Primary Aluminum
Futures Contracts
(Aggregate Value of
Contracts $137,145) | | | 3 | | | | (8,471 | ) |
March 2015 Coffee ‘C’
Futures Contracts
(Aggregate Value of
Contracts $63,112) | | | 1 | | | | (10,841 | ) |
February 2015 Natural Gas
Futures Contracts
(Aggregate Value of
Contracts $175,200) | | | 6 | | | | (10,998 | ) |
March 2015 Sugar #11
Futures Contracts
(Aggregate Value of
Contracts $81,648) | | | 5 | | | | (11,095 | ) |
February 2015 WTI Crude
Futures Contracts
(Aggregate Value of
Contracts $1,237,860) | | | 23 | | | | (99,169 | ) |
January 2015 Goldman Sachs Commodity Index
Futures Contracts
(Aggregate Value of
Contracts $7,867,500) | | | 75 | | | | (413,353 | ) |
| (Total Aggregate Value of Contracts $12,859,280) | | | | | | $ | (522,409 | ) |
| † | Value determined based on Level 1 inputs — See Note 4. |
| †† | Value determined based on Level 2 inputs — See Note 4. |
| 1 | Investment in a product that is managed by and/or pays a management fee to a party related to the Adviser — See Note 11. |
| 2 | Repurchase Agreements — See Note 5. |
| 48 | THE GUGGENHEIM FUNDS ANNUAL REPORT | SEE NOTES TO FINANCIAL STATEMENTS. |
| CONSOLIDATED STATEMENT OF ASSETS AND LIABILITIES |
| COMMODITIES STRATEGY FUND | |
December 31, 2014
| Assets: | |
| Investments, at value (cost $3,800,275) | | $ | 3,796,970 | |
| Repurchase agreements, at value (cost $425,200) | | | 425,200 | |
| Total investments (cost $4,225,475) | | | 4,222,170 | |
| Cash | | | 8,997,567 | |
| Segregated cash with broker | | | 1,378,480 | |
| Receivables: | |
| Fund shares sold | | | 57,390 | |
| Dividends | | | 10,855 | |
| Total assets | | | 14,666,462 | |
| | | | | |
| Liabilities: | |
| Due to broker | | | 33,727 | |
| Payable for: | |
| Securities purchased | | | 1,310,872 | |
| Fund shares redeemed | | | 468,430 | |
| Variation margin | | | 108,454 | |
| Management fees | | | 11,201 | |
| Distribution and service fees | | | 4,545 | |
| Transfer agent and administrative fees | | | 3,734 | |
| Portfolio accounting fees | | | 1,494 | |
| Miscellaneous | | | 9,934 | |
| Total liabilities | | | 1,952,391 | |
| Net assets | | $ | 12,714,071 | |
| | | | | |
| Net assets consist of: | |
| Paid in capital | | $ | 35,944,596 | |
| Accumulated net investment loss | | | (2,770,217 | ) |
| Accumulated net realized loss on investments | | | (19,904,594 | ) |
| Net unrealized depreciation on investments | | | (555,714 | ) |
| Net assets | | $ | 12,714,071 | |
| | | | | |
| A-Class: | |
| Net assets | | $ | 3,419,025 | |
| Capital shares outstanding | | | 346,343 | |
| Net asset value per share | | $ | 9.87 | |
| Maximum offering price per share (Net asset value divided by 95.25%) | | $ | 10.36 | |
| | | | | |
| C-Class: | |
| Net assets | | $ | 1,135,441 | |
| Capital shares outstanding | | | 124,101 | |
| Net asset value per share | | $ | 9.15 | |
| | | | | |
| H-Class: | |
| Net assets | | $ | 8,159,605 | |
| Capital shares outstanding | | | 825,064 | |
| Net asset value per share | | $ | 9.89 | |
| SEE NOTES TO FINANCIAL STATEMENTS. | THE GUGGENHEIM FUNDS ANNUAL REPORT | 49 |
| CONSOLIDATED STATEMENT OF OPERATIONS |
| COMMODITIES STRATEGY FUND |
Year Ended December 31, 2014
| Investment Income: | |
| Dividends | | $ | 103,634 | |
| Interest | | | 1,547 | |
| Total investment income | | | 105,181 | |
| | | | | |
| Expenses: | |
| Management fees | | | 166,085 | |
| Transfer agent and administrative fees | | | 49,804 | |
| Distribution and service fees: | | | | |
| A-Class | | | 22,923 | |
| C-Class | | | 18,105 | |
| H-Class | | | 22,355 | |
| Portfolio accounting fees | | | 19,921 | |
| Custodian fees | | | 2,452 | |
| Trustees’ fees* | | | 1,689 | |
| Miscellaneous | | | 38,003 | |
| Total expenses | | | 341,337 | |
| Less: | | | | |
| Expenses waived by Adviser | | | (16,141 | ) |
| Net expenses | | | 325,196 | |
| Net investment loss | | | (220,015 | ) |
| | | | | |
| Net Realized and Unrealized Gain (Loss): | |
| Net realized gain (loss) on: | |
| Investments | | $ | (53,452 | ) |
| Futures contracts | | | (6,325,844 | ) |
| Net realized loss | | | (6,379,296 | ) |
| Net change in unrealized appreciation (depreciation) on: | |
| Investments | | | (3,305 | ) |
| Futures contracts | | | (632,267 | ) |
| Net change in unrealized appreciation (depreciation) | | | (635,572 | ) |
| Net realized and unrealized loss | | | (7,014,868 | ) |
| Net decrease in net assets resulting from operations | | $ | (7,234,883 | ) |
| * | Relates to Trustees not deemed "interested persons" within the meaning of Section 2(a)(19) of the 1940 Act. |
| 50 | THE GUGGENHEIM FUNDS ANNUAL REPORT | SEE NOTES TO FINANCIAL STATEMENTS. |
| CONSOLIDATED STATEMENTS OF CHANGES IN NET ASSETS |
| COMMODITIES STRATEGY FUND | |
| | | Year Ended December 31, 2014 | | | Year Ended December 31, 2013 | |
| Increase (Decrease) in Net Assets from Operations: | | | | | | |
| Net investment loss | | $ | (220,015 | ) | | $ | (299,548 | ) |
| Net realized loss on investments | | | (6,379,296 | ) | | | (110,735 | ) |
| Net change in unrealized appreciation (depreciation) on investments | | | (635,572 | ) | | | (306,080 | ) |
| Net decrease in net assets resulting from operations | | | (7,234,883 | ) | | | (716,363 | ) |
| | | | | | | | | |
| Capital share transactions: | | | | | | | | |
| Proceeds from sale of shares | | | | | | | | |
| A-Class | | | 22,549,472 | | | | 10,078,236 | |
| C-Class | | | 260,844 | | | | 409,772 | |
| H-Class | | | 85,991,591 | | | | 60,099,288 | |
| Cost of shares redeemed | | | | | | | | |
| A-Class | | | (19,190,403 | ) | | | (13,684,423 | ) |
| C-Class | | | (444,139 | ) | | | (930,045 | ) |
| H-Class | | | (85,196,491 | ) | | | (71,364,280 | ) |
| Net increase (decrease) from capital share transactions | | | 3,970,874 | | | | (15,391,452 | ) |
| Net decrease in net assets | | | (3,264,009 | ) | | | (16,107,815 | ) |
| | | | | | | | | |
| Net assets: | | | | | | | | |
| Beginning of year | | | 15,978,080 | | | | 32,085,895 | |
| End of year | | $ | 12,714,071 | | | $ | 15,978,080 | |
| Accumulated net investment loss at end of year | | $ | (2,770,217 | ) | | $ | (2,770,217 | ) |
| | | | | | | | | |
| Capital share activity: | | | | | | | | |
| Shares sold | | | | | | | | |
| A-Class | | | 1,645,908 | | | | 643,669 | |
| C-Class | | | 19,526 | | | | 28,929 | |
| H-Class | | | 6,272,794 | | | | 3,961,097 | |
| Shares redeemed | | | | | | | | |
| A-Class | | | (1,432,812 | ) | | | (887,399 | ) |
| C-Class | | | (35,150 | ) | | | (66,086 | ) |
| H-Class | | | (6,253,169 | ) | | | (4,683,246 | ) |
| Net increase (decrease) in shares | | | 217,097 | | | | (1,003,036 | ) |
| SEE NOTES TO FINANCIAL STATEMENTS. | THE GUGGENHEIM FUNDS ANNUAL REPORT | 51 |
| CONSOLIDATED FINANCIAL HIGHLIGHTS |
| COMMODITIES STRATEGY FUND | |
This table is presented to show selected data for a share outstanding throughout each period and to assist shareholders in evaluating a Fund’s performance for the periods presented.
| A-Class | | Year Ended Dec. 31, 2014 | | | Year Ended Dec. 31, 2013 | | | Year Ended Dec. 31, 2012 | | | Year Ended Dec. 31, 2011 | | | Year Ended Dec. 31, 2010 | |
| Per Share Data | | | | | | | | | | | | | | | |
| Net asset value, beginning of period | | $ | 14.93 | | | $ | 15.49 | | | $ | 16.18 | | | $ | 17.33 | | | $ | 16.39 | |
| Income (loss) from investment operations: | |
Net investment income (loss)a | | | (.15 | ) | | | (.23 | ) | | | (.23 | ) | | | (.26 | ) | | | (.22 | ) |
| Net gain (loss) on investments (realized and unrealized) | | | (4.91 | ) | | | (.33 | ) | | | (.05 | ) | | | (.36 | ) | | | 1.16 | |
| Total from investment operations | | | (5.06 | ) | | | (.56 | ) | | | (.28 | ) | | | (.62 | ) | | | .94 | |
| Less distributions from: | |
| Net investment income | | | — | | | | — | | | | (.41 | ) | | | (.53 | ) | | | — | |
| Total distributions | | | — | | | | — | | | | (.41 | ) | | | (.53 | ) | | | — | |
| Redemption fees collected | | | — | | | | — | | | | — | | | | — | | | | — | b |
| Net asset value, end of period4 | | $ | 9.87 | | | $ | 14.93 | | | $ | 15.49 | | | $ | 16.18 | | | $ | 17.33 | |
| | |
Total Returnc | | | (33.89 | %) | | | (3.62 | %) | | | (1.63 | %) | | | (3.61 | %) | | | 5.74 | % |
| Ratios/Supplemental Data | |
| Net assets, end of period (in thousands) | | $ | 3,419 | | | $ | 1,990 | | | $ | 5,840 | | | $ | 5,223 | | | $ | 7,192 | |
| Ratios to average net assets: | |
| Net investment income (loss) | | | (1.03 | %) | | | (1.50 | %) | | | (1.40 | %) | | | (1.47 | %) | | | (4.22 | %) |
Total expensesd | | | 1.64 | % | | | 1.63 | % | | | 1.59 | % | | | 1.66 | % | | | 1.65 | % |
Net expensese | | | 1.56 | % | | | 1.53 | % | | | 1.49 | % | | | 1.55 | % | | | 1.56 | % |
| Portfolio turnover rate | | | 238 | % | | | — | | | | — | | | | — | | | | 200 | % |
| 52 | THE GUGGENHEIM FUNDS ANNUAL REPORT | SEE NOTES TO FINANCIAL STATEMENTS. |
CONSOLIDATED FINANCIAL HIGHLIGHTS (continued) |
| COMMODITIES STRATEGY FUND | |
This table is presented to show selected data for a share outstanding throughout each period and to assist shareholders in evaluating a Fund’s performance for the periods presented.
| C-Class | | Year Ended Dec. 31, 2014 | | | Year Ended Dec. 31, 2013 | | | Year Ended Dec. 31, 2012 | | | Year Ended Dec. 31, 2011 | | | Year Ended Dec. 31, 2010 | |
| Per Share Data | | | | | | | | | | | | | | | |
| Net asset value, beginning of period | | $ | 13.93 | | | $ | 14.56 | | | $ | 15.34 | | | $ | 16.58 | | | $ | 15.80 | |
| Income (loss) from investment operations: | |
Net investment income (loss)a | | | (.23 | ) | | | (.32 | ) | | | (.33 | ) | | | (.37 | ) | | | (.32 | ) |
| Net gain (loss) on investments (realized and unrealized) | | | (4.55 | ) | | | (.31 | ) | | | (.04 | ) | | | (.34 | ) | | | 1.10 | |
| Total from investment operations | | | (4.78 | ) | | | (.63 | ) | | | (.37 | ) | | | (.71 | ) | | | .78 | |
| Less distributions from: | |
| Net investment income | | | — | | | | — | | | | (.41 | ) | | | (.53 | ) | | | — | |
| Total distributions | | | — | | | | — | | | | (.41 | ) | | | (.53 | ) | | | — | |
| Redemption fees collected | | | — | | | | — | | | | — | | | | — | | | | — | b |
| Net asset value, end of period | | $ | 9.15 | | | $ | 13.93 | | | $ | 14.56 | | | $ | 15.34 | �� | | $ | 16.58 | |
| | |
Total Returnc | | | (34.31 | %) | | | (4.33 | %) | | | (2.38 | %) | | | (4.32 | %) | | | 4.94 | % |
| Ratios/Supplemental Data | |
| Net assets, end of period (in thousands) | | $ | 1,135 | | | $ | 1,947 | | | $ | 2,575 | | | $ | 3,558 | | | $ | 4,857 | |
| Ratios to average net assets: | |
| Net investment income (loss) | | | (1.77 | %) | | | (2.25 | %) | | | (2.15 | %) | | | (2.22 | %) | | | (2.17 | %) |
Total expensesd | | | 2.39 | % | | | 2.39 | % | | | 2.34 | % | | | 2.41 | % | | | 2.39 | % |
Net expensese | | | 2.32 | % | | | 2.28 | % | | | 2.24 | % | | | 2.30 | % | | | 2.30 | % |
| Portfolio turnover rate | | | 238 | % | | | — | | | | — | | | | — | | | | 200 | % |
| SEE NOTES TO FINANCIAL STATEMENTS. | THE GUGGENHEIM FUNDS ANNUAL REPORT | 53 |
CONSOLIDATED FINANCIAL HIGHLIGHTS (concluded) |
| COMMODITIES STRATEGY FUND |
This table is presented to show selected data for a share outstanding throughout each period and to assist shareholders in evaluating a Fund’s performance for the periods presented.
| H-Class | | Year Ended Dec. 31, 2014 | | | Year Ended Dec. 31, 2013 | | | Year Ended Dec. 31, 2012 | | | Year Ended Dec. 31, 2011 | | | Year Ended Dec. 31, 2010 | |
| Per Share Data | | | | | | | | | | | | | | | |
| Net asset value, beginning of period | | $ | 14.95 | | | $ | 15.50 | | | $ | 16.18 | | | $ | 17.33 | | | $ | 16.39 | |
| Income (loss) from investment operations: | |
Net investment income (loss)a | | | (.15 | ) | | | (.23 | ) | | | (.23 | ) | | | (.27 | ) | | | (.22 | ) |
| Net gain (loss) on investments (realized and unrealized) | | | (4.91 | ) | | | (.32 | ) | | | (.04 | ) | | | (.35 | ) | | | 1.16 | |
| Total from investment operations | | | (5.06 | ) | | | (.55 | ) | | | (.27 | ) | | | (.62 | ) | | | .94 | |
| Less distributions from: | |
| Net investment income | | | — | | | | — | | | | (.41 | ) | | | (.53 | ) | | | — | |
| Total distributions | | | — | | | | — | | | | (.41 | ) | | | (.53 | ) | | | — | |
| Redemption fees collected | | | — | | | | — | | | | — | | | | — | | | | — | b |
| Net asset value, end of period | | $ | 9.89 | | | $ | 14.95 | | | $ | 15.50 | | | $ | 16.18 | | | $ | 17.33 | |
| | |
Total Returnc | | | (33.85 | %) | | | (3.55 | %) | | | (1.57 | %) | | | (3.67 | %) | | | 5.74 | % |
| Ratios/Supplemental Data | |
| Net assets, end of period (in thousands) | | $ | 8,160 | | | $ | 12,042 | | | $ | 23,671 | | | $ | 14,982 | | | $ | 32,290 | |
| Ratios to average net assets: | |
| Net investment income (loss) | | | (1.05 | %) | | | (1.50 | %) | | | (1.40 | %) | | | (1.47 | %) | | | (1.42 | %) |
Total expensesd | | | 1.65 | % | | | 1.63 | % | | | 1.60 | % | | | 1.66 | % | | | 1.65 | % |
Net expensese | | | 1.57 | % | | | 1.53 | % | | | 1.49 | % | | | 1.56 | % | | | 1.56 | % |
| Portfolio turnover rate | | | 238 | % | | | — | | | | — | | | | — | | | | 200 | % |
a | Net investment income (loss) per share was computed using average shares outstanding throughout the period. |
b | Redemption fees collected are less than $0.01 per share. |
c | Total return does not reflect the impact of any applicable sales charges. |
d | Does not include expenses of the underlying funds in which the Fund invests. |
e | Net expense information reflects the expense ratios after expense waivers. |
| 54 | THE GUGGENHEIM FUNDS ANNUAL REPORT | SEE NOTES TO FINANCIAL STATEMENTS. |
| NOTES TO CONSOLIDATED FINANCIAL STATEMENTS |
1. Organization, Consolidation of Subsidiary and Significant Accounting Policies
Organization
The Rydex Series Funds (the “Trust”), a Delaware business trust, is registered with the SEC under the Investment Company Act of 1940 (”1940 Act”), as a non-diversified, open-ended investment company of the series type. Each series, in effect, is representing a separate Fund. The Trust is authorized to issue an unlimited number of no par value shares. The Trust accounts for the assets of each fund separately.
The Trust offers a combination of eight separate classes of shares: Investor Class shares, Advisor Class shares, A-Class shares, C-Class shares, H-Class shares, Y-Class shares, Institutional Class shares and Money Market Class shares. Sales of shares of each Class are made without a front-end sales charge at the net asset value per share (“NAV”), with the exception of A-Class shares. A-Class shares are sold at the NAV, plus the applicable front-end sales charge. The sales charge varies depending on the amount purchased, but will not exceed 4.75%. A-Class share purchases of $1 million or more are exempt from the front-end sales charge but have a 1% contingent deferred sales charge (“CDSC”) if shares are redeemed within 12 months of purchase. C-Class shares have a 1% CDSC if shares are redeemed within 12 months of purchase. Institutional Class shares are offered primarily for direct investment by institutions such as pension and profit sharing plans, endowments, foundations and corporations. Institutional Class shares have a minimum initial investment of $2 million and a minimum account balance of $1 million. Institutional Class shares are offered without a front-end sales charge or CDSC. At December 31, 2014, the Trust consisted of fifty-two funds.
This report covers the Multi-Hedge Strategies Fund and Commodities Strategy Fund (the “Funds”). Only A-Class, C-Class, H-Class and Institutional Class had been issued by the Funds.
Guggenheim Investments (“GI”) provides advisory services, and Rydex Fund Services, LLC (“RFS”) provides transfer agent, administrative and accounting services to the Trust. Guggenheim Funds Distributors, LLC (“GFD”) acts as principal underwriter for the Trust. GI, RFS and GFD are affiliated entities.
Consolidation of Subsidiary
Each of the consolidated financial statements of the Funds includes the accounts of a wholly-owned and controlled Cayman Islands subsidiary (the “Subsidiary”). Significant inter-company accounts and transactions have been eliminated in consolidation for the Funds.
| SEE NOTES TO FINANCIAL STATEMENTS. | THE GUGGENHEIM FUNDS ANNUAL REPORT | 55 |
NOTES TO CONSOLIDATED FINANCIAL STATEMENTS (continued) |
Each Fund may invest up to 25% of its total assets in its Subsidiary which acts as an investment vehicle in order to effect certain investments consistent with the Fund’s investment objectives and policies.
A summary of each Fund’s investment in its respective Subsidiary is as follows:
| Fund | Inception Date of Subsidiary | | Subsidiary Net Assets at December 31, 2014 | | | % of Net Asset of the Fund at December 31, 2014 |
| Multi-Hedge Strategies Fund | 09/18/09 | | $ | 6,343,003 | | | | 6.4% |
| Commodities Strategy Fund | 09/08/09 | | | 1,661,025 | | | | 13.1% |
Significant Accounting Policies
The Funds operate as investment companies and accordingly follow the investment company accounting and reporting guidance of the Financial Accounting Standards Board (“FASB”) Accounting Standards Codification Topic 946 Financial Services – Investment Companies.
The following significant accounting policies are in conformity with U.S. generally accepted accounting principles ("U.S. GAAP") and are consistently followed by the Trust. This requires management to make estimates and assumptions that affect the reported amount of assets and liabilities and disclosure of contingent assets and liabilities at the date of the financial statements and the reported amounts of revenues and expenses during the reporting period. Actual results could differ from these estimates. All time references are based on Eastern Time.
The NAV of each Class of the Funds calculated by dividing the market value of the Fund’s securities and other assets, less all liabilities, attributable to the Class by the number of outstanding shares of the Class.
A. The Board of Trustees of the Funds (the “Board”) has adopted policies and procedures for the valuation of the Funds’ investments (the “Valuation Procedures”). Pursuant to the Valuation Procedures, the Board has delegated to a valuation committee, consisting of representatives from Guggenheim’s investment management, fund administration, legal and compliance departments (the “Valuation Committee”), the day-to-day responsibility for implementing the Valuation Procedures, including, under most circumstances, the responsibility for determining the fair value of the Funds' securities or other assets.
Valuations of the Funds’ securities are supplied primarily by pricing services appointed pursuant to the processes set forth in the Valuation Procedures. The Valuation Committee convenes monthly, or more frequently as needed and will review the valuation of all assets which have been fair valued for reasonableness.
| 56 | THE GUGGENHEIM FUNDS ANNUAL REPORT | |
NOTES TO CONSOLIDATED FINANCIAL STATEMENTS (continued) |
The Funds’ officers, through the Valuation Committee and consistent with the monitoring and review responsibilities set forth in the Valuation Procedures, regularly review procedures used by, and valuations provided by, the pricing services.
If the pricing service cannot or does not provide a valuation for a particular investment or such valuation is deemed unreliable, such investment is fair valued by the Valuation Committee.
Equity securities listed on an exchange (New York Stock Exchange (“NYSE”) or American Stock Exchange) are valued at the last quoted sales price as of the close of business on the NYSE, usually 4:00 p.m. on the valuation date. Equity securities listed on the NASDAQ market system are valued at the NASDAQ Official Closing Price on the valuation date, which may not necessarily represent the last sale price. If there has been no sale on such exchange or NASDAQ on a given day, the security is valued at the closing bid price on that day.
Generally, trading in foreign securities markets is substantially completed each day at various times prior to the close of the NYSE. The values of foreign securities are determined as of the close of such foreign markets or the close of the NYSE, if earlier. All investments quoted in foreign currency are valued in U.S. dollars on the basis of the foreign currency exchange rates prevailing at the close of business. Investments in foreign securities may involve risks not present in domestic investments. The Valuation Committee will determine the current value of such foreign securities by taking into consideration certain factors which may include those discussed above, as well as the following factors, among others: the value of the securities traded on other foreign markets, ADR trading, closed-end fund trading, foreign currency exchange activity, and the trading prices of financial products that are tied to foreign securities such as World Equity Benchmark Securities. In addition, the Board of Trustees has authorized the Valuation Committee and GI to use prices and other information supplied by a third party pricing vendor in valuing foreign securities.
Open-end investment companies ("Mutual Funds") are valued at their NAV as of the close of business, on the valuation date. Exchange-traded funds ("ETFs") and closed-end investment companies ("CEFs") are valued at the last quoted sales price.
Repurchase agreements are valued at amortized cost, which approximates market value.
The value of futures contracts is accounted for using the unrealized gain or loss on the contracts that is determined by marking the contracts to their current realized settlement prices. Financial futures contracts are valued at the 4:00 p.m.
| | THE GUGGENHEIM FUNDS ANNUAL REPORT | 57 |
NOTES TO CONSOLIDATED FINANCIAL STATEMENTS (continued) |
price on the valuation date. In the event that the exchange for a specific futures contract closes earlier than 4:00 p.m., the futures contract is valued at the Official Settlement Price of the exchange. However, the underlying securities from which the futures contract value is derived are monitored until 4:00 p.m. to determine if fair valuation would provide a more accurate valuation.
The value of OTC swap agreements and credit default swap agreements entered into by a Fund is accounted for using the unrealized gain or loss on the agreements that is determined by marking the agreements to the last quoted value of the index that the swap pertains to at the close of the NYSE. The swap's value is then adjusted to include dividends accrued, and financing charges and/or interest associated with the swap agreements.
Investments for which market quotations are not readily available (including restricted securities) are fair valued as determined in good faith by GI under the direction of the Board of Trustees using methods established or ratified by the Board of Trustees. Valuations in accordance with these methods are intended to reflect each security’s (or asset’s) “fair value.” Each such determination is based on a consideration of all relevant factors, which are likely to vary from one pricing context to another. Examples of such factors may include, but are not limited to: (i) the type of security, (ii) the initial cost of the security, (iii) the existence of any contractual restrictions on the security’s disposition, (iv) the price and extent of public trading in similar securities of the issuer or of comparable companies, (v) quotations or evaluated prices from broker-dealers and/or pricing services, (vi) information obtained from the issuer, analysts, and/or the appropriate stock exchange (for exchange-traded securities), (vii) an analysis of the company’s financial statements, and (viii) an evaluation of the forces that influence the issuer and the market(s) in which the security is purchased and sold (e.g. the existence of pending merger activity, public offerings or tender offers that might affect the value of the security). In connection with futures contracts and options thereupon, and other derivative investments, such factors include obtaining information as to how (a) these contracts and other derivative investments trade in the futures or other derivative markets, respectively, and (b) the securities underlying these contracts and other derivative investments trade in the cash market.
B. When a Fund engages in a short sale of a security, an amount equal to the proceeds is reflected as an asset and an equivalent liability. The amount of the liability is subsequently marked-to-market to reflect the market value of the short sale. The Fund maintains a segregated account of cash and/or securities as collateral for short sales.
| 58 | THE GUGGENHEIM FUNDS ANNUAL REPORT | |
NOTES TO CONSOLIDATED FINANCIAL STATEMENTS (continued) |
Fees, if any, paid to brokers to borrow securities in connection with short sales are recorded as interest expense. In addition, the Fund must pay out the dividend rate of the equity or coupon rate of the obligation to the lender and record this as an expense. Short dividend or interest expense is a cost associated with the investment objective of short sales transactions, rather than an operational cost associated with the day-to-day management of any mutual fund. The Funds may also receive rebate income from the broker resulting from the investment of the proceeds from securities sold short.
C. Upon entering into a futures contract, a Fund deposits and maintains as collateral such initial margin as required by the exchange on which the transaction is affected. Pursuant to the contract, the Fund agrees to receive from or pay to the broker an amount of cash equal to the daily fluctuation in value of the contract. Such receipts or payments are known as variation margin and are recorded by the Fund as unrealized gains or losses. When the contract is closed, the Fund records a realized gain or loss equal to the difference between the value of the contract at the time it was opened and the value at the time it was closed.
D. Swap agreements are marked-to-market daily and the change, if any, is recorded as unrealized gain or loss. Payments received or made as a result of an agreement or termination of the agreement are recognized as realized gains or losses.
Credit default swap agreements are marked-to-market daily and the change, if any, is recorded as unrealized gain or loss. Upfront payments received or made by a Fund on credit default swap agreements are amortized over the expected life of the agreement. Periodic payments received or paid by a Fund are recorded as realized gains or losses. Payments received or made as a result of a credit event or termination of the contract are recognized, net of a proportional amount of the upfront payment, as realized gains or losses.
E. Investment securities and other assets and liabilities denominated in foreign currencies are translated into U.S. dollar amounts at the date of valuation. Purchases and sales of investment securities and income and expense items denominated in foreign currencies are translated into U.S. dollar amounts on the respective dates of such transactions. The Funds do not isolate that portion of the results of operations resulting from changes in foreign exchange rates on investments from the fluctuations arising from changes in market prices of securities held. Such fluctuations are included with the net realized and unrealized gain and loss from investments.
| | THE GUGGENHEIM FUNDS ANNUAL REPORT | 59 |
NOTES TO CONSOLIDATED FINANCIAL STATEMENTS (continued) |
Reported net realized foreign exchange gains or losses arise from sales of foreign currencies and currency gains or losses realized between the trade and settlement dates on investment transactions. Net unrealized exchange gains and losses arise from changes in the fair values of assets and liabilities other than investments in securities at the fiscal period end, resulting from changes in exchange rates.
F. Security transactions are recorded on the trade date for financial reporting purposes. Realized gains and losses from securities transactions are recorded using the identified cost basis. Proceeds from lawsuits related to investment holdings are recorded as realized gains in the respective Fund. Dividend income is recorded on the ex-dividend date, net of applicable taxes withheld by foreign countries. Taxable non-cash dividends are recorded as dividend income. Interest income, including amortization of premiums and accretion of discounts, is accrued on a daily basis. Dividend income from REITs is recorded based on the income included in the distributions received from the REIT investments using published REIT classifications, including some management estimates when actual amounts are not available. Distributions received in excess of this estimated amount are recorded as a reduction of the cost of investments or reclassified to capital gains. The actual amounts of income, return of capital, and capital gains are only determined by each REIT after its fiscal year-end, and may differ from the estimated amounts.
G. Distributions of net investment income and net realized gains, if any, are declared and paid at least annually. Dividends are reinvested in additional shares unless shareholders request payment in cash. Distributions are recorded on the ex-dividend date and are determined in accordance with income tax regulations which may differ from U.S. GAAP.
H. Interest and dividend income, most expenses, all realized gains and losses, and all unrealized gains and losses are allocated to the classes based upon the value of the outstanding shares in each Class. Certain costs, such as distribution and service fees are charged directly to specific classes. In addition, certain expenses have been allocated to the individual Funds in the Trust on a pro rata basis upon the respective aggregate net assets of each Fund included in the Trust.
I. The Funds may leave cash overnight in their cash account with the custodian. Periodically, a Fund may have cash due to the custodian bank as an overdraft balance. A fee is incurred on this overdraft, calculated by multiplying the overdraft by a rate based on the federal funds rate.
J. Under the Funds’ organizational documents, its Trustees and Officers are indemnified against certain liabilities arising out of the performance of their duties to the Trust. In addition, throughout the normal course of business, the Funds
| 60 | THE GUGGENHEIM FUNDS ANNUAL REPORT | |
NOTES TO CONSOLIDATED FINANCIAL STATEMENTS (continued) |
enter into contracts that contain a variety of representations and warranties which provide general indemnifications. The Funds’ maximum exposure under these arrangements is unknown, as this would involve future claims that may be made against the Funds and/or their affiliates that have not yet occurred. However, based on experience, the Funds expect the risk of loss to be remote.
2. Financial Instruments
As part of their investment strategy, the Funds utilize short sales and a variety of derivative instruments. These investments involve, to varying degrees, elements of market risk and risks in excess of the amounts recognized in the Statements of Assets and Liabilities.
A short sale is a transaction in which a Fund sells a security it does not own. If the security sold short decreases in price between the time the Fund sells the security and closes its short position, that Fund will realize a gain on the transaction. Conversely, if the security increases in price during the period, that Fund will realize a loss on the transaction. The risk of such price increases is the principal risk of engaging in short sales.
A futures contract is an agreement to purchase (long) or sell (short) an agreed amount of securities or other instruments at a set price for delivery at a future date. There are significant risks associated with a Fund’s use of futures contracts, including (i) there may be an imperfect or no correlation between the changes in market value of the underlying asset and the prices of futures contracts; (ii) there may not be a liquid secondary market for a futures contract; (iii) trading restrictions or limitations may be imposed by an exchange; and (iv) government regulations may restrict trading in futures contracts. When investing in futures, there is minimal counterparty credit risk to the Fund because futures are exchange-traded and the exchange’s clearinghouse, as counterparty to all exchange-traded futures, guarantees against default. Cash deposits are shown as restricted cash on the Statement of Assets and Liabilities; securities held as collateral are noted on the Schedule of Investments.
A swap is an agreement that obligates two parties to exchange a series of cash flows at specified intervals based upon or calculated by reference to changes in specified prices or rates for a specified amount of an underlying asset. A Fund utilizing OTC swaps bears the risk of loss of the amount expected to be received under a swap agreement in the event of the default or bankruptcy of a swap agreement counterparty. Additionally, there is no guarantee that a Fund or an underlying fund could eliminate its exposure under an outstanding swap agreement by entering into an offsetting swap agreement with the same or another party.
| | THE GUGGENHEIM FUNDS ANNUAL REPORT | 61 |
NOTES TO CONSOLIDATED FINANCIAL STATEMENTS (continued) |
A credit default swap enables a Fund to buy or sell protection against a defined credit event of an issuer or a basket of securities. Generally, the seller of credit protection against an issuer or basket of securities receives a periodic payment from the buyer to compensate against potential default events. If a default event occurs, the seller must pay the buyer the full notional value of the reference obligation in exchange for the reference obligation. If no default occurs, the counterparty will pay the stream of payments and have no further obligations to the Fund selling the credit protection. A Fund bears the risk of loss of the amount expected to be received under a swap agreement in the event of the default or bankruptcy of a swap agreement counterparty, or in the case of a credit default swap in which the Fund is selling credit protection, the default of a third party issuer.
The Funds’ use of derivative instruments provides leveraged exposure. In addition, as investment in derivative instruments generally requires a small investment relative to the amount of investment exposure assumed, this creates an opportunity for increased net income but, at the same time, additional leverage risk. The Funds’ use of leverage, through borrowings or instruments such as derivatives, may cause the Funds to be more volatile and riskier than if they had not been leveraged.
In conjunction with the use of short sales and derivative instruments, the Funds are required to maintain collateral in various forms. The Funds use, where appropriate, depending on the financial instrument utilized and the broker involved, margin deposits at the broker, cash and/or securities segregated at the custodian bank, discount notes or the repurchase agreements allocated to each Fund.
The Trust has established counterparty credit guidelines and enters into transactions only with financial institutions of investment grade or better. The Trust monitors the counterparty credit risk.
3. Fees and Other Transactions with Affiliates
Under the terms of an investment advisory contract, the Funds and each Subsidiary pay GI investment advisory fees calculated at their annualized rates below, based on their average daily net assets:
| Fund | Management Fees (as a % of Net Assets) |
| Multi-Hedge Strategies Fund | 1.15% |
| Commodities Strategy Fund | 0.75% |
| 62 | THE GUGGENHEIM FUNDS ANNUAL REPORT | |
NOTES TO CONSOLIDATED FINANCIAL STATEMENTS (continued) |
GI has contractually agreed to waive the management fee it receives from each Subsidiary in an amount equal to the management fee paid to GI by the Subsidiary. This undertaking will continue in effect for so long as the Funds invest in the Subsidiary, and may not be terminated by GI unless GI obtains the prior approval of the Funds’ Board of Trustees for such termination.
RFS provides transfer agent and administrative services to the Commodities Strategy Fund for fees calculated at the annualized rate of 0.25% based on the average daily net assets of the Fund.
RFS also provides accounting services to the Commodities Strategy Fund for fees calculated at annualized rates below, based on the average daily net assets of the Fund.
| Fund Accounting Fees | (as a % of Net Assets) |
| On the first $250 million | 0.10% |
| On the next $250 million | 0.075% |
| On the next $250 million | 0.05% |
| Over $750 million | 0.03% |
RFS engages external service providers to perform other necessary services for the Trust, such as audit and accounting related services, legal services, custody, printing and mailing, etc., on a pass-through basis. Such expenses are allocated to various Funds within the complex based on relative net assets.
As part of its agreement with the Trust, GI will pay all expenses of the Multi-Hedge Strategies Fund, including the cost of transfer agency, custody, fund administration, legal, audit and other services, except distribution and service fees, interest expense, taxes (expected to be de minimis), brokerage commissions and other expenses connected with execution of portfolio transactions, short dividend expenses, subsidiary expenses and extraordinary expenses.
The Trust has adopted a Distribution Plan applicable to A-Class shares and H-Class shares for which GFD and other firms that provide distribution and/or shareholder services (“Service Providers”) may receive compensation. If a Service Provider provides distribution services, the Funds will pay distribution fees to GFD at an annual rate not to exceed 0.25% of average daily net assets, pursuant to Rule 12b-1 of the 1940 Act. GFD, in turn, will pay the Service Provider out of its fees. GFD may, at its discretion, retain a portion of such payments to compensate itself for distribution services.
The Trust has adopted a separate Distribution and Shareholder Services Plan applicable to its C-Class shares that allows the Funds to pay annual distribution and service fees of 1.00% of the Funds’ C-Class shares average daily net assets.
| | THE GUGGENHEIM FUNDS ANNUAL REPORT | 63 |
NOTES TO CONSOLIDATED FINANCIAL STATEMENTS (continued) |
The annual 0.25% service fee compensates the shareholder’s financial adviser for providing ongoing services to the shareholder. The annual distribution fee of 0.75% reimburses GFD for paying the shareholder’s financial adviser an ongoing sales commission. GFD advances the first year’s service and distribution fees to the financial adviser. GFD retains the service and distribution fees on accounts with no authorized dealer of record.
If a Fund invests in an affiliated fund, the investing Fund’s Adviser will determine whether to waive fees at the investing fund level. Fee waivers will be calculated at the investing Fund level without regard to any expense cap in effect, if any, for the investing Fund. Fees waived under this arrangement are not subject to reimbursement to GI. For the year ended December 31, 2014, the Multi-Hedge Strategies Fund waived $41,279 related to investments in affiliated Funds.
For the year ended December 31, 2014, GFD retained sales charges of $342,892 relating to sales of A-Class shares of the Trust.
Certain trustees and officers of the Trust are also officers of GI, RFS and GFD.
4. Fair Value Measurement
In accordance with U.S. GAAP, fair value is defined as the price that the Funds would receive to sell an investment or pay to transfer a liability in an orderly transaction with an independent buyer in the principal market, or in the absence of a principal market, the most advantageous market for the investment or liability. U.S. GAAP establishes a three-tier fair value hierarchy based on the types of inputs used to value assets and liabilities and requires corresponding disclosure. The hierarchy and the corresponding inputs are summarized below:
| Level 1 — | quoted prices in active markets for identical assets or liabilities. |
| Level 2 — | significant other observable inputs (for example quoted prices for securities that are similar based on characteristics such as interest rates, prepayment speeds, credit risk, etc.). |
| Level 3 — | significant unobservable inputs based on the best information available under the circumstances, to the extent observable inputs are not available, which may include assumptions. |
The types of inputs available depend on a variety of factors, such as the type of security and the characteristics of the markets in which it trades, if any. Fair valuation determinations that rely on fewer or no observable inputs require greater judgment. Accordingly, fair value determinations for Level 3 securities require the greatest amount of judgment.
| 64 | THE GUGGENHEIM FUNDS ANNUAL REPORT | |
NOTES TO CONSOLIDATED FINANCIAL STATEMENTS (continued) |
The following table summarizes the inputs used to value the Funds’ investments at December 31, 2014:
| | | Level 1 Investments In Securities | | | Level 1 Other Financial Instruments* | | | Level 2 Investments In Securities | | | Level 2 Other Financial Instruments* | | | Level 3 Investments In Securities | | | Total | |
| Assets | | | | | | | | | | | | | | | | | | |
| Multi-Hedge Strategies Fund | | $ | 74,726,761 | | | $ | 1,191,728 | | | $ | 20,098,222 | | | $ | 801,177 | | | $ | — | | | $ | 96,817,888 | |
| Commodities Strategy Fund | | | 3,796,970 | | | | 22,602 | | | | 425,200 | | | | — | | | | — | | | | 4,244,772 | |
| | |
| Liabilities | | | | | | | | | | | | | | | | | | | | | | | | |
| Multi-Hedge Strategies Fund | | $ | 49,602,029 | | | $ | 112,263 | | | $ | — | | | $ | 22,302 | | | $ | — | | | $ | 49,736,594 | |
| Commodities Strategy Fund | | | — | | | | 575,011 | | | | — | | | | — | | | | — | | | | 575,011 | |
| * | Other financial instruments may include futures contracts and/or swaps, which are reported as unrealized gain/loss at period end. |
For the year ended December 31, 2014, there were no transfers between levels.
The inputs or methodologies used for valuing securities are not necessarily an indication of the risk associated with investing in those securities. The suitability of the techniques and sources employed to determine fair valuation are regularly monitored and subject to change.
5. Repurchase Agreements
The Funds transfer uninvested cash balances into a single joint account, the daily aggregate balance of which is invested in one or more repurchase agreements collateralized by obligations of the U.S. Treasury and U.S. Government Agencies. The collateral is in the possession of the Funds’ custodian and is evaluated to ensure that its market value exceeds, at a minimum, 102% of the original face amount of the repurchase agreements. Each Fund holds a pro rata share of the collateral based on the dollar amount of the repurchase agreement entered into by each Fund.
| | THE GUGGENHEIM FUNDS ANNUAL REPORT | 65 |
NOTES TO CONSOLIDATED FINANCIAL STATEMENTS (continued) |
At December 31, 2014, the repurchase agreements in the joint account were as follows:
Counterparty and Terms of Agreement | Face Value | Repurchase Price | | Collateral | Par Value | Fair Value |
| HSBC Group | | | | U.S. Treasury Strips | | |
| 0.02% | | | | 0.00% | | |
| Due 01/02/15 | $452,412,764 | $452,413,267 | | 02/15/26 - 11/15/42 | $944,521,100 | $461,461,094 |
| | | | | | | |
| RBC Capital Markets | | | | U.S. TIP Note | | |
| 0.03% | | | | 0.63% | | |
| Due 01/02/15 | 244,412,764 | 244,413,171 | | 07/15/21 | 232,332,200 | 249,301,020 |
In the event of counterparty default, the Funds have the right to collect the collateral to offset losses incurred. There is potential loss to the Funds in the event the Funds are delayed or prevented from exercising their rights to dispose of the collateral securities, including the risk of a possible decline in the value of the underlying securities during the period while the Funds seek to assert their rights. The Funds’ investment adviser, acting under the supervision of the Board of Trustees, reviews the value of the collateral and the creditworthiness of those banks and dealers with which the Funds enter into repurchase agreements to evaluate potential risks.
6. Portfolio Securities Loaned
The Funds may lend their securities to approved brokers to earn additional income. Security lending income shown on the Statements of Operations is shown net of rebates paid to the borrowers and earnings on cash collateral investments shared with the lending agent. Within this arrangement, the Funds act as the lender, Credit Suisse acts as the lending agent, and other approved registered broker dealers act as the borrowers. The Funds receive cash collateral, valued at 102% of the value of the securities on loan. Under the terms of the Funds’ securities lending agreement with Credit Suisse, cash collateral is invested in one or more joint repurchase agreements collateralized by obligations of the U.S. Treasury or Government Agencies and cash. The Funds bear the risk of loss on cash collateral investments. Collateral is maintained over the life of the loan in an amount not less than the value of loaned securities, as determined at the close of fund business each day; any additional collateral required due to changes in security values is delivered to the Funds the next business day. Although the collateral mitigates the risk, the Funds could experience a delay in recovering its securities and a possible loss of income or value if the borrower fails to return the securities. The Funds have the right under the securities lending agreement to recover the securities from the borrower on demand.
| 66 | THE GUGGENHEIM FUNDS ANNUAL REPORT | |
NOTES TO CONSOLIDATED FINANCIAL STATEMENTS (continued) |
At December 31, 2014, the Funds participated in securities lending as follows:
| Fund | | Value of Securities Loaned | | | Cash Collateral Received | |
| Multi-Hedge Strategies Fund | | $ | 192,994 | | | $ | 199,600 | |
Cash collateral received was invested in the following joint repurchase agreements at December 31, 2014:
Counterparty and Terms of Agreement | Face Value | Repurchase Price | | Collateral | Par Value | Fair Value |
| HSBC Securities, Inc. | | | | Fannie Mae Strips | | |
| 0.06% | | | | 0.00% | | |
| Due 01/02/15 | $124,751 | $124,751 | | 11/15/19 - 07/15/37 | $126,886 | $82,596 |
| | | | | Federal Farm Credit Bank | | |
| | | | | 0.34% - 2.22% | | |
| | | | | 01/14/16 - 01/17/23 | 44,749 | 44,651 |
| | | | | | |
| BNP Paribas Securities Corp. | | | U.S. Treasury Note | | |
| 0.06% | | | | 1.25% | | |
| Due 01/02/15 | 50,420 | 50,420 | | 04/30/19 | 51,998 | 51,428 |
| | | | | | | |
| Barclays Capital, Inc. | | | | U.S. Treasury Note | | |
| 0.05% | | | | 1.63% | | |
| Due 01/02/15 | 23,911 | 23,911 | | 12/31/19 | 24,458 | 24,389 |
There is also $519 in segregated cash held as collateral.
7. Derivative Investment Holdings Categorized by Risk Exposure
U.S. GAAP requires disclosures to enable investors to better understand how and why the Funds use derivative instruments, how these derivative instruments are accounted for and their effects on the Funds’ financial position and results of operations.
The following Funds utilized derivatives for the following purposes:
| Fund | Index Exposure | Liquidity | Hedging | Income | Speculation |
| Multi-Hedge Strategies Fund | | | x | x | x |
| Commodities Strategy Fund | x | x | | | |
| | THE GUGGENHEIM FUNDS ANNUAL REPORT | 67 |
NOTES TO CONSOLIDATED FINANCIAL STATEMENTS (continued) |
The following table represents the notional amount of derivative instruments outstanding as an approximate percentage of the Funds’ net assets on a daily basis.
| | Approximate percentage of Fund's Net Assets on a daily basis |
| Fund | Long | Short |
| Multi-Hedge Strategies Fund | 140% | 100% |
| Commodities Strategy Fund | 105% | — |
The following is a summary of the location of derivative investments on the Funds’ Statements of Assets and Liabilities as of December 31, 2014:
| Derivative Investment Type | Asset Derivatives | Liability Derivatives |
| Equity/Currency/Interest Rate/Commodity contracts | Variation margin | Variation margin |
| Equity/Credit contracts | Unrealized appreciation on swap agreements | Unrealized depreciation on swap agreements |
The following table sets forth the fair value of the Funds’ derivative investments categorized by primary risk exposure at December 31, 2014:
| Asset Derivative Investments Value | |
| Fund | | Futures Equity Contracts* | | | Swaps Equity Contracts | | | Futures Currency Contracts* | | | Futures Interest Rate Contracts* | | | Futures Commodity Contracts* | | | Swaps Credit Default Contracts | | | Total Value at December 31, 2014 | |
| Multi-Hedge Strategies Fund | | $ | 373,394 | | | $ | 237,128 | | | $ | 70,007 | | | $ | 785,707 | | | $ | 526,669 | | | $ | 60,876 | | | $ | 2,053,781 | |
| Commodities Strategy Fund | | | — | | | | — | | | | — | | | | — | | | | 22,602 | | | | — | | | | 22,602 | |
| Liability Derivative Investments Value | |
| Fund | | Futures Equity Contracts* | | | Swaps Equity Contracts | | | Futures Currency Contracts* | | | Futures Interest Rate Contracts* | | | Futures Commodity Contracts* | | | Swaps Credit Default Contracts | | | Total Value at December 31, 2014 | |
| Multi-Hedge Strategies Fund | | $ | 57,499 | | | $ | — | | | $ | 482 | | | $ | 528 | | | $ | 76,056 | | | $ | — | | | $ | 134,565 | |
| Commodities Strategy Fund | | | — | | | | — | | | | — | | | | — | | | | 575,011 | | | | — | | | | 575,011 | |
| * | Includes cumulative appreciation (depreciation) of futures contracts as reported on the Schedules of Investments. Only current day’s variation margin is reported within the Statements of Assets and Liabilities. |
| 68 | THE GUGGENHEIM FUNDS ANNUAL REPORT | |
NOTES TO CONSOLIDATED FINANCIAL STATEMENTS (continued) |
The following is a summary of the location of derivative investments on the Funds' Statements of Operations for the year ended December 31, 2014:
| Derivative Investment Type | Location of Gain (Loss) on Derivatives |
| Equity/Currency/Interest Rate/Commodity contracts | Net realized gain (loss) on futures contracts |
| | Net change in unrealized appreciation (depreciation) on futures contracts |
| Equity/Credit contracts | Net realized gain (loss) on swap agreements |
| | Net change in unrealized appreciation (depreciation) on swap agreements |
The following is a summary of the Funds’ realized gain (loss) and change in unrealized appreciation (depreciation) on derivative investments recognized on the Statements of Operations categorized by primary risk exposure for the year ended December 31, 2014:
| Realized Gain (Loss) on Derivative Investments Recognized on the Statements of Operations | |
| Fund | | Futures Equity Contracts | | | Swaps Equity Contracts | | | Futures Currency Contracts | | | Futures Interest Rate Contracts | | | Futures Commodity Contracts | | | Swaps Credit Default Contracts | | | Total | |
| Multi-Hedge Strategies Fund | | $ | (436,919 | ) | | $ | 721,305 | | | $ | 502,075 | | | $ | 1,247,670 | | | $ | 2,153,406 | | | $ | (16,527 | ) | | $ | 4,171,010 | |
| Commodities Strategy Fund | | | — | | | | — | | | | — | | | | — | | | | (6,325,844 | ) | | | — | | | | (6,325,844 | ) |
| Change in Unrealized Appreciation (Depreciation) on Derivative Investments Recognized on the Statements of Operations | |
| Fund | | Futures Equity Contracts | | | Swaps Equity Contracts | | | Futures Currency Contracts | | | Futures Interest Rate Contracts | | | Futures Commodity Contracts | | | Swaps Credit Default Contracts | | | Total | |
| Multi-Hedge Strategies Fund | | $ | 49,387 | | | $ | (81,632 | ) | | $ | (238,543 | ) | | $ | 1,027,919 | | | $ | (109,224 | ) | | $ | 60,876 | | | $ | 708,783 | |
| Commodities Strategy Fund | | | — | | | | — | | | | — | | | | — | | | | (632,267 | ) | | | — | | | | (632,267 | ) |
| | THE GUGGENHEIM FUNDS ANNUAL REPORT | 69 |
NOTES TO CONSOLIDATED FINANCIAL STATEMENTS (continued) |
8. Offsetting
In the normal course of business, the Funds enter into transactions subject to enforceable master netting arrangements or other similar arrangements. Generally, the right to offset in those agreements allows the Funds to counteract the exposure to a specific counterparty with collateral received or delivered to that counterparty based on the terms of the arrangements. These arrangements provide for the right to liquidate upon the occurrence of an event of default, credit event upon merger or additional termination event.
In order to better define their contractual rights and to secure rights that will help the Funds mitigate their counterparty risk, the Funds may enter into an International Swaps and Derivatives Association, Inc. Master Agreement (“ISDA Master Agreement”) or similar agreement with their derivative contract counterparties. An ISDA Master Agreement is a bilateral agreement between a Fund and a counterparty that governs OTC derivatives, including foreign exchange contracts, and typically contains, among other things, collateral posting terms and netting provisions in the event of a default and/or termination event. The provisions of the ISDA Master Agreement typically permit a single net payment in the event of a default (close-out netting) or similar event, including the bankruptcy or insolvency of the counterparty.
For derivatives traded under an ISDA Master Agreement, the collateral requirements are typically calculated by netting the mark to market amount for each transaction under such agreement and comparing that amount to the value of any collateral currently pledged by the Funds and the counterparty. For financial reporting purposes, cash collateral that has been pledged to cover obligations of the Funds and cash collateral received from the counterparty, if any, is reported separately on the Statement of Assets and Liabilities as segregated cash with broker/receivable for variation margin, or payable for swap settlement/variation margin. Generally, the amount of collateral due from or to a counterparty must exceed a minimum transfer amount threshold (e.g., $300,000) before a transfer is required to be made. To the extent amounts due to the Funds from their counterparties are not fully collateralized, contractually or otherwise, the Funds bear the risk of loss from counterparty nonperformance. The Funds attempt to mitigate counterparty risk by only entering into agreements with counterparties that they believe to be of good standing and by monitoring the financial stability of those counterparties.
For financial reporting purposes, the Funds do not offset derivative assets and derivative liabilities that are subject to netting arrangements in the Statements of Assets and Liabilities.
| 70 | THE GUGGENHEIM FUNDS ANNUAL REPORT | |
NOTES TO CONSOLIDATED FINANCIAL STATEMENTS (continued) |
The following tables present derivative financial instruments and secured financing transactions that are subject to enforceable netting arrangements and offset in the Statements of Assets and Liabilities in conformity with U.S. GAAP.
| | | | | | | | | | | | | Gross Amounts Not Offset in the Statements of Assets and Liabilities | | | | |
| Fund | Instrument | | Gross Amounts of Recognized Assets1 | | | Gross Amounts Offset In the Statements of Assets and Liabilities | | | Net Amount of Assets Presented on the Statements of Assets and Liabilities | | | Financial Instruments | | | Cash Collateral Received | | | Net Amount | |
| Multi-Hedge Strategies Fund | Swap equity contracts | | $ | 237,128 | | | $ | — | | | $ | 237,128 | | | $ | — | | | $ | — | | | $ | 237,128 | |
1 | Exchange traded futures and centrally cleared swaps are excluded from these reported amounts. |
9. Federal Income Tax Information
The Funds intend to comply with the provisions of Subchapter M of the Internal Revenue Code applicable to regulated investment companies and will distribute substantially all taxable net investment income and capital gains sufficient to relieve the Funds from all, or substantially all, federal income, excise and state income taxes. Therefore, no provision for federal or state income tax is required.
Tax positions taken or expected to be taken in the course of preparing the Funds' tax returns are evaluated to determine whether the tax positions are “more-likely-than-not” of being sustained by the applicable tax authority. Tax positions not deemed to meet the more-likely-than-not threshold would be recorded as a tax benefit or expense in the current year. Management has analyzed the Funds' tax positions taken, or to be taken, on Federal income tax returns for all open tax years, and has concluded that no provision for income tax is required in the Funds' financial statements. The Funds' federal tax returns are subject to examination by the Internal Revenue Service for a period of three years after they are filed.
Each Fund intends to invest up to 25% of its assets in its Subsidiary which is expected to provide the Funds with exposure to the commodities markets within the limitations of the federal tax requirements under Subchapter M of the Internal Revenue Code. The Funds have received a private letter ruling from the IRS that concludes that the income the Funds receive from the Subsidiary will constitute qualifying income for purposes of Subchapter M of the Internal Revenue Code. The Subsidiary will be classified as a corporation for U.S. federal income tax purposes.
| | THE GUGGENHEIM FUNDS ANNUAL REPORT | 71 |
NOTES TO CONSOLIDATED FINANCIAL STATEMENTS (continued) |
A foreign corporation, such as the Subsidiary, will generally not be subject to U.S. federal income taxation unless it is deemed to be engaged in a U.S. trade or business.
Tax basis capital losses in excess of capital gains are carried forward to offset future net capital gains. For the year ended December 31, 2014, the following capital loss carryforward amounts expired or were used:
| Fund | | Amount | |
| Multi-Hedge Strategies Fund | | $ | 2,794,444 | |
The tax character of distributions paid during the year ended December 31, 2014 was as follows:
| Fund | | Ordinary Income | | | Long-Term Capital Gain | | | Total Distributions | |
| Multi-Hedge Strategies Fund | | $ | 800,775 | | | $ | — | | | $ | 800,775 | |
| Commodities Strategy Fund | | | — | | | | — | | | | — | |
The tax character of distributions paid during the year ended December 31, 2013 was as follows:
| Fund | | Ordinary Income | | | Long-Term Capital Gain | | | Total Distributions | |
| Multi-Hedge Strategies Fund | | $ | — | | | $ | — | | | $ | — | |
| Commodities Strategy Fund | | | — | | | | — | | | | — | |
Note: For federal income tax purposes, short-term capital gain distributions are treated as ordinary income distributions.
The tax character of distributable earnings/(accumulated losses) at December 31, 2014 was as follows:
| Fund | | Undistributed Ordinary Income | | | Undistributed Long-Term Capital Gain | | | Net Unrealized Appreciation/ Depreciation | | | Capital Loss Carryforward | | | Other Temporary Difference | |
| Multi-Hedge Strategies Fund | | $ | — | | | $ | — | | | $ | 1,339,243 | | | $ | (43,960,867 | ) | | $ | (153,042 | ) |
| Commodities Strategy Fund | | | — | | | | — | | | | (3,341,975 | ) | | | (19,888,550 | ) | | | — | |
| 72 | THE GUGGENHEIM FUNDS ANNUAL REPORT | |
NOTES TO CONSOLIDATED FINANCIAL STATEMENTS (continued) |
For Federal income tax purposes, capital loss carryforwards represent realized losses of the Funds that may be carried forward and applied against future capital gains. For taxable years beginning on or before December 22, 2010, such capital losses may be carried forward for a maximum of eight years. Under the RIC Modernization Act of 2010, the Funds are permitted to carry forward capital losses incurred in taxable years beginning after December 22, 2010 for an unlimited period. However, any losses incurred during those taxable years must be utilized prior to the losses incurred in pre-enactment taxable years. As a result of this ordering rule, pre-enactment capital loss carryforwards may be more likely to expire unused. Additionally, post-enactment capital losses that are carried forward will retain their character as either short-term or long-term capital losses rather than being considered all short-term as under previous law. As of December 31, 2014, capital loss carryforwards for the Funds were as follows:
| | | | | | | | | | | | | | | Unlimited | | | | |
| Fund | | Expires in 2015 | | | Expires in 2016 | | | Expires in 2017 | | | Expires in 2018 | | | Short-Term | | | Long-Term | | | Total Capital Loss Carryforward | |
| Multi-Hedge Strategies Fund | | $ | (1,014,562 | ) | | $ | (33,671,475 | ) | | $ | (8,823,539 | ) | | $ | (219,647 | ) | | $ | (53,744 | ) | | $ | (177,900 | ) | | $ | (43,960,867 | )* |
| Commodities Strategy Fund | | | — | | | | — | | | | (19,850,783 | ) | | | — | | | | (37,408 | ) | | | (359 | ) | | | (19,888,550 | ) |
| * | In accordance with section 382 of the Internal Revenue Code, a portion of certain fund losses are subject to an annual limitation. Note, this annual limitation is generally applicable to all of the capital loss carryforwards shown with respect to each Fund. |
Net investment income and net realized gains (losses) may differ for financial statement and tax purposes because of temporary or permanent book/tax differences. These differences are primarily due to mark-market of futures contracts and foreign currency gains and losses. Additional differences may result from the tax treatment of net investment losses and expired capital loss carryforwards. To the extent these differences are permanent, reclassifications are made to the appropriate equity accounts in the period that the differences arise. These reclassifications have no effect on net assets or NAV.
On the Statements of Assets and Liabilities, the following adjustments were made for permanent book/tax differences:
| Fund | | Paid In Capital | | | Undistributed Net Investment Income | | | Accumulated Net Realized Gain (Loss) | |
| Multi-Hedge Strategies Fund | | $ | 1,712,666 | | | $ | 416,753 | | | $ | (2,129,419 | ) |
| Commodities Strategy Fund | | | (6,545,859 | ) | | | 220,015 | | | | 6,325,844 | |
| | THE GUGGENHEIM FUNDS ANNUAL REPORT | 73 |
NOTES TO CONSOLIDATED FINANCIAL STATEMENTS (continued) |
At December 31, 2014, the cost of securities for Federal income tax purposes, the aggregate gross unrealized gain for all securities for which there was an excess of value over tax cost and the aggregate gross unrealized loss for all securities for which there was an excess of tax cost over value, were as follows:
| Fund | | Tax Cost | | | Tax Unrealized Gain | | | Tax Unrealized Loss | | | Net Unrealized Gain (Loss) | |
| Multi-Hedge Strategies Fund | | $ | 90,372,915 | | | $ | 4,936,392 | | | $ | (2,143,772 | ) | | $ | 2,792,620 | |
| Commodities Strategy Fund | | | 7,011,736 | | | | — | | | | (2,789,566 | ) | | | (2,789,566 | ) |
10. Securities Transactions
For the year ended December 31, 2014, the cost of purchases and proceeds from sales of investment securities, excluding government securities, short-term investments and derivatives, were as follows:
| Fund | | Purchases | | | Sales | |
| Multi-Hedge Strategies Fund | | $ | 84,229,257 | | | $ | 69,113,803 | |
| Commodities Strategy Fund | | | 19,603,727 | | | | 15,750,000 | |
11. Affiliated and/or Related Transactions
Investments representing 5% or more of the outstanding voting shares of a portfolio company of a fund, or control of or by, or common control under GI, result in that portfolio company being considered an affiliated company of such fund, as defined in the 1940 Act.
The Funds may invest in the Guggenheim Strategy Funds Trust consisting of Guggenheim Strategy Fund I, Guggenheim Strategy Fund II, and Guggenheim Strategy Fund III (collectively, the “Cash Management Funds”), open-end management investment companies managed by GI. The Cash Management Funds, which launched on March 11, 2014, are offered as cash management options only to mutual funds, trusts, and other accounts managed by GI and/or its affiliates, and are not available to the public. The Cash Management Funds pay no investment management fees. The Cash Management Funds’ annual report on Form N-CSR dated September 30, 2014 is available publicly or upon request. This information is also available from the EDGAR database on the SEC’s website at http://www.sec.gov.
12. Line of Credit
The Trust, along with other affiliated trusts, secured an uncommitted, $75,000,000 line of credit from U.S. Bank, N.A., which expires June 13, 2015. This line of credit is reserved for emergency or temporary purposes. Borrowings, if any,
| 74 | THE GUGGENHEIM FUNDS ANNUAL REPORT | |
NOTES TO CONSOLIDATED FINANCIAL STATEMENTS (continued) |
under this arrangement bear interest equal to the Prime Rate, minus 2%, which shall be paid monthly, averaging 1.25% for the year ended December 31, 2014. The Funds did not have any borrowings under this agreement at December 31, 2014, and did not participate in borrowing during the year.
13. Legal Proceedings
Tribune Company
Rydex Series Funds has been named as a defendant and a putative member of the proposed defendant class of shareholders in the case entitled Kirschner v. FitzSimons, No. 12-2652 (S.D.N.Y.) (formerly Official Committee of Unsecured Creditors of Tribune Co. v. FitzSimons, Adv. Pro. No. 10-54010 (Bankr. D. Del.)) (the “FitzSimons action”), as a result of ownership by certain series of the Rydex Series Funds of shares in the Tribune Company (“Tribune”) in 2007, when Tribune effected a leveraged buyout transaction (“LBO”) by which Tribune converted to a privately-held company. In his complaint, the plaintiff has alleged that, in connection with the LBO, Tribune insiders and shareholders were overpaid for their Tribune stock using financing that the insiders knew would, and ultimately did, leave the Tribune Company insolvent. The plaintiff has asserted claims against certain insiders, major shareholders, professional advisers, and others involved in the LBO. The plaintiff is also attempting to obtain from former Tribune shareholders, including the Rydex Series Funds, the proceeds they received in connection with the LBO.
In June 2011, a group of Tribune creditors filed multiple actions against former Tribune shareholders involving state law constructive fraudulent conveyance claims arising out of the 2007 LBO (the “SLCFC actions”). Rydex Series Funds has been named as a defendant in one or more of these suits. In those actions, the creditors seek to recover from Tribune’s former shareholders the proceeds received in connection with the 2007 LBO.
The FitzSimons action and the SLCFC actions have been consolidated with the majority of the other Tribune LBO-related lawsuits in a multidistrict litigation proceeding captioned In re Tribune Company Fraudulent Conveyance Litig., No. 11-md-2696 (S.D.N.Y.) (the “MDL Proceeding”).
On September 23, 2013, the District Court granted the defendants’ omnibus motion to dismiss the SLCFC actions, on the basis that the creditors lacked standing. On September 30, 2013, the creditors filed a notice of appeal of the September 23 order. On October 28, 2013, the defendants filed a joint notice of cross-appeal of that same order. The SLCFC appeals have been fully briefed, and oral argument took place on November 5, 2014. The Court has not yet issued a decision on the appeals.
| | THE GUGGENHEIM FUNDS ANNUAL REPORT | 75 |
NOTES TO CONSOLIDATED FINANCIAL STATEMENTS (continued) |
On May 23, 2014, the defendants filed motions to dismiss the FitzSimons action, including a global motion to dismiss Count I, which is the claim brought against former Tribune shareholders for intentional fraudulent conveyance under U.S. federal law. The Court has not yet issued a decision on any of these motions.
None of these lawsuits alleges any wrongdoing on the part of Rydex Series Funds. The following series of Rydex Series Funds held shares of Tribune and tendered these shares as part of Tribune’s LBO: Nova Fund, S&P 500® Pure Value Fund, Multi-Cap Core Equity Fund, S&P 500® Fund, Multi-Hedge Strategies Fund and Hedged Equity Fund (the “Funds”). The value of the proceeds received by the foregoing Funds was $28,220, $109,242, $9,860, $3,400, $1,181,160, and $10,880, respectively. At this stage of the proceedings, Rydex Series Funds is not able to make a reliable predication as to the outcome of these lawsuits or the effect, if any, on a Fund’s net asset value.
Lyondell Chemical Company
In December 2011, Rydex Series Funds was named as a defendant in Weisfelner, as Trustee of the LB Creditor Trust, v. Fund 1 (In re Lyondell Chemical Co.), Adv. Pro. No. 10-4609 (Bankr. S.D.N.Y.) (the “Creditor Trust action”).
Similar to the claims made in the Tribune matter, the Weisfelner complaint seeks to have set aside and recovered as fraudulent transfers from former Lyondell Chemical Company (“Lyondell”) shareholders the consideration paid to them pursuant to the cash out merger of Lyondell shareholders in connection with the combination of Lyondell and Basell AF in 2007. Lyondell filed for bankruptcy in 2008.
On April 7, 2014, the plaintiff filed a Third Amended Complaint. In the related action entitled Weisfelner, as Trustee of the LB Litigation Trust v. A. Holmes & H. Holmes TTEE (In re Lyondell Co.), Adversary Proceeding No. 10-5525 (Bankr. S.D.N.Y.) (the “Litigation Trust action”), the plaintiff also filed a Second Amended Complaint that alleges a claim against the former Lyondell shareholders under federal law for intentional fraudulent transfer.
On May 8, 2014, the plaintiff in the Litigation Trust action filed a motion to certify a defendant class generally comprised of all former Lyondell shareholders that received proceeds in exchange for their shares in the 2007 merger transaction.
On July 30, 2014, the defendants filed a motion to dismiss all three lawsuits. The Court will held an oral argument on the motions to dismiss and on the motion for class certification on January 14 and January 15, 2015. Discovery shall commence in the near future.
| 76 | THE GUGGENHEIM FUNDS ANNUAL REPORT | |
NOTES TO CONSOLIDATED FINANCIAL STATEMENTS (concluded) |
These lawsuits do not allege any wrongdoing on the part of Rydex Series Funds. The following series of Rydex Series Funds received cash proceeds from the cash out merger in the following amounts: Basic Materials Fund - $1,725,168; Long Short Equity Fund f/k/a U.S. Long Short Momentum Fund - $2,193,600; Global 130/30 Strategy Fund - $37,920; Hedged Equity Fund - $1,440; and Multi-Hedge Strategies Fund - $1,116,480. At this stage of the proceedings, Rydex Series Funds is not able to make a reliable predication as to the outcome of these lawsuits or the effect, if any, on a Fund’s net asset value.
| | THE GUGGENHEIM FUNDS ANNUAL REPORT | 77 |
| REPORT OF INDEPENDENT REGISTERED PUBLIC ACCOUNTING FIRM |
The Board of Trustees and Shareholders of Rydex Series Funds:
We have audited the accompanying consolidated statements of assets and liabilities, including the consolidated schedules of investments, of Guggenheim Multi-Hedge Strategies Fund and Rydex Commodities Strategy Fund (two of the series constituting the Rydex Series Funds) (the “Funds”) as of December 31, 2014, and the related consolidated statements of operations for the year then ended, the consolidated statements of changes in net assets for each of the two years in the period then ended, and the consolidated financial highlights for each of the years or periods indicated therein. These financial statements and financial highlights are the responsibility of the Funds’ management. Our responsibility is to express an opinion on these financial statements and financial highlights based on our audits.
We conducted our audits in accordance with the standards of the Public Company Accounting Oversight Board (United States). Those standards require that we plan and perform the audit to obtain reasonable assurance about whether the financial statements and financial highlights are free of material misstatement. We were not engaged to perform an audit of the Funds’ internal control over financial reporting. Our audits included consideration of internal control over financial reporting as a basis for designing audit procedures that are appropriate in the circumstances, but not for the purpose of expressing an opinion on the effectiveness of the Funds’ internal control over financial reporting. Accordingly, we express no such opinion. An audit also includes examining, on a test basis, evidence supporting the amounts and disclosures in the financial statements and financial highlights, assessing the accounting principles used and significant estimates made by management, and evaluating the overall financial statement presentation. Our procedures included confirmation of securities owned as of December 31, 2014, by correspondence with the custodian, transfer agent, and brokers or by other appropriate auditing procedures where replies from brokers were not received. We believe that our audits provide a reasonable basis for our opinion.
In our opinion, the financial statements and financial highlights referred to above present fairly, in all material respects, the consolidated financial position of the above listed Funds (two of the series constituting the Rydex Series Funds) at December 31, 2014, the consolidated results of their operations for the year then ended, the consolidated changes in their net assets for each of the two years in the period then ended, and their consolidated financial highlights for each of the years or periods indicated therein, in conformity with U.S. generally accepted accounting principles.
McLean, Virginia
February 26, 2015
| 78 | THE GUGGENHEIM FUNDS ANNUAL REPORT | |
OTHER INFORMATION (Unaudited) |
Proxy Voting Information
A description of the policies and procedures that the Trust uses to determine how to vote proxies relating to securities held in the Funds’ portfolios is available, without charge and upon request, by calling 800.820.0888. This information is also available from the EDGAR database on the SEC’s website at http://www.sec.gov.
Information regarding how the Funds voted proxies relating to portfolio securities during the most recent 12-month period ended June 30 is available without charge, upon request, by calling 800.820.0888. This information is also available from the EDGAR database on the SEC’s website at http://www.sec.gov.
Quarterly Portfolio Schedules Information
The Trust files its complete schedule of portfolio holdings with the SEC for the first and third quarters of each fiscal year on Form N-Q; which are available on the SEC’s website at http://www.sec.gov. The Funds’ Forms N-Q may be reviewed and copied at the SEC’s Public Reference Room in Washington, DC, and that information on the operation of the Public Reference Room may be obtained by calling 800-SEC-0330. Copies of the portfolio holdings are also available to shareholders, without charge and upon request, by calling 800.820.0888.
Distributor Change
Effective March 3, 2014, Guggenheim Distributors, LLC (“GD”), the distributor for shares of the Funds was consolidated into and with Guggenheim Funds Distributors, LLC (“GFD”). Following the consolidation, GFD serves as the Funds’ distributor.
GD and GFD are both indirect, wholly-owned subsidiaries of Guggenheim Capital, LLC and, therefore, the consolidation will not result in a change of actual control of the Funds’ distributor. The primary goal of the consolidation is to achieve greater operational efficiencies and allow all of the Guggenheim funds, including funds that are not series of the Trusts, to be distributed by a single distributor.
The consolidation is not expected to affect the day-to-day management of the Funds or result in any material changes to the distribution of the Funds, including any changes to the distribution fees paid by the Funds.
| | THE GUGGENHEIM FUNDS ANNUAL REPORT | 79 |
INFORMATION ON BOARD OF TRUSTEES AND OFFICERS (Unaudited) |
A Board of Trustees oversees the Trust, as well as other trusts of GI, in which its members have no stated term of service, and continue to serve after election until resignation. The Statement of Additional Information includes further information about Fund Trustees and Officers, and can be obtained without charge by calling 800.820.0888.
Name, Address* and Year of Birth of Trustee | Position(s) Held with the Trust, Term of Office and Length of Time Served | Principal Occupation(s) During Past 5 Years | Number of Portfolios in Fund Complex Overseen by Trustee*** | Other Directorships Held by Trustee |
| INTERESTED TRUSTEE | | | |
Donald C. Cacciapaglia** (1951) | Trustee from 2012 to present. | Current: President and CEO, certain other funds in the Fund Complex (2012-present); Vice Chairman, Guggenheim Investments (2010-present). Former: Chairman and CEO, Channel Capital Group, Inc. (2002-2010). | 222 | Delaware Life (2013-present); Guggenheim Life and Annuity Company (2011-present); Paragon Life Insurance Company of Indiana (2011-present). |
| INDEPENDENT TRUSTEES | | | |
Corey A. Colehour (1945) | Trustee and Member of the Audit, Governance, Nominating, and Investment and Performance Committees from 1998 to present. | Retired. | 133 | None. |
J. Kenneth Dalton (1941) | Trustee, Member and Chairman of the Audit Committee, and Member of the Governance and Nominating Committees from 1998 to present; and Member of the Risk Oversight Committee from 2010 to present. | Retired. | 133 | Trustee of Epiphany Funds (4) (2009-present). |
| 80 | THE GUGGENHEIM FUNDS ANNUAL REPORT | |
INFORMATION ON BOARD OF TRUSTEES AND OFFICERS (Unaudited)(continued) |
Name, Address* and Year of Birth of Trustee | Position(s) Held with the Trust, Term of Office and Length of Time Served | Principal Occupation(s) During Past 5 Years | Number of Portfolios in Fund Complex Overseen by Trustee*** | Other Directorships Held by Trustee |
| INDEPENDENT TRUSTEES - concluded | |
John O. Demaret (1940) | Vice Chairman of the Board of Trustees from 2014 to present; Trustee from 1998 to present and Chairman of the Board from 2006 to 2014; Member and Chairman of the Audit Committee from 1998 to present; and Member of the Risk Oversight Committee from 2010 to present. | Retired. | 133 | None. |
Werner E. Keller (1940) | Chairman of the Board from 2014 to present; Vice Chairman of the Board of Trustees from 2010 to 2014; Trustee and Member of the Audit, Governance, and Nominating Committees from 2005 to present; and Chairman and Member of the Risk Oversight Committee from 2010 to present. | Current: Founder and President, Keller Partners, LLC (investment research firm) (2005-present). | 133 | None. |
Thomas F. Lydon, Jr. (1960) | Trustee and Member of the Audit, Governance, and Nominating Committees from 2005 to present. | Current: President, Global Trends Investments (registered investment adviser) (1996-present). | 133 | US Global Investors (GROW) (1995-present). |
Patrick T. McCarville (1942) | Trustee, Member of the Audit Committee, and Chairman and Member of the Governance and Nominating Committees from 1998 to present. | Retired. Former: Chief Executive Officer, Par Industries, Inc., d/b/a Par Leasing (1977-2010). | 133 | None. |
| | THE GUGGENHEIM FUNDS ANNUAL REPORT | 81 |
INFORMATION ON BOARD OF TRUSTEES AND OFFICERS (Unaudited)(continued) |
Name, Address and Year of Birth | Position(s) Held with the Trust, Term of Office and Length of Time Served | Principal Occupation(s) During Past 5 Years |
| OFFICERS | | |
Donald C. Cacciapaglia (1951) | President (2012-present). | Current: President and CEO, certain other funds in the Fund Complex (2012-present); Vice Chairman, Guggenheim Investments (2010-present). Former: Chairman and CEO, Channel Capital Group Inc. (2002-2010). |
Michael P. Byrum (1970) | Vice President (1999-present). | Current: Senior Vice President, Security Investors, LLC (2010-present); President and Chief Investment Officer, Rydex Holdings, LLC (2008-present); Director and Chairman, Advisory Research Center, Inc. (2006-present); Manager, Guggenheim Specialized Products, LLC (2005-present). Former: Vice President, Guggenheim Distributors, LLC (2009); Director (2009-2010) and Secretary (2002-2010), Rydex Fund Services, LLC; Director (2008-2010), Chief Investment Officer (2006-2010), President (2004-2010) and Secretary (2002-2010), Rydex Advisors, LLC; Director (2008-2010), Chief Investment Officer (2006-2010), President (2004-2010) and Secretary (2002-2010), Rydex Advisors II, LLC. |
Nikolaos Bonos (1963) | Vice President and Treasurer (2003-present). | Current: Senior Vice President, Security Investors, LLC (2010-present); Chief Executive Officer, Guggenheim Specialized Products, LLC (2009-present); Chief Executive Officer & President, Rydex Fund Services, LLC (2009-present); Vice President, Rydex Holdings, LLC (2008-present). Former: Senior Vice President, Security Global Investors, LLC (2010-2011); and Senior Vice President, Rydex Advisors, LLC and Rydex Advisors II, LLC (2006-2011). |
| 82 | THE GUGGENHEIM FUNDS ANNUAL REPORT | |
INFORMATION ON BOARD OF TRUSTEES AND OFFICERS (Unaudited)(concluded) |
Name, Address and Year of Birth | Position(s) Held with the Trust, Term of Office and Length of Time Served | Principal Occupation(s) During Past 5 Years |
| OFFICERS - concluded | |
Elisabeth Miller (1968) | Chief Compliance Officer (2012-present). | Current: CCO, certain other funds in the Fund Complex (2012-present); CCO, Security Investors, LLC (2012-present); CCO, Guggenheim Funds Investment Advisors, LLC (2012-present); Managing Director, Guggenheim Investments (2012-present); Vice President, Guggenheim Funds Distributors, LLC (March 2014-present). Former: CCO, Guggenheim Distributors, LLC (2009-March 2014); Senior Manager, Security Investors, LLC (2004-2009); Senior Manager, Guggenheim Distributors, LLC (2004-2009). |
Joseph M. Arruda (1966) | Assistant Treasurer (2006-present). | Current: Assistant Treasurer, certain other funds in the Fund Complex (2006-present); Vice President, Security Investors, LLC (2010-present); CFO and Manager, Guggenheim Specialized Products, LLC (2009-present). Former: Vice President, Security Global Investors, LLC (2010-2011); Vice President, Rydex Advisors, LLC (2010); Vice President, Rydex Advisors II, LLC (2010). |
Paul J. Davio (1972) | Assistant Treasurer (2014-present). | Current: Assistant Treasurer, certain other funds in the Fund Complex (2014-present); Director, Guggenheim Investments (2006-present). Former: Manager, Mutual Fund Administration, Guggenheim Investments (2003-2006). |
Amy J. Lee (1961) | Vice President (2009-present) and Secretary (2012-present). | Current: Chief Legal Officer, certain other funds in the Fund Complex (2012-present); Senior Managing Director, Guggenheim Investments (2012-present). Former: Vice President, Associate General Counsel and Assistant Secretary, Security Benefit Life Insurance Company and Security Benefit Corporation (2004-2012). |
| * | All Trustees and Officers may be reached c/o Guggenheim Investments, 805 King Farm Boulevard, Suite 600, Rockville, MD 20850. |
| ** | Mr. Cacciapaglia is an “interested” person of the Trust, as that term is defined in the 1940 Act by virtue of his affiliation with the Adviser’s parent company. |
| *** | The “Fund Complex” includes all closed-end and open-end funds (including all of their portfolios) advised by the Adviser and any funds that have an investment adviser or servicing agent that is an affiliated person of the Adviser. Information provided is as of the date of this report. |
| | THE GUGGENHEIM FUNDS ANNUAL REPORT | 83 |
GUGGENHEIM INVESTMENTS PRIVACY POLICIES (Unaudited) |
Rydex Funds, Guggenheim Funds, Rydex Investments, Guggenheim Funds Distributors, LLC, Security Investors, LLC, Security Distributors, Inc., Guggenheim Partners Investment Managers, LLC, and Rydex Advisory Services (Collectively “Guggenheim Investments”).
Our Commitment to You
When you become a Guggenheim Investments investor, you entrust us with not only your hard-earned money but also with personal and financial information about you. We recognize that your relationship with us is based on trust and that you expect us to act responsibly and in your best interests. Because we have access to this private information about you, we hold ourselves to the highest standards in its safekeeping and use. This means, most importantly, that we do not sell client information to anyone—whether it is your personal information or if you are a current or former Guggenheim Investments client.
The Information We Collect About You
In the course of doing business with shareholders and investors, we collect nonpublic personal information about you. You typically provide personal information when you complete a Guggenheim Investments account application or when you request a transaction that involves Rydex and Guggenheim Investments funds or one of the Guggenheim Investments affiliated companies. “Nonpublic personal information” is personally identifiable private information about you. For example, it includes information regarding your name and address, Social Security or taxpayer identification number, assets, income, account balance, bank account information and investment activity (e.g., purchase and redemption history).
How We Handle Your Personal Information
As emphasized above, we do not sell information about current or former clients or their accounts to third parties. Nor do we share such information, except when necessary to complete transactions at your request or to make you aware of related investment products and services that we offer. Additional details about how we handle your personal information are provided below. To complete certain transactions or account changes that you direct, it may be necessary to provide identifying information to companies, individuals or groups that are not affiliated with Guggenheim Investments. For example, if you ask to transfer assets from another financial institution to Guggenheim Investments, we will need to provide certain information about you to that company to complete the transaction. To alert you to other Guggenheim Investments investment products and services, we may share your information within the Guggenheim Investments family of affiliated companies. This would include, for example, sharing your information within Guggenheim Investments so we can make you aware of
| 84 | THE GUGGENHEIM FUNDS ANNUAL REPORT | |
GUGGENHEIM INVESTMENTS PRIVACY POLICIES (Unaudited)(continued) |
new Rydex and Guggenheim Investments funds or the services offered through another Guggenheim Investments affiliated company. In certain instances, we may contract with nonaffiliated companies to perform services for us. Where necessary, we will disclose information we have about you to these third parties. In all such cases, we provide the third party with only the information necessary to carry out its assigned responsibilities and only for that purpose. And we require these third parties to treat your private information with the same high degree of confidentiality that we do. In certain instances, we may share information with other financial institutions regarding individuals and entities in response to the U.S.A. Patriot Act. Finally, we will release information about you if you direct us to do so, if we are compelled by law to do so or in other circumstances permitted by law.
Opt Out Provisions
We do not sell your personal information to anyone. The law allows you to “opt out” of only certain kinds of information sharing with third parties. The firm does not share personal information about you with any third parties that triggers this opt-out right. This means YOU ARE ALREADY OPTED OUT.
How We Protect Privacy Online
Our concern for the privacy of our shareholders also extends to those who use our web site, guggenheiminvestments.com. Our web site uses some of the most secure forms of online communication available, including encryption technology, Secure Socket Layer (SSL) protocol, firewalls and user names and passwords. These technologies provide a high level of security and privacy when you access your account information or initiate online transactions. The Guggenheim Investments web site offers customized features that require our use of “http cookies”—tiny pieces of information that we ask your browser to store. However, we make very limited use of these cookies. We only use cookies for session management and security features on the Guggenheim Investments web site. We do not use them to pull data from your hard drive, to learn your email address, or to view data in cookies created by other web sites. We will not share the information in our cookies or give others access to it. See the legal information area on our web site for more details about web site security and privacy features.
How We Safeguard Your Personal Information
We restrict access to nonpublic personal information about shareholders to our employees and in some cases to third parties (for example, the service providers described above) as permitted by law. We maintain strict physical, electronic and procedural safeguards that comply with federal standards to guard your nonpublic personal information.
| | THE GUGGENHEIM FUNDS ANNUAL REPORT | 85 |
GUGGENHEIM INVESTMENTS PRIVACY POLICIES (Unaudited)(concluded) |
We’ll Keep You Informed
As required by federal law, we will notify shareholders of our privacy policy annually. We reserve the right to modify this policy at any time, but rest assured that if we do change it, we will tell you promptly. You will also be able to access our privacy policy from our web site at guggenheiminvestments.com. Should you have any questions regarding our privacy policy, contact us at 800.820.0888 or 301.296.5100.
| 86 | THE GUGGENHEIM FUNDS ANNUAL REPORT | |
This page intentionally left blank.
This page intentionally left blank.
This page intentionally left blank.
This page intentionally left blank.
This page intentionally left blank.
This page intentionally left blank.
This page intentionally left blank.
12.31.2014
Guggenheim Funds Annual Report
| Guggenheim Alternative Fund |
| Guggenheim Managed Futures Strategy Fund | | |
| RMFSF-ANN-1214x1215 | guggenheiminvestments.com |
| DEAR SHAREHOLDER | 2 |
| ECONOMIC AND MARKET OVERVIEW | 4 |
| ABOUT SHAREHOLDERS’ FUND EXPENSES | 7 |
| MANAGED FUTURES STRATEGY FUND | 10 |
| NOTES TO CONSOLIDATED FINANCIAL STATEMENTS | 28 |
| REPORT OF INDEPENDENT REGISTERED PUBLIC ACCOUNTING FIRM | 47 |
| OTHER INFORMATION | 48 |
| INFORMATION ON BOARD OF TRUSTEES AND OFFICERS | 49 |
| GUGGENHEIM INVESTMENTS PRIVACY POLICIES | 53 |
| | THE GUGGENHEIM FUNDS ANNUAL REPORT | 1 |
Dear Shareholder:
Security Investors, LLC (the “Investment Adviser”) is pleased to present the annual shareholder report for the Managed Futures Strategy Fund (the ”Fund”) that is part of the Rydex Series Funds. This report covers performance of the Fund for the annual period ended December 31, 2014.
The Investment Adviser is a part of Guggenheim Investments, which represents the investment management businesses of Guggenheim Partners, LLC, a global, diversified financial services firm.
Guggenheim Funds Distributors, LLC is the distributor of the Fund. Guggenheim Funds Distributors, LLC is affiliated with Guggenheim Partners, LLC and Security Investors, LLC.
We encourage you to read the Economic and Market Overview section of the report, which follows this letter, and then the Performance Report and Fund Profile for the Fund.
We are committed to providing innovative investment solutions and appreciate the trust you place in us.
Sincerely,
Donald C. Cacciapaglia
President
January 31, 2015
Read a prospectus and summary prospectus (if available) carefully before investing. It contains the investment objectives, risks, charges, expenses and other information, which should be considered carefully before investing. Obtain a prospectus and summary prospectus (if available) at guggenheiminvestments.com or call 800.820.0888.
| 2 | THE GUGGENHEIM FUNDS ANNUAL REPORT | |
The Managed Futures Strategy Fund may not be suitable for all investors. •The Fund's investments in securities and derivatives, in general, are subject to market risks that may cause their prices, and therefore the Fund's value, to fluctuate over time. An investment in the Fund may lose money. • The Fund’s investments in derivatives may pose risks in addition to those associated with investing directly in securities or other investments, including illiquidity of the derivatives, imperfect correlations with underlying investments or the Fund’s other portfolio holdings, lack of availability and counterparty risk. To the extent the Fund invests in derivatives to seek to hedge risk or limit leveraged exposure created by other investments, there is no guarantee that such hedging strategies will be effective at managing risk or limiting exposure to leveraged investments. • The Fund’s use of leverage will exaggerate the effect on net asset value of any increase or decrease in the market value of the Fund’s portfolio. •The Fund's use of short selling involves increased risk and costs. The Fund risks paying more for a security than it received from its sale. Theoretically, securities sold short have the risk of unlimited losses. •The Fund's investments in fixed income securities will change in value in response to interest rate changes and other factors. In general, bond prices rise when interest rates fall and vice versa. • The Fund‘s exposure to high yield, asset backed and mortgaged backed securities may subject the Fund to greater volatility. •The Fund's indirect and direct exposure to foreign currencies subjects the Fund to the risk that those currencies will decline in value relative to the U.S. dollar, or, in the case of short positions, that the U.S. dollar will decline in value relative to the currency being hedged. •The Fund's exposure to the commodity markets may subject the fund to greater volatility as commodity-linked investments may be affected by changes in overall market movements, commodity index volatility, changes in interest rates or factors affecting a particular industry or commodity such as droughts, floods, weather, embargos, tariffs and international economic, political and regulatory developments. •The Fund may invest in securities of foreign companies directly, or indirectly through the use of other investment companies and financial instruments that are linked to the performance of foreign issuers. Foreign securities markets generally have less trading volume and less liquidity than U.S. markets, and prices in some foreign markets may fluctuate more than those of securities traded on U.S. markets. •This Fund is considered nondiversified and can invest a greater portion of its assets in securities of individual issuers than a diversified fund. As a result, changes in the market value of a single security could cause greater fluctuations in the value of fund shares than would occur in a more diversified fund. •See the prospectus for more information on these and other risks.
| | THE GUGGENHEIM FUNDS ANNUAL REPORT | 3 |
ECONOMIC AND MARKET OVERVIEW (Unaudited) | December 31, 2014 |
The U.S. economy continued to grow throughout the 12 months ended December 31, 2014, despite some seasonal volatility in September and October that caused spreads in leveraged credit to widen and upward momentum in U.S. stocks to deteriorate. By the end of October, the spread widening had reversed and equities regained their footing, with some key indices shooting to new highs. Markets similarly overcame a weather-related winter soft patch in the first quarter of 2014. The benchmark U.S. 10-year Treasury rate declined from 3.03% to 2.17% over the period, a positive stimulant to continued economic expansion.
U.S. growth appears to have decoupled from the rest of the world. The third quarter’s 5% U.S. gross domestic product (GDP) growth—the fastest pace in 11 years—signals that the U.S. economy is doing very well. Deeming growth sustainable, the U.S. Federal Reserve (the “Fed”) formally ended its quantitative easing (QE) program in October, and all eyes are now on economic data—primarily inflation and employment figures—that would prompt the Fed to raise rates in 2015. Slowing global growth has translated into expectations of weaker demand for oil in an already oversupplied market, which contributed to oil’s 49% decline in the second half of the year, with West Texas Intermediate ending the year at a five-year low of $53 a barrel.
The bright side to declining energy prices is that it leaves more money for consumers to spend on other goods. Data are already confirming this, as American consumer confidence reached new post-recession highs, and fourth quarter retail spending posted solid gains. Overall, this should be positive for consumer-related companies with primarily domestic operations.
The U.S. added 246,000 jobs per month on average in 2014. Employment levels are transitioning from the recovery phase to the expansion phase, which typically coincides with accelerating economic activity. The downward trend in labor force participation has begun to flatten and, as fewer people leave the workforce, the rapid decline in the nation’s unemployment rate could begin to slow. Until unemployment falls below the natural rate of unemployment, it’s unlikely that the U.S. economy will experience the kind of meaningful wage pressure that would spur action by the Fed. An improving labor market, subdued mortgage rates, and tight housing inventory all point to a rebound in the housing market.
The battle against deflation in Europe forced the European Central Bank (ECB) to announce its own form of QE via purchases of asset-backed securities (ABS) and covered bonds. The consensus appears to be that in its current form, the program is insufficient to avert a slowdown. The next step for the ECB may be to buy sovereign bonds, which the ECB will decide on in the coming months. The only notable positive for Europe over the past year has been the devaluation of
| 4 | THE GUGGENHEIM FUNDS ANNUAL REPORT | |
ECONOMIC AND MARKET OVERVIEW (Unaudited)(continued) | December 31, 2014 |
the euro, which fell by 13% against the U.S. dollar between May and December. A weaker euro makes exports more competitive, but still will not be enough to boost inflation in the region.
While markets were already anxious over Europe’s struggles and the potential impact of a stronger dollar on U.S. company earnings, Japan relapsed into recession. This drove the Bank of Japan to announce it would expand its asset purchase program in 2015. China also faces slowing growth as financing costs remain high for smaller companies, forcing the People’s Bank of China (PBOC) to cut benchmark interest rates for the first time since July 2012.
From an investment standpoint, U.S. assets continue to look attractive. With global central banks easing or engaging in their form of QE, global yields remain anchored and are driving investors into U.S. markets. But we are wary of the potential for a setback in U.S. equities as certain factors, such as oil prices and currency fluctuations, drive markets to aggressively discount valuations for some sectors more than others.
For the year ended December 31, 2014, the Standard & Poor’s 500® (“S&P 500”) Index* returned 13.69%. The Morgan Stanley Capital International (“MSCI”) Europe-Australasia-Far East (“EAFE”) Index* returned -4.90%. The return of the MSCI Emerging Markets Index* was -2.19%.
In the bond market, the Barclays U.S. Aggregate Bond Index* posted a 5.97% return for the period, while the Barclays U.S. Corporate High Yield Index* returned 2.45%. The return of the Bank of America Merrill Lynch 3-Month U.S. Treasury Bill Index* was 0.04% for the 12-month period.
The opinions and forecasts expressed may not actually come to pass. This information is subject to change at any time, based on market and other conditions, and should not be construed as a recommendation of any specific security or strategy.
*Index Definitions:
The following indices are referenced throughout this report. Indices are unmanaged and not available for direct investment. Index performance does not reflect transaction costs, fees, or expenses.
Barclays U.S. Aggregate Bond Index is a broad-based benchmark that measures the investment grade, U.S. dollar denominated, fixed-rate taxable bond market, including U.S. Treasuries, government-related and corporate securities, MBS (agency fixed-rate and hybrid ARM pass-throughs), ABS, and CMBS.
Barclays U.S. Corporate High Yield Index measures the market of U.S. dollar denominated, non-investment grade, fixed-rate, taxable corporate bonds. Securities are classified as high yield if the middle rating of Moody’s, Fitch, and S&P is Ba1/BB +/BB + or below.
| | THE GUGGENHEIM FUNDS ANNUAL REPORT | 5 |
ECONOMIC AND MARKET OVERVIEW (Unaudited)(concluded) | December 31, 2014 |
Bank of America (“BofA“) Merrill Lynch 3-Month U.S. Treasury Bill Index is an unmanaged market index of U.S. Treasury securities maturing in 90 days that assumes reinvestment of all income.
MSCI EAFE Index is a free float-adjusted market capitalization index that is designed to measure the equity market performance of developed markets, excluding the U.S. & Canada.
MSCI Emerging Markets Index is a free float-adjusted market capitalization weighted index that is designed to measure equity market performance in the global emerging markets.
S&P 500®Index is a capitalization-weighted index of 500 stocks designed to measure the performance of the broad economy, representing all major industries and is considered a representation of the U.S. stock market.
| 6 | THE GUGGENHEIM FUNDS ANNUAL REPORT | |
ABOUT SHAREHOLDERS’ FUND EXPENSES (Unaudited) |
All mutual funds have operating expenses and it is important for our shareholders to understand the impact of costs on their investments. Shareholders of a Fund incur two types of costs: (i) transaction costs, including sales charges (loads) on purchase payments, reinvested dividends, or other distributions; and exchange fees; and (ii) ongoing costs, including management fees, administrative services, and shareholder reports, among others. These ongoing costs, or operating expenses, are deducted from a fund’s gross income and reduce the investment return of the fund.
A fund’s expenses are expressed as a percentage of its average net assets, which is known as the expense ratio. The following examples are intended to help investors understand the ongoing costs (in dollars) of investing in a Fund and to compare these costs with the ongoing costs of investing in other mutual funds.
The examples are based on an investment of $1,000 made at the beginning of the period and held for the entire six-month period beginning June 30, 2014 and ending December 31, 2014.
The following tables illustrate a Fund’s costs in two ways:
Table 1. Based on actual Fund return. This section helps investors estimate the actual expenses paid over the period. The “Ending Account Value” shown is derived from the Fund’s actual return, and the fourth column shows the dollar amount that would have been paid by an investor who started with $1,000 in the Fund. Investors may use the information here, together with the amount invested, to estimate the expenses paid over the period. Simply divide the Fund’s account value by $1,000 (for example, an $8,600 account value divided by $1,000 = 8.6), then multiply the result by the number provided under the heading “Expenses Paid During Period.”
Table 2. Based on hypothetical 5% return. This section is intended to help investors compare a Fund’s cost with those of other mutual funds. The table provides information about hypothetical account values and hypothetical expenses based on the Fund’s actual expense ratio and an assumed rate of return of 5% per year before expenses, which is not the Fund’s actual return. The hypothetical account values and expenses may not be used to estimate the actual ending account balance or expenses paid during the period. The example is useful in making comparisons because the U.S. Securities and Exchange Commission (the “SEC”) requires all mutual funds to calculate expenses based on the 5% return. Investors can assess a Fund’s costs by comparing this hypothetical example with the hypothetical examples that appear in shareholder reports of other funds.
| | THE GUGGENHEIM FUNDS ANNUAL REPORT | 7 |
ABOUT SHAREHOLDERS’ FUND EXPENSES (Unaudited)(continued) |
The calculations illustrated above assume no shares were bought or sold during the period. Actual costs may have been higher or lower, depending on the amount of investment and the timing of any purchases or redemptions.
Please note that the expenses shown in the table are meant to highlight your ongoing costs only and do not reflect any transactional costs, such as sales charges (loads) on purchase payments, and contingent deferred sales charges (“CDSC”) on redemptions, if any. Therefore, the second table is useful in comparing ongoing costs only, and will not help you determine the relative total costs of owning different funds. In addition, if these transactional costs were included, your costs would have been higher.
More information about a Fund’s expenses, including annual expense ratios for the past five years, can be found in the Financial Highlights section of this report. For additional information on operating expenses and other shareholder costs, please refer to the appropriate Fund prospectus.
| 8 | THE GUGGENHEIM FUNDS ANNUAL REPORT | |
ABOUT SHAREHOLDERS’ FUND EXPENSES (Unaudited)(concluded) |
| | Expense Ratio1 | Fund Return | Beginning Account Value June 30, 2014 | Ending Account Value December 31, 2014 | Expenses Paid During Period2 |
Table 1. Based on actual Fund return3 | | |
| Managed Futures Strategy Fund | | | | | |
| A-Class | 1.69% | 12.55% | $1,000.00 | $1,125.50 | $9.05 |
| C-Class | 2.44% | 12.09% | 1,000.00 | 1,120.90 | 13.04 |
| H-Class | 1.69% | 12.50% | 1,000.00 | 1,125.00 | 9.05 |
| Institutional Class | 1.46% | 12.64% | 1,000.00 | 1,126.40 | 7.83 |
| Y-Class | 1.45% | 12.66% | 1,000.00 | 1,126.60 | 7.77 |
| |
| Table 2. Based on hypothetical 5% return (before expenses) | | | |
| Managed Futures Strategy Fund | | | | | |
| A-Class | 1.69% | 5.00% | $1,000.00 | $1,016.69 | $8.59 |
| C-Class | 2.44% | 5.00% | 1,000.00 | 1,012.91 | 12.38 |
| H-Class | 1.69% | 5.00% | 1,000.00 | 1,016.69 | 8.59 |
| Institutional Class | 1.46% | 5.00% | 1,000.00 | 1,017.85 | 7.43 |
| Y-Class | 1.45% | 5.00% | 1,000.00 | 1,017.90 | 7.37 |
1 | Annualized and excludes expenses of the underlying funds in which the Fund invests. |
2 | Expenses are equal to the Fund's annualized expense ratio, net of any applicable fee waivers, multiplied by the average account value over the period, multiplied by 184/365 (to reflect the one-half year period). |
3 | Actual cumulative return at net asset value for the period June 30, 2014 to December 31, 2014. |
| | THE GUGGENHEIM FUNDS ANNUAL REPORT | 9 |
PERFORMANCE REPORT AND FUND PROFILE (Unaudited) | December 31, 2014 |
MANAGED FUTURES STRATEGY FUND
OBJECTIVE: Seeks to achieve absolute returns.
For the one-year period ended December 31, 2014, the Managed Futures Strategy Fund H-Class returned 10.06%. The Bank of America (“BofA”) Merrill Lynch 3-Month U.S. Treasury Bill Index, the Fund’s cash benchmark, returned 0.04%.
As a result of market turbulence and trend reversals at the beginning of 2014, the Fund experienced negative performance in the first quarter of the year. The remaining three quarters of 2014, however, were all positive, and the Fund finished 2014 with a double-digit return.
Throughout 2014, the best performing asset class was fixed income, particularly long positions in European bond futures. Positions in commodity and foreign exchange futures contributed positively to Fund returns on the year, while equities broke even. The individual markets that contributed most strongly to the Fund’s return were positions in Gas Oil, the German Government 10-Year Bond, and the Japanese Yen. Among the markets that most detracted from the Fund’s return were positions in the Australian dollar, West Texas Intermediate Crude, and the Hang Seng China Enterprises Stock Index.
The Fund is comprised of several proprietary strategies which systematically exploit inefficiencies occurring within and between markets and trade commodity, currency, equity and fixed income markets around the globe. These strategies enabled the fund to achieve its objective of positive absolute returns for the year.
The Fund takes advantage of Guggenheim’s fixed income expertise in managing the Fund’s cash positions primarily through the use of the Guggenheim Strategy Funds.
At year end, the fund was long fixed income, long the U.S. dollar, and long most equity index markets with a few short positions. The fund was short most commodities, with notable exceptions being long gold, long soybeans, and long live cattle.
Performance displayed represents past performance which is no guarantee of future results.
| 10 | THE GUGGENHEIM FUNDS ANNUAL REPORT | |
PERFORMANCE REPORT AND FUND PROFILE (Unaudited)(continued) | December 31, 2014 |
Consolidated Holdings Diversification
(Market Exposure as % of Net Assets)
“Consolidated Holdings Diversification (Market Exposure as % of Net Assets)” excludes any temporary cash investments or investments in Guggenheim Strategy Funds Trust mutual funds.
| Inception Dates: |
| A-Class | March 2, 2007 |
| C-Class | March 2, 2007 |
| H-Class | March 2, 2007 |
| Institutional Class | May 3, 2010 |
| Y-Class | March 29, 2010 |
| Ten Largest Holdings (% of Total Net Assets) |
| Guggenheim Strategy Fund II | 24.4% |
| Guggenheim Strategy Fund I | 23.7% |
| Guggenheim Strategy Fund III | 17.0% |
| Guggenheim Enhanced Short Duration ETF | 2.2% |
| Brentwood CLO Corp. 2006-1A | 1.6% |
| Morgan Stanley Reremic Trust 2012-IO | 1.4% |
| Duane Street CLO IV Ltd. 2007-4A | 1.4% |
| Boca Hotel Portfolio Trust 2013-BOCA | 1.2% |
| Hilton USA Trust 2013-HLF | 1.1% |
| Salus CLO 2012-1 Ltd. 2013-1AN | 1.1% |
| Top Ten Total | 75.1% |
| | |
| “Ten Largest Holdings” exclude any temporary cash or derivative investments. |
| | THE GUGGENHEIM FUNDS ANNUAL REPORT | 11 |
PERFORMANCE REPORT AND FUND PROFILE (Unaudited)(continued) | December 31, 2014 |
Cumulative Fund Performance*
| 12 | THE GUGGENHEIM FUNDS ANNUAL REPORT | |
PERFORMANCE REPORT AND FUND PROFILE (Unaudited)(concluded) | December 31, 2014 |
Average Annual Returns*
Periods Ended December 31, 2014
| | 1 Year | 5 Year | Since Inception (03/02/07) |
| A-Class Shares | 10.06% | -1.88% | 0.15% |
A-Class Shares with sales charge† | 4.86% | -2.84% | -0.47% |
| C-Class Shares | 9.22% | -2.62% | -0.59% |
C-Class Shares with CDSC‡ | 8.22% | -2.62% | -0.59% |
| H-Class Shares | 10.06% | -1.88% | 0.15% |
| BofA Merrill Lynch 3-Month U.S. Treasury Bill Index | 0.04% | 0.09% | 0.87% |
| | | 1 Year | Since Inception (05/03/10) |
| Institutional Class Shares | | 10.28% | -0.77% |
| BofA Merrill Lynch 3-Month U.S. Treasury Bill Index | | 0.04% | 0.09% |
| | | 1 Year | Since Inception (03/29/10) |
| Y-Class Shares | | 10.40% | -0.84% |
| BofA Merrill Lynch 3-Month U.S. Treasury Bill Index | | 0.04% | 0.09% |
| * | The performance data represents past performance that is not predictive of future results. The investment return and principal value of an investment in the Fund will fluctuate so that an investor’s shares, when redeemed, may be worth more or less than their original cost. Returns are historical and include changes in principal and reinvested dividends and capital gains and do not reflect the effect of taxes. The BofA Merrill Lynch 3-Month U.S. Treasury Bill Index is an unmanaged index and, unlike the Fund, has no management fees or operating expenses to reduce its reported return. The graphs are based on A-Class shares and H-Class shares only; performance for C-Class shares, Institutional Class shares and Y-Class shares will vary due to difference in fee structure. |
† | Fund returns are calculated using the maximum sales charge of 4.75%. |
‡ | Fund returns include a CDSC of 1% if redeemed within 12 months of purchase. |
| | THE GUGGENHEIM FUNDS ANNUAL REPORT | 13 |
| CONSOLIDATED SCHEDULE OF INVESTMENTS | December 31, 2014 |
| MANAGED FUTURES STRATEGY FUND | |
| | |
Shares | | | Value | |
| | | | | | | |
EXCHANGE-TRADED FUNDS† - 2.2% | |
Guggenheim Enhanced Short Duration ETF1,2 | | | 108,400 | | | $ | 5,411,328 | |
| Total Exchange-Traded Funds | | | | | | | | |
| (Cost $5,429,550) | | | | | | | 5,411,328 | |
| | | | | | | | | |
MUTUAL FUNDS† - 65.1% | |
Guggenheim Strategy Fund II3 | | | 2,392,744 | | | | 59,459,690 | |
Guggenheim Strategy Fund I3 | | | 2,329,788 | | | | 57,871,940 | |
Guggenheim Strategy Fund III3 | | | 1,674,717 | | | | 41,599,972 | |
| Total Mutual Funds | | | | | | | | |
| (Cost $159,637,177) | | | | | | | 158,931,602 | |
| | | | | | | | | |
| | | Face
Amount | | | | |
| | | | | | | | | |
ASSET BACKED SECURITIES†† - 9.3% | |
| Brentwood CLO Corp. | | | | | | | | |
2006-1A, 0.50% due 02/01/224,5 | | $ | 3,890,319 | | | | 3,831,575 | |
| Duane Street CLO IV Ltd. | | | | | | | | |
2007-4A, 0.46% due 11/14/214,5 | | | 3,437,087 | | | | 3,407,872 | |
| Salus CLO 2012-1 Ltd. | | | | | | | | |
2013-1AN, 2.48% due 03/05/214,5 | | | 2,700,000 | | | | 2,692,440 | |
| N-Star REL CDO VIII Ltd. | | | | | | | | |
2006-8A, 0.46% due 02/01/414,5 | | | 2,734,024 | | | | 2,632,865 | |
| Argent Securities Incorporated Asset-Backed Pass-Through Certificates Series | | | | | | | | |
2005-W3, 0.51% due 11/25/354 | | | 2,535,507 | | | | 2,435,755 | |
| GreenPoint Mortgage Funding Trust | | | | | | | | |
2005-HE4, 0.87% due 07/25/304 | | | 1,920,927 | | | | 1,812,089 | |
| Foothill CLO Ltd. | | | | | | | | |
2007-1A, 0.48% due 02/22/214,5 | | | 1,481,788 | | | | 1,470,082 | |
| Black Diamond CLO Delaware Corp. | | | | | | | | |
2005-1A, 2.15% due 06/20/174,5 | | | 1,500,000 | | | | 1,456,350 | |
| Popular ABS Mortgage Pass-Through Trust | | | | | | | | |
2005-A, 0.60% due 06/25/354 | | | 1,479,297 | | | | 1,424,782 | |
| Cornerstone CLO Ltd. | | | | | | | | |
2007-1A, 0.45% due 07/15/214,5 | | | 842,115 | | | | 834,705 | |
| Cerberus Onshore II CLO LLC | | | | | | | | |
2014-1A, 2.93% due 10/15/234,5 | | | 500,000 | | | | 492,550 | |
| Gleneagles CLO Ltd. | | | | | | | | |
2005-1A, 0.51% due 11/01/174,5 | | | 108,406 | | | | 108,179 | |
| Total Asset Backed Securities | | | | | | | | |
| (Cost $22,213,665) | | | | | | | 22,599,244 | |
| | | | | | | | | |
COLLATERALIZED MORTGAGE OBLIGATIONS†† - 5.3% | |
| Morgan Stanley Reremic Trust | | | | | | | | |
2012-IO, 1.00% due 03/27/515 | | | 3,504,436 | | | | 3,486,914 | |
| Boca Hotel Portfolio Trust | | | | | | | | |
2013-BOCA, 3.21% due 08/15/264,5 | | | 2,950,000 | | | | 2,948,212 | |
| Hilton USA Trust | | | | | | | | |
2013-HLF, 2.92% due 11/05/304,5 | | | 2,710,029 | | | | 2,710,170 | |
| Banc of America Merrill Lynch Commercial Mortgage, Inc. | | | | | | | | |
2005-6, 6.13% due 09/10/474,5 | | | 1,492,600 | | | | 1,514,986 | |
| Resource Capital Corporation Ltd. | | | | | | | | |
2013-CRE1, 3.01% due 12/15/284,5 | | | 1,000,000 | | | | 1,004,510 | |
| 14 | THE GUGGENHEIM FUNDS ANNUAL REPORT | SEE NOTES TO FINANCIAL STATEMENTS. |
CONSOLIDATED SCHEDULE OF INVESTMENTS (continued) | December 31, 2014 |
| MANAGED FUTURES STRATEGY FUND | |
| | | Face
Amount | | | Value | |
| | | | | | | | | |
| Wachovia Bank Commercial Mortgage Trust Series | | | | | | | | |
2007-WHL8, 0.24% due 06/15/204,5 | | $ | 791,159 | | | $ | 789,323 | |
| SRERS Funding Ltd. | | | | | | | | |
2011-RS, 0.41% due 05/09/464,5 | | | 344,426 | | | | 328,066 | |
| Total Collateralized Mortgage Obligations | | | | | | | | |
| (Cost $12,778,877) | | | | | | | 12,782,181 | |
| | | | | | | | | |
REPURCHASE AGREEMENTS††,6 - 10.7% | |
HSBC Group
issued 12/31/14 at 0.02%
due 01/02/15 | | | 17,009,507 | | | | 17,009,507 | |
RBC Capital Markets
issued 12/31/14 at 0.03%
due 01/02/15 | | | 9,189,265 | | | | 9,189,265 | |
| Total Repurchase Agreements | | | | | | | | |
| (Cost $26,198,772) | | | | | | | 26,198,772 | |
| | | | | | | | | |
SECURITIES LENDING COLLATERAL††,7 - 0.1% | |
| Repurchase Agreements | | | | | | | | |
HSBC Securities, Inc.
issued 12/31/14 at 0.06%
due 01/02/15 | | | 184,876 | | | | 184,876 | |
BNP Paribas Securities Corp.
issued 12/31/14 at 0.06%
due 01/02/15 | | | 74,721 | | | | 74,721 | |
Barclays Capital, Inc.
issued 12/31/14 at 0.05%
due 01/02/15 | | | 35,434 | | | | 35,434 | |
| Total Securities Lending Collateral | | | | | | | | |
| (Cost $295,031) | | | | | | | 295,031 | |
| | | | | | | | | |
| Total Investments - 92.7% | | | | | | | | |
| (Cost $226,553,072) | | | | | | $ | 226,218,158 | |
| Other Assets & Liabilities, net - 7.3% | | | | | | | 17,850,922 | |
| Total Net Assets - 100.0% | | | | | | $ | 244,069,080 | |
| | | | | | | | | |
| | | Contracts | | | Unrealized
Gain | |
| | | | | | | | | |
INTEREST RATE FUTURES CONTRACTS PURCHASED† | |
March 2015 Euro - Bund
Futures Contracts††
(Aggregate Value of
Contracts $81,139,832) | | | 430 | | | $ | 1,441,907 | |
March 2015 Euro - Bobl
Futures Contracts††
(Aggregate Value of
Contracts $167,914,612) | | | 1,064 | | | | 1,052,730 | |
March 2015 U.S. Treasury Long Bond
Futures Contracts
(Aggregate Value of
Contracts $36,703,000) | | | 254 | | | | 958,679 | |
March 2015 U.S. Treasury Ultra Long Bond
Futures Contracts
(Aggregate Value of
Contracts $15,686,875) | | | 95 | | | | 544,101 | |
March 2015 Japanese Government 10 Year Bond
Futures Contracts††
(Aggregate Value of
Contracts $111,075,022) | | | 90 | | | | 519,061 | |
March 2015 Australian Government 10 Year Bond
Futures Contracts††
(Aggregate Value of
Contracts $29,196,375) | | | 279 | | | | 274,788 | |
March 2015 Euro - Schatz
Futures Contracts††
(Aggregate Value of
Contracts $325,092,031) | | | 2,418 | | | | 238,253 | |
March 2015 Canadian Government 10 Year Bond
Futures Contracts††
(Aggregate Value of
Contracts $17,393,579) | | | 146 | | | | 234,570 | |
March 2015 Long Gilt
Futures Contracts††
(Aggregate Value of
Contracts $6,891,326) | | | 37 | | | | 158,230 | |
| SEE NOTES TO FINANCIAL STATEMENTS. | THE GUGGENHEIM FUNDS ANNUAL REPORT | 15 |
CONSOLIDATED SCHEDULE OF INVESTMENTS (continued) | December 31, 2014 |
| MANAGED FUTURES STRATEGY FUND | |
| | | Contracts | | | Unrealized
Gain (Loss) | |
| | | | | | | | | |
March 2015 Australian Government 3 Year Bond
Futures Contracts††
(Aggregate Value of
Contracts $44,434,219) | | | 489 | | | $ | 138,641 | |
March 2015 U.S. Treasury 10 Year Note
Futures Contracts
(Aggregate Value of
Contracts $2,153,688) | | | 17 | | | | 5,138 | |
March 2015 U.S. Treasury 5 Year Note
Futures Contracts
(Aggregate Value of
Contracts $21,396,094) | | | 180 | | | | (15,778 | ) |
| (Total Aggregate Value of Contracts $859,076,653) | | | | | | $ | 5,550,320 | |
| | | | | | | | | |
EQUITY FUTURES CONTRACTS PURCHASED† | |
January 2015 Amsterdam Index
Futures Contracts††
(Aggregate Value of
Contracts $10,672,681) | | | 105 | | | $ | 515,002 | |
March 2015 S&P 500 Index
Mini Futures Contracts
(Aggregate Value of
Contracts $19,186,200) | | | 187 | | | | 261,367 | |
January 2015 H-Shares Index
Futures Contracts††
(Aggregate Value of
Contracts $4,466,148) | | | 58 | | | | 170,160 | |
March 2015 SPI 200 Index
Futures Contracts††
(Aggregate Value of
Contracts $3,694,660) | | | 34 | | | | 139,179 | |
March 2015 S&P MidCap 400 Index
Mini Futures Contracts
(Aggregate Value of
Contracts $13,765,500) | | | 95 | | | | 100,863 | |
January 2015 MSCI Taiwan Stock Index
Futures Contracts
(Aggregate Value of
Contracts $7,564,167) | | | 221 | | | | 41,719 | |
March 2015 Dow Jones Industrial Average Index
Mini Futures Contracts
(Aggregate Value of
Contracts $14,646,225) | | | 165 | | | | 36,646 | |
January 2015 IBEX 35 Index
Futures Contracts††
(Aggregate Value of
Contracts $1,720,527) | | | 14 | | | | 30,324 | |
March 2015 FTSE 100 Index
Futures Contracts††
(Aggregate Value of
Contracts $5,326,692) | | | 53 | | | | (6,758 | ) |
March 2015 Topix Index
Futures Contracts††
(Aggregate Value of
Contracts $6,727,787) | | | 58 | | | | (114,701 | ) |
March 2015 Nikkei 225 (OSE) Index
Futures Contracts††
(Aggregate Value of
Contracts $6,464,599) | | | 45 | | | | (120,460 | ) |
March 2015 NASDAQ-100 Index
Mini Futures Contracts
(Aggregate Value of
Contracts $15,239,700) | | | 180 | | | | (169,783 | ) |
| (Total Aggregate Value of Contracts $109,474,886) | | | | | | $ | 883,558 | |
| | | | | | | | | |
COMMODITY FUTURES CONTRACTS PURCHASED† | |
February 2015 Gold 100 oz.
Futures Contracts
(Aggregate Value of
Contracts $2,956,750) | | | 25 | | | $ | 47,388 | |
March 2015 Wheat
Futures Contracts
(Aggregate Value of
Contracts $2,478,000) | | | 84 | | | | 14,092 | |
| 16 | THE GUGGENHEIM FUNDS ANNUAL REPORT | SEE NOTES TO FINANCIAL STATEMENTS. |
CONSOLIDATED SCHEDULE OF INVESTMENTS (continued) | December 31, 2014 |
| MANAGED FUTURES STRATEGY FUND | |
| | | Contracts | | | Unrealized
Gain (Loss) | |
| | | | | | | | | |
February 2015 LME Zinc
Futures Contracts
(Aggregate Value of
Contracts $1,133,087) | | | 21 | | | $ | (9,991 | ) |
February 2015 WTI Crude
Futures Contracts
(Aggregate Value of
Contracts $538,200) | | | 10 | | | | (18,973 | ) |
March 2015 Soybean
Futures Contracts
(Aggregate Value of
Contracts $3,069,000) | | | 60 | | | | (54,095 | ) |
March 2015 Coffee ‘C’
Futures Contracts
(Aggregate Value of
Contracts $946,687) | | | 15 | | | | (78,011 | ) |
February 2015 Live Cattle
Futures Contracts
(Aggregate Value of
Contracts $15,318,960) | | | 232 | | | | (411,032 | ) |
| (Total Aggregate Value of Contracts $26,440,684) | | | | | | $ | (510,622 | ) |
| | | | | | | | | |
COMMODITY FUTURES CONTRACTS SOLD SHORT† | |
March 2015 Sugar #11
Futures Contracts
(Aggregate Value of
Contracts $11,757,312) | | | 720 | | | $ | 1,393,836 | |
February 2015 Gas Oil
Futures Contracts
(Aggregate Value of
Contracts $12,661,400) | | | 236 | | | | 1,288,343 | |
March 2015 Brent Crude
Futures Contracts
(Aggregate Value of
Contracts $6,547,520) | | | 112 | | | | 748,636 | |
February 2015 Natural Gas
Futures Contracts
(Aggregate Value of
Contracts $3,270,400) | | | 112 | | | | 692,862 | |
February 2015 LME Primary Aluminum
Futures Contracts
(Aggregate Value of
Contracts $6,537,245) | | | 143 | | | | 233,837 | |
March 2015 Copper
Futures Contracts
(Aggregate Value of
Contracts $3,955,000) | | | 56 | | | | 118,317 | |
February 2015 Lean Hogs
Futures Contracts
(Aggregate Value of
Contracts $3,048,420) | | | 94 | | | | 94,043 | |
March 2015 Silver
Futures Contracts
(Aggregate Value of
Contracts $2,745,750) | | | 35 | | | | 66,345 | |
March 2015 Hard Red Winter Wheat
Futures Contracts
(Aggregate Value of
Contracts $3,268,200) | | | 104 | | | | 65,748 | |
February 2015 New York Harbor Ultra-Low Sulfur Diesel
Futures Contracts
(Aggregate Value of
Contracts $1,712,542) | | | 22 | | | | 31,221 | |
March 2015 Cotton #2
Futures Contracts
(Aggregate Value of
Contracts $3,675,250) | | | 122 | | | | 16,448 | |
February 2015 LME Nickel
Futures Contracts
(Aggregate Value of
Contracts $901,445) | | | 10 | | | | 12,098 | |
February 2015 LME Lead
Futures Contracts
(Aggregate Value of
Contracts $553,515) | | | 12 | | | | 9,348 | |
February 2015 Gasoline RBOB
Futures Contracts
(Aggregate Value of
Contracts $124,505) | | | 2 | | | | (2,266 | ) |
| SEE NOTES TO FINANCIAL STATEMENTS. | THE GUGGENHEIM FUNDS ANNUAL REPORT | 17 |
CONSOLIDATED SCHEDULE OF INVESTMENTS (concluded) | December 31, 2014 |
| MANAGED FUTURES STRATEGY FUND | |
| | | Contracts | | | Unrealized
Gain (Loss) | |
| | | | | | | | | |
March 2015 Corn
Futures Contracts
(Aggregate Value of
Contracts $1,469,825) | | | 74 | | | $ | (12,480 | ) |
| (Total Aggregate Value of Contracts $62,228,329) | | | | | | $ | 4,756,336 | |
| | | | | | | | | |
CURRENCY FUTURES CONTRACTS SOLD SHORT† | |
March 2015 Euro FX
Futures Contracts
(Aggregate Value of
Contracts $17,859,300) | | | 118 | | | $ | 272,747 | |
March 2015 Swiss Franc
Futures Contracts
(Aggregate Value of
Contracts $7,428,100) | | | 59 | | | | 172,984 | |
March 2015 Canadian Dollar
Futures Contracts
(Aggregate Value of
Contracts $12,889,500) | | | 150 | | | | 141,801 | |
March 2015 Japanese Yen
Futures Contracts
(Aggregate Value of
Contracts $32,058,475) | | | 307 | | | | 67,987 | |
March 2015 British Pound
Futures Contracts
(Aggregate Value of
Contracts $7,884,844) | | | 81 | | | | (4,851 | ) |
March 2015 Australian Dollar
Futures Contracts
(Aggregate Value of
Contracts $2,192,940) | | | 27 | | | | (7,592 | ) |
| (Total Aggregate Value of Contracts $80,313,159) | | | | | | $ | 643,076 | |
| | | | | | | | | |
EQUITY FUTURES CONTRACTS SOLD SHORT† | |
January 2015 Hang Seng Index
Futures Contracts††
(Aggregate Value of
Contracts $2,582,165) | | | 17 | | | $ | 12,716 | |
March 2015 DAX Index
Futures Contracts††
(Aggregate Value of
Contracts $1,173,097) | | | 4 | | | | 12,281 | |
March 2015 Russell 2000 Index
Mini Futures Contracts
(Aggregate Value of
Contracts $3,603,900) | | | 30 | | | | (60,247 | ) |
January 2015 CAC40 10 Euro Index
Futures Contracts††
(Aggregate Value of
Contracts $4,193,923) | | | 82 | | | | (109,798 | ) |
| (Total Aggregate Value of Contracts $11,553,085) | | | | | | $ | (145,048 | ) |
| † | Value determined based on Level 1 inputs, unless otherwise noted — See Note 4. |
| †† | Value determined based on Level 2 inputs — See Note 4. |
| 1 | Investment in a product that is managed by and/or pays a management fee to a party related to the Adviser — See Note 10. |
| 2 | All or portion of this security is on loan at December 31, 2014 — See Note 6. |
| 3 | Affiliated issuer — See Note 10. |
| 4 | Variable rate security. Rate indicated is rate effective at December 31, 2014. |
| 5 | Security is a 144A or Section 4(a)(2) security. The total market value of 144A or Section 4(a)(2) securities is $29,708,799 (cost $29,536,168), or 12.2% of total net assets. |
| 6 | Repurchase Agreements — See Note 5. |
| 7 | Securities lending collateral — See Note 6. |
| 18 | THE GUGGENHEIM FUNDS ANNUAL REPORT | SEE NOTES TO FINANCIAL STATEMENTS. |
| CONSOLIDATED STATEMENT OF ASSETS AND LIABILITIES |
| MANAGED FUTURES STRATEGY FUND | |
December 31, 2014
| Assets: | |
| Investments in unaffiliated issuers, at value – including $289,536 of securities loaned (cost $40,422,092) | | $ | 40,792,753 | |
| Investments in affiliated issuers, at value (cost $159,637,177) | | | 158,931,602 | |
| Repurchase agreements, at value (cost $26,493,803) | | | 26,493,803 | |
| Total investments (cost $226,553,072) | | | 226,218,158 | |
| Foreign currency, at value (cost $1,219,939) | | | 1,216,895 | |
| Segregated cash with broker | | | 19,450,357 | |
| Receivables: | |
| Fund shares sold | | | 549,675 | |
| Dividends | | | 239,721 | |
| Variation margin | | | 129,797 | |
| Interest | | | 41,735 | |
| Securities lending income | | | 2,193 | |
| Total assets | | | 247,848,531 | |
| | | | | |
| Liabilities: | |
| Overdraft due to custodian bank | | | 1,253,265 | |
| Due to broker | | | 376,180 | |
| Payable for: | |
| Fund shares redeemed | | | 1,155,886 | |
| Upon return of securities loaned | | | 295,800 | |
| Securities purchased | | | 228,873 | |
| Management fees | | | 182,872 | |
| Distribution and service fees | | | 63,962 | |
| Transfer agent and administrative fees | | | 51,194 | |
| Portfolio accounting fees | | | 20,489 | |
| Miscellaneous | | | 150,930 | |
| Total liabilities | | | 3,779,451 | |
| Net assets | | $ | 244,069,080 | |
| | | | | |
| Net assets consist of: | |
| Paid in capital | | $ | 310,669,709 | |
| Accumulated net investment loss | | | (4,994,427 | ) |
| Accumulated net realized loss on investments | | | (72,446,030 | ) |
| Net unrealized appreciation on investments | | | 10,839,828 | |
| Net assets | | $ | 244,069,080 | |
| | | | | |
| A-Class: | |
| Net assets | | $ | 27,514,331 | |
| Capital shares outstanding | | | 1,140,943 | |
| Net asset value per share | | $ | 24.12 | |
| Maximum offering price per share (Net asset value divided by 95.25%) | | $ | 25.32 | |
| | | | | |
| C-Class: | |
| Net assets | | $ | 24,065,628 | |
| Capital shares outstanding | | | 1,059,604 | |
| Net asset value per share | | $ | 22.71 | |
| | | | | |
| H-Class: | |
| Net assets | | $ | 180,871,629 | |
| Capital shares outstanding | | | 7,501,127 | |
| Net asset value per share | | $ | 24.11 | |
| | | | | |
| Institutional Class: | |
| Net assets | | $ | 11,006,709 | |
| Capital shares outstanding | | | 450,898 | |
| Net asset value per share | | $ | 24.41 | |
| | | | | |
| Y-Class: | |
| Net assets | | $ | 610,783 | |
| Capital shares outstanding | | | 24,965 | |
| Net asset value per share | | $ | 24.47 | |
| SEE NOTES TO FINANCIAL STATEMENTS. | THE GUGGENHEIM FUNDS ANNUAL REPORT | 19 |
| CONSOLIDATED STATEMENT OF OPERATIONS |
| MANAGED FUTURES STRATEGY FUND |
Year Ended December 31, 2014
| Investment Income: | |
| Interest | | $ | 2,232,224 | |
| Dividends from securities of affiliated issuers | | | 1,545,930 | |
| Dividends from securities of unaffiliated issuers | | | 475,157 | |
| Income from securities lending, net | | | 23,022 | |
| Total investment income | | | 4,276,333 | |
| | | | | |
| Expenses: | |
| Management fees | | | 2,384,285 | |
| Transfer agent and administrative fees: | |
| A-Class | | | 131,290 | |
| C-Class | | | 61,471 | |
| H-Class | | | 417,851 | |
| Institutional Class | | | 13,745 | |
| Y-Class | | | 2,585 | |
| Distribution and service fees: | |
| A-Class | | | 131,289 | |
| C-Class | | | 245,884 | |
| H-Class | | | 417,850 | |
| Portfolio accounting fees | | | 249,199 | |
| Registration fees | | | 235,195 | |
| Custodian fees | | | 30,122 | |
| Trustees’ fees* | | | 26,669 | |
| Line of credit interest expense | | | 81 | |
| Miscellaneous | | | 199,940 | |
| Total expenses | | | 4,547,456 | |
| Less: | |
| Expenses waived by Adviser | | | (165,713 | ) |
| Net expenses | | | 4,381,743 | |
| Net investment loss | | | (105,410 | ) |
| | | | | |
| Net Realized and Unrealized Gain (Loss): | |
| Net realized gain (loss) on: | |
| Investments in unaffiliated issuers | | $ | 427,477 | |
| Investments in affiliated issuers | | | (114,870 | ) |
| Futures contracts | | | 27,070,090 | |
| Foreign currency | | | (50,362 | ) |
| Net realized gain | | | 27,332,335 | |
| Net change in unrealized appreciation (depreciation) on: | |
| Investments in unaffiliated issuers | | | (371,379 | ) |
| Investments in affiliated issuers | | | (705,575 | ) |
| Futures contracts | | | (5,733,548 | ) |
| Foreign currency | | | 1,046 | |
| Net change in unrealized appreciation (depreciation) | | | (6,809,456 | ) |
| Net realized and unrealized gain | | | 20,522,879 | |
| Net increase in net assets resulting from operations | | $ | 20,417,469 | |
| * | Relates to Trustees not deemed "interested persons" within the meaning of Section 2(a)(19) of the 1940 Act. |
| 20 | THE GUGGENHEIM FUNDS ANNUAL REPORT | SEE NOTES TO FINANCIAL STATEMENTS. |
| CONSOLIDATED STATEMENTS OF CHANGES IN NET ASSETS |
| MANAGED FUTURES STRATEGY FUND | |
| | | Year Ended December 31, 2014 | | | Year Ended December 31, 2013 | |
| Increase (Decrease) in Net Assets from Operations: | | | | | | |
| Net investment loss | | $ | (105,410 | ) | | $ | (4,739,010 | ) |
| Net realized gain on investments and foreign currency | | | 27,332,335 | | | | 22,680,010 | |
| Net change in unrealized appreciation (depreciation) on investments and foreign currency | | | (6,809,456 | ) | | | (1,032,281 | ) |
| Net increase in net assets resulting from operations | | | 20,417,469 | | | | 16,908,719 | |
| | | | | | | | | |
| Distributions to shareholders from: | | | | | | | | |
| Net investment income | | | | | | | | |
| A-Class | | | (313,785 | ) | | | — | |
| C-Class | | | (299,361 | ) | | | — | |
| H-Class | | | (2,130,001 | ) | | | — | |
| Institutional Class | | | (125,944 | ) | | | — | |
| Y-Class | | | (7,829 | ) | | | — | |
| Total distributions to shareholders | | | (2,876,920 | ) | | | — | |
| | | | | | | | | |
| Capital share transactions: | | | | | | | | |
| Proceeds from sale of shares | | | | | | | | |
| A-Class | | | 8,716,439 | | | | 20,047,163 | |
| C-Class | | | 3,028,191 | | | | 2,300,319 | |
| H-Class | | | 60,160,173 | | | | 76,683,285 | |
| Institutional Class | | | 10,474,033 | | | | 6,003,352 | |
| Y-Class | | | 20,000 | | | | 574,534 | |
| Distributions reinvested | | | | | | | | |
| A-Class | | | 276,172 | | | | — | |
| C-Class | | | 289,334 | | | | — | |
| H-Class | | | 2,043,559 | | | | — | |
| Institutional Class | | | 124,839 | | | | — | |
| Y-Class | | | 3,281 | | | | — | |
| Cost of shares redeemed | | | | | | | | |
| A-Class | | | (60,395,444 | ) | | | (93,084,788 | ) |
| C-Class | | | (10,427,970 | ) | | | (23,140,295 | ) |
| H-Class | | | (85,798,345 | ) | | | (396,805,134 | ) |
| Institutional Class | | | (3,000,585 | ) | | | (49,563,256 | ) |
| Y-Class | | | (2,411,478 | ) | | | (99,821,495 | ) |
| Net decrease from capital share transactions | | | (76,897,801 | ) | | | (556,806,315 | ) |
| Net decrease in net assets | | | (59,357,252 | ) | | | (539,897,596 | ) |
| | | | | | | | | |
| Net assets: | | | | | | | | |
| Beginning of year | | | 303,426,332 | | | | 843,323,928 | |
| End of year | | $ | 244,069,080 | | | $ | 303,426,332 | |
| Accumulated net investment loss at end of year | | $ | (4,994,427 | ) | | $ | (1,952,195 | ) |
| SEE NOTES TO FINANCIAL STATEMENTS. | THE GUGGENHEIM FUNDS ANNUAL REPORT | 21 |
CONSOLIDATED STATEMENTS OF CHANGES IN NET ASSETS (concluded) |
| MANAGED FUTURES STRATEGY FUND | |
| | | Year Ended December 31, 2014 | | | Year Ended December 31, 2013 | |
| Capital share activity: | | | | | | |
| Shares sold | | | | | | |
| A-Class | | | 395,808 | | | | 936,557 | |
| C-Class | | | 144,551 | | | | 112,657 | |
| H-Class | | | 2,724,699 | | | | 3,578,841 | |
| Institutional Class | | | 468,393 | | | | 277,573 | |
| Y-Class | | | 895 | | | | 26,784 | |
| Shares issued from reinvestment of distributions | | | | | | | | |
| A-Class | | | 11,848 | | | | — | |
| C-Class | | | 13,175 | | | | — | |
| H-Class | | | 87,665 | | | | — | |
| Institutional Class | | | 5,292 | | | | — | |
| Y-Class | | | 139 | | | | — | |
| Shares redeemed | | | | | | | | |
| A-Class | | | (2,738,853 | ) | | | (4,339,454 | ) |
| C-Class | | | (506,997 | ) | | | (1,134,434 | ) |
| H-Class | | | (3,952,748 | ) | | | (18,541,767 | ) |
| Institutional Class | | | (132,954 | ) | | | (2,304,762 | ) |
| Y-Class | | | (111,163 | ) | | | (4,618,693 | ) |
| Net decrease in shares | | | (3,590,250 | ) | | | (26,006,698 | ) |
| 22 | THE GUGGENHEIM FUNDS ANNUAL REPORT | SEE NOTES TO FINANCIAL STATEMENTS. |
| CONSOLIDATED FINANCIAL HIGHLIGHTS |
| MANAGED FUTURES STRATEGY FUND | |
This table is presented to show selected data for a share outstanding throughout each period and to assist shareholders in evaluating a Fund’s performance for the periods presented.
| A-Class | | Year Ended Dec. 31, 2014 | | | Year Ended Dec. 31, 2013 | | | Year Ended Dec. 31, 2012 | | | Year Ended Dec. 31, 2011 | | | Year Ended Dec. 31, 2010 | |
| Per Share Data | | | | | | | | | | | | | | | |
| Net asset value, beginning of period | | $ | 22.15 | | | $ | 21.23 | | | $ | 23.95 | | | $ | 25.78 | | | $ | 26.81 | |
| Income (loss) from investment operations: | |
Net investment income (loss)a | | | .02 | | | | (.19 | ) | | | (.39 | ) | | | (.44 | ) | | | (.41 | ) |
| Net gain (loss) on investments (realized and unrealized) | | | 2.23 | | | | 1.11 | | | | (2.33 | ) | | | (1.39 | ) | | | (.62 | ) |
| Total from investment operations | | | 2.25 | | | | .92 | | | | (2.72 | ) | | | (1.83 | ) | | | (1.03 | ) |
| Less distributions from: | |
| Net investment income | | | (.28 | ) | | | — | | | | — | | | | — | | | | — | |
| Total distributions | | | (.28 | ) | | | — | | | | — | | | | — | | | | — | |
| Redemption fees collected | | | — | | | | — | | | | — | | | | — | | | | — | c |
| Net asset value, end of period | | $ | 24.12 | | | $ | 22.15 | | | $ | 21.23 | | | $ | 23.95 | | | $ | 25.78 | |
| | |
Total Returnd | | | 10.06 | % | | | 4.33 | % | | | (11.32 | %) | | | (7.14 | %) | | | (3.84 | %) |
| Ratios/Supplemental Data | |
| Net assets, end of period (in thousands) | | $ | 27,514 | | | $ | 76,900 | | | $ | 145,950 | | | $ | 733,469 | | | $ | 657,317 | |
| Ratios to average net assets: | |
| Net investment income (loss) | | | 0.07 | % | | | (0.89 | %) | | | (1.71 | %) | | | (1.76 | %) | | | (1.66 | %) |
Total expensese | | | 1.74 | % | | | 1.74 | % | | | 1.96 | % | | | 2.05 | % | | | 2.04 | % |
Net expensesf | | | 1.68 | % | | | 1.67 | % | | | 1.89 | % | | | 1.97 | % | | | 1.97 | % |
| Portfolio turnover rate | | | 83 | % | | | 102 | % | | | 172 | % | | | 72 | % | | | 148 | % |
| SEE NOTES TO FINANCIAL STATEMENTS. | THE GUGGENHEIM FUNDS ANNUAL REPORT | 23 |
CONSOLIDATED FINANCIAL HIGHLIGHTS (continued) |
| MANAGED FUTURES STRATEGY FUND | |
This table is presented to show selected data for a share outstanding throughout each period and to assist shareholders in evaluating a Fund’s performance for the periods presented.
| C-Class | | Year Ended Dec. 31, 2014 | | | Year Ended Dec. 31, 2013 | | | Year Ended Dec. 31, 2012 | | | Year Ended Dec. 31, 2011 | | | Year Ended Dec. 31, 2010 | |
| Per Share Data | | | | | | | | | | | | | | | |
| Net asset value, beginning of period | | $ | 21.04 | | | $ | 20.31 | | | $ | 23.09 | | | $ | 25.04 | | | $ | 26.24 | |
| Income (loss) from investment operations: | |
Net investment income (loss)a | | | (.15 | ) | | | (.33 | ) | | | (.53 | ) | | | (.61 | ) | | | (.59 | ) |
| Net gain (loss) on investments (realized and unrealized) | | | 2.10 | | | | 1.06 | | | | (2.25 | ) | | | (1.34 | ) | | | (.61 | ) |
| Total from investment operations | | | 1.95 | | | | .73 | | | | (2.78 | ) | | | (1.95 | ) | | | (1.20 | ) |
| Less distributions from: | |
| Net investment income | | | (.28 | ) | | | — | | | | — | | | | — | | | | — | |
| Total distributions | | | (.28 | ) | | | — | | | | — | | | | — | | | | — | |
| Redemption fees collected | | | — | | | | — | | | | — | | | | — | | | | — | c |
| Net asset value, end of period | | $ | 22.71 | | | $ | 21.04 | | | $ | 20.31 | | | $ | 23.09 | | | $ | 25.04 | |
| | |
Total Returnd | | | 9.22 | % | | | 3.59 | % | | | (12.04 | %) | | | (7.79 | %) | | | (4.57 | %) |
| Ratios/Supplemental Data | |
| Net assets, end of period (in thousands) | | $ | 24,066 | | | $ | 29,637 | | | $ | 49,378 | | | $ | 96,647 | | | $ | 158,628 | |
| Ratios to average net assets: | |
| Net investment income (loss) | | | (0.72 | %) | | | (1.63 | %) | | | (2.45 | %) | | | (2.50 | %) | | | (2.41 | %) |
Total expensese | | | 2.50 | % | | | 2.48 | % | | | 2.70 | % | | | 2.80 | % | | | 2.79 | % |
Net expensesf | | | 2.43 | % | | | 2.42 | % | | | 2.64 | % | | | 2.72 | % | | | 2.72 | % |
| Portfolio turnover rate | | | 83 | % | | | 102 | % | | | 172 | % | | | 72 | % | | | 148 | % |
| 24 | THE GUGGENHEIM FUNDS ANNUAL REPORT | SEE NOTES TO FINANCIAL STATEMENTS. |
CONSOLIDATED FINANCIAL HIGHLIGHTS (continued) |
| MANAGED FUTURES STRATEGY FUND |
This table is presented to show selected data for a share outstanding throughout each period and to assist shareholders in evaluating a Fund’s performance for the periods presented.
| H-Class | | Year Ended Dec. 31, 2014 | | | Year Ended Dec. 31, 2013 | | | Year Ended Dec. 31, 2012 | | | Year Ended Dec. 31, 2011 | | | Year Ended Dec. 31, 2010 | |
| Per Share Data | | | | | | | | | | | | | | | |
| Net asset value, beginning of period | | $ | 22.15 | | | $ | 21.23 | | | $ | 23.95 | | | $ | 25.78 | | | $ | 26.81 | |
| Income (loss) from investment operations: | |
Net investment income (loss)a | | | — | b | | | (.20 | ) | | | (.38 | ) | | | (.44 | ) | | | (.42 | ) |
| Net gain (loss) on investments (realized and unrealized) | | | 2.24 | | | | 1.12 | | | | (2.34 | ) | | | (1.39 | ) | | | (.61 | ) |
| Total from investment operations | | | 2.24 | | | | .92 | | | | (2.72 | ) | | | (1.83 | ) | | | (1.03 | ) |
| Less distributions from: | |
| Net investment income | | | (.28 | ) | | | — | | | | — | | | | — | | | | — | |
| Total distributions | | | (.28 | ) | | | — | | | | — | | | | — | | | | — | |
| Redemption fees collected | | | — | | | | — | | | | — | | | | — | | | | — | c |
| Net asset value, end of period | | $ | 24.11 | | | $ | 22.15 | | | $ | 21.23 | | | $ | 23.95 | | | $ | 25.78 | |
| | |
Total Returnd | | | 10.06 | % | | | 4.33 | % | | | (11.32 | %) | | | (7.14 | %) | | | (3.84 | %) |
| Ratios/Supplemental Data | |
| Net assets, end of period (in thousands) | | $ | 180,872 | | | $ | 191,400 | | | $ | 501,109 | | | $ | 1,059,988 | | | $ | 1,199,718 | |
| Ratios to average net assets: | |
| Net investment income (loss) | | | 0.01 | % | | | (0.94 | %) | | | (1.70 | %) | | | (1.75 | %) | | | (1.66 | %) |
Total expensese | | | 1.75 | % | | | 1.75 | % | | | 1.95 | % | | | 2.05 | % | | | 2.04 | % |
Net expensesf | | | 1.68 | % | | | 1.68 | % | | | 1.89 | % | | | 1.97 | % | | | 1.97 | % |
| Portfolio turnover rate | | | 83 | % | | | 102 | % | | | 172 | % | | | 72 | % | | | 148 | % |
| SEE NOTES TO FINANCIAL STATEMENTS. | THE GUGGENHEIM FUNDS ANNUAL REPORT | 25 |
CONSOLIDATED FINANCIAL HIGHLIGHTS (continued) |
| MANAGED FUTURES STRATEGY FUND | |
This table is presented to show selected data for a share outstanding throughout each period and to assist shareholders in evaluating a Fund’s performance for the periods presented.
| Institutional Class | | Year Ended Dec. 31, 2014 | | | Year Ended Dec. 31, 2013 | | | Year Ended Dec. 31, 2012 | | | Year Ended Dec. 31, 2011 | | Period Ended Dec. 31, 2010g | |
| Per Share Data | | | | | | | | | | | | | | | |
| Net asset value, beginning of period | | $ | 22.36 | | | $ | 21.38 | | | $ | 24.06 | | | $ | 25.84 | | | $ | 25.58 | |
| Income (loss) from investment operations: | |
Net investment income (loss)a | | | .05 | | | | (.19 | ) | | | (.33 | ) | | | (.38 | ) | | | (.23 | ) |
| Net gain (loss) on investments (realized and unrealized) | | | 2.28 | | | | 1.17 | | | | (2.35 | ) | | | (1.40 | ) | | | .49 | |
| Total from investment operations | | | 2.33 | | | | .98 | | | | (2.68 | ) | | | (1.78 | ) | | | .26 | |
| Less distributions from: | |
| Net investment income | | | (.28 | ) | | | — | | | | — | | | | — | | | | — | |
| Total distributions | | | (.28 | ) | | | — | | | | — | | | | — | | | | — | |
| Redemption fees collected | | | — | | | | — | | | | — | | | | — | | | | — | c |
| Net asset value, end of period | | $ | 24.41 | | | $ | 22.36 | | | $ | 21.38 | | | $ | 24.06 | | | $ | 25.84 | |
| | |
Total Returnd | | | 10.28 | % | | | 4.63 | % | | | (11.14 | %) | | | (6.85 | %) | | | 0.98 | % |
| Ratios/Supplemental Data | |
| Net assets, end of period (in thousands) | | $ | 11,007 | | | $ | 2,464 | | | $ | 45,700 | | | $ | 101,549 | | | $ | 134,733 | |
| Ratios to average net assets: | |
| Net investment income (loss) | | | 0.21 | % | | | (0.86 | %) | | | (1.45 | %) | | | (1.50 | %) | | | (1.41 | %) |
Total expensese | | | 1.50 | % | | | 1.52 | % | | | 1.70 | % | | | 1.80 | % | | | 1.78 | % |
Net expensesf | | | 1.44 | % | | | 1.45 | % | | | 1.64 | % | | | 1.72 | % | | | 1.72 | % |
| Portfolio turnover rate | | | 83 | % | | | 102 | % | | | 172 | % | | | 72 | % | | | 148 | % |
| 26 | THE GUGGENHEIM FUNDS ANNUAL REPORT | SEE NOTES TO FINANCIAL STATEMENTS. |
CONSOLIDATED FINANCIAL HIGHLIGHTS (concluded) |
| MANAGED FUTURES STRATEGY FUND |
This table is presented to show selected data for a share outstanding throughout each period and to assist shareholders in evaluating a Fund’s performance for the periods presented.
| Y-Class | | Year Ended Dec. 31, 2014 | | | Year Ended Dec. 31, 2013 | | | Year Ended Dec. 31, 2012 | | | Year Ended Dec. 31, 2011 | | Period Ended Dec. 31, 2010h | |
| Per Share Data | | | | | | | | | | | | | | | |
| Net asset value, beginning of period | | $ | 22.40 | | | $ | 21.41 | | | $ | 24.07 | | | $ | 25.84 | | | $ | 25.74 | |
| Income (loss) from investment operations: | |
Net investment income (loss)a | | | .05 | | | | (.21 | ) | | | (.32 | ) | | | (.37 | ) | | | (.26 | ) |
| Net gain (loss) on investments (realized and unrealized) | | | 2.30 | | | | 1.20 | | | | (2.34 | ) | | | (1.40 | ) | | | .36 | |
| Total from investment operations | | | 2.35 | | | | .99 | | | | (2.66 | ) | | | (1.77 | ) | | | .10 | |
| Less distributions from: | |
| Net investment income | | | (.28 | ) | | | — | | | | — | | | | — | | | | — | |
| Total distributions | | | (.28 | ) | | | — | | | | — | | | | — | | | | — | |
| Redemption fees collected | | | — | | | | — | | | | — | | | | — | | | | — | c |
| Net asset value, end of period | | $ | 24.47 | | | $ | 22.40 | | | $ | 21.41 | | | $ | 24.07 | | | $ | 25.84 | |
| | |
Total Returnd | | | 10.40 | % | | | 4.62 | % | | | (11.05 | %) | | | (6.85 | %) | | | 0.39 | % |
| Ratios/Supplemental Data | |
| Net assets, end of period (in thousands) | | $ | 611 | | | $ | 3,026 | | | $ | 101,187 | | | $ | 404,684 | | | $ | 189,251 | |
| Ratios to average net assets: | |
| Net investment income (loss) | | | 0.25 | % | | | (0.96 | %) | | | (1.41 | %) | | | (1.47 | %) | | | (1.36 | %) |
Total expensese | | | 1.44 | % | | | 1.51 | % | | | 1.65 | % | | | 1.75 | % | | | 1.73 | % |
Net expensesf | | | 1.38 | % | | | 1.44 | % | | | 1.59 | % | | | 1.68 | % | | | 1.67 | % |
| Portfolio turnover rate | | | 83 | % | | | 102 | % | | | 172 | % | | | 72 | % | | | 148 | % |
a | Net investment income (loss) per share was computed using average shares outstanding throughout the period. |
b | Net investment income (loss) is less than $0.01 per share. |
c | Redemption fees collected are less than $0.01 per share. |
d | Total return does not reflect the impact of any applicable sales charges and has not been annualized. |
e | Does not include expenses of the underlying funds in which the Fund invests. |
f | Net expense information reflects the expense ratios after expense waivers. |
g | Since commencement of operations: May 3, 2010. Percentage amounts for the period, except total return and portfolio turnover rate, have been annualized. |
h | Since commencement of operations: March 29, 2010. Percentage amounts for the period, except total return and portfolio turnover rate, have been annualized. |
| SEE NOTES TO FINANCIAL STATEMENTS. | THE GUGGENHEIM FUNDS ANNUAL REPORT | 27 |
| NOTES TO CONSOLIDATED FINANCIAL STATEMENTS |
1. Organization, Consolidation of Subsidiary and Significant Accounting Policies
Organization
The Rydex Series Funds (the “Trust”), a Delaware business trust, is registered with the SEC under the Investment Company Act of 1940 (”1940 Act”), as a non-diversified, open-ended investment company of the series type. Each series, in effect, is representing a separate Fund. The Trust is authorized to issue an unlimited number of no par value shares. The Trust accounts for the assets of each Fund separately.
The Trust offers a combination of eight separate classes of shares: Investor Class shares, Advisor Class shares, A-Class shares, C-Class shares, H-Class shares, Y-Class shares, Institutional Class shares and Money Market Class shares. Sales of shares of each Class are made without a front-end sales charge at the net asset value per share (“NAV”), with the exception of A-Class shares. A-Class shares are sold at the NAV, plus the applicable front-end sales charge. The sales charge varies depending on the amount purchased, but will not exceed 4.75%. A-Class share purchases of $1 million or more are exempt from the front-end sales charge but have a 1% contingent deferred sales charge (“CDSC”) if shares are redeemed within 12 months of purchase. C-Class shares have a 1% CDSC if shares are redeemed within 12 months of purchase. Institutional Class shares are offered primarily for direct investment by institutions such as pension and profit sharing plans, endowments, foundations and corporations. Institutional Class shares have a minimum initial investment of $2 million and a minimum account balance of $1 million. Institutional Class shares are offered without a front-end sales charge or CDSC. At December 31, 2014, the Trust consisted of fifty-two funds (the ”Funds”).
This report covers the Managed Futures Strategy Fund (the “Fund”). Only A-Class, C-Class, H-Class, Institutional Class and Y-Class shares had been issued by the Fund.
Guggenheim Investments (“GI”) provides advisory services, and Rydex Fund Services, LLC (“RFS”) provides transfer agent, administrative and accounting services to the Trust. Guggenheim Funds Distributors, LLC (“GFD”) acts as principal underwriter for the Trust. GI, RFS and GFD are affiliated entities.
Consolidation of Subsidiary
The consolidated financial statements of the Fund include the accounts of a wholly-owned and controlled Cayman Islands subsidiary (the “Subsidiary”). Significant inter-company accounts and transactions have been eliminated in consolidation for the Fund.
| 28 | THE GUGGENHEIM FUNDS ANNUAL REPORT | |
NOTES TO CONSOLIDATED FINANCIAL STATEMENTS (continued) |
The Fund may invest up to 25% of its total assets in its Subsidiary which acts as an investment vehicle in order to effect certain investments consistent with the Fund’s investment objectives and policies.
A summary of the Fund’s investment in its Subsidiary is as follows:
| Fund | Inception Date of Subsidiary | | Subsidiary Net Assets at December 31, 2014 | | | % of Net Assets of the Fund at December 31, 2014 |
| Managed Futures Strategy Fund | 05/01/08 | | $ | 17,822,947 | | | | 7.3% |
Significant Accounting Policies
The Fund operates as an investment company and accordingly follows the investment company accounting and reporting guidance of the Financial Accounting Standards Board (“FASB”) Accounting Standards Codification Topic 946 Financial Services – Investment Companies.
The following significant accounting policies are in conformity with U.S. generally accepted accounting principles (“U.S. GAAP”) and are consistently followed by the Trust. This requires management to make estimates and assumptions that affect the reported amount of assets and liabilities and disclosure of contingent assets and liabilities at the date of the financial statements and the reported amounts of revenues and expenses during the reporting period. Actual results could differ from these estimates. All time references are based on Eastern Time.
The NAV of each Class of the Fund is calculated by dividing the market value of the Fund’s securities and other assets, less all liabilities, attributable to the Class by the number of outstanding shares of the Class.
A. The Board of Trustees of the Fund (the “Board”) has adopted policies and procedures for the valuation of the Fund's investments (the “Valuation Procedures”). Pursuant to the Valuation Procedures, the Board has delegated to a valuation committee, consisting of representatives from Guggenheim’s investment management, fund administration, legal and compliance departments (the “Valuation Committee”), the day-to-day responsibility for implementing the Valuation Procedures, including, under most circumstances, the responsibility for determining the fair value of the Fund’s securities or other assets.
Valuations of the Fund's securities are supplied primarily by pricing services appointed pursuant to the processes set forth in the Valuation Procedures. The Valuation Committee convenes monthly, or more frequently as needed and will review the valuation of all assets which have been fair valued for reasonableness.
| | THE GUGGENHEIM FUNDS ANNUAL REPORT | 29 |
NOTES TO CONSOLIDATED FINANCIAL STATEMENTS (continued) |
The Fund's officers, through the Valuation Committee and consistent with the monitoring and review responsibilities set forth in the Valuation Procedures, regularly review procedures used by, and valuations provided by, the pricing services.
If the pricing service cannot or does not provide a valuation for a particular investment or such valuation is deemed unreliable, such investment is fair valued by the Valuation Committee.
Open-end investment companies (“Mutual Funds”) are valued at their NAV as of the close of business, on the valuation date. Exchange-traded funds (“ETFs”) and closed-end investment companies (“CEFs”) are valued at the last quoted sales price.
Debt securities with a maturity of greater than 60 days at acquisition are valued at prices that reflect broker/dealer supplied valuations or are obtained from independent pricing services, which may consider the trade activity, treasury spreads, yields or price of bonds of comparable quality, coupon, maturity, and type, as well as prices quoted by dealers who make markets in such securities. Short-term debt securities with a maturity of 60 days or less at acquisition are valued at amortized cost, which approximates market value.
Repurchase agreements are valued at amortized cost, which approximates market value.
The value of futures contracts is accounted for using the unrealized gain or loss on the contracts that is determined by marking the contracts to their current realized settlement prices. Financial futures contracts are valued at the 4:00 p.m. price on the valuation date. In the event that the exchange for a specific futures contract closes earlier than 4:00 p.m., the futures contract is valued at the Official Settlement Price of the exchange. However, the underlying securities from which the futures contract value is derived are monitored until 4:00 p.m. to determine if fair valuation would provide a more accurate valuation.
Investments for which market quotations are not readily available (including restricted securities) are fair valued as determined in good faith by GI under the direction of the Board of Trustees using methods established or ratified by the Board of Trustees. Valuations in accordance with these methods are intended to reflect each security’s (or asset’s) “fair value.” Each such determination is based on a consideration of all relevant factors, which are likely to vary from one pricing context to another. Examples of such factors may include, but are not limited to: (i) the type of security, (ii) the initial cost of the security, (iii) the existence of any contractual restrictions on the security’s disposition, (iv) the price and extent
| 30 | THE GUGGENHEIM FUNDS ANNUAL REPORT | |
NOTES TO CONSOLIDATED FINANCIAL STATEMENTS (continued) |
of public trading in similar securities of the issuer or of comparable companies, (v) quotations or evaluated prices from broker-dealers and/or pricing services, (vi) information obtained from the issuer, analysts, and/or the appropriate stock exchange (for exchange-traded securities), (vii) an analysis of the company’s financial statements, and (viii) an evaluation of the forces that influence the issuer and the market(s) in which the security is purchased and sold (e.g. the existence of pending merger activity, public offerings or tender offers that might affect the value of the security). In connection with futures contracts and other derivative investments, such factors may include obtaining information as to how (a) these contracts and other derivative investments trade in the futures or other derivative markets, respectively, and (b) the securities underlying these contracts and other derivative investments trade in the cash market.
B. The Fund may purchase and sell interests in securities on a when-issued and delayed delivery basis, with payment and delivery scheduled for a future date. No income accrues to the Fund on such interests or securities in connection with such transactions prior to the date the Fund actually take delivery of such interests or securities. These transactions are subject to market fluctuations and are subject to the risk that the value at delivery may be more or less than the trade date purchase price. Although the Fund will generally purchase these securities with the intention of acquiring such securities, they may sell such securities before the settlement date.
C. Upon entering into a futures contract, the Fund deposits and maintains as collateral such initial margin as required by the exchange on which the transaction is affected. Pursuant to the contract, the Fund agrees to receive from or pay to the broker an amount of cash equal to the daily fluctuation in value of the contract. Such receipts or payments are known as variation margin and are recorded by the Fund as unrealized gains or losses. When the contract is closed, the Fund records a realized gain or loss equal to the difference between the value of the contract at the time it was opened and the value at the time it was closed.
D. Investment securities and other assets and liabilities denominated in foreign currencies are translated into U.S. dollar amounts at the date of valuation. Purchases and sales of investment securities and income and expense items denominated in foreign currencies are translated into U.S. dollar amounts on the respective dates of such transactions. The Fund does not isolate that portion of the results of operations resulting from changes in foreign exchange rates on investments from the fluctuations arising from changes in market prices of securities held. Such fluctuations are included with the net realized and unrealized gain and loss from investments.
| | THE GUGGENHEIM FUNDS ANNUAL REPORT | 31 |
NOTES TO CONSOLIDATED FINANCIAL STATEMENTS (continued) |
Reported net realized foreign exchange gains or losses arise from sales of foreign currencies and currency gains or losses realized between the trade and settlement dates on investment transactions. Net unrealized exchange gains and losses arise from changes in the fair values of assets and liabilities other than investments in securities at the fiscal period end, resulting from changes in exchange rates.
E. Security transactions are recorded on the trade date for financial reporting purposes. Realized gains and losses from securities transactions are recorded using the identified cost basis. Proceeds from lawsuits related to investment holdings are recorded as realized gains in the Fund. Dividend income is recorded on the ex-dividend date, net of applicable taxes withheld by foreign countries. Taxable non-cash dividends are recorded as dividend income. Interest income, including amortization of premiums and accretion of discounts, is accrued on a daily basis.
F. Distributions of net investment income and net realized gains, if any, are declared and paid at least annually. Dividends are reinvested in additional shares unless shareholders request payment in cash. Distributions are recorded on the ex-dividend date and are determined in accordance with income tax regulations which may differ from U.S. GAAP.
G. Interest and dividend income, most expenses, all realized gains and losses, and all unrealized gains and losses are allocated to the classes based upon the value of the outstanding shares in each Class. Certain costs, such as distribution and service fees are charged directly to specific classes. In addition, certain expenses have been allocated to the individual Funds in the Trust on a pro rata basis upon the respective aggregate net assets of each Fund included in the Trust.
H. The Fund may leave cash overnight in its cash account with the custodian. Periodically, the Fund may have cash due to the custodian bank as an overdraft balance. A fee is incurred on this overdraft, calculated by multiplying the overdraft by a rate based on the federal funds rate.
I. Under the Fund's organizational documents, its Trustees and Officers are indemnified against certain liabilities arising out of the performance of their duties to the Trust. In addition, throughout the normal course of business, the Fund enters into contracts that contain a variety of representations and warranties which provide general indemnifications. The Fund's maximum exposure under these arrangements is unknown, as this would involve future claims that may be made against the Fund and/or its affiliates that have not yet occurred. However, based on experience, the Fund expects the risk of loss to be remote.
| 32 | THE GUGGENHEIM FUNDS ANNUAL REPORT | |
NOTES TO CONSOLIDATED FINANCIAL STATEMENTS (continued) |
2. Financial Instruments
As part of its investment strategy, the Fund utilizes derivative instruments. These investments involve, to varying degrees, elements of market risk and risks in excess of the amounts recognized in the Statement of Assets and Liabilities.
A futures contract is an agreement to purchase (long) or sell (short) an agreed amount of securities or other instruments at a set price for delivery at a future date. There are significant risks associated with a Fund’s use of futures contracts, including (i) there may be an imperfect or no correlation between the changes in market value of the underlying asset and the prices of futures contracts; (ii) there may not be a liquid secondary market for a futures contract; (iii) trading restrictions or limitations may be imposed by an exchange; and (iv) government regulations may restrict trading in futures contracts. When investing in futures, there is minimal counterparty credit risk to the Fund because futures are exchange-traded and the exchange’s clearinghouse, as counterparty to all exchange-traded futures, guarantees against default. Cash deposits are shown as restricted cash on the Statement of Assets and Liabilities; securities held as collateral are noted on the Schedule of Investments.
The Fund’s use of derivative instruments provides leveraged exposure. In addition, as investment in derivative instruments generally requires a small investment relative to the amount of investment exposure assumed, this creates an opportunity for increased net income but, at the same time, additional leverage risk. The Fund's use of leverage, through borrowings or instruments such as derivatives, may cause the Fund to be more volatile and riskier than if they had not been leveraged.
In conjunction with the use of derivative instruments, the Fund is required to maintain collateral in various forms. The Fund uses, where appropriate, depending on the financial instrument utilized and the broker involved, margin deposits at the broker, cash and/or securities segregated at the custodian bank, discount notes or the repurchase agreements allocated to the Fund.
The Trust has established counterparty credit guidelines and enters into transactions only with financial institutions of investment grade or better. The Trust monitors the counterparty credit risk.
| | THE GUGGENHEIM FUNDS ANNUAL REPORT | 33 |
NOTES TO CONSOLIDATED FINANCIAL STATEMENTS (continued) |
3. Fees and Other Transactions with Affiliates
Under the terms of an investment advisory contract, the Fund and the Subsidiary pay GI investment advisory fees calculated at an annualized rate of 0.90% of their average daily net assets.
GI has contractually agreed to waive the management fee it receives from the Subsidiary in an amount equal to the management fee paid to GI by the Subsidiary. This undertaking will continue in effect for so long as the Fund invests in the Subsidiary, and may not be terminated by GI unless GI obtains the prior approval of the Fund’s Board of Trustees for such termination.
RFS provides transfer agent and administrative services to the Fund calculated at an annualized rate of 0.20% of the average daily net assets of Y-Class and 0.25% of the average daily net assets of the remaining classes, respectively.
RFS also provides accounting services to the Fund for fees calculated at annualized rates below, based on the average daily net assets of the Fund.
| Fund Accounting Fees | (as a % of Net Assets) |
| On the first $250 million | 0.10% |
| On the next $250 million | 0.075% |
| On the next $250 million | 0.05% |
| Over $750 million | 0.03% |
RFS engages external service providers to perform other necessary services for the Trust, such as audit and accounting related services, legal services, custody, printing and mailing, etc., on a pass-through basis. Such expenses are allocated to various Funds within the complex based on relative net assets.
The Trust has adopted a Distribution Plan applicable to A-Class shares and H-Class shares for which GFD and other firms that provide distribution and/or shareholder services (“Service Providers”) may receive compensation. If a Service Provider provides distribution services, the Fund will pay distribution fees to GFD at an annual rate not to exceed 0.25% of average daily net assets, pursuant to Rule 12b-1 of the 1940 Act. GFD, in turn, will pay the Service Provider out of its fees. GFD may, at its discretion, retain a portion of such payments to compensate itself for distribution services.
The Trust has adopted a separate Distribution and Shareholder Services Plan applicable to its C-Class shares that allows the Fund to pay annual distribution and service fees of 1.00% of the Fund's C-Class shares average daily net assets. The annual 0.25% service fee compensates the shareholder’s financial adviser for providing ongoing services to the shareholder. The annual distribution fee of 0.75%
| 34 | THE GUGGENHEIM FUNDS ANNUAL REPORT | |
NOTES TO CONSOLIDATED FINANCIAL STATEMENTS (continued) |
reimburses GFD for paying the shareholder’s financial adviser an ongoing sales commission. GFD advances the first year’s service and distribution fees to the financial adviser. GFD retains the service and distribution fees on accounts with no authorized dealer of record.
If a Fund invests in an affiliated fund, the investing Fund’s Adviser will determine whether to waive fees at the investing fund level. Fee waivers will be calculated at the investing Fund level without regard to any expense cap, if any, in effect for the investing Fund. Fees waived under this arrangement are not subject to reimbursement to GI. For the year ended December 31, 2014, the Fund waived $41,279 related to investments in affiliated Funds.
For the year ended December 31, 2014, GFD retained sales charges of $342,892 relating to sales of A-Class shares of the Trust.
Certain trustees and officers of the Trust are also officers of GI, RFS and GFD.
4. Fair Value Measurement
In accordance with U.S. GAAP, fair value is defined as the price that the Fund would receive to sell an investment or pay to transfer a liability in an orderly transaction with an independent buyer in the principal market, or in the absence of a principal market, the most advantageous market for the investment or liability. U.S. GAAP establishes a three-tier fair value hierarchy based on the types of inputs used to value assets and liabilities and requires corresponding disclosure. The hierarchy and the corresponding inputs are summarized below:
| Level 1 — | quoted prices in active markets for identical assets or liabilities. |
| Level 2 — | significant other observable inputs (for example quoted prices for securities that are similar based on characteristics such as interest rates, prepayment speeds, credit risk, etc.). |
| Level 3 — | significant unobservable inputs based on the best information available under the circumstances, to the extent observable inputs are not available, which may include assumptions. |
The types of inputs available depend on a variety of factors, such as the type of security and the characteristics of the markets in which it trades, if any. Fair valuation determinations that rely on fewer or no observable inputs require greater judgment. Accordingly, fair value determinations for Level 3 securities require the greatest amount of judgment.
| | THE GUGGENHEIM FUNDS ANNUAL REPORT | 35 |
NOTES TO CONSOLIDATED FINANCIAL STATEMENTS (continued) |
The following table summarizes the inputs used to value the Fund's investments at December 31, 2014:
| | | Level 1 Investments In Securities | | | Level 1 Other Financial Instruments* | | | Level 2 Investments In Securities | | | Level 2 Other Financial Instruments* | | | Level 3 Investments In Securities | | | Total | |
| Assets | | | | | | | | | | | | | | | | | | |
| Managed Futures Strategy Fund | | $ | 164,342,930 | | | $ | 7,436,594 | | | $ | 61,875,228 | | | $ | 4,937,842 | | | $ | — | | | $ | 238,592,594 | |
| | |
| Liabilities | | | | | | | | | | | | | | | | | | | | | | | | |
| Managed Futures Strategy Fund | | $ | — | | | $ | 845,099 | | | $ | — | | | $ | 351,717 | | | $ | — | | | $ | 1,196,816 | |
| * | Other financial instruments may include futures contracts, which are reported as unrealized gain/loss at period end. |
Independent pricing services are used to value a majority of the Fund's investments. When values are not available from a pricing service, they may be computed by the Fund's investment adviser or an affiliate. In any event, values may be determined using a variety of sources and techniques, including: market prices; broker quotes; and models which derive prices based on inputs such as prices of securities with comparable maturities and characteristics or based on inputs such as anticipated cash flows or collateral, spread over Treasuries, and other information and analysis.
Indicative quotes from broker-dealers, adjusted for fluctuations in criteria such as credit spreads and interest rates, may be also used to value the Fund’s assets and liabilities, i.e. prices provided by a broker-dealer or other market participant who has not committed to trade at that price. Although indicative quotes are typically received from established market participants, the Fund may not have the transparency to view the underlying inputs which support the market quotations. Significant changes in an indicative quote would generally result in significant changes in the fair value of the security.
Certain fixed income securities are valued by obtaining a monthly indicative quote from a broker-dealer, adjusted for fluctuations in criteria such as credit spreads and interest rates. The Fund's fair valuation guidelines were recently revised to transition such monthly indicative quoted securities from Level 2 to Level 3.
For the year ended December 31, 2014, there were no transfers between levels.
| 36 | THE GUGGENHEIM FUNDS ANNUAL REPORT | |
NOTES TO CONSOLIDATED FINANCIAL STATEMENTS (continued) |
The inputs or methodologies used for valuing securities are not necessarily an indication of the risk associated with investing in those securities. The suitability of the techniques and sources employed to determine fair valuation are regularly monitored and subject to change.
5. Repurchase Agreements
The Funds transfer uninvested cash balances into a single joint account, the daily aggregate balance of which is invested in one or more repurchase agreements collateralized by obligations of the U.S. Treasury and U.S. Government Agencies. The collateral is in the possession of the Funds’ custodian and is evaluated to ensure that its market value exceeds, at a minimum, 102% of the original face amount of the repurchase agreements. Each Fund holds a pro rata share of the collateral based on the dollar amount of the repurchase agreement entered into by each Fund.
At December 31, 2014, the repurchase agreements in the joint account were as follows:
Counterparty and Terms of Agreement | Face Value | Repurchase Price | | Collateral | Par Value | Fair Value |
| HSBC Group | | | | U.S. Treasury Strips | | |
| 0.02% | | | | 0.00% | | |
| Due 01/02/15 | $452,412,764 | $452,413,267 | | 02/15/26 - 11/15/42 | $944,521,100 | $461,461,094 |
| | | | | | | |
| RBC Capital Markets | | | | U.S. TIP Note | | |
| 0.03% | | | | 0.63% | | |
| Due 01/02/15 | 244,412,764 | 244,413,171 | | 07/15/21 | 232,332,200 | 249,301,020 |
In the event of counterparty default, the Funds have the right to collect the collateral to offset losses incurred. There is potential loss to the Funds in the event the Funds are delayed or prevented from exercising their rights to dispose of the collateral securities, including the risk of a possible decline in the value of the underlying securities during the period while the Funds seek to assert their rights. The Funds’ investment adviser, acting under the supervision of the Board of Trustees, reviews the value of the collateral and the creditworthiness of those banks and dealers with which the Funds enter into repurchase agreements to evaluate potential risks.
6. Portfolio Securities Loaned
The Funds may lend their securities to approved brokers to earn additional income. Security lending income shown on the Statement of Operations is shown net of rebates paid to the borrowers and earnings on cash collateral investments shared
| | THE GUGGENHEIM FUNDS ANNUAL REPORT | 37 |
NOTES TO CONSOLIDATED FINANCIAL STATEMENTS (continued) |
with the lending agent. Within this arrangement, the Funds act as the lender, Credit Suisse acts as the lending agent, and other approved registered broker dealers act as the borrowers. The Funds receive cash collateral, valued at 102% of the value of the securities on loan. Under the terms of the Funds’ securities lending agreement with Credit Suisse, cash collateral is invested in one or more joint repurchase agreements collateralized by obligations of the U.S. Treasury or Government Agencies and cash. The Funds bear the risk of loss on cash collateral investments. Collateral is maintained over the life of the loan in an amount not less than the value of loaned securities, as determined at the close of fund business each day; any additional collateral required due to changes in security values is delivered to the Funds the next business day. Although the collateral mitigates the risk, the Funds could experience a delay in recovering its securities and a possible loss of income or value if the borrower fails to return the securities. The Funds have the right under the securities lending agreement to recover the securities from the borrower on demand.
At December 31, 2014, the Fund participated in securities lending as follows:
| Fund | | Value of Securities Loaned | | | Cash Collateral Received | |
| Managed Futures Strategy Fund | | $ | 289,536 | | | $ | 295,800 | |
Cash collateral received was invested in the following joint repurchase agreements at December 31, 2014:
| Counterparty and Terms of Agreement | Face Value | Repurchase Price | | Collateral | Par Value | Fair Value |
| HSBC Securities, Inc. | | | | Fannie Mae Strips | | |
| 0.06% | | | | 0.00% | | |
| Due 01/02/15 | $184,876 | $184,876 | | 11/15/19 - 07/15/37 | $188,040 | $122,404 |
| | | | | Federal Farm Credit Bank | | |
| | | | | 0.34% - 2.22% | | |
| | | | | 01/14/16 - 01/17/23 | 66,317 | 66,171 |
| | | | | | |
| BNP Paribas Securities Corp. | | | U.S. Treasury Note | | |
| 0.06% | | | | 1.25% | | |
| Due 01/02/15 | 74,721 | 74,721 | | 04/30/19 | 77,058 | 76,215 |
| | | | | | | |
| Barclays Capital, Inc. | | | | U.S. Treasury Note | | |
| 0.05% | | | | 1.63% | | |
| Due 01/02/15 | 35,434 | 35,434 | | 12/31/19 | 36,245 | 36,143 |
There is also $769 in segregated cash held as collateral.
| 38 | THE GUGGENHEIM FUNDS ANNUAL REPORT | |
NOTES TO CONSOLIDATED FINANCIAL STATEMENTS (continued) |
7. Derivative Investment Holdings Categorized by Risk Exposure
U.S. GAAP requires disclosures to enable investors to better understand how and why the Fund uses derivative instruments, how these derivative instruments are accounted for and their effects on the Fund's financial position and results of operations.
The Fund utilized derivatives for the following purposes:
| Fund | | Index Exposure | | | Liquidity | |
| Managed Futures Strategy Fund | | x | | | x | |
The following table represents the notional amount of derivative instruments outstanding as an approximate percentage of the Fund’s net assets on a daily basis.
| | | Approximate percentage of Fund's Net Assets on a daily basis |
| Fund | | Long | | Short |
| Managed Futures Strategy Fund | | | 330 | % | | | 110 | % |
The following is a summary of the location of derivative investments on the Fund's Statement of Assets and Liabilities as of December 31, 2014:
| Derivative Investment Type | Asset Derivatives | Liability Derivatives |
| Equity/Interest Rate/Currency/Commodity contracts | Variation margin | Variation margin |
The following table sets forth the fair value of the Fund's derivative investments categorized by primary risk exposure at December 31, 2014:
| Asset Derivative Investments Value | |
| Fund | | Futures Equity Contracts* | | | Futures Currency Contracts* | | | Futures Interest Rate Contracts* | | | Futures Commodity Contracts* | | | Total Value at December 31, 2014 | |
| Managed Futures Strategy Fund | | $ | 1,320,257 | | | $ | 655,519 | | | $ | 5,566,098 | | | $ | 4,832,562 | | | $ | 12,374,436 | |
| Liability Derivative Investments Value | |
| Fund | | Futures Equity Contracts* | | | Futures Currency Contracts* | | | Futures Interest Rate Contracts* | | | Futures Commodity Contracts* | | | Total Value at December 31, 2014 | |
| Managed Futures Strategy Fund | | $ | 581,747 | | | $ | 12,443 | | | $ | 15,778 | | | $ | 586,848 | | | $ | 1,196,816 | |
| * | Includes cumulative appreciation (depreciation) of futures contracts as reported on the Schedule of Investments. Only current day’s variation margin is reported within the Statement of Assets and Liabilities. |
| | THE GUGGENHEIM FUNDS ANNUAL REPORT | 39 |
NOTES TO CONSOLIDATED FINANCIAL STATEMENTS (continued) |
The following is a summary of the location of derivative investments on the Fund's Statement of Operations for the year ended December 31, 2014:
| Derivative Investment Type | Location of Gain (Loss) on Derivatives |
| Equity/Interest Rate/Currency/Commodity contracts | Net realized gain (loss) on futures contracts |
| | Net change in unrealized appreciation (depreciation) on futures contracts |
The following is a summary of the Fund's realized gain (loss) and change in unrealized appreciation (depreciation) on derivative investments recognized on the Statement of Operations categorized by primary risk exposure for the year ended December 31, 2014:
| Realized Gain (Loss) on Derivative Investments Recognized on the Statement of Operations | |
| Fund | | Futures Equity Contracts | | | Futures Currency Contracts | | | Futures Interest Rate Contracts | | | Futures Commodity Contracts | | | Total | |
| Managed Futures Strategy Fund | | $ | 4,613,671 | | | $ | 4,481,294 | | | $ | 10,923,907 | | | $ | 7,051,218 | | | $ | 27,070,090 | |
| Change in Unrealized Appreciation (Depreciation) on Derivative Investments Recognized on the Statement of Operations | |
| Fund | | Futures Equity Contracts | | | Futures Currency Contracts | | | Futures Interest Rate Contracts | | | Futures Commodity Contracts | | | Total | |
| Managed Futures Strategy Fund | | $ | (7,480,854 | ) | | $ | (2,710,138 | ) | | $ | 5,228,688 | | | $ | (771,244 | ) | | $ | (5,733,548 | ) |
8. Federal Income Tax Information
The Fund intends to comply with the provisions of Subchapter M of the Internal Revenue Code applicable to regulated investment companies and will distribute substantially all taxable net investment income and capital gains sufficient to relieve the Fund from all, or substantially all, federal income, excise and state income taxes. Therefore, no provision for federal or state income tax is required.
Tax positions taken or expected to be taken in the course of preparing the Fund’s tax returns are evaluated to determine whether the tax positions are “more-likely-than-not” of being sustained by the applicable tax authority. Tax positions not deemed to meet the more-likely-than-not threshold would be recorded as a tax benefit or expense in the current year. Management has analyzed the Fund’s tax positions taken, or to be taken, on Federal income tax returns for all open tax
| 40 | THE GUGGENHEIM FUNDS ANNUAL REPORT | |
NOTES TO CONSOLIDATED FINANCIAL STATEMENTS (continued) |
years, and has concluded that no provision for income tax is required in the Fund’s financial statements. The Fund’s federal tax returns are subject to examination by the Internal Revenue Service for a period of three years after they are filed.
The Fund intends to invest up to 25% of its assets in the Subsidiary which is expected to provide the Funds with exposure to the commodities markets within the limitations of the federal tax requirements under Subchapter M of the Internal Revenue Code. The Fund has received a private letter ruling from the IRS that concludes that the income the Fund receives from the Subsidiary will constitute qualifying income for purposes of Subchapter M of the Internal Revenue Code. The Subsidiary will be classified as a corporation for U.S. federal income tax purposes. A foreign corporation, such as the Subsidiary, will generally not be subject to U.S. federal income taxation unless it is deemed to be engaged in a U.S. trade or business.
Tax basis capital losses in excess of capital gains are carried forward to offset future net capital gains. For the year ended December 31, 2014, the following capital loss carryforward amounts expired or were used:
| Fund | | Amount | |
| Managed Futures Strategy Fund | | $ | 19,542,545 | |
The tax character of distributions paid during the year ended December 31, 2014, was as follows:
| Fund | | Ordinary Income | | | Long-Term Capital Gain | | | Total Distributions | |
| Managed Futures Strategy Fund | | $ | 2,876,920 | | | $ | — | | | $ | 2,876,920 | |
The tax character of distributions paid during the year ended December 31, 2013, was as follows:
| Fund | | Ordinary Income | | | Long-Term Capital Gain | | | Total Distributions | |
| Managed Futures Strategy Fund | | $ | — | | | $ | — | | | $ | — | |
Note: For federal income tax purposes, short-term capital gain distributions are treated as ordinary income distributions.
| | THE GUGGENHEIM FUNDS ANNUAL REPORT | 41 |
NOTES TO CONSOLIDATED FINANCIAL STATEMENTS (continued) |
The tax character of distributable earnings/(accumulated losses) at December 31, 2014, was as follows:
| Fund | | Undistributed Ordinary Income | | | Undistributed Long-Term Capital Gain | | | Net Unrealized Appreciation/ Depreciation | | | Capital Loss Carryforward | |
| Managed Futures Strategy Fund | | $ | — | | | $ | — | | | $ | 745,150 | | | $ | (67,345,779 | ) |
For Federal income tax purposes, capital loss carryforwards represent realized losses of the Fund that may be carried forward and applied against future capital gains. For taxable years beginning on or before December 22, 2010, such capital losses may be carried forward for a maximum of eight years. Under the RIC Modernization Act of 2010, the Fund is permitted to carry forward capital losses incurred in taxable years beginning after December 22, 2010 for an unlimited period. However, any losses incurred during those taxable years must be utilized prior to the losses incurred in pre-enactment taxable years. As a result of this ordering rule, pre-enactment capital loss carryforwards may be more likely to expire unused. Additionally, post-enactment capital losses that are carried forward will retain their character as either short-term or long-term capital losses rather than being considered all short-term as under previous law. As of December 31, 2014, capital loss carryforward for the Fund was as follows:
| | Expires in | | | Expires in | | | Unlimited | | | Total Capital Loss | |
| Fund | | 2017 | | | 2018 | | | Short-Term | | | Long-Term | | | Carryforward | |
| Managed Futures Strategy Fund | | $ | (42,873,423 | ) | | $ | (9,859,364 | ) | | $ | — | | | $ | (14,612,992 | ) | | $ | (67,345,779 | ) |
Net investment income and net realized gains (losses) may differ for financial statement and tax purposes because of temporary or permanent book/tax differences. These differences are primarily due to mark-to-market of futures contracts, and foreign currency gains and losses. Additional differences may result from the tax treatment of net investment losses and expired capital loss carryforwards. To the extent these differences are permanent, reclassifications are made to the appropriate equity accounts in the period that the differences arise. These reclassifications have no effect on net assets or NAV.
| 42 | THE GUGGENHEIM FUNDS ANNUAL REPORT | |
NOTES TO CONSOLIDATED FINANCIAL STATEMENTS (continued) |
On the Statement of Assets and Liabilities, the following adjustments were made for permanent book/tax differences:
| Fund | | Paid In Capital | | | Undistributed Net Investment Income | | | Accumulated Net Realized Loss | |
| Managed Futures Strategy Fund | | $ | 5,710,680 | | | $ | (59,902 | ) | | $ | (5,650,778 | ) |
At December 31, 2014, the cost of securities for Federal income tax purposes, the aggregate gross unrealized gain for all securities for which there was an excess of value over tax cost and the aggregate gross unrealized loss for all securities for which there was an excess of tax cost over value, were as follows:
| Fund | | Tax Cost | | | Tax Unrealized Gain | | | Tax Unrealized Loss | | | Net Unrealized Loss | |
| Managed Futures Strategy Fund | | $ | 231,556,842 | | | $ | — | | | $ | (5,338,684 | ) | | $ | (5,338,684 | ) |
9. Securities Transactions
For the year ended December 31, 2014, the cost of purchases and proceeds from sales of investment securities, excluding government securities, short-term investments and derivatives, were as follows:
| Fund | | Purchases | | | Sales | |
| Managed Futures Strategy Fund | | $ | 195,052,194 | | | $ | 157,621,358 | |
10. Affiliated and/or Related Transactions
Investments representing 5% or more of the outstanding voting shares of a portfolio company of a fund, or control of or by, or common control under GI, result in that portfolio company being considered an affiliated company of such fund, as defined in the 1940 Act.
The Fund may invest in the Guggenheim Strategy Funds Trust consisting of Guggenheim Strategy Fund I, Guggenheim Strategy Fund II, and Guggenheim Strategy Fund III (collectively, the “Cash Management Funds”), open-end management investment companies managed by GI. The Cash Management Funds, which launched on March 11, 2014, are offered as cash management options only to mutual funds, trusts, and other accounts managed by GI and/or its affiliates, and are not available to the public. The Cash Management Funds pay no investment management fees. The Cash Management Funds’ annual report on
| | THE GUGGENHEIM FUNDS ANNUAL REPORT | 43 |
NOTES TO CONSOLIDATED FINANCIAL STATEMENTS (continued) |
Form N-CSR dated September 30, 2014 is available publicly or upon request. This information is also available from the EDGAR database on the SEC’s website at http://www.sec.gov.
Transactions during the year ended December 31, 2014 in which the portfolio company is an “affiliated person” are as follows:
| Affiliated issuers by Fund | | Value 12/31/13 | | | Additions | | | Reductions | | | Value 12/31/14 | | | Shares 12/31/14 | | | Investment Income | | | Realized Gain (Loss) | | | Capital Gain Distributions | |
| Managed Futures Strategy Fund | | | | | | | | | | | | | |
| Guggenheim Strategy Fund I | | $ | — | | | $ | 62,608,305 | | | $ | (4,600,000 | ) | | $ | 57,871,940 | | | | 2,329,788 | | | $ | 206,216 | | | $ | (9,586 | ) | | $ | — | |
| Guggenheim Strategy Fund II | | — | | | | 65,796,702 | | | | (6,000,000 | ) | | | 59,459,690 | | | | 2,392,744 | | | | 694,397 | | | | (5,606 | ) | | | — | |
| Guggenheim Strategy Fund III | | — | | | | 59,647,040 | | | | (17,700,000 | ) | | | 41,599,972 | | | | 1,674,717 | | | | 645,317 | | | | (99,678 | ) | | | — | |
| | | $ | — | | | $ | 188,052,047 | | | $ | (28,300,000 | ) | | $ | 158,931,602 | | | | | | | $ | 1,545,930 | | | $ | (114,870 | ) | | $ | — | |
11. Line of Credit
The Trust, along with other affiliated trusts, secured an uncommitted, $75,000,000 line of credit from U.S. Bank, N.A., which expires June 13, 2015. This line of credit is reserved for emergency or temporary purposes. Borrowings, if any, under this arrangement bear interest equal to the Prime Rate, minus 2%, which shall be paid monthly, averaging 1.25% for the year ended December 31, 2014. The Fund did not have any borrowings under this agreement at December 31, 2014.
The average daily balance borrowed for the year ended December 31, 2014, was as follows:
| Fund | | Average Daily Balance | |
| Managed Futures Strategy Fund | | $ | 6,392 | |
12. Legal Proceedings
Tribune Company
Rydex Series Funds has been named as a defendant and a putative member of the proposed defendant class of shareholders in the case entitled Kirschner v. FitzSimons, No. 12-2652 (S.D.N.Y.) (formerly Official Committee of Unsecured Creditors of Tribune Co. v. FitzSimons, Adv. Pro. No. 10-54010 (Bankr. D. Del.))
| 44 | THE GUGGENHEIM FUNDS ANNUAL REPORT | |
NOTES TO CONSOLIDATED FINANCIAL STATEMENTS (continued) |
(the “FitzSimons action”), as a result of ownership by certain series of the Rydex Series Funds of shares in the Tribune Company (“Tribune”) in 2007, when Tribune effected a leveraged buyout transaction (“LBO”) by which Tribune converted to a privately-held company. In his complaint, the plaintiff has alleged that, in connection with the LBO, Tribune insiders and shareholders were overpaid for their Tribune stock using financing that the insiders knew would, and ultimately did, leave the Tribune Company insolvent. The plaintiff has asserted claims against certain insiders, major shareholders, professional advisers, and others involved in the LBO. The plaintiff is also attempting to obtain from former Tribune shareholders, including the Rydex Series Funds, the proceeds they received in connection with the LBO.
In June 2011, a group of Tribune creditors filed multiple actions against former Tribune shareholders involving state law constructive fraudulent conveyance claims arising out of the 2007 LBO (the “SLCFC actions”). Rydex Series Funds has been named as a defendant in one or more of these suits. In those actions, the creditors seek to recover from Tribune’s former shareholders the proceeds received in connection with the 2007 LBO.
The FitzSimons action and the SLCFC actions have been consolidated with the majority of the other Tribune LBO-related lawsuits in a multidistrict litigation proceeding captioned In re Tribune Company Fraudulent Conveyance Litig., No. 11-md-2696 (S.D.N.Y.) (the “MDL Proceeding”).
On September 23, 2013, the District Court granted the defendants’ omnibus motion to dismiss the SLCFC actions, on the basis that the creditors lacked standing. On September 30, 2013, the creditors filed a notice of appeal of the September 23 order. On October 28, 2013, the defendants filed a joint notice of cross-appeal of that same order. The SLCFC appeals have been fully briefed, and oral argument took place on November 5, 2014. The Court has not yet issued a decision on the appeals.
On May 23, 2014, the defendants filed motions to dismiss the FitzSimons action, including a global motion to dismiss Count I, which is the claim brought against former Tribune shareholders for intentional fraudulent conveyance under U.S. federal law. The Court has not yet issued a decision on any of these motions.
None of these lawsuits alleges any wrongdoing on the part of Rydex Series Funds. The following series of Rydex Series Funds held shares of Tribune and tendered these shares as part of Tribune’s LBO: Nova Fund, S&P 500® Pure Value Fund, Multi-Cap Core Equity Fund, S&P 500® Fund, Multi-Hedge Strategies Fund and Hedged Equity Fund (the “Funds”). The value of the proceeds received by the foregoing Funds was $28,220, $109,242, $9,860, $3,400, $1,181,160, and $10,880,
| | THE GUGGENHEIM FUNDS ANNUAL REPORT | 45 |
NOTES TO CONSOLIDATED FINANCIAL STATEMENTS (concluded) |
respectively. At this stage of the proceedings, Rydex Series Funds is not able to make a reliable predication as to the outcome of these lawsuits or the effect, if any, on a Fund’s net asset value.
Lyondell Chemical Company
In December 2011, Rydex Series Funds was named as a defendant in Weisfelner, as Trustee of the LB Creditor Trust, v. Fund 1 (In re Lyondell Chemical Co.), Adv. Pro. No. 10-4609 (Bankr. S.D.N.Y.) (the “Creditor Trust action”).
Similar to the claims made in the Tribune matter, the Weisfelner complaint seeks to have set aside and recovered as fraudulent transfers from former Lyondell Chemical Company (“Lyondell”) shareholders the consideration paid to them pursuant to the cash out merger of Lyondell shareholders in connection with the combination of Lyondell and Basell AF in 2007. Lyondell filed for bankruptcy in 2008.
On April 7, 2014, the plaintiff filed a Third Amended Complaint. In the related action entitled Weisfelner, as Trustee of the LB Litigation Trust v. A. Holmes & H. Holmes TTEE (In re Lyondell Co.), Adversary Proceeding No. 10-5525 (Bankr. S.D.N.Y.) (the “Litigation Trust action”), the plaintiff also filed a Second Amended Complaint that alleges a claim against the former Lyondell shareholders under federal law for intentional fraudulent transfer.
On May 8, 2014, the plaintiff in the Litigation Trust action filed a motion to certify a defendant class generally comprised of all former Lyondell shareholders that received proceeds in exchange for their shares in the 2007 merger transaction. On July 30, 2014, the defendants filed a motion to dismiss all three lawsuits. The Court will held an oral argument on the motions to dismiss and on the motion for class certification on January 14 and January 15, 2015. Discovery shall commence in the near future.
These lawsuits do not allege any wrongdoing on the part of Rydex Series Funds. The following series of Rydex Series Funds received cash proceeds from the cash out merger in the following amounts: Basic Materials Fund - $1,725,168; Long Short Equity Fund f/k/a U.S. Long Short Momentum Fund - $2,193,600; Global 130/30 Strategy Fund - $37,920; Hedged Equity Fund - $1,440; and Multi-Hedge Strategies Fund - $1,116,480. At this stage of the proceedings, Rydex Series Funds is not able to make a reliable predication as to the outcome of these lawsuits or the effect, if any, on a Fund’s net asset value.
| 46 | THE GUGGENHEIM FUNDS ANNUAL REPORT | |
| REPORT OF INDEPENDENT REGISTERED PUBLIC ACCOUNTING FIRM |
The Board of Trustees and Shareholders of Rydex Series Funds:
We have audited the accompanying consolidated statement of assets and liabilities, including the consolidated schedule of investments, of Managed Futures Strategy Fund (one of the series constituting the Rydex Series Funds) (the “Fund”) as of December 31, 2014, and the related consolidated statement of operations for the year then ended, the consolidated statements of changes in net assets for each of the two years in the period then ended, and the consolidated financial highlights for each of the years or periods indicated therein. These financial statements and financial highlights are the responsibility of the Fund’s management. Our responsibility is to express an opinion on these financial statements and financial highlights based on our audits.
We conducted our audits in accordance with the standards of the Public Company Accounting Oversight Board (United States). Those standards require that we plan and perform the audit to obtain reasonable assurance about whether the financial statements and financial highlights are free of material misstatement. We were not engaged to perform an audit of the Fund’s internal control over financial reporting. Our audits included consideration of internal control over financial reporting as a basis for designing audit procedures that are appropriate in the circumstances, but not for the purpose of expressing an opinion on the effectiveness of the Fund’s internal control over financial reporting. Accordingly, we express no such opinion. An audit also includes examining, on a test basis, evidence supporting the amounts and disclosures in the financial statements and financial highlights, assessing the accounting principles used and significant estimates made by management, and evaluating the overall financial statement presentation. Our procedures included confirmation of securities owned as of December 31, 2014, by correspondence with the custodian, transfer agent, and brokers. We believe that our audits provide a reasonable basis for our opinion.
In our opinion, the financial statements and financial highlights referred to above present fairly, in all material respects, the consolidated financial position of Managed Futures Strategy Fund (one of the series constituting the Rydex Series Funds) at December 31, 2014, and the consolidated results of its operations for the year then ended, the consolidated changes in its net assets for each of the two years in the period then ended, and its consolidated financial highlights for each of the years or periods indicated therein, in conformity with U.S. generally accepted accounting principles.
McLean, Virginia
February 26, 2015
| | THE GUGGENHEIM FUNDS ANNUAL REPORT | 47 |
OTHER INFORMATION (Unaudited) |
Proxy Voting Information
A description of the policies and procedures that the Trust uses to determine how to vote proxies relating to securities held in the Funds’ portfolios is available, without charge and upon request, by calling 800.820.0888. This information is also available from the EDGAR database on the SEC’s website at http://www.sec.gov.
Information regarding how the Funds voted proxies relating to portfolio securities during the most recent 12-month period ended June 30 is available without charge, upon request, by calling 800.820.0888. This information is also available from the EDGAR database on the SEC’s website at http://www.sec.gov.
Quarterly Portfolio Schedules Information
The Trust files its complete schedule of portfolio holdings with the SEC for the first and third quarters of each fiscal year on Form N-Q; which are available on the SEC’s website at http://www.sec.gov. The Funds’ Forms N-Q may be reviewed and copied at the SEC’s Public Reference Room in Washington, DC, and that information on the operation of the Public Reference Room may be obtained by calling 800-SEC-0330. Copies of the portfolio holdings are also available to shareholders, without charge and upon request, by calling 800.820.0888.
Distributor Change
Effective March 3, 2014, Guggenheim Distributors, LLC (“GD”), the distributor for shares of the Funds was consolidated into and with Guggenheim Funds Distributors, LLC (“GFD”). Following the consolidation, GFD serves as the Funds’ distributor.
GD and GFD are both indirect, wholly-owned subsidiaries of Guggenheim Capital, LLC and, therefore, the consolidation will not result in a change of actual control of the Funds’ distributor. The primary goal of the consolidation is to achieve greater operational efficiencies and allow all of the Guggenheim funds, including funds that are not series of the Trusts, to be distributed by a single distributor.
The consolidation is not expected to affect the day-to-day management of the Funds or result in any material changes to the distribution of the Funds, including any changes to the distribution fees paid by the Funds.
| 48 | THE GUGGENHEIM FUNDS ANNUAL REPORT | |
INFORMATION ON BOARD OF TRUSTEES AND OFFICERS (Unaudited) |
A Board of Trustees oversees the Trust, as well as other trusts of GI, in which its members have no stated term of service, and continue to serve after election until resignation. The Statement of Additional Information includes further information about Fund Trustees and Officers, and can be obtained without charge by calling 800.820.0888.
Name, Address* and Year of Birth of Trustee | Position(s) Held with the Trust, Term of Office and Length of Time Served | Principal Occupation(s) During Past 5 Years | Number of Portfolios in Fund Complex Overseen by Trustee*** | Other Directorships Held by Trustee |
| INTERESTED TRUSTEE | | | |
Donald C. Cacciapaglia** (1951) | Trustee from 2012 to present. | Current: President and CEO, certain other funds in the Fund Complex (2012-present); Vice Chairman, Guggenheim Investments (2010-present). Former: Chairman and CEO, Channel Capital Group, Inc. (2002-2010). | 222 | Delaware Life (2013-present); Guggenheim Life and Annuity Company (2011-present); Paragon Life Insurance Company of Indiana (2011-present). |
| INDEPENDENT TRUSTEES | | | |
Corey A. Colehour (1945) | Trustee and Member of the Audit, Governance, Nominating, and Investment and Performance Committees from 1998 to present. | Retired. | 133 | None. |
J. Kenneth Dalton (1941) | Trustee, Member and Chairman of the Audit Committee, and Member of the Governance and Nominating Committees from 1998 to present; and Member of the Risk Oversight Committee from 2010 to present. | Retired. | 133 | Trustee of Epiphany Funds (4) (2009-present). |
| | THE GUGGENHEIM FUNDS ANNUAL REPORT | 49 |
INFORMATION ON BOARD OF TRUSTEES AND OFFICERS (Unaudited)(continued) |
Name, Address* and Year of Birth of Trustee | Position(s) Held with the Trust, Term of Office and Length of Time Served | Principal Occupation(s) During Past 5 Years | Number of Portfolios in Fund Complex Overseen by Trustee*** | Other Directorships Held by Trustee |
| INDEPENDENT TRUSTEES - concluded | |
John O. Demaret (1940) | Vice Chairman of the Board of Trustees from 2014 to present; Trustee from 1998 to present and Chairman of the Board from 2006 to 2014; Member and Chairman of the Audit Committee from 1998 to present; and Member of the Risk Oversight Committee from 2010 to present. | Retired. | 133 | None. |
Werner E. Keller (1940) | Chairman of the Board from 2014 to present; Vice Chairman of the Board of Trustees from 2010 to 2014; Trustee and Member of the Audit, Governance, and Nominating Committees from 2005 to present; and Chairman and Member of the Risk Oversight Committee from 2010 to present. | Current: Founder and President, Keller Partners, LLC (investment research firm) (2005-present). | 133 | None. |
Thomas F. Lydon, Jr. (1960) | Trustee and Member of the Audit, Governance, and Nominating Committees from 2005 to present. | Current: President, Global Trends Investments (registered investment adviser) (1996-present). | 133 | US Global Investors (GROW) (1995-present). |
Patrick T. McCarville (1942) | Trustee, Member of the Audit Committee, and Chairman and Member of the Governance and Nominating Committees from 1998 to present. | Retired. Former: Chief Executive Officer, Par Industries, Inc., d/b/a Par Leasing (1977-2010). | 133 | None. |
| 50 | THE GUGGENHEIM FUNDS ANNUAL REPORT | |
INFORMATION ON BOARD OF TRUSTEES AND OFFICERS (Unaudited)(continued) |
Name, Address* and Year of Birth | Position(s) Held with the Trust, Term of Office and Length of Time Served | Principal Occupation(s) During Past 5 Years |
| OFFICERS | | |
Donald C. Cacciapaglia (1951) | President (2012-present). | Current: President and CEO, certain other funds in the Fund Complex (2012-present); Vice Chairman, Guggenheim Investments (2010-present). Former: Chairman and CEO, Channel Capital Group Inc. (2002-2010). |
Michael P. Byrum (1970) | Vice President (1999-present). | Current: Senior Vice President, Security Investors, LLC (2010-present); President and Chief Investment Officer, Rydex Holdings, LLC (2008-present); Director and Chairman, Advisory Research Center, Inc. (2006-present); Manager, Guggenheim Specialized Products, LLC (2005-present). Former: Vice President, Guggenheim Distributors, LLC (2009); Director (2009-2010) and Secretary (2002-2010), Rydex Fund Services, LLC; Director (2008-2010), Chief Investment Officer (2006-2010), President (2004-2010) and Secretary (2002-2010), Rydex Advisors, LLC; Director (2008-2010), Chief Investment Officer (2006-2010), President (2004-2010) and Secretary (2002-2010), Rydex Advisors II, LLC. |
Nikolaos Bonos (1963) | Vice President and Treasurer (2003-present). | Current: Senior Vice President, Security Investors, LLC (2010-present); Chief Executive Officer, Guggenheim Specialized Products, LLC (2009-present); Chief Executive Officer & President, Rydex Fund Services, LLC (2009-present); Vice President, Rydex Holdings, LLC (2008-present). Former: Senior Vice President, Security Global Investors, LLC (2010-2011); and Senior Vice President, Rydex Advisors, LLC and Rydex Advisors II, LLC (2006-2011). |
| | THE GUGGENHEIM FUNDS ANNUAL REPORT | 51 |
INFORMATION ON BOARD OF TRUSTEES AND OFFICERS (Unaudited)(concluded) |
Name, Address* and Year of Birth | Position(s) Held with the Trust, Term of Office and Length of Time Served | Principal Occupation(s) During Past 5 Years |
| OFFICERS - concluded | |
Elisabeth Miller (1968) | Chief Compliance Officer (2012-present). | Current: CCO, certain other funds in the Fund Complex (2012-present); CCO, Security Investors, LLC (2012-present); CCO, Guggenheim Funds Investment Advisors, LLC (2012-present); Managing Director, Guggenheim Investments (2012-present); Vice President, Guggenheim Funds Distributors, LLC (March 2014-present). Former: CCO, Guggenheim Distributors, LLC (2009-March 2014); Senior Manager, Security Investors, LLC (2004-2009); Senior Manager, Guggenheim Distributors, LLC (2004-2009). |
Joseph M. Arruda (1966) | Assistant Treasurer (2006-present). | Current: Assistant Treasurer, certain other funds in the Fund Complex (2006-present); Vice President, Security Investors, LLC (2010-present); CFO and Manager, Guggenheim Specialized Products, LLC (2009-present). Former: Vice President, Security Global Investors, LLC (2010-2011); Vice President, Rydex Advisors, LLC (2010); Vice President, Rydex Advisors II, LLC (2010). |
Paul J. Davio (1972) | Assistant Treasurer (2014-present). | Current: Assistant Treasurer, certain other funds in the Fund Complex (2014-present); Director, Guggenheim Investments (2006-present). Former: Manager, Mutual Fund Administration, Guggenheim Investments (2003-2006). |
Amy J. Lee (1961) | Vice President (2009-present) and Secretary (2012-present). | Current: Chief Legal Officer, certain other funds in the Fund Complex (2012-present); Senior Managing Director, Guggenheim Investments (2012-present). Former: Vice President, Associate General Counsel and Assistant Secretary, Security Benefit Life Insurance Company and Security Benefit Corporation (2004-2012). |
| * | All Trustees and Officers may be reached c/o Guggenheim Investments, 805 King Farm Boulevard, Suite 600, Rockville, MD 20850. |
| ** | Mr. Cacciapaglia is an “interested” person of the Trust, as that term is defined in the 1940 Act by virtue of his affiliation with the Adviser’s parent company. |
| *** | The “Fund Complex” includes all closed-end and open-end funds (including all of their portfolios) advised by the Adviser and any funds that have an investment adviser or servicing agent that is an affiliated person of the Adviser. Information provided is as of the date of this report. |
| 52 | THE GUGGENHEIM FUNDS ANNUAL REPORT | |
GUGGENHEIM INVESTMENTS PRIVACY POLICIES (Unaudited) |
Rydex Funds, Guggenheim Funds, Rydex Investments, Guggenheim Funds Distributors, LLC, Security Investors, LLC, Security Distributors, Inc., Guggenheim Partners Investment Managers, LLC, and Rydex Advisory Services (Collectively “Guggenheim Investments”).
Our Commitment to You
When you become a Guggenheim Investments investor, you entrust us with not only your hard-earned money but also with personal and financial information about you. We recognize that your relationship with us is based on trust and that you expect us to act responsibly and in your best interests. Because we have access to this private information about you, we hold ourselves to the highest standards in its safekeeping and use. This means, most importantly, that we do not sell client information to anyone—whether it is your personal information or if you are a current or former Guggenheim Investments client.
The Information We Collect About You
In the course of doing business with shareholders and investors, we collect nonpublic personal information about you. You typically provide personal information when you complete a Guggenheim Investments account application or when you request a transaction that involves Rydex and Guggenheim Investments funds or one of the Guggenheim Investments affiliated companies. “Nonpublic personal information” is personally identifiable private information about you. For example, it includes information regarding your name and address, Social Security or taxpayer identification number, assets, income, account balance, bank account information and investment activity (e.g., purchase and redemption history).
How We Handle Your Personal Information
As emphasized above, we do not sell information about current or former clients or their accounts to third parties. Nor do we share such information, except when necessary to complete transactions at your request or to make you aware of related investment products and services that we offer. Additional details about how we handle your personal information are provided below. To complete certain transactions or account changes that you direct, it may be necessary to provide identifying information to companies, individuals or groups that are not affiliated with Guggenheim Investments. For example, if you ask to transfer assets from another financial institution to Guggenheim Investments, we will need to provide certain information about you to that company to complete the transaction. To alert you to other Guggenheim Investments investment products and services, we may share your information within the Guggenheim Investments family of affiliated companies. This would include, for example, sharing your information within Guggenheim Investments so we can make you aware of
| | THE GUGGENHEIM FUNDS ANNUAL REPORT | 53 |
GUGGENHEIM INVESTMENTS PRIVACY POLICIES (Unaudited)(continued) |
new Rydex and Guggenheim Investments funds or the services offered through another Guggenheim Investments affiliated company. In certain instances, we may contract with nonaffiliated companies to perform services for us. Where necessary, we will disclose information we have about you to these third parties. In all such cases, we provide the third party with only the information necessary to carry out its assigned responsibilities and only for that purpose. And we require these third parties to treat your private information with the same high degree of confidentiality that we do. In certain instances, we may share information with other financial institutions regarding individuals and entities in response to the U.S.A. Patriot Act. Finally, we will release information about you if you direct us to do so, if we are compelled by law to do so or in other circumstances permitted by law.
Opt Out Provisions
We do not sell your personal information to anyone. The law allows you to “opt out” of only certain kinds of information sharing with third parties. The firm does not share personal information about you with any third parties that triggers this opt-out right. This means YOU ARE ALREADY OPTED OUT.
How We Protect Privacy Online
Our concern for the privacy of our shareholders also extends to those who use our web site, guggenheiminvestments.com. Our web site uses some of the most secure forms of online communication available, including encryption technology, Secure Socket Layer (SSL) protocol, firewalls and user names and passwords. These technologies provide a high level of security and privacy when you access your account information or initiate online transactions. The Guggenheim Investments web site offers customized features that require our use of “http cookies”—tiny pieces of information that we ask your browser to store. However, we make very limited use of these cookies. We only use cookies for session management and security features on the Guggenheim Investments web site. We do not use them to pull data from your hard drive, to learn your email address, or to view data in cookies created by other web sites. We will not share the information in our cookies or give others access to it. See the legal information area on our web site for more details about web site security and privacy features.
How We Safeguard Your Personal Information
We restrict access to nonpublic personal information about shareholders to our employees and in some cases to third parties (for example, the service providers described above) as permitted by law. We maintain strict physical, electronic and procedural safeguards that comply with federal standards to guard your nonpublic personal information.
| 54 | THE GUGGENHEIM FUNDS ANNUAL REPORT | |
GUGGENHEIM INVESTMENTS PRIVACY POLICIES (Unaudited)(concluded) |
We’ll Keep You Informed
As required by federal law, we will notify shareholders of our privacy policy annually. We reserve the right to modify this policy at any time, but rest assured that if we do change it, we will tell you promptly. You will also be able to access our privacy policy from our web site at guggenheiminvestments.com. Should you have any questions regarding our privacy policy, contact us at 800.820.0888 or 301.296.5100.
| | THE GUGGENHEIM FUNDS ANNUAL REPORT | 55 |
This page intentionally left blank.
This page intentionally left blank.
This page intentionally left blank.
This page intentionally left blank.
This page intentionally left blank.
This page intentionally left blank.